Latency reversal agents modulate HIV antigen processing and ...
24
RESEARCH ARTICLE Latency reversal agents modulate HIV antigen processing and presentation to CD8 T cells Julie Boucau 1 , Jishnu Das ID 2 , Neelambari Joshi 1 , Sylvie Le Gall ID 1 * 1 Ragon Institute of MGH, MIT and Harvard, Massachusetts General Hospital and Harvard Medical School, Cambridge, Massachusetts, United States of America, 2 Center for Systems Immunology, Departments of Immunology and Computational & Systems Biology, University of Pittsburgh School of Medicine, Pittsburgh, Pennsylvania, United States of America * [email protected] Abstract Latency reversal agents (LRA) variably induce HIV re-expression in CD4 T cells but reser- voirs are not cleared. Whether HIV epitope presentation is similar between latency reversal and initial infection of CD4 T cells is unknown yet crucial to define immune responses able to detect HIV-infected CD4 T cells after latency reversal. HIV peptides displayed by MHC comes from the intracellular degradation of proteins by proteasomes and post-proteasomal peptidases but the impact of LRAs on antigen processing is not known. Here we show that HDAC inhibitors (HDCAi) reduced cytosolic proteolytic activities while PKC agonists (PKCa) increased them to a lesser extent than that induced by TCR activation. During the cytosolic degradation of long HIV peptides in LRA-treated CD4 T cells extracts, HDACi and PKCa modulated degradation patterns of peptides and altered the production of HIV epitopes in often opposite ways. Beyond known HIV epitopes, HDACi narrowed the coverage of HIV antigenic fragments by 8-11aa degradation peptides while PKCa broadened it. LRAs altered HIV infection kinetics and modulated CD8 T cell activation in an epitope- and time-depen- dent manner. Interestingly the efficiency of endogenous epitope processing and presenta- tion to CD8 T cells was increased by PKCa Ingenol at early time points despite low levels of antigens. LRA-induced modulations of antigen processing should be considered and exploited to enhance and broaden HIV peptide presentation by CD4 T cells and to improve immune recognition after latency reversal. This property of LRAs, if confirmed with other antigens, might be exploited to improve immune detection of diseased cells beyond HIV. Author summary Latently HIV-infected CD4 T cells persist and remain invisible to the immune system. Strategies to flush out HIV reservoirs propose to re-express HIV with latency reversal agents (LRAs), leading to CD4 T cell death or clearance by HIV-specific immune responses. LRAs tested so far variably induced HIV re-expression but did not eliminate reservoirs. The activation of HIV-specific immune responses is triggered by HIV peptides displayed by infected cells after HIV intracellular degradation. Whether HIV antigens are similarly degraded and displayed by CD4 T cells after latency reversal or during initial PLOS PATHOGENS PLOS Pathogens | https://doi.org/10.1371/journal.ppat.1008442 March 20, 2020 1 / 24 a1111111111 a1111111111 a1111111111 a1111111111 a1111111111 OPEN ACCESS Citation: Boucau J, Das J, Joshi N, Le Gall S (2020) Latency reversal agents modulate HIV antigen processing and presentation to CD8 T cells. PLoS Pathog 16(3): e1008442. https://doi.org/ 10.1371/journal.ppat.1008442 Editor: Daniel C. Douek, Vaccine Research Center, UNITED STATES Received: November 24, 2019 Accepted: February 28, 2020 Published: March 20, 2020 Copyright: © 2020 Boucau et al. This is an open access article distributed under the terms of the Creative Commons Attribution License, which permits unrestricted use, distribution, and reproduction in any medium, provided the original author and source are credited. Data Availability Statement: All relevant data are within the manuscript and its Supporting Information files. Funding: This study was funded by grants AI131912 and AI112493 from NIAID (https://www. niaid.nih.gov/) to SLG. The funders had no role in study design, data collection and analysis, decision to publish, or preparation of the manuscript. Competing interests: The authors have declared that no competing interests exist.
-
Upload
khangminh22 -
Category
Documents
-
view
2 -
download
0
Transcript of Latency reversal agents modulate HIV antigen processing and ...
RESEARCH ARTICLE
Latency reversal agents modulate HIV antigen
processing and presentation to CD8 T cells
Julie Boucau1, Jishnu DasID2, Neelambari Joshi1, Sylvie Le GallID
1*
1 Ragon Institute of MGH, MIT and Harvard, Massachusetts General Hospital and Harvard Medical School,
Cambridge, Massachusetts, United States of America, 2 Center for Systems Immunology, Departments of
Immunology and Computational & Systems Biology, University of Pittsburgh School of Medicine, Pittsburgh,
Pennsylvania, United States of America
Abstract
Latency reversal agents (LRA) variably induce HIV re-expression in CD4 T cells but reser-
voirs are not cleared. Whether HIV epitope presentation is similar between latency reversal
and initial infection of CD4 T cells is unknown yet crucial to define immune responses able
to detect HIV-infected CD4 T cells after latency reversal. HIV peptides displayed by MHC
comes from the intracellular degradation of proteins by proteasomes and post-proteasomal
peptidases but the impact of LRAs on antigen processing is not known. Here we show that
HDAC inhibitors (HDCAi) reduced cytosolic proteolytic activities while PKC agonists (PKCa)
increased them to a lesser extent than that induced by TCR activation. During the cytosolic
degradation of long HIV peptides in LRA-treated CD4 T cells extracts, HDACi and PKCa
modulated degradation patterns of peptides and altered the production of HIV epitopes in
often opposite ways. Beyond known HIV epitopes, HDACi narrowed the coverage of HIV
antigenic fragments by 8-11aa degradation peptides while PKCa broadened it. LRAs altered
HIV infection kinetics and modulated CD8 T cell activation in an epitope- and time-depen-
dent manner. Interestingly the efficiency of endogenous epitope processing and presenta-
tion to CD8 T cells was increased by PKCa Ingenol at early time points despite low levels of
antigens. LRA-induced modulations of antigen processing should be considered and
exploited to enhance and broaden HIV peptide presentation by CD4 T cells and to improve
immune recognition after latency reversal. This property of LRAs, if confirmed with other
antigens, might be exploited to improve immune detection of diseased cells beyond HIV.
Author summary
Latently HIV-infected CD4 T cells persist and remain invisible to the immune system.
Strategies to flush out HIV reservoirs propose to re-express HIV with latency reversal
agents (LRAs), leading to CD4 T cell death or clearance by HIV-specific immune
responses. LRAs tested so far variably induced HIV re-expression but did not eliminate
reservoirs. The activation of HIV-specific immune responses is triggered by HIV peptides
displayed by infected cells after HIV intracellular degradation. Whether HIV antigens are
similarly degraded and displayed by CD4 T cells after latency reversal or during initial
PLOS PATHOGENS
PLOS Pathogens | https://doi.org/10.1371/journal.ppat.1008442 March 20, 2020 1 / 24
a1111111111
a1111111111
a1111111111
a1111111111
a1111111111
OPEN ACCESS
Citation: Boucau J, Das J, Joshi N, Le Gall S
(2020) Latency reversal agents modulate HIV
antigen processing and presentation to CD8 T cells.
PLoS Pathog 16(3): e1008442. https://doi.org/
10.1371/journal.ppat.1008442
Editor: Daniel C. Douek, Vaccine Research Center,
UNITED STATES
Received: November 24, 2019
Accepted: February 28, 2020
Published: March 20, 2020
Copyright: © 2020 Boucau et al. This is an open
access article distributed under the terms of the
Creative Commons Attribution License, which
permits unrestricted use, distribution, and
reproduction in any medium, provided the original
author and source are credited.
Data Availability Statement: All relevant data are
within the manuscript and its Supporting
Information files.
Funding: This study was funded by grants
AI131912 and AI112493 from NIAID (https://www.
niaid.nih.gov/) to SLG. The funders had no role in
study design, data collection and analysis, decision
to publish, or preparation of the manuscript.
Competing interests: The authors have declared
that no competing interests exist.
infection is unknown. We showed that LRAs altered the activities of the degradation
machinery and changed the degradation patterns of HIV into peptides. LRA-treated HIV-
infected CD4 T cells were variably recognized by immune cells in a time- and peptide-
dependent manner. Some LRAs increased the efficiency of HIV peptide presentation
despite low levels of HIV antigens inside CD4 T cells. The modulation of HIV peptide pre-
sentation by current or future LRAs should be accounted for and exploited to improve
HIV peptide presentation and enhance immune detection of HIV-infected CD4 T cells
after latency reversal.
Introduction
Despite efficient antiretroviral treatments (ART) HIV latently persists in long-lived CD4 T
cells [1]. One of the eradication strategies currently tested in clinical trials proposes to re-acti-
vate provirus expression with latency reversal agents (LRAs) to trigger HIV re-expression,
leading to cell death or elimination by pre-existing HIV-specific immune responses [2,3].
While HIV RNA re-expression can be induced to variable extents by LRAs in CD4 T cells ex
vivo or in vivo, the reservoir is never cleared [4,5]. This failure of LRAs may be explained by
limited reactivation of HIV provirus [6,7] and/or of antigen expression, mutations in epitopes
impairing immune recognition, ineffective magnitude or functionality of immune effectors
[8–11], or intrinsic resistance of cells to elimination [12,13]. Whether steps leading to HIV
MHC-peptide presentation to immune cells are similar during productive infection or latency
reversal is not known but play a major role in assessing the capacity of pre-existing immune
responses to recognize CD4 T cells after latency reversal and in defining additional vaccine-
induced immune responses relevant to latency reversal.
LRAs tested in vitro or in vivo in clinical trials [14] include HDAC inhibitors (HDACi)
such as Vorinostat [15], Romidepsin [16,17] or Panobinostat [18], PKC agonists (PKCa) such
as Bryostatin or Ingenol, aldehyde dehydrogenase inhibitor Disulfiram [19,20]. The addition
of immunomodulatory components such as TLR agonists [21–24], PD1 blockade [25], cyto-
kines such as IL-7 or IL-15 [26–28], activation of the RIG-I pathway [29], or of non-canonical
NF-κB signaling activator [30] may enhance HIV latency reversal in ex vivo or animal studies
but have not yet been tested in clinical trials or have not been successful.
Peptides displayed by MHC-I to CD8 T or NK cells derive from the intracellular degrada-
tion of proteins by the antigen processing machinery, including proteasomes and post-protea-
somal peptidases in the cytosol and endoplasmic reticulum (ER) where LRA-induced HIV
antigens may be found [31]. The expression and hydrolytic activities of the antigen processing
machineries are modulated by various stimuli such as cytokines [32], viral infection [33], TLR
ligands [34–36], TCR-induced cellular activation [37], oxidative stress [38] or enzyme inhibi-
tors [39–43]. We previously showed that TCR-mediated cellular activation enhanced peptidase
activities, modulated protein degradation patterns into peptides and CTL recognition [37].
The metabolic environment for HIV protein expression and degradation differs drastically
between productive infection in activated CD4 T cells [44,45] and latency reversal in differenti-
ated resting CD4 T cells [46,47], but the consequences on the degradation machinery and epi-
tope production are not known.
Here we showed that HDACi and PKCa used in clinical trials modulate cellular peptidase
activities of primary CD4 T cells in opposite ways. They variably altered degradation patterns
of HIV long peptides, the production of known HIV epitopes often in opposite ways. HDACi
narrowed the coverage of HIV antigenic fragments by 8-11aa-long degradation peptides while
PLOS PATHOGENS Latency reversal agents alter HIV antigen presentation
PLOS Pathogens | https://doi.org/10.1371/journal.ppat.1008442 March 20, 2020 2 / 24

PKCa broadened it. LRAs modulated the efficiency of endogenous processing and presenta-
tion of HIV epitopes by HIV-infected CD4 T cells and CTL responses in a time- and epitope-
dependent manner. Interestingly PKCa Ingenol increased the efficiency of peptide presenta-
tion to CTL at early time points despite low levels of antigens inside cells. Altogether the data
show that the impact of LRAs on antigen presentation should be accounted for and exploited
to enhance immune recognition of CD4 T cells after latency reversal and for the design of vac-
cines against reservoirs. Rather than aiming for strong HIV reactivation, augmenting or
broadening HIV peptide presentation after LRA treatment despite low antigens production
would improve immune detection. Beyond latency reversal of HIV, HDACi or PKCa improv-
ing or broadening MHC peptide presentation at low levels of antigens may facilitate the
immune detection of diseased cells.
Results
Different classes of LRA alter cytosolic peptidase activities
We assessed the effects of 5 LRAs on the antigen processing machinery of primary CD4 T
cells. The selected LRAs with confirmed in vitro and partial in vivo efficacy on HIV reactiva-
tion included HDACi Panobinostat (Pano) and Romidepsin (Romi); Disulfiram (Disu); and
PKCa: Bryostatin (Bryo) and Ingenol-3-angelate (Inge) while anti-CD3/CD28 TCR stimula-
tion defined the maximum cellular activation.
We measured with a fluorescence-based enzymatic assay the hydrolytic activities of the pro-
teasome (chymotryptic, tryptic-like and caspase-like activities) and the post-proteasomal ami-
nopeptidase activities involved in MHC-I presentation in live CD4 T cells of healthy donors at
6, 24 and 48 hours post-treatment [37] (Fig 1). Peptidase activities significantly changed after a
48 hours treatment (Fig 1A). Bryostatin treatment significantly increased aminopeptidase
hydrolytic activities by an average 1.6-fold and Panobinostat significantly decreased hydrolytic
activities by 0.78-fold (Fig 1A and 1B). Overall on 8–15 healthy donors, HDACi and disulfiram
had opposite effects on peptidase activities of primary CD4 T cells when compared to PKCa or
aCD3/CD28 (Fig 1C and S1 Fig). Treatment with HDACi or disulfiram significantly decreased
the proteasomal chymotryptic-like, tryptic-like and caspase-like hydrolytic activities and ami-
nopeptidase activities (0.35- and 0.85-fold depending on the activities). In contrast PKCa sig-
nificantly increased aminopeptidase and proteasomal activities (2.05- to 4.9-fold increase
depending on the activities) but to a lesser extent than TCR activation. Our previous work
indicated that the increase in peptidase activities following aCD3/CD28-stimulation is posi-
tively correlated with cellular activation of primary CD4 T cells [37]. We assessed the expres-
sion of activation markers CD25 and CD69 at the surface of primary CD4 T cells following
LRA-treatment (Fig 1D). Neither HDACi nor disulfiram changed the proportion of CD25+
and/or CD69+ primary CD4 T cells when compared to DMSO-treated cells but both PKCa
increased the expression of the activation markers over time with a maximum of 40%-70% of
activated CD4 T cells following PKCa treatments, remaining below the stimulation achieved
with aCD3/CD28 (up to 88%), in accordance with previously reported PKCa-induced T cell
activation measurements [48–50]. Unlike what we previously reported for cellular activation
following CD3/CD28 engagement, the changes in peptidase activities following LRA treatment
were not necessarily correlated with the percentage of activated cells. The multivariate analysis
of all four peptidase activities and activation levels after DMSO, HDACi, PKCa or aCD3/CD28
treatment in CD4 T cells with dimensionality reduction by tSNE showed clustering of DMSO
and HDACi treatment while PKCa and aCD3/28 clustered separately (Fig 1E), in accordance
with the decreased peptidase activities induced by HDACi and the increased peptidase activi-
ties induced by PKCa.
PLOS PATHOGENS Latency reversal agents alter HIV antigen presentation
PLOS Pathogens | https://doi.org/10.1371/journal.ppat.1008442 March 20, 2020 3 / 24
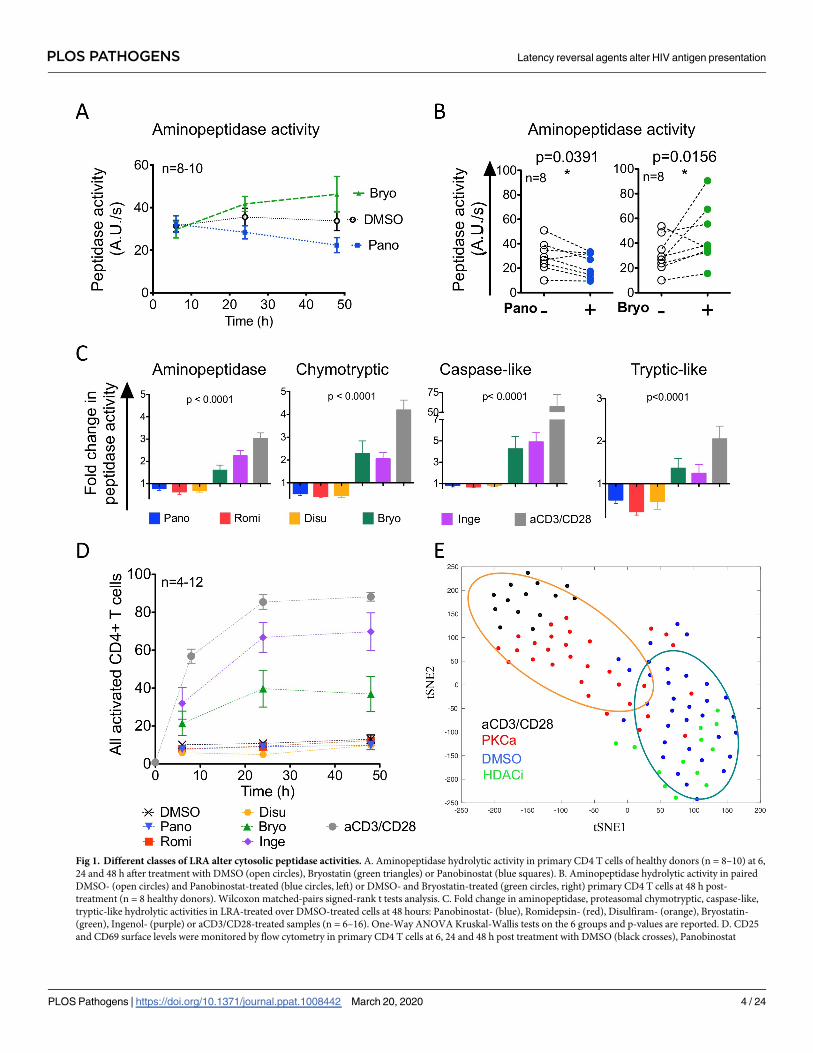
Fig 1. Different classes of LRA alter cytosolic peptidase activities. A. Aminopeptidase hydrolytic activity in primary CD4 T cells of healthy donors (n = 8–10) at 6,
24 and 48 h after treatment with DMSO (open circles), Bryostatin (green triangles) or Panobinostat (blue squares). B. Aminopeptidase hydrolytic activity in paired
DMSO- (open circles) and Panobinostat-treated (blue circles, left) or DMSO- and Bryostatin-treated (green circles, right) primary CD4 T cells at 48 h post-
treatment (n = 8 healthy donors). Wilcoxon matched-pairs signed-rank t tests analysis. C. Fold change in aminopeptidase, proteasomal chymotryptic, caspase-like,
tryptic-like hydrolytic activities in LRA-treated over DMSO-treated cells at 48 hours: Panobinostat- (blue), Romidepsin- (red), Disulfiram- (orange), Bryostatin-
(green), Ingenol- (purple) or aCD3/CD28-treated samples (n = 6–16). One-Way ANOVA Kruskal-Wallis tests on the 6 groups and p-values are reported. D. CD25
and CD69 surface levels were monitored by flow cytometry in primary CD4 T cells at 6, 24 and 48 h post treatment with DMSO (black crosses), Panobinostat
PLOS PATHOGENS Latency reversal agents alter HIV antigen presentation
PLOS Pathogens | https://doi.org/10.1371/journal.ppat.1008442 March 20, 2020 4 / 24

The changes in cytosolic peptidase activities following LRA treatment alter
antigen processing
We evaluated if the changes in cellular peptidase activities induced by LRAs affected the degra-
dation of two long HIV peptides and the production of HIV epitopes (Figs 2 and 3). First, we
compared the degradation of a HIV-1 Gag 35mer containing 6 MHC-I-restricted HIV epi-
topes, p24-10-35m MVHQAISPRTLNAWVKVVEEKAFSPEVIPMFAALS, in matched cellu-
lar extracts of primary CD4 T cells treated for 48 hours with DMSO, aCD3/CD28, Bryostatin,
Ingenol, Panobinostat or Disulfiram (Fig 2A). Degradation peptides generated at various time
points were purified, identified and quantified by mass spectrometry as in [37]. We compared
the degradation patterns of the 35-mer by quantifying the relative amount of peptides starting
or ending at each aa. A representative diagram of the N-terminal cleavage sites is shown in Fig
2B. While the main cleavage sites (H3, A13, V15, V17, E20, V27) were similar in the DMSO-,
LRAs- and aCD3/CD28-treated cells, the amount of fragments starting at each residue varied
with the treatment. For instance, fragments starting at H3 or N12 were reduced by 10-fold in
Panobinostat-treated extracts, while those starting at V2, V15, V17 were increased by Panobi-
nostat and reduced by Bryostatin and aCD3/CD28. To measure the changes in cleavage sites
in multiple donors (n = 6–15), we calculated the average fold change at each aa (peptide
amount obtained for LRA-treated divided by matched DMSO-treated extracts), and plotted
the values as heatmaps for N-terminal (top) and C-terminal (bottom) cleavage sites (Fig 2C;
compare intensity of each aa vertically). Most cleavage sites were variably increased or
decreased by treatments. Anti-CD3/CD28-stimulation caused the most frequent and signifi-
cant changes with 12 altered cleavage sites at the N-terminus (9 increased, 3 decreased) and 10
positions for the C-terminus (6 increased, 4 decreased), in accordance with our published
results [37]. PKCa treatment significantly changed several N- and C-terminus cleavage sites
but distinct from aCD3/CD28-induced changes. Ensuing the opposite changes in peptidase
activities, HDACi and PKCa had opposite effects on specific cleavage sites (for instance more
peptides starting at V17 in Panobinostat and fewer in Bryostatin-treated extracts).
We then assessed the production of known HIV-1 CTL epitopes spanning p24-10-35m (Fig
2A and 2C). Out of 11 known HIV epitopes 10 were produced as optimal or N-extended pep-
tides across 20 donors. We calculated the fold change in epitope production by dividing the
relative amount of epitope produced in LRA-treated extracts by the value obtained for the
matched DMSO control across all experiments (Fig 2D and 2E). HLA-B57 KF11 production
was increased by PKCa and aCD3/CD28, unchanged by Panobinostat and decreased by disul-
firam (Fig 2D). Since the impact of LRA treatment is variable across donors (as seen for all
HIV-related parameters measured ex vivo or in vivo on LRA-treated cells [14], we plotted the
amount of KF11 produced in paired DMSO/LRA samples, showing significantly increased
KF11 production in PKCa-treated extracts and reduced KF11 production in disulfiram-treated
extracts in most donors (Fig 2E). The production of 3 other HLA-B57 HIV epitopes (QW11,
ISW9 and FF9) was variably affected by LRA treatments (Fig 2F). HLA-B57 FF9 was mostly
unchanged by all treatments while QW11 production was increased in aCD3/CD28- or disulfi-
ram-treated extracts. Interestingly ISW9 was the only epitope increased by Panobinostat treat-
ment (low peptidase activities) and decreased by aCD3/CD28 treatment. Epitopes produced
(inverted blue triangles), Romidepsin (red squares), Disulfiram (orange circles), Bryostatin (green triangles), Ingenol (purple diamonds) or aCD3/CD28 (grey
circles). n = 4–12 healthy donors. E. Unsupervised visualization with t-SNE on Z score centered and normalized data, which included the percentages of CD25-,
CD69-, CD38 and HLA-DR-positive CD4 T cells in each sample and the values for aminopeptidase and proteasome chymotryptic, caspase-like and tryptic-like
hydrolytic activities. Panobinostat and Romidepsin were grouped as HDACi (green, n = 13) and Bryostatin and Ingenol were grouped as PKCa (red, n = 30), also
displayed are mock-treated DMSO (blue, n = 33) and aCD3/CD28-treated (black, n = 14). Ellipses indicate 75% confidence interval.
https://doi.org/10.1371/journal.ppat.1008442.g001
PLOS PATHOGENS Latency reversal agents alter HIV antigen presentation
PLOS Pathogens | https://doi.org/10.1371/journal.ppat.1008442 March 20, 2020 5 / 24
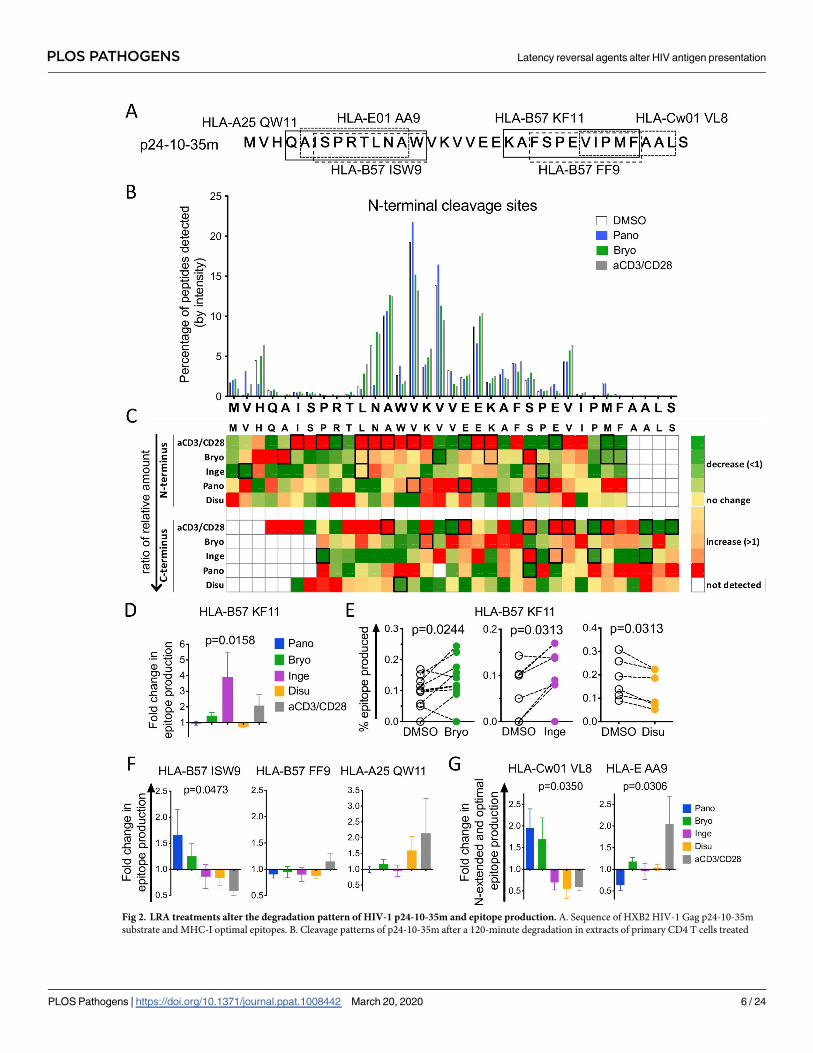
Fig 2. LRA treatments alter the degradation pattern of HIV-1 p24-10-35m and epitope production. A. Sequence of HXB2 HIV-1 Gag p24-10-35m
substrate and MHC-I optimal epitopes. B. Cleavage patterns of p24-10-35m after a 120-minute degradation in extracts of primary CD4 T cells treated
PLOS PATHOGENS Latency reversal agents alter HIV antigen presentation
PLOS Pathogens | https://doi.org/10.1371/journal.ppat.1008442 March 20, 2020 6 / 24
mostly as shortly N-extended peptides such as Cw-01 VL8 and HLA-E AA9 also showed dif-
ferent production patterns according to LRA treatments. Like ISW9, VL8-containing peptides
accumulated with treatments lowering peptidase activities while AA9 production was only
increased in aCD3/CD28 extracts (Fig 2G).
We similarly assessed the processing of another HIV fragment, p24-161-24mer, after LRAs
or aCD3/CD28 treatments (Fig 3A). Anti-CD3/CD28 treatment changed 12 (11/12 increased)
N- or C-terminal cleavage sites while Bryostatin treatment significantly increased 6 cleavage
sites. Panobinostat decreased peptide production at most aa (Fig 3B). The production of epi-
topes HLA-A02 YL9, HLA-A24 DT9, HLA-A33 DR11 and HLA-B35 QW9 were increased in
PKCa- and aCD3/CD28-treated extracts (Fig 3C) with variable fold change across donors in
LRA-treated extracts (Fig 3D). Altogether these data show that HDACi and PKCa induced het-
erogenous and often opposite changes in cleavage sites which variably affected HIV epitope
production. While many known HIV epitopes saw increased production upon PKCa treat-
ment and reduction or limited changes upon HDACi treatment, other epitopes such as
B57-ISW9 or CW01-VL8 were increased in conditions lowering peptidase activities (HDACi
treatment). We previously showed ISW9 is among the most degradable p24 sequences while
KF11 or DT9 were less degradable in the cytosol of primary cells [51]. Thus, the degradability
of a specific sequence together with drug-induced increased or decreased hydrolytic activities
will set changes in peptide production upon LRA treatment. Highly degradable sequences may
only accumulate in reduced hydrolytic environment while poorly degradable epitopes may be
processed faster in higher hydrolytic conditions.
LRAs change the production of degradation peptides and their distribution
across the HIV sequence
We analyzed whether LRA-induced changes in peptidase activities and cleavage sites could
broaden or narrow the production of degradation peptides of 8-11aa (a size compatible with
MHC-I loading) beyond known HIV epitopes (Fig 4). For both p24-10-35m and p24-161-24m
we measured the contribution of each aa to the amount of 8-11aa peptides across the sequence,
generating a density plot (Fig 4A and 4C) and a heatmap (Fig 4B and 4D) of the sequence cover-
age by 8-11aa degradation peptides. In p24-10-35m the amount of 8-11aa peptides was higher
in Bryostatin- or aCD3/CD28-treated extracts than in DMSO- or Panobinostat-treated extracts,
and the difference was heightened by up to 5-times in the second half of the sequence (Fig 4A).
This is in agreement with the lower degradability of the second half of p24-10-35m that may
subsist under higher hydrolytic activities induced by PKCa or aCD3/CD28 [37,51]. We then cal-
culated a ratio of peptide coverage in treated over DMSO extracts for each condition in multiple
with DMSO- (open bars), Panobinostat- (blue), Bryostatin- (green) or aCD3/CD28–treated (grey) showing the relative amount of fragments starting at
each residue (N-terminus cleavage site). Results shown for a representative experiment. C. Ratios of the relative amount of fragments starting (top) and
ending (bottom) at each residue in matched DMSO- over LRA-treated samples (n = 6–15). Changes in fragments starting (N-terminus) or ending (C-
terminus) at each position appear as decreased (green;<1), increased (orange/red;>1) or unchanged (yellow) compared to DMSO-treated samples.
Wilcoxon matched-pairs signed-rank t tests were performed on the matched DMSO- and LRA-treated samples. The boxed squares indicate statistical
significance (p < 0.05). D. Fold change in HLA-B57-KF11 epitope production in CD4 T cell extracts treated with Panobinostat- (blue), Bryostatin-
(green), Ingenol- (purple), Disulfiram- (orange) or aCD3/CD28-treated (grey) extracts over matched DMSO-treated extracts (n = 6–10 donors). One-
Way ANOVA Kruskal-Wallis tests on the 5 groups and the p-value is reported. E. Percentage of HLA-B57-restricted KF11 epitope produced in paired
DMSO- (open circles) and Bryostatin- (green, n = 9, left), Ingenol- (purple, n = 6, middle) or Disulfiram- (orange, n = 6, right). Wilcoxon matched-pairs
signed-rank t tests were performed. F. Fold change in HLA-B57 ISW9 (left, n = 4–9 donors), HLA-B57 FF9 (middle, n = 5–12 donors) and HLA-A25
QW11 (right, n = 2–6 donors) epitope production in paired Panobinostat- (blue), Bryostatin- (green), Ingenol- (purple), Disulfiram- (orange) or aCD3/
CD28-treated (grey) CD4 T cell over paired DMSO-treated extracts. G. Fold change in HLA-Cw01 VL8 (left, n = 2–6 donors) and HLA-E01 AA9 (right,
n = 5–9 donors) epitope and N-extended precursors production in Panobinostat- (blue), Bryostatin- (green), Ingenol- (purple), Disulfiram- (orange) or
aCD3/CD28-treated (grey) CD4 T cell extracts over paired DMSO-treated extracts. F and G: One-Way ANOVA Kruskal-Wallis tests were performed on
the 5 groups and the p-value is reported if statistically significant.
https://doi.org/10.1371/journal.ppat.1008442.g002
PLOS PATHOGENS Latency reversal agents alter HIV antigen presentation
PLOS Pathogens | https://doi.org/10.1371/journal.ppat.1008442 March 20, 2020 7 / 24
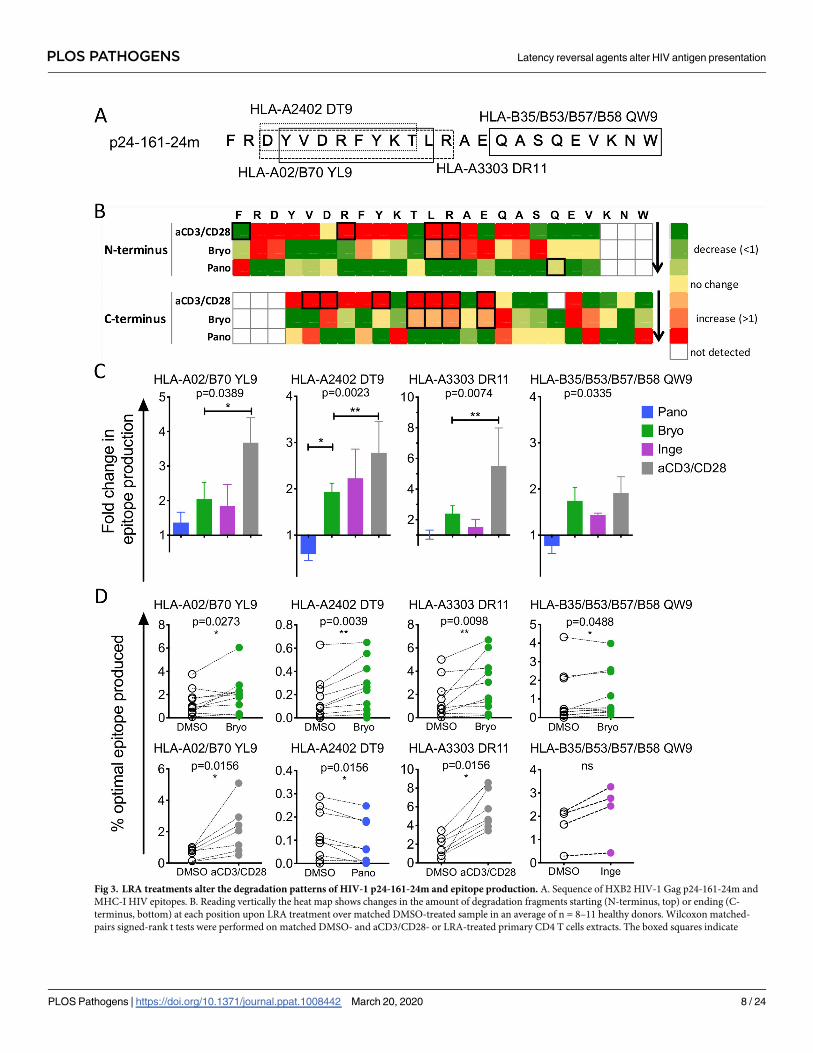
Fig 3. LRA treatments alter the degradation patterns of HIV-1 p24-161-24m and epitope production. A. Sequence of HXB2 HIV-1 Gag p24-161-24m and
MHC-I HIV epitopes. B. Reading vertically the heat map shows changes in the amount of degradation fragments starting (N-terminus, top) or ending (C-
terminus, bottom) at each position upon LRA treatment over matched DMSO-treated sample in an average of n = 8–11 healthy donors. Wilcoxon matched-
pairs signed-rank t tests were performed on matched DMSO- and aCD3/CD28- or LRA-treated primary CD4 T cells extracts. The boxed squares indicate
PLOS PATHOGENS Latency reversal agents alter HIV antigen presentation
PLOS Pathogens | https://doi.org/10.1371/journal.ppat.1008442 March 20, 2020 8 / 24
donors (n = 7–11) (Fig 4B). The coverage of the sequence by 8-11aa peptides in Panobinostat-
treated cells was similar to that of DMSO-treated cells with the exception of 3 residues with sig-
nificantly lower coverage. In extracts from aCD3/CD28 and from Ingenol-treated cells the cov-
erage of the sequence by 8-11aa was significantly higher throughout most of the 35-mer, in
accordance with increased peptidase activities leading to more frequent cleavage events.
In p24-161-24m, Panobinostat treatment reduced the production of 8-11aa peptides
throughout the sequence while Bryostatin and aCD3/CD28 increased it in the first half of the
sequence by 2- to 5-fold (Fig 4C). The ratio of 8-11aa produced in treated over DMSO treated
cells in n = 4–10 donors significantly increased in Bryostatin- and aCD3/CD28-treated cells
throughout most of the sequence and only in the first half of the sequence in Ingenol-treated
cells (Fig 4D). Throughout both p24 fragments PKCa treatments increased the density of 8-
11aa degradation peptides in areas most resistant to complete degradation [36,51], providing a
possible approach to increase production of nested peptide sets for MHC presentation.
Combination treatment of HDACi and PKCa modulate HIV antigen
processing
Since combinations of HDACi and PKCa improve HIV provirus reactivation [14,52,53], we
assessed the effects of Panobinostat and Bryostatin combination on antigen processing (Fig 5).
While treatment with Panobinostat or Bryostatin alone produced opposite effects on hydro-
lytic activities, the combination treatment did not significantly change -on average- aminopep-
tidase and proteasomal hydrolytic activities compared to DMSO-treated cells. However, we
observed large differences across donors in agreement with the variable effects of LRAs across
donors [14,52–55]. Interestingly the combination treatment did not reduce cellular activation
compared to Bryostatin treatment (Fig 5B left panel). Treatment of primary CD4 T cells with
either drug or even more for the HDACi+PKCa combination reduced CD3 expression (Fig 5B
right panel) as well as CD4 surface expression.
We compared the effect of single LRA or combination treatment on the degradation of
HIV p24-10-35m (Fig 5C). While the 3 main cleavage sites occurred at the same residues in all
conditions (A13, V15, V17), the relative abundance of peptides varied. Peptide abundance in
combination treatment sometime followed that of Bryostatin-treated cells (N11, V15, V17)
and less frequently that of Panobinostat-treated cells (I6). The combination treatment had
additive effect in decreasing peptide production (A13), increasing others (V2) or restored the
production of peptides (H3). Coverage of an antigenic fragment by 8-11aa degradation pep-
tides can be modulated and was intermediate between Bryostatin- or DMSO-treated extracts
after HDACi+PKCa combination treatments (Fig 5D).
LRA treatments affect endogenous processing and presentation of HIV
epitopes to CD8 T cells
To determine if LRA-induced changes in epitope production measured in vitro reflect changes
in endogenous processing and presentation, we measured epitope-specific CTL activation by
statistical significance (p< 0.05). C. Fold change in HLA-A02/B70 YL9 (left, n = 5–10 donors), HLA-A2402 DT9 (middle left, n = 5–12 donors) and HLA-A25
QW11 (right, n = 2–6 donors) epitope production in Panobinostat- (blue), Bryostatin- (green), Ingenol- (purple), or aCD3/CD28-treated (grey) CD4 T cell
extracts over paired DMSO-treated extracts. One-Way ANOVA Kruskal-Wallis tests were performed on the 4 groups and the associated p-value is reported,
Dunn’s Multi-comparison test was calculated and the pairs that statistically differed are indicated with a bar. D. The percentage of HLA-A02/B70 YL9,
HLA-A2402 DT9, HLA-A3303 DR11 and HLA-B35/B53/B57/B58 QW9 epitopes produced in paired DMSO- (open circles) and Bryostatin- (green, n = 8–10),
Ingenol- (purple, n = 4), Panobinostat- (blue, n = 9) or aCD3/CD28-treated (grey, n = 7) extracts. Wilcoxon matched-pairs signed-rank t tests were performed.� p< 0.05, �� p< 0.01, ns: not significant.
https://doi.org/10.1371/journal.ppat.1008442.g003
PLOS PATHOGENS Latency reversal agents alter HIV antigen presentation
PLOS Pathogens | https://doi.org/10.1371/journal.ppat.1008442 March 20, 2020 9 / 24
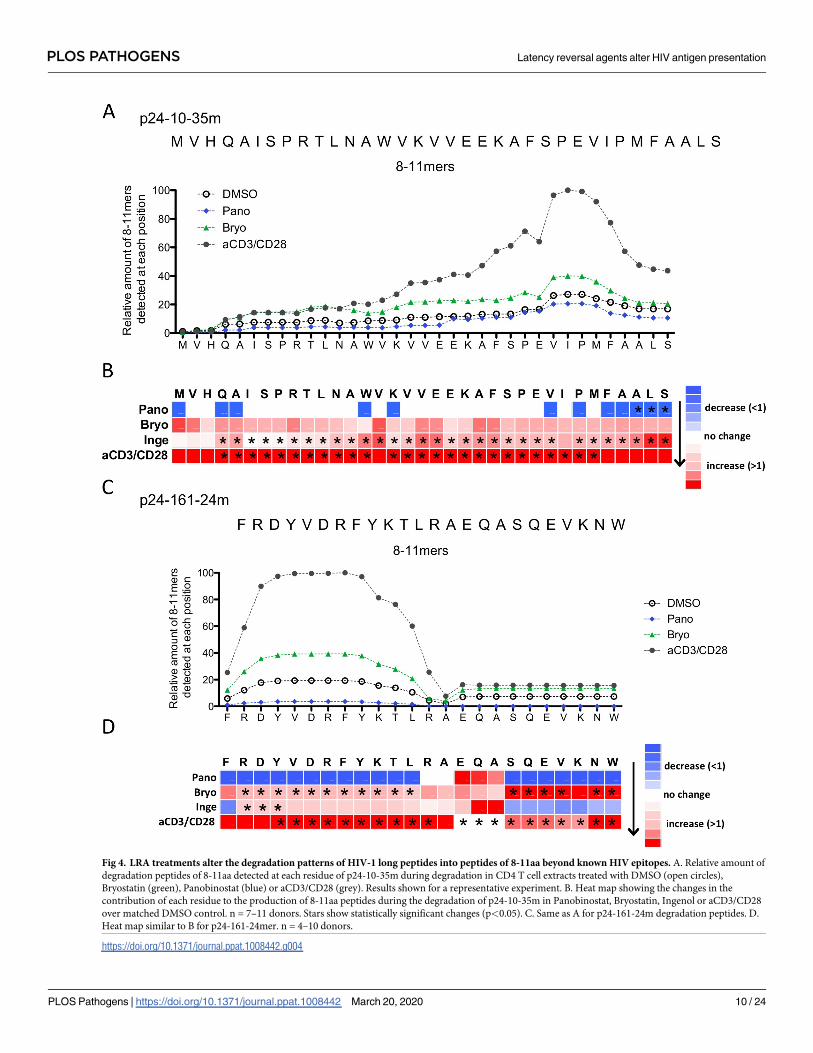
Fig 4. LRA treatments alter the degradation patterns of HIV-1 long peptides into peptides of 8-11aa beyond known HIV epitopes. A. Relative amount of
degradation peptides of 8-11aa detected at each residue of p24-10-35m during degradation in CD4 T cell extracts treated with DMSO (open circles),
Bryostatin (green), Panobinostat (blue) or aCD3/CD28 (grey). Results shown for a representative experiment. B. Heat map showing the changes in the
contribution of each residue to the production of 8-11aa peptides during the degradation of p24-10-35m in Panobinostat, Bryostatin, Ingenol or aCD3/CD28
over matched DMSO control. n = 7–11 donors. Stars show statistically significant changes (p<0.05). C. Same as A for p24-161-24m degradation peptides. D.
Heat map similar to B for p24-161-24mer. n = 4–10 donors.
https://doi.org/10.1371/journal.ppat.1008442.g004
PLOS PATHOGENS Latency reversal agents alter HIV antigen presentation
PLOS Pathogens | https://doi.org/10.1371/journal.ppat.1008442 March 20, 2020 10 / 24

Fig 5. Combined Bryostatin and Panobinostat treatment of CD4 T cells changes HIV peptide degradation patterns. A. Aminopeptidase (left) and proteasomal
chymotryptic (right) hydrolytic activities in paired DMSO- (open circles) and Panobinostat+Bryostatin-treated (filled circles) primary CD4 T cells measured at 48 h
post-treatment. n = 12 healthy donors. Wilcoxon matched-pairs signed-rank t tests. ns: not significant. B. The surface expression of CD3 (right) and CD25 and CD69
(left) was monitored by flow cytometry in primary CD4 T cells at 48 h post treatment with DMSO (open circles), Panobinostat (blue squares), Bryostatin (green
triangles), a combination of Panobinostat+Bryostatin (black inverted triangles) (n = 7 healthy donors). One-Way ANOVA Kruskal-Wallis tests were performed on
the 4 groups and the overall p-value is reported, Dunn’s Multi-comparison test was calculated and the pairs that statistically differed are indicated with a bar. �
p< 0.05, �� p< 0.01, ��� p< 0.001. C. Cleavage patterns of p24-10-35m after degradation in extracts from DMSO- (open bars), Panobinostat- (blue), Bryostatin-
(green) and combination Panobinostat+Bryostatin-treated (black) primary CD4 T cells extracts at 120 min, showing the relative amount of fragments starting (N-
terminus cleavage site) at each residue. Results shown for a representative experiment. D. Heat map representing the relative amount of 8–11 aa peptides containing
each aa. Each row represents an LRA-treatment. One representative experiment is shown.
https://doi.org/10.1371/journal.ppat.1008442.g005
PLOS PATHOGENS Latency reversal agents alter HIV antigen presentation
PLOS Pathogens | https://doi.org/10.1371/journal.ppat.1008442 March 20, 2020 11 / 24
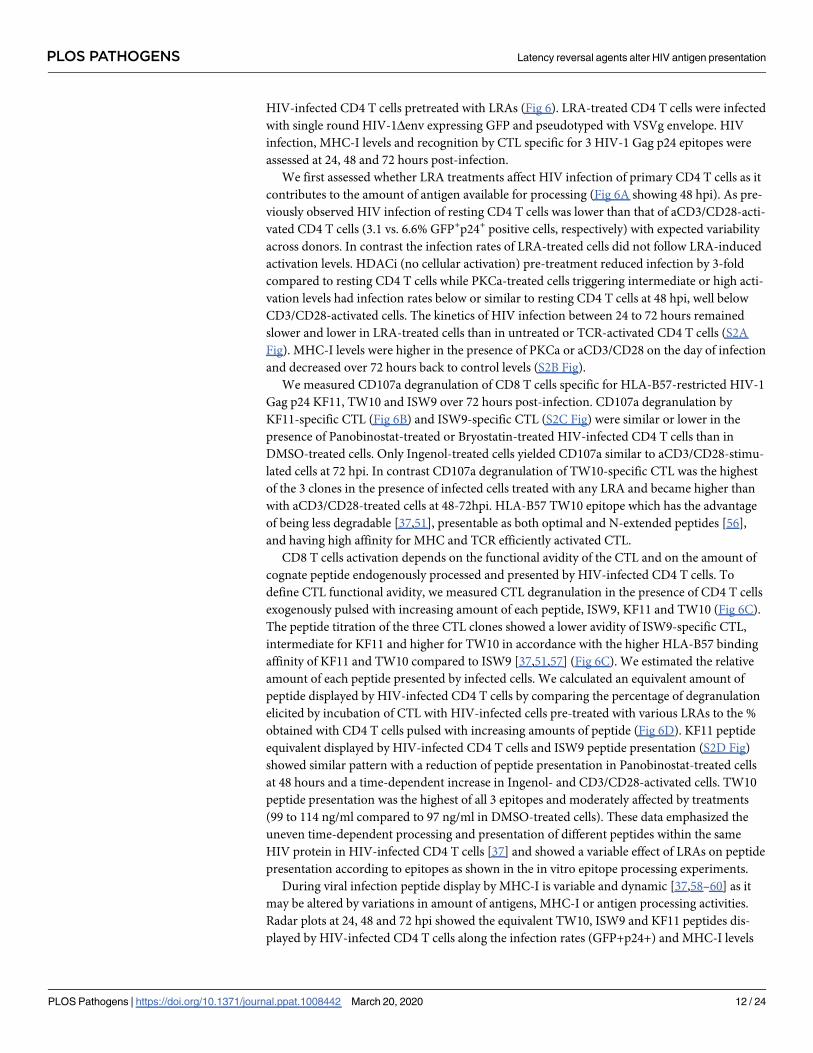
HIV-infected CD4 T cells pretreated with LRAs (Fig 6). LRA-treated CD4 T cells were infected
with single round HIV-1Δenv expressing GFP and pseudotyped with VSVg envelope. HIV
infection, MHC-I levels and recognition by CTL specific for 3 HIV-1 Gag p24 epitopes were
assessed at 24, 48 and 72 hours post-infection.
We first assessed whether LRA treatments affect HIV infection of primary CD4 T cells as it
contributes to the amount of antigen available for processing (Fig 6A showing 48 hpi). As pre-
viously observed HIV infection of resting CD4 T cells was lower than that of aCD3/CD28-acti-
vated CD4 T cells (3.1 vs. 6.6% GFP+p24+ positive cells, respectively) with expected variability
across donors. In contrast the infection rates of LRA-treated cells did not follow LRA-induced
activation levels. HDACi (no cellular activation) pre-treatment reduced infection by 3-fold
compared to resting CD4 T cells while PKCa-treated cells triggering intermediate or high acti-
vation levels had infection rates below or similar to resting CD4 T cells at 48 hpi, well below
CD3/CD28-activated cells. The kinetics of HIV infection between 24 to 72 hours remained
slower and lower in LRA-treated cells than in untreated or TCR-activated CD4 T cells (S2A
Fig). MHC-I levels were higher in the presence of PKCa or aCD3/CD28 on the day of infection
and decreased over 72 hours back to control levels (S2B Fig).
We measured CD107a degranulation of CD8 T cells specific for HLA-B57-restricted HIV-1
Gag p24 KF11, TW10 and ISW9 over 72 hours post-infection. CD107a degranulation by
KF11-specific CTL (Fig 6B) and ISW9-specific CTL (S2C Fig) were similar or lower in the
presence of Panobinostat-treated or Bryostatin-treated HIV-infected CD4 T cells than in
DMSO-treated cells. Only Ingenol-treated cells yielded CD107a similar to aCD3/CD28-stimu-
lated cells at 72 hpi. In contrast CD107a degranulation of TW10-specific CTL was the highest
of the 3 clones in the presence of infected cells treated with any LRA and became higher than
with aCD3/CD28-treated cells at 48-72hpi. HLA-B57 TW10 epitope which has the advantage
of being less degradable [37,51], presentable as both optimal and N-extended peptides [56],
and having high affinity for MHC and TCR efficiently activated CTL.
CD8 T cells activation depends on the functional avidity of the CTL and on the amount of
cognate peptide endogenously processed and presented by HIV-infected CD4 T cells. To
define CTL functional avidity, we measured CTL degranulation in the presence of CD4 T cells
exogenously pulsed with increasing amount of each peptide, ISW9, KF11 and TW10 (Fig 6C).
The peptide titration of the three CTL clones showed a lower avidity of ISW9-specific CTL,
intermediate for KF11 and higher for TW10 in accordance with the higher HLA-B57 binding
affinity of KF11 and TW10 compared to ISW9 [37,51,57] (Fig 6C). We estimated the relative
amount of each peptide presented by infected cells. We calculated an equivalent amount of
peptide displayed by HIV-infected CD4 T cells by comparing the percentage of degranulation
elicited by incubation of CTL with HIV-infected cells pre-treated with various LRAs to the %
obtained with CD4 T cells pulsed with increasing amounts of peptide (Fig 6D). KF11 peptide
equivalent displayed by HIV-infected CD4 T cells and ISW9 peptide presentation (S2D Fig)
showed similar pattern with a reduction of peptide presentation in Panobinostat-treated cells
at 48 hours and a time-dependent increase in Ingenol- and CD3/CD28-activated cells. TW10
peptide presentation was the highest of all 3 epitopes and moderately affected by treatments
(99 to 114 ng/ml compared to 97 ng/ml in DMSO-treated cells). These data emphasized the
uneven time-dependent processing and presentation of different peptides within the same
HIV protein in HIV-infected CD4 T cells [37] and showed a variable effect of LRAs on peptide
presentation according to epitopes as shown in the in vitro epitope processing experiments.
During viral infection peptide display by MHC-I is variable and dynamic [37,58–60] as it
may be altered by variations in amount of antigens, MHC-I or antigen processing activities.
Radar plots at 24, 48 and 72 hpi showed the equivalent TW10, ISW9 and KF11 peptides dis-
played by HIV-infected CD4 T cells along the infection rates (GFP+p24+) and MHC-I levels
PLOS PATHOGENS Latency reversal agents alter HIV antigen presentation
PLOS Pathogens | https://doi.org/10.1371/journal.ppat.1008442 March 20, 2020 12 / 24

Fig 6. LRAs affect endogenous HIV epitope processing and presentation by HIV-infected CD4 T cells to CD8+ T cells. A. HIV-1ΔEnv-GFP-VSVg
infection rate of primary CD4 T cells pretreated with DMSO (black), aCD3/CD28 (grey) or Panobinostat (blue), Bryostatin (green), Ingenol (purple) was
assessed by flow cytometry using GFP and HIV-p24 expression at 48 h post-infection (n = 7 donors with distinct symbols). B. Percentage of CD107a+ CD8 T
cells specific for HLA-B57 KF11 (left) and HLA-B57 TW10 (right) after incubation with HLA-B57+ HIV-infected CD4 T cells treated with DMSO, LRA or
PLOS PATHOGENS Latency reversal agents alter HIV antigen presentation
PLOS Pathogens | https://doi.org/10.1371/journal.ppat.1008442 March 20, 2020 13 / 24

of the same LRA-treated HIV-infected CD4 T cells scaled to the maximum value of each
parameter across time points (Fig 6E). At 24 hpi the equivalent peptide presented was the low-
est of all three time points for all 3 peptides despite presenting the highest level of MHC-I.
Despite low levels of HIV p24 and MHC-I, Panobinostat-treated cells (blue line) had the high-
est KF11 and ISW9 peptide presentations at 24 hours. In contrast despite having the second
highest levels of MHC-I and HIV infection the amount of ISW9, KF11 and TW10 presented
by Bryostatin-treated cells (green line) and aCD3/CD28-activated cells (grey line) were among
the lowest. At 48 hours aCD3/CD28-activated cells (grey line) had the highest equivalent pep-
tide display for all 3 epitopes. At 72 hours when HIV infection rates were the highest, Ingenol-
treated cells had the highest ISW9 and TW10 peptide equivalent presentation despite display-
ing the lowest levels of MHC-I. Altogether the data show that the equivalent HIV peptide pre-
sentation varied over time and was variably affected by LRAs but was not directly correlated
with MHC-I levels or infection rates.
Considering the impact of LRAs on the kinetics of HIV antigen expression (S2A Fig) we
calculated a score of efficiency of HIV peptide presentation defined as the ratio of peptide
equivalent displayed by CD4 T cells over the HIV infection rates (GFP+p24+), an indirect mea-
surement of the amount of HIV antigens present inside cells (Fig 6F). At 24 hours Ingenol-
treated cells had the highest score of peptide presentation efficiency for all 3 epitopes. DMSO-
treated and Panobinostat-treated cells were the second highest. The efficiency of presentation
was the lowest for aCD3/CD28- and Bryostatin-treated cells. Overtime the efficiency of peptide
presentation by Ingenol-treated or DMSO-treated cells decreased while that of aCD3/CD28-
and Bryostatin-treated cells increased. The data showed a dynamic peptide presentation not
solely driven by variations in MHC-I or antigen levels. Additionally, they unexpectedly
revealed that LRAs such as Ingenol can increase at early time points the efficiency of HIV pep-
tide presentation despite low levels of antigens.
Discussion
The underlying principle of shock and kill strategies is to unlock HIV transcriptional blocks
with latency reversal agents, induce HIV expression and cell death by apoptosis [3] or immune
clearance [2,3]. LRAs tested so far induced HIV RNA expression to various extents but led to
relatively small changes in the size of reservoirs in vivo [9,61]. Beside the efficacy of LRAs, the
capacity of pre-existing immune responses to clear reservoirs is uncertain and additional vac-
cine-induced immune responses are likely needed [10,11,13,62,63].
Most LRAs selected so far to relieve transcriptional blocks act on signaling pathways and
histone acetylation [5,64] but are not specific to HIV LTR promoters or targeted to the reser-
voirs, thus their effect should be considered globally on genes and cellular machineries of cell
populations [48–50,65]. The LRA-induced changes in cellular peptidase activities took 48
aCD3/CD28 at 24, 48 and 72h post-infection at a 4:1 CTL:CD4 ratio. For each treatment (DMSO, LRA or aCD3/CD28 beads) control uninfected LRA- or
beads-treated CD4 T cells were included in the experiment and used to calculate and subtract CD107a background. C. Percentage of CD107a+ CD8 T cells
specific for HLA-B57 ISW9- (cyan), KF11- (orange) and TW10- specific (red) after incubation with peptide-pulsed DMSO-treated HLA-B57+ CD4 T cells
measured at a 4:1 CTL:CD4 ratio. A-C: n = 6 experiments with mean values and standard deviations. D. Peptide equivalent (KF11 (right) and TW10 (left),
displayed at the surface of HIV-infected HLA-B57+ CD4 T cells treated with DMSO (open blank symbols), Panobinostat (blue squares), Bryostatin (green
triangles), Ingenol (inverted purple triangles) and CD3/CD28-stimulated (grey diamonds). The results of n = 5 (TW10) and n = 4 (KF11) infection and
degranulation experiments are shown at 24, 48 and 72 hpi. E. Spider plots showing the peptide equivalent (TW10, KF11, ISW9 in ng/ml), HIV infection rates
(% GFP+p24+), MHC-I surface levels (mfi) displayed by HIV-infected CD4 T cells pre-treated with DMSO (yellow), aCD3/CD28 (grey), Panobinostat (blue),
Bryostatin (green), Ingenol (purple). Axes for any given parameter were scaled uniformly across timepoints to take into account the full dynamic range (i.e.,
minimum to maximum value for that parameter across the 3 timepoints). Spider plots at 24, 48 and 72 h (left to right) after HIV infection of pre-treated CD4
T cells. F. Spider plots similar to E showing the efficiency of peptide presentation (TW10, KF11, ISW9) defined at the peptide equivalent (TW10, KF11, ISW9)
displayed by HIV-infected CD4 T cells divided by the infection rate (% GFP+p24+, an indirect measurement of HIV antigens in cells).
https://doi.org/10.1371/journal.ppat.1008442.g006
PLOS PATHOGENS Latency reversal agents alter HIV antigen presentation
PLOS Pathogens | https://doi.org/10.1371/journal.ppat.1008442 March 20, 2020 14 / 24

hours to reach maximum effect both for HDACi and PKCa, suggesting a transcriptional effect
either on the expression of the antigen processing machinery or on proteins regulating its
activity rather than a direct binding to peptidases’ catalytic sites. Bryostatin can enhance pro-
teasome activities in fibroblasts [43] while disulfiram effect on NF-κB inhibited proteasome
activities in cell lines [42]. The RNA expression of some proteasome subunits was modulated
in an in vitro latency model upon LRA treatment [55] but neither proteasome expression and
hydrolytic activities, nor the impact on antigen processing were assessed.
LRA-induced changes in peptidase activities of CD4 T cells altered degradation patterns of
long HIV peptides and epitope production in a sequence- and time-dependent manner. To
explain the heterogenous effect of LRA on peptide production and presentation, one needs to
consider two interconnected parameters: 1) the intracellular hydrolytic activity levels that are
defined by the cell type and the treatment applied to cells, and 2) the degradability of a given
antigenic sequence. We and others showed that various CD4+ cell types [35,36,39,40,66] and
resting and TCR-activated CD4 T cells [37] present different levels of cellular peptidase activi-
ties that influence HIV degradation patterns. Additionally HIV sequences within a protein are
variably sensitive to cytosolic degradation, as illustrated by the higher degradability of the first
half of the p24-10-35mer containing ISW9 epitope compared to the second half of the 35mer
containing HLA-B57 KF11. We showed that even peptides of 8-11aa present a cytosolic half-
life varying from a few seconds to hours [51]. This variable sensitivity of HIV sequences to
cytosolic degradation is driven by motifs associated with sensitivity/resistance to degradation
and shapes the amount of peptides available for MHC loading [51]. When peptidase activities
are reduced as seen with HDACi treatment, sequences highly sensitive to degradation are less
degraded and better presented as seen for ISW9 at early time points. Conversely poorly
degradable sequences are processed and trimmed slower, leading to a lesser and/or slower pre-
sentation of degradation-resistant peptides and indirectly favoring the early presentation of
the most degradable areas of HIV. Upon increased peptidase activities (as seen with PKCa
treatment) cutting events and peptide trimming or degradation increase which could acceler-
ate the production of the less degradable peptides such as intracellularly highly stable
HLA-B57 TW10 or HLA-B57 KF11 but conversely increase the degradation of the most sensi-
tive sequences such as HLA-B57 ISW9. Since the sensitivity or resistance to degradation is
driven by motifs it will eventually be possible to identify and predict areas of HIV antigens that
may yield 8-11aa peptides, or conversely define hydrolytic activities yielding the largest num-
ber of 8-11aa. The increased coverage of long HIV peptides by degradation products of 8-11aa
in the presence of PKCa provides an initial way to increase the variety and/or number of pep-
tides available for MHC presentation.
The endogenous processing and MHC presentation of HIV peptides to immune cells
encapsulates not only the kinetics and amount of peptide production but also MHC levels and
binding affinity of peptides (optimal epitopes or extended versions) for MHC and the TCR.
When accounting for the amount of HIV antigen available inside cells and MHC levels, Inge-
nol was remarkably efficient at increasing the presentation of all 3 HLA-B57 peptides at early
times (when antigen amount was low) while Bryostatin was efficient at late time points.
Whether this relative enhanced peptide presentation remains true for other HIV epitopes
remains to be determined. However, the increased production of 8-11aa long peptides and the
enhanced efficiency of peptide presentation at low levels of antigens induced by certain LRAs
offer new opportunities to broaden the MHC-peptide repertoire for immune detection and
define novel targets for immune clearance after latency reversal. As many HIV-specific pre-
existing T cell responses may express inhibitory markers [8–10,28], additional novel vaccine-
induced latency reversal-specific immune responses may be needed to clear reservoirs [67].
Eliciting immune responses against areas of HIV proteome whose processing and presentation
PLOS PATHOGENS Latency reversal agents alter HIV antigen presentation
PLOS Pathogens | https://doi.org/10.1371/journal.ppat.1008442 March 20, 2020 15 / 24
is enhanced by LRAs even at low levels of antigens may provide an additional way to improve
immune detection of reservoirs. It will be critical to assess whether HIV epitope presentation
is modulated by LRAs after latency reversal ex vivo in latently infected CD4 T cells from
patients or in reservoirs in vivo. Improved ex vivo latency models [55,68], streamlined ways to
generate or expand epitope-specific CTL [69] and the promising use of immunodeficient mice
repopulated with HIV-infected patients’ PBMCs [70] or of humanized BLT (bone-marrow-
liver-thymus) mice in recent latency reversal studies [30] may allow to test how the modulation
of peptide presentation by LRAs affects immune responses and could be exploited for reservoir
clearance.
While this study was focused on the presentation of peptides restricted by conventional
HLAs and mostly HLA-A or -B, the modulation of peptide processing might also affect presen-
tation by HLA-C or non-conventional HLA-E that can activate HIV-specific cytolytic NK cell
functions [71,72]. Although a MHC-dependent role of cytolytic NK cells after latency reversal
remains to be established, the effect of LRA on HIV peptide presentation could also be consid-
ered and exploited for these immune responses [73].
The HDACi and PKCa tested so far in clinical trials and used in this study are not very effi-
cient at reactivating HIV expression from reservoirs. The most efficient LRAs usually induce
cellular activation and the addition of immunomodulatory agents (IMA) such as Ruxolitinib
[74,75] have been tested ex vivo but even the combination of LRA and IMA modulates HIV
antigen processing. New LRAs such as those triggering the non-canonical NF-κB pathway [30]
or new LRAs combined with inclusion of TLR ligands [24] or PD-1 blockade [25] will be
needed to specifically and efficiently reactivate CD4 cell subsets harboring latent proviruses
[55,76]. The present study provides a proof of principle that LRAs, current and future more
efficacious drugs, should be assessed not only for their capacity to reactivate HIV transcription
or to produce HIV particles in ex vivo assays, but also for their impact on antigen processing
and their capacity to promote HIV peptide presentation. Ultimately to eliminate HIV reser-
voirs once provirus transcription is reactivated, a high expression of antigens is probably not
necessary as only a few to a few hundreds of MHC-peptides are needed for T cell-mediated
immune recognition. However, enhancing peptide presentation despite low levels of antigens
after LRA treatment (rather than aiming for high levels of antigens) and possibly broadening
the repertoire of surface peptides provides an initial yet unexplored way toward improved res-
ervoir detection. Predicting, ensuring and even improving the presentation of diverse HIV
peptides against which functional pre-existing or new vaccine-induced immune responses will
support efficient immune clearance of reservoirs. Beyond HIV reservoir clearance, the capacity
of LRAs to modulate the relative presentation of various antigenic fragments and to enhance
peptide presentation at low levels of antigens could be exploited and integrated in novel immu-
notherapy strategies (provided adequate targeting) to clear diseased cells in tumors or other
chronic disorders [77].
Material and methods
Ethics statement
Cells were isolated from buffy coats of anonymous healthy blood donors obtained from the
Massachusetts General Hospital blood center (Boston, MA) after approval by the Partners
Human Research Committee under protocol 2005P001218.
Latency reversing agents
Romidepsin, Bryostatin, Disulfiram (Sigma), Ingenol-3-angelate (Santa Cruz Biotechnologies),
Panobinostat (Selleckchem) were dissolved in DMSO (Fisher Scientific) to make stock
PLOS PATHOGENS Latency reversal agents alter HIV antigen presentation
PLOS Pathogens | https://doi.org/10.1371/journal.ppat.1008442 March 20, 2020 16 / 24

solutions. Fresh aliquots were used for each experiment. The final concentrations for each
LRA in cell culture were as follows: Panobinostat (30 nM), Romidepsin (40 nM), Disulfiram
(500 nM), Bryostatin (10 nM), Ingenol-3-angelate (50 nM). Maximum in vitro stimulation was
achieved by addition of anti-CD3/CD28 magnetic beads (Fisher Scientific) at a ratio of 1:1
bead to T cell as in [37]. For combination treatment, both drugs were added at the same time.
Primary cells
CD4 T cells were isolated by negative selection from fresh PBMCs purified from buffy coats
using a CD4+ T cell enrichment magnetic isolation kit (Stemcell Technologies). CD4 T cells
were cultured in the presence of 50 Units/mL of Interleukin-2 (NIH AIDS Research and Refer-
ence Reagents Program or R&D systems). Cytotoxic CD8 T cell clones and CD4 T cell clones
were isolated by limited dilution, maintained in R10+ medium supplemented with IL-2 and
stimulated for proliferation with irradiated PBMCs and OKT3 and CD28.2 or OKT3 antibod-
ies (eBioscience), respectively.
Peptidase activities in live CD4 T cells
The proteasome hydrolytic activities caspase-like (50 μM Z-LLE-AMC; EMD Millipore), tryp-
tic (50 μM Boc-LRR-AMC; Bachem), chymotryptic (50 μM Suc-LLVY-AMC; Bachem), post-
proteasomal aminopeptidases (50 μM H-Leu-AMC; Bachem) were measured in 25x103 live
CD4 T cells at given time points after drug treatment with peptidase-specific fluorogenic sub-
strates as in [37,40]. The specificity of each catalytic reaction was checked by pre-incubating
cells for 30 min with inhibitors of proteasome (10 μM MG132; Enzo Life Sciences), aminopep-
tidases (120 μM Bestatin; Sigma-Aldrich), before the addition of substrate. The rate of fluores-
cence emission, which is proportional to the proteolytic activity, was measured every 600 s at
37˚C in a Victor-3 Plate Reader (Perkin Elmer), as in [37].
In vitro degradation experiments and mass spectrometry
2 nmol of pure peptide (MGH peptide core facility or Biosynthesis, Texas) was degraded with
15 ug of CD4 T cell extracts at 37˚C in pH7.4 degradation buffer as in [37,40]. Aliquots were
taken at various time points and the reaction was stopped by addition of 5% (v/v) of Formic
acid (Thermo Scientific) and the degradation products were purified by trichloroacetic acid
(Sigma) precipitation (final concentration 5% (v/v)) and identified by in-house mass spec-
trometry as previously described [37]. Briefly, equal amounts of the purified degradation prod-
ucts were injected into a NanoLC Ultra-HPLC (Eksigent) for salt removal and separation, then
online nanosprayed into an LTQ Orbitrap Discovery mass spectrometer (Thermo) for identifi-
cation. Peptides were separated in a NanoLC column (ChromXP C18, 3 um 120Å; Eksigent)
over a gradient of 2–60% buffer B (buffer A: 0.1% (v/v) formic acid in MS-grade water (Fisher
Scientific)); buffer B: 0.1% (v/v) formic acid in MS-grade acetonitrile (Fisher Scientific) in 95
min with a conserved flow rate of 250 nl/min. Mass spectra were recorded in the 370–2000
Daltons range. In the tandem mass spectrometry mode, the eight most intense peaks were
selected with a window of 1 Dalton and fragmented using helium as collision gas and a voltage
of 35 V. Peaks in the mass spectra were searched against the source peptide databases with Pro-
teome Discoverer (version 1.3; Thermo) and quantitatively analyzed. For a given peptide, the
integrated area under the peak is proportional to the relative abundance of the peptide in the
sample. Each sample was run on the mass spectrometer at least twice.
PLOS PATHOGENS Latency reversal agents alter HIV antigen presentation
PLOS Pathogens | https://doi.org/10.1371/journal.ppat.1008442 March 20, 2020 17 / 24

Endogenous processing and presentation assay to CD8 T cells
HLA-B57+ primary CD4 T cells were either treated with LRA, stimulated with anti-CD3/
CD28 or kept in culture with no stimulation for 48 hours. The cells were thoroughly washed
and magnetic anti-CD3/CD28 beads were removed. For each condition, 2 million of CD4 T
cells were infected with 20 ug HIV Gag p24 equivalent of NL4-3-Δenv-GFP virus pseudotyped
with Vesicular Stomatitis Virus glycoprotein (VSV-g) in the presence of 5ug/mL polybrene
(Sigma) by spinfection for 1.5 h at 2000x g as in [37]. At 24, 48 and 72 h post-infection, CD4 T
cells were plated with epitope-specific CD8 T cells at a ratio of 1:4 (CD4:CD8) and an aliquot
of CD4 T cells was also harvested to measure HIV-1 infection through GFP and HIV-1 p24
intracellular expression, as well as cellular activation and HLA class I surface expression by
flow cytometry. After 30 min of co-culture, CD107a-Pe-Cy7 (BD Biosciences) and CD28/
CD49d antibodies (BD Biosciences) were added to each well to measure CTL degranulation.
After 6 h cells were harvested for surface staining.
The avidity of the CTL clones was assessed by performing a concentration-course titration.
Target HLA-B57 CD4 T cells were incubated with increasing concentration of the cognate
peptides (0.000002–2 ug/mL) before co-culture with the corresponding CD8 T cells as
described above.
Flow cytometry
Untreated or LRA-treated CD4 T cells were stained with CD4-BV605, CD3-Pacific Blue (BD
Biosciences) and HLA-ABC-AlexaFluor700 (Biolegend) to assess purity (95–99%) and
CD38-FITC, CD69-PE, CD25-PerCpCy5.5 and HLA-DR-APC (BD Biosciences) to measure
surface activation marker levels. Cellular activation levels were calculated by first gating on the
double negative population of CD25 and CD69 of the non-treated sample on live, CD4- and
CD3-positive cells and applying the same gates to the LRA-treated and CD3/CD28-stimulated
samples as done in [37]. A similar gating strategy was applied to determine the proportion of
CD38- and HLA-DR-positive CD4 T cells.
For degranulation experiments using HLA-B57-expressing CD4 T cell clone with CD8 T
cell clones, the co-cultured cells were stained with CD4-BV605, CD8-APC-Cy7, CD3-Pacific
Blue and CD107a-Pe-Cy7 (BD Biosciences). CD107a-positive cells were gated from the live,
CD4-negative, CD3- and CD8-positive cells. Non-HIV-infected CD4 T cells pre-treated with
DMSO, LRA or aCD3/CD28 with were used to calculate background degranulation at each
time point for each experiment. The target CD4 T cells were stained with CD4-BV605,
CD3-Pacific Blue, CD25-PerCpCy5.5, CD69-APC (BD Biosciences), and HLA-ABC-Alexa-
Fluor 700 (Biolegend). HIV-1 infection was assessed by GFP expression and HIV-1 p24 intra-
cellular protein staining using KC57-RD1 HIV p24 antibody (Beckman-Coulter). HIV-
infected CD4 T cells were gated as live, CD3- and CD4-positive cells that were both expressing
GFP and HIV-1 p24. Non-infected CD4 T cells similarly pre-treated were used to calculate
background staining. All mean fluorescence intensity (mfi) values were calculated using geo-
metric mean. Samples were run on a BD 4 Laser LSRII flow cytometer and analyzed using
FlowJo software (FlowJo, LLC).
Statistical analysis and data visualization
Experimental data were analyzed using Microsoft Excel and GraphPad Prism version 5.0f
(GraphPad Software). Spearman’s rank correlation was used to examine bivariate associations
and Wilcoxon signed rank test was used to compare measurements between paired non-
treated and LRA-stimulated samples. All p values are two-sided and p values lower than 5%
were considered statistically significant.
PLOS PATHOGENS Latency reversal agents alter HIV antigen presentation
PLOS Pathogens | https://doi.org/10.1371/journal.ppat.1008442 March 20, 2020 18 / 24

Dimensionality reduction was performed on multi-parametric datasets using the t-Distributed
Stochastic Neighbor Embedding (t-SNE) algorithm on scaled data [78]. t-SNE was run on cen-
tered and scaled (i.e., z-scored) data. Parameters critical for antigen presentation were visualized
using spider/radar plots. A different radar plot was generated for each timepoint. However, axes
for any given parameter were scaled uniformly across timepoints to take into account the full
dynamic range (i.e., minimum to maximum value for that parameter) across the 3 timepoints.
Supporting information
S1 Fig. Different classes of LRA alter cytosolic peptidase activities. Aminopeptidase, protea-
somal chymotryptic, tryptic-like and caspase-like hydrolytic activities in paired DMSO- (open
circles) and LRA-treated (filled circles) primary CD4 T cells measured at 48 h post-treatment.
Panobinostat, Romidepsin, Disulfiram, Bryostatin and Ingenol; results are shown for n = 7–15
healthy donors. Wilcoxon matched-pairs signed-rank t tests were performed. � p< 0.05, ��
p< 0.01, ��� p< 0.001, ns: not significant.
(TIF)
S2 Fig. LRA treatment affects endogenous processing and presentation of HIV epitopes by
HIV-infected CD4 T cells to CD8+ T cells. A. Primary CD4 T cells were treated with DMSO
(open circles), aCD3/CD28 (grey diamonds), Panobinostat (blue squares), Bryostatin (green
triangles), Ingenol (purple inverted triangles) 48 h prior to HIV-1 infection with HIV-1 NL4-
3-Denv-GFP pseudotyped with VSVg. The HIV infection rate of primary CD4 T cells was
assessed by flow cytometry (GFP and HIV-p24 expression) at 24, 48 and 72 h post-infection.
B. HLA class I levels were assessed by flow cytometry at 0, 24, 48 and 72 h post-infection in
DMSO, aCD3/CD28 and LRA-treated primary CD4 T cells. Changes upon treatment was
expressed as a ratio of HLA-ABC expression of LRA- or aCD3/CD28-treated cells by their
matching DMSO counterparts. Red line at ratio value = 1. C. The percentage of CD107a
+ HLA-B57 ISW9-specific CD8 T after incubation with DMSO (open circles), aCD3/CD28
(grey diamonds), Panobinostat (blue squares), Bryostatin (green triangles), Ingenol (purple
inverted triangles) HLA-B57+ CD4 T cells infected with HIV-1 NL4-3-ΔEnv-GFP pseudo-
typed with VSVg was measured at 24, 48 and 72 h post-infection at a 4:1 CTL:CD4 ratio. For
each treatment (DMSO, LRA or aCD3/CD28 beads) control uninfected LRA- or aCD3/CD28
beads-treated CD4 T cells were included in the experiment and used to calculate and subtract
CD107a background. D. The ISW9 peptide equivalent displayed by CD4 T cells pre-treated
with DMSO, LRA or aCD3/CD28 was shown at 24, 48, 72 hpi E. The efficiency of HIV peptide
presentation score at 24, 48 and 72 hpi was calculated for HLA-B57 ISW9 by dividing the rela-
tive amount of peptide presented at the cell surface by the % GFP+p24+ as indirect measure-
ment of HIV antigen content for each treatment condition at 24, 48 and 72 h post-infection.
n = 6 experiments as mean values with standard deviation.
(TIF)
Acknowledgments
The authors are grateful to the individuals who volunteered to give blood. We thank former
and current group members for helpful discussions, Mike Waring, director of the Ragon flow
core for advice and A. Trocha for advice on CTL clone maintenance, Dr D. Kaufmann for the
HLA-B57 CD4 T cell line, Dr B. Corleis for sharing buffy coat processing duties.
Author Contributions
Conceptualization: Sylvie Le Gall.
PLOS PATHOGENS Latency reversal agents alter HIV antigen presentation
PLOS Pathogens | https://doi.org/10.1371/journal.ppat.1008442 March 20, 2020 19 / 24
Data curation: Julie Boucau, Neelambari Joshi, Sylvie Le Gall.
Formal analysis: Julie Boucau, Jishnu Das, Sylvie Le Gall.
Funding acquisition: Sylvie Le Gall.
Investigation: Julie Boucau.
Methodology: Julie Boucau, Neelambari Joshi.
Software: Jishnu Das.
Supervision: Sylvie Le Gall.
Validation: Julie Boucau, Jishnu Das.
Visualization: Julie Boucau, Jishnu Das.
Writing – original draft: Sylvie Le Gall.
Writing – review & editing: Julie Boucau, Jishnu Das, Neelambari Joshi, Sylvie Le Gall.
References1. Chomont N, El-Far M, Ancuta P, Trautmann L, Procopio FA, Yassine-Diab B, et al. HIV reservoir size
and persistence are driven by T cell survival and homeostatic proliferation. Nat Med. 2009; 15(8):893–
900. https://doi.org/10.1038/nm.1972 PMID: 19543283
2. Churchill MJ, Deeks SG, Margolis DM, Siliciano RF, Swanstrom R. HIV reservoirs: what, where and
how to target them. Nature reviews Microbiology. 2016; 14(1):55–60. https://doi.org/10.1038/nrmicro.
2015.5 PMID: 26616417
3. Kim Y, Anderson JL, Lewin SR. Getting the "Kill" into "Shock and Kill": Strategies to Eliminate Latent
HIV. Cell host & microbe. 2018; 23(1):14–26.
4. Margolis DM, Garcia JV, Hazuda DJ, Haynes BF. Latency reversal and viral clearance to cure HIV-1.
Science. 2016; 353(6297):aaf6517. https://doi.org/10.1126/science.aaf6517 PMID: 27463679
5. Rasmussen TA, Lewin SR. Shocking HIV out of hiding: where are we with clinical trials of latency
reversing agents? Curr Opin HIV AIDS. 2016; 11(4):394–401. https://doi.org/10.1097/COH.
0000000000000279 PMID: 26974532
6. Ho YC, Shan L, Hosmane NN, Wang J, Laskey SB, Rosenbloom DI, et al. Replication-Competent Non-
induced Proviruses in the Latent Reservoir Increase Barrier to HIV-1 Cure. Cell. 2013; 155(3):540–51.
https://doi.org/10.1016/j.cell.2013.09.020 PMID: 24243014
7. Pollack RA, Jones RB, Pertea M, Bruner KM, Martin AR, Thomas AS, et al. Defective HIV-1 Proviruses
Are Expressed and Can Be Recognized by Cytotoxic T Lymphocytes, which Shape the Proviral Land-
scape. Cell host & microbe. 2017; 21(4):494–506 e4.
8. Jones RB, Walker BD. HIV-specific CD8(+) T cells and HIV eradication. J Clin Invest. 2016; 126
(2):455–63. https://doi.org/10.1172/JCI80566 PMID: 26731469
9. Zerbato JM, Purves HV, Lewin SR, Rasmussen TA. Between a shock and a hard place: challenges and
developments in HIV latency reversal. Curr Opin Virol. 2019; 38:1–9. https://doi.org/10.1016/j.coviro.
2019.03.004 PMID: 31048093
10. Walker-Sperling VE, Cohen VJ, Tarwater PM, Blankson JN. Reactivation Kinetics of HIV-1 and Suscep-
tibility of Reactivated Latently Infected CD4+ T Cells to HIV-1-Specific CD8+ T Cells. J Virol. 2015; 89
(18):9631–8. https://doi.org/10.1128/JVI.01454-15 PMID: 26178987
11. Ruiz A, Blanch-Lombarte O, Jimenez-Moyano E, Ouchi D, Mothe B, Pena R, et al. Antigen Production
After Latency Reversal and Expression of Inhibitory Receptors in CD8+ T Cells Limit the Killing of HIV-1
Reactivated Cells. Frontiers in immunology. 2018; 9:3162. https://doi.org/10.3389/fimmu.2018.03162
PMID: 30723480
12. Kuo HH, Ahmad R, Lee GQ, Gao C, Chen HR, Ouyang Z, et al. Anti-apoptotic Protein BIRC5 Maintains
Survival of HIV-1-Infected CD4(+) T Cells. Immunity. 2018; 48(6):1183–94 e5. https://doi.org/10.1016/j.
immuni.2018.04.004 PMID: 29802019
13. Huang SH, Ren Y, Thomas AS, Chan D, Mueller S, Ward AR, et al. Latent HIV reservoirs exhibit inher-
ent resistance to elimination by CD8+ T cells. J Clin Invest. 2018; 128(2):876–89. https://doi.org/10.
1172/JCI97555 PMID: 29355843
PLOS PATHOGENS Latency reversal agents alter HIV antigen presentation
PLOS Pathogens | https://doi.org/10.1371/journal.ppat.1008442 March 20, 2020 20 / 24
14. Darcis G, Kula A, Bouchat S, Fujinaga K, Corazza F, Ait-Ammar A, et al. An In-Depth Comparison of
Latency-Reversing Agent Combinations in Various In Vitro and Ex Vivo HIV-1 Latency Models Identified
Bryostatin-1+JQ1 and Ingenol-B+JQ1 to Potently Reactivate Viral Gene Expression. PLoS Pathog.
2015; 11(7):e1005063. https://doi.org/10.1371/journal.ppat.1005063 PMID: 26225566
15. Archin NM, Liberty AL, Kashuba AD, Choudhary SK, Kuruc JD, Crooks AM, et al. Administration of vori-
nostat disrupts HIV-1 latency in patients on antiretroviral therapy. Nature. 2012; 487(7408):482–5.
https://doi.org/10.1038/nature11286 PMID: 22837004
16. Wei DG, Chiang V, Fyne E, Balakrishnan M, Barnes T, Graupe M, et al. Histone deacetylase inhibitor
romidepsin induces HIV expression in CD4 T cells from patients on suppressive antiretroviral therapy at
concentrations achieved by clinical dosing. PLoS Pathog. 2014; 10(4):e1004071. https://doi.org/10.
1371/journal.ppat.1004071 PMID: 24722454
17. Sogaard OS, Graversen ME, Leth S, Olesen R, Brinkmann CR, Nissen SK, et al. The Depsipeptide
Romidepsin Reverses HIV-1 Latency In Vivo. PLoS Pathog. 2015; 11(9):e1005142. https://doi.org/10.
1371/journal.ppat.1005142 PMID: 26379282
18. Rasmussen TA, Tolstrup M, Brinkmann CR, Olesen R, Erikstrup C, Solomon A, et al. Panobinostat, a
histone deacetylase inhibitor, for latent-virus reactivation in HIV-infected patients on suppressive antire-
troviral therapy: a phase 1/2, single group, clinical trial. Lancet HIV. 2014; 1(1):e13–21. https://doi.org/
10.1016/S2352-3018(14)70014-1 PMID: 26423811
19. Spivak AM, Andrade A, Eisele E, Hoh R, Bacchetti P, Bumpus NN, et al. A pilot study assessing the
safety and latency-reversing activity of disulfiram in HIV-1-infected adults on antiretroviral therapy. Clin
Infect Dis. 2014; 58(6):883–90. https://doi.org/10.1093/cid/cit813 PMID: 24336828
20. Elliott JH, McMahon JH, Chang CC, Lee SA, Hartogensis W, Bumpus N, et al. Short-term administra-
tion of disulfiram for reversal of latent HIV infection: a phase 2 dose-escalation study. Lancet HIV. 2015;
2(12):e520–9. https://doi.org/10.1016/S2352-3018(15)00226-X PMID: 26614966
21. Offersen R, Nissen SK, Rasmussen TA, Ostergaard L, Denton PW, Sogaard OS, et al. A Novel Toll-
Like Receptor 9 Agonist, MGN1703, Enhances HIV-1 Transcription and NK Cell-Mediated Inhibition of
HIV-1-Infected Autologous CD4+ T Cells. J Virol. 2016; 90(9):4441–53. https://doi.org/10.1128/JVI.
00222-16 PMID: 26889036
22. Tsai A, Irrinki A, Kaur J, Cihlar T, Kukolj G, Sloan DD, et al. Toll-Like Receptor 7 Agonist GS-9620
Induces HIV Expression and HIV-Specific Immunity in Cells from HIV-Infected Individuals on Suppres-
sive Antiretroviral Therapy. J Virol. 2017;91(8).
23. Macedo AB, Novis CL, De Assis CM, Sorensen ES, Moszczynski P, Huang SH, et al. Dual TLR2 and
TLR7 agonists as HIV latency-reversing agents. JCI Insight. 2018; 3(19).
24. Macedo AB, Novis CL, Bosque A. Targeting Cellular and Tissue HIV Reservoirs With Toll-Like Receptor
Agonists. Front Immunol. 2019; 10:1–15. https://doi.org/10.3389/fimmu.2019.00001
25. Fromentin R, DaFonseca S, Costiniuk CT, El-Far M, Procopio FA, Hecht FM, et al. PD-1 blockade
potentiates HIV latency reversal ex vivo in CD4(+) T cells from ART-suppressed individuals. Nature
communications. 2019; 10(1):814. https://doi.org/10.1038/s41467-019-08798-7 PMID: 30778080
26. Jones RB, Mueller S, O’Connor R, Rimpel K, Sloan DD, Karel D, et al. A Subset of Latency-Reversing
Agents Expose HIV-Infected Resting CD4+ T-Cells to Recognition by Cytotoxic T-Lymphocytes. PLoS
Pathog. 2016; 12(4):e1005545. https://doi.org/10.1371/journal.ppat.1005545 PMID: 27082643
27. Katlama C, Lambert-Niclot S, Assoumou L, Papagno L, Lecardonnel F, Zoorob R, et al. Treatment
intensification followed by interleukin-7 reactivates HIV without reducing total HIV DNA: a randomized
trial. AIDS. 2016; 30(2):221–30. https://doi.org/10.1097/QAD.0000000000000894 PMID: 26684819
28. McBrien JB, Mavigner M, Franchitti L, Smith SA, White E, Tharp GK, et al. Robust and persistent reacti-
vation of SIV and HIV by N-803 and depletion of CD8(+) cells. Nature. 2020.
29. Li P, Kaiser P, Lampiris HW, Kim P, Yukl SA, Havlir DV, et al. Stimulating the RIG-I pathway to kill cells
in the latent HIV reservoir following viral reactivation. Nat Med. 2016; 22(7):807–11. https://doi.org/10.
1038/nm.4124 PMID: 27294875
30. Nixon CC, Mavigner M, Sampey GC, Brooks AD, Spagnuolo RA, Irlbeck DM, et al. Systemic HIV and
SIV latency reversal via non-canonical NF-kappaB signalling in vivo. Nature. 2020.
31. Boucau J, Le Gall S. Antigen processing and presentation in HIV infection. Mol Immunol. 2018; 113:67–
74. https://doi.org/10.1016/j.molimm.2018.03.027 PMID: 29636181
32. Beninga J, Rock KL, Goldberg A. Interferon-gamma can stimulate post-proteasomal trimming of the N
terminus of an antigenic peptide by inducing leucine aminopeptidase. J Biol Chem. 1998; 273
(30):18734–42. https://doi.org/10.1074/jbc.273.30.18734 PMID: 9668046
33. Loureiro J, Ploegh HL. Antigen presentation and the ubiquitin-proteasome system in host-pathogen
interactions. Adv Immunol. 2006; 92:225–305. https://doi.org/10.1016/S0065-2776(06)92006-9 PMID:
17145306
PLOS PATHOGENS Latency reversal agents alter HIV antigen presentation
PLOS Pathogens | https://doi.org/10.1371/journal.ppat.1008442 March 20, 2020 21 / 24

34. Crespo MI, Zacca ER, Nunez NG, Ranocchia RP, Maccioni M, Maletto BA, et al. TLR7 triggering with
polyuridylic acid promotes cross-presentation in CD8alpha+ conventional dendritic cells by enhancing
antigen preservation and MHC class I antigen permanence on the dendritic cell surface. J Immunol.
2013; 190(3):948–60. https://doi.org/10.4049/jimmunol.1102725 PMID: 23284054
35. Dinter J, Duong E, Lai NY, Berberich MJ, Kourjian G, Bracho-Sanchez E, et al. Variable Processing and
Cross-presentation of HIV by Dendritic Cells and Macrophages Shapes CTL Immunodominance and
Immune Escape. PLoS Pathog. 2015; 11(3):e1004725. https://doi.org/10.1371/journal.ppat.1004725
PMID: 25781895
36. Dinter J, Gourdain P, Lai NY, Duong E, Bracho-Sanchez E, Rucevic M, et al. Different antigen process-
ing activities in dendritic cells, macrophages and monocytes lead to uneven production of HIV epitopes
and affect CTL recognition. Journal of Immunology. 2014; 193(9):4322–34.
37. Boucau J, Madouasse J, Kourjian G, Carlin CS, Wambua D, Berberich MJ, et al. The Activation State of
CD4 T Cells Alters Cellular Peptidase Activities, HIV Antigen Processing, and MHC Class I Presentation
in a Sequence-Dependent Manner. J Immunol. 2019; 202(10):2856–72. https://doi.org/10.4049/
jimmunol.1700950 PMID: 30936293
38. Trujillo JA, Croft NP, Dudek NL, Channappanavar R, Theodossis A, Webb AI, et al. The cellular redox
environment alters antigen presentation. J Biol Chem. 2014; 289(40):27979–91. https://doi.org/10.
1074/jbc.M114.573402 PMID: 25135637
39. Kourjian G, Xu Y, Mondesire-Crump I, Shimada M, Gourdain P, Le Gall S. Sequence-Specific Alter-
ations of Epitope Production by HIV Protease Inhibitors. J Immunol. 2014; 192:3496–506. https://doi.
org/10.4049/jimmunol.1302805 PMID: 24616479
40. Kourjian G, Rucevic M, Berberich MJ, Dinter J, Wambua D, Boucau J, et al. HIV Protease Inhibitor-
Induced Cathepsin Modulation Alters Antigen Processing and Cross-Presentation. J Immunol. 2016;
196(9):3595–607. https://doi.org/10.4049/jimmunol.1600055 PMID: 27009491
41. Andre P, Groettrup M, Klenerman P, de Giuli R, Booth BL Jr., Cerundolo V, et al. An inhibitor of HIV-1
protease modulates proteasome activity, antigen presentation, and T cell responses. Proc Natl Acad
Sci U S A. 1998; 95(22):13120–4. https://doi.org/10.1073/pnas.95.22.13120 PMID: 9789051
42. Lovborg H, Oberg F, Rickardson L, Gullbo J, Nygren P, Larsson R. Inhibition of proteasome activity,
nuclear factor-KappaB translocation and cell survival by the antialcoholism drug disulfiram. Int J Cancer.
2006; 118(6):1577–80. https://doi.org/10.1002/ijc.21534 PMID: 16206267
43. Khan TK, Nelson TJ. Protein kinase C activator bryostatin-1 modulates proteasome function. J Cell Bio-
chem. 2018; 119(8):6894–904. https://doi.org/10.1002/jcb.26887 PMID: 29693282
44. Chun TW, Chadwick K, Margolick J, Siliciano RF. Differential susceptibility of naive and memory CD4+
T cells to the cytopathic effects of infection with human immunodeficiency virus type 1 strain LAI. J Virol.
1997; 71(6):4436–44. PMID: 9151834
45. Doitsh G, Greene WC. Dissecting How CD4 T Cells Are Lost During HIV Infection. Cell host & microbe.
2016; 19(3):280–91.
46. Valle-Casuso JC, Angin M, Volant S, Passaes C, Monceaux V, Mikhailova A, et al. Cellular Metabolism
Is a Major Determinant of HIV-1 Reservoir Seeding in CD4(+) T Cells and Offers an Opportunity to
Tackle Infection. Cell Metab. 2019; 29(3):611–26 e5. https://doi.org/10.1016/j.cmet.2018.11.015 PMID:
30581119
47. Hosmane NN, Kwon KJ, Bruner KM, Capoferri AA, Beg S, Rosenbloom DI, et al. Proliferation of latently
infected CD4+ T cells carrying replication-competent HIV-1: Potential role in latent reservoir dynamics.
J Exp Med. 2017; 214(4):959–72. https://doi.org/10.1084/jem.20170193 PMID: 28341641
48. Clutton G, Xu Y, Baldoni PL, Mollan KR, Kirchherr J, Newhard W, et al. The differential short- and long-
term effects of HIV-1 latency-reversing agents on T cell function. Scientific reports. 2016; 6:30749.
https://doi.org/10.1038/srep30749 PMID: 27480951
49. Walker-Sperling VE, Pohlmeyer CW, Tarwater PM, Blankson JN. The Effect of Latency Reversal
Agents on Primary CD8+ T Cells: Implications for Shock and Kill Strategies for Human Immunodefi-
ciency Virus Eradication. EBioMedicine. 2016; 8:217–29. https://doi.org/10.1016/j.ebiom.2016.04.019
PMID: 27428432
50. Zhao M, De Crignis E, Rokx C, Verbon A, van Gelder T, Mahmoudi T, et al. T cell toxicity of HIV latency
reversing agents. Pharmacol Res. 2019; 139:524–34. https://doi.org/10.1016/j.phrs.2018.10.023
PMID: 30366100
51. Lazaro E, Kadie C, Stamegna P, Zhang SC, Gourdain P, Lai NY, et al. Variable HIV peptide stability in
human cytosol is critical to epitope presentation and immune escape. J Clin Invest. 2011; 121(6):2480–
92. https://doi.org/10.1172/JCI44932 PMID: 21555856
52. Richard K, Williams DE, de Silva ED, Brockman MA, Brumme ZL, Andersen RJ, et al. Identification of
Novel HIV-1 Latency-Reversing Agents from a Library of Marine Natural Products. Viruses. 2018; 10
(7).
PLOS PATHOGENS Latency reversal agents alter HIV antigen presentation
PLOS Pathogens | https://doi.org/10.1371/journal.ppat.1008442 March 20, 2020 22 / 24

53. Desimio MG, Giuliani E, Ferraro AS, Adorno G, Doria M. In Vitro Exposure to Prostratin but Not Bryosta-
tin-1 Improves Natural Killer Cell Functions Including Killing of CD4(+) T Cells Harboring Reactivated
Human Immunodeficiency Virus. Frontiers in immunology. 2018; 9:1514. https://doi.org/10.3389/
fimmu.2018.01514 PMID: 30008723
54. Srivatsan SR, McFaline-Figueroa JL, Ramani V, Saunders L, Cao J, Packer J, et al. Massively multiplex
chemical transcriptomics at single-cell resolution. Science. 2020; 367(6473):45–51. https://doi.org/10.
1126/science.aax6234 PMID: 31806696
55. Kulpa DA, Talla A, Brehm JH, Ribeiro SP, Yuan S, Bebin-Blackwell AG, et al. Differentiation to an effec-
tor memory phenotype potentiates HIV-l latency reversal in CD4+ T cells. J Virol. 2019.
56. Pymm P, Illing PT, Ramarathinam SH, O’Connor GM, Hughes VA, Hitchen C, et al. MHC-I peptides get
out of the groove and enable a novel mechanism of HIV-1 escape. Nat Struct Mol Biol. 2017; 24
(4):387–94. https://doi.org/10.1038/nsmb.3381 PMID: 28218747
57. Le Gall S, Stamegna P, Walker BD. Portable flanking sequences modulate CTL epitope processing. J
Clin Invest. 2007; 117(11):3563–75. https://doi.org/10.1172/JCI32047 PMID: 17975674
58. Croft NP, Smith SA, Wong YC, Tan CT, Dudek NL, Flesch IE, et al. Kinetics of antigen expression and
epitope presentation during virus infection. PLoS Pathog. 2013; 9(1):e1003129. https://doi.org/10.1371/
journal.ppat.1003129 PMID: 23382674
59. Ternette N, Block P, Bernabeu AS, Borthwick N, Pappalardo E, Abdul-Jawad S, et al. Early kinetics of
HLA class I-associated peptidome of MVA.HIVconsv-infected cells. J Virol. 2015; 89(11):5760–71.
https://doi.org/10.1128/JVI.03627-14 PMID: 25810538
60. Spencer CT, Bezbradica JS, Ramos MG, Arico CD, Conant SB, Gilchuk P, et al. Viral infection causes
a shift in the self peptide repertoire presented by human MHC class I molecules. Proteomics Clin Appl.
2015; 9(11–12):1035–52. https://doi.org/10.1002/prca.201500106 PMID: 26768311
61. Rasmussen TA, Tolstrup M, Sogaard OS. Reversal of Latency as Part of a Cure for HIV-1. Trends in
microbiology. 2016; 24(2):90–7. https://doi.org/10.1016/j.tim.2015.11.003 PMID: 26690612
62. Buzon MJ, Yang Y, Ouyang Z, Sun H, Seiss K, Rogich J, et al. Susceptibility to CD8 T cell-mediated kill-
ing influences the reservoir of latently HIV-1 infected CD4 T cells. J Acquir Immune Defic Syndr. 2013.
63. Shan L, Deng K, Shroff NS, Durand CM, Rabi SA, Yang HC, et al. Stimulation of HIV-1-specific cytolytic
T lymphocytes facilitates elimination of latent viral reservoir after virus reactivation. Immunity. 2012; 36
(3):491–501. https://doi.org/10.1016/j.immuni.2012.01.014 PMID: 22406268
64. Khoury G, Darcis G, Lee MY, Bouchat S, Van Driessche B, Purcell DFJ, et al. The Molecular Biology of
HIV Latency. Adv Exp Med Biol. 2018; 1075:187–212. https://doi.org/10.1007/978-981-13-0484-2_8
PMID: 30030794
65. Bradley T, Ferrari G, Haynes BF, Margolis DM, Browne EP. Single-Cell Analysis of Quiescent HIV
Infection Reveals Host Transcriptional Profiles that Regulate Proviral Latency. Cell reports. 2018; 25
(1):107–17 e3. https://doi.org/10.1016/j.celrep.2018.09.020 PMID: 30282021
66. Steers NJ, Currier JR, Kijak GH, di Targiani RC, Saxena A, Marovich MA, et al. Cell type-specific pro-
teasomal processing of HIV-1 Gag-p24 results in an altered epitope repertoire. J Virol. 2011; 85
(4):1541–53. https://doi.org/10.1128/JVI.01790-10 PMID: 21106750
67. Smith KN, Mailliard RB, Piazza PA, Fischer W, Korber BT, Fecek RJ, et al. Effective Cytotoxic T Lym-
phocyte Targeting of Persistent HIV-1 during Antiretroviral Therapy Requires Priming of Naive CD8+ T
Cells. MBio. 2016; 7(3).
68. Takata H, Kessing C, Sy A, Lima N, Sciumbata J, Mori L, et al. Modeling HIV-1 Latency Using Primary
CD4(+) T Cells from Virally Suppressed HIV-1-Infected Individuals on Antiretroviral Therapy. J Virol.
2019;93(11).
69. Patel S, Hanajiri R, Grant M, Saunders D, Van Pelt S, Keller M, et al. HIV-Specific T Cells Can Be Gen-
erated against Non-escaped T Cell Epitopes with a GMP-Compliant Manufacturing Platform. Mol Ther
Methods Clin Dev. 2020; 16:11–20. https://doi.org/10.1016/j.omtm.2019.10.001 PMID: 31720305
70. Flerin NC, Bardhi A, Zheng JH, Korom M, Folkvord J, Kovacs C, et al. Establishment of a Novel Human-
ized Mouse Model To Investigate In Vivo Activation and Depletion of Patient-Derived HIV Latent Reser-
voirs. J Virol. 2019; 93(6).
71. Davis ZB, Cogswell A, Scott H, Mertsching A, Boucau J, Wambua D, et al. A Conserved HIV-1-Derived
Peptide Presented by HLA-E Renders Infected T-cells Highly Susceptible to Attack by NKG2A/CD94-
Bearing Natural Killer Cells. PLoS Pathog. 2016; 12(2):e1005421. https://doi.org/10.1371/journal.ppat.
1005421 PMID: 26828202
72. Hannoun Z, Lin Z, Brackenridge S, Kuse N, Akahoshi T, Borthwick N, et al. Identification of novel HIV-1-
derived HLA-E-binding peptides. Immunol Lett. 2018; 202:65–72. https://doi.org/10.1016/j.imlet.2018.
08.005 PMID: 30172717
PLOS PATHOGENS Latency reversal agents alter HIV antigen presentation
PLOS Pathogens | https://doi.org/10.1371/journal.ppat.1008442 March 20, 2020 23 / 24

73. Florez-Alvarez L, Hernandez JC, Zapata W. NK Cells in HIV-1 Infection: From Basic Science to Vaccine
Strategies. Frontiers in immunology. 2018; 9:2290. https://doi.org/10.3389/fimmu.2018.02290 PMID:
30386329
74. Martin AR, Pollack RA, Capoferri A, Ambinder RF, Durand CM, Siliciano RF. Rapamycin-mediated
mTOR inhibition uncouples HIV-1 latency reversal from cytokine-associated toxicity. J Clin Invest.
2017; 127(2):651–6. https://doi.org/10.1172/JCI89552 PMID: 28094770
75. Spivak AM, Larragoite ET, Coletti ML, Macedo AB, Martins LJ, Bosque A, et al. Janus kinase inhibition
suppresses PKC-induced cytokine release without affecting HIV-1 latency reversal ex vivo. Retrovirol-
ogy. 2016; 13(1):88. https://doi.org/10.1186/s12977-016-0319-0 PMID: 27998278
76. Grau-Exposito J, Luque-Ballesteros L, Navarro J, Curran A, Burgos J, Ribera E, et al. Latency reversal
agents affect differently the latent reservoir present in distinct CD4+ T subpopulations. PLoS Pathog.
2019; 15(8):e1007991. https://doi.org/10.1371/journal.ppat.1007991 PMID: 31425551
77. Zhao D, Amria S, Hossain A, Sundaram K, Komlosi P, Nagarkatti M, et al. Enhancement of HLA class
II-restricted CD4+ T cell recognition of human melanoma cells following treatment with bryostatin-1.
Cell Immunol. 2011; 271(2):392–400. https://doi.org/10.1016/j.cellimm.2011.08.007 PMID: 21903207
78. van der Maaten L, Hinton G. Visualizing Data using t-SNE. Journal of Machine Learning Research
2008; 9:2579–605.
PLOS PATHOGENS Latency reversal agents alter HIV antigen presentation
PLOS Pathogens | https://doi.org/10.1371/journal.ppat.1008442 March 20, 2020 24 / 24