Effects of high-fructose corn syrup and sucrose consumption on circulating glucose, insulin, leptin,...
10
Applied nutritional investigation Effects of high-fructose corn syrup and sucrose consumption on circulating glucose, insulin, leptin, and ghrelin and on appetite in normal-weight women Kathleen J. Melanson, Ph.D., R.D., L.D. a , Linda Zukley, M.A., R.N. b , Joshua Lowndes, M.A. c , Von Nguyen, M.S., R.D. b , Theodore J. Angelopoulos, Ph.D., M.P.H. b,c, *, and James M. Rippe, M.D. b a Department of Nutrition and Food Sciences, University of Rhode Island, Kingston, Rhode Island, USA b Rippe Lifestyle Institute, Shrewsbury, Massachusetts, and Celebration Health, Celebration, Florida, USA c Center for Lifestyle Medicine and Department of Health Professions, University of Central Florida, Orlando, Florida, USA Manuscript received August 7, 2006; accepted November 6, 2006. Abstract Objective: Fructose has been implicated in obesity, partly due to lack of insulin-mediated leptin stimulation and ghrelin suppression. Most work has examined effects of pure fructose, rather than high-fructose corn syrup (HFCS), the most commonly consumed form of fructose. This study examined effects of beverages sweetened with HFCS or sucrose (Suc), when consumed with mixed meals, on blood glucose, insulin, leptin, ghrelin, and appetite. Methods: Thirty lean women were studied on two randomized 2-d visits during which HFCS- and Suc-sweetened beverages were consumed as 30% of energy on isocaloric diets during day 1 while blood was sampled. On day 2, food was eaten ad libitum. Subjects rated appetite at designated times throughout visits. Results: No significant differences between the two sweeteners were seen in fasting plasma glucose, insulin, leptin, and ghrelin (P 0.05). The within-day variation in all four items was not different between the two visits (P 0.05). Net areas under the curve were similar for glucose, insulin, and leptin (P 0.05). There were no differences in energy or macronutrient intake on day 2. The only appetite variable that differed between sweeteners was desire to eat, which had a higher area under the curve the day after Suc compared with HFCS. Conclusion: These short-term results suggest that, when fructose is consumed in the form of HFCS, the measured metabolic responses do not differ from Suc in lean women. Further research is required to examine appetite responses and to determine if these findings hold true for obese individuals, males, or longer periods. © 2007 Elsevier Inc. All rights reserved. Keywords: Sweeteners; Sugars; Fructose; Energy balance regulation; Food intake; Hunger; Satiety Introduction The consumption of total sugars has increased signif- icantly in the past 30 y in the United States, with shifts in the sources of sweeteners [1,2]. Before the mid-1960s carbonated soft drinks (CSDs) were largely sweetened with sucrose (Suc; 50% glucose and 50% fructose), but currently the leading source of fructose in the diet in the United States is high-fructose corn syrup (HFCS). HFCS-55 used in CSDs contains 55% fructose and 42% glucose [2]. It has been argued that increased consump- tion of fructose in the diet may be a contributing factor to the dramatic increase in obesity in the United States and other developed countries, because fructose does not stimulate the production and secretion of insulin [3,4]. A role for insulin in the regulation of energy balance and adiposity was postulated in the early 1970s [5], and since this time considerable evidence has supported this hypoth- This work was funded by PepsiCo. * Corresponding author. Tel.: 407-882-0036; fax: 407-882-0037. E-mail address: [email protected] (T. J. Angelopoulos). Nutrition 23 (2007) 103–112 www.elsevier.com/locate/nut 0899-9007/07/$ – see front matter © 2007 Elsevier Inc. All rights reserved. doi:10.1016/j.nut.2006.11.001
Transcript of Effects of high-fructose corn syrup and sucrose consumption on circulating glucose, insulin, leptin,...

Nutrition 23 (2007) 103–112ut
Applied nutritional investigation
Effects of high-fructose corn syrup and sucrose consumption oncirculating glucose, insulin, leptin, and ghrelin and on appetite in
normal-weight womenKathleen J. Melanson, Ph.D., R.D., L.D.a, Linda Zukley, M.A., R.N.b,
Joshua Lowndes, M.A.c, Von Nguyen, M.S., R.D.b,Theodore J. Angelopoulos, Ph.D., M.P.H.b,c,*,
and James M. Rippe, M.D.b
a Department of Nutrition and Food Sciences, University of Rhode Island, Kingston, Rhode Island, USAb Rippe Lifestyle Institute, Shrewsbury, Massachusetts, and Celebration Health, Celebration, Florida, USA
c Center for Lifestyle Medicine and Department of Health Professions, University of Central Florida, Orlando, Florida, USA
Manuscript received August 7, 2006; accepted November 6, 2006.
Abstract Objective: Fructose has been implicated in obesity, partly due to lack of insulin-mediated leptinstimulation and ghrelin suppression. Most work has examined effects of pure fructose, rather thanhigh-fructose corn syrup (HFCS), the most commonly consumed form of fructose. This studyexamined effects of beverages sweetened with HFCS or sucrose (Suc), when consumed with mixedmeals, on blood glucose, insulin, leptin, ghrelin, and appetite.Methods: Thirty lean women were studied on two randomized 2-d visits during which HFCS- andSuc-sweetened beverages were consumed as 30% of energy on isocaloric diets during day 1 whileblood was sampled. On day 2, food was eaten ad libitum. Subjects rated appetite at designated timesthroughout visits.Results: No significant differences between the two sweeteners were seen in fasting plasmaglucose, insulin, leptin, and ghrelin (P � 0.05). The within-day variation in all four items was notdifferent between the two visits (P � 0.05). Net areas under the curve were similar for glucose,insulin, and leptin (P � 0.05). There were no differences in energy or macronutrient intake on day2. The only appetite variable that differed between sweeteners was desire to eat, which had a higherarea under the curve the day after Suc compared with HFCS.Conclusion: These short-term results suggest that, when fructose is consumed in the form of HFCS,the measured metabolic responses do not differ from Suc in lean women. Further research isrequired to examine appetite responses and to determine if these findings hold true for obeseindividuals, males, or longer periods. © 2007 Elsevier Inc. All rights reserved.
Keywords: Sweeteners; Sugars; Fructose; Energy balance regulation; Food intake; Hunger; Satiety
www.elsevier.com/locate/n
-
s
t
.
-
t
-
Introduction
The consumption of total sugars has increased significantly in the past 30 y in the United States, with shifts inthe sources of sweeteners [1,2]. Before the mid-1960carbonated soft drinks (CSDs) were largely sweetenedwith sucrose (Suc; 50% glucose and 50% fructose), bu
This work was funded by PepsiCo.* Corresponding author. Tel.: �407-882-0036; fax: 407-882-0037.E-mail address: [email protected] (T. J. Angelopoulos).
0899-9007/07/$ – see front matter © 2007 Elsevier Inc. All rights reserved.doi:10.1016/j.nut.2006.11.001
currently the leading source of fructose in the diet in theUnited States is high-fructose corn syrup (HFCS)HFCS-55 used in CSDs contains 55% fructose and 42%glucose [2]. It has been argued that increased consumption of fructose in the diet may be a contributing factor tothe dramatic increase in obesity in the United States andother developed countries, because fructose does nostimulate the production and secretion of insulin [3,4].
A role for insulin in the regulation of energy balance andadiposity was postulated in the early 1970s [5], and sincethis time considerable evidence has supported this hypoth

t
-
.--
s
.
tt-
,
-t
st-
t
f-
r-
,
-
.-s
s
r-,--
l
t
-t-s,
-
,
-
.
t
s
-
104 K. J. Melanson et al. / Nutrition 23 (2007) 103–112
esis. Insulin may influence energy balance through direcactions on the central nervous system that regulate energyintake [6,7] and through its influence on leptin. Insulinmediated glucose uptake and metabolism in adipose tissueplays a key regulatory role in leptin concentrations [8,9]Leptin, whose diurnal patterns have been shown to be regulated by insulin [10], is recognized as a medium- to longterm regulator of energy balance through its effects onreducing energy intake and stimulating energy expenditure[11]. Deficits in leptin production have been demonstratedto be associated with increased body adiposity in human[10,12].
Blood glucose, insulin, and leptin tend to be inverselyrelated to circulating ghrelin in the fasting [13] and fed[14–16] states. Ghrelin, an orexigenic hormone secretedfrom the enteroendocrine cells of the stomach, is implicatedin short-term hunger, food intake, and body weight [17–20]Ghrelin administration in rodents leads to increased foodintake and body weight, and in humans it has been shown toincrease food intake [17,21]. Circulating ghrelin is highesin humans in the fasting state, shows premeal increases thaare associated with hunger and meal initiation, and is suppressed upon food ingestion [18,21,22]. Carbohydrate-richmeals have been shown to suppress ghrelin and associatedsubjective hunger more so than fat-rich meals [22,23]which is likely due to effects on glycemia and possiblyinsulinemia [10,15].
Fructose, unlike glucose, does not stimulate insulin secretion from the pancreatic B cells [24,25]. In a recenstudy, fructose, consumed with mixed meals, was shown toresult in decreased circulating insulin and leptin and toattenuate postprandial suppression of ghrelin in women acompared with dietary glucose [16]. It was concluded thathe differential effect of fructose on energy regulatory systems compared with glucose might contribute to increasedcaloric intake and ultimately contribute to weight gain andobesity during long-term consumption of a diet high infructose [16]. However, pure fructose and glucose are nocommonly consumed, as are Suc and HFCS. Based on thesefindings [16] and the fact that Suc has been replaced byHFCS to a large extent over the past 40 y, the primaryobjective of the present study was to compare the effects oHFCS with the effects of Suc on endocrine systems associated with energy balance, including insulin, leptin, andghrelin, and with appetite through subjective ratings and adlibitum consumption. The aim was to investigate whetheHFCS may have more deleterious effects on measured indicators of energy balance control as compared with Suc.
Materials and methods
Study design
This study was a single-site, randomized, prospectivedouble-blind trial comparing the effects of HFCS-55 (55%
fructose) with those of Suc (50% fructose) on circulatingconcentrations of hormones regulating body weight andappetite (insulin, leptin, and ghrelin) over 24 h. We hypothesized that there would be no significant differences in theseenergy regulatory systems when comparing HFCS-55 withSuc-sweetened CSDs in healthy-weight female volunteersThe protocol was approved by the Florida Hospital Celebration Health institutional review board, and all subjectsigned informed consents.
Subjects
Non-smoking women 20 to 60 y of age with body masindexes of 19–25 kg/m2 were recruited. Exclusion criteriaincluded prescription medications, consumption of morethan two carbonated soft drinks per day, or enrollment inweight-loss programs during the previous month, or a �5-lbweight loss during the past 3 mo. Other exclusions includeda surgical procedure for weight loss at any time or majosurgery within 3 mo of enrollment, history of thyroid disease, diabetes, glucose intolerance, cardiovascular diseasesuncontrolled hypertension, gastrointestinal disorders, cancer, eating disorders, pregnancy, lactation, dietary restrictions or allergies that would limit the ability to adhere todietary requirements of the study, consumption of �14alcoholic drinks per week, and caffeine dependency. Astandard 2-h oral glucose tolerance test was performed torule out the presence of impaired glucose tolerance in alparticipants.
Body composition was determined by air displacemenplethysmography in a self-contained system comprised of acomputer-integrated dual-chambered air plethysmographequipped with a digital scale (model 2000A, Life Measurements Incorporated, Concord, CA, USA). This equipmenand methodology have been validated extensively by reputable research groups over a wide range of test subject[26,27]. Fasting state multiple measurements were takenand percent body fat and lean body mass were calculatedfrom body volume as is done with other densitometricmethods [28]. To assess baseline dietary intake, all individuals completed a 3-d food record, which was analyzed byregistered dietitians trained to use the Nutrient Data Systemfor Research (NDS-R) software (University of MinnesotaMinneapolis, MN, USA).
Each subject underwent two experimental visits in randomized order, spaced 1 mo apart. Both visits included twonights and two days in the clinical metabolic unit (CMU)During the first 24-h period dietary intake was controlled(day 1), and subjective appetite was monitored. For the nex12 h, subjects ate ad libitum (day 2). During day 1, thecontrolled diet was accompanied by beverages sweetenedwith HFCS-55 (HFCS condition) or Suc (Suc condition), adescribed below. Being a double-blind study, neither thesubjects nor the investigators knew the identity of the beverages. The blinding was not broken until all analyses werecomplete.

r
-
tr
.
sttr-
.fl
lst
-
s
ts
,s
t-
,sr
l
ts
rs
r
s
t--,,
--,t
-
.
,
,trt-
r,
-.
,
-
105K. J. Melanson et al. / Nutrition 23 (2007) 103–112
All studies were conducted during the mid-folliculaphase of each subject’s menstrual cycle to avoid metabolicand appetitive shifts that may occur during menses, ovulation, and the late luteal phase in many women. Becausevisits were spaced 1 mo apart, they were scheduled so thaeach woman was tested on the same day of her cycle foboth test days. Subjects maintained normal dietary intakeand exercise during the interval between the study sessions
The 2 d before both test visits were preparation days. Thepurposes of these days were to ensure that the subjectfollowed general guidelines well to avoid factors that mighaffect the measurements during test visits and to ensure thasubjects entered each of the two testing visits in as similaa metabolic state as possible. During these 2 d, a standardized diet was followed by all subjects to control for energyand macronutrient intake and to ensure the ability to complywith dietary prescriptions. Volunteers were instructed indetail on diet and physical activity for the preparation daysThe diets reflected the energy and macronutrient contents ostandardized diets to be fed on the test visits. No alcohowas consumed by subjects on these preparation days, andcaffeine was limited to two beverages per day. Physicaactivity was restricted to �1 h of moderate to vigorouexercise each day. Upon arrival at the CMU, subjects mewith registered dietitians to verify compliance with thepreparation diet and activity day instructions.
The test visits commenced on the evening before eachexperimental session. Subjects entered the CMU at FloridaHospital Celebration Health at 1700 h (day 0). At 1800 h, astandardized dinner was given, with macronutrient distribution reflecting that of the controlled test diets, and energycomposition geared to meet one-third of each subject’estimated daily requirement (as described below). Theythen fasted overnight while staying in the CMU. The nexmorning (day 1), at 0800 h an intravenous catheter wainserted and kept patent with slow saline infusion to allowfor blood sampled over the next 24 h. During this time, thesubjects consumed the controlled diet as breakfast, lunchand dinner, served with the test beverages. These beveragewere sweetened with HFCS-55 or Suc as 30% of energyintake. Meals were ingested in entirety within 15 min whilesubjects were observed for compliance to standardize thetiming of data collection. Subjects rated appetite throughouthe day by using 10-cm visual analog scales (VASs; described below).
Blood sampling was complete on the morning of day 2but subjects remained in the CMU until 1900 h. During thitime, subjects were given breakfast, lunch, and dinnemenus of prepared various foods to be consumed ad libitumduring the meal. They were asked to select the foods theywished to eat and to eat as much as they would like. Alportions were served in excess. For beverages, they wereallowed to choose among decaffeinated coffee or tea, fruijuice, milk (non-fat, 2%, or whole), and water. Menu itemwere designed to be acceptably palatable, but not especiallyappealing to the senses, because the intention was for the
subjects to select according to physiologic hunger rathethan hedonic appeal. However, palatability of these foodwas rated by each subject on a VAS. Amounts consumedwere determined by weighed differences, but subjects werenot aware that their food intake was monitored. Ad libitumintake was only allowed during the three meals of the day toavoid interference with the VAS appetite ratings betweenmeals. Each subject was required to ingest �1 L of wateover the course of each study day. This was necessary toensure adequate hydration and standardize possible effectof fluid consumption on appetite. The total volume of fluidconsumed by each subject was carefully measured.
Diet
Each subject ingested breakfast, lunch, and dinner onday 1, which was the controlled intake day. The nutriencomposition of the diet was determined using NDS-R software. At 0900 h they ate a bagel, cream cheese, and scrambled eggs; at 1300 h they ate a chef’s salad with turkeycheese, and a dinner roll; at 1800 h they ate a chicken breastmashed potato, carrots, and a roll with butter. Total energyintake was individualized according to each subject’s estimated daily energy expenditure by using a direct measurement of resting metabolic rate (MedGem, HealtheTechGolden, CO, USA), along with an activity factor adjustmen(1.3). Percentages of energy coming from fat, protein, andcarbohydrate were 30%, 15%, and 55%, respectively. Thetotal carbohydrate component consisted of 25% from complex carbohydrate and 30% from HFCS-55 or Suc, whichwere used to sweeten the beverages served with the mealsSubjects were given periodic 10-cm VASs, timed aroundmeals, between each meal, and at bedtime, to rate hungerdesire to eat, and thirst. These scales were anchored by thestatements “not at all” and “extremely.”
Blood sampling and analyses
During the first 24 h when the catheter was in placeblood samples were obtained before and after each meal, a30-min intervals until 1300 h, and then hourly until catheteremoval the next morning. This protocol allowed frequensampling for �6 h after dinner completion, when a nocturnal rise in leptin secretion would be anticipated. For eachsample, 1 mL of blood was removed to clear saline from thecatheter, and then 5 mL was collected into an Vacutainetube (Becton Dickinson and Company, Franklin Lakes, NJUSA) containing ethylene diaminetetra-acetic acid. Plasmaglucose was measured with a YSI Glucose Analyzer (Yellow Springs Instruments, Yellow Springs, OH, USA)Plasma samples for analysis of insulin, leptin, and ghrelinwere treated with protease inhibitors, centrifuged, aliquotedand frozen at �80°C. Batches were sent on dry ice to LincoDiagnostic Services Inc. (St. Charles, MO, USA) and measured by radioimmunoassay.

s
s-
-
-s
r;
l,
-
str
)
-
ssoe
nsos
106 K. J. Melanson et al. / Nutrition 23 (2007) 103–112
Data analysis
A two-way analysis of variance with repeated measure(time and trial) was performed to assess differences in thefluctuations of glucose, insulin, leptin, ghrelin, and VASappetite ratings with respect to the two trials. Net areaunder the curve (AUCs) were calculated using the trapezoidal model for glucose, insulin, and leptin in accordance withthe method used by Teff et al. [16]. Absolute AUCs werealso calculated for VAS appetite ratings for each trial. Differences in AUC between the two trials were determinedusing a two-way analysis of variance with repeated measures (trial and order of treatment). Dietary intake waanalyzed with paired sample t tests for differences betweentrials on day 2 (ad libitum feeding). Significance levels weretwo-sided with an � value equal to 0.05. All data arereported as means � SD.
Results
Subjects
Characteristics of subjects in the study are listed inTable 1. As dictated by inclusion criteria, oral glucosetolerance test results were normal for all subjects. Therewere no significant differences in day of the menstrual cyclebetween the two experimental visits (HFCS visits 10.1 �2.3; Suc visits 9.4 � 2.8). Body weights also did not diffebetween experimental visits (HFCS visits 135.7 � 14.5 lbSuc visits 135.8 � 14.1 lb).
Blood glucose, insulin, leptin, and ghrelin
No significant differences between the two experimentavisits were seen in fasting plasma glucose, insulin, leptin
Table 1Subject characteristics
Variable Randomized (n � 30
Age (y) 33.0 � 10.6Systolic blood pressure (mmHg) 105.7 � 19.9Diastolic blood pressure (mmHg) 71.1 � 6.4Waist circumference (cm) 70.5 � 4.8BMI (kg/m2) 22.4 � 1.7Weight (kg) 60.2 � 6.6Body fat (%) 31.5 � 6.7Body fat (kg) 19.1 � 5.1Lean mass (kg) 41.3 � 5.0Cholesterol (mg/dL) 172.9 � 37.5Triacylglycerols (mg/dL) 76.4 � 34.9HDL cholesterol (mg/dL) 61.3 � 12.8LDL cholesterol (mg/dL) 96.3 � 29.7Cortisol (�g/dL) 14.2 � 6.0Insulin (�U/mL) 5.0 � 3.6Resting metabolic rate (kcal/24 h) 1387.0 � 220.2
BMI, body mass index; HDL, high-density lipoprotein; LDL, lowdensity lipoprotein
and ghrelin (P � 0.05). As shown in Figures 1 to 4, therewere no between-trial differences in within-day variationfor the two experimental visits for any of these four variables (interaction P � 0.05). Typical nocturnal peaks wereseen for leptin and ghrelin, which did not differ betweentreatments. For all blood variables measured, there were nosignificant differences between conditions regarding thechange from fasted to postprandial values at 30 or 60 minafter any of the three meals. After each meal, ghrelin wasuppressed in a similar manner by HFCS and Suc. NeAUCs for glucose, insulin, and leptin, which did not diffesignificantly, are presented in Table 2.
Fig. 1. Plasma glucose concentrations during day 1 of experimental visitin 30 women when consuming HFCS- or sucrose-sweetened beverages a30% of energy on eucaloric diets. To convert glucose concentrations tmillimoles per liter, multiply by 0.556. The calculated area under the curvis presented in Table 2. HFCS, high-fructose corn syrup.
Fig. 2. Plasma insulin concentrations during day 1 of experimental visits i30 women when consuming HFCS- or sucrose-sweetened beverages a30% of energy on eucaloric diets. To convert insulin concentrations tmicromoles per liter, multiply by 6. The calculated area under the curve ipresented in Table 2. HFCS, high-fructose corn syrup.
-l-
s
t.r
s--
,
fs
.
r
-
s
s
-
f.-
s
-
-f
nso
nsoe
107K. J. Melanson et al. / Nutrition 23 (2007) 103–112
Dietary intake
Comparisons of dietary intake between the two experimental visits are presented in Table 3. There were no between-triadifferences for any dietary component during ad libitum feeding (P � 0.05).
Appetite ratings
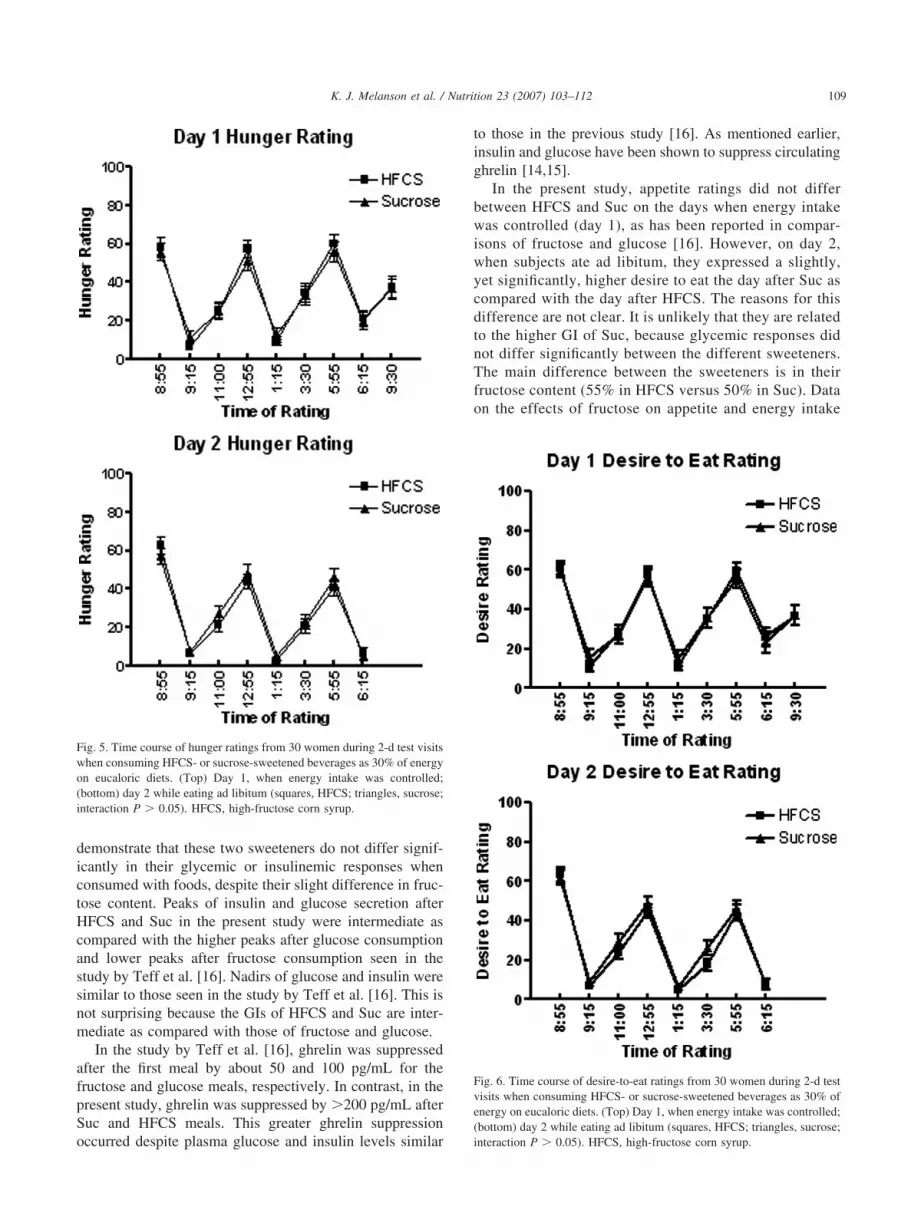
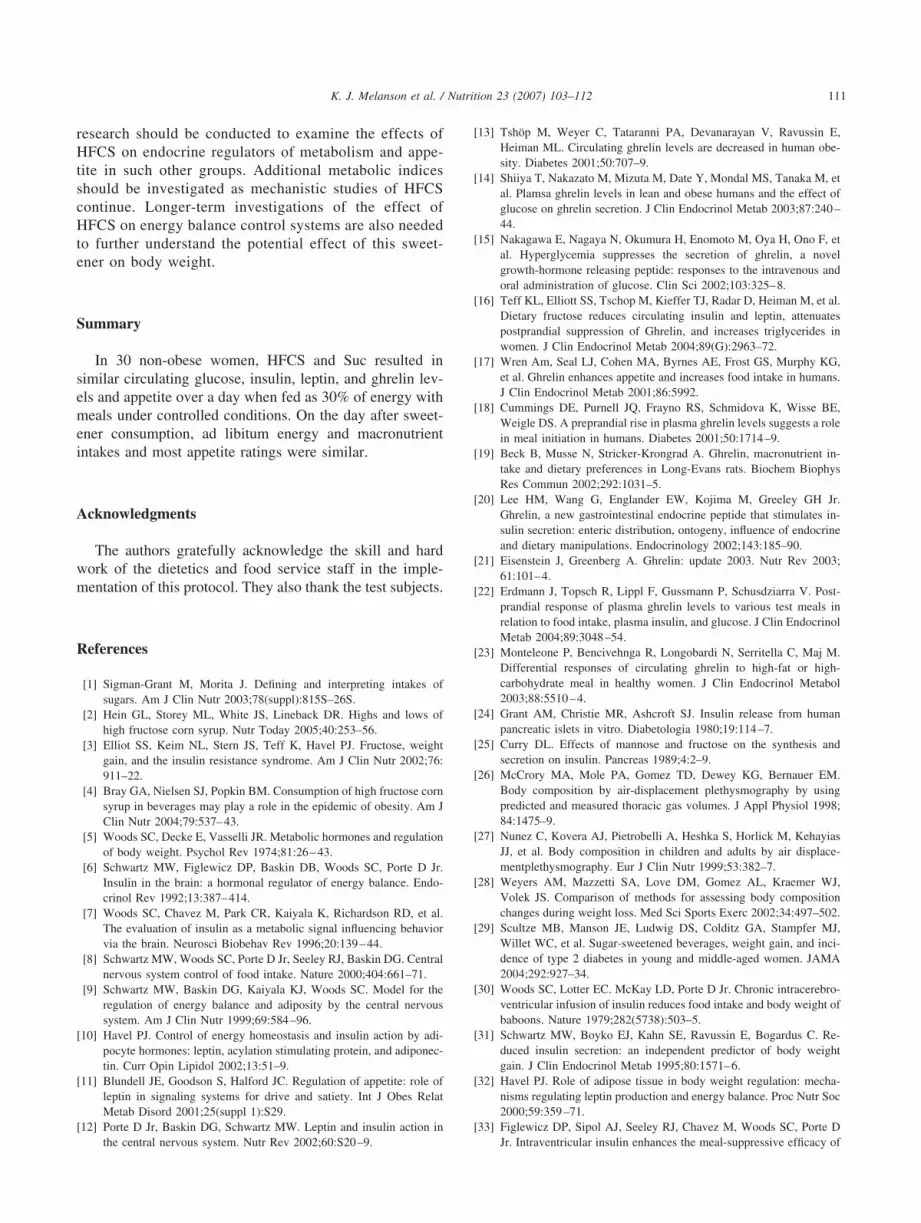
As shown in Figures 5 to 7, the within-trial variation inhunger, desire to eat, and thirst ratings were similar betweentrials for days 1 and 2 (interaction P � 0.05). There were nobetween-trial differences in AUC for VAS appetite ratingexcept for day 2 desire to eat (F � 5.776, P � 0.023), whichwas significantly higher during the Suc condition, as shownin Figure 8.
Effect of treatment order
Of the 30 participants, 16 consumed HFCS on their firsexperimental visit and 14 consumed Suc on their first visitIn all instances there was no treatment by treatment ordeinteractions (all P � 0.05).
Discussion
This study compared the metabolic and appetitive effectof HFCS-55 and Suc under controlled, randomized, doubleblinded conditions in non-obese women. In two 2-d experimental visits separated by 1 mo, the women ate isocaloricdiets on day 1 with HFCS- or sucrose-sweetened beverages
Fig. 3. Plasma leptin concentrations during day 1 of experimental visits i30 women when consuming HFCS- or sucrose-sweetened beverages a30% of energy on eucaloric diets. To convert leptin concentrations tnanomoles per liter, multiply by 0.0625. The calculated area under thcurve is presented in Table 2. HFCS, high-fructose corn syrup.
during which blood was frequently sampled. On day 2 othese visits, women ate ad libitum. VAS appetite ratingwere completed throughout the experimental visits. Bloodglucose, insulin, leptin, and ghrelin did not differ at any timepoint between conditions, nor did their AUCs. Similarly, nodifferences in energy or macronutrient intakes were seenbetween the visits when the two sweeteners were consumedThe only difference in appetite ratings between the twoconditions was a greater desire-to-eat AUC on day 2 afteSuc compared with HFCS.
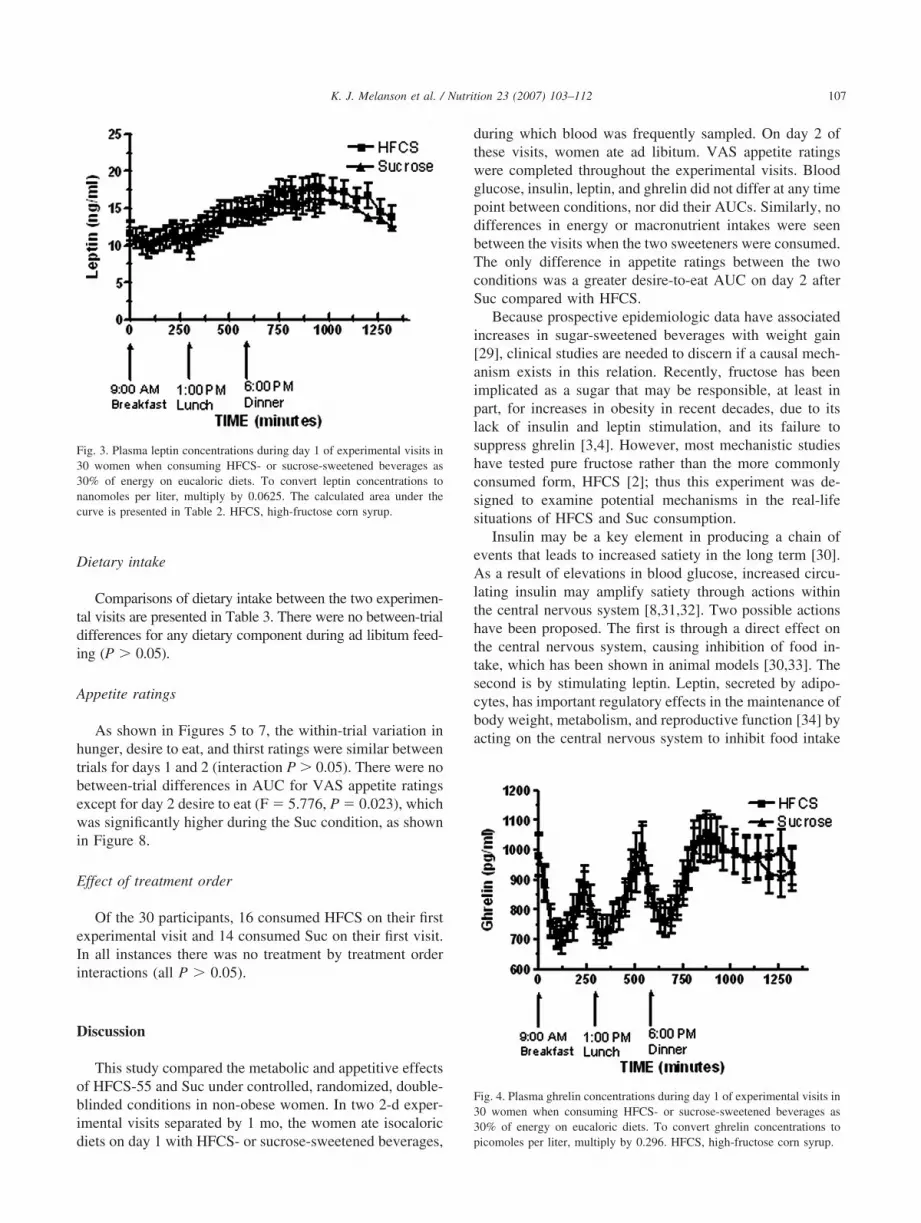
Because prospective epidemiologic data have associatedincreases in sugar-sweetened beverages with weight gain[29], clinical studies are needed to discern if a causal mechanism exists in this relation. Recently, fructose has beenimplicated as a sugar that may be responsible, at least inpart, for increases in obesity in recent decades, due to itlack of insulin and leptin stimulation, and its failure tosuppress ghrelin [3,4]. However, most mechanistic studiehave tested pure fructose rather than the more commonlyconsumed form, HFCS [2]; thus this experiment was designed to examine potential mechanisms in the real-lifesituations of HFCS and Suc consumption.
Insulin may be a key element in producing a chain oevents that leads to increased satiety in the long term [30]As a result of elevations in blood glucose, increased circulating insulin may amplify satiety through actions withinthe central nervous system [8,31,32]. Two possible actionhave been proposed. The first is through a direct effect onthe central nervous system, causing inhibition of food intake, which has been shown in animal models [30,33]. Thesecond is by stimulating leptin. Leptin, secreted by adipocytes, has important regulatory effects in the maintenance obody weight, metabolism, and reproductive function [34] byacting on the central nervous system to inhibit food intake
Fig. 4. Plasma ghrelin concentrations during day 1 of experimental visits i30 women when consuming HFCS- or sucrose-sweetened beverages a30% of energy on eucaloric diets. To convert ghrelin concentrations tpicomoles per liter, multiply by 0.296. HFCS, high-fructose corn syrup.

r
-
-f-t
-
,
r
-
s-
r--t
t
,f,
t--rr
-
.
r,
f
)))
-
108 K. J. Melanson et al. / Nutrition 23 (2007) 103–112
and activate thermogenesis. Whereas insulin is secreted inacute response to meals, leptin stimulation is delayed foseveral hours [35,36]. Therefore, leptin may be involved inlonger-term energy intake control. Insulin and leptin stimulate central pathways and are secreted in proportion tobody adiposity, although circulating levels are also influenced by recent energy intake [30,37,38]. The action oleptin is by the hypothalamus, stimulating energy expenditure from basal metabolism and reducing the drive to ea[11], and potentially inhibiting the effects of the orexigenichormone ghrelin [39,40]. Inter-relations among insulin, leptin, and ghrelin may provide mechanisms through whichshort-, medium-, and long-term energy balance controls arelinked. Ghrelin, which is secreted primarily by the stomachhas been implicated in the pathogenesis of obesity[22,41,42]. In rodents and in humans, ghrelin has beenshown to increase before meal initiation, leading to hungeand food intake, and it subsequently declines after foodingestion [17,21,22,41]. However, in humans, higher bodyweight is associated with lower ghrelin levels [13], anddiet-induced weight loss is associated with elevations inplasma ghrelin, which may promote recidivism [41]. Thesedata indicate a critical role of ghrelin in energy balance, andits relation to dietary factors deserves further research attention.
Consumption of high-fat/low-carbohydrate meals resultin lowered 24-h circulating leptin concentrations in normalweight women compared with low-fat/high-carbohydratemeals [40]. Leptin has also been shown to be reduced afteconsumption of meals accompanied by beverages sweetened with fructose, a sugar that induces low glycemic responses, as compared with glucose [16]. In the presen
Table 2Net AUC* (0900–0700 h) for the 22 h after a fasting baseline sample w
HFCS
Glucose (mg/dL) at 22 h 144.83 � 116.62Insulin (�U/mL) at 22 h 507.98 � 289.18Leptin (ng/dL) at 22 h 104.35 � 51.10
AUC, area under the curve; HFCS, high-fructose corn syrup; Suc, suc* Net AUC refers to above the baseline value (glucose and insulin) or
Table 3Dietary intake during experimental visits for day 1 (calorie and macronu
Day 1
HFCS and Suc
Total energy (kcal) 1790.5 � 272.2Total fat (g) 59.8 � 9.3Calories from fat (%) 30.1 � 0.3Total carbohydrates (g) 247.0 � 37.1Calories from carbohydrates (%) 55.2 � 0.2Total protein (g) 67.5 � 10.1Calories from protein (%) 15.1 � 0.1
HFCS, high-fructose corn syrup; Suc, sucrose
study, HFCS and Suc consumption resulted in stimulationof insulin and leptin secretion, which was associated with nodifferences in ad libitum consumption after the day of tessugar consumption. Paradoxically, the AUC for insulintended to be somewhat higher during the HFCS conditionbut this did not reach statistical significance. Two days oappetite ratings were also similar between the test visitswith the exception of desire to eat, which was higher the dayafter Suc consumption.
A recent weight-loss study in obese individuals showedthat a 12-wk high-carbohydrate (65%), low-fat (15%) diedid not result in the expected increases in ghrelin or appetite, suggesting that isocaloric substitution of dietary carbohydrate for fat may lower ghrelin levels and thus hunge[43]. Glucose administration has been shown to loweplasma ghrelin [14,15]. In the present study, HFCS andSuc consumption resulted in similar ghrelin suppressionas has been seen in other mixed-carbohydrate feedingstudies [23] and in greater ghrelin suppression as compared with a similar study in which pure fructose was fedrather than HFCS [16].
Recent data have suggested that high-fructose intakemay be lipogenic [3] and may fail to suppress ghrelin [16]Pure fructose does not increase plasma glucose or insulin toany great extent. Data from this study showed similaplasma glucose and insulin responses to HFCS-55 and Sucwhich contain some fructose and some glucose. The meanglycemic indexes (GIs) of fructose, glucose, and Suc arereported as 19 � 2, 99 � 3, and 68 � 5, respectively (withthe reference carbohydrate being glucose) [44]. The GI oHFCS is not published, but the GI of colas sweetened withit is 58 � 5 [44], which is less than with Suc. Our data
llected
Suc F P
121.33 � 135.67 0.823 NS (0.372436.55 � 194.19 4.124 NS (0.052
92.32 � 38.73 3.168 NS (0.086
e the nadir (before 1200 h for leptin).
controlled feeding) and day 2 (ad libtum feeding)
ay 2 P for betweentrial differencefor day 2FCS Suc
884.9 � 514.0 1802.5 � 447.1 0.22060.7 � 20.0 55.2 � 16.9 0.09729.0 � 5.3 27.7 � 5.9 0.255
229.8 � 72.7 224.5 � 62.7 0.62548.5 � 6.4 49.6 � 5.7 0.413
104.6 � 32.0 101.3 � 30.9 0.42022.4 � 4.7 22.6 � 4.3 0.830
as co
roseabov
trient
D
H
1
-
-rs
s-
r
r
,
r
-,,ss
.r
tf;;
sy;;
109K. J. Melanson et al. / Nutrition 23 (2007) 103–112
demonstrate that these two sweeteners do not differ significantly in their glycemic or insulinemic responses whenconsumed with foods, despite their slight difference in fructose content. Peaks of insulin and glucose secretion afteHFCS and Suc in the present study were intermediate acompared with the higher peaks after glucose consumptionand lower peaks after fructose consumption seen in thestudy by Teff et al. [16]. Nadirs of glucose and insulin weresimilar to those seen in the study by Teff et al. [16]. This inot surprising because the GIs of HFCS and Suc are intermediate as compared with those of fructose and glucose.
In the study by Teff et al. [16], ghrelin was suppressedafter the first meal by about 50 and 100 pg/mL for thefructose and glucose meals, respectively. In contrast, in thepresent study, ghrelin was suppressed by �200 pg/mL afteSuc and HFCS meals. This greater ghrelin suppressionoccurred despite plasma glucose and insulin levels simila
Fig. 5. Time course of hunger ratings from 30 women during 2-d test visitwhen consuming HFCS- or sucrose-sweetened beverages as 30% of energon eucaloric diets. (Top) Day 1, when energy intake was controlled(bottom) day 2 while eating ad libitum (squares, HFCS; triangles, sucroseinteraction P � 0.05). HFCS, high-fructose corn syrup.
to those in the previous study [16]. As mentioned earlierinsulin and glucose have been shown to suppress circulatingghrelin [14,15].
In the present study, appetite ratings did not diffebetween HFCS and Suc on the days when energy intakewas controlled (day 1), as has been reported in comparisons of fructose and glucose [16]. However, on day 2when subjects ate ad libitum, they expressed a slightlyyet significantly, higher desire to eat the day after Suc acompared with the day after HFCS. The reasons for thidifference are not clear. It is unlikely that they are relatedto the higher GI of Suc, because glycemic responses didnot differ significantly between the different sweetenersThe main difference between the sweeteners is in theifructose content (55% in HFCS versus 50% in Suc). Dataon the effects of fructose on appetite and energy intake
Fig. 6. Time course of desire-to-eat ratings from 30 women during 2-d tesvisits when consuming HFCS- or sucrose-sweetened beverages as 30% oenergy on eucaloric diets. (Top) Day 1, when energy intake was controlled(bottom) day 2 while eating ad libitum (squares, HFCS; triangles, sucroseinteraction P � 0.05). HFCS, high-fructose corn syrup.

s
r.
--
-
r,
l
);-
sy-;
110 K. J. Melanson et al. / Nutrition 23 (2007) 103–112
are conflicting, and data on the effects of HFCS versuSuc are extremely limited. Although some studies haveshown decreased appetite with fructose compared withglucose [45– 47], others have not [48 –50], especiallywhen fructose is consumed in combination with othecarbohydrates [16,51,52], as applies to the present studyHFCS and Suc have been associated with increased adlibitum energy intake when compared with non-caloricsweeteners [53,54], but this may be related to their energy content. In the present study, no significant differences in total intakes of energy or macronutrients wereseen after a day consuming HFCS versus a day consuming Suc. This corroborates a lack of differences betweenintakes when the two sugars compared were pure fructoseand glucose [16]. Lack of differences between HFCS andSuc treatments in energy intake and hunger ratings are
Fig. 7. Time course of thirst ratings from 30 women during 2-d test visitwhen consuming HFCS- or sucrose-sweetened beverages as 30% of energon eucaloric diets. (Top) Day 1 when energy intake was controlled; (bottom) day 2 while eating ad libitum (squares, HFCS; triangles, sucroseinteraction P � 0.05). HFCS, high-fructose corn syrup.
not surprising in the present study due to the similaresponses in plasma glucose, insulin, leptin, and ghrelinall of which have been postulated as metabolic/endocrinesignals of energy intake control [55].
Because the present protocol was conducted inhealthy-weight women, it cannot be generalized to menor to overweight or obese populations. Thus, additiona
Fig. 8. AUCs for hunger (top), desire to eat (middle), and thirst (bottomratings from 30 women during the 2-d test visits (shaded bars, HFCScross-hatched bars, sucrose). AUC, area under the curve; HFCS, highfructose corn syrup.
f-s
f
-
-
-t
-.
f
f
t:
nJ
n
.-
.r
l
es
--
ft
n
,-
tf–
tld
.sn
,.
,e
-s
.-e
;
-nl
.-l
n
d
.g;
s-
,n.,-
-f
-t
-c
f
111K. J. Melanson et al. / Nutrition 23 (2007) 103–112
research should be conducted to examine the effects oHFCS on endocrine regulators of metabolism and appetite in such other groups. Additional metabolic indiceshould be investigated as mechanistic studies of HFCScontinue. Longer-term investigations of the effect oHFCS on energy balance control systems are also neededto further understand the potential effect of this sweetener on body weight.
Summary
In 30 non-obese women, HFCS and Suc resulted insimilar circulating glucose, insulin, leptin, and ghrelin levels and appetite over a day when fed as 30% of energy withmeals under controlled conditions. On the day after sweetener consumption, ad libitum energy and macronutrienintakes and most appetite ratings were similar.
Acknowledgments
The authors gratefully acknowledge the skill and hardwork of the dietetics and food service staff in the implementation of this protocol. They also thank the test subjects
References
[1] Sigman-Grant M, Morita J. Defining and interpreting intakes osugars. Am J Clin Nutr 2003;78(suppl):815S–26S.
[2] Hein GL, Storey ML, White JS, Lineback DR. Highs and lows ohigh fructose corn syrup. Nutr Today 2005;40:253–56.
[3] Elliot SS, Keim NL, Stern JS, Teff K, Havel PJ. Fructose, weighgain, and the insulin resistance syndrome. Am J Clin Nutr 2002;76911–22.
[4] Bray GA, Nielsen SJ, Popkin BM. Consumption of high fructose corsyrup in beverages may play a role in the epidemic of obesity. AmClin Nutr 2004;79:537–43.
[5] Woods SC, Decke E, Vasselli JR. Metabolic hormones and regulatioof body weight. Psychol Rev 1974;81:26–43.
[6] Schwartz MW, Figlewicz DP, Baskin DB, Woods SC, Porte D JrInsulin in the brain: a hormonal regulator of energy balance. Endocrinol Rev 1992;13:387–414.
[7] Woods SC, Chavez M, Park CR, Kaiyala K, Richardson RD, et alThe evaluation of insulin as a metabolic signal influencing behaviovia the brain. Neurosci Biobehav Rev 1996;20:139–44.
[8] Schwartz MW, Woods SC, Porte D Jr, Seeley RJ, Baskin DG. Centranervous system control of food intake. Nature 2000;404:661–71.
[9] Schwartz MW, Baskin DG, Kaiyala KJ, Woods SC. Model for thregulation of energy balance and adiposity by the central nervousystem. Am J Clin Nutr 1999;69:584–96.
[10] Havel PJ. Control of energy homeostasis and insulin action by adipocyte hormones: leptin, acylation stimulating protein, and adiponectin. Curr Opin Lipidol 2002;13:51–9.
[11] Blundell JE, Goodson S, Halford JC. Regulation of appetite: role oleptin in signaling systems for drive and satiety. Int J Obes RelaMetab Disord 2001;25(suppl 1):S29.
[12] Porte D Jr, Baskin DG, Schwartz MW. Leptin and insulin action ithe central nervous system. Nutr Rev 2002;60:S20–9.
[13] Tshöp M, Weyer C, Tataranni PA, Devanarayan V, Ravussin EHeiman ML. Circulating ghrelin levels are decreased in human obesity. Diabetes 2001;50:707–9.
[14] Shiiya T, Nakazato M, Mizuta M, Date Y, Mondal MS, Tanaka M, eal. Plamsa ghrelin levels in lean and obese humans and the effect oglucose on ghrelin secretion. J Clin Endocrinol Metab 2003;87:24044.
[15] Nakagawa E, Nagaya N, Okumura H, Enomoto M, Oya H, Ono F, eal. Hyperglycemia suppresses the secretion of ghrelin, a novegrowth-hormone releasing peptide: responses to the intravenous anoral administration of glucose. Clin Sci 2002;103:325–8.
[16] Teff KL, Elliott SS, Tschop M, Kieffer TJ, Radar D, Heiman M, et alDietary fructose reduces circulating insulin and leptin, attenuatepostprandial suppression of Ghrelin, and increases triglycerides iwomen. J Clin Endocrinol Metab 2004;89(G):2963–72.
[17] Wren Am, Seal LJ, Cohen MA, Byrnes AE, Frost GS, Murphy KGet al. Ghrelin enhances appetite and increases food intake in humansJ Clin Endocrinol Metab 2001;86:5992.
[18] Cummings DE, Purnell JQ, Frayno RS, Schmidova K, Wisse BEWeigle DS. A preprandial rise in plasma ghrelin levels suggests a rolin meal initiation in humans. Diabetes 2001;50:1714–9.
[19] Beck B, Musse N, Stricker-Krongrad A. Ghrelin, macronutrient intake and dietary preferences in Long-Evans rats. Biochem BiophyRes Commun 2002;292:1031–5.
[20] Lee HM, Wang G, Englander EW, Kojima M, Greeley GH JrGhrelin, a new gastrointestinal endocrine peptide that stimulates insulin secretion: enteric distribution, ontogeny, influence of endocrinand dietary manipulations. Endocrinology 2002;143:185–90.
[21] Eisenstein J, Greenberg A. Ghrelin: update 2003. Nutr Rev 200361:101–4.
[22] Erdmann J, Topsch R, Lippl F, Gussmann P, Schusdziarra V. Postprandial response of plasma ghrelin levels to various test meals irelation to food intake, plasma insulin, and glucose. J Clin EndocrinoMetab 2004;89:3048–54.
[23] Monteleone P, Bencivehnga R, Longobardi N, Serritella C, Maj MDifferential responses of circulating ghrelin to high-fat or highcarbohydrate meal in healthy women. J Clin Endocrinol Metabo2003;88:5510–4.
[24] Grant AM, Christie MR, Ashcroft SJ. Insulin release from humapancreatic islets in vitro. Diabetologia 1980;19:114–7.
[25] Curry DL. Effects of mannose and fructose on the synthesis ansecretion on insulin. Pancreas 1989;4:2–9.
[26] McCrory MA, Mole PA, Gomez TD, Dewey KG, Bernauer EMBody composition by air-displacement plethysmography by usinpredicted and measured thoracic gas volumes. J Appl Physiol 199884:1475–9.
[27] Nunez C, Kovera AJ, Pietrobelli A, Heshka S, Horlick M, KehayiaJJ, et al. Body composition in children and adults by air displacementplethysmography. Eur J Clin Nutr 1999;53:382–7.
[28] Weyers AM, Mazzetti SA, Love DM, Gomez AL, Kraemer WJVolek JS. Comparison of methods for assessing body compositiochanges during weight loss. Med Sci Sports Exerc 2002;34:497–502
[29] Scultze MB, Manson JE, Ludwig DS, Colditz GA, Stampfer MJWillet WC, et al. Sugar-sweetened beverages, weight gain, and incidence of type 2 diabetes in young and middle-aged women. JAMA2004;292:927–34.
[30] Woods SC, Lotter EC. McKay LD, Porte D Jr. Chronic intracerebroventricular infusion of insulin reduces food intake and body weight obaboons. Nature 1979;282(5738):503–5.
[31] Schwartz MW, Boyko EJ, Kahn SE, Ravussin E, Bogardus C. Reduced insulin secretion: an independent predictor of body weighgain. J Clin Endocrinol Metab 1995;80:1571–6.
[32] Havel PJ. Role of adipose tissue in body weight regulation: mechanisms regulating leptin production and energy balance. Proc Nutr So2000;59:359–71.
[33] Figlewicz DP, Sipol AJ, Seeley RJ, Chavez M, Woods SC, Porte DJr. Intraventricular insulin enhances the meal-suppressive efficacy o

v
t
e;
ey
nc
,-
fe-
e:
rr
sb
-tb
f:
n
:
n
e.
.n
,e–
el
-:
hy
det
-.
112 K. J. Melanson et al. / Nutrition 23 (2007) 103–112
intraventricular cholecystokinin octapeptide in the baboon. BehaNeurosci 1995;109:567–9.
[34] Friedman MI. Body fat and the metabolic control of food intake. InJ Obesity 1990;14(suppl):53–66.
[35] Schoeller DA, Cella LK, Sinha MK, Caro JF. Entrainment of thdiurnal rhythm of plasma leptin to meal timing. J Clin Invest 1997100:1882–7.
[36] Havel PJ. Peripheral signals conveying metabolic information to thbrain: short-term and long-term regulation of food intake and energhomeostasis. Exp Biol Med 2001;226:963–77.
[37] Bagdade JD, Bierman EL, Porte D. The significance of basal insulilevels in the evaluation of the insulin response to glucose in diabetiand nondiabetic subjects. J Clin Invest 1967;46:1549–57.
[38] Considine RV, Sinha MK, Heiman ML, Kriauciunas A, Stephens TWNyce MR, et al. Serum immunoreactive-leptin concentrations in normalweight and obese humans. N Engl J Med 1996;334:292–5.
[39] Beretta E, Dube MG, Kalra PS, Kalra SP. Long-term suppression oweight gain, adiposity, and serum insulin by central leptin gentherapy in prepubertal rats: effects on serum ghrelin and appetiteregulating genes. Pediatr Res 2002;52:189–98.
[40] Havel PJ, Townsend R, Chaump L, Teff K. High-fat meals reduc24-h circulating leptin concentrations in women. Diabetes 1997;48334–41.
[41] Cummings DE, Weigle DS, Frayo RS, Breen PA, Ma MK, DellingeEP, et al. Plasma ghrelin levels after diet-induced weight loss ogastric bypass surgery. N Engl J Med 2002;346:1623–30.
[42] English PJ, Ghatei MA, Malik IA, Bloom SR, Wilding JP. Food failto suppress ghrelin levels in obese humans. J Clin Endocrinol Meta2002;87:2984.
[43] Weigle DS, Cummings DE, Newby PD, Breen PA, Frayo RS, Matthys CC, et al. Roles of leptin and ghrelin in the loss of body weighcaused by a low fat, high carbohydrate diet. J Clin Endocrinol Meta2003;88:1577–86.
email: reprints@CPC 481
[44] Foster-Powell K, Holt SHA, Brand-Miller JC. International table oglycemic index and glycemic load values. Am J Clin Nutr 2002;765–56.
[45] Rodin J. Effects of pure sugar versus mixed starch fructose loads ofood intake. Appetite 1991;17:213–9.
[46] Rodin J, Reed D, Jamner L. Metabolic effects of fructose and glucoseimplications for food intake. Am J Clin Nutr 1998;47:683–9.
[47] Spitzer L, Rodin J. Effects of fructose and glucose preloads osubsequent food intake. Appetite 1987;8:135–45.
[48] Guss JL, Kissileff HR, Pi-Sunyer FX. Effects of glucose and fructossolutions on food intake and gastric emptying in non-obese womenAm J Physiol 1994;267:R1537–44.
[49] Kong MF, Chapman I, Goble E, Wishart J, Wittert G, Morris H, et alEffects of oral fructose and glucose on plasma GLP-1 and appetite inormal subjects. Peptides 1999;20:545–51.
[50] Vozzo R, Baker B, Wittert GA, Wishart JM, Morris H, Horowitz Met al. Glycemic, hormone and appetite responses to monosaccharidingestion in patients with type 2 diabetes. Metabolism 2002;51:94957.
[51] Rayner CK, Park HS. Effects of intraduodenal glucose and fructoson antropyloric motility and appetite in healthy humans. Am J Physio2000;278:R360–6.
[52] Ball SD, Keller KR. Prolongation of satiety after low versus moderately high glycemic index meals in adolescents. Pediatrics 2003;111488–94.
[53] Tordoff MG, Alleva AM. Effect of drinking soda sweetened witaspartame or high-fructose corn syrup on food intake and bodweight. Am J Clin Nutr 1990;51:963–9.
[54] Raben A, Vasilaras TH, Moller AC, Astrup A. Sucrose comparewith artificial sweeteners: different effects on ad libitum food intakand body weight after 10 wk of supplementation in overweighsubjects. Am J Clin Nutr 2002;76:721–9.
[55] De Graaf C, Blom WA, Smeets PA, Stafleu A, Hendriks HF. Biomarkers of satiation and satiety. Am J Clin Nutr 2004;79:946–61
elsevier.com74