Measuring the effect of exercise on appetite, food intake and ...
309
i MEASURING THE EFFECT OF EXERCISE ON APPETITE, FOOD INTAKE AND APPETITE- ASSOCIATED HORMONES A thesis submitted by Adrian Holliday To the School of Sport, Exercise and Rehabilitation Sciences, University of Birmingham For the degree of DOCTOR OF PHILOSOPHY Exercise Metabolism Research Group School of Sport, Exercise and Rehabilitation Sciences University of Birmingham September 2013
-
Upload
khangminh22 -
Category
Documents
-
view
3 -
download
0
Transcript of Measuring the effect of exercise on appetite, food intake and ...
i
MEASURING THE EFFECT OF EXERCISE ON
APPETITE, FOOD INTAKE AND APPETITE-
ASSOCIATED HORMONES
A thesis submitted by
Adrian Holliday
To the
School of Sport, Exercise and Rehabilitation Sciences,
University of Birmingham
For the degree of
DOCTOR OF PHILOSOPHY
Exercise Metabolism Research Group
School of Sport, Exercise and Rehabilitation Sciences
University of Birmingham
September 2013
University of Birmingham Research Archive
e-theses repository This unpublished thesis/dissertation is copyright of the author and/or third parties. The intellectual property rights of the author or third parties in respect of this work are as defined by The Copyright Designs and Patents Act 1988 or as modified by any successor legislation. Any use made of information contained in this thesis/dissertation must be in accordance with that legislation and must be properly acknowledged. Further distribution or reproduction in any format is prohibited without the permission of the copyright holder.
i
ABSTRACT
The relationship between exercise and appetite has implications for acute energy
balance and weight-management. Evidence would indicate that aerobic exercise of a high
intensity can transiently suppress appetite, particularly in overweight and recreationally-
active, healthy-weight individuals. However, the effect of such a transient appetite
suppression on subsequent food intake may be limited. The aim of this thesis was to
investigate appetite responses to exercise in highly-trained endurance athletes and to
assess the effect of other exercise characteristics, as well as exercise intensity, in mediating
these responses.
Chapter 3 introduce a novel tool – The Visual Meal Creator – that is shown to be a
valid measure of subjective appetite and may prove a strong predictor of food intake, hence
proving a beneficial tool for appetite research. Using this tool alongside established
techniques, the findings of Chapters 4 and 5 demonstrate that an exercise-induced
suppression of appetite is experienced in highly-trained athletes, although there does appear
a blunting to this response. It may be that an elevated fitness level, resulting in reduced
physiological and metabolic perturbations during exercise mediates this blunting. Any
exercise-induced appetite suppression response would appear independent of the duration,
or energy cost of exercise. This is partly supported by findings of Chapter 6: a suppression
of appetite after very-low volume sprint interval cycling exercise in overweight and obese
individuals. However, in no instance was a suppression enduring (lasting >30 minutes) and
feeding was not influenced by prior exercise in any study of this thesis.
The responses to exercise of appetite-associated hormones were also investigated
throughout Chapters 4 to 6. PP and PYY appear to respond only modestly to exercise, at
least within trained individuals. Acylated ghrelin and GLP-1 exhibited more profound,
anorexigenic responses to exercise. The acylated ghrelin response may be entirely intensity-
dependent, whereas the GLP-1 response exhibited some degree of duration or energy cost
ii
dependency. Further, an enduring suppression of acylated ghrelin was observed after sprint
interval cycling exercise, to an extent that has very rarely been previously observed.
However, in all instances, there appeared a dissociation between changes in appetite-
associated hormone concentration and changes in both subjective appetite and energy
intake. This questions the well-held belief of the importance of appetite-associated hormones
in mediating post-exercise appetite regulation.
iii
ACKNOWLEDGEMENTS
On 19th September 2005, I began studying at the University of Birmingham. Eight
years and five days later, I conclude this chapter of my life with the submission of this thesis.
The journey would not have been surmountable, nor half as enjoyable, had it not been for a
number of important, special people. My interest in exercise metabolism research was
kindled by Professor Asker Jeukendrup, whose infectious enthusiasm for science I caught
during my final year project as an undergraduate. Such was his influence that I became his
PhD student the following year. I would like to thank him for passing on the bug to me.
When Professor Jeukendrup left the School part way through my PhD, Dr Andrew Blannin
stepped in and took the reigns as my Primary Supervisor. I have really enjoyed working with
Andy. For his support and guidance, I am eternally grateful.
I must acknowledge the contribution of the undergraduate project students that I
have had the pleasure of working with over the past four years. I owe a big thank-you to
Chris Batey, without whose computer programming skills developing the Visual Meal Creator
would have proved a lot more difficult.
The administration staff and the technical support staff keep the School functioning. I
cannot overstate the importance of these people. A special thank you must be paid to Val
and Rebecca in the main office and to the “techies” Dave, Ken, Andy, Rob and Steve.
I have been fortunate to have been supported by a fantastic peer group. During my
time at the University, I have been an active member of the Birmingham University Athletics
Club. Through the club, I have had (but unfortunately not ran) some great times. I have got
to know many great people and have formed lifelong friendships. Cheers lads! Within the
School of Sport and Exercise Sciences, I would like to thank Oliver Witard (despite him
being a United fan), for showing me the ropes in the early days. Thanks also go to all
members, past and present of Lunch Club (and of its predecessor, Tea Club). There are too
many to name, but you know who you are; you all made coming to work a lot of fun. A
iv
special mention must go to Daniel Crabtree, who I could always bounce ideas off and talk
football with, and a special thank you is paid to Oliver Wilson, for making me feel
unintelligent but extremely well-organised; we just about got there!
I would like to thank Sergio Aguero, for that goal.
I wish to pay a huge thanks to my parents, Keith and Glenis, and my sister Maegan.
Not just during my PhD, but throughout my life, in everything that I have done, you have
been there to offer limitless love and support (financial, as well as emotional). I could never,
ever have asked for more. I love you all dearly. Thank you.
Finally, thank you Lindsay. You are the reason I made it through a troubled,
homesick-stricken first year, the reason I am still at this University, the reason that I moved
to the School of Sport and Exercise Sciences and the reason I have made it here, to the
end. Day in, day out, from my very second week in Birmingham, you have been here for me
and put up with me. I couldn’t have done this without you. Thank you and I love you.
v
PUBLICATIONS and COMMUNICATIONS
Peer-review Journal Submission
Holliday, A., Batey, C., Eves, F.F. and Blannin, A.K. A novel tool for the measurement of
subjective appetite: The Visual Meal Creator (submitted)
Conference communications
Holliday, A. Introduction to appetite and monitoring. English Institute of Sport Weight
Management CPD Day, Cardiff, 2012. Invited speaker.
Holliday, A. and Blannin, A.K. Matching energy intake to expenditure of isocaloric exercise
at high and moderate intensities. The 18th Annual Congress of the European College of
Sport Science, Barcelona, 2013. Mini oral presentation
Holliday, A. and Blannin, A.K. Matching energy intake to energy expenditure of isocaloric
exercise at high and moderate intensities. Treatment of Obesity Conference, University of
Birmingham. 2012. Oral presentation
Holliday, A., Higgs, S., Blannin, A.K. and Jeukendrup, A.E. The effect of exercise intensity
on subjective appetite, food intake and satiety peptides in highly-trained male athletes. The
58th Annual Meeting of the American College of Sports Medicine, Denver, 2011. Oral
presentation
Unrelated publications
Holliday, A. and Jeukendrup, A.E. (2012), “The Metabolic Adaptations to Endurance
Training” in Mujika, I. (ed.), Endurance Training - Science and Practice (1st Edition), Vitoria-
Gasteiz: p143.
vi
ABBREVIATIONS
% Δ – percentage change from baseline
15 min – 15 minutes duration exercise condition
30 min – 30 minutes duration exercise condition
45 min – 45 minutes duration exercise condition
ANOVA – analysis of variance
ArRP – agouti-related peptide
AUC – area-under-the-curve
BMI – body mass index
BPAR – Birmingham Photographic Appetite Rating
bpm – beats per minute
CART – cocaine- and amphetamine-regulated transcript
CCK – cholecystokinin
CNS – central nervous system
CV – coefficient of variation
DEBQ – Dutch Eating Behaviour Questionnaire
EE – energy expenditure
EI – energy intake
EIAD LIB. – ad libitum energy intake
EIMATCH – energy intake at the “matching” task
ELISA – enzyme-linked immunosorbent assay
EST – estimate of energy expenditure/intake
EX – exercise condition
FAST – fasted state condition
FED – fed state condition
GHS-R – growth hormone secretagogue receptor
vii
GLP-1 – glucagon-like peptide 1
GLP-1R – glucagon-like peptide 1 receptor
HIE – high-intensity interval/intermittent exercise
HIGH – high-intensity exercise condition
HIT – high intensity interval/intermittent training
HR/HRmax – heart rate/maximum heart rate
INSR – insulin receptor
IPAQ – International Physical Activity Questionnaire
LB – large breakfast condition
LB+S – large breakfast and snacks condition
LEPR – leptin receptor
LOW – low-intensity exercise condition
METS – metabolic equivalent of task
MOD – moderate-intensity exercise condition
NPY – neuropeptide Y
OXM – oxyntomodulin
POST-AB – post-absorptive state condition
POMC – proopiomelanocortin
PP – pancreatic polypeptide
PYY – polypeptide tyrosine tyrosine
REI – relative energy intake
RER – respiratory exchange ratio
REST – resting condition
RPE – rating of perceived exertion
SB – small breakfast condition
SD – standard deviation
SEM – standard error of the mean
SICE – sprint interval/intermittent cycling exercise
viii
SIE – sprint interval/intermittent exercise
VAS – visual analogue scale
VIMEC – Visual Meal Creator
VO2/VO2max – rate of oxygen uptake/maximum rate of oxygen uptake
Wmax – maximal power output
YR – Y receptor
ix
CONTENTS
Abstract.....................................................................................................................................i
Acknowledgements..................................................................................................................iii
Publications and communications............................................................................................v
Abbreviations...........................................................................................................................vi
Contents..................................................................................................................................ix
Chapter 1 General introduction...........................................................................................1
1.1 Obesity and overweight – definition, prevalence, socio-economic cost and health
implications........................................................................................................................2
1.2 The energy balance equation: the role of exercise and appetite......................................3
1.3 The effect of acute exercise bouts on appetite, food intake and short- to medium-term
energy balance..................................................................................................................5
1.3.1 Is this an oversimplified message? The effect of exercise variables on appetite
and the appetite response in different populations..................................................7
1.3.1.1 Exercise intensity and the form of exercise......................................................7
1.3.1.2 Exercise duration and energy expenditure.......................................................9
1.3.1.3 Mode of exercise............................................................................................18
1.3.1.4 Study population.............................................................................................18
1.4 Peripheral endocrine signals and the relation of appetite................................................21
1.4.1 The effect of acute exercise on circulating concentrations of appetite-associated
hormones...............................................................................................................25
1.4.1.1 Ghrelin............................................................................................................25
1.4.1.2 Satiety peptides: PYY, GLP-1 and PP............................................................26
1.4.1.3 The relationship between appetite-associated hormones and subjective
appetite and food intake in the post-exercise period......................................28
x
1.5 Methodological issues associated with acute exercise and appetite research...............32
1.5.1 Lack of continuity in study design.........................................................................32
1.5.2 Problems with isolating variables...........................................................................33
1.5.3 Measurements of appetite and food intake............................................................35
1.6 Future direction of research............................................................................................37
1.7 Scope of thesis...............................................................................................................39
1.8 References.....................................................................................................................40
Chapter 2 – General methods.............................................................................................48
2.1 Pilot testing: The development of The Birmingham Photographic Appetite
Rating..............................................................................................................................50
2.1.1 Introduction..............................................................................................................50
2.1.2 Method.....................................................................................................................52
2.1.2.1 Participants......................................................................................................52
2.1.2.2 Study design....................................................................................................52
2.1.2.3 Procedure & protocol.......................................................................................52
2.1.2.4 Breakfast meal.................................................................................................53
2.1.2.5 Measures.........................................................................................................54
2.1.2.6 Statistical analysis...........................................................................................56
2.1.3 Results......................................................................................................................60
2.1.3.1 Energy intake at the test meal.........................................................................60
2.1.3.2 Subjective appetite scores...............................................................................60
2.1.3.2.1 VAS..........................................................................................................60
2.1.3.2.2 BPAR.......................................................................................................60
2.1.3.3 Correlation between subjective appetite measures.........................................62
2.1.3.4 Ability to predict between-subject differences in energy intake.......................62
2.1.3.4.1 VAS..........................................................................................................62
2.1.3.4.2 BPAR.......................................................................................................63
xi
2.1.3.5. Ability to predict within-subject differences in energy intake...........................65
2.1.3.5.1 VAS..........................................................................................................65
2.1.3.5.2 BPAR.......................................................................................................65
2.1.4 Discussion...............................................................................................................67
2.2 General methods of Chapters 4, 5 and 6.........................................................................70
2.2.1 Study design............................................................................................................70
2.2.2 Pre-testing sessions................................................................................................70
2.2.2.1 Chapters 4 and 5.............................................................................................70
2.2.2.2 Chapter 6.........................................................................................................71
2.2.3 Measures.................................................................................................................72
2.2.3.1 Eating restraint..................................................................................................72
2.2.3.2 Food intake......................................................................................................73
2.2.3.3 Subjective appetite..........................................................................................74
2.2.3.4 Analysis of exhaled gas...................................................................................75
2.2.3.5 Blood sampling and analysis...........................................................................76
2.2.3.5.1 Sampling...................................................................................................76
2.2.3.5.2 Analysis.....................................................................................................76
2.2.3.5.2.1 Glucose............................................................................................76
2.2.4.5.2.2 Appetite-associate hormone.............................................................76
2.2.4 Statistical analysis...................................................................................................77
2.3 References.......................................................................................................................78
Chapter 3 – The development of a novel tool for the measurement of subjective
appetite. Part B: The Visual Meal Creator..........................................................................80
3.1 Abstract...........................................................................................................................81
3.2 Introduction.....................................................................................................................83
3.3 Method............................................................................................................................87
3.3.1 Participants..............................................................................................................87
xii
3.3.2 Study design............................................................................................................87
3.3.3 Procedures & protocol.............................................................................................88
3.3.4 Breakfast meals and snacks....................................................................................89
3.3.5 Measures.................................................................................................................90
3.3.6 Statistical analysis...................................................................................................92
3.4 Results............................................................................................................................95
3.4.1 Energy intake at the test meal.................................................................................95
3.4.2 Subjective appetite scores......................................................................................95
3.4.2.1 VAS.................................................................................................................95
3.4.2.2 VIMEC.............................................................................................................96
3.4.3 Correlation between subjective appetite scores obtained with VAS and VIMEC....98
3.4.4 Ability to predict between-subject differences in energy intake...............................98
3.4.4.1 VAS..................................................................................................................98
3.4.4.2 VIMEC.............................................................................................................98
3.4.5 Ability to predict within-subject differences in energy intake...................................99
3.4.5.1 VAS.................................................................................................................99
2.4.5.2 VIMEC.............................................................................................................99
3.4.6 Reliability and reproducibility of subjective appetite................................................99
3.4.6.1 Day-to-day measures......................................................................................99
3.4.6.2 Test-retest measures.....................................................................................100
3.5 Discussion.....................................................................................................................101
3.6 References....................................................................................................................107
Chapter 4 – The effect of exercise intensity on subjective appetite, food intake and
appetite-associated hormone in highly trained male endurance athletes...................110
4.1 Abstract.........................................................................................................................111
4.2 Introduction...................................................................................................................113
4.3 Method..........................................................................................................................115

xiii
4.3.1 Participants............................................................................................................115
4.3.2 Experimental trial conditions..................................................................................115
4.3.3 Procedure & protocol.............................................................................................116
4.3.4 Blood sampling and analysis.................................................................................116
4.3.5 Statistical analysis.................................................................................................117
4.4 Results..........................................................................................................................118
4.4.1 Exercise trials........................................................................................................118
4.4.2 Subject appetite.....................................................................................................118
4.4.2.1 VAS................................................................................................................118
4.4.2.2 BPAR.............................................................................................................120
4.4.3 Energy intake at the ad libitum test meal..............................................................121
4.4.4 Satiety peptide concentration................................................................................122
4.4.4.1 PP..................................................................................................................122
4.4.4.2 PYY................................................................................................................123
4.4.5 Relationship between hormones, subjective appetite and food intake..................124
4.4.5.1 Between-condition correlation of change in hormone concentration with
exercise and change in appetite with exercise.....................................................124
4.4.5.2 Between-condition correlation of percentage change in hormone
concentration with percentage change in energy intake, and of
percentage change in appetite score with percentage change in energy
intake..................................................................................................................125
4.5 Discussion.....................................................................................................................126
4.6 References....................................................................................................................134
Chapter 5 – The effect of exercise duration on appetite, food intake and
appetite-associated hormones.........................................................................................138
5.1 Abstract.........................................................................................................................139
5.2 Introduction...................................................................................................................141
xiv
5.3 Method..........................................................................................................................144
5.3.1 Participants............................................................................................................144
5.3.2 Experimental trial conditions..................................................................................144
5.3.3 Procedure & protocol.............................................................................................145
5.3.4 Blood sampling and analysis.................................................................................145
5.3.5 Statistical analysis.................................................................................................146
5.4 Results..........................................................................................................................148
5.4.1 Exercise trials........................................................................................................148
5.4.2 Subjective appetite................................................................................................148
5.4.2.1 VAS................................................................................................................148
5.4.2.2 VIMEC...........................................................................................................149
5.4.3 Food intake at the ad libitum test meal..................................................................151
5.4.4 Plasma glucose and appetite-associated hormones concentrations....................153
5.4.4.1 Glucose..........................................................................................................153
5.4.4.2 Acylated ghrelin.............................................................................................153
5.4.4.3 PYY................................................................................................................156
5.4.4.4 GLP-1............................................................................................................156
5.4.5 Relationship between hormones, subjective appetite and food intake.................159
5.4.5.1 Between-condition correlation of change in hormone concentration with
exercise and change in appetite with exercise..................................................159
5.4.5.2 Between-condition correlation of percentage change in hormone
concentration with percentage change in energy intake, and of
percentage change in appetite score with percentage change in energy
intake..................................................................................................................159
5.5 Discussion....................................................................................................................161
5.6 References...................................................................................................................168
xv
Chapter 6 – The effect of sprint interval cycling exercise on appetite, food intake
and appetite-associated hormones in overweight and obese individuals...................173
6.1 Abstract.........................................................................................................................174
6.2 Introduction...................................................................................................................176
6.3 Method..........................................................................................................................180
6.3.1 Participants............................................................................................................180
6.3.2 Experimental trial conditions..................................................................................181
6.3.3 Procedure & protocol.............................................................................................181
6.3.4 Blood sampling and analysis.................................................................................183
6.3.5 Statistical analysis.................................................................................................183
6.4 Results..........................................................................................................................185
6.4.1 Resting and exercise conditions............................................................................185
6.4.2 Subjective appetite................................................................................................185
6.4.2.1 VAS................................................................................................................185
6.4.2.2 VIMEC...........................................................................................................186
6.4.3 Plasma glucose and appetite-associated hormones.............................................188
6.4.3.1 Glucose..........................................................................................................188
6.4.3.2 Acylated ghrelin.............................................................................................188
6.4.3.3 PYY................................................................................................................188
6.4.3.4 GLP-1............................................................................................................189
6.4.4 Food intake and energy balance...........................................................................191
6.4.5 The relationship between appetite-associated hormones, subjective appetite
and energy intake...................................................................................................193
6.5 Discussion................................................................................................................194
6.6 References...............................................................................................................201
Chapter 7 – Matching energy intake to expenditure of isocaloric exercise at high
and moderate intensities..............................................................................................206
xvi
7.1 Abstract....................................................................................................................207
7.2 Introduction..............................................................................................................209
7.3 Method.....................................................................................................................211
7.3.1 Participants.......................................................................................................211
7.3.2 Study design.....................................................................................................211
7.3.3 Preliminary testing............................................................................................211
7.3.4 Procedure & protocol........................................................................................213
7.3.5 Measures..........................................................................................................215
7.3.6 Statistical analysis............................................................................................215
7.4 Results......................................................................................................................217
7.4.1 Exercise trials...................................................................................................217
7.4.2 Energy expenditure, energy intake of the matching task and verbal
estimate.............................................................................................................217
7.4.3 Ad libitum energy intake...................................................................................218
7.4.4 Food selection: energy density and macronutrient intake................................219
7.5 Discussion................................................................................................................221
7.6 References...............................................................................................................227
Chapter 8 – General discussion..................................................................................231
8.1 General discussion...................................................................................................232
8.2 A novel tool for the measurement of subjective appetite.........................................233
8.3 The effect of exercise on appetite in highly-trained athletes....................................241
8.4 The effect of different exercise characteristics on appetite responses to exercise..245
8.5 Questioning the regulatory role of appetite-associated hormones on appetite
and food intake in the post-exercise period..............................................................248
8.6 What does regulate post-exercise appetite and food intake?..................................254
8.7 Summary of thesis findings......................................................................................259
8.8 Future research........................................................................................................260
xvii
8.9 Thoughts, speculation and practical implications.....................................................262
8.9.1 Can an exercise-induced suppression of appetite be used as a tool to
promote acute energy deficit and assist weight-loss?................................................262
8.9.2 Losing weight is difficult; the key for society is to prevent weight-gain.............263
8.9.3 Exercise for the avoidance of weight-gain........................................................264
8.10 References.............................................................................................................266
Appendices.........................................................................................................................272
Appendix 1 – Written consent form, Chapter 2...............................................................272
Appendix 2 – General Health Questionnaire...................................................................273
Appendix 3 – Food item, with nutritional information, of the Birmingham Photographic
Appetite Rating..........................................................................................276
Appendix 4 – The Dutch Eating Behaviour Questionnaire..............................................277
Appendix 5 – Food and drink items, with nutritional information, of the ad libitum
breakfast meal for Chapter 5......................................................................279
Appendix 6 – Food and drink items, with nutritional information, of the buffet meal for
Chapter 6....................................................................................................280
Appendix 7 – Food items, with nutritional information, of the Visual Meal Creator.........281
Appendix 8 – The International Physical Activity Questionnaire.....................................282
Appendix 9 – Food and drink items, with nutritional information, of the buffet meal for
Chapter 7....................................................................................................290
1
Chapter 1
General introduction: The effect of acute exercise on subjective
appetite, appetite-associated hormones, food intake and short-term
energy balance
2
1.1 Obesity and overweight – definition, prevalence, socio-economic cost and
health implications
The prevalence of obesity and overweight has escalated to pandemic proportions.
Recent estimates state that obesity, defined by the World Health Organisation as “abnormal
or excessive fat accumulation that may impair health” and classified as possessing a body
mass index (BMI) value of ≥30 kg•m-2, afflicts over 500 million people globally, with 1.4
billion adults either obese or overweight (BMI 25-29 kg•m-2) (Finucane et al. 2011). This
equates to 35% of the world’s population. In England, statistics indicate that 24% of men and
26% of women are obese, with a further 41% of men and 32% of women being overweight
(Health and Social Care Information Centre, 2013). Perhaps more worryingly for the future,
three in ten children are now overweight or obese (Health and Social Care Information
Centre, 2013)
The implications of an obesity pandemic are far-reaching, with economic and health
costs. In 2007, it was estimated that the total financial burden of obesity and obesity-related
illness on the National Health Service of the UK was £3.2 billion per year (Allender and
Rayner, 2007). Projections suggest that the total annual cost to the UK economy could be as
high £50 billion by 2050 (Butland et al., 2007). Obesity increases the risk of a number of
serious and potentially fatal diseases, including type II diabetes (Chan et al., 1994; Colditz et
al., 1990), cardiovascular disease (Hubert et al., 1983), stroke (Suk et al., 2003), some
cancers (Carroll, 1998) and psychiatric disorders, such as depression (Onyike et al., 2003;
Simon et al., 2006). The gravity of this increased risk of disease is perhaps best highlighted
in a study published in the Lancet in 2009 (Prospective Studies, 2009). Collaborative
analysis of 57 prospective follow-up studies, with a minimum follow-up period of 20 years,
showed that, for every 5 kg•m-2 an individual’s BMI was above 25 kg•m-2, the risk of mortality
increased approximately 30%. Further, obese individuals died, on average, 10 years earlier
than healthy-weight counterparts. It was found that approximately 8% of deaths could be
3
attributed to obesity, making obesity the UK’s second largest contributor to mortality
(Prospective Studies, 2009).
The obesity pandemic will most probably worsen before it gets better. It has been
forecast that by 2030, there will be a further 11 million obese adults in the UK (Wang et al.,
2011). This is likely to result in 8.5 million more cases of diabetes, 5.7-7.3 million more cases
of heart disease and stroke and around half a million more incidences of cancer. Hence, the
economic burden of obesity is expected to rise by £2 billion a year (Wang et al., 2011). In
light of the current pandemic and these alarming projections, successful, cost-effective
treatments and preventative measures for obesity must be sought.
1.2 The energy balance equation: the role of exercise and appetite
Weight-gain, leading to overweight and obesity, arises from prolonged, repeated
periods of positive energy balance. This occurs when total energy consumption exceeds
total energy expenditure. While sounding over-simplistic, the manipulation of this equation
over prolonged periods in favour of either a positive balance or a negative balance will lead
to weight-gain or weight-loss, respectively.
Those seeking to shift their energy balance in favour of an energy deficit are often
advised to increase their amount of physical activity and undertake exercise (Donnelly et al.,
2009; Jakicic et al., 2001). While exercise has been shown to effectively increase energy
expenditure (Poehlman and Horton, 1989), both sides of the equation must be considered.
From a homeostatic point of view it may be considered intuitive that any imbalance in energy
status will trigger a mechanism that will restore equilibrium, ensuring the tight regulation of
energy balance. This belief in energy balance being a tightly regulated homeostatic system
would lead to the acknowledgement of fast-acting compensatory increases in energy intake,
through an increase in appetite and drive to eat, in response to energy deficit. This view is
supported by evidence that energy deficit caused by a reduction in food intake (through meal
skipping and fasting) resulted in a subsequent upregulation of appetite and food intake
4
(Hubert et al., 1998; Johnstone et al., 2002). However, such a notion was challenged as long
ago as the early 1970s by findings of Edholm and colleagues (Edholm et al., 1970), who
showed an absence of day-to-day coupling of energy intake and energy expenditure. They
did, however, demonstrate that there may be a delayed compensatory response that allowed
a tighter coupling over a seven day period. Subsequent research would indicate that a
compensatory increase in energy intake, in response to exercise initiation is absent (Stubbs
et al., 2002a), minimal (Staten, 1991; Stubbs et al., 2004; Woo et al., 1982) or at most,
incomplete, accounting for ~30% of the exercise-induced increase in energy expenditure
(Stubbs et al., 2002b; Whybrow et al., 2008). Nevertheless, the persistence of a negative
energy balance is commonly seen during the early stages (1 – 3 weeks) of exercise training
commencement (Staten, 1991; Stubbs et al., 2002b; Whybrow et al., 2008; Woo et al.,
1982). Further, it has been shown that the appetite and food intake response may differ
between a food-restriction and an exercise-induced energy deficit (Hubert et al., 1998; King
et al., 2011a). This not only suggests that exercise may influence appetite independent of
alterations in energy balance, but also highlights the benefit of exercise within a weight-
management strategy.
With this in mind, the relationship between exercise, appetite and food intake is
clearly of importance. This review will primarily address the effect of acute exercise on short-
term appetite, food intake and energy balance. The effects of chronic exercise training on
long-term changes in appetite, food intake and bodyweight is beyond the scope of this
review and will not be discussed. (See Caudwell et al., 2009 and Hopkins et al., 2010 for
reviews of the effect of chronic exercise on appetite. See Curioni and Lourenco, 2005 and
Donnelly et al., 2009 for a systematic review and meta-analysis of the success of exercise in
weight-management and for recommendations for exercise interventions to promote weight-
loss). Furthermore, while the cognitive regulatory mechanisms of eating behaviour are both
intriguing and of considerable importance, this review will focus on metabolic components of
acute appetite regulation. For a review of the cognitive regulation of eating behaviour, the
reader is directed to two comprehensive review articles (King, 1999; Stubbs, 1998).
5
1.3 The effect of acute exercise bouts on appetite, food intake and short- to
medium-term energy balance
The weight of evidence would suggest that completing an acute bout of exercise
does not result in an increase in appetite and food intake. A 1999 systematic review carried
out by John Blundell and Neil King (Blundell and King, 1999) showed that, when reviewing
the findings of 48 intervention studies, 19% showed an increase in energy intake after
exercise, 65% showed no change and 16% showed a decrease. It is now generally accepted
that there is only a weak short-term coupling of energy intake and expenditure, opposing the
concept of a fast-acting compensatory mechanism to regulate energy balance (King et al.,
1997a; King et al., 1996; Lluch et al., 2000; Staten, 1991). Contrary to early intuitive belief, it
has been widely reported that vigorous exercise can in fact transiently suppress appetite
(Broom et al., 2009; Broom et al., 2007; Burns et al., 2007; Kawano et al., 2013; King et al.,
2011b; King et al., 1994; King et al., 1996; Kissileff et al., 1990; Thompson et al., 1988; Ueda
et al., 2009a; Ueda et al., 2009b; Westerterp-Plantenga et al., 1997). This much publicised
phenomenon was substantiated by the work of John Blundell’s research group, leading them
to coin the term “anorexia of exercise” to explain this exercise-induced suppression of
appetite after high intensity (≥60% VO2max) exercise (King et al., 1994). This response is not
observed after low- or moderate-intensity exercise (George and Morganstein, 2003; Kissileff
et al., 1990). Any suppression is also rather short-lived. Hence, while such a subjective
hunger suppression can lead to reductions in food intake in the immediate post–exercise
period (~10 minutes, (Westerterp-Plantenga et al., 1997); ~15 minutes, (Kissileff et al.,
1990)), food intake is largely unaffected when a meal is consumed ≥60 minutes after
exercise (King et al., 2010; King et al., 2011b; King et al., 1997b; Schubert et al., 2013;
Thompson et al., 1988).
Such a transient suppression of hunger, it could be argued, is unlikely to lead to
reductions in food intake in free living conditions when we consider that a major eating
episode (i.e., lunch or dinner meal) is unlikely to be consumed within 60 minutes of the
6
cessation of exercise (given the time taken for immediate recovery, to possibly warm-down,
to shower, change clothes, possibly return home from the site of exercise, e.g., the gym, and
to cook or prepare food).
The effect of an acute exercise bout on more medium-term (hours to days post-
exercise) energy intake is perhaps more relevant for assessing whether a compensatory
mechanism will act to re-establish energy balance after exercise-induced energy deficit.
Evidence would indicate that a single bout of aerobic exercise has little impact on medium-
term hunger and energy intake. Broom et al. (Broom et al., 2009) found that while aerobic
exercise (60 minutes of treadmill running at ~70% VO2max) did suppress hunger during the
two-hour period from the cessation of exercise to a standardised meal (versus a control
condition), subjective hunger was no different for the remaining 5 hour period after this meal.
Further work from this research group confirmed this response in the hours after exercise
(King et al., 2011a; King et al., 2011b).
King and co-workers, (King et al., 2010) investigated the effect of prolonged treadmill
running (90 minutes at ~ 70% VO2max) on appetite and energy intake, with measures
obtained for the 24 hour period after exercise, in 9 healthy males. Subjective appetite was
transiently suppressed during exercise, but did not differ from the control condition post-
exercise. The lack of significant difference in appetite between the exercise and control
condition was reflected by very similar energy intakes over the 24 hour trial period (4109 kcal
during the control conditions vs. 4208 kcal during the exercise condition). When considering
the increased energy expenditure of the exercise bout, the exercise condition resulted in
participants remaining in energy deficit for the 24 hour period. These findings were
substantiated with evidence of no compensatory increase in energy intake over a 5-day
period following 2 days of exercise in healthy-weight and overweight young girls (Dodd et al.,
2008).
Such findings suggest that while prolonged aerobic exercise may not suppress
appetite to such an extent, or for long enough, to result in a reduction in post-exercise
energy intake, neither does it trigger a compensatory response by which appetite and
7
therefore energy intake is upregulated, even when the energy cost of exercise is very high.
Hence, this would advocate that exercise can be an effective means of creating a medium-
term energy deficit that can be maintained for at least 24 hours.
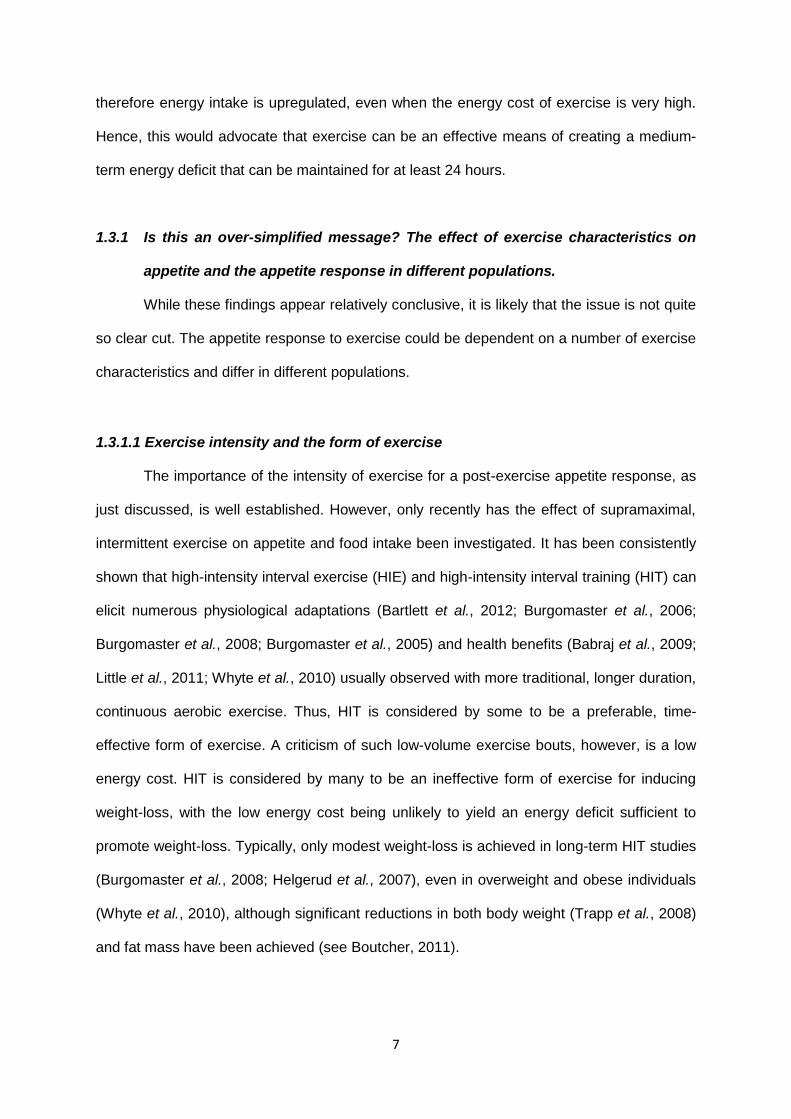
1.3.1 Is this an over-simplified message? The effect of exercise characteristics on
appetite and the appetite response in different populations.
While these findings appear relatively conclusive, it is likely that the issue is not quite
so clear cut. The appetite response to exercise could be dependent on a number of exercise
characteristics and differ in different populations.
1.3.1.1 Exercise intensity and the form of exercise
The importance of the intensity of exercise for a post-exercise appetite response, as
just discussed, is well established. However, only recently has the effect of supramaximal,
intermittent exercise on appetite and food intake been investigated. It has been consistently
shown that high-intensity interval exercise (HIE) and high-intensity interval training (HIT) can
elicit numerous physiological adaptations (Bartlett et al., 2012; Burgomaster et al., 2006;
Burgomaster et al., 2008; Burgomaster et al., 2005) and health benefits (Babraj et al., 2009;
Little et al., 2011; Whyte et al., 2010) usually observed with more traditional, longer duration,
continuous aerobic exercise. Thus, HIT is considered by some to be a preferable, time-
effective form of exercise. A criticism of such low-volume exercise bouts, however, is a low
energy cost. HIT is considered by many to be an ineffective form of exercise for inducing
weight-loss, with the low energy cost being unlikely to yield an energy deficit sufficient to
promote weight-loss. Typically, only modest weight-loss is achieved in long-term HIT studies
(Burgomaster et al., 2008; Helgerud et al., 2007), even in overweight and obese individuals
(Whyte et al., 2010), although significant reductions in both body weight (Trapp et al., 2008)
and fat mass have been achieved (see Boutcher, 2011).
8
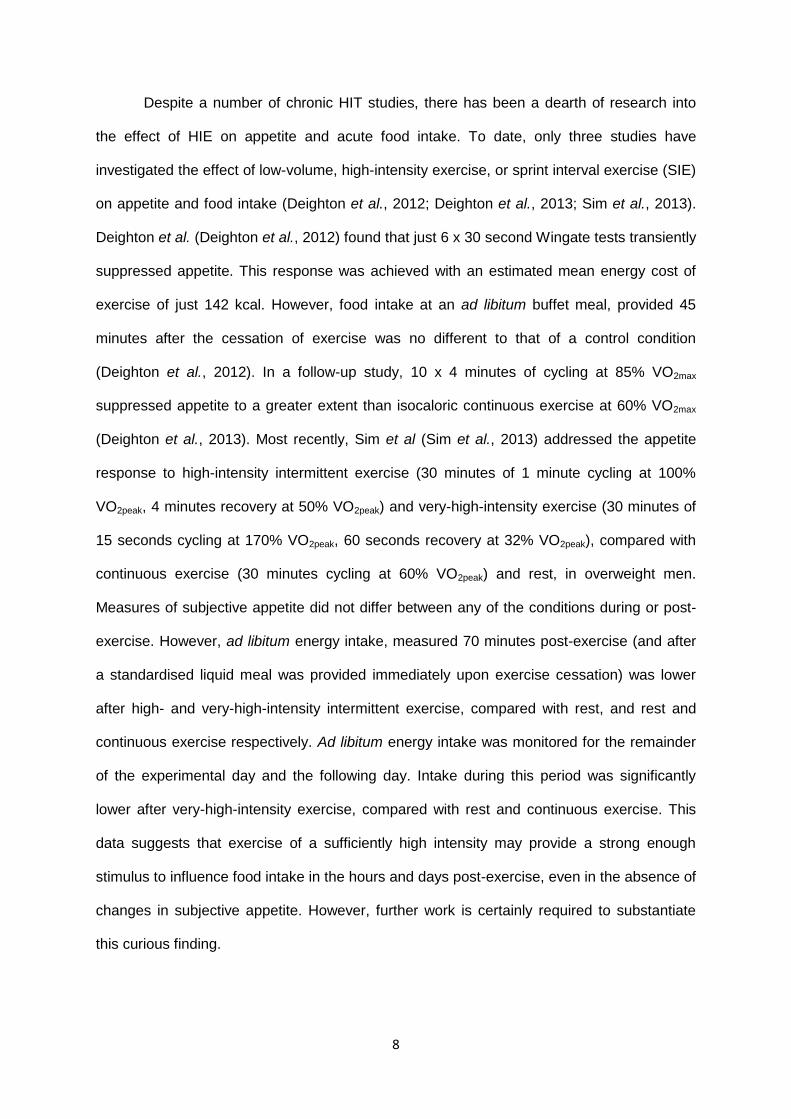
Despite a number of chronic HIT studies, there has been a dearth of research into
the effect of HIE on appetite and acute food intake. To date, only three studies have
investigated the effect of low-volume, high-intensity exercise, or sprint interval exercise (SIE)
on appetite and food intake (Deighton et al., 2012; Deighton et al., 2013; Sim et al., 2013).
Deighton et al. (Deighton et al., 2012) found that just 6 x 30 second Wingate tests transiently
suppressed appetite. This response was achieved with an estimated mean energy cost of
exercise of just 142 kcal. However, food intake at an ad libitum buffet meal, provided 45
minutes after the cessation of exercise was no different to that of a control condition
(Deighton et al., 2012). In a follow-up study, 10 x 4 minutes of cycling at 85% VO2max
suppressed appetite to a greater extent than isocaloric continuous exercise at 60% VO2max
(Deighton et al., 2013). Most recently, Sim et al (Sim et al., 2013) addressed the appetite
response to high-intensity intermittent exercise (30 minutes of 1 minute cycling at 100%
VO2peak, 4 minutes recovery at 50% VO2peak) and very-high-intensity exercise (30 minutes of
15 seconds cycling at 170% VO2peak, 60 seconds recovery at 32% VO2peak), compared with
continuous exercise (30 minutes cycling at 60% VO2peak) and rest, in overweight men.
Measures of subjective appetite did not differ between any of the conditions during or post-
exercise. However, ad libitum energy intake, measured 70 minutes post-exercise (and after
a standardised liquid meal was provided immediately upon exercise cessation) was lower
after high- and very-high-intensity intermittent exercise, compared with rest, and rest and
continuous exercise respectively. Ad libitum energy intake was monitored for the remainder
of the experimental day and the following day. Intake during this period was significantly
lower after very-high-intensity exercise, compared with rest and continuous exercise. This
data suggests that exercise of a sufficiently high intensity may provide a strong enough
stimulus to influence food intake in the hours and days post-exercise, even in the absence of
changes in subjective appetite. However, further work is certainly required to substantiate
this curious finding.
9
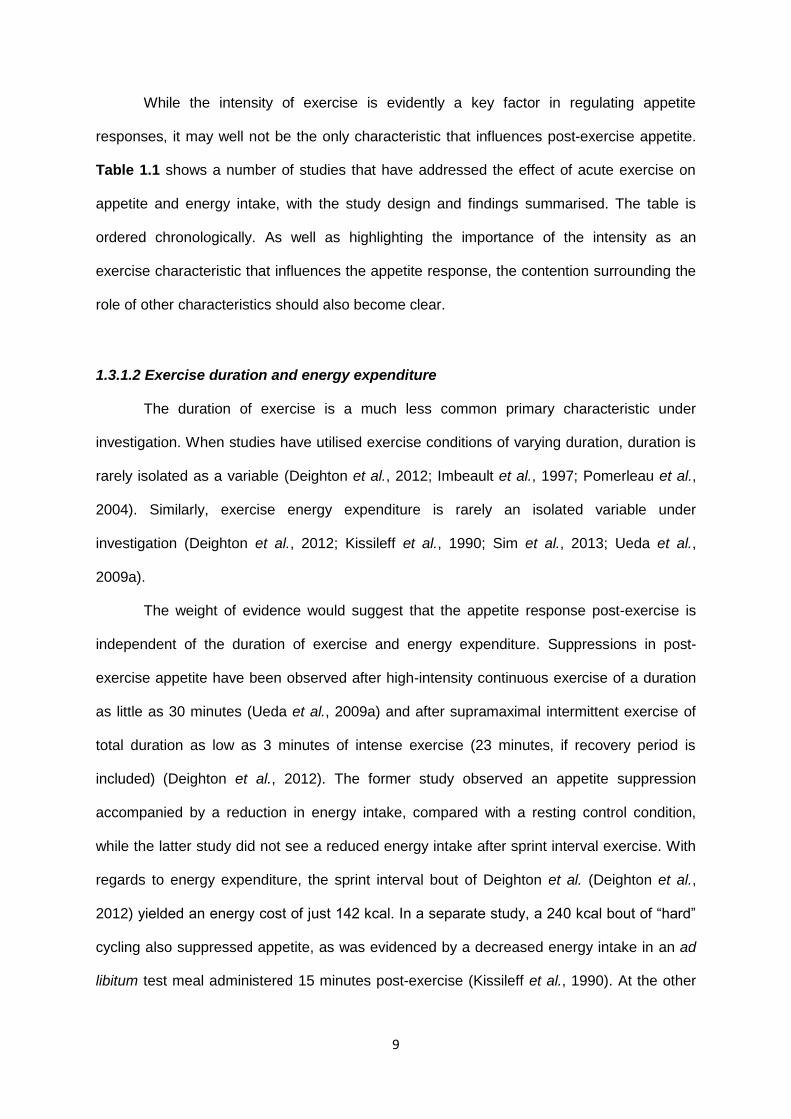
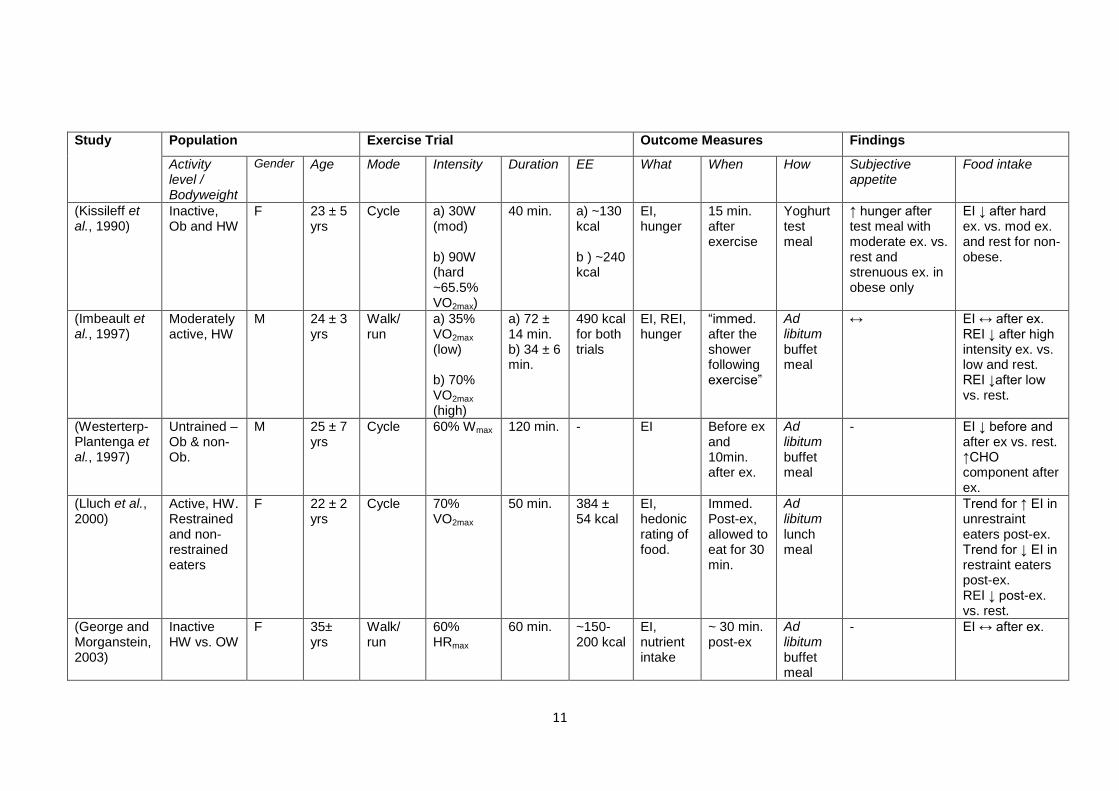
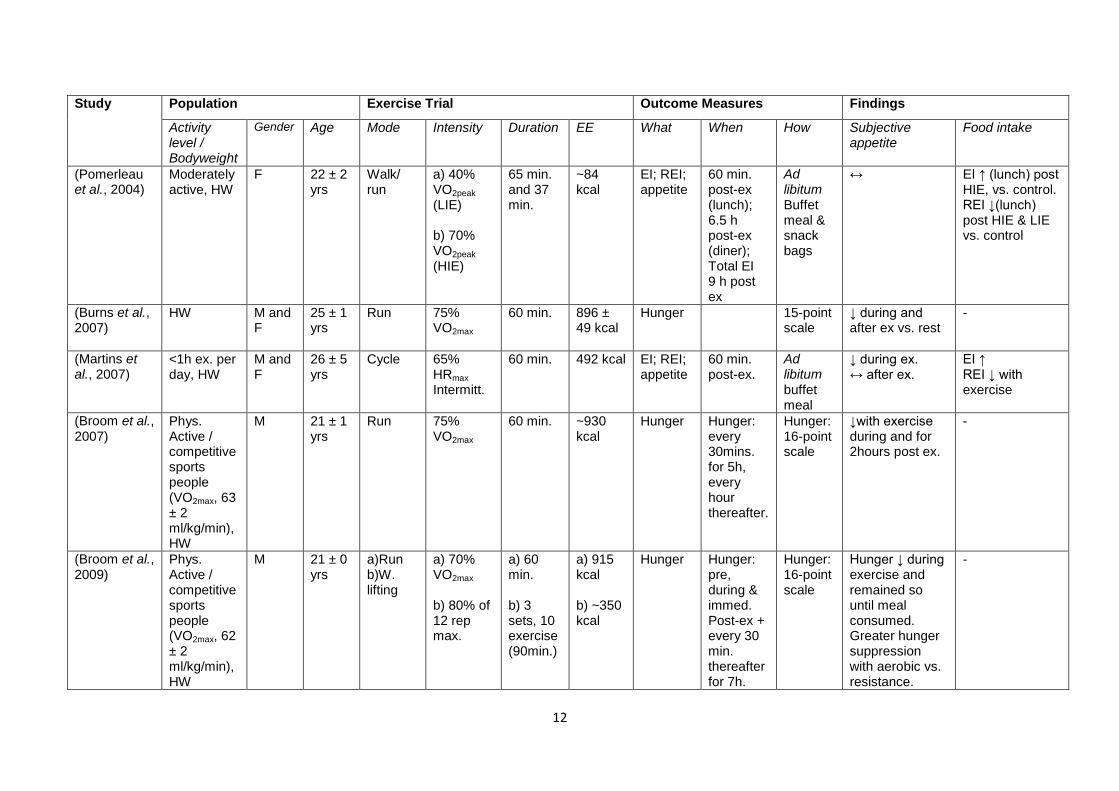
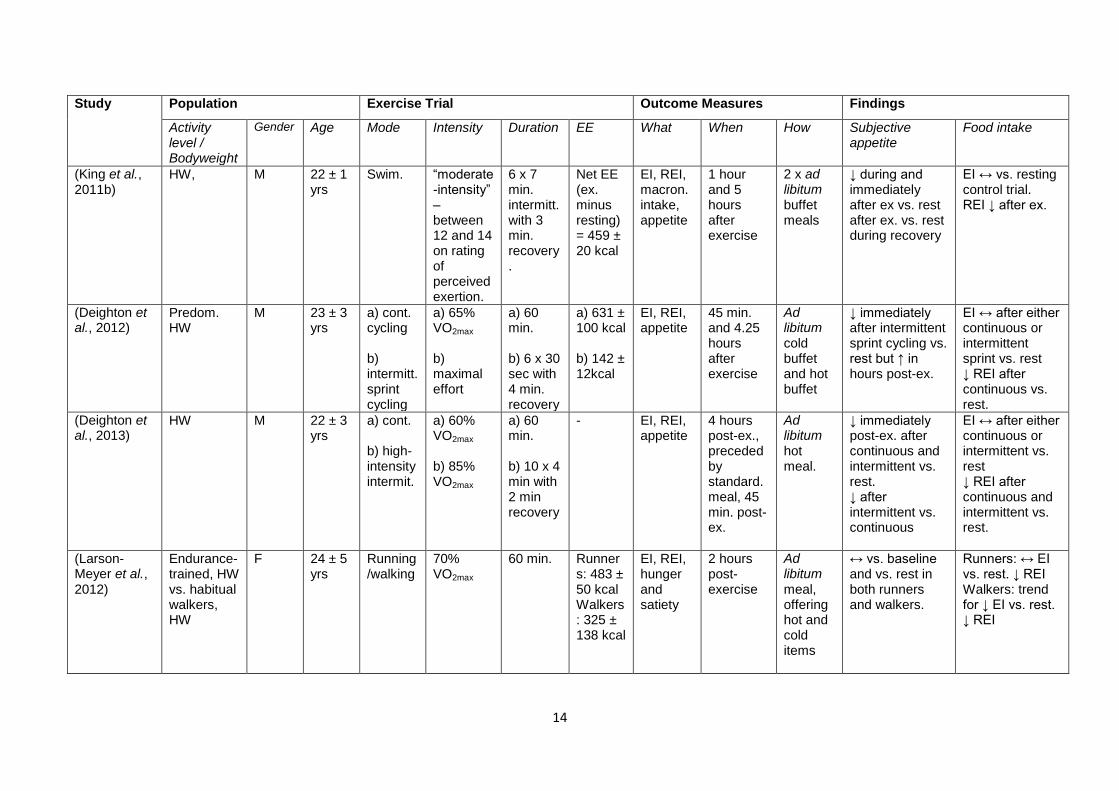
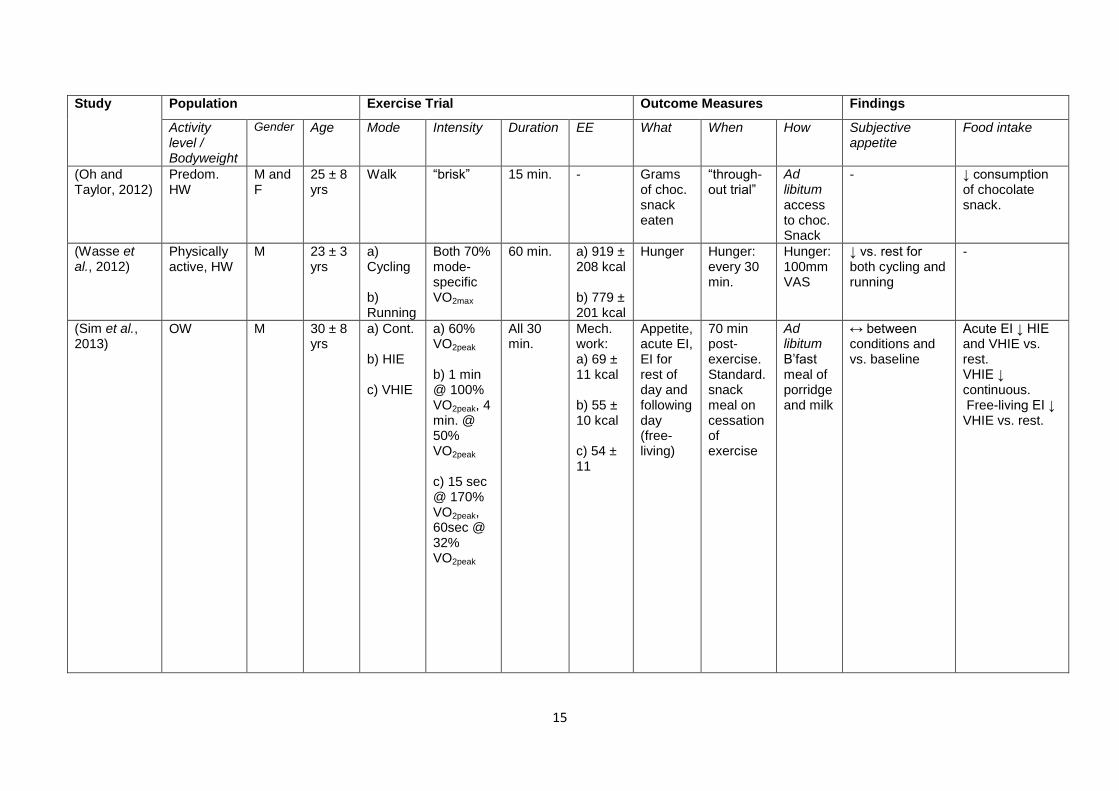
While the intensity of exercise is evidently a key factor in regulating appetite
responses, it may well not be the only characteristic that influences post-exercise appetite.
Table 1.1 shows a number of studies that have addressed the effect of acute exercise on
appetite and energy intake, with the study design and findings summarised. The table is
ordered chronologically. As well as highlighting the importance of the intensity as an
exercise characteristic that influences the appetite response, the contention surrounding the
role of other characteristics should also become clear.
1.3.1.2 Exercise duration and energy expenditure
The duration of exercise is a much less common primary characteristic under
investigation. When studies have utilised exercise conditions of varying duration, duration is
rarely isolated as a variable (Deighton et al., 2012; Imbeault et al., 1997; Pomerleau et al.,
2004). Similarly, exercise energy expenditure is rarely an isolated variable under
investigation (Deighton et al., 2012; Kissileff et al., 1990; Sim et al., 2013; Ueda et al.,
2009a).
The weight of evidence would suggest that the appetite response post-exercise is
independent of the duration of exercise and energy expenditure. Suppressions in post-
exercise appetite have been observed after high-intensity continuous exercise of a duration
as little as 30 minutes (Ueda et al., 2009a) and after supramaximal intermittent exercise of
total duration as low as 3 minutes of intense exercise (23 minutes, if recovery period is
included) (Deighton et al., 2012). The former study observed an appetite suppression
accompanied by a reduction in energy intake, compared with a resting control condition,
while the latter study did not see a reduced energy intake after sprint interval exercise. With
regards to energy expenditure, the sprint interval bout of Deighton et al. (Deighton et al.,
2012) yielded an energy cost of just 142 kcal. In a separate study, a 240 kcal bout of “hard”
cycling also suppressed appetite, as was evidenced by a decreased energy intake in an ad
libitum test meal administered 15 minutes post-exercise (Kissileff et al., 1990). At the other
10
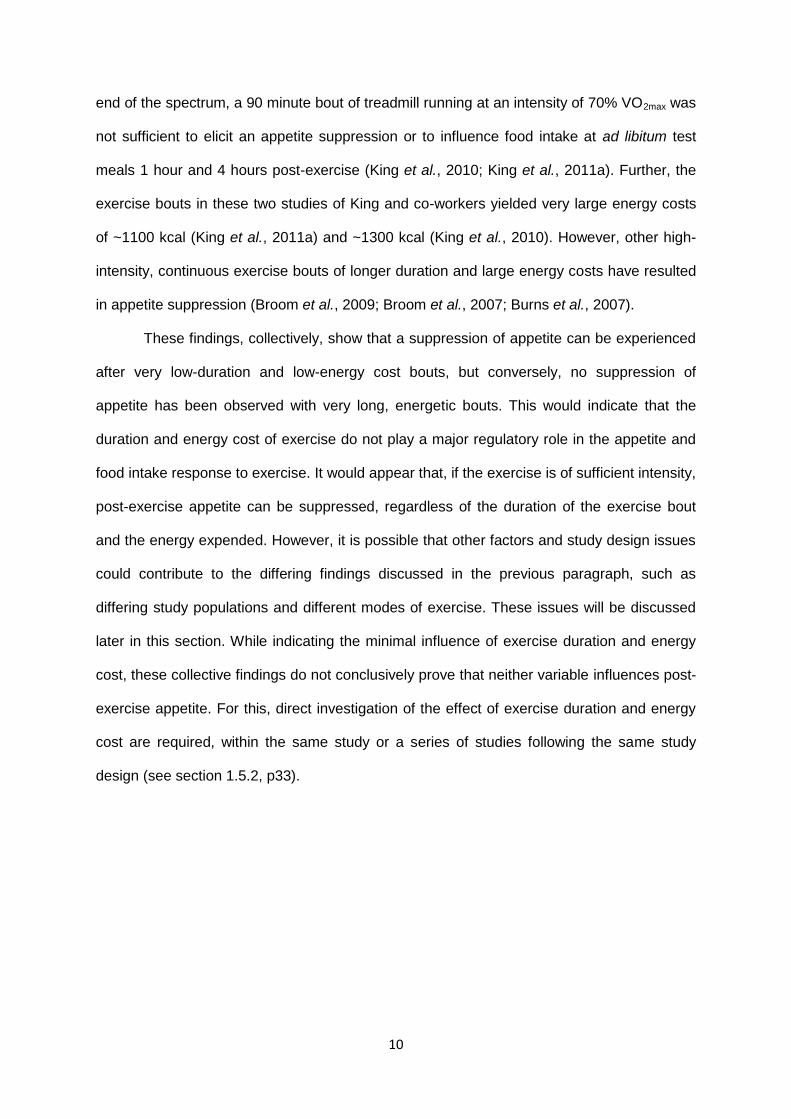
end of the spectrum, a 90 minute bout of treadmill running at an intensity of 70% VO2max was
not sufficient to elicit an appetite suppression or to influence food intake at ad libitum test
meals 1 hour and 4 hours post-exercise (King et al., 2010; King et al., 2011a). Further, the
exercise bouts in these two studies of King and co-workers yielded very large energy costs
of ~1100 kcal (King et al., 2011a) and ~1300 kcal (King et al., 2010). However, other high-
intensity, continuous exercise bouts of longer duration and large energy costs have resulted
in appetite suppression (Broom et al., 2009; Broom et al., 2007; Burns et al., 2007).
These findings, collectively, show that a suppression of appetite can be experienced
after very low-duration and low-energy cost bouts, but conversely, no suppression of
appetite has been observed with very long, energetic bouts. This would indicate that the
duration and energy cost of exercise do not play a major regulatory role in the appetite and
food intake response to exercise. It would appear that, if the exercise is of sufficient intensity,
post-exercise appetite can be suppressed, regardless of the duration of the exercise bout
and the energy expended. However, it is possible that other factors and study design issues
could contribute to the differing findings discussed in the previous paragraph, such as
differing study populations and different modes of exercise. These issues will be discussed
later in this section. While indicating the minimal influence of exercise duration and energy
cost, these collective findings do not conclusively prove that neither variable influences post-
exercise appetite. For this, direct investigation of the effect of exercise duration and energy
cost are required, within the same study or a series of studies following the same study
design (see section 1.5.2, p33).
11
Study Population Exercise Trial Outcome Measures Findings
Activity level / Bodyweight
Gender Age Mode Intensity Duration EE What When How Subjective appetite
Food intake
(Kissileff et al., 1990)
Inactive, Ob and HW
F 23 ± 5 yrs
Cycle a) 30W (mod) b) 90W (hard ~65.5% VO2max)
40 min. a) ~130 kcal b ) ~240 kcal
EI, hunger
15 min. after exercise
Yoghurt test meal
↑ hunger after test meal with moderate ex. vs. rest and strenuous ex. in obese only
EI ↓ after hard ex. vs. mod ex. and rest for non-obese.
(Imbeault et al., 1997)
Moderately active, HW
M 24 ± 3 yrs
Walk/ run
a) 35% VO2max
(low) b) 70% VO2max (high)
a) 72 ± 14 min. b) 34 ± 6 min.
490 kcal for both trials
EI, REI, hunger
“immed. after the shower following exercise”
Ad libitum buffet meal
↔ EI ↔ after ex. REI ↓ after high intensity ex. vs. low and rest. REI ↓after low vs. rest.
(Westerterp-Plantenga et al., 1997)
Untrained – Ob & non-Ob.
M 25 ± 7 yrs
Cycle 60% Wmax 120 min. - EI
Before ex and 10min. after ex.
Ad libitum buffet meal
- EI ↓ before and after ex vs. rest. ↑CHO component after ex.
(Lluch et al., 2000)
Active, HW. Restrained and non-restrained eaters
F 22 ± 2 yrs
Cycle 70% VO2max
50 min. 384 ± 54 kcal
EI, hedonic rating of food.
Immed. Post-ex, allowed to eat for 30 min.
Ad libitum lunch meal
Trend for ↑ EI in unrestraint eaters post-ex. Trend for ↓ EI in restraint eaters post-ex. REI ↓ post-ex. vs. rest.
(George and Morganstein, 2003)
Inactive HW vs. OW
F 35± yrs
Walk/ run
60% HRmax
60 min.
~150-200 kcal
EI, nutrient intake
~ 30 min. post-ex
Ad libitum buffet meal
- EI ↔ after ex.
12
Study Population Exercise Trial Outcome Measures Findings
Activity level / Bodyweight
Gender Age Mode Intensity Duration EE What When How Subjective appetite
Food intake
(Pomerleau et al., 2004)
Moderately active, HW
F 22 ± 2 yrs
Walk/ run
a) 40% VO2peak (LIE) b) 70% VO2peak (HIE)
65 min. and 37 min.
~84 kcal
EI; REI; appetite
60 min. post-ex (lunch); 6.5 h post-ex (diner); Total EI 9 h post ex
Ad libitum Buffet meal & snack bags
↔ EI ↑ (lunch) post HIE, vs. control. REI ↓(lunch) post HIE & LIE vs. control
(Burns et al., 2007)
HW M and F
25 ± 1 yrs
Run 75% VO2max
60 min. 896 ± 49 kcal
Hunger 15-point scale
↓ during and after ex vs. rest
-
(Martins et al., 2007)
<1h ex. per day, HW
M and F
26 ± 5 yrs
Cycle 65% HRmax Intermitt.
60 min. 492 kcal EI; REI; appetite
60 min. post-ex.
Ad libitum buffet meal
↓ during ex. ↔ after ex.
EI ↑ REI ↓ with exercise
(Broom et al., 2007)
Phys. Active / competitive sports people (VO2max, 63 ± 2 ml/kg/min), HW
M 21 ± 1 yrs
Run 75% VO2max
60 min. ~930 kcal
Hunger Hunger: every 30mins. for 5h, every hour thereafter.
Hunger: 16-point scale
↓with exercise during and for 2hours post ex.
-
(Broom et al., 2009)
Phys. Active / competitive sports people (VO2max, 62 ± 2 ml/kg/min), HW
M 21 ± 0 yrs
a)Run b)W. lifting
a) 70% VO2max b) 80% of 12 rep max.
a) 60 min. b) 3 sets, 10 exercise (90min.)
a) 915 kcal b) ~350 kcal
Hunger Hunger: pre, during & immed. Post-ex + every 30 min. thereafter for 7h.
Hunger: 16-point scale
Hunger ↓ during exercise and remained so until meal consumed. Greater hunger suppression with aerobic vs. resistance.
-

13
Study Population Exercise Trial Outcome Measures Findings
Activity level / Bodyweight
Gender Age Mode Intensity Duration EE What When How Subjective appetite
Food intake
(Ueda et al., 2009a) Comparable
HW M 23 ± 3 yrs
Recum. cycling
a) Mod. intensity: 50% VO2max b) High intensity: 70% VO2max
Both 30 min.
- EI, appetite
30 min. post-ex
Ad libitum pasta meal
Hunger ↓ during and immediately post-ex in mod. and high intensity conditions
EI ↓ after mod. and high intensity exercise
(Ueda et al., 2009b) changes
Ob vs. HW M 23 ± 4 yrs
Recum. cycling
50% VO2max
60 min. 707 kcal for obese. 496 kcal for healthy-weight
EI, REI, hunger
60 min. post ex.
Pasta-based test meal
↔ vs. baseline and rest trial
EI & REI ↓ post-ex. vs. post-rest. EI and REI ↓ after ex. in obese vs. HW.
(King et al., 2010)
Physically active (VO2max, 60.5 ± 1.5 ml/kg/min), HW
M 22 ± 1 yrs
Running 70 % VO2max
90 min. 1273 ± 45 kcal
EI, REI, appetite.
1 hour and 4 hours post-exercise
Ad libitum cold buffet and hot buffet
Hunger, prospective intake ↓ during exercise only
EI ↔ vs. resting control trial. REI ↓ after ex
(Unick et al., 2010)
OW/Ob F 28 ± 8 years
Walking 70-75% predicted HRmax
42 min. 354 kcal EI, REI, hunger
60-120 min. post-exercise
Ad libitum snack buffet
↔ vs. baseline ↔ vs. rest.
EI ↔ vs. resting control trial. REI ↓ after ex.
(King et al., 2011a)
Physically active (VO2max, 57 ± 1 ml/kg/min), HW
M 23 ± 1 yrs
Running 70% VO2max
90 min. 1127 kcal
EI, appetite.
6.5 hours after exercise, preceded by 2 standard. meal
Ad libitum buffet meal
↔ vs. baseline ↔ vs. rest
EI ↔ vs. resting control trial.
14
Study Population Exercise Trial Outcome Measures Findings
Activity level / Bodyweight
Gender Age Mode Intensity Duration EE What When How Subjective appetite
Food intake
(King et al., 2011b)
HW, M 22 ± 1 yrs
Swim. “moderate-intensity” – between 12 and 14 on rating of perceived exertion.
6 x 7 min. intermitt. with 3 min. recovery.
Net EE (ex. minus resting) = 459 ± 20 kcal
EI, REI, macron. intake, appetite
1 hour and 5 hours after exercise
2 x ad libitum buffet meals
↓ during and immediately after ex vs. rest after ex. vs. rest during recovery
EI ↔ vs. resting control trial. REI ↓ after ex.
(Deighton et al., 2012)
Predom. HW
M 23 ± 3 yrs
a) cont. cycling b) intermitt. sprint cycling
a) 65% VO2max b) maximal effort
a) 60 min. b) 6 x 30 sec with 4 min. recovery
a) 631 ± 100 kcal b) 142 ± 12kcal
EI, REI, appetite
45 min. and 4.25 hours after exercise
Ad libitum cold buffet and hot buffet
↓ immediately after intermittent sprint cycling vs. rest but ↑ in hours post-ex.
EI ↔ after either continuous or intermittent sprint vs. rest ↓ REI after continuous vs. rest.
(Deighton et al., 2013)
HW M 22 ± 3 yrs
a) cont. b) high-intensity intermit.
a) 60% VO2max
b) 85% VO2max
a) 60 min. b) 10 x 4 min with 2 min recovery
- EI, REI, appetite
4 hours post-ex., preceded by standard. meal, 45 min. post-ex.
Ad libitum hot meal.
↓ immediately post-ex. after continuous and intermittent vs. rest. ↓ after intermittent vs. continuous
EI ↔ after either continuous or intermittent vs. rest ↓ REI after continuous and intermittent vs. rest.
(Larson-Meyer et al., 2012)
Endurance-trained, HW vs. habitual walkers, HW
F 24 ± 5 yrs
Running/walking
70% VO2max
60 min. Runners: 483 ± 50 kcal Walkers: 325 ± 138 kcal
EI, REI, hunger and satiety
2 hours post-exercise
Ad libitum
meal, offering hot and cold items
↔ vs. baseline and vs. rest in both runners and walkers.
Runners: ↔ EI vs. rest. ↓ REI Walkers: trend for ↓ EI vs. rest. ↓ REI
15
Study Population Exercise Trial Outcome Measures Findings
Activity level / Bodyweight
Gender Age Mode Intensity Duration EE What When How Subjective appetite
Food intake
(Oh and Taylor, 2012)
Predom. HW
M and F
25 ± 8 yrs
Walk “brisk” 15 min. - Grams of choc. snack eaten
“through-out trial”
Ad libitum access to choc. Snack
- ↓ consumption of chocolate snack.
(Wasse et al., 2012)
Physically active, HW
M 23 ± 3 yrs
a) Cycling b) Running
Both 70% mode-specific VO2max
60 min. a) 919 ± 208 kcal b) 779 ± 201 kcal
Hunger Hunger: every 30 min.
Hunger: 100mm VAS
↓ vs. rest for both cycling and running
-
(Sim et al., 2013)
OW M 30 ± 8 yrs
a) Cont. b) HIE c) VHIE
a) 60% VO2peak b) 1 min @ 100% VO2peak, 4 min. @ 50% VO2peak c) 15 sec @ 170% VO2peak, 60sec @ 32% VO2peak
All 30 min.
Mech. work: a) 69 ± 11 kcal b) 55 ± 10 kcal c) 54 ± 11
Appetite, acute EI, EI for rest of day and following day (free-living)
70 min post-exercise. Standard. snack meal on cessation of exercise
Ad libitum B’fast meal of porridge and milk
↔ between conditions and vs. baseline
Acute EI ↓ HIE and VHIE vs. rest. VHIE ↓ continuous. Free-living EI ↓ VHIE vs. rest.

16
Study Population Exercise Trial Outcome Measures Findings
Activity level / Bodyweight
Gender Age Mode Intensity Duration EE What When How Subjective appetite
Food intake
(Heden et al., 2013)
HW and Ob M and F
26 ± 6 yrs
Walking 55-60% VO2peak
60 min. 430 ± 116 kcal for HW; 519 ± 148 for Ob
Hunger and fullness
Hunger and fullness: every 30min. for 4 hours, after standard. b’fast, morning after evening exercise.
Hunger and fullness: 100 mm VAS
↔ hunger ↓ fullness after ex. in Ob only.
-
(Holmstrup et al., 2013)
Ob M and F
25 ± 1 yrs
Running a) cont. b) intermit.
a) 60-65% VO2peak b) 60-65% VO2peak
a) 60 min. b) 60 min. total. 12 x 5min. bouts, hourly
- Subjec. hunger and satiety
Hunger and satiety: every 20 min.
Hunger and satiety: 100 mm VAS
↔ hunger and satiety between continuous and rest, during and immediately after ex. ↓ hunger for intermittent vs. rest.
-
(Kawano et al., 2013)
HW M 24 ± 2 yrs
a) rope skip b) cycling
a) 65% VO2max b) 64% VO2max
a) 3 x 10 min. with 5 min. recovery b) until EE matches skipping bout.
a) 295 kcal b) 288 kcal
Hunger Hunger and desire to eat: before, during, and every 15 min after ex. for 2hrs.
Hunger and desire to eat: 100 mm VAS
↓ for cycling and rope skip vs. rest during and <30min. post-ex. ↓ for rope skip vs. cycling during ex. ↑ for cycling vs. rest 105min post-ex.
-
17
Table 1.1 – Review of a number of studies investigating the effect of exercise on appetite and food intake. Ob, obese; OW, overweight; HW,
healthy weight; Predom., predominantly; M, male; F, female; ex, exercise; W. lifting, weight lifting; recum., recumbent; swim., swimming; cont.,
continuous; intermitt., intermittent; LIE, low intensity exercise; HIE, high intensity exercise; Mech., mechanical; macron., macronutrient; subec.,
subjective; immed., immediately; standard., standardised; b’fast., breakfast; EE, energy expenditure; EI, energy intake; REI, relative energy
intake.. “When” and “How” refers to the measures of energy intake, unless otherwise stated. Hunger/appetite measured using VAS unless
stated.
18
1.3.1.3 Mode of exercise
It remains unclear as to whether the appetite response to exercise is dependent on
the mode of exercise undertaken. Commonly, ergometer cycling and treadmill running are
the modes utilised in appetite research, with suppression of subjective appetite observed
with both (see table 1.1). In addition, swimming (King et al., 2011b) and weight-lifting
(Broom et al., 2009) have also been shown to suppress appetite. As it has been postulated
that the “up and down” movement of the trunk during certain types of exercise can cause
disturbance to the GI tract, leading to greater secretion of appetite-associate hormones,
direct comparisons of modes of exercise that do and do not cause excessive trunk
movement have been made, with contrasting findings. Kawano and colleagues (Kawano et
al., 2013) compared the appetite response to energy- and intensity-matched cycling and
rope skipping. Both modes elicited a suppression of appetite during, and immediately after
exercise, compared with baseline and a resting control condition. However, the suppression
was greater with rope skipping. Furthermore, appetite rebounded in the two-hour post-
exercise period in the cycling condition, but not after rope skipping. Conversely, Wasse et al.
(Wasse et al., 2012) found no difference between the effect of cycling and running on post-
exercise appetite, with both modes reducing hunger scores, compared with rest. Neither
study addressed post-exercise food intake.
In light of the majority of the current literature, it would appear unlikely that mode of
exercise influences post-exercise appetite responses. Data would suggest that exercise of a
sufficient intensity can transiently suppress appetite, regardless of mode. However, further
direct comparisons of different modes are required to fully clarify any remaining contention.
1.3.1.4 Study population
It is clear from table 1.1 that studies have utilised a wide range of study populations,
specifically with regard to activity level and bodyweight. It is difficult to elucidate whether
different populations respond differently with regard to post-exercise appetite. Transient
19
suppressions of appetite after high-intensity exercise have been observed with highly-active
(Broom et al., 2009; Broom et al., 2007), moderately- active, healthy-weight individuals
(Burns et al., 2007; Kawano et al., 2013; Wasse et al., 2012) and overweight/obese
individuals (Holmstrup et al., 2013). No such response is commonly seen with low- to
moderate-intensity exercise in both healthy-weight (Imbeault et al., 1997; Pomerleau et al.,
2004; Ueda et al., 2009b) and overweight/obese (George and Morganstein, 2003; Ueda et
al., 2009b; Unick et al., 2010) populations. However, differential responses have been
observed in studies directly comparing healthy-weight individuals with overweight and obese
counterparts (Heden et al., 2013; Kissileff et al., 1990), with obese exhibiting increased
hunger (Kissileff et al., 1990) and decreased fullness (Heden et al., 2013) post-moderate-
intensity exercise, compared with healthy-weight individuals.
There is evidence that those familiar with high-intensity exercise may exhibit some
degree of blunting to the exercise-induced suppression of appetite, or may require a higher-
intensity exercise bout than less active individuals, to experience an appetite suppression.
While non-habitual intense exercisers have been seen to experience appetite suppression
after exercise of an intensity ~60% VO2max (King et al., 1994; Martins et al., 2007; Ueda et
al., 2009a), exercise of a similar intensity (60-70% VO2max) has failed to elicit any
suppression in those more used to regular exercise (King et al., 2011a; King et al., 1997a;
Larson-Meyer et al., 2012), or suppression was observed but was only present during, but
not after exercise (King et al., 2010). It is possible that, by exercising regularly, and at a
relatively high intensity, some adaptation leads to the blunting of a post-exercise suppressive
appetite response. This may be a necessary adaptation, needed to promote post-exercise
refuelling or a mechanism by which energy deficit is opposed. It is possible that such a
mechanism is physiological in nature, governed by changes in appetite-associated
hormones (see section 1.4, p21), or purely behavioural; regular exercisers are likely aware
of potential benefits of immediate post-exercise feeding, so cognition may override the
physiological regulation of appetite. Hence, it is possible that any “intensity threshold” for
transient appetite suppression is dependent on the degree to which an individual is
20
accustomed to exercise, or on their fitness level. While some studies have utilised physically
active individuals, no studies to date have extensively and thoroughly investigated the
effects of exercise on appetite in highly-trained, athletic populations. If a “threshold intensity”
for post-exercise appetite suppression does exist, and if it is perhaps different for different
individuals based on their activity and training status, it would follow that highly-trained
athletes would be further resistant to this suppression effect, requiring an even greater
exercise intensity in order to experience a suppression of appetite.
Further evidence for a differential response of appetite and food intake to exercise,
based of habitual activity level is provided by a recent study of Rocha et al. (2013). They
observed that 60 minutes of moderate intensity cycling did not alter hunger ratings, nor ad
libitum lunch intake 60 minutes post-exercise in either active or inactive, healthy-weight
males. However, when monitoring food intake over the remainder of the test day and the 3
days following, active males increased intake on the exercise experimental day, compared
with the resting control experimental day. This indicates a compensatory response to the
exercise energy expenditure, resulting in a small over compensation of 27% over the course
of the test day. In contrast, inactive males exhibited a latent response, with an apparent
increased compensatory intake 3 days post-exercise. The cumulative percentage of energy
compensation over the entire 4 days of monitoring did not differ significantly between active
and inactive males. This data would suggest that a compensatory response of increased
food intake, to the energy expenditure of an acute bout of exercise, occurs in both active and
inactive healthy-weight males. However, this response appears to occur at different rates,
with active males possessing a more rapid response, suggesting a tighter regulation of
energy homeostasis.
As well as studies utilising participant populations of varying bodyweight and activity
level, there is variability in the gender of participants studied. Some studies investigated
effects in males and females combined, some in exclusively one gender while others directly
compared responses between males and females (see table 1.1). Acutely, the collective
data from table 1.1 would indicate that a gender difference in the appetite response to
21
exercise is not present, with findings from male only and female only studies following the
same patterns. Further, studies that have compared males with females have also not
observed a difference (Burns et al., 2007). However, there are a limited number of such
direct comparisons and investigations with female populations are rare.
From this discussion, it is clear that contention remains regarding the effect of a
single exercise bout on acute appetite. The exercise intensity-dependency of an appetite
suppression response would appear unquestionable. However, the largely-accepted
“intensity threshold” for the effect may be different for different populations and may be
governed by activity level or fitness level. The mode of exercise undertaken is an unlikely
regulator of any appetite suppression and it would seem probable that both genders respond
similarly to acute bouts of exercise, although direct comparisons are desired to confirm these
observations. What is less clear is the role of the duration and energy cost of exercise.
Further, direct assessment of the effect of differing exercise duration and energy cost of
exercise is necessary before these characteristics can be confirmed as regulatory factors or
not.
Despite the need for further clarity regarding the effect of different exercise
characteristics on post-exercise appetite and food intake in differing populations, it would
appear from the extensive literature that a single exercise bout does not result in an acute
compensatory increase in appetite and food intake, regardless of the intensity, duration,
energy cost, or mode of exercise, or the bodyweight, activity status or gender of the
individual.
1.4 Peripheral endocrine signals and regulation of appetite
If exercise does elicit responses in appetite and food intake, the influence of
physiological regulatory mechanisms in exercise-induced changes are likely to be of
importance. The secretion of hormones from the gastrointestinal tract has long been
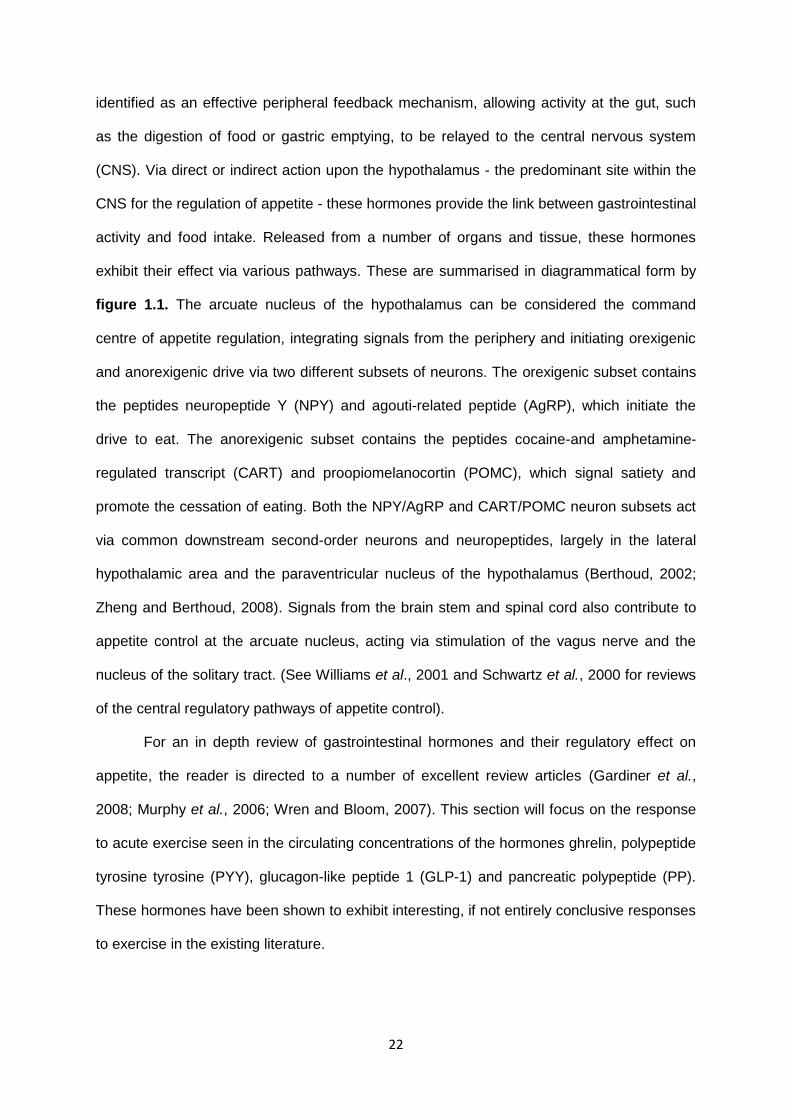
22
identified as an effective peripheral feedback mechanism, allowing activity at the gut, such
as the digestion of food or gastric emptying, to be relayed to the central nervous system
(CNS). Via direct or indirect action upon the hypothalamus - the predominant site within the
CNS for the regulation of appetite - these hormones provide the link between gastrointestinal
activity and food intake. Released from a number of organs and tissue, these hormones
exhibit their effect via various pathways. These are summarised in diagrammatical form by
figure 1.1. The arcuate nucleus of the hypothalamus can be considered the command
centre of appetite regulation, integrating signals from the periphery and initiating orexigenic
and anorexigenic drive via two different subsets of neurons. The orexigenic subset contains
the peptides neuropeptide Y (NPY) and agouti-related peptide (AgRP), which initiate the
drive to eat. The anorexigenic subset contains the peptides cocaine-and amphetamine-
regulated transcript (CART) and proopiomelanocortin (POMC), which signal satiety and
promote the cessation of eating. Both the NPY/AgRP and CART/POMC neuron subsets act
via common downstream second-order neurons and neuropeptides, largely in the lateral
hypothalamic area and the paraventricular nucleus of the hypothalamus (Berthoud, 2002;
Zheng and Berthoud, 2008). Signals from the brain stem and spinal cord also contribute to
appetite control at the arcuate nucleus, acting via stimulation of the vagus nerve and the
nucleus of the solitary tract. (See Williams et al., 2001 and Schwartz et al., 2000 for reviews
of the central regulatory pathways of appetite control).
For an in depth review of gastrointestinal hormones and their regulatory effect on
appetite, the reader is directed to a number of excellent review articles (Gardiner et al.,
2008; Murphy et al., 2006; Wren and Bloom, 2007). This section will focus on the response
to acute exercise seen in the circulating concentrations of the hormones ghrelin, polypeptide
tyrosine tyrosine (PYY), glucagon-like peptide 1 (GLP-1) and pancreatic polypeptide (PP).
These hormones have been shown to exhibit interesting, if not entirely conclusive responses
to exercise in the existing literature.
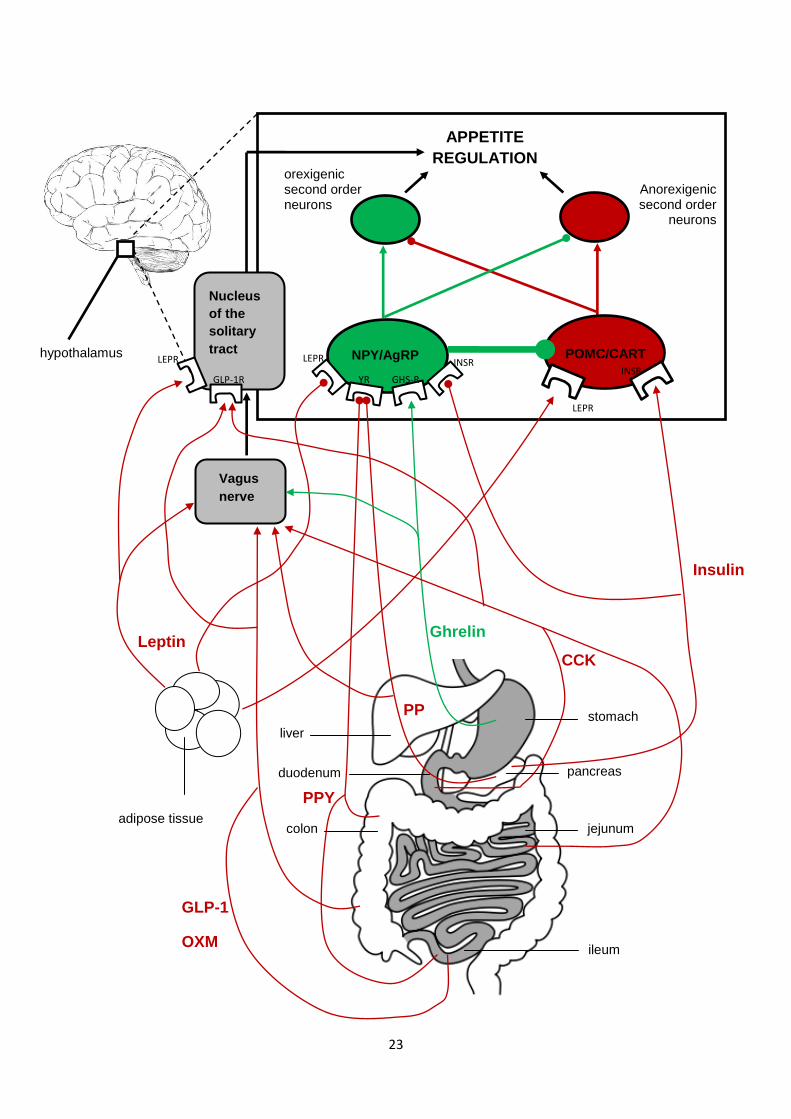
23
NPY/AgRP
APPETITE
REGULATION
POMC/CART
adipose tissue
orexigenic second order neurons
Anorexigenic second order
neurons
Leptin Ghrelin
PPY
Insulin
PP
Nucleus
of the
solitary
tract
Vagus
nerve
hypothalamus
GLP-1
OXM
CCK
GHS-R YR
INSR INSR
LEPR
LEPR LEPR
GLP-1R
stomach
pancreas duodenum
colon jejunum
ileum
liver
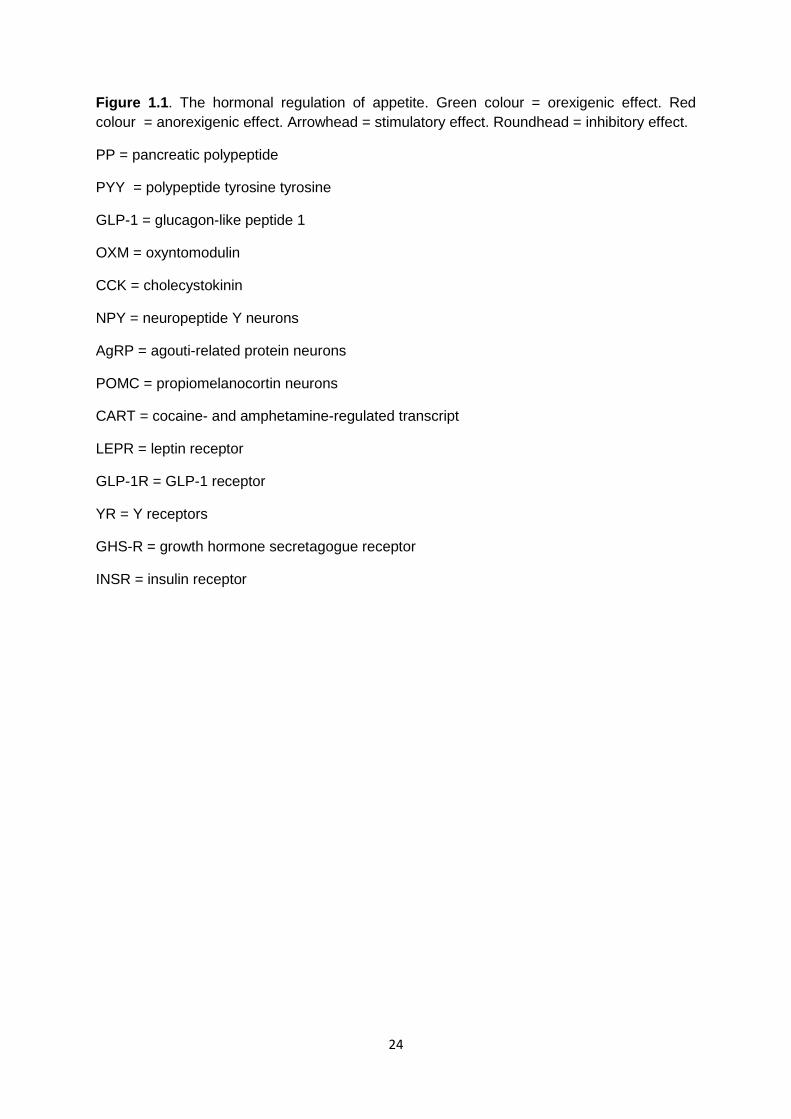
24
Figure 1.1. The hormonal regulation of appetite. Green colour = orexigenic effect. Red
colour = anorexigenic effect. Arrowhead = stimulatory effect. Roundhead = inhibitory effect.
PP = pancreatic polypeptide
PYY = polypeptide tyrosine tyrosine
GLP-1 = glucagon-like peptide 1
OXM = oxyntomodulin
CCK = cholecystokinin
NPY = neuropeptide Y neurons
AgRP = agouti-related protein neurons
POMC = propiomelanocortin neurons
CART = cocaine- and amphetamine-regulated transcript
LEPR = leptin receptor
GLP-1R = GLP-1 receptor
YR = Y receptors
GHS-R = growth hormone secretagogue receptor
INSR = insulin receptor
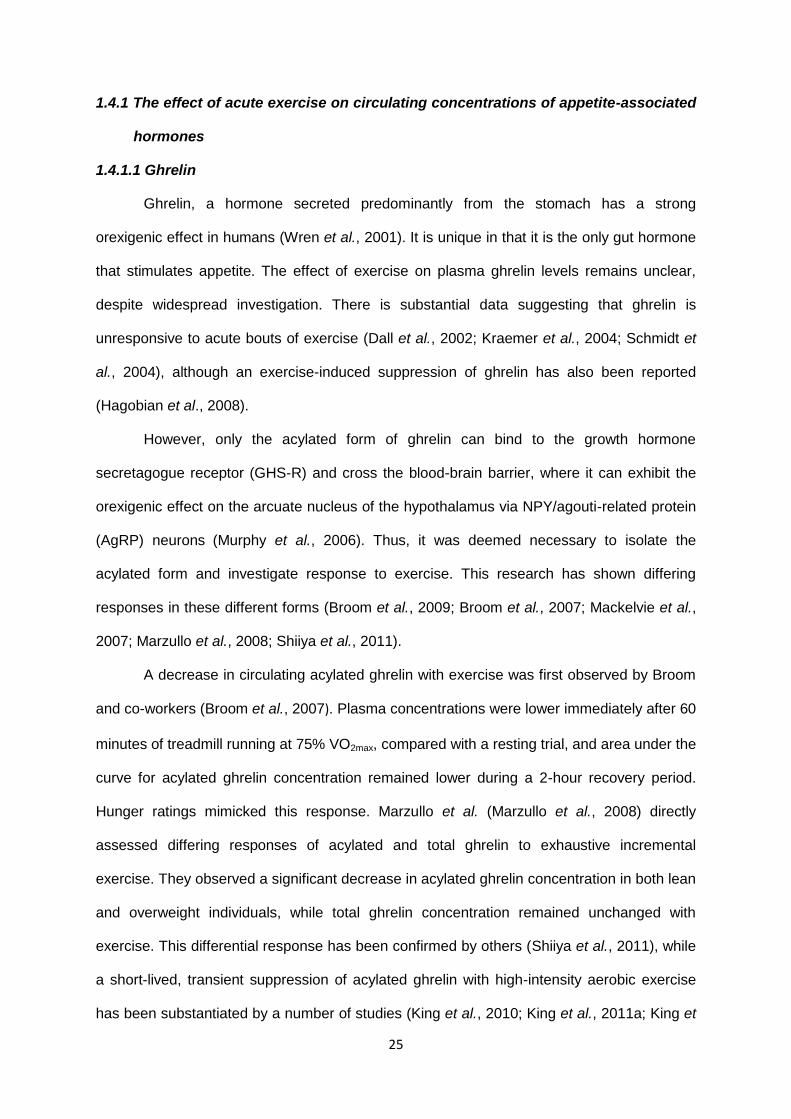
25
1.4.1 The effect of acute exercise on circulating concentrations of appetite-associated
hormones
1.4.1.1 Ghrelin
Ghrelin, a hormone secreted predominantly from the stomach has a strong
orexigenic effect in humans (Wren et al., 2001). It is unique in that it is the only gut hormone
that stimulates appetite. The effect of exercise on plasma ghrelin levels remains unclear,
despite widespread investigation. There is substantial data suggesting that ghrelin is
unresponsive to acute bouts of exercise (Dall et al., 2002; Kraemer et al., 2004; Schmidt et
al., 2004), although an exercise-induced suppression of ghrelin has also been reported
(Hagobian et al., 2008).
However, only the acylated form of ghrelin can bind to the growth hormone
secretagogue receptor (GHS-R) and cross the blood-brain barrier, where it can exhibit the
orexigenic effect on the arcuate nucleus of the hypothalamus via NPY/agouti-related protein
(AgRP) neurons (Murphy et al., 2006). Thus, it was deemed necessary to isolate the
acylated form and investigate response to exercise. This research has shown differing
responses in these different forms (Broom et al., 2009; Broom et al., 2007; Mackelvie et al.,
2007; Marzullo et al., 2008; Shiiya et al., 2011).
A decrease in circulating acylated ghrelin with exercise was first observed by Broom
and co-workers (Broom et al., 2007). Plasma concentrations were lower immediately after 60
minutes of treadmill running at 75% VO2max, compared with a resting trial, and area under the
curve for acylated ghrelin concentration remained lower during a 2-hour recovery period.
Hunger ratings mimicked this response. Marzullo et al. (Marzullo et al., 2008) directly
assessed differing responses of acylated and total ghrelin to exhaustive incremental
exercise. They observed a significant decrease in acylated ghrelin concentration in both lean
and overweight individuals, while total ghrelin concentration remained unchanged with
exercise. This differential response has been confirmed by others (Shiiya et al., 2011), while
a short-lived, transient suppression of acylated ghrelin with high-intensity aerobic exercise
has been substantiated by a number of studies (King et al., 2010; King et al., 2011a; King et
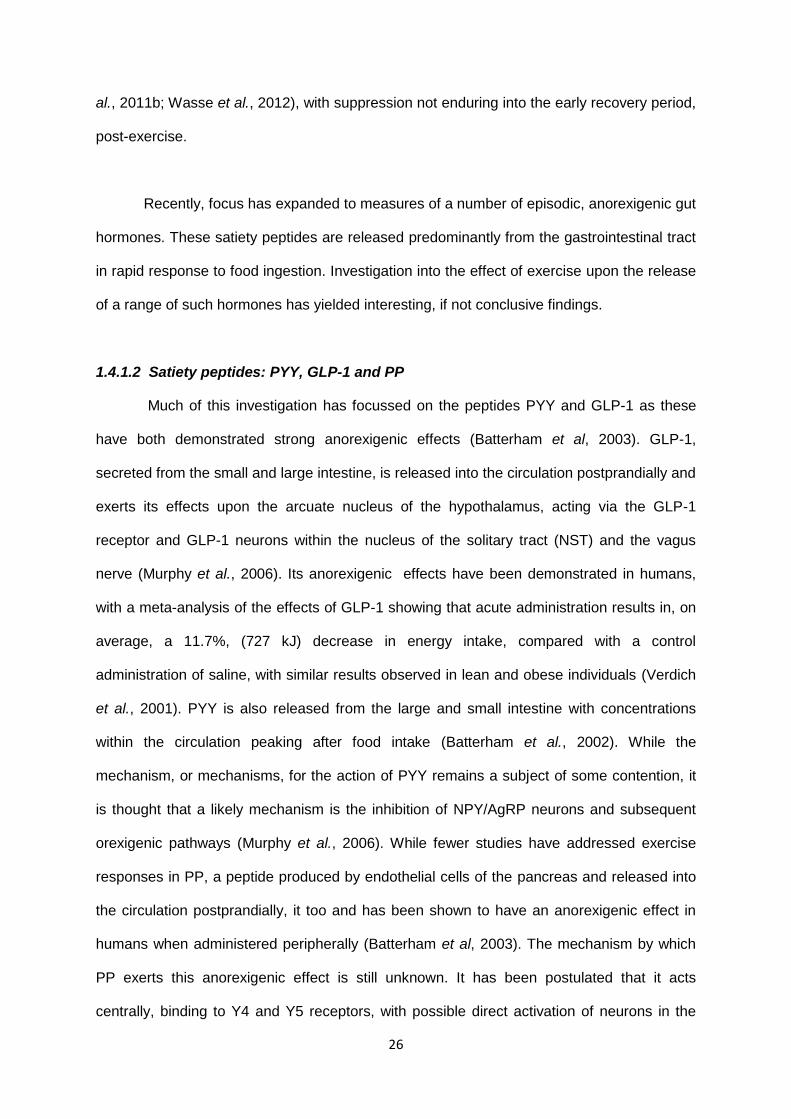
26
al., 2011b; Wasse et al., 2012), with suppression not enduring into the early recovery period,
post-exercise.
Recently, focus has expanded to measures of a number of episodic, anorexigenic gut
hormones. These satiety peptides are released predominantly from the gastrointestinal tract
in rapid response to food ingestion. Investigation into the effect of exercise upon the release
of a range of such hormones has yielded interesting, if not conclusive findings.
1.4.1.2 Satiety peptides: PYY, GLP-1 and PP
Much of this investigation has focussed on the peptides PYY and GLP-1 as these
have both demonstrated strong anorexigenic effects (Batterham et al, 2003). GLP-1,
secreted from the small and large intestine, is released into the circulation postprandially and
exerts its effects upon the arcuate nucleus of the hypothalamus, acting via the GLP-1
receptor and GLP-1 neurons within the nucleus of the solitary tract (NST) and the vagus
nerve (Murphy et al., 2006). Its anorexigenic effects have been demonstrated in humans,
with a meta-analysis of the effects of GLP-1 showing that acute administration results in, on
average, a 11.7%, (727 kJ) decrease in energy intake, compared with a control
administration of saline, with similar results observed in lean and obese individuals (Verdich
et al., 2001). PYY is also released from the large and small intestine with concentrations
within the circulation peaking after food intake (Batterham et al., 2002). While the
mechanism, or mechanisms, for the action of PYY remains a subject of some contention, it
is thought that a likely mechanism is the inhibition of NPY/AgRP neurons and subsequent
orexigenic pathways (Murphy et al., 2006). While fewer studies have addressed exercise
responses in PP, a peptide produced by endothelial cells of the pancreas and released into
the circulation postprandially, it too and has been shown to have an anorexigenic effect in
humans when administered peripherally (Batterham et al, 2003). The mechanism by which
PP exerts this anorexigenic effect is still unknown. It has been postulated that it acts
centrally, binding to Y4 and Y5 receptors, with possible direct activation of neurons in the
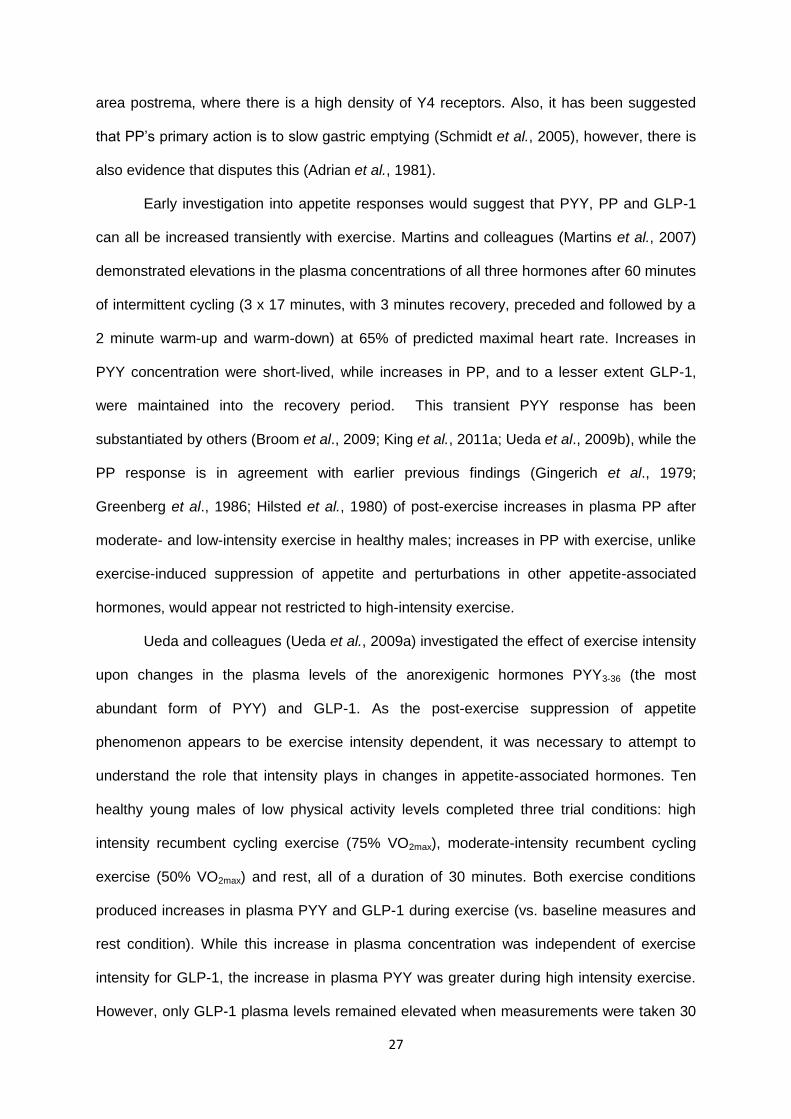
27
area postrema, where there is a high density of Y4 receptors. Also, it has been suggested
that PP’s primary action is to slow gastric emptying (Schmidt et al., 2005), however, there is
also evidence that disputes this (Adrian et al., 1981).
Early investigation into appetite responses would suggest that PYY, PP and GLP-1
can all be increased transiently with exercise. Martins and colleagues (Martins et al., 2007)
demonstrated elevations in the plasma concentrations of all three hormones after 60 minutes
of intermittent cycling (3 x 17 minutes, with 3 minutes recovery, preceded and followed by a
2 minute warm-up and warm-down) at 65% of predicted maximal heart rate. Increases in
PYY concentration were short-lived, while increases in PP, and to a lesser extent GLP-1,
were maintained into the recovery period. This transient PYY response has been
substantiated by others (Broom et al., 2009; King et al., 2011a; Ueda et al., 2009b), while the
PP response is in agreement with earlier previous findings (Gingerich et al., 1979;
Greenberg et al., 1986; Hilsted et al., 1980) of post-exercise increases in plasma PP after
moderate- and low-intensity exercise in healthy males; increases in PP with exercise, unlike
exercise-induced suppression of appetite and perturbations in other appetite-associated
hormones, would appear not restricted to high-intensity exercise.
Ueda and colleagues (Ueda et al., 2009a) investigated the effect of exercise intensity
upon changes in the plasma levels of the anorexigenic hormones PYY3-36 (the most
abundant form of PYY) and GLP-1. As the post-exercise suppression of appetite
phenomenon appears to be exercise intensity dependent, it was necessary to attempt to
understand the role that intensity plays in changes in appetite-associated hormones. Ten
healthy young males of low physical activity levels completed three trial conditions: high
intensity recumbent cycling exercise (75% VO2max), moderate-intensity recumbent cycling
exercise (50% VO2max) and rest, all of a duration of 30 minutes. Both exercise conditions
produced increases in plasma PYY and GLP-1 during exercise (vs. baseline measures and
rest condition). While this increase in plasma concentration was independent of exercise
intensity for GLP-1, the increase in plasma PYY was greater during high intensity exercise.
However, only GLP-1 plasma levels remained elevated when measurements were taken 30
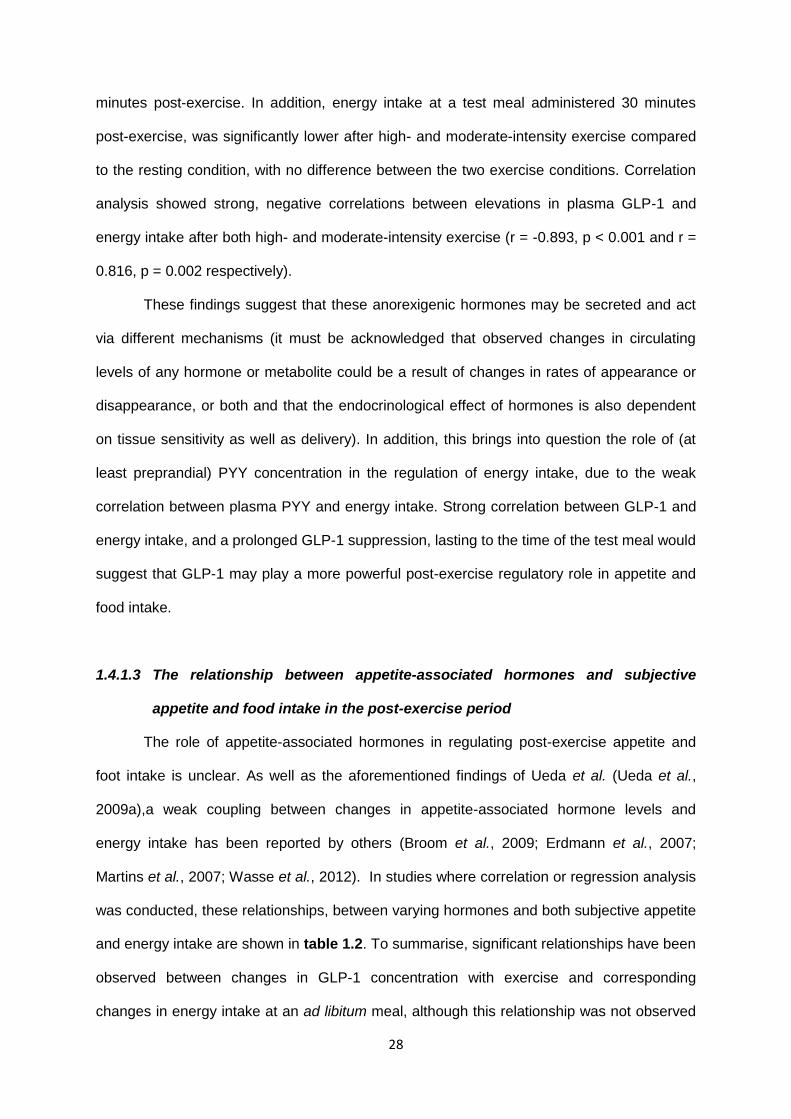
28
minutes post-exercise. In addition, energy intake at a test meal administered 30 minutes
post-exercise, was significantly lower after high- and moderate-intensity exercise compared
to the resting condition, with no difference between the two exercise conditions. Correlation
analysis showed strong, negative correlations between elevations in plasma GLP-1 and
energy intake after both high- and moderate-intensity exercise (r = -0.893, p < 0.001 and r =
0.816, p = 0.002 respectively).
These findings suggest that these anorexigenic hormones may be secreted and act
via different mechanisms (it must be acknowledged that observed changes in circulating
levels of any hormone or metabolite could be a result of changes in rates of appearance or
disappearance, or both and that the endocrinological effect of hormones is also dependent
on tissue sensitivity as well as delivery). In addition, this brings into question the role of (at
least preprandial) PYY concentration in the regulation of energy intake, due to the weak
correlation between plasma PYY and energy intake. Strong correlation between GLP-1 and
energy intake, and a prolonged GLP-1 suppression, lasting to the time of the test meal would
suggest that GLP-1 may play a more powerful post-exercise regulatory role in appetite and
food intake.
1.4.1.3 The relationship between appetite-associated hormones and subjective
appetite and food intake in the post-exercise period
The role of appetite-associated hormones in regulating post-exercise appetite and
foot intake is unclear. As well as the aforementioned findings of Ueda et al. (Ueda et al.,
2009a),a weak coupling between changes in appetite-associated hormone levels and
energy intake has been reported by others (Broom et al., 2009; Erdmann et al., 2007;
Martins et al., 2007; Wasse et al., 2012). In studies where correlation or regression analysis
was conducted, these relationships, between varying hormones and both subjective appetite
and energy intake are shown in table 1.2. To summarise, significant relationships have been
observed between changes in GLP-1 concentration with exercise and corresponding
changes in energy intake at an ad libitum meal, although this relationship was not observed
29
for changes in PYY (Ueda et al., 2009a). A lack of a correlation has also been observed
between acylated ghrelin and ad libitum energy intake (King et al., 2010; King et al., 2011b).
Larsen-Meyer et al. (Larson-Meyer et al., 2012) showed that GLP-1 and PYY concentration
were significant predictors of hunger in runners, post-exercise, but not for walkers. Both total
and acylated ghrelin were observed to not be significant predictors. In contrast, Broom and
colleagues (Broom et al., 2007) showed a significant positive relationship between acylated
ghrelin concentration and hunger immediately post-exercise, yet failed to observe a
significant correlation between acylated ghrelin and hunger at any time point in a follow up
study (Broom et al., 2009). However, table 1.2 also highlights the infrequency in which this
analysis is carried out in exercise and appetite research. To fully understand the regulatory
role of appetite-associated hormones on subjective appetite and food intake post-exercise,
correlation or regression analysis should be included in studies of this nature.
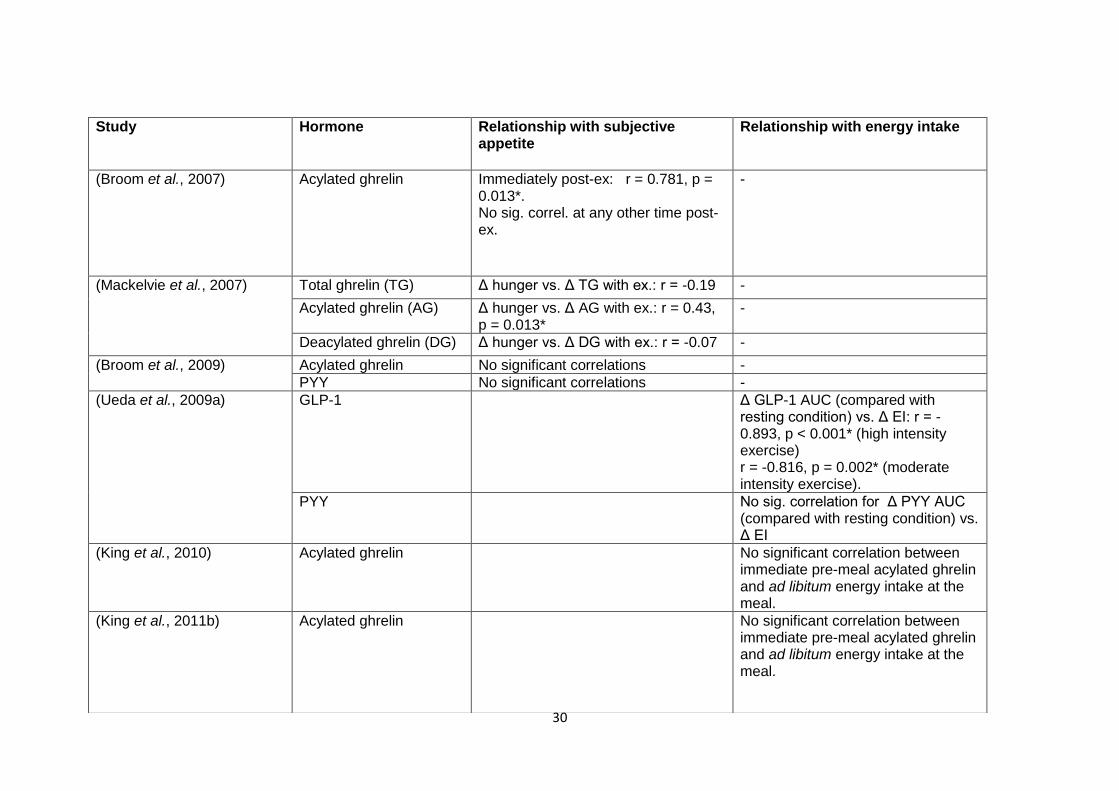
30
Study Hormone Relationship with subjective appetite
Relationship with energy intake
(Broom et al., 2007) Acylated ghrelin Immediately post-ex: r = 0.781, p = 0.013*. No sig. correl. at any other time post-ex.
-
(Mackelvie et al., 2007) Total ghrelin (TG) Δ hunger vs. Δ TG with ex.: r = -0.19 -
Acylated ghrelin (AG) Δ hunger vs. Δ AG with ex.: r = 0.43, p = 0.013*
-
Deacylated ghrelin (DG) Δ hunger vs. Δ DG with ex.: r = -0.07 -
(Broom et al., 2009) Acylated ghrelin No significant correlations -
PYY No significant correlations -
(Ueda et al., 2009a) GLP-1 Δ GLP-1 AUC (compared with resting condition) vs. Δ EI: r = -0.893, p < 0.001* (high intensity exercise) r = -0.816, p = 0.002* (moderate intensity exercise).
PYY No sig. correlation for Δ PYY AUC (compared with resting condition) vs. Δ EI
(King et al., 2010) Acylated ghrelin No significant correlation between immediate pre-meal acylated ghrelin and ad libitum energy intake at the meal.
(King et al., 2011b)
Acylated ghrelin No significant correlation between immediate pre-meal acylated ghrelin and ad libitum energy intake at the meal.
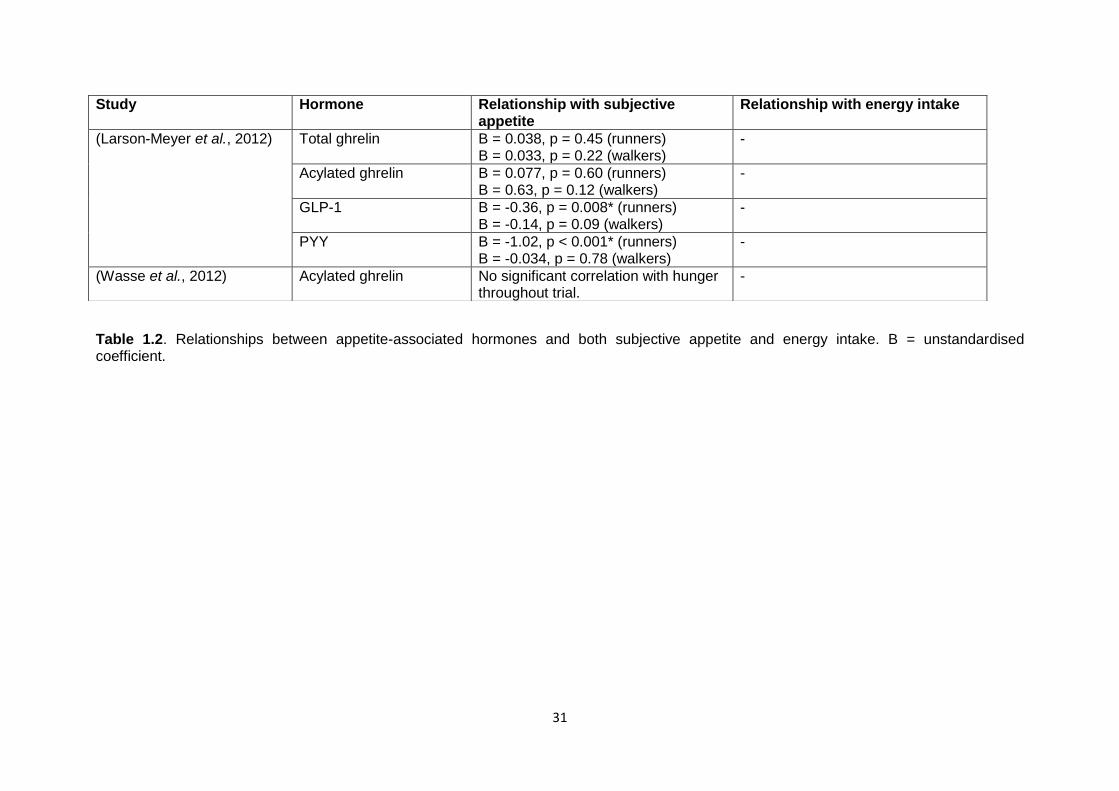
31
Table 1.2. Relationships between appetite-associated hormones and both subjective appetite and energy intake. B = unstandardised coefficient.
Study Hormone Relationship with subjective appetite
Relationship with energy intake
(Larson-Meyer et al., 2012) Total ghrelin B = 0.038, p = 0.45 (runners) B = 0.033, p = 0.22 (walkers)
-
Acylated ghrelin B = 0.077, p = 0.60 (runners) B = 0.63, p = 0.12 (walkers)
-
GLP-1 B = -0.36, p = 0.008* (runners) B = -0.14, p = 0.09 (walkers)
-
PYY B = -1.02, p < 0.001* (runners) B = -0.034, p = 0.78 (walkers)
-
(Wasse et al., 2012) Acylated ghrelin No significant correlation with hunger throughout trial.
-
32
1.5 Methodological issues associated with acute exercise and appetite
research
Despite a large body of literature regarding the effect of acute exercise on appetite,
food intake and appetite-associated hormones, contention remains. It is possible that the
lack of consistency in study findings and the difficulty in comparing and contrasting findings
can be attributed to issues associated with methodology. This section will briefly discuss
these issues.
1.5.1 Lack of continuity in study design
A vast number of studies have utilised a wide range of study designs, with little inter-
and intra-research group continuity. Table 1.1 shows a number of studies that have
investigated the effect of acute bouts of exercise on appetite and food intake. Expressed in
the table are detailed study designs and study findings. Looking at the study findings, there
is considerable variety and disagreement. When this is the case, it is then necessary to try to
decipher the reasons for disagreement, primarily looking at differences in methodologies and
critiquing study design. However, due to the lack of continuity in methodologies throughout
the literature, this is fraught with difficulty and a reasonable attempt to explain the
disagreement in study findings is very tricky.
As a crude example, Ueda et al (Ueda et al., 2009b) demonstrated a decrease in
energy intake after exercise, Pomerleau and colleagues (Pomerleau et al., 2004) found that
exercise increased energy intake, while Imbeault and co-workers (Imbeault et al., 1997)
showed that energy intake was unaffected by exercise. However, when we look at the study
designs in an attempt to highlight reasons for this disagreement, we find that many aspects
of the designs differ. These include: bodyweight-status, activity level and gender of the study
population; the intensity, duration and mode of exercise and the techniques used to obtain
appetite measures. With such lack of continuity, it is almost unfeasible to attribute the
different study findings to any single confounding variable. This makes drawing firm
33
conclusions from the existing literature very difficult and attempting to formulate hypotheses
of mechanisms underpinning observations all but impossible.
Closer inspection of table 1.1 unveils a number of similar discrepancies in both
findings and study design. Such observations highlight the need for a more consistent,
systematic approach to the study question, to allow for a true understanding of differing
study findings and effects.
1.5.2 Problems with isolating variables
As discussed in 1.3.1, the role of different exercise characteristics in the effect of
exercise on appetite responses has yet to be fully established. This is partly due to issues
associated with the isolation of variables under investigation. Often, when investigating the
effects of different exercise conditions, the intensity of exercise is the primary focus. As
discussed in section 1.3.1.2 (p9), the duration and energy expenditure of the exercise bout
are not often the variables under investigation. However, the nature of the relationship
between intensity, duration and energy expenditure means that it is impossible to isolate just
one of these characteristics as an independent variable in a single investigation. Hence,
from a single study, it is not possible to completely attribute study findings to the single
primary variable that is being investigated. For example, Kissileff et al. (Kissileff et al., 1990)
found a reduced food intake 15 minutes after high intensity exercise, but not moderate
intensity exercise and attributed this difference purely to the difference in exercise intensity.
However, as both bouts lasted for 40 minutes, the energy expenditure of the exercise also
varied. The differing responses in food intake after continuous moderate-intensity,
intermittent hard and intermittent very hard observed by Sim and colleagues (Sim et al.,
2013) could also be, to some extent, governed by differences in energy cost as well as
intensity. Similarly, studies that controlled for energy expenditure when assessing the
influence of different exercise intensity on appetite responses unavoidably have exercise
trials of differing duration (Imbeault et al., 1997; Pomerleau et al., 2004).
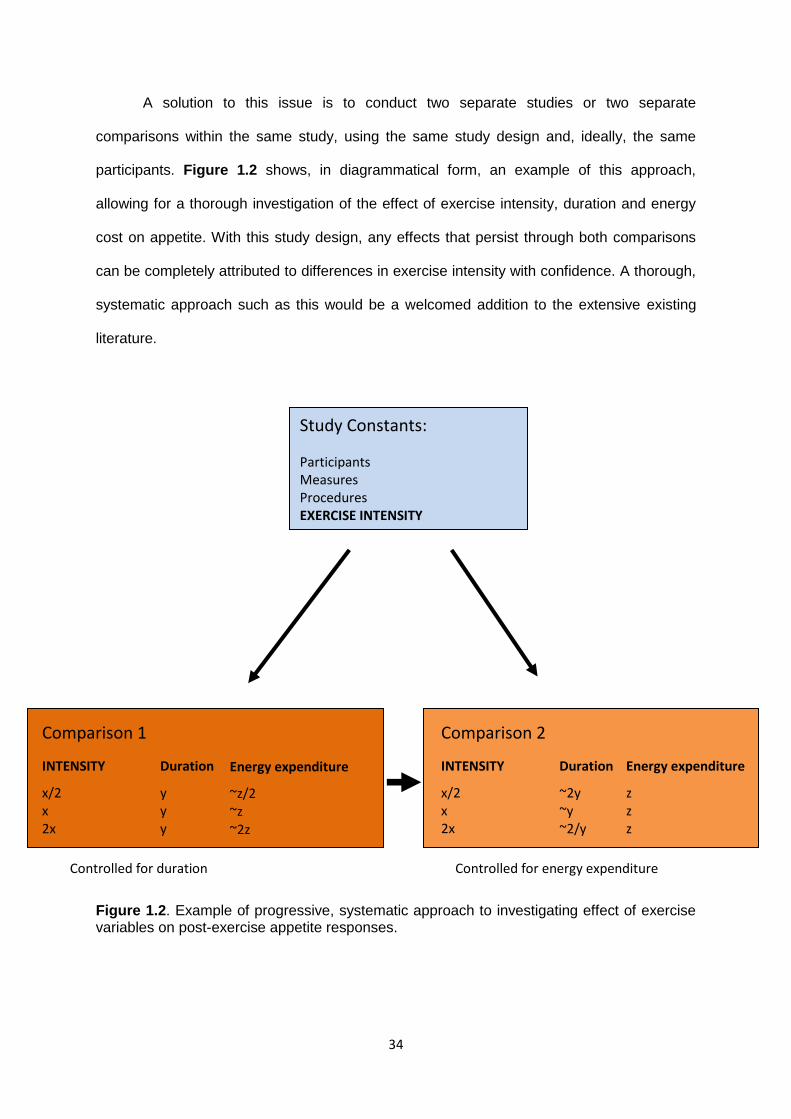
34
A solution to this issue is to conduct two separate studies or two separate
comparisons within the same study, using the same study design and, ideally, the same
participants. Figure 1.2 shows, in diagrammatical form, an example of this approach,
allowing for a thorough investigation of the effect of exercise intensity, duration and energy
cost on appetite. With this study design, any effects that persist through both comparisons
can be completely attributed to differences in exercise intensity with confidence. A thorough,
systematic approach such as this would be a welcomed addition to the extensive existing
literature.
Figure 1.2. Example of progressive, systematic approach to investigating effect of exercise variables on post-exercise appetite responses.
Comparison 1
INTENSITY
x/2 x 2x
Duration
y y y
Energy expenditure
~z/2 ~z ~2z
Comparison 2
INTENSITY
x/2 x 2x C
Study Constants:
Participants Measures Procedures EXERCISE INTENSITY
Controlled for energy expenditure Controlled for duration
Duration
~2y ~y ~2/y
Energy expenditure
z z z
35
It remains necessary to conduct a number of well-controlled studies, utilising the
same study design, in order to address the effect of a number of exercise characteristics on
the acute effect of exercise on appetite, food intake and appetite-associated hormones in a
range of study populations in a progressive, systematic manner. Such an approach should
lead to full elucidation of this study question.
1.5.3 Measurements of appetite and food intake
A number of different measures, using different techniques and tools have been used
to address post-exercise appetite. Subjective appetite is usually measured using visual
analogue scales to answer questions regarding hunger, fullness, desire to eat and expected
intake. The answer is given by making a mark on an ungraded line, typically 100mm or
150mm in length, anchored on either end with extreme answers to the question. A score is
denoted by measuring how far along the line the mark is made. These are quick and
relatively easy for the participant to complete and are inexpensive to administer. They
provide a valid measure of subjective appetite that proves reliable for within-subject,
repeated measures and scores correlate with subsequent food intake (Blundell et al., 2010;
Flint et al., 2000; Stratton et al., 1998; Stubbs et al., 2000). Visual analogue scales also
allow independent repeat measures within close proximity, so are successful at detecting
changes in appetite over time, which is commonly an important measure of interest within
exercise and appetite research. Test-retest reproducibility of VAS is good (Flint et al., 2000;
Stratton et al., 1998), but day-to-day reproducibility has been shown to be weak (Flint et al.,
2000; Raben et al., 1995).
However, this method does have a number of limitations. VAS provides only a
surrogate of energy intake, exhibiting questionable ability to predict eating behaviour. The
correlation between immediately pre-meal VAS score and food intake at an ad libitum test
meal have been observed to be weak-to-moderate in strength in some instances (Flint et al.,
2000; Parker et al., 2004). The between-subject reliability is considered poor (Stubbs et al.,
2000). This is likely because the VAS is in effect a measure of relative appetite, offering no
36
indication of absolute appetite or prediction of absolute food intake and not taking into
account habitual food intake. For instance, a VAS score for hunger of 130 on a 150mm scale
for participant A and participant B would indicated that they are both very hungry. However,
consider that participant A is perhaps a large individual who is active and with considerable
lean muscle mass (see (Blundell et al., 2012) for the relevance of body composition and lean
mass for energy intake) and an unrestrained eater (Lluch et al., 2000), while participant B is
of much smaller body mass, with little lean muscle mass and is a restrained eater. The
likelihood is that participant A habitually eats more than participant B at a meal and
throughout a day. Therefore, despite the same score on the VAS, suggesting the same
degree of hunger, there is likely to be a large variation in their respective intakes at an ad
libitum intake measure.
Other limitations also persist. VAS offers no indication of aspects of eating behaviour
such as food preference and likely macronutrient intake. The nature of the measure, with a
vague question and line format can be considered a rather abstract assessment of appetite,
with it possible that some participants struggle to conceptualise the constructs of hunger and
fullness. This may particularly be the case with certain populations, such as children.
Subjective measures of appetite are often accompanied by a more objective
measure such as measures of appetite-associated hormones, or proxy measures of eating
behaviour, typically in the form of ad libitum food intake. An extensive review of these
measures and the methodological issues associated was conducted by Stubbs et al. (1998)
and the reader is directed to this work for a thorough discussion. The current piece will
provide a more succinct overview.
These ad libitum intake measures can take the form of homogeneous meals, with no
aspect of food choice or in the form of buffet-style meals, offering a wide range of food
options (see table 1.1). The buffet-style option can be considered advantageous due to it
allowing for a measure of food preference and macronutrient intake. It also ensures that
eating cessation does not occur prematurely due to the participants not being particularly
fond of the food offered or due to boredom of consuming the same food. Conversely, buffet-
37
style meals offer a non-habitual eating environment and style, which may lead to overeating,
due to a large degree of food options. It is possible that the more quantitative a measure is,
the greater the disruption to normal eating behaviour (Stubbs et al., 1998). Also, the make-
up of these test meals across different studies varies dramatically, making comparisons
between study findings with regard to energy intake and food choice difficult.
An important limitation of the ad libitum test meal for measures of appetite is that it is
not possible to take independent repeated measures within close proximity. Prior food intake
will always impact upon the eating behaviour exhibited at a later eating episode several
hours later. So, changes in appetite over time are not easily measured with any sensitivity. In
addition, such test meals are highly labour intensive and can be expensive, especially if a
large food choice is provided and food is made available in excess to ensure true ad libitum
feeding. This can also lead to a large degree of food wastage, which can be considered
undesirable or unethical.
With limitations seen with the common methods used for both subjective appetite and
food intake measures, it may be considered desirable and prove beneficial to come up with a
solution.
1.6 Future directions of research
Future studies should focus on methodological issues, as well as research questions.
The methods used for the measure of appetite parameters are not perfect. Seeking an
alternative method or methods for the measure of appetite, maintaining the strengths of
existing measures but addressing their limitations may prove beneficial for use within
exercise and appetite research.
A more systematic, progressive approach to the research area would prove useful,
especially for fully elucidating questions for which contention remains. One of these issues is
whether duration of exercise and the energy cost of exercise influence appetite and the
38
response of appetite-associated hormones, as these questions have not been addressed
directly. While the effect on exercise intensity of appetite and appetite-associated hormones
has been extensively investigated, what remains to be assessed is whether this effect differs
with different populations, based on habitual exercise levels. For this reason, it may be of
interest to study the appetite response to high-intensity exercise in highly-trained athletic
populations. Using such a population will also allow for the completion of a more strenuous
exercise bout, with a greater exercise load; it would be of interest to see whether a greater
load could augment a post-exercise suppression of appetite and hence result in a greater
influence on food intake in the hours after exercise. As well as studies within athletic
populations being both useful and of interest, research assessing appetite responses to
exercise should investigate responses in the population that the issues of energy balance
and weight-management are most clinically relevant: the overweight and obese. Improving
the understanding of responses of appetite parameters to manageable, sustainable bouts of
exercise in overweight and obese individuals is necessary.
The research of this thesis will attempt to address these issues, with the following
primary aims:
1. To attempt to develop and validate a novel tool for the measurement of
subjective appetite
2. To investigate the effect of exercise on appetite in athletic populations, and in
doing so, assess the degree to which appetite responses to exercise may
vary in different populations
3. Shed further light on the influence of exercise characteristics, such as the
duration, energy cost and mode of exercise, on appetite responses to
exercise.
A secondary aim was to investigate the relationship between changes in appetite-
associated hormones and changes in both subjective appetite and ad libitum energy intake,
with these relationships being indicative of the likely regulatory role of these hormones in
post-exercise appetite responses.
39
1.7 Scope of thesis
This thesis consists of five experimental chapters. Chapter 2 comprises of a General
methods section, which includes the findings of pilot testing that preceded the investigation
of Chapter 3. Chapter 3 cover the development and validation of a novel tool for the
measurement of subjective appetite. Chapters 4 and 5 address the effect of exercise
intensity and exercise duration on subjective appetite, food intake and circulating
concentrations of appetite-associated hormones in highly trained athletes. An almost
identical study design is utilised, simply changing the independent variable in order to ensure
study continuity and allow for sound comparisons of findings. Chapter 6 differs slightly by
addressing the effect of sprint interval cycling exercise on appetite, food intake and appetite-
associated hormones in overweight and obese individuals. Chapter 7 approaches post-
exercise feeding from a slightly different perspective and assesses individuals’ ability to
consciously match energy intake with the energy expenditure of exercise. Finally, Chapter 8
discusses the findings of Chapters 2 to 7. The implications and practical relevance of these
findings are addressed and possible future directions of study are proposed.
40
1.8 References
Adrian, T.E., Greenberg, G.R., Fitzpatrick, M.L., and Bloom, S.R. (1981). Lack of effect of pancreatic polypeptide in the rate of gastric emptying and gut hormone release during breakfast. Digestion 21, 214-218. Allender, S., and Rayner, M. (2007). The burden of overweight and obesity-related ill health in the UK. Obesity Reviews 8, 467-473. Babraj, J., Vollaard, N., Keast, C., Guppy, F., Cottrell, G., and Timmons, J. (2009). Extremely short duration high intensity interval training substantially improves insulin action in young healthy males. BMC Endocrine Disorders 9, 3. Bartlett, J.D., Hwa Joo, C., Jeong, T.-S., Louhelainen, J., Cochran, A.J., Gibala, M.J., Gregson, W., Close, G.L., Drust, B., and Morton, J.P. (2012). Matched work high-intensity interval and continuous running induce similar increases in PGC-1α mRNA, AMPK, p38, and p53 phosphorylation in human skeletal muscle. Journal of Applied Physiology 112, 1135-1143. Batterham, R.L., Cowley, M.A., Small, C.J., Herzog, H., Cohen, M.A., Dakin, C.L., Wren, A.M., Brynes, A.E., Low, M.J., Ghatei, M.A., et al. (2002). Gut hormone PYY3-36 physiologically inhibits food intake. Nature 418, 650-654. Berthoud, H.-R. (2002). Multiple neural systems controlling food intake and body weight. Neuroscience & Biobehavioral Reviews 26, 393-428. Blundell, J., De Graaf, C., Hulshof, T., Jebb, S., Livingstone, B., Lluch, A., Mela, D., Salah, S., Schuring, E., Van Der Knaap, H., et al. (2010). Appetite control: methodological aspects of the evaluation of foods. Obesity Reviews 11, 251-270. Blundell, J.E., Caudwell, P., Gibbons, C., Hopkins, M., Näslund, E., King, N.A., and Finlayson, G. (2012). Body composition and appetite: fat-free mass (but not fat mass or BMI) is positively associated with self-determined meal size and daily energy intake in humans. British Journal of Nutrition 107, 445-449. Blundell, J.E., and King, N.A. (1999). Physical activity and regulation of food intake: current evidence. Medicine & Science in Sports & Exercise 31(11) Supplement, S573. Boutcher, S.H. (2011). High-intensity intermittent exercise and fat loss. Journal of Obesity 2011. Broom, D.R., Batterham, R.L., King, J.A., and Stensel, D.J. (2009). Influence of resistance and aerobic exercise on hunger, circulating levels of acylated ghrelin, and peptide YY in healthy males. American Journal of Physiology-Regulatory Integrative and Comparative Physiology 296, R29-R35. Broom, D.R., Stensel, D.J., Bishop, N.C., Burns, S.F., and Miyashita, M. (2007). Exercise-induced suppression of acylated ghrelin in humans. J Appl Physiol 102, 2165-2171. Burgomaster, K.A., Heigenhauser, G.J.F., and Gibala, M.J. (2006). Effect of short-term sprint interval training on human skeletal muscle carbohydrate metabolism during exercise and time-trial performance. Journal of Applied Physiology 100, 2041-2047. Burgomaster, K.A., Howarth, K.R., Phillips, S.M., Rakobowchuk, M., MacDonald, M.J., McGee, S.L., and Gibala, M.J. (2008). Similar metabolic adaptations during exercise after
41
low volume sprint interval and traditional endurance training in humans. The Journal of Physiology 586, 151-160. Burgomaster, K.A., Hughes, S.C., Heigenhauser, G.J.F., Bradwell, S.N., and Gibala, M.J. (2005). Six sessions of sprint interval training increases muscle oxidative potential and cycle endurance capacity in humans. Journal of Applied Physiology 98, 1985-1990. Burns, S.F., Broom, D.R., Miyashita, M., Mundy, C., and Stensel, D.J. (2007). A single session of treadmill running has no effect on plasma total ghrelin concentrations. Journal of Sports Sciences 25, 635-642. Butland, B., Jebb, S., Kopelman, P., McPherson, K., Thomas, S., Mardell, J., and Parry, V. (2007). Foresight. Tackling obesities: future choices. Project report, pp. 155. http://www.bis.gov.uk/foresight/our-work/projects/published-projects/tackling-obesities/reports-and-publications Carroll, K.K. (1998). Obesity as a risk factor for certain types of cancer. Lipids 33, 1055-1059. Caudwell, P., Hopkins, M., King, N.A., Stubbs, R.J., and Blundell, J.E. (2009). Exercise alone is not enough: weight loss also needs a healthy (Mediterranean) diet? Public Health Nutr 12, 1663-1666. Chan, J.M., Rimm, E.B., Colditz, G.A., Stampfer, M.J., and Willett, W.C. (1994). Obesity, fat distribution, and weight gain as risk factors for clinical diabetes in men. Diabetes Care 17, 961-969. Colditz, G.A., Willett, W.C., Stampfur, M.J., Manson, J.E., Hennekens, C.H., Arky, R.A., and Speizer, F.E. (1990). Weight as a risk factor for clinical diabetes in women. American Journal of Epidemiology 132, 501-513. Curioni, C.C., and Lourenco, P.M. (2005). Long-term weight loss after diet and exercise: a systematic review. Int J Obes Relat Metab Disord 29, 1168-1174. Dall, R., Kanaley, J., Hansen, T., Moller, N., Christiansen, J., Hosoda, H., Kangawa, K., and Jorgensen, J. (2002). Plasma ghrelin levels during exercise in healthy subjects and in growth hormone-deficient patients. Eur J Endocrinol 147, 65-70. Deighton, K., Barry, R., Connon, C., and Stensel, D. (2012). Appetite, gut hormone and energy intake responses to low volume sprint interval and traditional endurance exercise. Eur J Appl Physiol, 1-10. Deighton, K., Karra, E., Batterham, R.L., and Stensel, D.J. (2013). Appetite, energy intake and PYY3-36 responses to energy-matched continuous exercise and submaximal high intensity exercise. Applied Physiology, Nutrition, and Metabolism. Dodd, C.J., Welsman, J.R., and Armstrong, N. (2008). Energy intake and appetite following exercise in lean and overweight girls. Appetite 51, 482-488. Donnelly, J.E., Blair, S.N., Jakicic, J.M., Manore, M.M., Rankin, J.W., Smith, B.K., and null (2009). American College of Sports Medicine Position Stand. Appropriate physical activity intervention strategies for weight loss and prevention of weight regain for adults. Medicine and science in sports and exercise 41, 459-471.
42
Edholm, O.G., Adam, J.M., Healy, M.J.R., Wolff, H.S., Goldsmith, R., and Best, T.W. (1970). Food intake and energy expenditure of army recruits. British Journal of Nutrition 24, 1091-1107. Erdmann, J., Tahbaz, R., Lippl, F., Wagenpfeil, S., and Schusdziarra, V. (2007). Plasma ghrelin levels during exercise -- Effects of intensity and duration. Regulatory Peptides 143, 127-135. Finucane, M.M., Stevens, G.A., Cowan, M.J., Danaei, G., Lin, J.K., Paciorek, C.J., Singh, G.M., Gutierrez, H.R., Lu, Y., Bahalim, A.N., et al. (2011). National, regional, and global trends in body-mass index since 1980: systematic analysis of health examination surveys and epidemiological studies with 960 country-years and 9·1 million participants. The Lancet 377, 557-567. Flint, A., Raben, A., Blundell, J.E., and Astrup, A. (2000). Reproducibility, power and validity of visual analogue scales in assessment of appetite sensations in single test meal studies. International journal of obesity and related metabolic disorders : journal of the International Association for the Study of Obesity 24, 38-48. Gardiner, J.V., Jayasena, C.N., and Bloom, S.R. (2008). Gut Hormones: A Weight Off Your Mind. Journal of Neuroendocrinology 20, 834-841. George, V.A., and Morganstein, A. (2003). Effect of moderate intensity exercise on acute energy intake in normal and overweight females. Appetite 40, 43-46. Gingerich, R.L., Hickson, R.C., Hagberg, J.M., and Winder, W.W. (1979). Effect of endurance exercise training on plasma pancreatic polypeptide concentration during exercise. Metabolism 28, 1179-1182. Greenberg, G.R., Marliss, E.B., and Zinman, B. (1986). Effect of exercise on the pancreatic polypeptide response to food in man. Horm Metab Res 18, 194,196. Hagobian, T.A., Sharoff, C.G., and Braun, B. (2008). Effects of short-term exercise and energy surplus on hormones related to regulation of energy balance. Metabolism 57, 393-398. Health and Social Care Information Centre (2013). Health Survey for England. Statistics on Obesity, Physical Activity and Diet – England, 2013. http://www.hscic.gov.uk/searchcatalogue?productid=11194&q=obesity&sort=Relevance&size=10&page=1#top Heden, T.D., Liu, Y., Park, Y., Dellsperger, K.C., and Kanaley, J.A. (2013). Acute aerobic exercise differentially alters acylated ghrelin and perceived fullness in normal-weight and obese individuals. Journal of Applied Physiology. Helgerud, J., Hoydal, K., Wang, E., Karlsen, T., Berg, P., Bjerkaas, M., Simonsen, T., Helgesen, C., Hjorth, N., Bach, R., and Hoff, J. (2007). Aerobic high-intensity intervals improve vo2max more than moderate training. Medicine & Science in Sports & Exercise 39, 665-671. Holmstrup, M.E., Fairchild, T.J., Keslacy, S., Weinstock, R.S., and Kanaley, J.A. (2013). Satiety, but not total PYY, Is increased with continuous and intermittent exercise. Obesity, n/a-n/a.
43
Hopkins, M., King, N.A., and Blundell, J.E. (2010). Acute and long-term effects of exercise on appetite control: Is there any benefit for weight control? Current Opinion in Clinical Nutrition and Metabolic Care 13, 635-640. Hubert, H.B., Feinleib, M., McNamara, P.M., and Castelli, W.P. (1983). Obesity as an independent risk factor for cardiovascular disease: a 26-year follow-up of participants in the Framingham Heart Study. Circulation 67, 968-977. Hubert, P., King, N.A., and Blundell, J.E. (1998). Uncoupling the effects of energy expenditure and energy intake: appetite response to short-term energy deficit induced by meal omission and physical activity. Appetite 31, 9-19. Imbeault, P., Saint-Pierre, S., Almeras, N., and Tremblay, A. (1997). Acute effects of exercise on energy intake and feeding behaviour. British Journal of Nutrition 77, 511-521. Jakicic, J.M., Clark, K., Coleman, E., Donnelly, J.E., Foreyt, J., Melanson, E., Volek, J., Volpe, S.L., and null (2001). American College of Sports Medicine position stand. Appropriate intervention strategies for weight loss and prevention of weight regain for adults. Medicine and science in sports and exercise 33, 2145-2156. Johnstone, A.M., Faber, P., Gibney, E.R., Elia, M., Horgan, G., Golden, B.E., and Stubbs, R.J. (2002). Effect of an acute fast on energy compensation and feeding behaviour in lean men and women. Int J Obes Relat Metab Disord 26, 1623-1628. Kawano, H., Mineta, M., Asaka, M., Miyashita, M., Numao, S., Gando, Y., Ando, T., Sakamoto, S., and Higuchi, M. (2013). Effects of different modes of exercise on appetite and appetite-regulating hormones. Appetite 66, 26-33. King, J.A., Miyashita, M., Wasse, L.K., and Stensel, D.J. (2010). Influence of prolonged treadmill running on appetite, energy intake and circulating concentrations of acylated ghrelin. Appetite 54, 492-498. King, J.A., Wasse, L.K., Ewens, J., Crystallis, K., Emmanuel, J., Batterham, R.L., and Stensel, D.J. (2011a). Differential acylated ghrelin, peptide YY3-36, appetite, and food intake responses to equivalent energy deficits created by exercise and food restriction. Journal of Clinical Endocrinology & Metabolism 96, 1114-1121. King, J.A., Wasse, L.K., and Stensel, D.J. (2011b). The acute effects of swimming on appetite, food intake, and plasma acylated ghrelin. Journal of Obesity 2011. King, N.A. (1999). What processes are involved in the appetite response to moderate increases in exercise-induced energy expenditure? Proceedings of the Nutrition Society 58, 107-113. King, N.A., Burley, V.J., and Blundell, J.E. (1994). Exercise induced suppression of appetite: effects on food intake and implications for energ balance. European Journal of Clinical Nutrition 48, 715-724 King, N.A., Lluch, A., Stubbs, R.J., and Blundell, J.E. (1997a). High dose exercise does not increase hunger or energy intake in free living males. Eur J Clin Nutr 51, 478-483. King, N.A., Snell, L., Smith, R.D., and Blundell, J.E. (1996). Effects of short-term exercise on appetite responses in unrestrained females. European Journal of Clinical Nutrition 50, 663-667.
44
King, N.A., Tremblay, A., and Blundell, J.E. (1997b). Effects of exercise on appetite control: implications for energy balance. Medicine & Science in Sports & Exercise 29, 1076-1089. Kissileff, H.R., Pi-Sunyer, F.X., Segal, K., Meltzer, S., and Foelsch, P.A. (1990). Acute effects of exercise on food intake in obese and nonobese women. American Journal of Clinical Nutrition 52, 240-245. Kraemer, R.R., Durand, R.J., Acevedo, E.O., Johnson, L.G., Kraemer, G.R., Hebert, E.P., and Castracane, V.D. (2004). Rigorous running increases growth hormone and insulin-like growth factor-i without altering ghrelin. Experimental Biology and Medicine 229, 240-246. Larson-Meyer, D.E., Palm, S., Bansal, A., Austin, K.J., Hart, A.M., and Alexander, B.M. (2012). Influence of running and walking on hormonal regulators of appetite in women. Journal of Obesity 2012, 15. Little, J.P., Gillen, J.B., Percival, M.E., Safdar, A., Tarnopolsky, M.A., Punthakee, Z., Jung, M.E., and Gibala, M.J. (2011). Low-volume high-intensity interval training reduces hyperglycemia and increases muscle mitochondrial capacity in patients with type 2 diabetes. Journal of Applied Physiology 111, 1554-1560. Lluch, A., King, N.A., and Blundell, J.E. (2000). No energy compensation at the meal following exercise indietary restrained and unrestrained women. British Journal of Nutrition 84, 219-225. Mackelvie, K.J., Meneilly, G.S., Elahi, D., Wong, A.C.K., Barr, S.I., and Chanoine, J.-P. (2007). Regulation of appetite in lean and obese adolescents after exercise: role of acylated and desacyl ghrelin. J Clin Endocrinol Metab 92, 648-654. Martins, C., Morgan, L.M., Bloom, S.R., and Robertson, M.D. (2007). Effects of exercise on gut peptides, energy intake and appetite. J Endocrinol 193, 251-258. Marzullo, P., Salvadori, A., Brunani, A., Verti, B., Walker, G.E., Fanari, P., Tovaglieri, I., Medici, C.D., Savia, G., and Liuzzi, A. (2008). Acylated ghrelin decreases during acute exercise in the lean and obese state. Clinical Endocrinology 69, 970-971. Murphy, K.G., Dhillo, W.S., and Bloom, S.R. (2006). Gut peptides in the regulation of food intake and energy homeostasis. Endocr Rev 27, 719-727. Oh, H., and Taylor, A.H. (2012). Brisk walking reduces ad libitum snacking in regular chocolate eaters during a workplace simulation. Appetite 58, 387-392. Onyike, C.U., Crum, R.M., Lee, H.B., Lyketsos, C.G., and Eaton, W.W. (2003). Is obesity associated with major depression? Results from the third national health and nutrition examination survey. American Journal of Epidemiology 158, 1139-1147. Parker, B.A., Sturm, K., MacIntosh, C.G., Feinle, C., Horowitz, M., and Chapman, I.M. (2004). Relation between food intake and visual analogue scale ratings of appetite and other sensations in healthy older and young subjects. Eur J Clin Nutr 58, 212-218. Poehlman, E.T., and Horton, E.S. (1989). The impact of food intake and exercise on energy expenditure. Nutrition Reviews 47, 129-137. Pomerleau, M., Imbeault, P., Parker, T., and Doucet, E. (2004). Effects of exercise intensity on food intake and appetite in women. Am J Clin Nutr 80, 1230-1236.
45
Prospective Studies, C. (2009). Body-mass index and cause-specific mortality in 900 000 adults: collaborative analyses of 57 prospective studies. The Lancet 373, 1083-1096. Raben, A., Tagliabue, A., and Astrup, A. (1995). The reproducibility of subjective appetite scores. The British journal of nutrition 73, 517-530. Schmidt, A., Maier, C., Schaller, G., Nowotny, P., Bayerle-Eder, M., Buranyi, B., Luger, A., and Wolzt, M. (2004). Acute exercise has no effect on ghrelin plasma concentrations. Horm Metab Res 36, 174-177. Schmidt, P.T., Näslund, E., Grybäck, P., Jacobsson, H., Holst, J.J., Hilsted, L., and Hellström, P.M. (2005). A role for pancreatic polypeptide in the regulation of gastric emptying and short-term metabolic control. Journal of Clinical Endocrinology & Metabolism 90, 5241-5246. Schubert, M.M., Desbrow, B., Sabapathy, S., and Leveritt, M. (2013). Acute exercise and subsequent energy intake. A meta-analysis. Appetite 63, 92-104. Schwartz, M.W., Woods, S.C., Porte, D., Seeley, R.J., and Baskin, D.G. (2000). Central nervous system control of food intake. Nature 404, 661-671. Shiiya, T., Ueno, H., Toshinai, K., Kawagoe, T., Naito, S., Tobina, T., Nishida, Y., Shindo, M., Kangawa, K., Tanaka, H., and Nakazato, M. (2011). Significant lowering of plasma ghrelin but not des-acyl ghrelin in response to acute exercise in men. Endocrine journal 58, 335-342. Sim, A.Y., Wallman, K.E., Fairchild, T.J., and Guelfi, K.J. (2013). High-intensity intermittent exercise attenuates ad-libitum energ intake. International Journal of Obesity advance online publication. Simon, G.E., Von Korff, M., Saunders, K., Miglioretti, D.L., Crane, P.K., van Belle, G., and Kessler, R.C. (2006). Association between obesity and psychiatric disorders in the US adult population. Archives of general psychiatry 63, 824-830. Staten, M.A. (1991). The effect of exercise on food intake in men and women. American Journal of Clinical Nutrition 53, 27-31. Stratton, R.J., Stubbs, R.J., Hughes, D., King, N., Blundell, J.E., and Elia, M. (1998). Comparison of the traditional paper visual analogue scale questionnaire with an Apple Newton electronic appetite rating system (EARS) in free living subjects feeding ad libitum. European Journal of Clinical Nutrition 52, 737-741. Stubbs, R.J. (1998). Nutrition Society Medal Lecture. Appetite, feeding behaviour and energy balance in human subjects. Proc Nutr Soc 57, 341-356. Stubbs, R.J., Hughes, D.A., Johnstone, A.M., Rowley, E., Reid, C., Elia, M., Stratton, R., Delargy, H., King, N., and Blundell, J.E. (2000). The use of visual analogue scales to assess motivation to eat in human subjects: a review of their reliability and validity with an evaluation of new hand-held computerized systems for temporal tracking of appetite ratings. Br J Nutr 84, 405-415. Stubbs, R.J., Hughes, D.A., Johnstone, A.M., Whybrow, S., Horgan, G.W., King, N., and Blundell, J. (2004). Rate and extent of compensatory changes in energy intake and expenditure in response to altered exercise and diet composition in humans. Am J Physiol Regul Integr Comp Physiol 286, R350-358.
46
Stubbs, R.J., Johnstone, A.M., O'Reilly, L.M., and Poppitt, S.D. (1998). Methodological issues relating to the measurement of food, energy and nutrient intake in human laboratory-based studies. Proc Nutr Soc 57, 357-372. Stubbs, R.J., Sepp, A., Hughes, D.A., Johnstone, A.M., Horgan, G.W., King, N., and Blundell, J. (2002a). The effect of graded levels of exercise on energy intake and balance in free-living men, consuming their normal diet. Eur J Clin Nutr 56, 129-140. Stubbs, R.J., Sepp, A., Hughes, D.A., Johnstone, A.M., King, N., Horgan, G., and Blundell, J.E. (2002b). The effect of graded levels of exercise on energy intake and balance in free-living women. Int J Obes Relat Metab Disord 26, 866-869. Suk, S.-H., Sacco, R.L., Boden-Albala, B., Cheun, J.F., Pittman, J.G., Elkind, M.S., and Paik, M.C. (2003). Abdominal obesity and risk of ischemic stroke: The Northern Manhattan Stroke Study. Stroke 34, 1586-1592. Thompson, D.A., Wolfe, L.A., and Eikelboom, R. (1988). Acute effects of exercise intensity on appetite in young men. Medicine & Science in Sports & Exercise 20, 222-227. Trapp, E.G., Chisholm, D.J., Freund, J., and Boutcher, S.H. (2008). The effects of high-intensity intermittent exercise training on fat loss and fasting insulin levels of young women. Int J Obes 32, 684-691. Ueda, S.-y., Yoshikawa, T., Katsura, Y., Usui, T., and Fujimoto, S. (2009a). Comparable effects of moderate intensity exercise on changes in anorectic gut hormone levels and energy intake to high intensity exercise. J Endocrinol 203, 357-364. Ueda, S.-y., Yoshikawa, T., Katsura, Y., Usui, T., Nakao, H., and Fujimoto, S. (2009b). Changes in gut hormone levels and negative energy balance during aerobic exercise in obese young males. J Endocrinol, JOE-08-0500. Unick, J.L., Otto, A.D., Goodpaster, B.H., Helsel, D.L., Pellegrini, C.A., and Jakicic, J.M. (2010). Acute effect of walking on energy intake in overweight/obese women. Appetite 55, 413-419. Verdich, C., Flint, A., Gutzwiller, J.-P., Naslund, E., Beglinger, C., Hellstrom, P.M., Long, S.J., Morgan, L.M., Holst, J.J., and Astrup, A. (2001). A meta-analysis of the effect of glucagon-like peptide-1 (7-36) amide on ad libitum energy intake in humans. J Clin Endocrinol Metab 86, 4382-4389. Wang, Y.C., McPherson, K., Marsh, T., Gortmaker, S.L., and Brown, M. (2011). Health and economic burden of the projected obesity trends in the USA and the UK. The Lancet 378, 815-825. Wasse, L.K., Sunderland, C., King, J.A., Miyashita, M., and Stensel, D.J. (2012). The influence of vigorous running and cycling exercise on hunger perceptions and plasma acylated ghrelin concentrations in lean young men. Applied Physiology, Nutrition, and Metabolism 38, 1-6. Westerterp-Plantenga, M.S., Verwegen, C.R., Ijedema, M.J., Wijckmans, N.E., and Saris, W.H. (1997). Acute effects of exercise or sauna on appetite in obese and nonobese men. Physiology & Behavior 62, 1345-1354.
47
Whybrow, S., Hughes, D.A., Ritz, P., Johnstone, A.M., Horgan, G.W., King, N., Blundell, J.E., and Stubbs, R.J. (2008). The effect of an incremental increase in exercise on appetite, eating behaviour and energy balance in lean men and women feeding ad libitum. Br J Nutr 100, 1109-1115. Whyte, L.J., Gill, J.M.R., and Cathcart, A.J. (2010). Effect of 2 weeks of sprint interval training on health-related outcomes in sedentary overweight/obese men. Metabolism 59, 1421-1428. Williams, G., Bing, C., Cai, X.J., Harrold, J.A., King, P.J., and Liu, X.H. (2001). The hypothalamus and the control of energy homeostasis: Different circuits, different purposes. Physiology & Behavior 74, 683-701. Woo, R., Garrow, J., and Pi-Sunyer, F. (1982). Effect of exercise on spontaneous calorie intake in obesity. Am J Clin Nutr 36, 470-477. Wren, A.M., and Bloom, S.R. (2007). Gut hormones and appetite control. Gastroenterology 132, 2116-2130. Wren, A.M., Seal, L.J., Cohen, M.A., Brynes, A.E., Frost, G.S., Murphy, K.G., Dhillo, W.S., Ghatei, M.A., and Bloom, S.R. (2001). Ghrelin enhances appetite and increases food intake in humans. J Clin Endocrinol Metab 86, 5992-. Zheng, H., and Berthoud, H.-R. (2008). Neural systems controlling the drive to eat: mind versus metabolism. Physiology 23, 75-83.
48
CHAPTER 2
General methods
49
This section will firstly introduce developmental and pilot investigation that preceded
the work of Chapter 3. Secondly, methods that are common to experimental Chapters 4, 5
and 6 will be described. Deviations from these general methods, along with specific protocol
and procedures, will be described in the individual chapters. The methods implemented in
Chapter 7 will be described within Chapter 7 itself.
50
2.1 Pilot testing: The development of The Birmingham Photographic Appetite
Rating.
2.1.1 INTRODUCTION
With the most recent figures showing that 65% of adult males and 58% of adult
females in England are now overweight or obese (Health and Social Care Information
Centre, 2013), the need for a greater understanding of energy balance and weight
management is necessary. In an attempt to address the “energy in” side of the energy
balance equation, the regulation of appetite has been extensively investigated (the reader is
directed to a number of comprehensive review articles (Bellisle, 1999; King et al., 2009; King
et al., 1997; Martins et al., 2008). In conducting such research, a wide range of techniques
have been utilised to obtain both subjective and objective measures of appetite and
measures of eating behaviour.
The strengths and limitations of some of these techniques have been discussed
previously (General introduction, section 1.5.3, p35) and will again be discussed in greater
depth in the following chapter (section 3.2, p83). Briefly, measures of subjective appetite are
commonly obtained with the use of visual analogue scales (VAS) (Blundell et al., 2010), with
these measures often used in conjunction with objective appetite measure, such as
measures of appetite-associated hormones and surrogates of eating behaviour, usually in
the form of a food intake or energy intake measure. Typically, ad libitum energy intake is
measured from buffet-style or constant composition test meals. However, both the VAS and
ad libitum intake methods are not without limitation. The VAS approach does not provide any
indication of desired portion size or food choice and, therefore, important aspects of eating
behaviour are neither assessed nor predicted. The ad libitum food intake technique provides
a valid quantitative proxy of eating behaviour, but does not allow for independent, repeated
measures of appetite within a short time period. Hence, with this approach alone, it is not
possible to monitor time course changes in appetite, which is often an important interest of
51
researchers. Further, the ad libitum intake method can be expensive, time-consuming and
labour-intensive, and can result in a large degree of food wastage. Due to these limitations,
an investigation into the possibility of developing a new tool and technique for the measure
of appetite was undertaken. An attempt was made to tackle the limitations of the VAS and ad
libitum intake methods, while maintaining the desirable attributes of both. The concept of
food photography was used to create a tool that would allow for independent, repeated
measures of subjective appetite, while allowing for an indication of desired food choice and a
prediction of portion size selection.
The purpose of this exploratory, pilot investigation was to develop and assess the
validity of a novel photographic images tool for the measurement of subjective appetite –
The Birmingham Photographic Appetite Rating (BPAR) – with respect to commonly used,
validated measures of subjective appetite and eating behaviour. This was achieved by
attempting to manipulate appetite state through acutely controlling diet from breakfast until
an ad libitum lunch meal, obtaining appetite measures throughout. It was hypothesised that
the BPAR score would correlate strongly with VAS scores, producing a very similar appetite
profile. Further, we hypothesised that the BPAR score would correlate with ad libitum food
intake from a constant composition test meal, to a greater extent than VAS.
52
2.1.2 METHOD
2.1.2.1 Participants
Five recreationally active participants (3 female, 2 male; mean age 23 ± 3 years)
were recruited from The School of Sport, Exercise and Rehabilitation Sciences, University of
Birmingham. Those suffering from illness such as cold or flu, those taking medication that
was likely to affect appetite or that needed to be taken with food more frequently than once a
day, those with food allergies and those suffering from diabetes were excluded from taking
part. Ethical approval was obtained from the Ethics Subcommittee of the School of Sport,
Exercise and Rehabilitation Sciences at the University of Birmingham.
2.1.2.2 Study design
A within-subject, randomised crossover study design was utilised. Participants were
randomly assigned to each of the three experimental conditions; fasted (FAST), post-
absorptive (POST-AB) and fed (FED) states.
2.1.2.3 Procedure & protocol
Participants arrived at the Exercise Metabolism Laboratory within the School of
Sport, Exercise and Rehabilitation Science, University of Birmingham between 07.00 and
09.00, after a ten-hour overnight fast. Upon arrival at the laboratory for the first time, a
written consent form was signed (Appendix 1), prior to the completion of a health
questionnaire (Appendix 2). Participants were then randomly allocated to one of the three
trial conditions; fasted state, post-absorptive state or fed state. Trials were separated by a
minimum of 3 days. The study protocol for each condition is shown in diagrammatical form
(figure 2.1). Between feeding and between the taking of appetite measures, participants
remained sedentary, free to read, watch television or work at a computer.
Prior to the first trial, participants were supplied with a food diary and asked to
complete the diary on the day before their first trial. They were then asked to replicate this
diet on the day prior to each subsequent trial.
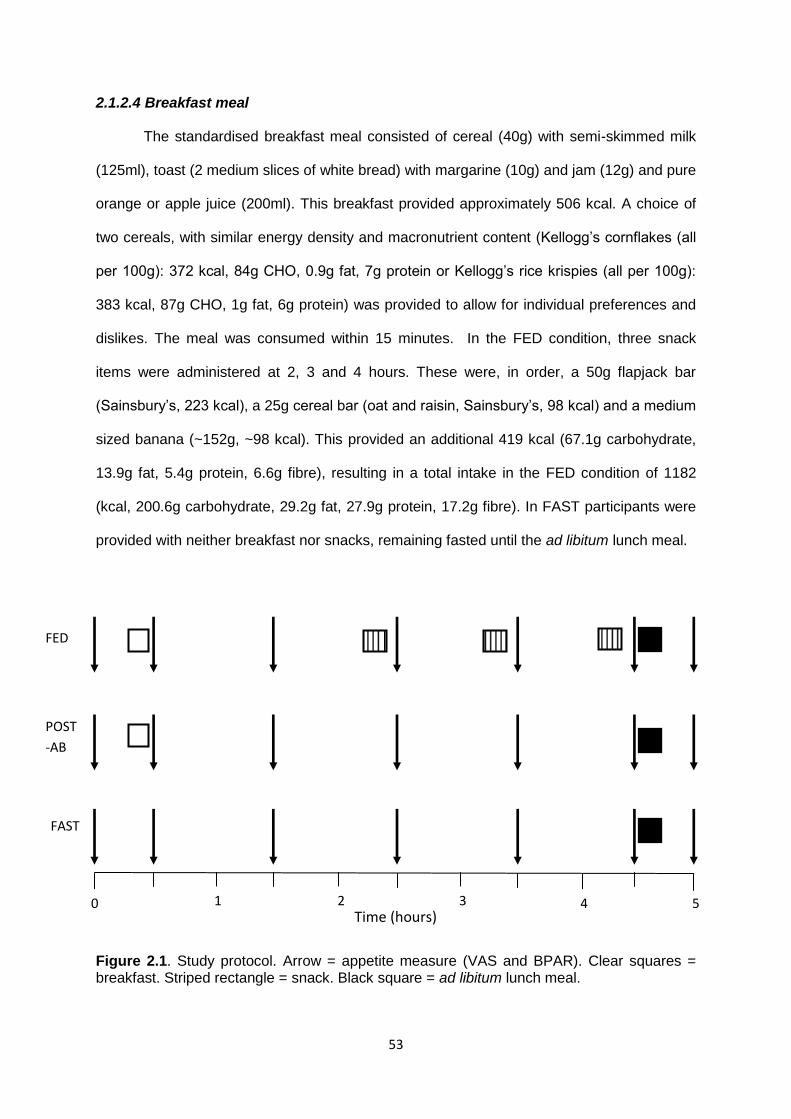
53
2.1.2.4 Breakfast meal
The standardised breakfast meal consisted of cereal (40g) with semi-skimmed milk
(125ml), toast (2 medium slices of white bread) with margarine (10g) and jam (12g) and pure
orange or apple juice (200ml). This breakfast provided approximately 506 kcal. A choice of
two cereals, with similar energy density and macronutrient content (Kellogg’s cornflakes (all
per 100g): 372 kcal, 84g CHO, 0.9g fat, 7g protein or Kellogg’s rice krispies (all per 100g):
383 kcal, 87g CHO, 1g fat, 6g protein) was provided to allow for individual preferences and
dislikes. The meal was consumed within 15 minutes. In the FED condition, three snack
items were administered at 2, 3 and 4 hours. These were, in order, a 50g flapjack bar
(Sainsbury’s, 223 kcal), a 25g cereal bar (oat and raisin, Sainsbury’s, 98 kcal) and a medium
sized banana (~152g, ~98 kcal). This provided an additional 419 kcal (67.1g carbohydrate,
13.9g fat, 5.4g protein, 6.6g fibre), resulting in a total intake in the FED condition of 1182
(kcal, 200.6g carbohydrate, 29.2g fat, 27.9g protein, 17.2g fibre). In FAST participants were
provided with neither breakfast nor snacks, remaining fasted until the ad libitum lunch meal.
Figure 2.1. Study protocol. Arrow = appetite measure (VAS and BPAR). Clear squares = breakfast. Striped rectangle = snack. Black square = ad libitum lunch meal.
Time (hours) 1 2 3 4 5
FED
POST
-AB
FAST
0
54
2.1.2.5 Measures
Subjective appetite was measured using the BPAR and the widely used VAS
technique. The BPAR is a computer programme test, in which the participant views
photographic images of 20 different food items (See Appendix 3 for list of food items, with
macronutrient information). Each food item is shown, using a continuum of many images,
with varying portion sizes. The portion size is altered by the participant using a sliding bar
scale, controlled by use of the computer mouse. The participant is asked, “If you were to
consume a meal at this moment, consisting of only the food item shown, how much would
you expect to eat in order to feel satisfyingly full? Move the sliding bar to select the
appropriate portion size.” The participant follows this instruction, selects the desired portion
size and moves on to the next food item and repeats the procedure for all 20 food items
(See figure 2.2 for an example of the BPAR in use). The number of images for each food
item typically ranged from 10 to 40, allowing for a high resolution. The participant was asked
to complete the trial within four minutes. Once completed, the result was analysed and the
investigator was able to see which portion size was selected and what number photograph
this selection corresponded to. As the weight of food in each photograph was known and
recorded, as was the nutritional information, it was possible to calculate the energy content
(kcal) of each food item selection, along with macronutrient content. A mean energy content
and mean macronutrient content was calculated from all food items rated. Although this
information alone is somewhat arbitrary, indicators of changes in macronutrient preference
were provided.
Results were derived with three of the 20 food items in the BPAR (porridge, tomato
soup and strawberry yoghurt) excluded from the analysis. This was because it was felt that
the size of the bowl that they were displayed in was not perceived accurately and therefore
portion size was also not accurately perceived. This led to extreme portion selections for
these food items. The amorphous nature of the food items is likely to have contributed to the
poor perception of portion size, as this has been seen previously with other estimations of
55
portion size when food is displayed (Weber et al., 1999) and in techniques whereby
photographic images of food were used (Venter et al., 2000).
The VAS test consisted of the participant being asked four questions relating to their
subjective appetite, based on perception of “hunger,” “fullness,” “desire to eat,” and
“expected food intake.” For each question, a 150mm line was presented, anchored at each
end by the two extreme answers (for example, the question, “how hungry do you feel at the
present moment?” had a line anchored with “the hungriest I have ever been” and “not hungry
at all”). The participant was asked to make a mark on this line using a pen. The distance
along the line that the mark was made was measured by the investigator using a ruler, with
this measure denoting a score for this question. A total VAS test score was calculated as,
hunger score + desire score + expected intake score + (150-fullness score). It was decided
to use this single score for ease of data analysis and presentation. It has been shown that,
with the original 6 question VAS technique of Hill & Blundell (Hill and Blundell, 1982), the
scores for each question co-vary to a large extent (Stubbs et al., 2000) and that the first
principal component of the questions is the mean value of the scores (Reid, et al., 1998).
Energy intake was measured with the use of an ad libitum test meal of pasta and
sauce. A choice of two sauces was available, to allow for individual preference. Both sauces
had similar nutritional content (Bolognese sauce – 80 kcal•100g-1; Carbonara sauce – 85
kcal•100g-1) and the same sauce was used for all three trials. Participants were
accompanied to the Research Kitchen within the School of Sport, Exercise and
Rehabilitation Sciences, where they were provided with a large bowl of cooked penne pasta
and a separate bowl of sauce, along with an empty plate. They were instructed to serve the
pasta and sauce onto the plate as desired and eat as much as they wanted, until they felt
satisfyingly full. They were also told that further pasta and sauce were available, should they
empty either bowl. The content of each bowl was weighed prior to the meal commencing and
again at the cessation of eating; the difference between the two indicating the amount
consumed. Subtracted from this was food left remaining on the plate, which was also

56
weighed before and after the meal. Energy density of the pasta and sauce were known,
allowing for the calculation of energy intake.
2.1.2.6 Statistical analysis
The mean energy intake values of the test meal for each condition were compared
using a one-way, repeated measures ANOVA. To test for sensitivity to change in appetite,
appetite scores from the BPAR and the VAS were both assessed using a 3 (condition:
FAST, POST-AB, FED) x 7 (time: 0, 30, 90, 150, 210, 270, 300) factorial, repeated-
measures ANOVA. Significant main effects and interactions from ANOVA were further
assessed by pairwise comparisons using Bonferroni post-hoc analysis. Also, appetite scores
from the BPAR were compared with VAS test scores, with the use of Pearson product
moment correlation analysis. This was done for within-condition, between-subject
comparisons and for between-condition, within-subject comparison, by assessing
percentage difference between the conditions (FAST – FED, FAST – POST-AB and POST-
AB – FED).
To assess the ability to predict between-subject differences in energy intake, within-
condition correlations of appetite scores and energy intake at the test meal were conducted,
for both VAS and BPAR scores. The ability to predict within-subject differences in energy
intake with different dietary manipulations was assessed by correlating between-condition
percentage changes (FAST – FED; FAST – POST-AB; POST-AB – FED) in VAS and BPAR
scores immediately prior to the test meal with percentage changes in energy intake
separately for each participant. This within-subject analysis was conducted, as it was felt that
an appetite tool should be efficacious at detecting changes in appetite that correspond with
changes in energy intake for an individual; as an intervention causes an increase in energy
intake for a person, so should it cause a similar increase in appetite score. Differences in
correlation coefficients were investigated for statistical significance using t-tests for non-
independent correlation coefficients.
57
A statistical significance level of p < 0.05 was used for all analyses of variance and
for correlation analysis. All statistical analysis was carried out using the SPSS software
programme (SPSS inc., Chicago, Illinois, USA).
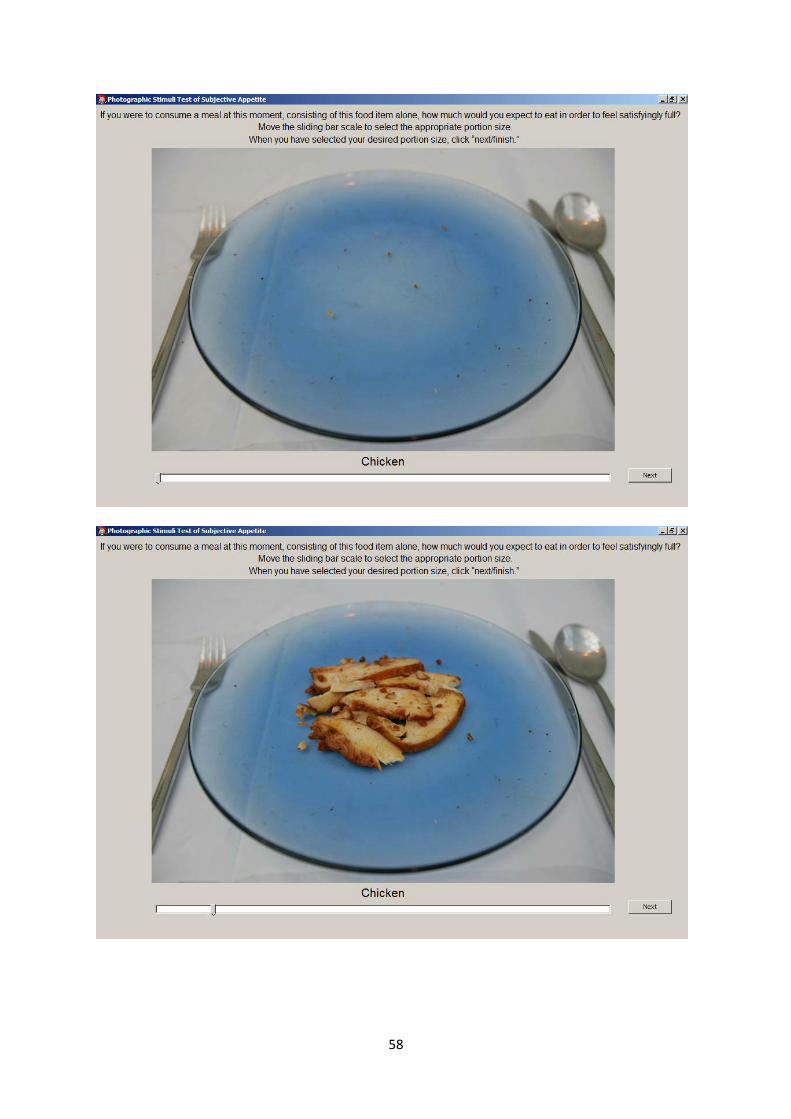
58
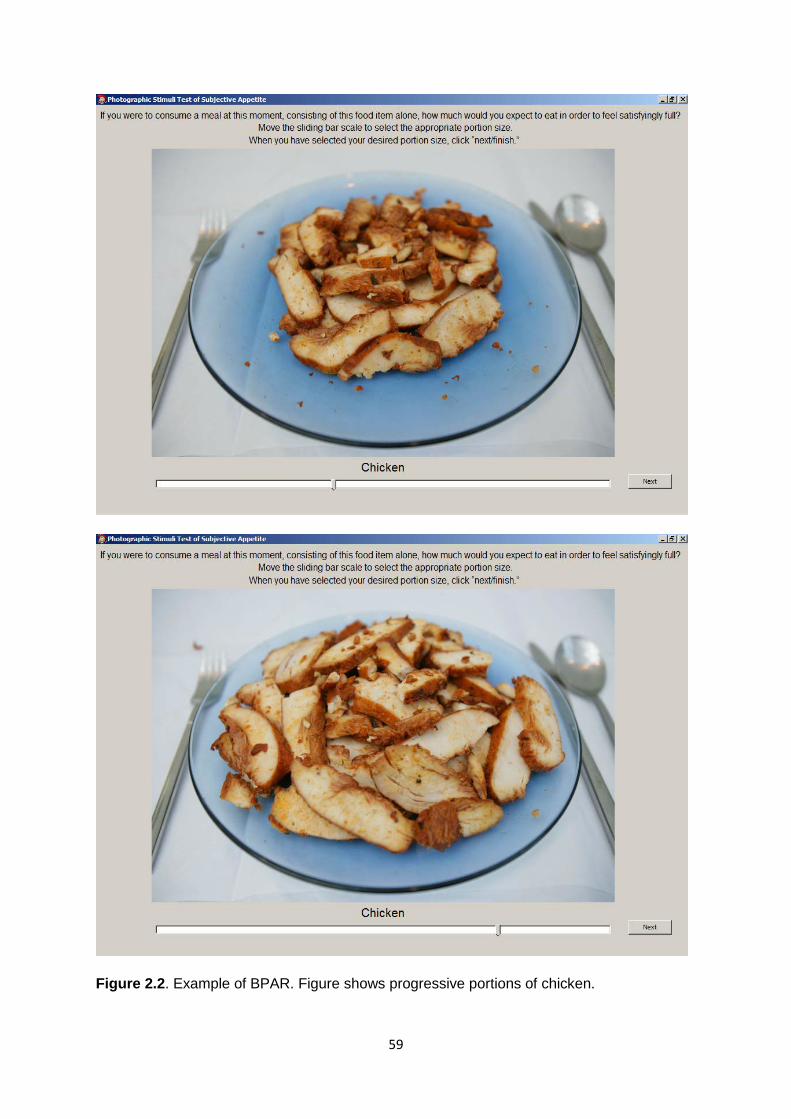
59
Figure 2.2. Example of BPAR. Figure shows progressive portions of chicken.
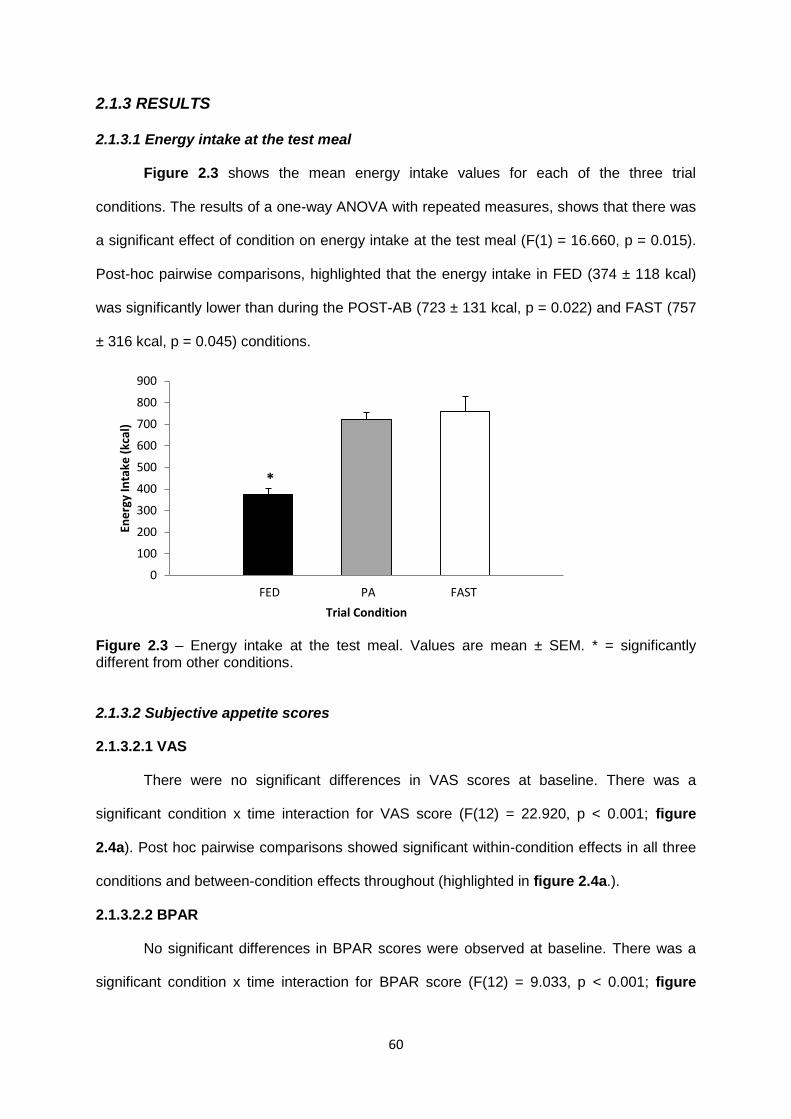
60
2.1.3 RESULTS
2.1.3.1 Energy intake at the test meal
Figure 2.3 shows the mean energy intake values for each of the three trial
conditions. The results of a one-way ANOVA with repeated measures, shows that there was
a significant effect of condition on energy intake at the test meal (F(1) = 16.660, p = 0.015).
Post-hoc pairwise comparisons, highlighted that the energy intake in FED (374 ± 118 kcal)
was significantly lower than during the POST-AB (723 ± 131 kcal, p = 0.022) and FAST (757
± 316 kcal, p = 0.045) conditions.
Figure 2.3 – Energy intake at the test meal. Values are mean ± SEM. * = significantly different from other conditions. 2.1.3.2 Subjective appetite scores
2.1.3.2.1 VAS
There were no significant differences in VAS scores at baseline. There was a
significant condition x time interaction for VAS score (F(12) = 22.920, p < 0.001; figure
2.4a). Post hoc pairwise comparisons showed significant within-condition effects in all three
conditions and between-condition effects throughout (highlighted in figure 2.4a.).
2.1.3.2.2 BPAR
No significant differences in BPAR scores were observed at baseline. There was a
significant condition x time interaction for BPAR score (F(12) = 9.033, p < 0.001; figure
0
100
200
300
400
500
600
700
800
900
FED PA FAST
Ene
rgy
Inta
ke (
kcal
)
Trial Condition
*
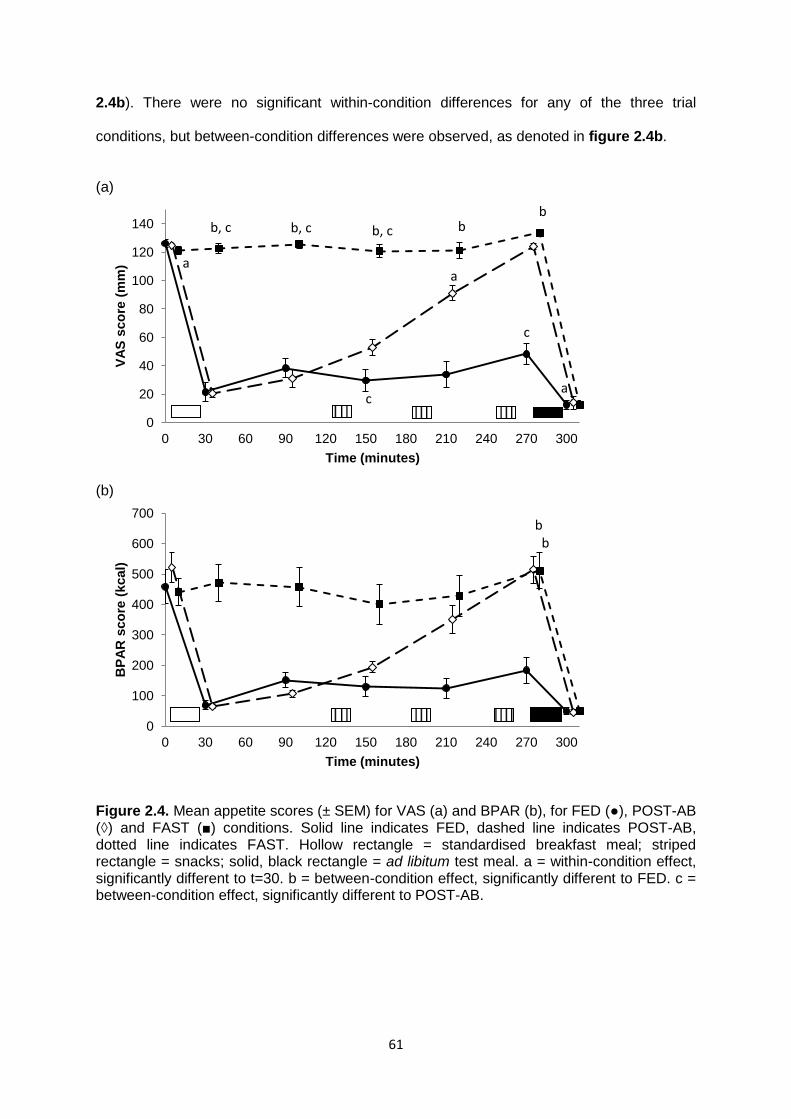
61
2.4b). There were no significant within-condition differences for any of the three trial
conditions, but between-condition differences were observed, as denoted in figure 2.4b.
(a)
(b)
Figure 2.4. Mean appetite scores (± SEM) for VAS (a) and BPAR (b), for FED (●), POST-AB (◊) and FAST (■) conditions. Solid line indicates FED, dashed line indicates POST-AB, dotted line indicates FAST. Hollow rectangle = standardised breakfast meal; striped rectangle = snacks; solid, black rectangle = ad libitum test meal. a = within-condition effect, significantly different to t=30. b = between-condition effect, significantly different to FED. c = between-condition effect, significantly different to POST-AB.
0
20
40
60
80
100
120
140
0 30 60 90 120 150 180 210 240 270 300
VA
S s
co
re (
mm
)
Time (minutes)
0
100
200
300
400
500
600
700
0 30 60 90 120 150 180 210 240 270 300
BP
AR
sco
re (
kcal)
Time (minutes)
a a
a
b, c b, c b, c b b
c
c
b b
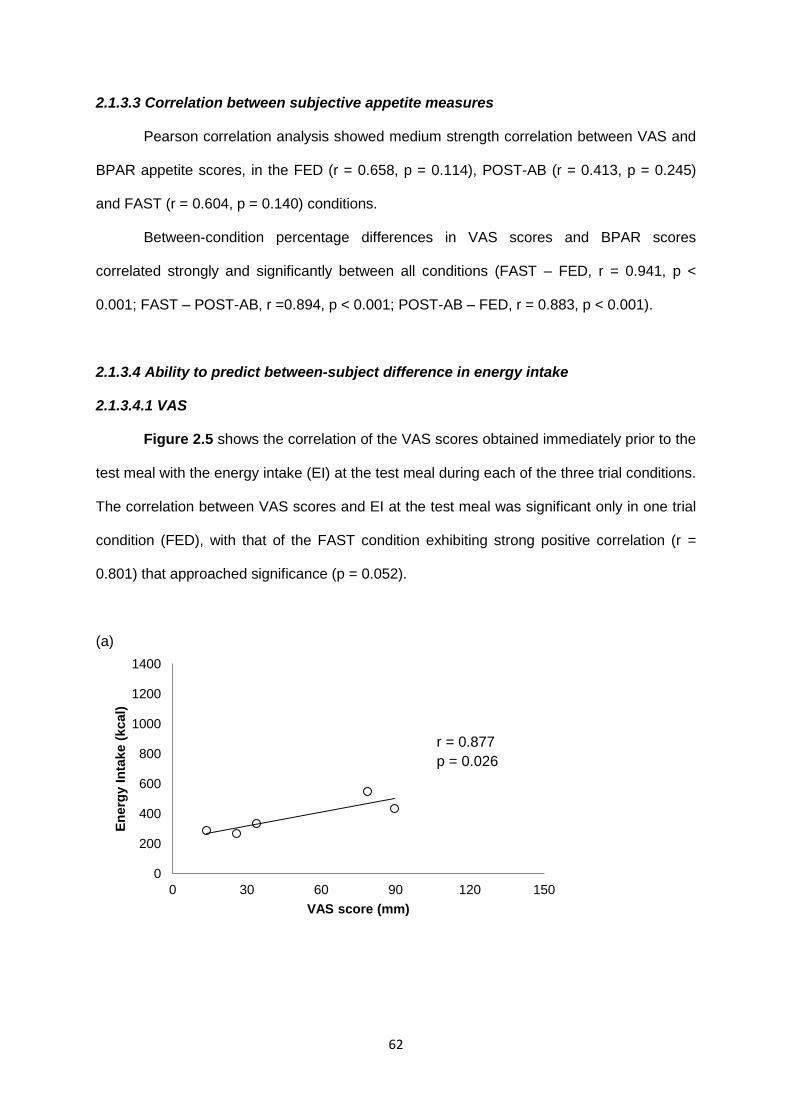
62
2.1.3.3 Correlation between subjective appetite measures
Pearson correlation analysis showed medium strength correlation between VAS and
BPAR appetite scores, in the FED (r = 0.658, p = 0.114), POST-AB (r = 0.413, p = 0.245)
and FAST (r = 0.604, p = 0.140) conditions.
Between-condition percentage differences in VAS scores and BPAR scores
correlated strongly and significantly between all conditions (FAST – FED, r = 0.941, p <
0.001; FAST – POST-AB, r =0.894, p < 0.001; POST-AB – FED, r = 0.883, p < 0.001).
2.1.3.4 Ability to predict between-subject difference in energy intake
2.1.3.4.1 VAS
Figure 2.5 shows the correlation of the VAS scores obtained immediately prior to the
test meal with the energy intake (EI) at the test meal during each of the three trial conditions.
The correlation between VAS scores and EI at the test meal was significant only in one trial
condition (FED), with that of the FAST condition exhibiting strong positive correlation (r =
0.801) that approached significance (p = 0.052).
(a)
0
200
400
600
800
1000
1200
1400
0 30 60 90 120 150
En
erg
y I
nta
ke (
kcal)
VAS score (mm)
r = 0.877
p = 0.026
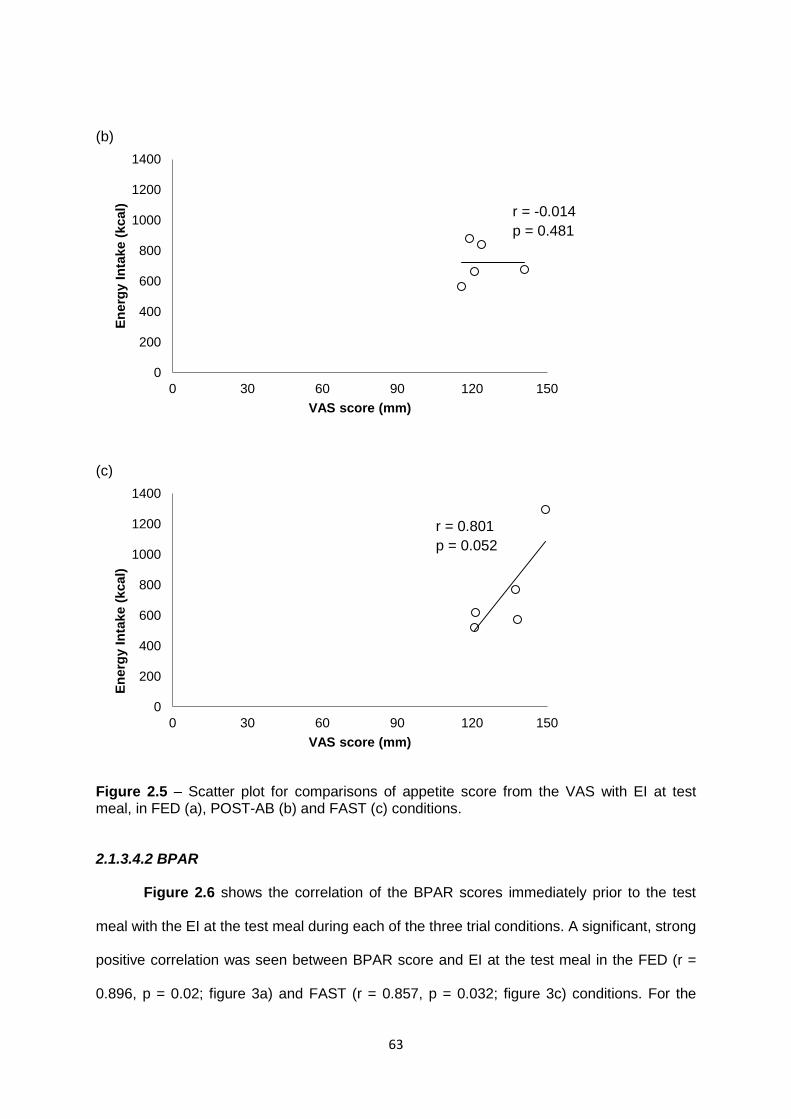
63
(b)
(c)
Figure 2.5 – Scatter plot for comparisons of appetite score from the VAS with EI at test meal, in FED (a), POST-AB (b) and FAST (c) conditions.
2.1.3.4.2 BPAR
Figure 2.6 shows the correlation of the BPAR scores immediately prior to the test
meal with the EI at the test meal during each of the three trial conditions. A significant, strong
positive correlation was seen between BPAR score and EI at the test meal in the FED (r =
0.896, p = 0.02; figure 3a) and FAST (r = 0.857, p = 0.032; figure 3c) conditions. For the
0
200
400
600
800
1000
1200
1400
0 30 60 90 120 150
En
erg
y I
nta
ke (
kcal)
VAS score (mm)
0
200
400
600
800
1000
1200
1400
0 30 60 90 120 150
En
erg
y I
nta
ke (
kcal)
VAS score (mm)
r = -0.014
p = 0.481
r = 0.801
p = 0.052
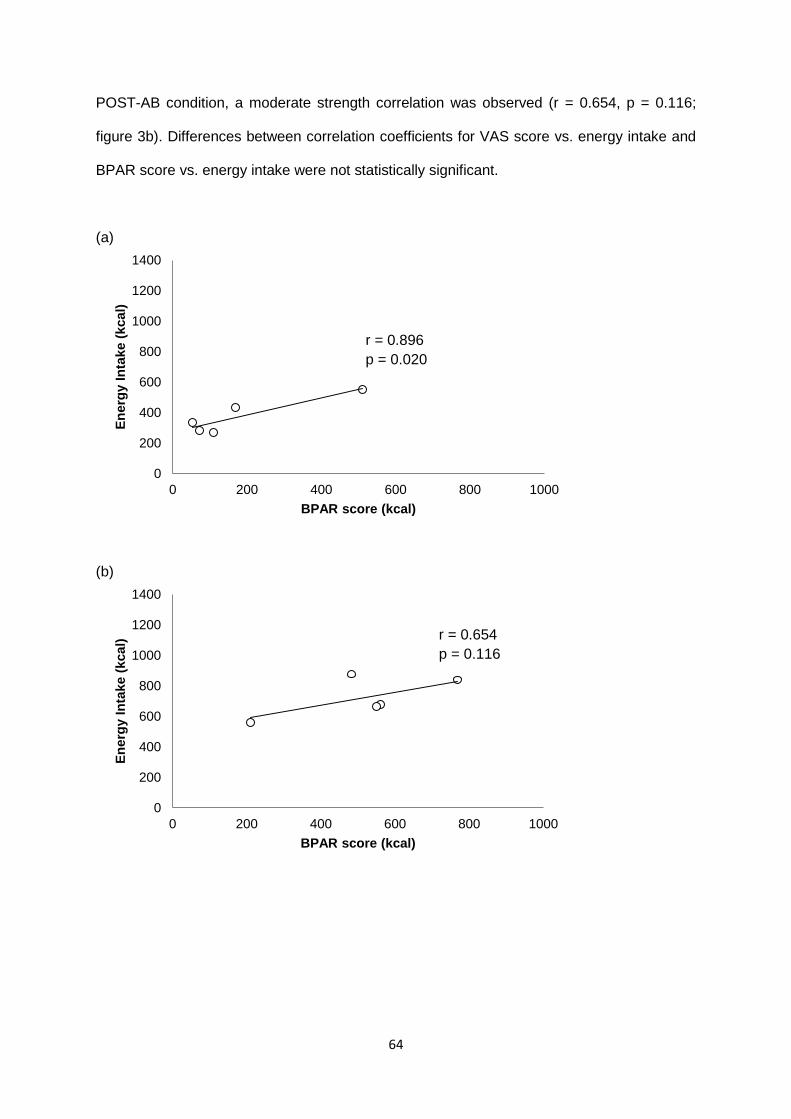
64
POST-AB condition, a moderate strength correlation was observed (r = 0.654, p = 0.116;
figure 3b). Differences between correlation coefficients for VAS score vs. energy intake and
BPAR score vs. energy intake were not statistically significant.
(a)
(b)
0
200
400
600
800
1000
1200
1400
0 200 400 600 800 1000
En
erg
y I
nta
ke (
kcal)
BPAR score (kcal)
0
200
400
600
800
1000
1200
1400
0 200 400 600 800 1000
En
erg
y I
nta
ke (
kcal)
BPAR score (kcal)
r = 0.896
p = 0.020
r = 0.654
p = 0.116
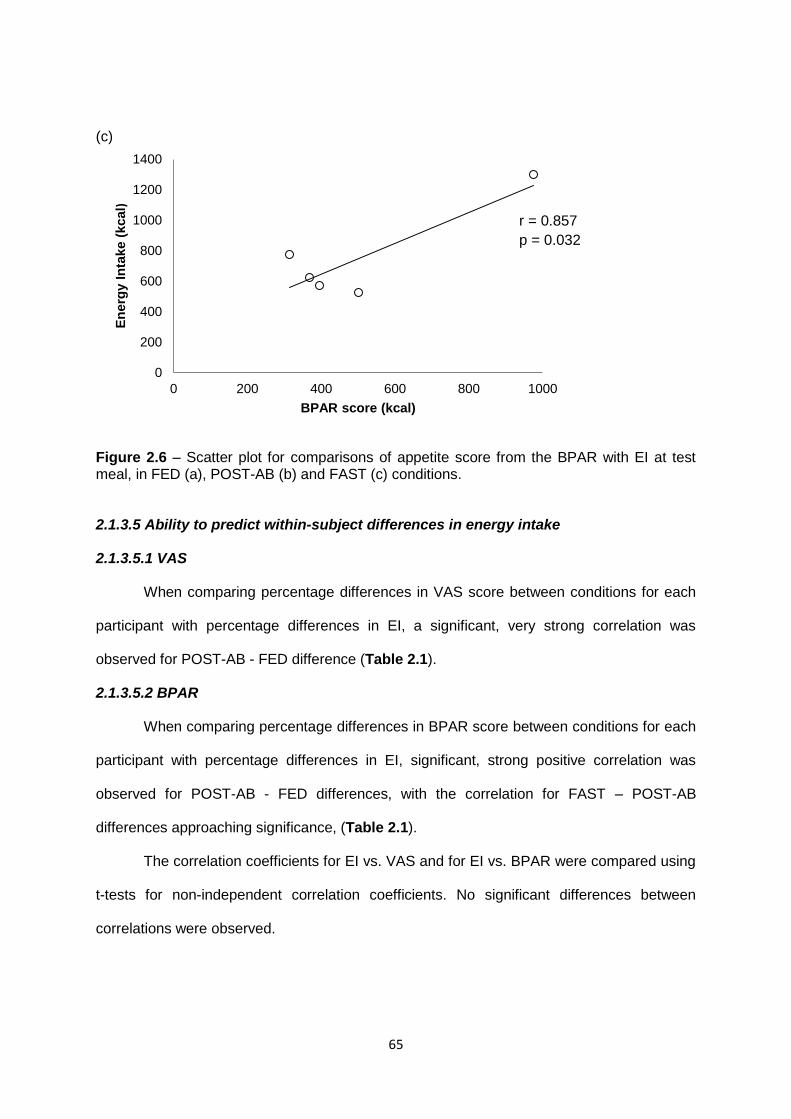
65
(c)
Figure 2.6 – Scatter plot for comparisons of appetite score from the BPAR with EI at test meal, in FED (a), POST-AB (b) and FAST (c) conditions. 2.1.3.5 Ability to predict within-subject differences in energy intake
2.1.3.5.1 VAS
When comparing percentage differences in VAS score between conditions for each
participant with percentage differences in EI, a significant, very strong correlation was
observed for POST-AB - FED difference (Table 2.1).
2.1.3.5.2 BPAR
When comparing percentage differences in BPAR score between conditions for each
participant with percentage differences in EI, significant, strong positive correlation was
observed for POST-AB - FED differences, with the correlation for FAST – POST-AB
differences approaching significance, (Table 2.1).
The correlation coefficients for EI vs. VAS and for EI vs. BPAR were compared using
t-tests for non-independent correlation coefficients. No significant differences between
correlations were observed.
0
200
400
600
800
1000
1200
1400
0 200 400 600 800 1000
En
erg
y I
nta
ke (
kcal)
BPAR score (kcal)
r = 0.857
p = 0.032
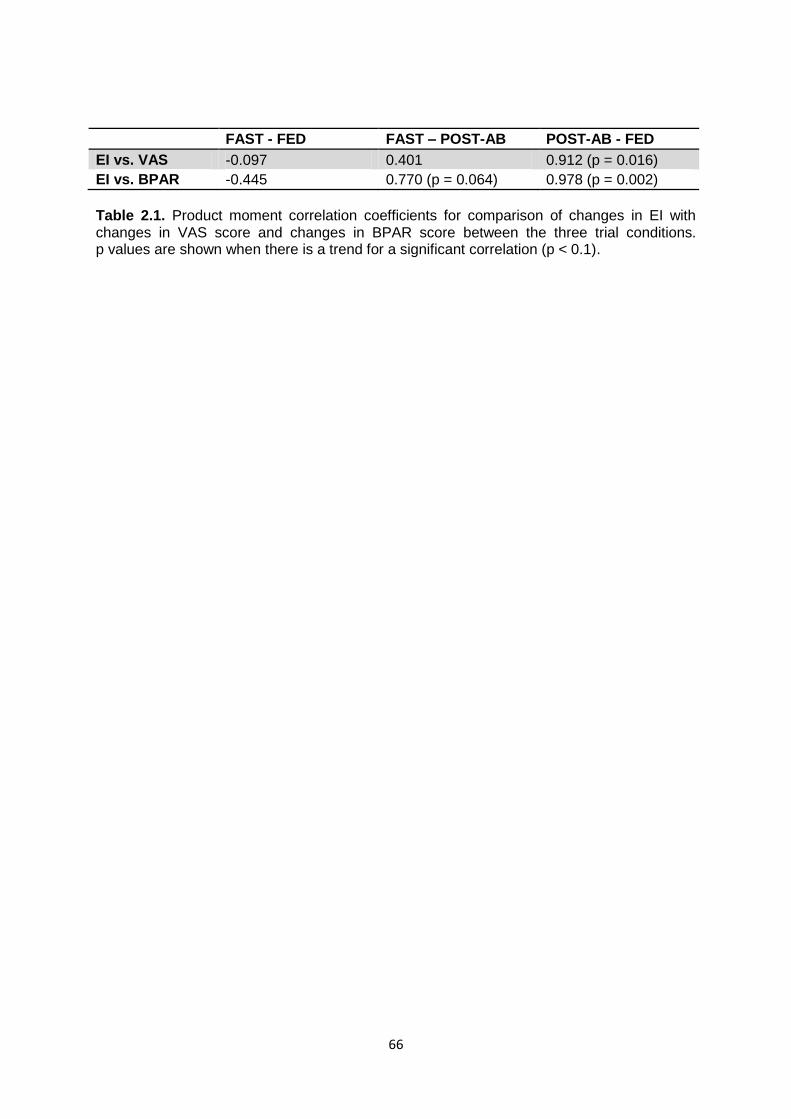
66
FAST - FED FAST – POST-AB POST-AB - FED
EI vs. VAS -0.097 0.401 0.912 (p = 0.016)
EI vs. BPAR -0.445 0.770 (p = 0.064) 0.978 (p = 0.002)
Table 2.1. Product moment correlation coefficients for comparison of changes in EI with changes in VAS score and changes in BPAR score between the three trial conditions. p values are shown when there is a trend for a significant correlation (p < 0.1).
67
2.1.4 DISCUSSION
The aim of this pilot study was to assess the validity of a novel tool - The Birmingham
Photographic Appetite Rating (BPAR) – for the measurement of subjective appetite. BPAR
appetite scores appeared to be sensitive to changes in appetite. The expected changes in
appetite with the manipulations of diet were detected with the BPAR and the appetite profiles
for each trial condition reflected the profile obtained from a validated technique for the
measure of subjective appetite – the VAS method. Significant within-condition differences,
identified with Bonferroni post-hoc pairwise comparisons, were identified with VAS but not
BPAR. It is possible that this indicates a greater degree of sensitivity with VAS, compared
with BPAR. Within-condition, between-subject subjective appetite scores obtained with the
BPAR exhibited moderate strength correlation with those obtained with the VAS technique.
Within-subject, between-condition percentage differences in VAS scores and BPAR scores
were very strongly correlated. This would indicate that the BPAR is effective at measuring
changes in appetite, as VAS is an accepted, validated method for obtaining this measure.
A limitation of VAS is that it has been shown to exhibit a questionable ability to
predict food intake (Parker et al., 2004; Raben et al., 1995). Hence, it was desirable to
produce a tool that could prove a stronger predictor of food intake than VAS. The BPAR
technique appeared to be a strong predictor of food intake, when assessing between- and
within-subject differences. BPAR appetite scores immediately prior to the test meal
correlated strongly with energy intake at the ad libitum test meal. BPAR scores correlated
strongly with energy intake in the FED and FAST conditions, while in the POST-AB
condition, a moderate strength correlation was observed. This highlighted a stronger
correlation between BPAR score and energy intake for between-subject differences than
between VAS and energy intake, suggesting that BPAR is the stronger predictor of between-
subject differences in food intake. However, it should be acknowledged that the correlation
of BPAR score energy intake was not statistically greater than that of VAS and energy
intake, as assessed by t-tests for non-independent correlation coefficients. It is possible that
68
this was due to a very small sample size of 5 participants and a subsequent low statistical
power. Nevertheless, such a relationship between an appetite score and energy intake was
not observed in the only previous study that has assessed the ability of a photographic
images tool to predict ad libitum energy intake (Farah et al., 2012).
Within-subject, between-condition percentage difference in BPAR score prior to the
test meal correlated strongly with percentage difference in EI at the test meal for two of the
three differences calculated (FAST – POST-AB and POST-AB – FED). VAS has previously
been shown to be particularly efficacious at detecting within-subject changes (Stubbs et al.,
2000), but the ability to predict within-subject changes in energy intake was strong in only
one of the differences (POST-AB – FED). BPAR exhibited greater correlation than VAS in
each of the three differences calculated (FAST – FED, FAST – POST-AB and POST-AB –
FED), although the differences in correlation coefficients was again not statistically
significant.
These initial findings, from a pilot investigation of only five subjects are encouraging
and suggest that the BPAR is a useful tool for the measurement of subjective appetite.
However, further investigation is required. The reliability and reproducibility of the measures
must be assessed and the tool’s ability to indicate food preference, as well as predict food
intake, has not been addressed in this preliminary study. It is likely that such investigation
will be conducted after further development of the BPAR that is necessary in order to
improve the tool and address current weaknesses; the main one of which is that the BPAR
asks participants to select a meal consisting of a single food item. This is an unnatural eating
behaviour and using this approach is likely to lead to difficulty in conceptualising appetite.
A limitation of the current validation study design is that the fasted state condition
may have proved too severe. From the point of view of assessing the ability of the BPAR to
track changes in appetite, it would appear that this condition proved ineffective, as appetite
remained very high and unchanged throughout, until the lunch meal. Further, some
participants reacted adversely to the long period without food (15 hours by the time of the
69
lunch meal). Severe “hunger pains” and light-headedness was reported by two of the five
participants.
It is considered desirable to develop the BPAR in order to allow the participant to
construct a virtual meal, consisting of numerous food items. This would be an improvement
on the current restrictive format, whereby participants are asked to “imagine you are to
consume a meal at this moment, consisting of this food item alone”. It is hoped that with
future developments, an improved format will allow for an easier conceptualisation of
subjective appetite, into a meaningful measure of desired food intake, hence further
improving on a major limitation associated with the use of VAS. If this is achieved, an
improved version of the BPAR could prove a stronger predictor of energy intake and food
preference, while maintaining the advantage of being able to allow independent, repeated
measures of subjective appetite.

70
2.2 General methods of Chapters 4, 5 and 6
2.2.1 Study designs
A within-subject, counterbalanced, crossover study design was utilised for the studies
of Chapters 4, 5 and 6. Participants were randomly assigned to each trial condition, with
measures of subjective appetite and circulating concentrations of appetite-associated
recorded throughout each trial.
In each case, experimental trials were preceded by one pre-testing trial session.
Experimental trials then commenced a minimum period of 3 days after pre-testing, with trials
also separated by a minimum wash out period of 3 days. However, typically, this period
between trials was 7 days.
To limit between test variability, participants in each of Chapters 4, 5 and 6 were
asked to refrain from moderate or high intensity exercise during the 24h prior to each trial. In
addition, a food diary was completed for the 24h prior to the first trial. The participant was
then asked to replicate their food intake as closely as possible for the 24h prior to
subsequent trials.
2.2.2. Pre-testing sessions
2.2.2.1 Chapters 4 and 5
A single pre-testing session was completed prior to study trials in order to calculate
specific exercise intensities to be used for each participant. After refraining from strenuous
exercise during the 2 days prior, and abstaining from food for a minimum of 2 hours,
participants reported to the Exercise Metabolism Laboratory, in the School of Sport, Exercise
and Rehabilitation Sciences, University of Birmingham, where the participant information
pack was administered and explained and the participant was given the opportunity to ask
any questions regarding the study. A written consent form was completed prior to the
completion of a health questionnaire and the Dutch Eating Behaviour Questionnaire (DEBQ,
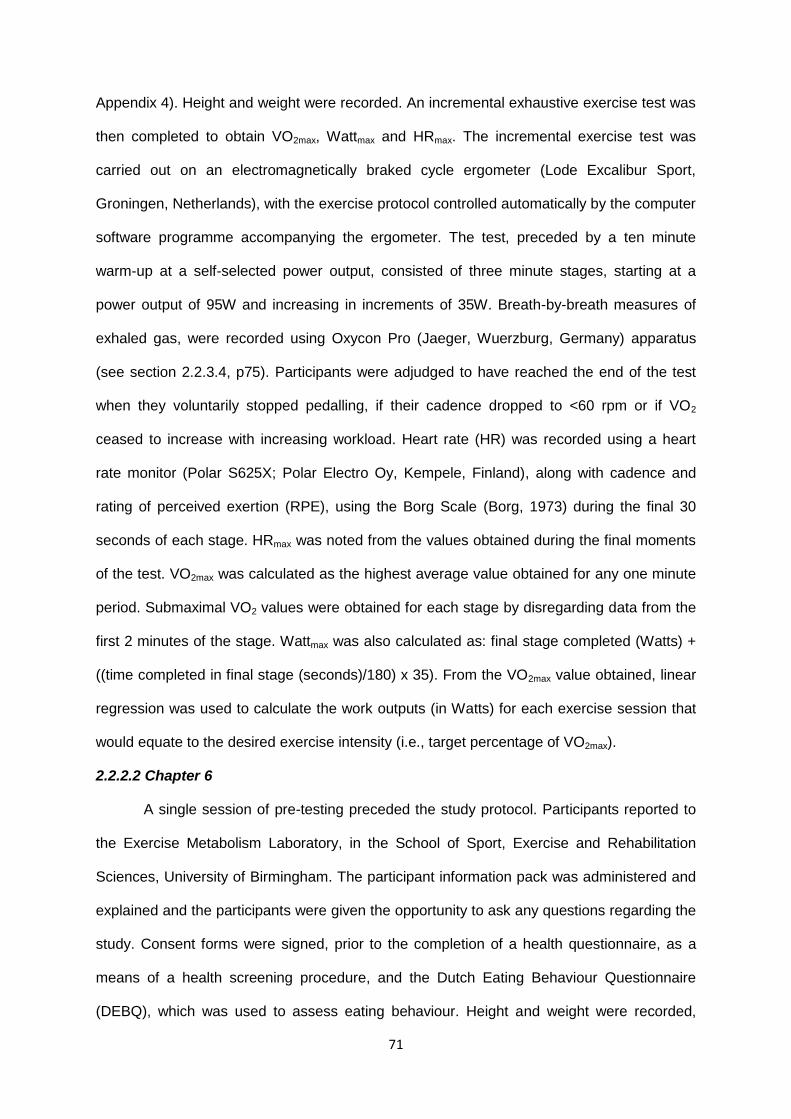
71
Appendix 4). Height and weight were recorded. An incremental exhaustive exercise test was
then completed to obtain VO2max, Wattmax and HRmax. The incremental exercise test was
carried out on an electromagnetically braked cycle ergometer (Lode Excalibur Sport,
Groningen, Netherlands), with the exercise protocol controlled automatically by the computer
software programme accompanying the ergometer. The test, preceded by a ten minute
warm-up at a self-selected power output, consisted of three minute stages, starting at a
power output of 95W and increasing in increments of 35W. Breath-by-breath measures of
exhaled gas, were recorded using Oxycon Pro (Jaeger, Wuerzburg, Germany) apparatus
(see section 2.2.3.4, p75). Participants were adjudged to have reached the end of the test
when they voluntarily stopped pedalling, if their cadence dropped to <60 rpm or if VO2
ceased to increase with increasing workload. Heart rate (HR) was recorded using a heart
rate monitor (Polar S625X; Polar Electro Oy, Kempele, Finland), along with cadence and
rating of perceived exertion (RPE), using the Borg Scale (Borg, 1973) during the final 30
seconds of each stage. HRmax was noted from the values obtained during the final moments
of the test. VO2max was calculated as the highest average value obtained for any one minute
period. Submaximal VO2 values were obtained for each stage by disregarding data from the
first 2 minutes of the stage. Wattmax was also calculated as: final stage completed (Watts) +
((time completed in final stage (seconds)/180) x 35). From the VO2max value obtained, linear
regression was used to calculate the work outputs (in Watts) for each exercise session that
would equate to the desired exercise intensity (i.e., target percentage of VO2max).
2.2.2.2 Chapter 6
A single session of pre-testing preceded the study protocol. Participants reported to
the Exercise Metabolism Laboratory, in the School of Sport, Exercise and Rehabilitation
Sciences, University of Birmingham. The participant information pack was administered and
explained and the participants were given the opportunity to ask any questions regarding the
study. Consent forms were signed, prior to the completion of a health questionnaire, as a
means of a health screening procedure, and the Dutch Eating Behaviour Questionnaire
(DEBQ), which was used to assess eating behaviour. Height and weight were recorded,

72
before the participant rested for a short period, prior to the measure of resting blood
pressure. Upon completion of the blood pressure measure, a 10-lead resting ECG was
conducted. The ECG trace was recorded and assessed for any abnormality in cardiac
activity by a qualified physician. Once all measures were completed, a short familiarisation
bout of exercise was undertaken. Participants mounted a cycle ergometer (Lode Excalibur
Sport, Groningen, Netherlands) and ensured that the handlebars and seat were positioned
to their liking. They then cycled for three minutes at a power of 40 Watts, which replicated
the three minute warm-up of the exercise trial bout. At the end of this 3 minute period, they
immediately commenced a 30 second “flat-out” sprint. The sprint was a modified Wingate
anaerobic power test, using a constant torque, relative to the participant’s body weight
(torque factor 0.6: braking torque = torque factor x participant’s bodyweight, Nm). Verbal
encouragement was provided throughout in an attempt to elicit maximal effort. Visual
feedback was provided in the form of a countdown timer and traces of both cadence and
power output, using the Wingate Software programme. The pre-testing session concluded
with the administering of a food diary and instructions on how to accurately record dietary
intake for the 24 hour period prior to the participant’s first trial. It was made clear that they
would be expected to replicate this dietary intake for the 24 hour period prior to their second
trial.
2.2.3 Measures
2.2.3.1 Eating restraint
Eating restraint was assessed using the Dutch Eating Behaviour Questionnaire (van
Strien et al., 1986a) (DEBQ, Appendix 4). The DEBQ has been shown to exhibit moderate to
good predictive validity of eating restraint (van Strien et al., 1986b) and proved preferable to
alternative scales and questionnaires, with regards test-retest reliability, internal consistency
and homogeneity with food intake measures (Allison et al., 1992).
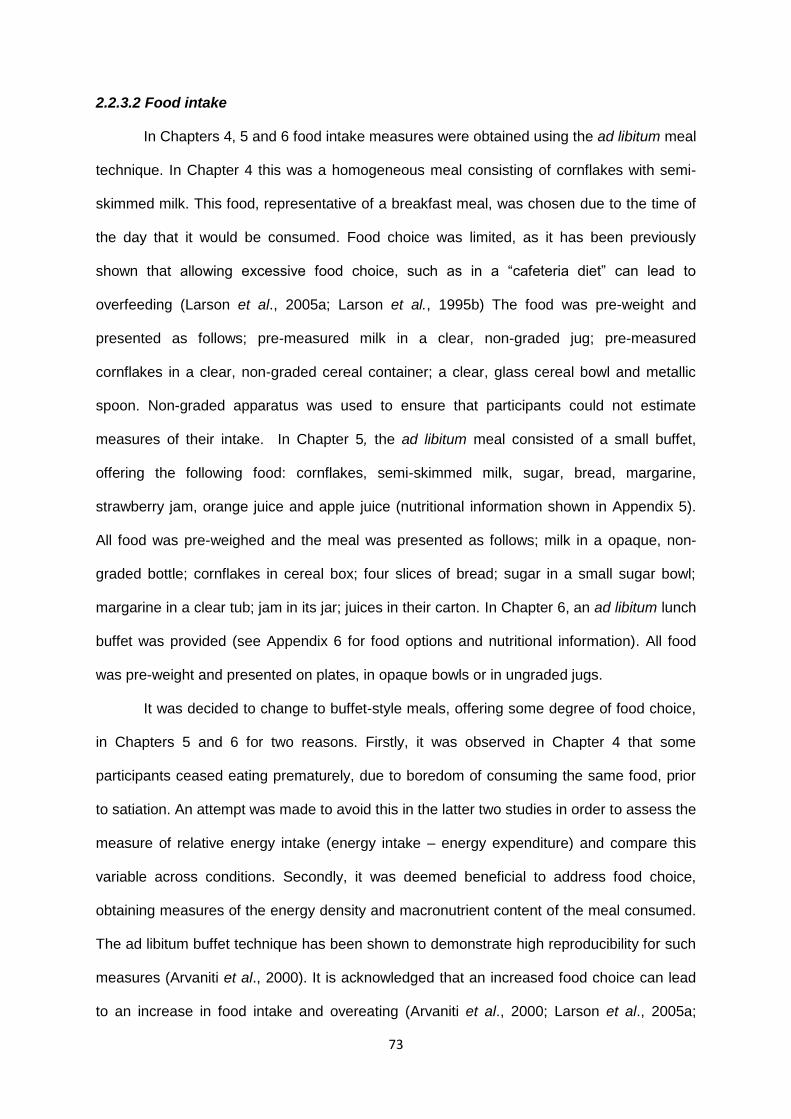
73
2.2.3.2 Food intake
In Chapters 4, 5 and 6 food intake measures were obtained using the ad libitum meal
technique. In Chapter 4 this was a homogeneous meal consisting of cornflakes with semi-
skimmed milk. This food, representative of a breakfast meal, was chosen due to the time of
the day that it would be consumed. Food choice was limited, as it has been previously
shown that allowing excessive food choice, such as in a “cafeteria diet” can lead to
overfeeding (Larson et al., 2005a; Larson et al., 1995b) The food was pre-weight and
presented as follows; pre-measured milk in a clear, non-graded jug; pre-measured
cornflakes in a clear, non-graded cereal container; a clear, glass cereal bowl and metallic
spoon. Non-graded apparatus was used to ensure that participants could not estimate
measures of their intake. In Chapter 5, the ad libitum meal consisted of a small buffet,
offering the following food: cornflakes, semi-skimmed milk, sugar, bread, margarine,
strawberry jam, orange juice and apple juice (nutritional information shown in Appendix 5).
All food was pre-weighed and the meal was presented as follows; milk in a opaque, non-
graded bottle; cornflakes in cereal box; four slices of bread; sugar in a small sugar bowl;
margarine in a clear tub; jam in its jar; juices in their carton. In Chapter 6, an ad libitum lunch
buffet was provided (see Appendix 6 for food options and nutritional information). All food
was pre-weight and presented on plates, in opaque bowls or in ungraded jugs.
It was decided to change to buffet-style meals, offering some degree of food choice,
in Chapters 5 and 6 for two reasons. Firstly, it was observed in Chapter 4 that some
participants ceased eating prematurely, due to boredom of consuming the same food, prior
to satiation. An attempt was made to avoid this in the latter two studies in order to assess the
measure of relative energy intake (energy intake – energy expenditure) and compare this
variable across conditions. Secondly, it was deemed beneficial to address food choice,
obtaining measures of the energy density and macronutrient content of the meal consumed.
The ad libitum buffet technique has been shown to demonstrate high reproducibility for such
measures (Arvaniti et al., 2000). It is acknowledged that an increased food choice can lead
to an increase in food intake and overeating (Arvaniti et al., 2000; Larson et al., 2005a;

74
Larson et al., 1995b), however, the buffet-style approach was deemed preferable after much
deliberation.
In each experiment, after volitional satiation was reached, all remaining food was
weighed and subtracted from the known quantity provided, allowing for determination of
consumed food. From this, energy intake was calculated. In Chapters 5 and 6, when there
was an element of food choice, macronutrient content of the meal consumed was also
calculated, as the nutritional information of each food item available was known.
In all instances, the manner of presentation of the ad libitum meal was constant
throughout the experiment. The meal options were presented, in the same portions for each
trial, on serving surface. On a separate table, cutlery, plate, bowl and cup were laid. The
participant was instructed to serve their food at the serving surface and return to the table to
consume. The same cutlery and crockery were used throughout the experiment.
2.2.3.3 Subjective appetite
Subjective appetite was assessed using the 4-question VAS test for subjective
appetite, as adapted from Hill & Blundell (Hill and Blundell, 1982) and a unique Birmingham
Photographic Appetite Rating (BPAR) tool. The VAS addressed “hunger,” “fullness,” “desire
to eat,” and “expected food intake”. A composite VAS test score was calculated as, hunger
score + desire score + expected intake score + (150-fullness score). It was decided to use
this single score for ease of data analysis and presentation and it has been shown that, with
the original 6 question VAS technique of Hall & Blundell, the scores for each question co-
vary to a large extent (Stubbs et al., 2000) and that the first principal component of the
questions is the mean value of the scores (Reid et al., 1998).
Subjective appetite was also measured using the BPAR tool in Chapter 4 and the
VIMEC tool in Chapters 5 and 6. The BPAR techniques have been described previously in
this chapter of the thesis (section 2.1.2.5, p54). In Chapter 4, three of the 20 food items in
the BPAR (porridge, tomato soup and strawberry yoghurt) were disregarded from the results.
This was because we felt that the portion size was not perceived accurately and led to
extremely large portion selections for these food items, relative to the portion selections of

75
other foods. The amorphous nature of the food items is likely to have contributed to the poor
perception of portion size, as this has been seen previously with other estimations of portion
size when real food is displayed (Weber et al., 1999) and in techniques whereby
photographic images of food were used (Venter et al., 2000). The VIMEC technique is
described in detail in Chapter 3 (section 3.3.5, p90).
The two subjective appetite measure techniques (VAS and BPAR in Chapter 4 and
VAS and VIMEC in Chapters 5 and 6) were completed in alternating order throughout each
trial condition, to control for any possible influence one technique may have on the other.
2.2.3.4 Analysis of exhaled gas
For the determination of rates of oxygen consumption and carbon dioxide production,
exhaled gas was analysed using the online automated gas analysis system, Oxycon Pro
(Jaeger, Wuerzburg, Germany). This system has previously shown to be a valid and reliable
apparatus for the measure of ventilation rate, rates of oxygen consumption and rates of
carbon dioxide production, over a range of exercise intensities (Rietjens et al., 2001; Carter
& Jeukendrup, 2002). Participants wore a nose clip and breathed through a mouthpiece. The
mouthpiece unit consisted of a sample tube and turbine volume transducer. Expired gas was
sampled, through the sample tube, and analysed using oxygen (O2) and carbon dioxide
(CO2) analysers. The system specifications for the O2 analyser were as follows: range: 0 to
25%, accuracy: 0.05%, resolution: 0.01%, stability 0.02%/hour. The specifications of the CO2
analyser were: range: 0 to 15%, accurancy: 0.05%, resolution: 0.01%, stability: 0.02%/hour.
The specification of the volume sensor were: range: 0 to 10L, accuracy:25% or 50ml,
resolution: 3ml, flow range: 0 to 15 L/sec, flow accuracy: 3% or 70ml/sec. Prior to data
collection, the gas analysers were calibrated using a calibration gas (BOC Gases, Guildford,
Surry, UK) of mixed, known concentrations of O2 (14.99%) and CO2 (5.04%) and volume
was calibrated using a 3 litre calibration syringe (Jaeger, Wuerzburg, Germany). Values
obtained were mean values of 8 breaths.
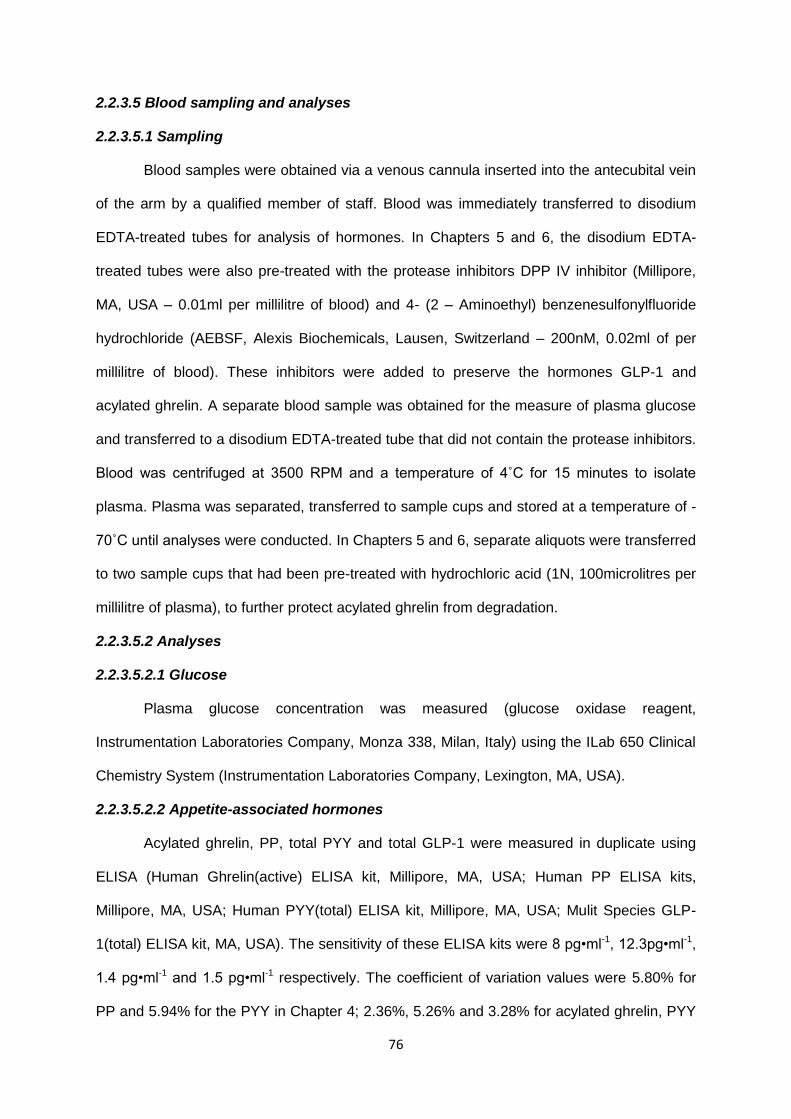
76
2.2.3.5 Blood sampling and analyses
2.2.3.5.1 Sampling
Blood samples were obtained via a venous cannula inserted into the antecubital vein
of the arm by a qualified member of staff. Blood was immediately transferred to disodium
EDTA-treated tubes for analysis of hormones. In Chapters 5 and 6, the disodium EDTA-
treated tubes were also pre-treated with the protease inhibitors DPP IV inhibitor (Millipore,
MA, USA – 0.01ml per millilitre of blood) and 4- (2 – Aminoethyl) benzenesulfonylfluoride
hydrochloride (AEBSF, Alexis Biochemicals, Lausen, Switzerland – 200nM, 0.02ml of per
millilitre of blood). These inhibitors were added to preserve the hormones GLP-1 and
acylated ghrelin. A separate blood sample was obtained for the measure of plasma glucose
and transferred to a disodium EDTA-treated tube that did not contain the protease inhibitors.
Blood was centrifuged at 3500 RPM and a temperature of 4˚C for 15 minutes to isolate
plasma. Plasma was separated, transferred to sample cups and stored at a temperature of -
70˚C until analyses were conducted. In Chapters 5 and 6, separate aliquots were transferred
to two sample cups that had been pre-treated with hydrochloric acid (1N, 100microlitres per
millilitre of plasma), to further protect acylated ghrelin from degradation.
2.2.3.5.2 Analyses
2.2.3.5.2.1 Glucose
Plasma glucose concentration was measured (glucose oxidase reagent,
Instrumentation Laboratories Company, Monza 338, Milan, Italy) using the ILab 650 Clinical
Chemistry System (Instrumentation Laboratories Company, Lexington, MA, USA).
2.2.3.5.2.2 Appetite-associated hormones
Acylated ghrelin, PP, total PYY and total GLP-1 were measured in duplicate using
ELISA (Human Ghrelin(active) ELISA kit, Millipore, MA, USA; Human PP ELISA kits,
Millipore, MA, USA; Human PYY(total) ELISA kit, Millipore, MA, USA; Mulit Species GLP-
1(total) ELISA kit, MA, USA). The sensitivity of these ELISA kits were 8 pg•ml-1, 12.3pg•ml-1,
1.4 pg•ml-1 and 1.5 pg•ml-1 respectively. The coefficient of variation values were 5.80% for
PP and 5.94% for the PYY in Chapter 4; 2.36%, 5.26% and 3.28% for acylated ghrelin, PYY
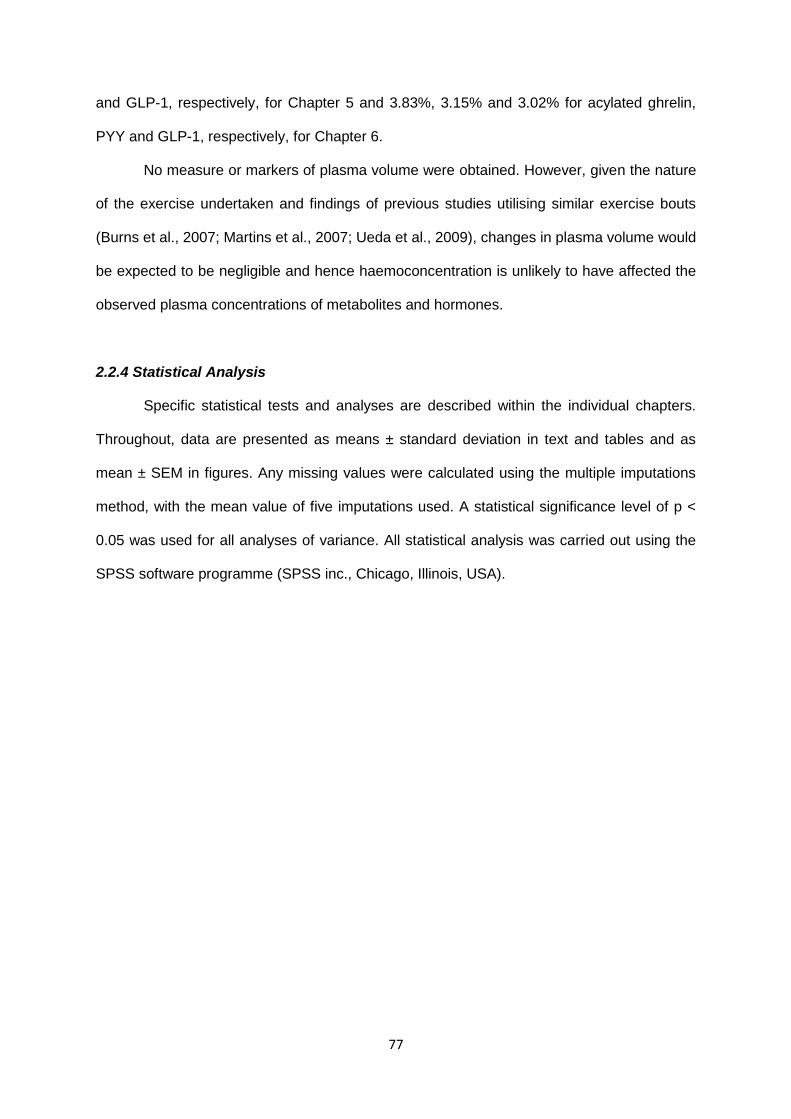
77
and GLP-1, respectively, for Chapter 5 and 3.83%, 3.15% and 3.02% for acylated ghrelin,
PYY and GLP-1, respectively, for Chapter 6.
No measure or markers of plasma volume were obtained. However, given the nature
of the exercise undertaken and findings of previous studies utilising similar exercise bouts
(Burns et al., 2007; Martins et al., 2007; Ueda et al., 2009), changes in plasma volume would
be expected to be negligible and hence haemoconcentration is unlikely to have affected the
observed plasma concentrations of metabolites and hormones.
2.2.4 Statistical Analysis
Specific statistical tests and analyses are described within the individual chapters.
Throughout, data are presented as means ± standard deviation in text and tables and as
mean ± SEM in figures. Any missing values were calculated using the multiple imputations
method, with the mean value of five imputations used. A statistical significance level of p <
0.05 was used for all analyses of variance. All statistical analysis was carried out using the
SPSS software programme (SPSS inc., Chicago, Illinois, USA).
78
2.3 REFERENCES
Allison, D.B., Kalinsky, L.B., and Gorman, B.S. (1992). A comparison of the psychometric properties of three measures of dietary restraint. Psychological Assessment 4, 391-398. Arvaniti, K., Richard, D., and Tremblay, A. (2000). Reproducibility of energy and macronutrient intake and related substrate oxidation rates in a buffet-type meal. The British journal of nutrition 83, 489-495. Bellisle, F. (1999). Food choice, appetite and physical activity. Public Health Nutrition 2, 357-361. Blundell, J., De Graaf, C., Hulshof, T., Jebb, S., Livingstone, B., Lluch, A., Mela, D., Salah, S., Schuring, E., Van Der Knaap, H., et al. (2010). Appetite control: methodological aspects of the evaluation of foods. Obesity Reviews 11, 251-270. Borg, G.A.V. (1973). "Perceived exertion: a note on history and methods". Medicine and Science in Sports & Exercise 5, 90-93. Carter, J., and Jeukendrup, A.E. (2002). Validity and relaibility of three commercially available breath-by-breath respiratory systems. European Journal of Applied Physiology 86, 435-441. Farah, N.M.F., Brunstrom, J.M., and Gill, J.M.R. (2012). Using a novel computer-based approach to assess the acute effects of exercise on appetite-related measures. Appetite 58, 196-204. Health and Social Care Information Centre (2013). Health Survey for England. Statistics on Obesity, Physical Activity and Diet – England, 2013. http://www.hscic.gov.uk/searchcatalogue?productid=11194&q=obesity&sort=Relevance&size=10&page=1#top Hill, A.J., and Blundell, J.E. (1982). Nutrients and behaviour: Research strategies for the investigation of taste characteristics, food preferences, hunger sensations and eating patterns in man. Journal of Psychiatric Research 17, 203-212. King, N.A., Caudwell, P.P., Hopkins, M., Stubbs, J.R., Naslund, E., and Blundell, J.E. (2009). Dual-process action of exercise on appetite control: increase in orexigenic drive but improvement in meal-induced satiety. The American Journal of Clinical Nutrition 90, 921-927. King, N.A., Tremblay, A., and Blundell, J.E. (1997). Effects of exercise on appetite control: implications for energy balance. Medicine and science in sports and exercise 29, 1076-1089. Larson, D.E., Rising, R., Ferraro, R.T., and Ravussin, E. (1995a). Spontaneous overfeeding with a "cafeteria diet" in men: effects on 24-hour energy expenditure and substrate oxidation. International Journal of Obesity 19, 331-337. Larson, D.E., Tataranni, P.A., Ferraro, R.T., and Ravussin, E. (1995b). Ad libitum food intake on a "cafeteria diet" in Native American women: relations with body composition and 24-hour energy expenditure. American Journal of Clinical Nutrition 62, 911-917. Martins, C., Morgan, L., and Truby, H. (2008). A review of the effects of exercise on appetite regulation: an obesity perspective. Int J Obes 32, 1337-1347.
79
Parker, B.A., Sturm, K., MacIntosh, C.G., Feinle, C., Horowitz, M., and Chapman, I.M. (2004). Relation between food intake and visual analogue scale ratings of appetite and other sensations in healthy older and young subjects. Eur J Clin Nutr 58, 212-218. Raben, A., Tagliabue, A., and Astrup, A. (1995). The reproducibility of subjective appetite scores. The British journal of nutrition 73, 517-530. Reid, C.H., CG. Blundell, JE. Stubbs, RJ (1998). What are psychometric assessments of appetite asking: a preliminary multivariate analysis. International Journal of Obesity 22, 151. Rietjens, G.J.W.M., Kuipers, H., Kester, A.D.M., and Keizer, H.A. (2001). Validation of a computerized metabolic measurement system (Oxycon-Pro) during low and high intensity exercise. International Journal of Sports Medicine 22, 291-294. Stubbs, R.J., Hughes, D.A., Johnstone, A.M., Rowley, E., Reid, C., Elia, M., Stratton, R., Delargy, H., King, N., and Blundell, J.E. (2000). The use of visual analogue scales to assess motivation to eat in human subjects: a review of their reliability and validity with an evaluation of new hand-held computerized systems for temporal tracking of appetite ratings. Br J Nutr 84, 405-415. van Strien, T., Frijters, J.E.R., Bergers, G.P.A., and Defares, P.B. (1986a). The Dutch Eating Behavior Questionnaire (DEBQ) for assessment of restrained, emotional, and external eating behavior. International Journal of Eating Disorders 5, 295-315. van Strien, T., Frijters, J.E.R., van Staveren, W.A., Defares, P.B., and Deurenburg, P. (1986b). The predictive validity of the Dutch Restrained Eating Scale. International Journal of Eating Disorders 5, 747-755. Venter, C.S., MacIntyre, U.E., and Vorster, H.H. (2000). The development and testing of a food portion photograph book for use in an African population. Journal of Human Nutrition and Dietetics 13, 205-218. Weber, J.L., Cunningham-Sabo, L., Skipper, B., Lytle, L., Stevens, J., Gittelsohn, J., Anliker, J., Heller, K., and Pablo, J.L. (1999). Portion-size estimation training in second- and third-grade American Indian children. The American Journal of Clinical Nutrition 69, 782S-787S.
80
CHAPTER 3
The development of a novel tool for the measurement of subjective
appetite. Part B: The Visual Meal Creator

81
3.1 ABSTRACT
Background: We previously attempted to address the limitations of commonly-used
methods for obtaining measures of appetite, with the development of the Birmingham
Photographic Appetite Rating (BPAR). Results of initial validation testing proved
encouraging (see Chapter 2, section 2.1, p50). However, a number of limitations of the
BPAR became apparent. These included the abstract nature of asking the participant to
imagine they are to consume a meal of only a single food item (i.e., a meal of chocolate
raisins) and the inability to combine different food items to replicate a more habitual eating
episode, i.e., create a meal.
Purpose: To further develop and validate the BPAR, creating a tool that would allow for the
creation of “computerised visual meal” to measure subjective appetite – the Visual Meal
Creator (VIMEC).
Method: Participants experienced dietary control over a 5-hour period to manipulate hunger
state on three occasions (small breakfast (SB) vs. large breakfast (LB) vs. large breakfast +
snacks (LB+S)). Appetite measures were obtained every 60 minutes using the VIMEC and
VAS. At 4.5 hours, participants were presented with an ad libitum test meal, from which
energy intake (EI) was measured. The efficacy of the VIMEC was assessed by its ability to
detect expected patterns of appetite and its strength as a predictor of energy intake. Day-to-
day and test-retest reproducibility were assessed.
Results: There was a significant time x condition interaction effect for appetite, using both
VAS and VIMEC methods, indicating that appetite was successfully manipulated and
expected changes in appetite were detected. Between- and within-condition differences in
VAS and VIMEC scores were significantly correlated with one another throughout. Between-
and within-condition changes in appetite scores obtained with the VIMEC exhibited a
stronger correlation with EI at the test meal than those obtained with VAS. Pearson
correlation coefficients for within-condition comparisons were 0.951, 0.914 and 0.875 (all p <
0.001) for SB, LB and LB+S respectively. Correlation coefficients for between-condition
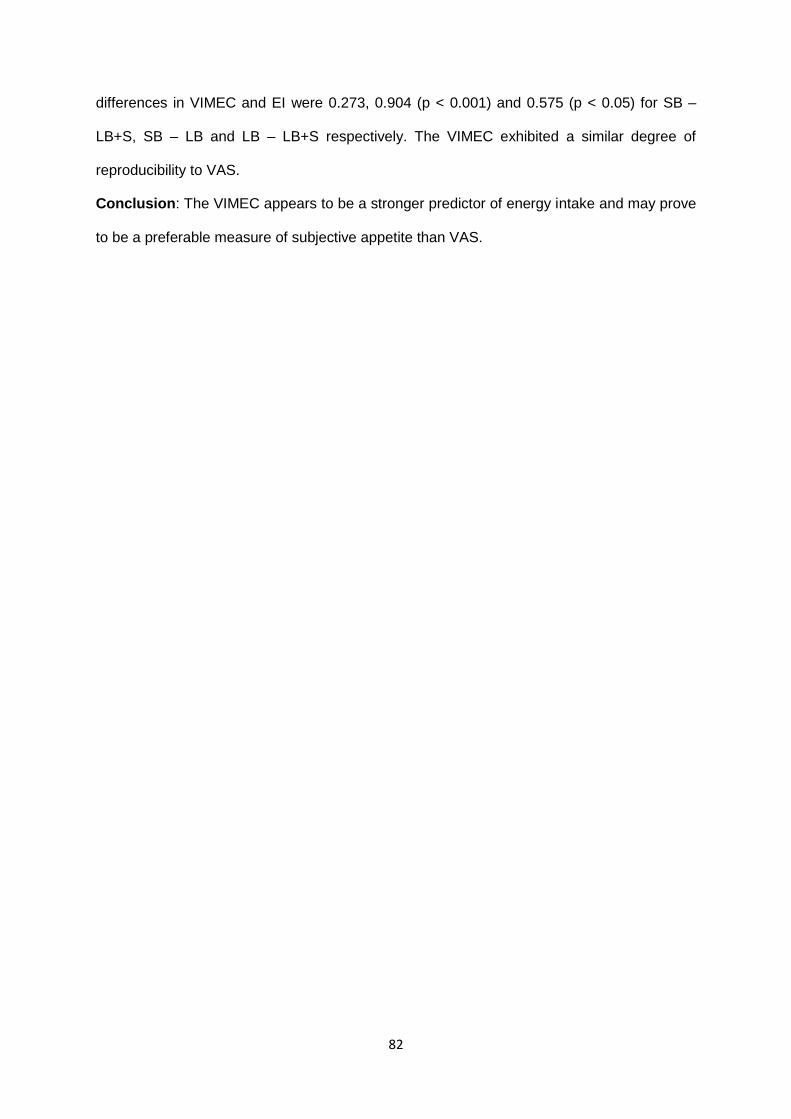
82
differences in VIMEC and EI were 0.273, 0.904 (p < 0.001) and 0.575 (p < 0.05) for SB –
LB+S, SB – LB and LB – LB+S respectively. The VIMEC exhibited a similar degree of
reproducibility to VAS.
Conclusion: The VIMEC appears to be a stronger predictor of energy intake and may prove
to be a preferable measure of subjective appetite than VAS.
83
3.2 INTRODUCTION
With the most recent figures showing that 65% of adult males and 58% of adult
females in England are now overweight or obese (Health and Social Care Information
Centre, 2013), the need for a greater understanding of energy balance and weight
management is necessary. In an attempt to address the “energy in” side of the energy
balance equation, the regulation of appetite has been extensively investigated (the reader is
directed to a number of comprehensive review articles (Bellisle, 1999; King et al., 2009; King
et al., 1997; Martins et al., 2008). In conducting such research, a wide range of techniques
have been utilised to obtain both subjective and objective measures of appetite and
measures of eating behaviour.
These techniques have been discussed previously, in the General introduction
(Section 1.5.3, p35). Briefly, self-report questionnaires and scales are commonly used for
the measure of subjective appetite, with the visual analogue scale method (VAS) being the
most prevalent within appetite research (Blundell et al., 2010). These subjective appetite
measures are usually used in conjunction with more objective measures, such as measures
of appetite-associated hormones, surrogates of eating behaviour, typically in the form of a
food intake or energy intake measure. Commonly, ad libitum energy intake is measured from
buffet-style or constant composition test meals.
The benefits and limitations of both subjective VAS appetite measure and ad libitum
food intake measures have also been documented previously. The VAS method is
inexpensive and both quick and simple to administer and is generally considered a valid
measure of subjective appetite (Blundell et al., 2010; Stratton et al., 1998; Stubbs et al.,
2000), especially when used to address within-subject comparisons (Flint et al., 2000).
VAS’s ability to predict eating behaviour, however, is less clear. While some studies have
demonstrated a significant correlation between VAS scores and subsequent aspects of
eating behaviour (Flint et al., 2000; Parker et al., 2004), others have shown a lack of a
relationship (Parker et al., 2004; Raben et al., 1995). Test-retest reproducibility has been
84
shown to be good (Flint et al., 2000; Stratton et al., 1998), but day-to-day reproducibility is
considerably weaker (Flint et al., 2000; Raben et al., 1995). There are limitations associated
with the use of the VAS method, notably the abstract nature of the question and line format
and the difficulty in conceptualising the constructs of “hunger” and “fullness,” and the lack of
any indication of desired portion size or food choice. Hence, important aspects of eating
behaviour are neither assessed nor predicted when using this method of measurement. The
ad libitum food intake method has been shown to exhibit a high degree of day-to-day
reproducibility, both when presented as a buffet (Arvaniti et al., 2000) and when the meal is
of a constant composition (Gregersen et al., 2008). While allowing for a valid quantitative
proxy of eating behaviour, food intake in test meals can be influenced by a number of
external factors, such as the amount of food presented (Rolls et al., 2002; Wansink et al.,
2005), the variety of foods available (Hetherington et al., 2006) and the perceived palatability
of the food (Yeomans et al., 2001). In addition, buffet-style presentation and a laboratory
setting are not habitual eating environments for the majority of people and may influence
intake (Blundell et al., 2010; George and Morganstein, 2003; Hetherington et al., 2006).
Such external cues are potent stimuli for appetite regulation and can override physiological
determinants of hunger. A key limitation of the ad libitum intake method is that it does not
allow for independent, repeated measures within a short space of time, in contrast to VAS,
which can be repeated frequently to track acute changes in appetite. Any food intake
measure will have a large impact upon subsequent measures and, while total or mean intake
values can be calculated over a study period, each separate intake or eating episode will not
be independent from previous measures. This means that ad libitum intake measures do not
allow the time course of changes in appetite to be monitored, which is often of interest to
researchers. From a practical viewpoint, the ad libitum intake method can be expensive,
time-consuming and labour-intensive to administer and can result in large amounts of food
wastage.
Partly in an attempt to reduce food wastage and the time and money investment
required to prepare food, techniques employing the use of photographic images of food have
85
been increasingly utilised within weight management and food intake research (Brunstrom et
al., 2008a; Brunstrom et al., 2008b; Frobisher and Maxwell, 2003; Nelson and Haraldsdóttir,
1998; Riley et al., 2007; Subar et al., 2010; Turconi et al., 2005; Venter et al., 2000;
Williamson et al., 2003). Most commonly, this technique has been developed and used to
assist with retrospective food recall (Frobisher and Maxwell, 2003; Subar et al., 2010;
Turconi et al., 2005) or as a reference for the estimation of habitual food intake (Riley et al.,
2007; Venter et al., 2000). While these investigations assessing the efficacy and validity of
such tools have produced mixed results, it would appear that photographic images of food
do show potential for use in measures of habitual and retrospective food intake.
More recently, Brunstrom and colleagues have used photographic images of food for
measures of everyday portion size estimates (Brunstrom et al., 2008a) and expected satiety
(Brunstrom and Rogers, 2009; Brunstrom and Shakeshaft, 2009; Brunstrom et al., 2008b),
with the “constant stimuli” technique. While the preliminary version of the technique
consisted of just 8 images, representing 8 different portion sizes of each food item, the later
version consisted of 17 food items, with 40-60 images of each. Expected satiety is measured
by using a “standard” – a known portion size of a commonly-consumed food item – and
using all other items as “comparison” foods. The participant is asked to select the portion
size, or image, of the comparison food that they would expect to satiate them to the same
extent as the standard.
This work was extended further, with the studies of Farah et al. (2012) and Sadoul et
al. (2012). Photographic images of foods were used to assess liking for certain foods and
desired portion size during exercise (Farah et al., 2012) and ileal infusion (Sadoul et al.,
2012) interventions. The techniques used allowed for sensitive measures, detecting
expected changes in appetite as a consequence of the intervention, although desired portion
size did not correlate with VAS scores for hunger in every population of participant and in
every study condition (Farah et al., 2012), and neither did it correlate with ad libitum food
intake measures (Sadoul et al., 2012). However, despite some short-comings, the
effectiveness of photographic image techniques at measuring expected satiety and desired
86
portion size suggests that a subtle adaptation to this approach may result in a tool capable of
measuring subjective appetite through the selection of desired portion size.
With an appreciation of the aforementioned limitations of the commonly used
methods of measuring subjective appetite and food intake, and in light of recent data on the
potential efficacy of food photography for the selection of portion size, an investigation into
the possibility of developing a new tool and technique for the measure of appetite was
undertaken. The early development of this project, along with pilot experimentation was
discussed in Chapter 2, (section 2.1, p50). This work led to the conception of the
Birmingham Photographic Appetite Rating (BPAR) – a computer-based tool utilising food
photography which enabled participants to select desired portions sizes of a number of food
items. Initial pilot validation testing of the BPAR proved encouraging. However, it was clear
that the tool harboured some limitations. Primarily, the BPAR asks the participant to consider
each food item in isolation, imagining that they are about to eat a meal consisting of only that
item. This is not a normal way in which individuals consume food. Therefore, it was
considered desirable to attempt to further develop the BPAR, allowing for the combination of
a number of food items to create a meal. Secondly, the pilot validation testing of the BPAR
did not include any measures of reliability or reproducibility.
Therefore, the aim of the current study was two-fold. Firstly, to further develop the
previously-created BPAR tool for the measure of subjective appetite, improving on the
current format and allowing for the creation of a “meal.” The new model must adhere to the
remit of the BPAR: to provide a less abstract subjective measure than VAS, using a portion
selection method, while also allowing for indicative measures of food choice and enabling
independent, repeated measures in a cost-effective and time-efficient manner. Secondly, we
aimed to address the validity and reproducibility of the new tool – the Visual Meal Creator
(VIMEC) – relative to both the VAS and ad libitum intake methods. This was achieved by
attempting to manipulate appetite state through acutely controlling diet from breakfast until
an ad libitum lunch meal.
87
3.3 METHOD
3.3.1 Participants
Twelve recreationally active participants (8 female, 4 male; mean age 23 ± 2 years;
mean body mass 70.4 ± 17.3 kg; mean BMI 22.8 ± 3.6 kg•m-2) were recruited from the
School of Sport, Exercise and Rehabilitation Sciences, University of Birmingham. Those
suffering from illness such as cold or flu, those taking medication that was likely to affect
appetite or that needed to be taken with food more frequently than once a day, those with
food allergies and those suffering from diabetes were excluded from taking part. Ethical
approval was obtained from the Ethics Committee of the University of Birmingham.
3.3.2 Study design
The validity of any form of rating scale is not easily addressed. To attempt this, we
used the three assessments as highlighted by Stubbs et al (Stubbs et al., 2000). These are
a) the apparent validity of the measure in terms of its ability to predict the behaviour which is
being assessed, which was assessed by comparing the VIMEC score with an ad libitum test
meal energy intake; b) the change in rating score under conditions where it should change if
sensitive, with changes compared with those seen with a valid, commonly-used technique
for the measure of subjective appetite – the visual analogue scale (VAS) test and c) the
reproducibility of the measures, which was assessed by comparing day-to-day measures
and short-term test-retest measures.
A within-subject, randomised crossover study design was utilised. Participants were
randomly assigned to each of the three experimental conditions; small breakfast (SB), large
breakfast (LB) and large breakfast with snacks (LB+S). These feeding conditions were used
to manipulate hunger state. This study design differs from that of Chapter 2 in so much that
the “fasting” condition was replaced with a “small breakfast” condition. This alteration was
made, as it became clear that remaining fasted for up to 15 hours could be quite distressing.
Some participants complained of feeling light-headed and nauseous, while some claimed to

88
have “gone past being hungry.” A “small breakfast” condition was considered more ethical
and a better reflection of normal eating habits.
3.3.3 Procedure & protocol
Participants arrived at the Exercise Metabolism Laboratory within the School of
Sport, Exercise and Rehabilitation Sciences, University of Birmingham between 07.00 and
09.00, after a ten-hour overnight fast. Upon arrival at the laboratory for the first time,
participants were provided with further verbal information regarding the nature of the study
and given the opportunity to ask any questions regarding their participation. A written
consent form was then signed. Health questionnaires were completed and breakfast food
selections were made. Participants were then randomly allocated to one of the three trial
conditions. The study protocol for each condition is shown in diagrammatical form in figure
3.1. Participants remained sedentary throughout the trial period. Trials were separated by a
minimum wash out period of 3 days, but typically, this period between trials was 7 days.
Prior to the first trial, participants were provided with a food diary and instructed on
how to complete it. They were asked to complete the diary on the day before their first trial
and instructed to replicate this diet on the day prior to the following two trials.
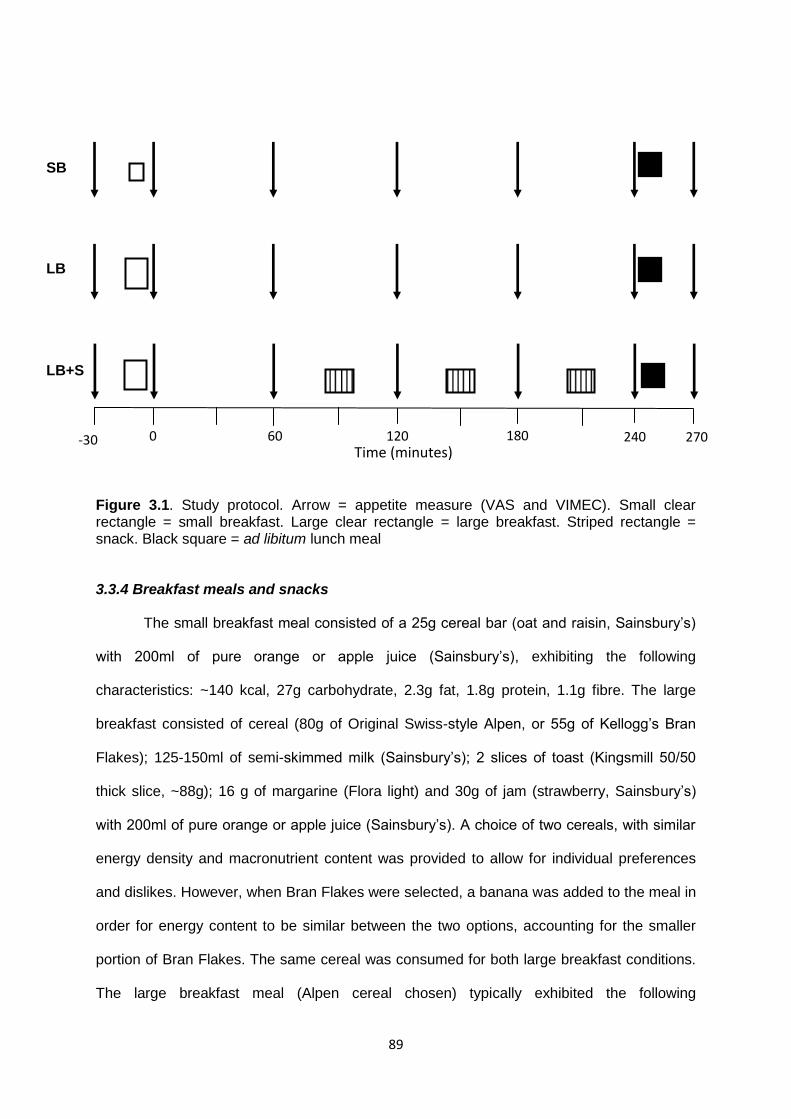
89
Figure 3.1. Study protocol. Arrow = appetite measure (VAS and VIMEC). Small clear rectangle = small breakfast. Large clear rectangle = large breakfast. Striped rectangle = snack. Black square = ad libitum lunch meal 3.3.4 Breakfast meals and snacks
The small breakfast meal consisted of a 25g cereal bar (oat and raisin, Sainsbury’s)
with 200ml of pure orange or apple juice (Sainsbury’s), exhibiting the following
characteristics: ~140 kcal, 27g carbohydrate, 2.3g fat, 1.8g protein, 1.1g fibre. The large
breakfast consisted of cereal (80g of Original Swiss-style Alpen, or 55g of Kellogg’s Bran
Flakes); 125-150ml of semi-skimmed milk (Sainsbury’s); 2 slices of toast (Kingsmill 50/50
thick slice, ~88g); 16 g of margarine (Flora light) and 30g of jam (strawberry, Sainsbury’s)
with 200ml of pure orange or apple juice (Sainsbury’s). A choice of two cereals, with similar
energy density and macronutrient content was provided to allow for individual preferences
and dislikes. However, when Bran Flakes were selected, a banana was added to the meal in
order for energy content to be similar between the two options, accounting for the smaller
portion of Bran Flakes. The same cereal was consumed for both large breakfast conditions.
The large breakfast meal (Alpen cereal chosen) typically exhibited the following
Time (minutes) -30 0 60 120 180 240 270
SB LB
LB+S
90
characteristics: ~763 kcal, 133.4g carbohydrate, 15.2g fat, 22.5g protein, 10.6g fibre. The
meals were consumed within 15 minutes.
Three snack items were administered at 1.5, 2.5 and 3.5 hours in the LB+S
condition. These were, in order, a 50g flapjack bar (Sainsbury’s, 223 kcal); a 25g cereal bar
(oat and raisin, Sainsbury’s, 98 kcal) and a ~152g, medium sized banana (Sainsbury’s, ~98
kcal). This provided an additional 419 kcal, 67.1g carbohydrate, 13.9g fat, 5.4g protein, 6.6g
fibre, resulting in a total intake in the LB+S of approximately 1182 kcal, 200.6g carbohydrate,
29.2g fat, 27.9g protein, 17.2g fibre. This compared with a total energy intake of ~763 kcal in
the LB condition and ~140 kcal in the SB condition.
3.3.5 Measures
Subjective appetite was measured using the VIMEC and the widely used visual
analogue scale technique (VAS). The VIMEC is a computer programme test, designed and
developed in the School of Sport, Exercise and Rehabilitation Sciences, University of
Birmingham, in which the participant is asked to construct a computerised visual meal from
an extensive menu, represented by a library of food images. The participant is asked to
select the foods that they would opt to consume, should they eat a meal or snack at this
moment in time. Selecting no food is an option available. The participant is presented with a
screen exhibiting the food items available (see figure 3.2a). The participant is free to select
up to a maximum of four “main meal” items (from a selection of 17, see Appendix 7), which
can be displayed on the meal plate, along with any number of “snack or dessert” items,
which are selected individually and displayed separately. Once selections are made, the
participant is then presented with a screen consisting of a meal plate on which their selected
food items appear. The portion size of each item can then be manipulated individually using
sliding bar scales (see figure 3.2b). The number of images for each food item varies,
depending on the nature of the item, typical portion sizes and the number of food items
selected. Typically, however, this number ranges from 10-40 images per food item, allowing
for a high resolution. This process is then repeated separately for any “snack or dessert”
items selected. Typically, this task took between 30 seconds and 2 minutes to complete.
91
Once the computerised meal was fully constructed, the meal was saved. The results
were analysed and the investigator was able to see which portion size was selected and
what number photograph this selection corresponded to. All food images were of a known
weight and the food characteristics of each food item were recorded (energy density,
macronutrient content). Hence, it was then possible to calculate the nutritional content of the
meal.
Subjective appetite was also assessed using the 4-question, 150mm-line VAS test
for subjective appetite, addressing “hunger”, “fullness”, “desire to eat” and “expected food
intake” (Hill and Blundell, 1982). A composite VAS test score was calculated (hunger score +
desire score + expected intake score + (150-fullness score)). This single score was used for
the ease of data analysis and presentation. With the original 6 question VAS technique of
Hill & Blundell (Hill and Blundell, 1982), the scores for each question co-vary to a large
extent (Stubbs et al., 2000) and that the first principal component of the questions is the
mean value of the scores (Reid et al., 1998). The two appetite measures, VIMEC and VAS,
were completed in a counterbalanced order to negate any order effect.
Energy intake was measured with the use of an ad libitum test meal. The content of
this test meal was dependant on the food choices made by the participant when using the
VIMEC. The food items selected during the measure obtained 60 minutes before the test
meal (t=180) were presented for the test meal. At the appetite measure obtained
immediately prior to the test meal, the participant was asked not to select any new,
additional food items. Participants were accompanied to the Research Kitchen within the
School of Sport, Exercise and Rehabilitation Sciences, where they were provided with a
dinner plate and a bowl at a table. The food items of the test meal were presented buffet-
style on a separate work surface, and of portion-size similar to that of the largest portion
available on the VIMEC tool. Participants were instructed to serve the food that they desired
to eat from the buffet on to the plate or into the bowl and return to the table to eat. They were
informed that they could return for further servings and that more of each food item was
available. They were instructed to eat until they felt satisfyingly full. Covertly, each food item
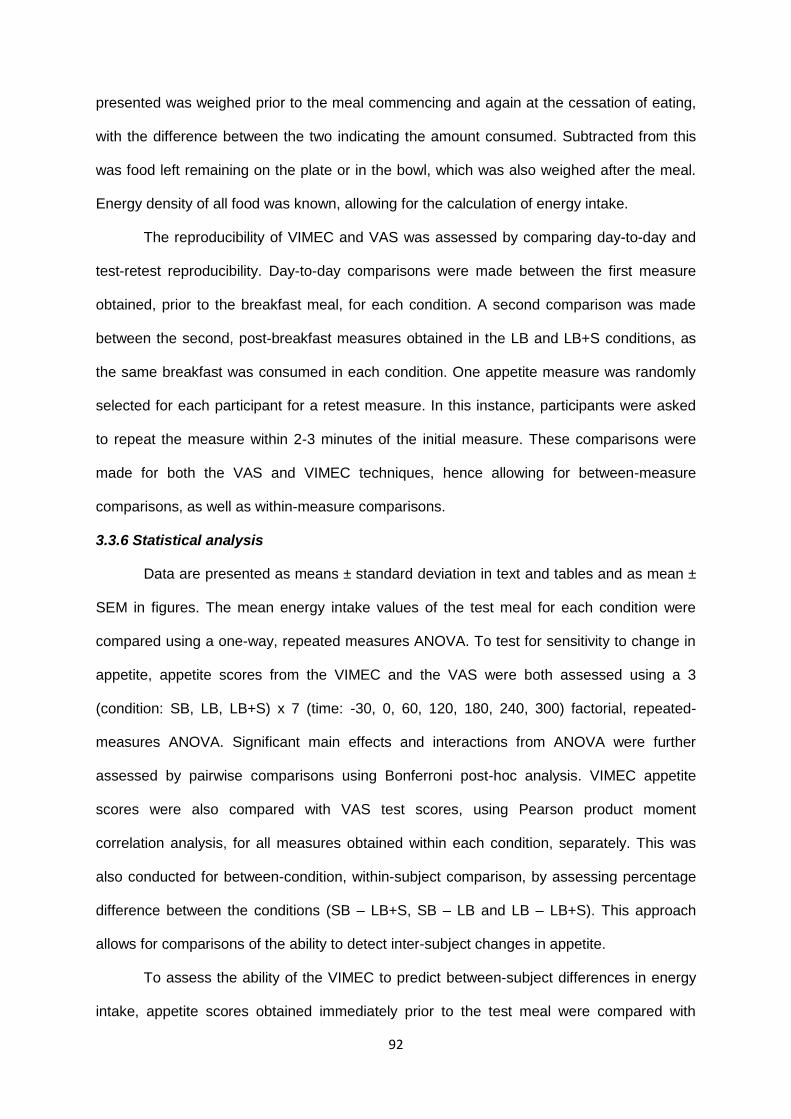
92
presented was weighed prior to the meal commencing and again at the cessation of eating,
with the difference between the two indicating the amount consumed. Subtracted from this
was food left remaining on the plate or in the bowl, which was also weighed after the meal.
Energy density of all food was known, allowing for the calculation of energy intake.
The reproducibility of VIMEC and VAS was assessed by comparing day-to-day and
test-retest reproducibility. Day-to-day comparisons were made between the first measure
obtained, prior to the breakfast meal, for each condition. A second comparison was made
between the second, post-breakfast measures obtained in the LB and LB+S conditions, as
the same breakfast was consumed in each condition. One appetite measure was randomly
selected for each participant for a retest measure. In this instance, participants were asked
to repeat the measure within 2-3 minutes of the initial measure. These comparisons were
made for both the VAS and VIMEC techniques, hence allowing for between-measure
comparisons, as well as within-measure comparisons.
3.3.6 Statistical analysis
Data are presented as means ± standard deviation in text and tables and as mean ±
SEM in figures. The mean energy intake values of the test meal for each condition were
compared using a one-way, repeated measures ANOVA. To test for sensitivity to change in
appetite, appetite scores from the VIMEC and the VAS were both assessed using a 3
(condition: SB, LB, LB+S) x 7 (time: -30, 0, 60, 120, 180, 240, 300) factorial, repeated-
measures ANOVA. Significant main effects and interactions from ANOVA were further
assessed by pairwise comparisons using Bonferroni post-hoc analysis. VIMEC appetite
scores were also compared with VAS test scores, using Pearson product moment
correlation analysis, for all measures obtained within each condition, separately. This was
also conducted for between-condition, within-subject comparison, by assessing percentage
difference between the conditions (SB – LB+S, SB – LB and LB – LB+S). This approach
allows for comparisons of the ability to detect inter-subject changes in appetite.
To assess the ability of the VIMEC to predict between-subject differences in energy
intake, appetite scores obtained immediately prior to the test meal were compared with
93
energy intake at the test meal .To assess the ability of the VIMEC to predict within-subject
differences in energy intake, between-condition percentage difference (SB – LB+S, SB – LB
and LB – LB+S) for energy intake, VAS score and VIMEC score was calculated and these
differences were compared using correlation analysis. Differences in correlation coefficients
were assessed using t-tests for non-independent correlation coefficients.
Day-to-day measures were compared using a one-way, repeated measures ANOVA
(pre-breakfast measures, SB vs. LB vs. LB+S) and a paired samples t-test (post-breakfast
measures, LB vs. LB+S). Test-retest measures were compared using a paired samples t-
test. The coefficient of variation was calculated for all reproducibility measures, with these
coefficient of variation values for the VIMEC and VAS methods compared using paired
samples t-tests. A statistical significance level of p < 0.05 was used throughout. All statistical
analysis was carried out using the SPSS software programme (SPSS inc. Chicago, Illinois,
USA).
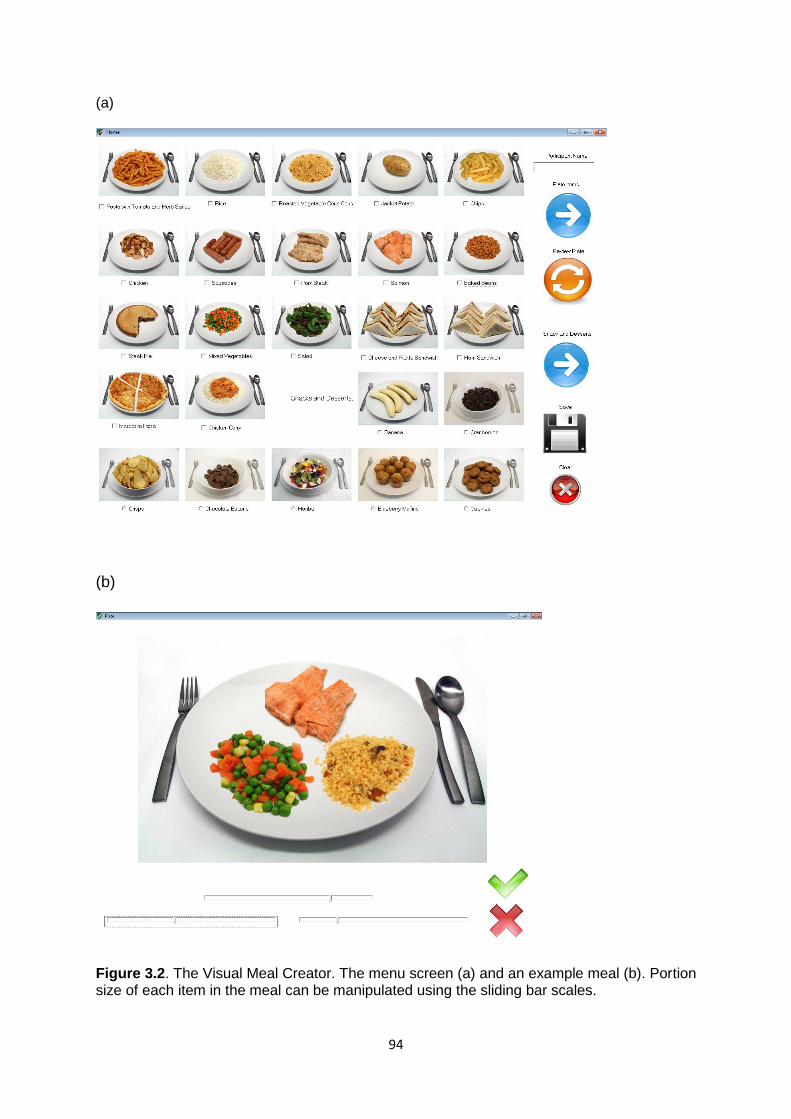
94
(a)
(b)
Figure 3.2. The Visual Meal Creator. The menu screen (a) and an example meal (b). Portion size of each item in the meal can be manipulated using the sliding bar scales.
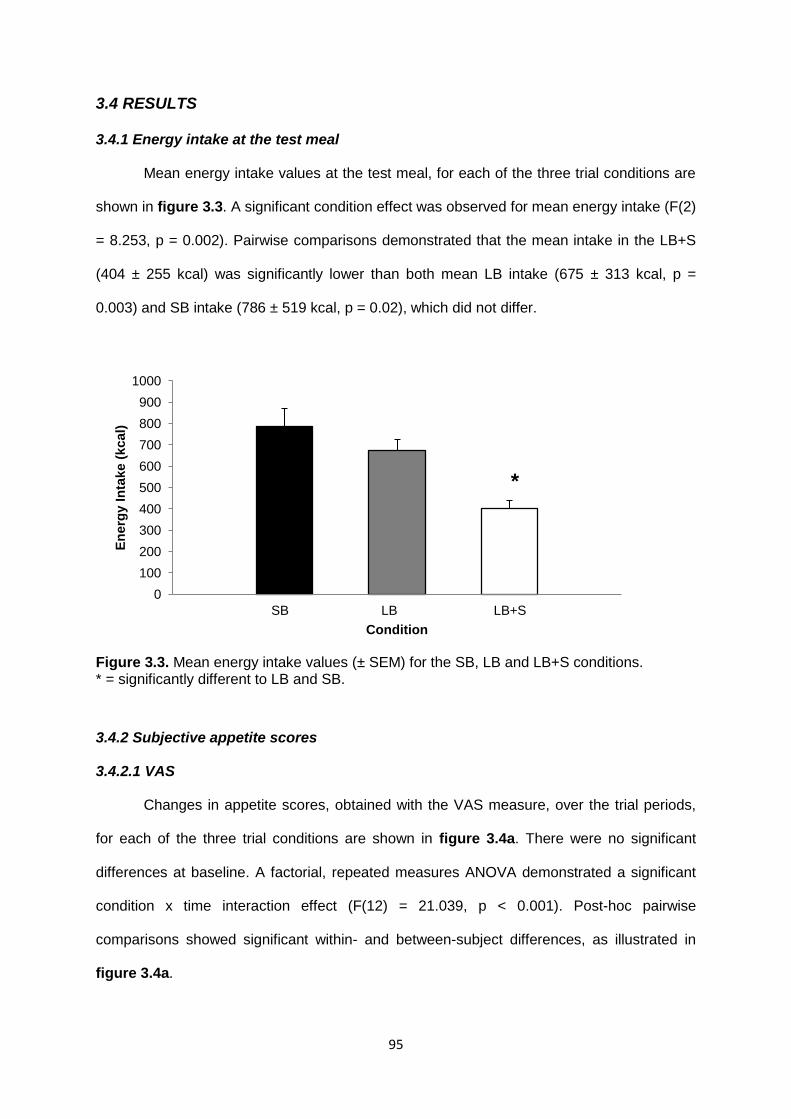
95
3.4 RESULTS
3.4.1 Energy intake at the test meal
Mean energy intake values at the test meal, for each of the three trial conditions are
shown in figure 3.3. A significant condition effect was observed for mean energy intake (F(2)
= 8.253, p = 0.002). Pairwise comparisons demonstrated that the mean intake in the LB+S
(404 ± 255 kcal) was significantly lower than both mean LB intake (675 ± 313 kcal, p =
0.003) and SB intake (786 ± 519 kcal, p = 0.02), which did not differ.
Figure 3.3. Mean energy intake values (± SEM) for the SB, LB and LB+S conditions. * = significantly different to LB and SB.
3.4.2 Subjective appetite scores
3.4.2.1 VAS
Changes in appetite scores, obtained with the VAS measure, over the trial periods,
for each of the three trial conditions are shown in figure 3.4a. There were no significant
differences at baseline. A factorial, repeated measures ANOVA demonstrated a significant
condition x time interaction effect (F(12) = 21.039, p < 0.001). Post-hoc pairwise
comparisons showed significant within- and between-subject differences, as illustrated in
figure 3.4a.
0
100
200
300
400
500
600
700
800
900
1000
SB LB LB+S
En
erg
y I
nta
ke (
kcal)
Condition
*
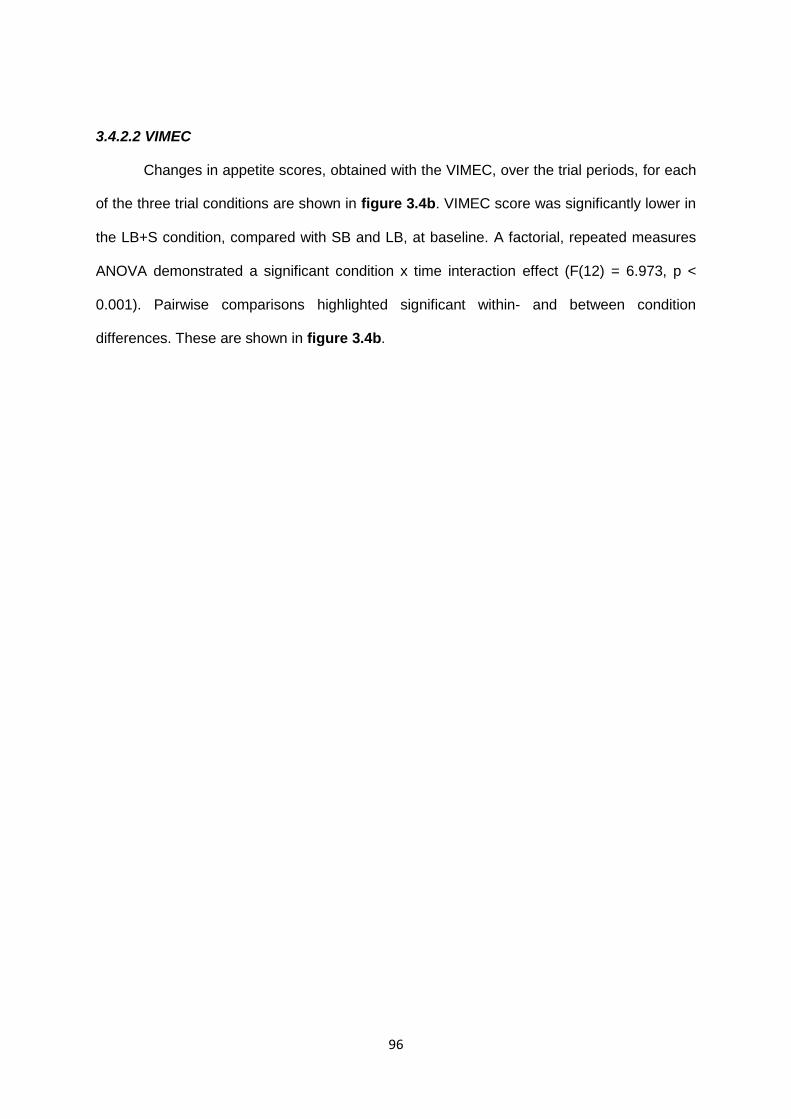
96
3.4.2.2 VIMEC
Changes in appetite scores, obtained with the VIMEC, over the trial periods, for each
of the three trial conditions are shown in figure 3.4b. VIMEC score was significantly lower in
the LB+S condition, compared with SB and LB, at baseline. A factorial, repeated measures
ANOVA demonstrated a significant condition x time interaction effect (F(12) = 6.973, p <
0.001). Pairwise comparisons highlighted significant within- and between condition
differences. These are shown in figure 3.4b.
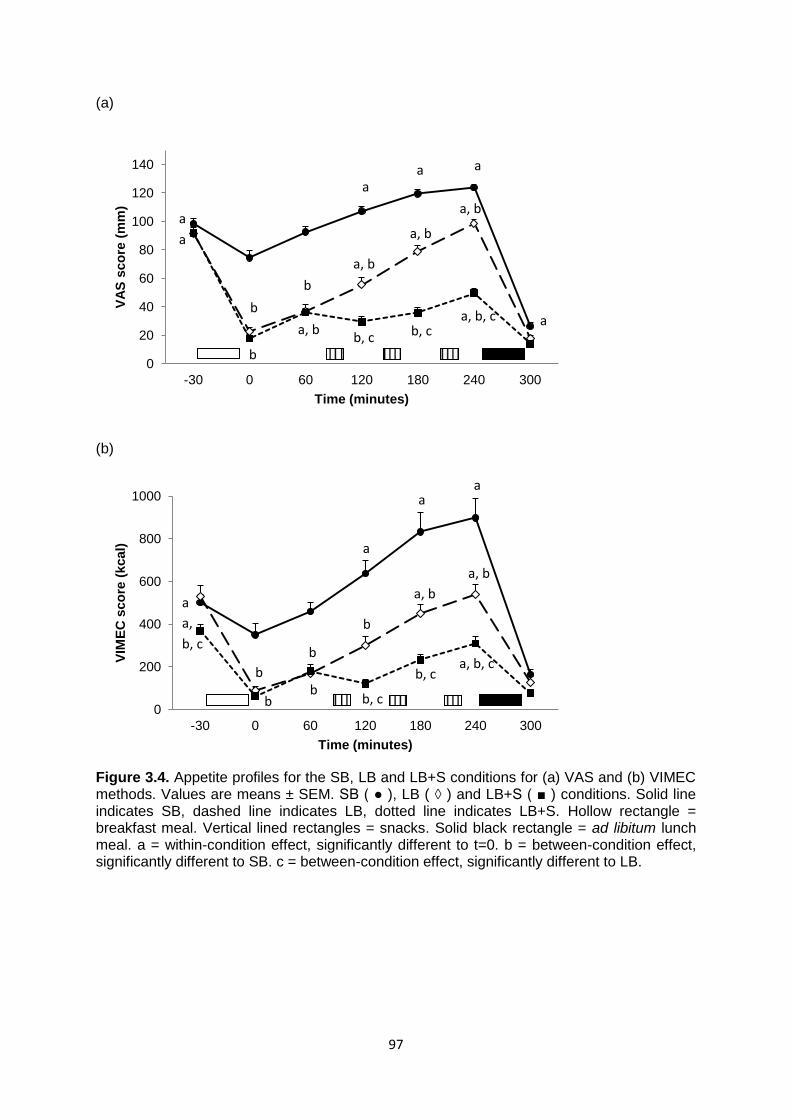
97
(a)
(b)
Figure 3.4. Appetite profiles for the SB, LB and LB+S conditions for (a) VAS and (b) VIMEC methods. Values are means ± SEM. SB ( ● ), LB ( ◊ ) and LB+S ( ■ ) conditions. Solid line indicates SB, dashed line indicates LB, dotted line indicates LB+S. Hollow rectangle = breakfast meal. Vertical lined rectangles = snacks. Solid black rectangle = ad libitum lunch meal. a = within-condition effect, significantly different to t=0. b = between-condition effect, significantly different to SB. c = between-condition effect, significantly different to LB.
0
20
40
60
80
100
120
140
-30 0 60 120 180 240 300
VA
S s
co
re (
mm
)
Time (minutes)
0
200
400
600
800
1000
-30 0 60 120 180 240 300
VIM
EC
sco
re (
kcal)
Time (minutes)
a, b a
a
a a a
a, b
a, b
b
b
b
a, b b, c b, c
a, b, c a
a, b a
a,
b, c
a
a a
b
a, b
b
b
b b
b, c
b, c a, b, c
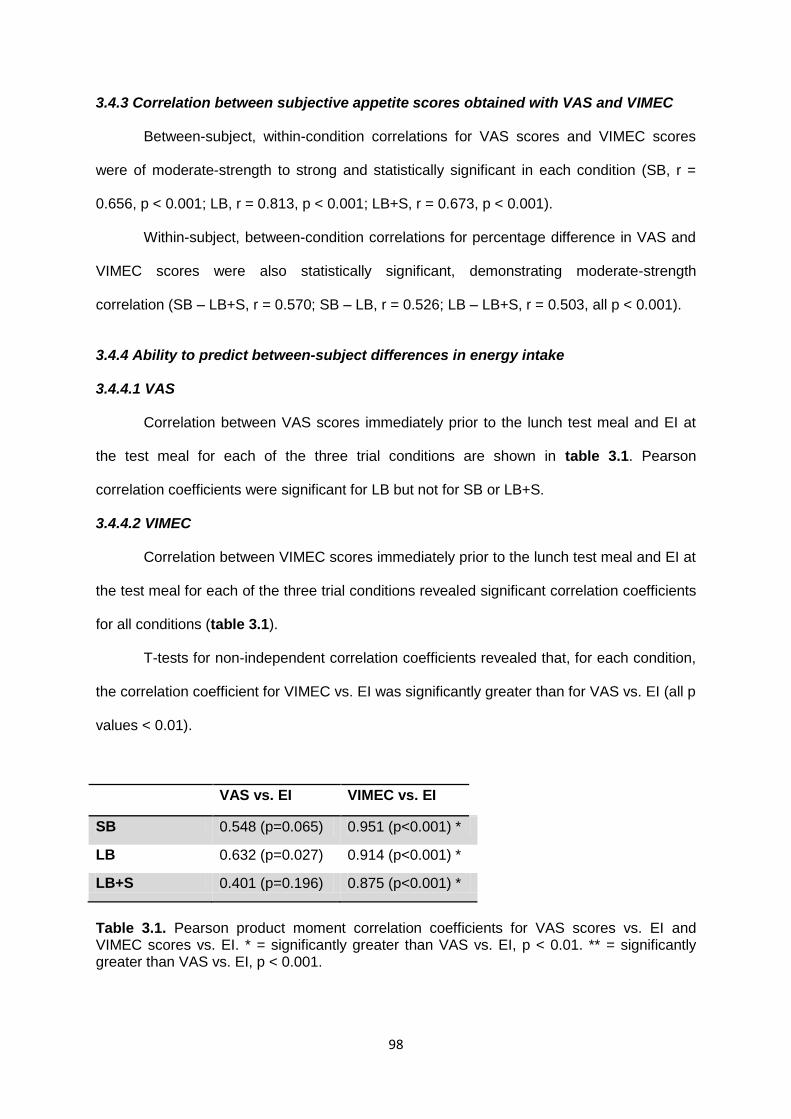
98
3.4.3 Correlation between subjective appetite scores obtained with VAS and VIMEC
Between-subject, within-condition correlations for VAS scores and VIMEC scores
were of moderate-strength to strong and statistically significant in each condition (SB, r =
0.656, p < 0.001; LB, r = 0.813, p < 0.001; LB+S, r = 0.673, p < 0.001).
Within-subject, between-condition correlations for percentage difference in VAS and
VIMEC scores were also statistically significant, demonstrating moderate-strength
correlation (SB – LB+S, r = 0.570; SB – LB, r = 0.526; LB – LB+S, r = 0.503, all p < 0.001).
3.4.4 Ability to predict between-subject differences in energy intake
3.4.4.1 VAS
Correlation between VAS scores immediately prior to the lunch test meal and EI at
the test meal for each of the three trial conditions are shown in table 3.1. Pearson
correlation coefficients were significant for LB but not for SB or LB+S.
3.4.4.2 VIMEC
Correlation between VIMEC scores immediately prior to the lunch test meal and EI at
the test meal for each of the three trial conditions revealed significant correlation coefficients
for all conditions (table 3.1).
T-tests for non-independent correlation coefficients revealed that, for each condition,
the correlation coefficient for VIMEC vs. EI was significantly greater than for VAS vs. EI (all p
values < 0.01).
VAS vs. EI VIMEC vs. EI
SB 0.548 (p=0.065) 0.951 (p<0.001) *
LB 0.632 (p=0.027) 0.914 (p<0.001) *
LB+S 0.401 (p=0.196) 0.875 (p<0.001) *
Table 3.1. Pearson product moment correlation coefficients for VAS scores vs. EI and VIMEC scores vs. EI. * = significantly greater than VAS vs. EI, p < 0.01. ** = significantly greater than VAS vs. EI, p < 0.001.
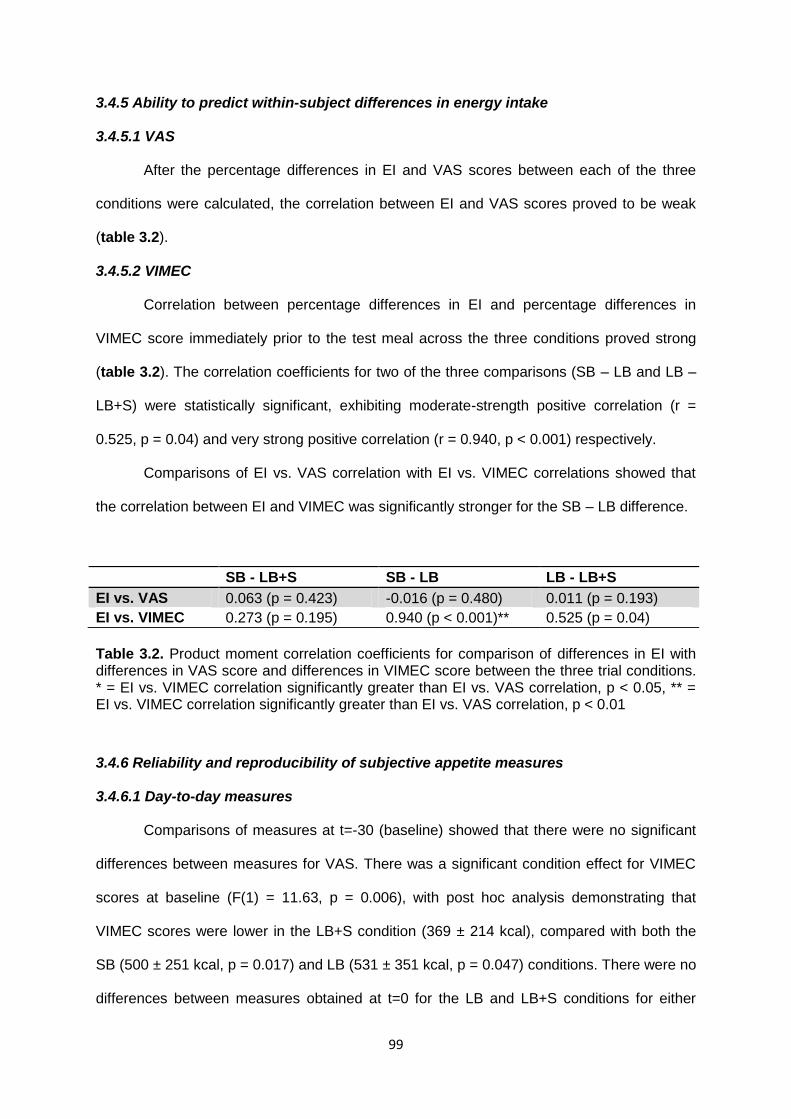
99
3.4.5 Ability to predict within-subject differences in energy intake
3.4.5.1 VAS
After the percentage differences in EI and VAS scores between each of the three
conditions were calculated, the correlation between EI and VAS scores proved to be weak
(table 3.2).
3.4.5.2 VIMEC
Correlation between percentage differences in EI and percentage differences in
VIMEC score immediately prior to the test meal across the three conditions proved strong
(table 3.2). The correlation coefficients for two of the three comparisons (SB – LB and LB –
LB+S) were statistically significant, exhibiting moderate-strength positive correlation (r =
0.525, p = 0.04) and very strong positive correlation (r = 0.940, p < 0.001) respectively.
Comparisons of EI vs. VAS correlation with EI vs. VIMEC correlations showed that
the correlation between EI and VIMEC was significantly stronger for the SB – LB difference.
Table 3.2. Product moment correlation coefficients for comparison of differences in EI with differences in VAS score and differences in VIMEC score between the three trial conditions. * = EI vs. VIMEC correlation significantly greater than EI vs. VAS correlation, p < 0.05, ** = EI vs. VIMEC correlation significantly greater than EI vs. VAS correlation, p < 0.01
3.4.6 Reliability and reproducibility of subjective appetite measures
3.4.6.1 Day-to-day measures
Comparisons of measures at t=-30 (baseline) showed that there were no significant
differences between measures for VAS. There was a significant condition effect for VIMEC
scores at baseline (F(1) = 11.63, p = 0.006), with post hoc analysis demonstrating that
VIMEC scores were lower in the LB+S condition (369 ± 214 kcal), compared with both the
SB (500 ± 251 kcal, p = 0.017) and LB (531 ± 351 kcal, p = 0.047) conditions. There were no
differences between measures obtained at t=0 for the LB and LB+S conditions for either
SB - LB+S SB - LB LB - LB+S
EI vs. VAS 0.063 (p = 0.423) -0.016 (p = 0.480) 0.011 (p = 0.193)
EI vs. VIMEC 0.273 (p = 0.195) 0.940 (p < 0.001)** 0.525 (p = 0.04)
100
subjective appetite method. Between-measure comparisons of the coefficient of variation
(CV) for t=-30 measures (SB vs. LB vs. LB+S) and CV for mean appetite scores for
measures obtained at t=-30, t=0 and t=60 (LB vs. LB+S) were conducted. The mean CV
value for VAS measures at t=-30 was significantly lower than that for VIMEC measures (19.1
± 11.7% vs. 32.2 ± 15.4%, p = 0.033). There was no significant difference in mean CV
values for meaned VAS and VIMEC measures obtained at t=-30, t=0 and t=60 (23.3 ±
12.1% for VAS and 25.6 ± 21.4% for VIMEC, p = 0.754).
3.4.6.2 Test-retest measures
Paired sample T-tests comparing the test-retest scores showed that retest measures
were similar to initial measures for both VAS and VIMEC methods. Mean CV values were
small and did not differ between the two methods (6.0 ± 6.1% vs. 5.7 ± 6.2% for VAS and
VIMEC respectively).
101
3.5 DISCUSSION
The aim of the current study was to assess the validity and reliability of the Visual
Meal Creator (VIMEC) as a method for measuring subjective appetite. The VIMEC
demonstrated the ability to detect expected changes in subjective appetite, as shown by the
appetite profiles. By time point t=240, immediately prior to the lunch test meal, the appetite
scores were significantly different between each trial condition. This was reflected by a
significant trial condition effect for energy intake at the lunch test meal, although it should be
noted that intakes in the SB and LB conditions, while differing by 14%, were not significantly
different. The appetite profile for VIMEC measures was almost identical to the profile
obtained from using the VAS method – a valid, reliable and highly-used method for the
measure of subjective appetite. Between-subject, within-condition comparisons of VIMEC
and VAS scores demonstrated significant, moderate-strength to strong correlation. Further,
between-condition percentage difference for VIMEC and VAS scores demonstrated a
moderate-strength relationship. While proving validity for such measures is difficult, this
comparison suggests that the VIMEC was performing as intended: providing a quantitative
measure of subjective appetite and detecting changes in subjective appetite after dietary
manipulation.
The VIMEC showed potential as a predictor of eating behaviour, of which the lunch
test meal energy intake acted as a proxy. Correlations between VIMEC scores immediately
prior to the test meal and the energy intake values were very strong for each of the three
conditions and compared favourably with those for VAS and energy intake, indicating that
the VIMEC is a stronger predictor of between-subject differences in energy intake. The
correlation for within-subject, between-condition differences in EI and differences in VIMEC
scores immediately prior to the test meal was significant and of moderate-strength to strong
in two of the three comparisons. This relationship was stronger than that of differences in
VAS score and differences in EI for all three comparisons, proving significantly so in one of
these cases.
102
Within appetite research, when the effect of an intervention upon appetite is under
investigation, VAS is commonly used in conjunction with objective appetite measures, such
as circulating levels of appetite-associated hormones or a measure of eating behaviour,
such as ad libitum energy intake. In these instances, the correlation between VAS scores
and these objective or behavioural measures are rarely assessed, so direct evidence of
VAS’s strength as a predictor of eating behaviour in such circumstances is not abundant.
Nevertheless, it is generally considered that VAS exhibits good predictive strength when
more severe interventions are implemented (pharmacological), but when more subtle
interventions are in place, such as exercise, the reliability of VAS to predict eating behaviour
is poor (Martins et al., 2007; Parker et al., 2004; Thompson et al., 1988). The intervention in
the current study was achieved by controlling food intake at breakfast and for the following
four hours until lunch in an attempt to manipulate appetite. Under these circumstances, the
VIMEC proved a strong predictor of eating behaviour. It remains to be seen whether the
VIMEC will prove a strong predictor of eating behaviour within exercise intervention studies.
The correlation coefficients for between-subject, within-condition comparisons of
VIMEC score and EI in the present study were extremely high. It is possible that the study
design contributed. The food items selected at time point t=180 were the items that were
presented at the buffet meal. This measure was obtained 60 minutes prior to the lunch test
meal, allowing sufficient time for food to be prepared. At t=240, immediately prior to the
meal, food item selection for the VIMEC was restricted to those items selected at t=180. This
ensured that the items selected here were those that the participant would be presented with
at the lunch test meal, allowing a strong comparison of the amount of each item selected. It
was possible that the number of food items selected (and hence made available at the lunch
test meal) could have constrained the subsequent energy intake. As a result, the magnitude
of correlation could have been artificially inflated, as food variety has been shown to
influence energy intake at a meal (Hetherington et al., 2006). Therefore, partial correlations
were calculated to remove the influence of the number of food items on the energy intake of
the test meal. These partial correlations differed minimally from the original correlation
103
coefficients (SB: 0.930 vs. 0.951; LB: 0.934 vs. 0.914; LB+S: 0.870 vs. 0.875). Hence, it
would appear that the number of food items selected was not a strong predictor of energy
intake in this study and did not contribute to the very strong correlation observed between
VIMEC score and energy intake.
Stubbs (2000) highlighted the large between-subject variability in subjective appetite
measures when using VAS and recommended that the method was therefore more
appropriate for within-subject comparisons. Large between-subject variability is not
uncommon with appetite measures, including ad libitum test meal intakes (Stubbs et al.,
1998) due to large biological variation in appetite, food preference and eating behaviour. The
between-subject variability of the VIMEC scores immediately prior to the lunch test meal,
was large (coefficient of variation (CV) values for 69%, 60% and 76% for SB, LB and LB+S
respectively), although not vastly larger than the variability in the energy intake measures
(CV values of 66%, 46% and 60% for SB, LB and LB+S respectively). Therefore, as with a
number of other subjective appetite and eating behaviour measures, it could be argued from
this data that the VIMEC is likely to be best suited to within-subject comparisons and
repeated-measure study designs. However, the stronger correlation between VIMEC score
and energy intake for between-subject differences, compared with within-subject changes,
may suggest that the VIMEC is better suited to assessing between-subject comparisons of
subjective appetite and predicted food intake.
The VAS has previously been shown to exhibit good test-retest reproducibility (Flint
et al., 2000; Stratton et al., 1998), but considerably poorer day-to-day reproducibility (Flint et
al., 2000; Raben et al., 1995; Stratton et al., 1998). The results of the current study would
suggest that the VIMEC exhibits a similar degree of test-retest reproducibility, with CV
values very comparable to those observed with VAS. While the CV for day-to-day repeated
measures at t=-30 was significantly higher than VAS, suggesting poorer day-to-day
reproducibility when using the VIMEC, the mean VIMEC scores for measure t=-30, t=0 and
t=60 for the LB and LB+S conditions were similar, suggesting a similar degree of
reproducibility. One would perhaps have expected a greater degree of variation with the
104
VIMEC, due to the option of choosing different food items of different energy densities. This
large degree of choice, allowing for the selection of vastly different meal creations would
lend itself to large variations in the measure. It should also be noted that, with any variation
in day-to-day measure, it is difficult to disentangle the contribution of biological and
methodological variation, especially when obtaining subjective measures, prone to variation
(Flint et al., 2000).
There were, however, significant differences in baseline values for VIMEC, between
the LB+S condition and LB condition and between LB+S and SB. This questions the day-to-
day reproducibility. Inspection of the data would suggest that this was not driven by a single
or small number of outliers. Other than the previously mentioned large degree of choice and
consequent increased likelihood of variability, and the biological variation in appetite
sensations from day-to-day, it is difficult to explain this observation. Food intake during the
24 hours prior to each trial was controlled by asking participants to record their dietary intake
on the day prior to their first trial, then asking them to repeat this intake on the day before
subsequent trials. It is possible that this was not well adhered to and that differences in
dietary intake on the day prior to trials may have influenced baseline appetite measures.
When obtaining a subjective appetite measure using the VIMEC, there is an upper
limit to the portion size available. This maximum portion is dependent on the food item and,
for the main meal items, the number of food items selected. To alleviate this limitation,
participants were informed that, should they desire more than the upper limit, they could
save the current measure, clear the screen and complete a second measure for any
additional food desired. While this option is not ideal, with the participant unable to visualise
their entire meal creation, it does allow for unlimited portion size selection. In the present
study, no participant chose to complete a second test for any measure. In addition, the 252
measures obtained in total resulted in 564 different food item selections. Only 31 times
(5.5%) were maximum portions selected (15 x salad). In addition, 26 of these 31 maximum
portion selections occurred during instances where the participant selected 4 or more food
items in the measure, when space on the plate for individual food item portions was limited.
105
We are therefore confident that the VIMEC does not substantially restrict the upper limit of a
subjective appetite measure.
While the use of photographic images of food is not a new concept within the area of
appetite research, the VIMEC is, to our knowledge, the first subjective appetite tool that
allows for the user to create a whole meal. Similar tools have asked users to select a desired
portion size of a range of individual food items (Sadoul et al., 2012) or a mixture of individual
items and ready-made meals (Farah et al., 2012), showing potential as useful appetite
measures. However, in neither of these studies did the technique demonstrate a relationship
between desired portion size and ad libitum food intake. The progressive step evident with
the VIMEC, allowing for the creation of a meal from an extensive menu of food items allows
a stronger measure of food choice and preference that is limited with the aforementioned
format of other tools. It is also possible that the more sophisticated nature of the VIMEC
allows for a stronger prediction of feeding behaviour, as is supported by the findings of the
current study.
One limitation that persists with the VIMEC, is that, when investigating the effects of
exercise on appetite, it would prove very difficult to obtain an appetite measure using the
VIMEC while exercising. While the validity and relevance of during-exercise measures could
be considered questionable in circumstances other than very prolonged exercise bouts, such
measures are often obtained and can be informative. These measures can be obtained with
the VAS method but due to the time, equipment and dexterity required to obtain a VIMEC
measure, using the VIMEC is unlikely to be feasible during exercise, particularly exercise
involving movement of the trunk and upper body.
In conclusion, the Visual Meal Creator demonstrates the potential to be a strong
predictor of between-subject difference in energy intake and a moderate strength predictor of
within- subject differences in energy intake. Test-retest reproducibility was good. Day-to-day
reproducibility was quite large, but this may be due to the large degree of food choice
allowable with the VIMEC. In comparison with the VAS technique, the VIMEC proved equally
as proficient at detecting expected changes in subjective appetite, while exhibiting a similar
106
degree of reproducibility. There was evidence that the VIMEC was a significantly stronger
predictor of energy intake – a fundamental aspect of eating behaviour – than VAS.
Therefore, the VIMEC demonstrates potential as a preferable tool for the measurement of
subjective appetite.
107
3.6 REFERENCES
Arvaniti, K., Richard, D., and Tremblay, A. (2000). Reproducibility of energy and macronutrient intake and related substrate oxidation rates in a buffet-type meal. The British journal of nutrition 83, 489-495. Bellisle, F. (1999). Food choice, appetite and physical activity. Public Health Nutrition 2, 357-361. Blundell, J., De Graaf, C., Hulshof, T., Jebb, S., Livingstone, B., Lluch, A., Mela, D., Salah, S., Schuring, E., Van Der Knaap, H., et al. (2010). Appetite control: methodological aspects of the evaluation of foods. Obesity Reviews 11, 251-270. Brunstrom, J.M., and Rogers, P.J. (2009). How many calories are on our plate? Expected fullness, not liking, determines meal-size selection. Obesity 17, 1884-1890. Brunstrom, J.M., Rogers, P.J., Pothos, E.M., Calitri, R., and Tapper, K. (2008a). Estimating everyday portion size using a "method of constant stimuli" in a student sample, portion size is predicted by gender, dietary behaviour, and hunger, but not BMI. Appetite 51, 296-301. Brunstrom, J.M., and Shakeshaft, N.G. (2009). Measuring affective (liking) and non-affective (expected satiety) determinants of portion size and food reward. Appetite 52, 108-114. Brunstrom, J.M., Shakeshaft, N.G., and Scott-Samuel, N.E. (2008b). Measuring "expected satiety" in a range of common foods using a method of constant stimuli. Appetite 51, 604-614. Farah, N.M.F., Brunstrom, J.M., and Gill, J.M.R. (2012). Using a novel computer-based approach to assess the acute effects of exercise on appetite-related measures. Appetite 58, 196-204. Flint, A., Raben, A., Blundell, J.E., and Astrup, A. (2000). Reproducibility, power and validity of visual analogue scales in assessment of appetite sensations in single test meal studies. International journal of obesity and related metabolic disorders : journal of the International Association for the Study of Obesity 24, 38-48. Frobisher, C., and Maxwell, S.M. (2003). The estimation of food portion sizes: a comparison between using descriptions of portion sizes and a photographic food atlas by children and adults. Journal of Human Nutrition and Dietetics 16, 181-188. George, V.A., and Morganstein, A. (2003). Effect of moderate intensity exercise on acute energy intake in normal and overweight females. Appetite 40, 43-46. Gregersen, N.T., Flint, A., Bitz, C., Blundell, J.E., Raben, A., and Astrup, A. (2008). Reproducibility and power of ad libitum energy intake assessed by repeated single meals. The American Journal of Clinical Nutrition 87, 1277-1281. Hetherington, M.M., Foster, R., Newman, T., Anderson, A.S., and Norton, G. (2006). Understanding variety: Tasting different foods delays satiation. Physiology & Behavior 87, 263-271. Hill, A.J., and Blundell, J.E. (1982). Nutrients and behaviour: Research strategies for the investigation of taste characteristics, food preferences, hunger sensations and eating patterns in man. Journal of Psychiatric Research 17, 203-212.
108
King, N.A., Caudwell, P.P., Hopkins, M., Stubbs, J.R., Naslund, E., and Blundell, J.E. (2009). Dual-process action of exercise on appetite control: increase in orexigenic drive but improvement in meal-induced satiety. The American Journal of Clinical Nutrition 90, 921-927. King, N.A., Tremblay, A., and Blundell, J.E. (1997). Effects of exercise on appetite control: implications for energy balance. Medicine and science in sports and exercise 29, 1076-1089. Martins, C., Morgan, L.M., Bloom, S.R., and Robertson, M.D. (2007). Effects of exercise on gut peptides, energy intake and appetite. J Endocrinol 193, 251-258. Martins, C., Morgan, L., and Truby, H. (2008). A review of the effects of exercise on appetite regulation: an obesity perspective. Int J Obes 32, 1337-1347. Nelson, M., and Haraldsdóttir, J. (1998). Food photographs: practical guidelines I. Design and analysis of studies to validate portion size estimates. Public Health Nutrition 1, 219-230. Parker, B.A., Sturm, K., MacIntosh, C.G., Feinle, C., Horowitz, M., and Chapman, I.M. (2004). Relation between food intake and visual analogue scale ratings of appetite and other sensations in healthy older and young subjects. Eur J Clin Nutr 58, 212-218. Raben, A., Tagliabue, A., and Astrup, A. (1995). The reproducibility of subjective appetite scores. The British journal of nutrition 73, 517-530. Reid, C.H., CG. Blundell, JE. Stubbs, RJ (1998). What are psychometric assessments of appetite asking: a preliminary multivariate analysis. International Journal of Obesity 22, 151. Riley, W.T., Beasley, J., Sowell, A., and Behar, A. (2007). Effects of a web-based food portion training program on food portion estimation. Journal of Nutrition Education and Behavior 39, 70-76. Rolls, B.J., Morris, E.L., and Roe, L.S. (2002). Portion size of food affects energy intake in normal-weight and overweight men and women. American Journal of Clinical Nutrition 76, 1207-1213. Sadoul, B.C., Schuring, E.A.H., Symersky, T., Mela, D.J., Masclee, A.A.M., and Peters, H.P.F. (2012). Measuring satiety with pictures compared to visual analogue scales. An exploratory study. Appetite 58, 414-417. Stratton, R.J., Stubbs, R.J., Hughes, D., King, N., Blundell, J.E., and Elia, M. (1998). Comparison of the traditional paper visual analogue scale questionnaire with an Apple Newton electronic appetite rating system (EARS) in free living subjects feeding ad libitum. European Journal of Clinical Nutrition 52, 737-741. Stubbs, R.J., Hughes, D.A., Johnstone, A.M., Rowley, E., Reid, C., Elia, M., Stratton, R., Delargy, H., King, N., and Blundell, J.E. (2000). The use of visual analogue scales to assess motivation to eat in human subjects: a review of their reliability and validity with an evaluation of new hand-held computerized systems for temporal tracking of appetite ratings. Br J Nutr 84, 405-415. Stubbs, R.J., Johnstone, A.M., O'Reilly, L.M., and Poppitt, S.D. (1998). Methodological issues relating to the measurement of food, energy and nutrient intake in human laboratory-based studies. Proc Nutr Soc 57, 357-372.
109
Subar, A.F., Crafts, J., Zimmerman, T.P., Wilson, M., Mittl, B., Islam, N.G., McNutt, S., Potischman, N., Buday, R., Hull, S.G., et al. (2010). Assessment of the accuracy of portion size reports using computer-based food photographs aids in the development of an automated self-administered 24-hour recall. Journal of the American Dietetic Association 110, 55-64. Thompson, D.A., Wolfe, L.A., and Eikelboom, R. (1988). Acute effects of exercise intensity on appetite in young men. Medicine & Science in Sports & Exercise 20, 222-227. Turconi, G., Guarcello, M., Berzolari, F.G., Carolei, A., Bazzano, R., and Roggi, C. (2005). An evaluation of a colour food photography atlas as a tool for quantifying food portion size in epidemiological dietary surveys. Eur J Clin Nutr 59, 923-931. Venter, C.S., MacIntyre, U.E., and Vorster, H.H. (2000). The development and testing of a food portion photograph book for use in an African population. Journal of Human Nutrition and Dietetics 13, 205-218. Wansink, B., Painter, J.E., and North, J. (2005). Bottomless Bowls: Why visual cues of portion size may influence intake[ast][ast]. Obesity 13, 93-100. Williamson, D.A., Allen, H.R., Martin, P.D., Alfonso, A.J., Gerald, B., and Hunt, A. (2003). Comparison of digital photography to weighed and visual estimation of portion sizes. Journal of the American Dietetic Association 103, 1139-1145. Yeomans, M.R., Lee, M.D., Gray, R.W., and French, S.J. (2001). Effects of test-meal palatability on compensatory eating following disguised fat and carbohydrate preloads. International Journal of Obesity 25, 1215-1224.
110
CHAPTER 4
The effect of exercise intensity on subjective appetite, food intake
and appetite associated hormones in highly-trained male
endurance athletes.
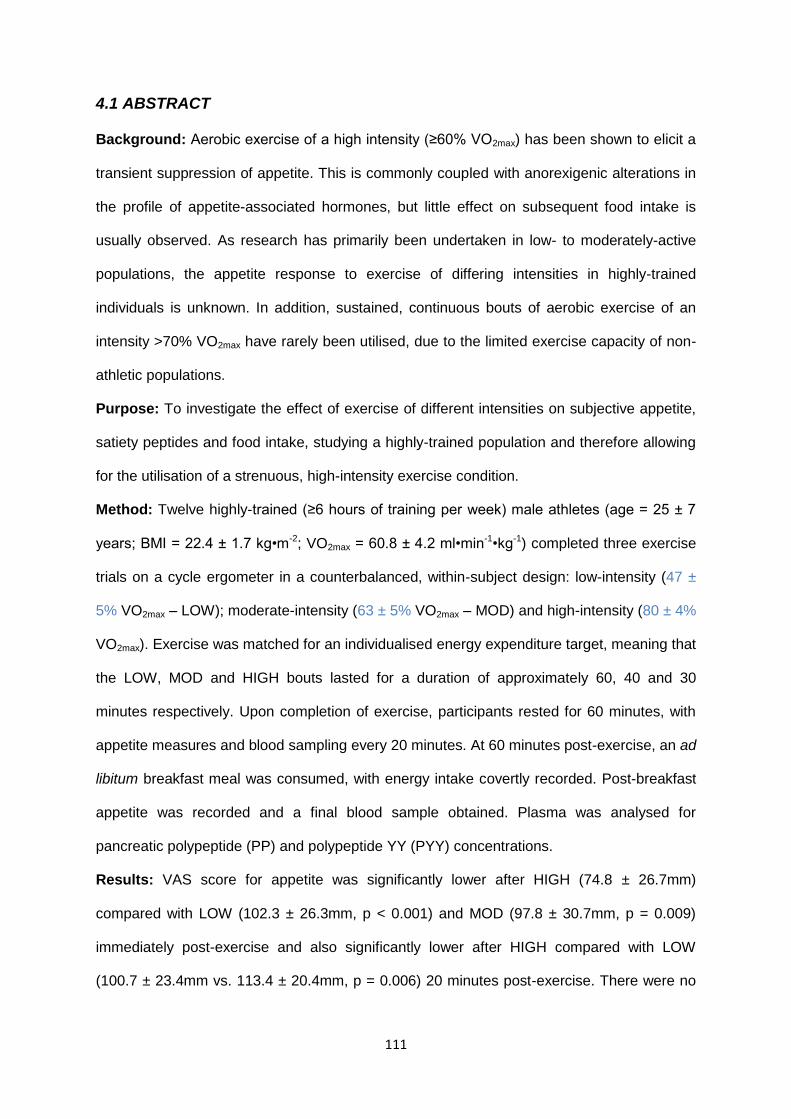
111
4.1 ABSTRACT
Background: Aerobic exercise of a high intensity (≥60% VO2max) has been shown to elicit a
transient suppression of appetite. This is commonly coupled with anorexigenic alterations in
the profile of appetite-associated hormones, but little effect on subsequent food intake is
usually observed. As research has primarily been undertaken in low- to moderately-active
populations, the appetite response to exercise of differing intensities in highly-trained
individuals is unknown. In addition, sustained, continuous bouts of aerobic exercise of an
intensity >70% VO2max have rarely been utilised, due to the limited exercise capacity of non-
athletic populations.
Purpose: To investigate the effect of exercise of different intensities on subjective appetite,
satiety peptides and food intake, studying a highly-trained population and therefore allowing
for the utilisation of a strenuous, high-intensity exercise condition.
Method: Twelve highly-trained (≥6 hours of training per week) male athletes (age = 25 ± 7
years; BMI = 22.4 ± 1.7 kg•m-2; VO2max = 60.8 ± 4.2 ml•min-1•kg-1) completed three exercise
trials on a cycle ergometer in a counterbalanced, within-subject design: low-intensity (47 ±
5% VO2max – LOW); moderate-intensity (63 ± 5% VO2max – MOD) and high-intensity (80 ± 4%
VO2max). Exercise was matched for an individualised energy expenditure target, meaning that
the LOW, MOD and HIGH bouts lasted for a duration of approximately 60, 40 and 30
minutes respectively. Upon completion of exercise, participants rested for 60 minutes, with
appetite measures and blood sampling every 20 minutes. At 60 minutes post-exercise, an ad
libitum breakfast meal was consumed, with energy intake covertly recorded. Post-breakfast
appetite was recorded and a final blood sample obtained. Plasma was analysed for
pancreatic polypeptide (PP) and polypeptide YY (PYY) concentrations.
Results: VAS score for appetite was significantly lower after HIGH (74.8 ± 26.7mm)
compared with LOW (102.3 ± 26.3mm, p < 0.001) and MOD (97.8 ± 30.7mm, p = 0.009)
immediately post-exercise and also significantly lower after HIGH compared with LOW
(100.7 ± 23.4mm vs. 113.4 ± 20.4mm, p = 0.006) 20 minutes post-exercise. There were no
112
significant differences in PP or PYY concentration between conditions, neither was there a
difference pre- versus post-exercise. Energy intake at the ad libitum breakfast meal did not
differ between conditions.
Conclusion: Subjective appetite was transiently suppressed after high-intensity exercise in
highly-trained male endurance athletes. However, no such suppression was observed after
exercise at 60% VO2max – an intensity commonly seen to elicit a transient appetite
suppression in non-athletic populations. The observed suppression was independent of
significant changes in satiety peptide concentration and the transient nature resulted in no
effect on food intake. This would suggest that athletes may exhibit some resistance to an
exercise-induced suppression of appetite at an intensity lower than 80% VO2max, while also
questioning the regulatory role of PP and PYY for subjective appetite in the post-exercise
period.
113
4.2 INTRODUCTION
The short-term coupling between exercise-induced energy expenditure and intake is
weak, advocating the absence of a fast-acting compensatory mechanism by which energy
intake is upregulated after physical activity (King et al., 1997a; King et al.,1996; Lluch et al.,
2000). In fact, it would appear that an acute bout of aerobic exercise of a sufficiently high
intensity (≥60% VO2max), can transiently suppress appetite (Broom et al., 2009; Broom et al.,
2007; Burns et al., 2007; Kawano et al., 2013; King et al., 2010; King et al., 1994; Kissileff et
al., 1990; Thompson et al., 1988; Ueda et al., 2009a; Ueda et al., 2009b; Westerterp-
Plantenga et al., 1997). This is often accompanied by increases in anorexigenic hormones
such as pancreatic polypeptide (PP), glucagon-like peptide-1 (GLP-1) and polypeptide YY
(PYY) (Broom et al., 2009; King et al., 2011a; Martins et al., 2007; Ueda et al., 2009a; Ueda
et al., 2009b), which has led to suggestions that this may be a mechanism which underpins
an exercise-induced suppression of appetite. The relative time-courses for changes in
hormonal profiles, subjective appetite and food intake remain unknown; hence, the influence
of exercise-induced changes in circulating concentrations of appetite-associated hormones
on appetite and food intake remains relatively unclear.
As this exercise-induced suppression of appetite, termed “anorexia of exercise” (King
et al., 1994) is short-lived, a subsequent reduction in post-exercise food intake has often
been reported only when food is available within close proximity (~15-30 minutes) to the
cessation of exercise (Kissileff et al., 1990; Westerterp-Plantenga et al., 1997). Any such
suppression of appetite has rarely been seen to reduce food intake when test meals are
administered 60 minutes post-exercise (Thompson et al., 1988), although the exact duration
of this transient suppression, and whether it can vary depending upon the nature of the
exercise and the population, is unclear.
To date, the effect of exercise on appetite has rarely been assessed using athletic
populations. Highly trained athletes regularly complete very strenuous, high energy cost
bouts of exercise. After completing these sessions, post-exercise nutrition is often
114
considered of vital importance to optimise recovery and adaptation to training (Burke, 1997).
Further, many endurance athletes value weight management highly (Filaire et al., 2007), as
an increase in body weight can result in an increase in the energy cost of performing. The
majority of investigations into the effect of exercise on appetite have been conducted with
overweight and obese, healthy-weight sedentary or moderately-active individuals. Further,
partly due to the difficulty of non-athletic populations exercising at a high intensity for
prolonged periods, few studies have used “high intensity” exercise bouts of greater than 60-
70% VO2max (Imbeault et al., 1997; Kissileff et al., 1990; Pomerleau et al., 2004; Ueda et al.,
2009b; Westerterp-Plantenga et al., 1997) and exercise bouts used have often yielded
relatively low energy expenditure values (e.g., ~85 kcal (350 kJ) (Pomerleau et al.,
2004);~145- 200 kcal (George and Morganstein, 2003);~240 kcal (Kissileff et al., 1990)).
Studies conducted within active individuals have failed to observe a suppression of appetite
after 60 minutes of treadmill running at 70% VO2max (King et al., 2010; King et al., 2011a),
while in the few investigations that have addressed the effect of exercise on measures of
appetite in athletic populations, the focus has primarily been on hormone measures and no
measures of subjective appetite or food intake have been obtained (Jurimae et al., 2006;
Jurimae and Jurimae, 2005; Jurimae et al., 2007; Jürimäe et al., 2003; Jurimae et al., 2009;
O'Connor et al., 1995; O'Connor et al., 2006; Russel et al., 2009).
The purpose of the current study was to address the effect of exercise intensity on
subjective appetite, food intake and circulating concentrations of appetite-associated
hormones in highly trained endurance athletes, utilising a strenuous exercise protocol. It was
hypothesised that a transient exercise-induced suppression of appetite would be observed
after moderate- and high-intensity exercise, with a greater, longer lasting suppression
evident after high-intensity exercise leading to a lower post-exercise energy intake in this
condition.

115
4.3 METHOD
4.3.1 Participants
Twelve healthy-weight, highly trained male endurance athletes were recruited
principally from the University of Birmingham cycling, triathlon and athletics clubs. The
participant characteristics are shown in Table 4.1. Inclusion criteria were: a minimum total
training duration of 6 hours per week and aged between 18 and 40 years. Exclusion criteria
were: a score of 3.5 or greater for restricted eating on the Dutch Eating Behaviour
Questionnaire (DEBQ, van Strien et al., 1986, Appendix 4); illness such as upper respiratory
tract infections; smoking and the taking of medication likely to affect appetite or induce
weight-loss. Ethical approval was obtained from the Ethics Subcommittee of the School of
Sport, Exercise and Rehabilitation Sciences at the University of Birmingham. One participant
suffered from a phobia of needles, so blood samples were not obtained. As a result,
hormone analysis was conducted for eleven participants.
Age (years) 25 ± 7
BMI (kg•m-2) 22.4 ± 1.7
VO2max (mL•kg-1•min-1) 60.8 ± 4.1
Wmax (Watts) 322 ± 55
DEBQ score for restraint
1.4 ± 0.1
Table 4.1. Participant characteristics. Values are mean ± SD.
4.3.2 Experimental trial conditions
Participants were randomly assigned to each exercise intensity condition:
high- (HIGH, 80% VO2max), moderate- (MOD, 60% VO2max) and low- (LOW, 40% VO2max)
intensity exercise, with measures of subjective appetite and circulating concentrations of
peptide tyrosine tyrosine (PYY) and pancreatic polypeptide (PP) recorded throughout each
trial.
116
4.3.3 Procedure & protocol
After a minimum period of 3 days after pre-testing (see General methods, section
2.2.2.1, p70), participants returned to the laboratory at approximately 08:00 after an
overnight fast for the first of three exercise trials. Upon arrival, the participants were weighed
(weight was recorded at each visit to ensure participants were weight-stable throughout). A
resting blood sample was obtained following the insertion of a venous cannula into the
antecubital vein of the arm by a qualified member of staff. The participant then completed
the pre-exercise tests of subjective appetite. Once the tests were completed, the exercise
trial commenced. This consisted of a bout of exercise on an electromagnetically braked
cycle ergometer (Lode Excalibur Sport, Groningen, Netherlands) at an intensity of 40%, 60%
or 80% VO2max, for a duration that elicited an individualised, standardised energy
expenditure. This individual energy expenditure target equated to approximately 60, 40 and
30 minutes at each of the respective exercise intensities. This allowed for intra-subject
standardisation of energy expenditure, while avoiding large inter-subject variation in exercise
duration that would have been unavoidable had a generic, standardised energy target been
used. During each exercise bout, exhaled gas samples were obtained intermittently to
monitor VO2 and to retrospectively calculate energy expenditure. A blood sample was
obtained at the half way point of the exercise trial. Upon reaching the energy expenditure
target, the exercise ceased. Measures of subjective appetite were completed and a blood
sample was obtained immediately, as the participant sat resting. This resting period
continued, with the participant sat reading or watching television, for a duration of 60 minutes
to allow for subsequent repetitions of appetite measures and repeated blood sampling at 20,
40 and 60 minutes post-exercise. At 60 minutes post-exercise, the participant consumed an
ad libitum intake test meal, as described in General methods, section 2.2.3.2, (p73).
4.3.4 Blood sampling and analysis
The blood sampling and plasma analysis techniques are described in General
methods, section 2.2.3.5, (p76). Briefly, blood samples were obtained and immediately
transferred to disodium EDTA-treated tubes for analysis of hormones. Blood was centrifuged
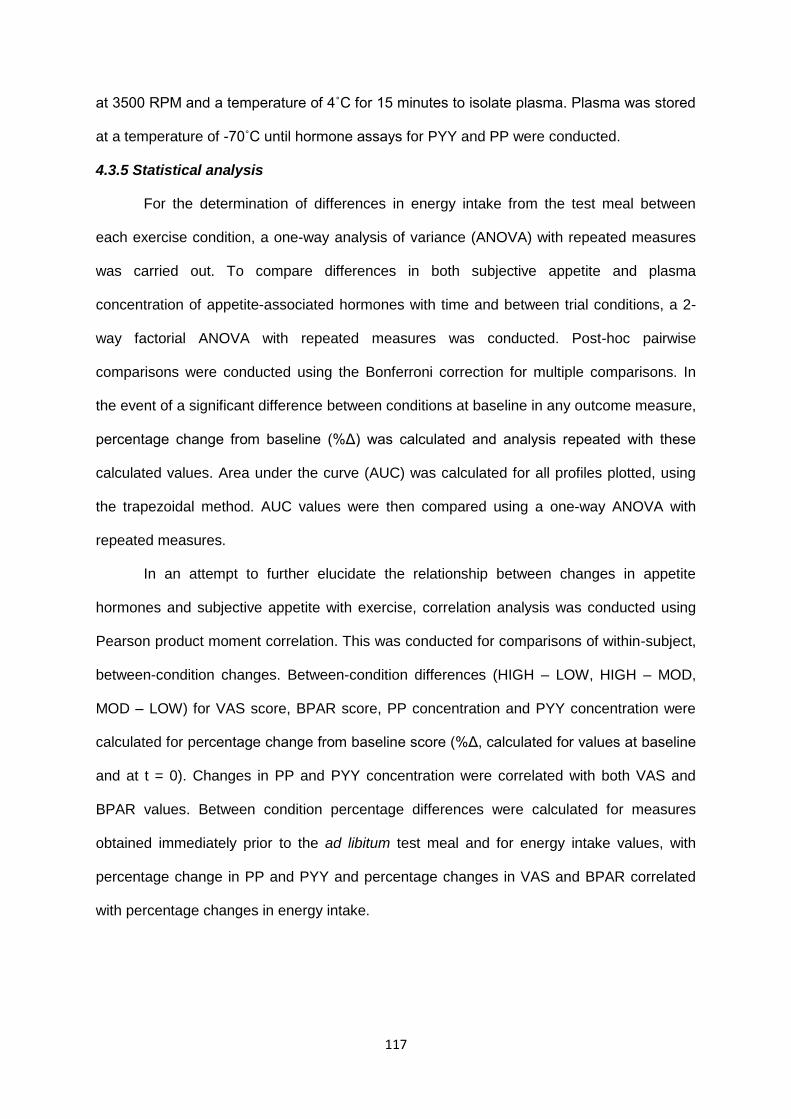
117
at 3500 RPM and a temperature of 4˚C for 15 minutes to isolate plasma. Plasma was stored
at a temperature of -70˚C until hormone assays for PYY and PP were conducted.
4.3.5 Statistical analysis
For the determination of differences in energy intake from the test meal between
each exercise condition, a one-way analysis of variance (ANOVA) with repeated measures
was carried out. To compare differences in both subjective appetite and plasma
concentration of appetite-associated hormones with time and between trial conditions, a 2-
way factorial ANOVA with repeated measures was conducted. Post-hoc pairwise
comparisons were conducted using the Bonferroni correction for multiple comparisons. In
the event of a significant difference between conditions at baseline in any outcome measure,
percentage change from baseline (%Δ) was calculated and analysis repeated with these
calculated values. Area under the curve (AUC) was calculated for all profiles plotted, using
the trapezoidal method. AUC values were then compared using a one-way ANOVA with
repeated measures.
In an attempt to further elucidate the relationship between changes in appetite
hormones and subjective appetite with exercise, correlation analysis was conducted using
Pearson product moment correlation. This was conducted for comparisons of within-subject,
between-condition changes. Between-condition differences (HIGH – LOW, HIGH – MOD,
MOD – LOW) for VAS score, BPAR score, PP concentration and PYY concentration were
calculated for percentage change from baseline score (%Δ, calculated for values at baseline
and at t = 0). Changes in PP and PYY concentration were correlated with both VAS and
BPAR values. Between condition percentage differences were calculated for measures
obtained immediately prior to the ad libitum test meal and for energy intake values, with
percentage change in PP and PYY and percentage changes in VAS and BPAR correlated
with percentage changes in energy intake.
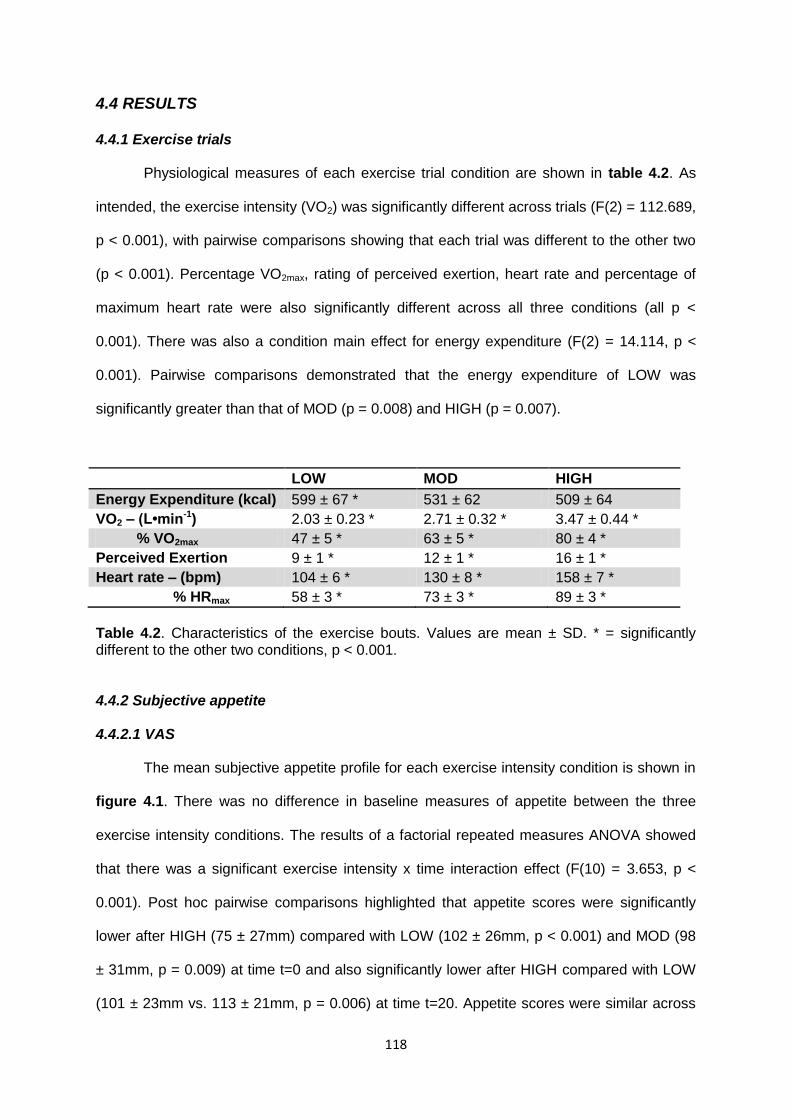
118
4.4 RESULTS
4.4.1 Exercise trials
Physiological measures of each exercise trial condition are shown in table 4.2. As
intended, the exercise intensity (VO2) was significantly different across trials (F(2) = 112.689,
p < 0.001), with pairwise comparisons showing that each trial was different to the other two
(p < 0.001). Percentage VO2max, rating of perceived exertion, heart rate and percentage of
maximum heart rate were also significantly different across all three conditions (all p <
0.001). There was also a condition main effect for energy expenditure (F(2) = 14.114, p <
0.001). Pairwise comparisons demonstrated that the energy expenditure of LOW was
significantly greater than that of MOD (p = 0.008) and HIGH (p = 0.007).
LOW MOD HIGH
Energy Expenditure (kcal) 599 ± 67 * 531 ± 62 509 ± 64
VO2 – (L•min-1) 2.03 ± 0.23 * 2.71 ± 0.32 * 3.47 ± 0.44 *
% VO2max 47 ± 5 * 63 ± 5 * 80 ± 4 *
Perceived Exertion 9 ± 1 * 12 ± 1 * 16 ± 1 *
Heart rate – (bpm) 104 ± 6 * 130 ± 8 * 158 ± 7 *
% HRmax 58 ± 3 * 73 ± 3 * 89 ± 3 *
Table 4.2. Characteristics of the exercise bouts. Values are mean ± SD. * = significantly different to the other two conditions, p < 0.001.
4.4.2 Subjective appetite
4.4.2.1 VAS
The mean subjective appetite profile for each exercise intensity condition is shown in
figure 4.1. There was no difference in baseline measures of appetite between the three
exercise intensity conditions. The results of a factorial repeated measures ANOVA showed
that there was a significant exercise intensity x time interaction effect (F(10) = 3.653, p <
0.001). Post hoc pairwise comparisons highlighted that appetite scores were significantly
lower after HIGH (75 ± 27mm) compared with LOW (102 ± 26mm, p < 0.001) and MOD (98
± 31mm, p = 0.009) at time t=0 and also significantly lower after HIGH compared with LOW
(101 ± 23mm vs. 113 ± 21mm, p = 0.006) at time t=20. Appetite scores were similar across
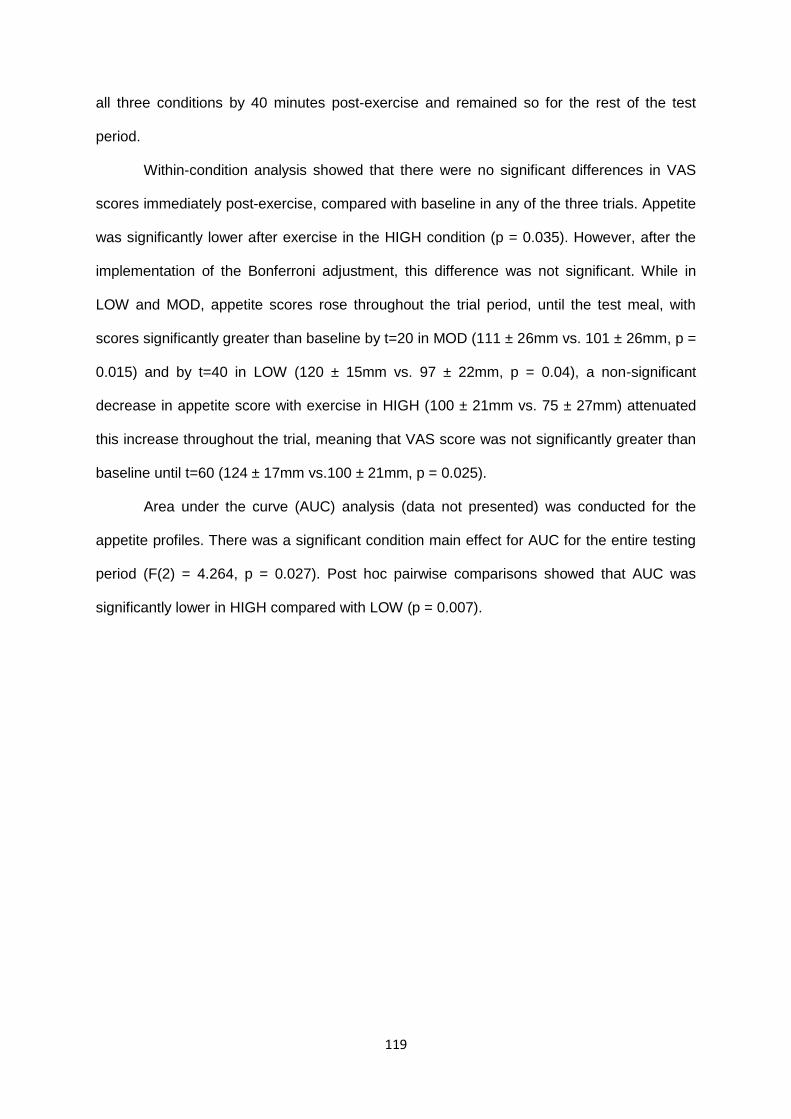
119
all three conditions by 40 minutes post-exercise and remained so for the rest of the test
period.
Within-condition analysis showed that there were no significant differences in VAS
scores immediately post-exercise, compared with baseline in any of the three trials. Appetite
was significantly lower after exercise in the HIGH condition (p = 0.035). However, after the
implementation of the Bonferroni adjustment, this difference was not significant. While in
LOW and MOD, appetite scores rose throughout the trial period, until the test meal, with
scores significantly greater than baseline by t=20 in MOD (111 ± 26mm vs. 101 ± 26mm, p =
0.015) and by t=40 in LOW (120 ± 15mm vs. 97 ± 22mm, p = 0.04), a non-significant
decrease in appetite score with exercise in HIGH (100 ± 21mm vs. 75 ± 27mm) attenuated
this increase throughout the trial, meaning that VAS score was not significantly greater than
baseline until t=60 (124 ± 17mm vs.100 ± 21mm, p = 0.025).
Area under the curve (AUC) analysis (data not presented) was conducted for the
appetite profiles. There was a significant condition main effect for AUC for the entire testing
period (F(2) = 4.264, p = 0.027). Post hoc pairwise comparisons showed that AUC was
significantly lower in HIGH compared with LOW (p = 0.007).
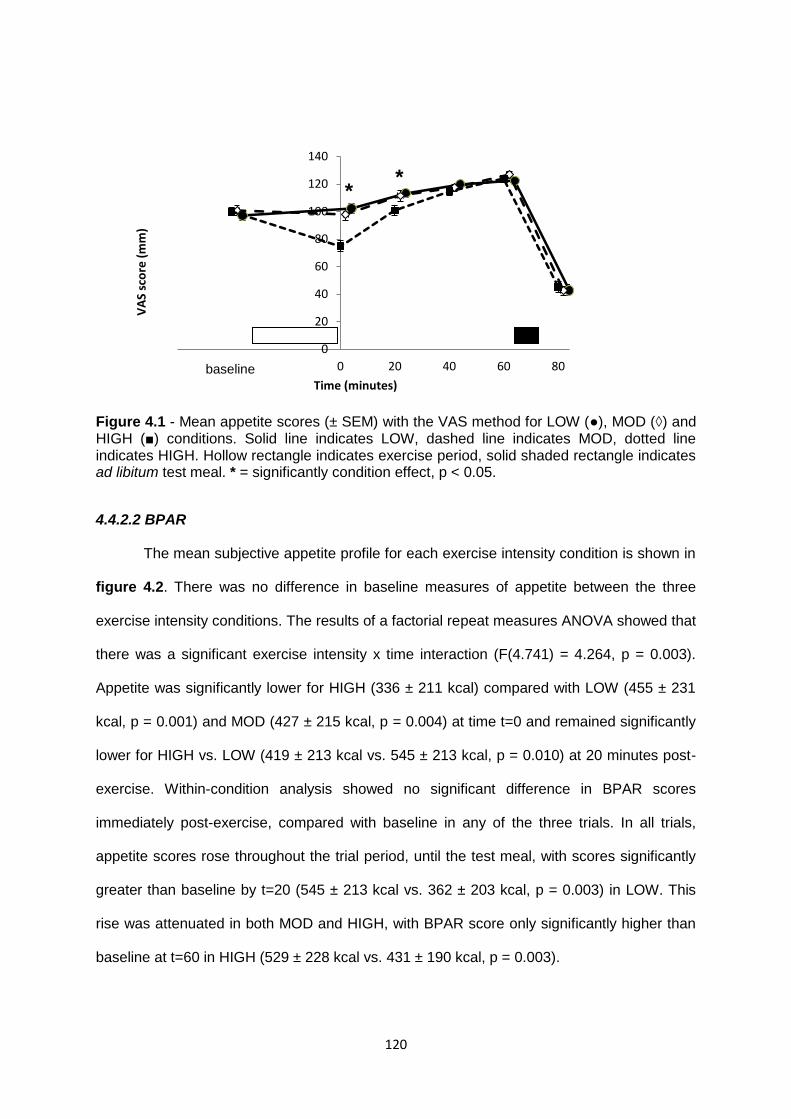
120
Figure 4.1 - Mean appetite scores (± SEM) with the VAS method for LOW (●), MOD (◊) and HIGH (■) conditions. Solid line indicates LOW, dashed line indicates MOD, dotted line indicates HIGH. Hollow rectangle indicates exercise period, solid shaded rectangle indicates ad libitum test meal. * = significantly condition effect, p < 0.05.
4.4.2.2 BPAR
The mean subjective appetite profile for each exercise intensity condition is shown in
figure 4.2. There was no difference in baseline measures of appetite between the three
exercise intensity conditions. The results of a factorial repeat measures ANOVA showed that
there was a significant exercise intensity x time interaction (F(4.741) = 4.264, p = 0.003).
Appetite was significantly lower for HIGH (336 ± 211 kcal) compared with LOW (455 ± 231
kcal, p = 0.001) and MOD (427 ± 215 kcal, p = 0.004) at time t=0 and remained significantly
lower for HIGH vs. LOW (419 ± 213 kcal vs. 545 ± 213 kcal, p = 0.010) at 20 minutes post-
exercise. Within-condition analysis showed no significant difference in BPAR scores
immediately post-exercise, compared with baseline in any of the three trials. In all trials,
appetite scores rose throughout the trial period, until the test meal, with scores significantly
greater than baseline by t=20 (545 ± 213 kcal vs. 362 ± 203 kcal, p = 0.003) in LOW. This
rise was attenuated in both MOD and HIGH, with BPAR score only significantly higher than
baseline at t=60 in HIGH (529 ± 228 kcal vs. 431 ± 190 kcal, p = 0.003).
0
20
40
60
80
100
120
140
-60 -40 -20 0 20 40 60 80
VA
S sc
ore
(m
m)
Time (minutes) baseline
* *
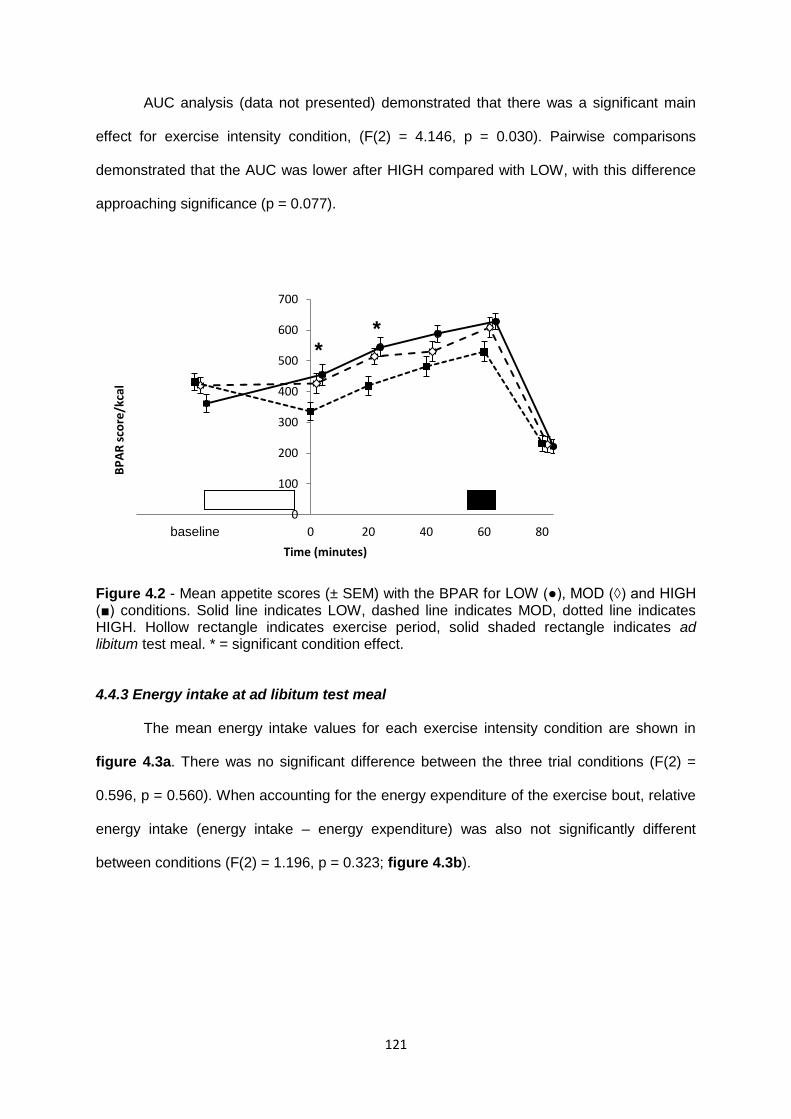
121
AUC analysis (data not presented) demonstrated that there was a significant main
effect for exercise intensity condition, (F(2) = 4.146, p = 0.030). Pairwise comparisons
demonstrated that the AUC was lower after HIGH compared with LOW, with this difference
approaching significance (p = 0.077).
Figure 4.2 - Mean appetite scores (± SEM) with the BPAR for LOW (●), MOD (◊) and HIGH (■) conditions. Solid line indicates LOW, dashed line indicates MOD, dotted line indicates HIGH. Hollow rectangle indicates exercise period, solid shaded rectangle indicates ad libitum test meal. * = significant condition effect.
4.4.3 Energy intake at ad libitum test meal
The mean energy intake values for each exercise intensity condition are shown in
figure 4.3a. There was no significant difference between the three trial conditions (F(2) =
0.596, p = 0.560). When accounting for the energy expenditure of the exercise bout, relative
energy intake (energy intake – energy expenditure) was also not significantly different
between conditions (F(2) = 1.196, p = 0.323; figure 4.3b).
0
100
200
300
400
500
600
700
-60 -40 -20 0 20 40 60 80
BP
AR
sco
re/k
cal
Time (minutes)
*
baseline
*

122
(a)
(b)
Figure 4.3 - Mean energy intake (a) and relative energy intake (b) values (± SEM) for LOW, MOD and HIGH conditions. 4.4.4 Satiety peptide concentration
4.4.4.1 PP
The mean plasma PP concentrations for each exercise trial condition are shown in
figure 4.4. There were no significant differences in PP concentrations at baseline. A factorial
repeated measures ANOVA showed no significant time x condition interaction effect. The
0
100
200
300
400
500
600
700
800
LOW MOD HIGH
Ene
rgy
inta
ke (
kcal
)
Condition
0
50
100
150
200
250
LOW MOD HIGH
Re
lati
vely
en
erg
y in
take
(kc
al)
Condition
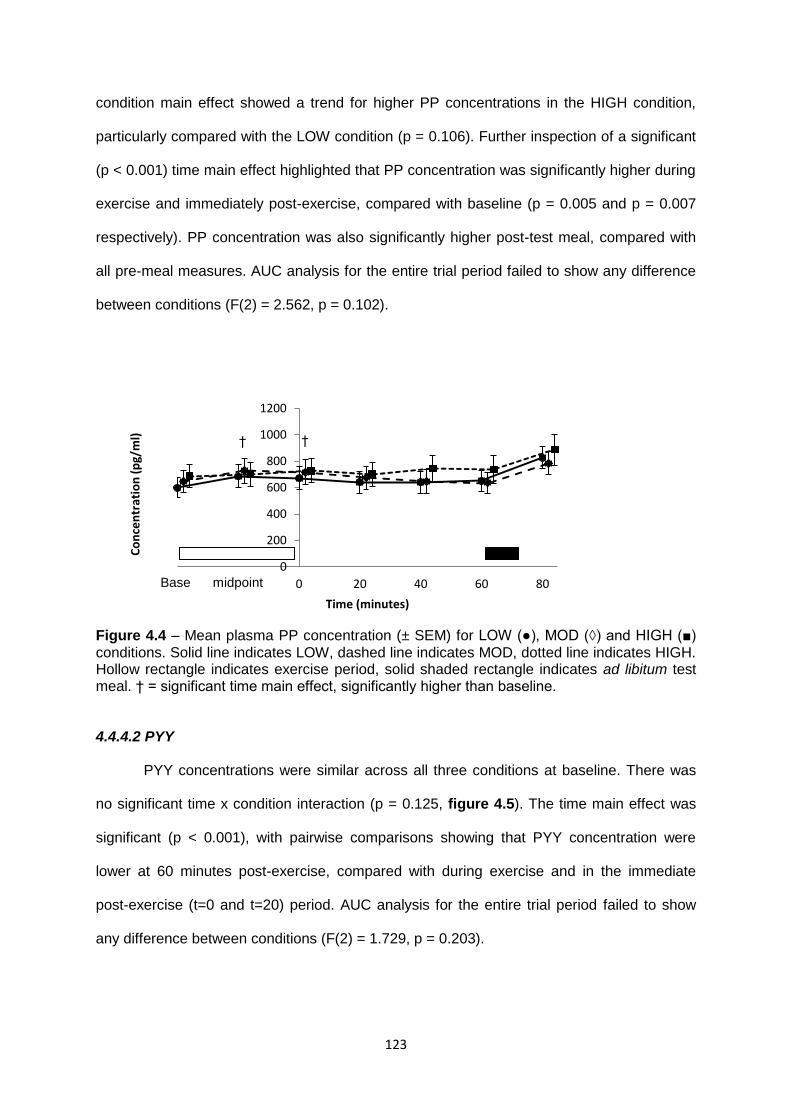
123
condition main effect showed a trend for higher PP concentrations in the HIGH condition,
particularly compared with the LOW condition (p = 0.106). Further inspection of a significant
(p < 0.001) time main effect highlighted that PP concentration was significantly higher during
exercise and immediately post-exercise, compared with baseline (p = 0.005 and p = 0.007
respectively). PP concentration was also significantly higher post-test meal, compared with
all pre-meal measures. AUC analysis for the entire trial period failed to show any difference
between conditions (F(2) = 2.562, p = 0.102).
Figure 4.4 – Mean plasma PP concentration (± SEM) for LOW (●), MOD (◊) and HIGH (■) conditions. Solid line indicates LOW, dashed line indicates MOD, dotted line indicates HIGH. Hollow rectangle indicates exercise period, solid shaded rectangle indicates ad libitum test meal. † = significant time main effect, significantly higher than baseline.
4.4.4.2 PYY
PYY concentrations were similar across all three conditions at baseline. There was
no significant time x condition interaction (p = 0.125, figure 4.5). The time main effect was
significant (p < 0.001), with pairwise comparisons showing that PYY concentration were
lower at 60 minutes post-exercise, compared with during exercise and in the immediate
post-exercise (t=0 and t=20) period. AUC analysis for the entire trial period failed to show
any difference between conditions (F(2) = 1.729, p = 0.203).
0
200
400
600
800
1000
1200
-40 -20 0 20 40 60 80
Co
nce
ntr
atio
n (
pg/
ml)
Time (minutes)
Base midpoint
† †

124
Figure 4.5 – Mean plasma PYY concentration (± SEM) for LOW (●), MOD (◊) and HIGH (■) conditions. Solid line indicates LOW, dashed line indicates MOD, dotted line indicates HIGH. Hollow rectangle indicates exercise period, solid shaded rectangle indicates ad libitum test meal.
4.4.5 Relationship between hormones, subjective appetite and food intake.
4.4.5.1 Between-condition correlations of change in hormone concentration with
exercise and change in appetite with exercise
In order to investigate if a change in hormone concentration from one trial to another
influenced subsequent change in subjective appetite, within-subject, between-condition
correlations were conducted. Change in %Δ PYY concentration was not significantly
associated with change in %Δ VAS score or change in %Δ BPAR score for any trial
condition. For HIGH – MOD differences, the correlation between change in %Δ PYY and
change in %Δ VAS was moderate-strength and showed a trend towards significance (r =
0.479, p = 0.068) Change in %Δ PP was positively correlated with change in %Δ VAS for
differences between MOD and LOW, (r = 0.587, p = 0.029).
20
30
40
50
60
70
80
90
100
110
-40 -20 0 20 40 60 80
PY
Y c
on
cen
trat
ion
(p
g/m
l)
Time (minutes)
Base midpoint

125
4.4.5.2 Between-condition correlations of percentage change in hormone
concentration with percentage change in energy intake, and of percentage change in
appetite score with percentage change in energy intake
In order to investigate if a change in hormone concentration or subjective appetite
from one trial to another influenced subsequent change in energy intake, within-subject,
between-condition correlations were conducted. There was little relationship between
percentage changes in energy intake and percentage changes in either appetite scores or
satiety peptide concentration; for MOD – LOW differences, the relationship between
percentage change in BPAR score and percentage change in energy intake showed a trend
towards significance (r = 0.469, p = 0.073).

126
4.5 DISCUSSION
The primary purpose of this study was to address the effect of exercise intensity on
subjective appetite, food intake and circulating concentrations of appetite-associated
hormones, utilising three aerobic exercise intensity conditions (high, moderate and low
intensity), in highly trained male endurance athletes. Subjective appetite scores were
transiently suppressed with high intensity exercise, compared with exercise at a moderate or
low intensity. VAS scores were 27% lower in the high-intensity condition immediately post-
exercise compared with moderate-intensity exercise and 31% lower than in the low-intensity
condition. While this provides some evidence for the notion of exercise-induced suppression
of appetite, and its occurrence after high-intensity aerobic exercise, no such effect was
observed after a bout of exercise at 60% VO2max, an intensity that has commonly been
shown to suppress appetite in overweight and obese, (Ueda et al., 2009b; Westerterp-
Plantenga et al., 1997), and healthy-weight, non-athletic populations (King et al., 1994;
Martins et al., 2007; Ueda et al., 2009a; Westerterp-Plantenga et al., 1997). It is possible that
individuals accustomed to moderate-high intensity exercise are more resistant to an
exercise-induced suppression of appetite, with a possible threshold for such an effect
(should the phenomenon be purely intensity dependent) increased with exercise training.
Imbeault and co-workers (Imbeault et al., 1997) failed to observe any suppression of
subjective hunger or a decrease in food intake with just 15 minutes of exercise at a high
intensity (72% VO2max) in moderately-trained individuals (VO2max = 56.7 ± 5.0 ml•kg-1•min-1).
While this provides no evidence of a “higher threshold” for exercise-induced appetite
suppression, it does suggest that exercise at an intensity of 60% VO2max is insufficient to
cause a suppression of appetite in moderately-trained athletes.
The observed suppression of appetite with high intensity aerobic exercise was rather
short-lived, with VAS test score returning to baseline levels 20 minutes post-exercise. While
appetite scores remained significantly lower after HIGH, compared with after LOW at the 20
minute post-exercise time point, scores at 40 minutes post-exercise were similar across all
127
conditions. However, AUC analysis for this post-exercise period showed a significant main
effect for condition, with AUC for HIGH significantly lower than AUC for LOW when using
both the VAS and BPAR measures. These results are similar to those of previous
investigations that have demonstrated the transient nature of an exercise-induced
suppression of appetite, even with lower intensities of exercise than in the current study
(Blundell et al., 2003; Broom et al., 2009; Broom et al., 2007; King et al., 1994; Martins et al.,
2007). Broom and colleagues (Broom et al., 2009; Broom et al., 2007) investigated the effect
of aerobic exercise on hunger, food intake and circulating concentrations of acylated ghrelin
in two separate studies. Common to both studies was a suppression of subjective hunger
(measured using the VAS technique) during and immediately after aerobic exercise (60
minutes of treadmill running at 72% VO2max (Broom et al., 2007) and 69% VO2max (Broom et
al., 2009), that was maintained at 30 minutes post-exercise. At 60 minutes post-exercise,
there was no difference in subjective hunger between the exercise condition and a control
condition. In keeping with the current study, although changes in subjective appetite were
short-lived, AUC analysis demonstrated lower hunger scores over more prolonged post-
exercise periods of up to 3 hours.
Unsurprising in light of transient changes in subjective appetite, analysis of the
energy intake values at the test meal demonstrated that intake did not differ significantly
across the exercise intensity conditions. Intake was 11.7% lower after high intensity
exercise, compared with moderate intensity exercise. This equated to an absolute difference
of 78 kcal. It is difficult to speculate about the impact of such an acute effect upon energy
balance (78 kcal shift in favour of deficit) on likely changes in body mass in the long term.
The failure of transient appetite suppression to induce a reduction in post-exercise energy
intake is in agreement with the findings of studies that administered the test meal at a similar
time point post-exercise (60 minutes (King et al., 2010; King et al., 2011b; King et al., 1997b;
Schubert et al., 2013; Thompson et al., 1988)) and contrasts the findings of Kissileff et al.
(Kissileff et al., 1990) who demonstrated a reduced energy intake after strenuous exercise,
but not moderate exercise in non-obese females, when food was presented 15 minutes post-
128
exercise. These findings support the concept of the any exercise-induced suppression of
appetite being a short-lived, transient phenomenon. However, what has yet to be concluded
is whether an even higher exercise load can elicit a greater anorexigenic effect. It is possible
that exercise bouts such as supramaximal exercise that is often undertaken by highly trained
athletes in the form of high-intensity interval training or high-intensity aerobic exercise
sustained for longer periods could lead to perhaps a greater suppression of appetite or a
suppression that lasts longer than that which has been observed with exercise bouts such as
those used in the present study.
To investigate the effect of exercise intensity on satiety peptides, the plasma
concentration of PP and PYY were measured. Plasma PP concentration increased with
exercise, with no difference between exercise intensity conditions. This would suggest that
any PP response to exercise is independent of exercise intensity. However, while the time
main effect showed a significant increase from baseline during and immediately after
exercise, the magnitude of these increases was small (~9%), indicating a muted response.
There is little in the current literature regarding the effect of exercise and exercise intensity
on plasma PP concentration. Martins and colleagues (Martins et al., 2007) showed an
increase in PP during a 60 minute bout of intermittent cycling at ~65% of estimated
maximum heart rate in healthy, normal-weight individuals. The magnitude of the increase
was considerably greater than that found in the current study (~170% vs. ~9%) but was
equally as transient. The large discrepancy in the magnitude of the increase may be due to
the difference in training status of the participants; while the current study population
consisted of highly trained athletes, Martins and colleagues excluded those exhibiting
greater than moderate activity levels.
PYY concentration exhibited a small (~9%), non-significant increase from baseline in
the HIGH trial. It could be said that HIGH appeared to attenuate the gradual fall in PYY
concentration observed with LOW and MOD, to the extent that, at t=20, the PYY
concentration was ~24% higher than LOW and ~30% higher than MOD, in the HIGH
condition. It is possible that some degree of exercise-intensity-dependent PYY response
129
could exist in this population, but that this study lacked the statistical power to observe a
significant difference and it may be that a greater duration of high-intensity exercise, or
exercise of a higher intensity would see a greater response. However, from the current data,
it would appear that PYY was not very responsive to exercise, even exercise of a high
intensity, in this athletic population.
A decline in plasma PYY concentration during and after moderate- and low-intensity
exercise observed in the current study is not a familiar finding. Ueda and colleagues (Ueda
et al., 2009a) observed that moderate intensity exercise (50% VO2max) resulted in a transient
increase in PYY concentration. Other studies have also shown transient increases in PYY
during moderate intensity exercise (Martins et al., 2007; Ueda et al., 2009b) and greater
increases with higher intensity aerobic exercise (Broom et al., 2009; King et al., 2011a; Ueda
et al., 2009a). This data could also suggest some degree of blunting of the exercise-induced
changes in PYY concentration in trained individuals. Previous studies used study
populations of obese individuals (Ueda et al., 2009b), those of low (Ueda et al., 2009b) or
moderate activity levels (Martins et al., 2007; Ueda et al., 2009a) or those described as
being “physically active” (King et al., 2011a). In comparison, the participants in the current
study all completed a minimum of 6 hours of aerobic exercise training per week, resulting in
high fitness levels, as demonstrated by a mean VO2max value of 60.8 ml•kg-1•min-1. It is
possible that habitual exercisers have developed an adaptive response whereby the
exercise-induced increase in satiety peptides is downregulated. This may be a response to
promote post-exercise feeding in order to maintain energy balance and body weight and
hence oppose weight-loss, or it may be an adaptive response in order to restore depleted
fuel stores, such as muscle and liver glycogen, after exercise. Trained individuals experience
reduced physiological and metabolic perturbations during exercise. As redistribution of blood
flow away from the gastrointestinal tract (Blundell et al., 2003; Burns et al., 2007) and
increases in body temperature (Shorten et al., 2009) have been postulated as mediators of
the exercise-induced alterations in hormone concentration (as well as alterations in
130
subjective appetite), a reduction in these responses to exercise in trained athletes may
explain the blunted PP and PYY responses.
Significant elevations in plasma PYY were observed in highly trained runners, after a
10km time trial, preceded by a 90 minute preload (Russel et al., 2009). However, such a
large stimulus still only elicited an 11% increase in PYY concentration, which is in line with
the increase observed in the present study and is a slightly smaller increase than is
commonly seen in non-athletic populations, after smaller exercise stimuli (~15% - (Ueda et
al., 2009b); ~20% - (Martins et al., 2007); ~20% (Broom et al., 2009)) Conversely, the
commencement of regular physical activity by previously sedentary individuals has been
shown to result in an increase in fasting plasma PYY concentrations (Jones et al., 2009;
Roth et al., 2005). However, these studies did not directly compare acute exercise-induced
perturbations in plasma PYY, pre- and post-training.
The influence of within-subject, between-condition changes in satiety peptide
concentration on subjective appetite and food intake were assessed using correlation
analysis. Within-subject comparisons were conducted, as opposed to the more commonly-
used between-subject analysis. It was felt that such an approach was preferable, as within-
subject changes are of greater interest and relevance than between-subject differences,
especially when considering the likely degree of variability in between-subject responses to
exercise. There was no association between within-subject changes in appetite and within-
subject changes in either PP or PYY. Neither was there any relationship between changes in
PP or PYY and energy intake.
These data question the role of the satiety peptides PP and PYY as regulators of
post-exercise subjective appetite. It has recently been shown that PYY concentrations were
strongly, positively correlated with VAS scores for satiety over a 12 hour period after
continuous exercise, but there was no correlation between PYY concentration and
suppressed appetite scores after intermittent exercise (Holmstrup et al., 2013). Further, in a
study assessing changes in appetite-associated hormones with strenuous endurance
running in trained runners, total ghrelin and PYY3-36 concentrations both increased
131
significantly, meaning an increase in both orexigenic and anorexigenic drive (Larson-Meyer,
Palm et al. 2012). No measures of subjective appetite, nor energy intake were obtained, so
the influence of this perplexing dual elevation was not known. The association between
changes in subjective appetite and changes in satiety peptides with exercise requires further
investigation.
It could be argued that the differing duration of exercise is a confounding variable in
this study. However, it was decided to control for energy expenditure. It was felt that this was
important to avoid differences in energy expenditure and short-term energy balance in the
post-exercise period and prior to the test meal, as certain appetite-regulating hormones
many be sensitive to energy status (Black et al., 2005; King et al., 2011a). Therefore, it is not
possible to have exercise bouts of varying intensity but yet be equal in both energy
expenditure and duration. Effort was made to eliminate large variations in inter-subject
durations of exercise within each trial condition by calculating standardised energy
expenditure targets that were individualised for each participant, thus equating to the
exercise durations of 30 minutes, 40 minutes and 60 minutes in the high-, moderate- and
low-intensity conditions respectively. It may be of interest to investigate the effect of exercise
duration on appetite directly by controlling for exercise intensity but varying the duration of
the bout of exercise. Again however, it will be impossible to distinguish between duration and
energy expenditure using such an approach.
A limitation with this study is that the energy expenditure of the three exercise bouts
were poorly controlled and not accurately matched, as intended. The energy expenditure of
the low-intensity bout was significantly greater than that of the moderate- and high-intensity
bouts, by 67 kcal (12%) and 89 kcal (16%) respectively. This error occurred due to an
overestimation of the power output to elicit an intensity of 40% VO2max in the low-intensity
condition. The linear regression equation, calculated from the VO2max test of the pre-testing
session turned out to be inaccurate at lower intensities. This is evidenced by the mean
relative intensities for the low-, moderate- and high-intensity conditions being 47%, 63% and
80% VO2max, as opposed to the targeted 40%, 60% and 80% VO2max. It is felt that the error in
132
relative intensities is unlikely to have impacted upon the study findings, as the intensities
remained significantly different from one another and could still be classified as low-,
moderate- and high-intensities. It is currently thought that any acute post-exercise
suppression of appetite is exercise-intensity dependent, with the duration or energy cost of
exercise not postulated as a regulatory factor. Hence, it would seem unlikely that the energy
expenditure differences of the current study influenced post-exercise subjective appetite
scores. Nonetheless, it was decided to calculate relative energy intake (energy intake –
energy expenditure of exercise), as well as absolute intake. Relative energy intake mirrored
absolute intake, in not being significantly different between conditions.
There are further limitations of this study. As the primary interest was the effect on
appetite parameters of exercise intensity, not exercise per se, it was decided not to include a
control condition. It is accepted that the inclusion of a control group would have been
optimal. However, as the appetite response to rest, in similar situations (overnight fast) has
previously been established within the literature (Erdmann et al., 2007; King et al., 2010;
King et al., 2011b), it was felt that a control condition would add little and compromise other
aspects of the study due to imposing a greater participant time commitment. It was also
decided to use a very simple form of constant composition ad libitum test meal, in the shape
of a cornflakes and milk breakfast meal. Such a homogeneous meal offers no information to
the researcher with regard to food selection and preference and a limited food choice may
have led to under eating. However, as the researchers of this current study were not directly
concerned with energy balance, issues of under eating were not a primary concern and
opted for a test meal that would be representative of a more habitual eating episode of
preparing a single meal consisting of breakfast-type food at that time of day, as opposed to
the less habitual buffet-style ad libitum test meal.
In conclusion, appetite was transiently suppressed with high intensity exercise (~80%
VO2max), compared with low- and moderate-intensity exercise. Although appetite scores were
similar across all conditions at 40 minutes post-exercise, total appetite scores (obtained by
AUC analysis) remained lower for HIGH over the 60min post-exercise period, compared with
133
lower intensity exercise. Post-exercise energy intake was similar across all conditions. There
were no significant changes in PYY plasma concentrations with exercise, while exercise
induced a modest increase in PP concentration. Changes in neither hormone correlated with
changes in subjective appetite or energy intake, which questions the role of PYY and PP in
regulating post-exercise appetite.
134
4.6 REFERENCES
Black, S.E., Mitchell, E., Freedson, P.S., Chipkin, S.R., and Braun, B. (2005). Improved insulin action following short-term exercise training: role of energy and carbohydrate balance. Journal of Applied Physiology 99, 2285-2293. Blundell, J.E., Stubbs, R.J., Hughes, D.A., Whybrow, S., and King, N.A. (2003). Cross talk between physical activity and appetite control: does physical activity stimulate appetite? Proc Nutr Soc 62, 651-661. Borg, G.A.V. (1973). "Perceived exertion: a note on history and methods". Medicine and Science in Sports & Exercise 5, 90-93. Broom, D.R., Batterham, R.L., King, J.A., and Stensel, D.J. (2009). Influence of resistance and aerobic exercise on hunger, circulating levels of acylated ghrelin, and peptide YY in healthy males. American Journal of Physiology-Regulatory Integrative and Comparative Physiology 296, R29-R35. Broom, D.R., Stensel, D.J., Bishop, N.C., Burns, S.F., and Miyashita, M. (2007). Exercise-induced suppression of acylated ghrelin in humans. J Appl Physiol 102, 2165-2171. Burke, L.M. (1997). Nutrition for post-exercise recovery. Australian journal of science and medicine in sport 29, 3-10. Burns, S.F., Broom, D.R., Miyashita, M., Mundy, C., and Stensel, D.J. (2007). A single session of treadmill running has no effect on plasma total ghrelin concentrations. Journal of Sports Sciences 25, 635-642. Erdmann, J., Tahbaz, R., Lippl, F., Wagenpfeil, S., and Schusdziarra, V. (2007). Plasma ghrelin levels during exercise -- Effects of intensity and duration. Regulatory Peptides 143, 127-135. Filaire, E., Rouveix, M., Pannafieux, C., and Ferrand, C. (2007). Eating attitudes, perfectionism and body-esteem of elite male judoists and cyclists. Journal of Sports Science and Medicine 5, 50-57. George, V.A., and Morganstein, A. (2003). Effect of moderate intensity exercise on acute energy intake in normal and overweight females. Appetite 40, 43-46. Hill, A.J., and Blundell, J.E. (1982). Nutrients and behaviour: Research strategies for the investigation of taste characteristics, food preferences, hunger sensations and eating patterns in man. Journal of Psychiatric Research 17, 203-212. Holmstrup, M.E., Fairchild, T.J., Keslacy, S., Weinstock, R.S., and Kanaley, J.A. (2013). Satiety, but not total PYY, is increased with continuous and intermittent exercise. Obesity, n/a-n/a. Imbeault, P., Saint-Pierre, S., Alm?Ras, N., and Tremblay, A. (1997). Acute effects of exercise on energy intake and feeding behaviour. British Journal of Nutrition 77, 511-521. Jones, T.E., Basilio, J.L., Brophy, P.M., McCammon, M.R., and Hickner, R.C. (2009). Long-term exercise training in overweight adolescents improves plasma peptide YY and resistin. Obesity 17, 1189-1195.
135
Jurimae, J., Hofmann, P., Jurimae, T., Maestu, J., Purge, P., Wonisch, M., Pokan, R., and von Duvillard, S.P. (2006). Plasma adiponectin response to sculling exercise at individual anaerobic threshold in college level male rowers. Int J Sports Med 27, 272-277. Jurimae, J., and Jurimae, T. (2005). Leptin responses to short term exercise in college level male rowers. Br J Sports Med 39, 6-9. Jurimae, J., Jurimae, T., and Purge, P. (2007). Plasma ghrelin is altered after maximal exercise in elite male rowers. Experimental Biology and Medicine 232, 904-909. Jürimäe, J., Mäestu, J., and Jürimäe, T. (2003). Leptin as a marker of training stress in highly trained male rowers? Eur J Appl Physiol 90, 533-538. Jurimae, J., Ramson, R., Maestu, J., Purge, P., Jurimae, T., Arciero, P.J., and Von Duvilard, S.P. (2009). Plasma visfatin and ghrelin response to prolonged sculling in competitive male rowers. Medicine & Science in Sports & Exercise 41, 137-143 110.1249/MSS.1240b1013e31818313e31818316. Kawano, H., Mineta, M., Asaka, M., Miyashita, M., Numao, S., Gando, Y., Ando, T., Sakamoto, S., and Higuchi, M. (2013). Effects of different modes of exercise on appetite and appetite-regulating hormones. Appetite 66, 26-33. King, J.A., Miyashita, M., Wasse, L.K., and Stensel, D.J. (2010). Influence of prolonged treadmill running on appetite, energy intake and circulating concentrations of acylated ghrelin. Appetite 54, 492-498. King, J.A., Wasse, L.K., Ewens, J., Crystallis, K., Emmanuel, J., Batterham, R.L., and Stensel, D.J. (2011a). Differential acylated ghrelin, peptide YY3-36, appetite, and food intake responses to equivalent energy deficits created by exercise and food restriction. Journal of Clinical Endocrinology & Metabolism 96, 1114-1121. King, J.A., Wasse, L.K., and Stensel, D.J. (2011b). The acute effects of swimming on appetite, food intake, and plasma acylated ghrelin. Journal of Obesity 2011. King, N.A., Burley, V.J., and Blundell, J.E. (1994). Exercise induced suppression of appetite: effects on food intake and implications for energ balance. European Journal of Clinical Nutrition 48, 715-724 King, N.A., Lluch, A., Stubbs, R.J., and Blundell, J.E. (1997a). High dose exercise does not increase hunger or energy intake in free living males. Eur J Clin Nutr 51, 478-483. King, N.A., Snell, L., Smith, R.D., and Blundell, J.E. (1996). Effects of short-term exercise on appetite responses in unrestrained females. European Journal of Clinical Nutrition 50, 663-667. King, N.A., Tremblay, A., and Blundell, J.E. (1997b). Effects of exercise on appetite control: implications for energy balance. Medicine & Science in Sports & Exercise 29, 1076-1089. Kissileff, H.R., Pi-Sunyer, F.X., Segal, K., Meltzer, S., and Foelsch, P.A. (1990). Acute effects of exercise on food intake in obese and nonobese women. American Journal of Clinical Nutrition 52, 240-245. Lluch, A., King, N.A., and Blundell, J.E. (2000). No energy compensation at the meal following exercise indietary restrained and unrestrained women. British Journal of Nutrition 84, 219-225.
136
Martins, C., Morgan, L.M., Bloom, S.R., and Robertson, M.D. (2007). Effects of exercise on gut peptides, energy intake and appetite. J Endocrinol 193, 251-258. O'Connor, A.M., Johnston, C.F., Buchanan, K.D., Boreham, C., Trinick, T.R., and Riddoch, C.J. (1995). Circulating gastrointestinal hormone changes in marathon running. Int J Sports Med 16, 283-287. O'Connor, A.M., Pola, S., Ward, B.M., Fillmore, D., Buchanan, K.D., and Kirwan, J.P. (2006). The gastroenteroinsular response to glucose ingestion during postexercise recovery. Am J Physiol Endocrinol Metab 290, E1155-1161. Pomerleau, M., Imbeault, P., Parker, T., and Doucet, E. (2004). Effects of exercise intensity on food intake and appetite in women. Am J Clin Nutr 80, 1230-1236. Reid, C.H., CG. Blundell, JE. Stubbs, RJ (1998). What are psychometric assessments of appetite asking: a preliminary multivariate analysis. International Journal of Obesity 22, 151. Roth, C.L., Enriori, P.J., Harz, K., Woelfle, J., Cowley, M.A., and Reinehr, T. (2005). Peptide YY is a regulator of energy homeostasis in obese children before and after weight loss. J Clin Endocrinol Metab 90, 6386-6391. Russel, R.R., Willis, K.S., Ravussin, E., and Larson-Meyer, E.D. (2009). Effects of endurance running and dietary fat on circulating ghrelin and peptide YY. Journal of sports science & medicine 8, 574-583. Schubert, M.M., Desbrow, B., Sabapathy, S., and Leveritt, M. (2013). Acute exercise and subsequent energy intake. A meta-analysis. Appetite 63, 92-104. Shorten, A.L., Wallman, K.E., and Guelfi, K.J. (2009). Acute effect of environmental temperature during exercise on subsequent energy intake in active men. The American Journal of Clinical Nutrition 90, 1215-1221. Stubbs, R.J., Hughes, D.A., Johnstone, A.M., Rowley, E., Reid, C., Elia, M., Stratton, R., Delargy, H., King, N., and Blundell, J.E. (2000). The use of visual analogue scales to assess motivation to eat in human subjects: a review of their reliability and validity with an evaluation of new hand-held computerized systems for temporal tracking of appetite ratings. Br J Nutr 84, 405-415. Thompson, D.A., Wolfe, L.A., and Eikelboom, R. (1988). Acute effects of exercise intensity on appetite in young men. Medicine & Science in Sports & Exercise 20, 222-227. Ueda, S.-y., Yoshikawa, T., Katsura, Y., Usui, T., and Fujimoto, S. (2009a). Comparable effects of moderate intensity exercise on changes in anorectic gut hormone levels and energy intake to high intensity exercise. J Endocrinol 203, 357-364. Ueda, S.-y., Yoshikawa, T., Katsura, Y., Usui, T., Nakao, H., and Fujimoto, S. (2009b). Changes in gut hormone levels and negative energy balance during aerobic exercise in obese young males. J Endocrinol, JOE-08-0500. Venter, C.S., MacIntyre, U.E., and Vorster, H.H. (2000). The development and testing of a food portion photograph book for use in an African population. Journal of Human Nutrition and Dietetics 13, 205-218.

137
Weber, J.L., Cunningham-Sabo, L., Skipper, B., Lytle, L., Stevens, J., Gittelsohn, J., Anliker, J., Heller, K., and Pablo, J.L. (1999). Portion-size estimation training in second- and third-grade American Indian children. The American Journal of Clinical Nutrition 69, 782S-787S.
Westerterp-Plantenga, M.S., Verwegen, C.R., Ijedema, M.J., Wijckmans, N.E., and Saris, W.H. (1997). Acute effects of exercise or sauna on appetite in obese and nonobese men. Physiology & Behavior 62, 1345-1354.
138
CHAPTER 5
The effect of exercise duration on appetite, food intake and
appetite-associated hormones.
139
5.1 ABSTRACT
Background: The importance of the intensity of exercise for appetite responses post-
exercise is well established, with an intensity of ≥60% VO2max commonly observed to elicit a
transient suppression of appetite. What is much less clear, is the role of the duration of
exercise in regulating responses in subjective appetite and plasma concentrations of
appetite-associated hormones to exercise.
Purpose: To investigate the effect of high-intensity aerobic exercise of differing durations on
subjective appetite, food intake and appetite-associated hormones in highly-trained male
endurance athletes.
Method: Twelve highly-trained (≥6 hours of training per week) male endurance runners,
cyclists and triathletes (age = 21 ± 2 years; BMI = 21.0 ± 1.6 kg•m-2; VO2max = 61.6 ± 6.0
ml•min-1•kg-1) completed four trials in a counterbalance, within-subject study design: resting
(REST); 15 minutes exercise bout (15 min); 30 minute exercise bout (30 min) and 45 minute
exercise bout (45 min). All exercise was completed on a cycle ergometer and at an intensity
of ~80% VO2max (76 ± 8%, 77 ± 8% and 76 ± 8% for 15 min, 30 min and 45 min
respectively). Upon cessation of exercise, a 60 minute resting period followed, with
measures of appetite and blood samples obtained every 20 minutes. After 60 minutes,
participants consumed an ad libitum breakfast meal, with food intake covertly recorded.
Appetite measures and blood samples were obtained throughout the trial, with plasma
analysed for acylated ghrelin, polypeptide YY (PYY) and glucagon-like peptide 1 (GLP-1)
concentrations.
Results: A composite VAS score for appetite did not differ between trial conditions, or with
time. Food intake at the breakfast meal also did not differ between conditions. When
considering the energy expenditure of exercise, relative energy intake (intake – expenditure)
was significantly lower after 30 min and 45 min, compared with REST. Relative energy
intake was also lower for 45 min, compared with 15 min. GLP-1 concentration was increased
with exercise in 30 min and 45 min, with concentration remaining elevated during the post-
140
exercise period. Acylated ghrelin was transiently suppressed with exercise in all three
exercise trials, with the greatest suppression observed in 45 min. PYY concentration did not
change with exercise and did not differ between conditions. However, correlation analysis
failed to show strong relationships between changes in hormone concentration and either
changes in subjective appetite or changes in ad libitum energy intake.
Conclusion: High intensity aerobic exercise did not elicit a suppression of subjective
appetite, irrespective of the duration of exercise. Consequently, absolute energy intake was
largely unaffected by exercise. This was despite changes in acylated ghrelin and GLP-1
towards a more anorexigenic state. This would suggest a dissociation between hormonal
signals of appetite and subjective appetite in the post-exercise period. Both acylated ghrelin
and GLP-1 appeared to exhibit some degree of dose response to increasing exercise
duration.
141
5.2 INTRODUCTION
High-intensity aerobic exercise commonly elicits a transient suppression of appetite
in lean, recreationally active individuals (Broom et al., 2009; Broom et al., 2007; Burns et al.,
2007; Kawano et al., 2013; King et al., 2010; Martins et al., 2007; Ueda et al., 2009a; Ueda
et al., 2009b). Typically, this phenomenon, termed the “anorexia of exercise,” (King et al.,
1994) is observed with exercise of an intensity ≥60% VO2max. This response in subjective
appetite is often coupled with anorexigenic changes in appetite-associated hormones.
Plasma concentrations of the acylated form of the orexigenic hormone ghrelin have been
shown to decrease with exercise (Broom et al., 2009; Broom et al., 2007; King et al., 2010;
King et al., 2011a; Marzullo et al., 2008; Shiiya et al., 2011), while concentrations of the
satiety peptides peptide YY (PYY) and glucagon-like peptide 1 (GLP-1) have been shown to
increase (Broom et al., 2009; King et al., 2011a; Larson-Meyer et al., 2012; Martins et al.,
2007; Russel et al., 2009; Ueda et al., 2009a; Ueda et al., 2009b). However, the ghrelin
response to exercise is somewhat equivocal, because no change (Burns et al., 2007;
Kraemer et al., 2004; Martins et al., 2007; Schmidt et al., 2004) and even increases in
ghrelin post-exercise have been observed (Larson-Meyer et al., 2012; Russel et al., 2009),
with differences likely due to the form of ghrelin measured.
While the intensity dependency of post-exercise appetite suppression appears well
established, the existence of a dependency with regard to duration of exercise or energy
expenditure of the bout of exercise has yet to be comprehensively investigated.
Suppressions in appetite, accompanied by increases in the satiety peptides PYY and GLP-1
have been observed with continuous, high-intensity aerobic bouts lasting as little as 30
minutes (Ueda et al., 2009a), and with intermittent exercise bouts yielding energy
expenditure values of as little as 142 kcal (Deighton et al., 2012). Conversely, bouts of very
low energy cost have elicited increases in subjective appetite (Bellissimo et al., 2007), or
failed to influence appetite, despite a response in plasma concentration of the hunger
hormone ghrelin (Erdmann et al., 2007). However in this instance, ghrelin was seen to

142
increase during exercise; a change in the opposite direction to that which is more usually
observed with higher intensity exercise. Furthermore, the role of the duration of an exercise
bout on plasma concentrations has not been directly assessed. It remains unknown whether
any of the appetite-associated hormones are released in a dose-response manner to
exercise duration or energy cost, or whether there is a duration or energy cost threshold for
a hormonal response.
The transient nature of both a suppression of subjective appetite and changes in
plasma hormone concentration means that food intake can be reduced when administered in
close proximity to the cessation of exercise (~10 minutes (Westerterp-Plantenga et al.,
1997); ~15 minutes (Kissileff et al., 1990); ~30 minutes (Ueda et al., 2009a); ~60 minutes
(Ueda et al., 2009b), but is largely unaffected when a meal is consumed ≥60 minutes after
exercise (King et al., 2010; King et al., 2011b; King et al., 1997; Martins et al., 2007;
Schubert et al., 2013; Thompson et al., 1988). Although, exercise bouts that yield a
considerable energy cost can elicit a decrease in relative energy intake (energy intake –
energy expenditure) compared with non-exercise control conditions (Imbeault et al., 1997;
King et al., 2010; Lluch et al., 2000; Martins et al., 2007). Due to the commonly used study
population of recreationally active individuals, large exercise loads of both a high intensity
and long duration have rarely been utilised. It may be possible that a larger exercise stimulus
could lead to a greater, sustained appetite suppression that could impact upon food intake.
Highly trained athletes regularly complete very strenuous, high energy cost bouts of
exercise. After completing these sessions, post-exercise nutrition is often considered of
crucial importance to optimise recovery and maximise adaptations to training (Burke, 1997).
In addition, many endurance athletes value weight management highly (Filaire et al., 2007),
as an increase in body weight can result in an increase in the energy cost of performing.
Therefore, the appetite response to exercise could be doubly important for athletes.
Nevertheless, there is a dearth of literature regarding the effect of exercise on appetite and
food intake in athletic populations. Of the few investigations that have addressed the effect
of exercise on any appetite-related measures in athletic populations, the focus has been
143
primarily on hormone measures and no measures of subjective appetite or food intake have
been obtained (Jurimae et al., 2006; Jurimae and Jurimae, 2005; Jurimae et al., 2007;
Jürimäe et al., 2003; Jurimae et al., 2009; O'Connor et al., 1995; O'Connor et al., 2006).
These studies have shown both increases (Jurimae et al., 2006; O'Connor et al., 2006) and
decreases (Jurimae and Jurimae, 2005; Jürimäe et al., 2003) in anorexigenic gut hormones
with strenuous exercise, while increases in the orexigenic hormone ghrelin have also been
reported (Jurimae et al., 2007; Jurimae et al., 2009). These data suggest that it may be
possible that highly-trained athletes respond differently to exercise than non-athletic
populations, with regard to changes in appetite-associated hormones. It has yet to be
investigated whether this translates to altered appetite and food intake responses.
The purpose of the current study was to address the effect of exercise duration on
subjective appetite, food intake and circulating concentrations of acylated ghrelin, PYY and
GLP-1 in highly trained endurance athletes, utilising high-intensity exercise bouts lasting 15,
30 and 45 minutes. It was hypothesised that a transient exercise-induced suppression of
appetite would be observed after all exercise durations, but in a dose response fashion, with
greater, longer lasting suppression evident after greater duration bouts. It is surmised that
due to a large exercise load, this may lead to a lower post-exercise energy intake in the 45
minute condition.
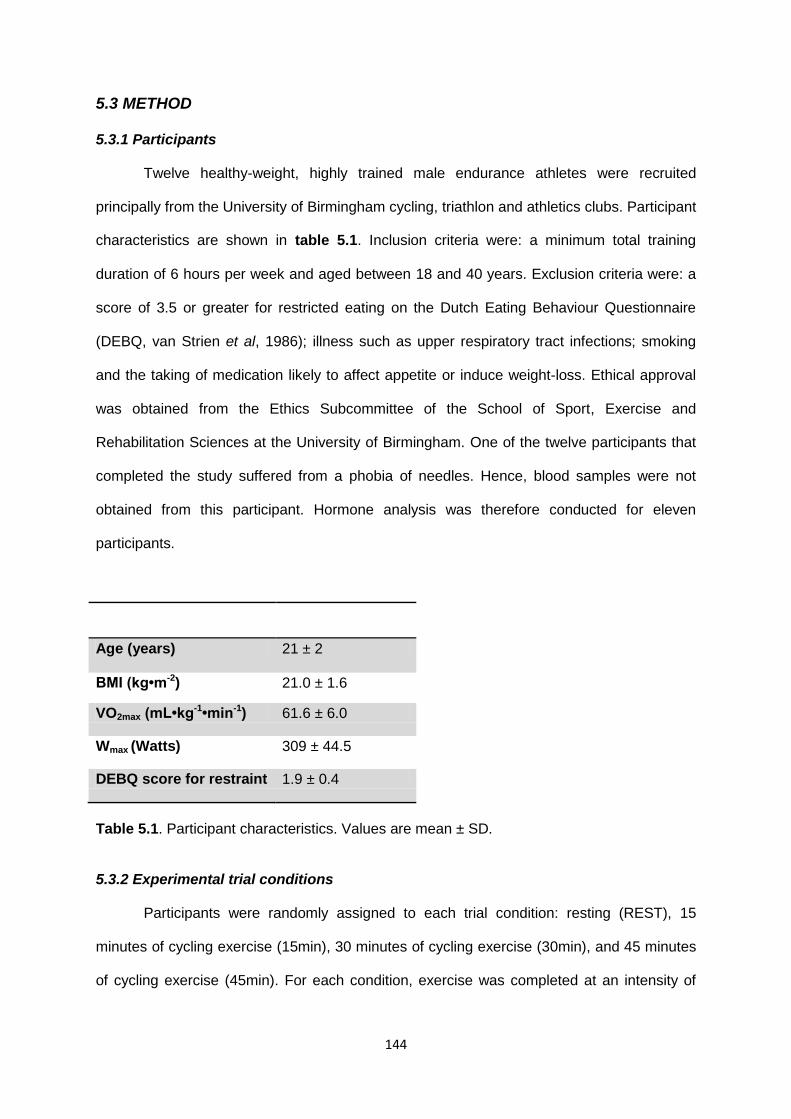
144
5.3 METHOD
5.3.1 Participants
Twelve healthy-weight, highly trained male endurance athletes were recruited
principally from the University of Birmingham cycling, triathlon and athletics clubs. Participant
characteristics are shown in table 5.1. Inclusion criteria were: a minimum total training
duration of 6 hours per week and aged between 18 and 40 years. Exclusion criteria were: a
score of 3.5 or greater for restricted eating on the Dutch Eating Behaviour Questionnaire
(DEBQ, van Strien et al, 1986); illness such as upper respiratory tract infections; smoking
and the taking of medication likely to affect appetite or induce weight-loss. Ethical approval
was obtained from the Ethics Subcommittee of the School of Sport, Exercise and
Rehabilitation Sciences at the University of Birmingham. One of the twelve participants that
completed the study suffered from a phobia of needles. Hence, blood samples were not
obtained from this participant. Hormone analysis was therefore conducted for eleven
participants.
Age (years) 21 ± 2
BMI (kg•m-2) 21.0 ± 1.6
VO2max (mL•kg-1•min-1) 61.6 ± 6.0
Wmax (Watts) 309 ± 44.5
DEBQ score for restraint 1.9 ± 0.4
Table 5.1. Participant characteristics. Values are mean ± SD.
5.3.2 Experimental trial conditions
Participants were randomly assigned to each trial condition: resting (REST), 15
minutes of cycling exercise (15min), 30 minutes of cycling exercise (30min), and 45 minutes
of cycling exercise (45min). For each condition, exercise was completed at an intensity of
145
80% VO2max. Subjective appetite measures and measures of circulating concentrations of
acylated ghrelin, PYY and GLP-1 were obtained throughout.
5.3.3 Procedure & protocol
Participants arrived at the laboratory at approximately 08:00, after a minimum 10-
hour overnight fast. On arriving, participants were weighed (weight was recorded at each
visit to ensure participants were weight-stable throughout) and a resting blood sample was
obtained following the insertion of a venous cannula into the antecubital vein of the arm by a
qualified member of staff. Pre-exercise tests of subjective appetite were then completed,
before the exercise bout commenced. This consisted of a bout of exercise on an
electromagnetically braked cycle ergometer (Lode Excalibur Sport, Groningen, Netherlands)
at an intensity of 80% VO2max, lasting a duration of 15, 30 or 45 minutes. During each
exercise bout, exhaled gas samples were obtained intermittently to monitor VO2 and to
retrospectively calculate energy expenditure. This also allowed the ergometer resistance to
be adjusted to maintain the correct VO2 output. A blood sample was obtained at the half way
point of the exercise trial. At 5 minute intervals throughout the exercise bout, measures of
heart rate and perceived exertion were obtained. These values were averaged for the entire
bout. Upon reaching the exercise duration target, the exercise ceased. A blood sample was
obtained and measures of subjective appetite were completed immediately. The resting
period then commenced, with the participant sat reading or watching television, for a
duration of 60 minutes, allowing for subsequent repetitions of the subjective appetite
measures and repeated blood sampling at; 20, 40, 60 minutes post-exercise. In the resting
condition, the participant remained rested throughout, resting for an additional 30 minutes to
equate to the period of time spent exercising. At 60 minutes post-exercise, the participant
consumed an ad libitum intake breakfast test meal, as described in General methods,
section 2.2.3.2 (p73).
5.3.4 Blood sampling and analysis
The blood sampling and plasma analysis techniques are described in General
methods, section 2.2.3.5 (p76). Briefly, blood samples were obtained and immediately
146
transferred to the appropriate pre-treated blood collection tubes for analysis of hormones.
Blood was centrifuged at 3500 RPM and a temperature of 4˚C for 15 minutes to isolate
plasma. Plasma was stored at a temperature of -70˚C until hormone assays for acylated
ghrelin, PYY and GLP-1 were conducted.
5.3.5 Statistical analysis
For the determination of differences in energy intake from the test meal between
each exercise condition, a one-way analysis of variance (ANOVA) with repeated measures
was carried out. To compare differences in both subjective appetite and plasma
concentration of appetite-associated hormones with time and between trial conditions, a 2-
way factorial ANOVA with repeated measures was conducted. Post-hoc pairwise
comparisons were conducted using the Bonferroni correction for multiple comparisons. In
the event of a significant difference between conditions at baseline in any outcome measure,
percentage change from baseline (%Δ) was calculated and analysis repeated with these
calculated values. Area under the curve (AUC) was calculated for all profiles plotted, using
the trapezoidal method. AUC values were then compared using a one-way ANOVA with
repeated measures.
To further investigate any possible exercise duration dose-response on acylated
ghrelin, PYY or GLP-1, percentage changes in hormone concentration from baseline (%Δ)
were correlated with time spent exercising. This was performed using the measures
obtained across all three excise trials, at t=7.5 (midpoint for 15min), t=15 (midpoint for 30min
and endpoint of 15min), t=22.5 (midpoint of 45min), t=30 (endpoint of 30min) and t=45
(endpoint 45min). Correlation analysis was conducted using Pearson product moment
correlation.
To further investigate the relationship between changes in appetite hormones and
changes in subjective appetite with exercise, correlation analysis was conducted for within-
subject, between-condition comparisons. Change from REST trial values were calculated for
each of the three exercise conditions (15 min – REST; 30 min – REST; 45 min – REST) for
percent change from baseline score (%Δ, calculated from value at baseline to value at t = 0)
147
in acylated ghrelin, PYY and GLP-1, with these values correlated with corresponding values
for VAS and VIMEC. Between-condition percentage change from REST was calculated for
hormone measures and appetite measures obtained immediately prior to the test meal and
these values were correlated with between-condition percentage change in energy intake at
the ad libitum test meal. Correlation coefficients were calculated using Pearson product
moment correlation analysis.
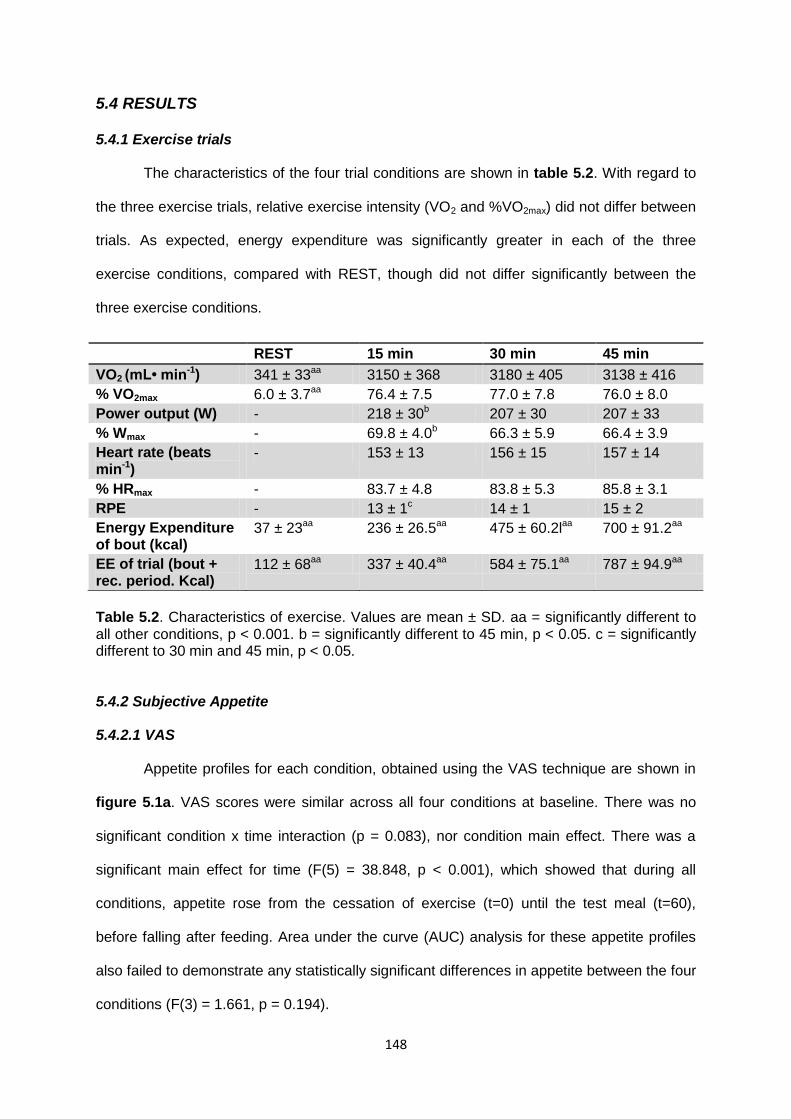
148
5.4 RESULTS
5.4.1 Exercise trials
The characteristics of the four trial conditions are shown in table 5.2. With regard to
the three exercise trials, relative exercise intensity (VO2 and %VO2max) did not differ between
trials. As expected, energy expenditure was significantly greater in each of the three
exercise conditions, compared with REST, though did not differ significantly between the
three exercise conditions.
Table 5.2. Characteristics of exercise. Values are mean ± SD. aa = significantly different to all other conditions, p < 0.001. b = significantly different to 45 min, p < 0.05. c = significantly different to 30 min and 45 min, p < 0.05.
5.4.2 Subjective Appetite
5.4.2.1 VAS
Appetite profiles for each condition, obtained using the VAS technique are shown in
figure 5.1a. VAS scores were similar across all four conditions at baseline. There was no
significant condition x time interaction (p = 0.083), nor condition main effect. There was a
significant main effect for time (F(5) = 38.848, p < 0.001), which showed that during all
conditions, appetite rose from the cessation of exercise (t=0) until the test meal (t=60),
before falling after feeding. Area under the curve (AUC) analysis for these appetite profiles
also failed to demonstrate any statistically significant differences in appetite between the four
conditions (F(3) = 1.661, p = 0.194).
REST 15 min 30 min 45 min
VO2 (mL• min-1) 341 ± 33aa 3150 ± 368 3180 ± 405 3138 ± 416
% VO2max 6.0 ± 3.7aa 76.4 ± 7.5 77.0 ± 7.8 76.0 ± 8.0
Power output (W) - 218 ± 30b 207 ± 30 207 ± 33
% Wmax - 69.8 ± 4.0b 66.3 ± 5.9 66.4 ± 3.9
Heart rate (beats min-1)
- 153 ± 13 156 ± 15 157 ± 14
% HRmax - 83.7 ± 4.8 83.8 ± 5.3 85.8 ± 3.1
RPE - 13 ± 1c 14 ± 1 15 ± 2
Energy Expenditure of bout (kcal)
37 ± 23aa 236 ± 26.5aa 475 ± 60.2laa 700 ± 91.2aa
EE of trial (bout + rec. period. Kcal)
112 ± 68aa 337 ± 40.4aa 584 ± 75.1aa 787 ± 94.9aa
149
5.4.2.2 VIMEC
Appetite profiles for each condition, obtained using the VIMEC are shown in figure
5.1b. There were no significant differences in VIMEC scores across the four conditions at
baseline. There was no significant condition x time interaction (F(3.592) = 2.257, p = 0.086),
nor condition main effect. There was a significant main effect for time (F(1.524) = 10.572, p =
0.002). Appetite scores rose from the cessation of exercise (t=0) until the test meal (t=60)
and fell after feeding. AUC analysis for these appetite profiles also failed to demonstrate any
statistically significant differences in appetite between the four conditions (F(3) = 0.883, p =
0.416).
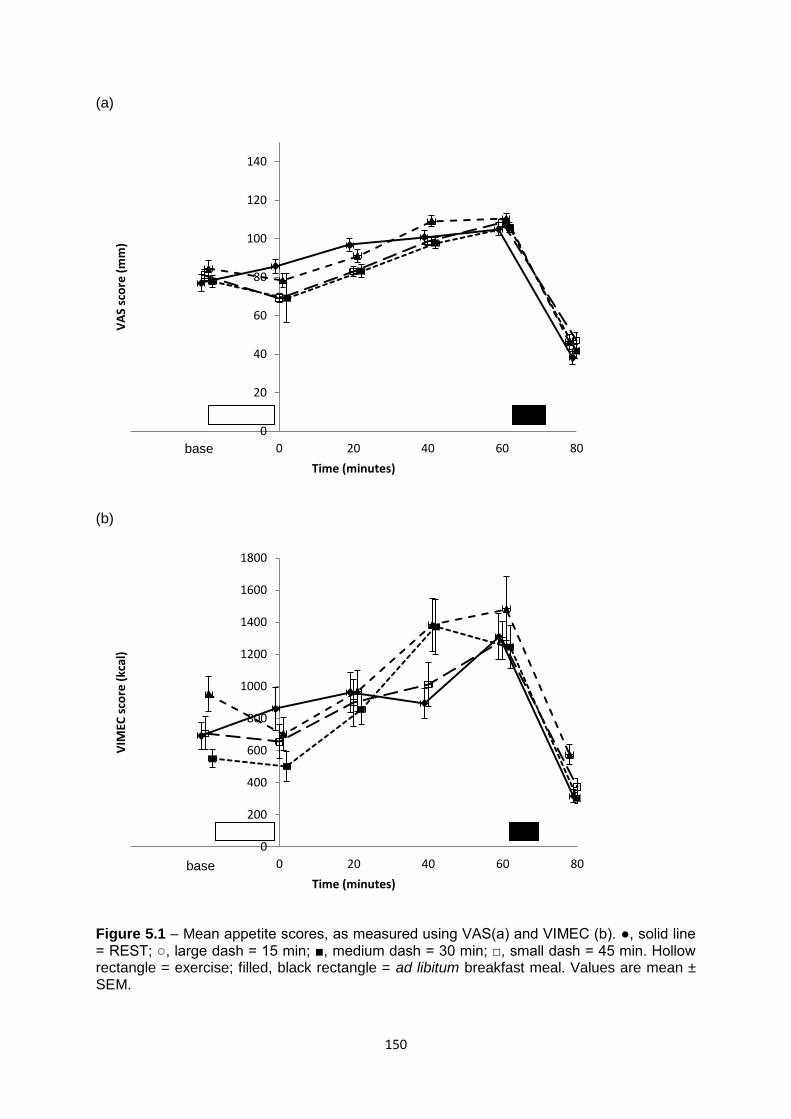
150
(a)
(b)
Figure 5.1 – Mean appetite scores, as measured using VAS(a) and VIMEC (b). ●, solid line = REST; ○, large dash = 15 min; ■, medium dash = 30 min; □, small dash = 45 min. Hollow rectangle = exercise; filled, black rectangle = ad libitum breakfast meal. Values are mean ± SEM.
0
20
40
60
80
100
120
140
-40 -20 0 20 40 60 80
VA
S sc
ore
(m
m)
Time (minutes)
0
200
400
600
800
1000
1200
1400
1600
1800
-40 -20 0 20 40 60 80
VIM
EC s
core
(kc
al)
Time (minutes)
base
base
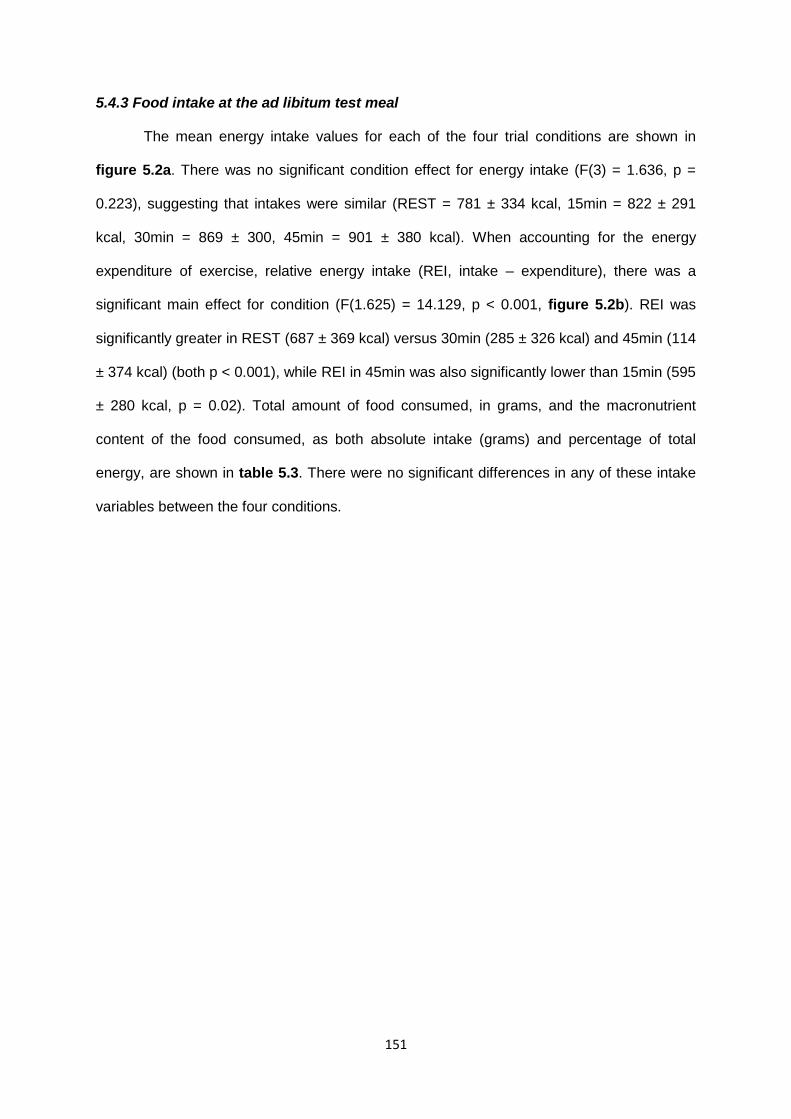
151
5.4.3 Food intake at the ad libitum test meal
The mean energy intake values for each of the four trial conditions are shown in
figure 5.2a. There was no significant condition effect for energy intake (F(3) = 1.636, p =
0.223), suggesting that intakes were similar (REST = 781 ± 334 kcal, 15min = 822 ± 291
kcal, 30min = 869 ± 300, 45min = 901 ± 380 kcal). When accounting for the energy
expenditure of exercise, relative energy intake (REI, intake – expenditure), there was a
significant main effect for condition (F(1.625) = 14.129, p < 0.001, figure 5.2b). REI was
significantly greater in REST (687 ± 369 kcal) versus 30min (285 ± 326 kcal) and 45min (114
± 374 kcal) (both p < 0.001), while REI in 45min was also significantly lower than 15min (595
± 280 kcal, p = 0.02). Total amount of food consumed, in grams, and the macronutrient
content of the food consumed, as both absolute intake (grams) and percentage of total
energy, are shown in table 5.3. There were no significant differences in any of these intake
variables between the four conditions.
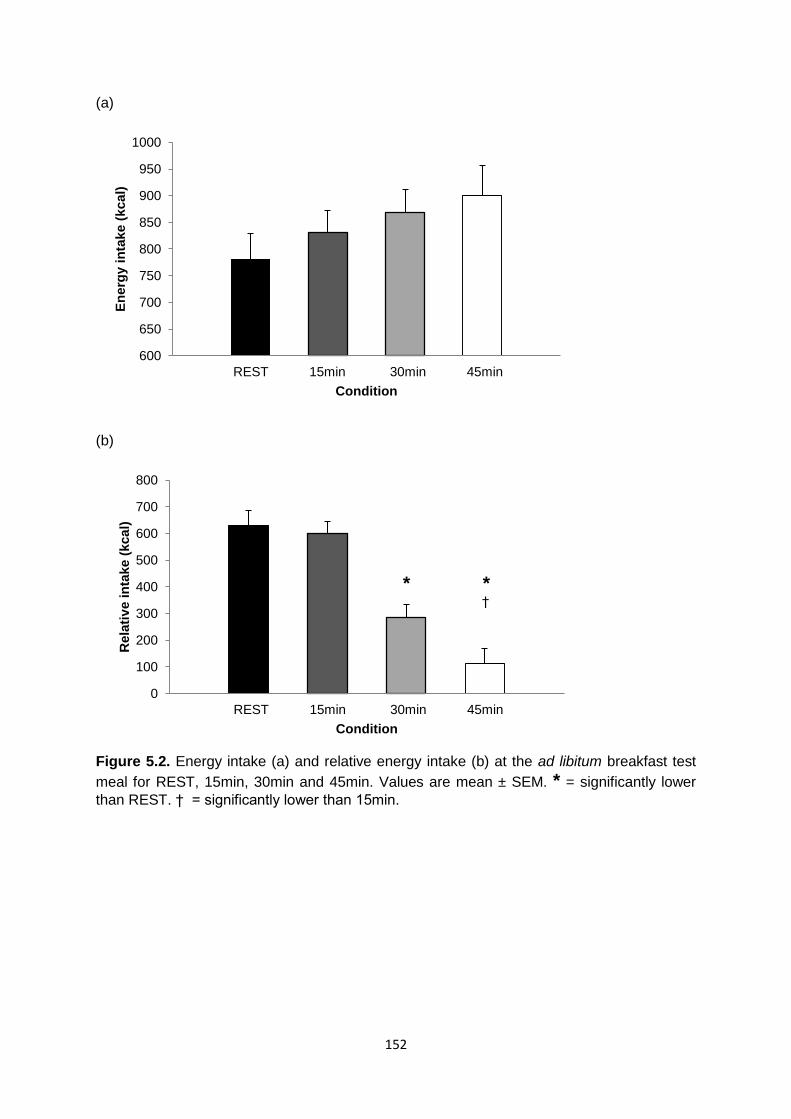
152
(a)
(b)
Figure 5.2. Energy intake (a) and relative energy intake (b) at the ad libitum breakfast test
meal for REST, 15min, 30min and 45min. Values are mean ± SEM. * = significantly lower
than REST. † = significantly lower than 15min.
600
650
700
750
800
850
900
950
1000
REST 15min 30min 45min
En
erg
y i
nta
ke (
kcal)
Condition
0
100
200
300
400
500
600
700
800
REST 15min 30min 45min
Rela
tiv
e in
take (
kcal)
Condition
* * †
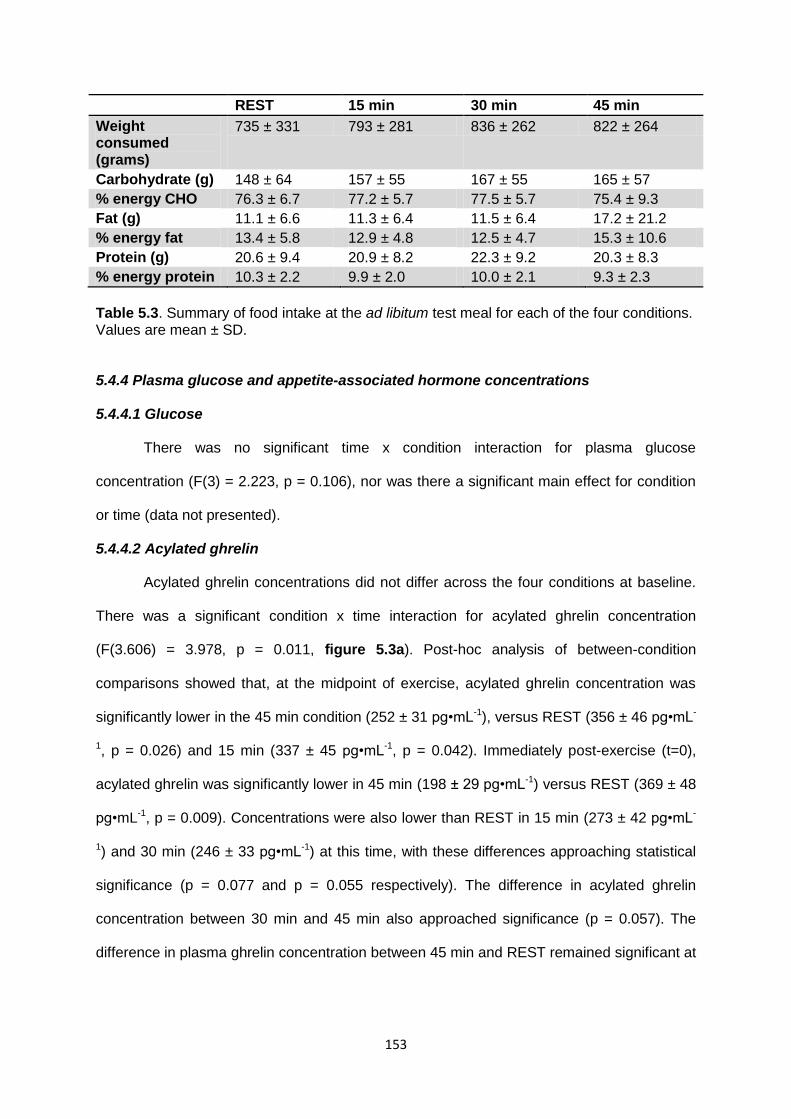
153
REST 15 min 30 min 45 min
Weight consumed (grams)
735 ± 331 793 ± 281 836 ± 262 822 ± 264
Carbohydrate (g) 148 ± 64 157 ± 55 167 ± 55 165 ± 57
% energy CHO 76.3 ± 6.7 77.2 ± 5.7 77.5 ± 5.7 75.4 ± 9.3
Fat (g) 11.1 ± 6.6 11.3 ± 6.4 11.5 ± 6.4 17.2 ± 21.2
% energy fat 13.4 ± 5.8 12.9 ± 4.8 12.5 ± 4.7 15.3 ± 10.6
Protein (g) 20.6 ± 9.4 20.9 ± 8.2 22.3 ± 9.2 20.3 ± 8.3
% energy protein 10.3 ± 2.2 9.9 ± 2.0 10.0 ± 2.1 9.3 ± 2.3
Table 5.3. Summary of food intake at the ad libitum test meal for each of the four conditions. Values are mean ± SD.
5.4.4 Plasma glucose and appetite-associated hormone concentrations
5.4.4.1 Glucose
There was no significant time x condition interaction for plasma glucose
concentration (F(3) = 2.223, p = 0.106), nor was there a significant main effect for condition
or time (data not presented).
5.4.4.2 Acylated ghrelin
Acylated ghrelin concentrations did not differ across the four conditions at baseline.
There was a significant condition x time interaction for acylated ghrelin concentration
(F(3.606) = 3.978, p = 0.011, figure 5.3a). Post-hoc analysis of between-condition
comparisons showed that, at the midpoint of exercise, acylated ghrelin concentration was
significantly lower in the 45 min condition (252 ± 31 pg•mL-1), versus REST (356 ± 46 pg•mL-
1, p = 0.026) and 15 min (337 ± 45 pg•mL-1, p = 0.042). Immediately post-exercise (t=0),
acylated ghrelin was significantly lower in 45 min (198 ± 29 pg•mL-1) versus REST (369 ± 48
pg•mL-1, p = 0.009). Concentrations were also lower than REST in 15 min (273 ± 42 pg•mL-
1) and 30 min (246 ± 33 pg•mL-1) at this time, with these differences approaching statistical
significance (p = 0.077 and p = 0.055 respectively). The difference in acylated ghrelin
concentration between 30 min and 45 min also approached significance (p = 0.057). The
difference in plasma ghrelin concentration between 45 min and REST remained significant at
154
t=20 (239 ± 35 pg•mL-1 vs. 365 ± 47 pg•mL-1, p = 0.023). There were no significant
differences between conditions at t=40 onwards.
Within-condition comparisons showed that acylated ghrelin concentration did not
change in the resting condition. In the 15 min condition the mean concentration fell
significantly from the midpoint to immediately post-exercise (337 ± 45 pg•mL-1 vs. 273 ± 42
pg•mL-1, p = 0.001) and remained lower than the midpoint of exercise at t=20 (256 ± 39
pg•mL-1, p = 0.026). In the 30 min condition acylated ghrelin fell during exercise, with a trend
for lower concentration immediately post-exercise versus baseline (246 ± 33 pg•mL-1 vs. 396
± 48 pg•mL-1 , p = 0.098). The difference between the acylated ghrelin concentration at t=20
and the baseline concentration almost reached statistical significance (249 ± 7 pg•mL-1 vs.
396 ± 8 pg•mL-1, p = 0.05). Mean acylated ghrelin concentration fell to the greatest extent in
the 45 min trial, with concentrations significantly lower immediately post-exercise (198 ± 29
pg•mL-1) and at t=20 (239 ± 35 pg•mL-1), versus baseline (366 ± 47 pg•mL-1, p = 0.038 and p
= 0.025 respectively). The continued decrease in acylated ghrelin during exercise resulted in
a lower immediate post-exercise concentration (198 ± 29 pg•mL-1), which approached
significance, compared with the midpoint of exercise (252 ± 31 pg•mL-1, p = 0.066). AUC
analysis showed a significant main effect for condition (F(3,30) = 3.781, p = 0.021), with
Bonferroni pairwise comparisons highlighting that AUC was significantly lower in 45min,
compared with REST (p = 0.039).
The plot of acylated ghrelin %Δ against time spent exercising is shown in figure
5.3b. A significant, strong negative correlation was observed (r = -0.945, p = 0.004).
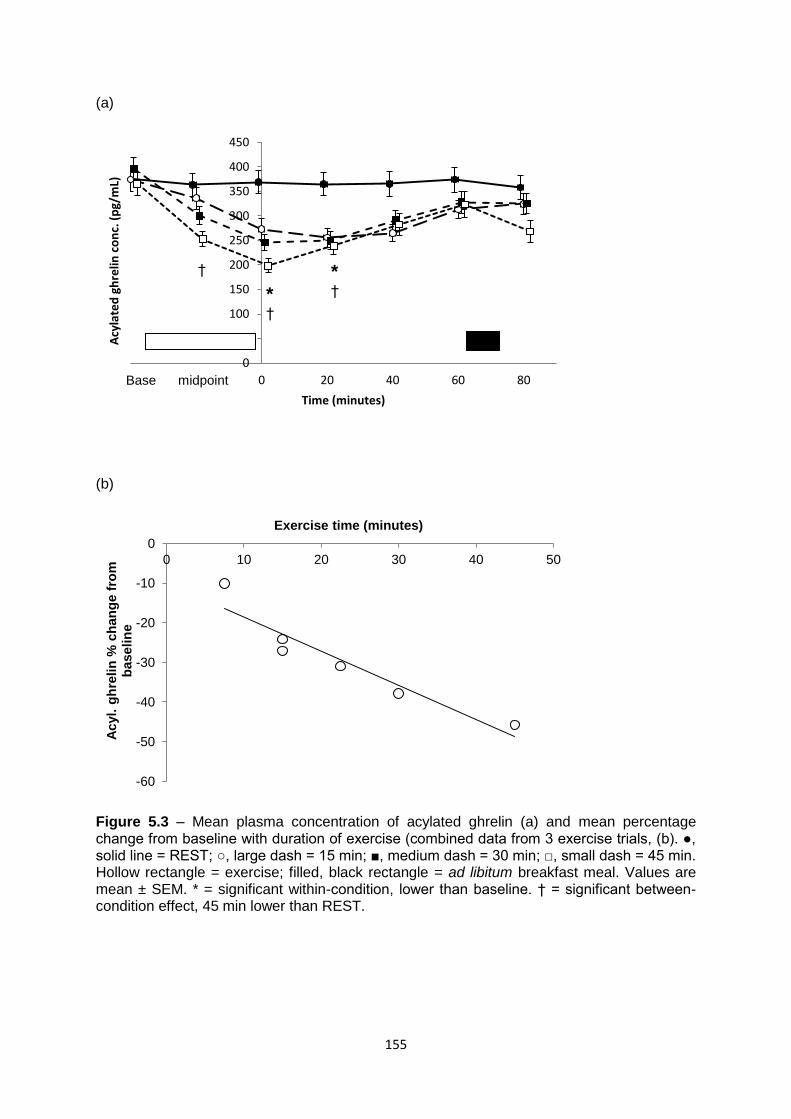
155
(a)
(b)
Figure 5.3 – Mean plasma concentration of acylated ghrelin (a) and mean percentage change from baseline with duration of exercise (combined data from 3 exercise trials, (b). ●, solid line = REST; ○, large dash = 15 min; ■, medium dash = 30 min; □, small dash = 45 min. Hollow rectangle = exercise; filled, black rectangle = ad libitum breakfast meal. Values are mean ± SEM. * = significant within-condition, lower than baseline. † = significant between-condition effect, 45 min lower than REST.
0
50
100
150
200
250
300
350
400
450
-40 -20 0 20 40 60 80
Acy
late
d g
hre
lin c
on
c. (
pg/
mL)
Time (minutes)
-60
-50
-40
-30
-20
-10
0
0 10 20 30 40 50
Acyl. g
hre
lin
% c
han
ge f
rom
b
aselin
e
Exercise time (minutes)
Base midpoint
* †
* †
†
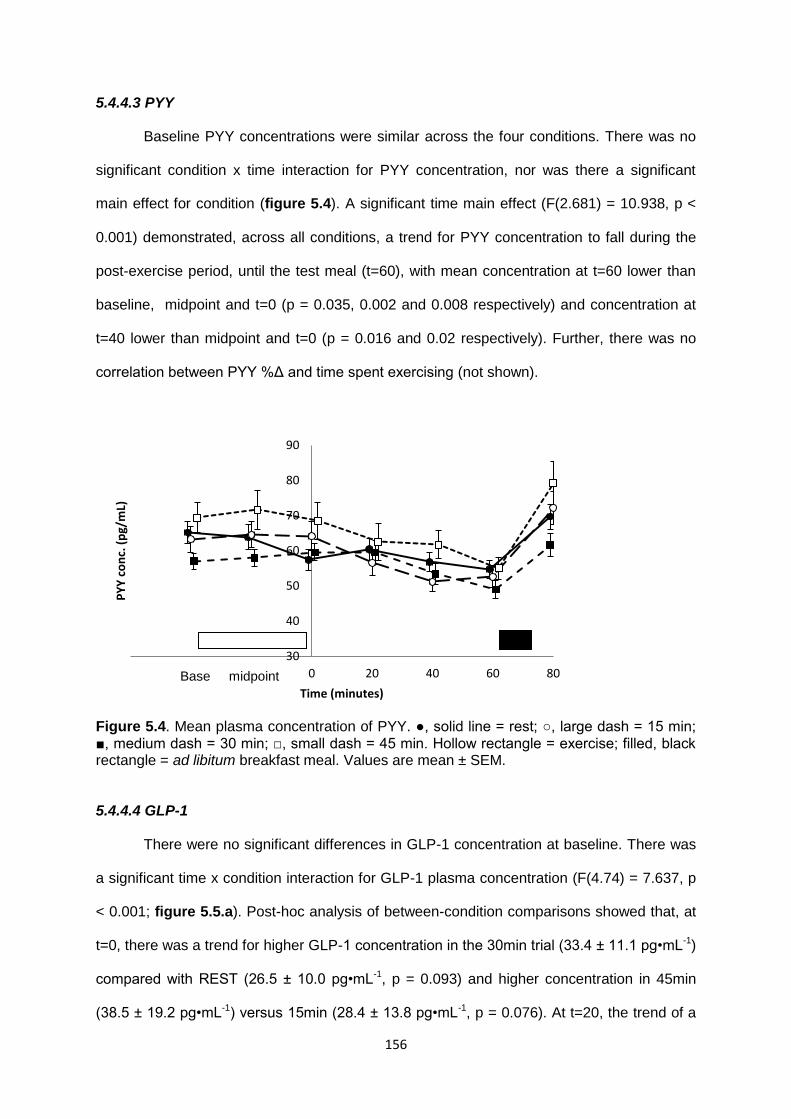
156
5.4.4.3 PYY
Baseline PYY concentrations were similar across the four conditions. There was no
significant condition x time interaction for PYY concentration, nor was there a significant
main effect for condition (figure 5.4). A significant time main effect (F(2.681) = 10.938, p <
0.001) demonstrated, across all conditions, a trend for PYY concentration to fall during the
post-exercise period, until the test meal (t=60), with mean concentration at t=60 lower than
baseline, midpoint and t=0 (p = 0.035, 0.002 and 0.008 respectively) and concentration at
t=40 lower than midpoint and t=0 (p = 0.016 and 0.02 respectively). Further, there was no
correlation between PYY %Δ and time spent exercising (not shown).
Figure 5.4. Mean plasma concentration of PYY. ●, solid line = rest; ○, large dash = 15 min; ■, medium dash = 30 min; □, small dash = 45 min. Hollow rectangle = exercise; filled, black rectangle = ad libitum breakfast meal. Values are mean ± SEM.
5.4.4.4 GLP-1
There were no significant differences in GLP-1 concentration at baseline. There was
a significant time x condition interaction for GLP-1 plasma concentration (F(4.74) = 7.637, p
< 0.001; figure 5.5.a). Post-hoc analysis of between-condition comparisons showed that, at
t=0, there was a trend for higher GLP-1 concentration in the 30min trial (33.4 ± 11.1 pg•mL-1)
compared with REST (26.5 ± 10.0 pg•mL-1, p = 0.093) and higher concentration in 45min
(38.5 ± 19.2 pg•mL-1) versus 15min (28.4 ± 13.8 pg•mL-1, p = 0.076). At t=20, the trend of a
30
40
50
60
70
80
90
-60 -40 -20 0 20 40 60 80
PY
Y c
on
c. (
pg/
mL)
Time (minutes)
Base midpoint
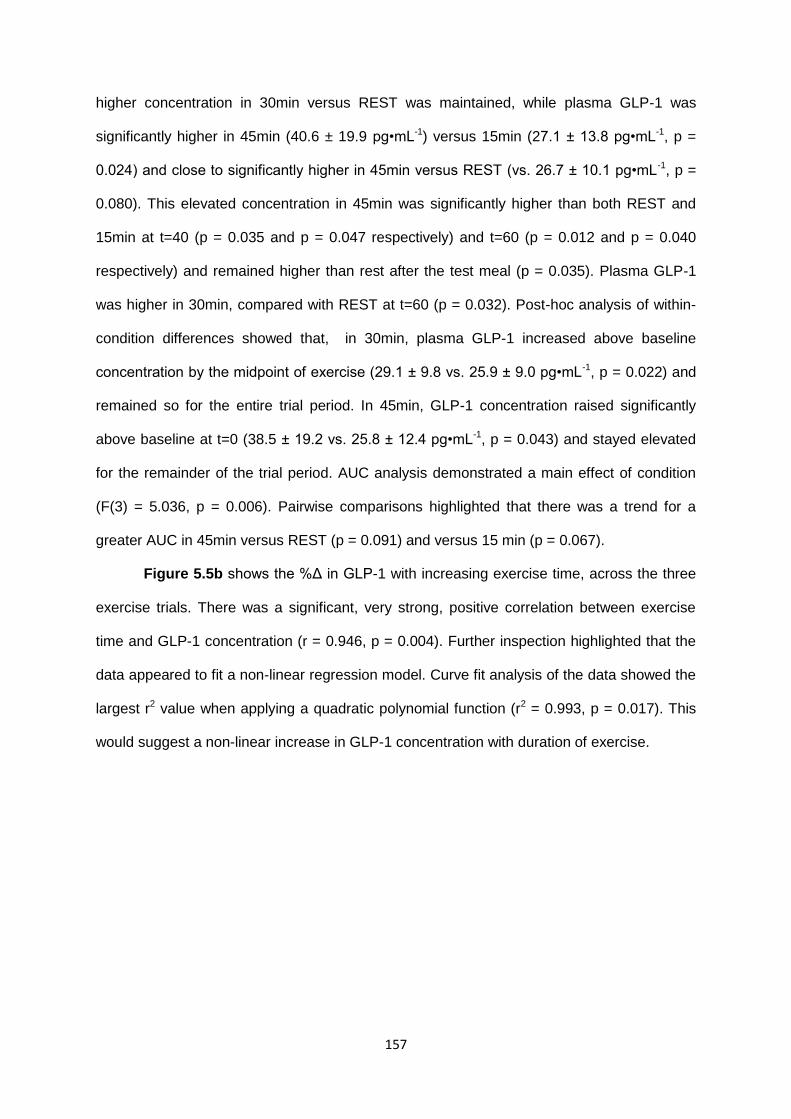
157
higher concentration in 30min versus REST was maintained, while plasma GLP-1 was
significantly higher in 45min (40.6 ± 19.9 pg•mL-1) versus 15min (27.1 ± 13.8 pg•mL-1, p =
0.024) and close to significantly higher in 45min versus REST (vs. 26.7 ± 10.1 pg•mL-1, p =
0.080). This elevated concentration in 45min was significantly higher than both REST and
15min at t=40 (p = 0.035 and p = 0.047 respectively) and t=60 (p = 0.012 and p = 0.040
respectively) and remained higher than rest after the test meal (p = 0.035). Plasma GLP-1
was higher in 30min, compared with REST at t=60 (p = 0.032). Post-hoc analysis of within-
condition differences showed that, in 30min, plasma GLP-1 increased above baseline
concentration by the midpoint of exercise (29.1 ± 9.8 vs. 25.9 ± 9.0 pg•mL-1, p = 0.022) and
remained so for the entire trial period. In 45min, GLP-1 concentration raised significantly
above baseline at t=0 (38.5 ± 19.2 vs. 25.8 ± 12.4 pg•mL-1, p = 0.043) and stayed elevated
for the remainder of the trial period. AUC analysis demonstrated a main effect of condition
(F(3) = 5.036, p = 0.006). Pairwise comparisons highlighted that there was a trend for a
greater AUC in 45min versus REST (p = 0.091) and versus 15 min (p = 0.067).
Figure 5.5b shows the %Δ in GLP-1 with increasing exercise time, across the three
exercise trials. There was a significant, very strong, positive correlation between exercise
time and GLP-1 concentration (r = 0.946, p = 0.004). Further inspection highlighted that the
data appeared to fit a non-linear regression model. Curve fit analysis of the data showed the
largest r2 value when applying a quadratic polynomial function (r2 = 0.993, p = 0.017). This
would suggest a non-linear increase in GLP-1 concentration with duration of exercise.
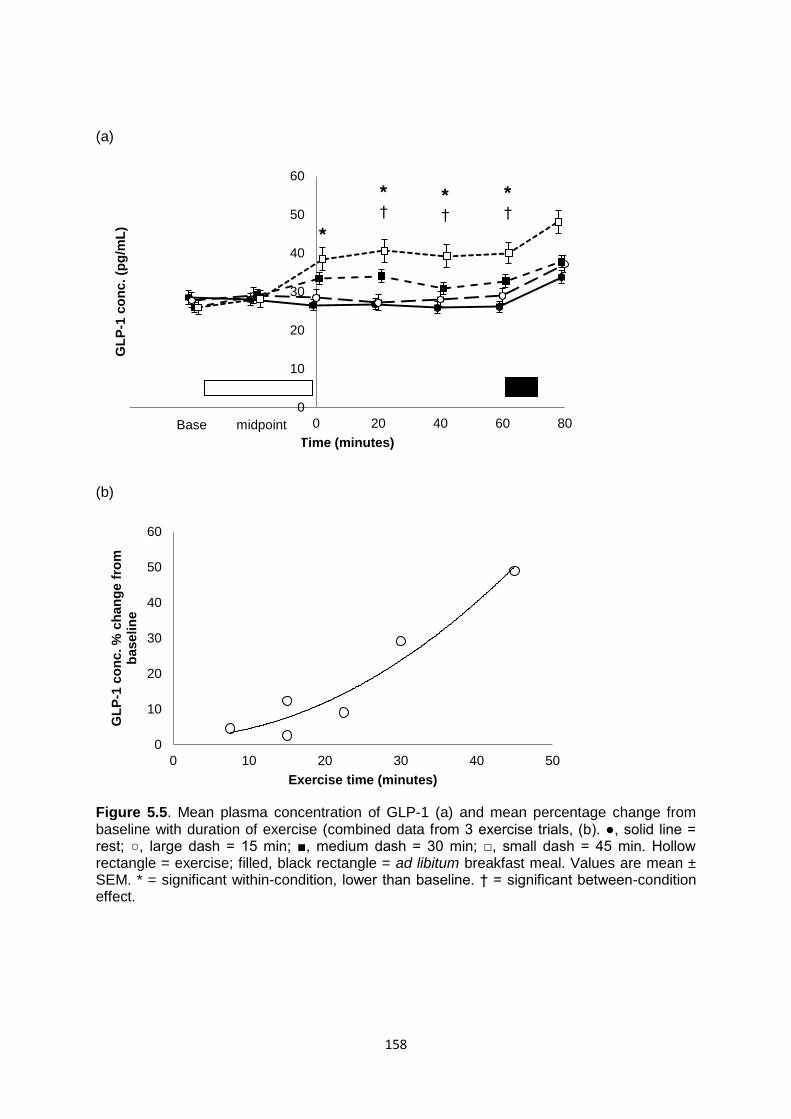
158
(a)
(b)
Figure 5.5. Mean plasma concentration of GLP-1 (a) and mean percentage change from baseline with duration of exercise (combined data from 3 exercise trials, (b). ●, solid line = rest; ○, large dash = 15 min; ■, medium dash = 30 min; □, small dash = 45 min. Hollow rectangle = exercise; filled, black rectangle = ad libitum breakfast meal. Values are mean ± SEM. * = significant within-condition, lower than baseline. † = significant between-condition effect.
0
10
20
30
40
50
60
-60 -40 -20 0 20 40 60 80
GL
P-1
co
nc. (p
g/m
L)
Time (minutes)
0
10
20
30
40
50
60
0 10 20 30 40 50
GL
P-1
co
nc. %
ch
an
ge f
rom
b
aselin
e
Exercise time (minutes)
* †
* †
* †
*
Base midpoint
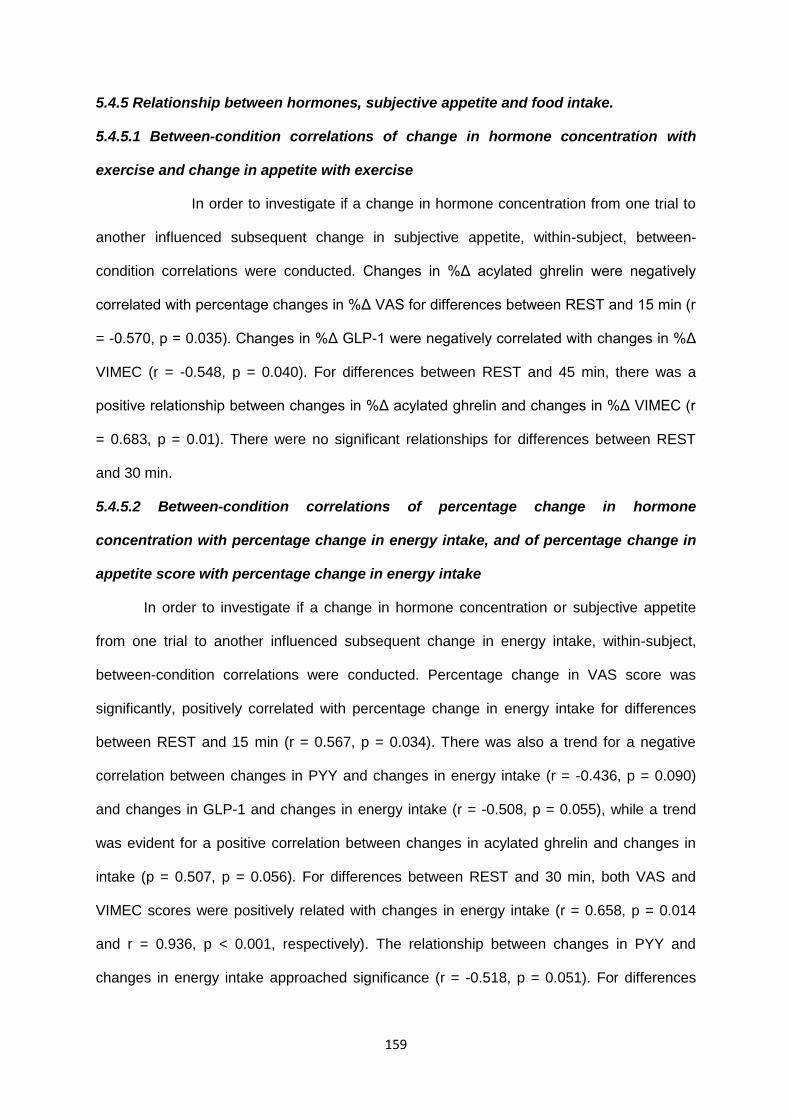
159
5.4.5 Relationship between hormones, subjective appetite and food intake.
5.4.5.1 Between-condition correlations of change in hormone concentration with
exercise and change in appetite with exercise
In order to investigate if a change in hormone concentration from one trial to
another influenced subsequent change in subjective appetite, within-subject, between-
condition correlations were conducted. Changes in %Δ acylated ghrelin were negatively
correlated with percentage changes in %Δ VAS for differences between REST and 15 min (r
= -0.570, p = 0.035). Changes in %Δ GLP-1 were negatively correlated with changes in %Δ
VIMEC (r = -0.548, p = 0.040). For differences between REST and 45 min, there was a
positive relationship between changes in %Δ acylated ghrelin and changes in %Δ VIMEC (r
= 0.683, p = 0.01). There were no significant relationships for differences between REST
and 30 min.
5.4.5.2 Between-condition correlations of percentage change in hormone
concentration with percentage change in energy intake, and of percentage change in
appetite score with percentage change in energy intake
In order to investigate if a change in hormone concentration or subjective appetite
from one trial to another influenced subsequent change in energy intake, within-subject,
between-condition correlations were conducted. Percentage change in VAS score was
significantly, positively correlated with percentage change in energy intake for differences
between REST and 15 min (r = 0.567, p = 0.034). There was also a trend for a negative
correlation between changes in PYY and changes in energy intake (r = -0.436, p = 0.090)
and changes in GLP-1 and changes in energy intake (r = -0.508, p = 0.055), while a trend
was evident for a positive correlation between changes in acylated ghrelin and changes in
intake (p = 0.507, p = 0.056). For differences between REST and 30 min, both VAS and
VIMEC scores were positively related with changes in energy intake (r = 0.658, p = 0.014
and r = 0.936, p < 0.001, respectively). The relationship between changes in PYY and
changes in energy intake approached significance (r = -0.518, p = 0.051). For differences
160
between REST and 45 min, there was a trend for a significant negative correlation between
changes in PYY and changes in energy intake (r = -0.496, p = 0.060) once again.
161
5.5 DISCUSSION
The aim of the current study was to assess the effect of the duration of high-intensity
aerobic exercise on subjective appetite, food intake and appetite-regulating hormones in
highly-trained male endurance athletes. Contrary to the hypothesis, subjective appetite was
not significantly suppressed post-exercise in any of the three exercise conditions, with no
significant drop in appetite scores from baseline observed with either subjective appetite
measure. Similarly, neither VAS nor VIMEC scores in any of the three exercise conditions
differed from resting condition scores at any point in the trial period. A lack of statistically
significant difference was despite a 14% decrease in VAS score post-exercise in 15min and
an 11% decrease in 45min. Further, VAS scores were 21% lower than REST in 15min and
22% lower in 45min.
It was hypothesised that completing exercise of such a high intensity would result in
a suppression of appetite in the 30 minute and 45 minute conditions. Exercise at an intensity
≥60% VO2max often elicits a transient suppression in recreationally active individuals (Broom
et al., 2009; King et al., 2010; Martins et al., 2007), despite being of a shorter duration and
lower energy cost (Laan et al., 2010) than the present study. Nonetheless, the present study
is not in isolation in finding no significant suppression of appetite despite a large exercise
stimulus (Imbeault et al., 1997; King et al., 2011a). Further, the present study was conducted
in highly trained athletes – a population rarely studied with regard to post-exercise appetite.
It may be possible that an appetite suppression was not observed due to a difference in
responses to exercise between athletic and non-athletic populations. It may be possible that
regularly exercising at an intensity of ≥60% VO2max may blunt the appetite suppression
response observed in those unfamiliar with such exercise. It may also be possible that
ingrained behavioural habits of athletes, regarding post-exercise feeding and nutrition are
more potent than physiological determinants of appetite and that this the primary regulator of
not only food intake, but also perceived appetite. However, this is purely speculative. It must
be acknowledged that the failure to observe a significant reduction in appetite, especially

162
after 30 and 45 minutes of exercise, could be due to lack of statistical power, especially
when considering the substantial absolute differences. It may be that a study cohort of 12
individuals was insufficient to afford the necessary statistical power for such a difference to
become statistically significant.
Unsurprisingly, in light of the absence of a post-exercise appetite suppression, there
was no significant difference in food intake at the ad libitum test meal, administered 60
minutes after the cessation of the exercise bout. The lack of any difference in food intake
post-exercise is a commonly observed finding, especially when the test meal is consumed
60 minutes post-exercise (King et al., 2010; King et al., 2011b; King et al., 1997; Schubert et
al., 2013; Thompson et al., 1988). Interestingly, there was a pattern for increased intake with
increased exercise duration. However, the differences between conditions were small and
insufficient to indicate a dose-response rebound in appetite. Relative energy intake did differ
between trial conditions. This has often been observed in the absence of a lower post-
exercise absolute energy intake (Imbeault et al., 1997; King et al., 2010; Lluch et al., 2000;
Unick et al., 2010), or even after absolute energy intake is greater after exercise, compared
with resting (Martins et al., 2007; Pomerleau et al., 2004). The 45 minute condition, despite
yielding a mean energy cost of 787 kcal was insufficient to elicit an acute energy deficit over
the course of the trial period. However, when one considers that the exercise was conducted
after a 10 hour overnight fast, 114 kcal is a small energy surplus for the morning testing
period, which included breakfast. Further, the REI was 573 kcal lower than in the resting
condition. From a weight-management perspective, the ACSM guidelines recommend a
daily energy deficit of ~170 - 300 kcal for the avoidance of weight gain and a deficit of over
500 kcal•day-1 for weight-loss (Donnelly et al., 2009) This would suggest that, for this study
population, an exercise bout of 45 minutes of cycling at 76% VO2max can elicit a reduction in
energy balance that, should it be maintained for the remainder of the day could assist in
weight maintenance, if not also help promote weight-loss.
While athletes may be concerned with weight management, the immediate post-
exercise period is of importance with regard to nutrition for recovery and adaptation to
163
training. Post-exercise carbohydrate intake is valued by many endurance athletes, with
exercise-induced GLUT-4 translocation leading to an increased potential for glucose uptake
and glycogen resynthesis after exercise (see (Goodyear and Kahn, 1998; Ivy, 1998; Jentjens
and Jeukendrup, 2003)). In addition, amino acid delivery and a positive energy balance
stimulate net muscle protein synthesis after resistance (Tipton et al., 1999) and endurance
(Howarth et al., 2009) exercise, meaning that the ingestion of protein in close proximity to
exercise is often desired for optimal rates of muscle protein synthesis (Phillips, 2006; Phillips
and Van Loon, 2011). Therefore, a suppression of appetite post-exercise may be detrimental
for recovery and adaptation, should it impact upon nutrition. The findings of the present
study would suggest that this was not the case, even after a strenuous bout of 45 minutes of
cycling at 76% VO2max.
A lack of a significant exercise-induced suppression of appetite was allied with no
significant change in plasma PYY concentration. Plasma PYY fell throughout the trial period,
until the test meal across all trials, and did not differ between conditions. Further, the small
increase in PYY concentration observed with exercise did not appear to follow a dose-
response with increasing duration of exercise. While PYY concentration has commonly been
observed to be responsive to high-intensity aerobic exercise (Broom et al., 2009; King et al.,
2011a; Larson-Meyer et al., 2012; Martins et al., 2007; Russel et al., 2009; Ueda et al.,
2009a; Ueda et al., 2009b), this was not the case in the present study. It is possible that this
is due to the study population; highly-trained athletes, familiar with exercising at such a high-
intensity may be resistant to exercise-induced alterations in PYY secretion. Chronic exercise
training has been postulated to sensitise satiety peptides to food intake, with greater late
post-prandial period concentrations of PYY and GLP-1 with food intake after training
(Martins et al., 2010). In addition exercise training has been shown to lower fasting PYY
concentrations (Jones et al., 2009; Roth et al., 2005). These may be mechanisms by which
regular physical activity assists with tighter regulation of energy balance, through limiting
over-eating. Similarly, a blunting of an exercise-induced increase in PYY through regular
exercise may be a means of regulating energy balance through the avoidance of appetite

164
suppression and an energy deficit after the energy cost of exercise. However, no study has
yet assessed the PYY response to acute exercise, pre- and post-training.
Despite no significant suppression of appetite post-exercise, there was a clear
response to exercise in GLP-1. Concentrations rose with exercise in the 30 minute and 45
minute conditions, by 29% and 49% respectively, with levels remaining elevated during the
60 minute recovery period. This finding is in agreement with previous studies in obese (Ueda
et al., 2009b) and healthy-weight (Martins et al., 2007; Ueda et al., 2009a) individuals, after
exercise of an intensity lower than that of the current study, lasting 30-60 minutes. As has
previously been shown in these studies, the increase in GLP-1 proved lasting. In the present
study, concentrations remained elevated at the time of the test meal, 60 minutes post-
exercise. No such response was observed in the 15 minute condition however, with the
GLP-1 profile closely resembling that of the rest condition. Moreover, there appeared a
dose-response increase in GLP-1 concentration with increasing duration of exercise, as
demonstrated by the very strong, positive correlation between %Δ and time spent exercising,
across the exercise conditions. The data appeared to follow a quadratic polynomial function
(y = 0.021x2 + 0.1545x + 0.391), which suggests a non-linear increase in GLP-1
concentration with increasing exercise duration. It must be noted at this point that this
analysis should be viewed with caution, as the measures used for correlation analysis are
not independent data points. Nevertheless, the exploratory investigation into this relationship
still allows for an interesting observation. Together these data would suggest that just 15
minutes of high-intensity cycling at 76% VO2max was an insufficient stimulus to cause any
exercise-induced increase in plasma GLP-1 and that GLP-1 concentration during high-
intensity aerobic exercise exhibits some duration or energy expenditure dependency,
possibly with a threshold duration for its secretion.
Acylated ghrelin also proved responsive to exercise. The plasma concentration fell
with exercise in all three exercise conditions, with the greatest decrease seen after 45
minutes of cycling. This suppression of acylated ghrelin was transient, with concentrations
not significantly different to baseline by 40 minutes post-exercise, even in 45 min; neither
165
was there a significant difference between any exercise condition and the resting condition
at this time point. This was despite acylated ghrelin concentration being 28%, 20% and 23%
lower than rest in the 15 minute, 30 minute and 45 minute conditions, respectively. There
was evidence of a dose-response of acylated ghrelin suppression, to the duration of
exercise. Further, when assessing changes in acylated ghrelin concentration over time
during exercise, a significant, very strong, negative correlation between %Δ and time spent
cycling was present (again, non-independent data points were used, so this observation
must be accepted with caution). This data would suggest that, with high-intensity aerobic
exercise, plasma acylated ghrelin concentration begins to fall in the very early stages of
exercise and continues to fall as the bout continues. This would suggest a physiological
mechanism by which the duration of exercise is an important regulatory factor in post-
exercise appetite suppression. However, the absence of a significant suppression of appetite
(either compared with baseline or with REST), dispels this theory somewhat and also
questions the role of acylated ghrelin as a regulator of appetite in the post-exercise state.
It would appear that there are a number of inconsistencies in the hormonal response
to exercise and subjective appetite in the present study. Firstly, changes in acylated ghrelin
and GLP-1 in favour of an anorexigenic state were not observed with PYY. It has generally
been observed that alterations in appetite-associated hormones occur concurrently,
especially with regards to satiety peptides (Broom et al., 2009; King et al., 2011a). Larson-
Meyer et al. (Larson-Meyer et al., 2012) did see a contrasting increase in the orexigenic
hormone ghrelin and in the anorexigenic hormones PYY and GLP-1, while Ueda and
colleagues observed an exercise induced increase in PYY and GLP-1, with no change in
total ghrelin concentration (Ueda et al., 2009b). This research group did, however,
demonstrate differential responses in PYY and GLP-1 following 30 minutes of cycling at 50%
VO2max and 75% VO2max(Ueda et al., 2009a). They found that PYY secretion appeared to be
intensity-dependent, whereas GLP-1 concentration increased to the same extent in both
exercise trials. The authors suggest that their data would advocate specific exercise
responses in plasma kinetics of PYY and GLP-1. The data of the present study would
166
support this notion, augmenting the theory by postulating that the rise in plasma GLP-1
concentration appears to be duration and/or energy expenditure dependent. Further, if an
increase in plasma PYY is intensity-dependent, then it may be the case that athletes posses
a blunted response, or, due to regularly undertaking high-intensity exercise, have elevated
their threshold intensity for PYY release.
Secondly, as alluded to earlier, the anorexigenic stimulus of an increase in GLP-1
concentration and a decrease in acylated ghrelin was not reflected by a suppression of
subjective appetite or a reduction in food intake. Total ghrelin (Wren et al., 2001), acylated
ghrelin (Druce et al., 2005) and GLP-1 (Verdich et al., 2001) have been shown to be potent
appetite regulators when administered pharmaceutically. However, in this case, exercise-
induced alterations in both, that would favour an anorexigenic state, did not lead to a
suppression of subjective appetite.
Assessment of the relationships for within-subject changes in appetite, hormone
concentration and energy showed little consistency in the association between changes in
appetite-associated hormones and subjective appetite. Changes in %Δ GLP-1 showed a
moderate-strength, negative correlation with changes in %Δ VIMEC score in 15 min, while
changes in %Δ acylated ghrelin was moderately, positively correlated with change %Δ
VIMEC score in 45 min. However, changes in %Δ acylated ghrelin was also negatively
correlated with changes in %Δ VIMEC for 15 min – an inverse relationship to that which was
seen in 45 min, and to that which would have been expected. Within-subject percentage
changes in appetite-associated hormones immediately prior to the test meal did not correlate
significantly with percentage changes in energy intake, which again would suggest a weak
relationship between hormonal regulators of appetite and food intake.
There is evidence that in the post-exercise period, there is blunting to hormonal
regulators of appetite. In a recent study by Heden et al. (Heden et al., 2013), acylated ghrelin
and subjective appetite responded differently with exercise in healthy-weight and obese
individuals; acylated ghrelin decreased post-exercise in healthy-weight participants but
appetite ratings remained unchanged. Conversely, acylated ghrelin was unaltered in the
167
obese post-exercise, which was reflected by no alteration in subjective appetite. This data,
allied with the findings of the present study, would suggest a discrepancy between changes
in hormone concentration and changes in subjective appetite in the post-exercise period in
highly-active, healthy-weight and obese individuals and hence questions the importance of
exercise-induced changes in appetite-associated hormones for appetite regulation and acute
energy balance.
In conclusion, as much as 45 minutes of cycling at 76% VO2max failed to suppress
subjective appetite or alter acute food intake in highly-trained endurance athletes. This was
despite a transient suppression of acylated ghrelin and a sustained increase in GLP-1. Both
of these hormones appeared to change in an exercise-duration-dependent manner. These
findings suggest that highly-trained individuals, accustomed to high-intensity aerobic
exercise, may exhibit a blunted response to exercise-induced appetite suppression, as is
commonly observed with recreationally active and (less commonly observed) overweight
individuals. Further, it would appear that post-exercise appetite responses are not duration-
dependent. The current data would also imply that changes in appetite-associated
hormones, specifically acylated ghrelin and GLP-1, may not play an important regulatory role
in either subjective appetite or post-exercise food intake.
168
5.6 REFERENCES
Bellissimo, N., Thomas, S.G., Goode, R.C., and Anderson, G.H. (2007). Effect of short-duration physical activity and ventilation threshold on subjective appetite and short-term energy intake in boys. Appetite 49, 644-651. Borg, G.A.V. (1973). "Perceived exertion: a note on history and methods". Medicine and Science in Sports & Exercise 5, 90-93. Broom, D.R., Batterham, R.L., King, J.A., and Stensel, D.J. (2009). Influence of resistance and aerobic exercise on hunger, circulating levels of acylated ghrelin, and peptide YY in healthy males. American Journal of Physiology-Regulatory Integrative and Comparative Physiology 296, R29-R35. Broom, D.R., Stensel, D.J., Bishop, N.C., Burns, S.F., and Miyashita, M. (2007). Exercise-induced suppression of acylated ghrelin in humans. J Appl Physiol 102, 2165-2171. Burke, L.M. (1997). Nutrition for post-exercise recovery. Australian journal of science and medicine in sport 29, 3-10. Burns, S.F., Broom, D.R., Miyashita, M., Mundy, C., and Stensel, D.J. (2007). A single session of treadmill running has no effect on plasma total ghrelin concentrations. Journal of Sports Sciences 25, 635-642. Deighton, K., Barry, R., Connon, C., and Stensel, D. (2012). Appetite, gut hormone and energy intake responses to low volume sprint interval and traditional endurance exercise. Eur J Appl Physiol, 1-10. Donnelly, J.E., Blair, S.N., Jakicic, J.M., Manore, M.M., Rankin, J.W., Smith, B.K., and null (2009). American College of Sports Medicine Position Stand. Appropriate physical activity intervention strategies for weight loss and prevention of weight regain for adults. Medicine and science in sports and exercise 41, 459-471. Druce, M.R., Neary, N.M., Small, C.J., Milton, J., Monteiro, M., Patterson, M., Ghatei, M.A., and Bloom, S.R. (2005). Subcutaneous administration of ghrelin stimulates energy intake in healthy lean human volunteers. Int J Obes Relat Metab Disord 30, 293-296. Erdmann, J., Tahbaz, R., Lippl, F., Wagenpfeil, S., and Schusdziarra, V. (2007). Plasma ghrelin levels during exercise -- Effects of intensity and duration. Regulatory Peptides 143, 127-135. Filaire, E., Rouveix, M., Pannafieux, C., and Ferrand, C. (2007). Eating attitudes, perfectionism and body-esteem of elite male judoists and cyclists. Journal of Sports Science and Medicine 5, 50-57. Goodyear, P., Laurie J., and Kahn, M., Barbara B. (1998). Exercise, glucose transport, and insulin sensitivity. Annual Review of Medicine 49, 235-261. Heden, T.D., Liu, Y., Park, Y., Dellsperger, K.C., and Kanaley, J.A. (2013). Acute aerobic exercise differentially alters acylated ghrelin and perceived fullness in normal-weight and obese individuals. Journal of Applied Physiology. Hill, A.J., and Blundell, J.E. (1982). Nutrients and behaviour: Research strategies for the investigation of taste characteristics, food preferences, hunger sensations and eating patterns in man. Journal of Psychiatric Research 17, 203-212.

169
Howarth, K.R., Moreau, N.A., Phillips, S.M., and Gibala, M.J. (2009). Coingestion of protein with carbohydrate during recovery from endurance exercise stimulates skeletal muscle protein synthesis in humans. Journal of Applied Physiology 106, 1394-1402. Imbeault, P., Saint-Pierre, S., Alm?Ras, N., and Tremblay, A. (1997). Acute effects of exercise on energy intake and feeding behaviour. British Journal of Nutrition 77, 511-521. Ivy, J.L. (1998). Glycogen resynthesis after exercise: effect of carbohydrate intake. International journal of sports medicine 19 Suppl 2, S142-145. Jentjens, R., and Jeukendrup, A. (2003). Determinants of post-exercise glycogen synthesis during short-term recovery. Sports medicine (Auckland, NZ) 33, 117-144. Jones, T.E., Basilio, J.L., Brophy, P.M., McCammon, M.R., and Hickner, R.C. (2009). Long-term exercise training in overweight adolescents improves plasma peptide YY and resistin. Obesity 17, 1189-1195. Jurimae, J., Hofmann, P., Jurimae, T., Maestu, J., Purge, P., Wonisch, M., Pokan, R., and von Duvillard, S.P. (2006). Plasma adiponectin response to sculling exercise at individual anaerobic threshold in college level male rowers. Int J Sports Med 27, 272-277. Jurimae, J., and Jurimae, T. (2005). Leptin responses to short term exercise in college level male rowers. Br J Sports Med 39, 6-9. Jurimae, J., Jurimae, T., and Purge, P. (2007). Plasma ghrelin is altered after maximal exercise in elite male rowers. Experimental Biology and Medicine 232, 904-909. Jürimäe, J., Mäestu, J., and Jürimäe, T. (2003). Leptin as a marker of training stress in highly trained male rowers? Eur J Appl Physiol 90, 533-538. Jurimae, J., Ramson, R., Maestu, J., Purge, P., Jurimae, T., Arciero, P.J., and Von Duvilard, S.P. (2009). Plasma visfatin and ghrelin response to prolonged sculling in competitive male rowers. Medicine & Science in Sports & Exercise 41, 137-143 110.1249/MSS.1240b1013e31818313e31818316. Kawano, H., Mineta, M., Asaka, M., Miyashita, M., Numao, S., Gando, Y., Ando, T., Sakamoto, S., and Higuchi, M. (2013). Effects of different modes of exercise on appetite and appetite-regulating hormones. Appetite 66, 26-33. King, J.A., Miyashita, M., Wasse, L.K., and Stensel, D.J. (2010). Influence of prolonged treadmill running on appetite, energy intake and circulating concentrations of acylated ghrelin. Appetite 54, 492-498. King, J.A., Wasse, L.K., Ewens, J., Crystallis, K., Emmanuel, J., Batterham, R.L., and Stensel, D.J. (2011a). Differential acylated ghrelin, peptide YY3-36, appetite, and food intake responses to equivalent energy deficits created by exercise and food restriction. Journal of Clinical Endocrinology & Metabolism 96, 1114-1121. King, J.A., Wasse, L.K., and Stensel, D.J. (2011b). The acute effects of swimming on appetite, food intake, and plasma acylated ghrelin. Journal of Obesity 2011. King, N.A., Burley, V.J., and Blundell, J.E. (1994). Exercise induced suppression of appetite: effects on food intake and implications for energ balance. European Journal of Clinical Nutrition 48, 715-724
170
King, N.A., Tremblay, A., and Blundell, J.E. (1997). Effects of exercise on appetite control: implications for energy balance. Medicine & Science in Sports & Exercise 29, 1076-1089. Kissileff, H.R., Pi-Sunyer, F.X., Segal, K., Meltzer, S., and Foelsch, P.A. (1990). Acute effects of exercise on food intake in obese and nonobese women. American Journal of Clinical Nutrition 52, 240-245. Kraemer, R.R., Durand, R.J., Acevedo, E.O., Johnson, L.G., Kraemer, G.R., Hebert, E.P., and Castracane, V.D. (2004). Rigorous running increases growth hormone and insulin-like growth factor-i without altering ghrelin. Experimental Biology and Medicine 229, 240-246. Laan, D.J., Leidy, H.J., Lim, E., and Campbell, W.W. (2010). Effects and reproducibility of aerobic and resistance exercise on appetite and energy intake in young, physically active adults. Applied Physiology, Nutrition, and Metabolism 35, 842-847. Larson-Meyer, D.E., Palm, S., Bansal, A., Austin, K.J., Hart, A.M., and Alexander, B.M. (2012). Influence of running and walking on hormonal regulators of appetite in women. Journal of Obesity 2012, 15. Lluch, A., King, N.A., and Blundell, J.E. (2000). No energy compensation at the meal following exercise indietary restrained and unrestrained women. British Journal of Nutrition 84, 219-225. Martins, C., Kulseng, B., King, N.A., Holst, J.J., and Blundell, J.E. (2010). The effects of exercise-induced weight loss on appetite-related peptides and motivation to eat. Journal of Clinical Endocrinology & Metabolism 95, 1609-1616. Martins, C., Morgan, L.M., Bloom, S.R., and Robertson, M.D. (2007). Effects of exercise on gut peptides, energy intake and appetite. J Endocrinol 193, 251-258. Marzullo, P., Salvadori, A., Brunani, A., Verti, B., Walker, G.E., Fanari, P., Tovaglieri, I., Medici, C.D., Savia, G., and Liuzzi, A. (2008). Acylated ghrelin decreases during acute exercise in the lean and obese state. Clinical Endocrinology 69, 970-971. O'Connor, A.M., Johnston, C.F., Buchanan, K.D., Boreham, C., Trinick, T.R., and Riddoch, C.J. (1995). Circulating gastrointestinal hormone changes in marathon running. Int J Sports Med 16, 283-287. O'Connor, A.M., Pola, S., Ward, B.M., Fillmore, D., Buchanan, K.D., and Kirwan, J.P. (2006). The gastroenteroinsular response to glucose ingestion during postexercise recovery. Am J Physiol Endocrinol Metab 290, E1155-1161. Phillips, S.M. (2006). Dietary protein for athletes: from requirements to metabolic advantage. Applied Physiology, Nutrition, and Metabolism 31, 647-654. Phillips, S.M., and Van Loon, L.J.C. (2011). Dietary protein for athletes: From requirements to optimum adaptation. Journal of Sports Sciences 29, S29-S38. Pomerleau, M., Imbeault, P., Parker, T., and Doucet, E. (2004). Effects of exercise intensity on food intake and appetite in women. Am J Clin Nutr 80, 1230-1236. Reid, C.H., CG. Blundell, JE. Stubbs, RJ (1998). What are psychometric assessments of appetite asking: a preliminary multivariate analysis. International Journal of Obesity 22, 151.
171
Rocha, J., Paxman, J., Dalton, C., Winter, E., and Broom. (2013). Effects of an acute bout of aerobic exercise on immediate and subsequent three-day food intake and energy expenditure in active and inactive men. Appetite 71, 369-378. Roth, C.L., Enriori, P.J., Harz, K., Woelfle, J., Cowley, M.A., and Reinehr, T. (2005). Peptide YY is a regulator of energy homeostasis in obese children before and after weight loss. J Clin Endocrinol Metab 90, 6386-6391. Russel, R.R., Willis, K.S., Ravussin, E., and Larson-Meyer, E.D. (2009). Effects of endurance running and dietary fat on circulating ghrelin and peptide YY. Journal of sports science & medicine 8, 574-583. Schmidt, A., Maier, C., Schaller, G., Nowotny, P., Bayerle-Eder, M., Buranyi, B., Luger, A., and Wolzt, M. (2004). Acute exercise has no effect on ghrelin plasma concentrations. Horm Metab Res 36, 174-177. Schubert, M.M., Desbrow, B., Sabapathy, S., and Leveritt, M. (2013). Acute exercise and subsequent energy intake. A meta-analysis. Appetite 63, 92-104. Shiiya, T., Ueno, H., Toshinai, K., Kawagoe, T., Naito, S., Tobina, T., Nishida, Y., Shindo, M., Kangawa, K., Tanaka, H., et al. (2011). Significant lowering of plasma ghrelin but not des-acyl ghrelin in response to acute exercise in men. Endocrine journal 58, 335-342. Stubbs, R.J., Hughes, D.A., Johnstone, A.M., Rowley, E., Reid, C., Elia, M., Stratton, R., Delargy, H., King, N., and Blundell, J.E. (2000). The use of visual analogue scales to assess motivation to eat in human subjects: a review of their reliability and validity with an evaluation of new hand-held computerized systems for temporal tracking of appetite ratings. Br J Nutr 84, 405-415. Thompson, D.A., Wolfe, L.A., and Eikelboom, R. (1988). Acute effects of exercise intensity on appetite in young men. Medicine & Science in Sports & Exercise 20, 222-227. Tipton, K.D., Ferrando, A.A., Phillips, S.M., Doyle, D., and Wolfe, R.R. (1999). Postexercise net protein synthesis in human muscle from orally administered amino acids. American Journal of Physiology - Endocrinology And Metabolism 276, E628-E634. Ueda, S.-y., Yoshikawa, T., Katsura, Y., Usui, T., and Fujimoto, S. (2009a). Comparable effects of moderate intensity exercise on changes in anorectic gut hormone levels and energy intake to high intensity exercise. Journal of Endocrinology 203, 357-364. Ueda, S.-y., Yoshikawa, T., Katsura, Y., Usui, T., Nakao, H., and Fujimoto, S. (2009b). Changes in gut hormone levels and negative energy balance during aerobic exercise in obese young males. J Endocrinol, JOE-08-0500. Unick, J.L., Otto, A.D., Goodpaster, B.H., Helsel, D.L., Pellegrini, C.A., and Jakicic, J.M. (2010). Acute effect of walking on energy intake in overweight/obese women. Appetite 55, 413-419. Verdich, C., Flint, A., Gutzwiller, J.-P., Naslund, E., Beglinger, C., Hellstrom, P.M., Long, S.J., Morgan, L.M., Holst, J.J., and Astrup, A. (2001). A meta-analysis of the effect of glucagon-like peptide-1 (7-36) amide on ad libitum energy intake in humans. J Clin Endocrinol Metab 86, 4382-4389.
172
Westerterp-Plantenga, M.S., Verwegen, C.R., Ijedema, M.J., Wijckmans, N.E., and Saris, W.H. (1997). Acute effects of exercise or sauna on appetite in obese and nonobese men. Physiology & Behavior 62, 1345-1354.
Wren, A.M., Seal, L.J., Cohen, M.A., Brynes, A.E., Frost, G.S., Murphy, K.G., Dhillo, W.S., Ghatei, M.A., and Bloom, S.R. (2001). Ghrelin enhances appetite and increases food intake in humans. J Clin Endocrinol Metab 86, 5992-.
173
CHAPTER 6
The effect of sprint interval cycling exercise on appetite, food
intake and appetite-associated hormones in overweight and
obese individuals.
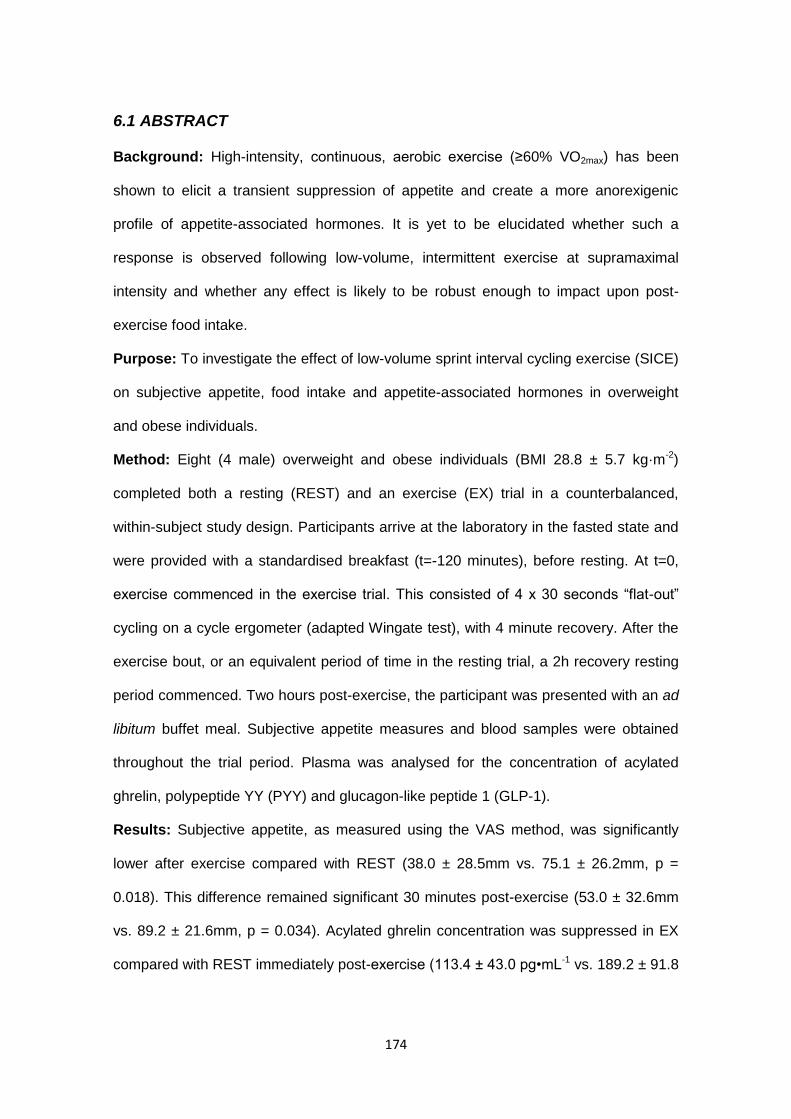
174
6.1 ABSTRACT
Background: High-intensity, continuous, aerobic exercise (≥60% VO2max) has been
shown to elicit a transient suppression of appetite and create a more anorexigenic
profile of appetite-associated hormones. It is yet to be elucidated whether such a
response is observed following low-volume, intermittent exercise at supramaximal
intensity and whether any effect is likely to be robust enough to impact upon post-
exercise food intake.
Purpose: To investigate the effect of low-volume sprint interval cycling exercise (SICE)
on subjective appetite, food intake and appetite-associated hormones in overweight
and obese individuals.
Method: Eight (4 male) overweight and obese individuals (BMI 28.8 ± 5.7 kg·m-2)
completed both a resting (REST) and an exercise (EX) trial in a counterbalanced,
within-subject study design. Participants arrive at the laboratory in the fasted state and
were provided with a standardised breakfast (t=-120 minutes), before resting. At t=0,
exercise commenced in the exercise trial. This consisted of 4 x 30 seconds “flat-out”
cycling on a cycle ergometer (adapted Wingate test), with 4 minute recovery. After the
exercise bout, or an equivalent period of time in the resting trial, a 2h recovery resting
period commenced. Two hours post-exercise, the participant was presented with an ad
libitum buffet meal. Subjective appetite measures and blood samples were obtained
throughout the trial period. Plasma was analysed for the concentration of acylated
ghrelin, polypeptide YY (PYY) and glucagon-like peptide 1 (GLP-1).
Results: Subjective appetite, as measured using the VAS method, was significantly
lower after exercise compared with REST (38.0 ± 28.5mm vs. 75.1 ± 26.2mm, p =
0.018). This difference remained significant 30 minutes post-exercise (53.0 ± 32.6mm
vs. 89.2 ± 21.6mm, p = 0.034). Acylated ghrelin concentration was suppressed in EX
compared with REST immediately post-exercise (113.4 ± 43.0 pg•mL-1 vs. 189.2 ± 91.8
175
pg•mL-1, p = 0.03) and remained lower for the entire post-exercise, pre-test-meal
period. Area-under-the-curve for GLP-1 concentration was greater for EX versus REST
and PYY showed a transient, non-significant increase with exercise. There was no
difference in ad libitum intake at the test meal. Further, when the energy expenditure of
exercise was accounted for, relative energy intake also did not differ between trial
conditions.
Conclusion: As little as 4 x 30 seconds of “flat-out” cycle exercise was sufficient to
suppress appetite. This was allied with a sustained suppression in plasma acylated
ghrelin and more modest increases in PYY and GLP-1. The suppression of appetite
was short-lived and elicited no difference in absolute or relative intake 2-hours post-
exercise between REST and EX. Further research is required to determine whether
this has implications for the undertaking of such exercise bouts as part of a fitness
programme or weight-loss strategy.
176
6.2 INTRODUCTION
It has been repeatedly shown that high-intensity, continuous aerobic exercise
elicits a transient suppression of appetite in lean, recreationally active individuals
(Broom et al., 2009; Broom et al., 2007; Burns et al., 2007; Kawano et al., 2013; King
et al., 2010; King et al., 2011b; Martins et al., 2007; Ueda et al., 2009a; Ueda et al.,
2009b). Typically, this phenomenon, termed the “anorexia of exercise,” (King et al.,
1994) is observed with exercise of an intensity ≥60% VO2max. Post-exercise appetite
suppression is a less common observation in obese and overweight individuals (Dodd
et al., 2008; George and Morganstein, 2003; Unick et al., 2010). This may be due to a
differing response in this population, or could be because exercise of an intensity of
>60% VO2max is rarely undertaken in studies investigating acute effects of exercise on
appetite in the overweight and obese (George and Morganstein, 2003; Unick et al.,
2010). The paucity of literature for this study population makes fully elucidating this
issue difficult.
While it has been shown that a suppression of subjective appetite can lead to
reductions in food intake in the immediate post–exercise period (~10 minutes
(Westerterp-Plantenga et al., 1997); ~15 minutes (Kissileff et al., 1990); ~30 minutes
(Ueda et al., 2009a); ~60 minutes (Ueda et al., 2009b) food intake is largely unaffected
when a meal is consumed ≥60 minutes after exercise (King et al., 2010; King et al.,
2011b; King et al., 1997b; Martins et al., 2007; Schubert et al., 2013; Thompson et al.,
1988). However, the response in subjective appetite is often coupled with changes in
appetite-associated hormones, in the favour of an anorexigenic state. While it would
appear that total ghrelin plasma concentration is perhaps unresponsive to exercise
(Burns et al., 2007; Kraemer et al., 2004; Martins et al., 2007; Schmidt et al., 2004), or
may even be increased post-exercise (Larson-Meyer et al., 2012; Russel et al., 2009)
concentrations of the acylated form of ghrelin, have been shown to decrease with

177
exercise (Broom et al., 2009; Broom et al., 2007; King et al., 2010; Marzullo et al.,
2008; Shiiya et al., 2011). In contrast, plasma concentrations of the satiety peptides
peptide YY (PYY) and glucogon-like peptide 1 (GLP-1) have been shown to increase
with exercise (Broom et al., 2009; Larson-Meyer et al., 2012; Martins et al., 2007;
Russel et al., 2009; Ueda et al., 2009a; Ueda et al., 2009b).
The intensity dependency of an exercise-induced suppression of appetite
appears well founded. However, the findings of Chapter 5 would suggest that the
exercise duration is not an important driver of exercise-induced changes in appetite.
If the exercise-induced suppression of appetite effect is exclusively driven by
intensity and independent of duration and energy expenditure, it may be possible to
elicit a suppression of appetite with low-volume, time efficient bouts of supramaximal
exercise. High-intensity interval exercise (HIE) and high-intensity training (HIT) have
recently been shown to elicit a host of physiological adaptations (Bartlett et al., 2012;
Burgomaster et al., 2006; Burgomaster et al., 2008; Burgomaster et al., 2005) and
health benefits (Babraj et al., 2009; Little et al., 2011; Whyte et al., 2010), akin to that
seen with more traditional, longer duration, continuous aerobic exercise. Furthermore,
it has also been suggested that this form of exercise is perceived as more enjoyable
than more traditional endurance exercise (Bartlett et al., 2011). With such observations,
allied with reduced time requirements, HIT is considered by some to be a preferable
form of exercise to undertake. However, one criticism often levelled at such low-volume
exercise bouts is a low energy cost. It is often argued that HIT is an ineffective form of
exercise for inducing weight-loss in overweight and obese individuals, as the low
energy cost is unlikely to yield an energy deficit sufficient to promote weight-loss.
Typically, only modest weight-loss is observed in long-term HIT studies (Burgomaster
et al., 2008; Helgerud et al., 2007), even in overweight and obese individuals (Whyte et
al., 2010), although significant reductions in body weight (Trapp et al., 2008) and fat
mass have been achieved (see Boutcher, 2011).
178
In light of a number of chronic exercise training studies, the dearth of research
in to the effect of HIE on appetite and acute food intake is perhaps surprising. Despite
a considerable amount of investigation into the effect of continuous aerobic exercise on
appetite, there is little within the literature with respect to alternative forms of exercise.
Only a small number of studies have investigated the effect of low-volume, high-
intensity exercise, or sprint interval exercise (SIE) on appetite, food intake and gut
hormones (Deighton et al., 2012; Deighton et al., 2013; Sim et al., 2013). Six 30
second Wingate tests transiently suppressed appetite and circulating acylated ghrelin
concentrations, as well as elevating plasma PYY3-36 (the most abundant form of PYY)
concentrations. This response was achieved with an estimated mean energy cost of
exercise of just 142 kcal. However, food intake at an ad libitum buffet meal, provided
45 minutes after the cessation of exercise was no different to that of a control condition
(Deighton et al., 2012). In a follow-up study, 10 x 4 minutes of cycling at 85% VO2max
suppressed appetite and elevated plasma PYY3-36 concentrations to a greater extent
than isocaloric continuous exercise at 60% VO2max (Deighton et al., 2013). While these
studies were conducted with recreationally active individuals, Sim et al. (Sim et al.,
2013) investigated the effect of high-intensity intermittent cycling on appetite in
overweight males. Repetitions of 60 second intervals at an intensity of 100% VO2peak
(high-intensity) and of 15 second intervals at 170% VO2peak (very-high-intensity) did not
result in changes in subjective appetite, compared with baseline, a resting control
condition or energy-matched moderate-intensity, continuous exercise. However,
energy intake at a test meal provided 70 minutes post-exercise was lower after high-
intensity and very-high-intensity exercise, compared with rest and rest and continuous
exercise, respectively. The monitoring of ad libitum food intake for the remainder of the
trial day and the following day showed that intake was lower after the very-high-
intensity exercise trial, compared with the resting and continuous exercise trials. These
data suggest that exercise of a sufficiently high intensity may provide a strong enough

179
stimulus to influence food intake in the hours and days post-exercise, even in the
absence of changes in acute subjective appetite. However, further work is certainly
required to substantiate this curious finding.
The aim of the current study was to investigate the effect of low-volume sprint
interval cycling on appetite, food intake and circulating concentration of the appetite-
associated hormones acylated ghrelin, PYY and GLP-1 in overweight and obese
individuals. It was hypothesised that just 4 x 30 seconds maximal effort cycling would
induce a suppression of subjective appetite, and that this would be associated with an
anorexigenic change in hormones. However, it was expected that these changes would
be transient, meaning that a difference in food intake two hours post-exercise was
unlikely to be observed.
180
6.3 METHOD
6.3.1 Participants
Eleven overweight or obese, low- to moderate-activity level individuals were
recruited principally from the University of Birmingham students and staff. Inclusion
criteria were: a BMI of ≥25 kg•m-2, a score of ≤3000 MET-minutes per week on the
International Physical Activity Questionnaire (IPAQ, Appendix 8), currently weight-
stable and not attempting weight-loss and not currently undertaking any form of
vigorous exercise. Exclusion criteria were: a score of 3.5 or greater for restricted eating
on the Dutch Eating Behaviour Questionnaire (DEBQ, van Strien et al, 1986); resting
blood pressure of >140/90 mm Hg, irregular cardiac activity at rest (as assessed with
the use of a resting ECG), illness such as upper respiratory tract infections; smoking
and the taking of medication likely to affect appetite or induce weight-loss. Ethical
approval was obtained from the Ethics Subcommittee of the School of Sport, Exercise
and Rehabilitation Sciences at the University of Birmingham. Of the eleven participants
recruited, two withdrew and one was excluded from the results on the basis that their
resting acylated ghrelin concentration was >2 SD from the mean. Further, we were
unable to obtain blood samples from one participant who did complete the study, so
hormone analysis was conducted for seven participants. The participant characteristics
for the eight individuals who completed the study (4 males, 4 females) are shown in
table 6.1.
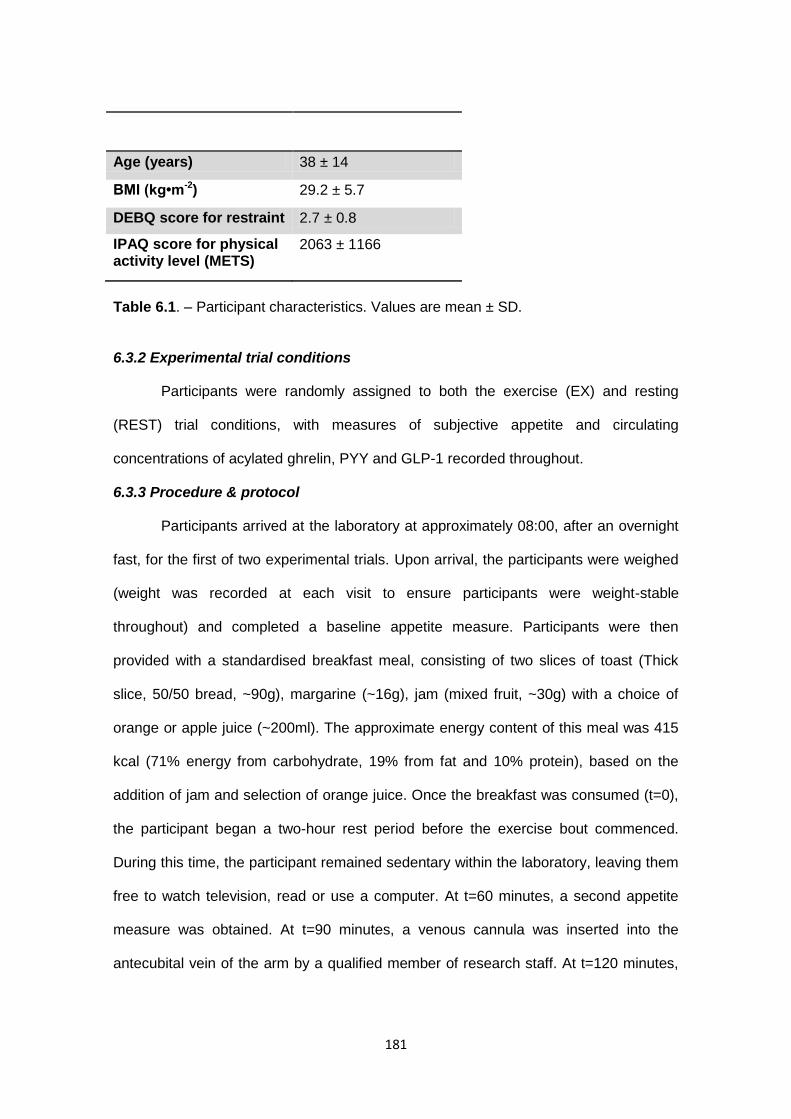
181
Age (years) 38 ± 14
BMI (kg•m-2) 29.2 ± 5.7
DEBQ score for restraint 2.7 ± 0.8
IPAQ score for physical activity level (METS)
2063 ± 1166
Table 6.1. – Participant characteristics. Values are mean ± SD.
6.3.2 Experimental trial conditions
Participants were randomly assigned to both the exercise (EX) and resting
(REST) trial conditions, with measures of subjective appetite and circulating
concentrations of acylated ghrelin, PYY and GLP-1 recorded throughout.
6.3.3 Procedure & protocol
Participants arrived at the laboratory at approximately 08:00, after an overnight
fast, for the first of two experimental trials. Upon arrival, the participants were weighed
(weight was recorded at each visit to ensure participants were weight-stable
throughout) and completed a baseline appetite measure. Participants were then
provided with a standardised breakfast meal, consisting of two slices of toast (Thick
slice, 50/50 bread, ~90g), margarine (~16g), jam (mixed fruit, ~30g) with a choice of
orange or apple juice (~200ml). The approximate energy content of this meal was 415
kcal (71% energy from carbohydrate, 19% from fat and 10% protein), based on the
addition of jam and selection of orange juice. Once the breakfast was consumed (t=0),
the participant began a two-hour rest period before the exercise bout commenced.
During this time, the participant remained sedentary within the laboratory, leaving them
free to watch television, read or use a computer. At t=60 minutes, a second appetite
measure was obtained. At t=90 minutes, a venous cannula was inserted into the
antecubital vein of the arm by a qualified member of research staff. At t=120 minutes,
182
an appetite measure was recorded and a resting blood sample (~7ml) was obtained.
An additional blood sample (~3ml) was obtained at this point for the baseline measure
of blood glucose. In the exercise trial condition, the exercise bout commenced
immediately.
The exercise bout consisted of 4 x 30 seconds “flat out” sprint on a cycle
ergometer (Lode Excalibur Sport, Groningen, Netherlands), utilising a modified
Wingate anaerobic power test (the torque factor was set at either 0.5 or 0.6, as
opposed to the commonly used torque factor of 0.7, due to the fitness level of the
participants and judging by their performance during the familiarisation trial). The first
bout was preceded by a brief 3 minute warm-up period at a constant load of 40 watts;
the first sprint was initiated immediately upon reaching the end of the 3 minute period.
The 4 sprint bouts were separated by a 4 minute recovery period, during which the
power of the cycle ergometer was a constant 40 watts. During this recovery period
participants were encouraged to remain on the bike, being free to rest or partake in
light cycling to facilitate active recovery. Heart rate was recorded throughout the bout,
using a heart rate monitor (Polar S625X; Polar Electro Oy, Kempele, Finland), and
noted at the end of every sprint and at the end of each recovery period. Rating of
perceived exertion, measured using the Borg Scale (Borg, 1973) was also recorded at
these time points. Breath-by-breath measures of exhaled gas were obtained, using the
Oxycon Pro (Jaeger, Wuerzburg, Germany) apparatus, during sprint number one,
recovery period number one and sprint and recovery period number three. The
exercise bout ended upon completing sprint number four, with a blood sample being
obtained immediately, followed by an appetite measure. An additional ~3ml blood
sample was obtained for the post-exercise measure of blood glucose. Thus, the
exercise bout lasted a total of 17 minutes. In the resting trial condition, the participant
remained sedentary for an equal amount of time. A 10-minute resting exhaled gas
183
measurement was made during this time, using the Oxycon Pro (Jaeger, Wuerzburg,
Germany) apparatus.
On concluding the exercise bout (t=0*), a 2 hour rest period began. During this
period, the participant again remained sedentary, free to watch television, read or use a
computer. Blood samples and appetite measures were obtained every 30 minutes
during this time. Between t=30* and t=40*, a resting sample of exhaled gas was
collected in order to calculate post-exercise recover period energy expenditure. At
t=120*, the participant was escorted to the research kitchen facility, where they were
provided with a buffet lunch meal (see General methods, section 2.2.3.2, p73). The
participant was instructed that they may consume as they wished and were left to do so
in isolation. Upon finishing the meal, a final blood sample was obtained and final
appetite measure recorded.
6.3.4 Blood sampling and analysis
The blood sampling and plasma analysis techniques are described in General
methods, section 2.2.3.5 (p76). Briefly, blood samples were obtained and immediately
transferred to the appropriate pre-treated blood collection tubes for analysis of
hormones. Blood was centrifuged at 3500 RPM and a temperature of 4˚C for 15
minutes to isolate plasma. Plasma was stored at a temperature of -70˚C until hormone
assays for acylated ghrelin, PYY and GLP-1 were conducted.
6.3.5 Statistical analysis
To assess changes in subjective appetite over time and between the two trial
conditions, a 2 x 9 factorial ANOVA with repeated measures was conducted, using
both the VAS and VIMEC scores. For the analysis of PYY, GLP-1 and acylated ghrelin
concentrations, 2 x 7 factorial ANOVA with repeated measures were carried out, and
for the analysis of glucose concentration, 2 x 2 factorial ANOVA with repeated
measures were conducted. Any significant interactions or main effects were
investigated further by carrying out pairwise comparisons, using Bonferroni post-hoc
184
analysis. In the event of a significant difference between conditions at baseline in any
outcome measure, percentage change from baseline (%Δ) was calculated and analysis
repeated with these calculated values. Area under the curve (AUC) was calculated for
all profiles plotted, using the trapezoidal method. AUC values were then compared
using paired-samples t-tests. Energy intake values at the ad libitum buffet meal, as
well as total grams, grams of carbohydrate, fat and protein consumed were compared
using paired-sample t-tests.
To assess the regulation of subjective appetite by appetite-associated
hormones, within-subject, between-condition changes in hormone concentration were
correlated with change in VAS scores and VIMEC score. For this analysis, change from
the resting condition was calculated (EX – REST) for percentage change with exercise
(%ΔEX, from value t = 0 to value at t = 0) in VAS, VIMEC, acylated ghrelin, PYY and
GLP-1. To assess the regulation of energy intake by subjective appetite and appetite-
associated hormones, within-subject, between-condition percentage differences (EX –
REST) for appetite and hormone concentration measures obtained immediately prior to
the ad libitum test meal were correlated with between-condition percentage differences
for energy intake at the test meal. Correlations were conducted using Pearson product
moment correlation analysis.
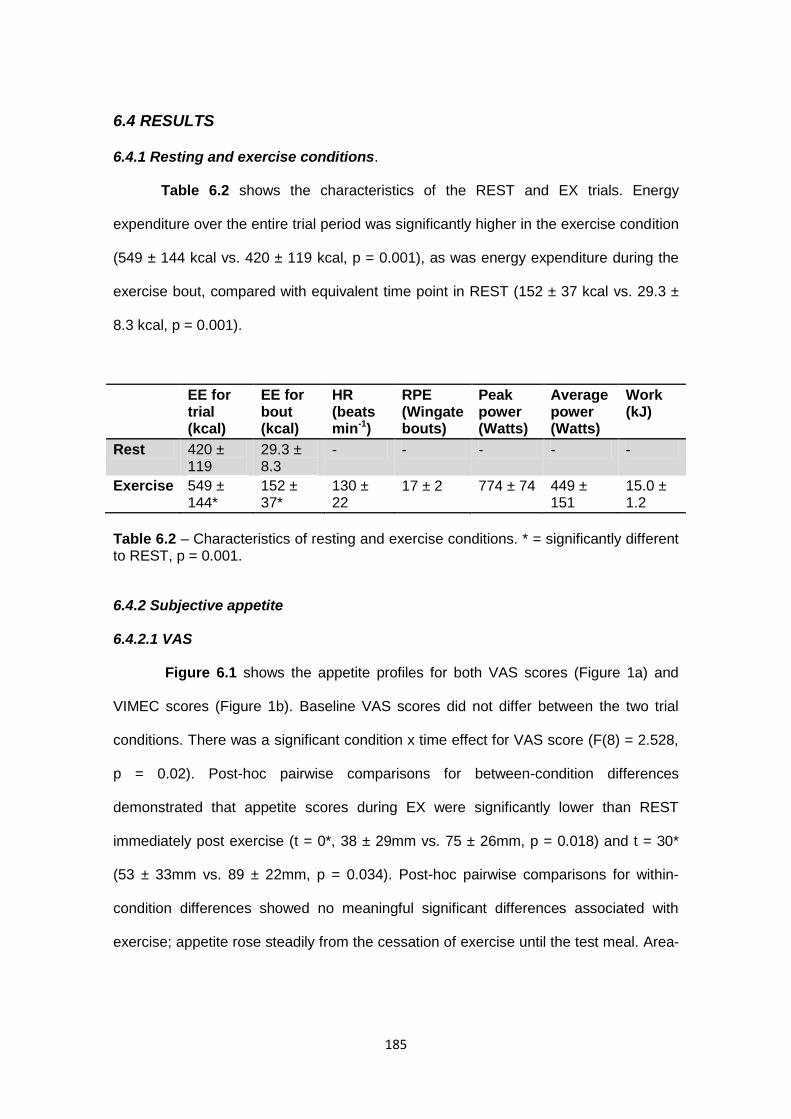
185
6.4 RESULTS
6.4.1 Resting and exercise conditions.
Table 6.2 shows the characteristics of the REST and EX trials. Energy
expenditure over the entire trial period was significantly higher in the exercise condition
(549 ± 144 kcal vs. 420 ± 119 kcal, p = 0.001), as was energy expenditure during the
exercise bout, compared with equivalent time point in REST (152 ± 37 kcal vs. 29.3 ±
8.3 kcal, p = 0.001).
EE for trial (kcal)
EE for bout (kcal)
HR (beats min-1)
RPE (Wingate bouts)
Peak power (Watts)
Average power (Watts)
Work (kJ)
Rest 420 ± 119
29.3 ± 8.3
- - - - -
Exercise 549 ± 144*
152 ± 37*
130 ± 22
17 ± 2 774 ± 74 449 ± 151
15.0 ± 1.2
Table 6.2 – Characteristics of resting and exercise conditions. * = significantly different to REST, p = 0.001.
6.4.2 Subjective appetite
6.4.2.1 VAS
Figure 6.1 shows the appetite profiles for both VAS scores (Figure 1a) and
VIMEC scores (Figure 1b). Baseline VAS scores did not differ between the two trial
conditions. There was a significant condition x time effect for VAS score (F(8) = 2.528,
p = 0.02). Post-hoc pairwise comparisons for between-condition differences
demonstrated that appetite scores during EX were significantly lower than REST
immediately post exercise (t = 0*, 38 ± 29mm vs. 75 ± 26mm, p = 0.018) and t = 30*
(53 ± 33mm vs. 89 ± 22mm, p = 0.034). Post-hoc pairwise comparisons for within-
condition differences showed no meaningful significant differences associated with
exercise; appetite rose steadily from the cessation of exercise until the test meal. Area-
186
under-the-curve (AUC) data for the VAS appetite profiles showed that appetite over the
entire trial period was significantly lower in EX versus REST (t(7) = 2.441, p = 0.045).
6.4.2.2 VIMEC
There was no significant difference in VIMEC scores at baseline. No significant
condition x time interaction was present (F(8) = 1.517, p = 0.172, figure 6.1b), nor was
there a significant condition main effect (F(1) = 0.718, p = 0.425). A significant main
effect for time (F(8) = 7.242, p < 0.001) simply indicated a general increase in appetite
from breakfast to the test meal, before falling post-test-meal. Analysis of AUC data also
failed to show any difference between conditions (t(7) = 0.770, p = 0.466).
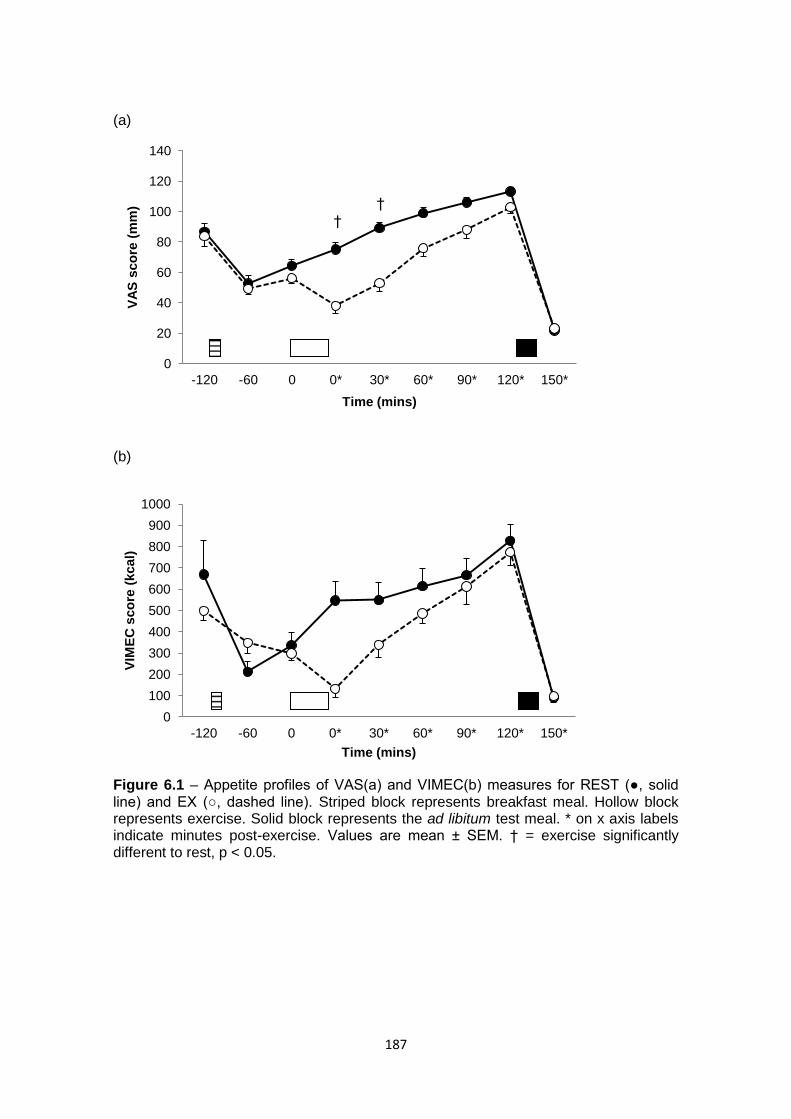
187
(a)
(b)
Figure 6.1 – Appetite profiles of VAS(a) and VIMEC(b) measures for REST (●, solid line) and EX (○, dashed line). Striped block represents breakfast meal. Hollow block represents exercise. Solid block represents the ad libitum test meal. * on x axis labels indicate minutes post-exercise. Values are mean ± SEM. † = exercise significantly different to rest, p < 0.05.
0
20
40
60
80
100
120
140
-120 -60 0 0* 30* 60* 90* 120* 150*
VA
S s
co
re (
mm
)
Time (mins)
0
100
200
300
400
500
600
700
800
900
1000
-120 -60 0 0* 30* 60* 90* 120* 150*
VIM
EC
sco
re (
kcal)
Time (mins)
†
†
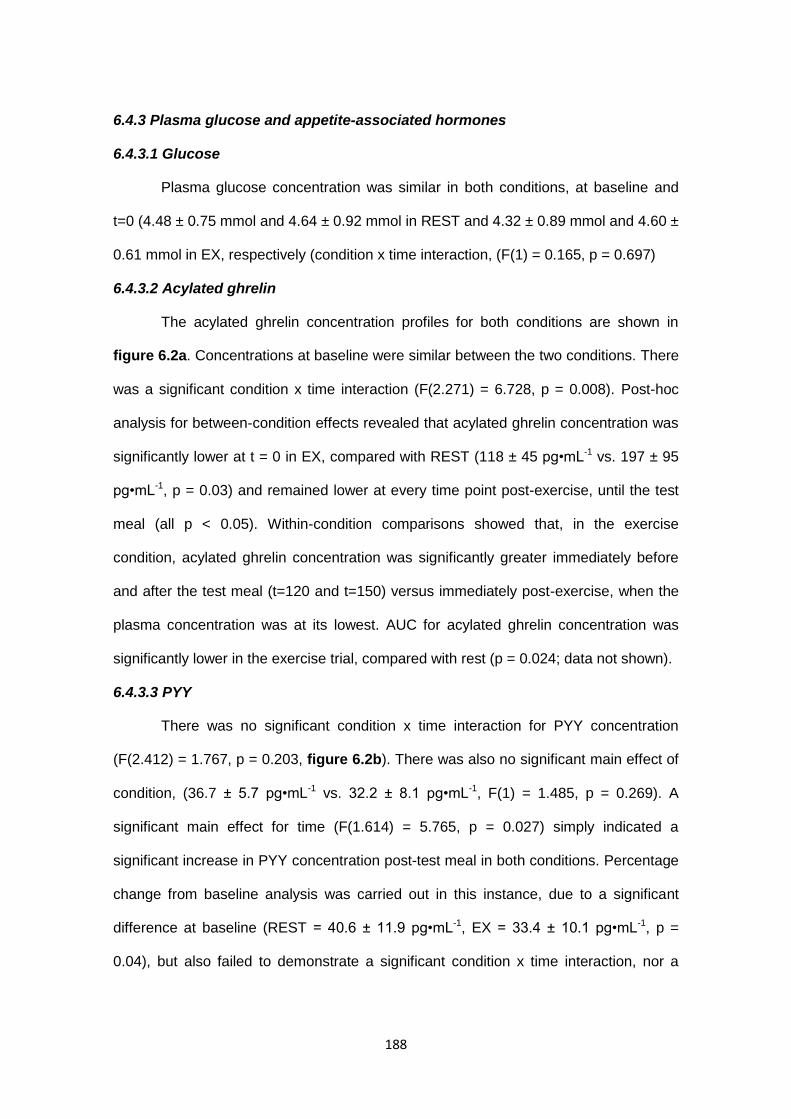
188
6.4.3 Plasma glucose and appetite-associated hormones
6.4.3.1 Glucose
Plasma glucose concentration was similar in both conditions, at baseline and
t=0 (4.48 ± 0.75 mmol and 4.64 ± 0.92 mmol in REST and 4.32 ± 0.89 mmol and 4.60 ±
0.61 mmol in EX, respectively (condition x time interaction, (F(1) = 0.165, p = 0.697)
6.4.3.2 Acylated ghrelin
The acylated ghrelin concentration profiles for both conditions are shown in
figure 6.2a. Concentrations at baseline were similar between the two conditions. There
was a significant condition x time interaction (F(2.271) = 6.728, p = 0.008). Post-hoc
analysis for between-condition effects revealed that acylated ghrelin concentration was
significantly lower at t = 0 in EX, compared with REST (118 ± 45 pg•mL-1 vs. 197 ± 95
pg•mL-1, p = 0.03) and remained lower at every time point post-exercise, until the test
meal (all p < 0.05). Within-condition comparisons showed that, in the exercise
condition, acylated ghrelin concentration was significantly greater immediately before
and after the test meal (t=120 and t=150) versus immediately post-exercise, when the
plasma concentration was at its lowest. AUC for acylated ghrelin concentration was
significantly lower in the exercise trial, compared with rest (p = 0.024; data not shown).
6.4.3.3 PYY
There was no significant condition x time interaction for PYY concentration
(F(2.412) = 1.767, p = 0.203, figure 6.2b). There was also no significant main effect of
condition, (36.7 ± 5.7 pg•mL-1 vs. 32.2 ± 8.1 pg•mL-1, F(1) = 1.485, p = 0.269). A
significant main effect for time (F(1.614) = 5.765, p = 0.027) simply indicated a
significant increase in PYY concentration post-test meal in both conditions. Percentage
change from baseline analysis was carried out in this instance, due to a significant
difference at baseline (REST = 40.6 ± 11.9 pg•mL-1, EX = 33.4 ± 10.1 pg•mL-1, p =
0.04), but also failed to demonstrate a significant condition x time interaction, nor a
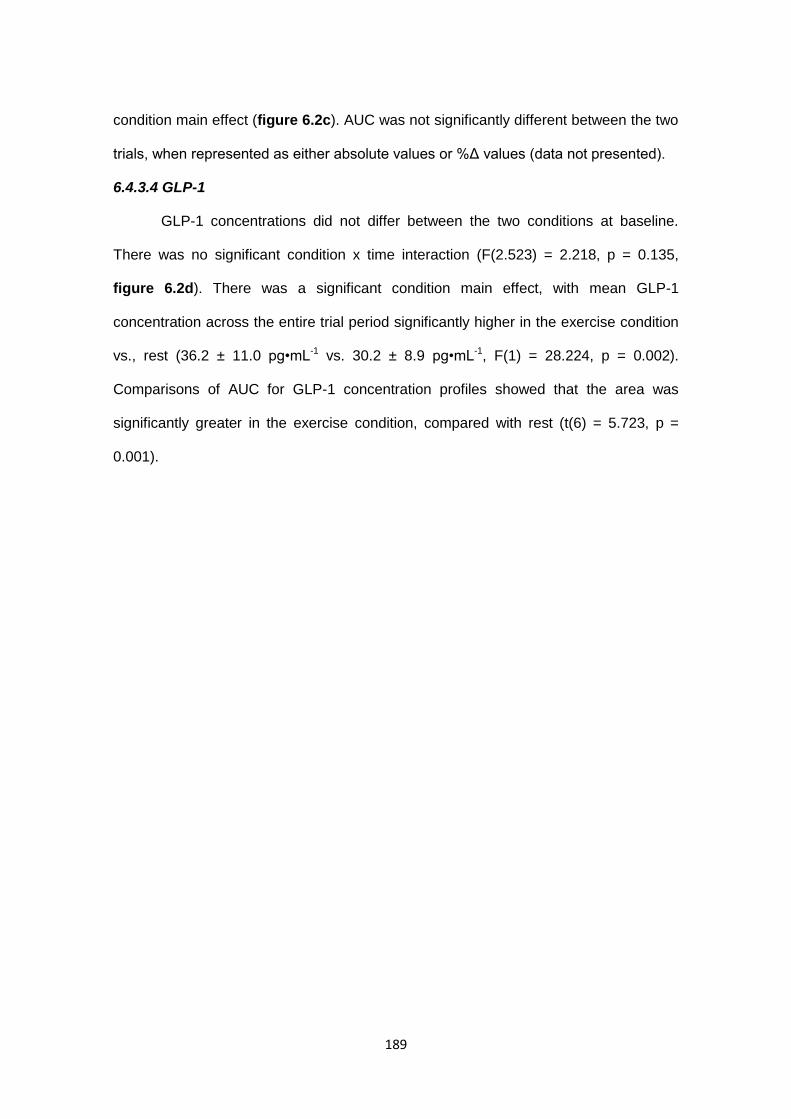
189
condition main effect (figure 6.2c). AUC was not significantly different between the two
trials, when represented as either absolute values or %Δ values (data not presented).
6.4.3.4 GLP-1
GLP-1 concentrations did not differ between the two conditions at baseline.
There was no significant condition x time interaction (F(2.523) = 2.218, p = 0.135,
figure 6.2d). There was a significant condition main effect, with mean GLP-1
concentration across the entire trial period significantly higher in the exercise condition
vs., rest (36.2 ± 11.0 pg•mL-1 vs. 30.2 ± 8.9 pg•mL-1, F(1) = 28.224, p = 0.002).
Comparisons of AUC for GLP-1 concentration profiles showed that the area was
significantly greater in the exercise condition, compared with rest (t(6) = 5.723, p =
0.001).

190
* * * *
*
† †
0
50
100
150
200
250
300
base 0 30 60 90 120 150
Acyla
ted
gh
relin
co
nc.
(pg
/ml)
Time (minutes)
10
15
20
25
30
35
40
45
base 0 30 60 90 120 150
PY
Y c
on
c.
(pg
/ml)
Time (minutes)
-40
-30
-20
-10
0
10
20
30
base 0 30 60 90 120 150
Perc
en
tag
e c
han
ge f
rom
b
aselin
e (
%)
Time (minutes)
0
5
10
15
20
25
30
35
40
45
50
base 0 30 60 90 120 150
GL
P-1
co
nc. (p
g/m
l)
Time (minutes)
Figure 6.2 – hormone profiles of acylated ghrelin (A), PYY (B) and GLP-1 (C), for REST (●, solid line) and EX (○, dashed line). PYY data include percentage change from baseline curve (inserted, top right). Hollow block represents exercise. Solid block represents the ad libitum test meal. Values are mean ± SEM. * = exercise significantly difference to rest. † = significantly different to t=30 in EX.
† †
* * * *
*
(a) (b)
(c) (d)
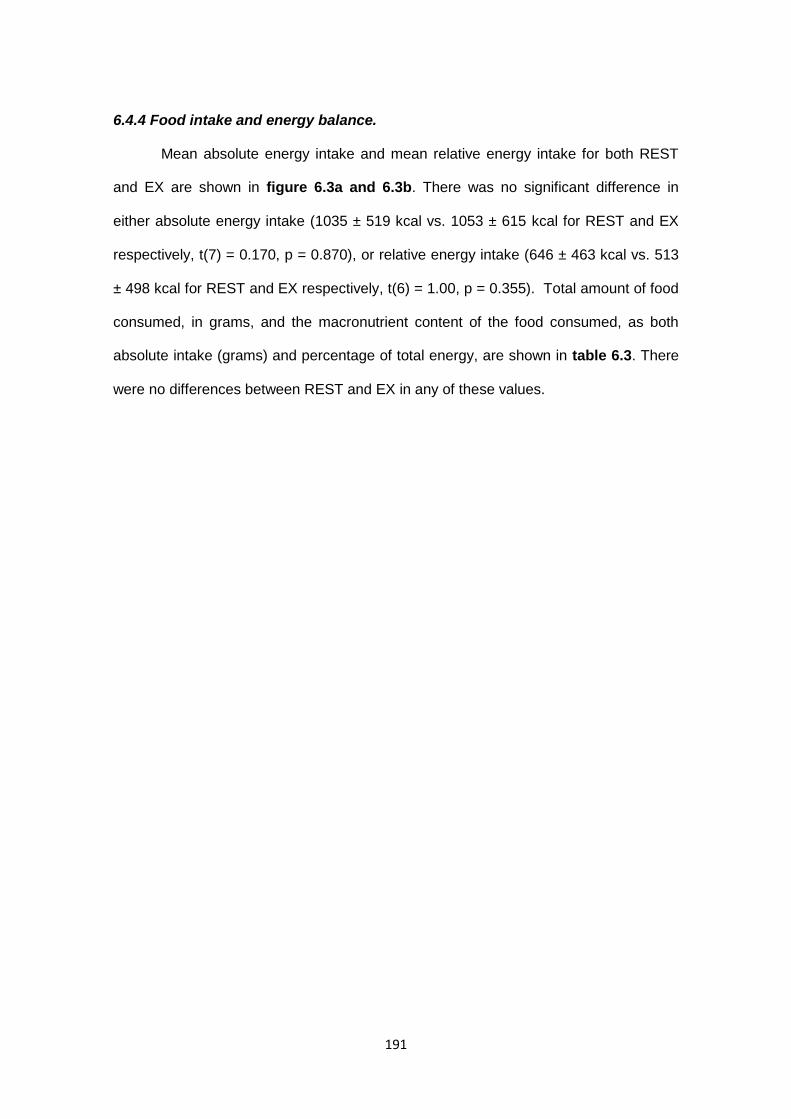
191
6.4.4 Food intake and energy balance.
Mean absolute energy intake and mean relative energy intake for both REST
and EX are shown in figure 6.3a and 6.3b. There was no significant difference in
either absolute energy intake (1035 ± 519 kcal vs. 1053 ± 615 kcal for REST and EX
respectively, t(7) = 0.170, p = 0.870), or relative energy intake (646 ± 463 kcal vs. 513
± 498 kcal for REST and EX respectively, t(6) = 1.00, p = 0.355). Total amount of food
consumed, in grams, and the macronutrient content of the food consumed, as both
absolute intake (grams) and percentage of total energy, are shown in table 6.3. There
were no differences between REST and EX in any of these values.
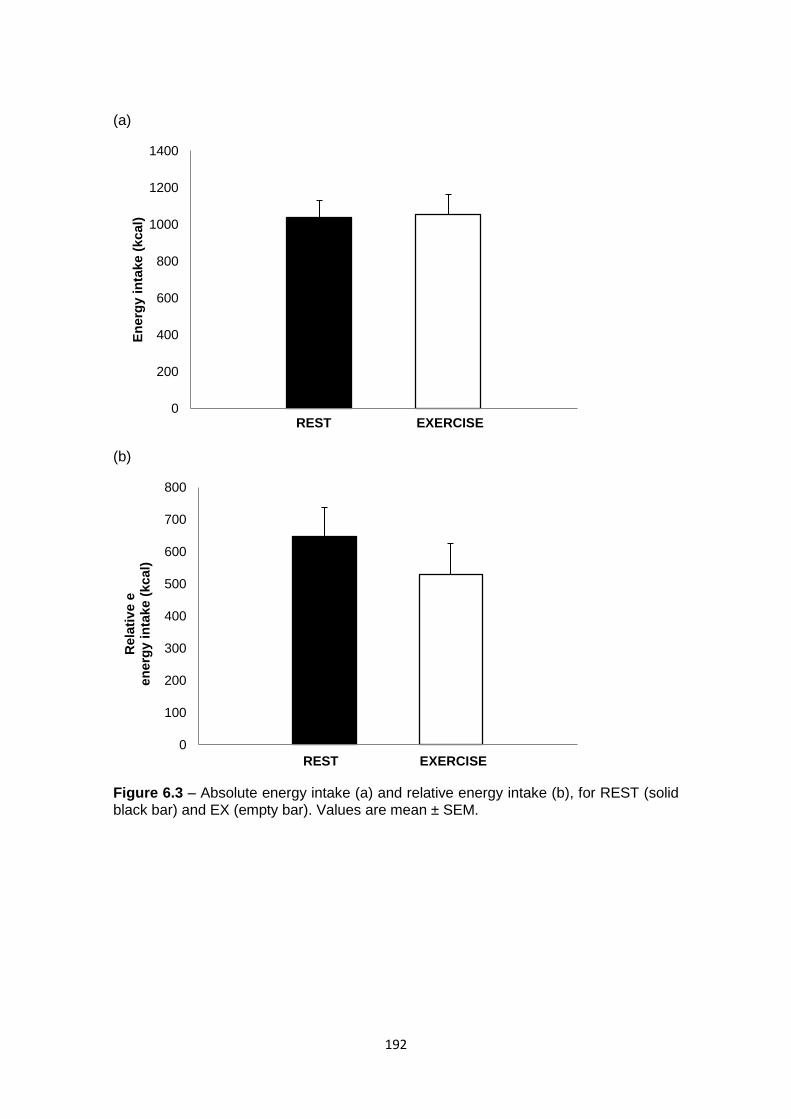
192
(a)
(b)
Figure 6.3 – Absolute energy intake (a) and relative energy intake (b), for REST (solid black bar) and EX (empty bar). Values are mean ± SEM.
0
200
400
600
800
1000
1200
1400 E
nerg
y i
nta
ke (
kcal)
0
100
200
300
400
500
600
700
800
Rela
tiv
e e
en
erg
y i
nta
ke (
kcal)
REST EXERCISE
REST EXERCISE
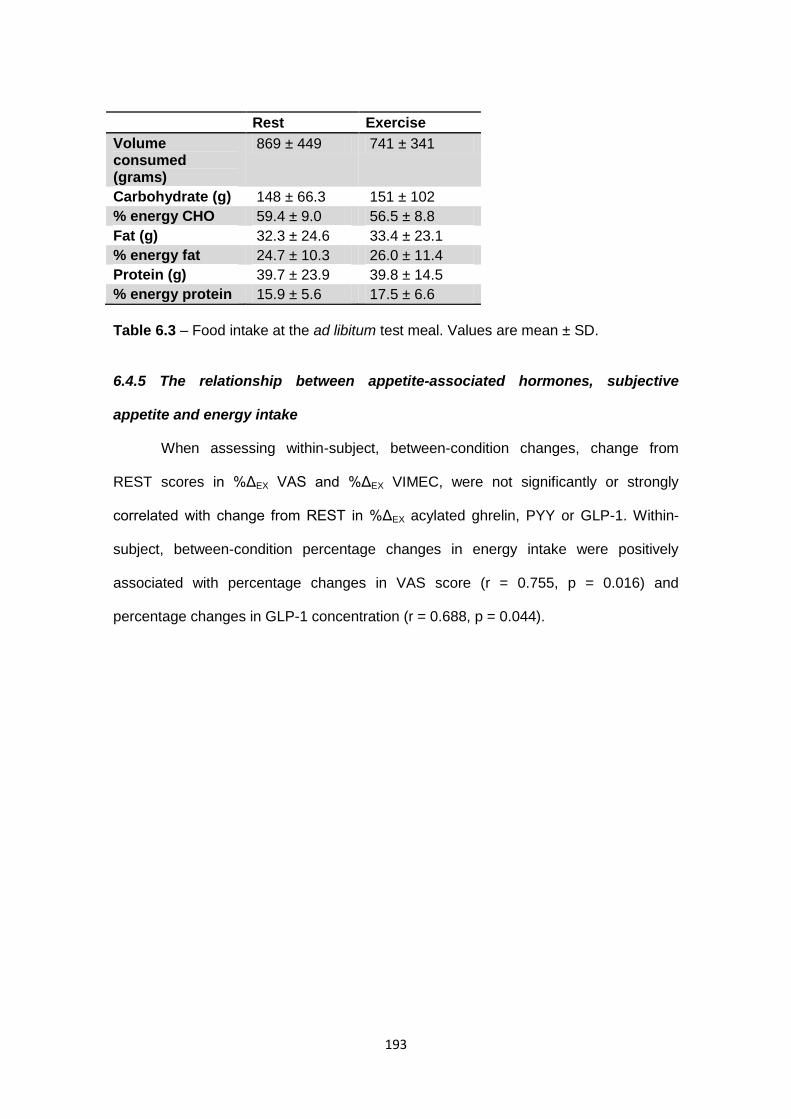
193
Rest Exercise
Volume consumed (grams)
869 ± 449 741 ± 341
Carbohydrate (g) 148 ± 66.3 151 ± 102
% energy CHO 59.4 ± 9.0 56.5 ± 8.8
Fat (g) 32.3 ± 24.6 33.4 ± 23.1
% energy fat 24.7 ± 10.3 26.0 ± 11.4
Protein (g) 39.7 ± 23.9 39.8 ± 14.5
% energy protein 15.9 ± 5.6 17.5 ± 6.6
Table 6.3 – Food intake at the ad libitum test meal. Values are mean ± SD.
6.4.5 The relationship between appetite-associated hormones, subjective
appetite and energy intake
When assessing within-subject, between-condition changes, change from
REST scores in %ΔEX VAS and %ΔEX VIMEC, were not significantly or strongly
correlated with change from REST in %ΔEX acylated ghrelin, PYY or GLP-1. Within-
subject, between-condition percentage changes in energy intake were positively
associated with percentage changes in VAS score (r = 0.755, p = 0.016) and
percentage changes in GLP-1 concentration (r = 0.688, p = 0.044).
194
6.5 DISCUSSION
The aim of this study was to assess the effect of sprint interval cycling exercise
on subjective appetite, food intake and plasma concentration of appetite-associated
hormones, in overweight and obese individuals. Just 4 x 30 seconds of maximal effort
sprint cycling was sufficient to elicit a transient suppression of subjective appetite,
compared with a resting condition. However, as is often the case with exercise-induced
appetite suppression, this effect was short-lived, with no significant difference in VAS
score or VIMEC score between the exercise and resting conditions 60 minutes post-
exercise. The absence of a difference in subjective appetite at this time was allied with
no difference in food intake at the ad libitum test meal, administered 2 hours after
exercise. Mean energy intake was very similar between the two conditions, differing by
only 18 kcal (1.7%). When accounting for the energy cost of both rest and exercise,
relative energy intake, despite being 20% lower in the exercise trial, was not
significantly different between conditions. This finding – a transient suppression of
appetite, with no consequent influence on food intake – is in agreement with the
findings of previous investigation into the effect of sprint interval exercise on appetite in
healthy-weight individuals. (Deighton et al., 2012; Deighton et al., 2013). Further, this
response to sprint interval exercise is analogous to the typical response to high-
intensity, continuous aerobic exercise (King et al., 2010; King et al., 2011b; King et al.,
1997a; Schubert et al., 2013; Thompson et al., 1988). This was despite a very low
energy cost of the exercise. In the current study, the mean energy expenditure for the
exercise bout (including recovery period between repetitions) was estimated to 152
kcal and the total duration of the bout was 17 minutes, with a total of only 2 minutes
worth of effort. Therefore the energy cost and duration of exercise were very low. The
protocol utilised by Deighton et al. (Deighton et al., 2012) of 6 x 30 seconds maximal
effort cycling yielded an energy cost of 142 kcal, although this was estimated, as
195
opposed to measured, so may have been an underestimate. Irrespective of this, to the
author’s best knowledge, a suppression of appetite has not previously been observed
with such a short exercise bout. Furthermore, this data would suggest the absence of
an exercise duration or energy expenditure threshold for exercise-induce appetite
suppression.
As stated earlier, food intake at the ad libitum test meal did not differ between
conditions. This is in line with previous literature, when ad libitum food intake measures
are obtained ≥60 minutes post-exercise (King et al., 2010; King et al., 2011b; King et
al., 1997b; Schubert et al., 2013; Thompson et al., 1988). Despite no difference in food
and energy intake being a common observation, the calculation of relative energy
intake, accounting for the energy expenditure of the exercise bout, often yields a
significant energy deficit in an exercise condition, when absolute energy intake is
unaffected (Imbeault et al., 1997; King et al., 2010; Lluch et al., 2000; Unick et al.,
2010) or even increased (Martins et al., 2007; Pomerleau et al., 2004), post-exercise.
This was not the case in the present study, with relative energy intake similar between
both the resting and exercise trials. As previously mentioned, the energy expenditure of
the sprint interval exercise bout was low, at just 152 kcal. Such a low energy
expenditure was evidently insufficient to generate even an acute energy deficit,
compared with the resting condition. While it was first considered that the absence of
an observed difference was due to lack of statistical power, a power calculation, based
on the data collected, suggested that a sample size of 135 participants would be
required to observed a statistically significant difference (alpha = 0.05, power of test =
0.8). In addition, there was no evidence of excess post-exercise oxygen consumption
(EPOC). EPOC has consistently been shown after high intensity exercise (Phelain et
al., 1997) and intermittent supramaximal exercise (Bahr et al., 1992), and therefore
may have been expected after even such a short bout as completed in the present
study. It is possible that the exercise bout was too short, as it has been shown that
196
EPOC is, to some respect, dependent on duration of exercise (see Børsheim and Bahr,
2003). It is also possible that the recovery period measure of expired gas, used to
calculate energy expenditure, was collected too late to detect any EPOC. This measure
was obtained 30 minutes post-exercise. It has previously been shown that EPOC can
occur for up to 3 hours post-high-intensity aerobic exercise (Phelain et al., 1997) and
for up to 30 minutes after just 1 x 2 minutes of supramaximal exercise (Bahr et al.,
1992). While these data would suggest that the timing of the measurement in the
present study should have detected any EPOC, it may have been preferable to obtain
more than one measurement during this recovery period: one in close proximity to the
cessation of exercise (≤15 minutes). Nonetheless, the contribution of EPOC to total
energy expenditure associated with an exercise bout has been postulated to be low –
6-15% (Laforgia et al., 2006). Therefore, any inaccuracy in this measure is unlikely to
cause substantial error in a relative energy balance calculation.
The suppression of subjective appetite was allied with changes in appetite-
associated hormones, in favour of an anorexigenic state. Acylated ghrelin was
suppressed immediately after exercise and continued to fall, with the lowest
concentration observed 30 minutes post-exercise. At this point, plasma concentration
was 64% lower than the corresponding time point in the resting trial and had fallen 53%
from baseline. While decreases in acylated ghrelin are usually transient, after both
continuous (Broom et al., 2009; Broom et al., 2007; King et al., 2010; King et al.,
2011a; Shiiya et al., 2011) and interval exercise (Deighton et al., 2012), concentrations
remained lower than those of the resting trial for the entire two-hour post-exercise
period, until the test meal. To the knowledge of the author, this is the most enduring
post-exercise suppression of acylated ghrelin observed. The suppression of acylated
ghrelin post-exercise contrasts previous observations of no response (Dall et al., 2002;
Kraemer et al., 2004; Martins et al., 2007; Schmidt et al., 2004), or an increase
(Larson-Meyer et al., 2012; Russel et al., 2009) in total ghrelin after exercise. This
197
finding further strengthens the notion that acylated and non-acylated ghrelin respond
differently to acute bouts of exercise (Shiiya et al., 2011), while also suggesting that
acylated ghrelin may be yet more responsive to supramaximal intensity exercise,
evidenced by the prolonged suppression observed in the present study.
GLP-1 proved less responsive to exercise. Plasma concentrations increased
non-significantly with exercise (by 17%), resulting in values being 15% higher in the
exercise condition, versus rest. Interestingly, the GLP-1 concentration continued to
increase steadily post-exercise, peaking at t=90, leading to a significantly greater AUC
for the entire trial period in the exercise condition, allied with the main effect of
condition. Existing literature regarding the effect of exercise on plasma GLP-1
concentration is limited. Martins et al. (Martins et al., 2007) reported a significant
increase in GLP-1 after intermittent cycling exercise at 65% of estimated maximal heart
rate (3 x 17 minutes with 3 minutes recovery), in healthy-weight individuals. While
concentration remained higher than corresponding measures in a resting trial at 30
minutes post-exercise, the increase was transient, unlike the sustained increase
observed in the present study. Ueda and co-workers showed a sustained but modest,
significant increase in GLP-1 concentrations after both moderate- and high-intensity
exercise in both lean and obese individuals. (Ueda et al., 2009a; Ueda et al., 2009b).
To the best knowledge of the author, this is the first study that has assessed changes
in plasma GLP-1 concentration after high-intensity, intermittent exercise. This data
would suggest that the response to this form of exercise is similar to that observed with
longer duration, continuous exercise of a lower intensity.
It has previously been suggested that prior exercise may sensitise GLP-1 to
food ingestion, with an increased acute GLP-1 response to a liquid meal post-exercise
(Chanoine et al., 2008). In addition, regular exercise would appear to increase the
postprandial secretion of satiety peptides after a standardised test meal (Guelfi et al.,
2013; Martins et al., 2010). Here, we witnessed a greater increase in GLP-1 after the
198
ad libitum test meal in the exercise condition (17% vs. 11% in the resting condition).
While this intake was ad libitum and not therefore controlled to be the same across
both conditions, energy intake varied to such a small degree (1.7%), that it is
acceptable to assume that any differing GLP-1 response to the test meal is not due to
differences in energy consumed. While this difference is small, it may provide further
evidence that prior exercise can sensitise satiation-signalling mechanisms during
feeding.
PYY concentration also exhibited a modest response to sprint interval cycling,
with a non-significant increase of 23%. Further, all but one of the participants for which
PYY concentration data was available, demonstrated an increase in PYY with exercise.
This increase was transient, with concentration falling immediately upon ceasing
exercise and returning to baseline 30 minutes post-exercise. Deighton et al. (Deighton
et al., 2012) also did not observe a significant increase in PYY3-36 concentration
following sprint interval exercise, with an increase of ~30% immediately post-exercise.
PYY is commonly responsive to high-intensity, continuous aerobic exercise, of longer
duration and greater energy cost (Broom et al., 2009; Larson-Meyer et al., 2012;
Martins et al., 2007; Russel et al., 2009; Ueda et al., 2009a; Ueda et al., 2009b).
Although, it should be noted that when significant increases in PYY concentrations are
observed with such exercise, the magnitude of increase is often similarly modest to the
non-significant increase seen in the present study (Broom et al., 2009; Martins et al.,
2007; Russel et al., 2009; Ueda et al., 2009b), suggesting that the response to sprint
interval exercise may not be dissimilar to continuous, aerobic exercise of a high
intensity. It is possible that the failure to observe a significant elevation in the present
study is due to lack of statistical power, with a sample size of just 7 for hormone
analysis.
These non-uniform changes in appetite-associated hormones led us to examine
which change may be the strongest driver of changes in subjective appetite. As
199
opposed to investigating the more commonly-assessed relationships of between-
subject, within-condition differences, it was decided to investigate within-subject
changes between the two conditions for each of the variables. This was considered a
more appropriate approach to investigating the likely regulatory role of appetite-
associated hormones on subjective appetite and energy intake. Within-subject,
between-condition percentage changes with exercise for VAS and VIMEC scores were
not correlated with percentage change in any of the three hormones. However,
unexpectedly, changes in GLP-1 were positively associated with changes in energy
intake. Due to the well-established anorexigenic effect of GLP-1, this would suggest a
dissociation between hormonal signals of appetite and energy intake with exercise.
Considering these data, it would appear that changes in acylated ghrelin, PYY and
GLP-1 with exercise may not play a key regulatory role in subjective appetite during the
post-exercise period, or in post-exercise food intake.
The exercise-induced suppression of appetite, compared with the resting
condition was observed with the VAS method of measurement, but no significant
differences were present with the VIMEC measure. Absolute and relative differences
failed to reach statistical significance despite being rather large. For instance, VIMEC
score dropped by 56%, or 166 kcal, after exercise and the score obtained immediately
post-exercise was 76% (414 kcal) lower in the exercise condition, compared with the
resting condition. Further, the area under the curve value for the post-exercise, pre-test
meal period was 31% lower in the exercise condition. The lack of statistical significance
for these differences is due, in part, to large between-subject variation in the VIMEC
measure. The mean coefficient of variation for VIMEC measures was 47.4%, compared
with 35.2% for VAS measures, indicating a larger spread of values across participants
at each measure. The nature of the VIMEC method, offering the participant a
considerable choice of food options, lends itself to a larger degree of variability.
200
However, it may be the case that this leads to a poorer degree of sensitivity of the
measure.
Another reason for the failure to observe statistical significance despite
considerable absolute and relative differences is lack of statistical power, due to a
small sample size. Eight participants completed the study, but we failed to obtain blood
samples from one individual, meaning that all hormone analysis was completed for
seven participants. Due to the difficulty in recruiting participants from this study
population to complete such an intense exercise bout, a larger sample size was not
successfully achieved. One participant was excluded due to high resting acylated
ghrelin concentrations (>2 SD from the mean) and a further two participants withdrew
after the initial pre-testing session.
In conclusion, a single bout of sprint interval exercise, consisting of just 4 x 30
seconds maximal effort cycling was sufficient to elicit a transient suppression of
subjective appetite in overweight and obese individuals. This was accompanied by a
sustained lowering of the orexigenic hormone acylated ghrelin, to an extent rarely
previously observed with continuous submaximal exercise, and more modest increases
in anorexigenic hormones. However, changes in appetite-associated hormones did not
correlate strongly with changes in appetite, which brings into question the role of such
hormones in the regulation of post-exercise appetite. Nonetheless, food intake was not
affected by exercise, with no difference between the exercise condition and the resting
condition in food intake at the test meal two-hours post-exercise. Further, when
accounting for the energy expenditure of exercise, relative energy intake also did not
differ between conditions. Therefore, it remains questionable whether high intensity
interval exercise could elicit a suppression of appetite sufficient to impact upon short-
term food intake and hence favour an acute energy deficit.
201
6.6 REFERENCES
Babraj, J., Vollaard, N., Keast, C., Guppy, F., Cottrell, G., and Timmons, J. (2009). Extremely short duration high intensity interval training substantially improves insulin action in young healthy males. BMC Endocrine Disorders 9, 3. Bahr, R., Grønnerød, O., and Sejersted, O.M. (1992). Effect of supramaximal exercise on excess postexercise O2 consumption. Medicine and science in sports and exercise 24, 66-71. Bartlett, J.D., Close, G.L., MacLaren, D.P.M., Gregson, W., Drust, B., and Morton, J.P. (2011). High-intensity interval running is perceived to be more enjoyable than moderate-intensity continuous exercise: Implications for exercise adherence. Journal of Sports Sciences 29, 547-553. Bartlett, J.D., Hwa Joo, C., Jeong, T.-S., Louhelainen, J., Cochran, A.J., Gibala, M.J., Gregson, W., Close, G.L., Drust, B., and Morton, J.P. (2012). Matched work high-intensity interval and continuous running induce similar increases in PGC-1α mRNA, AMPK, p38, and p53 phosphorylation in human skeletal muscle. Journal of Applied Physiology 112, 1135-1143. Borg, G.A.V. (1973). "Perceived exertion: a note on history and methods". Medicine and Science in Sports & Exercise 5, 90-93. Børsheim, E., and Bahr, R. (2003). Effect of exercise intensity, duration and mode on post-exercise oxygen consumption. Sports Med 33, 1037-1060. Boutcher, S.H. (2011). High-intensity intermittent exercise and fat loss. Journal of Obesity 2011. Broom, D.R., Batterham, R.L., King, J.A., and Stensel, D.J. (2009). Influence of resistance and aerobic exercise on hunger, circulating levels of acylated ghrelin, and peptide YY in healthy males. American Journal of Physiology-Regulatory Integrative and Comparative Physiology 296, R29-R35. Broom, D.R., Stensel, D.J., Bishop, N.C., Burns, S.F., and Miyashita, M. (2007). Exercise-induced suppression of acylated ghrelin in humans. J Appl Physiol 102, 2165-2171. Burgomaster, K.A., Heigenhauser, G.J.F., and Gibala, M.J. (2006). Effect of short-term sprint interval training on human skeletal muscle carbohydrate metabolism during exercise and time-trial performance. Journal of Applied Physiology 100, 2041-2047. Burgomaster, K.A., Howarth, K.R., Phillips, S.M., Rakobowchuk, M., MacDonald, M.J., McGee, S.L., and Gibala, M.J. (2008). Similar metabolic adaptations during exercise after low volume sprint interval and traditional endurance training in humans. The Journal of Physiology 586, 151-160. Burgomaster, K.A., Hughes, S.C., Heigenhauser, G.J.F., Bradwell, S.N., and Gibala, M.J. (2005). Six sessions of sprint interval training increases muscle oxidative potential and cycle endurance capacity in humans. Journal of Applied Physiology 98, 1985-1990.
202
Burns, S.F., Broom, D.R., Miyashita, M., Mundy, C., and Stensel, D.J. (2007). A single session of treadmill running has no effect on plasma total ghrelin concentrations. Journal of Sports Sciences 25, 635-642. Chanoine, J.-P., Mackelvie, K.J., Barr, S.I., Wong, A.C.K., Meneilly, G.S., and Elahi, D.H. (2008). GLP-1 and appetite responses to a meal in lean and overweight adolescents following exercise. Obesity 16, 202-204. Dall, R., Kanaley, J., Hansen, T., Moller, N., Christiansen, J., Hosoda, H., Kangawa, K., and Jorgensen, J. (2002). Plasma ghrelin levels during exercise in healthy subjects and in growth hormone-deficient patients. Eur J Endocrinol 147, 65-70. Deighton, K., Barry, R., Connon, C., and Stensel, D. (2012). Appetite, gut hormone and energy intake responses to low volume sprint interval and traditional endurance exercise. Eur J Appl Physiol, 1-10. Deighton, K., Karra, E., Batterham, R.L., and Stensel, D.J. (2013). Appetite, energy intake and PYY3-36 responses to energy-matched continuous exercise and submaximal high intensity exercise. Applied Physiology, Nutrition, and Metabolism. Dodd, C.J., Welsman, J.R., and Armstrong, N. (2008). Energy intake and appetite following exercise in lean and overweight girls. Appetite 51, 482-488. George, V.A., and Morganstein, A. (2003). Effect of moderate intensity exercise on acute energy intake in normal and overweight females. Appetite 40, 43-46. Guelfi, K.J., Donges, C.E., and Duffield, R. (2013). Beneficial effects of 12 weeks of aerobic compared with resistance exercise training on perceived appetite in previously sedentary overweight and obese men. Metabolism 62, 235-243. Helgerud, J., Hoydal, K., Wang, E., Karlsen, T., Berg, P., Bjerkaas, M., Simonsen, T., Helgesen, C., Hjorth, N., Bach, R., and Hoff, J. (2007). Aerobic high-intensity intervals improve VO2max more than moderate training. Medicine & Science in Sports & Exercise 39, 665-671. Hill, A.J., and Blundell, J.E. (1982). Nutrients and behaviour: Research strategies for the investigation of taste characteristics, food preferences, hunger sensations and eating patterns in man. Journal of Psychiatric Research 17, 203-212. Imbeault, P., Saint-Pierre, S., Alm?Ras, N., and Tremblay, A. (1997). Acute effects of exercise on energy intake and feeding behaviour. British Journal of Nutrition 77, 511-521. Kawano, H., Mineta, M., Asaka, M., Miyashita, M., Numao, S., Gando, Y., Ando, T., Sakamoto, S., and Higuchi, M. (2013). Effects of different modes of exercise on appetite and appetite-regulating hormones. Appetite 66, 26-33. King, J.A., Miyashita, M., Wasse, L.K., and Stensel, D.J. (2010). Influence of prolonged treadmill running on appetite, energy intake and circulating concentrations of acylated ghrelin. Appetite 54, 492-498.
203
King, J.A., Wasse, L.K., Ewens, J., Crystallis, K., Emmanuel, J., Batterham, R.L., and Stensel, D.J. (2011a). Differential acylated ghrelin, peptide YY3-36, appetite, and food intake responses to equivalent energy deficits created by exercise and food restriction. Journal of Clinical Endocrinology & Metabolism 96, 1114-1121. King, J.A., Wasse, L.K., and Stensel, D.J. (2011b). The acute effects of swimming on appetite, food intake, and plasma acylated ghrelin. Journal of Obesity 2011. King, N.A., Burley, V.J., and Blundell, J.E. (1994). Exercise induced suppression of appetite: effects on food intake and implications for energ balance. European Journal of Clinical Nutrition 48, 715-724 King, N.A., Lluch, A., Stubbs, R.J., and Blundell, J.E. (1997a). High dose exercise does not increase hunger or energy intake in free living males. Eur J Clin Nutr 51, 478-483. King, N.A., Tremblay, A., and Blundell, J.E. (1997b). Effects of exercise on appetite control: implications for energy balance. Medicine & Science in Sports & Exercise 29, 1076-1089. Kissileff, H.R., Pi-Sunyer, F.X., Segal, K., Meltzer, S., and Foelsch, P.A. (1990). Acute effects of exercise on food intake in obese and nonobese women. American Journal of Clinical Nutrition 52, 240-245. Kraemer, R.R., Durand, R.J., Acevedo, E.O., Johnson, L.G., Kraemer, G.R., Hebert, E.P., and Castracane, V.D. (2004). Rigorous running increases growth hormone and insulin-like growth factor-i without altering ghrelin. Experimental Biology and Medicine 229, 240-246. Laforgia, J., Withers, R.T., and Gore, C.J. (2006). Effects of exercise intensity and duration on the excess post-exercise oxygen consumption. Journal of Sports Sciences 24, 1247-1264. Larson-Meyer, D.E., Palm, S., Bansal, A., Austin, K.J., Hart, A.M., and Alexander, B.M. (2012). Influence of running and walking on hormonal regulators of appetite in women. Journal of Obesity 2012, 15. Little, J.P., Gillen, J.B., Percival, M.E., Safdar, A., Tarnopolsky, M.A., Punthakee, Z., Jung, M.E., and Gibala, M.J. (2011). Low-volume high-intensity interval training reduces hyperglycemia and increases muscle mitochondrial capacity in patients with type 2 diabetes. Journal of Applied Physiology 111, 1554-1560. Lluch, A., King, N.A., and Blundell, J.E. (2000). No energy compensation at the meal following exercise indietary restrained and unrestrained women. British Journal of Nutrition 84, 219-225. Martins, C., Kulseng, B., King, N.A., Holst, J.J., and Blundell, J.E. (2010). The effects of exercise-induced weight loss on appetite-related peptides and motivation to eat. Journal of Clinical Endocrinology & Metabolism 95, 1609-1616. Martins, C., Morgan, L.M., Bloom, S.R., and Robertson, M.D. (2007). Effects of exercise on gut peptides, energy intake and appetite. J Endocrinol 193, 251-258.

204
Marzullo, P., Salvadori, A., Brunani, A., Verti, B., Walker, G.E., Fanari, P., Tovaglieri, I., Medici, C.D., Savia, G., and Liuzzi, A. (2008). Acylated ghrelin decreases during acute exercise in the lean and obese state. Clinical Endocrinology 69, 970-971. Phelain, J.F., Reinke, E., Harris, M.A., and Melby, C.L. (1997). Postexercise energy expenditure and substrate oxidation in young women resulting from exercise bouts of different intensity. Journal of the American College of Nutrition 16, 140-146. Pomerleau, M., Imbeault, P., Parker, T., and Doucet, E. (2004). Effects of exercise intensity on food intake and appetite in women. Am J Clin Nutr 80, 1230-1236. Reid, C.H., CG. Blundell, JE. Stubbs, RJ (1998). What are psychometric assessments of appetite asking: a preliminary multivariate analysis. International Journal of Obesity 22, 151. Russel, R.R., Willis, K.S., Ravussin, E., and Larson-Meyer, E.D. (2009). Effects of endurance running and dietary fat on circulating ghrelin and peptide YY. Journal of sports science & medicine 8, 574-583. Schmidt, A., Maier, C., Schaller, G., Nowotny, P., Bayerle-Eder, M., Buranyi, B., Luger, A., and Wolzt, M. (2004). Acute exercise has no effect on ghrelin plasma concentrations. Horm Metab Res 36, 174-177. Schubert, M.M., Desbrow, B., Sabapathy, S., and Leveritt, M. (2013). Acute exercise and subsequent energy intake. A meta-analysis. Appetite 63, 92-104. Shiiya, T., Ueno, H., Toshinai, K., Kawagoe, T., Naito, S., Tobina, T., Nishida, Y., Shindo, M., Kangawa, K., Tanaka, H., Nakazato, M. (2011). Significant lowering of plasma ghrelin but not des-acyl ghrelin in response to acute exercise in men. Endocrine journal 58, 335-342. Sim, A.Y., Wallman, K.E., Fairchild, T.J., and Guelfi, K.J. (2013). High-intensity intermittent exercise attenuates ad-libitum energ intake. International Journal of Obesity advance online publication. Stubbs, R.J., Hughes, D.A., Johnstone, A.M., Rowley, E., Reid, C., Elia, M., Stratton, R., Delargy, H., King, N., and Blundell, J.E. (2000). The use of visual analogue scales to assess motivation to eat in human subjects: a review of their reliability and validity with an evaluation of new hand-held computerized systems for temporal tracking of appetite ratings. Br J Nutr 84, 405-415. Thompson, D.A., Wolfe, L.A., and Eikelboom, R. (1988). Acute effects of exercise intensity on appetite in young men. Medicine & Science in Sports & Exercise 20, 222-227. Trapp, E.G., Chisholm, D.J., Freund, J., and Boutcher, S.H. (2008). The effects of high-intensity intermittent exercise training on fat loss and fasting insulin levels of young women. Int J Obes 32, 684-691. Ueda, S.-y., Yoshikawa, T., Katsura, Y., Usui, T., and Fujimoto, S. (2009a). Comparable effects of moderate intensity exercise on changes in anorectic gut hormone levels and energy intake to high intensity exercise. Journal of Endocrinology 203, 357-364.
205
Ueda, S.-y., Yoshikawa, T., Katsura, Y., Usui, T., Nakao, H., and Fujimoto, S. (2009b). Changes in gut hormone levels and negative energy balance during aerobic exercise in obese young males. J Endocrinol, JOE-08-0500. Unick, J.L., Otto, A.D., Goodpaster, B.H., Helsel, D.L., Pellegrini, C.A., and Jakicic, J.M. (2010). Acute effect of walking on energy intake in overweight/obese women. Appetite 55, 413-419. Westerterp-Plantenga, M.S., Verwegen, C.R., Ijedema, M.J., Wijckmans, N.E., and Saris, W.H. (1997). Acute effects of exercise or sauna on appetite in obese and nonobese men. Physiology & Behavior 62, 1345-1354. Whyte, L.J., Gill, J.M.R., and Cathcart, A.J. (2010). Effect of 2 weeks of sprint interval training on health-related outcomes in sedentary overweight/obese men. Metabolism 59, 1421-1428.
206
CHAPTER 7
Matching energy intake to expenditure of isocaloric exercise at
high and moderate intensities
207
7.1 ABSTRACT
Background: Those seeking to manage their bodyweight use a variety of strategies,
but the most common approaches involve attempting to exercise more and/or consume
fewer calories (Weiss et al., 2006). A poor comprehension of the energy cost of
exercise and the energy content of food may contribute to weight-gain and the poor
success rate of exercise weight-loss interventions.
Purpose: To investigate individuals’ ability to consciously match energy intake with
energy expenditure after isocaloric exercise at moderate and high intensity.
Method: In a counterbalanced cross-over study design, 14 low- to moderately-active,
lean individuals (7 male; mean age 23 ± 3 years; mean BMI 22.0 ± 3.2 kg·m-2)
completed both a moderate-intensity (60% VO2max, MOD) and a high-intensity (90%
VO2max, HIGH) exercise bout on a treadmill, matched for energy expenditure, EE, (450
kcal). Participants were blinded to the intensity and duration of each bout. Thirty
minutes post exercise, participants were presented with a buffet, where they were
asked to consume food in an attempt to match energy intake with the energy expended
during the exercise bout. This was termed the “matching task,” providing a matching
task energy intake value (EIMATCH). Upon finishing the matching task, a verbal estimate
of energy expenditure (EST) was obtained before the participant was allowed to return
to the buffet to consume any more food, if desired. This intake was covertly measured
and added to EIMATCH to obtain an ad libitum intake value (EIAD LIB.).
Results: A significant condition x task interaction showed that, in MOD, EST was
significantly lower than EE (298 ± 156 kcal vs. 443 ± 22 kcal, p = 0.01). In the HIGH
condition, EE, EIMATCH and EST were similar. In both conditions, participants tended to
over-eat to a similar degree, relative to EST, with EIMATCH 20% and 22% greater than
EST in MOD and HIGH respectively. Between-condition comparisons demonstrated
that EIMATCH and EST were significantly lower in MOD, compared with HIGH (374 ± 220
208
kcal vs. 530 ± 248 kcal, p = 0.002 and 298 ± 156 kcal vs. 431 ± 129 kcal, p = 0.002
respectively). For both conditions, EIAD LIB was approximately 2-fold greater than EE.
Discussion: Participants exhibited a strong ability to estimate exercise energy
expenditure after high-intensity exercise. Participants appeared to perceive moderate-
intensity exercise to be less energetic than an isocaloric bout of high-intensity exercise.
This may have implications for exercise recommendations for weight-loss strategies,
especially when casual approaches to exercise and attempting to eat less are being
implemented.
209
7.2 INTRODUCTION
With obesity statistics now demonstrating that 63% of adults and 30% of
children in England are overweight or obese (Health and Social Care Information
Centre, 2013), many individuals are seeking effective weight-management strategies.
Those seeking to manage their bodyweight, whether attempting to lose weight or avoid
weight-gain, use a variety of strategies to do so. The most common strategies involve
attempting to exercise more and/or consume fewer calories (Weiss et al., 2006). For
the effective implementation rather crude weight-loss strategies, such as undertaking
more regular exercise, eating less food and eating less fat, a sound appreciation of
energy expenditure and energy intake is desirable. It has been extensively
demonstrated that individuals are prone to underreporting energy intake when using
techniques such as food diaries (Hill and Davies, 2001; Livingstone et al., 1992;
Livingstone et al., 1990; Westerterp et al., 1986), with obese individuals likely to
underreport to a greater extent (Bandini et al., 1990; Prentice et al., 1986; Schoeller,
1995). A contributing factor to this underreporting may be individuals’ poor
understanding of the energy content of food (Brindal et al., 2012; Carels et al., 2007;
Pettigrew et al., 2013; Polivy, 1976) which, incidentally, has been suggested to be
particularly awry in relation to the energy cost of exercise (Blundell and King, 2000;
Blundell et al., 2003). Further, this may partly explain why exercise alone can prove an
unsuccessful weight-loss strategy (Blundell and King, 2000; King, 1999), with large
individual variability in response to increased exercise energy expenditure, when
individuals eat ad libitum (King et al., 2008).
To the best knowledge of the authors, only two studies have acutely and
directly assessed individuals’ ability to estimate acute energy expenditure and intake.
Harris and George (Harris and George, 2010) asked participants to estimate their
energy expenditure after a 60 minute bout of treadmill exercise, at 65% of predicted

210
maximum heart rate. Fifteen minutes post-exercise, an ad libitum buffet meal was
provided. The participants were then asked to estimate their energy intake at an ad
libitum meal. Estimated energy expenditure was significantly greater than the actual
energy expenditure of the exercise bout. Conversely, estimated energy intake was
significantly lower than actual intake, with participants eating almost twice as many
calories as estimated. Willbond and colleagues (Willbond S.M. et al., 2010) conducted
a similar study, but after exercise (a 200kcal and a 300kcal bout of treadmill running at
50% VO2peak), participants were asked to estimate the energy expenditure of the
exercise bout and then consume the caloric equivalent from a buffet meal. The energy
expenditure of exercise was significantly and substantially overestimated, with
estimates 3-4 fold greater than actual expenditure. Intake significantly exceeded
expenditure, by 2-3 fold. However, it may be argued that with such low total energy
cost of exercise, overcompensation is likely. In addition, it is likely that the perception of
energy cost of exercise is dependent on the intensity, as well as the duration of
exercise.
Therefore, the aim of this study was to assess individuals’ ability to match
energy intake with energy expenditure after isoenergetic bouts of moderate- and high-
intensity treadmill exercise. It is hypothesised that participants will overestimate the
expenditure of both exercise bouts, while underestimating the energy content of food,
resulting in a greater intake than expenditure. A secondary aim was to assess ad
libitum intake after high- and moderate-intensity isoenergetic treadmill exercise.
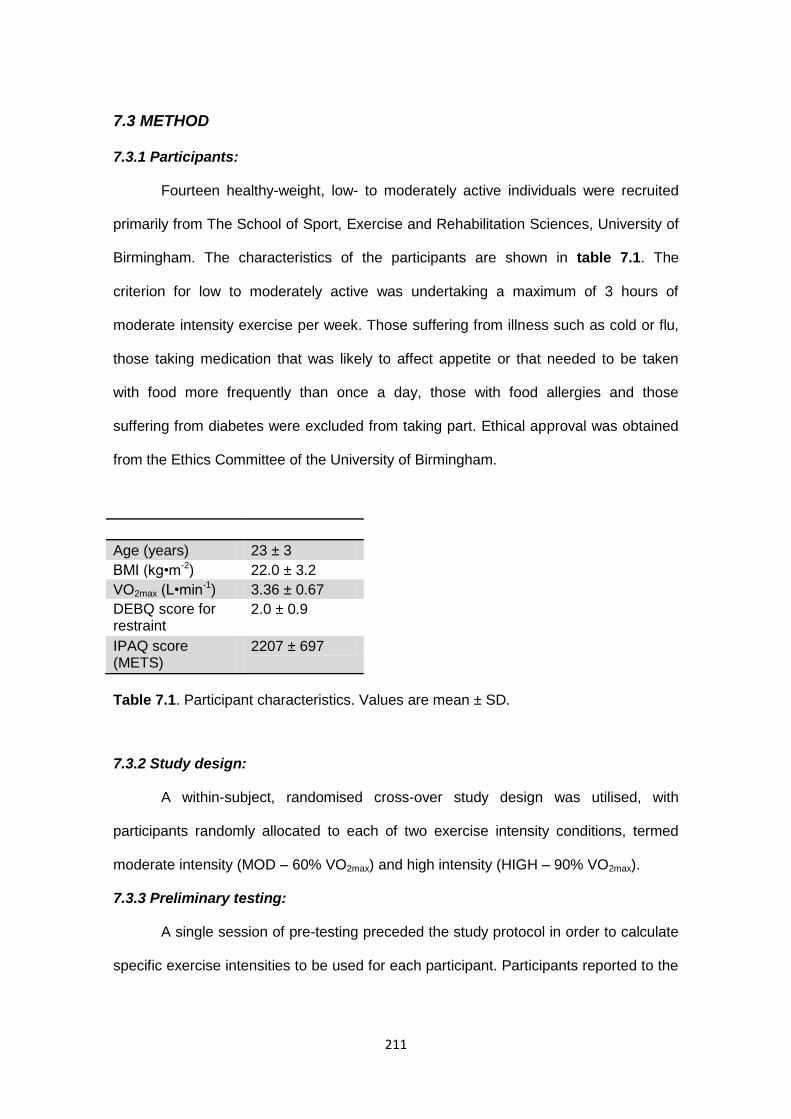
211
7.3 METHOD
7.3.1 Participants:
Fourteen healthy-weight, low- to moderately active individuals were recruited
primarily from The School of Sport, Exercise and Rehabilitation Sciences, University of
Birmingham. The characteristics of the participants are shown in table 7.1. The
criterion for low to moderately active was undertaking a maximum of 3 hours of
moderate intensity exercise per week. Those suffering from illness such as cold or flu,
those taking medication that was likely to affect appetite or that needed to be taken
with food more frequently than once a day, those with food allergies and those
suffering from diabetes were excluded from taking part. Ethical approval was obtained
from the Ethics Committee of the University of Birmingham.
Age (years) 23 ± 3
BMI (kg•m-2) 22.0 ± 3.2
VO2max (L•min-1) 3.36 ± 0.67
DEBQ score for restraint
2.0 ± 0.9
IPAQ score (METS)
2207 ± 697
Table 7.1. Participant characteristics. Values are mean ± SD.
7.3.2 Study design:
A within-subject, randomised cross-over study design was utilised, with
participants randomly allocated to each of two exercise intensity conditions, termed
moderate intensity (MOD – 60% VO2max) and high intensity (HIGH – 90% VO2max).
7.3.3 Preliminary testing:
A single session of pre-testing preceded the study protocol in order to calculate
specific exercise intensities to be used for each participant. Participants reported to the
212
Exercise Metabolism Laboratory, in the School of Sport, Exercise and Rehabilitation
Sciences, University of Birmingham after an overnight fast. The participant information
pack was administered and explained and the participant was given the opportunity to
ask any questions regarding the study, prior to providing written consent for their
participation. A health questionnaire was completed as a means of a health screening
procedure, The International Physical Activity Questionnaire (IPAQ, Appendix 8) was
completed as a measure of habitual physical activity and the Dutch Eating Behaviour
Questionnaire (DEBQ; (van Strien et al., 1986)) was completed to screen for restrained
eating behaviour. Height and weight were then recorded. An incremental exercise test
to volitional exhaustion was then completed on a motorised treadmill (H/P/ Cosmos.
Nuẞdorf, Germany) in order to obtain VO2max, and HRmax values and to establish the
relationship between running speed and rate of oxygen uptake. To achieve this, the
test comprised of two components: a constant gradient, steady-state component during
which the relationship between running speed and rate of oxygen uptake was
calculated; followed by a rapid speed and gradient increase component, from which
maximum oxygen uptake (VO2max) was calculated. The test began at a speed of 6 km
h-1 and a gradient of 1%. Each stage in the initial section of the test lasted 3 minutes.
The speed was increased to 8 km•h-1 at stage 2 and 10 km•h-1 at stage 3. From there
on, the speed increased by 1 km•h-1 at each stage with the gradient remaining constant
at 1%. This protocol was followed until an RER of 1.00 was reached. At this point,
component two of the test commenced. Stages were shortened to 1 minute in duration
and with each stage, speed or gradient increased in alternating fashion, by 1 km h-1
and 1% respectively. Participants were adjudged to have reached the end of the test
when they voluntarily stopped running, if VO2 ceased to increase with increasing
workload or if it was felt that the participant was struggling to maintain the speed of the
treadmill belt. Breath-by-breath measures of exhaled gas, averaged every eight
breaths, were recorded using Oxycon Pro (Jaeger, Wuerzburg, Germany) apparatus.

213
Prior to incremental exercise test, the gas analysers were calibrated using a calibration
gas (BOC Gases, Guildford, Surry, UK) of mixed, known concentrations of O2 (14.99%)
and CO2 (5.04%) and volume was calibrated using a 3 litre calibration syringe (Jaeger,
Wuerzburg, Germany). Exhaled gas was collected throughout the entire test, but
submaximal VO2 values were obtained for each stage during the steady-state
component of the test only from air collected during the final minute of the 3 minute
stage. VO2max was calculated as the highest average value obtained for any one minute
period. From the VO2max value obtained, linear regression was used to calculate an
estimate for the speed that would elicit the desired VO2 for each exercise session,
equating to exercise intensities of 60% and 90% VO2max.
7.3.4 Procedures & protocol:
After a minimum period of 3 days after pre-testing, participants returned to the
Exercise Metabolism Laboratory after a 10 hour overnight fast for the first of two
exercise trials. Trials were separated by a minimum period of 14 days. Participants
were provided with a standardised breakfast meal. This consisted of two slices of toast
(Thick slice, 50/50 bread, ~90g), margarine (~16g), jam (mixed fruit, ~30g) with a
choice of orange or apple juice (~200ml). The approximate energy content of this meal
was 415 kcal (71% energy from carbohydrate, 19% from fat and 10% protein), based
on the addition of jam and selection of orange juice. Once the breakfast was
consumed, the participant began a two-hour rest period before the exercise bout
commenced. The participant remained sedentary within the laboratory, leaving them
free to watch television, read or use a computer.
At the end of this resting period, the exercise bout commenced. The exercise
bout consisted of jogging/running on a motorised treadmill until an energy target of 450
kcal was reached. For two participants, whose VO2max values were lower than 2.5
L•min-1, this target was revised to 400 kcal. This was done to ensure that the HIGH
bout was manageable and also to limit between-subject variation in exercise duration.
214
In the MOD condition, the treadmill was set at a speed estimated to elicit an intensity of
60% VO2max. In the HIGH condition, the treadmill was set at a speed estimated to elicit
an intensity of 90% VO2max. During both trials, exhaled gas was collected intermittently,
with 2 minute samples collected at approximately 10 minute intervals. Breath-by-breath
measures of exhaled air, averaged every eight breaths, were recorded using Oxycon
Pro (Jaeger, Wuerzburg, Germany) apparatus, allowing for real-time feedback. This
allowed for the speed of the treadmill and the duration of the bout to be altered to
ensure the target exercise intensity and target energy expenditure were attained. From
the exhaled gas collection, VO2 and RER were recorded and used to calculate energy
expenditure. In addition, measures of heart rate were obtained using a heart rate
monitor (Polar, S625X; Polar Electro Oy, Kempele, Finland) for the entirety of the bout
and ratings of perceived exertion, using the Borg Scale (Borg, 1973), were obtained at
5 minute intervals. Throughout both exercise trials, the participant was blinded to the
speed and duration of the bout. The only verbal feedback provided, was to inform the
participant that they were approximately half way through the bout.
Upon completing the exercise bout, the participant was free to shower and
change, before being escorted to the research kitchen facility to complete the energy
matching task (EIMATCH). The participant was presented with an extensive pre-weighed
buffet meal (content shown in Appendix 9). They were then given the following verbal
instruction: “Consider the exercise bout that you have just completed and the amount
of energy that you expended, or the number of calories that you burned. Now, try to
match that energy, or number of calories in the food that you consume from the buffet.”
The participant was informed that, should they wish to eat any more food after the task,
they would be free to do so once the matching task was complete. They were then left
to complete the task in isolation. When the participant had finished eating, the buffet
food was re-weighted and energy intake was calculated using energy density data
derived from the manufacturer’s nutritional information. The energy matching task was
215
completed approximately 30 minutes (mean time from cessation of exercise to
matching task, 31 ± 4 min.; 29 ± 4 min. for MOD and 32 ± 4 min. for HIGH) after the
completion of the exercise bout.
After the energy matching task had been completed, the participant returned to
the Exercise Metabolism Laboratory to remain seated until the buffet food had been re-
weighed. During this time, they were asked to provide a verbal estimate of the energy
expenditure of the exercise bout. After the re-weighing was completed, they were
informed that the trial was finished. They were then told that they were free to consume
any more food that they wished from the buffet. Participants commenced this second
sitting at approximately 60 minutes post-exercise (56 ± 7 min.; 53 ± 4 min. for MOD
and 58 ± 7 min. for HIGH). Food intake was covertly recorded, with the buffet food
being re-weighted again after the participant had finished eating. The energy intake at
this sitting was added to the intake of the energy matching task to provide an ad libitum
energy intake value (EIAD LIB.).
7.3.5 Measures:
Energy expenditure (EE) was measured, in kcal, for both exercise bouts. This
was calculated from exhaled air collected intermittently during the bout. Mean rate of
oxygen utilisation (VO2) and RER were calculated and energy expenditure was
estimated using the RER-specific caloric equivalent of oxygen. EIMATCH and EIAD LIB.
were measures as described above, from the buffet meal provided and recorded in
kcal. The verbal estimate of energy expenditure (EST) was recorded as a further
outcome measure.
7.3.6 Statistical analysis:
All values stated are mean values ± standard deviation (SD) in text and tables
and mean ± standard error of the mean (SEM) in figures. Mean EE, EIMATCH and EST
values were investigated for energy measures and trial differences using a 3x2
repeated measures factorial ANOVA. Energy measures and trial comparisons of EE
216
and EIAD LIB. were assessed by conducting a further 2x2 repeated measures factorial
ANOVA. Comparisons of the dietary intakes for the EIMATCH and EIAD LIB. tasks in both
conditions were made by conducting separate 2x2 repeated measures factorial
ANOVA for each dietary characteristic investigated (total energy density, carbohydrate
intake, fat intake and protein intake). Significant interactions and main effects from all
AVOVA were further assessed by pairwise comparisons, using Bonferroni post-hoc
analysis. Statistical significance level of p < 0.05 was in use for all comparisons. All
statistical analysis was carried out using the SPSS software programme (SPSS inc.,
Chicago, Illinois, USA).
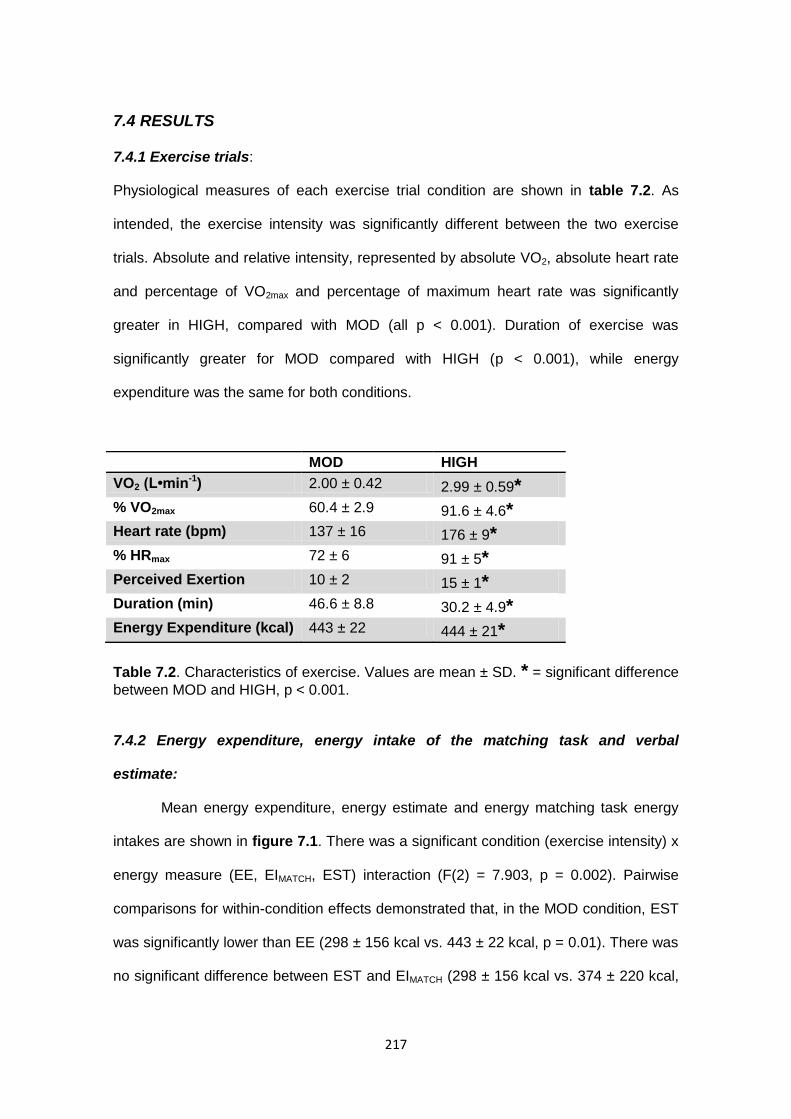
217
7.4 RESULTS
7.4.1 Exercise trials:
Physiological measures of each exercise trial condition are shown in table 7.2. As
intended, the exercise intensity was significantly different between the two exercise
trials. Absolute and relative intensity, represented by absolute VO2, absolute heart rate
and percentage of VO2max and percentage of maximum heart rate was significantly
greater in HIGH, compared with MOD (all p < 0.001). Duration of exercise was
significantly greater for MOD compared with HIGH (p < 0.001), while energy
expenditure was the same for both conditions.
MOD HIGH
VO2 (L•min-1) 2.00 ± 0.42 2.99 ± 0.59*
% VO2max 60.4 ± 2.9 91.6 ± 4.6*
Heart rate (bpm) 137 ± 16 176 ± 9*
% HRmax 72 ± 6 91 ± 5*
Perceived Exertion 10 ± 2 15 ± 1*
Duration (min) 46.6 ± 8.8 30.2 ± 4.9*
Energy Expenditure (kcal) 443 ± 22 444 ± 21*
Table 7.2. Characteristics of exercise. Values are mean ± SD. * = significant difference
between MOD and HIGH, p < 0.001.
7.4.2 Energy expenditure, energy intake of the matching task and verbal
estimate:
Mean energy expenditure, energy estimate and energy matching task energy
intakes are shown in figure 7.1. There was a significant condition (exercise intensity) x
energy measure (EE, EIMATCH, EST) interaction (F(2) = 7.903, p = 0.002). Pairwise
comparisons for within-condition effects demonstrated that, in the MOD condition, EST
was significantly lower than EE (298 ± 156 kcal vs. 443 ± 22 kcal, p = 0.01). There was
no significant difference between EST and EIMATCH (298 ± 156 kcal vs. 374 ± 220 kcal,
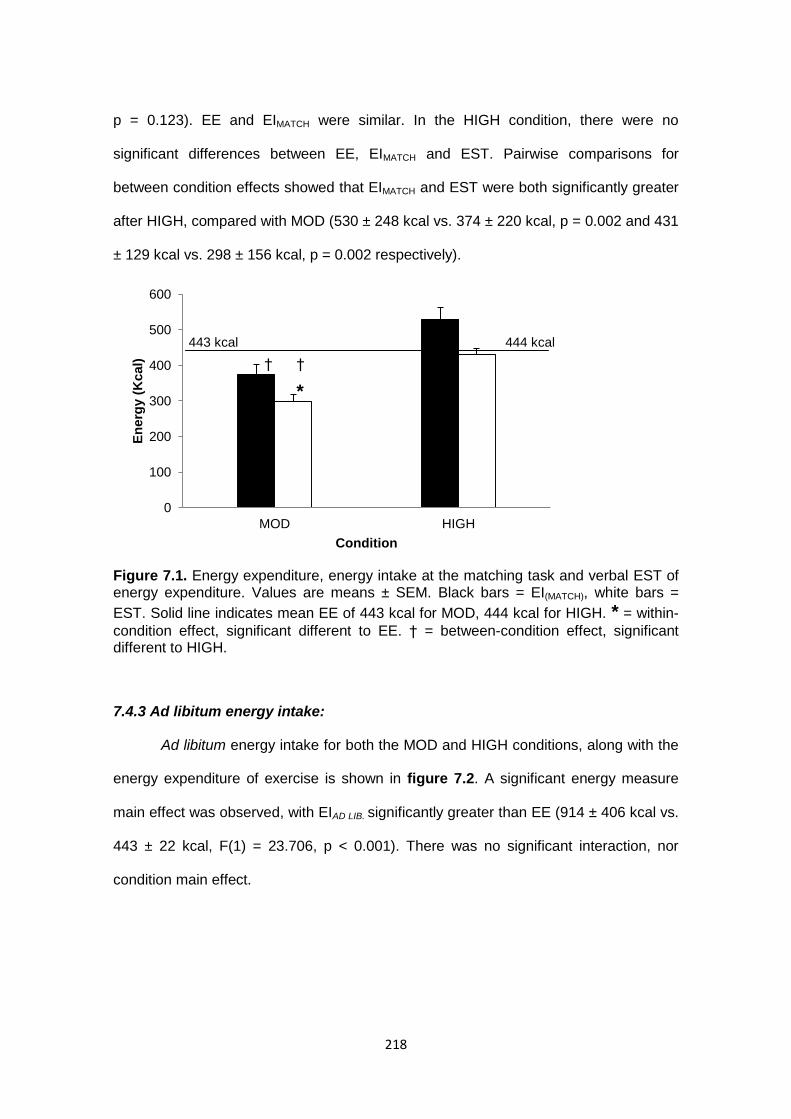
218
p = 0.123). EE and EIMATCH were similar. In the HIGH condition, there were no
significant differences between EE, EIMATCH and EST. Pairwise comparisons for
between condition effects showed that EIMATCH and EST were both significantly greater
after HIGH, compared with MOD (530 ± 248 kcal vs. 374 ± 220 kcal, p = 0.002 and 431
± 129 kcal vs. 298 ± 156 kcal, p = 0.002 respectively).
Figure 7.1. Energy expenditure, energy intake at the matching task and verbal EST of energy expenditure. Values are means ± SEM. Black bars = EI(MATCH), white bars =
EST. Solid line indicates mean EE of 443 kcal for MOD, 444 kcal for HIGH. * = within-
condition effect, significant different to EE. † = between-condition effect, significant different to HIGH.
7.4.3 Ad libitum energy intake:
Ad libitum energy intake for both the MOD and HIGH conditions, along with the
energy expenditure of exercise is shown in figure 7.2. A significant energy measure
main effect was observed, with EIAD LIB. significantly greater than EE (914 ± 406 kcal vs.
443 ± 22 kcal, F(1) = 23.706, p < 0.001). There was no significant interaction, nor
condition main effect.
0
100
200
300
400
500
600
MOD HIGH
En
erg
y (
Kcal)
Condition
443 kcal 444 kcal
† †
*
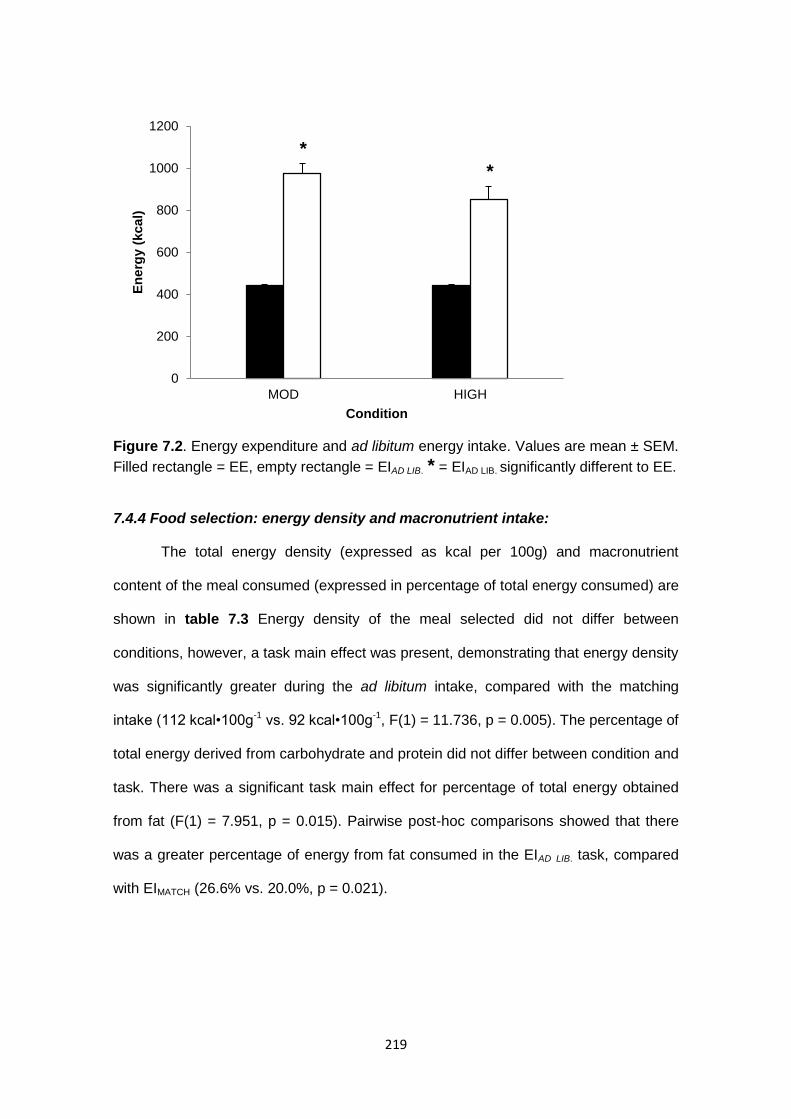
219
Figure 7.2. Energy expenditure and ad libitum energy intake. Values are mean ± SEM.
Filled rectangle = EE, empty rectangle = EIAD LIB. * = EIAD LIB. significantly different to EE.
7.4.4 Food selection: energy density and macronutrient intake:
The total energy density (expressed as kcal per 100g) and macronutrient
content of the meal consumed (expressed in percentage of total energy consumed) are
shown in table 7.3 Energy density of the meal selected did not differ between
conditions, however, a task main effect was present, demonstrating that energy density
was significantly greater during the ad libitum intake, compared with the matching
intake (112 kcal•100g-1 vs. 92 kcal•100g-1, F(1) = 11.736, p = 0.005). The percentage of
total energy derived from carbohydrate and protein did not differ between condition and
task. There was a significant task main effect for percentage of total energy obtained
from fat (F(1) = 7.951, p = 0.015). Pairwise post-hoc comparisons showed that there
was a greater percentage of energy from fat consumed in the EIAD LIB. task, compared
with EIMATCH (26.6% vs. 20.0%, p = 0.021).
0
200
400
600
800
1000
1200
MOD HIGH
En
erg
y (
kcal)
Condition
*
*
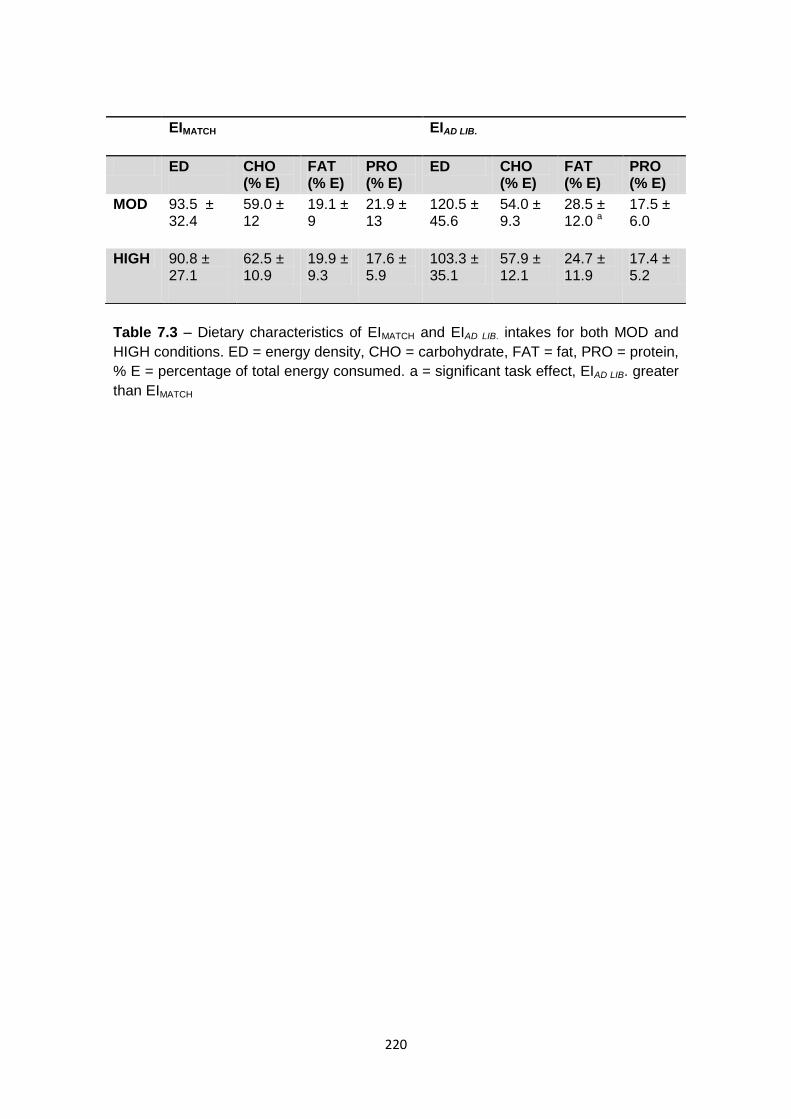
220
Table 7.3 – Dietary characteristics of EIMATCH and EIAD LIB. intakes for both MOD and
HIGH conditions. ED = energy density, CHO = carbohydrate, FAT = fat, PRO = protein,
% E = percentage of total energy consumed. a = significant task effect, EIAD LIB. greater
than EIMATCH
EIMATCH
EIAD LIB.
ED
CHO (% E)
FAT (% E)
PRO (% E)
ED CHO (% E)
FAT (% E)
PRO (% E)
MOD 93.5 ± 32.4
59.0 ± 12
19.1 ± 9
21.9 ± 13
120.5 ± 45.6
54.0 ± 9.3
28.5 ± 12.0 a
17.5 ± 6.0
HIGH 90.8 ± 27.1
62.5 ± 10.9
19.9 ± 9.3
17.6 ± 5.9
103.3 ± 35.1
57.9 ± 12.1
24.7 ± 11.9
17.4 ± 5.2
221
7.5 DISCUSSION
The aim of this study was to assess individuals’ ability to match energy intake with
energy expenditure after isoenergetic bouts of high- and moderate-intensity treadmill
exercise. It would appear that individuals accurately match EI with EE after high-intensity
and moderate-intensity exercise. In the MOD condition, EIMATCH, consumed at the matching
task buffet was very similar to the energy expenditure of the exercise bout (402 ± 220 kcal
vs. 443 ± 22 kcal). These values were also not significantly different to each other in the
HIGH condition, despite EIMATCH being 23% greater than EE. This is in conflict with the
findings of Harris and George (2010) and Willbond et al. (Willbond et al., 2010), who both
demonstrated poor energy matching ability.
This strong matching ability between EI and EE in the MOD condition was observed
despite an undervaluation of the energy cost of exercise. The verbal estimate of energy
expenditure of exercise was significantly lower than the exercise EE and EIMATCH. This was
not observed in the HIGH condition, with no difference between EST and either EE or
EIMATCH. The underestimation of the EE of moderate-intensity exercise was an unexpected
finding. It not only contrasted with the hypothesis that EE would be overestimated in both
exercise conditions but also contradicted the findings of Willbond and co-workers (Willbon et
al., 2010), who observed that the energy cost of treadmill running at an intensity of 50%
VO2max was overestimated 2-3 fold. The moderate-intensity exercise bout in the current study
was of a considerably greater energy cost (450 kcal) than the two bouts of exercise used in
the study of Willbond et al. (200 kcal and 300 kcal). With bouts of such low energy cost,
overcompensation is much more easily achieved. However, it is suspected that the
surprising findings of the current study may have been due to participants altering their
behaviour under experimental conditions. It is possible that individuals over-compensated for
their expected poor perception of the energy cost of exercise. Unfortunately, there is no
means of assessing whether this was the case.
222
It would appear that an underestimate of the caloric content of food compensated for
an undervaluation of the energy of moderate-intensity exercise. EIMATCH was, on average,
117 kcal greater than EST. While these two values were not significantly different in either
condition, there was a main effect for energy measure, which showed a significant difference
between EIMATCH and EST, with EIMATCH being 28% greater. In the moderate-intensity
condition, while EST was significantly lower than EE, this did not transpire into a significantly
lower EIMATCH than EE, as EIMATCH exceeded EST by a mean of over 100 kcal (285 kcal vs.
389 kcal). This undervaluation of the energy content of food is in agreement with previous
literature, which has found this to be the case particularly in foods that are considered more
“healthy” (Brindal et al., 2012; Carels et al., 2007). The findings of Harris and George (2000)
also suggest that the inability to match energy intake with exercise energy expenditure is
driven primarily by an undervaluation of the energy content of food; the mean estimate of the
caloric intake at a post-exercise ad libitum buffet was 435 kcal lower that the mean actual
intake. In comparison, the energy content of the exercise bout was overestimated by 129
kcal.
Both EST and EIMATCH were significantly greater after high-intensity exercise,
compared with moderate-intensity exercise. Mean EIMATCH was 159 kcal (33%) greater in the
HIGH condition, despite the two exercise bouts being matched for energy cost. This could
suggest that individuals perceive shorter, more strenuous bouts of exercise to be more
energetic than longer, less strenuous bouts and that perception of the energy cost of
exercise may be driven by the intensity of exercise, rather than the duration of exercise. If
this is the case, this may provide an argument for the undertaking of sustained, moderate-
intensity exercise bouts for those seeking to increase physical activity for weight-
management purposes. If such exercise bouts result in an undervaluation of the energy
expended, particularly compared with isocaloric bouts at a higher intensity, then this may
help produce negative energy balance through the avoidance of overcompensation in post-
exercise energy intake.
223
This may be particularly pertinent for those susceptible to increasing food intake due
to using food as a reward. As eating palatable food is a pleasurable experience for the
majority of individuals, some use food as a means of reward following behaviour that is
deemed an achievement or reward-worthy. One such behaviour may be the undertaking of a
bout of exercise. While it would appear that neural responses in areas of the brain
associated with the reward system are decreased immediately post-exercise (Evero et al.,
2012); Crabtree, D. PhD thesis, University of Birmingham), possibly explaining the “anorexia
of exercise” phenomenon, there is now also evidence for increases in reward system
activation in the hours after exercise, sensitising it to images of food (Crabtree, D. PhD
thesis, University of Birmingham). In addition, Finlayson and colleagues (Finlayson et al.,
2011) found that some overweight and obese individuals exhibited increased liking and
wanting of food items (components of the reward construct) following exercise . Further,
those that did demonstrate this response were those who failed to experience weight-loss
with a 12-week exercise programme. If exercise does sensitise individuals to the use or
abuse of food as a reward and increase explicit wanting of food, then the perception of a
less energetic bout may lower subsequent intake resulting from this response, as the
conscious, explicit components of rewarding exercise may be reduced. Therefore, lower-
intensity, longer duration bouts may prove preferable to shorter, higher intensity isocaloric
bouts when devising exercise regimen to facilitate weight-loss.
One possible explanation for the perceived greater energy cost of shorter, higher-
intensity exercise, compared with longer, moderate-intensity exercise, is that it is likely that
metabolic rate was slightly higher after high-intensity exercise, due to excess post-exercise
oxygen consumption (EPOC). EPOC has been shown to occur after high-intensity exercise
(Phelain et al., 1997). A greater metabolic rate after HIGH, compared with MOD, may have
contributed to a perception of greater energy cost; although, the only likely perception of
EPOC will likely have been a more sustained elevation in heart rate and breathing rate.
Further, the EPOC effect was most likely small, especially over a period of just 30 minutes.
EPOC has been shown to contribute minimally to the total energy expenditure of exercise
224
(Laforgia et al., 2006), meaning only a small increase in energy expenditure will have
occurred. Another potential explanation is that the participants may not have fully
appreciated the difference in duration of each bout. Anecdotally, exercise can feel longer
when it is strenuous, with exercisers experiencing a perceived slowing of time when
exercising hard. This may have been the case here, with little perceived difference in the
duration of the two bouts. It would perhaps have been interesting to have obtained estimates
of the duration of exercise, as well as the energy cost.
In both exercise conditions, EIAD LIB. was significantly greater than exercise EE,
resulting in a positive energy balance of +533 ± 357 kcal for MOD and +408 ± 448 kcal for
HIGH. Such large positive energy balance values would indicate the absence of a prolonged
post-exercise suppression of appetite, or “anorexia of exercise” effect (King et al., 1994).
While this phenomenon is commonly observed in the immediate post-exercise period after
exercise of ≥ 60% VO2max, (King et al., 1994; Kissileff et al., 1990; Thompson et al., 1988;
Ueda et al., 2009; Westerterp-Plantenga et al., 1997), this is not always reflected by a
decrease in energy intake (Deighton et al., 2012; George and Morganstein, 2003; King et al.,
2011) and rarely persists when an energy intake measure is obtained at ≥ 60 minutes post-
exercise (Deighton et al., 2012a; Martins et al., 2007; Thompson et al., 1988). In the current
study, it is worth noting that such a suppression appears to be absent, even after
undertaking running exercise of an intensity of 90% VO2max – a particularly high intensity of
continuous, aerobic exercise that is rarely utilised in such studies. However, it is
acknowledged that a true representation of the effect of the exercise bouts on appetite would
require a non-exercise control condition. As this was not a primary aim of the current study,
such a condition was deemed unnecessary. Similarly, subjective measures of appetite were
not recorded. While these would have been integral for a thorough investigation of the effect
of the exercise bouts on post-exercise appetite, they were forfeited to ensure that decisions
made during the EIMATCH task were influenced minimally by thoughts of appetite and hunger.
Further, participants were allowed to shower between completing the exercise bout and
feeding, and the duration and temperature of the shower were not controlled. Therefore, it is
225
likely that this will have impacted upon body temperature. As changes in body temperature
has been proposed as a mechanism underpinning the post-exercise appetite response
(Shorten et al., 2009; White et al., 2005; Halse et al., 2011), showering may have influenced
appetite and influenced appetite differential across the two trials.
The substantially greater energy intake when relieved of the constraints of the
matching task (EIAD LIB. intake exceeded EIMATCH intake by a mean of 602 ± 358 kcal (91%) in
MOD and 322 ± 332 kcal (42%) in HIGH) was due not only to a greater absolute food intake,
but also due, in part, to the selection of more energy dense foods. The total energy density
of the ad libitum intake was 27 kcal•100g-1 (25%) greater in MOD and 13 kcal•100g-1 (13%)
greater in HIGH, compared with the corresponding matching task intakes. It would appear
that this may have been partly driven by a greater fat intake in the ad libitum feeding, with
the percentage of total energy derived from fat significantly greater in the EIAD LIB. intake,
compared with EIMATCH (26.6% vs. 20.0%, data pooled for HIGH and MOD). Therefore, it
would seem that individuals attempted to restrict energy intake in the matching task by not
only eating less food, but also by successfully selecting less energy dense foods and foods
lower in fat, or by avoided high calorie, fatty foods.
In light of the findings of this study, that individuals posses a strong ability to
consciously match energy intake with energy expenditure, it may be worth asking the
question: if this is the case, then why do people gain weight initially and fail to lose weight
when initiating in weight-loss strategies involving increased physical activity? Firstly, it is
likely that those that gain weight initially are those that do not exercise regularly, hence an
ability to match intake with exercise-induced energy expenditure, whether consciously or not,
is irrelevant. However, some exercisers do gain weight and some that begin exercising
regularly in an attempt to lose weight fail to do so. It is possible that habitual eating
behaviour can override any matching ability. Individuals’ varying degree of eating restraint
(Elfhag and Linné, 2005; Provencher et al., 2003; van Strien et al., 2009), emotional eating
(van Strien et al., 2009) and external eating (Burton et al., 2007) have all been implicated in
weight-gain and the pathology of obesity, as well as in the success of attempted weight-loss
226
(Elfhag and Rössner, 2005; Karlsson et al., 1994). In the current study, ad libitum energy
intake considerably exceeded the EIMATCH intake and the exercise energy expenditure in both
conditions, with large positive energy balances recorded (+533 ± 357 kcal and +408 ± 448
kcal for MOD and HIGH respectively). This suggests that when participants were free to
consume as much as they desired, from a buffet-style meal providing considerable external
food cues to the participant, little eating restraint was used and a restriction of food intake
was not observed.
It should be noted that the participants in the current study were healthy-weight, low-
activity level individuals. It may be the case that healthy-weight individuals do possess a
strong ability to consciously match energy intake with energy expenditure, hence why they
are not overweight. Those that are overweight and obese may exhibit a much poorer
matching ability and this may have contributed to their weight-gain. It would be of interest to
repeat the current study with overweight and obese participants.
In summary, participants demonstrated a strong ability to consciously match energy
intake with exercise-induced energy expenditure after aerobic exercise at both a moderate-
and high-intensity. It would appear that an undervaluation of the energy cost of exercise,
particularly that of a moderate intensity, was countered by an undervaluation of the energy
content of food. Participants perceived exercise of a high intensity to be more energetic than
that of isocaloric exercise of a moderate intensity, which may suggest that perception of
energy expenditure is driven more by intensity than duration of exercise. This may have
implications for the types of exercise bouts recommended during exercise regimes utilised
as part of a weight-management strategy. Despite the conscious ability to match energy
intake with exercise-induced energy expenditure, participants exhibited little restraint when
the restriction of the energy matching task was lifted, resulting in large ad libitum intakes and
acute positive energy balance. It remains to be seen whether such a sound matching ability
is possessed by overweight and obese individuals, as well as the healthy-weight individuals
of the current study.
227
7.6 REFERENCES Bandini, L.G., Schoeller, D.A., Cyr, H.N., and Dietz, W.H. (1990). Validity of reported energy intake in obese and nonobese adolescents. The American Journal of Clinical Nutrition 52, 421-425. Blundell, J.E., and King, N.A. (2000). Exercise, appetite control, and energy balance. Nutrition 16, 519-522. Blundell, J.E., Stubbs, R.J., Hughes, D.A., Whybrow, S., and King, N.A. (2003). Cross talk between physical activity and appetite control: does physical activity stimulate appetite? Proc Nutr Soc 62, 651-661. Borg, G.A.V. (1973). "Perceived exertion: a note on history and methods". Medicine and Science in Sports & Exercise 5, 90-93. Brindal, E., Wilson, C., Mohr, P., and Wittert, G. (2012). Perceptions of portion size and energy content: implications for strategies to affect behaviour change. Public Health Nutrition 15, 246-253. Burton, P., Smit, H.J., and Lightowler, H.J. (2007). The influence of restrained and external eating patterns on overeating. Appetite 49, 191-197. Carels, R.A., Konrad, K., and Harper, J. (2007). Individual differences in food perceptions and calorie estimation: An examination of dieting status, weight, and gender. Appetite 49, 450-458. Crabtree, D.R. (2012). "The effects of exercise on appetite regulation." Ph.D thesis, University of Birmingham. http://etheses.bham.ac.uk/3779/ Deighton, K., Barry, R., Connon, C., and Stensel, D. (2012a). Appetite, gut hormone and energy intake responses to low volume sprint interval and traditional endurance exercise. Eur J Appl Physiol, 1-10. Deighton, K., Zahra, J.C., and Stensel, D.J. (2012b). Appetite, energy intake and resting metabolic responses to 60min treadmill running performed in a fasted versus a postprandial state. Appetite 58, 946-954. Elfhag, K., and Linné, Y. (2005). Gender differences in associations of eating pathology between mothers and their adolescent offspring. Obesity Research 13, 1070-1076. Elfhag, K., and Rössner, S. (2005). Who succeeds in maintaining weight loss? A conceptual review of factors associated with weight loss maintenance and weight regain. Obesity Reviews 6, 67-85. Evero, N., Hackett, L.C., Clark, R.D., Phelan, S., and Hagobian, T.A. (2012). Aerobic exercise reduces neuronal responses in food reward brain regions. Journal of Applied Physiology 112, 1612-1619. Finlayson, G., Caudwell, P., Gibbons, C., Hopkins, M., King, N., and Blundell, J. (2011). Low fat loss response after medium-term supervised exercise in obese is associated with exercise-induced increase in food reward. Journal of Obesity 2011.
228
George, V.A., and Morganstein, A. (2003). Effect of moderate intensity exercise on acute energy intake in normal and overweight females. Appetite 40, 43-46. Halse, R.E., Wallman, K.E., and Guelfi, K.J. (2011). Postexercise water immersion increases short-term food intake in trained men. Medicine and Science in Sports & Exercise 43, 632-638. Harris, C.L., and George, V.A. (2010). Dietary restraint influences accuracies in estimating energy expenditure and energy intake among physically inactive males. American Journal of Men's Health 4, 33-40. Health and Social Care Information Centre (2013). Health Survey for England. Statistics on Obesity, Physical Activity and Diet – England, 2013. http://www.hscic.gov.uk/searchcatalogue?productid=11194&q=obesity&sort=Relevance&size=10&page=1#top Hill, R.J., and Davies, P.S.W. (2001). The validity of self-reported energy intake as determined using the doubly labelled water technique. British Journal of Nutrition 85(4), 415-430. Karlsson, J., Hallgren, P., Kral, J., Lindroos, A.-K., Sjöström, L., and Sullivan, M. (1994). Predictors and effects of long-term dieting on mental well-being and weight loss in obese women. Appetite 23, 15-26. King, J.A., Wasse, L.K., Ewens, J., Crystallis, K., Emmanuel, J., Batterham, R.L., and Stensel, D.J. (2011). Differential acylated ghrelin, peptide YY3-36, appetite, and food intake responses to equivalent energy deficits created by exercise and food restriction. Journal of Clinical Endocrinology & Metabolism 96, 1114-1121. King, N.A. (1999). What processes are involved in the appetite response to moderate increases in exercise-induced energy expenditure? Proceedings of the Nutrition Society 58, 107-113. King, N.A., Burley, V.J., and Blundell, J.E. (1994). Exercise induced suppression of appetite: effects on food intake and implications for energ balance. European Journal of Clinical Nutrition 48, 715-724 King, N.A., Hopkins, M., Caudwell, P., Stubbs, R.J., and Blundell, J.E. (2008). Individual variability following 12 weeks of supervised exercise: identification and characterization of compensation for exercise-induced weight loss. Int J Obes (Lond) 32, 177-184. Kissileff, H.R., Pi-Sunyer, F.X., Segal, K., Meltzer, S., and Foelsch, P.A. (1990). Acute effects of exercise on food intake in obese and nonobese women. American Journal of Clinical Nutrition 52, 240-245. Laforgia, J., Withers, R.T., and Gore, C.J. (2006). Effects of exercise intensity and duration on the excess post-exercise oxygen consumption. Journal of Sports Sciences 24, 1247-1264. Livingstone, M.B., Prentice, A.M., Coward, W.A., Strain, J.J., Black, A.E., Davies, P.S., Stewart, C.M., McKenna, P.G., and Whitehead, R.G. (1992). Validation of estimates of energy intake by weighed dietary record and diet history in children and adolescents. The American Journal of Clinical Nutrition 56, 29-35.
229
Livingstone, M.B., Prentice, A.M., Strain, J.J., Coward, W.A., Black, A.E., Barker, M.E., McKenna, P.G., and Whitehead, R.G. (1990). Accuracy of weighed dietary records in studies of diet and health. British Medical Journal 300(6726), 708-712. Martins, C., Morgan, L.M., Bloom, S.R., and Robertson, M.D. (2007). Effects of exercise on gut peptides, energy intake and appetite. J Endocrinol 193, 251-258. Pettigrew, S., Rosenberg, M., and Ferguson, R. (2013). Consumers' (in)ability to estimate the energy content of unhealthy foods. Nutrition & Dietetics, n/a-n/a. Phelain, J.F., Reinke, E., Harris, M.A., and Melby, C.L. (1997). Postexercise energy expenditure and substrate oxidation in young women resulting from exercise bouts of different intensity. Journal of the American College of Nutrition 16, 140-146. Polivy, J. (1976). Perception of calories and regulation of intake in restrained and unrestrained subjects. Addictive Behaviors 1, 237-243. Prentice, A.M., Black, A.E., Coward, W.A., Davies, H.L., Goldberg, G.R., Murgatroyd, P.R., Ashford, J., Sawyer, M., and Whitehead, R.G. (1986). High levels of energy expenditure in obese women. British Medical Journal (Clin. Res. Ed.) 292(6526), 983-987. Provencher, V., Drapeau, V., Tremblay, A., Després, J.-P., and Lemieux, S. (2003). Eating Behaviors and Indexes of Body Composition in Men and Women from the Québec Family Study. Obesity Research 11, 783-792. Schoeller, D.A. (1995). Limitations in the assessment of dietary energy intake by self-report. Metabolism 44, Supplement 2, 18-22. Shorten, A.L., Wallman, K.E., and Guelfi, K.J. (2009). Acute effect of environmental temperature during exercise on subsequent energy intake in active men. The American Journal of Clinical Nutrition 90, 1215-1221. Thompson, D.A., Wolfe, L.A., and Eikelboom, R. (1988). Acute effects of exercise intensity on appetite in young men. Medicine & Science in Sports & Exercise 20, 222-227. Ueda, S.-y., Yoshikawa, T., Katsura, Y., Usui, T., and Fujimoto, S. (2009). Comparable effects of moderate intensity exercise on changes in anorectic gut hormone levels and energy intake to high intensity exercise. Journal of Endocrinology 203, 357-364. van Strien, T., Frijters, J.E.R., Bergers, G.P.A., and Defares, P.B. (1986). The Dutch Eating Behavior Questionnaire (DEBQ) for assessment of restrained, emotional, and external eating behavior. International Journal of Eating Disorders 5, 295-315. van Strien, T., Herman, C.P., and Verheijden, M.W. (2009). Eating style, overeating, and overweight in a representative Dutch sample. Does external eating play a role? Appetite 52, 380-387. Weiss, E.C., Galuska, D.A., Khan, L.K., and Serdula, M.K. (2006). Weight-Control Practices Among U.S. Adults, 2001–2002. American Journal of Preventive Medicine 31, 18-24. Westerterp-Plantenga, M.S., Verwegen, C.R., Ijedema, M.J., Wijckmans, N.E., and Saris, W.H. (1997). Acute effects of exercise or sauna on appetite in obese and nonobese men. Physiology & Behavior 62, 1345-1354.
230
Westerterp, K.R., Saris, W.H., van Es, M., and ten Hoor, F. (1986). Use of the doubly labeled water technique in humans during heavy sustained exercise. Journal of Applied Physiology 61, 2162-2167. White, L.J., Dressendorfer, R.H., Holland, E., McCoy, S.C., and Ferguson, M.A. (2005). Increased caloric intake soon after exercise in cold water. International Journal of Sports Nutrition and Exercise Metabolism 15, 38-47. Willbond S.M., Lavoilette M.A., Duval K., and E., D. (2010). Normal weight men and women overestimate exercise energy expenditure. Journal of sports medicine and physical fitness 50, 377-384.
231
CHAPTER 8
General discussion
232
8.1 General discussion
The rise in the amount of people with excessive bodyweight has led to an alarming
global prevalence of obesity and overweight (Finucane et al., 2011). Due to the health
implications associated with the disease state of obesity, it may be disconcerting to consider
that an adult in England who is not overweight or obese is now part of a ~35% minority
(Health and Social Care Information Centre, 2013). Throughout this thesis, the more
commonly used term “normal-weight” has been replaced by the term “healthy-weight” when
describing a study population; not being overweight or obese is no longer “normal”. With
projections showing that the prevalence is set to rise further, there is a need to tackle
overweight and obesity with the formulation of effective weight-management strategies. As
interventions that combine both exercise and dietary elements have been shown to be the
most efficacious for sustained weight-loss (Foster-Schubert et al., 2012; Kerksick et al.,
2010) and the avoidance of weight-gain (Artal et al., 2007; Skender et al., 1996), a sensible
starting point may be to gain a greater understanding of the effects of acute exercise on
short-term food intake and energy balance, addressing both sides of the energy balance
equation.
The primary aims of this thesis were:
1. To attempt to develop and validate a novel tool for the measurement of subjective
appetite
2. To investigate the effect of exercise on appetite in athletic populations, and in doing
so, assess the degree to which appetite responses to exercise may vary in different
populations
3. Shed further light on the influence of exercise characteristics, such as duration,
energy cost and mode of exercise, on appetite responses to exercise.
A secondary aim was to assess the likely role of appetite-associated hormones in
appetite regulation in the post-exercise period, through investigation of the relationships
between hormonal changes and changes in subjective appetite and energy intake.
233
This chapter will address these aims and attempt to answer the relevant research
questions.
8.2 A novel tool for the measurement of subjective appetite
This section will evaluate the findings of Chapters 2 and 3, as well as compiling the
findings of Chapters 4, 5 and 6, where the BPAR and the VIMEC were used to obtain
appetite measures during trials.
In summary, the findings of Chapter 2 and 3 were that the VIMEC was confirmed to
be an improvement on its predecessor, the BPAR, demonstrating a stronger ability to predict
within-subject changes and between-subject differences in energy intake, while maintaining
its efficacy at detecting expected changes in subjective appetite. Moreover, Chapter 3
provided an indication that the VIMEC is a stronger predictor of changes in energy intake
than the VAS method, while exhibiting a similar degree of reproducibility. It was concluded
that the VIMEC is a valid tool for the measurement of subjective appetite. Further, it may
prove preferable to the commonly-used VAS method as a predictor of food intake,
particularly when addressing between-subject differences in appetite or expected food
intake, either in conjunction with or as a cost-effective, time-efficient and less wasteful
alternative to ad libitum test meals.
As the studies of Chapters 4, 5 and 6 included VAS measures of subjective appetite
and ad libitum food intake measures, it is possible to obtain further indications of the efficacy
of the BPAR and the VIMEC by investigating the relationship between changes in
BPAR/VIMEC and changes in both VAS and energy intake.
Between-subject comparisons showed that VAS scores and BPAR/VIMEC scores
were significantly correlated with one another in all conditions, in all three studies, exhibiting
moderate-strength correlation (table 8.1a). Throughout the three studies, VAS score
immediately prior to the test meal was not significantly correlated with energy intake, with
234
coefficients demonstrating weak-to-moderate strength correlation. While BPAR scores
exhibited a weak relationship with energy intake in Chapter 4, the relationship between
VIMEC score and energy intake was stronger in Chapter 5, with a significant correlation
between the two in the resting condition and non-significant moderate strength correlation
demonstrated in the 15 minute and 30 minutes conditions also. In Chapter 6, the correlation
between VIMEC and energy intake in the resting condition was strong and statistically
significant. Moreover, this correlation was significantly stronger than the corresponding
correlation between VAS score and energy intake.
Table 8.1b shows the correlation coefficients for comparisons of between-condition,
within-subject percentage changes in BPAR/VIMEC with percentage changes in VAS for all
measures obtained in each trial condition and comparison of percentage changes in
BPAR/VIMEC score immediately prior to the ad libitum test meal with percentage changes in
energy intake for Chapters 4, 5 and 6. Changes in BPAR/VIMEC scores were significantly
correlated with changes in VAS scores for all but one condition, in all three studies,
exhibiting weak- to moderate-strength correlation on the whole. In Chapter 4, both VAS and
BPAR proved to be a poor predictor of energy intake. In Chapter 5, both VAS and VIMEC
scores immediately prior to the test meal were significantly associated with ad libitum intake
when assessing changes from the resting trial in the 30 minute trial. However, this
relationship was weak-to-moderate in the other two comparison of this study. Only change in
VAS score correlated significantly with change in energy intake in Chapter 6. The correlation
coefficients obtained for changes in VAS and changes in energy intake, and for changes in
VIMEC and changes in energy intake were not significantly different in any condition, in any
of the three studies.
The data from Chapters 4, 5 and 6 do not fully substantiate the findings of Chapters 2
and 3. The VIMEC is a stronger predictor of between-subject differences in energy intake
than the BPAR and there is evidence that the VIMEC is a stronger predictor than VAS, at
least in the resting state. The VIMEC and the BPAR exhibited a similar between-subject
correlation with VAS. However, the BPAR did appear a better tool for detecting within-
235
subject changes in subjective appetite, as indicated by stronger correlation with VAS score.
There is evidence that VIMEC is a better predictor of eating behaviour than BPAR, as shown
by stronger correlation with within-subject changes in energy intake, but these data would
suggest that the VIMEC is no stronger a predictor than VAS.
The relationship between VIMEC score and energy intake does appear to weaken
post-exercise. While it is not completely clear as to why this may be the case, it could be that
there is simply a dissociation between subjective appetite and energy intake after exercise,
as cognitive factors may become increasingly regulatory of eating behaviour during this time.
This may be specifically the case with athletic populations, as post-exercise nutrition is
considered of high importance for recovery and adaptation to training. This consideration will
be discussed further in sections 8.3 (p241) and 8.6 (p254). Nonetheless, further validation of
the VIMEC during post-exercise periods may be warranted.
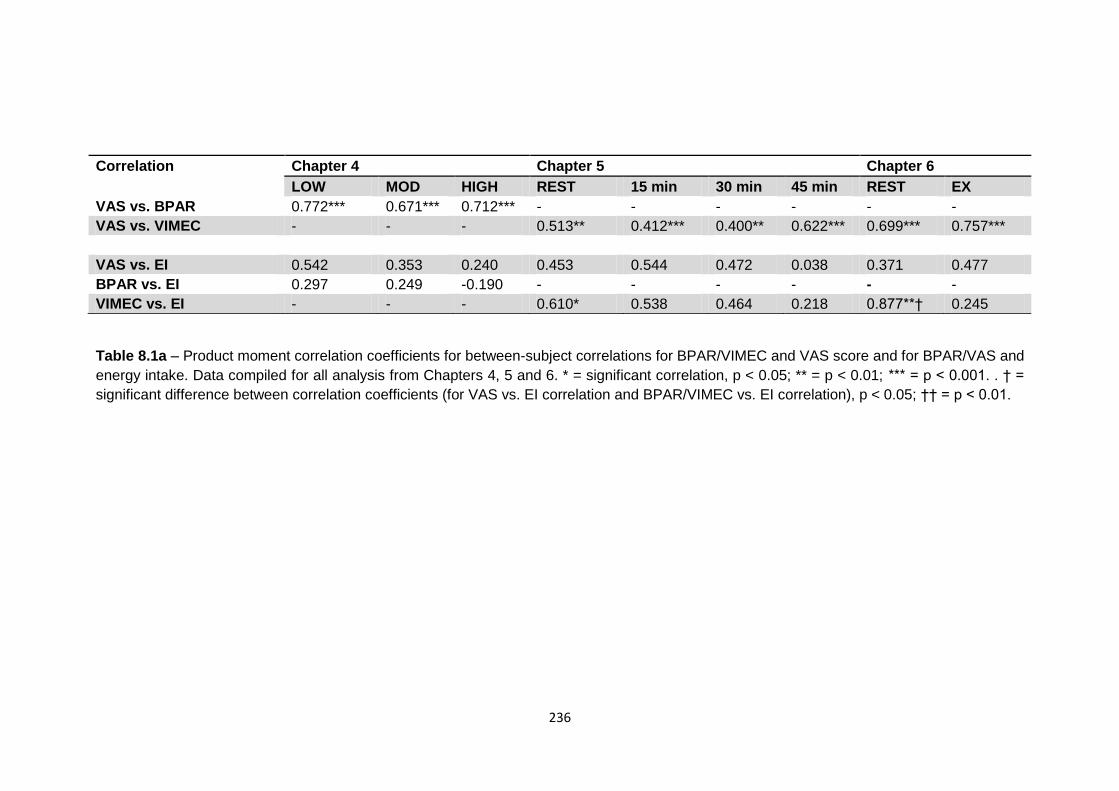
236
Table 8.1a – Product moment correlation coefficients for between-subject correlations for BPAR/VIMEC and VAS score and for BPAR/VAS and
energy intake. Data compiled for all analysis from Chapters 4, 5 and 6. * = significant correlation, p < 0.05; ** = p < 0.01; *** = p < 0.001. . † =
significant difference between correlation coefficients (for VAS vs. EI correlation and BPAR/VIMEC vs. EI correlation), p < 0.05; †† = p < 0.01.
Correlation Chapter 4 Chapter 5 Chapter 6
LOW MOD HIGH REST 15 min 30 min 45 min REST EX
VAS vs. BPAR 0.772*** 0.671*** 0.712*** - - - - - -
VAS vs. VIMEC - - - 0.513** 0.412*** 0.400** 0.622*** 0.699*** 0.757***
VAS vs. EI 0.542 0.353 0.240 0.453 0.544 0.472 0.038 0.371 0.477
BPAR vs. EI 0.297 0.249 -0.190 - - - - - -
VIMEC vs. EI - - - 0.610* 0.538 0.464 0.218 0.877**† 0.245
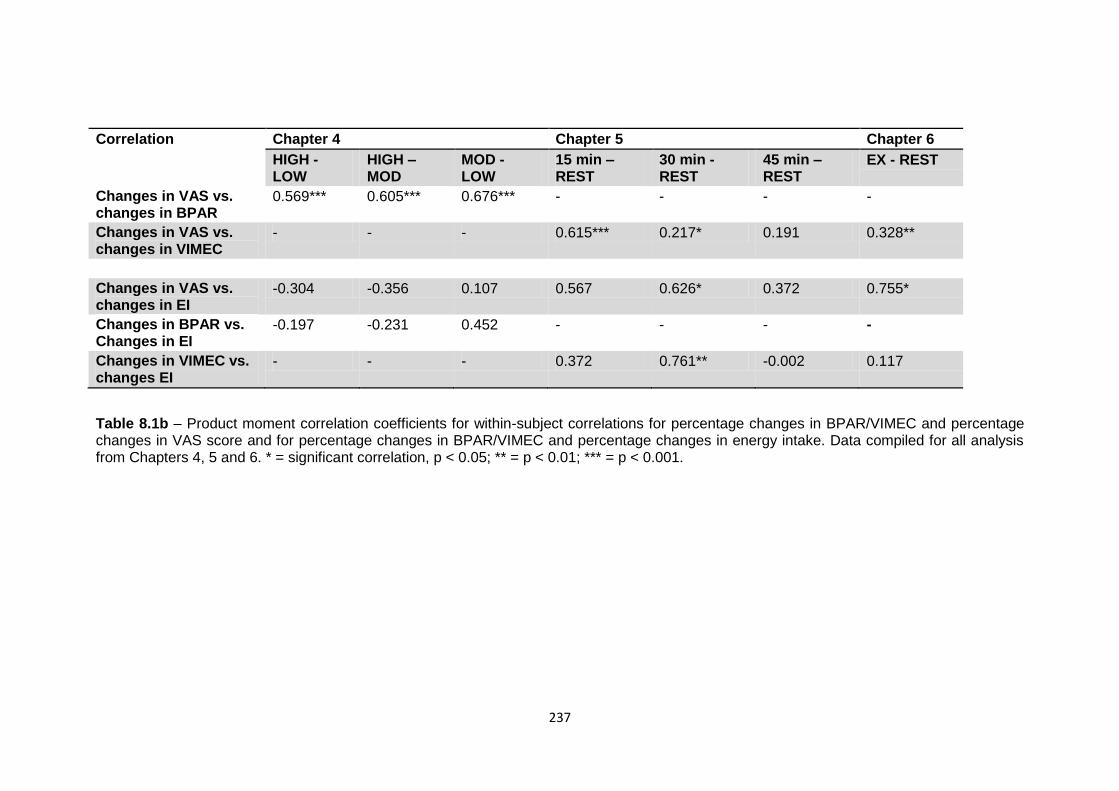
237
Correlation Chapter 4 Chapter 5 Chapter 6
HIGH - LOW
HIGH – MOD
MOD - LOW
15 min – REST
30 min - REST
45 min – REST
EX - REST
Changes in VAS vs. changes in BPAR
0.569*** 0.605*** 0.676*** - - - -
Changes in VAS vs. changes in VIMEC
- - - 0.615*** 0.217* 0.191 0.328**
Changes in VAS vs. changes in EI
-0.304 -0.356 0.107 0.567 0.626* 0.372 0.755*
Changes in BPAR vs. Changes in EI
-0.197 -0.231 0.452 - - - -
Changes in VIMEC vs. changes EI
- - - 0.372 0.761** -0.002 0.117
Table 8.1b – Product moment correlation coefficients for within-subject correlations for percentage changes in BPAR/VIMEC and percentage changes in VAS score and for percentage changes in BPAR/VIMEC and percentage changes in energy intake. Data compiled for all analysis from Chapters 4, 5 and 6. * = significant correlation, p < 0.05; ** = p < 0.01; *** = p < 0.001.
238
While the majority of the data suggests that VIMEC is effective at detecting
differences and changes in subjective appetite, there is some evidence that the VIMEC
measure lacks the sensitivity of the VAS method. In Chapter 3, a greater number of within-
and between-condition differences reach statistical significance with the VAS than with
VIMEC, despite a similar magnitude of difference. Similarly, in Chapter 6, a significant
suppression was observed with measures of VAS, but differences in VIMEC scores were not
statistically significant. No such discrepancy between the measures was observed in
Chapter 5. In the cases of Chapters 3 and 6, inconsistency between measures is likely due
to a greater degree of between-subject variability in VIMEC scores, as is highlighted by
larger standard error (depicted in figures) and larger coefficient of variation for each measure
(as highlighted in section 6.5, p194). The nature of the VIMEC, allowing for extensive food
choice and in doing so offering indications of food preference, lends itself to a larger
variation than the more restricted application of the VAS method. Therefore, because the
magnitude of differences may be large, detecting statistically significant differences will be
more difficult. It is likely that this is a trade-off, between a more informative and predictive
measure of appetite and food intake, and sensitivity to statistically significant changes in
subjective appetite.
The findings of Chapters 2 and 3, supported by the additional data from Chapter 4, 5
and 6 would suggest that the VIMEC is a valid tool for the measure of subjective appetite. It
remains to be confirmed whether the strong relationship between VIMEC score and ad
libitum intake, seen in Chapters 2 and 3, is maintained in the post-exercise period. Further,
the efficacy of the VIMEC to monitor subjective appetite and predict eating behaviour must
be assessed in a wider variety of populations. Within-subject changes in VIMEC score did
not correlate with changes in energy intake in Chapter 6, when the study population
consisted of overweight and obese individuals. Farah et al. (Farah et al., 2012) found that
the ability of a photographic image technique for the measure of desired portion size to
detect changes in hunger varied with the weight-status of participants, although they
observed a relationship between desired portion size and VAS hunger rating in obese, but
239
not lean individuals. They also showed that desired portion size matched subjective hunger
rating in unrestrained, but not restrained eaters. Chapters 4, 5 and 6 of this thesis used
unrestrained eaters, while the participants of Chapters 2 and 3 were not screened for eating
restraint. Therefore, it is necessary to investigate the use of the VIMEC further, with
restrained eaters and populations of varying weight-status. Nonetheless, the initial
development and validation testing of the VIMEC has proved encouraging and further
advancement and use of the tool is an exciting proposition.
While the BPAR and VIMEC tools were developed for the purpose of measuring
subjective appetite within the sphere of appetite research, it is felt that the VIMEC possesses
the potential for additional uses. With a more extensive library of photographic images, the
VIMEC could prove to be a useful tool for the retrospective recording of food intake or for
measures of habitual intake. Food photography has been used for these purposes
previously (Frobisher and Maxwell, 2003; Riley et al., 2007; Subar et al., 2010; Turconi et al.,
2005; Venter et al., 2000), but with varied degrees of success. However, the techniques
used in these previous studies did not allow for an extensive food choice, or for the creation
of a “meal,” as is possible with the VIMEC. This advancement could lead to a greater
efficacy with the VIMEC. As weighed food diaries and food frequency questionnaires have
been shown to demonstrate questionable validity (Krall and Dwyer, 1987; Muhlheim et al.,
1998), allowing participants to recreate their intake using an enhanced version of the
VIMEC, with a larger database of food items could improve the accuracy of reporting. The
increasing use of technology, especially in the form of “smart phone” apps., to assist with
lifestyle interventions (Turner-McGrievy and Tate, 2011; Turner-McGrievy et al., 2013)
means that a mobile, interactive device such as a VIMEC app could prove useful, especially
when considering that current calorie counter apps do not include photographic images of
food, either for the creation of a replica meal of those consumed, or as a reference point for
the estimation of portion size.
An alternative approach for the recording of food intake that is becoming increasingly
used within weight-management research is to ask participants to photograph the food that
240
they consume (Higgins et al., 2009; Martin et al., 2012; Small et al., 2009). These images
are then received by the researcher and from the image, portion size and intake is
estimated. A tool like the VIMEC, with a large database of food items and portion sizes, that
can be easily and precisely manipulated and that provides a calorie content output could be
used to compare the photographic image with. This may improve the accuracy of
estimations of energy content.
A further possible use of the VIMEC is as an educational tool. Many people have a
poor grasp of the calorie content of certain foods (Brindal et al., 2012), commonly
underestimating the energy content of food regarded as “healthy” (Carels et al., 2007) and
overestimating the calories in “unhealthy” food (Pettigrew et al., 2013). Using the VIMEC
may be an effective approach to improving understanding of the calorie content of food and
meals, allowing users to manipulate a meal (e.g., changing portion sizes and swapping
certain food items for alternative options) and observing how this effects total calorie content.
Within our department, similar applications have been explored using the VIMEC. It
has proved valuable, particularly when emphasising the effects of consuming energy-dense
foods as desert items after a low-calorie main course. We have also used the VIMEC for a
task with undergraduate students, emphasising the comparative energy content of food and
the energy cost of exercise. Asking participants to select a meal, using the VIMEC, to match
the energy cost of a theoretical walk or run proved an enlightening task for the students. It
may be of interest to assess the efficacy of the VIMEC at successfully improving
comprehension of the energy content of food, relative to the energy expenditure of physical
activity, by conducting an intervention study. Perhaps the ability to estimate the energy
content of food, or of a diet, before and after educational seminar sessions with and without
the use of the VIMEC could be investigated.
241
8.3 The effect of exercise on appetite in highly-trained athletes
Chapters 4 and 5 investigated appetite responses to exercise in highly-trained male
endurance athletes. Chapter 4 showed that subjective appetite was transiently suppressed
after high-intensity exercise at 80% VO2max, compared with exercise of moderate- and low-
intensity at 60% and 40% VO2max respectively. This suppression was short-lived and did not
result in any differences in ad libitum food intake 60 minutes post-exercise. PP concentration
demonstrated a very modest response to exercise. Small perturbations in PYY concentration
with high-intensity exercise were not statistically significant. Chapter 5 aimed to extend these
findings by maintaining the high-intensity exercise condition (30 minutes of cycling at
80%VO2max) and including conditions of a shorter (15 minute) and longer (45 minute)
duration. A near identical protocol was used and a resting condition was added. Subjective
appetite did not change with exercise in any condition and appetite did not differ between
conditions at any point. Food intake 60 minutes post-exercise also did not differ between
conditions. PYY was unresponsive to exercise. Acylated ghrelin was transiently suppressed
with exercise in all three conditions, with the greatest suppression observed in the 45 minute
condition. GLP-1 concentration was increased with exercise in the 30 minute and 45 minute
conditions, with concentration remaining elevated during the 60 minute post-exercise period.
The phenomenon of an exercise-induced suppression of appetite, or the “anorexia of
exercise” (King et al., 1994) was first stated to occur after high-intensity exercise of 60-
70%VO2max (King et al., 1994; King et al., 1996; Kissileff et al., 1990; Westerterp-Plantenga
et al., 1997), with the majority of this research conducted in obese or overweight sedentary
(Kissileff et al., 1990; Westerterp et al., 1986), or healthy-weight low-activity (King et al.,
1994; King et al., 1996; Kissileff et al., 1990; Westerterp et al., 1986) individuals.
Subsequent work, however, has shown a lack of appetite suppression after exercise at
~70% VO2max in physically active individuals (King et al., 2010; King et al., 2011a). Chapter 4
of this thesis showed that exercise at an intensity of 60% VO2max was not sufficient to elicit a
suppression of appetite in highly-trained endurance males and that, for appetite to be
242
suppressed, the intensity needed to be 80%VO2max. This data would suggest that exercise-
induced suppression of appetite can be experienced in athletic populations, but the intensity
required to elicit this response would appear to be higher than for low-activity and
recreationally active people.
Despite the observed suppression of subjective appetite after high-intensity exercise,
anorexigenic hormones were not affected. There was a small increase in PYY concentration
from baseline of 9% in the high-intensity condition, resulting in concentration being 24% and
30% higher than after low- and moderate-intensity exercise respectively. While it is possible
that lack of statistical power was responsible for this difference not being statistically
significant, a power calculation showed that sample size of 62 participants would be required
to observe a statistically significant difference (alpha = 0.05, power of test = 0.5). As an
increase in PYY concentration with aerobic exercise is commonly observed in non-athletic
populations (Broom et al., 2009; King et al., 2011a; King et al., 2011b; Martins et al., 2007;
Ueda et al., 2009b), in an intensity-dependent manner (Ueda et al., 2009a), this data would
indicate a potential blunting of this response in athletic populations, or among those familiar
with such exercise. This is yet to be directly assessed, either in the form of a cross-sectional
investigation, comparing trained with untrained individuals, exercising at the same relative
intensity (or a range of intensities), or in the form of a longitudinal study, addressing changes
in hormonal responses before and after an exercise programme, in sedentary individuals.
The effect of the duration or energy cost of exercise has not previously been directly
investigated. The findings of Chapter 5 would suggest that the duration or energy cost of
exercise does not regulate post-exercise appetite, at least not in athletic populations. In
previous studies, exercise-induced appetite suppressions have been observed with as little
as 30 minutes of continuous exercise (Ueda et al., 2009a) or just a total 3 minutes of
maximal effort cycling (6 x 30 sec interval, 23 minutes total, including 5 x 4 minute active
recovery at a very low intensity) and with an energy cost of just 142 kcal (Deighton et al.,
2012). In addition, no such response has been seen after long, energetic exercise. These
observations point towards exercise-induced appetite suppression being independent of
243
duration or energy cost. This study directly assessed the effect of varying duration (and
hence energy cost), while controlling for intensity and the findings confirm these
speculations, at least within the range of 15 minutes to 45 minutes of high-intensity aerobic
exercise.
However, it is difficult to conclude that duration plays no role in the exercise-induced
suppression of appetite phenomenon, as in this instance, no significant post-exercise
appetite suppression was observed. This was despite the replication of a study condition that
was seen to elicit this response in Chapter 4 (30 minutes of cycling at 80% VO2max).
Failure to replicate the findings of Chapter 4 in this condition is perplexing. The percentage
decrease from baseline seen in VAS score after 30 minutes of cycling at 80% VO2max in
Chapter 4 was 25%. In contrast, the same condition elicited just a 7% decrease in Chapter
5. The 15 minute and 45 minute conditions did induce a 14% and 11% decrease
respectively, but this is still a somewhat blunted response, compared with Chapter 4.
On inspection, it can be seen that the actual intensity of these two comparable bouts
differed. Whereas the mean intensity of the bout in Chapter 4 was 80%, as intended, the
mean intensity of the bout in Chapter 5 was 76%. This lower intensity was predominantly
due to a greater number of participants that struggled to maintain the power output
necessary to elicit an intensity of 80% VO2max, requiring a reduction due cycle ergometer
resistance to enable the completion of the bout. This difference in intensity, while small,
could explain the different appetite response, especially if a “threshold” intensity for appetite
suppression lies between 75% and 80% VO2max for such a highly-trained athletic population.
Another possible explanation for this difference is that the studies were conducted
with largely different participants and individual variability in appetite response was seen to
be considerable. Of the 12 participants of Chapter 5, 2 also partook in the study of Chapter
4. The coefficient of variability values for percentage change in VAS score from baseline,
with exercise, for these two identical conditions were 122% and 1064% for Chapter 4 and
Chapter 5 respectively. This indicates a huge degree of variability in the appetite response to
exercise, especially in Chapter 5; the appetite response immediately post-exercise in
244
Chapter 5 ranged from a decrease in VAS score of 48% to and increase of 83%. Hence,
having different participants, even from a similar population and exhibiting similar
characteristics (age, BMI, aerobic capacity, training status), could explain the differing mean
responses observed.
While the results of Chapter 5 would suggest that post-exercise appetite responses
are not dependent on the duration of exercise, the response of some appetite-associated
hormones may be. Acylated ghrelin concentration was decreased with exercise in each of
the three exercise conditions, but the greatest decrease was observed in the longest bout.
Further, the plot of concentration against duration of exercise indicated that acylated ghrelin
concentration continued to fall throughout the period of exercise. GLP-1 concentration
increased only in the 30 minute and 45 minute conditions and this increase appeared to
have a quadratic polynomial relationship with duration of exercise.
These data would suggest that there may be some duration, or energy cost,
dependency in the acylated ghrelin and GLP-1 responses to exercise, but not in the
subjective appetite response. This raises the possibility of a dissociation between hormonal
and appetite responses to exercise and questions the role of hormonal changes in regulating
post-exercise appetite. This will be further investigated and discussed in section 8.6 (p254).
The findings of Chapters 4 and 5 would also indicate that the effect of exercise on appetite
may differ between different populations, particularly with regard to athletic individuals.
There is evidence from Chapters 4 and 5 that there is a blunting to the exercise-
induced appetite-suppression in highly-trained male endurance athletes. While a
suppression response was evident after exercise at 80% VO2max in Chapter 4, it was not
observed in Chapter 5 with exercise at the same intensity. It could be said that this
suppressive effect can be observed, though a greater “threshold intensity” exists for such a
response in athletes. It can be speculated that this is due either to athletes being more
familiar with high-intensity aerobic exercise or athletes possessing greater exercise capacity.
An increased capacity for exercise and greater economy of energy production through
regular exercise training in athletes will result in a reduction in metabolic and physiological
245
perturbation when exercising, not only at the same absolute intensity, but also at the same
relative intensity. If changes in appetite with exercise are driven by physiological
mechanisms (see section 8.6, p254), then the possible stimuli for such mechanisms are
numerous. These could include changes in energy charge of the cell, changes in plasma
concentrations of fuels such as glucose and lipids, changes in plasma concentrations of
hormones and metabolites associated with exercise and metabolic stress (e.g., insulin,
adrenaline, cortisol, lactate etc), changes in blood flow distribution, changes in body
temperature and changes in neural drive. (Some of these factors will be discussed further in
section 8.6, p254). Such changes, and hence the magnitude of the stimuli are likely to be
smaller for highly-trained athletes during sub-maximal exercise, than for non-athletes.
8.4 The effect of different exercise characteristics on appetite responses to
exercise
One aim of this thesis was to conduct a progressive, systematic approach
investigating the effect of a number of exercise characteristics on the appetite responses to
exercise. This section will evaluate the extent to which this aim was achieved.
As discussed in section 8.3, Chapters 4 and 5 would suggest that high-intensity
exercise can lead to a transient suppression of appetite that does not influence food intake
60 minutes post-exercise and that any appetite response appears independent of the
duration of exercise, or the energy cost.
Having investigated intensity and duration effects on appetite, Chapter 7 looked at
these characteristics of exercise from a different perspective. Here, the ability of individuals
to consciously match energy intake with the energy expenditure of two isoenergetic bouts of
treadmill running: one at a moderate-intensity (60% VO2max) and one at a high-intensity (90%
VO2max), was assessed. Being matched for energy expenditure, these bouts were of differing
duration, with one lasting ~30 minutes, while the other lasted, on average, ~47 minutes. The
246
findings of the study were that, contrary to the study hypothesis, participants exhibited a
strong ability to match intake with expenditure after high-and moderate-intensity exercise,
but that higher-intensity, shorter duration exercise is perceived as more energetic than more
moderate-intensity, longer duration exercise. This suggests that the perception of the energy
cost of exercise is driven more by intensity than by duration. This is not in any way linked to
appetite post-exercise. The food intake at the matching task was a conscious attempt to
match intake with expenditure of exercise and, when allowed to feed ad libitum after the
matching task, intake did not differ between the two conditions. However, this differing
perception of energy expenditure may play a role in post-exercise energy intake, in certain
circumstances. This notion will be explored further in section 8.6 (p254).
It was my initial intention to continue with the systematic approach and investigate
the effect of further exercise characteristics on appetite parameters. One possible avenue
could have been to distinguish between duration effects and energy cost effects, following
the approach suggested in figure 1.2 (p34) in the Introduction section of this thesis.
However, as Chapter 5 showed no difference in subjective appetite and food intake between
exercise bouts completed at the same intensity but lasting either 15, 30 or 45 minutes (and
hence of differing energy cost), no further investigation was warranted. The influence of the
mode of exercise on appetite responses would also have been an interesting research
question, with the direct comparison of isoenergetic, intensity-matched ergometer cycling
and treadmill running. Gender difference could also have been assessed.
However, it was decided to deviate a little and conclude this line of research within
the thesis by addressing the effects of sprint-interval cycle exercise on appetite, food intake
and appetite-associated hormones in overweight and obese individuals (Chapter 6). This
allowed for the investigation of a different form of exercise (intermittent sprint exercise, as
opposed to the continuous aerobic exercise of Chapters 4 and 5), while also allowing for
investigation of a different and more clinically relevant population. Unfortunately, due to the
time and financial constraints of a PhD programme, direct comparison between this
population and the previously-used athletic cohort, by including a separate population group
247
within this study, was not possible. Also, direct comparison of the forms of exercise was not
possible in this instance due to the inability of low-fitness level, overweight and obese
individuals to maintain high-intensity, continuous aerobic exercise in order to match the
exercise trials of Chapters 4 and 5. However, it was decided that conducting this study was
not only in keeping with the latest research trends, but also allowed for mechanistic
questions regarding intensity and duration/energy cost to be further investigated, by using an
exercise bout of extremes in intensity (very high intensity) and duration/energy cost (very
short/low), while also addressing important and clinically relevant questions, namely: 1) Can
a low-volume, time-efficient bout of very high-intensity exercise elicit a suppression of
appetite in overweight and obese individuals and can this result in a reduction in short-term
energy intake? 2) Is there the potential for such exercise bouts within an effective weight-
management programme?
It was found that just 4 x 30 seconds maximal effort cycling did elicit a transient
suppression of appetite in overweight and obese individuals, with this suppression
maintained for 30 minutes post-exercise. Acylated ghrelin was suppressed with sprint
interval cycling exercise, with this suppression maintained until the ad libitum test meal
consumed 60 minutes after exercise. Area-under-the-curve for GLP-1 concentration was
higher in the exercise trial, compared with the resting trial. Despite these hormonal
responses, there was no difference in ad libitum energy intake between the exercise and
resting conditions.
These findings, allied with the limited existing literature (Deighton et al., 2012),
indicate that the suppression of acylated ghrelin could be greater after sprint, or maximal
effort, interval cycle exercise. The enduring length of the suppression was longer in the study
of Chapter 6 than in commonly seen after continuous aerobic exercise (Broom et al., 2009;
Broom et al., 2007; King et al., 2010; King et al., 2011b; Shiiya et al., 2011; Wasse et al.,
2012). Broom et al. (Broom et al., 2009) however, did see a sustained suppression after
resistance exercise. This data would suggest that the acylated ghrelin response to exercise
may be intensity-dependent, with supramaximal exercise eliciting a more enduring
248
suppression than continuous aerobic exercise. Nevertheless, this did not result in a
sustained appetite suppression or reduced food intake in any of these instances. Moreover,
with no reduction in food intake and the low energy cost of such low-volume exercise,
relative energy intake did not differ between the exercise trial and the resting trial. Deighton
et al. (Deighton et al., 2012) showed a trend for a greater relative energy intake after sprint
interval exercise, compared with continuous aerobic exercise (60 minutes at 65% VO2max),
which was primarily due to the large difference in energy expended during the bouts (~142
kcal for sprint interval exercise vs. ~631 kcal for aerobic exercise). Further, the relative
energy intake after exercise in the present study (513 ± 498 kcal) is considerably higher than
the corresponding values of Chapter 4 (range of 24 kcal – 200 kcal for the three exercise
conditions) and the 30 minute (285 ± 94 kcal) and 45 minute (114 ± 108 kcal) conditions of
Chapter 5. This would suggest that, despite causing a transient suppression of appetite,
sprint interval cycling exercise is not successful at reducing acute relative energy
intake/energy balance. While suggesting such exercise is interesting from a mechanistic
perspective, with regards to post-exercise appetite responses, it is questionable whether
low-volume, low-energy cost sprint interval exercise is likely to prove on optimal form of
exercise for weight-loss strategies. However, before this can be confirmed, longer duration
studies, addressing the effect of sprint interval training on long-term appetite, energy balance
and bodyweight are required.
8.5 Questioning the regulatory role of appetite-associated hormones on
appetite and food intake in the post-exercise period
Throughout Chapters 4, 5 and 6, the effect of differing exercise trials on plasma
concentration of appetite-associated hormones was investigated. The effects of exercise on
these hormones have been discussed previously in the relevant chapters and collectively
here, in sections 8.3 (p241) and 8.4 (p245). However, here I will discuss the relationship
249
between changes in hormone concentration and changes in both subjective appetite and
energy intake.
For each of the Chapters 4, 5 and 6, the relationship between within-subject changes
in hormone concentration and corresponding changes in appetite and energy intake were
assessed with correlation analysis. This data is shown in table 8.2. For ease of presentation
and continuity, only VAS appetite scores were used. Significant relationships for within-
subject percentage changes in hormone concentration and percentage changes in both
subjective appetite and energy intake were rare, with weak or weak-to-moderate strength
correlation predominating (table 8.2). Only three significant relationships were observed, all
of which are somewhat contradictory, occurring in the inverse direction to that which may
have been anticipated; changes in the anorexigenic hormones PP and GLP-1 were
positively correlated with changes in subjective appetite and energy intake respectively,
while the orexigenic hormone acylated ghrelin was negatively correlated with subjective
appetite.
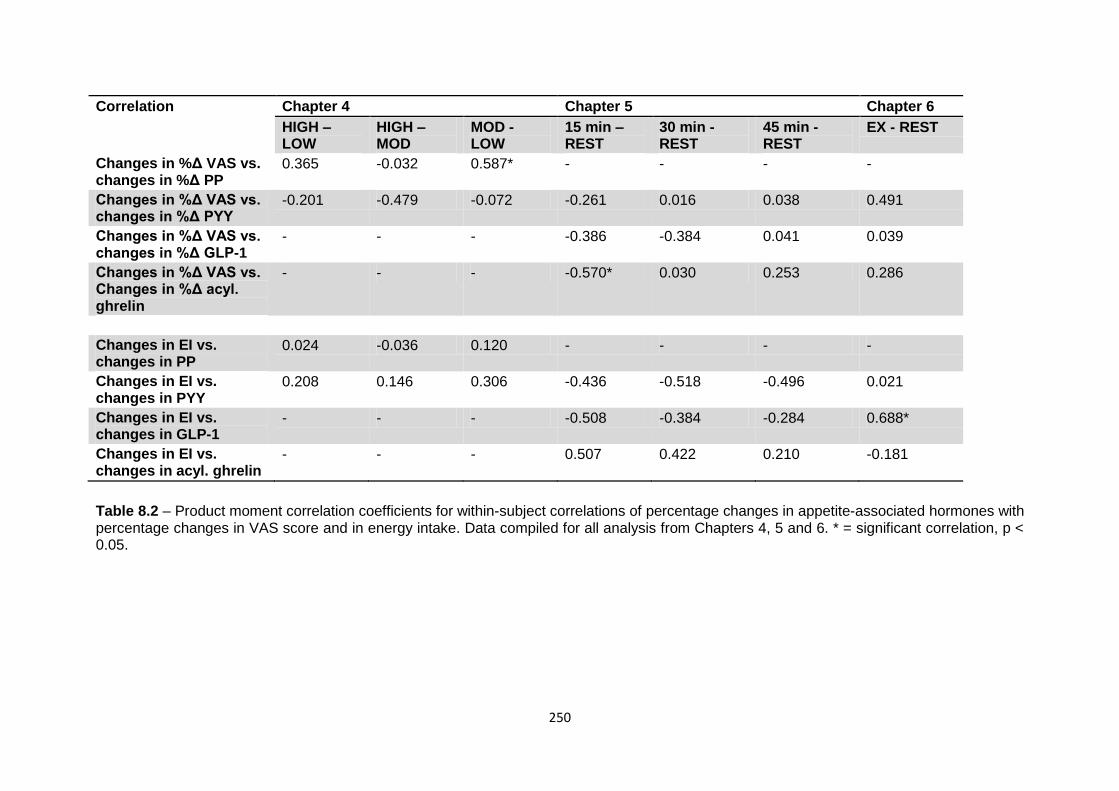
250
Correlation Chapter 4 Chapter 5 Chapter 6
HIGH – LOW
HIGH – MOD
MOD - LOW
15 min – REST
30 min - REST
45 min - REST
EX - REST
Changes in %Δ VAS vs. changes in %Δ PP
0.365 -0.032 0.587* - - - -
Changes in %Δ VAS vs. changes in %Δ PYY
-0.201 -0.479 -0.072 -0.261 0.016 0.038 0.491
Changes in %Δ VAS vs. changes in %Δ GLP-1
- - - -0.386 -0.384 0.041 0.039
Changes in %Δ VAS vs. Changes in %Δ acyl. ghrelin
- - - -0.570* 0.030 0.253 0.286
Changes in EI vs. changes in PP
0.024 -0.036 0.120 - - - -
Changes in EI vs. changes in PYY
0.208 0.146 0.306 -0.436 -0.518 -0.496 0.021
Changes in EI vs. changes in GLP-1
- - - -0.508 -0.384 -0.284 0.688*
Changes in EI vs. changes in acyl. ghrelin
- - - 0.507 0.422 0.210 -0.181
Table 8.2 – Product moment correlation coefficients for within-subject correlations of percentage changes in appetite-associated hormones with percentage changes in VAS score and in energy intake. Data compiled for all analysis from Chapters 4, 5 and 6. * = significant correlation, p < 0.05.
251
Of the few studies that have previously conducted such research, changes in
appetite-associated hormones have shown mixed associates with subjective appetite or ad
libitum energy intake (see table 1.2 in General introduction, p30). PYY has been shown to
be a strong predictor of appetite post-exercise in runners, but not walkers (Larson-Meyer et
al., 2012). Although, within-subject changes in AUC for PYY were not associated with
changes in energy intake in a different study (Ueda et al., 2009a). Unfortunately the former
study did not investigate the relationship between changes in hormone concentration and
changes in an ad libitum energy intake and the latter did not correlate hormonal change with
changes in subjective appetite. The findings of Chapters 4, 5 and 6 are in agreement with
Ueda et al. (Ueda et al., 2009a), suggesting that changes in PYY with exercise are not
strongly associated with post-exercise energy intake. Further, our data would also suggest
that PYY is not a key regulator of subjective appetite post-exercise, with no significant
relationship seen between changes in PYY and changes in VAS scores.
The relationship between changes in acylated ghrelin and both appetite and energy
intake has been addressed in a number of studies previously, with mixed findings. No study
within the existing literature has shown a correlation between changes in acylated ghrelin
and changes in energy intake. No such relationship was observed in the studies of this
thesis either. The association between changes in acylated ghrelin and changes in
subjective appetite is less clear. Previous studies have shown significant correlations (Broom
et al., 2007; Mackelvie et al., 2007), but the lack of such a relationship has also been seen
(Broom et al., 2009; Larson-Meyer et al., 2012; Wasse et al., 2012). The compiled findings of
the studies within this thesis are somewhat inconclusive, although they suggest that within-
subject changes in acylated ghrelin are not strongly associated with changes in subjective
appetite.
Changes in GLP-1 were not strongly associated with subjective appetite in highly-
trained athletes or overweight and obese individuals. This is not in agreement with the
findings of Larson-Meyer et al. (Larson-Meyer et al., 2012), who showed that GLP-1 was a
strong predictor of appetite in runners, but not walkers. In Chapter 5, no significant
252
relationships between changes in GLP-1 and energy intake were observed. Paradoxically,
within-subject changes in GLP-1 exhibited a strong, positive relationship with energy intake,
with a significant, moderate-strength correlation observed in the study of Chapter 6. This is
the inverse of the relationship previously seen in the studies of Ueda et al. (Ueda et al.,
2009a), who showed a strong, negative correlation between change in GLP-1 AUC for the
test period and change in energy intake for both exercise trials (high-intensity exercise and
moderate-intensity exercise) compared with a resting trial. This latter finding is the more
expected, due to the known anorexigenic action of GLP-1. The positive relationship
observed in Chapter 6 is rather perplexing. It is possible that the contrasting findings are due
to differences in the exercise bout completed, with the sprint interval cycling undertaken in
Chapter 6 of this thesis being of a higher intensity than both the moderate- (50% VO2max) and
high-intensity (75% VO2max) aerobic bouts of recumbent cycling undertaken in the study of
Ueda et al. (2009a). However, all three trial conditions, across the two studies elicited similar
GLP-1 responses to exercise. This suggests that intensity of the exercise was not an
important regulator of the GLP-1 response, and while it is possible that the nature of the
exercise may have some effect on the post-exercise relationship between GLP-1
concentration and appetite and eating behaviour, there is no clear rationale why this would
be the case.
A perhaps more likely reason for the discrepancy is the differing populations studied.
The study population of Chapter 6 was overweight and obese men and women, whereas the
study of Ueda and colleagues (Ueda et al., 2009a) was conducted in young, healthy-weight
males. It is possible that different populations show a differing relationship between changes
in appetite-associated hormones and both subjective appetite and ad libitum intake.
Overweight and obese individuals may possess a blunting to GLP-1 post-exercise, which
would explain the dissociation between changes in GLP-1 concentration and energy intake
in Chapter 6. There is evidence that this cohort exhibit higher fasting concentrations of GLP-
1 (Ranganath et al., 1996), which can suggest a blunting, while the overweight and obese
also demonstrate a blunted GLP-1 response to feeding (Lugari et al., 2004; Ranganath et
253
al., 1996; Verdich et al., 2001). Also, Larson-Meyer et al., (2012) demonstrated that runners,
but not walkers, exhibited a strong, negative relationship between changes in GLP-1
concentration and subjective appetite, post-exercise. Moreover, Martins and co-workers
(Martins et al., 201) showed that this GLP-1 response to feeding was sensitised by exercise
training in overweight individuals. These data support the notion of a possible blunting to
post-exercise alterations in GLP-1 concentration in the overweight and obese, and hence a
dissociation between changes in GLP-1 and food intake.
From assessing the accumulated data from three studies of this thesis, it is not easy
to draw firm conclusions regarding the relationship between within-subject changes in
appetite-associated hormones and both subjective appetite and energy intake, and hence
speculating about the regulatory role of these hormones post-exercise. It would appear that
any changes in PYY are not strongly associated with changes in appetite or energy intake,
and hence PYY is an unlikely key regulator of post-exercise appetite. A lack of a significant
increase in PYY concentration post-exercise in any exercise trial (vs. baseline or resting
trial), even when an appetite suppression was present substantiates this claim. A similar
observation can be made for PP. The role of acylated ghrelin is less clear. The present data,
allied with that of previous studies would suggest that acylated ghrelin does not play a key
regulatory role in post-exercise food intake, due to a lack of a relationship between changes
in these two measures. However, the relationship between changes in acylated ghrelin and
changes in subjective appetite remains unclear. Further investigation, assessing this
relationship in the post-exercise period may be warranted. The data from this thesis would
suggest that GLP-1 does not play a key regulatory role in post-exercise appetite and food
intake, although this does contradict existing literature to some degree. Further investigation
is again required to elucidate this relationship.
It should also be acknowledged that assessing the influence or relationship of a
single appetite-associated hormone on or with appetite and food intake is likely to prove a
somewhat moot exercise. It is probable that changes in appetite and food intake are
influence by perturbations in the entire profile of appetite-associated hormones, rather than
254
being strongly influences by alterations in just one hormone. This may explain the lack of
strong relationships between any single hormone and measures of appetite and food intake
in this thesis. Future research should attempt to address the exercise-induced changes in a
range of appetite-associated hormones and, if possible assess relationships between
perturbations in the concentrations of these hormones and appetite measures using large-
scale multiple regression models. However, it is acknowledged that for such analysis, a large
sample is required and the economic cost of obtaining such data from a single study would
be very high.
8.6 What does regulate post-exercise appetite and food intake?
Section 8.5 would indicate that peripheral endocrine signals are perhaps not key
regulators of post-exercise appetite and may not be the primary cause of any exercise-
induced suppression of appetite. If this is the case, it remains necessary to ask the question:
what, then, does regulate post-exercise appetite and energy intake, and what is the
mechanism, or mechanisms by which an appetite suppression transpires?
Peripheral endocrine signals are not the only physiological responses to exercise that
have been postulated to effect appetite. One proposed explanation for exercise-induced
appetite suppression is the redistribution of blood flow during exercise away from the
gastrointestinal region, towards the muscles (Blundell et al., 2003). Splanchnic blood flow
has been shown to reduce considerably during moderate- to high-intensity exercise (Rowell
et al., 1964) and it is thought that this may limit the blood volume available to the gut for the
circulation of the orexigenic hormone ghrelin (Burns et al., 2007). However, evidence of
increases in other gut-derived hormones with exercise, such as the satiety peptides would
contradict this theory. In addition, if a redistribution of blood flow acts as a means by which
the action of appetite-associated hormones is altered, then the findings of section 8.5 – that
these hormones may not play an important regulatory role in post-exercise changes in
appetite – again dispute the importance of reduced splanchnic blood flow.
255
An increase in body temperature during exercise is another possible mechanism by
which appetite could be suppressed. Exercise in the heat has been show to elicit a greater
suppression of appetite than exercise conducted in a thermoneutral environment (Shorten et
al., 2009). Exercise in cold environments has been seen to stimulate appetite and food
intake, compared with exercise at a neutral temperature (White et al., 2005; Crabtree, D.
PhD Thesis, University of Birmingham), while cold water immersion immediately post-
exercise can stimulate post-exercise feeding (Halse et al., 2011). Further, the anecdotal
increase in hunger post-swimming, compared with other, land-based forms of exercise has
been explained by a reduced increase in body temperature during swimming. However, King
and colleagues (King et al., 2011b) did observe a transient suppression in appetite during
and immediately after prolonged, moderate-intensity swimming, with no difference in post-
exercise ad libitum energy intake, compared with resting, in the hours following. The
mechanism by which changes in body temperature may influence appetite has been linked
to a greater redistribution of blood flow during exercise in hot environments, with an increase
in flow to the skin in order to dissipate heat and hence further decrease splanchnic blood
flow (Rowell et al., 1971). In contrast, exercise in the cold results in a decrease in blood flow
to the periphery and a consequent maintenance of flow to the gastrointestinal region.
Following the aforementioned theory of blood flow availability for the circulation of ghrelin,
this could explain the effect of temperature on appetite responses to exercise. However,
increases in plasma acylated ghrelin after exercise in the heat was not correlated with
increases in skin temperature (a marker of skin blood flow) (Crabtree, D. PhD Thesis,
University of Birmingham). In addition, as the study of Shorten et al. (Shorten et al., 2009)
observed a decrease in ghrelin concentration with exercise at a higher temperature, one
might also have expected to see a lower circulating concentration of PYY, as PYY is also
secreted from the gastrointestinal tract. However, this was not the case, with PYY largely
unaffected by exercise at different temperatures; in fact, PYY concentration was slightly
increased after exercise in the heat, compared with exercise in a thermoneutral environment.
This again questions the role of blood flow redistribution in the post-exercise appetite
256
response and would suggest that any effect of body temperature acts independent of
changes in blood flow.
As discussed in section 1.4 (p21), peripheral endocrine signals act upon central
appetite-governing regions of the brain (see figure 1.1, p23). It is plausible that any
exercise-induced alterations in appetite are mediated here. Only recently has the effect of
exercise on the central regulation of appetite been investigated. Primarily, this has been
done by using functional magnetic resonance imaging (fMRI) techniques to assess blood
flow to areas of the brain that are associated with the central reward system and the hedonic
properties of food, such as the orbitofrontal cortex (Kringelbach, 2005), the insula (Simmons
et al., 2005) and the amygdale (Siep et al., 2009) during the post-exercise period. For an in
depth discussion of the roles of these brain areas in the reward sensation and hedonics of
food and consequences for food intake and weight-status, please see these comprehensive
reviews: (Berridge, 2009; Kenny, 2011). There is evidence that acute (Evero et al., 2012)
and chronic (Cornier et al., 2012) exercise can reduce the neural responses in these areas
to visual food cues, while a region of the brain associated with feelings of satiation and
satiety, the dorsolateral prefrontal cortex, has also been shown to be responsive to exercise
(Montenegro et al., 2012). A bout of strenuous running downregulated activity within reward
areas of the brain when participants were shown photographic images of food immediately
post-exercise (Crabtree, D. PhD Thesis, University of Birmingham). This was coupled with a
suppression of appetite, an increase in acylated ghrelin and a decrease in total PYY
concentration. Furthermore, the activity of reward regions of the brain increased in the hours
after exercise and this was matched by a rebound increase in subjective appetite. It is
possible that appetite and food intake post-exercise are regulated via changes in sensitivity
of reward areas of the brain to food cues.
Other central factors could also regulate post-exercise changes in appetite, such as
changes in brain blood flow and hence delivery of peripheral signals to the arcuate nucleus,
changes in receptor affinity for the signals or changes in the downstream signalling of
hunger and/or satiation. These mechanisms have not yet been investigated. Also, as
257
different regions of the hypothalamus regulate both appetite and thermoregulation, any effect
of change in core temperature on appetite may take place here, with “cross-talk” between
appetite and thermoregulation command centres.
Changes in the hedonic perception of foods can be considered a cognitive response
to exercise, resulting in autonomous changes to feeding behaviour in the post-exercise
period. It is plausible that other behavioural responses, governed by volitional cognition play
a key role in food intake, if not subjective appetite, after exercise (King et al., 2007). As
stated in Chapter 1, the thesis is not directly concerned with the cognitive influences of
behavioural responses in food intake to exercise. However, as eating is governed entirely by
behaviour (Blundell et al., 2005), these factors cannot be overlooked and volitional changes
to behaviour undoubtedly play a role in post-exercise food intake.
As touched upon in section 8.5 (p248), powerful volitional changes in behaviour can
override less potent physiological stimuli. This may be particularly evident in specific
populations, such as highly-trained athletes. Current dogma recommends immediate post-
exercise feeding to facilitate recovery (Burke, 1997; Jentjens and Jeukendrup, 2003),
maximise adaptations to training (Tipton and Wolfe, 2004) and maintain immune function
(Gleeson et al., 2001). An increased capacity for glucose uptake and hence glycogen
resynthesis after exercise (Goodyear et al., 1991; Ivy and Kuo, 1998) and an increased
potential for protein synthesis in the post-exercise period when amino acid delivery is
adequate (Tipton et al., 2007) are both well established and publicised responses that
encourage the athlete to consume food within close proximity to the cessation of exercise.
So much so, that it is very plausible that food intake choices after exercise are governed
entirely by a desire to take advantage of a metabolic “window” for feeding and to maximise
recovery and adaptations to training, with physiological stimuli and any perceived levels of
hunger or satiety overridden and ignored. It would perhaps be of interest to investigate this
theory through qualitative research, gaining a greater understanding of what drives the post-
exercise feeding of athletes.
258
It is likely that volitional behavioural choices influence post-exercise intake in
populations other than athletes. The environment, or society, exerts a potent effect on eating
behaviour. The high abundance of food, the extensive marketing of food (including post-
exercise recovery drinks and foods) and high hedonic value of energy-dense foods favour
feeding and over-consumption of food. This development of a society that promotes food
consumption and hence a state of positive energy balance has been termed the obesogenic
environment (Swinburn et al., 1999). If such factors are so prevalent and powerful, then it is
likely that they also play a role in regulating eating behaviour, and hence energy intake in the
post-exercise period. The aforementioned desire of athletes to fuel post-exercise, by
consuming extensively marketed recovery supplements, is an example of such
environmental influences on post-exercise eating behaviour. Other examples in non-athletic
populations could include consumption of similar items, targeted at recreational exercisers or
food product sale (such as vending machines) in exercise venues, such as gyms and
swimming pools.
A further example of a potential influence on volitional behavioural choices is the
feeling of having “earned” food, particularly energy-dense “treats” after exercise. This may
be particularly prevalent in restrained eaters, who’s eating behaviour is influenced by their
perceived energy balance status (Herman and Mack, 1975). However, a poor understanding
of the relative rate of energy expenditure during exercise and the rate of intake during
feeding can lead to over-eating and energy surplus after exercise.
Chapter 7 investigated individuals’ ability to consciously match energy intake with the
energy expenditure of isocaloric exercise at a moderate and high intensity. Contrary to what
was hypothesised, participants demonstrated a strong ability to consciously match energy
intake with exercise-induced energy expenditure, with an undervaluation of the energy cost
of exercise, particularly that of a moderate intensity offset by an undervaluation of the energy
content of food. This would suggest that over-eating post-exercise because an exerciser
thought that they had expended more energy than then actually had, is unlikely. However, it
is possible that participants altered their behaviour under experimental conditions, perhaps
259
over-compensating for an expected imbalance in their perception of energy cost of exercise
and energy content of food. The participants in this study exhibited varying degrees of eating
restraint, as measured using the Dutch Eating Behaviour Questionnaire (van Strien et al.,
1986). The data was analysed with the addition of eating restraint as a between-subject
factor (high restraint (score > 2.2, n = 6) vs. low (n = 8) restraint) and strong matching ability
was seen in both groups. It would be of interest to repeat this study in a larger population of
restrained versus unrestrained eaters, as this ability to match may be an important regulator
of post-exercise intake amongst those that are consciously attempting to achieve an energy
deficit in order to lose weight, or to achieve energy balance to avoid weight gain, but doing
so without access to quantitative measures of both energy cost and content of energy in
food. While rather crude, this approach to weight-management is adopted by many
individuals attempting to manage their bodyweight (Weiss et al., 2006).
8.7 Summary of thesis findings
In summary, the findings of this thesis were as follows:
1. The novel tool for the measure of subjective appetite – The Visual Meal Creator – is
a valid measure of subjective appetite and proved a strong predictor of food intake at
rest. It remains to be confirmed whether this is the case after exercise interventions.
Nonetheless, the VIMEC may be considered a useful tool for appetite research,
either in addition or as an alternative to existing methods and techniques.
2. The exercise-induced suppression of appetite effect was observed in highly-trained
athletes, although there appears a blunting to this response. This is could be due to a
reduction in physiological perturbations during exercise in athletes or in-grained post-
exercise volitional eating behaviours.
3. The exercise-induced suppression of appetite appears independent of the duration or
energy cost of exercise.
260
4. PP and PYY were largely unresponsive to exercise. Acylated ghrelin and GLP-1
concentrations were responsive to exercise; however, there appears a dissociation
between changes in appetite-regulating hormones and both subjective appetite and
food intake in the post-exercise period.
5. Sprint-interval cycle exercise, in the form of just 4 x 30 seconds maximal effort
cycling, was sufficient to elicit a transient appetite suppression in overweight and
obese individuals. While this suppression was more enduring than is often observed
after continuous aerobic exercise, food intake was unaffected. In addition, relative
energy intake, and hence acute energy balance was no different to that of a resting
condition, which questions the appropriateness and value of low-volume, low-energy
cost exercise for weight-management strategies.
6. Individuals demonstrated a strong ability to match energy intake with the energy cost
of moderate- and high-intensity exercise. With moderate-intensity exercise, this
appears to be due to a slight underestimate of the energy content of food
compensating for and under-valuation of the energy cost of exercise. Further, the
perception of the energy cost of exercise appears to be driven by the intensity, rather
than the duration of exercise, which may have implications for weight-management
interventions, especially when casual approaches to exercise and attempting to eat
less are being implemented.
8.8 Future research
It would be fair to comment that this thesis has formulated more questions than it has
answered. From the findings and observations, a number of possible future directions of
research can be suggested:
1. It would be desirable to extend the validation of the VIMEC to a large scale
intervention study, further investigating its strength as a predictor of food intake. Prior
to this, it would perhaps be beneficial to increase the library of food items, including,
261
in particular, some more commonly-consumed breakfast items; the lack of such items
is considered a current limitation when obtaining measures in the morning. It may
also be wise to pursue some of the potential additional uses of the VIMEC.
2. It could prove informative to continue the systematic approach of Chapters 4 and 5,
principally investigating the concept of the exercise-induced suppression of appetite
effect differing in different populations. Direct comparisons of different population
cohorts (e.g. sedentary vs. moderately-active vs. highly active/trained) within the
same study would be an interesting next step. Investigating the effect of differing
modes of exercise (cycling vs. running vs. swimming) on appetite responses, as was
initially intended within this PhD programme, may also be of interest.
3. The regulatory role of appetite-associated hormones in the post-exercise period
certainly requires further attention. It has perhaps been assumed that changes in
these hormone concentrations are key regulators of any exercise-induced
suppression of appetite, yet recent data, including data from this thesis questions this
belief. If there is truly a dissociation between changes in appetite-associated
hormone concentration and subjective appetite, it is certainly worth investigating why
such a dissociation occurs after exercise. Due to individual variability in circulating
concentrations of these hormones, as well as variability in response to exercise, a
larger scale study would be warranted, with sufficient sample size and statistical
power to conduct multiple regression analysis. This would be a more robust measure
of the relationship between hormones and subjective appetite or food intake,
assessing the degree to which changes in the former predict changes in the latter.
However, due to the cost of measuring appetite-associated hormones, such an
investigation would be very expensive to conduct.
4. As with any investigation of acute responses to exercise in appetite and food intake,
only a small “snap shot” of energy balance is obtained. For an understanding of likely
effects on body weight and composition, long-term interventions and monitoring are
required. Therefore, any findings from acute studies, such as potentially prolonged
262
appetite suppression after supramaximal exercise, should be investigated further,
using such exercise bouts in chronic exercise intervention studies and addressing not
only changes in acute appetite and energy balance, but also in body weight and
composition changes. Investigating the efficacy of differing forms of exercise,
perhaps of differing intensity but matched for energy cost, at promoting compliance to
exercise and changes in ad libitum food intake and body weight and composition
would be worthwhile.
8.9 Thoughts, speculation and practical implications
I would like to conclude this chapter, and the thesis, by relaying some of my own
personal thoughts and speculations regarding the appetite response to exercise and the
potential role of such responses in weight-management strategies.
8.9.1 Can an exercise-induced suppression of appetite be used as a tool to promote
acute energy deficit and assist weight-loss?
There is little evidence that an exercise-induce suppression of appetite can result in
an acute reduction in food intake. It would appear that the response is lacking in potency and
is too transient. However, a reduction in relative energy intake, or energy balance, can be
observed acutely, if the energy cost of the exercise bout is sufficient. This is due to the
absence of a compensatory response in appetite to the energy cost of exercise; appetite is
rarely seen to be increased after high-intensity exercise, even after particularly energetic
exercise bouts. This would suggest that the exercise-induced appetite suppression effect per
se is not a useful tool that can be utilised and manipulated to assist with achieving an energy
deficit as part of a weight-management strategy, although it may assist with the limitation of
an energy surplus and weight gain.
However, before accepting this outright, it was worth considering a scenario where a
short-lived, transient suppression of appetite may impact upon energy balance. Supposing
an individual is following an energy restricted diet in order to lose weight. Major barriers to
263
such a diet include, unsurprisingly, hunger and snacking (Tu and Barchard, 1993).
Therefore, it is likely that dieters will experience hunger between meals and become tempted
to snack. Hence, the energy-restricted diet will be compromised. Imagine a scenario where
this individual is due to consume a meal in around one hour, but they are now hungry and
want to snack on a calorie-dense snack item, such as a cereal bar. If there was a means by
which appetite could be suppressed, just until meal time, without consuming calories to do
so, then this would be ideal. Could an exercise bout prove beneficial in this instance?
Chapter 6 showed that just 4 x 30 seconds maximal effort bouts of cycling was sufficient to
cause and appetite suppression that lasted at 30 minutes, with appetite scores still non-
significantly lower than the resting trial at 60 minutes post-exercise. Interestingly, one
participant was only able to complete two of the four sprints, yet their subjective appetite was
still suppressed. It would be interesting to see if this is a robust finding. What’s more, is even
just a single 30 second maximal effort sprint sufficient to elicit this response? If so, such a
short, time-efficient micro-bout of exercise may be able to act as a “snack replacement” in
the scenario describe here. While such a bout would result in a very small energy cost, this
can be added to the energy saved, if it prevents a snack from being consumed. This
suggestion requires access to some mode of exercise, ideally a cycle ergometer and
performing a micro-bout of exercise may not always be possible or convenient, depending
on the time, location and situation, hence, the feasibility of this recommendation is highly
questionable. Yet, it is a scenario in which an exercise-induced appetite suppression effect
may result in a benefit to short-term energy balance.
8.9.2 Losing weight is difficult; the key for society is to prevent weight-gain.
Achieving clinically significant, sustained weight-loss is difficult. Through the work of
my thesis I have seen that creating acute energy deficit with exercise is not easily achieved.
By definition, clinically significant weight-loss is a loss of ≥ 5% bodyweight, whereas weight
maintenance is considered a bodyweight change of ≤ 3%. The American College of Sports
Medicine Stand Point suggests that the weekly energy deficit required to promote weight-
264
loss is ~3500-7000 kcal week-1(Jakicic et al., 2001), whereas successful weight maintenance
requires a more modest deficit of 1200-2000 kcal week-1 (Donnelly et al., 2009). With fewer
barriers to remaining weight stable than to losing weight, attempting to remain weight stable
should be a more achievable goal. Prevention rather than cure should be the way forward.
8.9.3 Exercise for the avoidance of weight-gain.
In the investigation of this thesis, acute bouts of exercise failed to elicit a sustained
suppression of appetite and in no trial condition was a mean negative energy balance for the
trial period achieved. Given these observed relationships between exercise and subsequent
appetite, food intake and acute energy balance, it could be argued that the likely key role of
exercise alone, in the absence of dietary restriction, is in assisting with the avoidance of
weight-gain. It has been demonstrated that an acute exercise bout can elicit a substantial,
short-term shift of energy balance in favour of energy deficit compared with doing no
exercise, as long as the energy expenditure of the exercise bout is considerable (>450 kcal,
in the case of the findings of this thesis). While such a shift in energy balance (without the
further influence of dietary restriction limiting energy intake) may be insufficient to promote
weight-loss, when repeated regularly, it is likely to prevent sustained, prolonged periods of
positive energy balance, leading to weight-gain. However, this cannot be substantiated from
the acute studies of this thesis. Importantly, in keeping with the trends of previous research,
in no instance did exercise increase post-exercise appetite and food intake. Therefore,
energetic bouts of exercise should prove an effective method for increasing energy
expenditure and shifting the energy balance in favour of deficit, without triggering an acute
compensatory increase in energy intake. Thus, exercise can compliment an energy
restriction diet to assist in creating a more substantial energy deficit to promote weight-loss.
Transient suppressions of appetite were observed with high-intensity aerobic bouts of
continuous exercise, and after low-volume sprint interval exercise, although this did not
impact upon post-exercise food intake, just 60 minutes after exercise. It would appear that
the overall energy cost of the exercise is a vital determinant of acute post-exercise energy

265
balance and therefore, the intensity should be such that it does not limit the longevity of the
exercise bout due to the onset of fatigue and in doing so result in a low energy expenditure.
Therefore, whether attempting to avoid weight-gain of facilitate weight-loss, the total energy
cost of exercise is key.
266
8.10 References
Artal, R., Catanzaro, R.B., Gavard, J.A., Mostello, D.J., and Friganza, J.C. (2007). A lifestyle intervention of weight-gain restriction: diet and exercise in obese women with gestational diabetes mellitus. Applied Physiology, Nutrition, and Metabolism 32, 596-601. Berridge, K.C. (2009). ‘Liking’ and ‘wanting’ food rewards: Brain substrates and roles in eating disorders. Physiology & Behavior 97, 537-550. Blundell, J.E., King, N.A., and Bryant, E. (2005). Interactions among physical activity, food choice and appetite control: health messages in physical activity and diet. In: Caero N. Norgan NG Ellison GTH. eds. Childhood obesity London: Taylor & Francis, 135-148. Blundell, J.E., Stubbs, R.J., Hughes, D.A., Whybrow, S., and King, N.A. (2003). Cross talk between physical activity and appetite control: does physical activity stimulate appetite? Proc Nutr Soc 62, 651-661. Brindal, E., Wilson, C., Mohr, P., and Wittert, G. (2012). Perceptions of portion size and energy content: implications for strategies to affect behaviour change. Public Health Nutrition 15, 246-253. Broom, D.R., Batterham, R.L., King, J.A., and Stensel, D.J. (2009). Influence of resistance and aerobic exercise on hunger, circulating levels of acylated ghrelin, and peptide YY in healthy males. American Journal of Physiology-Regulatory Integrative and Comparative Physiology 296, R29-R35. Broom, D.R., Stensel, D.J., Bishop, N.C., Burns, S.F., and Miyashita, M. (2007). Exercise-induced suppression of acylated ghrelin in humans. J Appl Physiol 102, 2165-2171. Burke, L.M. (1997). Nutrition for post-exercise recovery. Australian journal of science and medicine in sport 29, 3-10. Burns, S.F., Broom, D.R., Miyashita, M., Mundy, C., and Stensel, D.J. (2007). A single session of treadmill running has no effect on plasma total ghrelin concentrations. Journal of Sports Sciences 25, 635-642. Carels, R.A., Konrad, K., and Harper, J. (2007). Individual differences in food perceptions and calorie estimation: An examination of dieting status, weight, and gender. Appetite 49, 450-458. Cornier, M.-A., Melanson, E.L., Salzberg, A.K., Bechtell, J.L., and Tregellas, J.R. (2012). The effects of exercise on the neuronal response to food cues. Physiology & Behavior 105, 1028-1034. Crabtree, D.R. (2012). "The effects of exercise on appetite regulation." Ph.D thesis, University of Birmingham. http://etheses.bham.ac.uk/3779/ Deighton, K., Barry, R., Connon, C., and Stensel, D. (2012). Appetite, gut hormone and energy intake responses to low volume sprint interval and traditional endurance exercise. Eur J Appl Physiol, 1-10. Donnelly, J.E., Blair, S.N., Jakicic, J.M., Manore, M.M., Rankin, J.W., Smith, B.K., and null (2009). American College of Sports Medicine Position Stand. Appropriate physical activity
267
intervention strategies for weight loss and prevention of weight regain for adults. Medicine and science in sports and exercise 41, 459-471. Evero, N., Hackett, L.C., Clark, R.D., Phelan, S., and Hagobian, T.A. (2012). Aerobic exercise reduces neuronal responses in food reward brain regions. Journal of Applied Physiology 112, 1612-1619. Farah, N.M.F., Brunstrom, J.M., and Gill, J.M.R. (2012). Using a novel computer-based approach to assess the acute effects of exercise on appetite-related measures. Appetite 58, 196-204. Finucane, M.M., Stevens, G.A., Cowan, M.J., Danaei, G., Lin, J.K., Paciorek, C.J., Singh, G.M., Gutierrez, H.R., Lu, Y., Bahalim, A.N., et al. (2011). National, regional, and global trends in body-mass index since 1980: systematic analysis of health examination surveys and epidemiological studies with 960 country-years and 9·1 million participants. The Lancet 377, 557-567. Foster-Schubert, K.E., Alfano, C.M., Duggan, C.R., Xiao, L., Campbell, K.L., Kong, A., Bain, C.E., Wang, C.-Y., Blackburn, G.L., and McTiernan, A. (2012). Effect of diet and exercise, alone or combined, on weight and body composition in overweight-to-obese postmenopausal women. Obesity 20, 1628- 1638. Frobisher, C., and Maxwell, S.M. (2003). The estimation of food portion sizes: a comparison between using descriptions of portion sizes and a photographic food atlas by children and adults. Journal of Human Nutrition and Dietetics 16, 181-188. Gleeson, M., Lancaster, G.I., and Bishop, N.C. (2001). Nutritional Strategies to Minimise Exercise-Induced Immunosuppression in Athletes. Canadian Journal of Applied Physiology 26, S23-S35. Goodyear, L.J., Hirshman, M.F., and Horton, E.S. (1991). Exercise-induced translocation of skeletal muscle glucose transporters. American Journal of Physiology - Endocrinology And Metabolism 261, E795-E799. Halse, R.E., Wallman, K.E., and Guelfi, K.J. (2011). Postexercise water immersion increases short-term food intake in trained men. Medicine and Science in Sports & Exercise 43, 632-638. Health and Social Care Information Centre (2013). Health Survey for England. Statistics on Obesity, Physical Activity and Diet – England, 2013. http://www.hscic.gov.uk/searchcatalogue?productid=11194&q=obesity&sort=Relevance&size=10&page=1#top Herman, C.P., and Mack, D. (1975). Restrained and unrestrained eating. Journal of personality 43, 647-660. Higgins, J.A., LaSalle, A.L., Zhaoxing, P., Kasten, M.Y., Bing, K.N., Ridzon, S.E., and Witten, T.L. (2009). Validation of photographic food records in children: are pictures really worth a thousand words? Eur J Clin Nutr 63, 1025-1033. Ivy, J.L., and Kuo, C.H. (1998). Regulation of GLUT4 protein and glycogen synthase during muscle glycogen synthesis after exercise. Acta Physiologica Scandinavica 162, 295-304.
268
Jakicic, J.M., Clark, K., Coleman, E., Donnelly, J.E., Foreyt, J., Melanson, E., Volek, J., Volpe, S.L., and null (2001). American College of Sports Medicine position stand. Appropriate intervention strategies for weight loss and prevention of weight regain for adults. Medicine and science in sports and exercise 33, 2145-2156. Jentjens, R., and Jeukendrup, A. (2003). Determinants of post-exercise glycogen synthesis during short-term recovery. Sports Med 33, 117-144. Kenny, Paul J. (2011). Reward mechanisms in obesity: New insights and future directions. Neuron 69, 664-679. Kerksick, C., Wismann-Bunn, J., Fogt, D., Thomas, A., Taylor, L., Campbell, B., Wilborn, C., Harvey, T., Roberts, M., La Bounty, P., et al. (2010). Changes in weight loss, body composition and cardiovascular disease risk after altering macronutrient distributions during a regular exercise program in obese women. Nutr J 9, 1-19. King, J.A., Miyashita, M., Wasse, L.K., and Stensel, D.J. (2010). Influence of prolonged treadmill running on appetite, energy intake and circulating concentrations of acylated ghrelin. Appetite 54, 492-498. King, J.A., Wasse, L.K., Ewens, J., Crystallis, K., Emmanuel, J., Batterham, R.L., and Stensel, D.J. (2011a). Differential acylated ghrelin, peptide YY3-36, appetite, and food intake responses to equivalent energy deficits created by exercise and food restriction. Journal of Clinical Endocrinology & Metabolism 96, 1114-1121. King, J.A., Wasse, L.K., and Stensel, D.J. (2011b). The acute effects of swimming on appetite, food intake, and plasma acylated ghrelin. Journal of Obesity 2011. King, N.A., Burley, V.J., and Blundell, J.E. (1994). Exercise induced suppression of appetite: effects on food intake and implications for energ balance. European Journal of Clinical Nutrition 48, 715-724 King, N.A., Caudwell, P., Hopkins, M., Byrne, N.M., Colley, R., Hills, A.P., Stubbs, J.R., and Blundell, J.E. (2007). Metabolic and behavioral compensatory responses to exercise interventions: barriers to weight loss[ast]. Obesity 15, 1373-1383. King, N.A., Snell, L., Smith, R.D., and Blundell, J.E. (1996). Effects of short-term exercise on appetite responses in unrestrained females. European Journal of Clinical Nutrition 50, 663-667. Kissileff, H.R., Pi-Sunyer, F.X., Segal, K., Meltzer, S., and Foelsch, P.A. (1990). Acute effects of exercise on food intake in obese and nonobese women. American Journal of Clinical Nutrition 52, 240-245. Krall, E.A., and Dwyer, J.T. (1987). Validity of a food frequency questionnaire and a food diary in a short-term recall situation. Journal of the American Dietetic Association 87, 1374-1377. Kringelbach, M.L. (2005). The human orbitofrontal cortex: linking reward to hedonic experience. Nat Rev Neurosci 6, 691-702. Larson-Meyer, D.E., Palm, S., Bansal, A., Austin, K.J., Hart, A.M., and Alexander, B.M. (2012). Influence of running and walking on hormonal regulators of appetite in women. journal of obesity 2012, 15.
269
Lugari, R., Dei Cas., A., Ugolotti, D., Barilli, A.L., Camellini, C., Ganzerla, G.C., Luciani, A., Salerni, B., Mittenperger, F., Nodari, S., Gnudi, A., and Zandomeneghi, R. (2004). Glucagon-like peptide 1 (GLP-1) secretion and plasma dipeptidyl peptidase IV (DPP-IV) activity in morbidly obese patients undergoing biliopancreatic diversion. Hormone and Metabolism Research 36, 111-115. Mackelvie, K.J., Meneilly, G.S., Elahi, D., Wong, A.C.K., Barr, S.I., and Chanoine, J.-P. (2007). Regulation of appetite in lean and obese adolescents after exercise: Role of acylated and desacyl ghrelin. J Clin Endocrinol Metab 92, 648-654. Martin, C.K., Correa, J.B., Han, H., Allen, H.R., Rood, J.C., Champagne, C.M., Gunturk, B.K., and Bray, G.A. (2012). Validity of the remote food photography method (RFPM) for estimating energy and nutrient intake in near real-time. Obesity 20, 891-899. Martins, C., Morgan, L.M., Bloom, S.R., and Robertson, M.D. (2007). Effects of exercise on gut peptides, energy intake and appetite. J Endocrinol 193, 251-258. Montenegro, R.A., Okano, A.H., Cunha, F.A., Gurgel, J.L., Fontes, E.B., and Farinatti, P.T.V. (2012). Prefrontal cortex transcranial direct current stimulation associated with aerobic exercise change aspects of appetite sensation in overweight adults. Appetite 58, 333-338. Muhlheim, L.S., Allison, D.B., Heshka, S., and Heymsfield, S.B. (1998). Do unsuccessful dieters intentionally underreport food intake? International Journal of Eating Disorders 24, 259-266. Pettigrew, S., Rosenberg, M., and Ferguson, R. (2013). Consumers' (in)ability to estimate the energy content of unhealthy foods. Nutrition & Dietetics, n/a-n/a. Ranganath, L.R., Beety, J.M., Morgan, L.M., Wright, J.W., Howland, R., and Marks, V. (1996). Attenuated GLP-1 secretion in the obese: cause or consequence? Gut 38, 916-919. Riley, W.T., Beasley, J., Sowell, A., and Behar, A. (2007). Effects of a web-based food portion training program on food portion estimation. Journal of Nutrition Education and Behavior 39, 70-76. Rowell, L.B., Blackmon, J.R., and Bruce, R.A. (1964). Indocyanine green clearance and estimated hepatic blood flow during mild to maximal exercise in upright man. The Journal of clinical investigation 43, 1677-1690. Rowell, L.B., Detry, J.R., Profant, G.R., and Wyss, C. (1971). Splanchnic vasoconstriction in hyperthermic man--role of falling blood pressure. Journal of Applied Physiology 31, 864-869. Shiiya, T., Ueno, H., Toshinai, K., Kawagoe, T., Naito, S., Tobina, T., Nishida, Y., Shindo, M., Kangawa, K., Tanaka, H., et al. (2011). Significant lowering of plasma ghrelin but not des-acyl ghrelin in response to acute exercise in men. Endocrine journal 58, 335-342. Shorten, A.L., Wallman, K.E., and Guelfi, K.J. (2009). Acute effect of environmental temperature during exercise on subsequent energy intake in active men. The American Journal of Clinical Nutrition 90, 1215-1221. Siep, N., Roefs, A., Roebroeck, A., Havermans, R., Bonte, M.L., and Jansen, A. (2009). Hunger is the best spice: An fMRI study of the effects of attention, hunger and calorie content on food reward processing in the amygdala and orbitofrontal cortex. Behavioural Brain Research 198, 149-158.
270
Simmons, W.K., Martin, A., and Barsalou, L.W. (2005). Pictures of appetizing foods activate gustatory cortices for taste and reward. Cerebral Cortex 15, 1602-1608. Skender, M.L., Goodrick, G.K., Del Junco, D.J., Reeves, R.S., Darnell, L., Gotto Jr, A.M., and Foreyt, J.P. (1996). Comparison of 2-year weight loss trends in behavioral treatments of obesity: diet, exercise, and combination interventions. Journal of the American Dietetic Association 96, 342-346. Small, L., Sidora-Arcoleo, K., Vaughan, L., Creed-Capsel, J., Chung, K.-Y., and Stevens, C. (2009). Validity and reliability of photographic diet diaries for assessing dietary intake among young children. ICAN: Infant, Child, & Adolescent Nutrition 1, 27-36. Subar, A.F., Crafts, J., Zimmerman, T.P., Wilson, M., Mittl, B., Islam, N.G., McNutt, S., Potischman, N., Buday, R., Hull, S.G., et al. (2010). Assessment of the accuracy of portion size reports using computer-based food photographs aids in the development of an automated self-administered 24-hour recall. Journal of the American Dietetic Association 110, 55-64. Swinburn, B., Egger, G., and Raza, F. (1999). Dissecting obesogenic environments: The development and application of a framework for identifying and prioritizing environmental interventions for obesity. Preventive Medicine 29, 563-570. Tipton, K.D., Elliott, T.A., Cree, M.G., Aarsland, A.A., Sanford, A.P., and Wolfe, R.R. (2007). Stimulation of net muscle protein synthesis by whey protein ingestion before and after exercise. American Journal of Physiology - Endocrinology And Metabolism 292, E71-E76. Tipton, K.D., and Wolfe, R.R. (2004). Protein and amino acids for athletes. Journal of Sports Sciences 22, 65-79. Tu, K.-S., and Barchard, K. (1993). An assessment of diabetes self-care barriers in older adults. Journal of Community Health Nursing 10, 113-118. Turconi, G., Guarcello, M., Berzolari, F.G., Carolei, A., Bazzano, R., and Roggi, C. (2005). An evaluation of a colour food photography atlas as a tool for quantifying food portion size in epidemiological dietary surveys. Eur J Clin Nutr 59, 923-931. Turner-McGrievy, G., and Tate, D. (2011). Tweets, Apps, and Pods: Results of the 6-month Mobile Pounds Off Digitally (Mobile POD) randomized weight-loss intervention among adults. Journal of medical Internet research 13, e120. Turner-McGrievy, G.M., Beets, M.W., Moore, J.B., Kaczynski, A.T., Barr-Anderson, D.J., and Tate, D.F. (2013). Comparison of traditional versus mobile app self-monitoring of physical activity and dietary intake among overweight adults participating in an mHealth weight loss program. Journal of the American Medical Informatics Association 20, 513-518. Ueda, S.-y., Yoshikawa, T., Katsura, Y., Usui, T., and Fujimoto, S. (2009a). Comparable effects of moderate intensity exercise on changes in anorectic gut hormone levels and energy intake to high intensity exercise. Journal of Endocrinology 203, 357-364. Ueda, S.-y., Yoshikawa, T., Katsura, Y., Usui, T., Nakao, H., and Fujimoto, S. (2009b). Changes in gut hormone levels and negative energy balance during aerobic exercise in obese young males. J Endocrinol, JOE-08-0500.
271
van Strien, T., Frijters, J.E.R., Bergers, G.P.A., and Defares, P.B. (1986). The Dutch Eating Behavior Questionnaire (DEBQ) for assessment of restrained, emotional, and external eating behavior. International Journal of Eating Disorders 5, 295-315. Venter, C.S., MacIntyre, U.E., and Vorster, H.H. (2000). The development and testing of a food portion photograph book for use in an African population. Journal of Human Nutrition and Dietetics 13, 205-218. Verdich, C., Toubro, S., Buemann, B., Madsen, L.J., Holst, J.J., and Astrup, A. (2001). The role of postprandial release of insulin and incretin hormones in meal-induced satiety: effect of obesity and weight reduction. International Journal of Obesity and Related Metabolic Disorders: Journal of the International Association for the Study of Obesity 25, 1206-1214. Wasse, L.K., Sunderland, C., King, J.A., Miyashita, M., and Stensel, D.J. (2012). The influence of vigorous running and cycling exercise on hunger perceptions and plasma acylated ghrelin concentrations in lean young men. Applied Physiology, Nutrition, and Metabolism 38, 1-6. Weiss, E.C., Galuska, D.A., Khan, L.K., and Serdula, M.K. (2006). Weight-control practices among u.s. adults, 2001–2002. American Journal of Preventive Medicine 31, 18-24. Westerterp-Plantenga, M.S., Verwegen, C.R., Ijedema, M.J., Wijckmans, N.E., and Saris, W.H. (1997). Acute effects of exercise or sauna on appetite in obese and nonobese men. Physiology & Behavior 62, 1345-1354. Westerterp, K.R., Saris, W.H., van Es, M., and ten Hoor, F. (1986). Use of the doubly labeled water technique in humans during heavy sustained exercise. Journal of Applied Physiology 61, 2162-2167. White, L.J., Dressendorfer, R.H., Holland, E., McCoy, S.C., and Ferguson, M.A. (2005). Increased caloric intake soon after exercise in cold water. International Journal of Sports Nutrition and Exercise Metabolism 15, 38-47.
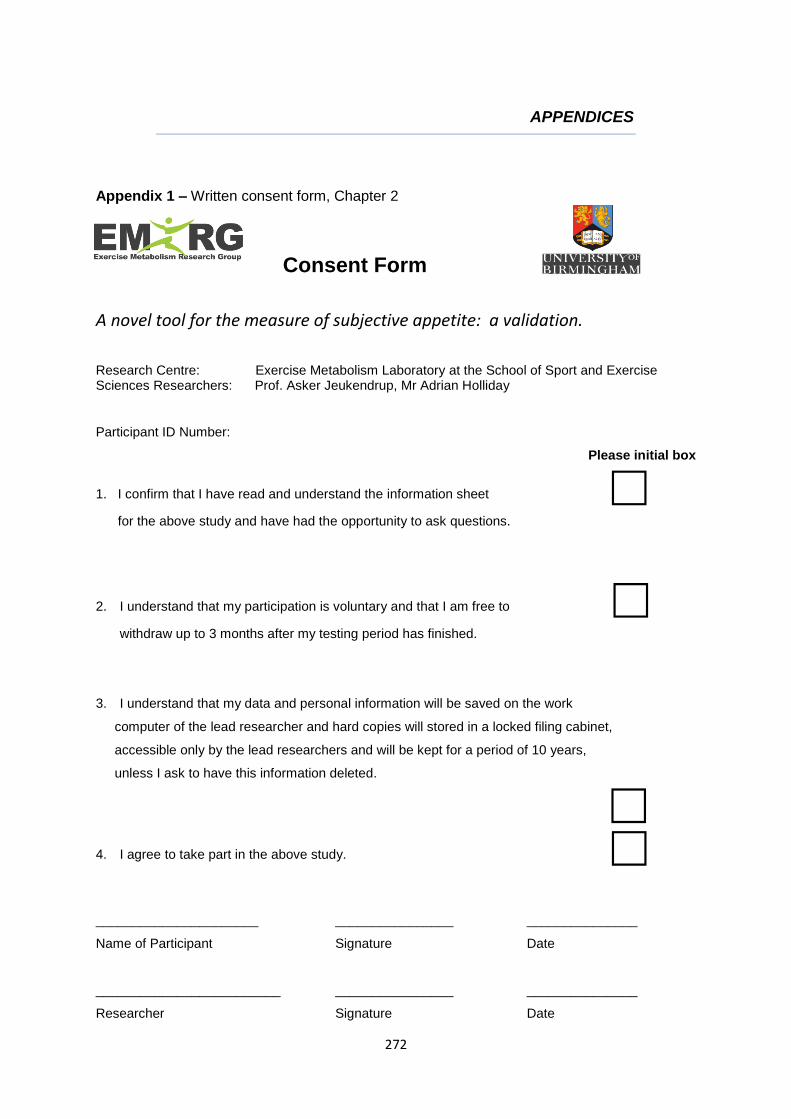
272
APPENDICES
Appendix 1 – Written consent form, Chapter 2
Consent Form
A novel tool for the measure of subjective appetite: a validation.
Research Centre: Exercise Metabolism Laboratory at the School of Sport and Exercise Sciences Researchers: Prof. Asker Jeukendrup, Mr Adrian Holliday
Participant ID Number:
Please initial box
1. I confirm that I have read and understand the information sheet
for the above study and have had the opportunity to ask questions.
2. I understand that my participation is voluntary and that I am free to
withdraw up to 3 months after my testing period has finished.
3. I understand that my data and personal information will be saved on the work
computer of the lead researcher and hard copies will stored in a locked filing cabinet,
accessible only by the lead researchers and will be kept for a period of 10 years,
unless I ask to have this information deleted.
4. I agree to take part in the above study.
______________________ ________________ _______________
Name of Participant Signature Date
_________________________ ________________ _______________
Researcher Signature Date
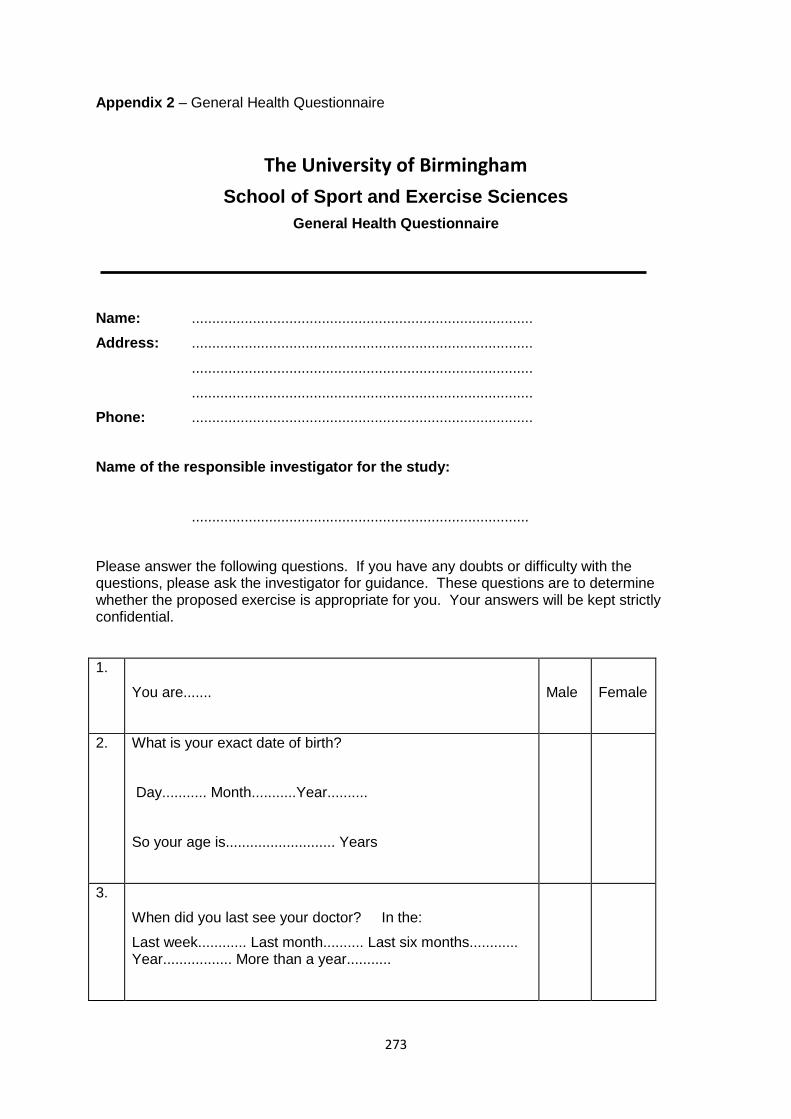
273
Appendix 2 – General Health Questionnaire
The University of Birmingham
School of Sport and Exercise Sciences
General Health Questionnaire
Name: ....................................................................................
Address: ....................................................................................
....................................................................................
....................................................................................
Phone: ....................................................................................
Name of the responsible investigator for the study:
...................................................................................
Please answer the following questions. If you have any doubts or difficulty with the questions, please ask the investigator for guidance. These questions are to determine whether the proposed exercise is appropriate for you. Your answers will be kept strictly confidential.
1.
You are.......
Male
Female
2. What is your exact date of birth?
Day........... Month...........Year..........
So your age is........................... Years
3.
When did you last see your doctor? In the:
Last week............ Last month.......... Last six months............ Year................. More than a year...........
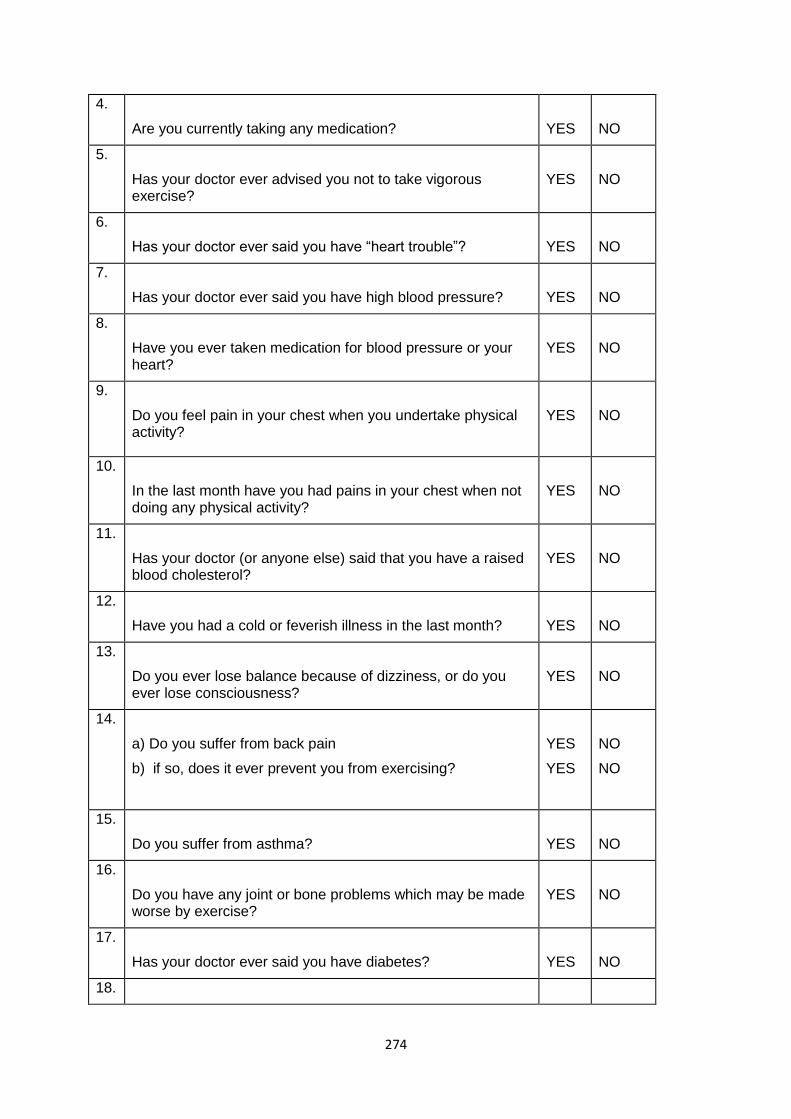
274
4.
Are you currently taking any medication?
YES
NO
5.
Has your doctor ever advised you not to take vigorous exercise?
YES
NO
6.
Has your doctor ever said you have “heart trouble”?
YES
NO
7.
Has your doctor ever said you have high blood pressure?
YES
NO
8.
Have you ever taken medication for blood pressure or your heart?
YES
NO
9.
Do you feel pain in your chest when you undertake physical activity?
YES
NO
10.
In the last month have you had pains in your chest when not doing any physical activity?
YES
NO
11.
Has your doctor (or anyone else) said that you have a raised blood cholesterol?
YES
NO
12.
Have you had a cold or feverish illness in the last month?
YES
NO
13.
Do you ever lose balance because of dizziness, or do you ever lose consciousness?
YES
NO
14.
a) Do you suffer from back pain
b) if so, does it ever prevent you from exercising?
YES
YES
NO
NO
15.
Do you suffer from asthma?
YES
NO
16.
Do you have any joint or bone problems which may be made worse by exercise?
YES
NO
17.
Has your doctor ever said you have diabetes?
YES
NO
18.
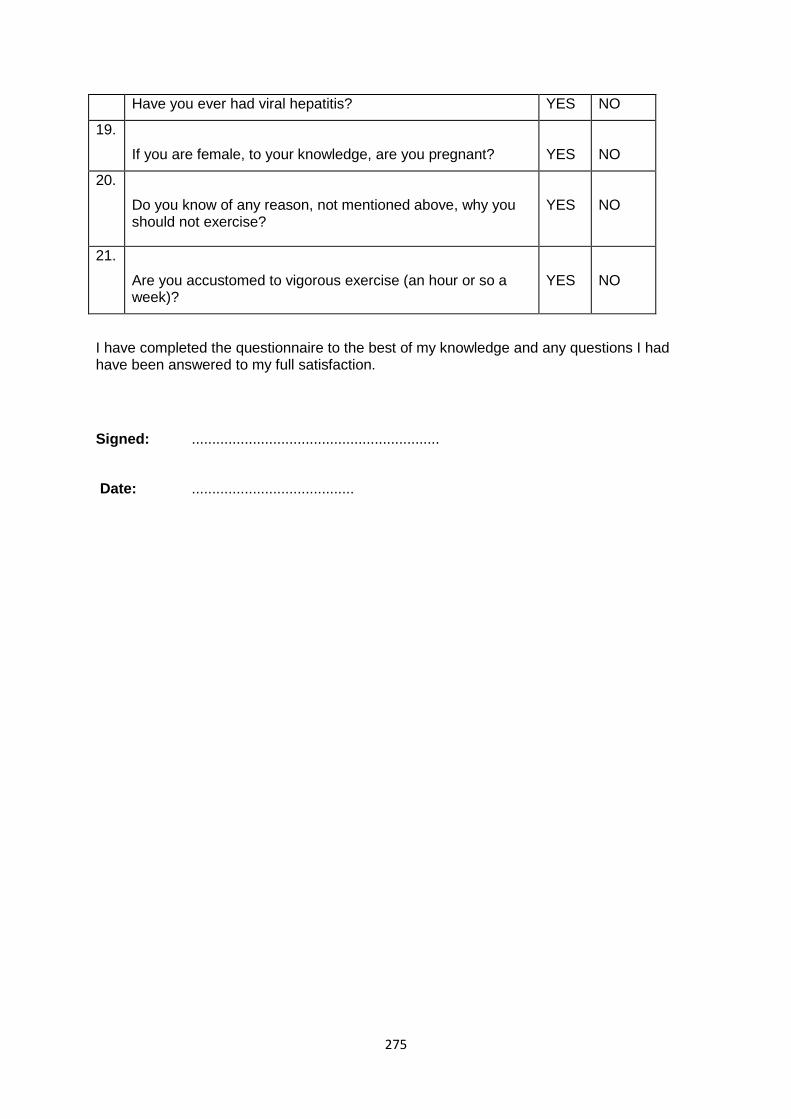
275
Have you ever had viral hepatitis? YES NO
19.
If you are female, to your knowledge, are you pregnant?
YES
NO
20.
Do you know of any reason, not mentioned above, why you should not exercise?
YES
NO
21.
Are you accustomed to vigorous exercise (an hour or so a week)?
YES
NO
I have completed the questionnaire to the best of my knowledge and any questions I had have been answered to my full satisfaction.
Signed: .............................................................
Date: ........................................
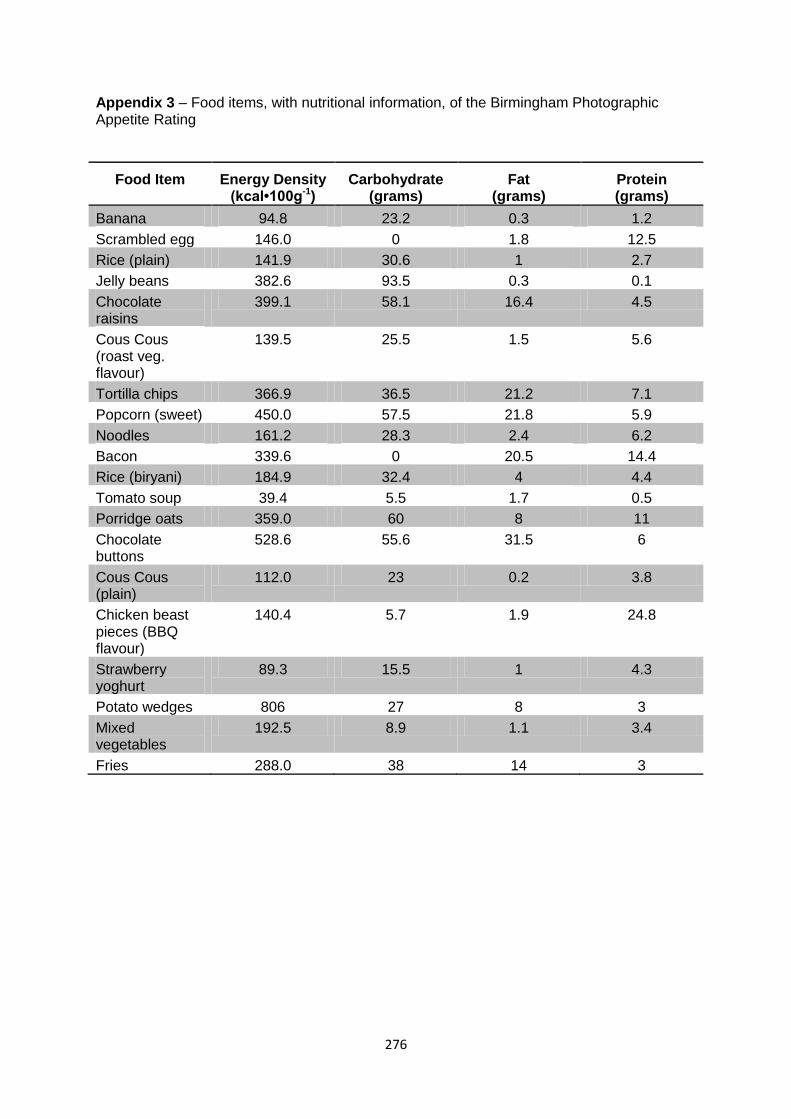
276
Appendix 3 – Food items, with nutritional information, of the Birmingham Photographic Appetite Rating
Food Item Energy Density (kcal•100g-1)
Carbohydrate (grams)
Fat (grams)
Protein (grams)
Banana 94.8 23.2 0.3 1.2
Scrambled egg 146.0 0 1.8 12.5
Rice (plain) 141.9 30.6 1 2.7
Jelly beans 382.6 93.5 0.3 0.1
Chocolate raisins
399.1 58.1 16.4 4.5
Cous Cous (roast veg. flavour)
139.5 25.5 1.5 5.6
Tortilla chips 366.9 36.5 21.2 7.1
Popcorn (sweet) 450.0 57.5 21.8 5.9
Noodles 161.2 28.3 2.4 6.2
Bacon 339.6 0 20.5 14.4
Rice (biryani) 184.9 32.4 4 4.4
Tomato soup 39.4 5.5 1.7 0.5
Porridge oats 359.0 60 8 11
Chocolate buttons
528.6 55.6 31.5 6
Cous Cous (plain)
112.0 23 0.2 3.8
Chicken beast pieces (BBQ flavour)
140.4 5.7 1.9 24.8
Strawberry yoghurt
89.3 15.5 1 4.3
Potato wedges 806 27 8 3
Mixed vegetables
192.5 8.9 1.1 3.4
Fries 288.0 38 14 3
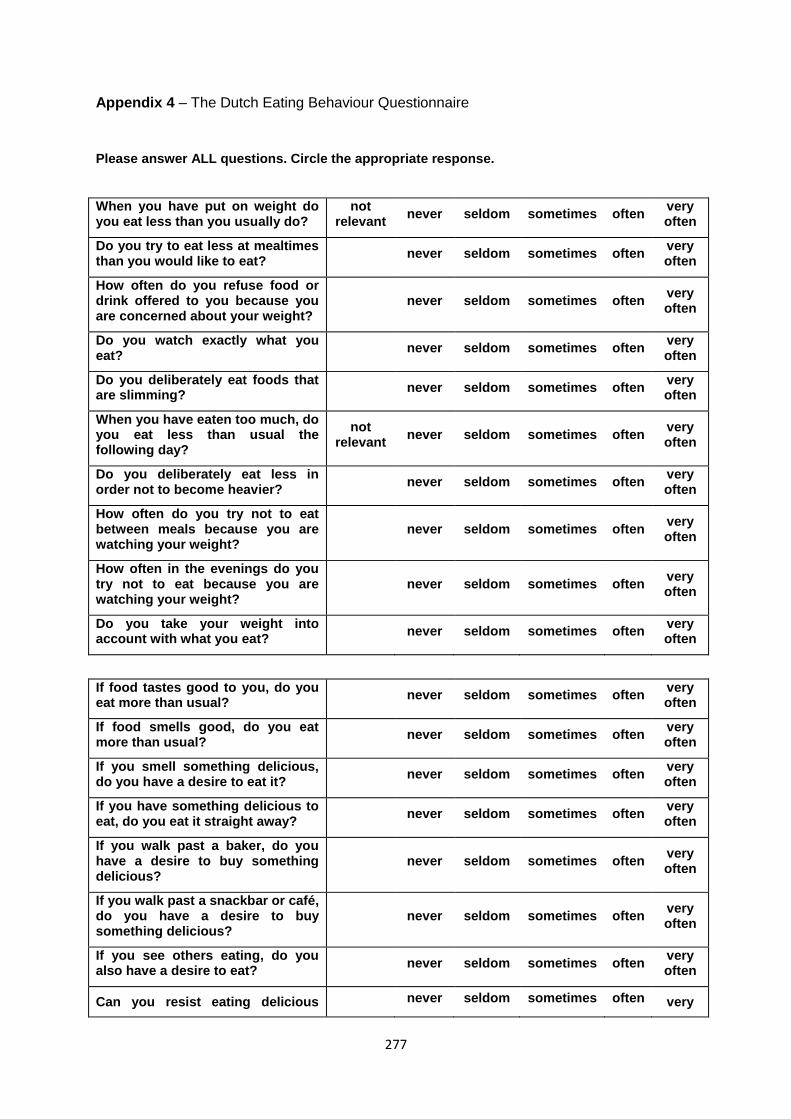
277
Appendix 4 – The Dutch Eating Behaviour Questionnaire
Please answer ALL questions. Circle the appropriate response.
When you have put on weight do you eat less than you usually do?
not relevant
never seldom sometimes often very often
Do you try to eat less at mealtimes than you would like to eat?
never seldom sometimes often very often
How often do you refuse food or drink offered to you because you are concerned about your weight?
never seldom sometimes often very often
Do you watch exactly what you eat?
never seldom sometimes often very often
Do you deliberately eat foods that are slimming?
never seldom sometimes often very often
When you have eaten too much, do you eat less than usual the following day?
not relevant
never seldom sometimes often very often
Do you deliberately eat less in order not to become heavier?
never seldom sometimes often very often
How often do you try not to eat between meals because you are watching your weight?
never seldom sometimes often very often
How often in the evenings do you try not to eat because you are watching your weight?
never seldom sometimes often very often
Do you take your weight into account with what you eat?
never seldom sometimes often very often
If food tastes good to you, do you eat more than usual?
never seldom sometimes often very often
If food smells good, do you eat more than usual?
never seldom sometimes often very often
If you smell something delicious, do you have a desire to eat it?
never seldom sometimes often very often
If you have something delicious to eat, do you eat it straight away?
never seldom sometimes often very often
If you walk past a baker, do you have a desire to buy something delicious?
never seldom sometimes often very often
If you walk past a snackbar or café, do you have a desire to buy something delicious?
never seldom sometimes often very often
If you see others eating, do you also have a desire to eat?
never seldom sometimes often very often
Can you resist eating delicious never seldom sometimes often very
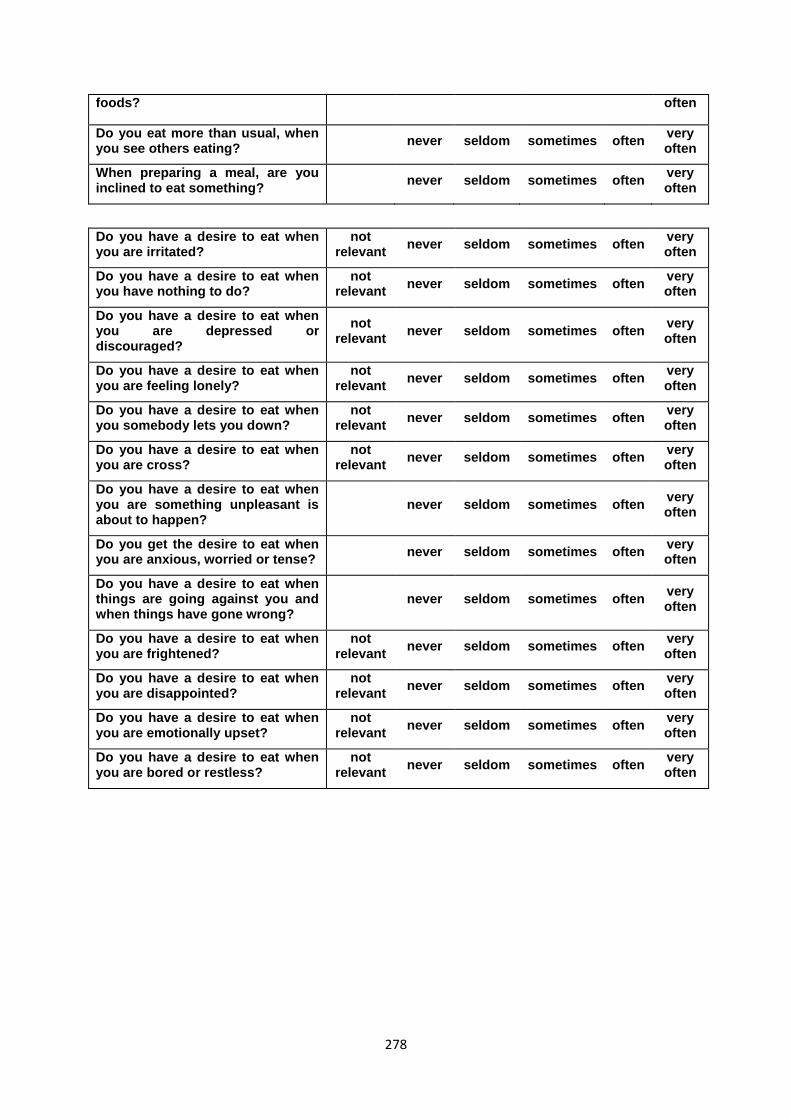
278
foods? often
Do you eat more than usual, when you see others eating?
never seldom sometimes often very often
When preparing a meal, are you inclined to eat something?
never seldom sometimes often very often
Do you have a desire to eat when you are irritated?
not relevant
never seldom sometimes often very often
Do you have a desire to eat when you have nothing to do?
not relevant
never seldom sometimes often very often
Do you have a desire to eat when you are depressed or discouraged?
not relevant
never seldom sometimes often very often
Do you have a desire to eat when you are feeling lonely?
not relevant
never seldom sometimes often very often
Do you have a desire to eat when you somebody lets you down?
not relevant
never seldom sometimes often very often
Do you have a desire to eat when you are cross?
not relevant
never seldom sometimes often very often
Do you have a desire to eat when you are something unpleasant is about to happen?
never seldom sometimes often very often
Do you get the desire to eat when you are anxious, worried or tense?
never seldom sometimes often very often
Do you have a desire to eat when things are going against you and when things have gone wrong?
never seldom sometimes often very often
Do you have a desire to eat when you are frightened?
not relevant
never seldom sometimes often very often
Do you have a desire to eat when you are disappointed?
not relevant
never seldom sometimes often very often
Do you have a desire to eat when you are emotionally upset?
not relevant
never seldom sometimes often very often
Do you have a desire to eat when you are bored or restless?
not relevant
never seldom sometimes often very often
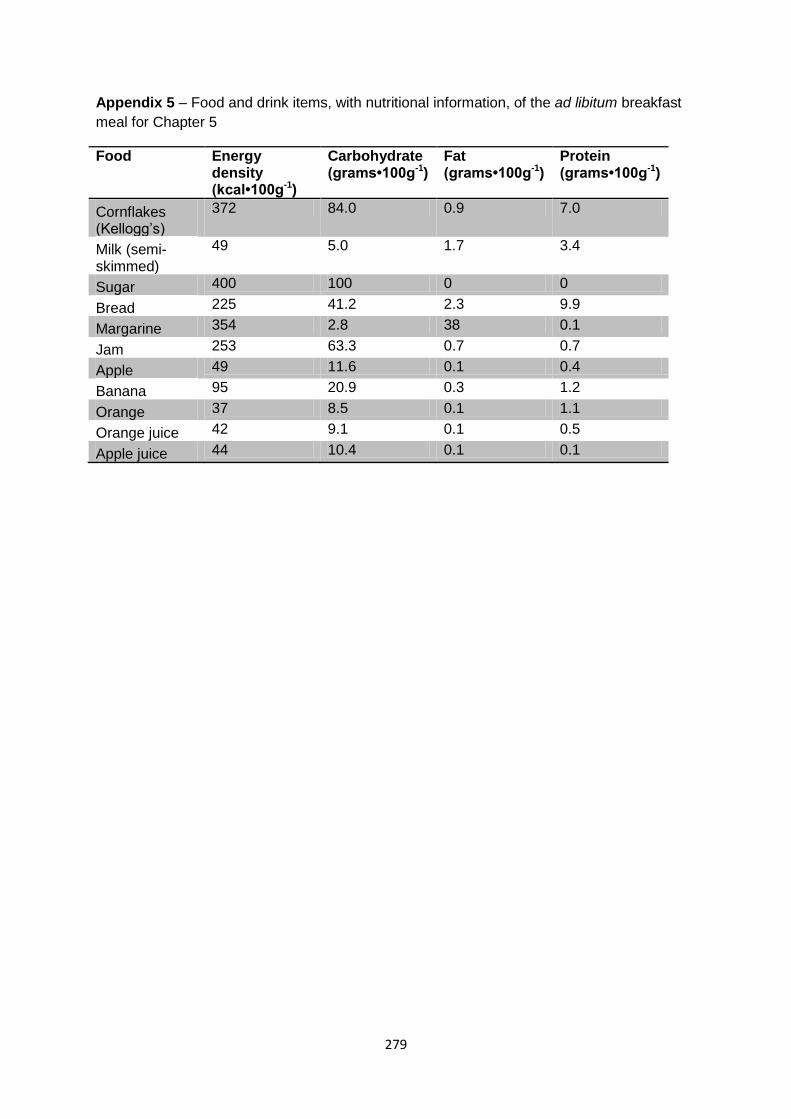
279
Appendix 5 – Food and drink items, with nutritional information, of the ad libitum breakfast
meal for Chapter 5
Food Energy density (kcal•100g-1)
Carbohydrate (grams•100g-1)
Fat (grams•100g-1)
Protein (grams•100g-1)
Cornflakes (Kellogg’s)
372 84.0 0.9 7.0
Milk (semi-skimmed)
49 5.0 1.7 3.4
Sugar 400 100 0 0
Bread 225 41.2 2.3 9.9
Margarine 354 2.8 38 0.1
Jam 253 63.3 0.7 0.7
Apple 49 11.6 0.1 0.4
Banana 95 20.9 0.3 1.2
Orange 37 8.5 0.1 1.1
Orange juice 42 9.1 0.1 0.5
Apple juice 44 10.4 0.1 0.1
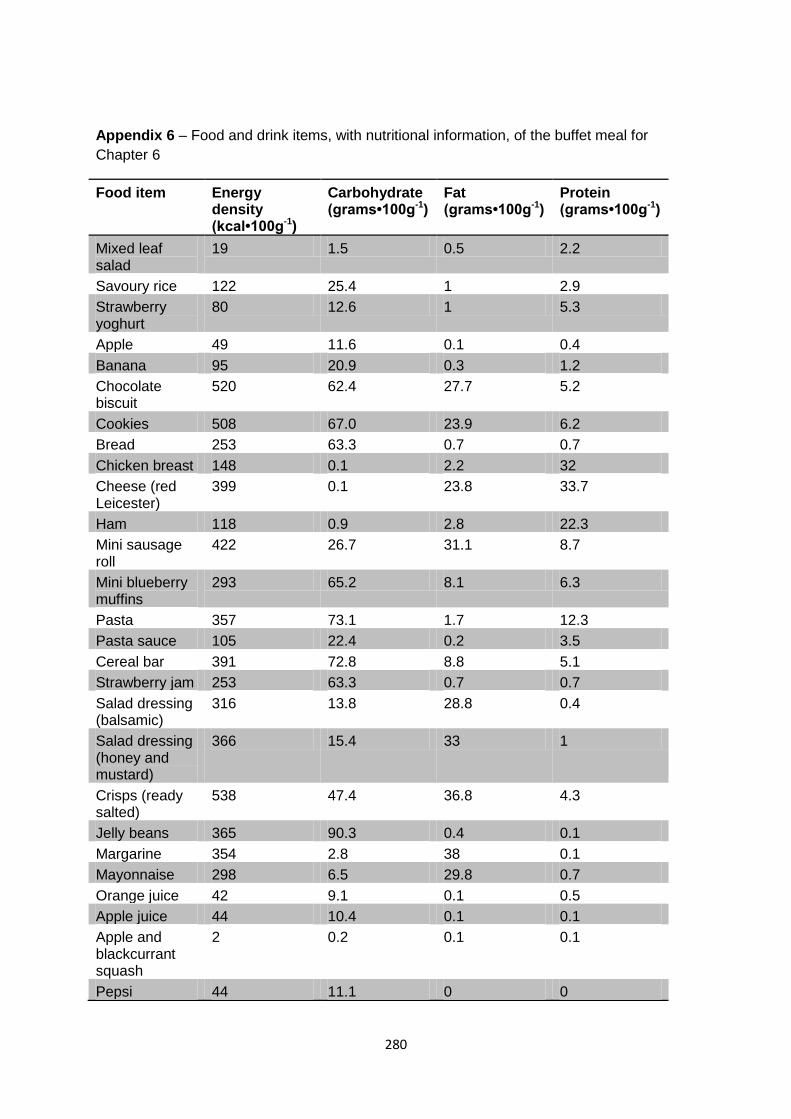
280
Appendix 6 – Food and drink items, with nutritional information, of the buffet meal for
Chapter 6
Food item Energy density (kcal•100g-1)
Carbohydrate (grams•100g-1)
Fat (grams•100g-1)
Protein (grams•100g-1)
Mixed leaf salad
19 1.5 0.5 2.2
Savoury rice 122 25.4 1 2.9
Strawberry yoghurt
80 12.6 1 5.3
Apple 49 11.6 0.1 0.4
Banana 95 20.9 0.3 1.2
Chocolate biscuit
520 62.4 27.7 5.2
Cookies 508 67.0 23.9 6.2
Bread 253 63.3 0.7 0.7
Chicken breast 148 0.1 2.2 32
Cheese (red Leicester)
399 0.1 23.8 33.7
Ham 118 0.9 2.8 22.3
Mini sausage roll
422 26.7 31.1 8.7
Mini blueberry muffins
293 65.2 8.1 6.3
Pasta 357 73.1 1.7 12.3
Pasta sauce 105 22.4 0.2 3.5
Cereal bar 391 72.8 8.8 5.1
Strawberry jam 253 63.3 0.7 0.7
Salad dressing (balsamic)
316 13.8 28.8 0.4
Salad dressing (honey and mustard)
366 15.4 33 1
Crisps (ready salted)
538 47.4 36.8 4.3
Jelly beans 365 90.3 0.4 0.1
Margarine 354 2.8 38 0.1
Mayonnaise 298 6.5 29.8 0.7
Orange juice 42 9.1 0.1 0.5
Apple juice 44 10.4 0.1 0.1
Apple and blackcurrant squash
2 0.2 0.1 0.1
Pepsi 44 11.1 0 0
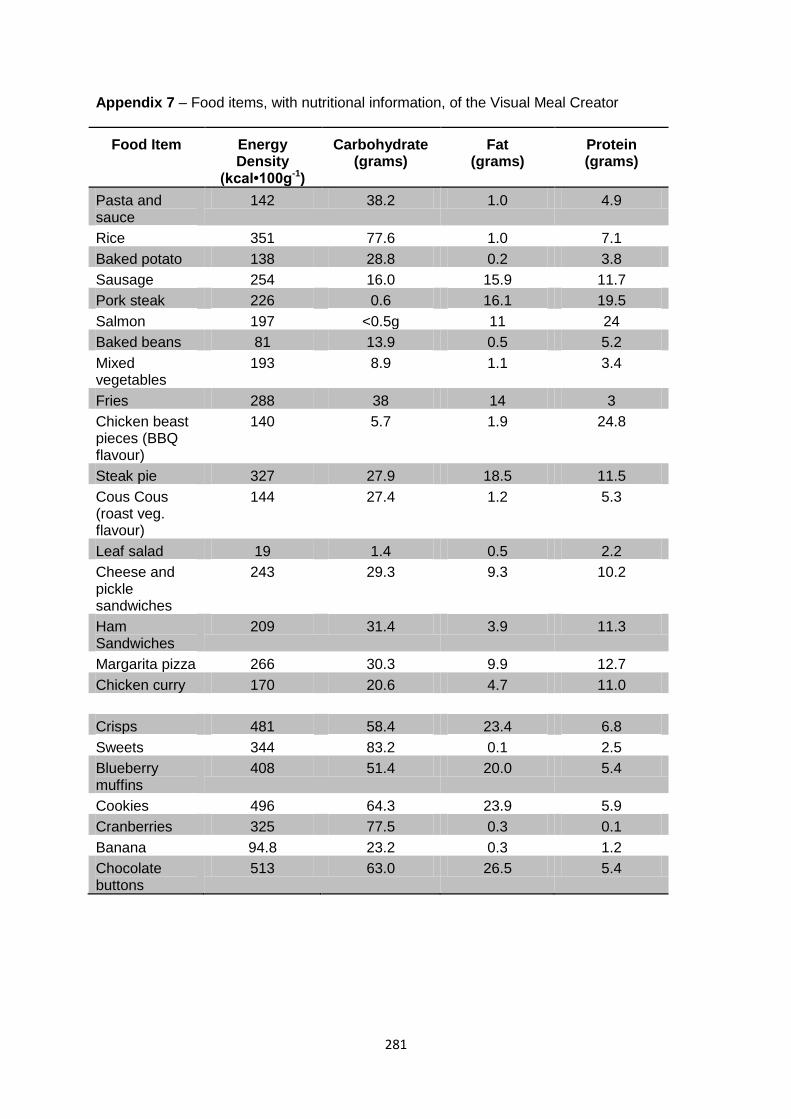
281
Appendix 7 – Food items, with nutritional information, of the Visual Meal Creator
Food Item Energy Density
(kcal•100g-1)
Carbohydrate (grams)
Fat (grams)
Protein (grams)
Pasta and sauce
142 38.2 1.0 4.9
Rice 351 77.6 1.0 7.1
Baked potato 138 28.8 0.2 3.8
Sausage 254 16.0 15.9 11.7
Pork steak 226 0.6 16.1 19.5
Salmon 197 <0.5g 11 24
Baked beans 81 13.9 0.5 5.2
Mixed vegetables
193 8.9 1.1 3.4
Fries 288 38 14 3
Chicken beast pieces (BBQ flavour)
140 5.7 1.9 24.8
Steak pie 327 27.9 18.5 11.5
Cous Cous (roast veg. flavour)
144 27.4 1.2 5.3
Leaf salad 19 1.4 0.5 2.2
Cheese and pickle sandwiches
243 29.3 9.3 10.2
Ham Sandwiches
209 31.4 3.9 11.3
Margarita pizza 266 30.3 9.9 12.7
Chicken curry 170 20.6 4.7 11.0
Crisps 481 58.4 23.4 6.8
Sweets 344 83.2 0.1 2.5
Blueberry muffins
408 51.4 20.0 5.4
Cookies 496 64.3 23.9 5.9
Cranberries 325 77.5 0.3 0.1
Banana 94.8 23.2 0.3 1.2
Chocolate buttons
513 63.0 26.5 5.4
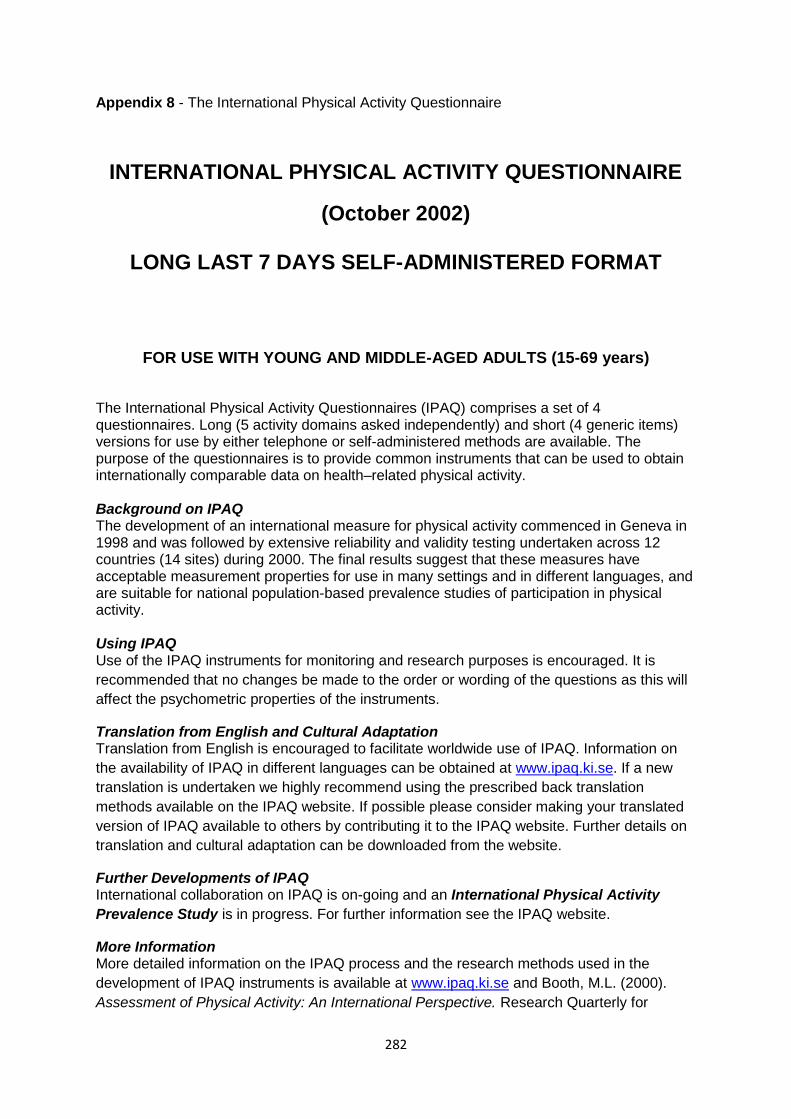
282
Appendix 8 - The International Physical Activity Questionnaire
INTERNATIONAL PHYSICAL ACTIVITY QUESTIONNAIRE
(October 2002)
LONG LAST 7 DAYS SELF-ADMINISTERED FORMAT
FOR USE WITH YOUNG AND MIDDLE-AGED ADULTS (15-69 years)
The International Physical Activity Questionnaires (IPAQ) comprises a set of 4 questionnaires. Long (5 activity domains asked independently) and short (4 generic items) versions for use by either telephone or self-administered methods are available. The purpose of the questionnaires is to provide common instruments that can be used to obtain internationally comparable data on health–related physical activity. Background on IPAQ The development of an international measure for physical activity commenced in Geneva in 1998 and was followed by extensive reliability and validity testing undertaken across 12 countries (14 sites) during 2000. The final results suggest that these measures have acceptable measurement properties for use in many settings and in different languages, and are suitable for national population-based prevalence studies of participation in physical activity. Using IPAQ Use of the IPAQ instruments for monitoring and research purposes is encouraged. It is
recommended that no changes be made to the order or wording of the questions as this will
affect the psychometric properties of the instruments.
Translation from English and Cultural Adaptation Translation from English is encouraged to facilitate worldwide use of IPAQ. Information on
the availability of IPAQ in different languages can be obtained at www.ipaq.ki.se. If a new
translation is undertaken we highly recommend using the prescribed back translation
methods available on the IPAQ website. If possible please consider making your translated
version of IPAQ available to others by contributing it to the IPAQ website. Further details on
translation and cultural adaptation can be downloaded from the website.
Further Developments of IPAQ International collaboration on IPAQ is on-going and an International Physical Activity
Prevalence Study is in progress. For further information see the IPAQ website.
More Information More detailed information on the IPAQ process and the research methods used in the
development of IPAQ instruments is available at www.ipaq.ki.se and Booth, M.L. (2000).
Assessment of Physical Activity: An International Perspective. Research Quarterly for
283
Exercise and Sport, 71 (2): s114-20. Other scientific publications and presentations on the
use of IPAQ are summarized on the website.
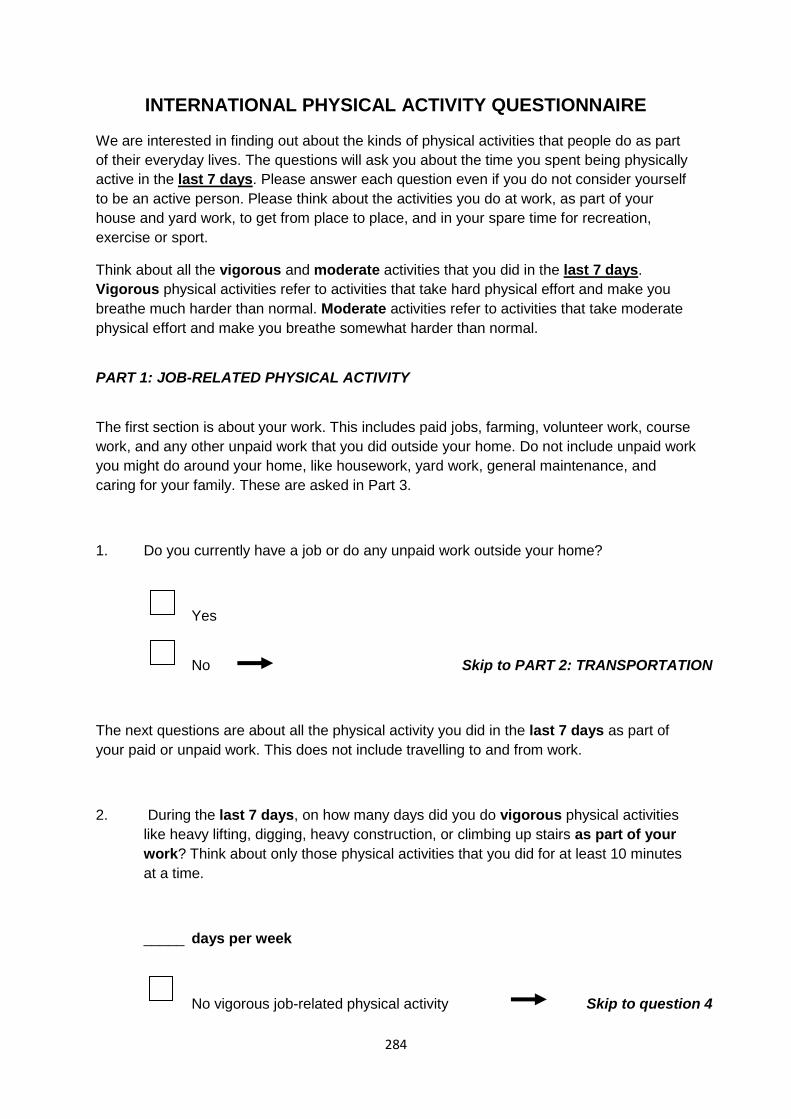
284
INTERNATIONAL PHYSICAL ACTIVITY QUESTIONNAIRE
We are interested in finding out about the kinds of physical activities that people do as part
of their everyday lives. The questions will ask you about the time you spent being physically
active in the last 7 days. Please answer each question even if you do not consider yourself
to be an active person. Please think about the activities you do at work, as part of your
house and yard work, to get from place to place, and in your spare time for recreation,
exercise or sport.
Think about all the vigorous and moderate activities that you did in the last 7 days.
Vigorous physical activities refer to activities that take hard physical effort and make you
breathe much harder than normal. Moderate activities refer to activities that take moderate
physical effort and make you breathe somewhat harder than normal.
PART 1: JOB-RELATED PHYSICAL ACTIVITY
The first section is about your work. This includes paid jobs, farming, volunteer work, course
work, and any other unpaid work that you did outside your home. Do not include unpaid work
you might do around your home, like housework, yard work, general maintenance, and
caring for your family. These are asked in Part 3.
1. Do you currently have a job or do any unpaid work outside your home?
Yes
No Skip to PART 2: TRANSPORTATION
The next questions are about all the physical activity you did in the last 7 days as part of
your paid or unpaid work. This does not include travelling to and from work.
2. During the last 7 days, on how many days did you do vigorous physical activities
like heavy lifting, digging, heavy construction, or climbing up stairs as part of your
work? Think about only those physical activities that you did for at least 10 minutes
at a time.
_____ days per week
No vigorous job-related physical activity Skip to question 4
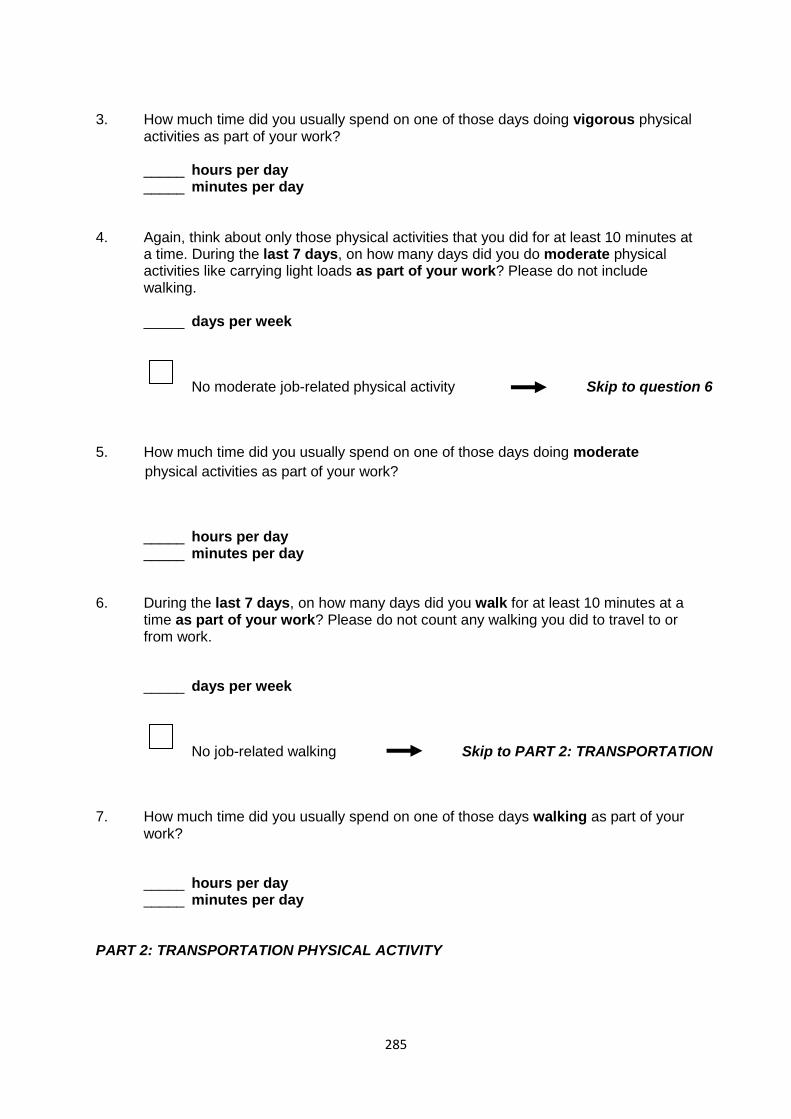
285
3. How much time did you usually spend on one of those days doing vigorous physical
activities as part of your work?
_____ hours per day _____ minutes per day
4. Again, think about only those physical activities that you did for at least 10 minutes at
a time. During the last 7 days, on how many days did you do moderate physical activities like carrying light loads as part of your work? Please do not include walking.
_____ days per week
No moderate job-related physical activity Skip to question 6
5. How much time did you usually spend on one of those days doing moderate
physical activities as part of your work?
_____ hours per day _____ minutes per day
6. During the last 7 days, on how many days did you walk for at least 10 minutes at a time as part of your work? Please do not count any walking you did to travel to or from work.
_____ days per week
No job-related walking Skip to PART 2: TRANSPORTATION
7. How much time did you usually spend on one of those days walking as part of your work?
_____ hours per day _____ minutes per day
PART 2: TRANSPORTATION PHYSICAL ACTIVITY
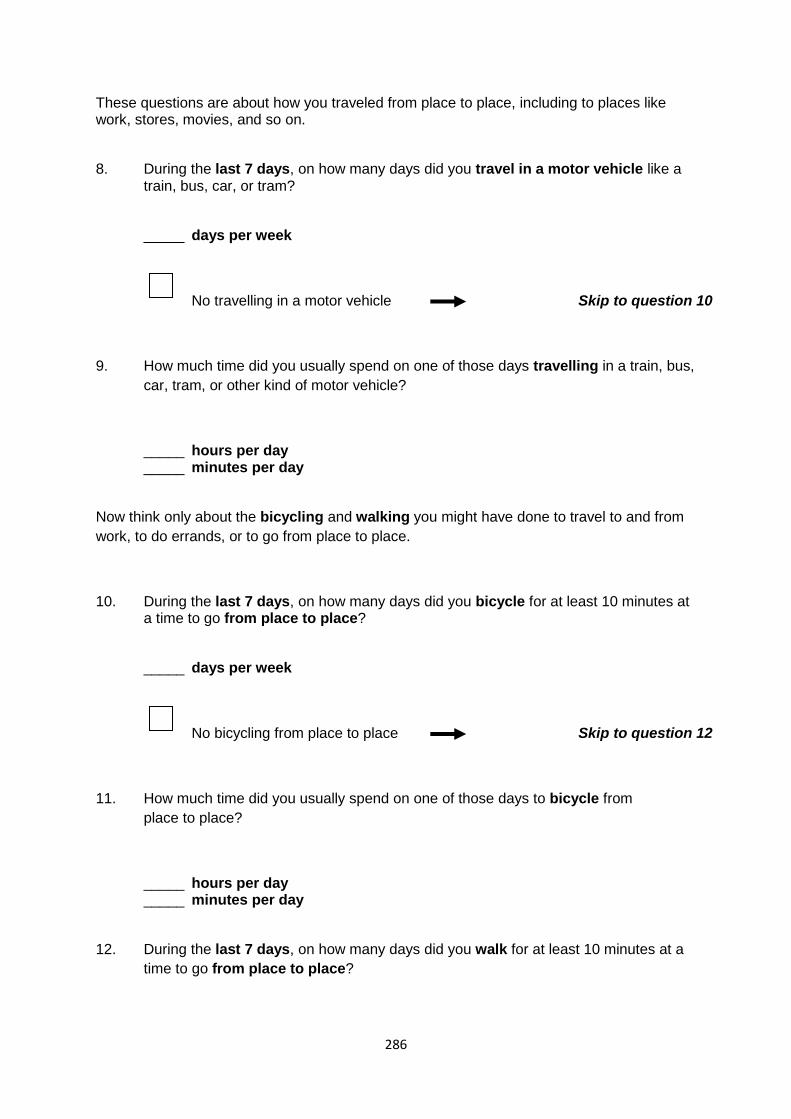
286
These questions are about how you traveled from place to place, including to places like work, stores, movies, and so on.
8. During the last 7 days, on how many days did you travel in a motor vehicle like a train, bus, car, or tram?
_____ days per week
No travelling in a motor vehicle Skip to question 10
9. How much time did you usually spend on one of those days travelling in a train, bus,
car, tram, or other kind of motor vehicle?
_____ hours per day _____ minutes per day
Now think only about the bicycling and walking you might have done to travel to and from
work, to do errands, or to go from place to place.
10. During the last 7 days, on how many days did you bicycle for at least 10 minutes at a time to go from place to place?
_____ days per week
No bicycling from place to place Skip to question 12
11. How much time did you usually spend on one of those days to bicycle from
place to place?
_____ hours per day _____ minutes per day
12. During the last 7 days, on how many days did you walk for at least 10 minutes at a
time to go from place to place?
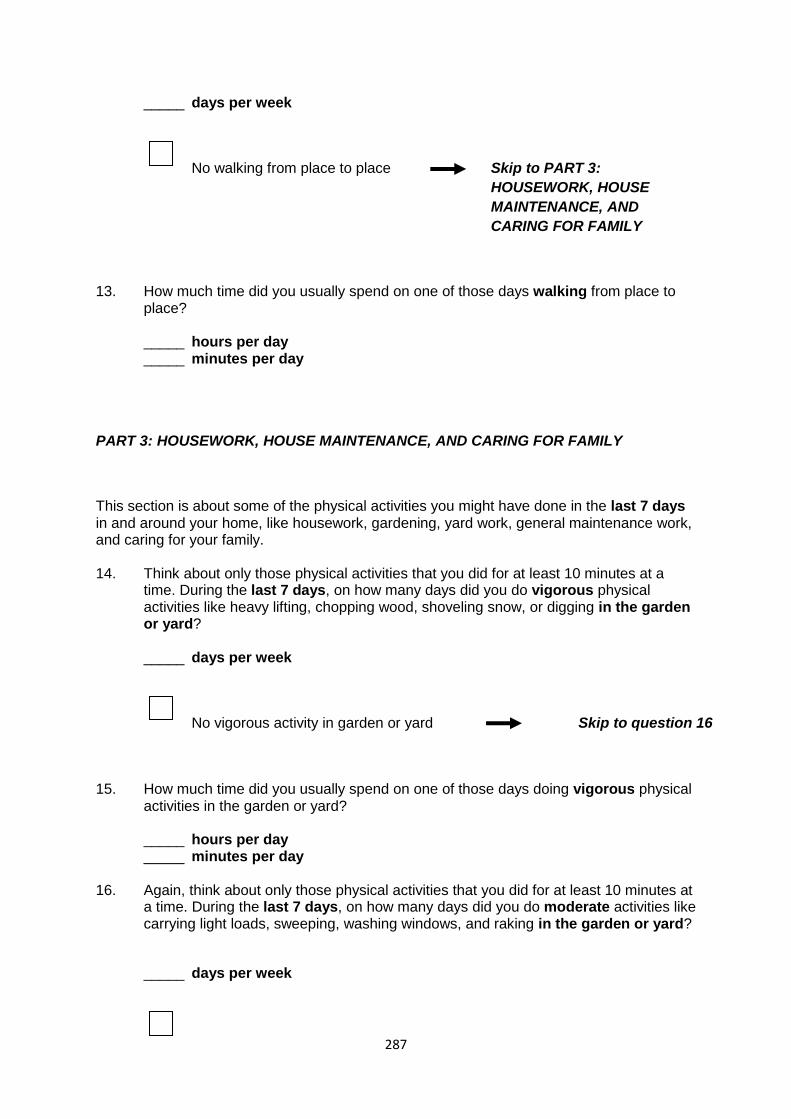
287
_____ days per week
No walking from place to place Skip to PART 3:
HOUSEWORK, HOUSE
MAINTENANCE, AND
CARING FOR FAMILY
13. How much time did you usually spend on one of those days walking from place to place?
_____ hours per day _____ minutes per day
PART 3: HOUSEWORK, HOUSE MAINTENANCE, AND CARING FOR FAMILY
This section is about some of the physical activities you might have done in the last 7 days in and around your home, like housework, gardening, yard work, general maintenance work, and caring for your family. 14. Think about only those physical activities that you did for at least 10 minutes at a
time. During the last 7 days, on how many days did you do vigorous physical activities like heavy lifting, chopping wood, shoveling snow, or digging in the garden or yard?
_____ days per week
No vigorous activity in garden or yard Skip to question 16
15. How much time did you usually spend on one of those days doing vigorous physical
activities in the garden or yard?
_____ hours per day _____ minutes per day
16. Again, think about only those physical activities that you did for at least 10 minutes at
a time. During the last 7 days, on how many days did you do moderate activities like carrying light loads, sweeping, washing windows, and raking in the garden or yard?
_____ days per week
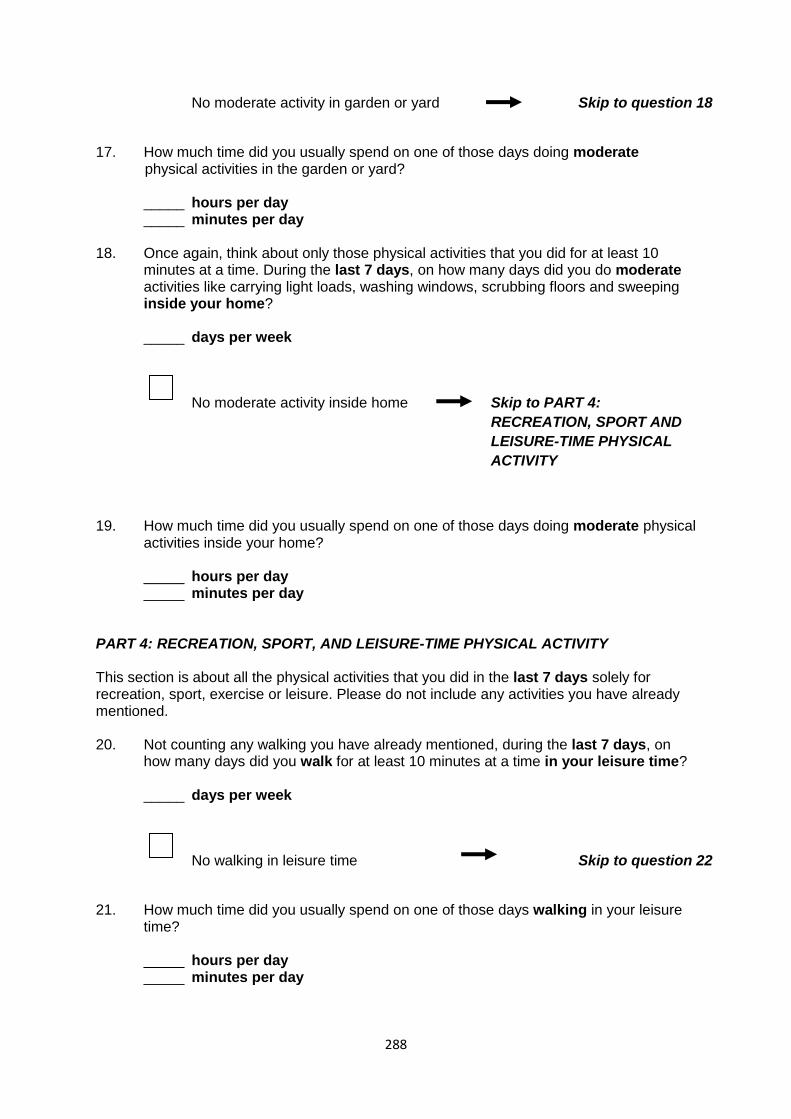
288
No moderate activity in garden or yard Skip to question 18
17. How much time did you usually spend on one of those days doing moderate physical activities in the garden or yard?
_____ hours per day _____ minutes per day
18. Once again, think about only those physical activities that you did for at least 10
minutes at a time. During the last 7 days, on how many days did you do moderate activities like carrying light loads, washing windows, scrubbing floors and sweeping inside your home?
_____ days per week
No moderate activity inside home Skip to PART 4:
RECREATION, SPORT AND
LEISURE-TIME PHYSICAL
ACTIVITY
19. How much time did you usually spend on one of those days doing moderate physical activities inside your home?
_____ hours per day _____ minutes per day
PART 4: RECREATION, SPORT, AND LEISURE-TIME PHYSICAL ACTIVITY This section is about all the physical activities that you did in the last 7 days solely for recreation, sport, exercise or leisure. Please do not include any activities you have already mentioned. 20. Not counting any walking you have already mentioned, during the last 7 days, on
how many days did you walk for at least 10 minutes at a time in your leisure time?
_____ days per week
No walking in leisure time Skip to question 22
21. How much time did you usually spend on one of those days walking in your leisure
time?
_____ hours per day _____ minutes per day
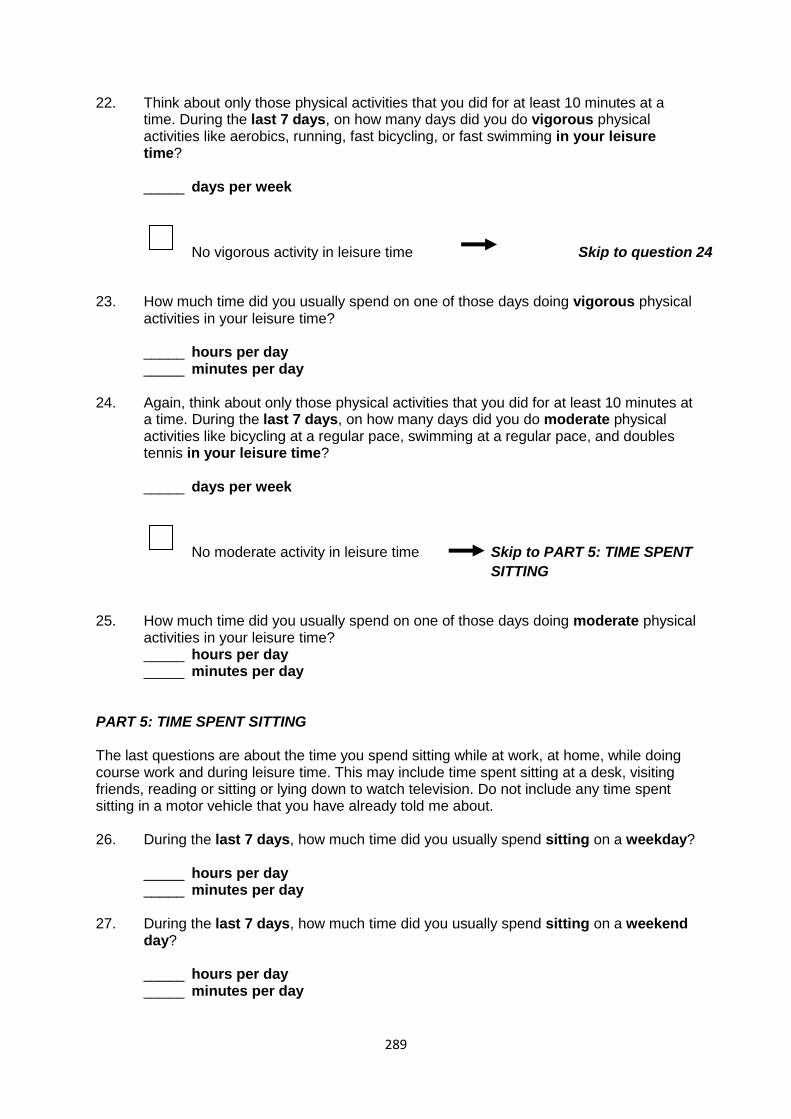
289
22. Think about only those physical activities that you did for at least 10 minutes at a time. During the last 7 days, on how many days did you do vigorous physical activities like aerobics, running, fast bicycling, or fast swimming in your leisure time?
_____ days per week
No vigorous activity in leisure time Skip to question 24
23. How much time did you usually spend on one of those days doing vigorous physical
activities in your leisure time?
_____ hours per day _____ minutes per day
24. Again, think about only those physical activities that you did for at least 10 minutes at
a time. During the last 7 days, on how many days did you do moderate physical activities like bicycling at a regular pace, swimming at a regular pace, and doubles tennis in your leisure time?
_____ days per week
No moderate activity in leisure time Skip to PART 5: TIME SPENT
SITTING
25. How much time did you usually spend on one of those days doing moderate physical
activities in your leisure time? _____ hours per day _____ minutes per day
PART 5: TIME SPENT SITTING The last questions are about the time you spend sitting while at work, at home, while doing course work and during leisure time. This may include time spent sitting at a desk, visiting friends, reading or sitting or lying down to watch television. Do not include any time spent sitting in a motor vehicle that you have already told me about. 26. During the last 7 days, how much time did you usually spend sitting on a weekday?
_____ hours per day _____ minutes per day
27. During the last 7 days, how much time did you usually spend sitting on a weekend
day?
_____ hours per day _____ minutes per day
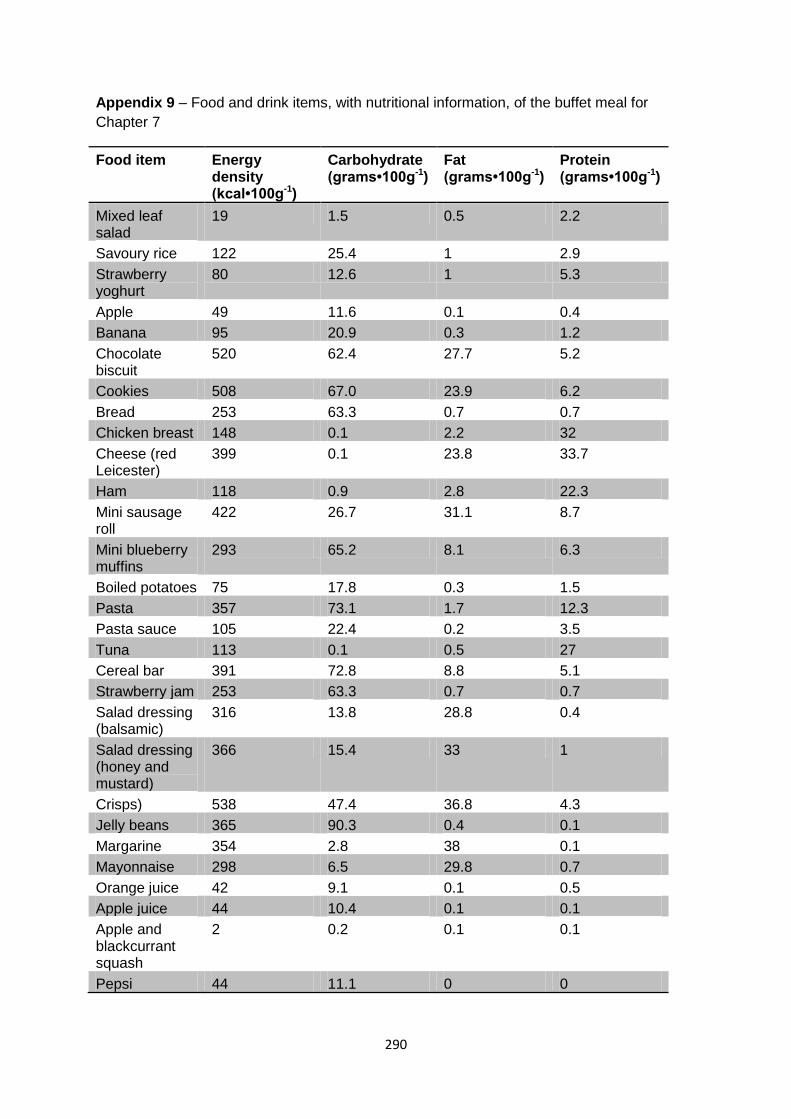
290
Appendix 9 – Food and drink items, with nutritional information, of the buffet meal for
Chapter 7
Food item Energy density (kcal•100g-1)
Carbohydrate (grams•100g-1)
Fat (grams•100g-1)
Protein (grams•100g-1)
Mixed leaf salad
19 1.5 0.5 2.2
Savoury rice 122 25.4 1 2.9
Strawberry yoghurt
80 12.6 1 5.3
Apple 49 11.6 0.1 0.4
Banana 95 20.9 0.3 1.2
Chocolate biscuit
520 62.4 27.7 5.2
Cookies 508 67.0 23.9 6.2
Bread 253 63.3 0.7 0.7
Chicken breast 148 0.1 2.2 32
Cheese (red Leicester)
399 0.1 23.8 33.7
Ham 118 0.9 2.8 22.3
Mini sausage roll
422 26.7 31.1 8.7
Mini blueberry muffins
293 65.2 8.1 6.3
Boiled potatoes 75 17.8 0.3 1.5
Pasta 357 73.1 1.7 12.3
Pasta sauce 105 22.4 0.2 3.5
Tuna 113 0.1 0.5 27
Cereal bar 391 72.8 8.8 5.1
Strawberry jam 253 63.3 0.7 0.7
Salad dressing (balsamic)
316 13.8 28.8 0.4
Salad dressing (honey and mustard)
366 15.4 33 1
Crisps) 538 47.4 36.8 4.3
Jelly beans 365 90.3 0.4 0.1
Margarine 354 2.8 38 0.1
Mayonnaise 298 6.5 29.8 0.7
Orange juice 42 9.1 0.1 0.5
Apple juice 44 10.4 0.1 0.1
Apple and blackcurrant squash
2 0.2 0.1 0.1
Pepsi 44 11.1 0 0