Enzymatic hydrolysis of corn gluten proteins - CORE
161
Retrospective eses and Dissertations Iowa State University Capstones, eses and Dissertations 1-1-1988 Enzymatic hydrolysis of corn gluten proteins Julie Elizabeth Hardwick Iowa State University Follow this and additional works at: hps://lib.dr.iastate.edu/rtd Part of the Chemical Engineering Commons is esis is brought to you for free and open access by the Iowa State University Capstones, eses and Dissertations at Iowa State University Digital Repository. It has been accepted for inclusion in Retrospective eses and Dissertations by an authorized administrator of Iowa State University Digital Repository. For more information, please contact [email protected]. Recommended Citation Hardwick, Julie Elizabeth, "Enzymatic hydrolysis of corn gluten proteins" (1988). Retrospective eses and Dissertations. 18247. hps://lib.dr.iastate.edu/rtd/18247
-
Upload
khangminh22 -
Category
Documents
-
view
0 -
download
0
Transcript of Enzymatic hydrolysis of corn gluten proteins - CORE

Retrospective Theses and Dissertations Iowa State University Capstones, Theses andDissertations
1-1-1988
Enzymatic hydrolysis of corn gluten proteinsJulie Elizabeth HardwickIowa State University
Follow this and additional works at: https://lib.dr.iastate.edu/rtd
Part of the Chemical Engineering Commons
This Thesis is brought to you for free and open access by the Iowa State University Capstones, Theses and Dissertations at Iowa State University DigitalRepository. It has been accepted for inclusion in Retrospective Theses and Dissertations by an authorized administrator of Iowa State University DigitalRepository. For more information, please contact [email protected].
Recommended CitationHardwick, Julie Elizabeth, "Enzymatic hydrolysis of corn gluten proteins" (1988). Retrospective Theses and Dissertations. 18247.https://lib.dr.iastate.edu/rtd/18247

Enzymatic hydrolysis of corn gluten proteins
by
Julie Elizabeth Hardwick
A Thesis Submitted to the
Graduate Faculty in Partial Fulfillment of the
Requirements for the Degree of
MASTER OF SCIENCE
Major: Chemical Engineering
Approved:
Signatures have been redacted for privacy
Iowa State University Ames, Iowa
1988

ii
TABLE OF CONTENTS
NOMENCLATURE
INTRODUCTION
LITERATURE REVIEW
Hydrolysis of Proteins
Acid hydrolysis Alkaline hydrolysis Enzymatic hydrolysis
pH Stat Hydrolysis Method
Principle Operation
Corn Gluten Meal
Composition and properties Uses of corn gluten meal
Hydrolysis Models
Kinetic models Statistical model
Enzyme Reactions
Enzyme properties Class of proteases
Functional Properties
Solubility Flavor Viscosity
MATERIALS AND METHODS
Materials
Corn gluten meal Enzyme preparation
Page
v
1
3
3
3 4 5
10
10 12
13
14 15
16
17 24
25
25 28
31
31 35 36
37
37
37 37

iii
Analyses 38
Kjeldahl nitrogen assay 38 Biuret protein assay 39 Trichloroacetic acid precipitation 39 Viscosity 39 Sieve analysis 39 B.E.T. surface analysis 40
Experimental Procedure 40
Screening experiments 40 Design experiments 47 Modelling experiments 48
Model Development 49
RESULTS AND DISCUSSION 55
Evaluation of Experimental Conditions (Screening Experiments) 55
Comparison of enzymes 55 Effect of enzyme dosage 57 Effect of pH 60 Effect of temperature 63
Hydrolysis Effects in Combination with Size Reduction (Design Experiments) 63
Time Course of Hydrolysis 78
Kinetic Models 82
Linear/linear model 82 Michaelis-Menten/Michaelis-Menten model 90 Freundlich adsorption/linear model 90 Simplified product inhibition/product inhibition model 93 Comparison of the linear and simplified product inhibition models 102 Simultaneous fast and slow reactions 106
CONCLUSIONS AND RECOMMENDATIONS 113
Conclusions 113
Recommendations 114
BIBLIOGRAPHY 116

ACKNOWLEDGEMENTS
APPENDIX
iv
121
122

A
A s
B
E
E a
h
h tot
I
IE
k s
K
K m
KmI'mP'mS
v
NOMENCLATURE
Arbitrary constant
Surface sites of insoluble substrate
Volume of base consumed during hydrolysis
Initial enzyme concentration
Enzyme concentration
Number of moles of enzyme adsorbed in equations (11) and (14) or activation energy in equation (20)
Hydrolysis equivalents, defined as equivalents of peptide bonds per g
Total number of peptide bonds in a protein, same units as h
Insoluble substrate concentration
Insoluble substrate concentration, resistant to hydrolysis
Reaction rate constants
Kinetic constant for enzyme denaturation
Kinetic constant for enzyme inactivation
Reaction rate constant for insoluble pool I
Mean reaction rate constant for insoluble pool I
Reaction rate constant for soluble pool S
Mean reaction rate constant for soluble pool S
Partition coefficient between phases I and II
Michaelis-Menten constant
Michaelis-Menten constant for inhibition
Michaelis-Menten constant for product inhibition
Michae1is-Menten constants for pools I, P, and S, respectively, used in modelling (Table 5)

MP
p. ,P J n
R
5
5. ,S. . ~ ~-J
50
t
T
v
v m
Greek letters
vi
Mass of protein
Normality of base in protein hydrolysis experiments
Concentration of soluble low molecular weight peptides, not precipitated by TCA
Soluble peptides of different molecular weight
Gas constant
Rate of hydrolysis of substrates I and S, respectively
Substrate species, protein or high molecular weight peptides, precipitated by TCA
Substrates of different molecular weight
Initial substrate concentration
Time
Temperature, degrees Kelvin or Celsius
Reaction rate in kinetic expression
Maximum rate of reaction
Volume of phase I, soluble phase
Standard deviation for rate constants k5 and kI ,
respectively, used in the kinetic models

1
INTRODUCTION
Enzymatic hydrolysis has been used to favorably modify the functional
properties of a protein, such that the hydrolysate could be incorporated
into foods for its flavor, functional, and nutritional value.
Corn gluten meal contains approximately 60% protein. The major draw
back of using corn gluten meal in foods is that it is very insoluble both
in water and dilute alkaline solutions (Ofelt and Evans, 1949, Russell
and Tsao, 1982). If corn gluten meal is dispersed in water, without
agitation, it quickly separates out into solid and liquid phases. The
object of enzymatic hydrolysis is to produce soluble protein hydrolysates.
The hydro1ysates should exhibit either a bland or pleasant flavor, in
order that the nutritional value of the hydro1ysates can be used in food
products (Kinsella, 1978). Corn gluten meal has been hydrolyzed using
alkaline microbial proteases (Adler-Nissen, 1977). The hydrolysate has
not yet been commercially incorporated into foods.
The purpose of this study is to develop a kinetic model to describe
the mechanism for the enzymatic hydrolysis of corn gluten meal, using an
alkaline protease. If the mechanism is more clearly understood, problems
encountered in the hydrolysis should be identified. It may then be
possible to develop a more efficient process for the hydrolysis, resulting
in a higher yield of soluble protein without the production of bitter
flavors.
In order to check the validity of different models, experimental data
were generated. Corn gluten meal was hydrolyzed batchwise in a baffled,
stirred reactor at different enzyme concentrations for a fixed pH and
2
temperature. The effect of size reduction on the hydrolysis was studied.
Size reduction increases the surface to volume ratio, which theoretically
could increase the rate of hydrolysis.
A series of compartmental models were studied. These included a
linear model, a Freundlich adsorption model (McLaren, 1963, Archer et al.,
1973) and Michaelis-Menten models with and without the effects of
product inhibition (Constantinides and Adu-Amankwa, 1980, O'Meara and
Munro, 1985). These models were solved iteratively using available soft
ware (IMSL, 1987). A graphical method for two simultaneous reactions was
also considered (Mihalyi and Harrington, 1959).
Calculated values of soluble protein with time were generated from
parameters, estimated by fitting a kinetic model to experimental data.
The different kinetic models were evaluated by comparing the fit of the
calculated values to the experimental data.
3
LITERATURE REVIEW
Hydrolysis of Proteins
Proteins consist of many amino acids joined together by peptide
linkages. They have a molecular weight range from 1200 to several
million. The hydrolysis of the peptide linkages breaks the protein into
smaller peptides. If the hydrolysis is carried far enough, the protein
may be broken down into amino acids.
There are three common methods of hydrolysis. These are acid
hydrolysis, alkaline hydrolysis and enzymatic hydrolysis.
Acid hydrolysis
Sulfuric acid and hydrochloric acid are applied the most frequently
in partial acid hydrolysis; acetic acid is also used. Dilute or
concentrated acids may be used; a shorter time is required to achieve
the same degree of hydrolysis with a more concentrated acid (English and
Grulke, 1934, Light, 1967). The time of hydrolysis is also reduced if
the reaction is carried out at elevated temperature. For example, if the
hydrolysis is carried out using S.7N hydrochloric acid at 37°e, the time
required for the hydrolysis is 3 days. In contrast, using the same S.7N
hydrochloric acid at a temperature of 100oe, the time of the hydrolysis
is 20-30 minutes (Light, 1967, Ricks et al., 1977).
The reaction conditions chosen for acid hydrolysis depend very
much on the raw materials. If the hydrolysate is to be used in foods,
the protein content and the flavor are of major importance, so the
hydrolysis may not be as extreme or for as long (Prendergast, 1974). Acid

4
hydrolysis may also be used to determine the protein content of foods; in
this case the hydrolysis is carried to completion, using 6N hydrochloric
acid at 137°C and for a time period varying between 12 and 96 hours (Davies
and Thomas, 1973).
For food use the cost of hydrolysis must be relatively low and the
hydrolysate should produce flavors which enhance or intensify naturally
occurring flavors. Prendergast (1974) reported that sulfuric acid
produces a salt-free product but with rather a harsh flavor. In addition,
large volumes of calcium sulfate must be filtered off after neutralization,
which results in a low yield and a relatively costly product. Sulfuric
acid is consequently used mostly in the production of dietary and special
products. Hydrochloric acid is generally preferred, but the hydrolysate
always contains sodium or potassium chlorine, which are formed when the
acids are neutralized.
Alkaline hydrolysis
Alkaline hydrolysis does not produce pleasant flavors, but it can
be used for analysis to determine amino acid content. Some amino acids
such as cystine and arginine are completely destroyed. Tryptophan, which
is destroyed by total acid hydrolysis, can be completely recovered by
total alkaline hydrolysis (Andrews and Baldar, 1985).
Total hydrolysis is carried out using 4.2N sodium hydroxide or barium
hydroxide; the time of hydrolysis depends on which amino acids are of
interest. Low recoveries of all amino acids, except tryptophan, are
observed for a hydrolysis time between land 10 hours. If the hydrolysis
is continued for 16 hours, 85-90% recovery of cystine, tyrosine, and

5
glutamine, and 95-100% recovery of proline, valine, leucine and tryptophan
are found (Davies and Thomas, 1973).
Enzymatic hydrolysis
Enzymatic hydrolysis is generally slow, quite expensive, and rarely
goes to completion. Native proteins are globular and the peptide bonds
are to a certain extent not accessible for enzymatic attack. The reaction
is also slow because it is carried out at the lower temperatures tolerated
by the enzyme.
Proteins for use in foods are hydrolyzed enzymatically to improve
their functionality. The functionality may be altered by many different
types of enzymes, but mostly proteases are used (Adler-Nissen, 1976).
The rate of proteolysis depends not only on the primary structure
of the protein, but also on the secondary and tertiary structure. The
folding of the protein in some systems may reduce the accessibility of
some bonds, which may be easily split when the chain is unfolded.
The hydrolysis of insulin chains, for example, involves mostly the
primary structure, and therefore depends mainly on the kinetic
properties of the protease (Ronca et al., 1975). The digestion of myosin
by trypsin results in the cleavage of only 59% of the susceptible bonds,
suggesting that the core is resistant, or extremely slowly digested
(Mihalyi and Harrington, 1959). If a protein is very unsoluble due to its
globular structure, peptide bonds may be cleaved at a slow rate until
inner parts of the protein molecule become accessible to the enzyme by
prior cleavages.

6
The hydrolysis of soybean protein by Penicillium duponti
(Constantinides and Adu-Amankwa, 1980) involves the cleavage of the
insoluble protein and partially soluble aggregates. The partially soluble
polypeptides are hydrolyzed in a fast reaction to smaller soluble peptides,
whereas the more compact protein core is solubilized by the adsorbed
enzyme in a slower reaction.
The rate of production of soluble soybean protein starts to decrease.
However, the substrate concentration is still high enough to rule out
substrate exhaustion. The solubilization is not greatly increased on
further addition of enzyme, but it is increased if the suspending solution
is removed, and the hydrolysis continued by resuspension of the solids.
This effect can be attributed to the presence of product inhibition
(Constantinides and Adu-Amankwa, 1980).
Mechanism Linderstrom-Lang proposed that the hydrolysis of a
protein may be described by two types of reaction sequences. These are
termed the "one by one" and the "zipper" mechanisms. Figure 1 shows the
basic ideas behind the two mechanisms (Adler-Nissen, 1976).
The "one by one" reaction is so called because the enzyme hydrolyzes
one chain at a time. This would result if bond accessibility increased
as cleavage progressed. If the first "denaturation" step, represented
as a reversible step in Figure l~ is rate determining, then only native
protein and end products are detected (Adler-Nissen, 1985).
In contrast, the "zipper" reaction applies when the native protein
is easily denatured and a large number of bonds are exposed. The enzyme
Can cleave at several different sites, but if the rate of cleavage is

7

Figure 1. Linderstrom-Lang one-by-one and zipper type models. Native protein is denoted by circles, denatured protein by rectangles, peptides by small rectangles of different length according to the chain length. The crescents symbolize enzymatic attack (Adler-Nissen, 1976)

8
one-by-one type zipper type
0 0 It slow 11 fast
D D I fast D I fast D
I , 1 fast D 1 slow D ~ c::I c::::I c:::::::J
c::r ~ CI
~ ~ cr c:::::::I

9
slow, there will be a build up of intermediate products, as the end
products are formed slowly.
Most hydrolysis reactions will be a combination of the two mechanisms.
One mechanism may be favored over another depending on the nature and
concentration of the substrate and the enzyme; the pH and temperature may
also playa part (Adler-Nissen, 1976).
Uses of hydrolysates In enzymatic hydrolysis, the major problem
is excessive hydrolysis, resulting in the formation of "bitter peptides".
A bitter taste is unacceptable if the hydrolysates are to be used in
foods. Bitter peptides may be avoided by controlling the degree of
hydrolysis and consequently reducing the formation of low molecular weight
peptides.
Gelatin and egg albumin are used as foaming agents in desserts, but
not for flavoring since these hydrolysates exhibit a moderately bland
flavor (Prendergast, 1974).
Soy protein is used as an ingredient in low pH foods, but it has to
be made more palatable and its solubility profile has to be improved.
As a result of a 10% degree of hydrolysis, soy protein has been 65-75%
solubilized at pH 8 and 50°C (Olsen and Adler-Nissen, 1979b). Soy protein
hydrolysates may be applied to soft drinks to increase their nutritional
value (Adler-Nissen, 1977).
Other food applications have been in the area of dietary disorders,
for example when insufficient pancreatic enzymes are present. Enzymatic
hydro1ysates have been used in the treatment of cystic fibrosis. Protein
is supplied in the pre-digested form because the small intestine is

10
impaired. An example of such an application is the use of skim milk and
casein (Clegg, 1977, Adler-Nissen, 1977).
As a consequence of the successful application of some food
hydrolysates, there is motivation to investigate other
protein rich sources, provided bitterness can be avoided during the
hydrolysis, e.g. fish protein hydrolysates.
The hydrolysis of corn gluten meal, a concentrate of corn protein is
a good protein source, but its properties are not ideal for this purpose.
Adler-Nissen (1978a) reports the successful modification of corn gluten
meal using Alcalase 0.6L, without creating bitter peptides. The hydrolysis
was, however, performed on corn gluten meal from only one supplier. It
should therefore not be eliminated that some conclusions may be specific
to the particular corn gluten meal used.
The highest substrate concentration used was 8% w/w protein due to
a large (more than ten times) increase in viscosity during the course of
the hydrolysis. Higher protein concentrations could not be used due to
possible agitation problems. There is no report on the use of the
hydrolysate as a protein additive in foods.
pH Stat Hydrolysis Method
Principle
The degree of hydrolysis, which is actually the percentage of peptide
bonds cleaved, may be measured by monitoring the base addition required
to maintain pH during the hydrolysis (Ad1er-Niss~n, 1985). The breakage
of a peptide bond during hydrolysis can be illustrated by the following
equation:
11
Enzyme -CHR' -CO-NH-CHR" + H
20 ~ __ ) -CHR' COOH + NH
2CHR" (1)
The free carboxyl and free amino groups mayor may not be ionized,
depending on the pH and to some extent the temperature of the reaction.
At 2SoC, the pK of the carboxyl group in a polypeptide is between 3.1 and
3.6, and the pK of the amino group is between 7.S and 7.8 (Adler-Nissen,
1985). If a reaction proceeds at pH 8 and 2SoC, the carboxyl group will
be fully dissociated and the amino group will be partially protonated
(Eriksen, 1982a). Hence hydrolysis results in release of protons where
the stoichiometry depends on the degree of protonation of the a amino
group. The protein exchange is shown in equation (2)
-CHR'-COOH + NH -CHR" + -CHR'-COO- + NH +-CHR" 2 3
(2)
The degree of protonation of the a amino group can be expressed in
terms of the pK of the amino group at a particular pH and temperature,
and the pH of the system (equation (3»
10PH-pK (3) a = ------
1 + 10PH-pK
The degree of dissociation a, increases with increasing temperature,
the pKa of the amino group at pH 8 and 2Soc is 7.7, but at SO°C the pKa
drops to 7.1 (Eriksen, 1982a, Adler-Nissen, 1982).
A protein is made up of a certain number of peptide bonds which
theoretically could all be cleaved to give 100% degree of hydrolysis.
The total number of peptide bonds in a particular protein may be calculated

12
from the amino acid composition in mmols of the individual amino acids per
g of protein (Adler-Nissen, 1985). The total number of peptide bonds is
denoted by htot
•
The pH stat meter is used to determine the actual number of peptide
bonds per g which are cleaved during hydrolysis. This is denoted by h,
and the degree of hydrolysis is defined as
h DH = -- x 100% htot
(4)
When hydrolysis is performed at neutral or mildly alkaline conditions,
the degree of hydrolysis (DH) can be monitored continuously. Without
the use of the pH stat technique, the pH drops as hydrolysis proceeds,
shown in equation (2). The pH stat technique involves the addition of
base, such as sodium hydroxide, to maintain a constant pH. The consumption
of base is proportional to the hydrolysis equivalents, h. h is given by
(Eriksen, 1982b)
1 1 h = B x Nb x - xa MP
Operation
The pH stat meter requires the pH electrode to be immersed in the
(5)
reaction system. The pH electrode is connected to a pH meter, which in
turn is connected to an adjustable controller.
A motor-driven burette is responsible for the delivery of the
titrant, either acid or base. One end of the burette must also be
immersed into the reaction system.

13
The controller may be set to maintain a particular pH value. If the
pH deviates from the desired value, titrant is added until the original
pH is restored (Jacobsen et a1., 1957). The consumption of base can be
plotted with time by a recorder.
The controller starts the motor-driven burette when the output
potential of the pH meter deviates from the desired value. It stops when
the pH is brought back to the original value.
The controller is a proportional controller. The advantage to this
is that near the set point, smaller amounts of titrant are added, and
addition stops when the set point is reached.
Carbon dioxide from the atmosphere can introduce some error into
the measurement of degree of hydrolysis when the pH stat is operating at
alkaline pH. Adler-Nissen (1985) showed that, for a 1 liter charge
operating at pH 9 and 50°C, less than 0.08 mmo1es of carbon dioxide are
absorbed over a four hour experiment. It is therefore assumed that the
carbon dioxide uptake is negligible relative to the amount of titrant
consumed during the hydrolysis. Carbon dioxide uptake can be avoided if
an inert gas such as nitrogen is flushed through the system.
Corn Gluten Meal
Corn gluten meal is a by-product of the corn wet milling process. In
corn wet milling, after steeping and grinding, the lighter germ may be
collected off the top of a hydro cyclone separator. Starch, protein, and
fiber are collected off the bottom. Fiber is further separated by grinding

14
and screening. Finally, the denser starch is separated from the gluten
meal by hydrocyclone separation (Hoseney, 1986).
In the dried form, corn gluten meal is a very valuable animal feed,
as it provides a high level of rumen bypass protein (Hoseney, 1986, Buck
et al., 1987).
Corn gluten meal is bright yellow due to the presence of xanthophyl1s;
it is used as a pigment source for poultry, imparting a bright yellow
color to their skin (Buck et al., 1987).
Composition and properties
Corn gluten meal on a dry basis contains typically 60% protein, 15-18%
fat, 20-25% carbohydrate, 3.5% fiber, and 1-2% ash (Buck et al., 1987).
Corn gluten protein may also be broken down into further protein
fractions. The major protein fractions are 68% zein and 28% glutelin,
with only 1.2% globulins (Neumann and Wall, 1984, Buck et al., 1987).
The different classes of protein are defined according to their
solubilities. The most abundant protein, zein, is soluble in relatively
strong alcohol, such as 70% ethanol, or in dilute alkaline solutions. It
is insoluble in water or solutions of neutral inorganic salts (Russell and
Tsao, 1982, Neumann and Wall, 1984).
Glutelin, the next most abundant protein fraction, is defined as
being readily soluble in dilute sodium or potassium hydroxide solutions,
but insoluble in water, saline solutions, or alcohol. Globulins are
soluble in &aline solution (Russell and Tsao, 1982).
The solubility in different solutions may be used to sequentially
fractionate the different proteins. Firstly, saline solution would remove

15
the globulins, zein may then be removed using 70% ethanol and lastly, the
glutelin is removed by O.lN sodium hydroxide (Neumann and Wall, 1984).
Most experimental work has been focused on zein, mainly due to the
highly hydrophobic nature of corn proteins in simple water/alcohol systems.
Solubility studies show that in a 70% ethanol/30% water mixture, the
solubility of zein is still low at 15 mg protein/ml (Augustine and
Baianu, 1987). Zein is also dispersible in sodium or potassium hydroxides
within the narrow pH range of 11.3 to 12.7 (Ofelt and Evans, 1949). The
dispersion is a result of the formation of the alkaline salt of
tyrosine, caused by a dissociation of the phenolic-hydroxyl groups.
Gel filtration shows that zein proteins are monomers and dimers of
similar sub-units. Molecular weights of 22000 and 45000 were found for
the monomers and dimers, respectively (Ganchev and Ivanov, 1969b).
Uses of corn gluten meal
Corn gluten meal is an important protein source for animals. It
would be desirable to use it for human nutrition since some fractions
are rich in sulfur amino acids (Sternberg et al., 1979).
Corn gluten meal and soy protein have complementary amino acid
compositions, such that an optimal protein content for foods can be
obtained by blending the two. The gluten meal is upgraded for human use
to give maize protein concentrate (MPC). The maize protein concentrate
is a bland, light colored material containing approximately 70% protein
and under 0.6% fat, the solubility of which is even less than the native
protein. Maize protein concentrate has been used as a stabilizer in
peanut butter. It can be substituted at levels of 10-15% in breakfast

16
cereal (Sternberg et a1., 1979). Soy protein and maize protein isolate
can be coextruded and substituted at varying concentrations in soy flour
products (Buck et a1., 1987).
The major drawback of using corn gluten meal in human food is its
insolubility in water. The functionality of corn gluten meal can be
modified by enzymatic hydrolysis using A1ca1ase 0.6L, such that its water
absorption capability is significantly improved and it remains a one
phase system if left suspended in an aqueous medium (Adler-Nissen, 1978a).
Hydrolysis Models
The Michae1is-Menten approach to enzyme kinetics has been widely
applied. Kinetic constants in food protein hydrolysis experiments are
evaluated using different approaches for soluble enzyme and insoluble
substrate systems.
A kinetic model provides a mechanistic understanding of enzymatic
hydrolysis. With macro-molecular substrates, a complete model of the
system can be very involved. In most cases, a few valid assumptions will
yield a more manageable model, which will still represent the mechanism
adequately for the purpose of reactor design.
A statistical model using empirical rate equations may also be
applied to soya isolate. Although, information on the mechanism is lost,
the precision is very good for the optimization and design of hydrolytic
processes.

17
Kinetic models
Different kinetic models have been applied to soluble enzyme and
insoluble substrate systems. The enzymatic hydrolysis of soybean protein
(Constantinides and Adu-Amankwa, 1980) and lean meat protein (O'Meara and
Munro, 1985) was modelled using a Michaelis-Menten product inhibition
model. Alternatively, the adsorption of the enzyme onto the substrate
(Freundlich adsorption method) followed by the subsequent hydrolysis was
used to model the enzymatic hydrolysis of fish protein hydrolysate
(Archer et a1., 1973). The hydrolysis of oxidized chains of insulin A
and B has been modelled as two simultaneous parallel reactions (Montali
et a1., 1980). It is not apparent which kinetic model might exhibit a
good fit to the experimental data until the system is carefully studied.
Michae1is-Menten model Insoluble substrate systems may be
modelled using mechanisms similar to those used for the hydrolysis of
soluble substrates. Such models follow the traditional Michaelis-Menten
format, shown below
dP v
v ·S m (6)
The model used by Constantinides and Adu-Amankwa (1980) modifies the
Michaelis-Menten equation to account for product inhibition and may be
represented by the following mechanisw
kl k Z E + S -- ES -- S + P. + E i +-- i i-j J
k_l
k E + P ~ EP
n k n -n
(7)
(8)
( 9)

18
Equation (7) represents a multistep process where intermediates S
are generated and further degraded. Equation (8) represents the product
inhibition, where a proportion of the product competitively ties up the
enzyme. Equation (9) represents the inactivation of the enzyme.
represents all the "intermediates", of varying molecular weights, in the
hydrolysis. In the same manner, p. represents a group of smaller, but J
varying molecular weight peptides.
Similar mechanistic models were used for the enzymatic hydrolysis
of insoluble lean meat protein using the protease Alcalase 0.6L (O'Meara
and Munro, 1985) and also the hydrolysis of cellulose by
Trichoderma viride (Howell and Stuck, 1975). The model for all three
systems may be represented by the following equation
dP dt = (10)
The global constants k., k., K , and ~ were evaluated mathematically J l. m --p
using the Marquardt nonlinear regression iterative technique to fit the
model to experimental data (Constantinides and Adu-Amankwa, 1980, O'Meara
and Munro, 1985). The rate equation is integrated using a Runge-Kutta
numerical integration algorithm. The global constants in the hydrolysis
of cellulose by Trichoderma viride (Howell and Stuck, 1975) were evaluated
by a graphical method.
Freundlich adsorption model The kinetic model considers firstly
the adsorption of the enzyme on the insoluble substrate, which is evaluated
using the Freundlich adsorption isotherm. The enzyme adsorption was then
combined with a kinetic expression for the hydrolysis. The enzymatic

19
hydrolysis of fish protein concentrate, starch, and cellulose (Archer
et al., 1973, McLaren, 1963) have all been modelled in this manner.
The Freundlich adsorption isotherm considers the distribution of
the solute between the soluble phase I and the insoluble phase II. For
an insoluble substrate with surface A onto which the enzyme can bind s
(McLaren, 1963, Archer et al., 1973),
E a
-= A
s
If hydrolysis takes place on the surface of the substrate, the
power n should be 2/3 or close to it. The value of n is less than 2/3
if the substrate has a high internal surface area, where additional
hydrolysis occurs (McLaren, 1963).
The mechanism for the adsorption to solid substrate and formation
of soluble protein is
E + A kl -EA
k3 -p + E s -- s
k2
The rate of product formation is given by the expression
If the assumption is made that all the adsorbed enzyme is in the form
of the enzyme-substrate complex,
(EA ) = s
(11)
(12)
(13)
(14)

20
The resulting rate equation for formation of products using the
Freundlich adsorption isotherm (equation (11)) may be expressed as
(15)
If As and VI are assumed to be constant, the initial rate of
hydrolysis becomes a function of enzyme concentration only. The enzyme can
occur as free enzyme in solution or as bound enzyme, as shown below.
(16)
The final kinetic expression for product formation becomes
dP k' [E - (EA )] n o s (17) -= dt
The values of constants k' and n may be evaluated by plotting log(dP/dt)
versus log E (Archer et al., 1973, McLaren, 1963).
If the surface area of the substrate is small, for example in the
digestion of gelatin gel with trypsin, the enzyme in the enzyme-substrate
complex is assumed to be negligible, and the enzyme concentration E in
equation (17) is replaced by EO' the total amount of enzyme in the
system (McLaren, 1963).
Simultaneous first-order reactions An alternative method which
was applied to the hydrolysis of oxidized chains of insulin A and B was
to consider two simultaneous first-order reactions (Mihalyi and Harrington,
1959, Ronca et al., 1975). The enzyme subtilisin Carlsberg was used
for the hydrolysis; this enzyme has a very wide specificity. The kinetics

21
of the reaction were followed using the pH stat technique, which
unfortunately cannot detect the separate reactions. The sum of both
reactions with time was therefore measured. The existence of two
simultaneous reactions was identified by kinetic analysis.
The two simultaneous reactions consist of a fast and a slow reaction
where the proteolysis of one class of peptide bonds is a fast reaction.
These bonds are identified as CyS(03H)-Ser and Leu-Tyr. The other class
of bonds are cleaved more slowly according to a first-order reaction.
The cleavage sites in this case are Leu-Glu, Asn-Tyr, and Try-Cys(03H)
(Montali et al., 1980). Other slowly cleaved bonds are also identified
as Glu-Gln (Ronca et al., 1975). Ronca et ale (1975) claim
that the limited proteolysis of other sites is also possible, due to the
broad specicity of subtilisin Carlsberg.
The rate constants were evaluated by plotting the natural log of
the proteolysis rate against time. The proteolysis rate is given by
the rate of base consumption (dP/dt) measured by the pH stat. It is
generally concluded that the fast reaction is complete before a
significant fraction of the slow reaction has occurred (Miha1Yi and
Harrington, 1959). The slow reaction is shown by the last part of the
plot, which is linear (Figure 2). An expression for each reaction is
obtained using the first-order rate law·
(18)
This equation can be integrated using the boundary condition that S
is SO' the initial substrate concentration, at time zero, which leads to

22

Figure 2. Graphical analysis of typical pH stat curve. Logarithm of the rate of base uptake versus time. Straight lines correspond to isolated slow (0) and fast (D) reactions. Simultaneous fast and slow reaction denoted by • (Mihalyi and Harrington, 1959)

23
1.90 I -
1.70
1.50 -
1.30 .-~ Slow Reaclion (Log Rate Plot) r:....
1.10 < / a:: '-"
~ 0.90 0 -l
O:fO I I. 0.50 !- Slow Reacllon
(Log Difference Plot)
0.30
0.10 0 20 40 60 EO 100
TIME [MIN]

In dP dt
24
The slope of the linear part is -k and the intercept is In(kSO)'
(19)
from which So may be found. So depends on the number of bonds split and
the degree of dissociation. At pH values greater than 9.0, it corresponds
to the number of bonds split.
The first part of the curve is the sum of the fast and slow reactions
(Figure 2). The k value and So for the fast reaction are evaluated by
a second semi-log plot of proteolysis rate versus. time. Tae data for the
fast reaction may be plotted after the rate of the slow reaction rate
has been subtracted from the combined rate (Ronca et al., 1975, Archer
et al., 1973, Mihalyi and Godfrey, 1962).
The hydrolysis of fish protein concentrate can be modelled as two
first-order reactions. The fast reaction corresponds to bound enzyme
cleaving accessible polypeptide chains. The slow reaction is the
hydrolysis of the more compact core protein. Archer et ale (1973)
conclude that the rate controlling process for fish protein concentrate
is the diffusion of the enzyme onto the surface active sites and the
compact core.
Statistical model
The statistical model (Adler-Nissen, 1985) gives no information on
the mechanism of the hydrolysis, but serves as an empirical comparison
between hydrolysis curves for the purpose of optimization of the process.
The statistical model compares an experimental hydrolysis curve with
a standard, defined hydrolysis curve. Scaling factors are used to correct

25
the time scale for any differences between the experimental curve and
the standard curve. Differences between the curves could be a result of
a different hydrolysis temperature or a different enzyme concentration,
for example. Statistical techniques are used to compare hydrolysis
curves, since experimental error as well as reaction conditions would
imply differences between the two hydrolysis curves.
The statistical analysis model relies on the fact that only one
enzyme is present, and that the substrate concentration is high enough
to ensure that the enzyme is saturated with substrate throughout the
course of the hydrolysis (Adler-Nissen, 1985).
The model has been applied to the hydrolysis of soya isolate using
A1ca1ase. It would not, however, be applicable to corn gluten meal,
where the enzyme may not be saturated with substrate throughout the course
of the hydrolysis. The applicability of this model was therefore not
pursued.
Enzyme Reactions
Enzyme properties
Enzymes are specific biological catalysts. The same thermodynamic
and kinetic constants can be applied as with any catalytic reaction, so
that the rate at which an enzyme reaction proceeds is altered, but not
the final position of the equilibrium. The substrate to undergo
reaction has to bind to the active site of the enzyme, which forms an
enzyme-substrate complex.
The activity and stability of the enzyme depend very much on the
surroundings. The rate of hydrolysis is dependent on the enzyme

26
concentration and, in addition, the ionic strength, pH, temperature, and
concentration of substrate and inhibitors (Wiseman, 1985). The effects
of these parameters on the rate of hydrolysis are illustrated in the
Michaelis-Menten equation, the model for product inhibition, and
the Freundlich adsorption model, equations (6), (10), and (17),
respectively.
Also fluid forces and chemical agents can effect an enzyme's
activity. Anyone of these factors may effect the shape or ionization
state of the enzyme.
Enzyme concentration The choice of enzyme concentration in an
industrial process is mostly an economic consideration of how much enzyme
is required to generate the products at a satisfactory rate. In general,
the amount of enzyme required relative to the substrate is small
(Wiseman, 1985).
Substrate concentration A high substrate concentration tends to
stabilize enzymes, even under nonidea1 conditions, permitting operation
at higher temperature and lower enzyme dosage. In food protein
hydrolysis, the substrate concentration is generally less than 10% by
weight (equation (10» (Boyce, 1986).
Effect of temperature The rate of reaction increases with
increasing temperature according to the Arhenius equation. The rule of
thumb is that for every 10°C increase in reaction temperature, the enzyme
will react twice as fast.
k = A exp(-E /RT) a (20)

27
However, enzyme stability is also influenced by the temperature, and
thermal denaturation can occur (Wiseman, 1985, Bailey and Ollis, 1977).
The high activation energy for enzyme denaturation makes the
enzyme quite sensitive to small changes in temperature. Denaturation
has been described by a first order decay law
E(t) = E(O) exp(-kdt) (21)
Effect of pH At the optimum pH, the maximum possible amount of
enzyme is in the active form. Enzymes possess ionizable groups, whose
charge varies with a pH change, which in turn alters the conformation of
the enzyme and consequently the binding of the substrate at the active
site (Wiseman, 1985). The optimum operational pH often is a compromise
between the effects on enzyme activity and enzyme stability (Boyce, 1986).
Enzyme inhibition Enzymes can be inhibited in different ways.
Enzyme inhibition can be categorized into irreversible and reversible
inhibition.
Irreversible inhibition involves the destruction or modification
of one or more functional groups of the enzyme, resulting in the loss
of some or all of the enzyme activity (Lehninger, 1972, Wiseman, 1985).
The most common types of reversible inhibition are competitive
and non-competitive. Competitive inhibition involves competition between
inhibitor and the normal substrate molecules for the binding site of
the enzyme. Competitive inhibition can generally be reduced by increasing
the substrate concentration (Lehninger, 1972). Competitive inhibition
is described by equation (22)

v v 'S
m
28
Non-competitive inhibition involves the inhibitor binding at some
(22)
other site on the enzyme. Inhibition cannot be reduced by increasing the
substrate concentration. The general rate equation for non-competitive
inhibition is given by
v 'S V = ______ ~m~~--____ ~
(1 + I/KI)(S + Km) (23)
Effect of mechanical forces Mechanical forces, including viscous
shear and interfacial tension, can disrupt the conformation (denature)
of the enzyme. The fragility of the enzyme may impose a limit on the
type of agitation in an enzyme reactor. Agitation increases the
substrate mass transfer rate, but it can cause enzyme denaturation
(Bailey and Ollis, 1977).
Class of proteases
The general name applied to enzymes used to hydrolyze proteins
is protease. Proteases can be further divided into endopeptidases
and exopeptidases. Both classes hydrolyze the peptide linkage.
Endopeptidases act upon peptide linkages that are not near the end
of the substrate molecule, whereas exopeptidases act only on peptide
linkages that are at the end of the peptide chain (Laidler, 1958).

29
All prot eases of significant industrial importance are endopeptidases
rather than exopeptidases. Endopeptidases can be grouped according to
the biochemical nature of the active site. These groups are serine
proteases, thiol proteases, carboxyl proteases and metalloproteases
(Moo-Young, 1985, Rehm and Reed, 1987). A general overview of the
class, source, and uses' for the important commercial enzymes is shown
in Table 1.
Serine proteases The serine proteases have serine and histidine
at the active site. Two sub-groups of the serine proteases are trypsin
like proteases and alkaline proteases. The serine proteases are active
in the neutral to alkaline pH range, with pH optima between 8 and 11
(Rehm and Reed, 1987). The alkaline proteases have, in general, a much
broader specificity to the substrate than the trypsin-like enzymes. The
alkaline proteases are all specific to aromatic or hydrophobic amino acids
at the carboxyl side of the splitting point (Moo-Young, 1987).
Thiol proteases Thiol proteases have cysteine at their active
site. They all exhibit a broad pH activity, with their optima around
neutrality. The commercial thiol proteases are plant proteases such as
papain and bromelain (Rehm and Reed, 1987).
Carboxyl prot eases Carboxyl prot eases are widely distributed in
animal cells, molds, and yeast. They exhibit their optima in the acid
pH range and many of them have aspartate residues at their active site.
They show specificity towards aromatic or bulky amino acid residues at
both sides of their splitting points.

Tab
le 1
. C
lass
ific
ati
on
of
com
mer
cial
pro
tease
s an
d th
eir
use
s (R
ehm
an
d R
eid
, 19
87)
Cla
ss
Ser
ine
pro
tease
s (a
lkali
ne)
Th
iol
pro
tease
s
Car
bo
xy
l p
rote
ase
s (a
cid
)
Met
allo
pro
teas
es
(neu
tral)
So
urc
e
Ani
mal
p
ancr
eas
-tr
yp
sin
ch
ym
otr
yp
sin
M
icro
bia
l (B
acil
lus
spp
.)
su
bti
lisin
s
Pla
nt
-p
apai
n
(pap
aya)
b
rom
elai
n
(pin
eap
ple
) fi
cin
(f
ig la
tex
)
Ani
mal
-
ren
nets
(c
alf
sto
mac
h)
pep
sin
(p
ig s
tom
ach
) M
icro
bia
l -
acid
pro
tease
s (A
sperg
illu
s an
d R
hiz
op
us)
m
icro
bia
l re
nn
ets
(M
ucor
)
Mic
rob
ial
neu
tral
pro
tease
s B
acil
lus
and
Asp
erg
illu
s
Use
Ph
arm
aceu
tica
l
Det
erg
ents
Fo
od
Mea
t te
nd
eri
zin
g
Bee
r h
aze
pre
ven
tio
n
Mil
k c
lott
ing
in
ch
eese
m
anu
fact
ure
Bak
ing
and
oth
er
foo
d
use
s
Asp
arta
me
man
ufa
ctu
re
Foo
d,
bre
win
g
w
o

31
The carboxyl proteases are divided into two sub-groups according to
their catalytic activity. One group resembles rennin and the other group
resembles pepsin. Pepsin-like prot eases have more acidic optima than
the rennin-like proteases.
Metalloproteases They all have a bound metal ion in
the active site that is involved in the catalytic mechanism.
Consequently, they are inhibited by chelating agents such as ethylene
diamine tetraacetic acid (EDTA).
The metalloproteases are sub-divided into neutral and alkaline
proteases. Enzymes of the neutral group usually have zinc at their active
site, and are specific towards hydrophobic amino acids on the amino side of
the peptide bond to be cleaved. Members of the alkaline group are very
similar to those of the neutral group, other than their pH optima.
Functional Properties
The functional properties of a food are defined as any properties
that effect the utilization of a food other than its nutritional
properties (Cherry, 1981). Certain functional properties of a food can
be favorably modified via enzymatic hydrolysis. Three factors which are
very important in assessing the functional value of a food are the
solubility, the flavor, and the viscosity.
Solubility
The solubility is a "hydrophilic" functional property; its measurement
generally is the first study to be made when more complicated functional
properties are to be investigated. A systematic study of the solubility

32
properties should be made under a variety of ionic environments. The
solubility at different pHs gives a good indication of the potential uses
of the protein, as well as indicating the inapplicability for some other
uses (Mattil, 1971).
Most foods contain a variety of ions, either natural or added. The
solubility of any protein can be varied by altering the ionic environment.
The nitrogen solubility index is generally used to indicate solubility.
It involves dispersing a sample of protein in the presence of a salt such
as NaCl or CaC12
(Wolf, 1970). The solubility is studied through the
full pH range. Samples are analyzed for soluble protein (Mattil, 1971,
Adler-Nissen, 1985).
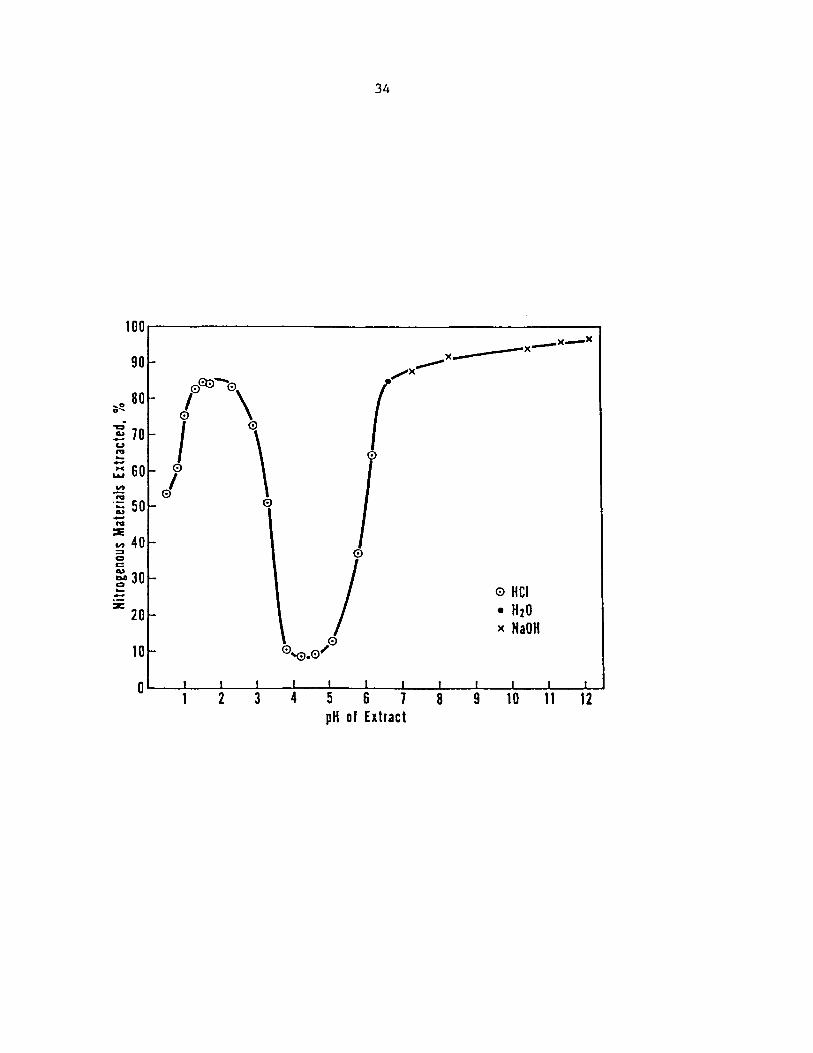
A typical solubility study for defatted soybean meal is shown in
Figure 3 (Wolf, 1970). The region of insolubility around pH 4-5 is the
isoelectric region, which according to Wolf can be eliminated if the
molecular weight of the protein can be reduced, for example by enzymatic
hydrolysis. Ideally, for a wide range of applicability, the solubility
should be increased through as wide a pH range as possible.
The solubility of soy protein isolate can be increased even for short
hydrolysis times using Alcalase or Neutrase (Olsen and Adler-Nissen, 1979a).
The solubility curves are relatively flat, reflecting the hydrolysate
product distribution. The hydrolysate contains fairly small, highly
soluble peptides and nearly insoluble denatured protein (Olsen and
Adler-Nissen, 1979a).

33

Figure 3. Extractability of proteins in defatted soybean meal as a function of pH (Wolf, 1970)
34
l00r-------------------------------------- .
(~X_x------)(-)(-)(
o
90~
~ 80
-c:i ~ 70 u c.J .... .... ~ 60 ~ c.J
":i; 50 .... c.J
:::s: ." 40 :::I C c: cu ~ 30 .... ....
20
10
o
0~-. 0 , \ I 0
I \ o
! o 0
'0.0'"
o Hel • H20 )( HaOH

35
Flavor
Flavor is an organoleptic property, which is a property attributed
to one of the sense organs. The flavor is very important if a protein
such as soy protein or corn gluten meal is to be incorporated into
foods.
Proteins in general have no intrinsic flavor, but they can
potentially modify flavor according to their capacity to bind flavors
or off-flavors. Flavors can be created during cooking or
released during enzymatic hydrolysis (Kinsella, 1979).
Bitterness is thought to be related to hydrophobicity of peptides,
so the higher the content of hydrophobic amino acids in the protein, the
greater the tendency to produce bitterness when the protein is hydrolyzed
(Olsen and Adler-Nissen, 1979a).
There are various approaches to removing off-flavors. One approach
is to add a desirable flavor, to mask the impact of off-flavors.
Taste evaluations of a particular product should be carried out by
a trained panel. Taste tests for bitterness involve use of two samples
and four bitter tasting standards, which are a mixture of sample and
increasing amounts of quinine hydrochloride. A certain concentration of
quinine hydrochloride is taken as the threshold value. Samples are then
assigned a score on a scale of one to five, with one representing no
flavor and five, a strong bitter flavor (Adler-Nissen, 1985, Olsen and
Adler-Nissen, 1979a).

36
Viscosity
Viscosity is a functional property arising from the ability of
proteins and other macromolecules to form temporary intermolecular cross
links (Cherry, 1981). The viscosity of protein dispersions is mostly
influenced by the molecular properties of the protein such as molecular
weight, hydration, and the shape of the molecule. Rheological properties
are a function of shear rate, protein concentration, temperature, pH, and
ionic strength (Kinsella, 1979).
In enzymatic hydrolysis, smaller molecular weight peptides are
produced from a higher molecular weight protein. A reduction in molecular
weight would generally bring about a decrease in the apparent viscosity.
Olsen and Adler-Nissen (1979a) have shown that this occurs for the enzymatic
hydrolysis of soy protein. However, when corn gluten meal is subjected
to enzymatic hydrolysis, an increase in viscosity by more than ten times
results. The hydrolysis may expose sites on the surface which can hydrogen
bond, resulting in a strengthened cohesion between particles.

37
MATERIALS AND METHODS
Materials
Corn gluten meal
The protein content of the corn gluten meal (Grain Processing,
Muscatine, lA) was found to be 60.61%, using the micro-Kjeldahl assay
(AOAC, 1970). An 8% weight protein slurry was made up with deionized
water (after Adler-Nissen, 1977).
EnZyme preparation
Four different proteases were used. The enzyme which gave the
highest yield of soluble protein and the highest degree of hydrolysis was
then screened further.
P4032 protease P4032 protease (Sigma Chemical Company, St. Louis,
MO) was a microbial alkaline protease from Aspergillus oryzae. The
required mass of enzyme was dissolved in 5 ml of deionized water for ease
of addition to the reactor. The enzyme solution was made up immediately
before addition, because it is unstable without the presence of substrate
and may deactivate.
Trypsin (T8l28) Trypsin (T8l28) (Sigma Chemical Company,
St. Louis, MO) was a crude preparation from porcine pancreas. The trypsin
(T8l28) solution was prepared in the same manner as P4032 protease.
Alcalase 2.4L Alcalase 2.4L (Novo Laboratories, Inc., Wilton, CT)
is a food grade preparation of subtilisin Carlsberg in the liquid form.
The enzyme was diluted by one to ten to reduce its viscosity for ease of
addition to the reactor. The dilution was made directly before addition

38
for the same reasons as with P4032 protease, to reduce any chances of
deactivation in the absence of substrate.
Different batches of Alcalase 2.4L were compared by using the Anson
method of activity determination (Anson, 1939, Novo, 1978), except the
color development between batches was compared directly. The Anson
method compares the color development of an enzyme sample to 1 milli
equivalent of tryosine per minute (1 Anson unit).
Neutrase 0.5L Neutrase 0.5L (Novo Laboratories, Inc., Wilton, CT)
is obtained by fermentation of Bacillus subtilis. The enzyme solution was
diluted by one to ten in the same manner as Alcalase 2.4L to reduce the
viscosity.
Analyses
Kjeldahl nitrogen assay
Nitrogen content was measured by the Kjeldahl assay. The amount of
protein in the corn gluten meal samples was obtained by multiplying the
nitrogen content by the Kjeldahl conversion factor (6.25) for corn gluten
proteins (Adler-Nissen, 1985).
Approximately 0.1 g of protein was digested, distilled (Labconco
Micro Digestion unit and Micro Kjeldahl unit, Fisher Scientific Co.,
Itasca, IL), and titrated according to the AOAC method (1970).
All analyses were performed in duplicate. The accuracy of the method
was checked using ammonium sulfate standards (Ma and Zuazaga, 1942).

39
Biuret protein assay
The soluble protein content was determined by the biuret method
(Doumas, 1975). The assay uses the absorbance of a complex formed between
the peptide bonds and copper ions in the biuret reagent. The absorbance
of the samples was measured at 540 nm. Standard solutions of bovine serum
albumin (Sigma Chemical Co., St. Louis, MO) were used to generate a
standard curve. Protein samples were analyzed in a 1 to 40 mg/m1 protein
range.
Trichloroacetic acid precipitation
Addition of 5 m1 of 2.4N trichloroacetic acid (TCA) was added to
10 ml of protein solution and mixed on a vortex mixer, resulting in the
precipitation of proteins and higher molecular weight peptides (A1der
Nissen, 1985). After centrifugation (2.7 x 10³ g for 30 minutes), the
concentration of soluble smaller molecular weight peptides was determined
by the biuret assay (Doumas, 1975).
Viscosity
The viscosity of the corn gluten slurry after hydrolysis was measured
with a Haake RV-12 viscometer (Haake Inc., Saddle Brook, NJ). The
viscometer was set to increase the shear rate from 0 to 1200 sec-lover a
three minute period.
Sieve analysis
A 30 g sample was placed in the top sieve in a series of six 8" sieves
and bottom pan (U.S. Standard Testing Sieves A.S.T.M. Ell Spec, W.S. Tyler
Inc., OR) and shaken in a sieve shaker for 30 minutes (Willis, 1981).

40
The weight of each sieve and the pan was recorded before and after
shaking to obtain the size distribution. Less than 5% of the sample should
be in the top sieve and the pan for a good size distribution (Willis, 1981).
B.E.T. surface analysis
B.E.T. analysis was used to determine the total surface area of
approximately 1 g of corn gluten meal (Accusorb 2100E physical adsorption
analyzer, Micromeritics, Norcross, GA) at a saturation temperature of
77.5K.
Krypton gas was used as the adsorbate. B.E.T. analysis relates the
volume of adsorbate removed on 'adsorption to the surface area of the
sample onto which adsorption occurs (McClellan and Hamsberger, 1967).
Experimental Procedure
Three areas of experimental work were implemented to study the
enzymatic hydrolysis of corn gluten meal. Screening runs were performed
to find the enzyme which resulted in the highest yield. This was followed
by determination of the pH and temperature that gave a good rate of
reaction as well as stable conditions for the enzyme. The effect of size
reduction on the hydrolysis of the corn gluten over a range of enzyme
concentrations was ascertained. Finally, a series of experiments was
conducted to study the degree of hydrolysis and soluble protein with time.
This data was used to develop a kinetic model for the hydrolysis.
Screening experiments
The four enzymes, p4032 protease, trypsin (T8128), Alcalase 2.4L, and
Neutrase 0.5L, were used to hydrolyze corn gluten meal. Literature values

41
(shown in Table 2) for the temperature and pH were used. The effects
of pH and temperature on the hydrolysis were studied using Alcalase 2.4L.
Enzyme screening runs The screening experiments were conducted
with a 500 g charge of 8% weight protein slurry in a 825 ml baffled
reactor. The original pH of the corn gluten meal slurry was between 4.3
and 4.6. The speed of agitation was adjusted to 450 rpm (Stir-pak
stirrer, Cole Palmer Instrument Co., Chicago, IL), and the slurry was
allowed to reach the correct temperature (Immersion Circulator Model 73,
Fisher Scientific Co., Itasca, IL), after which the pH was adjusted to 7,
8, or 9, depending on the optimum pH of the particular enzyme shown in
Table 2. The amount of enzyme used in all cases (after Ganchev and
Ivanov, 1969a) was 0.1% weight of the substrate protein. The relative
activities could not be compared, because the enzymes were standardized
in different activity units.
The pH dropped during the course of the hydrolysis due to cleavage.
At fifteen minute intervals, the pH was brought to the initial value
manually using standardized sodium hydroxide.
After four hours of hydrolysis a 50 ml sample was taken. The
hydrolysis was stopped by lowering the pH to 4.2 using concentrated
hydrochloric acid. The sample was centrifuged (Sorva1l RC-5 refrigerated
centrifuge, Du Pont Co., Wilmington, DE) at 27 x 103 g for 30 minutes. The
resulting supernatant was analyzed for protein content using the biuret
assay (Doumas, 1975). The degree of hydrolysis was calculated from the
consumption of sodium hydroxide during the course of the reaction (after
Adler-Nissen, 1985).

Tab
le 2
. L
itera
ture
val
ues
of
opti
mum
pH
an
d te
mp
erat
ure
fo
r d
iffe
ren
t p
rote
ase
s (G
od
frey
and
R
eic
helt
, 19
83)
Enz
yme
pH
Tem
per
atu
re
P40
32
pro
tease
(f
rom
Asp
. o
ryza
e)
7 5
0°c
Pan
cre
ati
c
try
psi
n
8 45
°C
Alc
alas
e 2
.4L
9
SO°C
Neu
tras
e O
.SL
9
SO°C
.,. N

43
Choice of reaction conditions These experiments were devised
to determine the most favorable pH, temperature, and concentration range
for Alcalase 2.4L.
The enzyme dosage was studied using an 800 g (775 ml) charge of corn
gluten slurry in the same baffled reactor. The reactor contents were
allowed to reach a temperature of 50°C, then the pH stat meter (Computer
Aided Titrimeter (CAT system), Fisher Scientific Co., Itasca, IL) was
started and the pH raised to 9. The reactor and pH stat configuration
are shown in Figure 4. The first aliquot, 0.05 Au/L (0.02 giL) was added
with a Pipetman pipette (Rainin Instrument Co., Woburn, MA).
Sodium hydroxide consumption was monitored with time. After 15
minutes, the base addition rate was linear and a second equal aliquot of
Alcalase was added. This procedure was repeated for a total of four
aliquots of enzyme. The total hydrolysis time was one hour. The three
experiments shown in Table 3 were performed until a range of enzyme
concentrations between 0.05 Au/L (0.02 giL) and 0.875 Au/L (0.35 giL) had
been studied. The rate of hydrolysis was calculated at each enzyme
concentration, from which the most favorable range of enzyme concentra
tion was determined.
The effect of temperature and pH at an intermediate concentration of
Alcalase 2.4L (0.375 AU/L) were examined in the same manner--by examining
a region of constant rate of hydrolysis. The pH and temperature values
studied are shown in Table 4.

44

Fig
ure
4
. R
eact
or
and
pH
sta
t co
nfi
gu
rati
on
use
d in
p
rote
in h
yd
roly
sis
ex
peri
men
ts.
The
re
acto
r w
as
sup
po
rted
fr
om
ben
eath
. A
sti
rrin
g m
oto
r w
ith
vari
ab
le
spee
d w
as
use
d

• ,~
Resi
stan
ce
The
rmom
eter
r---
----
--------~
r----------------
---.
S
tirr
er
r -
--
-• I I I
I I
I ,
1-I
r
~~ I--
1-1-
-A
uto
-b
ure
tte
.... ~
i I"
....
.----
--
I I I I I -•
Tit
rati
on
C
on
tro
ller
Rec
ord
er
.j::'
\J1

Tab
le
3.
~creening
run
s p
erfo
rmed
to
in
vest
igate
th
e eff
ect
of
Alc
alas
e 2
.4L
do
sag
e (0
.05
AU
/L
-(0
.87
5
AU
/L)
on
the
rate
of
hy
dro
lysi
s
Enz
yme
do
sag
e (A
u/L
) R
un
1 R
un
2 R
un
3
0.0
5
0.2
5
0.5
0.1
0
.30
0
.62
5
0.1
5
0.3
5
0.7
5
0.2
0
.4
0.8
75
Tab
le 4
. In
vest
igati
on
of
pH
and
tem
per
atu
re a
t an
A
lcal
ase
2.4
L c
on
cen
trati
on
of
0.3
75
AU
/L.
X d
eno
tes
par
amet
er i
nv
est
igate
d
pH
Tem
per
atu
re
(OC
) 40
50
60
9 X
X
X
10
X
11
X
~
0'\

47
Design experiments
Design experiments were carried out at pH 9 and 50°C in the concentra
tion range 0.375 AU/L (0.15 gil) and 0.75 AU/L (0.31 gIL) Alcalase 2.4L.
To gain an insight into the effect of size reduction on the rate of
hydrolysis, experiments were performed using the above conditions with
and without size reduction.
The dry corn gluten meal was pulverized using a rotating hammer mill
(Micro Switch, Freeport, IL). The corn gluten meal was passed through the
grinder three times to ensure a narrow size distribution. A sieve
analysis (U.S. Standard Testing Sieves, A.S.T.M. Ell Spec, W.S. Tyler
Inc., OH) was performed on 30 g of unground and 30 g of ground sample.
The sieve sizes used for the unground samples were between 1400 ~m (12
mesh) and 45 ~m (350 mesh), whereas for the ground sample, the size range
was between 1180 ~m (14 mesh) and 38 ~m (400 mesh).
All the design runs were based on an 800 g charge to the reactor,
containing 8% protein by weight. The corn gluten slurry was agitated
at 450 rpm for one hour at pH 9 and 50°C to allow for the limited
dissolution of the corn gluten meal without the action of the enzyme.
After 1 hour the base consumption was typically 30-50% of that after
enzyme addition. The enzymatic hydrolysis followed, beginning with taking
a 15 m1 sample and adding the required amount of enzyme. The titrator
was zeroed at this point.
The hydrolysis time was four hours, during vThich 15 m1 samples were
taken at two and four hours. Concentrated hydrochloric acid (0.15 ml) was
added to the samples to deactivate the enzyme.

48
The samples were centrifuged (27 x 103 g for 30 minutes) and the
supernatants were analyzed for protein content by the Kjeldahl (AOAC, 1970)
and biuret assays (Doumas, 1975). At the end of the hydrolysis, an extra
sample was taken and the viscosity determined.
Modelling experiments
In order to understand the mechanism of the corn gluten meal
hydrolysis, a series of modelling experiments was performed. To do this,
the soluble protein and the degree of hydrolysis were followed with time.
The range of enzyme concentrations studied was 0.375 AU/L (0.15 g/L) to
0.75 AU/L (0.31 giL) at pH 9 and 50°C.
The experimental procedure was the same as for the design runs,
except for sampling and analysis. Ten m1 samples were taken every 10
minutes for the first hour, every 15 minutes for the second hour, and
every 30 minutes for the remaining two hours of the four hour hydrolysis.
The enzyme was deactivated by placing the sample in a water bath at 90°C
for 15 minutes.
At four hours, sampling was stopped and a second aliquot of Alcalase
2.4L was added. The hydrolysis was continued for another hour. The
consumption of sodium hydroxide was observed after the addition of the
second aliquot of enzyme. This simple procedure tests for the possibility
of limited hydrolysis due to the presence of insufficient enzyme to
saturate the substrate. The samples were centrifuged and the supernatants
were assayed for soluble protein. Precipitation with trichloroacetic acid
(TCA) was then carried out on the supernatants. After addition of TCA,
the samples were centrifuged at 27 x 103 g for 30 minutes. The

49
supernatants were analyzed for soluble protein. TCA precipitates all but
the low molecular weight peptides. The degree of hydrolysis was calculated
from the values of base consumption.
Model Development
The kinetic models considered were all based on three compartments.
I represents insoluble corn gluten remaining during the course of
hydrolysis. The compartments Sand P both represent soluble material.
S is a group of high molecular weight protein/peptides, precipitated by
trichloroacetic acid (TCA), and P is a group of low molecular weight
peptides, not precipitated by TCA.
The three compartments and the rates connected with them are shown
in Figure 5. The rate expressions r I and rS may be written as
dI deS + P) rr = - -=
dt dt
dS dP rS = - -=
dt dt
Various kinetic expressions for both rr and rS were tested in
different combinations with each other, as shown in Table 5.
(24)
(25)
The linear/linear model was used as the basic starting point for a
compartmental model. The Michaelis-Menten approach was the next
progression from the linear model. Both an insoluble substrate (I) and
a soluble substrate (S) were involved in this model. The estimation of
four constants kI' kS' KmI , anJ KmS resulted.
Product inhibition was evident when soybean protein and lean meat
protein were enzymatically hydrolyzed, as mentioned earlier (Enzymatic

50

Fig
ure
5.
Illu
str
ati
on
of
dif
fere
nt
com
par
tmen
ts u
sed
in
th
e k
ineti
c m
od
elli
ng
of
the h
yd
roly
sis

51
- -~
a..
L .J ~
QJ
~ ~V'I
N c:: QJ
+ I -
(/)
lI-t.
QJ E :>.. N
~-c:: QJ
+
..,
-I~ -

Tab
le 5
. K
ineti
c
exp
ress
ion
s u
sed
to
mod
el
the
rate
s o
f r I
and
rS'
++
den
ote
s th
e c
om
bin
atio
n o
f
r I an
d rS
was
st
ud
ied
Mod
el
Lin
ear/
lin
ear
Mic
hae
lis-
Men
ten
/ M
ich
aeli
s-M
ente
n
Inso
lub
le s
ub
stra
te
Fre
un
dli
ch a
dso
rpti
on
/ li
near
Sim
pli
fied
pro
du
ct
inh
ibit
ion
/pro
du
ct
inh
ibit
ion
Inso
lub
le s
ub
stra
te
rI
kIe
O(I
-IE
)
kIe
O(I
-
IE)
1 +
(I/
Kni
r) +
(S!
K- ni
s)
kr(
eO
(I -
IE»
2/3
kIe
O(I
-
IE)
1 +
(P
/Km
p)
So
lub
le s
ub
stra
te
rS
~
kSeO
S
~
kSeO
S
1 +
(I/
K-r
or)
+ (
SIK
- ms)
~
kseO
S
~
kSeO
S 1
+ (
P/K
mp)
I.Jl
N

53
Hydrolysis section of Literature Review). It was therefore studied in a
model for the hydrolysis of corn gluten meal.
The idea of limited surface sites for enzyme binding (with an excess
of enzyme in solution) was used to describe the corn gluten hydrolysis.
The adsorption of the enzyme was described by the Freundlich adsorption
isotherm, followed by subsequent hydrolysis. The assumption was made that
the relative amount of enzyme bound to the substrate was small compared
with the free enzyme in solution (McLaren, 1963).
The constants in each compartmental model were evaluated by finding
the values giving the least squares fit to the experimental data of
I, (S + P), and P versus time. Minimization was done using the non-linear
iterative technique of Levenburg-Marquardt (I.M.S.L., 1987). The rate
equations were integrated using the Gear method of numerical integration
(I.M.S.L., 1987). Calculated values of soluble and insoluble protein
were compared with the experimental values by way of the parameters
estimated from each compartmental model.
The possibility of two simultaneous reactions was also investigated,
where one reaction would be a fast first-order reaction and the second
a slow first order reaction. The kinetic expressions for two simultaneous
reactions would be the linear expressions for rI
and rS shown in Table 5.
A plot of log(rate) versus time was made as discussed earlier (Kinetic
Models section of Literature Review) (after Mihalyi and Godfrey, 1962).
The rate of hydrolysis (dh/dt) was obtained from the pH stat values of
base consumption with time. The number of peptide bonds cleaved (h) was
obtained using equation (5). These values were first smoothed, and then

54
the rate (dh/dt) was calculated using Lagrange's forward, central, and
backward difference formulas for equally spaced points (Perry and Chilton,
1973). If two simultaneous reactions do occur, one fast and one slow,
the plot should resemble Figure 2.

55
RESULTS AND DISCUSSION
Evaluation of Experimental Conditions (Screening Experiments)
Comparison of enzymes
The degree of hydrolysis and the concentration of soluble protein
obtained, for each enzyme studied, is shown in Table 6. Trypsin
produced the highest yields using the same concentration (0.08 giL) for
each enzyme. For a higher concentration of Alcalase 2.4L (0.19 giL), the
amount of soluble protein was greater than for trypsin, with a lower
degree of hydrolysis.
The main objectives of the hydrolysis were to obtain as high a
concentration of soluble protein as possible. At the same time, too
high a degree of hydrolysis should be avoided, due to the formation of
bitter flavors (Olsen and Adler-Nissen, 1979a). The ratio of the protein
concentration to the degree of hydrolysis should therefore be as large
as possible. These ratios, shown in Table 6, indicate that Alcalase 2.4L
would be more suited towards the objectives of the hydrolysis than would
trypsin.
Enzymes normally are compared on the basis of their activity units.
However, of all the enzymes used, only Alcalase 2.4L and Neutrase 0.5L
were defined in the same activity units. Table 6 shows the protein
concentration and the degree of hydrolysis for corresponding activities
of Alcalase 2.4L (0.02 giL) and Neutrase 0.5L (0.08 giL). Alcalase 2.4L
gave slightly better yields than Neutrase 0.5L. At higher enzyme
concentrations, according to the literature (Godfrey and Reichelt, 1983),
even higher yields were obtained with Alcalase 2.4L compared to

Tab
le 6
. C
ompa
riso
n o
f th
e d
egre
e o
f h
yd
roly
sis
and
the s
olu
ble
pro
tein
co
ncen
trati
on
ob
tain
ed b
y
the
pro
tease
s P4
032
pro
tease
, tr
yp
sin
(T8l28)~
Alc
alas
e 2.4L~
and
Neu
tras
e 0
.5L
Pro
tease
P403
2 P
rote
ase
Try
psi
n
(T81
28)
A1
cala
se
2.4
L
Neu
tras
e 0
.5L
Enz
yme
co
ncen
trati
on
[g
iL]
O.O
B
0.0
8
O.O
Ba
0.0
8
0.1
9
O.O
Ba
Deg
ree
of
hy
dro
lysi
s (%
)
4.1
9
10
.5
4.4
5.4
6
B.l
O
3.0
4
So
lub
le
Rat
io
pro
tein
co
ncen
trati
on
E
rote
in c
on
cen
trati
on
[m
g/m
L]
deg
ree
of
hy
dro
lysi
s
6.9
7
1.6
6
18
.10
1
. 72
8.6
2
1.9
6
11
.94
2
.19
21
.68
2
.68
7.4
3
2.4
4
aCo
nce
ntr
atio
ns
hav
e co
mp
arab
le a
cti
vit
ies.
Alc
alas
e 2
.4L
has
an
acti
vit
y o
f 2
.4 A
nson
u
nit
s/g
an
d N
eutr
ase
0.5
L,
0.5
A
nson
u
nit
s/g
.
VI
0-

57
Neutrase 0.5L. On this basis, Alcalase 2.4L was chosen to study other
experimental parameters affecting the hydrolysis.
Effect of enzyme dosage
The solid lines in Figure 6 show the effect of enzyme dosage on the
rate of hydrolysis. The rate of hydrolysis not only increased with
enzyme dosage, but also with time. Corresponding time points in Figure 6
are joined by dotted lines. The rates of hydrolysis were corrected by
subtracting the control values (no enzyme) for the same time period. In
general, the rate of hydrolysis was greater at enzyme concentrations of
0.25 Anson units per liter (AU/L) and above. At lower enzyme concentra
tions (0.05 AU/L - 0.2 AU/L) , the rate of hydrolysis was slow and showed
no detectable increase with increasing enzyme concentration.
At the higher concentrations (0.5 Au/L - 0.875 AU/L) , the rate of
hydrolysis still increased after the addition of each aliquot of enzyme.
The fact the rate still increased with enzyme dosage illustrated that the
reaction wasn't substrate limited.
At the low enzyme concentrations (0.05 Au/L - 0.2 Au/L) , the rate
of hydrolysis (corrected for the control) was 0.15%/hr at 0.05 Au/L
(0 to 15 minutes) and increased to 0.3%/hr at 0.2 AU/L (45 to 60 minutes).
The enzyme at these low concentrations does not cause a significant
increase in the rate of hydrolysis compared with the control (no enzyme).
The control resulted in an "apparent" rate of hydrolysis \vhich was
0.63%/hr (0 to 15 minu~es) falling to 0.25%/hr (45 to 60 minutes).
The main objective of the screening runs was to verify that the
enzyme concentrations recommended in the literature were reasonable for

58

Figure 6. Effect of enzyme concentration in Anson units per liter (AU/L) on the rate of hydrolysis in %/hr. -- connects points from the same experiment over time. Broken lines correct for possible increased accessibility by connecting data points obtained at the same time of hydrolysis in each experiment. Rates are corrected using control rates (no enzyme) over the same time period

ID C'j
0
'0:: I C'j
::c ~~ ~C\1
rn -rnO ~N 0 O::ID O· ~ ..... ::c ~~ 0 ..... Cil
~~ 0:: 0
0 0
0.0
I
I
59
---I - __
I ~~~
/
, ,
, " ,
/ /
/ , , o 0-15 MIN
• 15-30 MIN
o 30-45 MIN
• 45-60 MIN
0.1 0.2 0.3 0.4 0.5 0.6 0.7 0.8 0.9
ENZYME CONCENTRATION [AU/L]

60
the hydrolysis. At the highest enzyme concentrations (0.5 AU/L -
0.875 AU/L) , the hydrolysis should be controlled to avoid bitter flavors
(Adler-Nissen, 1985). At the lower concentrations (0.05 AU/L - 0.2 AU/L) ,
it is likely that the functional properties of the hydrolysate weren't
sufficiently modified. A typical range of enzyme concentrations used
in the literature was 0.12 AU/L to 0.48 AU/L Alcalase 0.6L, in overall
agreement with the experimental results.
Effect of pH
Table 7 shows the average rate of hydrolysis for consecutive changes in
pH during the same experiment. The rate of hydrolysis increased by three
times when the pH was subsequently increased from pH 9 to pH 10. However,
later results (see Figure 9) showed that the rate at this enzyme concentra
tion (0.375 AU/L) would also have doubled over a similar time period if
the pH had been maintained at pH 9. On this baSiS, the increase in the
average rate of hydrolysis which can be attributed to the change in the
pH from 9 to 10 was 0.8l%/hr.
Table 8 shows the degree of hydrolysis and the soluble protein
concentration at pH 9 and 10 after two hours of hydrolysis. The ratio of
protein concentration to the degree of hydrolysis was consistently larger
at pH 9. As mentioned earlier, provided the yield of soluble protein is
acceptable, this ratio should be as large as possible. Another
advantage of working at pH 9 is that the enzyme is stable (Table 7),
while at pH 10, measurable inactivation of the enzyme occurs. In view of
the experimental results and the values recommended in the literature,
pH 9 was taken to be the "standard" pH for further hydrolyses.

Tab
le
7.
Ex
per
imen
tal
resu
lts
show
ing
the
eff
ect
of
pH
on th
e a
ver
age
rate
of
hy
dro
lysi
s in
%/h
r.
a b c d e
Ave
rage
ra
tes
of
hy
dro
lysi
s w
ere
calc
ula
ted
aft
er
con
secu
tiv
e ch
ang
es in
pH
d
uri
ng
one
ex
per
imen
t.
Lit
era
ture
val
ues
o
f ho
w
the
% r
ela
tiv
e a
cti
vit
y o
f th
e e
nzym
e v
ari
es
wit
h p
H
pH 9 10
11
Ave
rage
a
rate
of
hy
dro
lysi
s (%
/hr)
0.9
6c
2.7
3d
1.6
3e
Enz
yme
co
ncen
trati
on
was
0
.37
5
AU
/L.
Acti
vit
y m
easu
red
aft
er
one
ho
ur'
s h
yd
roly
sis
%
b re
lati
ve a
cti
vit
y
100 95
85
(Nov
o,
19
84
a).
Rat
e m
easu
red
ov
er a
li
near
per
iod
bet
wee
n 6
5 m
inu
tes
and
80 m
inu
tes.
Rat
e m
easu
red
ov
er a
li
near
per
iod
bet
wee
n 9
0 m
inu
tes
and
120
min
ute
s.
Rat
e m
easu
red
ov
er a
li
near
per
iod
bet
wee
n 1
30 a
nd
160
min
ute
s.
0\
f-'

Tab
le 8
. E
ffect
of
pH
on
the
rate
of
hy
dro
lysi
s an
d th
e so
lub
le p
rote
in c
on
cen
trati
on
at
thre
e
lev
els
o
f A
lcal
ase
do
sag
e (0
.37
5 A
nson
/L,
0.5
Ans
on/L
, an
d 0
.75
An
son
/L).
H
yd
roly
sis
tim
e:
2 h
ou
rs at
50°C
Enz
yme
pH
Deg
ree
of
So
lub
le p
rote
in
Rat
io
co
ncen
trati
on
h
yd
roly
sis
co
ncen
trati
on
p
rote
in c
on
cen
trati
on
(A
u/L
) (%
) (m
g/m
L)
deg
ree
of
hy
dro
lysi
s
0.3
75
9
2.3
9
9.9
6
4.1
7
0.3
75
10
2
.50
9
.47
3
.79
0.5
0
9 3
.23
1
3.0
6
4.0
4
a-
N
0.5
0
10
3.5
2
11
.87
3
.37
0.6
25
9
4.5
7
17
.88
3
.91
0.6
25
10
4
.89
1
8.1
7
3.7
1

63
Effect of temperature
The effect of temperature on the rate of hydrolysis is shown in
Table 9. There was a gradual increase in the rate of hydrolysis with
increasing temperature, but the effect of time must also be taken into
consideration. The rate of hydrolysis at 50°C and 60°C was measured over
a 30 minute period. Later results (see Figure 9) showed that the rate
at this enzyme concentration increased if the temperature remained at
50°C. The effect of temperature on the rate of hydrolysis was therefore
assumed to be negligible.
Table 9 also shows literature values for the percentage residual
and percentage relative activities of Alcalase at different temperatures
(Novo, 1984a). A temperature of 50°C was used in all further hydrolyses.
Hydrolysis Effects in Combination with Size Reduction (Design Experiments)
The rate of hydrolysis and the percentage of soluble protein
increased with increasing enzyme concentration, reflected in Figures 7
and 8, respectively. For all enzyme concentrations, the rate of hydrolysis
(shown in Figure 9) accelerated, followed by a decline during
the later period of the hydrolysis. At the lowest enzyme concentration
(0.375 AU/L) , the rate of hydrolysis proceeded more slowly than the
higher enzyme concentrations. The initial acceleration therefore occurred
later in the hydrolysis, and consequently so did the decline in the rate.
Initially the most accessible bonds would be cleaved, and as a result of
these cleavages further accessible bonds would be exposed. It is this
process that caused the acceleration in the rate of hydrolysis. The

Tab
le
9.
Ex
per
imen
tal
resu
lts
show
ing
the e
ffect
of
tem
per
atu
re in
deg
rees
C
elsi
us
on
the a
ver
age
rate
of
hy
dro
lysi
s (%
/hr)
. A
vera
ge ra
tes
of
hy
dro
lysi
s w
ere
calc
ula
ted
aft
er
con
secu
tiv
e ch
ang
es
in p
H
du
rin
g o
ne e
xp
erim
ent.
L
itera
ture
val
ues
o
f ho
w
the
% r
esi
du
al
and
rela
tiv
e a
cti
vit
y o
f th
e e
nzym
e v
ary
wit
h
tem
per
atu
re
a b c d e
Tem
per
atu
re
(OC
)
40
50
60
Ave
rage
a
rate
of
hy
dro
lysi
s (%
/hr)
0.8
3c
1.0
5d
1.2
4e
Enz
yme
co
ncen
trati
on
was
0
.37
5 A
U/L
.
% R
esid
ual
b
acti
vit
y
100
100
"'70
Acti
vit
y m
easu
red
ov
er o
ne h
ou
r's
hy
dro
lysi
s (N
ovo,
1
98
4a)
.
Rat
e m
easu
red
ov
er a
li
near
per
iod
bet
wee
n 0
and
15
min
ute
s.
Rat
e m
easu
red
o
ver
a
lin
ear
per
iod
bet
wee
n 4
5 an
d 75
m
inu
tes.
Rat
e m
easu
red
ov
er a
li
near
per
iod
bet
wee
n 1
05
and
135
min
ute
s.
% R
ela
tiv
e
b acti
vit
y
50
78
100
(J\
.p..

65

Figure 7. Variation with enzyme concentration (AU/L) of % degree of hydrolysis after 2 and 4 hours of hydrolysis. Error bars represent high and low values of two observations. Reaction conditions: pH 9, 50°C

66

67

Figure 8. Variation with enzyme concentration (AU/L) of soluble protein (mg protein/ml) after 2 and 4 hours of hydrolysis. Error bars represent high and low values of two observations. Reaction conditions: pH 9, 50°C

0 It) C'j
0 0 C'j
', .... :)' ::g~
&~ ,::gao ZO ON -~~ o::~ E-t Zo ~. U O Z-0 Uo
It)
0 0
0.3
68
T T~· ____ • 1
· t T/ _____ ·--i • • 1 1
T • .L
• 2 HOURS
• 4 HOURS
0.4 0.5 0.6 0.7 0.8 0.9 ENZYME CONCENTRATION [AU/L]

69

Figure 9. Variation in the rate of hydrolysis (mequiv/g/min) with time (min) at three levels of enzyme concentration (AU/L). Smoothed values of h were used to calculate the rate -dh/dt. Reaction conditions: pH 9, SO°C

70
o ~ ~--------------------------------------------~
o 0.375 AU/L
• 0.500 AU/L
• 0.625 AU/L
• .. / .-.
o o L-______ ~ ________ ~ ________ ~ ________ ~ ______ ~
0.0 50.0 100.0 150.0 200.0 250.0
TIME [MIN]

71
lower the concentration of enzyme, the longer it takes to reach the same
extent of cleavage at higher enzyme concentrations.
The eventual decline could be attributed to either product inhibition,
a reduction in the soluble pool, or a reduction in susceptible bonds.
Further experimentation would be required to ascertain which of the above
is actually occurring.
The size of unground corn gluten meal was found to be mostly (74.56%)
between 355 ~m (44 mesh) and 180 ~m (85 mesh). Pulverizing the corn gluten
reduced 84.59% of the sample to a size between 75 ~m (200 mesh) and
38 ~m (400 mesh). There was an average error of ±O.6% associated with the
degree of hydrolysis in Figure 7. The difference in the degree of
hydrolysis between non-reduced and size reduced corn (Figure 10) was not
significant, according to a t test at the 90% level. Similar conclusions
can be made using the error introduced in the values of soluble protein
concentration (Figure 8). The differences in the soluble protein between
non-reduced and size reduced corn (Figure 11) were not significant
at the 90% level (t test). On the basis of the experimental error, size
reduction appeared to have no effect on the rate of hydrolysis--the
number of available surface sites did not limit the rate of reaction.
If the corn gluten meal has a very high internal surface area, the
effect of size reduction would be negligible. B .E. T. analysis ,-;as used
to find the total surface area of the samples. The theoretical surface
area was calculated by assuming that the corn gluten meal consists of
spheres (no internal surface area) in the size range measured. The
actual measured surface area compared to these theoretical values

72

Figure 10. Difference between the degree of hydrolysis for non-reduced (NR) and size reduced (SR) corn gluten meal (NR-SR) versus enzyme concentration (Au/L). 90% confidence interval is shown. Reaction conditions: pH 9, 50°C

<l
73
10 N ~--------------------------------------~
10 -
10 o I
• • 2 HOURS
• 4 HOURS
90% LEVEL -----er-----------
• ~i
• 90% LEVEL
------ ------------------------------------------• ~ L-____ ~ ______ ~ ____ ~ ______ ~ ____ ~ ____ ~
I 0.3 0.4 0.5 0.6 0.7 0.8 0.9
ENZYME CONCENTRATION [AU/LJ

74

Figure 11. Difference between the amount of soluble protein for nonreduced (NR) and size reduced (SR) corn gluten meal (NR-SR) versus enzyme concentration (AU/L). 90% confidence interval is shown. Reaction conditions: pH 9, 50°C

'.....:l' :::g 0-,:::g ,
o U')
z~ 0 0 -~ 0:: EZ ~o u· zU')
01
U
<]
o o
75
~. • 90% LEVEL
• • 2 HOURS
/ • 4 HOURS
• - ~----~----~------~----~------~----~ 1 0.3 0.4 0.5 0.6 0.7 0.8 0.9
ENZYME CONCENTRATION [AU/LJ

76
indicated that the corn gluten meal has very little internal surface area
(shown in Table 10). The internal surface area for unground and ground
corn gluten was calculated as the difference between the actual and
theoretical surface areas in Table 10. The internal surface area for the
2 ground sample was found to be 0.078 m /g greater than the unground
sample.
The measurement of total surface area depended on the diffusivity
of krypton gas into the pores of the corn gluten. The rate of hydrolysis
depends on the diffusion of the enzyme to the surface of the corn gluten.
Since Alcalase has a large molecular weight (approximately 27300), the
internal surface area available to the enzyme will likely be less than
that measured.
A substantial amount of heat was generated during size reduction.
The possibility of high temperatures modifying the physical properties
of the corn gluten should not be ruled out.
The viscosity of the corn gluten slurry during the course of the
hydrolysis did not increase to the extent reported in the literature
(Adler-Nissen, 1978a). The viscosity of the hydrolysates was found to
be around 13 cPo The original viscosity of the slurry could not be
measured easily because the corn gluten meal quickly settled out. The
viscosity of the slurry using Einstein's equation (Rosen, 1981) was 1.9 cPo
Adler-Nissen (1978a) reported hydrolysate viscosities using corn gluten
meal of 50-150 cPo These results were obtained, however, using a different
source of corn gluten meal; they were also observed using corn gluten from

Tab
le 1
0.
Act
ual
su
rface a
rea o
f g
rou
nd
an
d u
ng
rou
nd
co
rn g
lute
n m
eal
(CG
M)
com
pare
d to
th
e
theo
reti
cal
surf
ace a
rea b
ased
on
perf
ect
sph
eres
un
gro
un
d
CGM
(3
55-1
80
llm
)
gro
un
d
CGM
(7
5-38
ll
m)
Th
eo
reti
cal
surf
ace a
rea
2 (m
/g
)
0.0
63
0.3
1
Act
ual
su
rface a
rea
2 (m
/g
)
0.1
06
9
0.4
32
Rat
io
actu
al
S.A
. th
eo
reti
cal
S.A
.
1. 7
0
1.3
9
'-J
'-J

78
only one source. It is likely that different observations will be made
with corn gluten meal from different sources.
Time Course of Hydrolysis
Initially only insoluble protein was present so most of the initial
hydrolysis would be in the insoluble phase, producing soluble proteins
and high molecular weight peptides (S). At this point, the rate of
hydrolysis of I (r I ) is greater than that of S (rS
) which results in an
overall increase in S. The concentrations of pools Sand P for the course
of the hydrolysis are shown in Figure 12 for low (0.375 AU/L) and high
(0.625 AU/L) enzyme concentrations. The increased enzyme concentration
results in a decrease in I or an increase in the total soluble protein
concentration (S + P) of between 10 and 20%. Throughout most of the
decrease shows up in pool P. This implies that the additional enzyme
preferentially hydrolyses soluble protein.
After four hours' hydrolysis, the enzyme concentration was doubled
by adding a second aliquot of enzyme, but the reaction rate did not
double. Alcalase 2.4L is stable at the reaction conditions used (Novo
Technical Service Representative, 1987) and the insoluble substrate
concentration after four hours' hydrolysis was at least 63 mg protein/mL.
The observed rates (Table 11) must have been lower than expected due to
either product inhibition or depletion of the susceptible bonds. The
lower the enzyme concentration, the lower the extent of hydrolysis at
four hours (Figure 9). Product concentration and reduction in
susceptible bonds are less important at low enzyme concentrations and
consequently rate does increase with addition of more enzyme.

79

Figure 12. Experimental values of protein concentration (mg protein/ ml) with time (min). • denotes low enzyme concentration (0.375 AU/L) and • denotes high enzyme concentration (0.625 AU/L)

80
0 0 co
• : : • I ', .... i • • • • ::go 0-0 ::E co
l.......,;,J
Z 0 ....... 0
~o O:::~ ~ Z
P Cil U o z· o~ U •
• S .. 0 0
0.0 50.0 100.0 150.0 200.0 250.0
TIME [MIN]

Tab
le 1
1.
Com
pari
son
of
the i
nit
ial
rate
of
hy
dro
lysi
s (%
/hr)
a w
ith
th
e ra
te o
f h
yd
roly
sis
aft
er
fou
r h
ou
rs w
ith
th
e a
dd
itio
n o
f a
seco
nd
eq
ual
ali
qu
ot
of
enzy
me
a
Enz
yme
co
ncen
trati
on
(A
U/L
)
0.3
75
0.5
0
0.6
25
0.7
50
Init
ial
rate
o
f h
yd
roly
sis
(fir
st
ali
qu
ot)
(%
/hr)
0.7
4
1.4
5
2.5
7
2.5
4
Rat
e o
f h
yd
roly
sis
Rat
io
aft
er
ad
dit
ion
of
seco
nd
eq
ual
ali
qu
ot
rate
2n
d ali
gu
ot
(%/h
r)
rate
1st
ali
qu
ot
2.0
0
2.7
0
1. 7
9 1
.23
2.5
0
0.9
7
2.4
8
0.9
8
Rat
es
of
hy
dro
lysi
s are
av
erag
e ra
tes
mea
sure
d o
ver
a
60
min
ute
peri
od
.
CD
t-'

82
Experimental results (Figure 12) show that towards the end of the
hydrolysis, the rate r I was approaching zero. There was, however, a
great deal of insoluble substrate remaining (at least 63 mg protein/mL),
which suggests that there is a limit to the extent of hydrolysis and
that the remainder tends to be a hydrolysis resistant core. An estimation
of this solubility limit was made for corn gluten meal by performing an
extended run over a period of forty-eight hours. This resulted in 53.2%
(49.16 mg/mL) soluble protein. This value was represented by IE
in all the kinetic models studied. Similar conclusions concerning an
insoluble "core" have been made for other enzymatic hydrolyses, such as
the tryptic digestion of myosin (Mihalyi and Harrington, 1959).
Kinetic Models
Linear/linear model
The expressions used to describe the linear model were shown in
Table 5. The data values for pools (S + P) and P were calculated directly
from the biuret analyses (Doumas, 1975). These values
were accurate to ±O.36 mg protein/mL supernatant. The experimen-
tal values for the S pool were dependent on the values from two biuret
analyses, before and after TCA precipitation (Adler-Nissen, 1985). The
experimental error for the S values was therefore accurate to ±O.5l mg
protein/mL supernatant. The experimental values of I were calculated as
the difference between the amount of protein charged to the reactor and
the experimental values of (S + P). The residual sum of squares was
minimized using the experimental values of (S + P) and P.

83
Figures 13 and 14 show the values obtained for the linear model
(solid lines) compared to the experimental values (symbols) for low
(0.375 AU/L) and high (0.625 AU/L) enzyme concentrations. Samples were
taken more frequently during the first two hours of the hydrolysis
because the rate of hydrolysis was higher, and changes relevant to the
hydrolysis mechanism occurred mostly during this time. Consequently, the
frequency of sampling introduced a bias towards the first half of the
hydrolysis during the minimization.
Figures 13 and 14 show that the linear model was able to predict the
main trends of the experimental data. The values of the P pool fitted
well for the first half of the hydrolysis. The model tended to over
predict the values of P towards the end of the hydrolysis. This deviation
from the experimental values was also more pronounced for the higher
enzyme concentrations. The linear model lacked the ability to distinguish
if there exists bonds of different susceptibility or whether product inhibi
tion was taking place, both of which would reduce the rate at the later
stages of the hydrolysis. Pool S increased initially, then gradually
decreased. The model fitted this poorly during the first fifty minutes of
the hydrolysis. It did, however, predict the later times well. Increased
weighting of the first six residuals leads to a closer fit for the first
fifty minutes of the hydrolysis (Figure 15), but requires weighting factors
of 5-10. However, the fit to the later experimental points became poor as
a result of the improved fit at the early times.
Values for the constants kr and kS were estimated for each set of
experimental data. The average values of kr and kS were found to be

84

Figure 13. Comparison between experimental data and the linear/linear model. Experimental data are denoted by symbols: • insoluble, I, • soluble proteins/peptides, S, and o soluble peptides, P. Linear model denoted by lines. Reaction conditions: enzyme concentration 0.375 AU/L, pH 9, and 50°C

85
~ ~.--. .--.-.--.--.--.-----...!! co •
• 0
• 0
• • t"\-==-. v---:. 0 0
0.0 100.0 150.0 200.0 250.0
TIME [MIN]

86

Figure 14. Comparison between experimental data and the linear/linear model. Experimental data are denoted by symbols: • insoluble, I, • soluble proteins/peptides, S, and o soluble peptides, P. Linear model denoted by lines. Reaction conditions: enzyme concentration 0.625 AU/L, pH 9, and 50°C

z o
o o co
~o
~o ~'<:t' E-t Z CLl U o z· O~ U
87
-------~

88

Figure 15. Comparison of the weighted linear model with experimental data. Weighting is applied over the first fifty minutes of hydrolysis for 1(.), S ( • ), and P (0 ) . . .. denotes weighting factor is 1, --- weighting factor is 5, and --- weighting factor is 10. Reaction conditions: enzyme concentration 0.625 AU/L, pH 9, and 50°C

z o
o o CO
-0
~o ~'<:t' ~ Z /:£I U o z· og U
o
89
:".P-.-:-.-:-.:-.~.~O .~ .. ······0 . . -~ ....
....
• ..... ....
.... .... .... o
•
o
~---- .:.=-.-.~ •.. -:: :,,'-----------.............................•...•....•..........•..........•..........•.........•
o L-______ ~ ________ ~ ________ ~ ________ ~ ______ ~
0.0 50.0 100.0 150.0 200.0 250.0
TIME [MIN]

90
1.29 x 10⁻² (±0.18 x 10⁻²) L/g min and 4.60 x 10⁻² (±0.79 x 10⁻²) L/g min,
respectively. Figure 16 shows the normalized values k. - k.)/cr. of the ~ ~ ~
constants kI and kS' together with the 60%, 80%, and 95% confidence limits
for a small population (t distribution). The scatter of the normalized
constants (Figure 16) between the different confidence levels is typical of
experimental data following a normal distribution. There is, therefore,
no reason to disprove the hypothesis that the values are constant.
Michaelis-Menten/Michaelis-Menten model
The Michaelis-Menten model (shown in Table 5) didn't result in any
improvement over the linear model. The minimization resulted in the same
values for the constants kS and kI as were found for the linear model.
The constants KmI and KmS were found to be so large (approximately 1017
),
that their influence in the denominator became trivial. The effective
fit of the Michaelis-Menten model was the same as the linear model.
Consequently, the Michaelis-Menten model posed the same weaknesses as
discussed for the linear model.
Freundlich adsorption/linear model
This model accounted for available surface sites at which the enzyme
could bind. Experimental work has shown that the rate of hydrolysis was
not dependent on the available surface sites. The Freundlich adsorption/
linear model didn't seem to represent the mechanism any better than the
linear model. There was an increase between 10% and 20% in the residual
sum of squares over the linear model.

91
Figure 16. Normalized values of the constants kr ( .) and kS (0 )
versus enzyme concentration in AU/L. Constants are
normalized according to (k.-k.)/cr .• 60%, 80%, and 95% l. l. l.
confidence levels for a t distribution are shown

92
o ~ ~------------------------------------------~
95% LEVEL
o [j)Nt-
E--o Z 80% LEVEL
~ • 0 E--4 ~ I- • 60% LEVEL [j) - ------------------------------------~-----------Z o °0 Oof-~ N - • u
• o
• • o o ~ 0 60% LEVEL < 5 ~-------------------------------------------------~ I ____________________________________ : ___ ~~~_~Ey~~_
z ~ 0 N t-I 95% LEVEL
o ~ ~----~I------~I~----~I------_~~----~I------~ I
0.3 0.4 0.5 0.6 0.7 0.8 0.9
ENZYME CONCENTRATION [AU/L]

93
Figures 17 and 18 show the experimental values (symbols) compared
to the calculated values (lines). The weaknesses in the model were
essentially the same as those discussed for the linear model. The linear
model is therefore a better basis from which a more complex model may be
developed.
Simplified product inhibition/product inhibition model
This model was a simple progression from the linear model allowing
for the effects of product inhibition. The Michaelis-Menten model
(Table 5) showed a tendency to approach the linear model. Consequently,
the simplified product inhibition model enables product inhibition effects
to be studied without introducing too many constants. Even the addition
of a third constant increased the computation time required to find a
solution. In some cases, convergence problems were encountered even when
good initial guesses of the parameter constants were available.
The calculated P values fit the experimental values much closer
than the other models during the later stages of the hydrolysis (shown in
Figures 19 and 20). The main weakness of this model were the calculated
values of S during the first fifty minutes of the hydrolysis. When the
residual sum of squares was weighted during the early stages of the
hydrolysis, convergence could not be achieved because the problem became
stiff.
With equal weighting, different solutions could be found for the
constants k I , kS' and KmP depending on the initial guesses. When the
different solutions were compared to the parameter values kI and kS for
the linear model, it was easy to decide which solutions were reasonable.

94

Figure 17. Comparison between experimental data and the Freundlich adsorption/linear model. Experimental data are denoted by symbols: • insoluble, I, • soluble proteins/peptides, S, and 0 soluble peptides, P. Model denoted by lines. Reaction conditions: enzyme concentration 0.375 AU/L, pH 9, and 50°C

95
~ ~-.-.-.-.--.-.-.-----! co •
z go ~$ 0:: ~ Z w U o Zo ON U
0.0
• • • n O~_. __ • V--.=-. .... _---o 0
150.0 100.0 [MIN] TIME
o o
~--. --. 200.0 250.0

96

Figure 18. Comparison between experimental data and the Freundlich adsorption/linear model. Experimental data are denoted by symbols: • insoluble, I, • soluble proteins/peptides, S, and 0 soluble peptides, P. Model denoted by lines. Reaction conditions: enzyme concentration 0.625 AU/L, pH 9, and 50°C

z o
o o aJ
-0
~o ~~ ~ z C£l 0 0 Z' O~ o
97
. ----. --.~

· .. .
98
'.

Figure 19. Comparison between experimental data and the simplified product inhibition/product inhibition model. Experimental data are denoted by • insoluble, I,. soluble proteins/ pep tides , S, and 0 soluble peptides, P. Model denoted by lines. Reaction conditions: enzyme concentration 0.375 AU/L, pH 9, and 50°C

99
o o ~_ • <0 ______________________ _
• • ~-
o - -----. •
0.0 ~~~~O~~~~-~to~--200.0 ,/ 100.0 150.0 250.0
TIME [MIN]

100

Figure 20. Comparison between experimental data and the simplified product inhibition/product inhibition model. Experimental data are denoted by. insoluble, I,. soluble proteins/ peptides~ S~ and 0 soluble peptides, P. Model denoted by lines. Reaction conditions: enzyme concentration 0.625 AU/L, pH 9, and 50°C

z o
o o CO
-0
~o o::~ ~ z ~ U o z· o~ U
o
...... .• ~.-
101
.-..-.-.-.
•
--. . - -----
• .---.---. o ~ ______ ~ ________ ~ ________ -L ________ ~ ______ ~
0.0 50.0 100.0 150.0 200.0 250.0
TIME [MIN]

102
The values of kI and kS for the product inhibition should increase a little
due to the addition of the constant K P, but not by orders of magnitude. m
In some cases it was not possible to find reasonable values for the
constants k I , ks ' and KmP' even with good initial guesses. The residual
sum of squares for the "alternative solutions" was always the same or
higher than the "correct" solution. The average values for kI , kS
' and Kmp
-2 -2 from five of eight data sets were found to be 5.27 x 10 (±4.38 x 10 )
L/g min, 1.65 x 10⁻¹ (±1.43 x 10⁻¹) L/g min, and 3.79 (±2.36) mg/mL,
respectively. The constants were normalized in the same manner as the
linear model, and are shown in Figure 21. They show no systematic
variation, so the scatter must be due to experimental error. The
normalized values are therefore within the bounds of statistical error
and the hypothesis that they are constant is not contradicted.
Comparison of the linear and simplified product inhibition models
The incorporation of the product inhibition term into the linear
model resulted in a lower residual sum of squares for both low and high
enzyme concentrations (shown in Table 12). The reduction in the residual
sum of squares was more pronounced where product levels, and consequently
product inhibition, were higher.
There were two main areas where the linear model was not able to
provide a good fit to the experimental data. Firstly, the calculated
values of S were too low during the first hour of the hydrolysis.
Secondly, the values of P were over-predicted during the later (product
inhibition) stages of the hydrolysis.

103

Figure 21. Normalized values of the constants kr (X), kS (0), and
~p (e) versus enzyme concentration in Au/L. Constants
are normalized according to (k.-k.)la .. 60%,80%, and 95% ~ ~ ~
confidence levels are shown

104
\0 ~ ~----------------------------------------~
\0 95% LEVEL N ~-------------------------------------------------
ifl t-< Z \0 80% LEVEL ~ ~ ~---------------~--------------------------------En ________________________________________ ~~~_~~~E~_ Z\O 0 0 1-U • • o ~ ~ \0 a ~ t:3 1 - ~ 60% LEVEL ~ ---------------~---------------------------------~ \0 • 80% LEVEL ~ ~ --------------------------------------------------0' Z\O
95% LEVEL N ~ ________________________________________________ _
I
\0
~ ~----_~I----~I------~I------_~I----~I----~ , 0.3 0.4 0.5 0.6 0.7 0.8 0.9
ENZYME CONCENTRATION [AU/L]

Tab
le 1
2.
A c
ompa
riso
n o
f th
e re
sid
ual
sum
of
squ
ares
at
dif
fere
nt
enzy
me
con
cen
trat
ion
s (A
nson
/L)
for
the
lin
ear
and
pro
du
ct in
hib
itio
n m
odel
s
a
Run
E
nzym
e co
nce
ntr
atio
n
6M
12M
8M
7M
4M
9M
5M
11M
Con
verg
ence
pro
ble
ms.
(AU
/L)
0.3
75
0.3
75
0.5
0.5
0.6
25
0.6
25
0.7
5
0.7
5
Res
idu
al
sum
of
sgu
ares
L
inea
r m
odel
P
rod
uct
in
hib
itio
n m
odel
90
.92
5
2.4
4
17 .2
5
Cpa
87
.72
5
7.9
9
11
0.1
5
60
.81
24
3.6
0
35
.97
13
8.8
7
32
.10
15
7.7
0
59
.01
220.
14
73
.05
......
0 V1

106
The product inhibition model, on the other hand, proved to have
problems only in calculating the values of S during the first hour of
the hydrolysis. These observations can be seen more clearly when both
models are plotted together with the experimental data (shown in Figures
22 and 23).
Any variations in the constants evaluated in both models did not
appear to be related to the enzyme concentration. Any scatter in their
values was probably as a result of experimental error. Statistically they
are "constant".
Simultaneous fast and slow reactions
Figure 24 and the earlier Figure 9 do not show the form expected
(Figure 2) for the simple case of fast and slow bond cleavages occurring
simultaneously. This is not unexpected since each type of bond exists
in both soluble and insoluble pools, and the relative amounts in the
protein pools vary throughout.
Figure 24 also illustrates the effect of enzyme concentration on
the rate of hydrolysis. The rate increases and drops off at a faster
rate at the higher enzyme concentration. The initial increase in the
rate (during the first fifty minutes) was because of the increased
accessibility of bonds for cleavage. The rate dropped later in the
hydrolysis as described previously, likely as a result of the depletion
of susceptible bonds or product inhibition.

107

Figure 22. Comparison of the linear/linear model (--) and the simplified product inhibition model (---) with experimental data. Experimental data are denoted by: • insoluble, I, • soluble proteins/peptides, S, and 0 soluble peptides, P. Reaction conditions: enzyme concentration 0.375 AU/L, pH 9, and 50°C

108
:; ~ --- =--- - • ------~ ro _ · .-.-.-.-.--.-----.=-0 ~._ ~ ------.:
---- . ----. - --- - . ---.- ---0--
o
0.0 150.0 100.0 [MIN] TIME
200.0 250.0

109

Figure 23. Comparison of the linear/linear model (--) and the simplified product inhibition model (---) with experimental data. Experimental data are denoted by: • insoluble, I, • soluble proteins/peptides, S, and 0 soluble peptides, P. Reaction conditions: enzyme concentration 0.625 AU/L, pH 9, and 50°C

z o
o o 0::>
-0
~o ~~ E-< Z W U o z· o~ U
o
110
0-----.0 -0-- ------
e 0_ e e e e __ f"'r - --
------- .:-e-.::e__ e - e~ ---------------e e -.-----.-----.
o L-______ ~ ________ ~ ________ ~ ________ ~ ______ ~
0.0 50.0 100.0 150.0 200.0 250.0
TIME [MIN]

III

Figure 24. Variation in the log(rate) with time for low (0.375 AU/L) and high (0.625 AU/L) enzyme concentrations. Smoothed values of h were used to calculate the rate - dh/dt. Reaction conditions: pH 9, 50°C

o lD I
tD tD I
0tD Oc6 ~I
o l:'I
tD l'-1
0.0
112
50.0 100.0 150.0
TIME [MIN]
• 0.375 AU/L
• 0.625 AU/L
200.0 250.0

113
CONCLUSIONS AND RECOMMENDATIONS
Conclusions
The most suitable pH and temperature for the hydrolysis of corn
gluten meal, using Alcalase 2.4L, were found to be 9 and 50°C, respec
tively. The range of enzyme concentrations used was 0.375 Anson units/L
to 0.75 Anson units/L.
The rate of hydrolysis and the percent soluble protein, using
Alcalase 2.4L, were shown to increase with enzyme dosage. The rate of
hydrolysis accelerated during the first hour of hydrolysis, followed by
an eventual decline. The acceleration was explained by an increase in
the bond accessibility for cleavage. The decline, on the other hand, was
attributed to either product inhibition or a reduction in the susceptible
bonds.
Corn gluten meal does not exhibit a high internal surface area.
Nevertheless, an increase in the rate of hydrolysis was not observed
even when the total surface area was increased by four times. The
hydrolysis was apparently not limited by the availability of surface sites
at which the enzyme can bind.
An increase in soluble protein with an increase in enzyme concentra
tion was accounted for by an increase in low molecular weight pep tides
(P). The high molecular weight proteins/peptides (S) in solution hardly
varied with enzyme concentration. For longer term hydrolysis (48 hours),
53.2% of the available protein became soluble.
Of all the kinetic models studied, the linear and simplified product
inhibition models generated the best representation of the experimental

114
data. These models predicted most of the trends of the experimental data.
Product inhibition did, however, seem to be apparent. The addition of the
product inhibition term to the linear model resulted in an improvement in
the residual sum of squares of between 33% and 85%. The largest improve
ment was observed at the highest enzyme concentrations. In these cases,
the highest concentration of low molecular weight peptides was produced.
Recommendations
Certain aspects of the enzymatic hydrolysis of corn gluten meal are
still not thoroughly understood. Further experimentation should be carried
out to try to improve the hydrolysis y~e1ds. In addition, the kinetic
model should be tested further. Future work should involve in particular:
1) Specific sizes can be collected after sieving. Hydrolysis should
then be carried out on the different sizes to try to determine if an
optimum particle size exists for the hydrolysis.
2) Corn gluten meal should be steamed and thereafter hydrolyzed.
Any improvement in the rate of hydrolysis would be due to swelling of the
corn gluten meal.
3) Further extended hydrolysis runs should be performed with a view
to obtaining as much soluble protein as possible.
4) Experiments can be carried out to test for product inhibition.
The insoluble fraction should be separated from the soluble phase,
resuspended in water, and the hydrolysis continued. The rate should
increase due to the removal of the low molecular weight pep tides
responsible for the product inhibition, provided the enzyme is not removed
in the soluble phase. Alternatively, low molecular weight peptides

115
could be added during the early stages of the hydrolysis, and the resulting
product inhibition if present would cause the rate to decrease.
5) Steps should be taken to continually remove the low molecular
weight peptides responsible for product inhibition. This could be achieved
by using ultrafiltration in combination with the reactor.
6) A more complex model should be developed. This model should be
able to account for the initial increase in high molecular weight
proteins/peptides (S), and the eventual decline in the rate of hydrolysis
due to product inhibition. The time course of the degree of hydrolysis
could be coupled with the insoluble and soluble protein data.

116
BIBLIOGRAPHY
Adler-Nissen, J. 1976. Enzymatic Hydrolysis of Proteins for Increased Solubility. J. Agric. Food Chern. 24(6):1090-1093.
Adler-Nissen, J. 1977. Enzymatic Hydrolysis of Food Proteins. Process Biochem. 12(6):18-23.
Adler-Nissen, J. 1978a. Enzymatic Modification of Corn Gluten. U.S. Patent 4,100,151.
/ /
V Adler-Nissen, J. 1978b. Enzymatic Hydrolysis of Soy Protein for ~
Nutritional Fortification of Low pH Food. Ann. Nutr. Alim. 32:205-216.
Adler-Nissen, J. 1982. Limited Enzymatic Degradation of Proteins: A ~ New Approach in the Industrial Application of Hydro1ases. J. Chern. Techno1. Biotechno1. 32:138-156.
Adler-Nissen, J. 1985. Enzymatic Hydrolysis of Food Proteins. Elsevier, Applied Science Publishers, New York, N.Y.
Andrews, R. P., and N. A. Baldar. 1985. Amino Acid Analysis of Feed Constituents. Sci. Tools 32(2):44-48.
Anson, M. L. 1939. The Estimation of Pepsin, Trypsin, Papain and Cathepsin with Hemoglobin. J. Gen. Physio1. 22:79-89.
Archer, M. C., J. O. Ragnarsson, S. R. Tannenbaum, and D. I. C. Wang. 1973. Enzymatic Solubilization of an Insoluble Substrate, Fish Protein ~ Concentrate: Process and Kinetic Considerations. Biotechnol. Bioeng. 15:181-196.
Association of Official Agricultural Chemists (AOAC). 1970. Official Methods of Analysis. 11th ed. AOAC, Washington, D.C.
Augustine, M. E., and I. C. Baianu. 1987. Basic Studies of Corn Proteins for Improved Solubility and Future Utilization: A Physicochemical Approach. J. Food. Sci. 52(3):649-652.
Bailey, J. E., and D. F. Ollis. 1977. Biochemical Engineering .~' Fundamentals. McGraw-Hill, New York, N.Y. ~
Boyce, C. O. L. 1986. Novo's Handbook of Practia1 Biotechnology. Novo Industri A/S, Bagsvaerd, Denmark.
Buck, J. S., C. E. Walker, and K. S. Watson. 1987. Incorporation of Corn Gluten Meal and Soy into Various Cereal-based Foods and Resulting Product Functional, Sensory and Protein Quality. Cereal Chern. 64(4):264-269.

117
Cherry~ J. P. 1981. Protein Functionality in Foods. Am. Chern. Soc. Syrnp. 147, Houston, Texas. Am. Chern. Soc., Washington, D.C.
Clegg, K. M. 1977. Dietary Enzymic Hydro1ysates of Protein. Pages 109-118 in J. Adler-Nissen, B. O. Eggum, L. Munck, and H. S. Olsen, eds. Biochemical Aspects of New Protein Food. F. E. B. S. 11th Meeting, Copenhagen. Vol. 44. Symp. A3. Pergamon Press, New York, N.Y.
Constantinides, A., and B. Adu-Amankwa. 1980. Enzymatic Modification of Vegetable Protein: Mechanism, Kinetics, and Production of Soluble ~ and Partially Soluble Protein in a Batch Reactor. Biotechno1. ~ Bioeng. 22:1543-1565.
Davies, M. 0., and A. J. Thomas. 1973. An Investigation of Hydrolytic Techniques for the Amino Acid Hydrolysis of Foodstuffs. J. Sci. Food. Agric. 24:1525-1540.
Dees1ie, W. D., and M. Cheryan. 1981. Continuous Enzymatic Modification of Proteins in an Ultrafiltration Reactor. J. Food. Sci. 46:1035-1042.
Doumas, B. T. 1975. Standards for Total Serum Protein Assays-A Collaborative Study. C1in. Chern. 21(8):1159-1165.
Eriksen, S. 1982a. Enzymatic Modification of Proteins for Utilization in Food Systems. Biochemical Engineering Summer Course. University College London, London.
Eriksen, S. 1982b. Controlled Proteolysis in Food Protein Ingredients. Biochem. Soc. Trans. 10:285-287.
English, J. C., and C. A. Grulke. 1934. Industrial Uses for Corn Gluten. Iowa State University, Ames, Ioya.
Ganchev, K. D., and Ch. P. Ivanov. 1969a. A Preliminary Study on the Hydrolysis of Zein. Dok1. Bo1g. Akad. Nauk 22(3):269-272.
Ganchev, K. D., and Ch. P. Ivanov. 1969b. tion of Zein by Means of Gel Filtration. 22(4):439-442.
Investigation of the FractionaDokl. Bo1g. Akad. Nauk
Ganchev, K. D., and Ch. P. Ivanov. 1969c. The Molecular Weight and Amino Acid Composition of Zein Fractions. Dok1. Bo1g. Akad. Nauk 22(10): 1127-1131.
Ganchev, K. D., and Ch. P. Ivanov. 1969d. Enzyme Hydrolysis of Fraction Cs Isolated from Total Zein by Means of Gei Filtration. Dok1. Bo1g.
Akad. Nauk 22(12):1397-1400.

118
Godfrey, T., and J. Reichelt. 1983. Industrial Enzymology-The Application of Enzymes in Industry. Macmillan Publishers Ltd., Surrey.
Gunther, R. C. 1979. Chemistry and Characteristics of Enzyme Modified J. Am. Oil Chem. Soc. 56:346-349. Whipping Proteins.
Gutfreund, H. 1965. An Introduction to the Study of Enzymes. John Wiley and Sons Inc., New York, N.Y.
Hoseney, R. C. Technology. Minnesota.
1986. Page 153 in Principles of Cereal Science and Chapter 7. Am. Assoc. of Cereal Chem., Inc., St. Paul,
Howell, J. A., and D. Stuck. 1975. Kinetics of Solka Floc Cellulose ~ Hydrolysis by Trichoderma viride Cellulase. Biotechnol. Bioeng. ~ 17:873-893.
International Mathematical and Statistical Libraries Inc. (I.M.S.L.). 1987. Version 2.0. I.M.S.L., Houston, Texas.
Jacobsen, C. F., J. Leonis, K. Linderstrom-Lang, and M. Ottesen. 1957. The pH-Stat and its Use in Biochemistry. Methods of Biochemical Analysis 4:171-210.
Kinsella, J. E. 1979. Functional Properties of Soy Proteins. J. Am. Oil Chem. Soc. 56:242-257.
Laidler, K. J. 1958. The Chemical Kinetics of Enzyme Action. Oxford University Press, London.
Lehninger, A. L. 1972. The Molecular Basis of Cell Structure and Function. Worth Publishers Inc., New York, N.Y.
Light, A. 1967. Partial Acid Hydrolysis. Methods in Enzymol. 11:417-420.
Ma, T. S., and G. Zuazaga. 1942. ~licro-Kjeldahl Determination of Nitrogen-A New Indicator and an Improved Rapid Method. Ind. Eng. Chem. 14(3):280-282.
Mandels, M., J. Kostick, and R. Parizek. 1971. The Use of Adsorbed Cellulase in the Continuous Conversion of Cellulose to Glucose. J. Polym. Sci. 26:445-459.
Mattil, K. F. 1971. The Functional Requirements of Proteins for Foods. J. Am. Oil Chem. Soc. 48(9):447-480.
McClellan, A. L., and H. F. Hamsberger. Molecules Adsorbed on Solid Surfaces. 23:577-599.
1967. Cross-sectional Areas of J. Colloid and Interface Sci. /

119
McLaren, A. D. 1963. Enzyme Reactions in Structurally Restricted Systems ~ IV. - The Digestion of Insoluble Substrates by Hydrolytic Enzymes. Enzymo1ogia 26:237-246.
Miha1yi, E., and J. E. Godfrey. 1962. I. Kinetic Studies of the Reaction.
Digestion of Fibrinogen by Trypsin Biochim. Biophys. Acta 67:73-89.
Mihalyi, E., and W. F. Harrington. 1959. Studies of the Tryptic Digestion of Myosin. Biochim. Biophys. Acta 26:447-466.
Montali, U., A. Luchacchini, G. Ronca, and C. A. Rossi. 1981. Subtilisin: Fast and Slow Proteolysis of Peptide Bonds of Oxidized A Chain of Insulin. Int. J. Pept. Prot. Res. 17:427-429.
Moo-Young, M. 1985. of Biotechnology:
Comprehensive Biotechnology. Current Commodity Products.
Vol. 3 - The Practice Pergamon, New York, N.Y.
Mosse, J., and J. Landry. 1979. Recent Research on Major Maize Proteins: Zeins and G1ute1ins. Pages 255-276 in C. E. Inglett and L. Munck, eds. Cereals for Food and Beverages. Academic Press, New York, N.Y.
Nerying, A., and P. J. Reilly. 1984. Laboratory Wet Milling of Ensiled Corn Kernels. Cereal Chern. 61(1):8-14.
Neumann, P. E., and J. S. Wall. 1984. Chemical and Physical Properties of Proteins in Wet-Milled Corn Gluten. Cereal Chern. 61(4):353-356.
Novo Laboratories, Inc. 1978. Modified Anson-Hemoglobin Method for the Determination of Proteolytic Activity. Novo Laboratories, Inc., Wilton, Connecticut.
Novo Industri A/S. 1984a. Alcalase l3259b-6B 2000. Bagsvaerd, Denmark.
Novo Industri A/S. 1984b. Neutrase B2l3C-6B 3000. Bagsvaerd, Denmark.
Novo Technical Service Representative. 1987. Novo Enzymes Division, Wilton, Connecticut.
Ofelt, C. W., and C. D. Evans. 1949. Aqueous Zein Dispersions. Ind. Eng. Chern. 41(4):830-833.
Olsen, J. H., and J. Adler-Nissen. 1979a. The Influence of Peptide Chain Length on Taste and Functional Properties of Enzymatically Modified Soy Protein. Am. Chern. Soc. Symp. 92:125-146.
Olsen, J. H., and J. Adler-~issen. 1979b. Industrial Production of Applications of a Soluble Enzymatic Hydrolysate of Soya Protein. Process Biochem. 14(7):6-11.

120
O'Meara, G. M., and P. A. Munro. 1985. Kinetics of the Hydrolysis of Lean Meat Protein by Alcalase: Derivation of Two Alternative Rate Equations and Their Fit to Experimental Data. Biotechnol. Bioeng. 27: 861-869.
Perry, R. H., and C. H. Chilton. 1973. Chemical Engineers' Handbook. McGraw-Hill, New York, N.Y.
Prendergast, K. 1974. Protein Hydrolysate-A Review. Food Trade Review 44 (1): 14-21.
Rackis, J. J., D. J. Sessa, and D. H. Honig. 1979. Flavor Problems of Vegetable Food Proteins. J. Am. Oil Chem. Soc. 56:262-271.
Rehm, H. J., and G. Reed. 1987. J. F. Kennedy, ed. Vol. 7a. Weinheim, West Germany.
Enzyme Technology. Pages 156-158 in Biotechnology. VCR Verlagsgesellschaft,
Ricks, E., B. Ridling, G. A. Iacobucci, and D. V. Myers. 1977. Approaches to Analyze and Optimize Protein Hydrolysate. Pages 119-128 in J. Adler-Nissen, B. O. Eggum, L. Munck, and R. S. Olsen, eds. Biochemical Aspects of New Protein Food. F. E. B. S. 11th Meeting, Copenhagen. Vol. 44. Symp. A3. Pergamon Press, New York, N.Y.
Ronca, G., U. Montali, A. Lucacchini, S. Ronca-Testoni, and C. A. Rossi. 1975. Digestion of Insulin Derivatives with Subtilisin: A Kinetic Study. Int. J. Pept. Prot. Res. 7:111-117.
Rosen, S. L. 1981. Fundamental Principles of Polymeric Materials. John Wiley and Sons, New York, N.Y.
Russell, M. H., and G. T. Tsao. 1982. Protein Removal from Corn Endosperm by Solvent Extraction. AIChE Symp. Series 78(218):83-89.
j
Sternberg, M., R. D. Phillips, and L. H. Daley. 1979. Maize Protein Concentrate. Pages 275-286 in C. E. Inglett and L. Munck, eds. Cereal for Food and Beverages. Academic Press, New York, N.Y.
Wahl, J. 1934. Extraction of Zein from Corn Gluten by Use by Alkaline Solvents. Iowa State University Thesis, Ames, Iowa.
Willis, B. A. 1981. An Introduction to Practical Aspects of Ore Treatment. Mineral Processing Technology. 2nd Edition. Pergamon Press, New York, N.Y.
Wiseman, A. 1985. Handbook of Enzyme Biotechnology. 2nd Edition. Halstead Press, New York, N.Y.
Wolf., W. J. 1970. Soybean Proteins: Their Functional, Chemical, and Physical Properties. J. Agric. Food Chem. 18(6):969-976.

121
ACKNOWLEDGEMENTS
Thanks goes to the Iowa Corn Promotion Board, who was responsible
for funding this research.
I would like to thank my major professor, Dr. Charles Glatz, for
his guidance and support--particularly during difficult times. I
would also like to thank my committee members: Dr. Larry Johnson, of
the Food Technology Department, and Dr. Peter Reilly and
Dr. Maurice Larson, of the Chemical Engineering Department.
This would not have been possible without my parents' dedication
to my education. Unfortunately, they cannot share these moments with me.

122
APPENDIX
Experimental conditions, experimental values of I, (S + P), and P
used for modelling, and the estimated parameter constants calculated
for each data set.

Tab
le A
-I.
Run
4M
, en
zym
e co
nce
ntr
atio
n:
0.6
25
A
U/L
, pH
: 9
, te
mp
erat
ure
: 50
°C.
-2
-2
Lin
ear
mod
el:
kI
1.3
2 x
10
L
/g m
in,
kS
5.5
9 x
10
L
/g m
in.
Pro
du
ct in
hib
itio
n m
odel
: l
-1
kI
1.4
0 x
1
0-
L/g
min
, kS
4
.46
x
10
L/g
min
, Km
P 1
.01
mg/
mL
Tim
e %
Deg
ree
Inso
lub
le
To
tal
solu
ble
Lo
w M
.Wt.
(min
) h
yd
roly
sis
pro
tein
(I
) p
rote
in
(S +
P)
pep
tid
es
(P)
(mg/
mt..
) (m
g/m
L)
(mg/
mL
)
0 0
82
.06
1
0.3
8
0.5
4
10
0.3
3
76
.16
1
6.2
8
2.6
0
20
0.5
6
74
.27
1
8.1
7
5.5
2
30
0.9
8
73
.50
1
8.9
4
5.0
9
I-'
N
40
1.5
0
73
.15
1
9.2
9
7.5
9
w
50
2.0
3
72
.18
2
0.2
6
8.4
5
60
2.5
7
70
.89
2
1.5
5
11
.02
75
3.3
2
69
.69
2
2.7
5
13
.17
90
3.6
0
69
.26
2
3.1
8
14
.20
105
4.6
6
66
.77
2
5.6
7
15
.84
120
5.2
7
67
.51
2
4.9
3
15
.75
150
6.2
8
66
.57
2
5.8
7
18
.76
180
7.1
6
65
.22
2
7.2
2
19
.79
210
7.9
8
65
.08
2
7.3
6
21
.94
240
8.7
5
64
.82
2
7.8
2
21
.67

Tab
le A
-2.
Run
5M
, en
zym
e co
nce
ntr
atio
n:
0.7
5 A
U/L
, pH
: 9
, te
mp
erat
ure
: 50
°C.
-2
-2
Lin
ear
mod
el:
k1
1.0
6 x
10
L
/g m
in, ~~
4.4
4 x
10
L
/g m
in.
-1
Pro
du
ct
inh
ibit
ion
mod
el:
k1
3.5
2 x
10
L
/g m
in,
kS
1.1
8 x
10
L/g
min
, Km
P 4
.59
mg/
mL
Tim
e %
Deg
ree
Inso
lub
le
To
tal
solu
ble
Lo
w M
.Wt.
(min
) h
yd
roly
sis
pro
tein
(I
) p
rote
in
(S +
p)
pep
tid
es
(P)
(mg/
mL
) (m
g/m
L)
(mg/
mL
)
0 0
80
.92
1
1.5
2
1.0
6
10
0.3
1
77
.77
1
4.6
7
3.4
6
20
0.5
5
72
.92
1
9.5
2
3.8
1
30
0.9
5
73
.10
1
9.3
4
5.1
8
I-'
40
1.4
6
72.9
2 1
9.5
2
5.8
7
N ~
50
2.0
0
71
.98
2
0.4
6
7.0
7
60
2.5
4
70.3
2 2
2.1
2
12
.23
75
3.2
9
69
.46
2
2.9
8
12
.91
90
4.0
1
69
.52
2
2.9
2
13
.43
105
4.6
5
68
.89
2
3.5
5
15
.15
120
5.2
7
68
.34
2
4.1
0
17
.21
150
6.3
2
66
.71
2
5.7
3
19
.96
180
7.2
6
65
.53
2
6.9
1
22.3
7
210
8.1
5
64
.10
2
8.3
4
22.0
2
240
8.9
3
62
.93
2
9.5
1
22
.71

Tab
le A
-3.
Run
6M
, en
zym
e co
nce
ntr
atio
n:
0.3
75
AU
/L,
pH:
9,
tem
per
atu
re:
50°C
. -2
-2
L
inea
r m
odel
: k
I 1
.49
x
10
L/g
min
, kS
4
.85
x
10
L/g
min
. -2
-1
P
rod
uct
in
hib
itio
n m
odel
: k
I 3
.48
x
10
L/g
min
, kS
1
.06
x 1
0 L
/g m
in,
KmP
5.0
8 m
g/m
L
Tim
e %
Deg
ree
Inso
lub
le
To
tal
solu
ble
Lo
w M
.Wt.
(min
) h
yd
roly
sis
pro
tein
(I
) p
rote
in
(S
+ P
) p
epti
des
(P
) (m
g/m
L)
(mg/
mL
) (m
g/m
L)
0 0
82
.01
1
0.4
3
0.8
8
10
0.1
9
77 .
82
14
.62
1
.06
20
0.3
0
77 .4
8
14
.96
2
.52
30
0.3
8
76
.73
1
5.7
1
3.9
8
40
0.4
9
76
.39
1
6.0
5
.....
4.7
5
N
\.J1
50
0.6
0
76
.33
1
6.1
1
4.4
9
60
0.7
4
74
.73
1
7.7
1
3.6
3
75
1.1
4
74
.27
1
8.1
7
4.3
2
90
1.5
7
71
.32
2
1.1
2
9.6
5
105
2.1
0
72
.81
1
9.6
3
10
.68
120
2.6
1
72
.81
1
9.6
3
11
.11
150
3.5
3
70
.86
2
1.5
8
13
.09
180
4.3
4
69
.66
2
2.7
8
14
.98
210
5.0
6
68
.20
2
4.2
4
14
.55
240
5.7
1
68
.77
2
3.6
7
16
.87
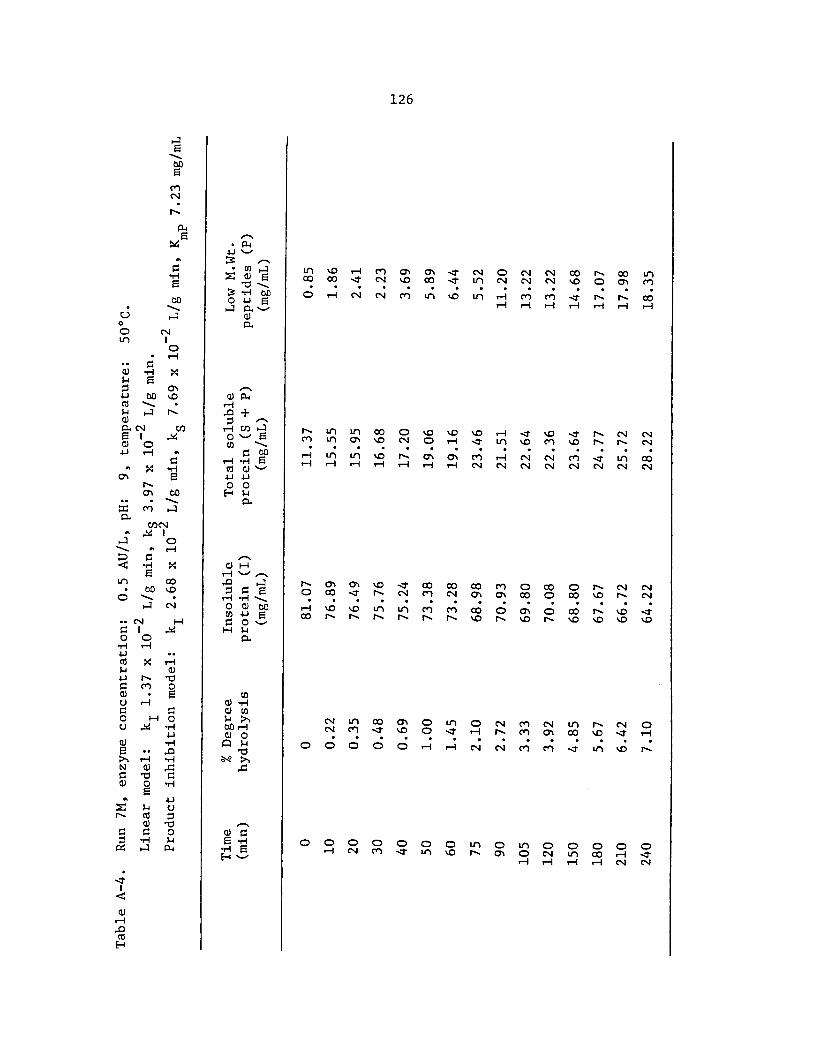
Tab
le A
-4.
Run
7M
, en
zym
e co
nce
ntr
atio
n:
0.5
AU
/L,
pH:
9,
tem
per
atu
re:
50°C
. -2
-2
L
inea
r m
odel
: k
I 1
.37
x
10
L/g
min
, kS
3
.97
x
10
L/g
min
. -2
-2
P
rod
uct
in
hib
itio
n m
odel
: k
I 2
.68
x 1
0 L
/g m
in,
kS
7.6
9 x
10
L/g
min
, Km
P 7
.23
mg/
mL
Tim
e %
Deg
ree
Inso
lub
le
To
tal
solu
ble
Lo
w M
.Wt.
(min
) h
yd
roly
sis
pro
tein
(I
) p
rote
in
(S +
P)
pep
tid
es
(P)
(mg/
mL
) (m
g/m
L)
(mg/
mL
)
0 0
81
.07
1
1.3
7
0.8
5
10
0.2
2
76.8
9 1
5.5
5
1.8
6
20
0.3
5
76
.49
1
5.9
5
2.4
1
30
0.4
8
75
.76
1
6.6
8
2.2
3
I-'
40
0.6
9
75
.24
1
7.2
0
3.6
9
N
0\
50
1.0
0
73
.38
1
9.0
6
5.8
9
60
1.4
5
73
.28
1
9.1
6
6.4
4
75
2.1
0
68
.98
2
3.4
6
5.5
2
90
2.7
2
70
.93
2
1.5
1
11
.20
105
3.3
3
69
.80
2
2.6
4
13
.22
120
3.9
2
70
.08
2
2.3
6
13
.22
150
4.8
5
68
.80
2
3.6
4
14
.68
180
5.6
7
67
.67
24
.77
17
.07
210
6.4
2
66
.72
2
5.7
2
17
.98
240
7.1
0
64
.22
2
8.2
2
18
.35

Tab
le A
-5.
Run
8M
, en
zym
e co
nce
ntr
atio
n:
0.5
AU
/L,
pH:
9,
tem
per
atu
re:
50°C
. -2
-2
L
inea
r m
odel
: k
I 1
.51
x 1
0 L
/g m
in, k~
4.3
7 x
10
L/g
min
. -
-2
Pro
du
ct in
hib
itio
n m
odel
: k
I 2
.51
x 1
0 L
/g m
in,
kS
6.8
3 x
10
L/g
min
, Km
P 1
.39
mg/
mL
Tim
e %
Deg
ree
Inso
lub
le
To
tal
solu
ble
Lo
w M
.Wt.
(min
) h
yd
roly
sis
pro
tein
(I
) p
rote
in
(S +
P)
pep
tid
es
(P)
(mg/
mL
) (m
g/m
L)
(mg/
mL
)
0 0
80
.58
1
1.8
6
1.3
2
10
0.2
4
77 .0
1 1
5.4
3
2.1
3
20
0.3
8
76
.55
1
5.8
9
2.4
0
30
0.5
1
73
.99
1
8.4
5
2.8
8
t-'
40
0.7
2
74
.11
1
8.3
3
3.1
5
N
--.J
50
1.0
5
72
.98
1
9.4
6
7.0
8
60
1.4
6
71
.09
21
.35
6.7
1
75
2.1
1
70
.69
21
. 75
8.6
4
90
2.7
5
69
.83
2
2.6
1
10
.10
105
3.3
5
68
.19
2
4.2
5
13
.68
120
3.9
2
68
.15
2
4.2
9
14
.04
150
4.8
9
66
.96
2
5.4
8
17
.43
180
5.7
5
66
.47
2
5.9
7
18
.26
210
6.5
5
65
.80
2
6.6
4
19
.36
240
7.2
9
63
.33
2
9.1
1
23
.30

Tab
le A
-6.
Run
9M
, en
zym
e co
nce
ntr
atio
n:
0.6
25
AU
/L,
pH:
9,
tem
per
atu
re:
50°C
. -2
-2
L
inea
r m
odel
: k
r 1
.27
x
10
L/g
min
, k~
5.1
0 x
10
L
/g m
in.
--1
P
rod
uct
in
hib
itio
n m
odel
: k
r 5
.23
x
10
L/g
min
, kS
1
.72
x
10
L/g
min
, Km
P 3
.43
mg/
mL
Tim
e %
Deg
ree
Inso
lub
le
To
tal
solu
ble
Lo
w M
.Wt.
(min
) h
yd
roly
sis
pro
tein
(I
) p
rote
in
(S +
P)
pep
tid
es
(P)
(mg/
mL
) (m
g/m
L)
(mg/
mL
)
0 0
80
.89
1
1.5
5
1.7
7
10
0.3
4
77 .
19
15
.25
2
.96
20
0.5
9
74.9
9 17
.45
3.8
7
30
0.9
8
73
.41
1
9.0
3
6.1
6
I-'
40
1.5
1
73
.16
1
9.2
8
6.8
1
N
(Xl
50
2.0
6
72
.31
2
0.1
3
8.9
1
60
2.6
0
70
.90
2
1.5
4
10
.84
75
3.4
0
69
.53
2
2.9
1
12
.21
90
4.1
0
68
.43
2
4.0
1
15
.42
105
4.7
5
67
.70
2
4.7
4
15
.78
120
5.3
7
68
.58
2
3.8
6
17
.07
150
6.4
1
66
.72
2
5.7
2
19
.08
180
7.3
1
64
.95
27
.49
19
.81
210
8.1
3
64
.49
2
7.9
5
21.9
2
240
8.9
1
63
.48
2
8.9
6
22.9
3

Tab
le A
-7.
Run
11
M,
enzy
me
con
cen
trat
ion
: 0
.75
AU
/L,
pH:
9,
tem
per
atu
re:
50°C
. -2
-2
L
inea
r m
odel
: k
r 1
.01
x
10
L/g
min
, kS
5
.32
x
10
L/g
min
. .
3 /
3 /
Pro
du
ct in
hib
itio
n m
odel
: k
I 1
.44
x
10
L g
min
, kS
5
.46
x
10
L g
min
, -5
Km
P 8
.35
x
10
mg/
mL
Tim
e %
Deg
ree
Inso
lub
le
To
tal
solu
ble
Lo
w M
.Wt.
(min
) h
yd
roly
sis
pro
tein
(I
) p
rote
in
(S +
P)
pep
tid
es
(P)
(mg/
mL
) (m
g/m
L)
(mg/
mL
)
0 0
80
.74
1
1.7
0
2.6
8
10
0.3
0
74
.96
17
.48
4.7
0
20
0.5
1
73
.80
1
8.6
4
5.8
0
.....
30
0.9
4
73
.53
1
8.9
1
7.2
6
N
1.0
40
1.4
7
72
.46
1
9.9
8
8.5
5
50
2.0
6
69
.99
2
2.4
5
10
.38
60
2.5
9
71
.94
2
0.5
0
12
.39
75
3.3
3
68
.86
23
.58
13
.49
90
4.0
3
68
.19
24
.25
15
.14
105
4.6
7
68
.00
2
4.4
4
18
.17
120
5.2
6
67
.60
2
4.8
4
18
.02
150
6.2
2
65
.77
26
.67
19
.72
180
7.0
8
66
.69
25
.75
22.8
4
210
7.8
0
68
.58
2
3.8
6
21
.83
240
8.4
7
61
.99
3
0.4
5
23
.66
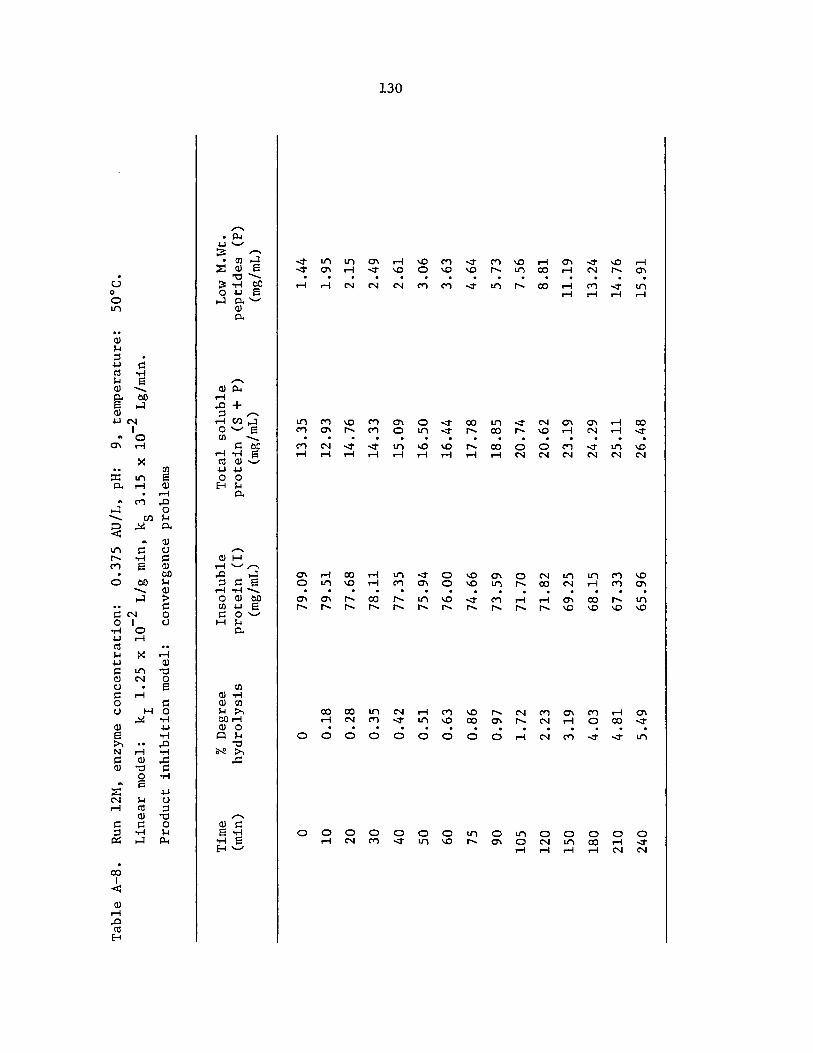
Tab
le A
-8.
Run
12
M,
enzy
me
con
cen
trat
ion
: 0
.37
5 A
U/L
, pH
: 9
, te
mp
erat
ure
: 50
°C.
-2
-2
Lin
ear
mod
el:
kI
1.2
5 x
10
L
/g m
in,
kS
3.1
5 x
10
L
g/m
in.
Pro
du
ct in
hib
itio
n m
odel
: co
nv
erg
ence
pro
blem
s
Tim
e %
Deg
ree
Inso
lub
le
To
tal
solu
ble
Lo
w M
.Wt.
(min
) h
yd
roly
sis
pro
tein
(I
) p
rote
in
(S +
P)
pep
tid
es
(P)
(mg/
mL
) (m
g/m
L)
(mg/
mL
)
0 0
79
.09
1
3.3
5
1.4
4
10
0.1
8
79
.51
1
2.9
3
1.9
5
20
0.2
8
77 .6
8 1
4.7
6
2.1
5
30
0.3
5
78
.11
1
4.3
3
2.4
9
~
40
0.4
2
77 .
35
15
.09
2
.61
w
0
50
0.5
1
75
.94
1
6.5
0
3.0
6
60
0.6
3
76
.00
1
6.4
4
3.6
3
75
0.8
6
74
.66
1
7.7
8
4.6
4
90
0.9
7
73
.59
1
8.8
5
5.7
3
105
1.7
2
71. 7
0 2
0.7
4
7.5
6
120
2.2
3
71
.82
2
0.6
2
8.8
1
150
3.1
9
69.2
5 2
3.1
9
11
.19
180
4.0
3
68
.15
24
.29
13
.24
210
4.8
1
67
.33
2
5.1
1
14
.76
240
5.4
9
65
.96
2
6.4
8
15
.91