Glucose, fructose and sucrose increase the solubility of protein–tannin complexes and at high...
8
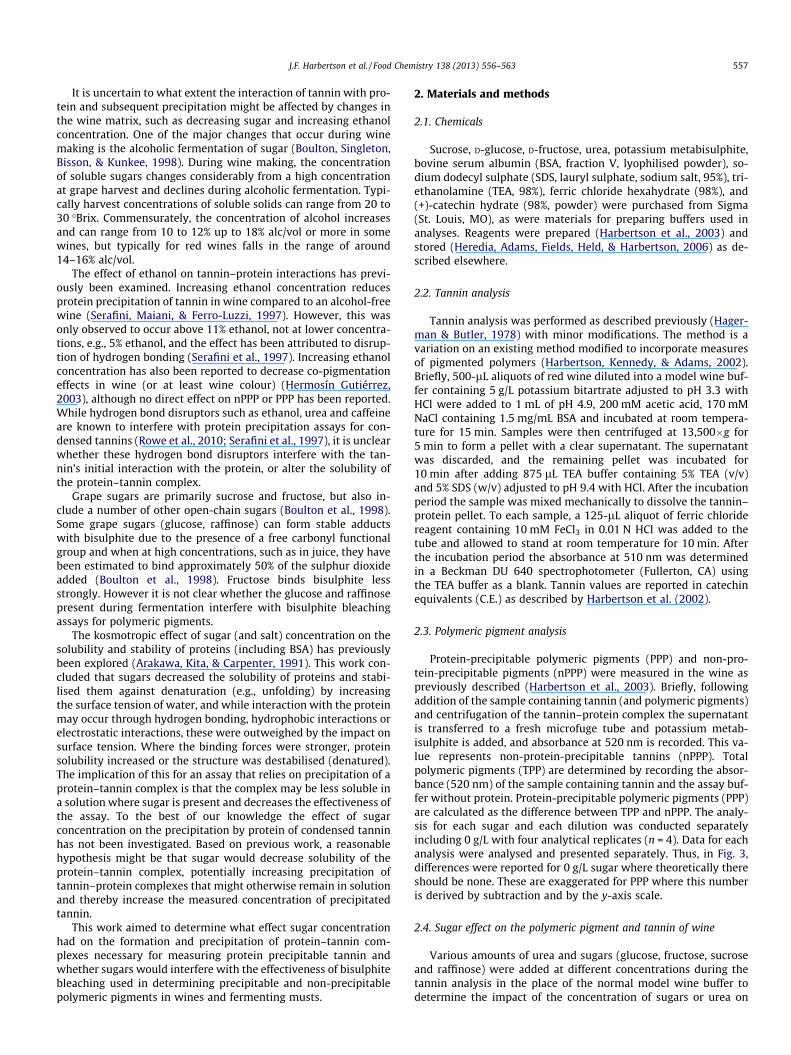
Glucose, fructose and sucrose increase the solubility of protein–tannin complexes and at high concentration, glucose and sucrose interfere with bisulphite bleaching of wine pigments James F. Harbertson a,⇑ , Chunlong Yuan b , Maria S. Mireles a , Rachel L. Hanlin c , Mark O. Downey c a School of Food Science, Washington State University, Irrigated Agriculture and Extension Center, 24106 N. Bunn Rd., Prosser, WA 99350-8694, USA b Northwestern Agriculture and Forest University, 22 Xinong Road, Yangling, Shaanxi 712100, China c Department of Primary Industries, P.O. Box 905, Mildura, Victoria 3502, Australia article info Article history: Received 17 July 2012 Received in revised form 24 October 2012 Accepted 30 October 2012 Available online 12 November 2012 Keywords: Condensed tannin Protein precipitation Polymeric pigments Bisulphite bleaching Hydrogen bonding Wine abstract Wines were modified with increasing sugar concentrations and decreasing tannin concentrations and analysed by a combination of protein precipitation and bisulphite bleaching. Increasing sugar concentra- tion decreased the precipitation of tannin and protein-precipitable polymeric pigments (PPP). The use of a hydrogen bond disruptor (urea) to reduce protein–tannin and protein–pigment complex formation showed that the effect of sugar concentration occurred by increasing the solubility of the tannin–protein complex, not by interfering with protein–tannin complex formation. By increasing the solubility of pig- ment–protein complexes, non-protein-precipitable polymeric pigments (nPPP) appeared to increase. There was also an increase in total polymeric pigments at each tannin concentration with increasing glu- cose and sucrose concentration, indicating that sugar concentration might also affect bisulphite bleaching of wine pigments. While a significant effect of sugar concentration on tannin–protein complex solubility was observed, these effects were greatest at sugar concentrations far in excess of normal wine making conditions. Under normal wine making conditions, sugar concentration will have a negligible effect on protein-precipitable tannin, PPP and nPPP concentrations. Ó 2012 Elsevier Ltd. All rights reserved. 1. Introduction Increasingly, tannins and polymeric pigments are routinely measured during commercial wine fermentation to evaluate important wine quality parameters, such as wine astringency and colour stability (Harbertson & Spayd, 2006). Because tannins and polymeric pigments are such important components of the sensory perception of wine, it is important to evaluate how various grape juice and wine components impact on the efficacy and therefore the usefulness or validity of an assay employed to measure tannins and polymeric pigments. The tannin and polymeric pigment assay based on protein precipitation is a robust and accessible method gaining increasing acceptance in the wine industry as well as in grape and wine research (Harbertson & Spayd, 2006). With increas- ing reliance of the methodology and its incorporation into the busi- ness model of winery production systems, it is important that such an assay has been thoroughly and critically evaluated under a range of conditions that occur in grape and wine analysis. Protein precipitation (Hagerman & Butler, 1978; Harbertson, Picciotto, & Adams, 2003) has been adopted by wineries to monitor tannin extraction and pigmented polymer formation during wine making. In tannin protein precipitation assays, an insoluble tan- nin–protein complex (precipitate) is formed (Haslam, 1998; Swain, 1965). The commonly used protein for grape and wine tannin anal- ysis is bovine serum albumin (BSA) (Harbertson & Spayd, 2006), which behaves similarly to human saliva in precipitating con- densed tannin. Protein precipitable tannins have been demon- strated to correlate strongly with sensory evaluations of astringency (Kennedy, Ferrier, Harbertson, & Peyrot des Gachons, 2006; Mercurio & Smith, 2008). The long term stability of colour in red wines is also attributed to the presence of condensed tannin in the form of pigmented polymers (Cheynier et al., 2006; Somers, 1968). Protein precipitation has been adapted to measure polymeric pigments in combination with bisulphite bleaching (Harbertson et al., 2003). Polymeric pigments are defined as those pigments that are resistant to bisulphite bleaching. These can be differenti- ated into two classes, protein-precipitable polymeric pigments (PPP) and non-protein-precipitable polymeric pigments (nPPP). Previously these have been called long and short pigmented poly- mers (Harbertson et al., 2003); however the size distinction be- tween these has not been defined. Therefore, in a protein precipitation study the revised terminology of precipitable and non-precipitable pigments is more appropriate. 0308-8146/$ - see front matter Ó 2012 Elsevier Ltd. All rights reserved. http://dx.doi.org/10.1016/j.foodchem.2012.10.141 ⇑ Corresponding author. Tel.: +1 509 786 9296; fax: +1 509 786 9370. E-mail address: [email protected] (J.F. Harbertson). Food Chemistry 138 (2013) 556–563 Contents lists available at SciVerse ScienceDirect Food Chemistry journal homepage: www.elsevier.com/locate/foodchem
-
Upload
independent -
Category
Documents
-
view
0 -
download
0
Transcript of Glucose, fructose and sucrose increase the solubility of protein–tannin complexes and at high...
Food Chemistry 138 (2013) 556–563
Contents lists available at SciVerse ScienceDirect
Food Chemistry
journal homepage: www.elsevier .com/locate / foodchem
Glucose, fructose and sucrose increase the solubility of protein–tannincomplexes and at high concentration, glucose and sucrose interfere withbisulphite bleaching of wine pigments
James F. Harbertson a,⇑, Chunlong Yuan b, Maria S. Mireles a, Rachel L. Hanlin c, Mark O. Downey c
a School of Food Science, Washington State University, Irrigated Agriculture and Extension Center, 24106 N. Bunn Rd., Prosser, WA 99350-8694, USAb Northwestern Agriculture and Forest University, 22 Xinong Road, Yangling, Shaanxi 712100, Chinac Department of Primary Industries, P.O. Box 905, Mildura, Victoria 3502, Australia
a r t i c l e i n f o
Article history:Received 17 July 2012Received in revised form 24 October 2012Accepted 30 October 2012Available online 12 November 2012
Keywords:Condensed tanninProtein precipitationPolymeric pigmentsBisulphite bleachingHydrogen bondingWine
0308-8146/$ - see front matter � 2012 Elsevier Ltd. Ahttp://dx.doi.org/10.1016/j.foodchem.2012.10.141
⇑ Corresponding author. Tel.: +1 509 786 9296; faxE-mail address: [email protected] (J.F. Harber
a b s t r a c t
Wines were modified with increasing sugar concentrations and decreasing tannin concentrations andanalysed by a combination of protein precipitation and bisulphite bleaching. Increasing sugar concentra-tion decreased the precipitation of tannin and protein-precipitable polymeric pigments (PPP). The use ofa hydrogen bond disruptor (urea) to reduce protein–tannin and protein–pigment complex formationshowed that the effect of sugar concentration occurred by increasing the solubility of the tannin–proteincomplex, not by interfering with protein–tannin complex formation. By increasing the solubility of pig-ment–protein complexes, non-protein-precipitable polymeric pigments (nPPP) appeared to increase.There was also an increase in total polymeric pigments at each tannin concentration with increasing glu-cose and sucrose concentration, indicating that sugar concentration might also affect bisulphite bleachingof wine pigments. While a significant effect of sugar concentration on tannin–protein complex solubilitywas observed, these effects were greatest at sugar concentrations far in excess of normal wine makingconditions. Under normal wine making conditions, sugar concentration will have a negligible effect onprotein-precipitable tannin, PPP and nPPP concentrations.
� 2012 Elsevier Ltd. All rights reserved.
1. Introduction tannin extraction and pigmented polymer formation during wine
Increasingly, tannins and polymeric pigments are routinelymeasured during commercial wine fermentation to evaluateimportant wine quality parameters, such as wine astringency andcolour stability (Harbertson & Spayd, 2006). Because tannins andpolymeric pigments are such important components of the sensoryperception of wine, it is important to evaluate how various grapejuice and wine components impact on the efficacy and thereforethe usefulness or validity of an assay employed to measure tanninsand polymeric pigments. The tannin and polymeric pigment assaybased on protein precipitation is a robust and accessible methodgaining increasing acceptance in the wine industry as well as ingrape and wine research (Harbertson & Spayd, 2006). With increas-ing reliance of the methodology and its incorporation into the busi-ness model of winery production systems, it is important that suchan assay has been thoroughly and critically evaluated under arange of conditions that occur in grape and wine analysis.
Protein precipitation (Hagerman & Butler, 1978; Harbertson,Picciotto, & Adams, 2003) has been adopted by wineries to monitor
ll rights reserved.
: +1 509 786 9370.tson).
making. In tannin protein precipitation assays, an insoluble tan-nin–protein complex (precipitate) is formed (Haslam, 1998; Swain,1965). The commonly used protein for grape and wine tannin anal-ysis is bovine serum albumin (BSA) (Harbertson & Spayd, 2006),which behaves similarly to human saliva in precipitating con-densed tannin. Protein precipitable tannins have been demon-strated to correlate strongly with sensory evaluations ofastringency (Kennedy, Ferrier, Harbertson, & Peyrot des Gachons,2006; Mercurio & Smith, 2008). The long term stability of colourin red wines is also attributed to the presence of condensed tanninin the form of pigmented polymers (Cheynier et al., 2006; Somers,1968).
Protein precipitation has been adapted to measure polymericpigments in combination with bisulphite bleaching (Harbertsonet al., 2003). Polymeric pigments are defined as those pigmentsthat are resistant to bisulphite bleaching. These can be differenti-ated into two classes, protein-precipitable polymeric pigments(PPP) and non-protein-precipitable polymeric pigments (nPPP).Previously these have been called long and short pigmented poly-mers (Harbertson et al., 2003); however the size distinction be-tween these has not been defined. Therefore, in a proteinprecipitation study the revised terminology of precipitable andnon-precipitable pigments is more appropriate.
J.F. Harbertson et al. / Food Chemistry 138 (2013) 556–563 557
It is uncertain to what extent the interaction of tannin with pro-tein and subsequent precipitation might be affected by changes inthe wine matrix, such as decreasing sugar and increasing ethanolconcentration. One of the major changes that occur during winemaking is the alcoholic fermentation of sugar (Boulton, Singleton,Bisson, & Kunkee, 1998). During wine making, the concentrationof soluble sugars changes considerably from a high concentrationat grape harvest and declines during alcoholic fermentation. Typi-cally harvest concentrations of soluble solids can range from 20 to30 �Brix. Commensurately, the concentration of alcohol increasesand can range from 10 to 12% up to 18% alc/vol or more in somewines, but typically for red wines falls in the range of around14–16% alc/vol.
The effect of ethanol on tannin–protein interactions has previ-ously been examined. Increasing ethanol concentration reducesprotein precipitation of tannin in wine compared to an alcohol-freewine (Serafini, Maiani, & Ferro-Luzzi, 1997). However, this wasonly observed to occur above 11% ethanol, not at lower concentra-tions, e.g., 5% ethanol, and the effect has been attributed to disrup-tion of hydrogen bonding (Serafini et al., 1997). Increasing ethanolconcentration has also been reported to decrease co-pigmentationeffects in wine (or at least wine colour) (Hermosín Gutiérrez,2003), although no direct effect on nPPP or PPP has been reported.While hydrogen bond disruptors such as ethanol, urea and caffeineare known to interfere with protein precipitation assays for con-densed tannins (Rowe et al., 2010; Serafini et al., 1997), it is unclearwhether these hydrogen bond disruptors interfere with the tan-nin’s initial interaction with the protein, or alter the solubility ofthe protein–tannin complex.
Grape sugars are primarily sucrose and fructose, but also in-clude a number of other open-chain sugars (Boulton et al., 1998).Some grape sugars (glucose, raffinose) can form stable adductswith bisulphite due to the presence of a free carbonyl functionalgroup and when at high concentrations, such as in juice, they havebeen estimated to bind approximately 50% of the sulphur dioxideadded (Boulton et al., 1998). Fructose binds bisulphite lessstrongly. However it is not clear whether the glucose and raffinosepresent during fermentation interfere with bisulphite bleachingassays for polymeric pigments.
The kosmotropic effect of sugar (and salt) concentration on thesolubility and stability of proteins (including BSA) has previouslybeen explored (Arakawa, Kita, & Carpenter, 1991). This work con-cluded that sugars decreased the solubility of proteins and stabi-lised them against denaturation (e.g., unfolding) by increasingthe surface tension of water, and while interaction with the proteinmay occur through hydrogen bonding, hydrophobic interactions orelectrostatic interactions, these were outweighed by the impact onsurface tension. Where the binding forces were stronger, proteinsolubility increased or the structure was destabilised (denatured).The implication of this for an assay that relies on precipitation of aprotein–tannin complex is that the complex may be less soluble ina solution where sugar is present and decreases the effectiveness ofthe assay. To the best of our knowledge the effect of sugarconcentration on the precipitation by protein of condensed tanninhas not been investigated. Based on previous work, a reasonablehypothesis might be that sugar would decrease solubility of theprotein–tannin complex, potentially increasing precipitation oftannin–protein complexes that might otherwise remain in solutionand thereby increase the measured concentration of precipitatedtannin.
This work aimed to determine what effect sugar concentrationhad on the formation and precipitation of protein–tannin com-plexes necessary for measuring protein precipitable tannin andwhether sugars would interfere with the effectiveness of bisulphitebleaching used in determining precipitable and non-precipitablepolymeric pigments in wines and fermenting musts.
2. Materials and methods
2.1. Chemicals
Sucrose, D-glucose, D-fructose, urea, potassium metabisulphite,bovine serum albumin (BSA, fraction V, lyophilised powder), so-dium dodecyl sulphate (SDS, lauryl sulphate, sodium salt, 95%), tri-ethanolamine (TEA, 98%), ferric chloride hexahydrate (98%), and(+)-catechin hydrate (98%, powder) were purchased from Sigma(St. Louis, MO), as were materials for preparing buffers used inanalyses. Reagents were prepared (Harbertson et al., 2003) andstored (Heredia, Adams, Fields, Held, & Harbertson, 2006) as de-scribed elsewhere.
2.2. Tannin analysis
Tannin analysis was performed as described previously (Hager-man & Butler, 1978) with minor modifications. The method is avariation on an existing method modified to incorporate measuresof pigmented polymers (Harbertson, Kennedy, & Adams, 2002).Briefly, 500-lL aliquots of red wine diluted into a model wine buf-fer containing 5 g/L potassium bitartrate adjusted to pH 3.3 withHCl were added to 1 mL of pH 4.9, 200 mM acetic acid, 170 mMNaCl containing 1.5 mg/mL BSA and incubated at room tempera-ture for 15 min. Samples were then centrifuged at 13,500�g for5 min to form a pellet with a clear supernatant. The supernatantwas discarded, and the remaining pellet was incubated for10 min after adding 875 lL TEA buffer containing 5% TEA (v/v)and 5% SDS (w/v) adjusted to pH 9.4 with HCl. After the incubationperiod the sample was mixed mechanically to dissolve the tannin–protein pellet. To each sample, a 125-lL aliquot of ferric chloridereagent containing 10 mM FeCl3 in 0.01 N HCl was added to thetube and allowed to stand at room temperature for 10 min. Afterthe incubation period the absorbance at 510 nm was determinedin a Beckman DU 640 spectrophotometer (Fullerton, CA) usingthe TEA buffer as a blank. Tannin values are reported in catechinequivalents (C.E.) as described by Harbertson et al. (2002).
2.3. Polymeric pigment analysis
Protein-precipitable polymeric pigments (PPP) and non-pro-tein-precipitable pigments (nPPP) were measured in the wine aspreviously described (Harbertson et al., 2003). Briefly, followingaddition of the sample containing tannin (and polymeric pigments)and centrifugation of the tannin–protein complex the supernatantis transferred to a fresh microfuge tube and potassium metab-isulphite is added, and absorbance at 520 nm is recorded. This va-lue represents non-protein-precipitable tannins (nPPP). Totalpolymeric pigments (TPP) are determined by recording the absor-bance (520 nm) of the sample containing tannin and the assay buf-fer without protein. Protein-precipitable polymeric pigments (PPP)are calculated as the difference between TPP and nPPP. The analy-sis for each sugar and each dilution was conducted separatelyincluding 0 g/L with four analytical replicates (n = 4). Data for eachanalysis were analysed and presented separately. Thus, in Fig. 3,differences were reported for 0 g/L sugar where theoretically thereshould be none. These are exaggerated for PPP where this numberis derived by subtraction and by the y-axis scale.
2.4. Sugar effect on the polymeric pigment and tannin of wine
Various amounts of urea and sugars (glucose, fructose, sucroseand raffinose) were added at different concentrations during thetannin analysis in the place of the normal model wine buffer todetermine the impact of the concentration of sugars or urea on
558 J.F. Harbertson et al. / Food Chemistry 138 (2013) 556–563
protein precipitation analysis for red wine tannins. While sucroseis not a major grape sugar, it has been included here for compara-tive purposes.
The tannin assay dilution was also varied to simulate differentconcentrations of tannin that might be present during a red winefermentation. A red wine (Cabernet Sauvignon, Mattawa, WA2008) was added such that the final assay dilution of the winewas 13.3-, 10.0- and 6.67-fold. This was achieved by adding 75,100, or 150 lL of red wine during the analysis. For the additionsof sucrose, glucose, fructose, raffinose and urea, each compoundwas dissolved in water to make stock solution of 1.0 g/mL. As thisconcentration is approaching saturation, in some cases, we verifiedthe concentration of the stock solution with a handheld densitymeter (DMA-35N; Anton Paar GmbH, Graz, Austria).
To achieve final assay concentrations of 66.67 mg/mL,133.3 mg/mL, 200.0 mg/mL and 266.7 mg/mL of sucrose, glucose,fructose, raffinose and urea, 100, 200, 300, or 400 lL of the appro-priate stock solution were added. Since the final volume target forthe sample was 500 lL as in the standard analysis of tannins, theadditional volume was made up with water to keep the total assayvolume at 1.5 mL. Furthermore, for the 6.67-fold tannin dilutiononly, 350 lL of stock solution was added to keep the total assayvolume constant. The sugars and urea were added to the proteinsolution and then the red wine sample was added. In each casethe analysis was carried out in four replicates (n = 4).
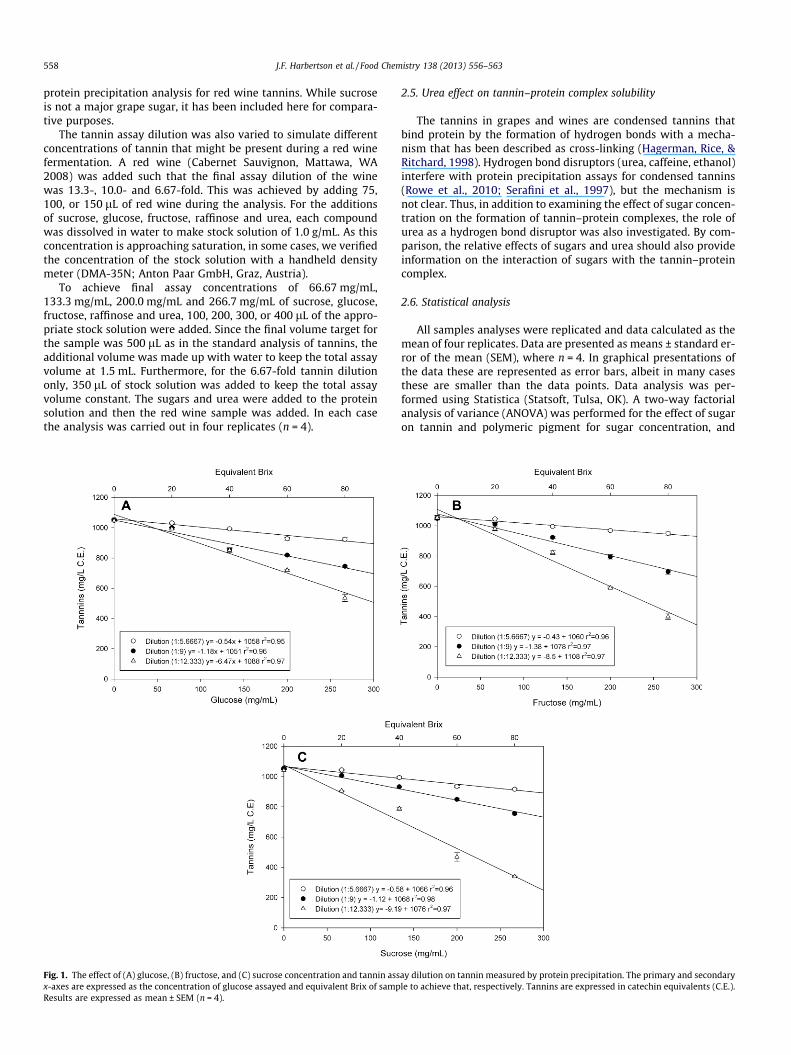
Fig. 1. The effect of (A) glucose, (B) fructose, and (C) sucrose concentration and tannin assx-axes are expressed as the concentration of glucose assayed and equivalent Brix of sampResults are expressed as mean ± SEM (n = 4).
2.5. Urea effect on tannin–protein complex solubility
The tannins in grapes and wines are condensed tannins thatbind protein by the formation of hydrogen bonds with a mecha-nism that has been described as cross-linking (Hagerman, Rice, &Ritchard, 1998). Hydrogen bond disruptors (urea, caffeine, ethanol)interfere with protein precipitation assays for condensed tannins(Rowe et al., 2010; Serafini et al., 1997), but the mechanism isnot clear. Thus, in addition to examining the effect of sugar concen-tration on the formation of tannin–protein complexes, the role ofurea as a hydrogen bond disruptor was also investigated. By com-parison, the relative effects of sugars and urea should also provideinformation on the interaction of sugars with the tannin–proteincomplex.
2.6. Statistical analysis
All samples analyses were replicated and data calculated as themean of four replicates. Data are presented as means ± standard er-ror of the mean (SEM), where n = 4. In graphical presentations ofthe data these are represented as error bars, albeit in many casesthese are smaller than the data points. Data analysis was per-formed using Statistica (Statsoft, Tulsa, OK). A two-way factorialanalysis of variance (ANOVA) was performed for the effect of sugaron tannin and polymeric pigment for sugar concentration, and
ay dilution on tannin measured by protein precipitation. The primary and secondaryle to achieve that, respectively. Tannins are expressed in catechin equivalents (C.E.).
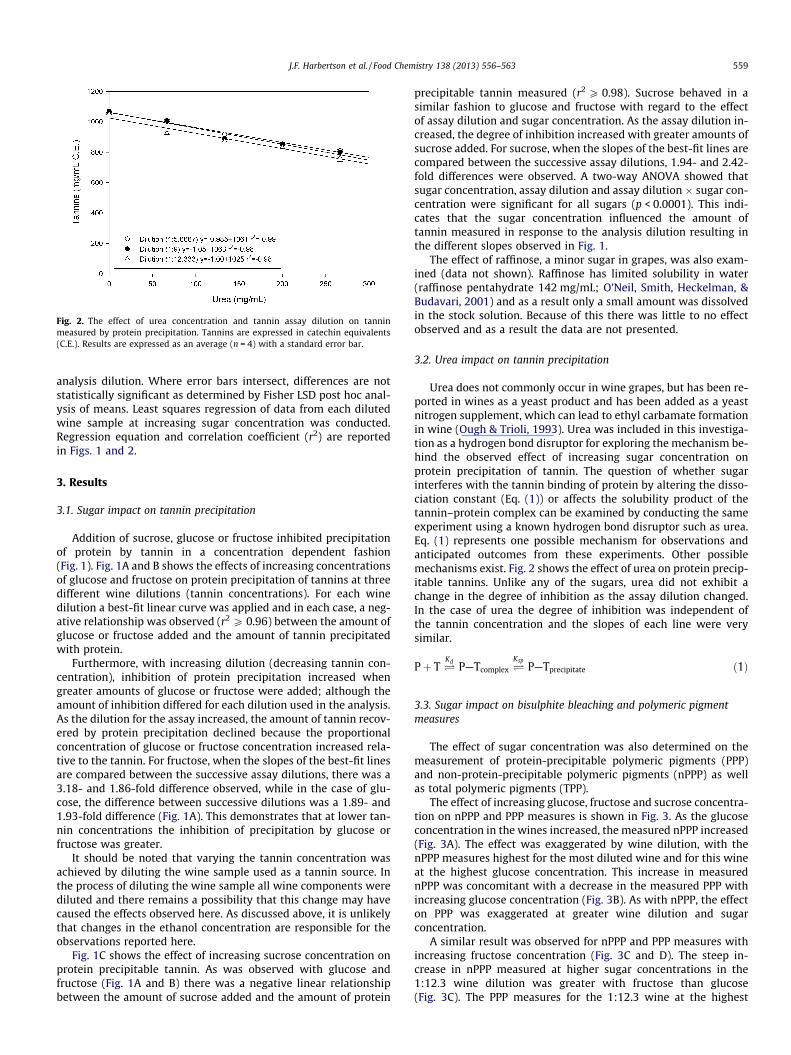
Fig. 2. The effect of urea concentration and tannin assay dilution on tanninmeasured by protein precipitation. Tannins are expressed in catechin equivalents(C.E.). Results are expressed as an average (n = 4) with a standard error bar.
J.F. Harbertson et al. / Food Chemistry 138 (2013) 556–563 559
analysis dilution. Where error bars intersect, differences are notstatistically significant as determined by Fisher LSD post hoc anal-ysis of means. Least squares regression of data from each dilutedwine sample at increasing sugar concentration was conducted.Regression equation and correlation coefficient (r2) are reportedin Figs. 1 and 2.
3. Results
3.1. Sugar impact on tannin precipitation
Addition of sucrose, glucose or fructose inhibited precipitationof protein by tannin in a concentration dependent fashion(Fig. 1). Fig. 1A and B shows the effects of increasing concentrationsof glucose and fructose on protein precipitation of tannins at threedifferent wine dilutions (tannin concentrations). For each winedilution a best-fit linear curve was applied and in each case, a neg-ative relationship was observed (r2 P 0.96) between the amount ofglucose or fructose added and the amount of tannin precipitatedwith protein.
Furthermore, with increasing dilution (decreasing tannin con-centration), inhibition of protein precipitation increased whengreater amounts of glucose or fructose were added; although theamount of inhibition differed for each dilution used in the analysis.As the dilution for the assay increased, the amount of tannin recov-ered by protein precipitation declined because the proportionalconcentration of glucose or fructose concentration increased rela-tive to the tannin. For fructose, when the slopes of the best-fit linesare compared between the successive assay dilutions, there was a3.18- and 1.86-fold difference observed, while in the case of glu-cose, the difference between successive dilutions was a 1.89- and1.93-fold difference (Fig. 1A). This demonstrates that at lower tan-nin concentrations the inhibition of precipitation by glucose orfructose was greater.
It should be noted that varying the tannin concentration wasachieved by diluting the wine sample used as a tannin source. Inthe process of diluting the wine sample all wine components werediluted and there remains a possibility that this change may havecaused the effects observed here. As discussed above, it is unlikelythat changes in the ethanol concentration are responsible for theobservations reported here.
Fig. 1C shows the effect of increasing sucrose concentration onprotein precipitable tannin. As was observed with glucose andfructose (Fig. 1A and B) there was a negative linear relationshipbetween the amount of sucrose added and the amount of protein
precipitable tannin measured (r2 P 0.98). Sucrose behaved in asimilar fashion to glucose and fructose with regard to the effectof assay dilution and sugar concentration. As the assay dilution in-creased, the degree of inhibition increased with greater amounts ofsucrose added. For sucrose, when the slopes of the best-fit lines arecompared between the successive assay dilutions, 1.94- and 2.42-fold differences were observed. A two-way ANOVA showed thatsugar concentration, assay dilution and assay dilution � sugar con-centration were significant for all sugars (p < 0.0001). This indi-cates that the sugar concentration influenced the amount oftannin measured in response to the analysis dilution resulting inthe different slopes observed in Fig. 1.
The effect of raffinose, a minor sugar in grapes, was also exam-ined (data not shown). Raffinose has limited solubility in water(raffinose pentahydrate 142 mg/mL; O’Neil, Smith, Heckelman, &Budavari, 2001) and as a result only a small amount was dissolvedin the stock solution. Because of this there was little to no effectobserved and as a result the data are not presented.
3.2. Urea impact on tannin precipitation
Urea does not commonly occur in wine grapes, but has been re-ported in wines as a yeast product and has been added as a yeastnitrogen supplement, which can lead to ethyl carbamate formationin wine (Ough & Trioli, 1993). Urea was included in this investiga-tion as a hydrogen bond disruptor for exploring the mechanism be-hind the observed effect of increasing sugar concentration onprotein precipitation of tannin. The question of whether sugarinterferes with the tannin binding of protein by altering the disso-ciation constant (Eq. (1)) or affects the solubility product of thetannin–protein complex can be examined by conducting the sameexperiment using a known hydrogen bond disruptor such as urea.Eq. (1) represents one possible mechanism for observations andanticipated outcomes from these experiments. Other possiblemechanisms exist. Fig. 2 shows the effect of urea on protein precip-itable tannins. Unlike any of the sugars, urea did not exhibit achange in the degree of inhibition as the assay dilution changed.In the case of urea the degree of inhibition was independent ofthe tannin concentration and the slopes of each line were verysimilar.
Pþ T �Kd
P—Tcomplex �Ksp
P—Tprecipitate ð1Þ
3.3. Sugar impact on bisulphite bleaching and polymeric pigmentmeasures
The effect of sugar concentration was also determined on themeasurement of protein-precipitable polymeric pigments (PPP)and non-protein-precipitable polymeric pigments (nPPP) as wellas total polymeric pigments (TPP).
The effect of increasing glucose, fructose and sucrose concentra-tion on nPPP and PPP measures is shown in Fig. 3. As the glucoseconcentration in the wines increased, the measured nPPP increased(Fig. 3A). The effect was exaggerated by wine dilution, with thenPPP measures highest for the most diluted wine and for this wineat the highest glucose concentration. This increase in measurednPPP was concomitant with a decrease in the measured PPP withincreasing glucose concentration (Fig. 3B). As with nPPP, the effecton PPP was exaggerated at greater wine dilution and sugarconcentration.
A similar result was observed for nPPP and PPP measures withincreasing fructose concentration (Fig. 3C and D). The steep in-crease in nPPP measured at higher sugar concentrations in the1:12.3 wine dilution was greater with fructose than glucose(Fig. 3C). The PPP measures for the 1:12.3 wine at the highest
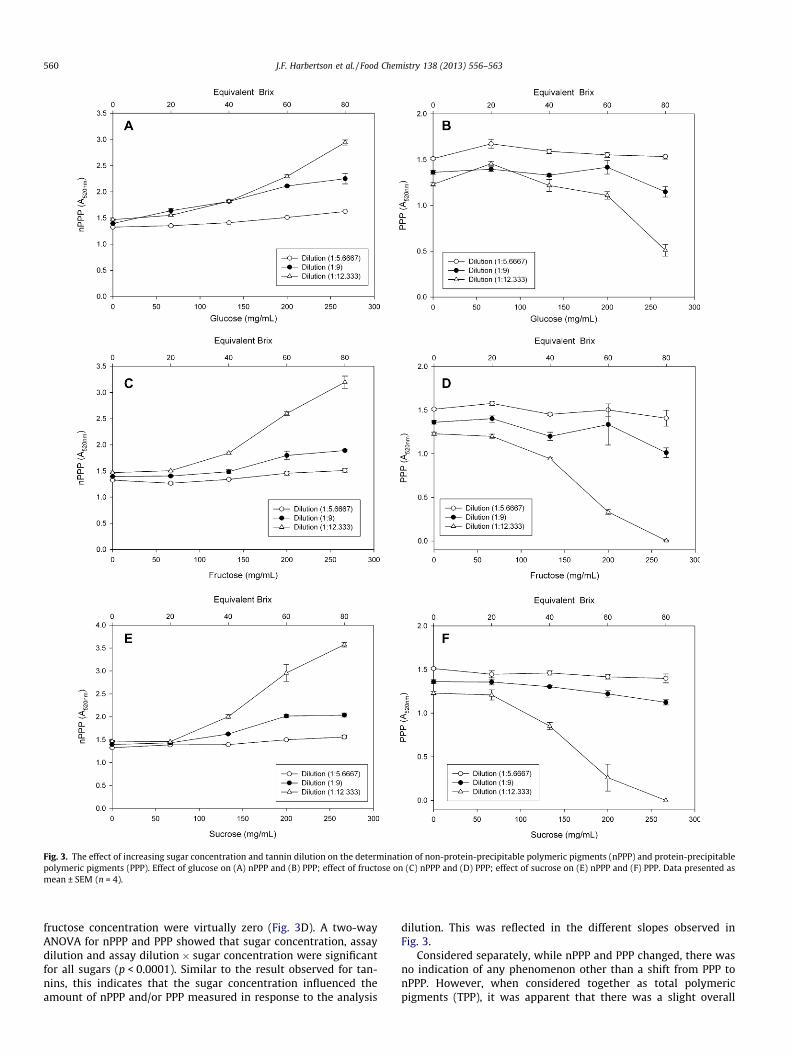
Fig. 3. The effect of increasing sugar concentration and tannin dilution on the determination of non-protein-precipitable polymeric pigments (nPPP) and protein-precipitablepolymeric pigments (PPP). Effect of glucose on (A) nPPP and (B) PPP; effect of fructose on (C) nPPP and (D) PPP; effect of sucrose on (E) nPPP and (F) PPP. Data presented asmean ± SEM (n = 4).
560 J.F. Harbertson et al. / Food Chemistry 138 (2013) 556–563
fructose concentration were virtually zero (Fig. 3D). A two-wayANOVA for nPPP and PPP showed that sugar concentration, assaydilution and assay dilution � sugar concentration were significantfor all sugars (p < 0.0001). Similar to the result observed for tan-nins, this indicates that the sugar concentration influenced theamount of nPPP and/or PPP measured in response to the analysis
dilution. This was reflected in the different slopes observed inFig. 3.
Considered separately, while nPPP and PPP changed, there wasno indication of any phenomenon other than a shift from PPP tonPPP. However, when considered together as total polymericpigments (TPP), it was apparent that there was a slight overall
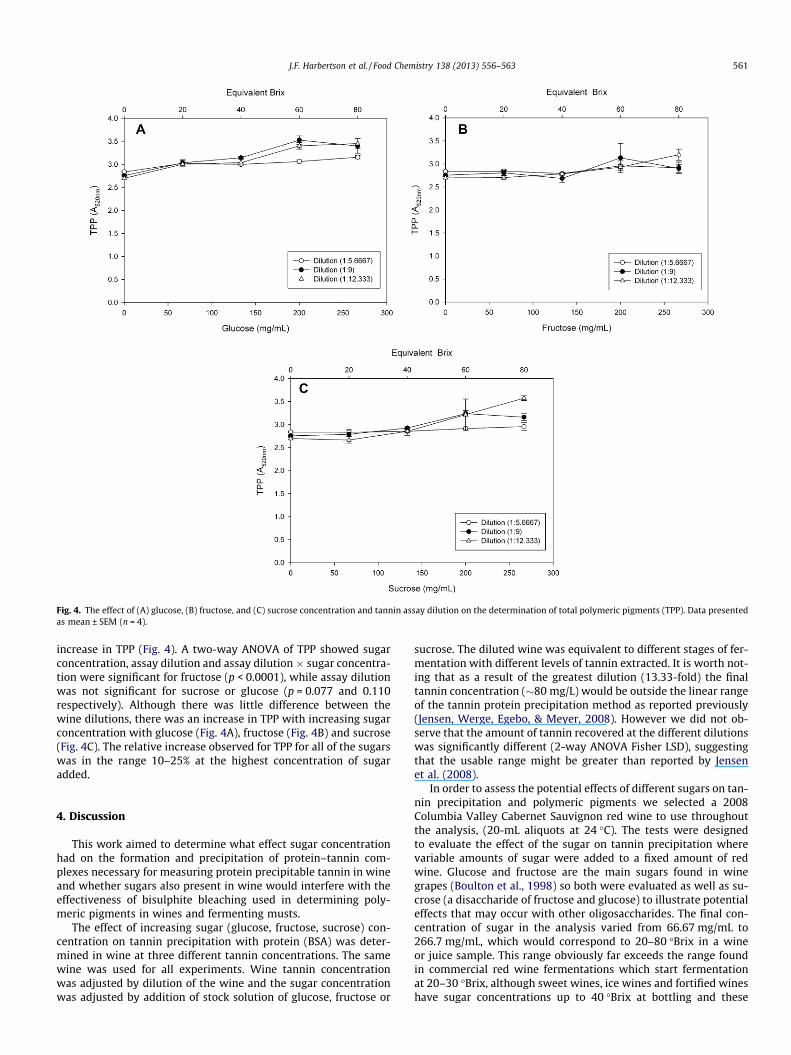
Fig. 4. The effect of (A) glucose, (B) fructose, and (C) sucrose concentration and tannin assay dilution on the determination of total polymeric pigments (TPP). Data presentedas mean ± SEM (n = 4).
J.F. Harbertson et al. / Food Chemistry 138 (2013) 556–563 561
increase in TPP (Fig. 4). A two-way ANOVA of TPP showed sugarconcentration, assay dilution and assay dilution � sugar concentra-tion were significant for fructose (p < 0.0001), while assay dilutionwas not significant for sucrose or glucose (p = 0.077 and 0.110respectively). Although there was little difference between thewine dilutions, there was an increase in TPP with increasing sugarconcentration with glucose (Fig. 4A), fructose (Fig. 4B) and sucrose(Fig. 4C). The relative increase observed for TPP for all of the sugarswas in the range 10–25% at the highest concentration of sugaradded.
4. Discussion
This work aimed to determine what effect sugar concentrationhad on the formation and precipitation of protein–tannin com-plexes necessary for measuring protein precipitable tannin in wineand whether sugars also present in wine would interfere with theeffectiveness of bisulphite bleaching used in determining poly-meric pigments in wines and fermenting musts.
The effect of increasing sugar (glucose, fructose, sucrose) con-centration on tannin precipitation with protein (BSA) was deter-mined in wine at three different tannin concentrations. The samewine was used for all experiments. Wine tannin concentrationwas adjusted by dilution of the wine and the sugar concentrationwas adjusted by addition of stock solution of glucose, fructose or
sucrose. The diluted wine was equivalent to different stages of fer-mentation with different levels of tannin extracted. It is worth not-ing that as a result of the greatest dilution (13.33-fold) the finaltannin concentration (�80 mg/L) would be outside the linear rangeof the tannin protein precipitation method as reported previously(Jensen, Werge, Egebo, & Meyer, 2008). However we did not ob-serve that the amount of tannin recovered at the different dilutionswas significantly different (2-way ANOVA Fisher LSD), suggestingthat the usable range might be greater than reported by Jensenet al. (2008).
In order to assess the potential effects of different sugars on tan-nin precipitation and polymeric pigments we selected a 2008Columbia Valley Cabernet Sauvignon red wine to use throughoutthe analysis, (20-mL aliquots at 24 �C). The tests were designedto evaluate the effect of the sugar on tannin precipitation wherevariable amounts of sugar were added to a fixed amount of redwine. Glucose and fructose are the main sugars found in winegrapes (Boulton et al., 1998) so both were evaluated as well as su-crose (a disaccharide of fructose and glucose) to illustrate potentialeffects that may occur with other oligosaccharides. The final con-centration of sugar in the analysis varied from 66.67 mg/mL to266.7 mg/mL, which would correspond to 20–80 �Brix in a wineor juice sample. This range obviously far exceeds the range foundin commercial red wine fermentations which start fermentationat 20–30 �Brix, although sweet wines, ice wines and fortified wineshave sugar concentrations up to 40 �Brix at bottling and these
562 J.F. Harbertson et al. / Food Chemistry 138 (2013) 556–563
concentrations may be higher during vinification. Additional highconcentrations were included to exaggerate the results better todemonstrate the effect of sugar concentration on proteinprecipitation.
The amount of red wine added was changed to determine theeffect of sugar on protein precipitation of tannin when there weredifferent amounts of tannin present in solution. This was achievedby diluting the wine 6.67-, 10.0- and 13.3-fold. This was done in aneffort to simulate the conditions present during the early stages ofred wine fermentation where very low tannin and polymeric pig-ment concentrations are observed (Harbertson, Mireles, Harwood,Weller, & Ross, 2009). In each of the applicable plots the secondaryx-axis shows the �Brix scale relative to the sugar concentration(primary x-axis) in the assay achieved by accounting for dilutionin the assay. Further, in each plot the dilution factor was used tocalculate the tannin and polymeric pigment concentration presentin the sample so that the experiments could be evaluated on thesame scale. In effect, this design captures three snapshots of fer-mentation with decreasing sugar concentration during alcoholicfermentation and increasing tannin concentration due to extrac-tion from the seeds and skin of the grapes. Admittedly, the twohighest sugar concentrations, while highlighting the trend, are be-yond what would be expected in a normal wine making scenario,yet they also demonstrate the relationships remain linear at thesehigher concentrations and therefore interpolation anywhere with-in this range is likely to be valid.
In addition to changes in tannin, pigmented polymer and sugarconcentrations during wine making, the conversion of sugar to alco-hol by yeasts results in increasing alcohol concentrations (Boultonet al., 1998). As mentioned above, ethanol is also a hydrogen bonddisruptor and had the potential to confound the results of thisinvestigation. However, it should be noted that while the originalwine had 14% alcohol (v/v), upon dilution the 5.67-fold diluted winehad 2.47% ethanol, the 10.0-fold diluted wine had 1.4% ethanol andthe 13.3-fold diluted wine had 1.05% ethanol (v/v). Based on thepublished work by Serafini et al. (1997) that showed no effect ofethanol on protein precipitation below 11% ethanol and the workof Hagerman et al. (1998) indicate no effect up to 25% methanol,it is considered that there would be a negligible effect of ethanolon protein precipitation in the work reported here.
Ethanol also affects the solubility of condensed tannin (Downey& Hanlin, 2010; Poncet-Legrand, Cartalade, Putaux, Cheynier, &Vernhet, 2003) with tannin increasingly soluble at high ethanolconcentrations up to 50% (v/v) and much less soluble below 5%(v/v). In theory therefore, we would expect to see a decrease in tan-nin concentration and tannin precipitation at all wine dilutions,which was observed, and that this would be constant, i.e. the linesin Fig. 1 would be parallel, if there was no additional effect of theadded sugar. That this was not observed indicates a sugar effect;at increasing sugar concentrations even less tannin was precipi-tated. Because the aim of this work was not to examine the tanninsolubility in ethanol, ethanol concentration was not controlled(e.g., constant ethanol concentration at all tannin dilutions). Argu-ably it would have been more thorough to separate the additive ef-fects of decreasing tannin concentration and decreasing tanninsolubility; however, the overall effect of less tannin in each succes-sive dilution remains the same and, as described above, ethanol atthe concentrations in the assay is unlikely to affect proteinprecipitation.
Increasing sugar (glucose, fructose, sucrose) concentration de-creased, or inhibited, tannin precipitation, i.e. increased solubilityof the protein–tannin complex. This is not consistent with the con-clusions of Arakawa et al. (1991) that sugar decreases protein sol-ubility, which would suggest that at higher sugar concentrationsprotein–tannin complex solubility would be decreased, i.e. precip-itation of the protein–tannin complex would increase. Rather than
the salting out effect previously reported, we have observed whatappears to be ‘‘salting in’’ of the tannin–protein complex by glu-cose, fructose and sucrose.
In the diluted wines; even less tannin was precipitated as sugarconcentration increased. This indicates an additive effect of in-creased sugar and decreased tannin concentration, but it is uncer-tain what would cause this.
If sugar was interfering with the hydrogen-bonding betweentannins and protein, the expected observation would be decreasedtannin precipitation with increasing sugar concentration, but theextent to which that occurred would be constant at a given sugarconcentration, i.e. it would be independent of tannin concentra-tion. Because this was not observed, the glucose/fructose/sucrosewas not preventing the tannin from binding with the protein. Infact, the effect of the sugar may have been to increase the affinityof tannin for protein, by increasing hydrogen bonding betweentannin and protein and thereby increasing protein solubility.
If we consider the schematic for tannin–protein complex forma-tion and precipitation (Eq. (1)), we notice that this is a two-stageprocess: first formation of the complex and second, precipitationof the complex. We have hypothesised that sugar does not altercomplex formation (Kd), therefore it must affect the solubility ofthe complex (Ksp). We can confirm this by looking at the effect ofurea, a chaotropic agent and hydrogen bond disruptor (Le Bourvel-lec, Guyot, & Renard, 2004). When urea was added to the system atincreasing concentration, there was a clear reduction in tannin mea-sured by protein precipitation, but this was independent of tannin(and ethanol) concentration (Fig. 2). Clearly urea interferes withtannin–protein complex formation, most likely by disrupting hydro-gen bonding between tannin and the protein; sugar therefore mustaffect solubility of the complex. The more sugar (glucose/fructose/sucrose) that is added to the system the greater the number of tan-nin–protein complexes that remain in solution. When the tanninconcentration is decreased the effect is amplified because at lowtannin concentration it takes less sugar to overcome the insolubilityof the complex. Hence solubility is not an on-and-off phenomenon,but a continuous variable; the more tannin that is associated withthe same amount of protein the more insoluble the complex be-comes and the more sugar that is required to keep it in solution.
A similar principle affects PPP and nPPP: with increasing sugarthe PPP are increasingly soluble. Because these PPP do not precip-itate at high sugar concentration they are by definition nPPP. Thus,with increasing sugar, the relative proportions of nPPP and PPP areshifted artificially; nPPP and PPP concentrations at high sugar con-centrations are an artefact of the sugar concentration. At higherdilution (lower tannin concentration) even less PPP precipitatesuntil virtually no PPP is detected; at very high sugar concentrationsall pigmented polymers will appear to be nPPP. This in itself is aninteresting observation, but does not address the question of theeffect of sugar on bisulphite bleaching. Pigmented polymers aredefined as the pigments in wine that are resistant to bisulphitebleaching. If sugar interfered with bisulphite bleaching, an increasein all polymeric pigments (nPPP and PPP) would be observed. How-ever, due to the changing solubility of PPP with increasing sugarand the shift between PPP and nPPP, this effect was not observedor was obscured.
By examining TPP with increasing sugar concentration we sawthat TPP increased with sugar concentration. This indicates that su-gar might affect bisulphite bleaching of anthocyanins. Because ofthe interference of the sugar, some anthocyanins will appear tobe resistant to bisulphite bleaching and being non-protein-precip-itable, will appear as in increase in nPPP. Consistent with previousreports (Boulton et al., 1998), this effect was observed with glu-cose, but to a much lesser extent with fructose. Thus, the data ap-pear to indicate that sucrose interferes with bisulphite bleaching ofanthocyanins.
J.F. Harbertson et al. / Food Chemistry 138 (2013) 556–563 563
However, sugars could also alter the extinction coefficient of theanthocyanins and polymeric pigments, or promote formation ofintramolecular co-pigmented complexes that would cause anapparent increase in absorbance (Boulton, 2001). We did observean increase in the total absorbance at 520 nm prior to the sulphurdioxide bleaching (data not shown) and an increase of about 10–25% in TPP, which would be consistent with this line of thinking.In previous work evaluating the influence of sugar on anthocyaninstability, it was found that sucrose had a protective effect onanthocyanins during storage (Wrolstad, Skrede, Lea, & Enersen,1990). Polymeric pigments determined by bisulphite bleachingdid not to change as a result of the sugar addition, although antho-cyanins were 13–27% higher for all concentrations of sucroseadded. This is consistent with a hypothesis that sugar alters absor-bance of anthocyanins. However, these workers did not separatethe sugar effect from the anthocyanin measure itself. To the bestof our knowledge the effect of sugar concentration on the molarextinction coefficient of anthocyanins has not been directly inves-tigated. Nevertheless, the results of Wrolstad et al. (1990) suggestthat changes in the extinction coefficient of anthocyanins, or ofpolymeric pigments, may have caused the observed increase inTPP. Thus, it is difficult to conclude that there was an effect of sugaron bisulphite bleaching when sugar could have altered absorbanceand this has not been specifically tested or controlled for.
In grape juices and wines at the start of wine making, sugar lev-els are typically 20–30 �Brix. This range is close to the lower end ofthe experimental range utilised in the research presented here. Atthese concentrations the effect of sugar on protein precipitationwas less than at the higher concentrations and for glucose andfructose there was no significant difference in tannin precipitationat 20 �Brix. In finished dry red wines the sugar concentration istypically around 0.1–0.2 �Brix.
During fermentation, the concentration of sugar decreases,which indicates that only in freshly crushed juices from very ripeor over-ripe fruit would the sugar concentration be likely to inter-fere with tannin or polymeric pigment measures. The effect of thesugars on tannin and polymeric pigment measurement at the sugarconcentrations found in wines is likely to be fairly small, so theoverall implication for measuring tannin, even early in fermenta-tion, is minimal. Similarly the impact on the partitioning betweennPPP and PPP was fairly low at wine sugar concentrations and theamount of bisulphite added to wine is usually so great that therewould be a negligible effect on measures of polymeric pigments.
5. Conclusion
The effect of sugar concentration on measures of protein precip-itable tannins and pigmented polymers was determined in winesamples with different tannin and sugar concentrations. Additionof sucrose, glucose or fructose decreased protein precipitation oftannin in a concentration-dependent fashion. This occurred as a re-sult of sugar increasing the solubility of the tannin–protein com-plex. Increased sugar concentration in the samples also increasednPPP and decreased PPP by increasing the solubility of PPP suchthat it did not precipitate. These observations occurred at sugarconcentrations far in excess of those found in grape juices andwines. At the sugar concentrations observed in wine fermenta-tions, the effect on tannin and pigmented polymer measures basedon protein precipitation is likely to be minimal.
Acknowledgements
The research was supported by the Victorian Department of Pri-mary Industries (DPI) and by the grapegrowers and wine makers of
Australian through their investment body, the Grape and Wine Re-search and Development Corporation. Dr James F. Harbertson wassupported by a DPI visiting fellows grant to undertake thisresearch.
References
Arakawa, T., Kita, Y., & Carpenter, J. F. (1991). Protein–solvent interactions inpharmaceutical formulations. Pharmaceutical Research, 8(3), 285–291.
Boulton, R. (2001). The copigmentation of anthocyanins and its role in the colour ofred wine: A critical review. American Journal of Enology and Viticulture, 52(2),67–87.
Boulton, R. B., Singleton, V. L., Bisson, L. F., & Kunkee, R. E. (1998). Principles andpractices of winemaking. New York: Chapman & Hall.
Cheynier, V., Dueñas-Paton, M., Salas, E., Maury, C., Souquet, J.-M., Sarni-Manchado,P., et al. (2006). Structure and properties of wine pigments and tannins.American Journal of Enology and Viticulture, 57(3), 298–305.
Downey, M. O., & Hanlin, R. L. (2010). Comparison of ethanol and acetone mixturesfor extraction of condensed tannin from grape skin. South African Journal ofEnology and Viticulture, 3(2), 154–159.
Hagerman, A. E., & Butler, L. G. (1978). Protein precipitation method for thequantitative determination of tannins. Journal of Agricultural and Food Chemistry,26(4), 809–812.
Hagerman, A. E., Rice, M. E., & Ritchard, N. T. (1998). Mechanisms of proteinprecipitation for two tannins, pentagalloylglucose and epicatechin16(4-8)catechin (procyanidin). Journal of Agricultural and Food Chemistry, 46,2590–2595.
Harbertson, J. F., Kennedy, J. A., & Adams, D. O. (2002). Tannin in skins and seeds ofCabernet Sauvignon, Syrah, and Pinot noir during ripening. American Journal ofEnology and Viticulture, 53(1), 54–59.
Harbertson, J. F., Mireles, M. S., Harwood, E. D., Weller, K. M., & Ross, C. F. (2009).Chemical and sensory effects of saignée, water addition, and extendedmaceration on high Brix must. American Journal of Enology and Viticulture,60(4), 450–460.
Harbertson, J. F., Picciotto, E. A., & Adams, D. O. (2003). Measurements of polymericpigments in grape berry extracts and wines using a protein precipitation assaycombined with bisulphite bleaching. American Journal of Enology and Viticulture,54(4), 301–306.
Harbertson, J. F., & Spayd, S. (2006). Measuring phenolics in the winery. AmericanJournal of Enology and Viticulture, 57(3), 280–288.
Haslam, E. (1998). Practical polyphenolics: From structure to molecular recognition andphysiological action (1st ed.). Cambridge: Cambridge University Press.
Heredia, T. M., Adams, D. O., Fields, K. C., Held, P. G., & Harbertson, J. F. (2006).Evaluation of a comprehensive red wine phenolics assay using a microplatereader. American Journal of Enology and Viticulture, 57(4), 497–502.
Hermosín Gutiérrez, I. (2003). Influence of ethanol content on the extent ofcopigmentation in a Cencibel young red wine. Journal of Agricultural and FoodChemistry, 51(14), 4079–4083.
Jensen, J. S., Werge, H. H. M., Egebo, M., & Meyer, A. S. (2008). Effect of wine dilutionon the reliability of tannin analysis by protein precipitation. American Journal ofEnology and Viticulture, 59(1), 103–105.
Kennedy, J. A., Ferrier, J., Harbertson, J. F., & Peyrot des Gachons, C. (2006). Analysisof tannins in red wine using multiple methods: Correlation with perceivedastringency. American Journal of Enology and Viticulture, 57(4), 481–485.
Le Bourvellec, C., Guyot, S., & Renard, C. M. G. C. (2004). Non-covalent interactionbetween procyanidins and apple cell wall material. Part I. Effect of someenvironmental parameters. Biochimica et Biophysica Acta, 1672(3), 192–202.
Mercurio, M. D., & Smith, P. A. (2008). Tannin quantification in red grapes and wine:Comparison of polysaccharide- and protein-based tannin precipitationtechniques and their ability to model wine astringency. Journal of Agriculturaland Food Chemistry, 56(14), 5528–5537.
O’Neil, M. J., Smith, A., Heckelman, P. E., & Budavari, S. (2001). The Merck index (13thed.). Whitehouse Station: Merck & Co., Inc..
Ough, C., & Trioli, G. (1993). Urea removal from wine by an acid urease. AmericanJournal of Enology and Viticulture, 39(4), 303–307.
Poncet-Legrand, C., Cartalade, D., Putaux, J.-L., Cheynier, V., & Vernhet, A. (2003).Flavan-3-ol aggregation in model ethanolic solutions: Incidence of polyphenolstructure, concentration, ethanol content, and ionic strength. Langmuir, 19(25),10563–10572.
Rowe, J. D., Harbertson, J. F., Osborne, J. P., Freitag, M., Lim, J., & Bakalinsky, A. T.(2010). Systematic identification of yeast proteins extracted into model wineduring aging on the yeast lees. Journal of Agricultural and Food Chemistry, 58,2337–2346.
Serafini, M., Maiani, G., & Ferro-Luzzi, A. (1997). Effect of ethanol on red winetannin–protein (BSA) interactions. Journal of Agricultural and Food Chemistry, 45,3148–3151.
Somers, C. (1968). Pigment profiles of grapes and of wines. Vitis, 7, 303–320.Swain, T. (1965). The tannins. In J. F. Bonner & J. E. Varner (Eds.), Plant biochemistry
(pp. 552–580). New York: Academic Press.Wrolstad, R. E., Skrede, G., Lea, P., & Enersen, G. (1990). Influence of sugar on
anthocyanin pigment stability in frozen strawberries. Journal of Food Science,55(4), 1064–1065. 1072.