Correspondence of continuous interstitial glucose measurement against arterialised and capillary...
7
Correspondence of continuous interstitial glucose measurement against arterialised and capillary glucose following an oral glucose tolerance test in healthy volunteers Louise Dye 1 *, Michael Mansfield 2 , Nicola Lasikiewicz 1 , Lena Mahawish 2 , Rainer Schnell 3 , Duncan Talbot 4 , Hitesh Chauhan 4 , Fiona Croden 1 and Clare Lawton 1 1 Human Appetite Research Unit, Institute of Psychological Sciences, University of Leeds, Leeds LS2 9JT, UK 2 The Diabetes Centre, St James’s University Hospital, Leeds LS9 7TF, UK 3 University of Duisburg-Essen, Lotharstr. 65, D-47057 Duisburg, Germany 4 Unilever R&D, Colworth Science Park, Sharnbrook, Bedfordshire MK44 1LQ, UK (Received 4 November 2008 – Revised 8 June 2009 – Accepted 8 June 2009 – First published online 13 August 2009) The aim of the present study was to validate the Glucoday w continuous interstitial ambulatory glucose-monitoring device (AGD) against plasma glucose measured from arterialised venous (AV) and glucose from capillary whole blood (finger prick, FP) in non-diabetic subjects in response to an oral glucose tolerance test. Fifteen healthy overweight men (age 30 – 49 years, BMI 26 – 31 kg/m 2 ) participated. Glucose levels were measured before, during and after consumption of an oral 75 g glucose load using twelve FP samples and forty-four 1 ml AV blood samples during 180 min. Interstitial glucose was measured via the AGD. Three venous samples for fasting insulin were taken to estimate insulin resistance. Profiles of AGD, AV and FP glucose were generated for each participant. Glucose values for each minute of the measurement period were interpolated using a locally weighted scatterplot smoother. Data were compared using Bland – Altman plots that showed good correspondence between all pairs of measurements. Concordance between the three methods was 0·8771 (Kendall’s W, n 15, P,0·001). Concordance was greater between AV and FP (W ¼ 0·9696) than AGD and AV (W ¼ 0·8770) or AGD and FP (W ¼ 0·8764). Analysis of time to peak glucose indicated that AGD measures lagged approximately 15 min behind FP and AV measures. Percent body fat was significantly correlated with time to peak glucose levels for each measure, while BMI and estimated insulin resistance (homeostatic model assessment, HOMA) were not. In conclusion, AGD shows good correspondence with FP and AV glucose measures in response to a glucose load with a 15 min time lag. Taking this into account, AGD has potential application in nutrition and behaviour studies. Continuous glucose monitoring: Arterialised venous glucose: Capillary glucose: Validation Systems for the continuous monitoring of interstitial fluid glucose are used in the clinical management of patients with diabetes to supplement information gained from repeated capillary blood glucose (1) . Interstitial fluid glucose is suffi- ciently related to circulating blood glucose levels to make such clinical use of value. The use of such systems has been validated particularly with regard to the ability to reliably detect and report high and low glucose values in people with diabetes (2) . The ability to con- tinuously measure glucose concentration may have scientific value in a number of non-diabetic settings, for example to investigate the relationship between circulating glucose changes and nutritional intake, and behaviours such as appetite or cognitive function. However, there are no studies validating use of such systems in healthy non-diabetic subjects. Real-time interstitial fluid glucose levels may be influenced by factors other than central arterial blood glucose levels, which could differ between diabetic and non-diabetic individuals. Physiological factors may include local tissue metabolism of glucose, local and regional differences in blood flow rates, arteriovenous shunting of blood, make-up of subcutaneous tissue and other obscure variables. Research groups including ours have used continuous interstitial glucose-monitoring devices to examine real-time changes in glucose levels after meals and their relationship to either cognitive function, appetite control or physical activity (3–6) . These studies require frequent concomitant measurement of biological (glucose levels) and psychological or behavioural (appetite, cognitive performance and physical activity) parameters. Assessment of the nature of the relationship between appetite, cognitive function and circulating glucose availability has to date been compromised by reliance on finger capillary glucose measurement, since this cannot be undertaken continuously during other activities. The only practical way to frequently assess glucose levels within such a study is to use a system, which measures glucose continuously in interstitial fluid and which does not interfere with other experimental * Corresponding author: Louise Dye, fax þ44 113 3435749, email [email protected] Abbreviations: AGD, ambulatory glucose-monitoring device; AV, arterialised venous; FP, finger prick; HOMA, homeostatic model assessment; OGTT, oral glucose tolerance test. British Journal of Nutrition (2010), 103, 134–140 doi:10.1017/S0007114509991504 q The Authors 2009 British Journal of Nutrition
Transcript of Correspondence of continuous interstitial glucose measurement against arterialised and capillary...

Correspondence of continuous interstitial glucose measurement against
arterialised and capillary glucose following an oral glucose tolerance
test in healthy volunteers
Louise Dye1*, Michael Mansfield2, Nicola Lasikiewicz1, Lena Mahawish2, Rainer Schnell3, Duncan Talbot4,
Hitesh Chauhan4, Fiona Croden1 and Clare Lawton1
1Human Appetite Research Unit, Institute of Psychological Sciences, University of Leeds, Leeds LS2 9JT, UK2The Diabetes Centre, St James’s University Hospital, Leeds LS9 7TF, UK3University of Duisburg-Essen, Lotharstr. 65, D-47057 Duisburg, Germany4Unilever R&D, Colworth Science Park, Sharnbrook, Bedfordshire MK44 1LQ, UK
(Received 4 November 2008 – Revised 8 June 2009 – Accepted 8 June 2009 – First published online 13 August 2009)
The aim of the present study was to validate the Glucodayw continuous interstitial ambulatory glucose-monitoring device (AGD) against plasma
glucose measured from arterialised venous (AV) and glucose from capillary whole blood (finger prick, FP) in non-diabetic subjects in response to
an oral glucose tolerance test. Fifteen healthy overweight men (age 30–49 years, BMI 26–31 kg/m2) participated. Glucose levels were measured
before, during and after consumption of an oral 75 g glucose load using twelve FP samples and forty-four 1 ml AV blood samples during 180 min.
Interstitial glucose was measured via the AGD. Three venous samples for fasting insulin were taken to estimate insulin resistance. Profiles of AGD,
AV and FP glucose were generated for each participant. Glucose values for each minute of the measurement period were interpolated using a
locally weighted scatterplot smoother. Data were compared using Bland–Altman plots that showed good correspondence between all pairs of
measurements. Concordance between the three methods was 0·8771 (Kendall’s W, n 15, P,0·001). Concordance was greater between AV
and FP (W ¼ 0·9696) than AGD and AV (W ¼ 0·8770) or AGD and FP (W ¼ 0·8764). Analysis of time to peak glucose indicated that AGD
measures lagged approximately 15 min behind FP and AV measures. Percent body fat was significantly correlated with time to peak glucose
levels for each measure, while BMI and estimated insulin resistance (homeostatic model assessment, HOMA) were not. In conclusion, AGD
shows good correspondence with FP and AV glucose measures in response to a glucose load with a 15 min time lag. Taking this into account,
AGD has potential application in nutrition and behaviour studies.
Continuous glucose monitoring: Arterialised venous glucose: Capillary glucose: Validation
Systems for the continuous monitoring of interstitial fluidglucose are used in the clinical management of patients withdiabetes to supplement information gained from repeatedcapillary blood glucose(1). Interstitial fluid glucose is suffi-ciently related to circulating blood glucose levels to makesuch clinical use of value.
The use of such systems has been validated particularly withregard to the ability to reliably detect and report high and lowglucose values in people with diabetes(2). The ability to con-tinuously measure glucose concentration may have scientificvalue in a number of non-diabetic settings, for example toinvestigate the relationship between circulating glucosechanges and nutritional intake, and behaviours such as appetiteor cognitive function. However, there are no studies validatinguse of such systems in healthy non-diabetic subjects.
Real-time interstitial fluid glucose levels may be influencedby factors other than central arterial blood glucose levels,which could differ between diabetic and non-diabetic individuals.
Physiological factors may include local tissue metabolism ofglucose, local and regional differences in blood flow rates,arteriovenous shunting of blood, make-up of subcutaneoustissue and other obscure variables. Research groups includingours have used continuous interstitial glucose-monitoring devicesto examine real-time changes in glucose levels after meals andtheir relationship to either cognitive function, appetite control orphysical activity(3–6). These studies require frequent concomitantmeasurement of biological (glucose levels) and psychological orbehavioural (appetite, cognitive performance and physicalactivity) parameters. Assessment of the nature of the relationshipbetween appetite, cognitive function and circulating glucoseavailability has to date been compromised by reliance on fingercapillary glucose measurement, since this cannot be undertakencontinuously during other activities. The only practical way tofrequently assess glucose levels within such a study is to use asystem, which measures glucose continuously in interstitialfluid and which does not interfere with other experimental
*Corresponding author: Louise Dye, fax þ44 113 3435749, email [email protected]
Abbreviations: AGD, ambulatory glucose-monitoring device; AV, arterialised venous; FP, finger prick; HOMA, homeostatic model assessment; OGTT, oral glucose
tolerance test.
British Journal of Nutrition (2010), 103, 134–140 doi:10.1017/S0007114509991504q The Authors 2009
British
Journal
ofNutrition
procedures such as test meal consumption and computerisedcognitive testing.
Measurement of glucose from arterialised venous (AV)plasma is considered the best available proxy measure ofcentral arterial glucose(7). The most convenient method toestimate circulating glucose is by capillary glucose measure-ment. Therefore, in the present study, we sought to examinethe relationship between glucose concentrations measuredfrom the interstitial fluid with those in AV blood and lessfrequently measured finger capillary glucose in non-diabeticsubjects. We studied overweight males who were likelyto show a greater (albeit non-diabetic) glucose excursionfollowing a 75 g oral glucose load.
Methods
Subjects
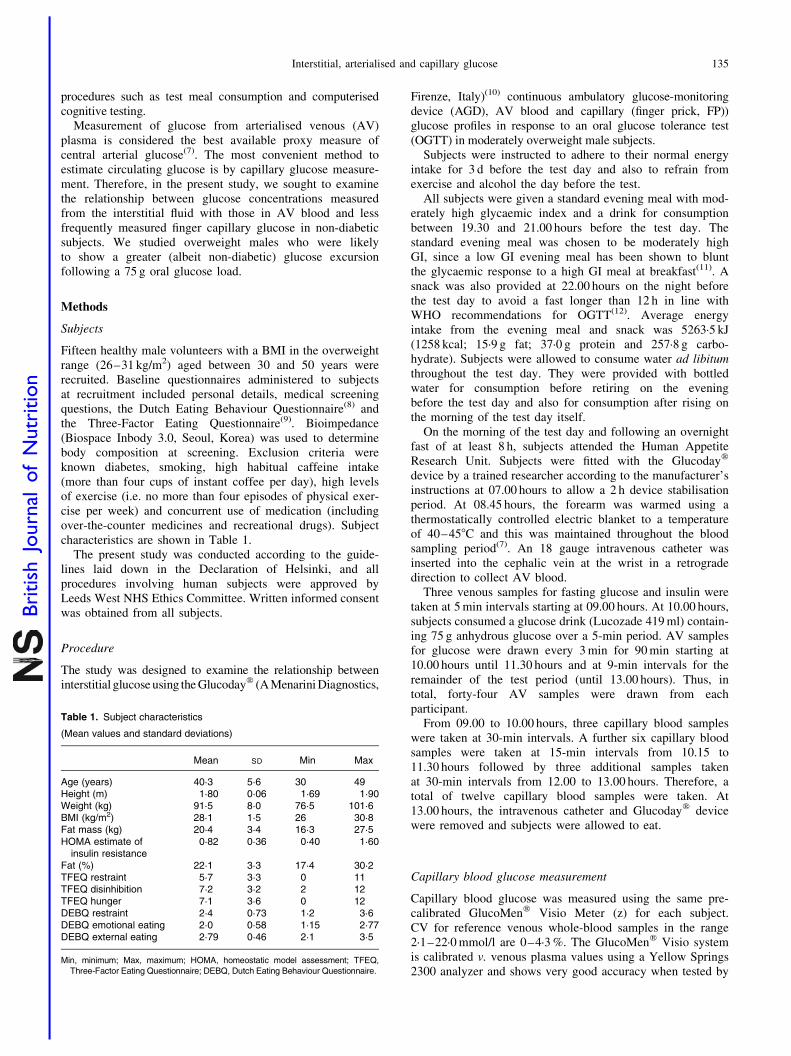
Fifteen healthy male volunteers with a BMI in the overweightrange (26–31 kg/m2) aged between 30 and 50 years wererecruited. Baseline questionnaires administered to subjectsat recruitment included personal details, medical screeningquestions, the Dutch Eating Behaviour Questionnaire(8) andthe Three-Factor Eating Questionnaire(9). Bioimpedance(Biospace Inbody 3.0, Seoul, Korea) was used to determinebody composition at screening. Exclusion criteria wereknown diabetes, smoking, high habitual caffeine intake(more than four cups of instant coffee per day), high levelsof exercise (i.e. no more than four episodes of physical exer-cise per week) and concurrent use of medication (includingover-the-counter medicines and recreational drugs). Subjectcharacteristics are shown in Table 1.
The present study was conducted according to the guide-lines laid down in the Declaration of Helsinki, and allprocedures involving human subjects were approved byLeeds West NHS Ethics Committee. Written informed consentwas obtained from all subjects.
Procedure
The study was designed to examine the relationship betweeninterstitial glucose using the Glucodayw (A Menarini Diagnostics,
Firenze, Italy)(10) continuous ambulatory glucose-monitoringdevice (AGD), AV blood and capillary (finger prick, FP))glucose profiles in response to an oral glucose tolerance test(OGTT) in moderately overweight male subjects.
Subjects were instructed to adhere to their normal energyintake for 3 d before the test day and also to refrain fromexercise and alcohol the day before the test.
All subjects were given a standard evening meal with mod-erately high glycaemic index and a drink for consumptionbetween 19.30 and 21.00 hours before the test day. Thestandard evening meal was chosen to be moderately highGI, since a low GI evening meal has been shown to bluntthe glycaemic response to a high GI meal at breakfast(11). Asnack was also provided at 22.00 hours on the night beforethe test day to avoid a fast longer than 12 h in line withWHO recommendations for OGTT(12). Average energyintake from the evening meal and snack was 5263·5 kJ(1258 kcal; 15·9 g fat; 37·0 g protein and 257·8 g carbo-hydrate). Subjects were allowed to consume water ad libitumthroughout the test day. They were provided with bottledwater for consumption before retiring on the eveningbefore the test day and also for consumption after rising onthe morning of the test day itself.
On the morning of the test day and following an overnightfast of at least 8 h, subjects attended the Human AppetiteResearch Unit. Subjects were fitted with the Glucodayw
device by a trained researcher according to the manufacturer’sinstructions at 07.00 hours to allow a 2 h device stabilisationperiod. At 08.45 hours, the forearm was warmed using athermostatically controlled electric blanket to a temperatureof 40–458C and this was maintained throughout the bloodsampling period(7). An 18 gauge intravenous catheter wasinserted into the cephalic vein at the wrist in a retrogradedirection to collect AV blood.
Three venous samples for fasting glucose and insulin weretaken at 5 min intervals starting at 09.00 hours. At 10.00 hours,subjects consumed a glucose drink (Lucozade 419 ml) contain-ing 75 g anhydrous glucose over a 5-min period. AV samplesfor glucose were drawn every 3 min for 90 min starting at10.00 hours until 11.30 hours and at 9-min intervals for theremainder of the test period (until 13.00 hours). Thus, intotal, forty-four AV samples were drawn from eachparticipant.
From 09.00 to 10.00 hours, three capillary blood sampleswere taken at 30-min intervals. A further six capillary bloodsamples were taken at 15-min intervals from 10.15 to11.30 hours followed by three additional samples takenat 30-min intervals from 12.00 to 13.00 hours. Therefore, atotal of twelve capillary blood samples were taken. At13.00 hours, the intravenous catheter and Glucodayw devicewere removed and subjects were allowed to eat.
Capillary blood glucose measurement
Capillary blood glucose was measured using the same pre-calibrated GlucoMenw Visio Meter (z) for each subject.CV for reference venous whole-blood samples in the range2·1–22·0 mmol/l are 0–4·3 %. The GlucoMenw Visio systemis calibrated v. venous plasma values using a Yellow Springs2300 analyzer and shows very good accuracy when tested by
Table 1. Subject characteristics
(Mean values and standard deviations)
Mean SD Min Max
Age (years) 40·3 5·6 30 49Height (m) 1·80 0·06 1·69 1·90Weight (kg) 91·5 8·0 76·5 101·6BMI (kg/m2) 28·1 1·5 26 30·8Fat mass (kg) 20·4 3·4 16·3 27·5HOMA estimate of
insulin resistance0·82 0·36 0·40 1·60
Fat (%) 22·1 3·3 17·4 30·2TFEQ restraint 5·7 3·3 0 11TFEQ disinhibition 7·2 3·2 2 12TFEQ hunger 7·1 3·6 0 12DEBQ restraint 2·4 0·73 1·2 3·6DEBQ emotional eating 2·0 0·58 1·15 2·77DEBQ external eating 2·79 0·46 2·1 3·5
Min, minimum; Max, maximum; HOMA, homeostatic model assessment; TFEQ,Three-Factor Eating Questionnaire; DEBQ, Dutch Eating Behaviour Questionnaire.
Interstitial, arterialised and capillary glucose 135
British
Journal
ofNutrition

hexokinase method on a Roche laboratory analyser, accordingto the manufacturer’s information.
Continuous interstitial ambulatory glucose-monitoring device
Interstitial glucose was measured via continuous ambulatorymonitoring using the Glucodayw microdialysis technique.The Glucodayw device consists of a microdialysis fibre,which is inserted into the subcutaneous tissue, and a biosensor,which consists of a glucose oxidase membrane. The deviceprovides 3 min interstitial glucose estimates for up to 48 h.The AGD was calibrated against FP, according to the manu-facturer’s instructions using a one-point calibration beforeOGTT (capillary sample 3).
Arterialised venous glucose measurement
AV blood samples (each 1 ml) were taken at regular intervalsfrom an indwelling catheter into glucose oxalate tubes, centri-fuged and aliquoted (2 £ 250ml), before being frozen at2808C. The cannula was kept patent with a flush of at least1 ml 0·9 % sodium chloride solution after each sample hadbeen taken. Before each sample was taken, 1 ml of bloodwas drawn and discarded. Glucose was analysed using thehexokinase method on a Pentra 400 Horiba ABX clinicalchemistry analyser (Montpellier, France). Within-assayprecision for twenty repeat tests gave a CV of 0·8 %, andbetween-assay precision for the samples tested in duplicateover 20 days gave a CV of 1·7 %. Mean percentage of CVfor low glucose (1·7 mmol/l) was 1·2 %, medium (5·2 mmol/l)was 0·5 % and high (14 mmol/l) was 0·7 %.
Blood insulin profiles
Three 2 ml blood samples were collected, at 5-min intervals(see schedule), into a serum tube, centrifuged and aliquoted(two 0·5 ml aliquots) and frozen at 2808C. Insulin wasmeasured using a time-resolved fluorescence immunoassayon an AutoDELFIA (PerkinElmer, Waltham, MA, USA) auto-mated analyser. For twenty runs, within-assay mean precisionwas 2·0 % CV and between-assay mean precision 2·7 % CV.Mean CV for low insulin (5·65mU/ml) was 2·4 % within-and 2·3 % between-assay precision; for medium insulin(13·7mU/ml), CV was 1·8 % within- and 3 % between-assayprecision and for high (30·2mU/ml) was 1·7 % within- and3·5 % between-assay precision.
This assay detects biologically active insulin with a highdegree of specificity. HOMA estimates of insulin resistance(13)
(based on the mean of the three fasting insulin and glucoselevels) were calculated.
Data analysis
The AGD records a measurement every 3 min, capillary bloodglucose and AV measurements were made as close in realtime as possible to the corresponding AGD measurements,but could not be exactly synchronised. All three measurementswere, however, within 3 min of each other. Data were alignedon a minute-by-minute basis with time 0 set as the start ofconsumption of the oral glucose load. The period of analysisbegan at 30 min before commencement of the OGTT and
concluded with the final venous sample taken 182–186 minafter the commencement of the OGTT.
In order to compare the data from all measures on a minute-by-minute basis, it was necessary to interpolate values foreach measure for those minutes where measured values werenot obtained. Interpolation of data was performed using thesoftware package R 2.6.0(14). The same interpolation methodwas used for each measure.
Interpolation was done using a highly robust locallyweighted scatterplot smoother(15). This was chosen in prefer-ence to linear or cubic splines, which produced physiologi-cally implausible predicted values, especially before thesharp increase in glucose in response to the glucose load.
The bandwidth or smoothing span applied to each measurewas chosen to be as small as possible(16) without resulting inphysiologically implausible predicted values. For AV whereforty-four actual measurements per participant were available,a smoothing span of 0·05 was used. For the capillary bloodglucose (FP) where eighteen actual measurements per partici-pant were available, a span of 0·2 was used. For the continu-ous AGD where 240 measurements per participant wereavailable, a span of 0·1 was used. This small but wider thanexpected bandwidth was necessary to reduce the impact ofoccasional obvious outliers. The use of these relatively smallsmoothing spans means that smoothed values are very closeto the observed values since locally weighted scatterplot wasused to interpolate rather than smooth. Altering the selectedspans (within the preset parameters) used in the analysis hadno substantial impact on the interpolated profiles. R code forthe smoothing and individual plots is available on request assupplemental material.
Bland–Altman plots were produced for each pair ofmeasures, and Kendall’s W, a non-parametric measure ofconcordance, was computed for each pair and to examinethe concordance of all three measures.
Time to peak was determined for each participant as the time(min) to maximum glucose concentration from the commence-ment of consumption of the oral glucose load. Bland–Altmanplots were also produced for each pair of measures for timeto peak (by plotting the average of the two measures againstthe difference between the two measures).
Pearson’s product moment correlation coefficients werecalculated to examine the relationship between time to peakand time to return to 75 and 50 % of peak glucose valuesfor each method with BMI, percent body fat and HOMA-estimated insulin resistance.
Results
The interpolated curves for each measure on each participantwere averaged across subjects (see Fig. 1). This shows the riseand fall in glucose measured by each method before, duringand after the OGTT. Analysis of time to peak glucose indi-cated that the AGD measures lagged approximately 15 minbehind the FP (mean difference 14·67 (SD 10·06)) and AV(mean difference 14·73 (SD 6·16)) measures (Table 2). TheCI for time to peak in capillary data is wider than for theother measures since fewer capillary measures were taken intotal. A one-way ANOVA with measure (AGD, AV and FP)included as the within-subjects variable showed that therewas a significant difference in the mean time to peak
L. Dye et al.136
British
Journal
ofNutrition
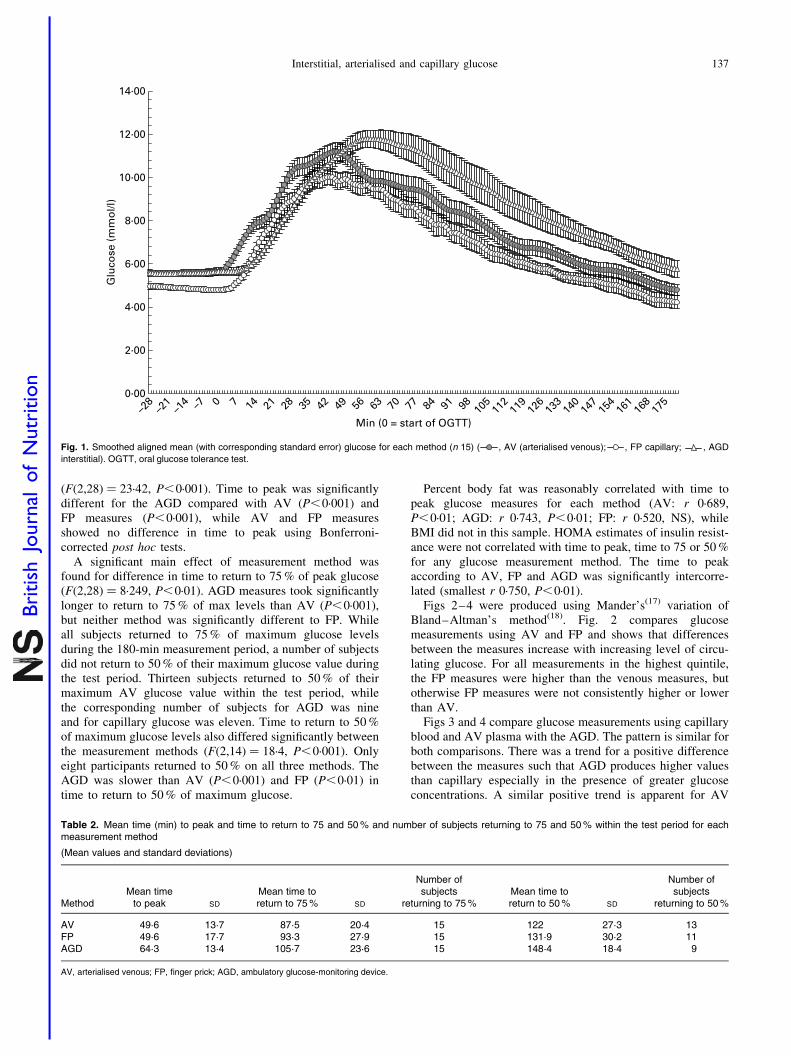
(F(2,28) ¼ 23·42, P,0·001). Time to peak was significantlydifferent for the AGD compared with AV (P,0·001) andFP measures (P,0·001), while AV and FP measuresshowed no difference in time to peak using Bonferroni-corrected post hoc tests.
A significant main effect of measurement method wasfound for difference in time to return to 75 % of peak glucose(F(2,28) ¼ 8·249, P,0·01). AGD measures took significantlylonger to return to 75 % of max levels than AV (P,0·001),but neither method was significantly different to FP. Whileall subjects returned to 75 % of maximum glucose levelsduring the 180-min measurement period, a number of subjectsdid not return to 50 % of their maximum glucose value duringthe test period. Thirteen subjects returned to 50 % of theirmaximum AV glucose value within the test period, whilethe corresponding number of subjects for AGD was nineand for capillary glucose was eleven. Time to return to 50 %of maximum glucose levels also differed significantly betweenthe measurement methods (F(2,14) ¼ 18·4, P,0·001). Onlyeight participants returned to 50 % on all three methods. TheAGD was slower than AV (P,0·001) and FP (P,0·01) intime to return to 50 % of maximum glucose.
Percent body fat was reasonably correlated with time topeak glucose measures for each method (AV: r 0·689,P,0·01; AGD: r 0·743, P,0·01; FP: r 0·520, NS), whileBMI did not in this sample. HOMA estimates of insulin resist-ance were not correlated with time to peak, time to 75 or 50 %for any glucose measurement method. The time to peakaccording to AV, FP and AGD was significantly intercorre-lated (smallest r 0·750, P,0·01).
Figs 2–4 were produced using Mander’s(17) variation ofBland–Altman’s method(18). Fig. 2 compares glucosemeasurements using AV and FP and shows that differencesbetween the measures increase with increasing level of circu-lating glucose. For all measurements in the highest quintile,the FP measures were higher than the venous measures, butotherwise FP measures were not consistently higher or lowerthan AV.
Figs 3 and 4 compare glucose measurements using capillaryblood and AV plasma with the AGD. The pattern is similar forboth comparisons. There was a trend for a positive differencebetween the measures such that AGD produces higher valuesthan capillary especially in the presence of greater glucoseconcentrations. A similar positive trend is apparent for AV
Fig. 1. Smoothed aligned mean (with corresponding standard error) glucose for each method (n 15) ( , AV (arterialised venous); , FP capillary; , AGD
interstitial). OGTT, oral glucose tolerance test.
Table 2. Mean time (min) to peak and time to return to 75 and 50 % and number of subjects returning to 75 and 50 % within the test period for eachmeasurement method
(Mean values and standard deviations)
MethodMean time
to peak SD
Mean time toreturn to 75 % SD
Number ofsubjects
returning to 75 %Mean time toreturn to 50 % SD
Number ofsubjects
returning to 50 %
AV 49·6 13·7 87·5 20·4 15 122 27·3 13FP 49·6 17·7 93·3 27·9 15 131·9 30·2 11AGD 64·3 13·4 105·7 23·6 15 148·4 18·4 9
AV, arterialised venous; FP, finger prick; AGD, ambulatory glucose-monitoring device.
Interstitial, arterialised and capillary glucose 137
British
Journal
ofNutrition
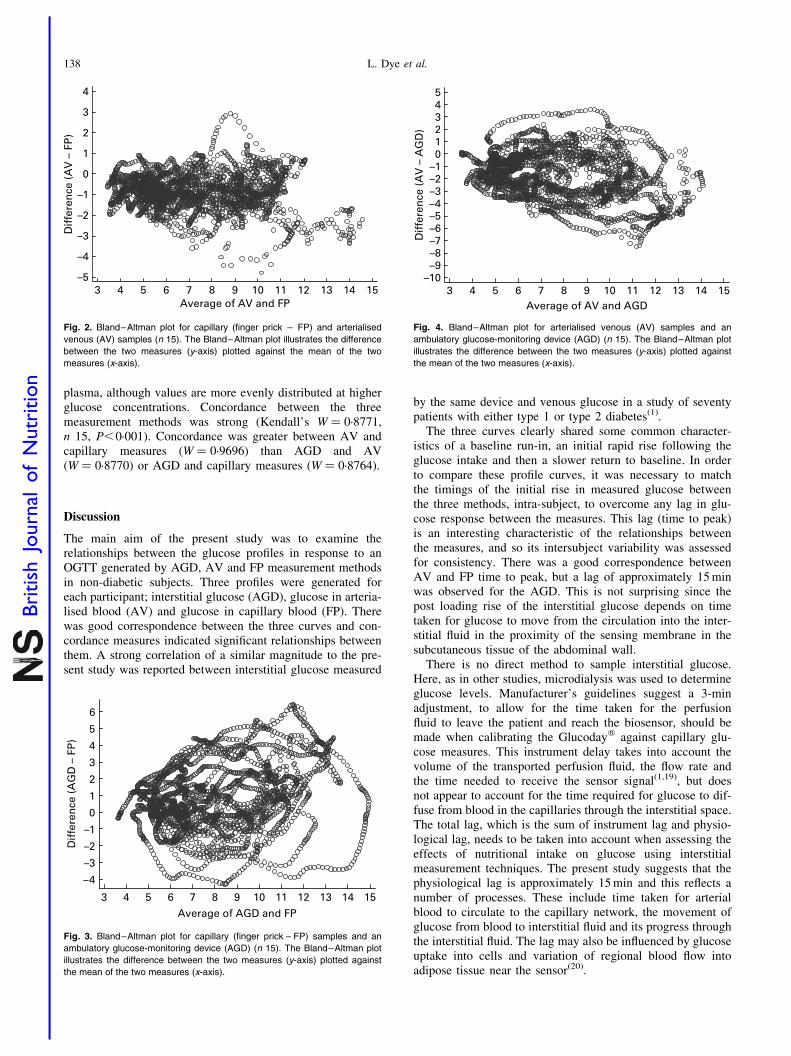
plasma, although values are more evenly distributed at higherglucose concentrations. Concordance between the threemeasurement methods was strong (Kendall’s W ¼ 0·8771,n 15, P,0·001). Concordance was greater between AV andcapillary measures (W ¼ 0·9696) than AGD and AV(W ¼ 0·8770) or AGD and capillary measures (W ¼ 0·8764).
Discussion
The main aim of the present study was to examine therelationships between the glucose profiles in response to anOGTT generated by AGD, AV and FP measurement methodsin non-diabetic subjects. Three profiles were generated foreach participant; interstitial glucose (AGD), glucose in arteria-lised blood (AV) and glucose in capillary blood (FP). Therewas good correspondence between the three curves and con-cordance measures indicated significant relationships betweenthem. A strong correlation of a similar magnitude to the pre-sent study was reported between interstitial glucose measured
by the same device and venous glucose in a study of seventypatients with either type 1 or type 2 diabetes(1).
The three curves clearly shared some common character-istics of a baseline run-in, an initial rapid rise following theglucose intake and then a slower return to baseline. In orderto compare these profile curves, it was necessary to matchthe timings of the initial rise in measured glucose betweenthe three methods, intra-subject, to overcome any lag in glu-cose response between the measures. This lag (time to peak)is an interesting characteristic of the relationships betweenthe measures, and so its intersubject variability was assessedfor consistency. There was a good correspondence betweenAV and FP time to peak, but a lag of approximately 15 minwas observed for the AGD. This is not surprising since thepost loading rise of the interstitial glucose depends on timetaken for glucose to move from the circulation into the inter-stitial fluid in the proximity of the sensing membrane in thesubcutaneous tissue of the abdominal wall.
There is no direct method to sample interstitial glucose.Here, as in other studies, microdialysis was used to determineglucose levels. Manufacturer’s guidelines suggest a 3-minadjustment, to allow for the time taken for the perfusionfluid to leave the patient and reach the biosensor, should bemade when calibrating the Glucodayw against capillary glu-cose measures. This instrument delay takes into account thevolume of the transported perfusion fluid, the flow rate andthe time needed to receive the sensor signal(1,19), but doesnot appear to account for the time required for glucose to dif-fuse from blood in the capillaries through the interstitial space.The total lag, which is the sum of instrument lag and physio-logical lag, needs to be taken into account when assessing theeffects of nutritional intake on glucose using interstitialmeasurement techniques. The present study suggests that thephysiological lag is approximately 15 min and this reflects anumber of processes. These include time taken for arterialblood to circulate to the capillary network, the movement ofglucose from blood to interstitial fluid and its progress throughthe interstitial fluid. The lag may also be influenced by glucoseuptake into cells and variation of regional blood flow intoadipose tissue near the sensor(20).
Fig. 2. Bland–Altman plot for capillary (finger prick – FP) and arterialised
venous (AV) samples (n 15). The Bland–Altman plot illustrates the difference
between the two measures (y-axis) plotted against the mean of the two
measures (x-axis).
Fig. 3. Bland–Altman plot for capillary (finger prick – FP) samples and an
ambulatory glucose-monitoring device (AGD) (n 15). The Bland–Altman plot
illustrates the difference between the two measures (y-axis) plotted against
the mean of the two measures (x-axis).
Fig. 4. Bland–Altman plot for arterialised venous (AV) samples and an
ambulatory glucose-monitoring device (AGD) (n 15). The Bland–Altman plot
illustrates the difference between the two measures (y-axis) plotted against
the mean of the two measures (x-axis).
L. Dye et al.138
British
Journal
ofNutrition

Previous studies in a variety of species and using a range ofmethods have suggested that lag can vary depending onwhether the rise or fall in the glucose curve is considered.Overall, delays can be as much as 45 min(21). In the presentstudy, there was good correspondence between the shape ofthe curves. In addition, glucose measured in capillary andAV blood did not differ in time to peak or in the eliminationphase of the curves (time to 75 % and time to 50 %). Thissuggests that with appropriate correction for lag, interstitialglucose measures could feasibly be used to indicate deliveryof glucose to the tissues and brain in non-diabetic people.
The response to glucose load results in a complex curvewith a number of characteristics. From Fig. 1, it appears thatnot only did the AGD values peak later but also the peakappears slightly higher. Since the timing and maximumheight of the peak vary between subjects, it is difficult torobustly test differences in the mean peak values. Thehigher peak noted on the AGD may relate to the method ofcalibration of the AGD i.e. against FP, such that AGDvalues are dependent on FP values.
Insulin resistance could be an important factor in explainingthe amplitude of the peaks and troughs in the glucose profilesresulting from the oral glucose load. HOMA estimates of insu-lin resistance indicated that the overweight subjects recruitedto the present study were relatively healthy and noneshowed evidence of clinically relevant insulin resistance i.e.mean HOMA was 0·82 (range 0·4–1·6), where 1 is considerednormal insulin sensitivity in this age group. The subjects didnot show evidence of impaired glucose tolerance. Only onesubject had not returned to below 7·8 mmol/l at 2 h based onAV glucose measurement. Although a large proportion ofthe sample did not return to 50 % of maximum levels withinthe test period on the AGD and FP measures, all had returnedto 50 % according to the AV measure. This could have impli-cations for the diagnosis of impaired glucose tolerance usingcapillary or interstitial measures.
Having matched the profiles temporally, we employedBland–Altman’s methods to assess the difference and concor-dance of the three different glucose measurement techniques.The Bland–Altman plots of the profile differences demon-strated some discrepancies between the methods. If themeasures were effectively giving the same information, wewould expect these plots to be randomly scattered, with smalldeviation, about a mean of zero. In some circumstances, therewere indications of non-randomness and the positive differ-ences observed suggested that the greatest lack of concordanceoccurred at higher glucose concentrations. Nevertheless, overthe course of the test period in response to the glucose load,this sample of overweight men, in whom we anticipated andobserved glucose excursions of reasonable magnitude,showed good concordance between the three measures.
Previous studies, which aimed to validate the use ofinterstitial glucose monitors, have employed the continuousglucose–error grid analysis technique described by Kovatchevet al. (23) to assess the consistency of the temporal, clinicalaccuracy of the measures. Although the continuous glucose–error grid analysis is a helpful clinical classification tool, ithas predominantly been used to compare clinical accuracyin hypo- and hyperglycaemia(24). In the euglycaemic range,continuous glucose–error grid analysis analyses of continuousglucose monitors have estimated accuracy to be 71–89 %
from studies of patients with type 1 diabetes (Clarke errorgrid A zone)(24,25). These studies and others, which correlatetwo methods over a range of values, often report highcorrelations between the measures. However, under suchcircumstances, a high correlation is ‘almost guaranteed’(26).
In order to assess the utility of continuous interstitial glu-cose monitoring for research examining nutrition behaviourrelationships, we wanted to select a sample in whom glucoseexcursions were likely to be accentuated, but who were notdiabetic. The sample recruited was representative of the gen-eral (overweight and middle aged) population in whom thesetechniques might be employed to examine effects of nutri-tional intervention on health outcomes(4). Frequent or sus-tained glycaemic excursions are associated with thedevelopment of impaired glucose tolerance, diabetes andmacrovascular disease(27). It could be argued that the resultsobtained on this sample have limited generalisability. How-ever, this group is likely to be the target for interventionand not dissimilar in terms of BMI to average males in thisage group in the UK. Our sample also showed a meanHOMA of 0·82, reflecting their normal insulin resistance(28,29).Further research could examine the concordance between themethods of glucose measurement described here in othersamples.
AV glucose measurement is considered the gold standardmethod(7), and is related to glucose delivery to the brainwith a similar delay but lower amplitude(22). Capillarymeasures are practicable but can only be performed relativelyinfrequently, and hence important alterations in circulatingglucose, which can be detected by continuous interstitialmonitoring, may be missed. However, accurate correctionfor the time lag and information on its variability is essentialif we are to draw conclusions about the physiological profileof food ingested, subjective state or glucose delivery to thebrain and any impact this might have on the activities suchas hunger perception or cognitive function.
In conclusion, continuous ambulatory glucose measurementusing the Glucodayw is a reasonable method to assess bloodglucose, provided that adjustment is made for the not insub-stantial physiological time lag observed.
Acknowledgements
We are grateful for the donation of AGD consumables fromMenarini and for the performance of venous glucose and insulinassays by Unilever. There are no conflicts of interest on the partof any of the authors. The study was designed by L. D., C. L. andM. M., conducted by N. L. and L. M. with input from L. D. andM. M. F. C. designed the meals. D. T. and H. C. performed theassays and L. D. and R. S. performed the data analysis. Themanuscript was written by L. D., C. L. and M. M.
References
1. Maran A, Crepaldi C, Tiengo A, et al. (2002) Continuous sub-
cutaneous glucose monitoring in diabetic patients: a multicenter
analysis. Diabetes Care 25, 347–352.
2. Monsod TP, Flanagan DE, Rif F, et al. (2002) Do sensor glu-
cose levels accurately predict plasma glucose concentrations
during hypoglycaemia and hyperinsulinemia? Diabetes Care
25, 889–893.
Interstitial, arterialised and capillary glucose 139
British
Journal
ofNutrition

3. Brouns F, Bjorck I, Frayn KN, et al. (2005) Glycaemic index
methodology. Nutr Res Rev 18, 145–171.
4. Brynes AE, Adamson J, Dornhorst A, et al. (2005) The ben-
eficial effect of a diet with low glycaemic index on 24 h glucose
profiles in healthy young people as assessed by continuous glu-
cose monitoring. Br J Nutr 93, 179–182.
5. Lai Ling H, Nelson EAS, Choi KC, et al. (2005) Twelve-hour
glycaemic profiles with meals of high, medium or low glycae-
mic load. Diabetes Care 28, 2981–2983.
6. Simpson EJ, Holdsworth M & Macdonald IA (2006) Ambulatory
blood glucose measurement, dietary composition and physical
activity levels in otherwise healthy women reporting symptoms
that they attribute to hypoglycaemia. Br J Nutr 95, 1127–1133.
7. Liu D, Moberg E, Kollind M, et al. (1992) Arterial, arterialised
venous, venous and capillary blood glucose measurements in
normal man during hyperinsulinaemic euglycaemia and hypo-
glycaemia. Diabetologia 35, 287–290.
8. Van Strien T, Frijters JER, Bergers GPA, et al. (1986) The
Dutch Eating Behaviour Questionnaire (DEBQ) for assessment
of restrained, emotional and external eating behaviour. Int J
Eat Disord 5, 295–315.
9. Stunkard AJ & Messick S (1985) The Three Factor Eating
Questionnaire to measure dietary restraint, disinhibition and
hunger. J Psychosom Res 29, 71–83.
10. Varalli M, Marelli G, Maran A, et al. (2003) A microdialysis
technique for continuous subcutaneous glucose monitoring
in diabetic patients (part 2). Biosens Bioelectron 18, 899–905.
11. Stevenson E, Williams C, Nute M, et al. (2005) The effect of the
glycemic index of an evening meal on the metabolic responses to
a standard high glycemic index breakfast and subsequent exercise
in men. Int J Sport Nutr Exerc Metab 15, 308–322.
12. World Health Organization (1999) Report of a WHO Consul-
tation. Part 1: diagnosis and classification of diabetes mellitus.
Definition, Diagnosis and Classification of Diabetes Mellitus
and its Complications. Geneva: World Health Organization
Department of Noncommunicable Disease Surveillance.
13. Matthews DR, Hosker JP, Rudenski AS, et al. (1985) Homeo-
stasis model assessment: insulin resistance and beta-cell func-
tion from fasting plasma glucose and insulin concentrations in
man. Diabetologia 28, 412–419.
14. R Development Core Team (2007) R. 2.6.0: A Programming
Environment for Data Analysis and Graphics. www.r-projec-
t.org (accessed July 2007).
15. Cleveland WS, Grosse E & Shyu MJ (1992) Local regression
models. Statistical Models in S, pp. 309–376 [JM Chambers
and T Hastie, editors]. New York: Chapman & Hall.
16. Hardle W (1990) Applied Nonparametric Regression. Cam-
bridge: Cambridge University Press.
17. Mander A. BATPLOT: Stata module to produce Bland-Altman
plots accounting for trend. www.ideas.repec.org/c/boc/bocode/
s448703.html (accessed July 2007).
18. Bland JM & Altman DG (1995) Comparing methods of
measurement: why plotting difference against standard method
is misleading. Lancet 346, 1085–1087.
19. Poscia A, Mascini M, Moscone D, et al. (2003) A microdialysis
technique for continuous subcutaneous glucose monitoring in
diabetic patients (part 1). Biosens Bioelectron 18, 891–898.
20. Kulcu E, Tamada JA, Reach G, et al. (2003) Physiological
differences between interstitial glucose and blood glucose
measured in human subjects. Diabetes Care 26, 2405–2409.
21. Rebrin K, Steil GM, Van Antwerp WP, et al. (1999) Subcu-
taneous glucose predicts plasma glucose independent of insulin:
implications for continuous monitoring. Am J Physiol Endocri-
nol Metab 277, E561–E571.
22. Nielson JK, Djurhuus CB, Gravholt CH, et al. (2005) Continu-
ous glucose monitoring in interstitial subcutaneous adipose
tissue and skeletal muscle reflects excursions in cerebral
cortex. Diabetes 54, 1635–1639.
23. Kovatchev BP, Gonder-Frederick L & Cox D (2004) Evaluating
the accuracy of continuous glucose monitoring sensors.
Diabetes Care 27, 1922–1928.
24. Clarke WL, Anderson S, Farhy L, et al. (2005) Evaluating the
clinical accuracy of two continuous glucose sensors using continu-
ous glucose error grid analysis. Diabetes Care 28, 2412–2417.
25. Wienstein RL, Schwartz SL, Brazg RL, et al. (2007) Accuracy
of the 5-day FreeStyle Navigator Continuous glucose monitor-
ing system. Diabetes Care 30, 1125–1130.
26. Bland JM & Altman DG (1986) Statistical methods for asses-
sing agreement between two methods of clinical measurement.
Lancet i, 307–310.
27. Jarrett RJ, McCartney P & Keen H (1982) The Bedford Survey:
ten year mortality rates in newly diagnosed diabetics, borderline
diabetics and normoglycaemic controls and risk indices for cor-
onary heart disease in borderline diabetics. Diabetologia 22,
79–84.
28. Levy JC, Matthews DR & Hermans MP (1998) Corrrect
Homeostasis Model Assessment (HOMA) evaluation uses the
computer program (Letters). Diabetes Care 21, 2191–2192.
29. Matthews DR, Hosker JP, Rudenski AS, et al. (1985) Homeo-
stasis model assessment: insulin resistance and b-cell function
from fasting plasma glucose and insulin concentrations in
man. Diabetologia 28, 412–419.
L. Dye et al.140
British
Journal
ofNutrition