Fabrication and Characterization of Sucrose Palmitate Reinforced Poly(lactic acid) Bionanocomposite...
10
Fabrication and Characterization of Sucrose Palmitate Reinforced Poly(lactic acid) Bionanocomposite Films Ravi Babu Valapa, G. Pugazhenthi, Vimal Katiyar Department of Chemical Engineering, Indian Institute of Technology Guwahati, Guwahati-781039, Assam, India Correspondence to: V. Katiyar (E - mail: [email protected]) and G. Pugazhenthi ([email protected]) ABSTRACT: Environmental issues concerning petroleum-based polymers have begun a growing emphasis to utilize sustainable poly(lactic acid) (PLA) based packaging. However, PLA has its own limitations such as brittleness, high gas permeabilities and slow crystallization rate. With the aim to alleviate these limitations, we made a maiden effort to use a food additive, sucrose palmitate (SP) as eco-friendly filler for fabrication of PLA based bionanocomposites. FTIR analysis elucidated the presence of hydrogen bonding and intermolecular interaction between PLA and reinforcement. Ordered orientation of the SP in the PLA matrix visualized by TEM analysis revealed uni- form dispersion of SP filler into PLA matrix. DSC and XRD results confirmed that the incorporated bio-filler acted as a nucleating agent and thus partially contributed towards the crystallinity of PLA-SP bionanocomposites. Enhancement in the tensile strength and elonga- tion at break up to 83 and 56% respectively is obtained. The best positive influence for the oxygen barrier was confirmed for the PLA- SP bionanocomposite film where the reduction in oxygen permeability by 69% is achieved in comparison to pure PLA. V C 2014 Wiley Peri- odicals, Inc. J. Appl. Polym. Sci. 2015, 132, 41320. KEYWORDS: biodegradable; biopolymers and renewable polymers; composites; packaging Received 6 March 2014; accepted 22 July 2014 DOI: 10.1002/app.41320 INTRODUCTION Polymer based packaging plays an important role in the modern society, as it is not only providing ease in handling, storage effi- ciency, attractiveness, light weight, inexpensiveness, and prolong product display but also possibly protecting food from spoilage by microbial contamination, physical damage or bio-chemical reactions during storage. 1–3 Although, plastics serve as one of the cheapest sources available for food packaging, their fossil fuel origin and long-term impact on the environment have spurred research in recent years on search for degradable pack- aging plastics. 4 Biopolymers derived from renewable resources can be powerful replacements for conventional plastic packaging materials due to superior degradability and eco-friendly nature. 5 To compete with petroleum-based products, economically suited biodegrad- able materials which can be easily molded into different forms become a prerequisite factor. Poly(lactic acid) (PLA) is one of such potential representative biodegradable polymers, which has rapidly become the most industrialized bio-sourced synthetic polyester. PLA is a linear, aliphatic, thermoplastic polyester that can be produced from either L-lactic acid or D-lactic acid monomers for useful applications. These monomers are obtained through fermentation of corn starch, sugarcane juice or other agricultural resources. 6,7 PLA is commercially available in variety of grades 8–10 and has been approved by the U.S. Food and Drug Administration (FDA). 8–10 Although PLA exhibits enormous applications in packaging, its intrinsic mechanical property, low crystallization rate and barrier effects to gaseous substances, such as water vapor, oxygen (O 2 ), carbon dioxide (CO 2 ) and organic volatiles limit its versatility as food packag- ing material. 11–13 Although the tensile strength of PLA is almost comparable with the conventional plastics like polyethylene ter- ephthalate (PET), ductility should be improved for PLA. It is indeed necessary to improve the crystallization rate of PLA. This is because, the perfect crystallization in the crystalline area accounts for the compact arrangement of molecular chains which in turn improves mechanical properties and mean while enhances the barrier properties. 14 Till date, many strategies have been reported to tune PLA properties as a function of chemical structure, structural mor- phology and its compatibility with other fillers. 15 These include: (i) polymer blending with organic and inorganic fill- ers 15 and (ii) addition of plasticizer. 4,16–18 Over the past few years, the incorporation of nano-sized bio-fillers in PLA matrix to produce bionanocomposite materials has been explored as an innovative and effective alternative over the traditional technologies for enhancing the mechanical performance, ther- mal stability and barrier properties of PLA. 4,17,18 At the V C 2014 Wiley Periodicals, Inc. WWW.MATERIALSVIEWS.COM J. APPL. POLYM. SCI. 2015, DOI: 10.1002/APP.41320 41320 (1 of 10)
Transcript of Fabrication and Characterization of Sucrose Palmitate Reinforced Poly(lactic acid) Bionanocomposite...

Fabrication and Characterization of Sucrose Palmitate ReinforcedPoly(lactic acid) Bionanocomposite Films
Ravi Babu Valapa, G. Pugazhenthi, Vimal KatiyarDepartment of Chemical Engineering, Indian Institute of Technology Guwahati, Guwahati-781039, Assam, IndiaCorrespondence to: V. Katiyar (E - mail: [email protected]) and G. Pugazhenthi ([email protected])
ABSTRACT: Environmental issues concerning petroleum-based polymers have begun a growing emphasis to utilize sustainable poly(lactic
acid) (PLA) based packaging. However, PLA has its own limitations such as brittleness, high gas permeabilities and slow crystallization
rate. With the aim to alleviate these limitations, we made a maiden effort to use a food additive, sucrose palmitate (SP) as eco-friendly
filler for fabrication of PLA based bionanocomposites. FTIR analysis elucidated the presence of hydrogen bonding and intermolecular
interaction between PLA and reinforcement. Ordered orientation of the SP in the PLA matrix visualized by TEM analysis revealed uni-
form dispersion of SP filler into PLA matrix. DSC and XRD results confirmed that the incorporated bio-filler acted as a nucleating agent
and thus partially contributed towards the crystallinity of PLA-SP bionanocomposites. Enhancement in the tensile strength and elonga-
tion at break up to 83 and 56% respectively is obtained. The best positive influence for the oxygen barrier was confirmed for the PLA-
SP bionanocomposite film where the reduction in oxygen permeability by 69% is achieved in comparison to pure PLA. VC 2014 Wiley Peri-
odicals, Inc. J. Appl. Polym. Sci. 2015, 132, 41320.
KEYWORDS: biodegradable; biopolymers and renewable polymers; composites; packaging
Received 6 March 2014; accepted 22 July 2014DOI: 10.1002/app.41320
INTRODUCTION
Polymer based packaging plays an important role in the modern
society, as it is not only providing ease in handling, storage effi-
ciency, attractiveness, light weight, inexpensiveness, and prolong
product display but also possibly protecting food from spoilage
by microbial contamination, physical damage or bio-chemical
reactions during storage.1–3 Although, plastics serve as one of
the cheapest sources available for food packaging, their fossil
fuel origin and long-term impact on the environment have
spurred research in recent years on search for degradable pack-
aging plastics.4
Biopolymers derived from renewable resources can be powerful
replacements for conventional plastic packaging materials due
to superior degradability and eco-friendly nature.5 To compete
with petroleum-based products, economically suited biodegrad-
able materials which can be easily molded into different forms
become a prerequisite factor. Poly(lactic acid) (PLA) is one of
such potential representative biodegradable polymers, which has
rapidly become the most industrialized bio-sourced synthetic
polyester. PLA is a linear, aliphatic, thermoplastic polyester that
can be produced from either L-lactic acid or D-lactic acid
monomers for useful applications. These monomers are
obtained through fermentation of corn starch, sugarcane juice
or other agricultural resources.6,7 PLA is commercially available
in variety of grades8–10 and has been approved by the U.S. Food
and Drug Administration (FDA).8–10 Although PLA exhibits
enormous applications in packaging, its intrinsic mechanical
property, low crystallization rate and barrier effects to gaseous
substances, such as water vapor, oxygen (O2), carbon dioxide
(CO2) and organic volatiles limit its versatility as food packag-
ing material.11–13 Although the tensile strength of PLA is almost
comparable with the conventional plastics like polyethylene ter-
ephthalate (PET), ductility should be improved for PLA. It is
indeed necessary to improve the crystallization rate of PLA.
This is because, the perfect crystallization in the crystalline area
accounts for the compact arrangement of molecular chains
which in turn improves mechanical properties and mean while
enhances the barrier properties.14
Till date, many strategies have been reported to tune PLA
properties as a function of chemical structure, structural mor-
phology and its compatibility with other fillers.15 These
include: (i) polymer blending with organic and inorganic fill-
ers15 and (ii) addition of plasticizer.4,16–18 Over the past few
years, the incorporation of nano-sized bio-fillers in PLA matrix
to produce bionanocomposite materials has been explored as
an innovative and effective alternative over the traditional
technologies for enhancing the mechanical performance, ther-
mal stability and barrier properties of PLA.4,17,18 At the
VC 2014 Wiley Periodicals, Inc.
WWW.MATERIALSVIEWS.COM J. APPL. POLYM. SCI. 2015, DOI: 10.1002/APP.4132041320 (1 of 10)

nanoscale, such particles have significantly large surface area
and exhibit the possibility to interfere with polymer chain
mobility, thereby manipulating the matrix properties.19–22
Hence, it is important to understand that the expected
improvements are directly dependent on the dispersion of the
nanoparticles in the polymer matrix which manipulate physical
or chemical interaction between the matrix and the reinforcing
phases. The optimization of dispersion and interactions of
nanoparticles in polymer matrices through mechanical and
chemical approaches plays a key role for the development of
high quality bionanocomposites.
Numerous studies involving a variety of fillers in the develop-
ment of PLA based bionanocomposites have endeavored.5,15,17,18
More recently, graphene,23 silica nanoparticles,24 carbon nano-
tubes,25 and other inorganics19 are increasingly used as load-
bearing constituents in developing PLA composites due to their
high aspect ratio and good mechanical properties.23–26 Enhance-
ment in the tensile strength due to high aspect ratio of the filler
(�53 MPa for PLA and �60 MPa for PLA-CNT composites)
was reported using melt compounding by Park et al.22 Yan and
coworkers incorporated silica nanoparticles in the PLA matrix
using solution casting method and improvement in the tensile
strength (�15.5 MPa for PLA and �17.5 MPa for PLA-silica
composites) was observed due to good compatibility and inter-
facial combination strength between the filler and PLA matrix.21
Especially for food packaging applications, it is important to
understand not only the physical and mechanical properties of
filler materials, but also their compatibility with food during
storage becomes a foremost prerequisite factor.27 Hence, explo-
ration of nontoxic substances approved for food contact needs
to be prospected as fillers. Few attempts were made to produce
PLA composite systems based on bio-fillers that are nontoxic in
nature.28–37 The effect of different bio-fillers such as starch,28
olive pit powder,29 limonene,30 chitosan,31 cellulose nanocrys-
tals,32 kenaf fibers,33 talc,34 soy protein,35 jute fibers,36 cellulose
actetate butyrate37 on the thermal, mechanical, and gas barrier
properties of PLA are investigated. In this study, we have chosen
U.S FDA approved food additive, sucrose palmitate (SP) as eco-
friendly filler for fabrication of PLA bionanocomposites.26
Sucrose esters (SEs) are nonionic in nature that are character-
ized by the presence of hydrophilic and hydrophobic moieties,
provided by sugar (sucrose) and alkyl chain (ester), respec-
tively.26 Besides, SEs being readily biodegradable and nontoxic,
they exhibit antimicrobial, mechanical and barrier properties,
which make them potential for the storage of food.26 In the
study described here, PLA-SP based bionanocomposites film
processing is investigated. Here, the influence of the bio-filler
on morphological, thermal, mechanical and barrier properties
of PLA composites are examined.
EXPERIMENTAL
Materials
SP manufactured by Sisterna (Netherlands) was used as a filler
material. PLA grade 2003D obtained from Nature WorksVR
(USA) was used as a polymer matrix. Chloroform obtained
from Merck (India) was used as the solvent for fabrication of
PLA-SP bionanocomposites films.
Nanocomposite Preparation
PLA-SP composites were fabricated by solution-casting method
as follows: �0.95 g of PLA was mixed in 50 mL of chloroform
and subsequently the mixture was stirred for 2 h in order to
completely dissolve the PLA. Likewise above, various concentra-
tions of SP (1, 3, 5, 10, 15, 30 wt % with respect to PLA) was
dispersed in chloroform with continuous stirring for 1 h. Subse-
quently, this solution containing dispersed SP was transferred
into PLA-chloroform mixture under vigorous stirring. PLA-SP
solution was casted on teflon petriplates and further dried
under ambient condition for 24 h. The dried composite films
were peeled off carefully from the petriplates. The resulting
films were finally oven dried under vacuum for 12 h at 40�Cand stored in airtight bags at room temperature for further
characterizations. All the samples are designated as SP, PLA,
PLA-SP-1, PLA-SP-3, PLA-SP-5, PLA-SP-10, PLA-SP-15, and
PLA-SP-30 for SP, PLA, PLA/SP 1 (wt %), PLA/SP 3 (wt %),
PLA/SP 5 (wt %), PLA/SP 10 (wt %), PLA/SP 15 (wt %), and
PLA/SP 30 (wt %), respectively. The thickness of the fabricated
films was measured using film thickness meter (Indi 1652).
Twenty measurements were taken on each film and the average
thickness of the films is found to be 60 6 5 lm.
Characterization
Thermogravimetric Analysis (TGA). Thermogravimetric analy-
sis was performed on a Mettler Toledo thermo gravimetric ana-
lyzer (TGA/SDTA 851VR
model). Samples (10.5 6 0.3 mg) were
placed in 900 lL crucible. Pure PLA and PLA-SP bionanocom-
posites were heated from 25 to 700�C in a 60 mL/min flow of
N2 at a heating rate of 20�C/min.
Differential Scanning Calorimetry (DSC). Thermal properties
and crystallization behavior of PLA and PLA-SP bionanocom-
posites were studied using a differential scanning calorimeter
(Mettler Toledo-1 series). Samples (10 6 0.5 mg) were hermeti-
cally sealed in aluminum pans and heated from 25 to 180�C at
a heating rate of 5�C/min in an inert atmosphere (N2 flow,
50 mL/min). All the samples were first heated from 25 to 180�Cand held at this temperature for 5 min to eliminate the effect of
the thermal and processing history. Glass transition temperature
(Tg), cold crystallization temperature (Tcc), the enthalpy change
at Tcc (DHcc), melting temperature (Tm) and the enthalpy of
fusion at Tm (DHm) of pure PLA and bionanocomposites films
were determined from the DSC thermograph during second
heating cycle. The Tg was obtained from the midpoint of heat
changes from the DSC curves. The percentage crystallinity (%
Xc) of PLA was calculated according to the fallowing relation.27
%Xc5DHm2DHccð Þ
DHmp
� � 3100 (1)
where, DHm is enthalpy of fusion at melting temperature Tm,
DHcc is the enthalpy of fusion at cold crystallization tempera-
ture Tcc, and DHmp is the heat of fusion of a perfect PLA crystal
which is 93.6 J/g.27
X-ray Diffraction (XRD). XRD analysis of pure PLA and its
bionanocomposite films was carried out under air atmosphere
at room temperature on a Bruker A8 advance instrument using
Cu-Ka (k 5 0.15406 nm) radiation operating at 40 kV and 40
ARTICLE WILEYONLINELIBRARY.COM/APP
WWW.MATERIALSVIEWS.COM J. APPL. POLYM. SCI. 2015, DOI: 10.1002/APP.4132041320 (2 of 10)

mA. The diffraction data were recorded in the 2h range of 1–
50� with a scanning rate of 0.05� s21 and 0.5 s step size.
Fourier Transform Infrared Spectroscopy (FTIR). FT-IR spec-
tra for pure PLA and composite films were recorded between
4000 and 450 cm21 region using a Shimadzu IR affinity-1
model spectrometer operated under attenuated total reflectance
(ATR) mode.
Transmission Electron Microscopy (TEM). The dispersion of
SP in PLA matrix was visually observed using transmission elec-
tron microscopy (JEOLJEM 2100), operated at 200kV. By direct
casting of polymer composite solution over the carbon-coated
copper TEM grid, images of the bionanocomposite were
obtained.
UV-Visible Spectrometry. Transparency measurements were
carried out using a UV-Visible spectrophotometer (Make: Per-
kin Elmer, Model: Lambda 35). The wavelength range for the
measurements was varied between 200 and 600 nm with a scan
rate of 50 nm/min and a spectral bandwidth of 2 nm.
Mechanical Testing. The uni-axial tensile properties (modulus,
tensile strength, elongation at break) were measured at room
temperature with a 50 kN load cell on a tensile tester. The
cross-head speed was set at 5 mm/min. specimens used in this
method were prepared according to ASTM standard D 882-12.
Three specimens of each sample were tested and the average
results were reported.
Oxygen Permeability Measurements. The oxygen permeability
of PLA and PLA-SP composites was measured using a PBI-
Dansensor (Ringsted, Denmark) OPT 5000 oxygen permeability
tester at 23 6 0.03�C and 50 6 2% RH. Dry nitrogen containing
less than 0.1 ppm oxygen (Alphagaz 2, Air-Liquid Denmark,
Ballerup, Denmark) was used as carrier gas and pure oxygen
(purity: 99.995%), Air-Liquid Denmark) was used as a test gas.
Inlet pressure was maintained at �4 Kg/cm2. At least three rep-
licate tests were performed for each sample films.
RESULTS AND DISCUSSION
Thermogravimetric Analysis
Thermo graph shown in Figure 1(a) indicates the weight loss
profile in two stages: first stage of weight loss �100�C is due to
evaporation of adsorbed moisture. The second stage of thermal
degradation process of PLA that occurs in the temperature
regime of 300–375�C can be mainly due to intra-molecular
trans-esterification (backbitting reaction).27,38–42 From the TGA
profiles, the onset of degradation (Tonset) that corresponds to 10
wt % loss is determined by extrapolating the peak of degrada-
tion of the samples. Similar to neat PLA, PLA-SP composites
also exhibit two stages of degradation. When 10% weight loss is
taken as a point of comparison, Tonset of the composites for
PLA is 301�C and declines to 288�C for 1 wt % of SP content.
As the SP content increases from 3 to 10 wt %, Tonset reduces
from 278 to 249�C. The possible reason is the contribution of
thermal decomposition profile of SP. It can be observed from
the TGA curves that SP is thermally stable up to 180�C. Hence,
with increasing the concentration of SP content in the PLA
matrix, sucrose content also increases in turn leading to early
onset degradation of PLA composites.
However, thermal decomposition of SP occurs via three stages.
First stage of thermal degradation is due to the adsorbed mois-
ture. The second region of weight loss observed from 180 to
240�C reflects splitting of glycosidic bridge between glucose and
fructose groups present in the sucrose.43,44 The third region of
weight loss of SP observed at 240�C corresponds to the decom-
position of ester groups present in the palmitate tail.45,46
The decomposition temperatures at 50% weight loss for neat
PLA, 1, 3, 5, and 10 wt % PLA-SP composites are 348, 347,
336, and 316�C, respectively. The temperature of 50% weight
loss of PLA is comparable with PLA composites (SP: 1 and 3 wt
%). In rest of the composites, a considerable difference in
weight loss can be seen. This is because of the excess water
released during sucrose hydrolysis that induces autocatalytic
cleavage of ester groups.47,48 Another important thermal prop-
erty is the temperature corresponding to the maximum rate of
weight loss (Tmax), which is defined as the peak value of the
first derivative of the TGA curve. The first derivative curves for
SP, neat PLA, and PLA-SP composites are depicted in Figure
1(b). All the samples (neat PLA and PLA composites)
Figure 1. (a) TGA curves and (b) DTG curves for SP, PLA and PLA-SP
composites at the heating rate of 20�C/min.
ARTICLE WILEYONLINELIBRARY.COM/APP
WWW.MATERIALSVIEWS.COM J. APPL. POLYM. SCI. 2015, DOI: 10.1002/APP.4132041320 (3 of 10)

demonstrate single peak in the DTG curves indicating that the
main degradation of these materials proceed in one step. It can
be noticed that there is no change in the Tmax value (357�C) for
neat PLA and its composites (up to 5 wt % of SP loading). In
the case of 10 wt % of SP reinforcement in the PLA matrix,
Tmax shifts to lower temperature (324�C). The downturn exhib-
ited is probably due to the increased acidic sites created during
the degradation of higher loadings of SP in the PLA matrix.49,50
Moreover, it can be observed from Figure 1(a,b), the thermal
stability of PLA-SP-10 is drastically reduced in comparison to
PLA-SP-5. Hence, PLA-SP-5 is considered as optimum loading
and further characterizations are carried out only up to 5 wt %
SP loading.
Differential Scanning Calorimetry
DSC analysis is carried out to evaluate crystallization and melt-
ing behaviors of PLA and PLA-SP composites. DSC second
heating thermographs of neat PLA and PLA bionanocomposites
are shown in Figure 2. In this study, the influence of addition
of nano bio-filler (SP) on the crystalline morphology of PLA is
slightly positive effect which can be seen from Table I. The
melting region of PLA provides unimodal endothermic peak,
(Tm 5 149�C), which indicates the presence of PLA in a-
crystalline form.51–54 Incorporation of the bio-filler does not
result in bimodal endothermic melting peaks for PLA bionano-
composites (Figure 2). Unimodal endotherms reveal the melting
of stable crystals of PLA formed due to the absence of heteroge-
neous distribution of the crystals as well as uniform crystal
thickness developed in PLA after reinforcement of the SP fil-
ler.55 Addition of bio-filler in PLA matrix shifts Tm to slightly
higher value. The shift in Tm indicates that the addition of the
SP filler do not lower the molecular weight of PLA. The current
result specifies that the SP acts as a better nucleating agent by
enhancing the Tm, in contrast to the recently reported reinforce-
ments such as organically modified montmorillonite (MMT-
TAC),17 nickel-containing layered double hydroxides (LDH),56
nanoclay,57 and talc34 used for developing PLA composites. The
decrease in the Tm values of about �6, 8, 1, and 3�C, is
reported for the respective fillers in comparison to neat PLA.
The reduction in the heat of fusion for melting peaks is
observed when the SP content increases. This phenomenon is
attributed to the strong hydrogen bonding interaction between
SP and PLA.58
Several studies reported that lower values of Tg for PLA compo-
sites could be attributed to the presence of short chain mole-
cules due to filler induced PLA degradation and reduced
macromolecular interactions.52,59 Interestingly, in this study, Tg
(61�C) remains unaltered for the PLA composites indicating
that the reinforcement of SP does not induce the formation of
short chain PLA molecules. Because nanocomposite films are
prepared by solution casting techniques at room temperature
instead of melt extrusion where degradation generally occurs if
the material is exposed for longer time. It can be seen from the
DSC curves that in comparison with neat PLA, the cold crystal-
lization temperature (Tcc) increases significantly by 6, 14, 14�Cfor 1, 3, 5 wt % loading of SP, respectively. The increase in Tcc
is due to the fact that the addition of SP suppresses the diffu-
sion rate leading to the slower migration of the polymer chains
to the surface of the nucleus.60,61 The higher Tcc values with
broadening of its peak width obtained for the composites sig-
nify that the crystallization rate becomes slower than that of
neat PLA; both homogeneous and heterogeneous crystallization
take place within the composites.60 The increase in Tcc could be
further considered due to the nucleation effect of SP incorpo-
rated in the PLA matrix.62 Another reason for enhancement in
the crystallization temperature for the PLA composites may be
the formation of ordered a-form of PLA crystals during cold
crystallization process.63
DSC analysis of nanocomposite films provides data on DHcc
and DHm, from which useful insight into interactions between
PLA and SP can be inferred.64 It is noticed from Table I, that
DHcc and DHm for PLA-SP-1 are slightly higher in comparison
with neat PLA. This is indicative of stable crystals of PLA
formed during crystallization process and hence, slight
Figure 2. DSC heating curves for PLA, and PLA-SP composites at the
heating rate of 5�C/min.
Table I. DSC Results for PLA and PLA-SP Composites
S.No Sample Tg (�C) Tc (�C) Tm (�C) DHc DHm % Xc
1 PLA 61 110 149 16.14 27.20 �12
2 PLA-SP-1 60 117 150 17.20 31.98 �16
3 PLA-SP-3 60 125 152 5.14 19.27 �15
4 PLA-SP-5 60 125 152 1.51 13.16 �12
ARTICLE WILEYONLINELIBRARY.COM/APP
WWW.MATERIALSVIEWS.COM J. APPL. POLYM. SCI. 2015, DOI: 10.1002/APP.4132041320 (4 of 10)
enhancement in the percentage crystallinity is observed for 1 wt
% SP incorporation. In contrast, DHcc and DHm gradually
decreases with further increase in the SP content, which is due
to the melting of PLA crystallites.65 Due to this fact, at higher
loadings, despite of enhancement in crystallization temperature,
crystallization peaks broaden leading to decrease in % crystallin-
ity when compared with 1 wt % loading of SP. DSC results
reveal that there is a slight improvement in the crystallinity of
the PLA at very low concentration of SP.
XRD Analysis
XRD analysis as shown in Figure 3 was performed to under-
stand the addition of SP on the crystalline structure of PLA.
The crystal structure of PLA has been the topic of extensive
studies. In general, depending on the preparation conditions,
two crystal structures may be obtained for PLA: a pseudoortho-
rhombic a-structure with left handed 103 helices chain confor-
mation and a less stable b-orthorhombic structure with 31
chain conformation.66 The structural analysis of neat PLA dis-
plays the most intense peak at 2h 5 16.7� corresponding to the
reflections from (110) and/or (200) planes of orthorhombic a-
crystalline phase. The less intense peaks appeared at 2h 5 15.1,
19.1, and 21.5� are from the (010), (203), and (210) planes of
a-phase, respectively.61,67 The PLA diffraction pattern presented
herein matches closely with the a-crystalline structure. XRD
analysis of SP shows a sharp intense crystalline peak at
2h 5 2.27�, corresponding to the palmitate ester tail present in
the bio-filler. The less intense diffraction peaks at 4.53 and
22.4� are attributed to the head group of SP.45
The nanocomposite diffraction intensities are vertically offset
for clarity of presentation. The peak at 2h 5 4.53� correspond-
ing to the head group of SP is not identified at low SP content,
due to their relatively low concentration of SP in the PLA com-
posites. The intensity of the crystalline peak corresponding to
the palmitate ester group increases with an increase in SP con-
centration. This increased intensity is due to the more diffracted
X-rays from the dispersion of the additional reinforcing agent
in the PLA matrix.66 For all the bionanocomposites, the peak
position (2h 5 16.7�) corresponding to the crystal structure of
PLA is not altered. It is clear that lattice parameters are not
altered by the addition of SP.68–70 The reflection representing
the crystal structure of PLA is present in all the bio-
nanocomposite indicating that the incorporation of SP has not
significantly disrupted the crystal structure within the PLA
matrix.68–70 However, it can be seen from Figure 3 that the
intensity of the peak (2h 5 16.7�) corresponding to the crystal
structure of PLA increases for the PLA-SP-1 sample. This
Figure 3. XRD patterns for SP, PLA, and PLA-SP composites.
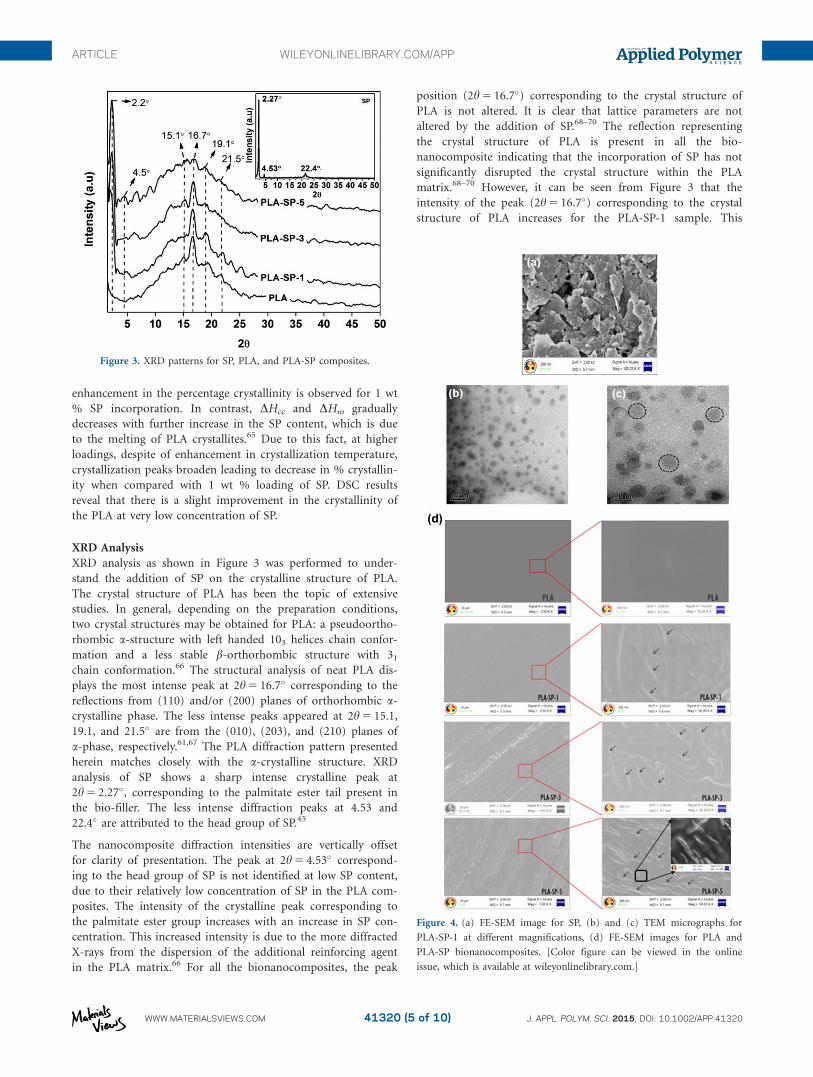
Figure 4. (a) FE-SEM image for SP, (b) and (c) TEM micrographs for
PLA-SP-1 at different magnifications, (d) FE-SEM images for PLA and
PLA-SP bionanocomposites. [Color figure can be viewed in the online
issue, which is available at wileyonlinelibrary.com.]
ARTICLE WILEYONLINELIBRARY.COM/APP
WWW.MATERIALSVIEWS.COM J. APPL. POLYM. SCI. 2015, DOI: 10.1002/APP.4132041320 (5 of 10)

supports the increase in amount of crystallinity66 as discussed
in DSC analysis. The presence of a shoulder at around
2h 5 19.1� for PLA-SP bionanocomposite elucidates that SP has
the ability to act as a nucleating agent, by increasing the crystal-
linity of the composite system.71
Morphology of PLA Bionanocomposite Films
The morphological feature of SP is examined by FE-SEM as
depicted in Figure 4(a). The images reveal that the SP exhibits a
plate-like structure. The dispersed SP platelets (1 wt %) within
PLA matrix can also be seen from TEM micrographs in Figure
4(b,c). The average particle size of the reinforced SP in the PLA
matrix is found to be 50.84 6 11.98 nm. In the TEM micro-
graph, the sheet-like particles (dark portion indicated in circles)
represent the bio-filler SP and the bright areas represent the
PLA matrix. The appearance of homogeneously dispersed SP in
the composite system is visualized from the TEM image. The
uniform dispersion of SP in the PLA matrix can also be
observed from the FE-SEM images for PLA and PLA-SP biona-
nocomposites shown in Figure 4(d). It is indicative from the
FE-SEM image (inset) pictoriated at higher magnification for
PLA-SP-5 bionanocomposites that plate like structure of SP fil-
ler is homogenously dispersed in the PLA matrix without
agglomeration.
Transparency
From Figure 5(a), it can be observed that, 63% (at 250 nm) and
66% (at 300 nm) of UV light are transmitted in the neat PLA
film respectively. This indicates that most of the UV-B radiation
(315–280 nm) passes through PLA film.72,73 In case of PLA-SP-5
bionanocomposite film, the reduction in the UV-B transmittance
of 32%, 30% at 250, 300 nm, respectively, is noticed in compari-
son to neat PLA. At 575 nm, the visible light transmittance for
neat PLA, and PLA-SP-5 films is observed to be 72 and 63%,
respectively which is 12.5% reduction in transmittance when
compared with neat PLA. This is an advantage provided by SP
filler, such that the optical clarity remains very close to that of
the neat PLA film, with only a slight decrease in transparency
with increase in SP wt % loadings. The contact transparency
images for PLA and PLA-SP composites are also illustrated in
Figure 5(b). As observed, all the PLA-composite films illustrate
almost a similar contact transparency in comparison with neat
PLA. This observation seems to indicate that there exists a better
compatibility between the filler and PLA matrix.23
Fourier Transform Infrared Spectroscopy
Figure 6 depicts the FTIR spectra of SP, PLA, PLA-SP compo-
sites. In the case of PLA, a band observed around 3500 cm21
corresponds to the stretching of hydroxyl groups present as end
group in PLA backbone.57 The strong bands at 3000 and
2937 cm21 correspond to the asymmetric and symmetric mode
of C-H stretching, respectively. An absorption band present in
the region of 1700–1800 cm21 is attributed to the carbonyl
group present in the ester linkage of the PLA matrix.74 The
existence of CH3 band in the PLA is characterized by the pres-
ence of peak at 1456 cm21. The appearance of band atFigure 5. (a) % Transparency measurements and (b) contact transparency
images for PLA and PLA-SP composites. [Color figure can be viewed in
the online issue, which is available at wileyonlinelibrary.com.]
Figure 6. FTIR spectra for SP, PLA, and PLA-SP composites.
ARTICLE WILEYONLINELIBRARY.COM/APP
WWW.MATERIALSVIEWS.COM J. APPL. POLYM. SCI. 2015, DOI: 10.1002/APP.4132041320 (6 of 10)

1386 cm21 is assigned to the C-H deformation.74 The band
present around 1083 cm21 is due to the C-O asymmetric group
of ester groups.75 The stretching frequency observed at 956 and
922 cm21 is mainly attributed to the rocking mode of
CH3.57,74,75 In the FTIR spectrum of SP, the strong absorption
band found in the region of 3500–3200 cm21 characterizes the
O-H stretching of the free hydroxyl groups of SP. The stretching
bands at 2917 and 2845 cm21 are assigned to the methylene
and terminal methyl groups of palmitate chain of SP, respec-
tively. The band at 1058 cm21 corresponds to the C-O-C
stretching vibration of SP.44,55
It can be observed from the FTIR spectrum of PLA-SP bionano-
composites that the hydroxyl region is exhibited in the range of
3600–3200 cm21 upon addition of SP in the PLA matrix.76,77
When the carbonyl region (1700–1800 cm21) of PLA and PLA-
SP composites are closely visualized, the corresponding peak
become broadened and split into two small peaks (1753 and
1746 cm21) for PLA-SP composites. This reveals the existence
of intermolecular interaction between PLA and SP.76,77 As the
SP loading increases in the PLA matrix, the content of methyl-
ene and terminal methyl groups of palmitate in the PLA com-
posites also increases. This fact is well revealed by the increase
in the intensity of the bands (2845 cm21) corresponding to ter-
minal methyl groups of palmitate chain of SP.76,77 The increase
in sharpness preceded by the decrease in broadness of the corre-
sponding band region (3200–2800 cm21) in comparison with
pure PLA also supports the above statement.
Mechanical Properties
Figure 7 shows the effect of SP content on the mechanical prop-
erties of PLA matrix. It can be seen from Figure 7(a) that the
tensile strength of PLA composites increases with an increase in
the SP content. The PLA-SP-5 composite demonstrates a maxi-
mum tensile strength and modulus of 41 MPa, 2.2 GPa, respec-
tively over neat PLA (tensile strength of 34 MPa and modulus
of 2 GPa). The addition of SP improves the tensile strength,
which is an indication of good adhesion between PLA and the
filler. The obtained results are consistent with results reported
by Graupner76 for PLA-cotton fiber composites. As can be seen
from Figure 7(b), the incorporation of SP in the PLA matrix
enhances the tensile modulus for PLA composites, indicating
the reinforcing action of the filler. In comparison with neat
PLA, the increased modulus of PLA-SP composites compared
with PLA matrix can also be associated with the restrictions of
molecular mobility and deformability imposed by the presence
of SP. Figure 7(c) shows the elongation at break of PLA and
PLA-SP composites. The value obtained at 5 wt % of SP con-
tent is 56% higher than that of neat PLA. It implies that the
ductility of PLA is effectively improved by the incorporation of
SP. This behavior is due to the plasticization effect provided by
hydrophobic moieties of SP reinforced in the PLA matrix. The
results also indicate that SP acts as a bridge to prolong the frac-
ture process of PLA composites and thereby reduces the sudden
risk of failure. Enhancement in the elongation at break values
obtained in this study is comparable to the PLA-chicken feather
fiber composites (�55%) reported by Cheng et al.77 However,
drop in the tensile strength and elongation at break (%) is also
reported for PLA-starch28 and PLA-soy protein.35 It is discussed
that both the tensile strength and elongation at break (%) of
these composites decreases due to the lack of affinity between
filler and PLA.28,35
Film Permeability
One of the main functions of the films for food packaging is to
decrease the oxygen transmission between the food and the sur-
rounding atmosphere. Hence, oxygen permeability (OP)
becomes a significant physical parameter to be considered. In a
view to know the effect of novel filler “SP” in terms of barrier
properties, oxygen permeation studies are carried out beyond 5
wt % SP loading (i.e., 15 and 30 wt % SP). Figure 8 shows the
Figure 7. (a) Tensile strength, (b) modulus, and (c) elongation at break
for PLA and PLA-SP composites.
ARTICLE WILEYONLINELIBRARY.COM/APP
WWW.MATERIALSVIEWS.COM J. APPL. POLYM. SCI. 2015, DOI: 10.1002/APP.4132041320 (7 of 10)

OP values of PLA and PLA bionanocomposites reinforced with
SP. Bionanocomposites display reduction in the OP values with
respect to PLA film and the OP values reduces drastically when
the SP content increases. This underlines the positive effect of
SP in increasing the barrier properties of PLA. The best positive
influence is confirmed for the PLA-SP-30 bionanocomposite
films where the reduction in OP by �69.46% is noticed in com-
parison to PLA (Figure 8). It is well known that the transport
properties of gases through PLA films are strongly influenced by
tortuousity of their path, which is dependent on several factors
including shape and aspect ratio of the filler, degree of exfolia-
tion or dispersion, filler loading and orientation, adhesion to
the matrix, moisture activity, filler-induced crystallinity, poly-
mer chain immobilization, filler-induced solvent retention and
porosity.78 In our case, dispersion of SP to a higher extent in
the PLA matrix as shown in TEM analysis and good adhesion
between SP with PLA matrix via intra molecular hydrogen
bonding as revealed in FTIR analysis results in a more efficient
barrier effect. The reduction in OP of 15.95 and 7.97% are
reported for butylated hydroxytoluene (BHT)/poly(ethylene gly-
col) (PEG 400) and a-tocopherol/BHT/PEG 400 blended PLA
films,79 respectively. Around 47–62% reduction of OP for PLA/
closite-B composite is also reported in a previous study.80 How-
ever, for food packaging applications, consideration of compati-
bility of filler with food during storage becomes a prerequisite
factor. In comparison to the literature data,79,80 a significant
enhancement in the oxygen barrier effects for PLA-SP bionano-
composites is evidenced and also the filler chosen in the current
work is a food additive which has definite compatibility with
food during storage. Highly dispersed state of SP in the PLA
matrix increases the distance (tortuous path) that the oxygen
molecules have to travel through the PLA matrix and the same
is reflected in terms of barrier effects. High oxygen barrier
effects and transparent nature of the films induced by food
additive SP promises that PLA-SP bionanocomposite films can
be used as potential materials for food packaging applications.
CONCLUSION
The incorporation of SP has brought considerable improve-
ments in the thermal, mechanical, and barrier properties of
PLA. The DTG thermographs reveal that incorporation of SP
decelerates the thermal degradation rate of PLA composites.
From the DSC analysis, it is observed that crystallization takes
place in PLA through homogeneous crystallization. PLA-SP
bionanocomposites exhibited both homogeneous as well as het-
erogeneous crystallization which confirms the nucleation effect
of SP. The higher Tc values obtained for the composites indicate
that crystallization rate become dependent on filler loading.
Uniform dispersion of SP in the PLA matrix perceived in the
morphological analyses showed profound impact on the
mechanical and barrier properties. In terms of mechanical prop-
erties, SP indeed improves the elongation at break (%) due to
its plasticizing property. The best positive effect is observed for
PLA-SP composites, where the reduction in OP by 69.46% is
noticed in comparison with neat PLA. This effect in terms of
barrier properties is due to increase in the tortuous path, which
can be correlated to the uniform dispersion of SP in the PLA
matrix evidenced in morphological studies.
ACKNOWLEDGMENTS
The authors sincerely thank the Central Instrument Facility
(CIF), Indian Institute of Technology Guwahati for providing
FE-SEM and TEM facilities. The authors sincerely thank the
Department of Chemicals and Petrochemicals, Ministry of
Chemicals and Fertilizers, Government of India - funded Cen-
ter of Excellence for Sustainable Polymers at IIT Guwahati for
Research facilities to perform this research work. Authors also
thank Dr. David Plackett, DTU, Denmark, for sharing bio-
fillers and OTR facility, used in this study.
REFERENCES
1. Zhang, B.; Wang, Q. J. Agric. Food Chem. 2012, 60, 4162.
2. Ali, S. S.; Tang, X.; Alavi, S.; Faubion, J. J. Agric. Food
Chem. 2011, 59, 12384.
3. Simoneit, B. R. T.; Medeiros, P. M.; Didyk, B. M. Environ.
Sci. Technol. 2005, 39, 6961.
4. Goffin, A. L.; Raquez, J. M.; Duquesne, E.; Siqueria, G.;
Habibi, Y.; Dufresne, A.; Dubois, P. Biomacromolecules 2011,
12, 2456.
5. Ray, S. S.; Bousmina, M. Prog. Mater. Sci. 2005, 50, 962.
6. Magniez, K.; Voda, A. S.; Kafi, A. A.; Fichini, A.; Guo, Q.;
Fox, B. L. ACS Appl. Mater. Interfaces 2013, 5, 276.
7. Oksman, K.; Skrifvars, M.; Selin, J. F. Compos. Sci. Technol.
2003, 63, 1317.
8. Jain, R. A. Biomaterials 2000, 21, 2475.
9. Mikos, A. G.; Lyman, M. D.; Freed, L. E; Langer, R. Bioma-
terials 1994, 15, 55.
10. Park, T. G.; Cohen, S.; Langer, R. Macromolecules 1992, 25,
116.
11. Liu, H.; Song, W.; Chen, F.; Guo, L.; Zhang, J. Macromole-
cules 2011, 44, 1513.
12. Hoglund, A.; Hakkarainen, M.; Albertsson, A. C. Biomacro-
molecules 2010, 11, 277.
13. Ljungberg, N.; Wesslen, B. Biomacromolecules 2005, 6, 1789.
Figure 8. Oxygen permeability measurements for PLA and PLA-SP
composites.
ARTICLE WILEYONLINELIBRARY.COM/APP
WWW.MATERIALSVIEWS.COM J. APPL. POLYM. SCI. 2015, DOI: 10.1002/APP.4132041320 (8 of 10)

14. Ray, S. S. Acc. Chem. Res. 2012, 45, 1710.
15. Bordes, P.; Pollet, E.; Averous, L. Prog. Polym. Sci. 2009, 34,
125.
16. Ray, S. S.; Okamoto, M. Prog. Polym. Sci. 2003, 28, 1539.
17. Wang, D. Y.; Gohs, U.; Kang, N. J.; Leuteritz, A.; Boldt, R.;
Wagenknecht, U.; Heinrich, G. Langmuir 2012, 28, 12601.
18. Li, Yonghui.; Sun, X. S. Biomacromolecules 2010, 11, 1847.
19. Svagan, A. J.; Akesson, A.; Cardenas, M.; Bulut, S.; Knudsen,
J. C.; Risbo, J.; Plackett, D. Biomacromolecules 2012, 13, 397.
20. Ray, S. S.; Yamada, K.; Okamoto, M.; Ogami, A.; Ueda, K.
Chem. Mater. 2003, 15, 1456.
21. Yan, S.; Yin, J.; Yang, J.; Chen, X. Mater. Lett. 2007, 61,
2683.
22. Park, S. H.; Lee, S. G; Kim, S. H. Compos. A 2013, 46, 11.
23. Sun, Y.; He, C. ACS Macro Lett. 2012, 1, 709.
24. Zhang, J.; Lou, J.; Ilias, S.; Krishnamachari, P.; Yan, J. Poly-
mer 2008, 49, 2381.
25. Duncan, T. V. J. Colloid. Interface Sci. 2011, 363, 1.
26. Corma, A.; Iborra, S.; Velty, A. Chem. Rev. 2007, 107, 2411.
27. Garlotta, D. J. Polym. Environ. 2001, 9, 63.
28. Lu, D. R.; Xiao, C. M.; Xu, S. J. Express Polym. Lett. 2009, 3,
366.
29. Koutsomitopoulou, A. F.; Benezet, J. C.; Bergeret, A.;
Papanicolaou, G. C. Powder Technol. 2014, 255, 10.
30. Fortunati, E.; Luzi, F.; Puglia, D.; Dominici, F.; Santulli, C.;
Kenny, J. M.; Torre, L. Eur. Polym. J. 2014, 56, 77.
31. Bonilla, J.; Fortunati, E.; Vargas, M.; Chiralt, A.; Kenny, J.
M. J. Food Eng. 2013, 119, 236.
32. Fortunati, E.; Peltzer, M.; Armentano, I.; Torre, L.; Jimenez,
A.; Kenny, J. M. Carbohydr. Polym. 2012, 90, 948.
33. Lee, B. H.; Kin, H. S.; Lee, S.; Kim, H. Y.; Dorgan, J. R.
Compos. Sci. Technol. 2009, 69, 2573.
34. Battegazzore, D.; Bocchini, S.; Frache, A. Express Polym Lett.
2011, 5, 849.
35. Zhu, R.; Liu, H.; Zhang, J. Ind. Eng. Chem. Res. 2012, 51,
7786.
36. Goriparthi, B. K.; Suman, K. N. S.; Rao, N. M. Compos. A
2012, 43, 1800.
37. Wang, Y.; Xu, Y.; He, D.; Yao, W.; Liu, C.; Shen, C. Mater.
Lett. 2014, 128, 85.
38. Fan, Y.; Nishida, H.; Shirai, Y.; Endo, T. Polym. Degrad. Sta-
bil. 2004, 84, 143.
39. Taubner, V.; Shishoo, R. J. Appl. Polym. Sci. 2001, 79, 2128.
40. Wang, Y.; Mano, J. F. Eur. Polym. J. 2005, 41, 2335.
41. Wang, Y.; Steinhoff, B.; Brinkmann, C. Alig, I. Polymer
2008, 49, 1257.
42. Yu, H.; Huang, N.; Wang, C.; Tang, Z. J. Appl. Polym. Sci.
2003, 88, 2557.
43. Hosseini, S. G.; Pourmortazavi, S. M.; Hajimirsadeghi, S. S.
Comb. Flame 2005, 141, 322.
44. Predoi, D. J. Nanomater. Biosci. 2010, 5, 373.
45. Fang, G.; Li, H.; Chen, Z.; Liu, X. Sol. Energy Mater. Sol.
Cells 2011, 95, 1875.
46. Li, Y.; Wang, S.; Yang, X.; Zhang, X. Int. J. Nanosci. 2009, 8,
97.
47. Antheunis, H.; Meer, J. C. V. D.; Geus, M. D.; Heise, A.;
Koning, C. E. Biomacromolecules 2010, 11, 1118.
48. Janorkar, A. V.; Metters, A. T.; Hirt, D. E. Macromolecules
2004, 37, 9151.
49. Kelly, F. H. C.; Brown, D. W. Sugar Technol. Rev. 1978, 6, 1.
50. Richards, G.N. Int. Sugar J. 1986, 88, 145.
51. Valapa, R.; Pugazhenthi, G.; Katiyar, V. Int. J. Biol. Macro-
mol. 2014, 65, 275.
52. Peng, F.; Shaw, M. T.; Olson, J. R.; Wei, M. J. Phys. Chem. C
2011, 115, 15743.
53. Sawai, D.; Takahashi, K.; Sasashige, A.; Kanamoto, T.; Hyon,
S. H. Macromolecules 2003, 36, 3601.
54. Hoogsteen, W.; Postema, A. R.; Pennings, A. J.; Brinke, G.
T. Macromolecules 1990, 23, 634.
55. Bharadwaj, R.; Mohanty, A. K.; Drzal, L. T.; Pourboghrat, F.;
Misra, M. Biomacromolecules 2006, 7, 2044.
56. Shan, X.; Song, L.; Xing, W.; Hu, Y.; Lo, S. Ind. Eng. Chem.
Res. 2012, 51, 13037.
57. Vasanthan, N.; Ly, H.; Ghosh, S. J. Phys. Chem. B 2011, 115,
9556.
58. Ali, S. S.; Tang, X.; Alavi, S.; Faubion, J. J. Agric. Food
Chem. 2011, 59, 12384.
59. Liu, L.; Jin, T. Z.; Coffin, D. R.; Hicks, K. B. J. Agric. Food
Chem. 2009, 57, 8392.
60. Katiyar, V.; Gerds, N.; Koch, C. B.; Risbo, J.; Hansen, H. C.
B.; Plackett, D. Polym. Degrad. Stabil. 2010, 95, 2563.
61. Zhang, K.; Mohanty, A. K.; Misra, M. ACS Appl. Mater.
Interfaces 2012, 4, 3091.
62. Goffin, A. L.; Raquez, J. M.; Duquesne, E.; Siqueria, G.;
Habibi, Y.; Dufresne, A. Biomacromolecules 2011, 12, 2456.
63. Pan, P.; Yang, J.; Shan, G.; Bao, Y.; Weng, Z.; Cao, A.;
Yazawa, K.; Inoue, Y. Macromolecules 2012, 45, 189.
64. Ali, S. S.; Tang, X.; Alavi, S.; Faubion, J. J. Agric. Food
Chem. 2011, 59, 12384.
65. Zeng, J. B.; Li, Y. D.; He, Y. S.; Wang, Y. Z. Ind. Eng. Chem.
Res. 2011, 50, 6124.
66. Krikorian, V.; Pochan, D. J. Chem. Mater. 2003, 15, 4317.
67. Barrau, S.; Vanmansart, C.; Moreau, M.; Addad, A.; Stoclet,
G.; Lefebvre, J. M.; Seguela, R. Macromolecules 2011, 44,
6496.
68. Desantis, P.; Kovacs, A. J. Biopolymers 1968, 6, 299.
69. Brizzolara, D.; Cantow, H. J.; Diederichs, K.; Keller, E.;
Domb, A. J. Macromolecules 1996, 29, 191.
70. Hoogsteen, W.; Postema, A. R.; Pennings, A. J.; Tenbrinke,
G.; Zugenmaier, P. Macromolecules 1990, 23, 634.
71. Fortunati, E.; Peltzer, M.; Armentano, I.; Torre, L.; Jimenez,
A.; Kenny, J. M. Carbohydr. Polym. 2012, 90, 948.
72. Auras, R.; Harte, B.; Selke, S. Macromol. Biosci. 2004, 4, 835.
ARTICLE WILEYONLINELIBRARY.COM/APP
WWW.MATERIALSVIEWS.COM J. APPL. POLYM. SCI. 2015, DOI: 10.1002/APP.4132041320 (9 of 10)

73. Hernandez, J. J.; Garcia-Gutierrez, M. C.; Nogales, A.;
Rueda, D. R.; Kwiatkowska, M.; Szymczyk, A.; Roslaneic, Z.;
Concheso, A.; Guinea, I.; Ezquerra, T. A. Compos. Sci. Tech-
nol. 2009, 69, 1867.
74. Pamula, E.; Blazewicz, M.; Paluszkiewicz, C.; Dobrzynski, P.
J. Mol. Struct. 2001, 596, 69.
75. Mai, T. T. T.; Nguyen, T. T. T.; Le, Q. D.; Park, J. S. Adv.
Nat. Sci. Nanosci. Nanotechnol. 2012, 3, 25014.
76. Grapnuer, N. J. Mater. Sci. 2008, 43, 5222.
77. Cheng, S.; Lau, K.; Liu, T.; Zhao, Y.; Lam, P.; Yin, Y. Com-
pos. B 2009, 40, 650.
78. Sanchez-Garcia, M. D.; Gimenez, E.; Lagaron, J. M. Carbo-
hydr. Polym. 2008, 71, 235.
79. Byun, Y.; Kim, Y. T.; Whiteside, S. J. Food Eng. 2010, 100,
239.
80. Katiyar, V.; Gerds, N.; Koch, C. B.; Risbo, J.; Hansen, H. S.
B.; Plackett, D. J. Appl. Polym. Sci. 2011, 122, 112.
ARTICLE WILEYONLINELIBRARY.COM/APP
WWW.MATERIALSVIEWS.COM J. APPL. POLYM. SCI. 2015, DOI: 10.1002/APP.4132041320 (10 of 10)