Natural and Lactic Acid Bacteria Fermentations of - Brage NMBU
214
! " # !" # $ %&%& $ % & ’ & ( ) % * + , ’ - ./01 # ./0121 3’’ 024151/. 3’% 4622.7670.184
-
Upload
khangminh22 -
Category
Documents
-
view
0 -
download
0
Transcript of Natural and Lactic Acid Bacteria Fermentations of - Brage NMBU
��
�
����������������� ������������������������������������������������������������������������
����������������������������������������� �!����������������������"�������� ���#������
���
������������ ���� ������� ���� ��������������������������������� ����������� ���������� �� �������������� ��� �������
�������������������������������������������������������������
��������������� ����!���"�#�������
$����� �������%&��%&������������
��������� ����$����������%���� � ������ ��&����' �� ��
&� �������(����� ����)��� � ��� ��%��� �� ������*��� �+ �����������,���' �� ���
��
-��./01����
���
���
#������ ������./01�21�3''���0241�51/.�
3'%���462�2.�767�0.18�4�

���
�
����
�
Table of Contents
������������� ����������������������������������������������������������������������������������������������������������������������������������������
�����������������������������������������������������������������������������������������������������������������������������������������������������������������
������������ ���������������������������������������������������������������������������������������������������������������������������������������������������
�����������������������������������������������������������������������������������������������������������������������������������������������������������������
�����������������������������������������������������������������������������������������������������������������������������������������������������������
�� ���������� ���������������������������������������������������������������������������������������������������������������������������������������������������
�� ������������������������������������������������������������������������������������������������������������������������������������������������������
���� ������ ������������������������������������������������������������������������������������������������������������������������������������������
���� ������� ������������������������������������������������������������������������������������������������������������������������������������������
���� ������������ �����������������������������������������������������������������������������������������������������������������������������������������
�� �����������������������������������������������������������������������������������������������������������������������������������������������������
���� ���������������� �� ���������������� ����������������������������������������������������������������������������������������������������
���� ���������� �� ������ ������������� ���������� ��������������������������������������������������������������������������������������
���� �������������������������� �� ����������� ���������� ��������������������������������������������������������������������������
���� ���� ����� ������������������� ���������������� �����������������������������������������������������������������������������
���� �������������������������������������� ����������������������������������������������������������������������������
�� � �������������������� ������ ����������� �������� ���������������������������������������������������������������������!�
��!� �������������� ���������� ���������������������������������������������������������������������������������������������������������������
��"� ������������������� ���������� ������ ����� ���������� ��������������������������������������������������������
��#� �� �������������� ��������� ���������� ���������� ������������������������������������������������������������������ �
���$� ����������������������������� ������ %��%���� ����� ����� ���������� ������������������������������������"�
�� ��������� �������������������������������������������������������������������������������������������������������������������������������������������������
���� ��� ��������%������������������������������������������������������������������������������������������������������������������������������������������ �
���� ����������������%�������������������������������������������������������������������������������������������������������������������������������������� �
���� ��������������������������������������������������������������������������������������������������������������������������������������������������������� �
�� ������� ��� ������������ �� ���������������������������������������������������������������������������������������������������
���� �������������� ����� �� � ������ ���&�������������������������� ��� �������� ����'����� ������������������!�
���� ������������������ ����%������� �������������� � ������� �������������������������� ����� �����������#�
���� ���������������������� ����� ������� �������������������������� ����� ������������������������������������������������
���� �� ���������������%� ��� ������������ ����������������������������������������������������������������������������������������!�
� ������ ��� �������������� ������� ����������������������������������������������������������������������������������������������!�
���� �� ������ ��������������������������������������������������������������������������������������������������������������������������������������������� $�
���� ��������������%����������������������������������������������������������������������������������������������������������������������������������� ��
�� �������� ������������������������������������������������������������������������������������������������������������������������������������������������
�� ��������� ������������������������������������������������������������������������������������������������������������������������������������������������
"� ����� ������� ��#�������������������������������������������������������������������������������������������������������������������������������"��
�
�

�(�
�
�
�
�
�
�
�
�
�
�
�
�
�
�
�
�
�
�
�
�
�
�
�
�
�
�

(�
�
ACKNOWLEDGEMENTS It is with gratitude that I acknowledge the Norwegian Programme for Development, Research
and Education (NUFU) for financing this research. The International Foundation for Science
(IFS) through grant number E/4889-1 is acknowledged for financing some of the research
activities conducted in Malawi. I also acknowledge the Norwegian State Education Loan
Fund (Lånekassen) for financially supporting my stay in Norway. I sincerely thank
management of Lilongwe University of Agriculture and Natural Resources (LUANAR),
Bunda Campus, Malawi for granting me a study leave.
I am very grateful to the coordinators of the Lungwena health, nutrition and agriculture
research project (NUFUPRO-2007/10149), Professor Kenneth Maleta and Professor Johanne
Sundby for accepting me as a PhD student. I sincerely thank Dr Anne Wetlesen for accepting
to be my supervisor when I was applying for admission at Norwegian University of Life
Sciences (NMBU). Dr Charles Masangano is also thanked for coordinating at LUANAR.
This PhD thesis would not have been accomplished if it were not for the guidance and support
from my supervisors. I thank all my supervisors for reading my papers over and over. I am
forever grateful to Associate Professor Trude Wicklund for accepting to be my main
supervisor when Dr Anne Wetlesen took another job. Associate Professor Trude Wicklund
was supportive and considerate in all matters. I am deeply indebted to my co-supervisor
Associate Professor Hilde Marit Østlie for her keen interest in my work. Her in-depth
microbiological knowledge and her timely constructive suggestions shaped the write-up of the
papers for the better. I also greatly appreciate the kindness and generosity that Associate
Professor Hilde Marit Østlie and her family accorded my family when we just moved to
Norway. I also express my appreciation to my co-supervisor Dr Agnes Mwangwela for her
valuable contribution towards this work and because of her administrative support at
LUANAR that created a conducive environment for laboratory work in Malawi.
I am very grateful for the technical support I received from members of the Dairy Technology
group (1951) at IKBM, Norway. I extend my gratitude to Kari Olsen for HPLC analyses, to
Ellen Skuterud for texture analyses, to Tone Stokke Molland for assistance in some
microbiological techniques, and to May Aalberg for countless everyday support in the lab. I
also appreciate the assistance of Ahmed Abdelghani and Bjørg Holter in the pathogen lab.
I am thankful for the technical support I received in Malawi from the following: Mr Chipiliro
Kantikana (Home Economic and Human Nutrition Department) and Mr Emmanuel Mbewe

(��
�
(Crops and Soil Sciences Department). Sincere gratitude goes to Oliveta Buleya for practical
support throughout laboratory analyses and for protein analyses. Technicians in Aquaculture
and Fisheries Sciences and Basic Sciences departments are thanked for their support in
various ways.
I am very thankful to the students of Home Economics and Human Nutrition Department and
to the staff members of LUANAR, Bunda Campus, who participated in descriptive sensory
panel. The people of Lungwena (Mdala-Makumba, Chilonga and Chapola villages) who
participated in consumer studies are also thanked. I greatly thank Mrs Mercy Chautsi for
tirelessly supporting me during sensory and consumer studies.
I greatly appreciate former PhD students of IKBM. Special thanks to Dr Beatrice Mgaya
Kilima for supporting me when I needed someone most, the words of encouragement and the
laughter we shared are cherished. I am very grateful to Dr Agnes Nabubuya for sharing in the
joys and the challenges. I thank Dr Heide Grønnevik for hands-on DGGE tutorial and Dr Ivan
Mukisa for fruitful discussions on molecular microbiology work.
I am thankful for the wonderful association with the Malawian community in Ås and around
Oslo. Thanks to Doreen Auma and Cecilia Munthali for their social support.
Many and special thanks go to my Mum and Dad for laying good foundation, encouraging
and supporting their children with education from primary school to universities. Your love,
prayers, guidance and innumerable support are always cherished. I sincerely appreciate the
love, support, encouragement and prayers from my sisters (and their families) Anita, Esther,
Mafase and Khumbo, my brother Austin, my Aunt Mrs Deliwe Munthali and my niece
Maggie Munthali.
My sincere and heartfelt gratitude goes to my dear husband Felton for supporting me
throughout my studies. I thank Felton for taking good care of our son, Takondwa when I was
away. I also thank my beloved children Takondwa and Mphatso for their patience when I was
stressed and gave them divided attention. Your smiles and joys are a motivation.
Lastly but not least, I praise and thank God for giving me life and for granting me rare
opportunities and blessings in life.
Tinna Austen Ng’ong’ola-Manani.
Ås, Norway, September, 2014.
(���
�
DEDICATION
To
My Dad, Austin Henderson Supuni Ng’ong’ola and my mum, Grace Chapasi Ng’ong’ola.
For your love and for instilling love for education in your five daughters and your son.
&
To
Felton, Takondwa and Mphatso.
For your love, patience and endurance during my studies.

(����
�
ABBREVIATIONS 100S Paste composed of 100% soybeans and subjected to natural fermentation
100SBS Paste composed of 100% soybeans and subjected to lactic acid bacteria
fermentation through back-slopping
100SC Paste composed of 100% soybeans and fermented with Lactobacillus
fermentum
75S Paste composed of 75% soybeans and 25% maize and subjected to natural
fermentation
75SBS Paste composed of 75% soybeans and 25% maize and subjected to lactic acid
bacteria fermentation through back-slopping
90S Paste composed of 90% soybeans and 10% maize and subjected to natural
fermentation
90SBS Paste composed of 90% soybeans and 10% maize and subjected to lactic acid
bacteria fermentation through back-slopping
90SC Paste composed of 90% soybeans and 10% maize and fermented with
Lactobacillus fermentum
BSP Pastes fermented through back-slopping
CFU Colony forming units
DGGE Denaturing gradient gel electrophoresis
DNA Deoxyribonucleic acid
LAB Lactic acid bacteria
LFP Lactic acid bacteria fermented pastes
NFP Naturally fermented pastes
PCA Principal component analysis
PCR Polymerase chain reaction
SCP Pastes fermented with Lactobacillus fermentum as starter culture
TI Trypsin inhibitors
TIA Trypsin inhibitor activities

�)�
�
SUMMARY Traditional Malawian diets are predominantly maize-based and have been associated with
widespread inadequate intakes of several nutrients. In addition to maize, legumes are an
important source of protein and other nutrients in diets of many people in developing
countries. Soybeans have the highest protein content among legumes and when consumed
together with cereals, a high quality protein is provided because cereals and legumes are
complementary in terms of limiting amino acids. However, soybean utilization in Malawi is
minimal due to limited knowledge in processing.
In an effort to increase utilization and consumption of soybeans by all age groups in Malawi,
solid-state fermented pastes of soybeans and soybean-maize blends were developed. The
fermented pastes were to be used as relish and to serve as major sources of protein in maize-
based diets. Spontaneous solid state fermentation of soybeans favors growth of Bacillus
subtilis, a highly proteolytic organism that produces high amount of ammonia. High ammonia
levels result in strong odor which some people find objectionable. On the other hand, lactic
acid bacteria (LAB) are weakly proteolytic and do not lead to accumulation of high levels of
organoleptically unpleasant metabolic products.
In this study, thobwa, a Malawian fermented cereal gruel prepared from maize flour and co-
fermented with malt flour from finger millet was used as a back – slopping material to
facilitate lactic acid bacteria fermentations in LAB fermented pastes (LFP). Whereas pastes
fermented without inoculum were referred to as naturally fermented pastes (NFP). Pastes
composed of 100% soybeans, 90% soybeans and 10% maize, and 75% soybeans and 25%
maize. Naturally fermented pastes were designated 100S, 90S and 75S, while LFP were
designated 100SBS, 90SBS and 75SBS. Metabolite changes, microbial diversity, growth and
survival of enteropathogens, sensory properties and consumer acceptance of pastes of
soybeans and soybean-maize blends fermented naturally and by LAB were compared.
Both types of fermentation resulted in increases in soluble protein which were pronounced at
48 hrs in most samples and were highest in 100S (49%). High decreases in total amino acids
were also observed at 48 hrs, with 6.8% and 7.4% reductions in 100S and in 100SBS,
respectively. On a positive note, the limiting amino acids, cysteine (in 100S and 90S) and
methionine (in 90S) increased throughout fermentation. Whereas in LFP, cysteine increased
during 48 hrs of fermentation and this trend was also observed with methionine in 75SBS.

)�
�
Both types of fermentation degraded anti-nutritional factors, phytic acid and trypsin
inhibitors. However, natural fermentation was more effective in degrading phytic acid than
LAB fermentation. In NFP, 33 to 54% reduction in phytic acid was achieved during 24 hrs
fermentation and by 72 hrs, 85% reduction was noted and the phytate was not detected in
some samples. Whereas, 18 to 32% reduction was achieved in LFP after 24 hrs, and by 72 hrs,
37 to 49% reduction had been achieved.
Lactic acid was the major end product of fermentation in both LFP and NFP. High lactic acid
production in LFP was consistent with pH reduction. The pH was reduced from 6.44 - 6.48 to
4.20 – 4.64 representing a 28 – 35% reduction after 24 hrs fermentation. After 72 hrs, the pH
was reduced to 3.91 – 4.26, representing 34 – 39% reduction. In NFP, pH was reduced from
6.88 – 6.95 to 6.15 – 6.74 during 24 hrs and to 5.36 – 5.81 during 72 hrs representing 3 – 12%
and 17 – 23% reductions, respectively. Higher pH reduction in LFP could have been due to a
higher LAB population which was 3 log10 cfu/g higher than in NFP at the beginning of the
fermentations.
The fermenting LAB microflora in both NFP and LFP were heterofermentative rods and
homofermentative cocci. The microbiota were phenotypically characterized as Lactobacillus
brevis, Lactobacillus fermentum, Lactobacillus buchneri, Lactobacillus collonoides,
Lactobacillus acidophilus, Lactobacillus plantarum, Lactobacillus delbrueckii subsp.
delbrueckii, Lactobacillus pentosus, Leuconostoc mesenteroides, Weissella confusa,
Lactococcus lactis subsp. lactis, Pediococcus pentosaceus and Pediococcus damnosus. The
dominant microflora were Lb. fermentum, Lb. brevis, W. confusa and P. pentosaseus. These
four species were confirmed as the dominant fermenting microflora by 16S rDNA genotyping.
In addition, Bacillus spp. and Enterococcus faecium/ Enterococcus durans were identified as
part of the microflora.
Denaturing gradient gel electrophoresis confirmed Lb. fermentum, W. confusa/Weissella
cibaria, P. pentosaseus as dominant microflora. DGGE revealed microbial succession in NFP
in which Bacillus spp. and Lactobacillus linderi were succeeded during later fermentation.
Microbial diversity was similar throughout fermentation in LFP. The following
microorganisms were present in both NFP and LFP at the end of the fermentations: P.
pentosaceus, Lb. fermentum, W. confusa/W. cibaria, and Weissella koreensis.
In paper IV, natural fermentation, LAB fermentation through back-slopping and starter
culture fermentation using Lb. fermentum were inoculated with Escherichia coli. All
)��
�
fermentations could not reduce the pH to � 4.4, the critical value for Escherichia coli growth.
Nevertheless, back-slopping inhibited E. coli growth more than the other fermentations. In
back-slopped pastes, E. coli counts increased from 2.4 to 3.5 log10 cfu/g during 24 hrs and
remained constant during further fermentation. While E. coli population increased from 2.0 –
2.3 log10 cfu/g to 6.8 – 7.6 log10 cfu/g in Lb. fermentum fermentation and from 2.3 log10 cfu/g
to 8.8 – 9.2 log10 cfu/g in NFP during 24 hrs fermentation. The cell counts were above the
infectious dose of 100 cells implying food safety concerns for some Shiga-toxin producing E.
coli in the event of contamination during fermentation.
In fermentations inoculated with Bacillus cereus, only back-slopping reduced the pH to below
5.0, the critical value for B. cereus growth. After 72 hrs, B. cereus cell counts ranged between
0 to 3 log10 cfu/g in back-slopped pastes. In Lb. fermentum fermentation, pH values ranged
between 5.30 and 5.35 while cell counts were 3.7 to 5.3 log10 cfu/g after 72 hrs of
fermentation. In natural fermentation, pH increased from 5.87 at 24 hrs to 7.2 during 72 hrs of
fermentation in 90S. Consequently, B. cereus population increased from 2.2 log10 cfu/g to
above 8.0 log10 cfu/g during 24 hrs of fermentation. Since the infectious dose for B. cereus is
� 3.0 log10 cfu/g, it was concluded that back-slopping has a potential of producing pastes that
are safe with regards to B. cereus poisoning. Nevertheless, a thermal treatment of the pastes
prior to consumption was recommended to ensure safety.
Consumers unconsciously used type of fermentation to determine their preference patterns
and preference was biased towards natural fermentation. Naturally fermented pastes were
characterized by yellow color, higher pH, fried egg-like appearance and aroma, sweetness,
softness, rancid odor, and raw soybean odor. These attributes were also considered as drivers
of liking. Lactic acid bacteria fermented pastes were characterized by brown color, sourness,
bitterness, saltiness, umami, burnt roasted soybeans and maize aromas. Optimization by
enhancing the drivers of liking while suppressing drivers of dislike would increase utilization
of soybean fermented pastes.
�
�
�
�
�

)���
�
SAMMENDRAG Tradisjonell malawisk kost inneholder mye mais og blir ofte satt i sammenheng med mangel
på flere viktige næringskomponenter. I tillegg til mais er belgvekster en viktig kilde til protein
og andre næringskomponenter for mange mennesker i utviklingsland. Soyabønner har det
høyeste innholdet av proteiner spesielt sammenliknet med andre bønner og belgvekster.
Sammen med kornråstoff vil disse to utfylle hverandre med tanke på essensielle aminosyrer.
Konsumet av soyabønner er imidlertid lavt i Malawi da kunnskap om riktig prosessering er
mangelfull.
Som et tiltak for å øke konsumet av soyabønner for alle aldersgrupper i Malawi, er det gjort
forsøk med å fermentere en grøtblanding av soyabønner og soyabønne-maisblandinger. Den
fermenterte grøten kan brukes som mellommåltid eller som en viktig proteinkilde i en diett
basert på mais. Ved spontanfermentering av moste soyabønner vil Bacillus subtilis, en
bakteriekultur som produserer mye ammoniakk, være dominerende. Dersom det er mye
ammoniakk tilstede i produktet vil dette føre til en særegen lukt som mange finner ubehagelig.
Melkesyrebakterier (MSB) er svakt proteolytiske organismer og fører ikke til et tilsvarende
høyt innhold av ubehagelige lukter (odører). I dette forsøket ble det brukt thobwa, et
malawisk fermentert produkt, laget av maismel og maltet mel av hirse som starterkultur for å
sikre et riktig fermenteringsforløp for et MSB fermentert produkt, kalt melkesyrefermentert
puré/grøt (LFP). Grøt fermentert uten tilsetning av starterkultur ble kalt naturlig fermentert
grøt (NFP). Deretter ble forskjeller i metabolske produkter, mikrobiell diversitet, vekst og
overlevelse av enteropatogener, sensoriske egenskaper og konsumentpreferanser
sammenliknet mellom soyabønne og soyabønne/maisblandinger med henholdsvis
spontanfermentering og med melkesyrebakteriefermentering.
Begge typer fermentering resulterte i økning i innholdet av løselig protein, mest markert etter
48 timer i de fleste prøvene og høyest i 100S (49%). Høyest nedgang i totalt
aminosyreinnhold fant en etter 48 timer, med 6,8 % og 7,4 % reduksjon i henholdsvis 100S og
100SBS. De begrensende aminosyrene cystein (i 100S og 90S) og meteonin (i 90S) økte
derimot i løpet av fermenteringen, mens en fant økning i cystein i alle LFP etter 48 timers
fermentering. Dette ble også observert for metionin ved 75SBS.
Ved begge fermenteringsformene fant en nedgang i antinæringsstoffene, fytinsyre- og
trypsinhemmere. Spontanfermentering reduserte innholdet av fytinsyre mer effektivt enn LAB
fermentering. Ved NFP fant en nedgang på mellom 33 og 54% i fytinsyre etter 24 timers
)����
�
fermentering og 85% nedgang etter 72 timers fermentering. I noen prøver fant en ikke
fytinsyre. Ved LFP fant en 18-32 % nedgang i innholdet av fytinsyre etter 24 timers
fermentering og 37-49% nedgang etter 72 timers fermentering.
Melkesyre var hovedproduktet dannet både fra fermentering av LFP og NFP. Høyt innhold av
melkesyre samsvarte med reduksjon av pH. pH gikk ned fra 6,44-6,48 til 4,20-4,64, noe som
gir 28-35 % reduksjon etter 24 timer. Etter 72 timer var pH gått ned til 3,91-4,26, noe som gir
en reduksjon på 34-39%. I NFP gikk pH ned fra 6,88-6.95 til 6,15-6,74 i løpet av 24 timer og
til 5,36-5,81 etter 72 timer, noe som gir en nedgang på henholdsvis 3-12 % og 17-23 %.
Høyere nedgang i LFP kan komme av et høyere antall MSB, som var 3 log 10 cfu/g høyere
enn i NFP ved starten av fermenteringen.
MSB mikrofloraen i både NEP og LEP bestod av heterofermentative staver og
homofermentative kokker. Mikrofloraen ble fenotypisk karakterisert som Lactobacillus
brevis, Lactobacillus fermentum, Lactobacillus buchneri, Lactobacillus collonoides,
Lactobacillus acidophilus, Lactobacillus plantarum, Lactobacillus delbrueckii subsp.
delbrueckii, Lactobacillus pentosus, Leuconostoc mesenteroides, Weissella confusa,
Lactococcus lactis subsp. lactis, Pediococcus pentosaceus og Pediococcus damnosus. Den
dominerende mikrofloraen var Lb. fermentum, Lb. brevis, W. confusa og P. pentosaseus. Ved
16S rDNA genotyping ble disse fire artene bekreftet som de dominerende
fermenteringsmikroorganismene. I tillegg ble Bacillus spp. og Enterococcus
faecium/Enterococcus durans identifisert som en del av mikrofloraen.
Denaturerende gradient gel elektroforese (DGGE) bekreftet Lb. fermentum, W.
confusa/Weissella cibaria, P. pentosaseus som de dominerende mikroorganismene. DGGE
bekreftet mikrobiologisk endring i NFP hvor Bacillus spp. og Lactobacillus linderi ble
etablert etter hvert i fermenteringsforløpet. Det mikrobiologiske mangfoldet var tilsvarende i
LFP. En fant følgende mikroorganismer ved slutten av fermenteringsperioden i både NFP og
LFP: P. pentosaceus, Lb. fermentum, W. confusa/W. cibaria, og Weissella koreensis.
I manus IV, hvor forsøk med naturlig fermentering, fermentering med MSB ved poding med
tilsetning fra en tidligere produksjon ("back-slopping") og bruk av starterkultur med Lb.
fermentum ble alle tilsatt Escherichia coli. Ingen av disse fermenteringene fikk den
nødvendige nedgangen i pH til � 4,4 som er det kritiske nivået for vekst av E. coli. En fant
imidlertid bedre hemming av E. coli ved "back-slopping" enn ved de andre
fermenteringsformene. I grøt med "back-slopping" økte E. coli celletall fra 2,4 til 3,5 log10

)�(�
�
cfu/g i løpet av 24 timer og dette holdt seg på samme nivå gjennom fermenteringsperioden.
Mengden E. coli økte fra 2,0-2,3 log10cfu/g til 6,8-7,6 log10 cfu/g ved fermentering med Lb.
fermentum og for NFP økte antallet fra 2,3 log10 cfu/g til 8,8-9,2 log10 cfu/g i løpet av 24
timers fermentering. Disse celletallene var over det anbefalte nivået på 100 bakterier totalt og
kan utgjøre et mulig problem med hensyn til mattrygghet, dersom shiga-toksin produserende
E. coli er tilstede under fermenteringen.
Ved fermentering med tilsatt Bacillus cereus var det bare ved "back-slopping" at en fikk
nedgang i pH til <5,0 som er det kritiske nivået for vekst av B. cereus. Etter 72 timer var
antallet B. cereus celler mellom 0 og 3 log10 cfu/g i grøtblandingene hvor "back-slopping" var
brukt. Ved Lb. fermentum fermentering ble det målt en pH på mellom 5,30 og 5,35, mens
celletallet varierte fra 3,7 til 5,3 log10 cfu/g etter 72 timers fermentering. Ved naturlig
fermentering økte pH fra 5,87 etter 24 timer til 7,2 i 90 S i løpet av 72 timers fermentering.
Antallet B. cereus celler økte derfor fra 2,2 log10 cfu/g til over 8,0 log10 cfu/g i løpet av 24
timers fermentering. Siden en regner med en infektiv dose for B. cereus > 3,0 log10 cfu/g kan
en anta at en ved "back-slopping" kan produsere en grøt som vil være trygg med hensyn på B.
cereus matforgiftning. Varmebehandling av grøten vil imidlertid være å anbefale for å være
på den sikre siden.
Forbrukerne brukte ofte ubevist fermenteringsmetode ved bestemmelse av sin preferanse for
produkt, og preferansene var oftest mot naturlig fermentering. Disse grøtene ble karakterisert
med gulere farge, høyere pH, utseende og aroma som stekt egg, søt, myk, harsk lukt og lukt
av rå soyabønner. Disse egenskapene var også viktige for hvordan konsumentene likte
produktet. Grøt fra melkesyrefermentering ble karakterisert med brun farge, sur, bitter, salt,
umami, stekte/brente soyabønner og maislukt. Dersom en i videre arbeid kan få fram de
positive og redusere de negative sensoriske egenskapene vil dette kunne føre til økt bruk av
fermentert grøt laget av soyabønner.
�
�
�
�
�
�

)(�
�
LIST OF PAPERS �
PAPER I
Tinna Austen Ng’ong’ola-Manani, Hilde Marit Østlie, Agnes Mbachi Mwangwela, Trude
Wicklund. (2014). Metabolite changes during natural and lactic acid bacteria fermentations in
pastes of soybeans and soybean-maize blends. Food Science & Nutrition (In press). Doi:
10.1002/fsn3.171
PAPER II
Tinna Austen Ng’ong’ola-Manani, Trude Wicklund, Agnes Mbachi Mwangwela, Hilde Marit
Østlie. (2014). Identification and characterization of lactic acid bacteria involved in natural
and lactic acid bacteria fermentations of pastes of soybeans and soybean-maize blends using
culture-dependent techniques and denaturing gradient gel electrophoresis. Accepted for
publication in Food Biotechnology.
PAPER III
Tinna A. Ng’ong’ola-Manani, Agnes M. Mwangwela, Reidar B. Schüller, Hilde M. Østlie &
Trude Wicklund. (2014). Sensory evaluation and consumer acceptance of naturally and lactic
acid bacteria-fermented pastes of soybeans and soybean–maize blends. Food Science &
Nutrition, 2: 114-131.
PAPER IV
Tinna Austen Ng’ong’ola-Manani, Trude Wicklund, Agnes Mbachi Mwangwela, Hilde Marit
Østlie. (2014). Effect of natural and lactic acid bacteria fermentations on growth and survival
of Bacillus cereus and Escherichia coli in pastes of soybeans and soybean-maize blends.
Manuscript.

)(��
�

��
�
1 INTRODUCTION ��
1.1 Background to the study ��
About 85% of the Malawian population lives in rural areas {156} and works in agriculture, ��
with a primary aim of producing maize for home consumption {75}. Traditional Malawian ��
diets are predominantly maize-based {64, 129}). The major staple food is a stiff, unfermented ��
maize-based porridge (nsima) consumed with relishes prepared from green vegetables, �
legumes, fish {63, 64} and occasionally meat, while complementary foods given to young !�
children are thin gruels made from unfermented and unrefined maize {218}. Such "�
predominantly maize-based diets have been associated with widespread inadequate intakes of #�
several nutrients {61, 64}. The maize-based diet has consequences on the content and �$�
bioavailability of iron, zinc, preformed vitamin A, vitamin B-12 and calcium due to the ���
presence of anti-nutrients like phytic acid, polyphenols and oxalate {64, 80}. Increased risks ���
of various types of malnutrition including micronutrient deficiencies in children and pregnant ���
women have been attributed to such diets {81, 128, 129}. ���
���
According to the National Statistical Office & O.R.C Macro {157}, the extent of chronic � �
malnutrition in Malawi has not changed for decades. Among under-five children, stunting was �!�
reported as high as 47% (and 20% were severely stunted), while wasting and underweight �"�
were estimated at 4% and 13%, respectively {156}. Nine percent women of the age group 15 �#�
– 49 years had chronic energy deficiency nationwide. The levels of malnutrition were higher �$�
among rural women with highest levels (12%) in Mangochi district (site of the NUFU project) ���
{157}. Micronutrient deficiencies were also reported amongst under – five children, women ���
and even men {157}. Malnutrition is caused by inadequate dietary intake of energy and ���
nutrients {64, 126, 143} among other causes. Foods of animal origin are good sources of ���
protein, vitamins and other micronutrients but because of economic constraints, their ���
consumption is generally low in the populace {62}. Therefore, there is need for an alternative � �
low cost source of high quality protein and other nutrients that can be incorporated in the diet �!�
and can be consumed by both adults and children. �"�
�#�
Legumes such as soybeans provide good quantities of protein, carbohydrate, fiber, B �$�
vitamins, calcium, iron and fat hence are an appropriate supplement to carbohydrate rich diets ���
{8}. Soybean (Glycine max) has the highest protein content (35-40%) among the edible grain ���

��
�
legumes, it is cheaper than animal source proteins {8} and is cultivated in most parts of ���
Malawi {83}. Like all legumes, soybean proteins are relatively low in sulphur-containing ���
amino acids (methionine and cysteine) and tryptophan but are a rich source of lysine which is ���
a first limiting essential amino acid in cereals {8, 46}. With respect to lysine and sulphur-� �
containing amino acids, cereal and legume proteins are nutritionally complementary because �!�
limiting amino acids in soybean protein are adequately complemented by those found in �"�
cereals such as maize {46}. Therefore, consumption of soybeans together with cereals �#�
provides a high quality protein equivalent to that of meat and eggs {125}. Soybean has been �$�
used in the prevention and treatment of protein energy malnutrition in young children, as well ���
as in improving the nutritional status of communities {223}. Therefore, soybean is a suitable ���
substitute or alternative for expensive animal products as there is a worldwide shortage of ���
affordable protein {223}. ���
1.2 Statement of the problem ���
In spite of the high nutritional value of soybean, its utilization in Malawi is minimal and it is � �
mainly consumed as a porridge locally known as Likuni Phala {87, 126}. Utilization of �!�
soybeans to their maximum potential is held back due to limited knowledge in processing �"�
{35}. Soybeans require processing before utilization because they contain anti-nutritional �#�
factors such as lectins, trypsin inhibitors and phytic acid {137, 168, 171, 207}. The major �$�
disadvantage of soybeans regarding consumer acceptance is the strong off-flavors associated ���
with its products. Soybeans have a characteristic “beany” or grassy flavor with bitter and ���
astringent tastes {8} which some people find disagreeable. In addition, adoption of soybean ���
utilization at home level in Africa is challenged by the long cooking time that is required ���
before palatability is attained and the subsequent high fuel requirements {122, 223}. In order ���
to maximise nutritional benefits from soybeans, there is a need for low cost household food � �
processing methods that can reduce or eliminate anti-nutrients and off-flavors and at the same �!�
time reduce the energy requirements by reducing the cooking time. It was against this �"�
background that fermentation of soybeans into soybean pastes or soybean-maize blends to be �#�
consumed as side dishes or relishes along with nsima was proposed. $�
1.3 Justification of the study ��
Although numerous intervention efforts to combat various types of malnutrition mainly ��
focused on under-five children, it is now recognized that malnutrition are prevalent in the ��
��
�
general population {66}. In addition, regardless of several trials involving multiple ��
micronutrient supplements or fortificants conducted in developing countries, results have been ��
disappointing. In some cases, no effect of multi-micronutrients on growth was seen whereas �
in others, the actual increase in linear growth in children receiving the multi-micronutrients !�
was less than the potential increment expected {236}. The mixed results highlighted the "�
constraints on growth in children in developing regions, imposed by prenatal and/or #�
intergenerational maternal malnutrition {236}. Therefore, there is critical need for sustainable !$�
dietary interventions to improve the nutrient adequacy of plant-based diets across generations !��
in developing countries {236}. !��
Fermentation is one of the oldest food technology applications that has been used for survival !��
since the primitive pottery age. In Malawi, fermentation is an indigenous technique used in !��
the production of cereal fermented gruels (thobwa) consumed as refreshing beverages {64}. !��
The traditional fermentation of foods has several benefits including enrichment of the diet ! �
through development of a diversity of flavors, aromas, and textures in food substrates, !!�
preservation of substantial amounts of food through lactic acid, alcoholic, acetic acid, and !"�
alkaline fermentations, enrichment of food substrates biologically with protein, essential !#�
amino acids, essential fatty acids, and vitamins, detoxification and decrease in cooking times "$�
and fuel requirements {210, 212}. "��
Moreover, in a study to promote dietary diversification in order to increase consumption and "��
bioavailability of micronutrients (zinc and iron) in maize-based staples in rural Malawi, "��
Gibson & Hotz {62} recommended use of fermented maize and legume flours. They also "��
recommended consumption of additional fermented products. Fermented soybeans or a "��
combination of soybean and grains have been widely consumed in Far East Asia and in some " �
parts of Africa as protein sources and as flavoring ingredients {39, 95, 106, 193, 211}. Some "!�
of the fermented soybean products like Nepalese kinema are fried and served as side dishes ""�
along with rice and they act as meat substitutes or meat alternatives {194}. Therefore, in order "#�
to increase utilization of soybeans in Malawian diets, fermented soybean pastes and their #$�
maize blends to be used as meat alternatives were developed. #��
�#��
�#��
�#��
��
�
2 LITERATURE REVIEW#��
2.1 History, production and uses of soybeans # �
Soybean [Glycine max (L.) Merr.] belongs to the Leguminosae family and is thought to have #!�
originated in Eastern Asia, particularly in north and central China. It is believed that #"�
cultivated varieties were introduced into Korea and Japan about 2000 years ago {16}. Today, ##�
220.9 million metric tons of soybeans are cultivated worldwide and the United States of �$$�
America, Brazil and Argentina are the leading producers {8}. In 2008, U.S.A produced 33% �$��
of the total soybean in the world, followed by Brazil (28%), Argentina (21%), and China (6%) �$��
{8}. In Malawi, 73,000 tonnes of soybeans were produced in 2010 and most (63,000 tonnes) �$��
were used within the country {130}. Demand for soybean production in Malawi is driven by �$��
the poultry feed industry {130} and limited demand comes from the corn–soy blend industry �$��
that produces composite flours mainly for children consumption {220}. �$ �
The existence of numerous utilization alternatives have earned soybean the title of " the �$!�
wonder bean" {16}. Utilization options for soybeans can be divided into two groups: those �$"�
based on the whole seed and those which start with the fractionation of the soybean into oil �$#�
and meal (Fig 1). Crude soybean oil undergoes several operations during refining to produce ��$�
soybean oil for human consumption while the by-products are used as animal feedstuff {16}. ����
Roasted whole soybean flours are used as ingredients of traditional confectionery products ����
and snacks in China, Japan, Korea and Indonesia. Immature whole green soybeans are ����
consumed as a vegetable while mature dry soybeans are rarely used as cooked legume (as is ����
done in navy beans, black beans, chick peas or lentils) even in the traditional areas of soybean ����
consumption {16}. This is probably due to the persistent bitterness and "green beany taste" of �� �
soybeans, the low starch content, the relatively low water adsorption (swelling) capacity, long ��!�
cooking time and poor digestibility {16}. Therefore, all the traditional routes of utilization of ��"�
soybeans as food involve some sort of processing or fractionation to overcome these ��#�
disadvantages. ��$�
����

��
�
����
Fig 1: Flow chart of soybean processing, products and how they are used. Source: National ����
Soybean Research Laboratory {155}. ����
2.2 Chemical and nutritional composition of soybeans ����
2.2.1 Proteins and amino acids �� �
Soybeans constitute an important component of the traditional diets of many people ��!�
particularly in Asia and Africa {16, 134, 216}. Soybeans are valued because of their high ��"�
protein and fat contents {8, 132}. The chemical composition of soybeans varies according to ��#�
genotype and growing conditions {70}. Soybean seeds contain on average 40 – 41% protein ��$�
on a dry matter basis {132} although a range of 33.2 to 51.3% protein in some genotypes has ����
been reported {16, 60, 84, 137, 168, 181, 184}. The main proteins are two globulins, glycinin ����
and �-conglycinin and they account for 65 – 80% of the total seed protein {132}. ����
Soybean proteins contain all amino acids essential to human nutrition; hence soybean’s ����
protein quality is regarded as almost equivalent to animal sources {44}. Protein quality is ����
evaluated using chemical score, biological value, protein efficiency ratio, net protein �� �
utilization, and true protein digestibility-corrected amino acid score {8, 16, 46}. The chemical ��!�

�
�
score of soybeans is estimated to be about 70% {222} because the percentage of limiting ��"�
sulfur containing amino acids, methionine and cysteine (Table 1) in soybean protein is about ��#�
70% of that of whole egg protein {16}. Protein digestibility-corrected amino acid score ��$�
(PDCAAS) is now widely used as a routine assay for protein quality evaluation {8}. This ����
method compares the amino acid pattern of a protein and human amino acid requirements and ����
digestibility, to arrive at a value for protein quality {8}. According to PDCAAS method, ����
soybean protein products received scores between 0.95 and 1.00 {8}. The PDCAAS values ����
for beef protein, milk protein, and egg protein are 0.92, 1.00, and 1.00, respectively {8, 27}. ����
Thus according to the PDCAAS method, the quality of soybean protein is comparable to �� �
animal protein {8}. ��!�
Overall nutritional quality of soybeans is lower than that of animal proteins because of low ��"�
concentration of sulfur containing amino acids in soybeans. {46, 132}. Nevertheless, for a ��#�
plant protein, soybean protein is rich in lysine and tryptophan and hence serves as a valuable ��$�
supplement to cereal foods where the two amino acids are limiting factors {16, 168}. The ����
most abundant amino acid in soybeans is glutamic acid followed by aspartic acid (Table 1). ����
These two amino acids are responsible for the monosodium glutamate (umami) flavor in ����
soybean products {92}. The other amino acids contribute to sweetness and bitterness in ����
soybean products {92, 119}. ����
2.2.2 Lipids �� �
The amount of oil in soybeans varies from 15 – 23% depending on genotype {16, 84, 138, ��!�
184}. The contents of unsaturated fatty acids such as oleic, linoleic and linolenic acids are ��"�
relatively higher compared to the saturated fatty acids, palmitic and stearic acids. Total ��#�
unsaturated fatty acids in different soybean varieties range from 78.8 to 88.3% {138}. � $�
Soybean oil is a rich source of linoleic and �-linolenic acids which are essential fatty acids � ��
belonging to the �-6 and �-3 families, respectively {44, 132}. However, the high content of � ��
unsaturated fatty acids makes soybean oil relatively unstable and susceptible to oxidation in � ��
the presence of lipoxygenases leading to rancidification and consequently to off-flavor � ��
development {44, 132, 138}. � ��
� �
� !�
� "�

!�
�
Table 1: Amino acid composition of soybeans (dry matter basis) � #�
Component Literature values Literature reviewed Essential amino acids g/100g (g/16g N) {16, 23, 56, 69, 70, 141, 168, 171} Arginine 2.58 – 3.45 (5.68 – 7.23) Histidine 0.91 – 1.23 (2.28 – 2.53) Isoleucine 1.33 – 2.08 (3.40 – 4.54) Leucine 2.77 – 3 .65 (5.88 – 7.84) Lysine 2.07 – 2.96 (5.23 – 6.68) Methionine 0.22 – 0.65 (1.19 – 1.39) Phenylalanine 1.84 – 2.36 (3.88 – 4.94) Threonine 1.42 – 2.13 (3.34 – 3.99) Valine 1.54 – 2.22 (3.40 – 4.80) Nonessential amino acids g/100g (g/16g N) {16, 23, 56, 69, 70, 141, 168, 171} Alanine 1.53 – 2.09 (3.38 – 4.26) Aspartic acid 4.12 – 5.59 (9.26 – 11.70) Cystine 0.45 – 1.04 (1.33 – 1.39) Glutamic acid 6.65 – 8.77 (14.3 – 18.87) Glycine 1.52 – 2.06 (3.29 – 4.18) Proline 1.85 – 2.61 (4.35 – 5.61) Serine 1.97 – 2.58 (4.61 – 5.28) Tyrosine 1.12 – 1.75 (2.49 – 3.76) Tryptophan 0.30 – 0.80 (0.71 – 1.28) Hydroxyproline 0.01 – 0.1
2.2.3 Carbohydrates �!$�
Carbohydrates are among the most abundant components in soybeans accounting for ca. 35% �!��
of the dry seed weight {132}. Other seed lines with a total carbohydrate content ranging from �!��
19.8 – 38.1% are known {16, 60, 168, 171}. High proportion of the carbohydrates is in seed �!��
coat (hulls) and some carbohydrates are located in the embryo {132}. Almost half of the total �!��
carbohydrates are structural, composed of cell-wall polysaccharides such as cellulose, �!��
hemicellulose, and pectins, whereas the nonstructural carbohydrates include starch and �! �
different mono-, di-, and oligosaccharides {132}. The cell-wall polysaccharides together with �!!�
lignin, enzyme-resistant starch and oligosaccharides are constituents of dietary fiber, a non-�!"�
digestible portion of food and feed {132}. Soybeans are rich in dietary fiber (Table 2) which �!#�
is mostly removed during a dehulling process. �"$�
The proportion of soluble carbohydrates varies between 11 and 25% and includes 15 – 20 �"��
different sugar species {132}. The most abundant soluble sugars are sucrose, stachyose and �"��
raffinose (Table 2). The galactooligosaccharides, raffinose, stachyose and verbascose are �"��
considered as anti-nutritional factors because their consumption is associated with flatulence �"��
and digestive disturbance in humans and nonruminant animals {108, 132, 229}. Raffinose, �"��
stachyose and verbascose contain one, two, and three galactose molecules, respectively, �" �

"�
�
attached to sucrose via �-1�6 glycosidic bond {132}. Mammals do not synthesize �-�"!�
galactosidase enzyme required to hydrolyze galactooligosaccharides to D-galactose and �""�
sucrose in the small intestine {27, 132}. Consequently, the galactooligosaccharides pass to the �"#�
lower intestine where they become substrates for bacterial fermentation that generates carbon �#$�
dioxide, methane and other flatulence–producing gases {27, 132}. �#��
Table 2: Carbohydrate composition and dietary fiber content of soybeans (dry matter based) �#��
Carbohydrate Literature values (g/100g) Literature reviewed Glucose 0.03 – 2.7 {16, 132, 168, 171, 184} Fructose 0.02 – 2.5 Maltose 0.30 – 0.50 Sucrose 1.1 – 9.47 Raffinose 0.1 – 1.4 Stachyose 0.07 – 6.9 Verbascose 0 – 0.19 Starch 0.2 – 1 Dietary fiber 19.7 – 24.4 Crude fiber 4 – 8 ��#��
2.2.4 Minerals and vitamins �#��
Soybeans contain about 3.9 – 5.36% minerals determined as ash {16, 60, 171}. The major �#��
mineral constituents are potassium, calcium, magnesium and phosphorus. However, a �# �
substantial amount of the phosphorous in soybeans is found in bound form hence is not �#!�
available for human use {132}. Mohamed et al. {137} estimated total phosphorus in soybeans �#"�
as 20.82 mg/g while available phosphorus was 11.97 mg/g. In addition, the biological �##�
utilization of most minerals such as zinc (Zn), iron (Fe), magnesium (Mg) and calcium (Ca) is �$$�
impaired by phytic acid {16, 132, 137}. �$��
Soybean is a good source of niacin, B-vitamins, folic acid and vitamin E (�-tocopherol) but is �$��
deficient in vitamin B12 and vitamin C {44}. In human diet, soybean oil is considered as good �$��
source of vitamins K and E even though some proportion of the vitamins may be lost during �$��
processing of the oil {168}. �$��
2.2.5 Anti-nutritional factors �$ �
In addition to oligosaccharides, soybeans contain other anti-nutritional factors namely trypsin �$!�
inhibitors, lectins, and phytic acid {30, 168, 205, 224}. Levels of the anti-nutritional factors �$"�
are presented in Table 3. �$#�
There are two types of trypsin inhibitors known as Kunitz trypsin inhibitor (KTI) and ��$�
Bowman-Birk inhibitor (BBI) and both are active against trypsin, while the latter is also ����

#�
�
active against chymotrypsin {16, 27, 56, 168}. These protease inhibitors interfere with ����
digestion of proteins resulting in decreased animal growth {27, 168}. Ingestion of trypsin ����
inhibitors can result in increased pancreatic secretion and hypertrophy of the pancreas {118}. ����
Since pancreatic enzymes such as trypsin and chymotrypsin are particularly rich in sulfur-����
containing amino acids, then pancreatic hypertrophy causes a drain on the body tissue of these �� �
particular amino acids {118}. This loss intensifies an already critical situation which cannot ��!�
be compensated with dietary soybean protein, which is inherently deficient in sulfur-��"�
containing amino acids {16, 27, 118}. The activity of the inhibitors is destroyed when ��#�
soybeans are toasted or heated during processing {48, 168}. ��$�
Table 3: Anti-nutrient composition of soybeans ����
Anti-nutrient Literature values Literature reviewedLectins 0.11 – 9.4 HU1/mg DM2 {168, 171} Phytic acid 1.12 – 4.07 g/100 g DM {137, 207} Trypsin inhibitor 24.713 – 1844 TIU5/mg DM {137, 168}
1 HU = Hemaggluttination units ����2DM = dry matter ����3 in TIU/mg of raw soybean based on dry matter ����4 in TIU/mg in protein content of crude defatted soybean seed extract ����5TIU = Trypsin inhibitor units �� �
��!�
Lectins were formely known as hemagglutinins and are proteins capable of agglutinating red ��"�
blood cells {16, 180}. Some lectins can be highly toxic but the lectins present in raw soybeans ��#�
have no observable dietary effects (good or bad) in humans and they are heat-labile {16, ��$�
180}. However, resistance to dry heat has been reported in some studies {168}. ����
Phytic acid (myoinositol 1,2,3,4,5,6-hexakis dihydrogen phosphate) is the main storage form ����
of phosphorus in legumes and cereals {27, 132, 137}. It accounts for 65–80 % of the total ����
soybean seed phosphorous {132} and its contents varies (Table 3). In soybeans, phytic acid is ����
concentrated mostly in the cotyledons {132}. Humans cannot utilize phytic acid phosphorus ����
because of lack of phytase, the digestive enzyme required to release phosphorous from the �� �
phytic acid molecule {27, 132}. ��!�
Charged phytin salts bind with nutritionally important minerals like Zn, Ca, Mg and Fe and ��"�
forms phytate-metal complex rendering the minerals biologically unavailable to humans and ��#�
non-ruminant animals {30, 132, 137, 224, 237}. In addition, phytic acid decreases the ��$�
solubility, functionality and digestibility of proteins by forming protein-phytate complexes ����
{27, 180}. The protein-phytate complexes are more resistant to digestion by proteolytic ����
�$�
�
enzymes; hence they reduce utilization of dietary protein {27}. Phytic acid also interacts with ����
enzymes, such as trypsin, pepsin, �-amylase and �-galactosidase decreasing their activities ����
{30, 180}. ����
There is an increasing number of reports suggesting that phytic acid may have a positive �� �
effect on animal and human health by acting as an anti-carcinogen and as an antioxidant ��!�
through formation of complexes with Fe leading to a decrease in free radical generation and ��"�
peroxidation of membranes {67, 132, 134}. However, in populations dependent on cereals ��#�
and legumes, where micronutrient deficiencies such as Zn deficiencies and anemia are ��$�
widespread, emphasis should be on reducing or eliminating phytic acid in the diet. ����
Mohamed & Rangappa {138} considered lipoxygenase as an anti-nutritional factor prevalent ����
in soybean. Lipoxygenase activities are responsible for the development of off-flavors ����
described as grassy or beany {8}. Lipoxygenase activities in soybean ranges from 829.8 to ����
4750.4 units/min/mg and the variations are influenced by genotype {138}. Lipoxygenase-free ����
cultivars were developed to eliminate the off-flavors and increase acceptability of soybean �� �
foods in Western cultures {132}. However, sensory characteristics only improved in tofu and ��!�
soymilk but not in bread, meat patties, and beverage products because of auto-oxidation of oil ��"�
{132}. As a result, lipoxygenase-free cultivars have not been used extensively {132}. ��#�
2.2.6 Other compounds � $�
Soybean is the most abundant source of isoflavones, containing about 0.1 to 5 mg/g (dry � ��
weight){44, 107}. Isoflavones are a sub-group of plant phenolic compounds called flavonoids � ��
{44, 134}. The isoflavones in soybeans are of three basic types, diadzein, genistein and � ��
glycitein and they exist as aglycones but they can also exist in three other conjugate forms as � ��
glucosides, acetylglucosides or malonylglucosides {44, 85, 107, 168}. Lately, the effects of � ��
isoflavones in humans have become an active area of research. Isoflavones are phytoestrogens � �
with structural similarity to mammalian estradiol; hence they have the ability to bind estrogen � !�
receptors and exhibit weak estrogenic activities {44, 132, 134}. Other biological and � "�
beneficial health effects include hypocholesterolemic effects, anticancer effects, improved � #�
digestive tract function, improved lipid metabolism, bone health, prevention of menopausal �!$�
symptoms, antidiabetic effects and antioxidative effects {12, 44, 85, 106, 132, 134}. �!��
However, isoflavones are associated with bitter and astringent tastes which are increased by �!��
the hydrolysis of isoflavones aglycones through the action of �-glucosidases {8}. �!��
���
�
Soybean is one of the eight foods that account for most of the immunoglobulin E (IgE) -�!��
mediated food allergies {27, 168, 209}. The prevalence of soybean allergy in the general �!��
population is between 0.3 – 0.7% and the prevalence is high in children with atopic eczema �! �
{168}. Many cases of soy allergy are outgrown during childhood {55, 168}. Allergic �!!�
reactions are similar to those elicited by other food allergens and most severe reactions like �!"�
anaphylaxis and death are rare {168}. Proteins in soybeans that are considered as potential �!#�
allergens include �-conglycinin, glycinin and P34; and the P34 protein is responsible for most �"$�
of the soybean allergic reactions {168}. �"��
2.3 Effect of domestic processing on composition of soybeans �"��
Different processing techniques such as soaking, cooking, roasting, germination and �"��
fermentation are employed before consumption of soybeans. The processing causes changes �"��
in a number of physicochemical, biochemical, nutritional and sensory properties. The �"��
processing methods enhance the nutritional value of soybean by increasing the availability of �" �
amino acids, increasing vitamin content, improving protein digestibility and reducing the �"!�
contents of the anti-nutritional factors {199}. In many cases, the use of only one method does �""�
not completely remove a given anti-nutritional compound and a combination of two or more �"#�
methods is required {46}. Processing of raw soybeans is also required in order to eliminate �#$�
the disagreeable beany flavors so as to increase market potential and acceptability {179, 233}. �#��
Processing also improves appearance, texture, cooking quality and palatability {48, 207}. �#��
2.3.1 Dehulling �#��
Soybeans possess a fibrous seed coat, or testa or husk which is indigestible because it contains �#��
most of the dietary fiber. Therefore, in most cases soybeans are dehusked or dehulled before �#��
use or before further processing. Dehulling improves palatability and digestibility and it also �# �
reduces cooking time {207, 233}. Digestibility is improved through removal of the �#!�
indigestible cell-wall polysaccharides, tannins and trypsin inhibitors {132, 233}. Dehulling �#"�
can lead to 48% reduction {90} or complete elimination of tannins {48}. �##�
Combining dehulling and cooking can completely eliminate tannins and at the same time �$$�
substantially (82%) reduce trypsin inhibitor {48}. Lower reduction (17%) in trypsin inhibitor �$��
activity (TIA) was reported due to dehulling and cooking {90}. However, the combined �$��
treatment led to an increase in phytic acid content by 21% {48}. Removal of the germ along �$��
with the husk during dehulling results in loss of thiamine {207}. �$��
���
�
2.3.2 Soaking �$��
Soaking reduces the amount of soluble compounds like oligosaccharides, reducing sugars and �$ �
total soluble sugars. Soaking reduced total soluble sugars by 17%, reducing sugars by 23%, �$!�
starch content by 14% {89}, sucrose, raffinose and stachyose, by 26.68%, 25% and 20%, �$"�
respectively {48}. The combined effect of soaking, dehulling, washing and cooking resulted �$#�
in 61%, 47.5% and 63% reductions in sucrose, raffinose and stachyose, respectively {48}. ��$�
While soaking and cooking reduced raffinose by 88% and stachyose by 75%, the two ����
oligosaccharides along with sucrose were completely hydrolysed after fermentation {189}. ����
On the contrary, Kaushik et al. {89} reported buildup of reducing sugars from 34 to 44% and ����
of total soluble sugars from 2 to 10% after cooking of soaked seeds. In the same study, ����
cooking greatly reduced the starch content with 35 to 39% and the reductions were highest in ����
pressure cooking (57%). �� �
Soaking reduced anti-nutritional factors such as tannins by 15 – 54.6%, sapponins by 29% ��!�
and trypsin inhibitor activities (TIA) by 8% {30, 199} but phytic acid content was increased ��"�
by 34% {30}. Soaking is also employed prior to a number of other processing treatments such ��#�
as germination, cooking and fermentation because it reduces cooking time {199, 233}. In a ��$�
combined treatment of soaking and cooking, tannins, phytic acid, sapponins and TIA were ����
reduced to a greater extent, 43%, 45%, 56% and 26%, respectively, than soaking only {199}. ����
Mineral losses occur when legumes are soaked in water which is generally discarded before ����
further processing {30}. Kaushik et al. {89} reported decreases in potassium (K), Ca, Mg, ����
phosphorus (P) and Fe and Kayembe {90} reported a 21% decrease in Fe but slight increases ����
in Ca and P. Significant reductions were also reported in riboflavin, niacin, pyridoxine and �� �
ascorbic acid {89}. Vitamin losses were explained in terms of their relative solubility in water ��!�
which defined the corresponding vitamin diffusion to the soaking medium and its subsequent ��"�
loss {89}. Sometimes salts such as sodium bicarbonate are added to soaking or cooking water ��#�
to reduce the cooking time {233}. However, such alkali treatments result in considerable ��$�
losses (up to 80%) of thiamine {233}. ����
2.3.3 Heating ����
Proper heat treatment is an absolute requirement if the essential nutrients in soybean products ����
were to be used maximally {179}. According to Chitra et al. {30}, both wet-heating and dry-����
heating were effective in reducing phytic acid content, although wet-heating was more ����
effective than dry-heating. Reddy & Pierson {180} reported 14% and 10.3% reductions in �� �

���
�
phytic acid content due to boiling and steaming, respectively. Boiling was also more effective ��!�
than autoclaving in reducing phytic acid and trypsin inhibitor contents. Boiling reduced phytic ��"�
acid by 65 – 67% and and trypsin inhibitor contents by 77 – 89%, while autoclaving resulted ��#�
in 4 – 13% and 54 – 57% reductions in phytic acid and tryspin inhibitor contents, respectively ��$�
{60}. On the other hand, boiling soybeans that were previously germinated had no effect on ����
the phytic acid content {222}. This could be due to reduced extractability of phytic acid due ����
to heat processing {137} because insoluble complexes between phytate phosphorus and other ����
components are formed during cooking {60}. ����
����
Friedman et al. {56} demonstrated the effect of duration of heating in reducing trypsin, �� �
chymotrypsin and lectin activities. Autoclaving soybeans at 121 oC for 10 min resulted in ��!�
31%, 81% and 75% reductions in trypsin, chymotrypsin and lectin activities, respectively. ��"�
When the heating time was increased to 30 min, there was complete destruction in ��#�
chymotrypsin activity while 81% and 97% reductions were achieved in trypsin and lectin ��$�
activities, respectively. Vasconcelos et al. {228} did not detect TIA after 5 min of incubation ����
at boiling temperature (92 oC). Trugo et al. {222} also reported complete inactivation of ����
trypsin inhibitor in soybeans that were germinated prior to boiling for 20 min. Although ����
heating is effective in destroying protease inhibitor activities, it does not completely eliminate ����
the protease inhibitors {55}. Friedman et al. {56} and Friedman & Brandon {55} reported ����
24% and about 1% retention of KTI and BBI, respectively, in soybeans heated for 30 min. A �� �
retention of 5 – 20% of the original trypsin and chymotrypsin inhibitory activity has also been ��!�
reported {228}. Residual inhibitory activity is attributed to minor protease inhibitors and ��"�
nonspecific inhibitors {55}. The extent to which anti-nutritional factors are destroyed by ��#�
heating is a function of temperature, duration of heating, particle size and moisture conditions � $�
{228}. � ��
� ��
Heat processes such as roasting, autoclaving and boiling result in non-significant increases in � ��
crude protein content {30, 222} although up to 10% increases due to boiling were reported by � ��
Kaushik et al. {89}. The increases were attributed to loss of soluble solids, which increased � ��
the concentration of protein in the cooked seeds. On the other hand, slight decreases in protein � �
content due to autoclaving (0.9 – 1.1%) and boiling (1.7 – 5.6%) were reported {60}. Protein � !�
digestibility was increased due to roasting and autoclaving, although to a lesser extent than � "�
fermentation and germination {30}. Increase in protein digestibility due to heating is � #�
���
�
attributed to the destruction of heat-labile protease inhibitors and to the denaturation of �!$�
globulin proteins that are highly resistant to proteases in their native state {30, 122, 233}. �!��
�!��
Heating can also lead to non-significant increases in amino acids {56, 222} although it is �!��
generally agreed that heat treatments often damage lysine, arginine, and the sulfur amino �!��
acids {76, 228}. Up to 27% reduction in lysine content of previously soaked chickpeas that �!��
underwent microwave cooking for 23 min was reported {76}. However, Van Buren et al.�! �
{226} associated lysine loss with excessive heating. Heating at 121 oC, 165 oC, and 182 oC �!!�
did not cause lysine loss, but when soymilk powders were heated from 226 oC to 315 oC, there �!"�
was an increasing loss in lysine availability. Therefore, although heating improves protein �!#�
quality by increasing its digestibility {46, 233}, loss of protein quality on continued heating �"$�
may occur due to increasing Maillard browning rendering lysine unavailable {226, 233}. As �"��
such, heat treatments have to be kept to a minimum to avoid destroying sensitive amino acids �"��
like cysteine, methionine and lysine {55, 228}. �"��
�"��
The loss of lysine due to thermal processing may be followed by the formation of new amino �"��
acids such as lysinoalanine, lanthionine and ornithinoalanine. The loss of cysteine probably �" �
occurs through desulphurization reactions which produce unstable residues of dehydroalanine �"!�
which may then condense with cysteine or lysine to form lanthionine, or lysinoalanine {173}.��""�
Although not an essential amino acid, cysteine has a sparing effect on the dietary requirement �"#�
for methionine {55}. Therefore, cysteine destruction is of importance in many vegetable �#$�
proteins which are limiting in the sulphur amino acids {173}.�Bioavailability studies have �#��
shown that lysinoalanine is not available as a source of lysine {55, 173}. Similarly, �#��
lanthionine, as a source of cysteine is partially available {173}. Methionine on the other hand �#��
may undergo oxidation to methionine sulfoxide and methionine sulfone, or may undergo �#��
racemization to D-methionine which may be degraded to compounds with undesirable flavors �#��
{55}. Protein-bound methionine is poorly utilized because of poor digestibility {55}. �# �
�#!�
Sensory characteristics such as flavor and texture may also be improved by heating, �#"�
particularly roasting {204}. Soy-dawadawa made from roasted soybeans was most preferred �##�
by consumers than dawadawa made from boiled beans {39}. Roasting can also serve as a �$$�
preliminary step in facilitating husk removal {204}. However, roasting substantially (22%) �$��
decreased in vitro protein digestibility due to an increased (21%) tannin content {90}. �$��
�$��

���
�
Heating increased total carbohydrate content by 15 – 20% {60} and reduced dietary fiber �$��
content to almost the same level as in germinated soybeans, with an advantage of less mineral �$��
loss than germination {30}. Mineral loss is high in wet-heating because of leaching {30} and �$ �
the extent depends on cooking method and the mineral in question {89}. Similarly, vitamin �$!�
losses are vitamin dependent and cooking method dependent with microwave cooking �$"�
resulting in more vitamin retention than boiling and pressure cooking because of the shorter �$#�
cooking time in the microwave cooking {89}. ��$�
����
Extrusion cooking, although not a domestic technique is becoming more popular because of ����
its numerous applications including precooked food mixes for infants and texturized vegetable ����
proteins (TVP) that are used as meat analogues {8, 206}. Texturized vegetable protein is ����
cheaper than animal proteins and it can be flavored {8}. In a consumer acceptance study of ����
fermented soybeans in Malawi, 17.8% (n = 129) of the respondents indicated using TVP �� �
popularly known as soy pieces as relish {158}. The use of TVP as protein source will become ��!�
increasingly important as the cost of animal source proteins is still escalating. Therefore, it is ��"�
important to review some of the nutritional changes that may occur during extrusion. ��#�
Extrusion cooking is a high-temperature, short-time process in which moistened, expansive, ��$�
starchy and/or proteinacious food materials are plasticized and cooked in a tube by a ����
combination of moisture, pressure, temperature and mechanical shear, resulting in molecular ����
transformation and chemical reactions {206}. The extrusion process denatures undesirable ����
enzymes (lipoxygenase, peroxidase); inactivates some anti-nutritional factors (trypsin ����
inhibitors, haemagglutinins, tannins and phytates); sterilises the finished product; and retains ����
natural colors and flavors of foods {26, 206}. There is nutritional concern regarding extrusion �� �
when the process is used specifically to produce foods that are nutritionally balanced or ��!�
enriched like weaning foods, meat replacers, animal feeds, and dietetic foods {26, 206} . ��"�
Protein digestibility value of extruded products is higher than non-extruded products, possibly ��#�
because of the denaturation of proteins and inactivation of anti-nutritional factors that impair ��$�
digestion {17, 26, 206}. Texturization under moderate conditions (160 – 170 oC) does not ����
lead to formation of lysinoalanine and lanthionine in appreciable amounts {26}. ����
However, extensive lysine loss can take place when legumes or cereals are extruded under ����
severe conditions {26, 206}. Lysine loss increases with increasing temperature (Tm > 180°C) ����
and decreasing moisture content (%H2O < 15), especially in the presence of reducing sugars ����

� �
�
{17, 26, 206}. Decreases in total lysine content, available lysine and lysine bioavailability of �� �
up to 37%, 32 – 80% and 50%, respectively were reported {17, 26, 206}. Since lysine is ��!�
limiting in cereals, its loss would immediately result in a decrease in protein nutritional value ��"�
{206}. Hence, lysine may serve as an indicator of protein damage in extruded products. In ��#�
addition, availability of arginine, tryptophan, cysteine, aspartic acid, histidine and tyrosine ��$�
may be decreased in low moisture extrusion {17, 206}. Cheftel {26} suggested ����
supplementing extruded flours with free lysine or methionine (together with vitamins and ����
minerals). ����
2.3.4 Germination ����
Germination is one of the effective means of reducing anti-nutritional factors like phytic ����
acids. During germination, the activities of endogenous phytases are increased leading to �� �
hydrolysis of phytic acid {80}. Chitra et al. {30} reported a 38.9% reduction in phytic acid ��!�
content of soybeans as a result of germination. Germination for 3 and 6 days reduced TIA by ��"�
22.6% and 32.4%, respectively {141}. Six days of germination decreased tannins (54%) but ��#�
increased polyphenols (18%) {90}. ��$�
Germination led to variable effects in reducing sugars. For instance, 4.5% reduction in ����
reducing sugars was observed after one day of germination and this was explained in terms of ����
leaching out of the soluble fractions during the soaking period {141}. As the germination ����
period increased, reducing sugars decreased by 27% {141}. The reduction in reducing sugars ����
was attributed to utilization of simple sugars as a source of energy during the germination ����
process {141}. On the contrary, Kaushik et al. {89} reported a progressive increase in the �� �
concentration of both total soluble and reducing sugars with germination time. Increases of ��!�
10% and 32% were observed in total soluble and reducing sugars, respectively, while starch ��"�
content was reduced by 26% {89}. Increases in sugars were probably due to mobilization and ��#�
hydrolysis of seed polysaccharides including starch to oligosaccharides and ultimately to � $�
monosaccharides, resulting in more available sugars and decreased starch content {89}. � ��
Chitra et al. {30} and Kaushik et al. {89} reported higher increases in protein content � ��
between 13% and 15%. According to Mostafa et al. {141}, a major change was observed in � ��
the non-protein nitrogen fraction which increased by 54% after 6 days of germination. This � ��
was attributed to the activity of proteolytic enzymes and hydrolysis of protein molecules. � ��
Although germination does not increase protein content significantly, hydrolysis of proteins � �

�!�
�
leads to improved digestibility {141}. Increased in vitro protein digestibility between 12% - � !�
26% were reported {90, 141}. � "�
Mostafa et al. {141} also showed that germination increased amino acid contents of soybeans. � #�
Total essential amino acids increased from 8.9 to 22.4% during 3 days and 6 days of �!$�
germination while the corresponding increases in total non-essential amino acids were 17.6 �!��
and 17.5% after 3 and 6 days' germination, respectively. The greatest increases were, in �!��
descending order: leucine > tyrosine > phenylalanine and glutamic acid whereas methionine �!��
and histidine contents slightly decreased {141}. �!��
Germination also increased fat content (30%) and decreased dietary fiber content (12%), �!��
starch content (30%), calcium and Mg {90, 141}. A major advantage of germination is the �! �
pronounced increases in vitamin contents. The levels of vitamins A, E, B1, B2, B6 and C �!!�
increased significantly with germination {89} and increases exceeded 500% in vitamins E �!"�
and B2 {176}. �!#�
2.3.5 Fermentation �"$�
During fermentation of soybeans, proteases, lipases, a variety of carbohydrases, and phytases �"��
are produced {164}. These enzymes cause degradation of macromolecules into substances of �"��
lower molecular weight such as peptides, amino acids, fatty acids, and sugars {107}. Cell �"��
walls and intracellular material are partly solubilized {164} contributing to texture, flavor, �"��
aroma and functionality of the product {107, 164}. In addition, fermentation can yield �"��
products with decreased cooking times and improved digestibility {210}. Generally, �" �
fermentation improves the nutritional and functional properties of legumes {3}. �"!�
Variable effects of fermentation on anti-nutritional factors have been reported. In cowpea and �""�
groundbean, TIA could not be detected after 24 hrs of fermentation while the TIA increased �"#�
in soybeans during 48 hrs of fermentation {48}. Reddy & Pierson {180}, reported about 90% �#$�
reduction in TIA in tempe fermented with Rhizopus spp. for 24 hrs and 48 hrs. On the other �#��
hand, phytic acid content increased during 24 hrs of fermentation before a 31% reduction was �#��
observed after 36 hrs {48}. Phytic acid reductions ranging from 19 - 67% have been reported �#��
in naturally-, Bacillus and Lactobacillus fermented soybeans {7, 30}. Variations in the extent �#��
to which phytic acid is reduced are attributed to the differences in culture inoculum which �#��
produce varying levels of phytase activities {30}. Phytic acid was also degraded to various �# �
extents when other processes were combined with fermentation {180}. There was a 54.5% �#!�
reduction in fermented tempe, 77% reduction in fried tempe, 89% reduction in tempe stored �#"�
�"�
�
for two weeks at 5 oC and a 94.5% reduction in fried tempe that had been stored for two �##�
weeks at 5 oC. Loss of phytic acid during fermentation is due to the activities of endogenous �$$�
phytases from both raw ingredients and due to production of phytases by fermentative �$��
microorganisms {30, 80, 180}. �$��
Other anti-nutritional factors like saponins, lectins and oligosaccharides; and sucrose are also �$��
hydrolyzed during fermentation. Up to 55.8% hydrolysis of saponins and complete hydrolysis �$��
of lectins in tempe made from germinated soybeans and fermented for 36 hrs were reported �$��
{180}. Rhizopus oligosporus, Lactobacillus curvatus R08, Leuconostoc mesenteriodes, �$ �
Lactobacillus fermentum, Bifidobacterium spp. were reported to produce �-galactosidase, an �$!�
enzyme that hydrolyses oligosaccharides {27}. Stachyose and raffinose decreased by 56.8% �$"�
and 10%, respectively, in soybeans fermented by R. oligosporus {27}. Raffinose, stachyose �$#�
and sucrose were completely hydrolyzed in cooked soybeans fermented with either Bacillus ��$�
subtilis, Enterococcus faecium, Geotrichum candidum, Candida parapsilosis or their mixture ����
{189}. Similarly, in Leu. mesenteriodes JK55 and Lb. curvatus R08 fermented soymilk, the ����
oligosaccharides were completely hydrolyzed during 18 – 24 hrs of fermentation {27}. ����
Proteins and lipids are partially hydrolyzed during fermentation resulting in more digestible ����
products {91, 210}. Minor protein increases (1 – 2%) were reported during fermentation of ����
soybeans that were either roasted or boiled prior to fermentation {39}. Chitra et al. {30} �� �
reported 11% increase in protein content and 13% increase in vitro protein digestibility due to ��!�
fermentation. Solid state fermentation of soybeans by Lactobacillus plantarum Lp6 caused ��"�
polypeptide degradation due to proteolytic enzymes of the bacteria {3}. Free amino acid ��#�
contents increased significantly from 0.33 to 8.86 g/100g, although the contents of essential ��$�
amino acids did not increase {3}. The increases were in non-essential amino acids like ����
leucine, isoleucine, valine, aspartic acid and proline {3}. During natural fermentation to ����
produce kinema, total nitrogen, soluble nitrogen and free fatty acids increased significantly ����
{193}. While B. subtilis fermentation to produce kinema resulted in 18 – 21% reduction in ����
protein nitrogen {163}, B. subtilis also increased solubility of soybean proteins during 48 hrs ����
fermentation from 22 to 54 – 64% depending on strain used {91}. �� �
Different types of fermentation result in varying effects in the chemical composition of ��!�
fermented soybeans. Cooked soybeans were subjected to natural fermentation, or were ��"�
prepared into dawadawa and naturally fermented with potash or were fermented by ��#�
Lactobacillus {7}. The amino acid profiles of soybeans fermented with Lactobacillus were ��$�
�#�
�
preferable while most of the amino acids (except glutamic acid which was highest) were ����
lowest in dawadawa compared to the naturally and Lactobacillus fermented soybeans. ����
Lactobacillus fermented soybeans had highest proline (3.59%), methionine (1.34%), leucine ����
(7.44%), tyrosine (3.46%) and phenylalanine (4.50%) contents while these amino acids were ����
lowest in dawadawa fermentation {7}. The variations were attributed to differences in ����
fermentation microorganisms associated with the different methods {7}. The different �� �
microorganisms might have used different nutrients to varying extents as sources of energy ��!�
and protein for their growth and survival {7}. ��"�
Song et al. {209} also showed that different microorganisms used in fermentation of soybeans ��#�
resulted in varied protein and amino acid contents of the fermented products. Soybean meal ��$�
that underwent natural and Saccharomyces cerevisiae fermentations increased in protein ����
content from 47 to 50% and 58%, respectively {209}. There were no significant changes in ����
methionine in natural, Lb. plantarum and S. cerevisiae fermentations but there was a 15% ����
decrease in methionine in Bifidobacterium lactis fermentation. Cysteine decreased in natural, ����
Lb. plantarum and B. lactis fermentations and increased by 56% in S. cerevisiae fermentation ����
{209}. Sarkar et al. {190} also observed variations in amino acid profiles of kinema due to B. �� �
subtilis and yeast fermentations. In Bacillus fermentation, free amino acids increased from 0.2 ��!�
to 26% of the total dry matter representing a 60-fold increase. This was attributed to the high ��"�
proteolytic nature of the organism which was evidenced by a 40-fold increase in ammonia. ��#�
The proteolytic activities were accompanied by depletion of methionine, cysteine, tryptophan, ��$�
lysine, histidine, arginine, alanine, isoleucine and hydroxyproline. The depletions were more ����
pronounced in arginine and cysteine. On the other hand, yeast fermentation resulted in smaller ����
increases in glycine, leucine, glutamine, lysine, histidine, phenylalanine and proline. The ����
variations in the profiles were attributed to the nutritional requirements of the fermenting ����
organisms {190}. ����
The extent to which amino acids are increased or decreased depends on fermentation time and �� �
temperature. Proteolytic activities were higher in dawadawa fermented at 30 – 40 oC, with ��!�
highest activities observed at 35 oC throughout fermentation while there were no proteolytic ��"�
activities until 12 hrs in soybeans fermented at 25 oC {166}. The proteolytic activities ��#�
coincided with increases in free amino acids which were highest at 35 oC and lowest at 25 oC � $�
{166}. Free amino acids also increased with fermentation time with most being produced � ��
during secondary fermentation (from 48 hrs to 2 months) of douchi fermentation {239}. Total � ��
amino acids in douchi were lower than total amino acids of boiled soybeans used as a raw � ��
�$�
�
material {239}, suggesting reduction of total amino acids with fermentation. Methionine was � ��
not detected after 15 days of fermentation, while arginine decreased more than the other � ��
amino acids because it was a preferred source of nitrogen for microorganisms during � �
secondary fermentation {239}. � !�
Crude lipid content increased from 28.8 to 32.7 – 37.2% during 48 hrs of B. subtilis� "�
fermentation of soybeans {91}. Crude lipid increases between 20 – 30% in kinema� #�
fermentation were reported {191}. Contrasting results by Dakwa et al. {39} indicated �!$�
decreases in lipid content by 10 to 15% in dawadawa. Slight decreases in crude lipid content �!��
were also reported in soybean fermentation of douchi {239}. �!��
�!��
Fermentation can alter the distribution pattern of fatty acids, although linoleic acid remains �!��
the major fatty acid in both unfermented and fermented soybeans {191}. In tempe�!��
fermentation, there was preferential hydrolysis of �-linolenic acid resulting in slight increases �! �
in oleic and linoleic acids at the expense of linolenic acid and the levels of total free fatty �!!�
acids were higher in the final product {164}. Kinema fermentation led to increases in free �!"�
fatty acids {194} which were significant in palmitic and stearic acids and non-significant in �!#�
other fatty acids, resulting in 9% and 6% increases in saturated and unsaturated fatty acids, �"$�
respectively {191}. The changes were due to lipases produced during fermentation which �"��
hydrolyzed glycerides into fatty acids that can be easily assimilated {191}. �"��
�"��
Vitamin or provitamin formations during tempe fermentation by fourteen strains of Rhizopus �"��
were studied and all the strains could form riboflavin, pyridoxine, nicotinic acid and �"��
ergosterol {43}. Some of the strains were able to form �-carotene in significant amounts and a �" �
fourfold increase in �-carotene was detected between 34 and 48 hr fermentation {43}. �"!�
According to Steinkraus {210}, riboflavin nearly doubles, niacin increases sevenfold and �""�
vitamin B12 is synthesized during tempe fermentation. Vitamin B12 levels in tempe are �"#�
estimated in the range of 2 – 40 ng/g and Klebsiella pneumoniae and Citrobacter freundii are �#$�
responsible for its production {163}. Soybean is considered as a good source of vitamin K. A �#��
Japanese fermented soybean product, natto, is a rich source containing about 6-9 ug/g vitamin �#��
K2 {27}. Natto that was produced by a mutated B. subtilis strain showed an even higher �#��
content of vitamin K2, up to 12.98 ug/g {27}. �#��
�#��
���
�
Fermentation can be used to eliminate or reduce allergic reactions in soybean sensitive �# �
individuals. During fermentation, soybean allergens are degraded by microbial proteolytic �#!�
enzymes {27, 209}. In fermented soy products such as soy sauce, miso and tempe, soy protein �#"�
is hydrolyzed into smaller peptides and amino acids and the structure of antigen epitopes may �##�
be altered, and may become less reactive {27, 104}. In soybean meal naturally fermented and $$�
fermented with Lb. plantarum, B. lactis, and S. cerevisiae, immunoreactivity was reduced by $��
79.8%, 78%, 77% and 77%, respectively, when plasma of soy sensitive individuals was used. $��
The reductions were higher, 87.5%, 86.9%, 86.3%, and 88.7%, respectively, when pooled $��
plasma of soy sensitive individuals was used {209}. $��
$��
Lately, the study of fermented soybeans has received a lot of attention from researchers $ �
because of formation of functional biopeptides. During fermentation large protein molecules $!�
are degraded into small peptides and amino acids. Some of the peptides are biologically active $"�
and play important roles as angiotensin-I converting enzyme (ACE) inhibitor and as $#�
antioxidants {27, 82, 164, 202}. �$�
2.4 Fermentation as a small-scale and household technology ���
Fermentation is one of the oldest food processing techniques that has stood the test of time ���
because of its numerous benefits including improvement of nutritional quality through ���
degradation of anti-nutritional factors and biological enrichment with nutrients, improvement ���
of organoleptic characteristics, prolonging shelf-life of food, ensuring food safety and ���
reduction in cooking times and fuel requirements {18, 22, 77, 142, 170, 212}. Fermentation � �
has allowed dietary diversification through utilization and acceptance of certain foods that �!�
may have been considered unpalatable in unfermented state {77, 201}. Fermentation is a �"�
cheap and reliable technology that is accessible to all populations even in less developed �#�
countries {116, 142}, where it may still serve as an economic means of preserving food where �$�
refrigeration or other means may not be available {78, 142, 170}. In addition, fermentation ���
has the potential of enhancing food safety by controlling growth and multiplication of some ���
enteropathogens {99, 100, 142, 214}. Fermentation still has wide applications to date in spite ���
of industrialization as evidenced by a variety of fermented products {78} including dairy, ���
bakery, alcoholic and non-alcoholic beverages, vegetables and meat products. Lately, the ���
contribution of functional attributes to a food as a result of fermentation has become a major � �
research theme {22, 27, 82, 202}. �!�
�"�

���
�
Fermented foods are described as food substrates that are invaded or overgrown by edible �#�
microorganisms whose enzymes, particularly amylases, proteases and lipases hydrolyze the �$�
polysaccharides, proteins and lipids to non-toxic products with flavors, aromas and textures ���
pleasant and attractive to the human consumer {211, 212}. Microorganisms contribute to the ���
development of taste, aroma, visual appearance, texture, shelf-life and safety due to their ���
metabolic activities {77, 78}. Enzymes indigenous to the raw materials may also play a role ���
in enhancing these characteristics {77, 78}. Traditional skills for controlling technical ���
parameters during fermentation were developed through trial and error {78}. Traditional � �
approaches include spontaneous or natural fermentations and back-slopping {78, 116} which �!�
serves as a traditional mixed starter system of inoculation. �"�
2.4.1 Natural fermentations �#�
Natural fermentations are processes initiated without the use of a starter inoculum {78}. A �$�
starter inoculum or starter culture is a preparation or material containing large numbers of ���
viable cells of at least one microorganism, which is added to a raw material to accelerate its ���
fermentation process {77, 78, 116}. Natural fermentations result from competitive activities ���
of a variety of contaminating microorganisms on raw materials, utensils and from the ���
environment {78, 116}. The microorganisms best adapted to the food substrate and to the ���
fermentation conditions and with highest growth rate dominate different stages of the � �
fermentation process {77, 78}. The production of metabolites (e.g. organic acids) inhibitory to �!�
other contaminating microorganisms may provide an additional advantage during �"�
fermentation {78}. Natural fermentations have been applied for thousands of years and are �#�
still practiced in a majority of small-scale and household fermentations all around the world, �$�
but today more extensively in Africa and Asia {18, 38, 58, 78, 95, 144, 148, 170, 174, 186, ���
187, 216}. ���
���
The quality of naturally fermented foods depends on the microbiological load of the raw ���
material {116}. Usually, the initiation of the fermentation process takes a long time and there ���
is a risk of fermentation failure which can lead to spoilage or survival of pathogens, thereby � �
creating unexpected health risks in food products generally regarded as safe {58, 78}. �!�
Because processing conditions are not sterile, natural fermentations are difficult to control �"�
{162}, and results in products of inconsistent and unstable qualities {58, 186}. To accelerate �#�
natural fermentations, malted grains have been added to the fermentation media. Available $�
endogenous amylolytic enzymes in the malted grains increase the rate of fermentation {78, ��

���
�
100, 101, 165}. Acceleration of natural fermentations have also been achieved through back- ��
slopping {58, 116, 162, 165}. ��
2.4.2 Traditional mixed starter systems of inoculation ��
These systems involve the inoculation of raw materials with a small quantity of a previous ��
successfully fermented batch and are commonly referred to as back-slopping {78, 116}. The �
microorganisms are in an active state during the time of inoculation {78}. This reduces the !�
initiation time, shortens the fermentation process and reduces the risk of fermentation failure "�
{116}. Use of back-slopping is common in developed countries although it is still practiced in #�
industrialized countries in fermentation of some products such as sauerkraut, sourdoughs, !$�
fermented meats and vegetables {22, 78, 116}. Up to 10% of previously fermented material !��
can be used as back-slopping material {161} and its continuous recycling results in selection !��
of the best adapted strains {116}. In this study, 10% of traditional fermented cereal gruel, !��
thobwa, was used as back-slopping material to initiate and accelerate lactic acid bacteria !��
fermentations. !��
2.4.3 Preservation of inoculum in traditional fermentations ! �
Use of back-slopping has allowed preservation of “starter cultures” using simple techniques !!�
such as dehydration or use of carriers. A fermenting substrate containing mixed cultures can !"�
be preserved by dehydration (air- or sun-drying) in form of flat cakes, hard balls or powders !#�
{78, 162}. Dehydration enhances the viability of microorganisms over relatively long periods, "$�
provided the product is maintained in the dehydrated state {78}. The extended viability of "��
fermentation strains allows extended storage and improved distribution of a ‘starter’ for "��
traditional food fermentations {77}. "��
"��
Inoculum carriers include use of piece of cloth in a fermentation so that the cloth becomes "��
microbiologically impregnated and provides inoculum in subsequent fermentations {219}. " �
This is practiced in fermentation of cassava dough into agbelima {219}. Another carrier of "!�
similar nature is an “inoculation belt” for pito beer fermentations in Ghana in which a fiber ""�
belt is immersed into fermenting brew to immobilize microorganisms {219}. The "#�
microbiologically impregnated cloth is dried and used to initiate next batch of fermentation #$�
{78, 219}. A porous material of a gourd and fermentation utensils are also used to preserve #��
inoculum {78}. Such simple preservation techniques usually result in mixed strain cultures #��
which offer several advantages to small-scale processing that are usually limited in #��
infrastructure. The mixed strain cultures are less susceptible to deterioration, are relatively #��

���
�
unaffected by fluctuating conditions of handling, storage and applications and they contribute #��
to a more complex sensory quality {78}. The mixed strain cultures produce favorable # �
synergistic effects such as degradation of undesirable factors, flavor production and #!�
accelerated ripening and maturation {78}. The disadvantage of the cultures is the variation in #"�
product quality which can be minimized through proper process control and the risk of ##�
contamination of the back-slopping cultures {78, 162, 186}. !$$�
2.4.4 Starter cultures in small-scale fermentations !$��
Defined (multiple–strain starter) and undefined (mixed-strain starter) cultures that are used in !$��
large-scale fermentations {131} offer advantages of improving both process control and the !$��
predictability of product quality {186}. However, they possess a number of challenges for !$��
small-scale operations because the pure cultures relatively undergo deterioration in !$��
performance easily due to bacteriophage infection and loss of key physiological properties !$ �
that may be plasmid encoded {78, 116}. Besides, the equipment for the preparation, handling !$!�
and application of pure strain cultures and the strict process control required at all stages of !$"�
the fermentation may not be feasible in most small-scale operations {78}. Another barrier to !$#�
the application of starter cultures in small-scale fermentation is the loss of uniqueness of the !�$�
characteristics that made the fermented products popular {116, 225}. !���
!���
Nevertheless use of defined starter cultures becomes inevitable due to upscaling of !���
manufacturing processes as products become popular and as demand grows {22}. This makes !���
it imperative to determine roles and technological properties of microorganisms involved in !���
natural fermentations. Therefore, studies on isolation and characterization of wild strains that !� �
dominate natural and back-slopping fermentations remain important as these strains serve as !�!�
sources of desirable properties for starter culture development. !�"�
2.5 Microbiology of lactic acid bacteria fermented cereal gruels of Africa !�#�
Africa boasts abundant types of fermented foods that can be found in all categories of !�$�
Steinkraus {211} classification of fermented foods.�Among the fermented foods in Africa, !���
lactic acid bacteria fermented products form the majority, and of which cereal based !���
fermented foods dominate {170}. Lactic acid bacteria fermented cereal based foods include !���
gruels and beverages, alcoholic beverages, acid leavened breads and pancakes, while non-!���
cereal based foods include root crops, milk products and vegetable products {170}. The main !���
LAB implicated in fermentations of both cereal and non-cereal based foods belong to four !� �
genera, namely Lactobacillus, Lactococcus, Leuconostoc and Pediococcus {170}. Some of !�!�

���
�
the cereals gruels are used as complementary foods therefore are of nutritional significance !�"�
{18, 170, 211}. !�#�
!�$�
The names, raw materials, preparation techniques and recipes for fermentation of cereal !���
gruels vary from country to country (Table 4). The Zimbabwean tobwa is made from left !���
overs of stiff maize porridge (sadza) which are broken into small pieces, suspended in water !���
and left to ferment naturally {58}. On the other hand, the Malawian thobwa is prepared like !���
some of the Tanzanian togwa in which maize flour slurry is boiled for 20 – 30 min, cooled !���
down to 45 – 60 oC, and then malt flour of either millet, sorghum, or maize is added before !� �
the mixture is left to ferment naturally {102, 144, 158}. Lactic acid bacteria are the dominant !�!�
flora of the fermented cereal gruels (Table 4). The general principle of lactic acid bacteria !�"�
fermentation is that lactic acid bacteria convert fermentable sugars in the cereals to lactic acid !�#�
and other metabolites {99, 133, 211}. The pH is subsequently reduced to 4.0 or less and the !�$�
final product is generally regarded as safe {100, 133, 214}. Inhibition of proliferation of !���
enteropathogens including toxigenic Escherichia coli, Campylobacter jejuni, Shigella !���
flexineri, Salmonella typhimurim, Bacillus cereus and Aeromonas, during fermentation of !���
maize and sorghum based gruels (togwa and mahewu) have been reported {58, 99, 100, 214}. !���
Therefore, promotion of wide use of fermented cereals as complementary foods was !���
suggested as a solution to many cases of infant diarrhea that arise due to contamination of !� �
infant foods in Africa {170}. ��!�!�
!�"�
!�#�
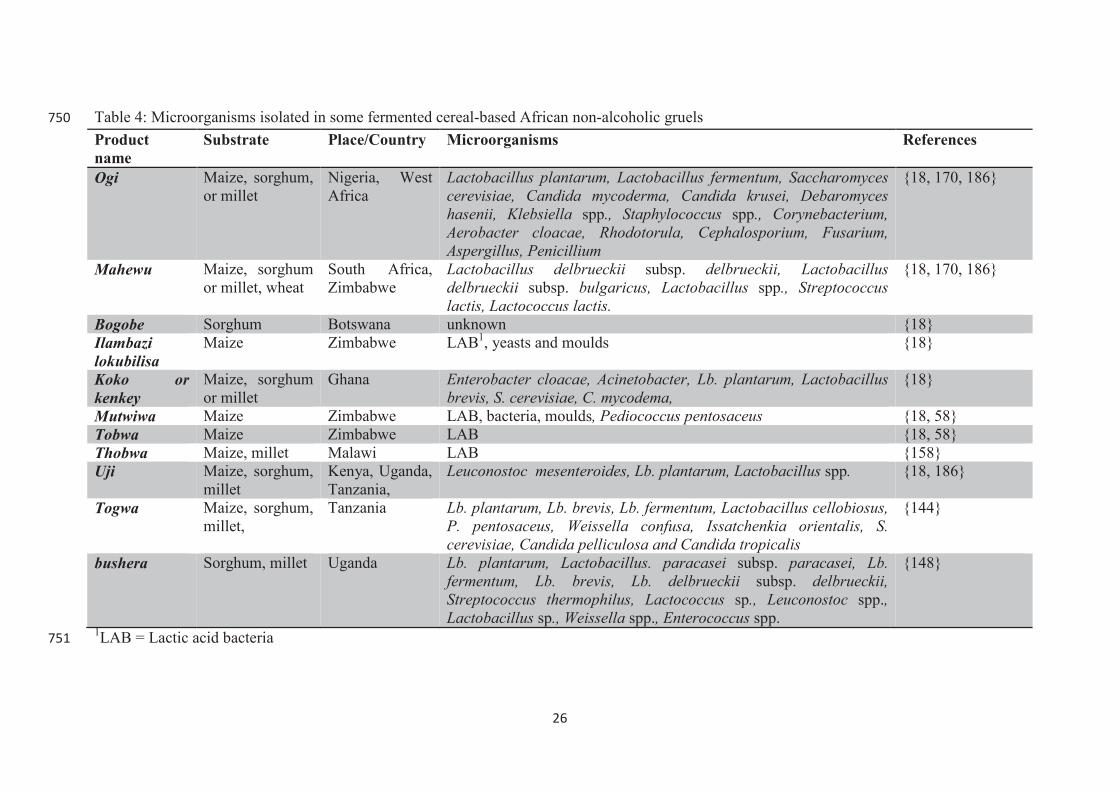
� �
�
Table 4: Microorganisms isolated in some fermented cereal-based African non-alcoholic gruels !�$�
Product
name
Substrate Place/Country Microorganisms References
Ogi Maize, sorghum, or millet
Nigeria, West Africa
Lactobacillus plantarum, Lactobacillus fermentum, Saccharomyces
cerevisiae, Candida mycoderma, Candida krusei, Debaromyces
hasenii, Klebsiella spp., Staphylococcus spp., Corynebacterium,
Aerobacter cloacae, Rhodotorula, Cephalosporium, Fusarium,
Aspergillus, Penicillium
{18, 170, 186}
Mahewu Maize, sorghum or millet, wheat
South Africa, Zimbabwe
Lactobacillus delbrueckii subsp. delbrueckii, Lactobacillus
delbrueckii subsp. bulgaricus, Lactobacillus spp., Streptococcus
lactis, Lactococcus lactis.
{18, 170, 186}
Bogobe Sorghum Botswana unknown {18} Ilambazi
lokubilisa
Maize Zimbabwe LAB1, yeasts and moulds {18}
Koko or
kenkey
Maize, sorghum or millet
Ghana Enterobacter cloacae, Acinetobacter, Lb. plantarum, Lactobacillus
brevis, S. cerevisiae, C. mycodema,
{18}
Mutwiwa Maize Zimbabwe LAB, bacteria, moulds, Pediococcus pentosaceus {18, 58} Tobwa Maize Zimbabwe LAB {18, 58} Thobwa Maize, millet Malawi LAB {158} Uji Maize, sorghum,
millet Kenya, Uganda, Tanzania,
Leuconostoc mesenteroides, Lb. plantarum, Lactobacillus spp. {18, 186}
Togwa Maize, sorghum, millet,
Tanzania Lb. plantarum, Lb. brevis, Lb. fermentum, Lactobacillus cellobiosus,
P. pentosaceus, Weissella confusa, Issatchenkia orientalis, S.
cerevisiae, Candida pelliculosa and Candida tropicalis
{144}
bushera Sorghum, millet Uganda Lb. plantarum, Lactobacillus. paracasei subsp. paracasei, Lb.
fermentum, Lb. brevis, Lb. delbrueckii subsp. delbrueckii,
Streptococcus thermophilus, Lactococcus sp., Leuconostoc spp., Lactobacillus sp., Weissella spp., Enterococcus spp.
{148}
1LAB = Lactic acid bacteria!���
�!�
�
2.6 Microbiology of alkaline fermented seeds and soybean products !���
Africa and Asia have a number of important fermented foods that are produced from seeds to !���
provide flavor and serve as cheap sources of protein in the diet {167, 187, 211, 216}. In !���
Africa, these include dawadawa (soumbara or iru), ogiri, ugba, aisa, okpehe, bikalga and !���
awoh {4, 174}. Ogiri, ugba, aisa, okpehe, bikalga and awoh are produced from mellon seeds !� �
(Citrullus vulgaris), African oil been seeds (Pentaclethra macrophylla), rain or saman tree !�!�
(Albizia saman), Prosopis Africana, roselle (Hibiscus sabdariffa) and cotton seeds !�"�
(Gossypium hirsutum), respectively {174}. Dawadawa, as is known in Nigeria and Ghana, is !�#�
also called soumbara in Burkina Faso and iru in Nigeria, nenetu in Senegal, afitin, iru and ! $�
sonru in Benin and kinda in Sierra Leon {1, 4, 39, 174}. Dawadawa is produced by natural ! ��
fermentation of soaked, cooked and dehulled locust bean seeds (Parkia biglobosa) and B. ! ��
subtilis is the main fermenting microorganism {4, 39, 174, 211}. The seeds are spread in ! ��
calabash trays and wrapped in jute sacks or packed in earthenware pots and their fermentation ! ��
results in a stringy mucilaginous coating accompanied by strong ammoniacal odor {174}. ! ��
Soybeans can substitute locust beans or can be used in combination with locust beans in the ! �
production of soy-dawadawa {4, 39, 174}. ! !�
! "�
Popular alkaline fermented foods of Asia include Japanese natto, Thai thua-nao, Korean ! #�
doenjang, and Indian kinema, all made from soybeans and where B. subtilis is the major !!$�
microorganism during their fermentation {38, 96, 193, 211}. The principle behind alkaline !!��
fermentation is that the fermenting bacteria are highly proteolytic, hydrolyzing proteins into !!��
peptides and amino acids with subsequent production of ammonia {2, 113, 114, 133, 174, !!��
193, 211}. The ammonia is released and the pH rapidly increases to 8.0 or higher {113, 211}. !!��
The combination of high pH, free ammonia and rapid growth of the fermenting !!��
microorganisms at relatively high temperature (above 40 oC) make it difficult for competing !! �
microorganisms that may be present in the product to grow {192, 211}. Therefore, alkaline !!!�
fermented foods are quite stable, safe and well preserved especially when dried {211}. !!"�
!!#�
Natto is consumed fresh without further processing in boiled rice while kinema is fried and !"$�
eaten as a side dish with boiled rice {113, 191, 194}. Traditional kinema is a non-salted !"��
fermented food prepared by washing, soaking, cooking and crushing soybeans to grits {187, !"��
215}. The soybeans are then wrapped in fern or banana leaves and sackcloth and allowed to !"��
ferment for 1-3 days at ambient temperature {187, 194}. After about 12 h, the surfaces of the !"��

�"�
�
beans are covered with a rough, white, viscous mass {187}. Fresh kinema is fried in oil and !"��
then added to vegetables and spices to prepare a curry {187, 192}. Shelf-life of fresh kinema!" �
without refrigeration is 2 – 3 days in summer and 5 – 7 days in winter and the shelf-life is !"!�
extended by sun drying for 2 – 3 days {216}. A bonus characteristic of kinema is the 50% !""�
reduction in cooking time compared to raw soybeans {192}. Japanese hikiwari-natto differs !"#�
from kinema because dehulled soybeans cracked into two or four pieces are used, while the !#$�
more common Japanese itohiki-natto, Thai thua-nao, and Chinese schui-douchi are prepared !#��
like in kinema except that whole soybeans rather than crushed ones are used {37, 187, 192}. !#��
!#��
Korean cheonggukjang differs from kinema because steamed soybeans are naturally !#��
fermented or are fermented using dried rice straws (jip) for over three days {152}. On the !#��
other hand, Korean doenjang is prepared from another fermented product called meju. Meju!# �
serves as basis for preparation of soy sauce (ganjang), soybean paste (doenjang) and hot !#!�
pepper paste (gochujang) {98, 111, 153}. Traditional meju is prepared by soaking, steaming, !#"�
and molding soybeans, followed by aging for one or two months under natural environmental !##�
conditions {98}. During doenjang preparation, meju is mixed with salt and water or red "$$�
pepper or rice and the mixture is further fermented for 2 or 3 months {95, 152}. The quality "$��
and functionality of doenjang are affected by microorganisms, fermentation process and by "$��
basic ingredients such as soybeans or grains used {151}. "$��
"$��
High ammonia production in alkaline fermented foods results in strong pungent odor which "$��
readily reaches objectionable levels {2, 174}. As such, consumption of alkaline fermented "$ �
foods is limited because some people find the atypical odor unpleasant, offensive, undesirable "$!�
or objectionable {4, 174}. The strong ammonia-like smell can be reduced by drying the "$"�
fermented product as in the case of thua nao or frying as is done in kinema {113, 192}. "$#�
Alternatively, ammonia production can be restricted during fermentation by limiting growth "�$�
and metabolism of the bacteria without inhibiting the action of flavor-generating proteolytic "���
enzymes {2}. Addition of humectants such as NaCl or glycerol or limitation of the amount of "���
initial O2 by doing the fermentation in sealed containers achieves this {2, 174}. Use of NaCl "���
inhibits both growth of bacteria and enzymatic activities while glycerol inhibits growth but "���
allows enzymatic activities to continue {2}. Amoa-Awua et al. {4} reported 1.5 and 1.7 mol "���
per kg as optimal concentrations of salt and glycerol, respectively, for controlling Bacillus"� �
growth for a reduced dawadawa odor. For a successful fermentation, addition of the "�!�
humectants after the beans have started fermenting actively is recommended {4}. Limiting the "�"�

�#�
�
initial amount of O2 to 10 – 20% reduced growth of Bacillus and allowed some increase in pH "�#�
without ammonia production {2}. In natto, ammonia formation is reduced by storage at low "�$�
temperature (5 – 10 oC) which restricts bacterial growth but allows the proteolytic enzymes to "���
continue to work {113, 174}. "���
"���
Dominant microorganisms in many alkaline fermented foods are B. subtilis {113, 174}. In "���
numerous dawadawa samples, B. subtilis accounted for 31% of all isolates while other "���
Bacillus spp. accounted for 13%, and in some samples B. subtilis represented as high as 61 to "� �
69% of all isolates {174}. Other microorganisms in dawadawa included LAB, Micrococcus "�!�
spp. and Staphylococcus spp. (Table 5). The main microflora in thua nao include Bacillus"�"�
spp. whose count can reach as high as 1010 cfu/g, followed by LAB with a count of 106 cfu/g "�#�
and moulds with a count of 103 cfu/g {113}. Chukeatirote et al. {33} reported 1012 cfu/g "�$�
moulds and bacteria counts were 1013 cfu/g and LAB were detected after 12 and 24 hrs of "���
thua nao fermentation. In kinema, B. subtilis is the functional bacterium during fermentation "���
{216}. Bacillus spp. population ranged from 3 – 5 x 10⁸ to 1010 cfu/g and the growth of "���
Bacillus did not affect growth of E. faecium whose population ranged from 5 x 10⁷ to 109"���
cfu/g during fermentation {187, 194}. Other commonly isolated microorganisms in kinema"���
are yeasts {194}(Table 5). Presence of E. coli and other Enterobacteriaceae and B. cereus in "� �
market kinema have also been reported {163}. "�!�
"�"�
Complicated and diverse microbial structures have been reported in meju, doenjang and "�#�
dajiang (Table 5). Contrary to other reports that suggested B. subtilis and its relatives as the "�$�
dominant and only important species in meju fermentation, LAB were also found to be "���
dominant {98}. Bacillus spp. represented 52% of total isolates in meju while LAB represented "���
44% of the isolates and pyrosequencing confirmed Firmicutes (composed of Bacillus and "���
LAB) as the dominant phyla {98}. LAB genera in meju include Enterococcus, Pediococcus, "���
Lactococcus, and Leuconostoc (Table 5). According to Kim et al. {95}, B. subtilis and B. "���
licheniformis are the dominant organisms that play an important role during fermentation in "� �
doenjang. However, Bacillus species are not always the dominant species because LAB were "�!�
reported dominant in other doenjang samples {151}. Although Bacillus species were "�"�
dominant in some samples of Cheonggukjang, levels of B. subtilis, B. licheniformis and B. "�#�
amyloliquefaciens varied between samples and the three species were not the dominant "�$�
microorganisms in all samples {152}. Unclassified Bacillus species and LAB dominated "���
various samples of Cheonggukjang {152}. "���

�$�
�
Table 5: Microorganisms isolated from locust bean and soybean fermentations "���
Product name Substrate Country/Place Microorganisms References
Dawadawa,
Soumbara, iru,
nenetu, afitini,
sonru, kinda
Locust bean (Parkia
biglobosa)
Nigeria, Ghana, Burkina Faso, Senegal, Benin, Sierra Leon
Bacillus subtilis, Bacillus pumilus, Bacillus licheniformis,
Bacillus brevis, Bacillus megaterium, Bacillus polymyxa,
Bacillus cereus, Bacillus firmus, Bacillus sphaericus, Bacillus
badius, Bacillus thuringiensis, Bacillus mycoides, Pediococcus
acidilactici, Enterococcus faecium, Paenibacillus alvei,
Paenibacillus larvae, Brevibacillus laterosporus, Brevibacillus
borstelensis, Brevibacillus parabrevis, Leuconostoc spp., Pseudomonas aeruginosa, Micrococcus spp.,Staphylococcus
vitulinus, Staphylococcus aureus, Staphylococcus saprophyticus,
Staphylococcus spp.,Tetragenococcus halophilus, Morganella
morganii, Ureibacillus thermosphaericus, Salinicoccus jeotgali,
Brevibacterium spp.
{1, 11, 52, 86, 169, 174, 188}
Soy(a)-
dawadawa/ soy-
daddawa
Soybeans, locust beans
Nigeria, Ghana B. subtilis, Bacillus licheniformis, Bacillus circulans, B. cereus,
B. firmus, B. pumilus, B. megaterium, S. saprophyticus,
Staphylococcus epidermidis, Micrococcus luteus, P. aeruginosa,
LAB
{39, 167, 174}
Thua nao Soybeans Thailand B. subtilis, B. megaterium, B. cereus, B. pumilus, LAB, Lactobacillus spp., moulds,
{113} {33}
Kinema Soybeans Nepal, India B. subtilis, B. cereus, B. licheniformis, B. circulans, B.
thuringiensis, B. sphaericus, Enterobacteriaceae, E. faecium,
Candida parapsilosis, Geotrichum, Escherichia coli
{163, 188, 194}
Cheonggukjang Soybeans Korea Bacillus amyloliquefaciens, Bacillus coagulans, B. licheniformis,
Bacillus sonorensis, B. subtilis, Bacillus thermoamylovorans,
Bacillus vallismortis, Enterococcus faecalis, E. faecium,
Lactobacillus pentosus, Lactobacillus plantarum, Streptomyces
rangoonensis,
{152}
Doenjang Soybeans, grains
Korea B. subtilis, B. licheniformis, B. sonorensis, B. cereus, B.
amyloliquefaciens, Brochothrix spp., E. faecium, E. faecalis,
Enterococcus casseliflavus, Lactobacillus halophilus,
{94, 95, 151}
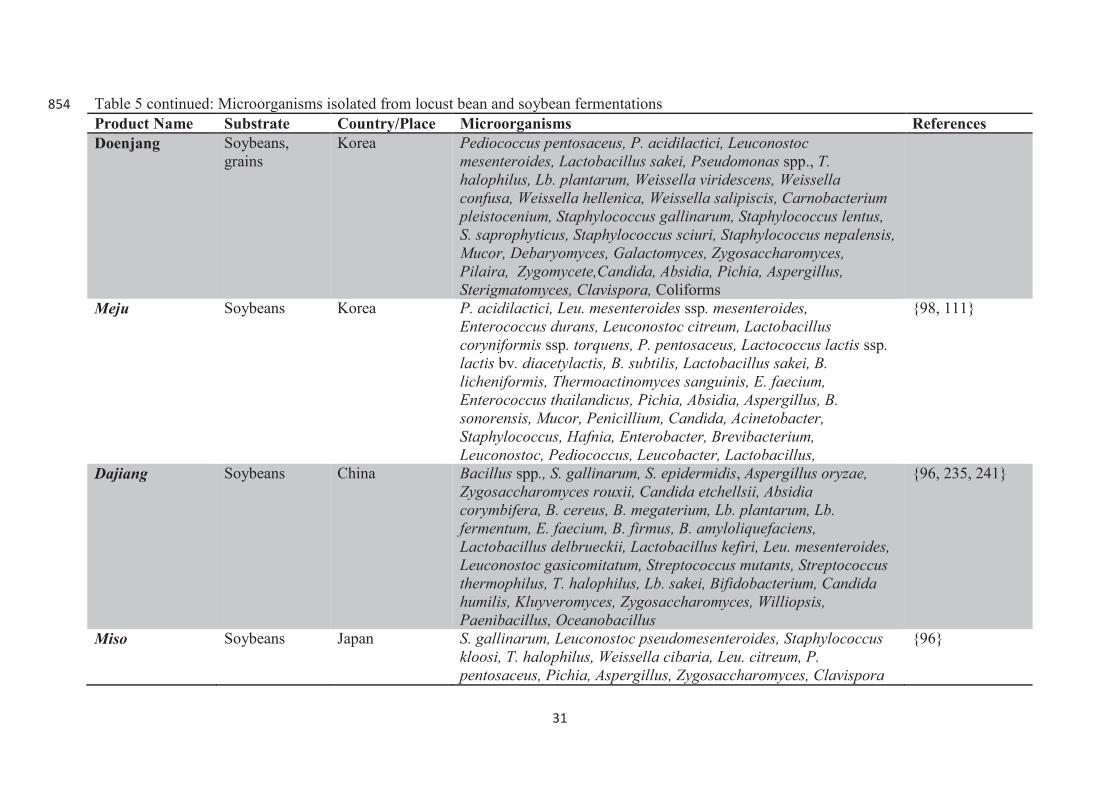
���
�
Table 5 continued: Microorganisms isolated from locust bean and soybean fermentations "���
Product Name Substrate Country/Place Microorganisms References
Doenjang Soybeans, grains
Korea Pediococcus pentosaceus, P. acidilactici, Leuconostoc
mesenteroides, Lactobacillus sakei, Pseudomonas spp., T.
halophilus, Lb. plantarum, Weissella viridescens, Weissella
confusa, Weissella hellenica, Weissella salipiscis, Carnobacterium
pleistocenium, Staphylococcus gallinarum, Staphylococcus lentus,
S. saprophyticus, Staphylococcus sciuri, Staphylococcus nepalensis,
Mucor, Debaryomyces, Galactomyces, Zygosaccharomyces,
Pilaira, Zygomycete,Candida, Absidia, Pichia, Aspergillus,
Sterigmatomyces, Clavispora, ColiformsMeju Soybeans Korea P. acidilactici, Leu. mesenteroides ssp. mesenteroides,
Enterococcus durans, Leuconostoc citreum, Lactobacillus
coryniformis ssp. torquens, P. pentosaceus, Lactococcus lactis ssp.
lactis bv. diacetylactis, B. subtilis, Lactobacillus sakei, B.
licheniformis, Thermoactinomyces sanguinis, E. faecium,
Enterococcus thailandicus, Pichia, Absidia, Aspergillus, B.
sonorensis, Mucor, Penicillium, Candida, Acinetobacter,
Staphylococcus, Hafnia, Enterobacter, Brevibacterium,
Leuconostoc, Pediococcus, Leucobacter, Lactobacillus,
{98, 111}
Dajiang Soybeans China Bacillus spp., S. gallinarum, S. epidermidis, Aspergillus oryzae,
Zygosaccharomyces rouxii, Candida etchellsii, Absidia
corymbifera, B. cereus, B. megaterium, Lb. plantarum, Lb.
fermentum, E. faecium, B. firmus, B. amyloliquefaciens,
Lactobacillus delbrueckii, Lactobacillus kefiri, Leu. mesenteroides,
Leuconostoc gasicomitatum, Streptococcus mutants, Streptococcus
thermophilus, T. halophilus, Lb. sakei, Bifidobacterium, Candida
humilis, Kluyveromyces, Zygosaccharomyces, Williopsis,
Paenibacillus, Oceanobacillus
{96, 235, 241}
Miso Soybeans Japan S. gallinarum, Leuconostoc pseudomesenteroides, Staphylococcus
kloosi, T. halophilus, Weissella cibaria, Leu. citreum, P.
pentosaceus, Pichia, Aspergillus, Zygosaccharomyces, Clavispora
{96}

���
�
2.7 Safety of fermented soybean products
Alkaline fermentations are generally regarded as safe because the high pH value and the
release of ammonia make the substrate unsatisfactory for invasion by other microorganisms
{2, 211}. However, Sarkar & Tamang {193} showed that B. subtilis and E. faecium co-
existed during natural fermentation of kinema and the two organisms did not affect each
other’s growth. Bacillus subtilis population increased from 8.0 x 10⁵ cfu/g to 4.55 x 10⁸ cfu/g
while E. faecium increased from 2.0 x 10⁵ cfu/g to 8.23 x 10⁷ cfu/g during 48 hrs fermentation
{193}. The two organisms were also dominant in market kinema at levels of 3-5 x 10⁸ cfu/g
and 5-9 x 10⁷ cfu/g for B. subtilis and E. faecium, respectively {194}. In addition, B. cereus,
E. faecium, E. faecalis, and E. coli have been isolated from some alkaline fermented products
{33, 39, 95, 111, 151, 152, 163, 188, 235, 241}. Furthermore, some B. cereus strains isolated
from kinema were able to produce diarrheal type enterotoxin, BCET {188}.
The presence of these undesirable microorganisms suggests that alkaline pH and ammonia
production do not inhibit growth of all potential spoilage and pathogenic bacteria. Besides, E.
coli can grow at a wide pH range of 4.5 to 9.0, with minor differences in generation time
between pH 7.3 (0.4 hrs) and pH 9.0 (0.5 hrs){65}. Escherichia coli can also survive lactic
acid fermentation because of its inducible acid-tolerance response system {21, 99, 100, 117,
142}. Thus, growth of E. faecium and presence of B. cereus and E. coli suggest food safety
concerns in alkaline fermented foods.
The fact that a number of foodborne hazards are not completely inhibited by fermentation
means that fermentation alone cannot be relied upon for complete elimination of these
hazards. However, controlled fermentations of kinema and doenjang with starter cultures
reduced the microbial diversity of these products {151, 188}. In addition, a kinema strain, B.
subtilis DK- Wl, was able to suppress growth and BCET formation by a selected toxin
producing strain (BC7-5) of B. cereus {188}. Thus, controlled fermentation could be used to
reduce the presence of pathogenic bacteria that may be found as opportunistic contaminants in
natural fermentations. Further, safety of soybean fermented pastes could be ensured if the
fermentation is combined with other processing operations, such as cooking {142}.
Escherichia coli can be controlled readily through sufficient heat treatment {21} and frying
kinema was able to reduce BCET from levels exceeding 256 ng/g soybeans to 8 ng/g {188}.
Another concern in fermented soybeans is the formation of various biogenic amines during
fermentation. Biogenic amine levels change depending on the ratio of soybean in the raw
���
�
material, microbiological composition, duration of fermentation, and many other factors {93,
203}. High levels of histamine, cadaverine, putrescine and tyramine were reported in
fermented soy products {198, 203}. Consumption of food containing biogenic amines can
lead to several types of foodborne diseases, including histamine poisoning or scombroid
poisoning and tyramine toxicity or cheese reaction {198}.
2.8 Methods for detection of microorganisms in fermented soybean
products
Traditionally, detection of microorganisms in different environmental systems including
fermented foods have relied on culture-dependent methods which are based on cultivation and
isolation of microorganisms on suitable substrates {51}. The isolates may be phenotypically
characterized through their morphology, physiology, biochemical or protein profiles {217}.
Alternatively, genotypic methods based on polymerase chain reaction (PCR) that enables
selective amplification of specifically targeted DNA fragments through the use of
oligonucleotide primers are used {217}. Particular gene fragments such as the 16S rDNA can
be amplified {1}. Genotypic techniques are robust in discriminatory power and in
differentiation of microorganisms to strain level {217}. The DNA resulting from PCR can be
used in fingerprinting methods such as restriction fragment length polymorphism, amplified
ribosomal DNA restriction analysis, randomly amplified polymorphism of DNA, amplified
fragment length polymorphism and pulsed field gel electrophoresis {1, 217}. The results
provide information on isolate identities and clonal relationships through dendrograms of gel
fingerprints {1}.
One major limitation of culture-dependent techniques is bias in cultivation of isolates because
it is difficult to develop media that accurately resembles the growing conditions of most
bacteria in natural habitat {50, 51}. The identification of isolates using phenotypic methods
such as sugar fermentation patterns may sometimes be uncertain, complicated and time-
consuming {51}. Uncertainty arise because some strains that display similar phenotypes do
not always correspond to similar or even closely related genotypes {217}. Additional
weaknesses include poor reproducibility and poor discriminatory power {217}. Culture-
dependent methods do not always give a true reflection of microbial diversity in complex
ecosystems such as fermented foods and there is failure to account for minor microbial
populations, stressed and injured cells that are present in low numbers {1, 51, 217}.
Nevertheless, cultivation and isolation of microorganisms cannot be ignored since most

���
�
industrial applications and health effects of microorganisms depend on specific characteristics
of particular strains {217}. Learning the properties of the strains also depends on cultivation.
Culture-independent methods were developed to overcome the limitations of selective
cultivation {50}. Microorganisms in a food matrix can be detected at genus, species or strain
level using specific primers for target organisms in microbial DNA extracted from the sample
{217}. The limitation of this approach is that only targeted microorganisms are detected,
hence the PCR assays are of limited value in the analysis of complex ecosystems or samples
with unknown species composition {217}. Probing techniques based on hybridization of
synthetically designed oligonucleotides to specific target sequences in bacterial DNA, such as
colony, dot blot and in situ hybridizations have similar limitations {217}.
Lately, denaturing gradient gel electrophoresis (DGGE) has proven to be one of the most
suitable and widely applied methods to study complex microbial communities originating
from various ecosystems. Denaturing gradient gel electrophoresis is a PCR-based genetic
fingerprinting technique that provides a profile of genetic diversity in a microbial community
based on physical separation of unique nucleic acid species {149}. During DGGE, there is
sequence-dependent separation of a mixture of amplified DNA fragments of the same length
on polyacrylamide gels containing a linear gradient of DNA denaturants {50, 149, 150, 217}.
The separation is based on decreased electrophoretic mobility of a partially melted double-
stranded DNA molecule {149, 150}. The DNA fragments melt in discrete melting domains,
with each domain having a melting temperature (Tm) at a particular position in the denaturing
gradient gel. Partial denaturation of the domains occurs at Tm causing the migration of the
domains to practically halt, forming discrete bands in the gel {53, 150}. Sequence variation
and % G + C content within such domains causes the Tm to differ, and molecules with
different sequences will stop migrating at different positions in the gel {150, 217}. Addition
of a 30- to 40-bp GC clamp to one of the PCR primers insures that the fragment of DNA
remains partially double-stranded and that the region screened is in the lowest melting domain
{50}. Fig 2 summarizes the principle of DGGE.
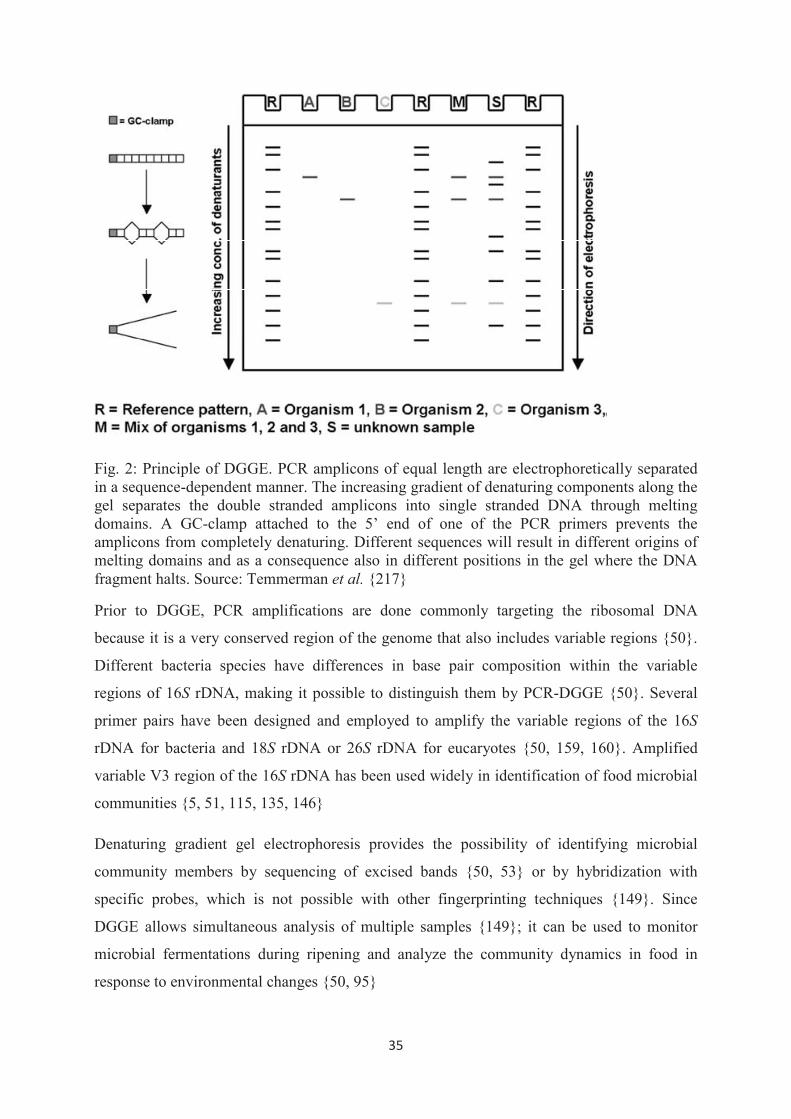
���
�
Fig. 2: Principle of DGGE. PCR amplicons of equal length are electrophoretically separated in a sequence-dependent manner. The increasing gradient of denaturing components along the gel separates the double stranded amplicons into single stranded DNA through melting domains. A GC-clamp attached to the 5’ end of one of the PCR primers prevents the amplicons from completely denaturing. Different sequences will result in different origins of melting domains and as a consequence also in different positions in the gel where the DNA fragment halts. Source: Temmerman et al. {217}
Prior to DGGE, PCR amplifications are done commonly targeting the ribosomal DNA
because it is a very conserved region of the genome that also includes variable regions {50}.
Different bacteria species have differences in base pair composition within the variable
regions of 16S rDNA, making it possible to distinguish them by PCR-DGGE {50}. Several
primer pairs have been designed and employed to amplify the variable regions of the 16S
rDNA for bacteria and 18S rDNA or 26S rDNA for eucaryotes {50, 159, 160}. Amplified
variable V3 region of the 16S rDNA has been used widely in identification of food microbial
communities {5, 51, 115, 135, 146}
Denaturing gradient gel electrophoresis provides the possibility of identifying microbial
community members by sequencing of excised bands {50, 53} or by hybridization with
specific probes, which is not possible with other fingerprinting techniques {149}. Since
DGGE allows simultaneous analysis of multiple samples {149}; it can be used to monitor
microbial fermentations during ripening and analyze the community dynamics in food in
response to environmental changes {50, 95}

� �
�
However, like other molecular techniques DGGE is also affected by errors and biases due to
sample handling, extraction and purification of nucleic acids {50, 149, 150}, differential or
preferential amplification of rRNA genes by PCR {50, 51} and the possibility of formation of
chimeric molecules due to PCR amplification of mixed target DNAs {50, 149, 150}.
Limitations specific to the DGGE itself include separation of relatively small DNA fragments,
co-migration of DNA fragments with different sequences, presence of heteroduplex
molecules, possibility of species giving identical band positions and limited sensitivity of
detection of rare community members {50, 135, 149, 150}. In fact, detection limits ranging
from 104 to 108 cfu/ml have been reported depending on species or strain {50, 51}.
The resolution of DGGE analysis in mixed microbial systems can be improved by using more
than one primer pair {28, 29}. In other cases, even nested PCR-mediated DGGE approaches
have been used to improve the sensitivity of detection when the targeted microbial population
is low {95, 96, 111}.
There is no doubt that DGGE reveals the complexity of microbial communities in food
fermentations. However, currently next generation sequencing or pyrosequencing has found
its place in the study of food fermentations. Pyrosequencing involves the synthesis of single-
stranded DNA and the detection of light generated by pyrophosphate released in a coupled
reaction with luciferase {115}. Pyrosequencing allows over 100-fold higher throughput rapid
and accurate sequencing of nucleotide sequences {98, 115}. The information generated makes
it possible to process large numbers of samples simultaneously {98} and analyze population
structure, gene content and metabolic potential of the microbial communities in an ecosystem
{115}. Pyrosequencing has highlighted DGGE’s failure to detect a large number of
predominant or diverse rare species in fermented soybeans {152}.
In soybean fermentations, pyrosequencing has revolutionalized the dominant thought that
Bacillus subtilis was the only important microorganism. Currently, from the thousands of
sequences generated and analyzed from soybean paste fermentations, Bacillus species and
lactic acid bacteria seem to be the dominant species and there are a diverse range of rare
species that accompany the fermentations that had never been reported before {98, 151, 152}.
2.9 Sensory properties and acceptance of fermented soybean products
Sensory and consumer studies play an important role in food science and industry for the
understanding of food properties, human acceptance, preference and buying behavior. The use
and application of descriptive sensory testing offers the ability to determine relationships
�!�
�
between descriptive sensory and instrumental or consumer preference measurements {147}.
Thus descriptive sensory testing provides understanding of consumer responses in relation to
products’ sensory attributes, and aids in sensory mapping and product matching {147}. It may
also be used to investigate the effects of ingredients or processing variables on the final
sensory quality of a product, and to investigate consumer perceptions of products {147}. In
this study descriptive sensory analysis was used in combination with data from chemical and
physical analyses and consumer acceptance to generate preference maps.
Descriptive sensory analyses of fermented soybean products have indicated the complexity of
sensory properties of these products. Sensory panels generated 10 – 48 attributes describing
appearance, odors, aromas, taste, mouthfeel and texture {34, 92, 110}. Brown and yellow
colors are used to describe the appearance of fermented soybean pastes that include miso,
natto, doenjang and chungkukjang {34}. Strong desirable flavors associated with the
fermented products include soy sauce, boiled soy sauce, nutty, briny, roasted bean, sweet
aroma, meju, gatsuo, sesame leaf flavor, alcohol flavor, chemical flavors and sweet grain
flavor while undesirables odors include earthy, metallic, fermented fish, burnt, sulfury,
ammonia, fermented, beany, and acetic acid odors {34, 92, 110}. Fermented soybeans pastes
elicit all the taste sensations, namely, sweet, salty, bitter, sour and monosodium glutamate
(umami) in addition to astringency {34, 92}. The products’ texture vary in particle sizes
depending on production methods and they are usually sticky or slippery with a mouth
coating mouthfeel {34, 92, 110, 238}.
Kim et al. {92} determined the sensory attributes that influenced consumer acceptance in
doenjang. Drivers of liking were strong intensities of sweetness, umami, sweet grain flavor,
soy sauce flavor, sesame leaf flavor while drivers of disliking were strong intensities of
bitterness, earthy, metallic, astringency, saltiness and fermented fish. Apart from sensory
characteristics, consumer preference was also significantly influenced by consumer segments
{92}. Consumers tendency to rate the intensities of negative attributes highly for products that
originated from other countries was reported in fermented soybean products {34}. This
signifies the challenge that could be encountered when introducing food products that
consumers are not culturally accustomed to.
Lee & Ahn {112} noted correlations among some volatile compounds and some sensory data.
The sweet aromas were associated with furfuryl alcohol, 1-octen-3-ol, 1, 2-dimethoxy-
benzene and acetyl pyrrole; while beany flavors were associated with isoamyl acetate, 2-

�"�
�
phenylethyl acetate and 4-ethyl-2-methoxy-phenol. They suggested heat treatment during the
manufacturing process and ingredients of the fermented products as main sources of variation
in aroma characteristics. Ingredients and fermentation methods also determined aroma
characteristics in different fermented soybean pastes {34}.
2.10 Metabolism of the major microorganisms involved in fermentation of
soybean pastes
2.10.1 Carbohydrate fermentation of Bacillus species
Bacillus subtilis has usually been found as the dominant microorganism in fermented soybean
foods {230}. There are 8 members within the B. subtilis group, including B. subtilis subsp.
subtilis, B. licheniformis, B. amyloliquefaciens, B. atrophaeus, B. mojavensis, B. vallismortis,
B. subtilis subsp. spizizenii, and B. sonorensis {178}. Bacillus spp. are ubiquitous and grow in
diverse environments including soils, on plant roots, and within the gastrointestinal tract of
animals {47, 178}. Bacillus spp. belong to the phylum Firmicutes, class Bacilli, order
Bacillales and family Bacillaceae {57}. Bacillus spp. are Gram-positive, endospore-forming
and catalase positive bacteria that have spreading colonies with fringed margins {194}.
Bacillus subtilis is capable of utilizing a variety of carbohydrates although glucose is the
preferred source of carbon and energy {19, 195, 208}.
Glucose is taken up and is phosphorylated by the sugar:phosphoenolpyrvate
phosphotransferase system {195}. Further metabolism of glucose involves the Embden–
Meyerhof–Parnas or the glycolytic pathway, pentose phosphate pathway and the Krebs cycle
(Fig 3) {19, 40, 195}. Other sugars and polyols are phosphorylated and converted to
intermediates of either pathways {19, 195}. Pyruvate formed during glycolysis is further
oxidized to acetyl-CoA or is used to generate NAD+ {19} resulting in fermentation products
such as lactate, acetate and acetoin which are excreted into the extracellular environment
{208}. Acetyl-CoA can be converted to acetate through substrate-level phosphorylation {19};
which is coupled to ATP synthesis by the activities of phosphotransacetylase and acitate
kinase {208}.
Utilization of organic acids produced during glycolysis requires conversion of the acids to
intermediates of the Krebs cycle, gluconeogenesis or pentose phosphate pathway {195}.
Glycolysis is linked to the Krebs or citric acid cycle by pyruvate dehydrogenase {19}. When
glucose is completely consumed to pyruvate, B. subtilis cells metabolize lactate, acetoin and
acetate using lactate dehydrogenase, acetoin dehydrogenase and acetyl-coA synthatase,

�#�
�
respectively, via the Krebs cycle (Fig 3), generating additional ATP and reducing power
{208}. Bacillus subtilis is also able to grow anaerobically in the presence of nitrate as an
electron acceptor {47}.
Fig 3: Overview on glycolysis, pentose phosphate shunt, Krebs cycle and their interconnections in B. subtilis. Abbreviations: DHAP, dihydroxyacetone phosphate; PEP, phosphoenol pyruvate. Enzymes are indicated by the names of the corresponding genes as follows: ptsGHI, glucose-specific enzymes for sugar:phosphoenolpyruvate phosphotransferase system; pgi, phosphoglucoisomerase, pfk, phosphofructokinase; fbp, fructose-1,6-biphosphatase; fbaA, fructose-1,6-biphosphate aldolase; tpi, triose phosphate isomerase; gapA/gapB, glyceraldehyde-3-phosphate dehydrogenase; pgk, phosphoglycerate kinase; pgm, phosphoglycerate mutase; eno, enolase; zwf, glucose-6-phosphate 1-dehydrogenase; gntZ, 6-phosphogluconate dehydrogenase; rpe, ribulose-5-phosphate epimerase; ywlF, ribose-5-phosphate isomerase; tkt, transketolase; ywjH, transaldolase; pykA, pyruvate kinase; pdhABCD, pyruvate dehydrogenase (pyruvate decarboxylase); alsS, �-Acetolactate synthase; alsD, �-acetolactate decarboxylase; ldh, lactate dehydrogenase; pta,
phosphotransacetylase; ackA, acetate kinase; citZ, citA, citrate synthase; citB, aconitase; icd,
�$�
�
isocitrate dehydrogenase; odhAB pdhD, 2-oxoglutarate dehydrogenase; sucCD, succinyl-CoA synthetase; sdhCAB, succinate dehydrogenase; citG, fumarate hydratase; mdh, malate dehydrogenase; pckA, phosphoenolpyruvate carboxykinase; pycA, pyruvate carboxylase. Source: Blencke et al. {19}.
2.10.2 Proteolysis in Bacillus subtilis
An important process during soybean fermentation is enzymatic degradation of proteins by
proteolysis. Proteolysis contributes to texture, appearance and characteristic aroma and taste
of fermented soybeans {230}. Bacillus subtilis exhibits relatively high proteolytic activities,
hence is able to digest soybean proteins, releasing amino acids and other biological
compounds {178}. Soybean fermentation with Bacillus is characterized by increases in pH
and release of ammonia due to deamination of amino acids {230}. Proteolysis also increases
TCA-soluble peptides and �-amino acids {230}. Extracellular proteases secreted by B. subtilis
hydrolyse soy proteins to oligopeptides, smaller peptides and amino acids and these are
subsequently converted to �-polyglutamic acid, a major component of the viscous material on
the surface of fermented soybeans {124, 230}. The smaller molecules can either be
assimilated directly into microbial protein or fermented with the production of ammonia and
volatile fatty acids {124}.
Glutamine is the preferred nitrogen source for B. subtilis, followed by arginine {54}. In the
presence of exogenous amino acids, B. subtilis can produce glutamate by the glutamate
synthase and �-ketoglutarate reactions and by the degradation of glutamine, proline and
arginine {14}. Catabolism of arginine to glutamate proceeds via the first three steps of the
Roc pathway (Fig 4) through ornithine and �-glutamic semialdehyde {14}. Two enzymes of
the three steps, arginase and ornithine aminotransferase are induced in the presence of L-
arginine, L-ornithine, and L-citrulline {13}. The reaction that converts �1-pyrroline-5-
carboxylate to glutamate is shared with the proline utilization pathway {13, 14}. The final
step in arginine and proline utilization pathways is catalyzed by glutamate dehydrogenase and
leads to formation of �-ketoglutarate and ammonium {14}.
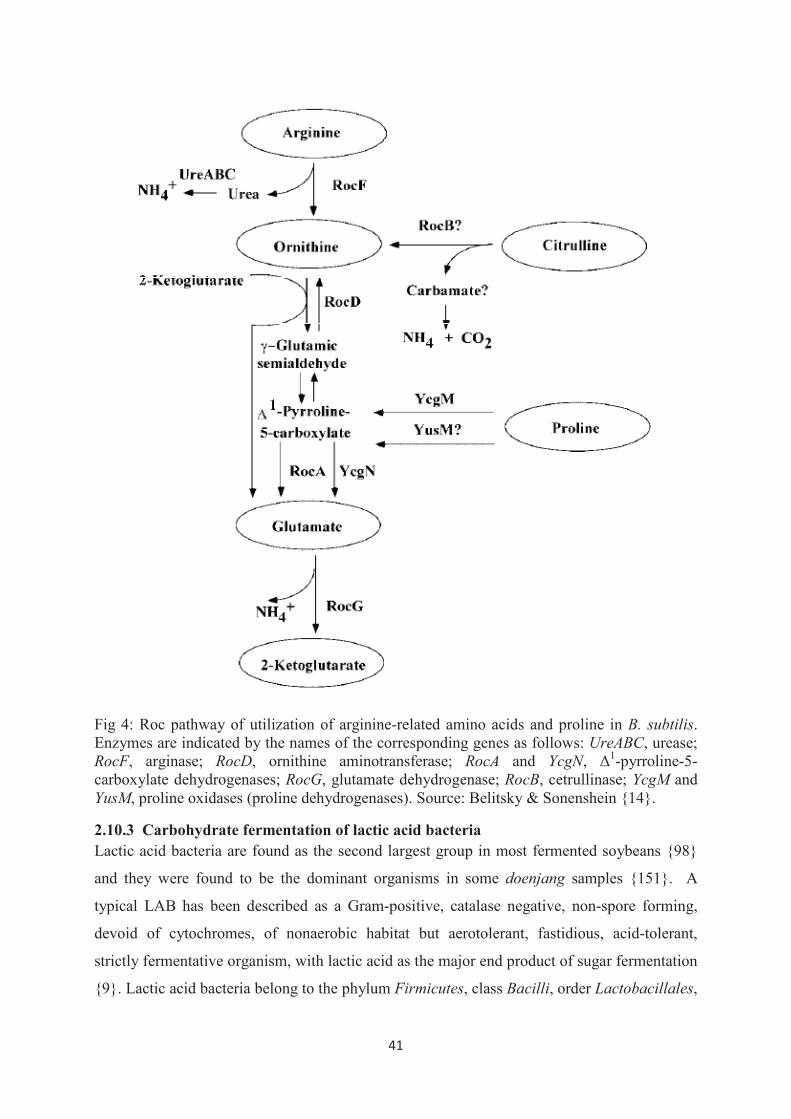
���
�
Fig 4: Roc pathway of utilization of arginine-related amino acids and proline in B. subtilis. Enzymes are indicated by the names of the corresponding genes as follows: UreABC, urease; RocF, arginase; RocD, ornithine aminotransferase; RocA and YcgN, �1-pyrroline-5-carboxylate dehydrogenases; RocG, glutamate dehydrogenase; RocB, cetrullinase; YcgM and YusM, proline oxidases (proline dehydrogenases). Source: Belitsky & Sonenshein {14}.
2.10.3 Carbohydrate fermentation of lactic acid bacteria
Lactic acid bacteria are found as the second largest group in most fermented soybeans {98}
and they were found to be the dominant organisms in some doenjang samples {151}. A
typical LAB has been described as a Gram-positive, catalase negative, non-spore forming,
devoid of cytochromes, of nonaerobic habitat but aerotolerant, fastidious, acid-tolerant,
strictly fermentative organism, with lactic acid as the major end product of sugar fermentation
{9}. Lactic acid bacteria belong to the phylum Firmicutes, class Bacilli, order Lactobacillales,
���
�
and include the following families: Aerococcaceae, Carnobacteriaceae, Enterococcaceae,
Lactobacillaceae, Leuconostoceae and Streptococceae {232}. Bifidobacteria are not included
among the LAB because they have more than 55 % G + C content in their DNA {213}. The
LAB of importance in foods belong to the genera: Aerococcus, Carnobacterium,
Enterococcus, Lactobacillus, Lactococcus, Leuconostoc, Oenococcus, Pediococcus,
Streptococcus, Tetragenococcus, Vagococcus and Weissella {213}.
Lactic acid bacteria can be categorized into two groups based on their hexose fermentation
pathways. Those with a homolactic fermentation use glycolysis resulting in almost
exclusively lactic acid as the end product of sugar fermentation under standard conditions {9,
88, 232}. Lactic acid bacteria with heterolactic fermentation use pentose phosphate pathway
or 6-phosphogluconate/phosphoketolase (6-PG/PK) pathway and produce significant amounts
of other fermentation products such as ethanol, acetic acid and CO2 in addition to lactic acid
{9, 88, 232}.
Glycolysis is characterized by the splitting of fructose-1,6-disphosphate (FDP) with an FDP
aldolase into two triose phosphate moieties which are further converted to lactic acid, Fig 5A
{88}. Glycolysis occurs in aerococci, enterococci, tetragenococci, vagococci, lactococci,
streptococci, pediococci and homofermentative lactobacilli {9, 10, 88}. In obligately
homofermentative LAB, sugars only can be fermented by glycolysis {9}. Obligately
homofermentative LAB possess a constitutive FDP aldolase and lack phosphoketolase hence
they are unable to ferment pentoses and gluconate {9, 88}. Obligately homofermentative
lactobacilli such as Lb. acidophilus, Lb. delbrueckii, Lb. helveticus, and Lb. salivarius are
referred to as group I lactobacilli {9}.
Although most species of enterococci, lactococci, pediococci, streptococci, tetragenococci and
vagococci are grouped as homofermentative LAB, but they are in fact intermediate regarding
fermentation {9}. They possess a constitutive FDP aldolase and use glycolysis for hexose
fermentation; at the same time they are able to ferment pentoses via the 6-PG/PK {9, 88}.
Therefore, they are homofermentative with respect to hexose fermentation and
heterofermentative with respect to fermentation of pentoses and other substrates and are as
such more “correctly” called facultatively heterofermentative LAB {9, 88}. However in
general terms “homofermentative LAB” refers to those in the group that use the glycolytic
pathway for glucose fermentation and “heterofermentative LAB” refers to those that using the
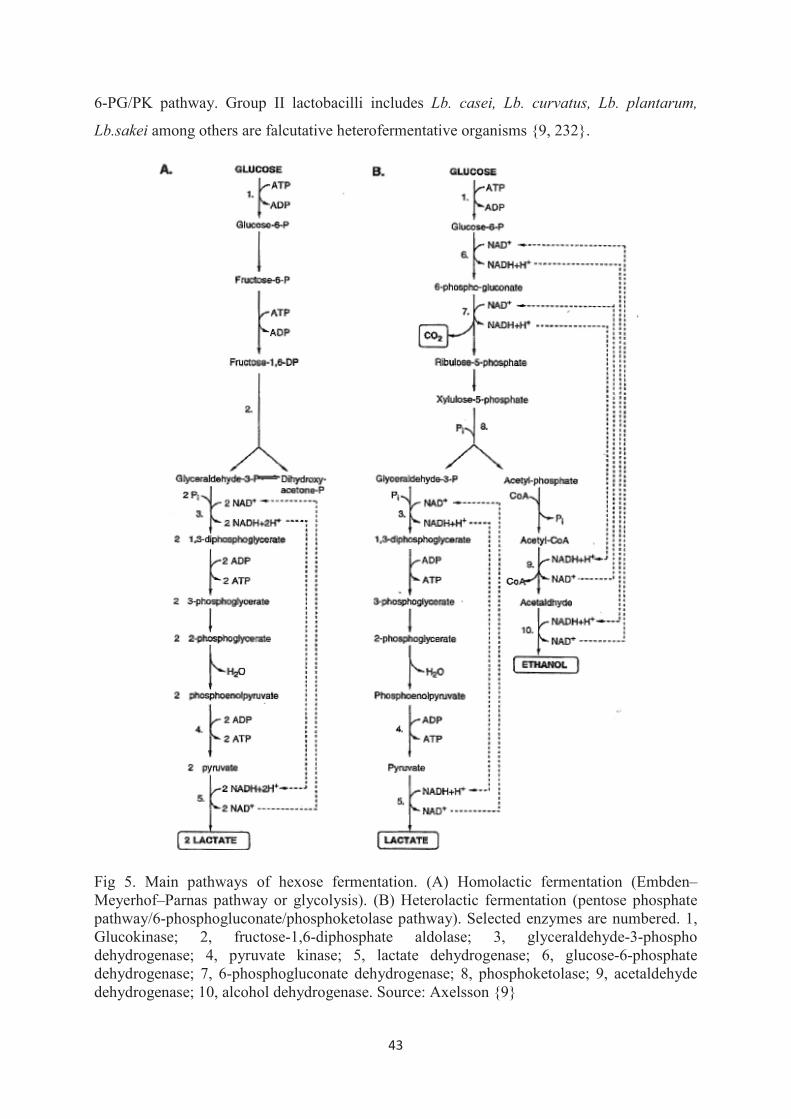
���
�
6-PG/PK pathway. Group II lactobacilli includes Lb. casei, Lb. curvatus, Lb. plantarum,
Lb.sakei among others are falcutative heterofermentative organisms {9, 232}.
Fig 5. Main pathways of hexose fermentation. (A) Homolactic fermentation (Embden–Meyerhof–Parnas pathway or glycolysis). (B) Heterolactic fermentation (pentose phosphate pathway/6-phosphogluconate/phosphoketolase pathway). Selected enzymes are numbered. 1, Glucokinase; 2, fructose-1,6-diphosphate aldolase; 3, glyceraldehyde-3-phospho dehydrogenase; 4, pyruvate kinase; 5, lactate dehydrogenase; 6, glucose-6-phosphate dehydrogenase; 7, 6-phosphogluconate dehydrogenase; 8, phosphoketolase; 9, acetaldehyde dehydrogenase; 10, alcohol dehydrogenase. Source: Axelsson {9}

���
�
Heterofermentation, is initiated by the oxidation of glucose-6-phosphate to gluconate-6-
phosphate followed by decarboxylation and splitting of the resulting pentose-5-phosphate into
C-2 and C-3 moieties, Fig 5B {88}. The key enzyme for heterofermentation is
phosphoketolase, therefore obligately heterofermentative LAB constitutively express this
enzyme but lack FDP aldolase {9}. Group III lactobacilli such as Lb. brevis, Lb. buchneri, Lb.
fermentum, and Lb. reuteri, leuconostocs, oenococci, and weissellas are obligately
heterofermentative {9, 232}. In heterofermentation, ethanol is produced from acetaldehyde
when additional hydrogen acceptors are not available and the ratio acetate/ethanol formed
depends on redox potential of the system {88}. In the presence of additional hydrogen
acceptors such as O2 or fructose, O2 is reduced to H2O2 and H2O while fructose is reduced to
mannitol and ethanol is not formed {72, 88, 231}. Although LAB are fermentative, the
presence of O2 as an electron acceptor is often stimulatory to their growth {232}. Oxygen is
reduced by the action of NADH oxidase resulting in conversion of acetyl phosphate to acetic
acid and formation of an additional ATP {232}. This phenomenon is common among
heterofermentative LAB {232}.
Other hexoses such as fructose, mannose and galactose enter the two fermentation pathways
at the level of glucose-6-phosphate or fructose-6-phosphate after isomerization and/or
phosphorylation {9, 232}. Disaccharides can be split by specific hydrolases into
monosaccharides, which then enter the major pathways. Maltose, for instance is
phosphorylated by maltose phosphorylase yielding glucose and glucose-1-phosphate {72,
232}. The glucose-1-phosphate is converted to glucose-6-phosphate which can be further
metabolized via either glycolysis or 6-PG/PK pathways while the glucose can be
phosphorylated by homofermentative LAB or converted to glucose-6-phosphate by
heterofermentative LAB and follow their respective pathways {10, 42, 72, 231}. Sucrose is
cleaved into fructose and glucose-6-phosphate by sucrose-6-phosphate hydrolase and the two
monosaccharide units enter the major pathways {9, 10}. Sucrose also acts as a donor of
monosaccharides for dextran or exopolysaccharide formation in certain LAB. Sucrose is
cleaved by a cell-wall associated enzyme, dextransucrase, resulting into a glucose moiety that
is used for dextran formation while the fructose is fermented in the usual way {9, 232}.
Pentoses in heterofermentative LAB are readily fermented via phosphorylation of the pentose
sugar to ribulose-5-phosphate or xylulose-5-phosphate by epimerases or isomerases {9}. The
phosphorylated compounds can then be metabolized by the lower part of the 6-PG/PK
pathway {9, 88}. Products of pentose fermentation are different from those of glucose

���
�
fermentation because there is no CO2 production and dehydrogenation is not required to
produce the intermediate xylulose-5-phosphate {9}. Acetyl phosphate is used by acetate
kinase in substrate-level phosphorylation yielding acetate and ATP. The products of this
fermentation are equimolar amounts of lactic acid and acetic acid {9}.
2.10.4 Alternative fates of pyruvate
In a lot of fermentations, pyruvate serves as an electron (or hydrogen) acceptor for
regeneration of NAD+ from reduced form NADH necessary for continued fermentation of the
cells {9}. As such, pyruvate is not always reduced to lactic acid but may undergo alternative
pathways. Alternative pathways of pyruvate may result in a flavor compound such as diacetyl
(butter aroma) and flavorless compounds acetoin/2,3-butanediol which are important in
fermentation of milk {9, 88}. Other products from pyruvate pathways include acetate,
formate, acetyl-coA, ethanol, acetolactate, active acetaldehyde, CO2 and H2O2 {9, 88}. When
pyruvate enters alternative pathways, homolactic fermentation may be converted to
heterolactic fermentation with acetate, ethanol and formate as end products {88}.
2.10.5 Proteolysis in lactic acid bacteria
Lactic acid bacteria are weakly proteolytic compared to many other bacteria {109}, but they
are amino acid auxotrophs requiring preformed amino acids for their growth {105, 109}. The
amino acid requirements are strain dependent and can vary from 4 to 14 amino acids {105}.
Growth of LAB in milk has been intensively studied and it is concluded that LAB depend on
proteolytic systems which allow them to degrade milk proteins {105, 109}. The proteolytic
systems are important because they make protein and peptide nitrogen available for microbial
growth, and at the same time they play an active role in the maturation processes which give
fermented foods their characteristic rheological and organoleptic properties {109}.
LAB proteolytic systems are comprised of three major components: (i) extracellular
proteinases that breakdown proteins into oligopeptides, (ii) peptide transport systems that
translocate the breakdown products across the cytoplasmic membrane and (iii) various
intracellular peptidases that degrade peptides into shorter peptides and amino acids {105, 109,
120}. The amino acids can be further converted into various flavor compounds such as
aldehydes, alcohols, acetaldehyde and esters {109, 120}. Proteolysis may also contribute to
bitter defects in cheese {109}.
� �
�
3 OBJECTIVES
3.1 Main objective
To improve soybeans’ nutritional quality, utilization and consumer acceptance through natural
and lactic acid bacteria fermentations.
3.2 Specific objectives
1. To determine the effects of natural and lactic acid bacteria fermentations of pastes of
soybeans and soybean-maize blends on the levels of protein, amino acids, anti-nutritional
factors (phytic acid and trypsin inhibitor), organic acids, reducing sugars and enzyme
activities. PAPER I
2. To isolate, identify and characterize lactic acid bacteria involved in natural and lactic acid
bacteria fermentations of pastes of soybeans and soybean-maize blends using culture-
dependent techniques and denaturing gradient gel electrophoresis. PAPER II
3. To determine sensory properties driving consumer acceptance of naturally and lactic acid
bacteria fermented pastes of soybeans and soybean-maize blends. PAPER III
4. To assess the effect of natural and lactic acid bacteria fermentations on growth and
survival of Bacillus cereus and Escherichia coli in pastes of soybeans and soybean-maize
blends. PAPER IV
3.3 Hypotheses
• There are no significant differences in the effects of natural and lactic acid bacteria
fermentations on levels of protein, amino acids, anti – nutritional factors, organic
acids, sugars, and enzyme activities in pastes of soybeans and soybean-maize blends.
• There is no difference in microbial composition between naturally fermented and
lactic acid bacteria fermented pastes of soybeans and soybean-maize blends.
• There is no significant difference in consumer acceptance between naturally fermented
and lactic acid bacteria fermented pastes of soybeans and soybean-maize blends.
• There are no significant differences in the effects of natural and lactic acid bacteria
fermentations on growth of Bacillus cereus and Escherichia coli in pastes of soybeans
and soybean-maize blends during fermentation.
�!�
�
4 MAIN RESULTS AND GENERAL DISCUSSION
4.1 Effect of fermentation on nutritional quality of pastes of soybeans and
soybean-maize blends
In papers I – III, pastes composed of 100% soybeans, 90% soybeans and 10% maize, and 75%
soybeans and 25% maize were naturally fermented (NFP) and lactic acid bacteria fermented
(LFP). Lactic acid bacteria fermentations were facilitated through back-slopping using
traditional fermented cereal gruel, thobwa as an inoculum. Naturally fermented pastes were
designated 100S, 90S and 75S, while LFP were designated 100SBS, 90SBS and 75SBS. In
paper I, changes in levels of protein, amino acids, enzyme activities and anti-nutritional
factors were studied to determine the effects of natural and lactic acid bacteria fermentations
on nutritional quality of the fermented pastes. Organic acids and sugars were also studied in
paper I but will be discussed in later sections.
Both types of fermentation did not significantly affect total protein content, but significant
fluctuations in soluble protein content suggested proteolysis of soybean proteins and
subsequent utilization of the hydrolyzed protein by fermenting microorganisms. Highest
increase in soluble protein was observed at 48 hrs in all samples except 75SBS; and 100S had
the highest (49%) soluble protein increase. After 72 hrs, increase in soluble protein content
was observed only in 75S (27%) while there were significant losses in the remaining samples.
Proteolytic activities were confirmed by fluctuations in free amino acid contents in most of
the 21 free amino acids analyzed during fermentation.
The free amino acids analyzed included cyst(e)in (Cys), methionine (Met), aspartic acid
(Asp), threonine (Thr), serine (Ser), glutamic acid (Glu), proline (Pro), glycine (Gly), alanine
(Ala), valine (Val), isoleucine (Ile), leucine (Leu), tyrosine (Tyr), phenylalanine (Phe),
histidine (His), lysine (Lys), arginine (Arg), glutamine (Gln), asparagine (Asn), citrulline
(Cit), �-aminobutyric acid (GABA), ornithine (Orn) and tryptophan (Trp). Arginine was the
most abundant free amino acid at the beginning of the fermentations but it was rapidly
depleted during fermentation and its depletion was more pronounced in LFP. Rapid depletion
of Arg during fermentation was also reported in kinema and was attributed to its preferential
uptake by B. subtilis as source of nitrogen {190}. In LAB, Arg provides energy via substrate
level phosphorylation {32}. Arginine may enter the arginine-deiminase pathway where Arg is
converted via Orn to CO2 and NH3 which contributes to the acid tolerance of lactobacilli
{72}. Glutamate was the only free amino acid that increased throughout fermentation in all

�"�
�
samples and it became the most abundant free amino acid at the end of the fermentations. In
B. subtilis, Glu is the preferred nitrogen source followed by Arg, and Glu can be synthesized
from Arg and Pro {14, 54}. Other amino acids also increased throughout fermentation in
some samples and these included Ala (all LFP), GABA and Lys (100SBS and 90SBS) and
Asp (90S). Decreases in free amino acids during early fermentation followed by increases
during late fermentation were observed in NFP in Ala, Val, Ile, and Leu; in LFP in Asn and
Leu; in 100S in Asn and Gly and in 100SBS in Val. Free amino acids that had significantly
higher levels at the end of the fermentation than at the beginning were Glu, Ala, Lys in all
samples; Leu in NFP; Gln in LFP, 100S and 90S; Thr and GABA in 100SBS and 90SBS;
Asn, Cit and Ile in 100S; Gly in 100S, 90S and 100SBS; Phe in 100S and 90S; and Val in 90S
and 100SBS. Amino acids contribute to taste and aroma in fermented soybean foods {37}.
Seventeen total amino acids including Cys, Met, Asp, Thr, Ser, Glu, Pro, Gly, Ala, Val, Ile,
Leu, Tyr, Phe, His, Lys, and Arg were identified. The sums of the total amino acids were
higher in NFP than in LFP except in 75S at 48 hrs and 72 hrs. Slight percent increases in sums
of total amino acids were observed in 90SBS at 48 hrs (1.5%) and 72 hrs (1.7%) and in
75SBS at 48 hrs (3.2%). On the other hand, percent reductions were noted at 48 hrs in all NFP
(ranging from 0.01% in 90S to 6.8% in 100S) and in 100SBS (7.4%). This could have been
due to utilization of the amino acids to sustain higher metabolism rate at this fermentation
time since enzyme activities were also highest at this time. Higher total amino acid percent
losses were also noted at 72 hrs in 75S (4.7%) and in 100SBS (7.4%).
Nonetheless, significant increases (p<0.05) in the sulfur-containing amino acids (Cys and
Met) which are limiting in soybeans were observed throughout fermentation in some samples.
The increases in NFP with respect to Cys were in100S and 90S and with respect to Met were
observed in 90S. In all LFP, Cys increased during 48 hrs of fermentation while this trend was
observed with Met in 75SBS. In this study, Glu, Asp, Leu, Arg, Lys, Ser and Phe were
considered the main amino acids (> 20 g per kg sample) throughout fermentation. With the
exception of Ser and Glu, similar results were reported in other studies {39, 190}.
Alpha-galactosidase activities were highest at 48 hrs in NFP while �-amylase activities were
highest at 48 hrs in 75S. Significant increases in �-amylase activities for 90S and �-
galactosidase activities for 100S were observed at 24 hrs. High enzyme activities at 48 hrs
could suggest that metabolic activities of the fermenting pastes were highest at this
fermentation time. On the other hand, LFP had high enzyme activities at the beginning of the
�#�
�
fermentations due to use of malt in back-slopping material, and the enzyme activities declined
with fermentation time, although fluctuations were observed in 75SBS and significant
increases in �-amylase activities were observed in 90SBS at 72 hrs. The inconsistencies in the
trends in enzyme activities in both fermentations underscore one of the limitations of
processes based on natural fermentations, which is variability in product quality {78, 186}.
The increases in �-amylase and �-galactosidase activities with fermentation time in NFP
could suggest increases in starch hydrolysis and degradation of �-galactooligosaccharides,
respectively. Starch hydrolysis would reduce the dietary bulk density and provide the
possibility of increasing energy density through use of increased amounts of raw materials
{74, 123, 140} but with a product of acceptable consistency. Degradation of �-
galactooligosaccharides would reduce flatulence and its related gastrointestinal discomforts
{229}and hence could increase consumer acceptance of soybean products.
Both types of fermentation degraded the anti-nutritional factors, phytic acid and trypsin
inhibitors (TI). Heat treatment was most effective in deactivating TI {48}, because TI content
was 19 mg/g sample in raw soybeans, but after boiling TI could not be detected in 100S while
the highest TI at 0 hrs was 0.169 mg/g sample signifying a 99% reduction. Nevertheless,
fermentation also hydrolyzed TI because after 72 hrs, TI could not be detected in all samples.
On the other hand, natural fermentation was more effective in degrading phytic acid than the
LAB fermentation. After 24 hrs fermentation, 33 to 54% reductions in phytic acid were
achieved by natural fermentation and by 72 hrs, 85% reduction was noted and in some
samples the phytate could not be detected. Whereas, only 18 to 32% reductions were achieved
in LFP at 24 hrs and by 72 hrs, 37 to 49% reductions were observed. Variations in the extent
of phytic acid degradation were attributed to the type of microorganisms involved in the
fermentations, the complexity of the physiological and environmental factors that affect the
production and activities of phytases in microorganisms, whether the phytases were
intracellular or extracellular and also the specificity of the enzymes with regard to phytic acid
{31, 41, 97, 172, 200}.
4.2 Microbial population, diversity and metabolism in natural and lactic
acid bacteria fermentations
4.2.1 Microbial population
Lactic acid bacteria involved in natural and LAB accelerated fermentations were
characterized using culture-dependent and culture-independent techniques (Paper II). Changes

�$�
�
in microbial populations were investigated on appropriate media. Initial microbial counts of
LAB, Lactobacillus spp., total aerobic bacteria, spores, yeasts and molds were higher in LFP
than in NFP due to the back-slopping. Back-slopping introduced more LAB in the fermenting
pastes than the other microorganisms. At 0 hrs, LAB was about 3 log10 cfu/g more in LFP
(8.13 – 8.49 log10 cfu/g) than in NFP (4.97 – 5.31 log10 cfu/g), while the other
microorganisms were 1 or 2 log10 cfu/g more in LFP. Lactic acid bacteria increased
throughout fermentation in NFP while LAB decreased slightly in LFP during 24 – 72 hrs of
fermentation from 9.45 – 9.82 log10 cfu/g to 9.24 – 9.33 log10 cfu/g. At the end of the
fermentation, LAB population in NFP ranged from 8.71 to 9.62 log10 cfu/g.
Cell counts of LAB, Lactobacillus spp., and total aerobic bacteria remained higher in LFP
than in NFP during fermentation, while trends in spores, yeasts and mold counts varied.
Decreases in spore formers populations between 0 and 24 hrs for all LFP were observed and
counts at 72 hrs were lower (5.82 – 6.02 log10 cfu/g) than in all NFP (6.10 – 7.10 log10 cfu/g).
Lower spore proliferation rate in LFP was explained in terms of increase in acidity in LFP
during 24 hrs of fermentation (pH dropped from 6.4 to 4.0). Spore formers that dominate
soybean fermentations are usually B. subtilis {39, 187, 188, 194} and they exhibit active
growth at pH-range between 5.5 and 8.5 {25}. The growth rates of yeasts and molds were
lower in LFP than in NFP between 0 and 24 hrs. Yeast and mold counts increased from 2.0 to
7.0 log10 cfu/g in NFP while the increases were from 3.0 – 4.0 to 4.0 – 4.8 log10 cfu/g in LFP
and the differences were significant between these fermentation types. Inhibition of yeast and
mold growth could not be explained by increasing acidity alone since yeasts are capable of
growing in acidic conditions {177}. Therefore, production of other inhibitory metabolites
including CO2 was suggested.
4.2.2 Microbial composition and diversity in the fermented pastes
A total of 239 Gram-positive and catalase negative isolates were assessed for a number of
physiological characteristics which aided in grouping the isolates. Heterofermentative rods
able to hydrolyze Arg were dominant (59.4%) followed by heterofermentative rods unable to
hydrolyze Arg (23%) and homofermentative cocci that hydrolyzed Arg (14.6%) and lastly
homofermentative cocci unable to hydrolyze Arg (2.9%).
Representative isolates 72 (30%) from the groups above were used in further phenotypic
characterization. Data obtained from profiling of carbohydrate fermentation by API 50 and
API 50 CHL medium, analysis of CO2 production in MRS broth using an infrared gas
���
�
analyzer technique and hydrolysis of Arg was subjected to principal component analysis
(PCA) in order to cluster phenotypically similar isolates. Three distinct clusters A, B, and C
composed of 4, 8 and 5 species, respectively were obtained. A fourth cluster, D was mostly
composed of Lb. brevis with diverse sugar fermentation profiles. Principal component 1
(33%) delineated isolates mainly based on fermentation patterns with most of the
homofermentative cocci on the positive dimension and heterofermentative rods on the
negative dimension.
Heterofermentative rods were further allocated to clusters A and B based on PC 2 (14%).
Cluster A was on the positive dimension on which L-arabinose, D-ribose, D-xylose,
melibiose, D-raffinose and potassium-5-celuconate loaded highly. Strains in cluster A were
typical for obligate heterofermenative Lactobacillus spp. fermenting glucose and fructose but
unable to ferment amygdaline, mannitol, rhamnose and sorbitol {73} and they included Lb.
brevis, Lb. fermentum, Lb. buchneri, and Lb. collonoides.
Cluster B was dominated by Weissella confusa and the identities of other isolates were Lb.
collonoides, Lb. acidophilus, Lb. plantarum, Lb. delbrueckii subsp. delbrueckii, Lc. lactis
subsp. lactis, Lb. brevis and Leu. mesenteroides. All isolates fermented glucose, fructose,
mannose, esculine and maltose. In addition, the isolates fully or partially fermented potassium
gluconate, D-xylose and N-acetylglucosamine.
Cluster D was composed of heterofermentative lactobacilli mostly identified as Lb. brevis 1
and they all fermented glucose, fructose, mannose, esculine, cellobiose and maltose.
However, they showed wide variations in the fermentation of the other sugars. Two isolates
close to cluster D were Lb. pentosus and Lb. plantarum. The Lb. pentosus strain exhibited a
similar fermentation profile to the Lb. plantarum strain except that the later did not ferment
turanose, potassium gluconate and potassium-5-celuconate but fermented starch and
melezitose.
Homofermentative cocci (cluster C) were identified as Pediococcus pentosaceus and Lc.
lactis subsp. lactis by API and all isolates in this group fermented galactose, glucose, fructose,
mannose, N-acetyglucosamine, amygdaline, arbutine, esculine, salicine, cellobiose, maltose,
trehalose and gentibiose. Five cocci strains could not be identified by API were placed in this
cluster. Some lactobacilli clustered with the cocci due to their inability to ferment saccharose
and raffinose. Sánchez et al. {185} classified isolates as Lb. brevis 2 based on their ability to
ferment raffinose and saccharose.

���
�
Genotypic characterization based on 16S rDNA gene using universal primers, 1F and
5R/1492R led to identification of 43 of the 72 isolates as Lb. fermentum and Lb. brevis
(cluster A), W. confusa and W. cibaria (Cluster B), P. pentosaseus (Cluster C) and two
isolates from cluster D were identified as Lb. fermentum. This study observed mismatches
between phenotypic and genotypic characterization which have previously been reported {6,
20, 242}. The mismatches were attributed to poor discriminatory power of API because of
atypical fermentation patterns in a number of species. Because most LAB have very similar
nutritional requirements and grow under similar environmental conditions {6, 20, 227}.
According to Hammes et al. {73}, strain-to-strain variability within a species in phenotypic
characteristics could be partly explained by encoding of specific properties on plasmids.
Genotyping identified Bacillus spp. and E. faecium/ E. durans in addition to the
microorganisms identified by API. Bacillus species are important predominant
microorganisms that cause proteolysis in alkaline fermented soybeans {1, 38, 39, 98, 174,
194, 230}. Enterococcus faecium and E. durans have previously been isolated from fermented
soybeans {95, 188, 194}.
Denaturing gradient gel electrophoresis, a culture-independent technique was used to
determine changes and similarity in microbial diversity during fermentation (Paper II). The
V3 region of 16S rDNA was amplified using universal primers PRBA338fgc and PRUN518r
and the same primer pair but without a GC clamp was used for amplification of excised gel
bands prior to sequencing. Denaturing gradient gel electrophoresis revealed microbial
succession particularly in NFP in which Lb. fermentum, and Bacillus spp. were present at the
beginning of the fermentations. During 24 hrs of fermentation Bacillus spp. disappeared while
W. confusa/W. cibaria and Lb. linderi were recovered. By the end of fermentations, Lb.
linderi had disappeared and P. pentosaceus was detected along with Lb. fermentum and W.
confusa/W. cibaria. On the other hand, W. koreensis, W. confusa/W. cibaria and P.
pentosaceus were present from the onset of fermentation in LFP. Lactobacillus fermentum
was isolated as an additional microorganism after 24 hrs fermentation in LFP, and the
microbial composition did not change during further fermentation.
4.2.3 Metabolism of the fermenting microflora
Changes in pH, titratable acidity (Papers I, II and IV), sugars and organic acids (Paper II)
gave an insight to the possible metabolism of the microorganisms in the fermenting pastes.
Fermentations in NFP and LFP were biased towards lactic acid fermentation as indicated by
���
�
the decreases in pH throughout fermentation (Papers I & II). Reductions in pH were more
pronounced in LFP than in NFP as evidenced by 28 – 35% reduction in pH in LFP compared
to 3 – 12% reduction in pH during 24 hrs. By the end of the fermentations, LFP had
undergone 34 to 39% pH reduction while the cumulative percent reduction in pH in NFP
ranged from 17 – 23%.
Correspondingly, lactic acid levels were higher in LFP than in NFP and lactic acid was the
highest produced organic acid in both types of fermentations. Higher lactic acid production
suggested lactic acid as the major end product of fermentation, a characteristic of lactic acid
bacteria metabolism {9, 79, 88, 103}. This demonstrated the possibility of soybean solid
substrate lactic acid fermentation as opposed to alkaline fermentations that have been
intensively investigated. Lactic acid bacteria fermentations were achieved probably because
of the fermenting conditions which limited the amount of oxygen {2, 174} since the
fermentations were performed in nearly full glass jars that were completely closed.
The production of acetic acid in both NFP and LFP suggested heterolactic fermentation.
Heterolactic fermentation results in equimolar amounts of CO2, lactate, and acetate or ethanol
{88}. However, the ratios of lactate/acetate were more than 1 in all fermentations except 90S
at 24 hrs. Thus homolactic fermentation also contributed to lactic acid production. Besides,
both heterofermentative and homofermentative LAB were isolated in both LFP and NFP.
Further, the slower pH reduction and the lower lactic acid production in NFP suggested
possibility of co-fermentation with other microorganisms. More acetic acid was produced in
100S and 90S than in 100SBS and 90SBS, suggesting the possibility of B. subtilis metabolism
in the NFP since acetic acid is a major end product of carbohydrate metabolism in B. subtilis
{136, 195}. Lastly, the presence of succinic acid confirmed heterofermentation {10}, or the
possibility of pyruvate entering alternative pathways {136} which could include the Krebs
cycle {19, 195}.
At the beginning of the fermentations, the levels of reducing sugars were higher in LFP due to
the back-slopping material which contained some flour from malted grain. Malting increases
sugar (glucose, fructose or maltose) content due to amylolytic activities {127}. After 24 hrs
fermentation, glucose was nearly used up (from 932 – 1171 mg/kg to 204 – 246 mg/kg) in
LFP while pronounced decreases in maltose were observed in 100S (5653 to 402 mg/kg) and
in 90S (6250 to 1701 mg/kg). On the other hand, fructose accumulation was observed
between 0 and 24 hrs in LFP, 90S and 75S. The rapid depletion of glucose and maltose
���
�
coincided with the rapid production of lactic acid by a higher LAB population in LFP. The
nearly complete utilization of glucose by 24 hrs could indicate preferential use of glucose as
carbon source followed by maltose. The slight accumulations of maltose and glucose in NFP
at 24 hrs could have been due to slow metabolism because LAB population was lower. In
addition amylase activities could have contributed to the slight accumulation of the sugars.
Accumulation of fructose at 24 hrs and its gradual decline during further fermentation in all
samples except 100S, suggested fructose was not the preferred carbon source.
At the end of the fermentations, 75SBS had significantly higher fructose content than all
samples. Fructose content was also higher in 100SBS and 90SBS than in all NFP. It was
suggested that the higher sugar content in LFP was responsible for the browning color in LFP
during frying (Appendix 1B) due to Maillard reactions and caramelization.
4.3 Food safety implications of natural and lactic acid bacteria
fermentations
Growth of E. coli and B. cereus in pastes of soybeans and soybean-maize blends during
fermentation was investigated (Paper IV). Pastes containing 100% or 90% soybeans were
either fermented naturally (100S, 90S) or fermented with Lb. fermentum as starter culture
(100SC, 90SC) or fermented through back-slopping (100SBS, 90SBS) using a traditional
fermented cereal gruel, thobwa as an inoculum. A single pathogen was inoculated into the
pastes to be fermented naturally, while a single pathogen was simultaneously inoculated with
the back-slopping material or with the Lb. fermentum starter culture in the other
fermentations.
4.3.1 Escherichia coli growth during fermentation
In pastes inoculated with E. coli, the pH of the back-slopped pastes (BSP) decreased
significantly (p<0.05) faster than in the other fermentations. After 24 hrs fermentation, pH
was 4.44 and 5.0 in 90SBS and 100SBS, respectively, while 90S and 100S had pH values of
6.21 and 6.58, respectively and 90SC and 100SC had pH values of 5.69 and 5.74,
respectively. In papers I & II, pH had dropped to 4.36 at 24 hrs and by 72 hrs, the pH had
reached 4.01 in 90SBS while in 100SBS, pH dropped to 4.26 by 72 hrs. The results confirmed
that back-slopping was still subject to variation in product quality {78}.
Nevertheless, back-slopping significantly inhibited E. coli proliferation more than natural and
starter culture fermentations. During 24 hrs fermentation, E. coli increased from 2.4 to 3.2 –
3.5 log10 cfu/g and remained constant at 3.0 log10 cfu/g during further fermentation. While in
���
�
Lb. fermentum fermented pastes (SCP), E. coli increased from 2.0 – 2.3 log10 cfu/g to 6.8 –
7.6 log10 cfu/g during 24 hrs and by 72 hrs, the cell count was 7.2 log10 cfu/g. In NFP, E. coli
increased from 2.3 to 8.8 – 9.2 log10 cfu/g during 24 hrs and by 72 hrs, the count was about
9.1 log10 cfu/g. The relatively faster acidification in BSP compared to SCP and NFP partly
explained the higher inhibition of E. coli growth. Higher initial LAB populations of 6.0 – 8
log10 cfu/g in BSP and SCP were responsible for comparatively faster acidification in these
samples. On the contrary, a low initial LAB count of 2.0 to 2.5 log10 cfu/g was observed in
NFP. Although LAB increased to 5.5 – 6.3 log10 cfu/g after 24 hrs fermentation and reached
7.6 – 9.4 log10 cfu/g after 72 hrs, a high initial LAB population is required in order to inhibit
enteropathogen growth {183} as observed in BSP and SCP.
The LAB profile of BSP and SCP was almost similar but BSP were more effective in
suppressing E.coli growth than the single strain culture in SCP. This suggested that the
mixture of LAB strains in BSP offered a competitive advantage over the single strain culture
in SCP. The results were consistent with Drago et al. {45} who reported that mixed
lactobacilli strains exerted more inhibitory effect on the growth of E. coli and Salmonella
enteritidis than single culture strains.
4.3.2 Bacillus cereus growth and survival during fermentation
In pastes inoculated with B. cereus, BSP and SCP showed pH trends similar to those observed
in pastes inoculated with E. coli. On the other hand, NFP had significantly higher pH values.
In 100S, the pH decreased from 6.25 to 6.11 during 48 hrs and thereafter it increased to 6.86.
While in 90S, the pH decreased from 6.67 to 5.87 during 24 hrs and it increased to 7.2 after
72 hrs fermentation. The increase in pH may be attributed to B. cereus metabolism which is
highly proteolytic (like in other Bacillus spp.) leading to accumulation of ammonia and
subsequent increase in pH {114}.
Higher B. cereus population in NFP compared to BSP and SCP also explains the increase in
pH in NFP. Viable cells of B. cereus in NFP increased from 2.2 to ca. 8.0 log10 cfu/g after 24
hrs and remained relatively unchanged throughout fermentation. On the other hand, B. cereus
counts decreased from 5.0 log10 cfu/g at 24 hrs to 3.7 log10 cfu/g at 72 hrs in 90SC. This was
explained in terms of more acidification due to availability of more fermentable sugars in
90SC than in 100SC. Comparatively, back-slopping resulted in higher B. cereus growth
inhibition than SCP and NFP. Viable cell counts fluctuated between 2.0 and 3.0 log cfu/g in
100SBS while in 90SBS, the highest counts were 2.4 log10 cfu/g and after 24 hrs, no viable
� �
�
cells could be detected. This was probably due to high LAB metabolic activities in 90SBS due
to presence of more fermentable sugars resulting in more production of metabolites with
inhibitory effects.
4.3.3 Preferential pathogen inhibition
It was observed that back-slopping and single strain starter culture fermentations inhibited
growth of B. cereus more than growth of E. coli. However, in this study, only one strain of
each pathogen species was tested. Kingamkono et al. {101} also observed preferential growth
inhibition of Campylobacter jejuni over E. coli in LAB fermentations. Bacillus cereus was
also reported more sensitive than enterotoxigenic E. coli (ETEC) in togwa fermentations {99,
100}. Limited growth inhibition of E. coli was attributed to its inducible acid-tolerance
response system {100, 117}.
4.3.4 Food safety implications of the types of fermentation
Bacillus cereus causes two types of food poisoning. One is an intoxication called emetic
syndrome caused by a preformed heat stable emetic toxin known as cereulide and results in
vomiting {24, 49}. The other is an infection requiring live cells or spores to be ingested
together with food to cause diarrhea {24}. Heat labile enterotoxins are important in the
diarrhea syndrome {24, 59, 68}. The infectious dose in the emetic syndrome is estimated to
be around 105–108 cells/g of ingested food {24, 49, 68, 121}. In the diarrhea syndrome,
various infectious dose ranges of 104 – 109 cells/g {121}, 105 – 107 cells/g {68} and 103 – 107
cells ingested {196} have been reported. The critical pH value for B. cereus growth inhibition
is 5.0 {182, 197} although inhibition at higher pH values of 5.3 to 5.7 have been reported
{234}. Cereulide and enterotoxin production are inhibited by low pH values (less than 5.6 in
cereulide production) {24}.
Considering that viable cells of B. cereus at 72 hrs ranged from 0 to 3 log10 cfu/g in BSP and
3.7 to 5.3 log10 cfu/g in SCP while it was > 5.0 log10 cfu/g in NFP; and pH values at 72 hrs
were 5.30 and 5.35 in 90SC and 100SC, respectively; 4.86 and 5.30 in 90SBS and 100SBS,
respectively; and 7.2 and 6.86 in 90S and 100S, respectively, BSP could be considered
relatively safe with regards to B. cereus poisonings. However, because the minimum pH for
growth for B. cereus is 5.0, then pH values close to 5.0 should be considered borderline.
Escherichia coli is a highly adapted pathogen capable of causing gastroenteritis as well as
extraintestinal infections and eight E. coli pathovars and their mechanisms of disease have
been extensively studied {36, 139}. A diarrhoeagenic E. coli strain known as

�!�
�
enteropathogenic E. coli (EPEC) is a major cause of infant diarrhea in developing countries
{154}. The minimum pH for growth of E. coli is 4.4 {15}, although some EHEC strains like
E. coli O157:H7 have a high degree of acid tolerance {21}. The infectious dose for some
Shiga toxin-producing Escherichia coli (STEC) strains (O111:H2 and O157:H7) is as low as
1 to 100 cells while it may be higher in some strains {175}. In this study, the final pH values
for all fermentations containing E. coli were > 4.4 with minimum population of 3 log10 cfu/g
in BSP. Thus process optimization of the fermentations would be required to improve safety.
This study confirmed that fermentation alone cannot be considered as a critical control point
for elimination of all risks of biological hazards {142}. Thus a combination of prevention of
contamination and control through hygiene, fermentation and thermal treatment like ordinary
cooking could improve the safety of these foods.
4.4 Sensory properties driving consumer acceptance
In paper III, a study was conducted in order to describe sensory properties of the fermented
pastes, to determine consumer acceptance of the pastes and to find out sensory properties that
would drive acceptance of the pastes. Ten trained panelists were involved in a descriptive
sensory analysis. The fermented pastes (Appendix 1A) were molded and were fried
(Appendix 1B) before being presented to the panelists for evaluation. The panelists generated
34 descriptors that were used to rate attributes describing appearance, aroma/odor, taste, and
texture. Significant differences were found in 27 descriptors which were used in further
analyses.
4.4.1 Sensory properties of the fermented pastes
Principal component analysis was used to determine attributes that characterized the
fermented pastes. Principal component analysis categorized the fermented pastes into two
groups based on type of fermentation and the differences in the sensory properties were due to
type of fermentation. Naturally fermented pastes were characterized by yellow color, fried
egg-like appearance, raw soybean odor, fried egg aroma, and higher pH. Sensory properties of
LAB fermented pastes included brown color, chitumbuwa- and mandazi-like appearances
(terms and definitions of attributes are explained in Paper III), burnt roasted soybean odor,
chigumuyoyo and chitumbuwa aromas, umami, bitterness, aftertaste, and sourness. High sour
intensity was due to high lactic acid and succinic acid contents in LFP. Most amino acids
responsible for bitterness and glutamate responsible for umami were higher in NFP than in
LFP. However, sensory panelists rated LFP higher in bitterness and with higher umami
�"�
�
intensities than NFP. This contradiction was explained in terms of taste interactions in which
glutamate could have suppressed bitterness {119} in NFP and sourness could have enhanced
bitterness {145} in LFP.
4.4.2 Consumer acceptance and drivers of liking of the fermented pastes
A total of 150 consumers participated in the consumer acceptance study and 32.4% of the
participants had consumed soybean-based products within the past two months from the date
of data collection. Soybeans were mostly consumed in porridge (69%), although some of the
consumers (17.8%) used texturized soy products locally known as soya pieces as relish (side
dish), roasted beans as snack, soy flour as a condiment in vegetables and other foods, in
addition to using soybeans in porridge.
To understand attributes driving consumer liking, sensory, chemical, and physical data were
regressed with consumer acceptance data using partial least square regression analysis. The
results indicated that consumers’ acceptance was influenced by type of fermentation. Most
consumers preferred NFP to LFP. The drivers of liking were identified as strong yellow color,
higher pH, fried egg-like appearance and aroma, sweetness, softness, rancid odor, and raw
soybean odor. It appeared that the positive impact of higher pH (low sourness intensity),
sweetness, and fried egg aroma masked the negative impact of rancid and raw soybean odors.
Rancid and raw soybean odors have been documented as deterring consumer acceptance of
soybeans {71, 221}. Other consumers preferred LAB fermented pastes which were
characterized by brown color, sourness, bitterness, saltiness, umami, burnt roasted soybeans
and maize aromas. These attributes were considered drivers of liking of LFP.
Cluster analysis revealed consumer heterogeneity, and four clusters of consumers with the
following drivers of liking were identified: Clusters 1 & 3, yellow color, higher pH, raw
soybean odor, and fermented aroma; Cluster 2, roasted soybean aroma and thobwa aroma;
Cluster 4, yellow color, higher pH, raw soybean odor, fermented aroma, sweet taste, fried egg
aroma, fried egg-like appearance, rancid odor, and soft texture. The drivers of dislike for most
consumers were burnt roasted soybean odor, chigumuyoyo aroma, soaked burnt roasted maize
aroma, mandazi aroma, chitumbuwa aroma, mandazi- and chitumbuwa- like appearances,
sourness, umami, bitterness, saltiness, aftertaste and brown color. Umami is the savory taste
in fermented soybeans {240}. Its presence among drivers of disliking could have been due to
its high correlation with bitterness. Optimization by enhancing drivers of liking while
�#�
�
suppressing the drivers of dislike would improve utilization and acceptance of the fermented
pastes of soybeans and soybean-maize blends.

$�
�
5 CONCLUSIONS AND FUTURE PERSPECTIVES
5.1 Conclusions
The following conclusions were drawn from this work:
The study demonstrated the possibility of soybean solid substrate fermentation achieved with
lactic acid bacteria naturally present on the raw materials or introduced through back-
slopping, although possibility of B. subtilis metabolism in addition to LAB was suggested in
the case of natural fermentation. The dominant lactic acid bacteria flora in both natural and
lactic acid bacteria fermentations were Weissella cibaria/W. confusa, Lb. fermentum and P.
pentosaceus. Denaturing gradient gel electrophoresis revealed succession of microbial
communities during natural fermentation in which Bacillus spp. and Lb. linderi present during
early stages of fermentation were succeeded and more acid tolerant organisms like Lb.
fermentum, Weissella spp. and P. pentosaceus proliferated and survived during further
fermentation. Some species were only recovered by culture-dependent techniques and others
were only recovered by DGGE, therefore the use of polyphasic approaches to study microbial
diversity in complex systems was recommended.
High organic acid production in lactic acid bacteria fermentations suggested that back-
slopping has the potential of producing fermented soybean pastes with reduced risk of
foodborne illnesses with regards to B. cereus. This conclusion was drawn because of the
possibility of reaching pH values of lower than 5.0, a critical value for B. cereus growth
inhibition. In addition, inhibition of growth of spore formers, yeasts and molds suggested a
better microbial safety due to back-slopping. Although soybean pastes naturally fermented
with B. subtilis have always been considered as safe, failure of both natural and lactic acid
bacteria fermentations to reduce pH of the pastes to lower than 4.4, the critical value for E.
coli growth inhibition, suggested a risk of food poisoning if contamination by E. coli should
occur during raw material preparation prior to fermentation and even during fermentation
under the conditions employed in this study. Therefore application of a thermal processing
step like ordinary cooking before consumption was recommended to ensure safety.
Lactic acid bacteria fermentation through back-slopping and natural fermentation improved
the nutritional quality of pastes of soybeans and soybean-maize blends through degradation of
anti-nutritional factors and increases in soluble protein, increases in some free amino acids
and increases in total amino acids including the limiting amino acids cysteine and methionine.
The main total amino acids throughout fermentation were Glu, Asp, Leu, Arg, Lys, Ser and

��
�
Phe. Proteolytic activities and amino acid metabolism resulted in differences in major free
amino acids which were Asp, Glu, Ala, Val, Phe, Leu, and Lys in naturally fermented pastes
and Asp, Glu, Gly, Ala, GABA, Leu and Lys in lactic acid bacteria fermented pastes. A
comparative advantage of natural fermentation in this study was its higher degradation of
phytic acid compared to lactic acid bacteria fermentation.
Sensory properties in the fermented pastes were influenced by type of fermentation and
consumers also used type of fermentation to determine their preference patterns. Although
there was consumer segmentation, most consumers preferred naturally fermented pastes to
lactic acid bacteria fermented pastes. Sensory properties that were drivers of liking included
strong intensities of yellow color, pH, sweet taste, egg aroma, egg-like appearance, raw
soybean odor, rancid odor, fermented aroma, soft texture and roasted soybean aroma.
Therefore, optimization of the desirable properties could increase acceptance of fermented
soybean products.
5.2 Future perspectives
Future work should focus on the research gaps that were not addressed in this study and these
include:
Identification of other microorganisms (total aerobic bacteria, yeasts and molds and spore
formers) that were part of the microflora in the fermented pastes. Next generation sequencing
can be used for identification of LAB and other microbial groups in the fermented pastes.
Isolation, identification and characterization of the microflora and its diversity in the
fermented cereal gruel, thobwa, used as a source of back-slopping material in this study.
Although numerous studies have reported that LAB and yeasts are dominant microflora in
similar gruels, but geographical influence in microbial diversity has also been reported.
Therefore a study in this product is important since the product seems to be a potential source
of starter cultures.
Lactic acid bacteria strains that were isolated in this study could be tested for pH lowering
ability and could be used in mixed starter culture development studies for fermentation of
soybean pastes.
Investigation on technological, functional and sensory properties of Weissella cibaria/W.
confusa, Lb. fermentum and P. pentosaceus strains which were identified as the dominant
��
�
species in the microflora, to establish their roles during fermentation and to explore their
potential use as starter cultures in fermented pastes of soybeans and soybean-maize blends.
Investigation on the changes in atmospheric gases under the fermenting conditions and the
possibility of B. cereus enterotoxin or cereulide production during fermentation is
recommended.
Investigation on the changes in soy proteins and ammonia production with fermentation time
would be important in optimization to overcome the objectionable odor associated with
proteolysis of soybean fermentations.
A direct measurement of oligosaccharides should be undertaken to determine the fate of these
flatulence causing sugars during natural and lactic acid bacteria fermentations.
To increase utilization of the fermented pastes, optimization is required in which the
intensities of drivers of liking would be increased while decreasing the intensities of drivers of
disliking.
Determination of volatile compounds associated with soybean aromas/odors would increase
an understanding of the consumer preference patterns.
�
�
�
�
�
�
�
�
�
�
�
�
���

��
�
6 APPENDICES Appendix 1A: Raw fermented pastes of soybeans and soybean-maize blends
Fig. 1: Raw fermented pastes at 72 hrs. A) From left to right: 100S, 90S and 75S; B) From left
to right: 100SBS, 90SBS and 75SBS.
Appendix 1B: Fried fermented pastes
Fig. 2: Fried fermented pastes at 72 hrs. A) From left to right: 100S, 90S and 75S; B) From
left to right: 100SBS, 90SBS and 75SBS.
��
�
7 REFERENCES
1. Adewumi, G. A., Oguntoyinbo, F. A., Keisam, S., Romi, W. and Jeyaram, K. 2013. Combination of culture-independent and culture-dependent molecular methods for the determination of bacterial community of iru, a fermented Parkia biglobosa seeds. Frontiers in
Microbiology, 3, 1-9.
2. Allagheny, N., Obanu, Z. A., Campbell-Platt, G. and Owens, J. D. 1996. Control of ammonia formation during Bacillus subtilis fermentation of legumes. International Journal of
Food Microbiology, 29, 321-333.
3. Amadou, I., Kamara, M. T., Tidjani, A., Foh, M. B. K. and Guo-Wei, L. 2010. Physicochemical and nutritional analysis of fermented soybean protein meal by Lactobacillus
plantarum Lp6. World Journal of Dairy & Food Sciences, 5, 114-118.
4. Amoa-Awua, W. K., Awusi, B., Owusu, M., Appiah, V., Ofori, H., Thorsen, L. and Jespersen, L. 2014. Reducing the atypical odour of dawadawa: Effect of modification of fermentation conditions and post-fermentation treatment on the development of the atypical odour of dawadawa. Food Control, 42, 335-342.
5. Ampe, F., Sirvent, A. and Zakhia, N. 2001. Dynamics of the microbial community responsible for traditional sour cassava starch fermentation studied by denaturing gradient gel electrophoresis and quantitative rRNA hybridization. International Journal of Food
Microbiology, 65, 45-54.
6. Andrighetto, C., De Dea, P., Lombardi, A., Neviani, E., Rossetti, L. and Giraffa, G. 1998. Molecular identification and cluster analysis of homofermentative thermophilic lactobacilli isolated from dairy products. Research in Microbiology, 149, 631-643.
7. Ari, M. M., Ayanwale, B. A., Adama, T. Z. and Olatunji, E. A. 2012. Effects of different fermentation methods on the proximate composition, amino acid profile and some antinutritional factors (ANFs) in soyabeans (Glycine Max). Fermentation Technology and
Bioengineering, 2, 6-13.
8. Asgar, M. A., Fazilah, A., Huda, N., Bhat, R. and Karim, A. A. 2010. Nonmeat protein alternatives as meat extenders and meat analogs. Comprehensive Reviews in Food Science
and Food Safety, 9, 513-529.
9. Axelsson, L. 1998. Lactic acid bacteria: Classification and physiology. In: Salminen, S. and Von Wright, A. (eds.) Lactic acid bacteria: Microbiology and functional aspects. New York: Marcel Dekker Inc.
10. Axelsson, L. 2004. Lactic acid bacteria: Classification and physiology. In: Salminen, S., Von Wright, A. and Ouwehand, A. (eds.) Lactic acid bacteria: Microbiological and
functional aspects. Revised and Expanded. 3rd ed. New York Marcel Dekker, Inc.

��
�
11. Azokpota, P., Hounhouigan, D. J. and Nago, M. C. 2006. Microbiological and chemical changes during the fermentation of African locust bean (Parkia biglobosa) to produce afitin, iru and sonru, three traditional condiments produced in Benin. International
Journal of Food Microbiology, 107, 304-309.
12. Baek, J. G., Shim, S. M., Kwon, D. Y., Choi, H. K., Lee, C. H. and Kim, Y. S. 2010. Metabolite profiling of Cheonggukjang, a fermented soybean paste, inoculated with various Bacillus strains during fermentation. Bioscience, Biotechnology & Biochemistry, 74, 1860-1868.
13. Baumberg, S. and Harwood, C. R. 1979. Carbon and nitrogen repression of arginine catabolic enzymes in Bacillus subtilis. Journal of Bacteriology, 137, 189-196.
14. Belitsky, B. R. and Sonenshein, A. L. 2004. Modulation of activity of Bacillus subtilis
regulatory proteins GltC and TnrA by glutamate dehydrogenase. Journal of Bacteriology,
186, 3399-3407.
15. Bell, C. 2002. Approach to the control of entero-haemorrhagic Escherichia coli
(EHEC). International Journal of Food Microbiology, 78, 197-216.
16. Berk, Z. 1992. Technology of production of edible flours and protein products from
soybeans, Rome, Food and Agriculture Organization of the United Nations.
17. Björck, I. and Asp, N. G. 1983. The effects of extrusion cooking on nutritional value — A literature review. Journal of Food Engineering, 2, 281-308.
18. Blandino, A., Al-Aseeri, M. E., Pandiella, S. S., Cantero, D. and Webb, C. 2003. Cereal-based fermented foods and beverages. Food Research International, 36, 527-543.
19. Blencke, H.-M., Homuth, G., Ludwig, H., Mäder, U., Hecker, M. and Stülke, J. 2003. Transcriptional profiling of gene expression in response to glucose in Bacillus subtilis: Regulation of the central metabolic pathways. Metabolic Engineering, 5, 133-149.
20. Boyd, M. A., Antonio, M. A. D. and Hillier, S. L. 2005. Comparison of API 50 CH strips to whole-chromosomal DNA probes for identification of Lactobacillus species. Journal
of Clinical Microbiology, 43, 5309-5311.
21. Buchanan, R. L. and Doyle, M. P. 1997. Foodborne disease significance of Escherichia coli O157:H7 and other enterohemorrhagic E. coli. Food Technology, 51, 69-76.
22. Caplice, E. and Fitzgerald, G. F. 1999. Food fermentations: Role of microorganisms in food production and preservation. International Journal of Food Microbiology, 50, 131-149.
23. Carrera, C. S., Reynoso, C. M., Funes, G. J., Martínez, M. J., Dardanelli, J. and Resnik, S. L. 2011. Amino acid composition of soybean seeds as affected by climatic variables. Pesquisa Agropecuária Brasileira, 46, 1579-1587.
�
�
24. Ceuppens, S., Rajkovic, A., Heyndrickx, M., Tsilia, V., Van De Wiele, T., Boon, N. and Uyttendaele, M. 2011. Regulation of toxin production by Bacillus cereus and its food safety implications. Critical Reviews in Microbiology, 37, 188-213.
25. Chantawannakul, P., Oncharoen, A., Klanbut, K., Chukeatirote, E. and Lumyong, S. 2002. Characterization of proteases of Bacillus subtilis strain 38 isolated from traditionally fermented soybean in Northern Thailand. ScienceAsia, 28, 241 - 245.
26. Cheftel, J. C. 1986. Nutritional effects of extrusion-cooking. Food Chemistry, 20, 263-283.
27. Chen, L., Madl, R. L., Vadlani, P. V., Li, L. and Wang, W. 2013. Value - added
products from soybean: Removal of anti-nutritional factors via bioprocessing, Croatia, InTech.
28. Chen, T., Jiang, S., Xiong, S., Wang, M., Zhu, D. and Wei, H. 2012. Application of denaturing gradient gel electrophoresis to microbial diversity analysis in Chinese Douchi. Journal of the Science of Food and Agriculture, 92, 2171-2176.
29. Chen, T., Wang, M., Jiang, S., Xiong, S., Zhu, D. and Wei, H. 2011. Investigation of the microbial changes during koji-making process of Douchi by culture-dependent techniques and PCR-DGGE. International Journal of Food Science & Technology, 46, 1878-1883.
30. Chitra, U., Singh, U. and Venkateswara Rao, P. 1996. Phytic acid, in vitro protein digestibility, dietary fiber, and minerals of pulses as influenced by processing methods. Plant
Foods for Human Nutrition, 49, 307-316.
31. Choi, Y. M., Suh, H. J. and Kim, J. M. 2001. Purification and properties of extracellular phytase from Bacillus sp. KHU-10. Journal of Protein Chemistry, 20, 287-292.
32. Christensen, J., Dudley, E., Pederson, J. and Steele, J. 1999. Peptidases and amino acid catabolism in lactic acid bacteria. Antonie van Leeuwenhoek, 76, 217-246.
33. Chukeatirote, E., Dajanta, K. and Apichartsrangkoon, A. 2010. Thua nao, indigenous Thai fermented soybean: A review. Journal of Biological Sciences, 10, 581-583.
34. Chung, L. and Chung, S. J. 2007. Cross-cultural comparisons among the sensory characteristics of fermented soybean using Korean and Japanese descriptive analysis panels. Journal of Food Science, 72, S676-688.
35. Coulibaly, O., Alene, A. D., Manyong, V., Sanogo, D., Abdoulaye, T., Chianu, J., Fatokun, C., Kamara, K., Tefera, H. and Boukar, O. 2009. Situation and outlook for cowpea and soybean in Sub-Saharan Africa. [8 August 2014]. Available from: http://www.icrisat.org/what-we-do/impi/projects/tl2-publications/regional-situation-outlook-reports/rso-cwp-sbean-sub-SaharaAfrica.pdf.

!�
�
36. Croxen, M. A. and Finlay, B. B. 2010. Molecular mechanisms of Escherichia coli
pathogenicity. Nature Reviews Microbiology, 8, 26-38.
37. Dajanta, K., Apichartsrangkoon, A., Chukeatirote, E. and Frazier, R. A. 2011. Free-amino acid profiles of thua nao, a Thai fermented soybean. Food Chemistry, 125, 342-347.
38. Dajanta, K., Chukeatirote, E. and Apichartsrangkoon, A. 2012. Improvement of thua
nao production using protein-rich soybean and Bacillus subtilis TN51 starter culture. Annals
of Microbiology, 62, 785-795.
39. Dakwa , S., Sakyi-Dawson, E., Diako, C., Annan, N. T. and Amoa-Awua, W. K. 2005. Effect of boiling and roasting on the fermentation of soybeans into dawadawa (soy-dawadawa). International Journal of Food Microbiology, 104, 69 - 82.
40. Dauner, M., Storni, T. and Sauer, U. 2001. Bacillus subtilis metabolism and energetics in carbon-limited and excess-carbon chemostat culture. Journal of Bacteriology, 183, 7308-7317.
41. De Angelis, M., Gallo, G., Corbo, M. R., McSweeney, P. L. H., Faccia, M., Giovine, M. and Gobbetti, M. 2003. Phytase activity in sourdough lactic acid bacteria: Purification and characterization of a phytase from Lactobacillus sanfranciscensis CB1. International Journal
of Food Microbiology, 87, 259-270.
42. De Vuyst, L., Schrijvers, V., Paramithiotis, S., Hoste, B., Vancanneyt, M., Swings, J., Kalantzopoulos, G., Tsakalidou, E. and Messens, W. 2002. The biodiversity of lactic acid bacteria in Greek traditional wheat sourdoughs is reflected in both composition and metabolite formation. Applied and Environmental Microbiology, 68, 6059-6069.
43. Denter, J., Rehm, H. J. and Bisping, B. 1998. Changes in the contents of fat-soluble vitamins and provitamins during tempe fermentation. International Journal of Food
Microbiology, 45, 129-134.
44. Dixit, A. K., Antony, J. I. X., Sharma, N. K. and Tiwari, R. K. 2011. Soybean
constituents and their functional benefits, London, World Scientific Publishing Company.
45. Drago, L., Gismondo, M. R., Lombardi, A., de Haën, C. and Gozzini, L. 1997. Inhibition of in vitro growth of enteropathogens by new Lactobacillus isolates of human intestinal origin. FEMS Microbiology Letters, 153, 455-463.
46. Duranti, M. and Gius, C. 1997. Legume seeds: protein content and nutritional value. Field Crops Research, 53, 31-45.
47. Earl, A. M., Losick, R. and Kolter, R. 2008. Ecology and genomics of Bacillus
subtilis. Trends in Microbiology, 16, 269-275.
48. Egounlety, M. and Aworh, O. C. 2003. Effect of soaking, dehulling, cooking and fermentation with Rhizopus oligosporus on the oligosaccharides, trypsin inhibitor, phytic acid

"�
�
and tannins of soybean (Glycine max Merr.), cowpea (Vigna unguiculata L. Walp) and groundbean (Macrotyloma geocarpa Harms). Journal of Food Engineering, 56, 249-254.
49. Ehling-Schulz, M., Fricker, M. and Scherer, S. 2004. Bacillus cereus, the causative agent of an emetic type of food-borne illness. Molecular Nutrition & Food Research, 48, 479-487.
50. Ercolini, D. 2004. PCR-DGGE fingerprinting: Novel strategies for detection of microbes in food. Journal of Molecular Methods, 56, 297-314.
51. Ercolini, D., Moschetti, G., Blaiotta, G. and Coppola, S. 2001. The potential of a polyphasic PCR-DGGE approach in evaluating microbial diversity of natural whey cultures for water-buffalo mozzarella cheese production: Bias of culture-dependent and culture-independent analyses. Systematic and Applied Microbiology, 24, 610-617.
52. Farinde, E. O., Adeniran, H. A. and Abiose, S. H. 2014. Comparative microbial assessment of fermented lima bean (Phaseolus lunatus) and locust bean (Parkia biglobossa) in production of daddawa. British Microbiology Research Journal, 4, 772-784.
53. Ferris, M. J., Muyzer, G. and Ward, D. M. 1996. Denaturing gradient gel electrophoresis profiles of 16S rRNA-defined populations inhabiting a hot spring microbial mat community. Applied and Environmental Microbiology, 62, 340-346.
54. Fisher, S. H. 1999. Regulation of nitrogen metabolism in Bacillus subtilis: Vive la différence! Molecular Microbiology, 32, 223-232.
55. Friedman, M. and Brandon, D. L. 2001. Nutritional and health benefits of soy proteins. Journal of Agricultural and Food Chemistry, 49, 1069-1086.
56. Friedman, M., Brandon, D. L., Bates, A. H. and Hymowitz, T. 1991. Comparison of a commercial soybean cultivar and an isoline lacking the Kunitz trypsin inhibitor: Composition, nutritional value, and effects of heating. Journal of Agricultural and Food Chemistry, 39,
327-335.
57. Fritze, D. 2004. Taxonomy of the genus Bacillus and related genera: The aerobic endospore-forming bacteria. Phytopathology, 94, 1245-1248.
58. Gadaga, T. H., Mutukumira, A. N., Narvhus, J. A. and Feresu, S. B. 1999. A review of traditional fermented foods and beverages of Zimbabwe. International Journal of Food
Microbiology, 53, 1-11.
59. Ghelardi, E., Celandroni, F., Salvetti, S., Barsotti, C., Baggiani, A. and Senesi, S. 2002. Identification and characterization of toxigenic Bacillus cereus isolates responsible for two food-poisoning outbreaks. FEMS Microbiology Letters, 208, 129-134.
#�
�
60. Giami, S. Y. 2002. Chemical composition and nutritional attributes of selected newly developed lines of soybean (Glycine max (L) Merr). Journal of the Science of Food and
Agriculture, 82, 1735-1739.
61. Gibson, R. S., Bailey, K. B., Gibbs, M. and Ferguson, E. L. 2010. A review of phytate, iron, zinc, and calcium concentrations in plant-based complementary foods used in low-income countries and implications for bioavailability. Food and Nutrition Bulletin, 31, S134-146.
62. Gibson, R. S. and Hotz, C. 2001. Dietary diversification/modification strategies to enhance micronutrient content and bioavailability of diets in developing countries. British
Journal of Nutrition, 85 Suppl 2, S159-166.
63. Gibson, R. S., Yeudall, F., Drost, N., Mtimuni, B. and Cullinan, T. 1998. Dietary interventions to prevent zinc deficiency. The American Journal of Clinical Nutrition, 68,
484S-487S.
64. Gibson, R. S., Yeudall, F., Drost, N., Mtimuni, B. M. and Cullinan, T. R. 2003. Experiences of a community-based dietary intervention to enhance micronutrient adequacy of diets low in animal source foods and high in phytate: a case study in rural Malawian children. The Journal of Nutrition, 133, 3992S-3999S.
65. Glass, K. A., Loeffelholz, J. M., Ford, J. P. and Doyle, M. P. 1992. Fate of Escherichia coli O157:H7 as affected by pH or sodium chloride and in fermented, dry sausage. Applied and Environmental Microbiology, 58, 2513-2516.
66. Government of Malawi. 2006. Interim guidelines for the management of acute
malnutrition in adolescents and adults. Malawi: Ministry of Health.
67. Graf, E., Empson, K. L. and Eaton, J. W. 1987. Phytic acid. A natural antioxidant. Journal of Biological Chemistry, 262, 11647-11650.
68. Granum, P. E. and Lund, T. 1997. Bacillus cereus and its food poisoning toxins. FEMS Microbiology Letters, 157, 223-228.
69. Grieshop, C. M. and Fahey, G. C. 2001. Comparison of quality characteristics of soybeans from Brazil, China, and the United States. Journal of Agricultural and Food
Chemistry, 49, 2669-2673.
70. Grieshop, C. M., Kadzere, C. T., Clapper, G. M., Flickinger, E. A., Bauer, L. L., Frazier, R. L. and Fahey, G. C. 2003. Chemical and nutritional characteristics of United States soybeans and soybean meals. Journal of Agricultural and Food Chemistry, 51, 7684-7691.
71. Gupta, R. P. 1997. Nutrition vs. Taste - meet the soya challenge Available: http://prosoya.com/wp-content/uploads/2014/03/nutrition-taste.pdf [Accessed 10 August 2014].
!$�
�
72. Gänzle, M. G., Vermeulen, N. and Vogel, R. F. 2007. Carbohydrate, peptide and lipid metabolism of lactic acid bacteria in sourdough. Food Microbiology, 24, 128-138.
73. Hammes, W. P., Weiss, N. and Holzapfel, W. H. 1992. The genera Lactobacillus and
Carnobacterium, Heidelberg, Germany, Springer.
74. Hansen, M., Pedersen, B., Munck, L. and Eggum, B. O. 1989. Weaning foods with
improved energy and nutrient density prepared from germinated cereals. 1. Preparation and
dietary bulk of gruels based on barley, Tokyo, Japan, United Nations University.
75. Harrigan, J. 2008. Food insecurity, poverty and the Malawian starter pack: Fresh start or false start? Food Policy, 33, 237-249.
76. Hernandez-Infante, M., Sousa, V., Montalvo, I. and Tena, E. 1998. Impact of microwave heating on hemagglutinins, trypsin inhibitors and protein quality of selected legume seeds. Plant Foods for Human Nutrition, 52, 199-208.
77. Holzapfel, W. 1997. Use of starter cultures in fermentation on a household scale. Food
Control, 8, 241-258.
78. Holzapfel, W. H. 2002. Appropriate starter culture technologies for small-scale fermentation in developing countries. International Journal of Food Microbiology, 75, 197-212.
79. Holzapfel, W. H., Haberer, P., Geisen, R., Björkroth, J. and Schillinger, U. 2001. Taxonomy and important features of probiotic microorganisms in food and nutrition. The
American Journal of Clinical Nutrition, 73, 365S-373S.
80. Hotz, C. and Gibson, R. S. 2007. Traditional food-processing and preparation practices to enhance the bioavailability of micronutrients in plant-based diets. The Journal of
Nutrition, 137, 1097-1100.
81. Huddle, J. M., Gibson, R. S. and Cullinan, T. R. 1998. Is zinc a limiting nutrient in the diets of rural pregnant Malawian women? British Journal of Nutrition, 79, 257-265.
82. Inatsu, Y., Nakamura, N., Yuriko, Y., Fushimi, T., Watanasiritum, L. and Kawamoto, S. 2006. Characterization of Bacillus subtilis strains in Thua nao, a traditional fermented soybean food in northern Thailand. Letters in Applied Microbiology, 43, 237-242.
83. International Crops Research Institute for the Semi-Arid Tropic. 2013. Tropical legume farming in Malawi. A bulletin of the tropical legumes II project [Online], 21. Available: http://www.icrisat.org/tropicallegumesII/pdfs/November-2013.pdf [Accessed 8 August 2014].
84. Ivanov, D. S., Levi, J. D. and Sredanovi, S. A. 2010. Fatty acid composition of various soybean products. Food and Feed Research, 2, 65-70.
!��
�
85. Jackson, C. J. C., Dini, J. P., Lavandier, C., Rupasinghe, H. P. V., Faulkner, H., Poysa, V., Buzzell, D. and DeGrandis, S. 2002. Effects of processing on the content and composition of isoflavones during manufacturing of soy beverage and tofu. Process Biochemistry, 37,
1117-1123.
86. Jideani, I. A. and Okeke, C. R. 1991. Comparative study of microorganisms and sensory attributes of condiments from the fermentation of different seeds. Plant Foods for
Human Nutrition, 41, 27-34.
87. Kalimbira, A. A., Mtimuni, B. M. and Mtimuni, J. P. 2004. Effect of incorporating legumes on nutritive value of cassava-based complementary foods. Bunda Journal of
Agriculture, Environvironmental Science & Technology, 2, 13-21.
88. Kandler, O. 1983. Carbohydrate metabolism in lactic acid bacteria. Antonie van
Leeuwenhoek, 49, 209-224.
89. Kaushik, G., Satya, S. and Naik, S. N. 2010. Effect of domestic processing techniques on the nutritional quality of the soybean. Mediterranean Journal of Nutrition and Metabolism,
3, 39-46.
90. Kayembe, N. C. 2011. Germination as a processing technique for soybeans in small-
scale broiler farming. M Inst Agrar. (Animal Production), University of Pretoria.
91. Kiers, J. L., Van laeken, A. E. A., Rombouts, F. M. and Nout, M. J. R. 2000. In vitro digestibility of Bacillus fermented soya bean. International Journal of Food Microbiology,
60, 163-169.
92. Kim, H. G., Hong, J. H., Song, C. K., Shin, H. W. and Kim, K. O. 2010. Sensory characteristics and consumer acceptability of fermented soybean paste (Doenjang). Journal of
Food Science, 75, S375-383.
93. Kim, J. H., Ahn, H. J., Kim, D. H., Jo, C., Yook, H. S., Park, H. J. and Byun, M. W. 2003. Irradiation effects on biogenic amines in Korean fermented soybean paste during fermentation. Journal of Food Science, 68, 80-84.
94. Kim, M. and Kim, Y. S. 2012. Detection of foodborne pathogens and analysis of aflatoxin levels in home-made doenjang samples Preventive Nutrition & Food Science, 17,
172-176.
95. Kim, T.-W., Lee, J.-H., Kim, S.-E., Park, M.-H., Chang, H. C. and Kim, H.-Y. 2009. Analysis of microbial communities in doenjang, a Korean fermented soybean paste, using nested PCR-denaturing gradient gel electrophoresis. International Journal of Food
Microbiology, 131, 265-271.
96. Kim, T., Lee, J.-H., Park, M.-H. and Kim, H.-Y. 2010. Analysis of bacterial and fungal communities in Japanese- and Chinese-fermented soybean pastes using nested PCR–DGGE. Current Microbiology, 60, 315-320.

!��
�
97. Kim, Y.-O., Kim, H.-K., Bae, K.-S., Yu, J.-H. and Oh, T.-K. 1998. Purification and properties of a thermostable phytase from Bacillus sp. DS11. Enzyme and Microbial
Technology, 22, 2-7.
98. Kim, Y.-S., Kim, M.-C., Kwon, S.-W., Kim, S.-J., Park, I.-C., Ka, J.-O. and Weon, H.-Y. 2011. Analyses of bacterial communities in meju, a Korean traditional fermented soybean bricks, by cultivation-based and pyrosequencing methods. The Journal of Microbiology, 49,
340-348.
99. Kingamkono, R., Sjögren, E., Svanberg, U. and Kaijser, B. 1994. pH and acidity in lactic-fermenting cereal gruels: effects on viability of enteropathogenic microorganisms. World Journal of Microbiology and Biotechnology, 10, 664-669.
100. Kingamkono, R., Sjögren, E., Svanberg, U. and Kaijser, B. 1995. Inhibition of different strains of enteropathogens in a lactic-fermenting cereal gruel. World Journal of
Microbiology and Biotechnology, 11, 299-303.
101. Kingamkono, R. R., Sjögren, E. and Svanberg, U. 1998. Inhibition of enterotoxin production by, and growth of enteropathogens in a lactic acid-fermenting cereal gruel. World
Journal of Microbiology and Biotechnology, 14, 661-667.
102. Kitabatake, N., Gimbi, D. M. and Oi, Y. 2003. Traditional non-alcoholic beverage, Togwa, in East Africa, produced from maize flour and germinated finger millet. International
Journal of Food Sciences and Nutrition, 54, 447-455.
103. Klein, G., Pack, A., Bonaparte, C. and Reuter, G. 1998. Taxonomy and physiology of probiotic lactic acid bacteria. International Journal of Food Microbiology, 41, 103-125.
104. Kobayashi, M. 2005. Immunological functions of soy sauce: hypoallergenicity and antiallergic activity of soy sauce. Journal of Bioscience and Bioengineering, 100, 144-151.
105. Kunji, E. R., Mierau, I., Hagting, A., Poolman, B. and Konings, W. N. 1996. The proteolytic systems of lactic acid bacteria. Antonie van Leeuwenhoek, 70, 187-221.
106. Kwak, C. S., Lee, M. S. and Park, S. C. 2007. Higher antioxidant properties of Chungkookjang, a fermented soybean paste, may be due to increased aglycone and malonylglycoside isoflavone during fermentation. Nutrition Research, 27, 719-727.
107. Kwon, D. Y., Daily, J. W., Kim, H. J. and Park, S. 2010. Antidiabetic effects of fermented soybean products on type 2 diabetes. Nutrition Research, 30, 1-13.
108. Lan, Y., Williams, B. A., Verstegen, M. W. A., Patterson, R. and Tamminga, S. 2007. Soy oligosaccharides in vitro fermentation characteristics and its effect on caecal microorganisms of young broiler chickens. Animal Feed Science and Technology, 133, 286-297.

!��
�
109. Law, B. and Kolstad, J. 1983. Proteolytic systems in lactic acid bacteria. Antonie van
Leeuwenhoek, 49, 225-245.
110. Lee, G. and Yoon, K.-H. 2009. Sensory comparison of fermented soybeans (Cheongkookjang) inoculated with various Bacillus species by principal component analysis. Journal of the Korean Society for Applied Biological Chemistry, 52, 726-730.
111. Lee, J. H., Kim, T. W., Lee, H., Chang, H. C. and Kim, H. Y. 2010. Determination of microbial diversity in meju, fermented cooked soya beans, using nested PCR-denaturing gradient gel electrophoresis. Letters in Applied Microbiology, 51, 388-394.
112. Lee, S.-J. and Ahn, B. 2009. Comparison of volatile components in fermented soybean pastes using simultaneous distillation and extraction (SDE) with sensory characterisation. Food Chemistry, 114, 600-609.
113. Leejeerajumnean, A. 2001. Thua nao: Alkali fermented soybean from Bacillus subtilis. Available: http://www.journal.su.ac.th/index.php/suij/article/view/53/53. [Accessed 11 August 2014].
114. Leejeerajumnean, A., Ames, J. M. and Owens, J. D. 2000. Effect of ammonia on the growth of Bacillus species and some other bacteria. Letters in Applied Microbiology, 30, 385-389.
115. Leite, A. M., Mayo, B., Rachid, C. T., Peixoto, R. S., Silva, J. T., Paschoalin, V. M. and Delgado, S. 2012. Assessment of the microbial diversity of Brazilian kefir grains by PCR-DGGE and pyrosequencing analysis. Food Microbiology, 31, 215-221.
116. Leroy, F. and De Vuyst, L. 2004. Lactic acid bacteria as functional starter cultures for the food fermentation industry. Trends in Food Science & Technology, 15, 67-78.
117. Leyer, G. J., Wang, L. L. and Johnson, E. A. 1995. Acid adaptation of Escherichia coli
O157:H7 increases survival in acidic foods. Applied and Environmental Microbiology, 61,
3752-3755.
118. Liener, I. 1979. Significance for humans of biologically active factors in soybeans and other food legumes. Journal of the American Oil Chemists’ Society, 56, 121-129.
119. Lindqvist, M. 2010. Flavour improvement of water solutions comprising bitter amino
acids. Masters in Food Science, Swedish University of Agricultural Sciences.
120. Liu, M., Bayjanov, J. R., Renckens, B., Nauta, A. and Siezen, R. J. 2010. The proteolytic system of lactic acid bacteria revisited: A genomic comparison. BioMed Central
Genomics, 11, 36.
121. Logan, N. A. 2012. Bacillus and relatives in foodborne illness. Journal of Applied
Microbiology, 112, 417-429.
!��
�
122. Lokuruka, M. 2011. Effects of processing on soybean nutrients and potential impact on consumer health: An overview. African Journal of Food, Agriculture, Nutrition and
Development, 11, 5000-5017.
123. Lorri, W. and Svanberg, U. 1993. Lactic acid-fermented cereal gruels: Viscosity and flour concentration. International Journal of Food Sciences and Nutrition, 44, 207-213.
124. Macfarlane, G. T., Cummings, J. H. and Allison, C. 1986. Protein degradation by human intestinal bacteria. Journal of General Microbiology, 132, 1647-1656.
125. Makato, C. J. A. 1997. A description of crop varieties in Malawi. Malawi: Department of Agricultural Research and Technical Services, Ministry of Agriculture & Irrigation
126. Maleta, K. 2006. Undernutrition. Malawi Medical Journal, 18, 191–207.
127. Malleshi, N. G., Desikachar, H. S. R. and Tharanathan, R. N. 1986. Free sugars and non-starchy polysaccharides of finger millet (Eleusine coracana), pearl millet (Pennisetum
typhoideum), foxtail millet (Setaria italica) and their malts. Food Chemistry, 20, 253-261.
128. Manary, M. J., Hotz, C., Krebs, N. F., Gibson, R. S., Westcott, J. E., Arnold, T., Broadhead, R. L. and Hambidge, K. M. 2000. Dietary phytate reduction improves zinc absorption in Malawian children recovering from tuberculosis but not in well children. The
Journal of Nutrition, 130, 2959-2964.
129. Manary, M. J., Hotz, C., Krebs, N. F., Gibson, R. S., Westcott, J. E., Broadhead, R. L. and Hambidge, K. M. 2002. Zinc homeostasis in Malawian children consuming a high-phytate, maize-based diet. The American Journal of Clinical Nutrition, 75, 1057-1061.
130. Markets and Economic Research Centre of the National Agricultural Marketing Council. 2011. The South African soybean value chain. Available: http://www.namc.co.za/dnn/LinkClick.aspx?fileticket=hmnbvBkExdY%3D&tabid=92&mid=635 [Accessed 8 August 2014].
131. Mayra-Makinen, A. and Bigret, M. 2004. Undustrial use and producion of lactic acid bacteria. In: Salminen, S., Von Wright, A. and Ouwehand, A. (eds.) Lactic acid bacteria:
Microbiological and functional Aspects. Revised and Expanded. 3rd ed. New York: Marcel Dekker Inc.
132. Medic, J., Atkinson, C. and Hurburgh, C., Jr. 2014. Current knowledge in soybean composition. Journal of the American Oil Chemists' Society, 91, 363-384.
133. Mensah, P. 1997. Fermentation — the key to food safety assurance in Africa? Food
Control, 8, 271-278.
134. Messina, M. J. 1999. Legumes and soybeans: overview of their nutritional profiles and health effects. The American Journal of Clinical Nutrition, 70, 439S-450S.
!��
�
135. Miambi, E., Guyot, J.-P. and Ampe, F. 2003. Identification, isolation and quantification of representative bacteria from fermented cassava dough using an integrated approach of culture-dependent and culture-independent methods. International Journal of
Food Microbiology, 82, 111-120.
136. Moat, A. G., Foster, J. W. and Spector, M. P. 2002. Fermentation pathways, Wiley-Liss, Inc.
137. Mohamed, A. I., Mebrahtu, T. and Rangappa, M. 1991. Nutrient composition and anti-nutritional factors in selected vegetable soybean (Glycine max [L.] Merr.). Plant Foods for
Human Nutrition, 41, 89-100.
138. Mohamed, A. I. and Rangappa, M. 1992. Nutrient composition and anti-nutritional factors in vegetable soybean: II. Oil, fatty acids, sterols, and lipoxygenase activity. Food
Chemistry, 44, 277-282.
139. Moriel, D. G., Rosini, R., Seib, K. L., Serino, L., Pizza, M. and Rappuoli, R. 2012. Escherichia coli: Great diversity around a common core. mBio, 3, 1-3.
140. Mosha, A. C. and Svanberg, U. (eds.) 1983. Preparation of weaning foods with high
nutrient density using flour of germinated cereals. United Nations University: Hunger, technology, and society.
141. Mostafa, M. M., Rahma, E. H. and Rady, A. H. 1987. Chemical and nutritional changes in soybean during germination. Food Chemistry, 23, 257-275.
142. Motarjemi, Y. 2002. Impact of small scale fermentation technology on food safety in developing countries. International Journal of Food Microbiology, 75, 213-229.
143. Mtimuni, B. M., Ngwira, M. M., Chilima, D. M. and Cusack, G. W. (eds.) 1994. Utilisation of legumes in the rural areas of Malawi, Lilongwe, Malawi: Bunda College of Agriculture.
144. Mugula, J. K., Nnko, S. A. M., Narvhus, J. A. and Sørhaug, T. 2003. Microbiological and fermentation characteristics of togwa, a Tanzanian fermented food. International Journal
of Food Microbiology, 80, 187-199.
145. Mukai, J., Tokuyama, E., Ishizaka, T., Okada, S. and Uchida, T. 2007. Inhibitory effect of aroma on the bitterness of branched-chain amino acid solutions. Chemical and
Pharmaceutical Bulletin (Tokyo), 55, 1581-1584.
146. Mukisa, I. M., Porcellato, D., Byaruhanga, Y. B., Muyanja, C. M. B. K., Rudi, K., Langsrud, T. and Narvhus, J. A. 2012. The dominant microbial community associated with fermentation of Obushera (sorghum and millet beverages) determined by culture-dependent and culture-independent methods. International Journal of Food Microbiology, 160, 1-10.

! �
�
147. Murray, J. M., Delahunty, C. M. and Baxter, I. A. 2001. Descriptive sensory analysis: Past, present and future. Food Research International, 34, 461-471.
148. Muyanja, C. M. B. K., Narvhus, J. A., Treimo, J. and Langsrud, T. 2003. Isolation, characterisation and identification of lactic acid bacteria from bushera: a Ugandan traditional fermented beverage. International Journal of Food Microbiology, 80, 201-210.
149. Muyzer, G. 1999. DGGE/TGGE a method for identifying genes from natural ecosystems. Current Opinion in Microbiology, 2, 317-322.
150. Muyzer, G. and Smalla, K. 1998. Application of denaturing gradient gel electrophoresis (DGGE) and temperature gradient gel electrophoresis (TGGE) in microbial ecology. Antonie van Leeuwenhoek, 73, 127-141.
151. Nam, Y.-D., Lee, S.-Y. and Lim, S.-I. 2012. Microbial community analysis of Korean soybean pastes by next-generation sequencing. International Journal of Food Microbiology,
155, 36-42.
152. Nam, Y.-D., Yi, S.-H. and Lim, S.-I. 2012. Bacterial diversity of cheonggukjang, a traditional Korean fermented food, analyzed by barcoded pyrosequencing. Food Control, 28,
135-142.
153. Nam, Y. D., Park, S. L. and Lim, S. I. 2012. Microbial composition of the Korean traditional food "kochujang" analyzed by a massive sequencing technique. Journal of Food
Science, 77, M250-256.
154. Nataro, J. P. and Kaper, J. B. 1998. Diarrheagenic Escherichia coli. Clinical
Microbiology Reviews, 11, 142-201.
155. National Soybean Research Laboratory. Available: http://www.nsrl.uiuc.edu/aboutsoy/images/processing_diagram.gif [Accessed 19 August 2014].
156. National Statistical Office and I.C.F Macro. 2011. Malawi Demographic and Health
Survey 2010. Zomba, Malawi & Calverton, Maryland, USA: NSO and ICF Macro.
157. National Statistical Office and O.R.C Macro. 2005. Malawi Demographic and
Healthy Survey Report, 2004. Zomba, Malawi & Calverton, Maryland, U.S.A: NSO and ORC Macro.
158. Ng'ong'ola-Manani, T. A., Mwangwela, A. M., Schüller, R. B., Østlie, H. M. and Wicklund, T. 2014. Sensory evaluation and consumer acceptance of naturally and lactic acid bacteria-fermented pastes of soybeans and soybean–maize blends. Food Science & Nutrition,
2, 114-131.
!!�
�
159. Nielsen, D. S., Hønholt, S., Tano-Debrah, K. and Jespersen, L. 2005. Yeast populations associated with Ghanaian cocoa fermentations analysed using denaturing gradient gel electrophoresis (DGGE). Yeast, 22, 271-284.
160. Nielsen, D. S., Teniola, O. D., Ban-Koffi, L., Owusu, M., Andersson, T. S. and Holzapfel, W. H. 2007. The microbiology of Ghanaian cocoa fermentations analysed using culture-dependent and culture-independent methods. International Journal of Food
Microbiology, 114, 168-186.
161. Nout, M. J. 1991. Ecology of accelerated natural lactic fermentation of sorghum-based infant food formulas. International Journal of Food Microbiology, 12, 217-224.
162. Nout, M. J. R. 1992. Applications of biotechnology to traditional fermented foods.
Washington D.C. .
163. Nout, M. J. R., Bakshi, D. and Sarkar, P. K. 1998. Microbiological safety of kinema, a fermented soya bean food. Food Control, 9, 357-362.
164. Nout, M. J. R. and Kiers, J. L. 2005. Tempe fermentation, innovation and functionality: update into the third millenium. Journal of Applied Microbiology, 98, 789-805.
165. Nout, M. J. R. and Motarjemi, Y. 1997. Assessment of fermentation as a household technology for improving food safety: A joint FAO/WHO workshop. Food Control, 8, 221-226.
166. Omafuvbe , B. O. 2008. Effect of temperature on biochemical changes induced by Bacillus subtilis (SDA3) during starter culture fermentation of soybean into condiment (Soy-Daddawa). American Journal of Food Technology, 3, 33-41.
167. Omafuvbe, B. O., Shonukan, O. O. and Abiose, S. H. 2000. Microbiological and biochemical changes in the traditional fermentation of soybean for ‘soy-daddawa’ — Nigerian food condiment. Food Microbiology, 17, 469-474.
168. Organization for Economic Co-Operation and Development, O. 2012. Revised
consensus document on compositional considerations for new varieties of soybean [Glycine
max (l.) Merr]: Key food and feed nutrients, anti-nutrients, toxicants and allergens. Paris.
169. Ouoba, L. I. I., Nyanga-Koumou, C. A. G., Parkouda, C., Sawadogo, H., Kobawila, S. C., Keleke, S., Diawara, B., Louembe, D. and Sutherland, J. P. 2010. Genotypic diversity of lactic acid bacteria isolated from African traditional alkaline-fermented foods. Journal of
Applied Microbiology, 108, 2019-2029.
170. Oyewole, O. B. 1997. Lactic fermented foods in Africa and their benefits. Food
Control, 8, 289-297.

!"�
�
171. Padgette, S. R., Taylor, N. B., Nida, D. L., Bailey, M. R., MacDonald, J., Holden, L. R. and Fuchs, R. L. 1996. The composition of glyphosate-tolerant soybean seeds is equivalent to that of conventional soybeans. The Journal of Nutrition, 126, 702-716.
172. Palacios, M. C., Haros, M., Rosell, C. M. and Sanz, Y. 2005. Characterization of an acid phosphatase from Lactobacillus pentosus: Regulation and biochemical properties. Journal of Applied Microbiology, 98, 229-237.
173. Papadopoulos, M. C. 1989. Effect of processing on high-protein feedstuffs: A review. Biological Wastes, 29, 123-138.
174. Parkouda, C., Nielsen, D. S., Azokpota, P., Ivette Irène Ouoba, L., Amoa-Awua, W. K., Thorsen, L., Hounhouigan, J. D., Jensen, J. S., Tano-Debrah, K., Diawara, B. and Jakobsen, M. 2009. The microbiology of alkaline-fermentation of indigenous seeds used as food condiments in Africa and Asia. Critical Reviews in Microbiology, 35, 139-156.
175. Paton, J. C. and Paton, A. W. 1998. Pathogenesis and diagnosis of shiga toxin-producing Escherichia coli infections. Clinical Microbiology Reviews, 11, 450-479.
176. Plaza, L., de Ancos, B. and Cano, P. 2003. Nutritional and health-related compounds in sprouts and seeds of soybean (Glycine max), wheat (Triticum aestivum.L) and alfalfa (Medicago sativa) treated by a new drying method. European Food Research and
Technology, 216, 138-144.
177. Praphailong, W. and Fleet, G. H. 1997. The effect of pH, sodium chloride, sucrose, sorbate and benzoate on the growth of food spoilage yeasts. Food Microbiology, 14, 459-468.
178. Qin, H., Yang, H., Qiao, Z., Gao, S. and Liu, Z. 2013. Identification and characterization of a Bacillus subtilis strain HB-1 isolated from Yandou, a fermented soybean food in China. Food Control, 31, 22-27.
179. Rackis, J. J., McGhee, J. E., Honig, D. H. and Booth, A. N. 1975. Processing soybeans into foods: Selected aspects of nutrition and flavor. Journal of the American Oil Chemists’
Society, 52, 249A-253A.
180. Reddy, N. R. and Pierson, M. D. 1994. Reduction in antinutritional and toxic components in plant foods by fermentation. Food Research International, 27, 281-290.
181. Redondo-Cuenca, A., Villanueva-Suárez, M. J., Rodríguez-Sevilla, M. D. and Mateos-Aparicio, I. 2007. Chemical composition and dietary fibre of yellow and green commercial soybeans (Glycine max). Food Chemistry, 101, 1216-1222.
182. Røssland, E., Langsrud, T. and Sørhaug, T. 2005. Influence of controlled lactic fermentation on growth and sporulation of Bacillus cereus in milk. International Journal of
Food Microbiology, 103, 69-77.

!#�
�
183. Sahlin, P. 1999. Fermentation as a method of food processing: Production of organic
acids, pH-development and microbial growth in fermenting cereals. Licentiate Thesis, Lund University.
184. Saldivar, X., Wang, Y.-J., Chen, P. and Hou, A. 2011. Changes in chemical composition during soybean seed development. Food Chemistry, 124, 1369-1375.
185. Sánchez, I., Palop, L. and Ballesteros, C. 2000. Biochemical characterization of lactic acid bacteria isolated from spontaneous fermentation of ‘Almagro’ eggplants. International
Journal of Food Microbiology, 59, 9-17.
186. Sanni, A. I. 1993. The need for process optimization of African fermented foods and beverages. International Journal of Food Microbiology, 18, 85-95.
187. Sarkar, P. K., Cook, P. E. and Owens, J. D. 1993. Bacillus fermentation of soybeans. World Journal of Microbiology and Biotechnology, 9, 295-299.
188. Sarkar, P. K., Hasenack, B. and Nout, M. J. R. 2002. Diversity and functionality of Bacillus and related genera isolated from spontaneously fermented soybeans (Indian Kinema) and locust beans (African Soumbala). International Journal of Food Microbiology, 77, 175-186.
189. Sarkar, P. K., Jones, L. J., Craven, G. S. and Somerset, S. M. 1997. Oligosaccharide profiles during kinema production. Letters in Applied Microbiology, 24 337 – 339.
190. Sarkar, P. K., Jones, L. J., Craven, G. S., Somerset, S. M. and Palmer, C. 1997. Amino acid profiles of kinema, a soybean-fermented food. Food Chemistry, 59, 69-75.
191. Sarkar, P. K., Jones, L. J., Gore, W., Craven, G. S. and Somerset, S. M. 1996. Changes in soya bean lipid profiles during kinema production. Journal of the Science of Food and
Agriculture, 71, 321-328.
192. Sarkar, P. K. and Tamang, J. P. 1994. The influence of process variables and inoculum composition on the sensory quality of kinema. Food Microbiology, 11, 317-325.
193. Sarkar, P. K. and Tamang, J. P. 1995. Changes in the microbial profile and proximate composition during natural fermentations of soybeans to produce kinema. Food
Microbiology, 12 317 – 325.
194. Sarkar, P. K., Tamang, J. P., Cook, P. E. and Owens, J. D. 1994. Kinema — a traditional soybean fermented food: proximate composition and microflora. Food
Microbiology, 11, 47-55.
195. Schilling, O., Frick, O., Herzberg, C., Ehrenreich, A., Heinzle, E., Wittmann, C. and Stülke, J. 2007. Transcriptional and metabolic responses of Bacillus subtilis to the availability of organic acids: Transcription regulation is important but not sufficient to account for metabolic adaptation. Applied and Environmental Microbiology, 73, 499-507.
"$�
�
196. Schraft, H. and Griffiths, M. W. 2006. Bacillus cereus gastroenteritis. Foodborne
Infections and Intoxications 3e. Elsevier Science.
197. Senesi, S. and Ghelardi, E. 2010. Production, secretion and biological activity of Bacillus cereus enterotoxins. Toxins, 2, 1690-1703.
198. Shalaby, A. R. 1996. Significance of biogenic amines to food safety and human health. Food Research International, 29, 675-690.
199. Sharma, S., Goyal, R. and Barwal, S. 2013. Domestic processing effects on physicochemical, nutritional and anti-nutritional attributes in soybean (Glycine max L. Merill). International Food Research Journal, 20, 3203-3209.
200. Shimizo, M. 1992. Purification and characterization of phytase from Bacillus subtilis
(natto) N-77. Bioscience, Biotechnology, and Biochemistry, 56, 1266-1269.
201. Shin, D. H. 2011. Utilization of soybean as food Stuffs in Korea, Shanghai, China, InTech. Available: http://www.intechopen.com/books/soybeanand-nutrition/utilization-of-soybean-as-food-stuffs-in-korea [Accessed 14 August 2014].
202. Shin, Z.-I., Yu, R., Park, S.-A., Chung, D. K., Ahn, C.-W., Nam, H.-S., Kim, K.-S. and Lee, H. J. 2001. His-His-Leu, an angiotensin I converting enzyme inhibitory peptide derived from Korean soybean paste, exerts antihypertensive activity in vivo. Journal of
Agricultural and Food Chemistry, 49, 3004-3009.
203. Shukla, S., Park, H.-K., Kim, J.-K. and Kim, M. 2010. Determination of biogenic amines in Korean traditional fermented soybean paste (Doenjang). Food and Chemical
Toxicology, 48, 1191-1195.
204. Siegel, A. S. and Fawcett, B. 1976. Food legume processing and utilization: (with
special emphasis on application in developing countries), Ottawa, Canada, International Development Research Centre.
205. Sindhu, S. C. and Khetarpaul, N. 2001. Probiotic fermentation of indigenous food mixture: Effect on antinutrients and digestibility of starch and protein. Journal of Food
Composition and Analysis, 14, 601-609.
206. Singh, S., Gamlath, S. and Wakeling, L. 2007. Nutritional aspects of food extrusion: a review. International Journal of Food Science & Technology, 42, 916-929.
207. Singh, U. and Singh, B. 1992. Tropical grain legumes as important human foods. Economic Botany, 46, 310-321.
208. Sonenshein, A. L. 2007. Control of key metabolic intersections in Bacillus subtilis. Nature Reviews Microbiology, 5, 917-927.
"��
�
209. Song, Y. S., Frias, J., Martinez-Villaluenga, C., Vidal-Valdeverde, C. and de Mejia, E. G. 2008. Immunoreactivity reduction of soybean meal by fermentation, effect on amino acid composition and antigenicity of commercial soy products. Food Chemistry, 108, 571-581.
210. Steinkraus, K. H. 1994. Nutritional significance of fermented foods. Food Research
International, 27, 259-267.
211. Steinkraus, K. H. 1997. Classification of fermented foods: worldwide review of household fermentation techniques. Food Control, 8, 311-317.
212. Steinkraus, K. H. 2002. Fermentations in world food processing. Comprehensive
Reviews in Food Science and Food Safety, 1, 23-32.
213. Stiles, M. E. and Holzapfel, W. H. 1997. Lactic acid bacteria of foods and their current taxonomy. International Journal of Food Microbiology, 36, 1-29.
214. Svanberg, U., Sjögren, E., Lorri, W., Svennerholm, A. M. and Kaijser, B. 1992. Inhibited growth of common enteropathogenic bacteria in lactic-fermented cereal gruels. World Journal of Microbiology and Biotechnology, 8, 601-606.
215. Tamang, J. P. and Nikkuni, S. 1996. Selection of starter cultures for the production of kinema, a fermented soybean food of the Himalaya. World Journal of Microbiology and
Biotechnology, 12, 629-635.
216. Tamang, J. P., Tamang, N., Thapa, S., Dewan, S., Tamang, B., Yonzan, H., Rai, A. K., Chettri, R., Chakrabarty, J. and Kharel, N. 2012. Microorganisms and nutritional value of ethnic fermented foods and alcoholic beverages of North East India. Indian Journal of
Traditional Knowledge, 11, 7-25.
217. Temmerman, R., Huys, G. and Swings, J. 2004. Identification of lactic acid bacteria: culture-dependent and culture-independent methods. Trends in Food Science & Technology,
15, 348-359.
218. Temple, L., Gibson, R. S. and Hotz, C. 2002. Use of soaking and enrichment for improving the content and bioavailability of calcium, iron, and zinc in complementary foods and diets of rural Malawian weanlings. Journal of Food Science, 67, 1926-1932.
219. Terlabie, N. N., Sakyi-Dawson, E. and Amoa-Awua, W. K. 2006. The comparative ability of four isolates of Bacillus subtilis to fermemt soybeans into dawadawa. International
Journal of Food Microbiology, 106 145 – 152.
220. Tinsley, R. L. 2009. Value chain analysis for soybeans in Malawi. Available: http://lamar.colostate.edu/~rtinsley/ValueChainAnalysisSoybeansMalawi.pdf [Accessed 11 August 2014].

"��
�
221. Torres-Penaranda, A. V., Reitmeier, C. A., Wilson, L. A., Fehr, W. R. and Narvel, J. M. 1998. Sensory characteristics of soymilk and tofu made from lipoxygenase-free and normal soybeans. Journal of Food Science, 63, 1084-1087.
222. Trugo, L. C., Donangelo, C. M., Trugo, N. M. F. and Bach Knudsen, K. E. 2000. Effect of heat treatment on nutritional quality of germinated legume seeds. Journal of
Agricultural and Food Chemistry, 48, 2082-2086.
223. United Nations Industrial Development Organization. 2003. Soya bean and its recipes,
Viena, Austria, United Nations Industrial Development Organization.
224. Urbano, G., López-Jurado, M., Aranda, P., Vidal-Valverde, C., Tenorio, E. and Porres, J. 2000. The role of phytic acid in legumes: antinutrient or beneficial function? Journal of
Physiology and Biochemistry, 56, 283-294.
225. Valyasevi, R. and Rolle, R. S. 2002. An overview of small-scale food fermentation technologies in developing countries with special reference to Thailand: scope for their improvement. International Journal of Food Microbiology, 75, 231-239.
226. Van Buren, J. P., Steinkraus, K. H., Hackler, L. R., El Rawi, I. and Hand, D. B. 1964. Heat effects on soymilk, indices of protein quality in dried soymilks. Journal of Agricultural
and Food Chemistry, 12, 524-528.
227. Vandamme, P., Pot, B., Gillis, M., de Vos, P., Kersters, K. and Swings, J. 1996. Polyphasic taxonomy, a consensus approach to bacterial systematics. Microbiological
Reviews, 60, 407-438.
228. Vasconcelos, I. M., Siebra, E. A., Maia, A. A. B., Moreira, R. A., Neto, A. F., Campelo, G. J. A. and Oliveira, J. T. A. 1997. Composition, toxic and antinutritional factors of newly developed cultivars of Brazilian soybean (Glycine max). Journal of the Science of
Food and Agriculture, 75, 419-426.
229. Vidal-Valverde, C., Frías, J. and Valverde, S. 1993. Changes in the carbohydrate composition of legumes after soaking and cooking. Journal of the American Dietetic
Association, 93, 547-550.
230. Visessanguan, W., Benjakul, S., Potachareon, W., Panya, A. and Riebroy, S. 2005. Accelerated proteolysis of soy proteins during fermentation of thua-nao inoculated with Bacillus subtilis. Journal of Food Biochemistry, 29, 349-366.
231. Vogel, R. F., Knorr, R., Müller, M. R. A., Steudel, U., Gänzle, M. G. and Ehrmann, M. A. 1999. Non-dairy lactic fermentations: The cereal world. Antonie van Leeuwenhoek, 76,
403-411.
232. Von Wright, A. and Axelsson, L. 2012. Lactic acid bacteria: An introduction. In:
Lahtinen, S., Ouwehand, A. C., Salminen, S. and von Wright, A. (eds.) Lactic acid bacteria:
Microbiological and functional aspects. 4th ed. Boca Raton, Florida: CRC Press

"��
�
233. Walker, A. F. and Kochhar, N. 1982. Effect of processing including domestic cooking on nutritional quality of legumes. Proceedings of the Nutrition Society, 41, 41-51.
234. Wong, H. C. and Chen, Y. L. 1988. Effects of lactic acid bacteria and organic acids on growth and germination of Bacillus cereus. Applied and Environmental Microbiology, 54,
2179-2184.
235. Wu, J., Zhang, J., Shi, P., Wu, R., Yue, X. and Zhang, H. 2013. Bacterial community involved in traditional fermented soybean paste dajiang made in northeast China. Annals of
Microbiology, 63, 1417-1421.
236. Yeudall, F., Gibson, R. S., Cullinan, T. R. and Mtimuni, B. 2005. Efficacy of a community-based dietary intervention to enhance micronutrient adequacy of high-phytate maize-based diets of rural Malawian children. Public Health Nutrition, 8, 826-836.
237. Yoon, J. H., Thompson, L. U. and Jenkins, D. J. 1983. The effect of phytic acid on in vitro rate of starch digestibility and blood glucose response. The American Journal of Clinical
Nutrition, 38, 835-842.
238. Yoshikawa, Y., Chen, P., Zhang, B., Scaboo, A. and Orazaly, M. 2014. Evaluation of seed chemical quality traits and sensory properties of natto soybean. Food Chemistry, 153,
186-192.
239. Zhang, J.-H., Tatsumi, E., Fan, J.-F. and Li, L.-T. 2007. Chemical components of Aspergillus-type Douchi, a Chinese traditional fermented soybean product, change during the fermentation process. International Journal of Food Science & Technology, 42, 263-268.
240. Zhao, G. Q., Zhang, Y., Hoon, M. A., Chandrashekar, J., Erlenbach, I. E., Ryba, N. J. P. and Zuker, C. S. 2003. The receptors for mammalian sweet and umami taste. Cell, 115,
255–266.
241. Zhao, J., Dai, X., Liu, X., Chen, H., Tang, J., Zhang, H. and Chen, W. 2009. Changes in microbial community during Chinese traditional soybean paste fermentation. International
Journal of Food Science & Technology, 44, 2526-2530.
242. Østlie, H. M., Eliassen, L., Florvaag, A. and Skeive, S. 2004. Phenotypic and PCR-based characterization of the microflora in Norvegia cheese during ripening. International
Journal of Food Microbiology, 94, 287 -299.
�
�
�
�
"��
�
8 ENCLOSED PAPERS I-IV

�
�
�
�
�
�
�
�
�
�
�

ORIGINAL RESEARCH
Metabolite changes during natural and lactic acid bacteriafermentations in pastes of soybeans and soybean–maizeblends
Tinna Austen Ng’ong’ola-Manani1,2, Hilde Marit Østlie1, Agnes Mbachi Mwangwela2 &Trude Wicklund1
1Department of Chemistry, Biotechnology and Food Science, Norwegian University of Life Sciences, P.O. Box 5003, 1430 !As, Norway2Department of Food Science and Technology, Lilongwe University of Agriculture and Natural Resources, Bunda College Campus, P.O. Box 219,
Lilongwe, Malawi
Keywords
Amino acid, fermentation, lactic acid
bacteria, phytic acid, protein, soybean paste
Correspondence
Tinna A. Ng’ong’ola-Manani, Department of
Food Science and Technology, Lilongwe
University of Agriculture and Natural
Resources, Bunda College Campus, P.O. Box
219, Lilongwe, Malawi.
Tel: +265 1 277 260/+265 1 277 222;
Fax: +265 1 277 364;
E-mail: [email protected]
Funding Information
We would like to acknowledge financial
support from the Norwegian Programme for
Development, Research and Education
(NUFU) and Norwegian State Education Fund
(L!anekassen). This research was also partly
financed by the International Foundation for
Science (IFS) through grant no. E/4889-1
awarded to Tinna A. Ng’ong’ola-Manani.
Received: 1 June 2014; Revised: 7 August
2014; Accepted: 7 August 2014
doi: 10.1002/fsn3.171
Abstract
The effect of natural and lactic acid bacteria (LAB) fermentation processes on
metabolite changes in pastes of soybeans and soybean–maize blends was stud-
ied. Pastes composed of 100% soybeans, 90% soybeans and 10% maize, and
75% soybeans and 25% maize were naturally fermented (NFP), and were fer-
mented by lactic acid bacteria (LFP). LAB fermentation processes were facili-
tated through back-slopping using a traditional fermented gruel, thobwa as an
inoculum. Naturally fermented pastes were designated 100S, 90S, and 75S, while
LFP were designated 100SBS, 90SBS, and 75SBS. All samples, except 75SBS,
showed highest increase in soluble protein content at 48 h and this was highest
in 100S (49%) followed by 90SBS (15%), while increases in 100SBS, 90S, and
75S were about 12%. Significant (P < 0.05) increases in total amino acids
throughout fermentation were attributed to cysteine in 100S and 90S; and
methionine in 100S and 90SBS. A 3.2% increase in sum of total amino acids
was observed in 75SBS at 72 h, while decreases up to 7.4% in 100SBS at 48 and
72 h, 6.8% in 100S at 48 h and 4.7% in 75S at 72 h were observed. Increases in
free amino acids throughout fermentation were observed in glutamate (NFP
and 75SBS), GABA and alanine (LFP). Lactic acid was 2.5- to 3.5-fold higher in
LFP than in NFP, and other organic acids detected were acetate and succinate.
Maltose levels were the highest among the reducing sugars and were two to
four times higher in LFP than in NFP at the beginning of the fermentation, but
at 72 h, only fructose levels were significantly (P < 0.05) higher in LFP than in
NFP. Enzyme activities were higher in LFP at 0 h, but at 72 h, the enzyme
activities were higher in NFP. Both fermentation processes improved nutritional
quality through increased protein and amino acid solubility and degradation of
phytic acid (85% in NFP and 49% in LFP by 72 h).
Introduction
Legumes, cereals, and their blends remain important in
the diets of many people in developing countries.
Legumes are the main source of protein because animal
proteins are expensive. Soybeans contain up to 40% pro-
tein (Redondo-Cuenca et al. 2007) and when consumed
together with maize, they provide a high-quality protein
diet comparable to animal protein (Asgar et al. 2010).
Soybeans and maize complement each other in terms of
limiting amino acids. Cereals are deficient in lysine, but
are rich in cysteine and methionine, whereas legumes are
rich in lysine, but deficient in the sulfur-containing amino
acids (Palanisamy et al. 2012). Therefore, by combining
cereals with legumes, the overall protein quality of the
diet is improved.
However, the biological utilization of nutrients from
legumes is affected by the presence of antinutritional
ª 2014 The Authors. Food Science & Nutrition published by Wiley Periodicals, Inc. This is an open access article under the terms of
the Creative Commons Attribution License, which permits use, distribution and reproduction in any medium,
provided the original work is properly cited.
1

factors. Cereals, legumes, and their blends contain phytic
acid, trypsin inhibitors, polyphenols, and flatulence caus-
ing oligosaccharides such as raffinose and stachyose (Mu-
limani and Devendra 1998; Sindhu and Khetarpaul 2001;
Yoon and Hwang 2008). Trypsin inhibitor reduces digest-
ibility of proteins by inhibiting protease activity of trypsin
enzyme (Sindhu and Khetarpaul 2001), while a-galacto-
sides (raffinose and stacchyose) are broken down by
intestinal anaerobic microorganisms causing flatulence
(Vidal-Valverde et al. 1993). Phytic acid forms complexes
with proteins and minerals such as calcium, iron, magne-
sium, and zinc reducing their biological availability (Yoon
et al. 1983; Chitra et al. 1996; Urbano et al. 2000). The
presence of antinutritional factors along with disagreeable
beany flavor has limited the consumption of soybean as a
raw material (Wang et al. 2003). Several processing meth-
ods including fermentation reduce levels of antinutritional
factors and hence they improve the nutritive value of pro-
cessed foods (Golbitz 1995; Chitra et al. 1996; Wang and
Murphy 1996; Palanisamy et al. 2012). Fermentation also
improves flavors and textures of legumes (Deshpande and
Salunkhe 2000) and other fermented products in general.
In Malawi, utilization of soybeans is limited to maize–
soybean composite flour locally known as likuni phala
which is used as a weaning food (Kalimbira et al. 2004;
Maleta 2006). In an effort to increase utilization and con-
sumption of soybeans by all age groups, solid state fer-
mented pastes of soybeans and soybean–maize blends to
be used as a side dish or meat alternative were developed
(Ng’ong’ola-Manani et al. 2014). Many studies on solid
state fermentation of soybeans and legumes have focused
on natural fermentation which favors growth of Bacillus
subtilis or molds. Bacillus-fermented soybean products
include soy-dawadawa (Dakwa et al. 2005), Nepalese
kinema (Sarkar and Tamang 1995), Japanese natto, Thai
thua-nao (Dajanta et al. 2012), and Korean doenjang
(Kim et al. 2010). The main metabolic activity of B. sub-
tilis is proteolysis of proteins into amino acids and subse-
quent production of ammonia (Sarkar and Tamang 1995;
Dakwa et al. 2005). High amount of ammonia in the fer-
mented product results in a strong odor which some peo-
ple find objectionable (Allagheny et al. 1996; Parkouda
et al. 2009). On the other hand, lactic acid fermentation
processes improve texture, flavor, and shelf life of tradi-
tional foods (Steinkraus 1997).
Cereal gruels such as ogi, koko, kenkey, and mahewu
made from maize and/or sorghum (Sanni 1993), bushera
from sorghum and millet (Muyanja et al. 2003), ben-
saalga from pearl millet (Songr"e-Ouattara et al. 2008),
and togwa from cassava, maize, sorghum, millet, or their
blends (Mugula et al. 2003) are fermented by LAB. Like
B. subtilis, some LAB degrade antinutritional factors like
trypsin inhibitor, phytic acid, raffinose, and stachyose
(Holzapfel 1997, 2002; Sindhu and Khetarpaul 2001). An
additional advantage of lactic acid fermentation is the
possibility of involvement of LAB with potential probiotic
characteristics (Sindhu and Khetarpaul 2001) in addition
to increased safety of the product. In this study, thobwa, a
Malawian fermented cereal gruel prepared from maize
flour and cofermented with malt flour from finger millet
was used as a back-slopping material to facilitate LAB
fermentation processes in LAB-fermented pastes (LFP).
Lactic acid bacteria (LAB)-fermented pastes were char-
acterized by brown color, sourness, bitterness, saltiness,
umami, burnt roasted soybean aroma, and maize aroma
(Ng’ong’ola-Manani et al. 2014). Sensory properties that
characterized naturally fermented pastes included higher
pH, yellow color, fried egg-like appearance and aroma,
sweetness, softness, roasted soybean aroma, rancid odor,
and raw soybean odor (Ng’ong’ola-Manani et al. 2014).
There was consumer segmentation in preference patterns
of the fermented pastes and liking was biased toward
naturally fermented pastes (Ng’ong’ola-Manani et al.
2014).
The fermented pastes were developed to serve as major
sources of protein in maize-based diets, and a report on
proximate composition of the pastes would give impor-
tant nutrition information. Therefore, this study aimed at
reporting and comparing metabolites and metabolite
changes in pastes of soybeans and soybean–maize blends
fermented naturally and by LAB. Particularly, changes in
proteins, amino acids, organic acids, sugars, antinutritional
factors, and enzyme activities during fermentation were
investigated.
Materials and Methods
Preparation of pastes of soybeans and
soybean–maize blends
Pastes of soybeans and soybean–maize blends were pre-
pared in the laboratory according to Ng’ong’ola-Manani
et al. (2014). Portions of 500 g pastes of soybeans and
soybean–maize blends were naturally fermented or LAB
fermented through back-slopping using thobwa. Thobwa
was produced by making maize porridge containing 15%
(w/v) maize flour and 80% water according to the proto-
col for togwa processed in the southern part of Tanzania
(Kitabatake et al. 2003). The porridge was cooled to
about 50–60°C before the addition of finger millet (Eleu-
sine coracana) malt flour (5%, w/v). The porridge was left
to ferment naturally at room temperature (23–28°C) for
18 h before being used as inocula in back-slopped sam-
ples. The quality of the thobwa was determined through
monitoring continuous pH reduction during 18 h of
thobwa fermentation. The LFP were back slopped with
2 ª 2014 The Authors. Food Science & Nutrition published by Wiley Periodicals, Inc.
Chemical Changes During Fermentation of Soybeans T. A. Ng’ong’ola-Manani et al.

10% (v/w) of the thobwa. The pH of the thobwa was
around 4.5 with a LAB population of 108 cfu/mL.
Naturally fermented pastes (NFP) were designated as
100S, 90S, and 75S according to 100%, 90%, and 75%
soybean composition in the pastes, the remaining propor-
tions being maize. Similarly, back-slopped LFP were des-
ignated as 100SBS, 90SBS, and 75SBS. All treatments were
fermented at 30°C for 72 h. The fermenting pastes were
sampled at 0, 24, 48, and 72 h and samples were frozen
at !20°C until analysis. Analyses were made from three
independent experiments except in amino acids, organic
acids, and sugars in which analyses were made from two
experiments.
pH, titratable acidity, moisture content, and
protein determination
AOAC (1990) methods were used to determine moisture
content, pH, and titratable acidity. The pH was measured
using a pH meter (WTW pH 525; D. Jurgens and Co.,
Bremen, Germany) fitted with a glass electrode (WTW
SenTix 97T). Total proteins and water-soluble proteins
were analyzed as total nitrogen and water soluble nitro-
gen, respectively by the Kjeldahl method according to
Thiex et al. (2002). For total protein, samples were
ground in a mortar with a pestle until they turned fine
and homogenous, and 0.5 g of the sample was transferred
into a digestion flask where 0.8 g CuSO4, 7.0 g of K2SO4,
and 15 mL H2SO4 (98%) were added. The digestion was
done on a Labconco microKjeldahl digestor (Model
60300-00; Kansas City) for 3 h. The digested material was
distilled using a Kjeltec System 1002 distillation unit
(Tecator, Hoganas, Sweden) with 4% boric acid contain-
ing a mixed indicator in the receiving flask. Samples for
determination of water soluble nitrogen were prepared
according to Sarkar and Tamang (1995) by homogenizing
2.0 g of sample with 100 mL of distilled water for 2 min
in a Star Lab blender LB 400 (VWR, Fontenay Sous Bois
Cedex, France) and centrifuging at 3500g for 10 min at
25°C. The supernatant was filtered through a Whatman
No. 2 filter paper and the nitrogen content of a known
volume was determined by the Kjeldahl method. A con-
version factor of 6.25 was used to obtain percentage of
protein (Dajanta et al. 2012).
Enzyme activities
Preparation of enzyme extract
Enzyme extracts of the fermenting pastes were prepared
according to Dakwa et al. (2005) and Terlabie et al.
(2006). Five grams of the sample was ground in 50 mL of
0.1 mol/L potassium hydrogen phosphate (Merck, KGaA,
Damstadt, Germany) buffer, pH 6.5 as the extracting
buffer. The suspension was washed with petroleum ether
(Sigma-Aldrich, St Louis, MO) to extract the oil. The
sample was centrifuged (Kokusan H-201 series; Kokusan
Enshinki Co. Ltd., Tokyo, Japan) at 3500g for 5 min at
4°C. The supernatant constituting the crude enzyme was
stored at !20°C until analysis.
Determination of a-amylase and a-galactosidase
activities in fermenting pastes
Alpha-amylase activities were determined by the assay
method of Bernfeld (1955). Two milliliters of the enzyme
extract was mixed with 1 mL of 1% (w/v) starch (Merck)
solution and was incubated for 1 h at 40°C. The reaction
was stopped by adding 3 mL of dinitrosalisylic acid
reagent (DNS; Alfa Aesar, Karlsruhe, Germany) before
heating for 5 min. After cooling, the sample mixture was
diluted with 18 mL of distilled water and the optical
density was measured at 550 nm in a spectrophotometer
(Jenway 6300; Bibby Scientific, Staffordshire, UK). A blank
was prepared by adding DNS before the starch solution.
The amount of reducing sugars formed was calculated
from a standard curve prepared with known concentra-
tions of maltose (Merck) according to Bernfeld (1955).
Alpha-galactosidase activities were determined accord-
ing to Odunfa (1983). About 2 mL of the enzyme extract
was mixed with 1 mL of 1% (w/v) melibiose monohydrate
(Merck) solution before incubation for 2 h at 40°C. The
reaction was stopped by adding 3 mL of DNS (Alfa Aesar)
before boiling in a water bath for 5 min. The subsequent
steps proceeded as in alpha-amylase determination.
Amino acids
Total amino acids
Total amino acids were determined according to the
method of Official Journal of the European Communities
(1998). Amino acids were extracted from a weighed
(116.5–190.2 mg) well homogenized freeze-dried sample.
A closed hydrolysis was done to extract the amino acids,
and the procedure for hydrolysis was amino acid depen-
dent. For instance, cysteine and methionine were oxidized
to cysteic acid and methionine sulfone, respectively, prior
to hydrolysis. Asparagine and glutamine were converted
to aspartic acid and glutamic acid before hydrolysis, while
tyrosine was analyzed separately from the rest of the
amino acids using basic hydrolysis and high-performance
liquid chromatography (HPLC)/fluorescence detection.
Different optimal times for hydrolysis for each amino
acid were used. The pH of the hydrolysates was adjusted
to 2.20 using an autotitrator. The hydrolysates were then
ª 2014 The Authors. Food Science & Nutrition published by Wiley Periodicals, Inc. 3
T. A. Ng’ong’ola-Manani et al. Chemical Changes During Fermentation of Soybeans

run on a Biochrom 30 amino acid analyzer (Biochrom
Co, Cambridge, UK), equipped with a sodium high-per-
formance oxidized column (Biochrom). The UV-signals
were read after postcolumn derivatization with ninhydrin
at 570 and 440 nm using Chromeleon software (Dionex,
Sunnyvale, CA). Cysteic acid, methionine sulfone, lysine,
threonine, alanine, arginine, aspartic acid, glutamic acid,
glycine, histidine, isoleucine, leucine, phenylalanine, pro-
line, serine, tyrosine, and valine standards were used in
the analysis and were obtained from Sigma-Aldrich.
Free amino acids
Free amino acids were extracted from a 1.00 g freeze-
dried homogenized sample which was weighed into a
15-mL centrifuge tube. To each sample, 5 mL of 0.1 mol/L
HCl standard solution containing 0.4 lmol/mL L-norva-
line and piperidine-4-carboxylic acid was added. The
sample and the standard solution were thoroughly mixed
on a vortex. The sample mixture was put on ultra sound
water bath (Branson 2510, Soest, Netherland) at room
temperature for 30 min. Sonication was followed by
centrifugation at 3000g (Beckman J2-MC; GMI Inc, Ram-
sey, MN) for 40 min at 4°C. From the supernatant, 1 mL
of extract was transferred into a 2-mL Eppendorf tube to
which 1 mL of 4% trichloroacetic acid (Merck) was
added. The rest of the procedure was done according to
B€utikofer and Ard€o (1999).
Organic acids and sugars
To 1.0 g of freeze-dried homogenized sample, 5 mL of
milliQ water was added and mixed thoroughly. Then
1.00 g of the sample mixture was transferred to another
tube to which 2.5 mL of milliQ water, followed by
0.2 mL of 0.5 mol/L H2SO4 (Merck) and 8 mL of aceto-
nitrile (Merck) were added. Mixing was done for 30 min
on a MultiRS-60 BIOSAN rotator (Nerlien, Oslo, Nor-
way). The rest of the procedure was done according to
Narvhus et al. (1998). Organic acids, glucose, fructose,
and maltose levels were analyzed by HPLC. The organic
acids were detected with a UV detector set at 210 nm and
the sugars were determined using a refractive index detec-
tor (Perkin Elmer series 200, Norwalk, CT). Organic acids
were identified based on comparison of their retention
times with standard solutions of citrate, orotic acid, pyru-
vate, succinate, DL-lactate, uric acid, DL-pyroglutamate,
propionate, a-ketoglutaric acid, oxalic acid, acetate, and
formate (Merck). Identification of sugars was also based
on retention times of standard solutions of maltose,
lactose, galactose, fructose, and glucose (Merck). Quantifi-
cation was done using external calibration curves of
mixed standards in deionized water.
Antinutritional factors (phytic acid and
trypsin inhibitor)
Phytic acid was extracted from 0.5 g samples in 25 mL of
0.2 N HCl for 3 h with continuous shaking, according to
Erdal et al. (2002). The extracts were centrifuged at 3500g
for 10 min at 4°C and the supernatants were used for
analysis. The extracted phytate was assayed according to
the method described by Haug and Lantzsch (1983).
Trypsin inhibitors were measured by the method of Kak-
ade et al. (1974) as modified by Hamerstrand et al.
(1980).
Statistical analysis
Analysis of variance (ANOVA) at P = 0.05 was performed
in SPSS 15.0 (SPSS Inc., Chicago, IL) and least squares
difference test was used to separate means.
Results and Discussion
Proximate composition
The initial pH and titratable acidity were almost the same
for all samples, despite LFP being inoculated with a LAB-
fermented product (Table 1). The pH for LFP decreased
faster than for NFP. The relatively fast drop in pH as in
LFP to about 4.0 at 24 h would be desirable to prevent
growth of pathogens and spoilage bacteria. The slow drop
in pH in NFP indicated cofermentation by LAB and other
microorganisms. Nevertheless, the gradual decline in pH
in NFP suggested a bias toward LAB fermentation as
opposed to alkaline fermentation, reported in natural fer-
mentation processes of soybeans (Sarkar et al. 1994, 2002;
Dakwa et al. 2005; Parkouda et al. 2009; Dajanta et al.
2011). The lactic acid fermentation could be attributed to
limited oxygen during fermentation in the jars which
could have favored growth of microaerophiles while limit-
ing growth of spore formers, eventually reducing ammo-
nia production with no increase in pH (Allagheny et al.
1996; Parkouda et al. 2009). Significant increases in the
amount of titratable acidity were observed in all samples
(except in 100S) from 0 to 24 h (Table 1) and thereafter
continuous increases throughout fermentation were
observed, although some of them were not significant.
Continuous increases in titratable acidity in alkaline fer-
mentation processes have been reported previously
(Sarkar and Tamang 1995).
Moisture content was not affected by fermentation time
except in 100S where significant differences were observed
between early stages and late stages of fermentation. In
90SBS, differences were observed between 0 and 48 h
(Table 1). During fermentation of kinema, no appreciable
4 ª 2014 The Authors. Food Science & Nutrition published by Wiley Periodicals, Inc.
Chemical Changes During Fermentation of Soybeans T. A. Ng’ong’ola-Manani et al.
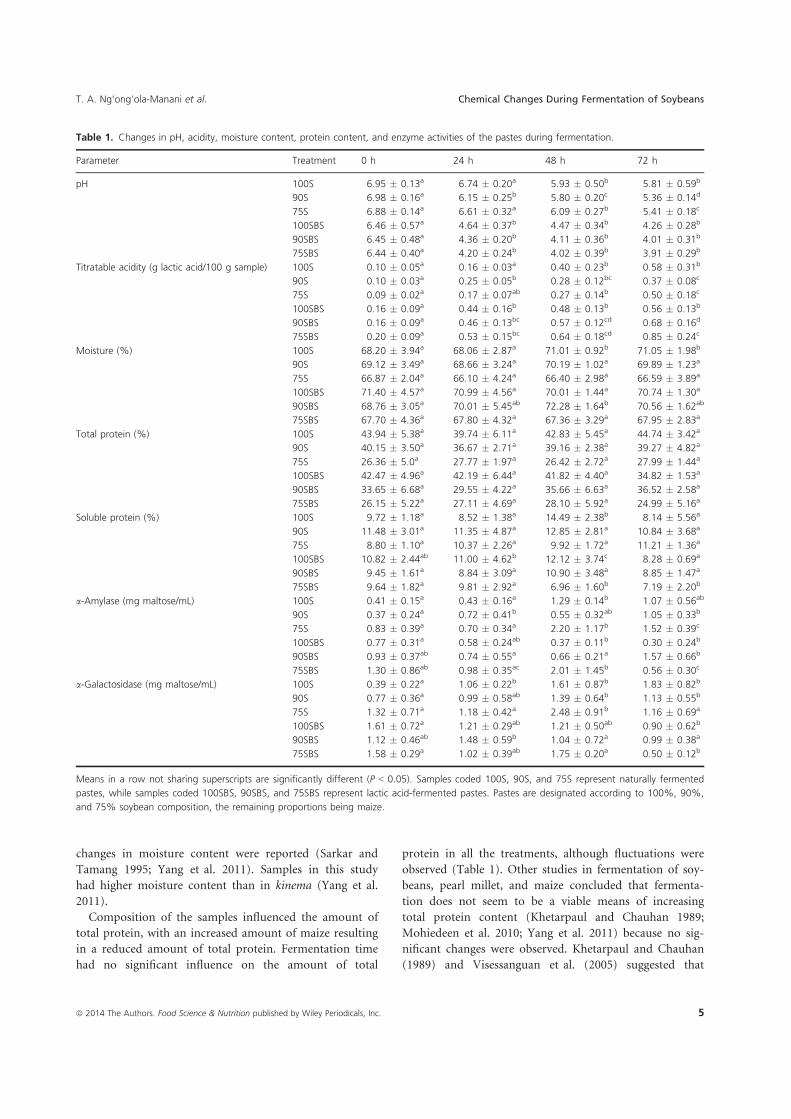
changes in moisture content were reported (Sarkar and
Tamang 1995; Yang et al. 2011). Samples in this study
had higher moisture content than in kinema (Yang et al.
2011).
Composition of the samples influenced the amount of
total protein, with an increased amount of maize resulting
in a reduced amount of total protein. Fermentation time
had no significant influence on the amount of total
protein in all the treatments, although fluctuations were
observed (Table 1). Other studies in fermentation of soy-
beans, pearl millet, and maize concluded that fermenta-
tion does not seem to be a viable means of increasing
total protein content (Khetarpaul and Chauhan 1989;
Mohiedeen et al. 2010; Yang et al. 2011) because no sig-
nificant changes were observed. Khetarpaul and Chauhan
(1989) and Visessanguan et al. (2005) suggested that
Table 1. Changes in pH, acidity, moisture content, protein content, and enzyme activities of the pastes during fermentation.
Parameter Treatment 0 h 24 h 48 h 72 h
pH 100S 6.95 " 0.13a 6.74 " 0.20a 5.93 " 0.50b 5.81 " 0.59b
90S 6.98 " 0.16a 6.15 " 0.25b 5.80 " 0.20c 5.36 " 0.14d
75S 6.88 " 0.14a 6.61 " 0.32a 6.09 " 0.27b 5.41 " 0.18c
100SBS 6.46 " 0.57a 4.64 " 0.37b 4.47 " 0.34b 4.26 " 0.28b
90SBS 6.45 " 0.48a 4.36 " 0.20b 4.11 " 0.36b 4.01 " 0.31b
75SBS 6.44 " 0.40a 4.20 " 0.24b 4.02 " 0.39b 3.91 " 0.29b
Titratable acidity (g lactic acid/100 g sample) 100S 0.10 " 0.05a 0.16 " 0.03a 0.40 " 0.23b 0.58 " 0.31b
90S 0.10 " 0.03a 0.25 " 0.05b 0.28 " 0.12bc 0.37 " 0.08c
75S 0.09 " 0.02a 0.17 " 0.07ab 0.27 " 0.14b 0.50 " 0.18c
100SBS 0.16 " 0.09a 0.44 " 0.16b 0.48 " 0.13b 0.56 " 0.13b
90SBS 0.16 " 0.09a 0.46 " 0.13bc 0.57 " 0.12cd 0.68 " 0.16d
75SBS 0.20 " 0.09a 0.53 " 0.15bc 0.64 " 0.18cd 0.85 " 0.24c
Moisture (%) 100S 68.20 " 3.94a 68.06 " 2.87a 71.01 " 0.92b 71.05 " 1.98b
90S 69.12 " 3.49a 68.66 " 3.24a 70.19 " 1.02a 69.89 " 1.23a
75S 66.87 " 2.04a 66.10 " 4.24a 66.40 " 2.98a 66.59 " 3.89a
100SBS 71.40 " 4.57a 70.99 " 4.56a 70.01 " 1.44a 70.74 " 1.30a
90SBS 68.76 " 3.05a 70.01 " 5.45ab 72.28 " 1.64b 70.56 " 1.62ab
75SBS 67.70 " 4.36a 67.80 " 4.32a 67.36 " 3.29a 67.95 " 2.83a
Total protein (%) 100S 43.94 " 5.38a 39.74 " 6.11a 42.83 " 5.45a 44.74 " 3.42a
90S 40.15 " 3.50a 36.67 " 2.71a 39.16 " 2.38a 39.27 " 4.82a
75S 26.36 " 5.0a 27.77 " 1.97a 26.42 " 2.72a 27.99 " 1.44a
100SBS 42.47 " 4.96a 42.19 " 6.44a 41.82 " 4.40a 34.82 " 1.53a
90SBS 33.65 " 6.68a 29.55 " 4.22a 35.66 " 6.63a 36.52 " 2.58a
75SBS 26.15 " 5.22a 27.11 " 4.69a 28.10 " 5.92a 24.99 " 5.16a
Soluble protein (%) 100S 9.72 " 1.18a 8.52 " 1.38a 14.49 " 2.38b 8.14 " 5.56a
90S 11.48 " 3.01a 11.35 " 4.87a 12.85 " 2.81a 10.84 " 3.68a
75S 8.80 " 1.10a 10.37 " 2.26a 9.92 " 1.72a 11.21 " 1.36a
100SBS 10.82 " 2.44ab 11.00 " 4.62b 12.12 " 3.74c 8.28 " 0.69a
90SBS 9.45 " 1.61a 8.84 " 3.09a 10.90 " 3.48a 8.85 " 1.47a
75SBS 9.64 " 1.82a 9.81 " 2.92a 6.96 " 1.60b 7.19 " 2.20b
a-Amylase (mg maltose/mL) 100S 0.41 " 0.15a 0.43 " 0.16a 1.29 " 0.14b 1.07 " 0.56ab
90S 0.37 " 0.24a 0.72 " 0.41b 0.55 " 0.32ab 1.05 " 0.33b
75S 0.83 " 0.39a 0.70 " 0.34a 2.20 " 1.17b 1.52 " 0.39c
100SBS 0.77 " 0.31a 0.58 " 0.24ab 0.37 " 0.11b 0.30 " 0.24b
90SBS 0.93 " 0.37ab 0.74 " 0.55a 0.66 " 0.21a 1.57 " 0.66b
75SBS 1.30 " 0.86ab 0.98 " 0.35ac 2.01 " 1.45b 0.56 " 0.30c
a-Galactosidase (mg maltose/mL) 100S 0.39 " 0.22a 1.06 " 0.22b 1.61 " 0.87b 1.83 " 0.82b
90S 0.77 " 0.36a 0.99 " 0.58ab 1.39 " 0.64b 1.13 " 0.55b
75S 1.32 " 0.71a 1.18 " 0.42a 2.48 " 0.91b 1.16 " 0.69a
100SBS 1.61 " 0.72a 1.21 " 0.29ab 1.21 " 0.50ab 0.90 " 0.62b
90SBS 1.12 " 0.46ab 1.48 " 0.59b 1.04 " 0.72a 0.99 " 0.38a
75SBS 1.58 " 0.29a 1.02 " 0.39ab 1.75 " 0.20a 0.50 " 0.12b
Means in a row not sharing superscripts are significantly different (P < 0.05). Samples coded 100S, 90S, and 75S represent naturally fermented
pastes, while samples coded 100SBS, 90SBS, and 75SBS represent lactic acid-fermented pastes. Pastes are designated according to 100%, 90%,
and 75% soybean composition, the remaining proportions being maize.
ª 2014 The Authors. Food Science & Nutrition published by Wiley Periodicals, Inc. 5
T. A. Ng’ong’ola-Manani et al. Chemical Changes During Fermentation of Soybeans
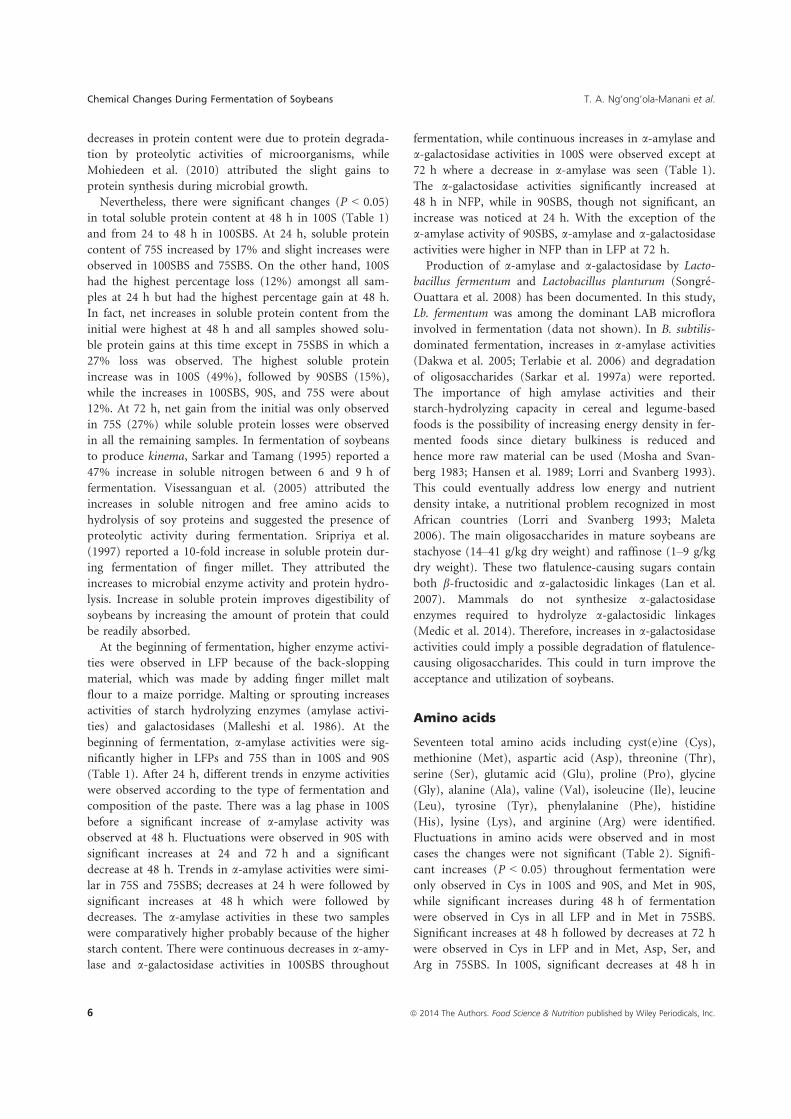
decreases in protein content were due to protein degrada-
tion by proteolytic activities of microorganisms, while
Mohiedeen et al. (2010) attributed the slight gains to
protein synthesis during microbial growth.
Nevertheless, there were significant changes (P < 0.05)
in total soluble protein content at 48 h in 100S (Table 1)
and from 24 to 48 h in 100SBS. At 24 h, soluble protein
content of 75S increased by 17% and slight increases were
observed in 100SBS and 75SBS. On the other hand, 100S
had the highest percentage loss (12%) amongst all sam-
ples at 24 h but had the highest percentage gain at 48 h.
In fact, net increases in soluble protein content from the
initial were highest at 48 h and all samples showed solu-
ble protein gains at this time except in 75SBS in which a
27% loss was observed. The highest soluble protein
increase was in 100S (49%), followed by 90SBS (15%),
while the increases in 100SBS, 90S, and 75S were about
12%. At 72 h, net gain from the initial was only observed
in 75S (27%) while soluble protein losses were observed
in all the remaining samples. In fermentation of soybeans
to produce kinema, Sarkar and Tamang (1995) reported a
47% increase in soluble nitrogen between 6 and 9 h of
fermentation. Visessanguan et al. (2005) attributed the
increases in soluble nitrogen and free amino acids to
hydrolysis of soy proteins and suggested the presence of
proteolytic activity during fermentation. Sripriya et al.
(1997) reported a 10-fold increase in soluble protein dur-
ing fermentation of finger millet. They attributed the
increases to microbial enzyme activity and protein hydro-
lysis. Increase in soluble protein improves digestibility of
soybeans by increasing the amount of protein that could
be readily absorbed.
At the beginning of fermentation, higher enzyme activi-
ties were observed in LFP because of the back-slopping
material, which was made by adding finger millet malt
flour to a maize porridge. Malting or sprouting increases
activities of starch hydrolyzing enzymes (amylase activi-
ties) and galactosidases (Malleshi et al. 1986). At the
beginning of fermentation, a-amylase activities were sig-
nificantly higher in LFPs and 75S than in 100S and 90S
(Table 1). After 24 h, different trends in enzyme activities
were observed according to the type of fermentation and
composition of the paste. There was a lag phase in 100S
before a significant increase of a-amylase activity was
observed at 48 h. Fluctuations were observed in 90S with
significant increases at 24 and 72 h and a significant
decrease at 48 h. Trends in a-amylase activities were simi-
lar in 75S and 75SBS; decreases at 24 h were followed by
significant increases at 48 h which were followed by
decreases. The a-amylase activities in these two samples
were comparatively higher probably because of the higher
starch content. There were continuous decreases in a-amy-
lase and a-galactosidase activities in 100SBS throughout
fermentation, while continuous increases in a-amylase and
a-galactosidase activities in 100S were observed except at
72 h where a decrease in a-amylase was seen (Table 1).
The a-galactosidase activities significantly increased at
48 h in NFP, while in 90SBS, though not significant, an
increase was noticed at 24 h. With the exception of the
a-amylase activity of 90SBS, a-amylase and a-galactosidase
activities were higher in NFP than in LFP at 72 h.
Production of a-amylase and a-galactosidase by Lacto-
bacillus fermentum and Lactobacillus planturum (Songr"e-
Ouattara et al. 2008) has been documented. In this study,
Lb. fermentum was among the dominant LAB microflora
involved in fermentation (data not shown). In B. subtilis-
dominated fermentation, increases in a-amylase activities
(Dakwa et al. 2005; Terlabie et al. 2006) and degradation
of oligosaccharides (Sarkar et al. 1997a) were reported.
The importance of high amylase activities and their
starch-hydrolyzing capacity in cereal and legume-based
foods is the possibility of increasing energy density in fer-
mented foods since dietary bulkiness is reduced and
hence more raw material can be used (Mosha and Svan-
berg 1983; Hansen et al. 1989; Lorri and Svanberg 1993).
This could eventually address low energy and nutrient
density intake, a nutritional problem recognized in most
African countries (Lorri and Svanberg 1993; Maleta
2006). The main oligosaccharides in mature soybeans are
stachyose (14–41 g/kg dry weight) and raffinose (1–9 g/kg
dry weight). These two flatulence-causing sugars contain
both b-fructosidic and a-galactosidic linkages (Lan et al.
2007). Mammals do not synthesize a-galactosidase
enzymes required to hydrolyze a-galactosidic linkages
(Medic et al. 2014). Therefore, increases in a-galactosidase
activities could imply a possible degradation of flatulence-
causing oligosaccharides. This could in turn improve the
acceptance and utilization of soybeans.
Amino acids
Seventeen total amino acids including cyst(e)ine (Cys),
methionine (Met), aspartic acid (Asp), threonine (Thr),
serine (Ser), glutamic acid (Glu), proline (Pro), glycine
(Gly), alanine (Ala), valine (Val), isoleucine (Ile), leucine
(Leu), tyrosine (Tyr), phenylalanine (Phe), histidine
(His), lysine (Lys), and arginine (Arg) were identified.
Fluctuations in amino acids were observed and in most
cases the changes were not significant (Table 2). Signifi-
cant increases (P < 0.05) throughout fermentation were
only observed in Cys in 100S and 90S, and Met in 90S,
while significant increases during 48 h of fermentation
were observed in Cys in all LFP and in Met in 75SBS.
Significant increases at 48 h followed by decreases at 72 h
were observed in Cys in LFP and in Met, Asp, Ser, and
Arg in 75SBS. In 100S, significant decreases at 48 h in
6 ª 2014 The Authors. Food Science & Nutrition published by Wiley Periodicals, Inc.
Chemical Changes During Fermentation of Soybeans T. A. Ng’ong’ola-Manani et al.

Asp, Glu, Pro, Val, Phe, His, Arg were observed, and
levels of many amino acids decreased in 100SBS at 48 h.
The sums of the total amino acids were higher in NFP
than in LFP except in 75S at 48 and 72 h. Although not
significant, slight percent increases in sums of total amino
acids were observed in 90SBS and 75SBS (48 h). At 48
and 72 h, 90SBS showed 1.5% and 1.7% increases, respec-
tively. In 75SBS, a 3.2% increase was noted at 48 h. On
the other hand, reductions were noted in all NFP at 48 h
(from 0.01% in 90S to 6.8% in 100S) and in 100SBS.
Higher decreases were noted at 72 h in 75S (4.7%), at
48 h in 100S (6.8%), and at 48 and 72 h in 100SBS
(7.4%). In 75S, there were decreases throughout fermen-
tation.
In all samples, Glu was the most abundant amino acid
followed by Asp, while Cys and Met were the limiting
amino acids. Similar results were reported in fermentation
of kinema by B. subtilis (Sarkar et al. 1997b). In fermenta-
tion of doenjang by B. subtilis, increases in Leu, Phe, Lys,
and Ala were up to three times greater after 40 and
100 days of fermentation than the initial levels (Namgung
et al. 2010). In cheonggukjang fermented for 3 days with
Bacillus spp., total amino acids significantly (P < 0.05)
increased between 24 and 48 h (Baek et al. 2010). In their
study, Baek et al. (2010) identified Ala, Glu, Phe, and Trp
as major amino acids (above one related peak area) dur-
ing the initial stages of fermentation. In this study, Glu,
Asp, Leu, Arg, Lys, Ser, and Phe were considered the
main amino acids (>20 g per kg sample) throughout fer-
mentation. In kinema, Glu, Asp, Leu, Arg and Lys were
major amino acids (Sarkar et al. 1997b), while in soy-da-
wadawa, Glu and Ser were not among the major amino
acids (Dakwa et al. 2005).
A total of 21 free amino acids (Table 3) including cyst
(e)ine, methionine, aspartic acid, threonine, serine,
glutamic acid, proline, glycine, alanine, valine, isoleucine,
leucine, tyrosine, phenylalanine, histidine, lysine, arginine,
glutamine (Gln), asparagine (Asn), citrulline (Cit), c-
aminobutyric acid (GABA), ornithine (Orn), and trypto-
phan (Trp) were identified. Fluctuations in free amino
acids were also observed. The fluctuations reflected the
conversion of peptides to free amino acids and the subse-
quent utilization of these amino acids. Peptide conversion
into free amino acids is a central metabolic activity in
LAB (Christensen et al. 1999). Increases throughout fer-
mentation were observed in Glu (all samples), Ala (all
LFP), GABA and Lys (100SBS and 90SBS) and Asp (90S).
Decreases at 24 h followed by increases at 48 and 72 h
were observed in NFP in Ala, Val, Ile, and Leu; and in
LFP in Asn and Leu. These changes were also observed in
100S in Asn and Gly and in 100SBS in Val. At the end of
the fermentation, the following amino acids were signifi-
cantly higher than at the beginning of the fermentation:
Glu, Ala, Lys in all samples; Leu in NFP; Gln in LFP,
100S and 90S; Thr and GABA in 100SBS and 90SBS; Asn,
Cit, and Ile in 100S; Gly in 100S, 90S, and 100SBS; Phe
in 100S and 90S; and Val in 90S and 100SBS (Table 3).
Sarkar et al. (1997b) reported significant increases in free
amino acids during 48 h of fermentation in kinema. They
also reported net decreases in some amino acids and sug-
gested that the amino acids were metabolized to a greater
extent than they were replaced by proteolytic activities. In
cheonggukjang fermented for 2–3 days, fluctuations in
amino acids were also observed and the levels of most
amino acids decreased in the early stages of fermentation
and increased in the late stages of fermentation (Park
et al. 2010). Increases in free amino acids would be
desirable to improve digestibility of soybean proteins.
In LFP, His was not detected beyond 24 h while Met
was not detected at 24 h but was detected at 48 and/or
72 h. The absence of His and Met during further fermen-
tation suggested degradation of the amino acids. The
breakdown of His to the biogenic amine, histamine has
received attention due to food safety concerns since hista-
mine can result in food poisoning (Christensen et al.
1999; Fernandez and Zuniga 2006). The physiological
roles of His decarboxylation in LAB include regulation of
intracellular pH and generation of metabolic energy
(Christensen et al. 1999). On the other hand, Met degra-
dation is associated with aroma compounds in cheese
(Fernandez and Zuniga 2006). In all samples, Arg
decreased between 0 and 24 h and the decreases were
more pronounced in LFP. Sarkar et al. (1997b) attributed
Arg’s pronounced decreases to its preferential uptake by
B. subtilis. In addition, Arg provides energy in LAB via
substrate-level phosphorylation (Christensen et al. 1999).
Arg can also be converted to Orn via the arginine-
deiminase pathway by several lactobacilli. This pathway
contributes to the acid tolerance of lactobacilli (G€anzle
et al. 2007).
The main free amino acids at the beginning of the fer-
mentation in NFP and LFP were Asp, Glu, Arg, Ala, Orn,
and Asn. At 72 h, major amino acids in NFP were Asp,
Glu, Ala, Orn, Val, Ile, Phe, Leu and Lys while major
amino acids in LFP were Asp, Glu, Gly, GABA, Val and
Lys. Gly was one of the major amino acids in 90S and
LFP, Leu in 100SBS, GABA in 100SBS, and 90SBS and
Orn in 75SBS. High quantities of Ser were also observed
in 100S. GABA, a nonprotein amino acid abundant in
nature and present in soybeans (Namgung et al. 2010;
Park et al. 2010), significantly increased at 48 and 72 h in
100SBS and 90SBS. GABA is produced by decarboxylation
of L-Glu catalyzed by glutamate decarboxylase and has
diverse physiological functions in humans including
hypotensive effects and regulation of cardiovascular func-
tions (Park and Oh 2007; Park et al. 2010).
ª 2014 The Authors. Food Science & Nutrition published by Wiley Periodicals, Inc. 7
T. A. Ng’ong’ola-Manani et al. Chemical Changes During Fermentation of Soybeans
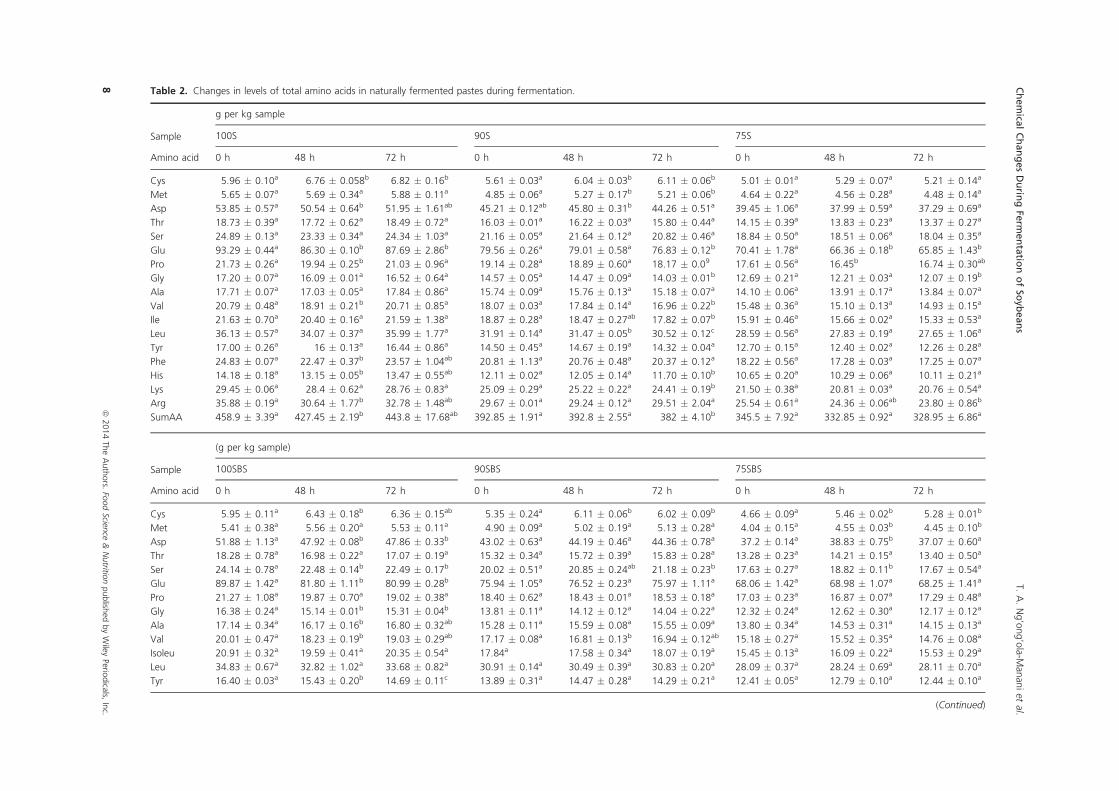
Table 2. Changes in levels of total amino acids in naturally fermented pastes during fermentation.
g per kg sample
Sample 100S 90S 75S
Amino acid 0 h 48 h 72 h 0 h 48 h 72 h 0 h 48 h 72 h
Cys 5.96 " 0.10a 6.76 " 0.058b 6.82 " 0.16b 5.61 " 0.03a 6.04 " 0.03b 6.11 " 0.06b 5.01 " 0.01a 5.29 " 0.07a 5.21 " 0.14a
Met 5.65 " 0.07a 5.69 " 0.34a 5.88 " 0.11a 4.85 " 0.06a 5.27 " 0.17b 5.21 " 0.06b 4.64 " 0.22a 4.56 " 0.28a 4.48 " 0.14a
Asp 53.85 " 0.57a 50.54 " 0.64b 51.95 " 1.61ab 45.21 " 0.12ab 45.80 " 0.31b 44.26 " 0.51a 39.45 " 1.06a 37.99 " 0.59a 37.29 " 0.69a
Thr 18.73 " 0.39a 17.72 " 0.62a 18.49 " 0.72a 16.03 " 0.01a 16.22 " 0.03a 15.80 " 0.44a 14.15 " 0.39a 13.83 " 0.23a 13.37 " 0.27a
Ser 24.89 " 0.13a 23.33 " 0.34a 24.34 " 1.03a 21.16 " 0.05a 21.64 " 0.12a 20.82 " 0.46a 18.84 " 0.50a 18.51 " 0.06a 18.04 " 0.35a
Glu 93.29 " 0.44a 86.30 " 0.10b 87.69 " 2.86b 79.56 " 0.26a 79.01 " 0.58a 76.83 " 0.12b 70.41 " 1.78a 66.36 " 0.18b 65.85 " 1.43b
Pro 21.73 " 0.26a 19.94 " 0.25b 21.03 " 0.96a 19.14 " 0.28a 18.89 " 0.60a 18.17 " 0.09 17.61 " 0.56a 16.45b 16.74 " 0.30ab
Gly 17.20 " 0.07a 16.09 " 0.01a 16.52 " 0.64a 14.57 " 0.05a 14.47 " 0.09a 14.03 " 0.01b 12.69 " 0.21a 12.21 " 0.03a 12.07 " 0.19b
Ala 17.71 " 0.07a 17.03 " 0.05a 17.84 " 0.86a 15.74 " 0.09a 15.76 " 0.13a 15.18 " 0.07a 14.10 " 0.06a 13.91 " 0.17a 13.84 " 0.07a
Val 20.79 " 0.48a 18.91 " 0.21b 20.71 " 0.85a 18.07 " 0.03a 17.84 " 0.14a 16.96 " 0.22b 15.48 " 0.36a 15.10 " 0.13a 14.93 " 0.15a
Ile 21.63 " 0.70a 20.40 " 0.16a 21.59 " 1.38a 18.87 " 0.28a 18.47 " 0.27ab 17.82 " 0.07b 15.91 " 0.46a 15.66 " 0.02a 15.33 " 0.53a
Leu 36.13 " 0.57a 34.07 " 0.37a 35.99 " 1.77a 31.91 " 0.14a 31.47 " 0.05b 30.52 " 0.12c 28.59 " 0.56a 27.83 " 0.19a 27.65 " 1.06a
Tyr 17.00 " 0.26a 16 " 0.13a 16.44 " 0.86a 14.50 " 0.45a 14.67 " 0.19a 14.32 " 0.04a 12.70 " 0.15a 12.40 " 0.02a 12.26 " 0.28a
Phe 24.83 " 0.07a 22.47 " 0.37b 23.57 " 1.04ab 20.81 " 1.13a 20.76 " 0.48a 20.37 " 0.12a 18.22 " 0.56a 17.28 " 0.03a 17.25 " 0.07a
His 14.18 " 0.18a 13.15 " 0.05b 13.47 " 0.55ab 12.11 " 0.02a 12.05 " 0.14a 11.70 " 0.10b 10.65 " 0.20a 10.29 " 0.06a 10.11 " 0.21a
Lys 29.45 " 0.06a 28.4 " 0.62a 28.76 " 0.83a 25.09 " 0.29a 25.22 " 0.22a 24.41 " 0.19b 21.50 " 0.38a 20.81 " 0.03a 20.76 " 0.54a
Arg 35.88 " 0.19a 30.64 " 1.77b 32.78 " 1.48ab 29.67 " 0.01a 29.24 " 0.12a 29.51 " 2.04a 25.54 " 0.61a 24.36 " 0.06ab 23.80 " 0.86b
SumAA 458.9 " 3.39a 427.45 " 2.19b 443.8 " 17.68ab 392.85 " 1.91a 392.8 " 2.55a 382 " 4.10b 345.5 " 7.92a 332.85 " 0.92a 328.95 " 6.86a
(g per kg sample)
Sample 100SBS 90SBS 75SBS
Amino acid 0 h 48 h 72 h 0 h 48 h 72 h 0 h 48 h 72 h
Cys 5.95 " 0.11a 6.43 " 0.18b 6.36 " 0.15ab 5.35 " 0.24a 6.11 " 0.06b 6.02 " 0.09b 4.66 " 0.09a 5.46 " 0.02b 5.28 " 0.01b
Met 5.41 " 0.38a 5.56 " 0.20a 5.53 " 0.11a 4.90 " 0.09a 5.02 " 0.19a 5.13 " 0.28a 4.04 " 0.15a 4.55 " 0.03b 4.45 " 0.10b
Asp 51.88 " 1.13a 47.92 " 0.08b 47.86 " 0.33b 43.02 " 0.63a 44.19 " 0.46a 44.36 " 0.78a 37.2 " 0.14a 38.83 " 0.75b 37.07 " 0.60a
Thr 18.28 " 0.78a 16.98 " 0.22a 17.07 " 0.19a 15.32 " 0.34a 15.72 " 0.39a 15.83 " 0.28a 13.28 " 0.23a 14.21 " 0.15a 13.40 " 0.50a
Ser 24.14 " 0.78a 22.48 " 0.14b 22.49 " 0.17b 20.02 " 0.51a 20.85 " 0.24ab 21.18 " 0.23b 17.63 " 0.27a 18.82 " 0.11b 17.67 " 0.54a
Glu 89.87 " 1.42a 81.80 " 1.11b 80.99 " 0.28b 75.94 " 1.05a 76.52 " 0.23a 75.97 " 1.11a 68.06 " 1.42a 68.98 " 1.07a 68.25 " 1.41a
Pro 21.27 " 1.08a 19.87 " 0.70a 19.02 " 0.38a 18.40 " 0.62a 18.43 " 0.01a 18.53 " 0.18a 17.03 " 0.23a 16.87 " 0.07a 17.29 " 0.48a
Gly 16.38 " 0.24a 15.14 " 0.01b 15.31 " 0.04b 13.81 " 0.11a 14.12 " 0.12a 14.04 " 0.22a 12.32 " 0.24a 12.62 " 0.30a 12.17 " 0.12a
Ala 17.14 " 0.34a 16.17 " 0.16b 16.80 " 0.32ab 15.28 " 0.11a 15.59 " 0.08a 15.55 " 0.09a 13.80 " 0.34a 14.53 " 0.31a 14.15 " 0.13a
Val 20.01 " 0.47a 18.23 " 0.19b 19.03 " 0.29ab 17.17 " 0.08a 16.81 " 0.13b 16.94 " 0.12ab 15.18 " 0.27a 15.52 " 0.35a 14.76 " 0.08a
Isoleu 20.91 " 0.32a 19.59 " 0.41a 20.35 " 0.54a 17.84a 17.58 " 0.34a 18.07 " 0.19a 15.45 " 0.13a 16.09 " 0.22a 15.53 " 0.29a
Leu 34.83 " 0.67a 32.82 " 1.02a 33.68 " 0.82a 30.91 " 0.14a 30.49 " 0.39a 30.83 " 0.20a 28.09 " 0.37a 28.24 " 0.69a 28.11 " 0.70a
Tyr 16.40 " 0.03a 15.43 " 0.20b 14.69 " 0.11c 13.89 " 0.31a 14.47 " 0.28a 14.29 " 0.21a 12.41 " 0.05a 12.79 " 0.10a 12.44 " 0.10a
(Continued)
8ª
2014TheAuthors.
FoodScience&Nutritio
npublish
edbyWileyPerio
dica
ls,Inc.
Chemica
lChangesDurin
gFerm
entatio
nofSoybeans
T.A.Ng’ong’ola-M
ananietal.

Amino acids play important roles in aroma and taste
development in food (Dajanta et al. 2011) as they are
involved in Maillard reactions and Strecker degradation
(Park et al. 2010). For instance, Orn is a precursor for a
key flavor compound of wheat bread crust that intensifies
the roasty note of the crust odor (G€anzle et al. 2007).
During fermentation, Orn was highest at 24 h in most
samples and by 72 h, the highest content was in 75SBS.
Glu elicits the savory taste sensation of umami in humans
(Zhao et al. 2003). At the end of the fermentation, Glu
was three to six times greater in NFP and about three
times greater in LFP than at the start of the fermentation
and Glu was highest in 100S. Glu was reported as the
most abundant amino acid in soybean paste during ripen-
ing and storage (Namgung et al. 2010). Amino acids asso-
ciated with bitterness were high in 100S (Val and Leu)
and 90S (Ile, Leu and Phe). Amino acids associated with
sweetness such as Gly, Ala, and Lys were mostly high in
LFP and were highest in 100SBS, while other sweet amino
acids such as Ser and Ala were high in 100S. The higher
levels of total and free Asp and Glu in NFP would suggest
that NFP would have higher umami intensities, while the
higher levels of amino acids associated with sweetness in
LFP would suggest high sweetness intensities in LFP. On
the contrary, sensory perception by descriptive panel
rated LFP higher in umami intensities and NFP higher in
sweetness intensities. This was explained in terms of inter-
action effects with other tastants including organic acids
that were responsible for high sourness intensities in LFP
(Ng’ong’ola-Manani et al. 2014).
Organic acids and sugars
Citric, orotic, succinic, DL-lactic, uric, DL-pyroglutamic,
propionic, a-ketoglutaric, oxalic, acetic and formic acids,
and pyruvate were analyzed in the samples. However,
detectable levels were only found in lactic, succinic, and
acetic acids (Fig 1). More lactic acid was produced in both
NFP and LFP compared to acetic and succinic acids.
Higher lactic acid productions implied lactic acid as the
major end product of fermentation, a characteristic of
LAB metabolism (Kandler 1983; Axelsson 1998; Klein
et al. 1998; Holzapfel et al. 2001). Lactic acid in LFP was
2.5 to 3.5-fold higher than in NFP (Fig 1A). Significantly
high lactic acid production in LFP could mean higher
LAB numbers in LFP resulting in dominant LAB metabo-
lism compared to NFP. Alternatively, mixed fermentation
processes of LAB and other microflora could be suggested
for NFP. At 72 h, production of lactic acid was five to
16-fold and 19- to 30-fold higher than of succinic acid in
NFP and LFP, respectively, while at the same time, lactic
acid was one to twofold and 10- to 11-fold higher than
acetic acid in NFP and LFP, respectively. The presence ofTable
2.Continued.
(gperkgsample)
Sample
100SBS
90SBS
75SBS
Aminoacid
0h
48h
72h
0h
48h
72h
0h
48h
72h
Phe
23.22"
0.13a
21.67"
0.04b
21.32"
0.22b
19.76"
0.05a
20.36"
0.32a
20.26"
0.35a
17.87"
0.045ab
18.03"
0.12b
17.55"
0.14a
His
13.66"
0.20a
12.39"
0.01b
12.48"
0.05b
11.57"
0.05a
11.65"
0.03a
11.59"
0.14a
10.36"
0.22a
10.53"
0.09a
10.30"
0.08a
Lys
28.19"
0.36a
26.55"
0.05b
26.55"
0.15b
23.46"
0.12a
24.33"
0.04b
24.42"
0.19b
20.34"
0.23a
21.32"
0.71a
20.48"
0.41a
Arg
34.47"
0.62a
30.30"
0.10b
30.38"
0.11b
28.26"
0.52a
28.22"
0.05a
28.09"
0.83a
25.11"
0.54ab
26"
2.78b
23.53"
0.31a
SumAA
442"
8.77a
409.3"
3.11b
409.9"
0.99b
374.85"
3.46a
380.45"
3.04a
381.1"
4.81a
332.8"
3.54a
343.4"
7.78a
332.45"
0.21a
Meansin
arow
andwithin
asample
notsharingsuperscripts
are
significantlydifferent(P
<0.05).Samplescoded100S,90S,and75Srepresentnaturally
ferm
entedpastes,
while
samplescoded
100SBS,90SBS,and75SBSrepresentlactic
acid-ferm
entedpastes.
Pastesare
designatedaccordingto
100%,90%,and75%
soybeancomposition,theremainingproportionsbeingmaize.
ª 2014 The Authors. Food Science & Nutrition published by Wiley Periodicals, Inc. 9
T. A. Ng’ong’ola-Manani et al. Chemical Changes During Fermentation of Soybeans

Table 3. Changes in levels of free amino acids in naturally fermented pastes during fermentation.
(lmol/mL)
Sample 100S 90S 75S
Amino
acid 0 h 24 h 48 h 72 h 0 h 24 h 48 h 72 h 0 h 24 h 48 h 72 h
Asp 0.58 " 0.04a 0.36 " 0.33a 0.55 " 0.5a 0.79 " 0.50a 0.56 " 0.014a 0.64 " 0.36a 0.84 " 0.08a 1.23 " 1.05a 0.61 " 0.02a 0.71 " 0.46a 0.85 " 0.71a 0.78 " 0.37a
Glu 0.8 " 0.03a 1.12 " 0.45a 2.92 " 1.43ab 4.84 " 0.48b 0.87 " 0.02a 0.92 " 0.35a 2.16 " 0.91b 3.71 " 2.64b 0.82 " 0.01a 0.99 " 0.13a 1.36 " 0.09ab 2.38 " 0.72b
Asn 0.6a 0.03b 0.13bc 0.2 " 0.08c 0.51 " 0.01a 0.17 " 0.03ab 0.09 " 0.08b 0.15 " 0.15ab 0.63 " 0.03a 0.19 " 0.14b 0.05 " 0.03b 0.12 " 0.09b
Ser 0.12 " 0.01a 0.35 " 0.01b 0.65 " 0.09c 0.63 " 0.07c 0.10 + 0.01a 0.11 " 0.06a 0.27 " 0.22a 0.29 " 0.3a 0.1a 0.1 " 0.02a 0.22 " 0.09a 0.3 " 0.17a
Gln 0.01a 0.03 " 0.01a 0.06 " 0.04ab 0.12 " 0.03b 0.01a 0.04 " 0.01a 0.06 " 0.03ab 0.13 " 0.12b 0.01a 0.04 " 0.01a 0.04 " 0.01a 0.07 " 0.04a
His 0.29 " 0.04a 0.09 " 0.03b 0.06 " 0.02b 0.38c 0.19 " 0.01a 0.12 " 0.01a 0.12 " 0.09a 0.24a 0.16 " 0.02a 0.15 " 0.02a 0.14 " 0.06a 0.07 " 0.06a
Gly 0.22ab 0.15 " 0.08b 0.25 " 0.13ab 0.47 " 0.09c 0.20a 0.19 " 0.04a 0.41 " 0.18b 0.57 " 0.30b 0.23 " 0.01a 0.18 " 0.04a 0.18 " 0.08a 0.29 " 0.16a
Thr 0.08 " 0.01a 0.03 " 0.01a 0.10 " 0.11a 0.13 " 0.08a 0.08 " 0.01a 0.03 " 0.01a 0.12 " 0.06a 0.20 " 0.24a 0.08 " 0.01a 0.04 " 0.01b 0.07 " 0.01a 0.07 " 0.01a
Cit 0.01a 0.19b 0.13 " 0.16b 0.37c 0.01a 0.06 " 0.07a 0.07 " 0.06a 0.07 " 0.07a n.d. 0.07 0.10 " 0.06 0.06 " 0.01
Arg 5.82 " 0.01a 1.45 " 1.49b 0.05 " 0.02c 0.06c 3.16 " 0.02a 1.94 " 1.46ab 0.11 " 0.12b 0.07 " 0.01b 2.82 " 0.04a 1.31 " 0.24b 0.04 " 0.01c 0.04 " 0.02c
Ala 0.67ac 0.35 " 0.11ab 1.79 " 0.66c 3.63 " 0.46d 0.59 " 0.01a 0.30 " 0.18a 1.15 " 1.03b 2.63 " 2.32c 0.64 " 0.01a 0.37 " 0.12a 0.61 " 0.37a 1.43 " 0.41b
GABA 0.13 " 0.14a 0.14 " 0.02a 0.13 " 0.04a 0.12a 0.11a 0.10a 0.12 " 0.01a 0.23 " 0.13a 0.15 " 0.01a 0.13 " 0.01a 0.13 " 0.01a 0.21 " 0.09a
Tyr 0.11 " 0.01a 0.15 " 0.15a 0.12 " 0.11a 0.07 " 0.06a 0.12a 0.10a 0.19 " 0.23a 0.18 " 0.03a 0.14 " 0.01a 0.11 " 0.11a 0.13 " 0.16a 0.08 " 0.06a
Val 0.17 " 0.01a 0.06a 0.57 " 0.11ab 1.0 " 0.37b 0.13 " 0.01a 0.05 " 0.05a 0.42 " 0.52ab 0.89 " 1.17b 0.13 " 0.01a 0.05 " 0.03a 0.21 " 0.24a 0.50 " 0.43a
Met 0.10 " 0.01a 0.01a 0.02 " 0.01a 0.03 " 0.02a 0.07a 0.05a 0.05a 0.05a 0.06 0.03 0.02 n.d.
Ile 0.16 " 0.01a 0.01a 0.26 " 0.13ab 0.55 " 0.19b 0.12a 0.04 " 0.04a 0.21 " 0.26a 0.65 " 0.88a 0.10 " 0.01a 0.05 " 0.04a 0.15 " 0.17a 0.32 " 0.26a
Phe 0.2 " 0.03a 0.25 " 0.17a 1.13 " 0.31b 1.66 " 1.12b 0.2a 0.15a 0.84 " 1.06b 1.61 " 2.15b 0.15 " 0.01a 0.12 " 0.11a 0.44 " 0.56a 0.67 " 0.71a
Trp 0.29 " 0.04a 0.27 " 0.11a 0.33 " 0.07a 0.33 " 0.05a 0.28 " 0.021a 0.29 " 0.01a 0.25 " 0.06a 0.24 " 0.04a 0.22 " 0.01a 0.24 " 0.05a 0.25 " 0.01a 0.21a
Leu 0.20 " 0.01a 0.09 " 0.04a 1.06 " 0.21ab 2.19 " 1.0b 0.16 + 0.01a 0.05 " 0.05a 1.12 " 1.47b 2.59 " 3.49b 0.13a 0.06 " 0.03a 0.42 " 0.52a 1.11 " 0.95b
Orn 1.05 " 0.20ab 1.91 " 0.61a 0.82 " 0.67ab 0.42 " 0.34b 0.72 " 0.08a 0.75 " 0.21a 1.01 " 0.12a 0.25 " 0.08b 0.61 " 0.09a 0.83 " 0.24a 1.38 " 0.25b 0.56 " 0.16a
Lys 0.33 " 0.01a 0.35 " 0.06ab 0.58 " 0.13b 0.95 " 0.08c 0.31 " 0.10a 0.25 " 0.01a 0.65 " 0.45ab 0.92 " 0.65b 0.3a 0.37 " 0.12a 0.34 " 0.01a 0.74 " 0.30a
(lmol/mL)
Sample 100SBS 90SBS 75SBS
Amino
acid 0 h 24 h 48 h 72 h 0 h 24 h 48 h 72 h 0 h 24 h 48 h 72 h
Asp 0.55 " 0.04a 0.99 " 0.41a 0.74 " 0.13a 0.78 " 0.12a 0.66 " 0.11a 0.84 " 0.3a 1.05 " 0.03a 0.90 " 0.04a 0.89 " 0.12a 1.13 " 0.39a 0.83 " 0.11a 0.72 " 0.14a
Glu 0.87 " 0.01a 2.79 " 0.1b 2.33 " 0.54b 2.55 " 0.38b 0.98 " 0.1a 2.56 " 0.1b 3.37 " 0.1c 3.07 " 0.35c 0.98 " 0.06a 2.37 " 0.05ab 2.94 " 0.42b 3.14 " 1.30b
Asn 0.50 " 0.05a 0.15 " 0.03a 0.25 " 0.21a 0.36 " 0.19a 0.50 " 0.08a 0.12 " 0.01b 0.33 " 0.10ab 0.35 " 0.10a 0.85 " 0.11a 0.11 " 0.01b 0.21 " 0.04b 0.25 " 0.14b
Ser 0.14a 0.09 " 0.05a 0.11 " 0.01a 0.18 " 0.05a 0.18 " 0.01a 0.08 " 0.04b 0.12 " 0.04ab 0.19 " 0.01a 0.20 " 0.01a 0.07 " 0.02b 0.11ab 0.18 " 0.01a
Gln 0.01a 0.12 " 0.01b 0.22 " 0.03c 0.33 " 0.06d 0.02a 0.16 " 0.03ab 0.42 " 0.16b 0.5 " 0.21b 0.03 " 0.01a 0.18 " 0.01b 0.39 " 0.03c 0.43 " 0.08c
His 0.14 " 0.08 n.d. n.d. n.d. 0.11 " 0.06 n.d. n.d. n.d. 0.17 " 0.09 n.d. n.d. n.d.
Gly 0.25 " 0.01a 0.46 " 0.03ab 0.79 " 0.14ab 1.07 " 0.47b 0.27 " 0.01a 0.51 " 0.02ab 0.75 " 0.18b 1.06 " 0.06c 0.32 " 0.02a 0.49 " 0.01b 0.71 " 0.08c 0.73 " 0.01c
Thr 0.07 " 0.02a 0.13 " 0.06a 0.11 " 0.02a 0.24 " 0.01b 0.10 " 0.05a 0.11 " 0.04a 0.29 " 0.09b 0.29 " 0.05b 0.11 " 0.04a 0.13 " 0.04a 0.19 " 0.09a 0.31 " 0.11a
Cit 0.01a 0.28 " 0.36a 0.13 " 0.15a 0.04 " 0.02a 0.01a 0.29 " 0.36a 0.27 " 0.36a 0.15 " 0.18a 0.02 " 0.01a 0.37 " 0.39a 0.31 " 0.38a 0.19 " 0.23a
Arg 5.09 " 0.03a 0.06 " 0.04b 0.06 " 0.01b 0.07 " 0.01b 3.12 " 0.02a 0.06 " 0.04b 0.05 " 0.01b 0.05 " 0.01b 4.20 " 0.05a 0.08 " 0.05b 0.09 " 0.06b 0.10 " 0.04b
Ala 0.70 " 0.01a 1.34 " 0.43a 2.67 " 0.66ab 3.84 " 1.53b 0.72 " 0.02a 1.25 " 0.34ab 2.32 " 0.5bc 3.27 " 0.66c 0.89 " 0.01a 1.19 " 0.19ab 2.00 " 0.53ab 2.54 " 0.81b
GABA 0.17 " 0.01a 0.51 " 0.42a 2.49 " 2.77b 3.75 " 3.75b 0.21 + 0.03a 0.35 + 0.13a 1.07 " 0.86b 2.20 " 1.96b 0.27 " 0.04a 0.31 " 0.06a 0.41 " 0.03a 0.43 " 0.15a
(Continued)
10
ª2014TheAuthors.
FoodScience&Nutritio
npublish
edbyWileyPerio
dica
ls,Inc.
Chemica
lChangesDurin
gFerm
entatio
nofSoybeans
T.A.Ng’ong’ola-M
ananietal.

acetic acid suggested heterofermentation in both LFP and
NFP. Heterofermentative LAB produce acetic acid, etha-
nol, and CO2 in addition to lactic acid as products of fer-
mentation (Kandler 1983). Heterofermentative and
homofermentative LAB were identified in both the fer-
mentation processes, and the former were dominant (data
not shown).
At 24 h, there were no significant differences in acetic
acid production in all samples except 75S (Fig 1C) which
had a significantly (P < 0.05) lower acetic acid level. At
48 h, 90S and 100S contained more acetic acid than all
LFP and 75S. At the end of the fermentation, highest ace-
tic acid amount was produced in 100S followed by 90S
and 75S although contents in 90S and 75S and all LFP
were not significantly different (P > 0.05). High acetic
acid production in NFP could be attributed to natural
fermentation probably by Bacillus spp. because acetic acid
is a major product of carbohydrate metabolism in B. sub-
tilis (Moat et al. 2002). The presence of succinic acid con-
firmed heterofermentation (Axelsson 2004) and could
also mean that pyruvate entered alternative pathways
(Moat et al. 2002). No particular trend in succinic acid
was observable except that there was a continual increase
in production throughout fermentation in 75SBS, 90SBS,
90S, and 100S, while increases were followed by sharp
decreases at 48 h in 75S and 100SBS (Fig 1B).
Organic acids in fermented soybean pastes like doenj-
ang are used as quality indicators. They affect the flavor
of the pastes through increases in acidity and develop-
ment of unpleasant odors. Lactic and succinic acids for
instance are related to sourness (Namgung et al. 2010).
Likewise, the sourness intensities of LFP were higher than
those of NFP (Ng’ong’ola-Manani et al. 2014). Acetic acid
is considered to provide an unpleasant flavor in fer-
mented soy foods (Namgung et al. 2010).
Soybeans contain about 9.94% carbohydrates in the
form of polysaccharides and sugars. Fermentable sugars
such as glucose and galactose ranging from 3.29 to
4.44/100 g and 2.91 to 3.36/100 g, respectively, were
reported as part of the total dietary fiber (Redondo-
Cuenca et al. 2007). Iheanacho (2010) reported 5.13% of
maltose and 14.05% of fructose in soybeans. In this study,
there were more sugars in LFP than in NFP at 0 h (Fig 2)
probably because of the back-slopping material which had
been previously fermented and was made using malt
flour. Malting increases sugar (glucose, fructose, or malt-
ose) content due to amylolytic activities (Malleshi et al.
1986). Fermentation leads to increases and decreases in
sugar content in cereal-based products (Palanisamy et al.
2012). Rapid decreases in maltose in 100SBS and 90SBS
(Fig 2A) could be due to its utilization as energy
source and subsequent conversion into organic acids and
other metabolites. The catabolism of maltose begins withTable
3.Continued.
(lmol/mL)
Sample
100SBS
90SBS
75SBS
Amino
acid
0h
24h
48h
72h
0h
24h
48h
72h
0h
24h
48h
72h
Tyr
0.13"
0.01a
0.06"
0.02ab
0.03b
0.06"
0.03ab
0.15a
0.04+0.02b
0.03"
0.01b
0.04"
0.01b
0.16a
0.03"
0.02b
0.02"
0.01b
0.04"
0.03b
Val
0.20"
0.01ab
0.05"
0.01a
0.25"
0.21ab
0.53"
0.26b
0.21"
0.01a
0.03"
0.01a
0.13"
0.13a
0.26"
0.18a
0.24"
0.01a
0.02b
0.06"
0.03b
0.18"
0.12ab
Met
0.10"
0.01
n.d.
0.03
0.04+0.03
0.09
n.d.
n.d.
0.02
0.09
n.d.
n.d.
0.01
Ile0.14"
0.02a
0.10"
0.01a
0.03"
0.03a
0.13"
0.07a
0.12+0.01a
0.11"
0.01a
0.07"
0.07a
0.04"
0.03a
0.12a
0.11"
0.01a
0.12"
0.02a
0.10"
0.08a
Phe
0.20a
0.14"
0.08a
0.20"
0.15a
0.38"
0.25a
0.20"
0.02a
0.10"
0.05a
0.15"
0.08a
0.22"
0.15a
0.18"
0.01a
0.09"
0.06a
0.08"
0.01a
0.17"
0.12a
Trp
0.29"
0.02a
0.26"
0.07a
0.16"
0.08a
0.13"
0.07a
0.27"
0.01a
0.22"
0.03ab
0.16"
0.07ab
0.12"
0.04b
0.23"
0.01a
0.19"
0.01a
0.12"
0.06a
0.09"
0.08a
Leu
0.22"
0.01a
0.07"
0.05a
0.4"
0.05a
0.96"
0.87a
0.23"
0.01a
0.05"
0.06a
0.22"
0.28a
0.42"
0.49a
0.22"
0.01a
0.03"
0.01a
0.08"
0.09a
0.28"
0.33a
Orn
0.98"
0.06a
1.63"
1.98a
0.21"
0.03a
0.25"
0.01a
0.74a
1.01"
1.09a
0.71"
0.71a
0.35"
0.16a
0.84+0.01a
2.77"
0.01b
0.99"
0.94a
0.62"
0.53a
Lys
0.30"
0.10a
0.67"
0.04a
1.00"
0.5
ab
1.49"
0.77b
0.28"
0.06a
0.50"
0.08a
0.98"
0.09b
1.47"
0.26c
0.35"
0.01a
0.57"
0.03ab
0.84"
0.16b
0.78"
0.23b
Meansin
arow
andwithin
asample
notsharingsuperscripts
are
significantlydifferent(P
<0.05).n.d.,notdetected.Samplescoded100S,90S,and75Srepresentnaturally
ferm
entedpastes,
while
samplescoded100SBS,
90SBS,and75SBSrepresentlacticacid-ferm
entedpastes.Pastesare
designatedaccordingto
100%
,90%
,and75%
soybeancomposition,theremainingproportionsbeingmaize.
ª 2014 The Authors. Food Science & Nutrition published by Wiley Periodicals, Inc. 11
T. A. Ng’ong’ola-Manani et al. Chemical Changes During Fermentation of Soybeans

its phosphorylatic cleavage catalyzed by maltose
phosphorylase, yielding glucose and glucose-1-phosphate
(Axelsson 2004; G€anzle et al. 2007). Homofermentative
and heterofermentative LAB convert glucose-1-phosphate
to glucose-6-phosphate, which is further metabolized via
glycolysis to lactic acid or via phosphogluconate pathway
to yield lactic acid, carbon dioxide, and ethanol/acetic
acid, respectively. Glucose can also be phosphorylated by
homofermentative LAB and follow the glycolytic pathway
or it can be converted to glucose-6-phosphate and follow
the phosphogluconate pathway by heterofermentative
LAB (Vogel et al. 1999; De Vuyst et al. 2002; Axelsson
2004; G€anzle et al. 2007).
Rapid decreases in glucose in LFP between 0 and 24 h
(Fig 2B) could be due to its utilization in the generation
of energy via glycolysis or the phosphogluconate pathway
(Vogel et al. 1999; Axelsson 2004) to support growth of a
higher microbial population in LFP at the beginning of
the fermentation. Although fructose content was higher
throughout fermentation in LFP than in NFP (Fig 2C), it
followed similar trends. Increases between 0 and 24 h in
all samples, except 100S, and thereafter gradual decreases
throughout fermentation in all samples, except 75SBS,
were observed. The presence and increases of fructose
could have been due to accumulation as a result of
metabolism of other sugars like sucrose while decreases
could have been due to utilization as carbon source or
bioconversion of the sugar. Fructose accumulation can
also be explained in terms of preferential carbohydrate
utilization of LAB (G€anzle et al. 2007). All microorgan-
isms important in foods can metabolize glucose, but vary
greatly in their ability to utilize other fermentable sugars
including fructose (Ray 2003). Fructose and glucose can
be released from sucrose fermentation which starts with
the cleavage of the sugar by sucrose hydrolase into the
two monosaccharide units. The two sugars then enter
the major fermentation pathways (Axelsson 2004).
Heterofermentative LAB can assimilate fructose via the
(A)
(C)
(B)
Figure 1. Changes in organic acids during fermentation. Samples coded 100S, 90S, and 75S represent naturally fermented pastes, while samples
coded 100SBS, 90SBS, and 75SBS represent lactic acid-fermented pastes. Pastes are designated according to 100%, 90%, and 75% soybean
composition, the remaining proportions being maize.
12 ª 2014 The Authors. Food Science & Nutrition published by Wiley Periodicals, Inc.
Chemical Changes During Fermentation of Soybeans T. A. Ng’ong’ola-Manani et al.
6-phosphogluconate/phosphoketolase pathway for hexose
(Wisselink et al. 2002). Fructose may also be used as an
alternative electron acceptor in LAB fermentation pro-
cesses to increase LAB energy yield, resulting in its reduc-
tion to mannitol (Chen et al. 1983; Kandler 1983; Vogel
et al. 1999; G€anzle et al. 2007). By 72 h, there were no
significant differences in maltose and glucose levels
between LFP and NFP and these two sugars were nearly
all used up, while there were significant differences in the
fructose content.
Antinutritional factors
Phytic acid
The levels of phytic acid content at the beginning of the
fermentation processes varied among the pastes and did
not seem to be influenced by sample composition. How-
ever, after 48 and 72 h, significant reductions were
observed in all samples and levels of degradation
depended on the type of fermentation. Overall, natural
fermentation was more effective in reducing phytic acid
levels (Table 4). A 33–54% reduction was achieved by
natural fermentation at 24 and by 72 h, 85% reduction
was noted while in some samples the phytate could not
be detected. On the contrary, only 18–32% reduction was
achieved in LFP at 24 h and 37–49% reduction was
achieved by 72 h. Bacillus subtilis (Shimizo 1992; Kerovuo
et al. 1998) and LAB species (Songr"e-Ouattara et al. 2008;
Khodaii et al. 2013) with phytase activities have been
reported previously.
The differences in the extent of phytic acid degradation
between LFP and NFP can probably be explained in terms
of the complexity of the physiological and environmental
factors that affect the production and activity of phytases;
and also in terms of the types of microflora in the pastes.
Phytase activities in Bacillus spp. are optimal at a wide
pH range of 4.5–8.5 (Shimizo 1992; Kim et al. 1998; Choi
et al. 2001). In sourdough LAB, pH 4.0 was optimum for
phytase activity and the activity rapidly decreased at pH
3.5 or pH 4.5 (De Angelis et al. 2003). Palacios et al.
(2005) reported an optimum pH of 5.0 and 50% reten-
tion of optimum phytase activity at pH 4.5 and 5.5, while
only 20% retention at pH 4.0 and 6.0 were reported for
various LAB strains. Extracellular phytase activities in
Bacillus spp. are known (Shimizo 1992; Kim et al. 1998;
(A) (B)
(C)
Figure 2. Changes in sugars during fermentation. Samples coded 100S, 90S, and 75S represent naturally fermented pastes, while samples coded
100SBS, 90SBS, and 75SBS represent lactic acid-fermented pastes. Pastes are designated according to 100%, 90%, and 75% soybean
composition, the remaining proportions being maize.
ª 2014 The Authors. Food Science & Nutrition published by Wiley Periodicals, Inc. 13
T. A. Ng’ong’ola-Manani et al. Chemical Changes During Fermentation of Soybeans

Choi et al. 2001) while in LAB only intracellular activities
have been detected (De Angelis et al. 2003; Palacios et al.
2005). Further, Palacios et al. (2005) purified and charac-
terized an acid phosphatase (produced by LAB strains)
with broad specificity that hydrolyzed monophosphorylat-
ed substrates and also phytic acid. This could suggest the
possibility of phytic acid degradation activity by LAB due
to nonspecific acid phosphatase with residual activity on
phytic acid (Haros et al. 2008). On the contrary, enzymes
with high specificity for sodium phytate have been iso-
lated and purified from Bacillus spp. (Shimizo 1992; Kim
et al. 1998). Finally, the synthesis of phytase in lactobacilli
strains responded to limiting concentrations of carbon
source (Palacios et al. 2005). Nevertheless, phytic acid
degradation in both LFP and NFP fermentation processes
is essential to improve bioavailability of minerals such as
Ca and Zn (Kim et al. 2010).
Trypsin inhibitor
In this study, heating during paste preparation was the
most effective way of reducing trypsin inhibitor. This was
in agreement with results reported by Egounlety and
Aworh (2003). The content of trypsin inhibitor in raw
soybeans was 19 mg/g sample, but after boiling, trypsin
inhibitor could not be detected in 100S while the highest
trypsin inhibitor at 0 h was 0.169 mg/g sample signifying
a 99% reduction (Table 5). Higher levels of trypsin inhib-
itor in LFP could be due to the back-slopping material
which was made using finger millet malt that was added
after cooling the porridge to 50–60°C. Although reduc-
tions were observed in both types of fermentation pro-
cesses, fluctuations were observed in 100SBS and 90SBS
in which marked increases were observed at 24 h. Higher
trypsin inhibitor levels at 24 h in 100SBS and 90SBS
could be due to release of bound trypsin inhibitors. Wang
et al. (1972) and Egounlety and Aworh (2003) reported
increases in levels of trypsin-inhibiting activities of heated
soybeans fermented with Rhizopus oligosporus. According
to Wang et al. (1972), various proteases produced by the
mold were responsible for releasing bound trypsin inhibi-
tor from the soybean substrate. Release of bound trypsin
inhibitors by gastric digestion has also been suggested
(Wang et al. 1972).
Conclusions
LAB fermentation and natural fermentation improved the
nutritional quality of pastes of soybeans and soybean–
maize blends through increases in soluble protein,
increases in some total and free amino acids, and degra-
dation of antinutritional factors. Increases in a-amylase
activities in NFP and 75SBS could suggest an increased
starch digestibility and possibility of reduced dietary bulk-
iness providing room for increasing energy density. Both
types of fermentation processes resulted in nonsignificant
changes in most of the total amino acids, although the
fermentation processes increased the levels of the sulfur-
Table 4. Phytic acid content at different times of fermentation of the pastes.
Phytic acid (g/100 g sample dry matter)
Sample 0 h 24 h 48 h 72 h
100S 0.314 " 0.037a 0.183 " 0.112ab n.d. n.d.
90S 0.274 " 0.036a 0.125 " 0.094b 0.132 " 0.087ab 0.040 " 0.215c
75S 0.319 " 0.063a 0.213 " 0.05b 0.079 " 0.06bc n.d.
100SBS 0.322 " 0.019a 0.226 " 0.072b 0.199 " 0.053c 0.202 " 0.048bc
90SBS 0.234 " 0.080a 0.191 " 0.128a 0.194 " 0.043a 0.138 " 0.062b
75SBS 0.276 " 0.047a 0.186 " 0.030b 0.160 " 0.010bc 0.141 " 0.025c
Means not sharing superscript letter(s) are significantly different (P < 0.05) within a row. n.d., not detected. Samples coded 100S, 90S, and 75S
represent naturally fermented pastes, while samples coded 100SBS, 90SBS, and 75SBS represent lactic acid-fermented pastes. Pastes are desig-
nated according to 100%, 90%, and 75% soybean composition, the remaining proportions being maize.
Table 5. Trypsin inhibitor at different times of fermentation of the
pastes.
Trypsin inhibitor (mg/g sample dry matter)
Sample 0 h 24 h 48 h 72 h
100S n.d. 0.002 " 0.15 n.d. n.d.
90S 0.156 " 0.08 n.d. n.d. n.d.
75S 0.013 " 0.17 n.d. n.d. n.d.
100SBS 0.160 " 0.20 0.293 " 0.43 n.d. n.d.
90SBS 0.069 " 0.09 0.112 " 0.33 n.d. n.d.
75SBS 0.169 " 0.10 n.d. n.d. n.d.
Samples coded 100S, 90S, and 75S represent naturally fermented
pastes, while samples coded 100SBS, 90SBS, and 75SBS represent lac-
tic acid-fermented pastes. Pastes are designated according to 100%,
90%, and 75% soybean composition, the remaining proportions
being maize. n.d., not detected.
14 ª 2014 The Authors. Food Science & Nutrition published by Wiley Periodicals, Inc.
Chemical Changes During Fermentation of Soybeans T. A. Ng’ong’ola-Manani et al.

containing amino acids, cysteine, and methionine, which
are limiting in legumes. In this study, Glu, Asp, Leu, Arg,
Lys, Ser, and Phe were considered the main total amino
acids throughout fermentation. Amino acid metabolism
and proteolytic activities in the fermentation processes
resulted in differences in major free amino acids. In NFP,
these were Asp, Glu, Ala, Val, Phe, Leu, and Lys, while in
LFP, these were Asp, Glu, Gly, Ala, GABA, Leu, and Lys.
The free amino acids together with the organic acids
would influence the taste of the pastes. High lactic acid
production in LFP could mean an increased shelf life, a
better microbial safety, and an increased sour taste. A
comparative advantage of natural fermentation over lactic
acid fermentation in this study was the higher degrada-
tion of the antinutrient, phytic acid in natural fermenta-
tion.
Acknowledgments
We acknowledge financial support from the Norwegian
Programme for Development, Research and Education
(NUFU) and Norwegian State Education Fund (L!anekas-
sen). This research was also partly financed by the Inter-
national Foundation for Science (IFS) through grant no.
E/4889-1 awarded to Tinna A. Ng’ong’ola-Manani. We
also acknowledge Kari Olsen of the Norwegian University
of Life Sciences for assistance in HPLC measurements of
free amino acids, organic acids, and sugars.
Conflict of Interest
None declared.
References
Allagheny, N., Z. A. Obanu, G. Campbell-Platt, and J. D.
Owens. 1996. Control of ammonia formation during
Bacillus subtilis fermentation of legumes. Int. J. Food
Microbiol. 29:321–333.
AOAC. 1990. Official methods of analysis of the Association
of Official Chemists. Association of Official Chemists,
Washington, D.C.
Asgar, M. A., A. Fazilah, N. Huda, R. Bhat, and A. A. Karim.
2010. Nonmeat protein alternatives as meat extenders and
meat analogs. Compr. Rev. Food Sci. Food Saf. 9:513–529.
Axelsson, L. 1998. Lactic acid bacteria: classification and
physiology. Marcel Dekker Inc, New York, NY.
Axelsson, L. 2004. Lactic acid bacteria: classification and
physiology. Pp. 1–66 in S. Salminen, A. Von Wright, eds.
Lactic acid bacteria: microbiological and functional aspects.
3rd edn (Revised & Expanded). Marcel Dekker Inc., New
York, NY.
Baek, J. G., S. M. Shim, D. Y. Kwon, H. K. Choi, C. H. Lee,
and Y. S. Kim. 2010. Metabolite profiling of Cheonggukjang,
a fermented soybean paste, inoculated with various Bacillus
strains during fermentation. Biosci. Biotechnol. Biochem.
74:1860–1868.
Bernfeld, P. 1955. Amylases a and ß. Academic Press, New
York, NY.
B€utikofer, U., and Y. Ard€o. 1999. Quantitative determination of
free amino acids in cheese. Bull. Int. Dairy Fed. 337:24–32.
Chen, K. H., R. F. Mcfeeters, and H. P. Fleming. 1983.
Fermentation characteristics of heterolactic acid bacteria in
green bean juice. J. Food Sci. 48:962–966.
Chitra, U., U. Singh, and P. Venkateswara Rao. 1996. Phytic
acid, in vitro protein digestibility, dietary fiber, and minerals
of pulses as influenced by processing methods. Plant Foods
Hum. Nutr. 49:307–316.
Choi, Y. M., H. J. Suh, and J. M. Kim. 2001. Purification and
properties of extracellular phytase from Bacillus sp. KHU-10.
J. Protein Chem. 20:287–292.
Christensen, J., E. Dudley, J. Pederson, and J. Steele. 1999.
Peptidases and amino acid catabolism in lactic acid bacteria.
Antonie Van Leeuwenhoek 76:217–246.
Dajanta, K., A. Apichartsrangkoon, E. Chukeatirote, and R. A.
Frazier. 2011. Free-amino acid profiles of thua nao, a Thai
fermented soybean. Food Chem. 125:342–347.
Dajanta, K., E. Chukeatirote, and A. Apichartsrangkoon. 2012.
Improvement of thua nao production using protein-rich
soybean and Bacillus subtilis TN51 starter culture. Ann.
Microbiol. 62:785–795.
Dakwa, S., E. Sakyi-Dawson, C. Diako, N. T. Annan, and W.
K. Amoa-Awua. 2005. Effect of boiling and roasting on the
fermentation of soybeans into dawadawa (soy-dawadawa).
Int. J. Food Microbiol. 104:69–82.
De Angelis, M., G. Gallo, M. R. Corbo, P. L. H. McSweeney,
M. Faccia, M. Giovine, et al. 2003. Phytase activity in
sourdough lactic acid bacteria: purification and
characterization of a phytase from Lactobacillus
sanfranciscensis CB1. Int. J. Food Microbiol. 87:259–270.
De Vuyst, L., V. Schrijvers, S. Paramithiotis, B. Hoste, M.
Vancanneyt, J. Swings, et al. 2002. The biodiversity of lactic
acid bacteria in Greek traditional wheat sourdoughs is
reflected in both composition and metabolite formation.
Appl. Environ. Microbiol. 68:6059–6069.
Deshpande, S. S., and D. K. Salunkhe. 2000. Grain legumes,
seeds and nuts: rationale for fermentation. Pp. 1–32 in S. S.
Deshpande, ed. Fermented grain legumes, seeds and nuts: a
global perspective. Food and Agriculture Organization of the
United Nations, Rome, Italy.
Egounlety, M., and O. C. Aworh. 2003. Effect of soaking,
dehulling, cooking and fermentation with Rhizopus
oligosporus on the oligosaccharides, trypsin inhibitor, phytic
acid and tannins of soybean (Glycine max Merr.), cowpea
(Vigna unguiculata L. Walp) and groundbean (Macrotyloma
geocarpa Harms). J. Food Eng. 56:249–254.
Erdal, I., A. Yilmaz, S. Taban, S. Eker, B. Torun, and I.
Cakmak. 2002. Phytic acid and phosphorus concentrations
ª 2014 The Authors. Food Science & Nutrition published by Wiley Periodicals, Inc. 15
T. A. Ng’ong’ola-Manani et al. Chemical Changes During Fermentation of Soybeans

in seeds of wheat cultivars grown with and without zinc
fertilization. J. Plant Nutr. 25:113–127.
Fernandez, M., and M. Zuniga. 2006. Amino acid catabolic
pathways of lactic acid bacteria. Crit. Rev. Microbiol.
32:155–183.
G€anzle, M. G., N. Vermeulen, and R. F. Vogel. 2007.
Carbohydrate, peptide and lipid metabolism of lactic acid
bacteria in sourdough. Food Microbiol. 24:128–138.
Golbitz, P. 1995. Overview of soybean processing and
production. Traditional soyfoods: processing and products.
J. Nutr. 125:570S–572S.
Hamerstrand, G. E., L. T. Black, and J. D. Glover. 1980.
Trypsin inhibitors is soy products: modification of the
standard analytical procedure. Cereal Chem. 58:42–45.
Hansen, M., B. Pedersen, L. Munck, and B. O. Eggum. 1989.
Weaning foods with improved energy and nutrient density
prepared from germinated cereals. 1. Preparation and
dietary bulk of gruels based on barley. United Nations
University, Tokyo, Japan.
Haros, M., M. Bielecka, J. Honke, and Y. Sanz. 2008.
Phytate-degrading activity in lactic acid bacteria. Polish
J. Food Nutr. Sci. 58:33–40.
Haug, W., and H.-J. Lantzsch. 1983. Sensitive method for the
rapid determination of phytate in cereals and cereal
products. J. Sci. Food Agric. 34:1423–1426.
Holzapfel, W. 1997. Use of starter cultures in fermentation on
a household scale. Food Control 8:241–258.
Holzapfel, W. H. 2002. Appropriate starter culture
technologies for small-scale fermentation in developing
countries. Int. J. Food Microbiol. 75:197–212.
Holzapfel, W. H., P. Haberer, R. Geisen, J. Bj€orkroth, and U.
Schillinger. 2001. Taxonomy and important features of
probiotic microorganisms in food and nutrition. Am.
J. Clin. Nutr. 73:365s–373s.
Iheanacho, K. M. E. 2010. Comparative studies of the
nutritional composition of soy bean (Glycine max) and lima
bean (Phaseolus lunatus). Sci. Afr. 9:29–35.
Kakade, M. L., J. J. Rackis, J. E. McGhee, and G. Puski. 1974.
Determination of trypsin inhibitor activity of soy products:
a collaborative analysis of an improved procedure. Cereal
Chem. 51:376–382.
Kalimbira, A. A., B. M. Mtimuni, and J. P. Mtimuni. 2004.
Effect of incorporating legumes on nutritive value of
cassava-based complementary foods. Bunda J. Agric.
Environ. Sci. Technol. 2:13–21.
Kandler, O. 1983. Carbohydrate metabolism in lactic acid
bacteria. Antonie Van Leeuwenhoek 49:209–224.
Kerovuo, J., M. Lauraeus, P. Nurminen, N. Kalkkinen, and J.
Apajalahti. 1998. Isolation, characterization, molecular gene
cloning, and sequencing of a novel phytase from Bacillus
subtilis. Appl. Environ. Microbiol. 64:2079–2085.
Khetarpaul, N., and B. M. Chauhan. 1989. Effect of
fermentation on protein, fat, minerals and thiamine content
of pearl millet. Plant Foods Hum. Nutr. 39:169–177.
Khodaii, Z., M. Mehrabani Natanzi, M. H. Naseri, M.
Goudarzvand, and H. Dodsons. 2013. Phytase activity of
lactic acid bacteria isolated from dairy and pharmaceutical
probiotic products. Int. J. Ent. Pathog. 1:12–16.
Kim, Y.-O., H.-K. Kim, K.-S. Bae, J.-H. Yu, and T.-K. Oh.
1998. Purification and properties of a thermostable phytase
from Bacillus sp. DS11. Enzyme Microb. Technol. 22:2–7.
Kim, T., J.-H. Lee, M.-H. Park, and H.-Y. Kim. 2010. Analysis
of bacterial and fungal communities in Japanese- and
Chinese-fermented soybean pastes using nested PCR–DGGE.
Curr. Microbiol. 60:315–320.
Kitabatake, N., D. M. Gimbi, and Y. Oi. 2003. Traditional
non-alcoholic beverage, Togwa, in East Africa, produced
from maize flour and germinated finger millet. Int. J. Food
Sci. Nutr. 54:447–455.
Klein, G., A. Pack, C. Bonaparte, and G. Reuter. 1998.
Taxonomy and physiology of probiotic lactic acid bacteria.
Int. J. Food Microbiol. 41:103–125.
Lan, Y., B. A. Williams, M. W. A. Verstegen, R. Patterson, and
S. Tamminga. 2007. Soy oligosaccharides in vitro
fermentation characteristics and its effect on caecal
microorganisms of young broiler chickens. Anim. Feed Sci.
Technol. 133:286–297.
Lorri, W., and U. Svanberg. 1993. Lactic acid-fermented cereal
gruels: viscosity and flour concentration. Int. J. Food Sci.
Nutr. 44:207–213.
Maleta, K. 2006. Undernutrition. Malawi Med. J. 18:191–207.
Malleshi, N. G., H. S. R. Desikachar, and R. N. Tharanathan.
1986. Free sugars and non-starchy polysaccharides of finger
millet (Eleusine coracana), pearl millet (Pennisetum
typhoideum), foxtail millet (Setaria italica) and their malts.
Food Chem. 20:253–261.
Medic, J., C. Atkinson, and C. Hurburgh, Jr. 2014. Current
knowledge in soybean composition. J. Am. Oil Chem. Soc.
91:363–384.
Moat, A. G., J. W. Foster, and M. P. Spector. 2002.
Microbial physiology. 4th ed. John Wiley & Sons Inc.,
New York, NY.
Mohiedeen, I. E., A. H. E. Tinay, A. E. O. Elkhalifa, E. E.
Babiker, and L. O. Mallasiy. 2010. Effect of fermentation on
in vitro protein digestibility, protein fractions and amino
acids composition of maize (Zea mays Linnaeus) cultivars.
Electronic J. Environ. Agric. Food Chem. 9:838–847.
Mosha, A. C., and U. H. Svanberg. 1983. Preparation of
weaning foods with high nutrient density using flour of
germinated cereals. Food Nutr. Bull. 5:10–14.
Mugula, J. K., S. A. M. Nnko, J. A. Narvhus, and T. Sørhaug.
2003. Microbiological and fermentation characteristics of
togwa, a Tanzanian fermented food. Int. J. Food Microbiol.
80:187–199.
Mulimani, V. H., and S. Devendra. 1998. Effect of soaking,
cooking and crude a-galactosidase treatment on the
oligosaccharide content of red gram flour. Food Chem.
61:475–479.
16 ª 2014 The Authors. Food Science & Nutrition published by Wiley Periodicals, Inc.
Chemical Changes During Fermentation of Soybeans T. A. Ng’ong’ola-Manani et al.
Muyanja, C. M. B. K., J. A. Narvhus, J. Treimo, and T.
Langsrud. 2003. Isolation, characterisation and
identification of lactic acid bacteria from bushera: a
Ugandan traditional fermented beverage. Int. J. Food
Microbiol. 80:201–210.
Namgung, H.-J., H.-J. Park, I. H. Cho, H.-K. Choi, D.-Y.
Kwon, S.-M. Shim, et al. 2010. Metabolite profiling of
doenjang, fermented soybean paste, during fermentation.
J. Sci. Food Agric. 90:1926–1935.
Narvhus, J. A., K. Østeraas, T. Mutukumila, and R. K.
Abrahamsen. 1998. Production of fermented milk using
malty compound-producing strain of Lactococcus lactis
subsp. lactis biovar. diacetylactis isolated from Zimbabwe
naturally fermented milk. Int. J. Food Microbiol. 41:73–80.
Ng’ong’ola-Manani, T. A., A. M. Mwangwela, R. B. Sch€uller,
H. M. Østlie, and T. Wicklund. 2014. Sensory evaluation
and consumer acceptance of naturally and lactic acid
bacteria-fermented pastes of soybeans and soybean–maize
blends. Food Sci. Nutr. 2:114–131.
Odunfa, S. A. 1983. Carbohydrate changes in fermenting
locust bean (Parkia filicoidea) duringiru preparation. Plant
Foods Hum. Nutr. 32:3–10.
Official Journal of the European Communities. 1998.
Establishing Community methods of analysis for the
determination of amino acids, crude oils and fats, and
olaquindox in feedingstuffs and amending Directive 71/393/
EEC. Commission Directive 98/64/EC: L 257/14–L 257/28.
Palacios, M. C., M. Haros, C. M. Rosell, and Y. Sanz. 2005.
Characterization of an acid phosphatase from Lactobacillus
pentosus: regulation and biochemical properties. J. Appl.
Microbiol. 98:229–237.
Palanisamy, B. D., V. Rajendran, S. Sathyaseelan, R. Bhat, and
B. P. Venkatesan. 2012. Enhancement of nutritional value of
finger millet-based food (Indian dosa) by co-fermentation
with horse gram flour. Int. J. Food Sci. Nutr. 63:5–15.
Park, K.-B., and S.-H. Oh. 2007. Production of yogurt with
enhanced levels of gamma-aminobutyric acid and valuable
nutrients using lactic acid bacteria and germinated soybean
extract. Bioresour. Technol. 98:1675–1679.
Park, M. K., I. H. Cho, S. Lee, H.-K. Choi, D.-Y. Kwon, and
Y.-S. Kim. 2010. Metabolite profiling of Cheonggukjang, a
fermented soybean paste, during fermentation by gas
chromatography-mass spectrometry and principal
component analysis. Food Chem. 122:1313–1319.
Parkouda, C., D. S. Nielsen, P. Azokpota, L. Ivette Ir$ene
Ouoba, W. K. Amoa-Awua, L. Thorsen, et al. 2009. The
microbiology of alkaline-fermentation of indigenous seeds
used as food condiments in Africa and Asia. Crit. Rev.
Microbiol. 35:139–156.
Ray, B. 2003. Fundamental food microbiology. 3rd ed. CRC
Press, New York, NY.
Redondo-Cuenca, A., M. J. Villanueva-Su"arez, M. D.
Rodr"ıguez-Sevilla, and I. Mateos-Aparicio. 2007. Chemical
composition and dietary fibre of yellow and green
commercial soybeans (Glycine max). Food Chem. 101:1216–
1222.
Sanni, A. I. 1993. The need for process optimization of African
fermented foods and beverages. Int. J. Food Microbiol.
18:85–95.
Sarkar, P. K., and J. P. Tamang. 1995. Changes in the
microbial profile and proximate composition during natural
fermentations of soybeans to produce kinema. Food
Microbiol. 12:317–325.
Sarkar, P. K., J. P. Tamang, P. E. Cook, and J. D. Owens. 1994.
Kinema — a traditional soybean fermented food: proximate
composition and microflora. Food Microbiol. 11:47–55.
Sarkar, P. K., L. J. Jones, G. S. Craven, and S. M. Somerset.
1997a. Oligosaccharide profiles during kinema production.
Lett. Appl. Microbiol. 24:337–339.
Sarkar, P. K., L. J. Jones, G. S. Craven, S. M. Somerset, and
C. Palmer. 1997b. Amino acid profiles of kinema, a
soybean-fermented food. Food Chem. 59:69–75.
Sarkar, P. K., B. Hasenack, and M. J. R. Nout. 2002. Diversity
and functionality of Bacillus and related genera isolated
from spontaneously fermented soybeans (Indian kinema)
and locust beans (African soumbala). Int. J. Food Microbiol.
77:175–186.
Shimizo, M. 1992. Purification and characterization of phytase
from Bacillus subtilis (natto) N-77. Biosci. Biotechnol.
Biochem. 56:1266–1269.
Sindhu, S. C., and N. Khetarpaul. 2001. Probiotic fermentation
of indigenous food mixture: effect on antinutrients and
digestibility of starch and protein. J. Food Compos. Anal.
14:601–609.
Songr"e-Ouattara, L. T., C. Mouquet-Rivier, C. Icard-Verni$ere,
C. Humblot, B. Diawara, and J. P. Guyot. 2008. Enzyme
activities of lactic acid bacteria from a pearl millet
fermented gruel (ben-saalga) of functional interest in
nutrition. Int. J. Food Microbiol. 128:395–400.
Sripriya, G., U. Antony, and T. S. Chandra. 1997. Changes in
carbohydrate, free amino acids, organic acids, phytate and
HCl extractability of minerals during germination and
fermentation of finger millet (Eleusine coracana). Food
Chem. 58:345–350.
Steinkraus, K. H. 1997. Classification of fermented foods:
worldwide review of household fermentation techniques.
Food Control 8:311–317.
Terlabie, N. N., E. Sakyi-Dawson, and W. K. Amoa-Awua.
2006. The comparative ability of four isolates of Bacillus
subtilis to fermemt soybeans into dawadawa. Int. J. Food
Microbiol. 106:145–152.
Thiex, N. J., H. Manson, S. Anderson, and J.-!A. Persson. 2002.
Determination of crude protein in animal feed, forage,
grain, and oilseeds by using block digestion with a copper
catalyst and steam distillation into boric acid: collaborative
study. J. AOAC Int. 85:309–317.
Urbano, G., M. L"opez-Jurado, P. Aranda, C. Vidal-Valverde, E.
Tenorio, and J. Porres. 2000. The role of phytic acid in
ª 2014 The Authors. Food Science & Nutrition published by Wiley Periodicals, Inc. 17
T. A. Ng’ong’ola-Manani et al. Chemical Changes During Fermentation of Soybeans
legumes: antinutrient or beneficial function? J. Physiol.
Biochem. 56:283–294.
Vidal-Valverde, C., J. Fr"ıas, and S. Valverde. 1993. Changes in
the carbohydrate composition of legumes after soaking and
cooking. J. Am. Diet. Assoc. 93:547–550.
Visessanguan, W., S. Benjakul, W. Potachareon, A. Panya, and
S. Riebroy. 2005. Accelerated proteolysis of soy proteins
during fermentation of thua-nao inoculated with Bacillus
subtilis. J. Food Biochem. 29:349–366.
Vogel, R., R. Knorr, M. A. M€uller, U. Steudel, M. G€anzle, and
M. Ehrmann. 1999. Non-dairy lactic fermentations: the
cereal world. Antonie Van Leeuwenhoek 76:403–411.
Wang, H.-J., and P. A. Murphy. 1996. Mass balance study of
isoflavones during soybean processing. J. Agric. Food Chem.
44:2377–2383.
Wang, H. L., J. B. Vespa, and W. Hesseltine. 1972. Release of
bound trypsin inhibitors in soybeans by Rhizopus
oligosporus. J. Nutr. 102:1495–1500.
Wang, Y.-C., R.-C. Yu, H.-Y. Yang, and C.-C. Chou. 2003.
Sugar and acid contents in soymilk fermented with lactic
acid bacteria alone or simultaneously with bifidobacteria.
Food Microbiol. 20:333–338.
Wisselink, H. W., R. A. Weusthuis, G. Eggink, J. Hugenholtz,
and G. J. Grobben. 2002. Mannitol production by lactic acid
bacteria: a review. Int. Dairy J. 12:151–161.
Yang, H. J., S. Park, V. Pak, K. R. Chung, and D. Y. Kwon.
2011. Fermented soybean products and their bioactive
compounds. Pp. 21–59 in P. H. El-Shemy, ed. Soybean and
health. InTech Europe, Croatia.
Yoon, M. Y., and H.-J. Hwang. 2008. Reduction of soybean
oligosaccharides and properties of a-d-galactosidase from
Lactobacillus curvatus R08 and Leuconostoc mesenteriodes
JK55. Food Microbiol. 25:815–823.
Yoon, J. H., L. U. Thompson, and D. J. Jenkins. 1983. The
effect of phytic acid on in vitro rate of starch digestibility
and blood glucose response. Am. J. Clin. Nutr. 38:835–
842.
Zhao, G. Q., Y. Zhang, M. A. Hoon, J. Chandrashekar, I. E.
Erlenbach, N. J. P. Ryba, et al. 2003. The receptors for
mammalian sweet and umami taste. Cell 115:255–266.
18 ª 2014 The Authors. Food Science & Nutrition published by Wiley Periodicals, Inc.
Chemical Changes During Fermentation of Soybeans T. A. Ng’ong’ola-Manani et al.

�
�
�
�
�
�
�
�
�
�
�
�
�
�
�
�
�
�
�
�
�
�
�
�
�
�
�

�
1
Identification and characterization of lactic acid bacteria involved in
natural and lactic acid bacteria fermentations of pastes of soybeans and
soybean-maize blends using culture-dependent techniques and denaturing
gradient gel electrophoresis
Tinna Austen Ng’ong’ola-Manania,b*, Trude Wicklunda, Agnes Mbachi Mwangwelab, Hilde
Marit Østliea
aNorwegian University of Life Sciences, Department of Chemistry, Biotechnology and Food
Science, P.O Box 5003, 1430, Ås, Norway.
bLilongwe University of Agriculture and Natural Resources, Bunda College Campus,
Department of Food Science and Technology, P.O Box 219, Lilongwe, Malawi.
* Corresponding author’s email address: [email protected]
Accepted in Food Biotechnology

2
Abstract
Pastes of soybeans and soybean-maize blends were fermented without inoculum (naturally)
and with inoculum through back-slopping using lactic acid bacteria (LAB) fermented cereal
gruel, thobwa. LAB involved in the fermentations were characterized using culture-
dependent and culture-independent analyses. Decreases in pH from 6.4 to 3.9 – 4.2 and
from 6.9 to 5.4 – 5.8 after 72 h were observed in LAB fermented pastes (LFP) and in
naturally fermented pastes (NFP), respectively. LAB increased from 5.0 to 8.7 – 9.6 log10
cfu/g in NFP and from 8.1 to 9.3 log10 cfu/g in LFP. LAB in both fermentations were
heterofermentative lactobacilli (82.4%) and homofermentative cocci (17.6%), of which
44.7% and 42.9% were exopolysaccharide producers, respectively. Principal component
analysis based on carbohydrate fermentation, CO2 production and arginine hydrolysis
showed four clusters dominated by Lactobacillus fermentum, Weissella confusa,
Lactobacillus brevis 1 and Pediococcus pentosaceus, respectively. Sequencing of 16S
rDNA gene confirmed Lb. fermentum, W. confusa/W. cibaria, and P. pentosaceus as
identities of species in three clusters. Denaturing gradient gel electrophoresis (DGGE)
confirmed these species as the dominant microbiota. DGGE showed higher similarity in
microbial profiles of LFP throughout fermentation and low similarity in NFP during early
and late stages of fermentation.
Key words: soybean pastes, lactic acid bacteria, fermentation, back-slopping, culture-
dependent techniques, DGGE.
3
1. Introduction
Fermented soybean (Glycine max) foods are the subject of worldwide interest these days
because of their health-related beneficial properties (Esaki et al., 1999; Peng et al., 2003;
Park et al., 2003; Yang et al., 2011) in addition to nutritional benefits. Fermented soybean
pastes are consumed widely in Far East Asia and are commonly known as dajiang in China,
miso in Japan, and doenjang in Korea (Kim et al., 2009; Kim et al., 2010). Fermented
soybean pastes are fermented foods with soybeans as an essential ingredient; they may be
semi-solid and/or contain partially intact soybeans with optional ingredients like grains and
are fermented by naturally occurring or cultivated microorganisms (Kim et al., 2010).
In many developing countries, legumes contribute a significant proportion of protein
(Odunfa, 1983). Although soybeans have the highest protein content among legumes
(Redondo-Cuenca et al., 2007), their utilization in Malawi is limited to maize-soybean blend
flour used as a weaning food (CYE Consult, 2009; Kalimbira et al., 2004; Maleta, 2006). In
an effort to increase consumption of soybeans by all age groups, solid-state fermented
pastes of soybeans and soybean-maize blends to be used as side dishes or meat alternatives
were developed (Ng’ong’ola-Manani et al., 2014).
In Africa, most food fermentations are spontaneous by lactic acid bacteria (LAB) and yeasts
(Axelsson, 1998; Lei and Jakobsen, 2004; Mukisa et al., 2012; Oyewole, 1997). However,
solid state fermentations of soybeans favor alkaline fermentation by Bacillus subtilis
(Parkouda et al., 2009), a proteolytic organism that produces ammonia (Dakwa et al., 2005;
Sarkar and Tamang, 1995) resulting in a strong odor which some people find objectionable
(Allagheny et al., 1996; Parkouda et al., 2009). On the contrary, LAB are weakly proteolytic
and do not lead to accumulation of metabolic products that are organoleptically unpleasant
(Narvhus and Axelsson, 2003). LAB fermentations also improve flavor, texture, keeping
quality and safety of many traditional foods (Parkouda et al., 2009; Steinkraus, 1997).
Natural fermentations and LAB fermentations of pastes of soybeans and soybean-maize
blends were studied. LAB fermentations were facilitated through back-slopping using
traditional fermented cereal gruel called thobwa. The preparation of thobwa is similar to that
of gruels of Tanzania and Uganda (Kitabatake et al., 2003; Muyanja et al., 2003).
Predominant microorganisms in these gruels are LAB and yeasts (Mugula et al., 2003;
Muyanja et al., 2003; Odunfa and Adeyele, 1985). Back-slopping involves addition of
material from a previous fermentation to facilitate the initiation of a new fermentation.
4
Back-slopping results in selection of best adapted strains, some of which may be suitable for
use as starter cultures (Holzapfel, 2002; Leroy and De Vuyst, 2004). Back-slopping is still
practiced in fermentations of sourdoughs and sauerkraut (Ali, 2010; De Vuyst and Neysens,
2005; Lattanzi et al., 2013; Scheirlinck et al., 2008). Back-slopping can be achieved by
repetitive use of 5-10% (w/w) inoculation of a previously fermented batch as a starter (Nout,
1991).
Culture-dependent techniques were complemented by the culture-independent denaturing
gradient gel electrophoresis (DGGE) method. Culture-dependent techniques are limited to
isolation and cultivation of strains onto suitable substrates (Chen et al., 2008; Temmerman
et al., 2004). One of their limitations is failure to provide a true reflection of microbial
diversity in complex ecosystems (Muyzer, 1999; Muyzer and Smalla, 1998; Temmerman et
al., 2004). Lately, DGGE has been successfully and widely used to study microbial diversity
of different foods (Feligini et al., 2012; Kim et al., 2009; Miambi et al., 2003; Kim et al.,
2010; Mukisa et al., 2012). During DGGE, there is sequence-dependent separation of DNA
fragments of the same length based on decreased electrophoretic mobility of partially
melted double-stranded DNA molecule in polyacrylamide gels containing linear gradient of
DNA denaturants (Muyzer and Small, 1998; Muyzer, 1999; Temmerman et al., 2004).
Separation of a PCR amplified mixture of DNA fragments of a hypervariable region such as
16S rDNA generates a genetic fingerprint of a community (Walter et al., 2001; Meroth et
al., 2003; Muyzer and Small, 1998; Muyzer, 1999; Temmerman et al., 2004). The
community members are identified by sequencing of excised gel bands (Ferris et al., 1996).
DGGE allows simultaneous analysis of multiple samples; therefore, it has been successfully
used for investigating microbial community dynamics during food fermentations (ben Omar
and Ampe, 2000; Meroth et al., 2003; Ampe et al., 2001).
Therefore, this study aimed at characterizing LAB involved in natural and LAB accelerated
fermentations of pastes of soybeans and soybean-maize blends using culture-dependent and
culture-independent methods. In addition, the changes in bacteria diversity during
fermentation were investigated.
5
2. Materials and Methods
2.1 Preparation of fermented gruel (Thobwa)
Thobwa was produced by making maize porridge containing 15% (w/v) maize flour and
80% water according to the protocol for togwa processed in southern part of Tanzania
(Kitabatake et al., 2003). The porridge was cooled to about 50 - 60 oC before addition of
finger millet (Eleusine coracana) malt flour (5%, w/v). The porridge was left to ferment
naturally at room temperature (23 – 28 oC) for 18 h before being used as inocula in back-
slopped samples.
2.2 Preparation of soybean and soybean-maize blend pastes
Pastes of soybeans and soybean-maize blends were prepared in the laboratory according to
Ng'ong'ola-Manani et al (2014). Soybeans (Nasoko, variety code 427/6/7) were sorted,
washed and boiled for 30 min and dehulled by rubbing between palms in cold water,
washed again and then boiled for one hour (Dakwa et al. 2005). Maize (DK8071) was
boiled for two hours (to soften it) before being ground together with soybeans into a paste.
Grinding was done for 10 to 15 min in a Waring Commercial blender (800ES, Torrington,
USA) which was sterilized by boiling for 5 min. Sterile water (100 ml) was added to 500 g
material during the grinding to make pastes. Lactic acid bacteria fermentation was
facilitated by addition of thobwa. The LAB fermented pastes (LFP) were back-slopped
using 10% (v/w) thobwa. The pH of the thobwa was around 4.5 with a LAB population of
108 cfu/ml. Naturally fermented pastes (NFP) were made similarly but without adding the
thobwa. Pastes compositions were determined based on preliminary laboratory trials
whereby pastes containing 100%, 75% and 50% soybeans (the remaining proportions being
maize) were studied. The preliminary study showed no significant differences in pH
reduction and microbial loads (total aerobic counts and lactic acid bacteria counts) of pastes
containing 75% and 50% soybeans. Thus for this study, pastes were prepared according to
the following compositions: pastes of soybeans only; pastes of soybeans and maize blends
containing 90% and 75% soybeans, respectively. Naturally fermented pastes were
designated as 100S, 90S and 75S according to 100%, 90% and 75% soybean composition in
the pastes, the remaining proportions being maize. Similarly, back-slopped (BS) LAB
fermented pastes were designated 100SBS, 90SBS and 75SBS. Portions of 500 g for all
treatments were fermented at 30 oC for 72 h in glass jars. The fermenting pastes were
sampled at 0, 24, 48 and 72 h. Three independent experiments were made.

6
2.3 Determination of pH and titratable acidity
AOAC (1990), methods were used to determine pH and titratable acidity. The pH was
measured using a pH meter (WTW pH 525, D. Jurgens and Co., Bremen, Germany) fitted
with a glass electrode (WTW SenTix 97T).
2.4 Enumeration of bacteria, yeasts and molds
From each sample, 10 g was transferred aseptically into a sterile stomacher bag before
adding 90 mL sterile diluent containing 0.1% buffered peptone water (Mast DM494D, Mast
Group Ltd, Merseyside,UK) and homogenising in a VWR Star-blenderTM LB400 (VWR,
France) for 120 s. From the homogenate, appropriate ten-fold dilutions were taken for
enumeration of aerobic mesophiles on Plate Count Agar (PCA, Merck, Darmstadt,
Germany), lactic acid bacteria were enumerated on De Man, Rogosa and Sharpe Agar
(MRS, Merck), and lactococci were enumerated on M17 agar (Merck), all after incubation
at 30 oC for 48 h. Lactobacilli were enumerated on Lactobacillus selective agar (LBS agar
BBLTM, Becton, Dickinson and Company, Le Pont de Claix, France) incubated in anaerobic
jars containing AnaeroGenTM sachet (Oxoid AN35A, Oxoid Ltd, Basingstoke, Hampshire,
England) at 30 oC for 4 days. Bacillus were isolated on Brain Heart Infusion agar (BHI
agar, Merck) by spore plating in which the homogenate was heated to 80 oC for 10 min
according to Harrigan (1998). Yeasts and molds were enumerated on Rose Bengal
Chloramphenicol agar (RBC agar, Oxoid) containing 100 mg chloramphenicol
(Chloramphenicol Supplement SR0078E, Oxoid) per litre incubated at 25 oC for 3 – 5 days.
Coliforms were enumerated on Violet Red Bile agar with lactose (VRBA, Merck) at 37 oC
for 24 hours.
2.5 Isolation of lactic acid bacteria
Five colonies each were randomly picked from the fermenting pastes isolated on MRS, M17
and LBS agar for purification at all sampling times. A total of 360 isolates were screened
and only Gram-positive and catalase negative organisms were selected for further
characterization. Eventually, 239 isolates were subcultured to purity at least twice on MRS.
The pure cultures were frozen and stored at -20 oC in MRS medium containing 15% (v/v)
glycerol.
7
2.6 Phenotypic characterization of lactic acid bacteria
Gram’s staining and catalase reaction (3% H2O2) were carried out on the isolates. A total of
239 Gram-positive and catalase negative isolates were characterized morphologically by
light microscopy, CO2 production from glucose, growth in MRS broth containing 7% and
10% salt, growth at 4 oC, 15 oC and 45 oC, growth at pH 3.9 and hydrolysis of arginine
according to Schillinger and Lucke (1987) and Samelis et al. (1994). Production of dextran
(slime) from sucrose was determined on MRS agar in which glucose was replaced by 5%
(w/v) sucrose (Schillinger and Lucke, 1987; Samelis et al., 1994). Amylolytic activity was
determined on MRS agar in which glucose was replaced with 2% (w/v) soluble starch
(Oguntoyinbo, 2007). A single line streak of each pure isolate was made on MRS-starch
agar before incubation at 30 oC for 48 h. Enzymatic activity was indicated as clear zones on
the plates after flooding with iodine solution (Dakwa et al., 2005). Isolates were grouped
according to similarities of the physiological characteristics. Representative isolates, 72
(30%) from the different groups were assessed for CO2 production in MRS broth after
incubation at 30 oC for 24 h, using an infrared gas analyzer (ADC 225 MK3, The Analytical
Development Hertfordshire, UK) connected to a Chromatopac (C-R3A, Shimadzu
Analytical Instruments, Kyoto, Japan) according to Narvhus et al. (1992). Carbohydrate
fermentation patterns of the representative isolates were determined using API 50 CH
gallery with API 50 CHL medium (BioMérieux, Marcy L’Etoile, France) according to
manufacturer’s specifications. Anaerobic conditions in the inoculated tubes were obtained
by overlaying with sterile paraffin oil. The results were recorded after 24 h and 48 h and
were interpreted using apiweb (BioMérieux).
2.7 16S rDNA sequence analysis of pure isolates
Genomic DNA from 43 out of the 72 isolates was extracted from cells harvested from
overnight cultures. DNA was extracted using GenEluteTM Bacterial Genomic DNA kit
(Sigma-Aldrich, St Louis, Missouri) according to manufacturer’s instructions with some
modifications. Bead beating was introduced after incubation with proteinase K. The lysis
solution (400 µl) contained 45 mg/ml lysozyme (Sigma, Aldrich), 250 U/ml mutanolysin
(Sigma, Aldrich) and 0.5 g of acid-washed glass beads (Sigma, Aldrich). The cells were
lysed in a cell disrupter (FastPrep® FP 120 BIO101, ThermoSavant) for 20 s at 6 m/s. The
reaction mixture was then centrifuged at 16, 000 x g for 3 min and the liquid was transferred

8
into a new Eppendorf tube. Remaining glass beads were removed by giving the mixture a
short spin. Subsequent DNA recovery was done according to the manufacturer’s
instructions. The quality and concentration of the DNA were determined using a nanoDrop
spectrophotometer (ND-1000 spectrophotometer, V3.2, Wilmington, USA).
Universal primers, 1F (5′ GAGTTTGATCCTGGCTCAG 3′) and 5R/1492R (5′
GGTTACCTTGTTACGACTT 3′) were used to amplify the 16S rDNA gene. The PCR
reactions were performed in a final volume of 50 µl containing 5 µl 10x PCR buffer
(Finnzymes Oy, Espoo, Finland), 1 µl (10 mM) dNTP mixture (Finnzymes), 0.5 µl 1F
primer (100 pmol/µl), 0.5 µl 5R primer (100 pmol/µl), 0.5 µl (2 U/µl) DyNAzyme™ II
DNA polymerase (Finnzymes), 3 µl template DNA and 39.5 µl milliQ-water. The samples
were amplified in a DNA Thermocycler (MJ research PTC-200 Inc., California, USA) with
an initial denaturation step at 94 oC for 3 min, followed by 29 cycles of denaturation (94 oC,
3 s), annealing (55 oC, 3 s), extension (72 oC, 3 min) and final extension (72 oC, 10 min).
The sizes of the amplicons were checked by electrophoresis on 1% agarose gels. Prior to
sequencing, PCR products were purified using QIAquickR PCR Purification kit (Qiagen,
Hilden, Germany) according to manufacturers’ instructions. The PCR products were sent to
GATC Biotech (Konstanz, Germany) for sequencing. Sequences were edited in BioEdit
software (Ibs Biosciences, Carlsbad, CA) and were compared in Genbank using the BLAST
algorithm (http://www.ncbi.nlm.nih.gov/blast).
2.8 Total DNA extraction from the pastes
Fermented pastes (10 g) were suspended in 90 ml of 0.9% NaCl and homogenized in a
stomacher blender (Seward Laboratory blender, STOMACHER 400) for 2 min. Avoiding
debris, 30 ml of the mixture was collected and centrifuged at 800 x g for 5 min at 4 oC. Ten
ml of the supernatant was transferred into a new centrifuge tube and the contents were
centrifuged at 12, 000 x g for 15 min at 4 oC. The supernatant was discarded and the pellet
was suspended with 1 ml of 0.9% NaCl to wash the cells. The cells were centrifuged at 16,
000 x g for 2 min and were washed two times. DNA extraction was done according to the
procedure described for pure isolates with minor modifications. To increase the quality of
community DNA extracted from starchy foods, 20 µl of 10% hexadecyltrimethyl-
ammonium bromide (CTAB) (Ampe et al., 1998), was added during incubation with
proteinase K. The extracted DNA was used as template for PCR amplification for DGGE
analysis.
9
2.9 DGGE analysis and band identification
Universal primers PRBA338fgc (5’ C GCC CGC CGC GCG CGG CGG GCG GGG CGG
GGG CAC GGG GGG ACT CCT ACG GGA GGC AGC AG’3) and PRUN518r (5’ATT
ACC GCG GCT GCT GG ‘3) targeting the V3 region of 16S rDNA and suited for DGGE
were used (Øvreås et al., 1997). PCR was performed in a final volume of 50 µl containing 5
µl 10X DreamTaqTM Green Buffer (Fermentas GmbH, Leon-Rot, Germany), 8 µl dNTP-
mix (1.25 mM (Finnzymes), 1.0 µl forward primer (5 pmol/µl) 1.0 µl reverse primer (5
pmol/µl), 0.5 µl formamide, 0.5 µl bovine serum albumin (1mg/ml), 0.25 µl DreamTaqTM
DNA polymerase (5U/µl) (Fermentas), 3 µl template DNA and 30.75 µl milliQ-water. The
samples were amplified in a thermal cycler (BIO-RAD C1000™, Bio Rad Laboratories Inc.,
USA). Amplification conditions included an initial denaturation at 94 °C for 5 min followed
by 34 cycles of denaturation (94 °C, 30 s), annealing (53 °C, 60 s), extension (72 °C, 60 s)
and final extension (72 °C, 10 min). Gel electrophoresis, band excision and DNA elution
were done according to Porcellato et al. (2012) except that the gels contained 20% to 50%
urea-formamide as denaturants. The eluted DNA was reamplified using the same primer set
but without the GC-clamp on the forward primer. The PCR products were purified using
QIAquickR PCR Purification kit (Qiagen) according to manufacturers’ instructions and
were sent to GATC Biotech (Germany) for sequencing. Sequences were searched in
Genbank using the BLAST algorithm.
Cluster analysis of DGGE fingerprints was performed in GelCompar II software version
6.5. The fingerprints were processed according to the software’s manual. Similarity between
DGGE profiles was calculated according to Dice’s similarity coefficients and a dendrogram
was constructed using unweighted pair group method with arithmetic average (UPMGA).
2.10 Statistical analysis
Analysis of variance (ANOVA) at p=0.05 was performed in SPSS 15.0 (SPSS Inc.,
Chicago, Illinois., USA) to find out if type of fermentation and duration of fermentation had
significant effects on pH, titratable acidity and microbial counts among the samples.
Principal component analysis was done to group isolates based on carbohydrate
fermentation profile from API, CO2 production, and arginine hydrolysis. A matrix was
generated based on colors of the results of the API reading after 48 h in which 1 was
definitely negative and 5 was definitely positive; strains able to produce >1000 mg/kg of
CO2 were considered heterofermentative and positive, those that produced less were
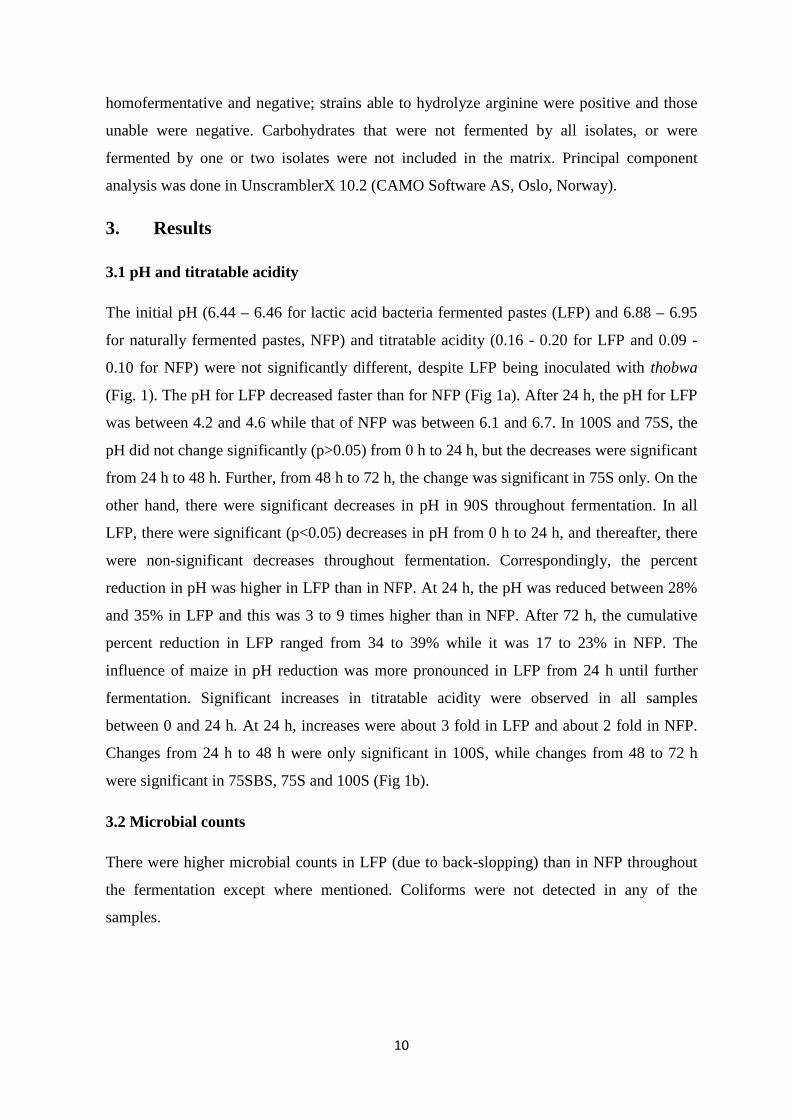
10
homofermentative and negative; strains able to hydrolyze arginine were positive and those
unable were negative. Carbohydrates that were not fermented by all isolates, or were
fermented by one or two isolates were not included in the matrix. Principal component
analysis was done in UnscramblerX 10.2 (CAMO Software AS, Oslo, Norway).
3. Results
3.1 pH and titratable acidity
The initial pH (6.44 – 6.46 for lactic acid bacteria fermented pastes (LFP) and 6.88 – 6.95
for naturally fermented pastes, NFP) and titratable acidity (0.16 - 0.20 for LFP and 0.09 -
0.10 for NFP) were not significantly different, despite LFP being inoculated with thobwa
(Fig. 1). The pH for LFP decreased faster than for NFP (Fig 1a). After 24 h, the pH for LFP
was between 4.2 and 4.6 while that of NFP was between 6.1 and 6.7. In 100S and 75S, the
pH did not change significantly (p>0.05) from 0 h to 24 h, but the decreases were significant
from 24 h to 48 h. Further, from 48 h to 72 h, the change was significant in 75S only. On the
other hand, there were significant decreases in pH in 90S throughout fermentation. In all
LFP, there were significant (p<0.05) decreases in pH from 0 h to 24 h, and thereafter, there
were non-significant decreases throughout fermentation. Correspondingly, the percent
reduction in pH was higher in LFP than in NFP. At 24 h, the pH was reduced between 28%
and 35% in LFP and this was 3 to 9 times higher than in NFP. After 72 h, the cumulative
percent reduction in LFP ranged from 34 to 39% while it was 17 to 23% in NFP. The
influence of maize in pH reduction was more pronounced in LFP from 24 h until further
fermentation. Significant increases in titratable acidity were observed in all samples
between 0 and 24 h. At 24 h, increases were about 3 fold in LFP and about 2 fold in NFP.
Changes from 24 h to 48 h were only significant in 100S, while changes from 48 to 72 h
were significant in 75SBS, 75S and 100S (Fig 1b).
3.2 Microbial counts
There were higher microbial counts in LFP (due to back-slopping) than in NFP throughout
the fermentation except where mentioned. Coliforms were not detected in any of the
samples.
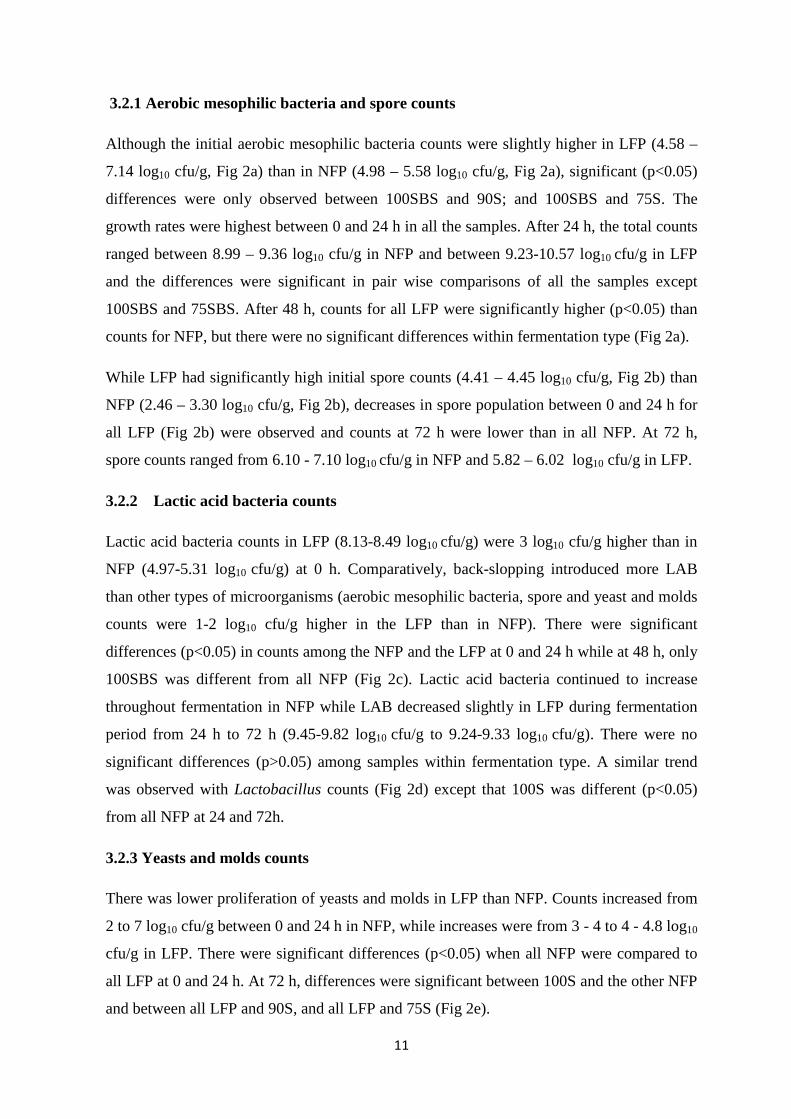
11
3.2.1 Aerobic mesophilic bacteria and spore counts
Although the initial aerobic mesophilic bacteria counts were slightly higher in LFP (4.58 –
7.14 log10 cfu/g, Fig 2a) than in NFP (4.98 – 5.58 log10 cfu/g, Fig 2a), significant (p<0.05)
differences were only observed between 100SBS and 90S; and 100SBS and 75S. The
growth rates were highest between 0 and 24 h in all the samples. After 24 h, the total counts
ranged between 8.99 – 9.36 log10 cfu/g in NFP and between 9.23-10.57 log10 cfu/g in LFP
and the differences were significant in pair wise comparisons of all the samples except
100SBS and 75SBS. After 48 h, counts for all LFP were significantly higher (p<0.05) than
counts for NFP, but there were no significant differences within fermentation type (Fig 2a).
While LFP had significantly high initial spore counts (4.41 – 4.45 log10 cfu/g, Fig 2b) than
NFP (2.46 – 3.30 log10 cfu/g, Fig 2b), decreases in spore population between 0 and 24 h for
all LFP (Fig 2b) were observed and counts at 72 h were lower than in all NFP. At 72 h,
spore counts ranged from 6.10 - 7.10 log10 cfu/g in NFP and 5.82 – 6.02 log10 cfu/g in LFP.
3.2.2 Lactic acid bacteria counts
Lactic acid bacteria counts in LFP (8.13-8.49 log10 cfu/g) were 3 log10 cfu/g higher than in
NFP (4.97-5.31 log10 cfu/g) at 0 h. Comparatively, back-slopping introduced more LAB
than other types of microorganisms (aerobic mesophilic bacteria, spore and yeast and molds
counts were 1-2 log10 cfu/g higher in the LFP than in NFP). There were significant
differences (p<0.05) in counts among the NFP and the LFP at 0 and 24 h while at 48 h, only
100SBS was different from all NFP (Fig 2c). Lactic acid bacteria continued to increase
throughout fermentation in NFP while LAB decreased slightly in LFP during fermentation
period from 24 h to 72 h (9.45-9.82 log10 cfu/g to 9.24-9.33 log10 cfu/g). There were no
significant differences (p>0.05) among samples within fermentation type. A similar trend
was observed with Lactobacillus counts (Fig 2d) except that 100S was different (p<0.05)
from all NFP at 24 and 72h.
3.2.3 Yeasts and molds counts
There was lower proliferation of yeasts and molds in LFP than NFP. Counts increased from
2 to 7 log10 cfu/g between 0 and 24 h in NFP, while increases were from 3 - 4 to 4 - 4.8 log10
cfu/g in LFP. There were significant differences (p<0.05) when all NFP were compared to
all LFP at 0 and 24 h. At 72 h, differences were significant between 100S and the other NFP
and between all LFP and 90S, and all LFP and 75S (Fig 2e).
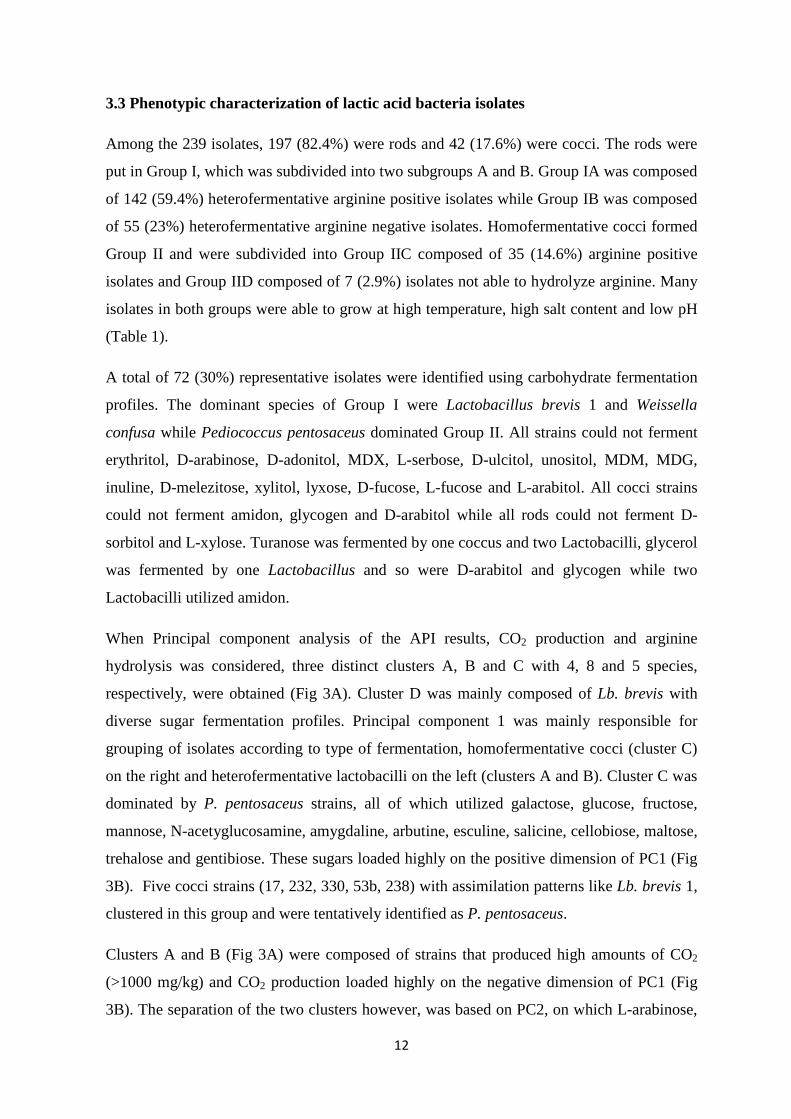
12
3.3 Phenotypic characterization of lactic acid bacteria isolates
Among the 239 isolates, 197 (82.4%) were rods and 42 (17.6%) were cocci. The rods were
put in Group I, which was subdivided into two subgroups A and B. Group IA was composed
of 142 (59.4%) heterofermentative arginine positive isolates while Group IB was composed
of 55 (23%) heterofermentative arginine negative isolates. Homofermentative cocci formed
Group II and were subdivided into Group IIC composed of 35 (14.6%) arginine positive
isolates and Group IID composed of 7 (2.9%) isolates not able to hydrolyze arginine. Many
isolates in both groups were able to grow at high temperature, high salt content and low pH
(Table 1).
A total of 72 (30%) representative isolates were identified using carbohydrate fermentation
profiles. The dominant species of Group I were Lactobacillus brevis 1 and Weissella
confusa while Pediococcus pentosaceus dominated Group II. All strains could not ferment
erythritol, D-arabinose, D-adonitol, MDX, L-serbose, D-ulcitol, unositol, MDM, MDG,
inuline, D-melezitose, xylitol, lyxose, D-fucose, L-fucose and L-arabitol. All cocci strains
could not ferment amidon, glycogen and D-arabitol while all rods could not ferment D-
sorbitol and L-xylose. Turanose was fermented by one coccus and two Lactobacilli, glycerol
was fermented by one Lactobacillus and so were D-arabitol and glycogen while two
Lactobacilli utilized amidon.
When Principal component analysis of the API results, CO2 production and arginine
hydrolysis was considered, three distinct clusters A, B and C with 4, 8 and 5 species,
respectively, were obtained (Fig 3A). Cluster D was mainly composed of Lb. brevis with
diverse sugar fermentation profiles. Principal component 1 was mainly responsible for
grouping of isolates according to type of fermentation, homofermentative cocci (cluster C)
on the right and heterofermentative lactobacilli on the left (clusters A and B). Cluster C was
dominated by P. pentosaceus strains, all of which utilized galactose, glucose, fructose,
mannose, N-acetyglucosamine, amygdaline, arbutine, esculine, salicine, cellobiose, maltose,
trehalose and gentibiose. These sugars loaded highly on the positive dimension of PC1 (Fig
3B). Five cocci strains (17, 232, 330, 53b, 238) with assimilation patterns like Lb. brevis 1,
clustered in this group and were tentatively identified as P. pentosaceus.
Clusters A and B (Fig 3A) were composed of strains that produced high amounts of CO2
(>1000 mg/kg) and CO2 production loaded highly on the negative dimension of PC1 (Fig
3B). The separation of the two clusters however, was based on PC2, on which L-arabinose,

13
D-ribose, D-xylose, melibiose, D-raffinose and potassium-5-celuconate loaded highly on the
positive dimension (Fig 3B). In cluster A, all Lb. brevis 3 strains utilized L-arabinose, D-
xylose and D-ribose while all Lb. fermentum strains fermented the mentioned sugars plus D-
raffinose. Further, all strains of the two species showed partial fermentation of potassium-5-
celuconate.
Cluster B was dominated by W. confusa which were arginine positive (with a few
exceptions). All isolates in cluster B fermented glucose, fructose, mannose, esculine and
maltose. The isolates also fully or partially fermented potassium gluconate, D-xylose and N-
acetylglucosamine. Some isolates also utilized amygdaline (105), arbutine (105), and
trehalose (105, 205).
Most isolates identified as Lb. brevis 1 grouped into cluster D and were all arginine positive
and heterofermentative. They all utilized glucose, fructose, mannose, esculine, cellobiose
and maltose. With exception of the strains in parenthesis, fermentation or partial
fermentation of the following sugars was observed: L-arabinose (106s), ribose (172), D-
xylose, N-acetylglucosamine, amygdaline (225c), arbutine, salicine, melibiose (106b, 172),
saccharose (106b, 140b, 371a), trehalose (172), gentibiose (172R), and potassium gluconate
(172R). Partial fermentation of potassium-5-celuconate was done by 181s, 181b, 182s, and
324w.
Lactobacillus pentosus 127R was placed close to cluster D, since it was heterofermentative
and arginine positive. Apart from utilizing all sugars used by the cocci, this isolate also
fermented melibiose, saccharose, raffinose, turanose, lactose (Fig 3B) and partially
fermented mannitol, amygdaline, potassium gluconate and potassium-5-celuconate. The
isolate was close to the heterofermentative, arginine positive Lb. plantarum 273 on the
principal component analysis map (Fig 3A), indicating similarity in fermentation profiles
except that the later did not ferment turanose, potassium gluconate and potassium-5-
celuconate but fermented starch and melezitose.
Almost all species identified by API were present in both LFP and NFP from the onset and
throughout the fermentation period. API identification showed that Lb. brevis 1 (19.2%), W.
confusa (17.8%) and P. pentosaceus (13.7%) were the dominant species. Table 2 shows the
distribution of strains based on API identification. At 0h, Lb. buchneri and P. pentosaceus
were identified from both NFP and LFP while Lb. fermentum and W. confusa were only
identified in LFP and Lb. plantarum 1 was only identified in NFP. At 24h more species

14
appeared, Lb. brevis 1, Lb. brevis 3, Lactococcus. lactis, P. pentosaceus and W. confusa
were identified in both NFP and LFP, Lb. delbrueckii, Lb. fermentum, and P. damnosus
were only identified in NFP while Lb. buchneri and Leu. mesenteroides were identified in
LFP only. At 48 h, new species were Lb. acidophilus and Lb. collinoides in NFP, Lb.
pentosus and Lb. plantarum 1 and 2 in LFP. At 72 h, Lb. acidophilus and L.brevis 1 were
identified in LFP.
3.4 Identification of isolates by 16S rDNA sequencing
Among the 72 strains characterized by API, 43 representative strains were identified using
16S rDNA gene sequencing. Bacillus spp. and Enterococcus faecium were identified in
addition to the species identified by API. The dominant species of Group I (Table 1) were
found to be W. cibaria and Lb. fermentum while P. pentosaceus was the only species
identified in Group II (Table 1). Subgroup A (Table 1) was composed of Lb. buchneri, Lb.
brevis 3, Lb.collinoides and Lb. fermentum, according to API identification, however, all
strains were identified as Lb. fermentum by 16S rDNA except two Lb. brevis 3 strains which
were identified as Lb. brevis (Table 3). Most strains in subgroup B (Table 1) were identified
as W. cibaria, except one strain of Lb. delbrueckii ssp. delbrueckii which was identified as
W. confusa. All cocci in subgroup C (Table 1) were identified as P. pentosaceus including
the five strains (17, 232, 330, 53b, 238) with fermentation profiles similar to Lb. brevis 1.
Principal component analysis grouped isolates with similar fermentation patterns into
clusters with dominant strains representing the correct classification at species level when
compared with 16S rDNA. For instance cluster A was dominated by Lb. fermentum and 7 of
9 strains 16S rDNA sequenced from this cluster were Lb. fermentum. Sixteen isolates
representing 7 species and grouped in a Weissella dominated cluster (cluster B) were
identified as W. confusa or W. cibaria by 16S rDNA sequencing. Further, all 10 strains
sequenced from cluster C were confirmed as P. pentosaceus, although there were three
lactobacilli identified as Lb. brevis 1 which were clearly misplaced into this cluster. These
lactobacilli could not ferment saccharose and raffinose as the other Lb. brevis 1, hence their
placement in cluster C. Two Lb. brevis 1 strains in cluster D were identified as Lb.
fermentum by 16S rDNA sequencing.

15
3.5 Bacteria community based on DGGE analysis
Culture-independent techniques based on amplification of the V3 region of the 16S rDNA
gene were used to identify bacteria diversity of the fermenting pastes throughout
fermentation. Figure 4 shows changes in the microflora of NFP and LFP during
fermentation. Weissella cibaria/W. confusa were the dominant organisms from the
beginning (0 h in LFP and 24 h in NFP) of the fermentation to the end as shown by the
intensity of their bands (Fig. 4 bands 4, 6 and 11; Table 4). Although Lactobacillus
fermentum was present at 0 h in 100S (Fig. 4 band 13), but in other NFP this species
appeared at 48 h while in all LFP, the species appeared at 24 h (Fig.4 band 3).
At 0 h, Lb. fermentum (bands 7 and 13), Bacillus spp. (band 14) and uncultured bacteria
(band 15) were recovered in NFP (Fig. 4; Table 4) while in LFP uncultured Weissella (band
1), W. koreensis (band 2), W. confusa/W. cibaria (bands 6 and 11), and P. pentosaceus
(band 5) were recovered (Fig. 4 lanes 100SBS 1, 90SBS 1, 75SBS 1; Table 4). At 24 h,
uncultured Weissella (band 1), W. confusa/W. cibaria (bands 4, 6, 11) and Lb. linderi (band
12) appeared while Bacillus (band 14) disappeared in NFP (Fig. 4 lanes 100S 2, 90S 2, 75S
2; Table 4). In LFP, an additional species at 24 h was Lb. fermentum (band 3). At 48 h, all
microorganisms (except Bacillus, band 14) present at 0 and 24 h were recovered in NFP
(Fig 4. lanes 100S 3, 90S 3, and 75S 3; Table 4) as well as in LFP (lanes 100SBS 3, 90SBS
3 and 75SBS 3), although LFP showed P. pentosaceus as weak bands (band 5) and no Lb.
linderi (band 12). At 72 h, the microflora of NFP (Fig. 4 lanes 100S 4, 90S 4, and 75S 4;
Table 4) and LFP (Fig. 4 lanes 100SBS 4, 90SBS 4, 75SBS 4; Table 4) were similar; Lb.
linderi (band 12) had disappeared in NFP (100S) while P. pentosaceus (band 5) was
detected in both fermentation types as weak bands.
3.6 Bacterial profile of the samples
Cluster analysis of the DGGE profiles showed low similarity in microbial communities
between NFP and LFP during early stages of fermentation. Three distinct clusters and outer
groupings were formed, most LFP clustered separately from NFP. All 75SBS and 90SBS
samples plus 100SBS 72h formed one cluster with 70% similarity, remaining 100SBS
samples clustered together with 75S 48h and 72h (78% similarity), while 100S and 90S also
clustered together (68% similarity). Outer groupings were formed by all NFP samples at 0 h
and 75S and 90S at 24 h (Fig 5).
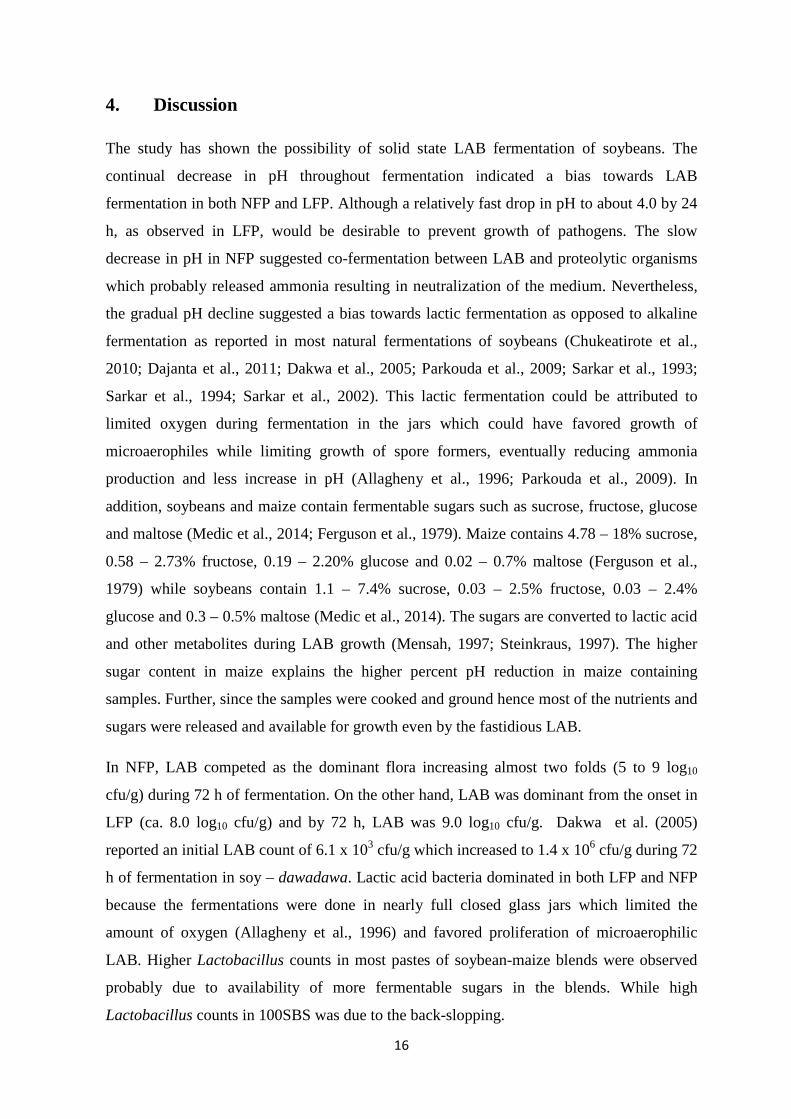
16
4. Discussion
The study has shown the possibility of solid state LAB fermentation of soybeans. The
continual decrease in pH throughout fermentation indicated a bias towards LAB
fermentation in both NFP and LFP. Although a relatively fast drop in pH to about 4.0 by 24
h, as observed in LFP, would be desirable to prevent growth of pathogens. The slow
decrease in pH in NFP suggested co-fermentation between LAB and proteolytic organisms
which probably released ammonia resulting in neutralization of the medium. Nevertheless,
the gradual pH decline suggested a bias towards lactic fermentation as opposed to alkaline
fermentation as reported in most natural fermentations of soybeans (Chukeatirote et al.,
2010; Dajanta et al., 2011; Dakwa et al., 2005; Parkouda et al., 2009; Sarkar et al., 1993;
Sarkar et al., 1994; Sarkar et al., 2002). This lactic fermentation could be attributed to
limited oxygen during fermentation in the jars which could have favored growth of
microaerophiles while limiting growth of spore formers, eventually reducing ammonia
production and less increase in pH (Allagheny et al., 1996; Parkouda et al., 2009). In
addition, soybeans and maize contain fermentable sugars such as sucrose, fructose, glucose
and maltose (Medic et al., 2014; Ferguson et al., 1979). Maize contains 4.78 – 18% sucrose,
0.58 – 2.73% fructose, 0.19 – 2.20% glucose and 0.02 – 0.7% maltose (Ferguson et al.,
1979) while soybeans contain 1.1 – 7.4% sucrose, 0.03 – 2.5% fructose, 0.03 – 2.4%
glucose and 0.3 – 0.5% maltose (Medic et al., 2014). The sugars are converted to lactic acid
and other metabolites during LAB growth (Mensah, 1997; Steinkraus, 1997). The higher
sugar content in maize explains the higher percent pH reduction in maize containing
samples. Further, since the samples were cooked and ground hence most of the nutrients and
sugars were released and available for growth even by the fastidious LAB.
In NFP, LAB competed as the dominant flora increasing almost two folds (5 to 9 log10
cfu/g) during 72 h of fermentation. On the other hand, LAB was dominant from the onset in
LFP (ca. 8.0 log10 cfu/g) and by 72 h, LAB was 9.0 log10 cfu/g. Dakwa et al. (2005)
reported an initial LAB count of 6.1 x 10³ cfu/g which increased to 1.4 x 10⁶ cfu/g during 72
h of fermentation in soy – dawadawa. Lactic acid bacteria dominated in both LFP and NFP
because the fermentations were done in nearly full closed glass jars which limited the
amount of oxygen (Allagheny et al., 1996) and favored proliferation of microaerophilic
LAB. Higher Lactobacillus counts in most pastes of soybean-maize blends were observed
probably due to availability of more fermentable sugars in the blends. While high
Lactobacillus counts in 100SBS was due to the back-slopping.
17
Different growth trends were observed in yeast and mold populations and in spore counts.
All the initial counts were higher in LFP than in NFP probably due to the back-slopping, but
as fermentation progressed; spore numbers and yeast and mold counts in LFP were lower
than in NFP suggesting inhibition. Low spore proliferation in LFP could be due to an
increase in acidity in LFP as the pH dropped from 6.4 to ca. 4.0 during 24 h fermentation.
Spore formers that dominate soybean fermentations are mostly B. subtilis (Dakwa et al.,
2005; Sarkar et al., 2002; Sarkar et al., 1994), and they exhibit active growth at pH-range
between 5.5 and 8.5 (Chantawannakul et al., 2002). Inhibition of spore formers could
improve safety of the fermented products because some pathogenic sporulating organisms
like Clostridium spp. have been implicated in foodborne disease outbreaks associated with
fermented foods including pastes of soybeans (Motarjemi, 2002). Unlike Bacillus spp.,
yeasts proliferate even in acidic conditions causing spoilage of low acid foods (Praphailong
and Fleet, 1997). Therefore, low yeast and mold proliferation in LFP could suggest an
inhibitory effect other than acidity by LAB. Production of CO2 by heterofermentative LAB
may have inhibited growth of obligately aerobic yeasts which have an exclusive oxidative
metabolism (Rosenfeld and Beauvoit, 2003). In addition, the possibility of production of
bacteriocins active against yeasts may be suggested because LAB producing such
bacteriocins have been reported (Atanassova et al., 2003).
Phenotypic identification showed Lb. brevis 1 as the dominant species. However, Lb. brevis
1 strains varied in their sugar fermentation profiles, hence were placed in all clusters. Their
spreading in different clusters suggested differences in fermentation patterns within the Lb.
brevis group. All Lb. brevis not included in cluster A were atypical because they fermented
amygdaline and most also fermented trehalose (Kandler and Weiss, 1986). Strains in cluster
A were typical for obligate heterofermentative Lactobacillus spp. fermenting glucose and
fructose, and unable to ferment amygdaline, mannitol, rhamnose and sorbitol (Hammes et
al., 1992). Although strains 106b, 140b, and 371a were heterofermentative rods identified as
Lb. brevis 1 by API, they were clustered together with P. pentosaceus in cluster C because
of their inability to ferment saccharose and raffinose. Sánchez et al. (2000) classified
isolates as Lb. brevis 2 based on their ability to ferment raffinose and saccharose.
This study agrees with studies of Boyd et al. (2005), Østlie et al. (2004.) and Andrighetto et
al. (1998) in which phenotypic identification based on API 50CH mismatched genotypic
identification of some Lactobacillus spp. The mismatches were attributed to poor
discriminatory power of API because of atypical fermentation patterns in a number of

18
species, particularly in Lb. brevis 1 and P. pentosaceus. Most isolates identified as Lb.
brevis by API were identified as Lb. fermentum by 16S rDNA sequencing. In addition, some
cocci with fermentation patterns similar to Lb. brevis 1 on API, were identified as P.
pentosaceus by 16S rDNA gene sequencing. Physiological and biochemical criteria used for
strain identification are often ambiguous because most of the Lactobacillus species have
very similar nutritional requirements and grow under similar environmental conditions
(Andrighetto et al., 1998). Thus, phenotypic heterogeneity among Lactobacillus spp.
account for discrepancies between genotypic and phenotypic identification (Boyd et al.,
2005; Vandamme et al., 1996). The strain–to–strain variability within a species in
phenotypic characteristics may be partly explained by encoding of specific properties
located on plasmids (Hammes et al., 1992).
Genotyping revealed that seven species were involved in the fermentation of the pastes
including E. faecium/E. durans and Bacillus spp. Bacillus spp. are important predominant
microorganisms that cause proteolysis in alkaline fermented soybeans (Dakwa et al., 2005;
Sarkar et al., 1994; Steinkraus, 2002). Enterococcus faecium have also been isolated in
soybean fermentations (Kim et al., 2009; Sarkar and Tamang, 1995; Sarkar et al., 1994).
Although some Enterococcus faecalis/E. faecium strains are used as probiotics (Franz et al.,
2003; Lund and Edlund, 2001) and others produce bacteriocins with activity against food
spoilage and pathogenic bacteria (Criado et al., 2006), they are also known nosocomial
pathogens with resistance to a variety of antibiotics (Banwo et al., 2013; Yoon et al., 2008;
Yousif et al., 2005). Therefore, E. faecalis/E. faecium strains unintentionally found in food
raise a food safety concern.
Lactobacillus fermentum, P. pentosaceus and W. confusa have been reported in lactic acid
fermentations of cereal based products of Africa (Kalui et al., 2010; Mukisa et al., 2012;
Oyewole, 1997). These organisms were dominant species in naturally fermented millet
porridge (Lei and Jakobsen, 2004). Their presence in lactic acid bacteria fermented pastes
could be attributed to the back-slopping material which was maize and finger millet based.
Their presence in naturally fermented pastes however, suggested they were contaminants
from the environment. Although studies on soybean fermentation have focused on Bacillus
spp., many LAB species have been isolated. For instance, Leu. mesenteroides,
Tetragenococcus halophilus, and E. faecium were observed as the dominant bacteria species
in Korean deonjang, while Lb. sakei, P. pentosaceus, Lb. plantarum, W. confusa and other
Lactobacillus spp. were also detected (Kim et al., 2009). Pediococcus pentosaceus, Lb.
19
plantarum, Lb. delbrueckii ssp. delbrueckii, Lb. vaccinostercus, Lb. collinoides, Lb. panis,
Lb. pentosus, Lb. fructivorans, E. faecium, E. durans, E. avium and E. feacalis were isolated
in a Chinese fermented soybean paste (Cui et al., 2012). Further, Kim et al. (2010) isolated
W. cibaria, Lb. citreum, Leu. pseudomesenteroides and P. pentosaceus in Japanese
fermented soybean pastes.
The dominance of Weissella spp., Lb. fermentum, and P. pentosaceus probably suggests
they have important roles in lactic acid fermentation of soybeans hence could be explored as
starter cultures. Their roles could be organoleptic, contributing to the flavor and texture of
the pastes. For instance, acidification of food by both homofermentative and
heterofermentative LAB imparts a tangy lactic acid taste (Leroy and De Vuyst, 2004). In
addition, LAB produces aromatic and volatile compounds from bioconversion, that
contributes to typical flavor of certain fermented products when pyruvate enters alternative
pathways leading to generation of acetate, ethanol, diacetyl, and acetaldehyde (Leroy and
De Vuyst, 2004). Another important characteristic of the isolates was their ability to
produce exopolysaccharides (EPS). The use of EPS-forming starter cultures to improve
rheological properties of dairy products is well known (Ruas-Madiedo et al., 2002; Leroy
and De Vuyst, 2004). In sourdoughs, EPS influence the viscoelastic properties of the dough
and has beneficial effects that improve dough rheology, bread texture and shelf life of the
bread (Galle and Arendt, 2014; Tieking et al., 2003). Application of EPS in the bakery
industry includes beneficial effect on bread volume and staling (Leroy and De Vuyst, 2004).
Thus, EPS in the fermented soybean pastes could influence organoleptic properties as
texture improvers responsible for cohesion of the matrix. Therefore, a better understanding
of the structure–function relationship of EPS in soybean fermented products is crucial to
expand their technological applications. Further research is required to determine the roles
of the LAB in fermented soybean pastes since functional or technological properties of the
LAB were not investigated in this study.
Diversity of microorganisms identified with DGGE was almost similar as identified with
culture-dependent techniques, except that Lb. brevis and E. faecium were not recovered with
DGGE while two other species, Lb. linderi and W. koreensis were detected. Although
DGGE gives a better reflection of the actual diversity in complex ecosystems, failure to
recover species representing less than 1% of the total community has been reported as its
limitation (Miambi et al., 2003). The cell numbers of Lb. brevis and E. faecium/E. durans
could have been lower than the DGGE threshold detection limit. A 104 cfu/ml detection

20
limit of PCR-DGGE has been indicated as one of the limitations of PCR-DGGE techniques
(Cocolin et al., 2004). Other reasons for failure to recover the species could include choice
of PCR primers, as universal primers targeting V3 or V6-V8 allow only the dominant flora
to be visualized when analyzing ecosystem with high bacteria diversity; the possibility of
species giving identical band positions (Temmerman et al., 2004); and biases in DNA
extraction and selective PCR amplification (Miambi et al., 2003; Muyzer, 1999; Muyzer &
Smalla, 1998). These results are in agreement with Miambi et al. (2003) who recommended
a combination of culture-dependent and culture-independent techniques to obtain a more
detailed view of microbial communities.
Nevertheless, DGGE confirmed that the dominant microorganisms were Weissella species
and Lb. fermentum as observed by the intensity of their bands. Weissella cibaria/W. confusa
and Lb. fermentum were represented by multiple bands (4, 6, 8, and 11) and (3, 7 and 13),
respectively. Multiple banding patterns have previously been observed (Kim et al., 2009;
Kim et al., 2010) and are attributed to sequence heterogeneity between multiple copies of
the 16S rDNA of any given strain (Nübel et al., 1996). DGGE also revealed low similarity
in microbial composition at the beginning of fermentation between NFP and LFP. Microbial
diversity remained relatively unchanged in LFP from onset to termination because of the
back-slopping, while microbial succession was observed in NFP. Thus, most LFP samples
had similar microbial profiles at different fermentation stages, forming one cluster. In
contrast, microbial profiles for NFP were different during early and late fermentation stages.
At 24 h, Bacillus had been succeeded probably due to acidification of the environment and
colonization of W. confusa/W. cibaria in NFP. Microorganisms capable of flourishing in
acid environments were abundant at the end of the fermentations.
Conclusions
The study demonstrated the possibility of soybean solid state fermentation achieved with
lactic acid bacteria in both naturally fermented and back-slopped pastes. However, co-
fermentation was suggested for natural fermentation. The advantage of back-slopping was
the possibility of inhibition of unwanted microorganisms such as spore formers which may
be pathogenic. Although, successions were observed in naturally fermented pastes; and
bacterial diversity in back-slopped samples remained relatively unchanged throughout
fermentation, but common species were dominant microflora in both types of fermentation.
These were Weissella cibaria/W. confusa, Lb. fermentum and P. pentosaceus. The study
21
therefore recommends further investigations on technological, functional and sensory
properties of the dominant microflora to establish their roles during fermentation and to
explore their potential use as starter cultures in fermented soybeans and soybean-maize
products. Because some species were only recovered by culture-dependent techniques while
others were only recovered by PCR-DGGE, this study confirms the need for polyphasic
approaches to study microbial diversity of complex systems.
Acknowledgements
We would like to acknowledge financial support from the Norwegian Programme for
Development, Research and Education (NUFU) and Norwegian State Education Fund
(Lånekassen). This research was also partly financed by International Foundation for
Science (IFS) through grant no. E/4889-1 awarded to Tinna A. Ng’ong’ola-Manani.

22
References
Ali, A.A. (2010). Beneficial role of lactic acid bacteria in food preservation and human
health: A Review. Res. J. Microbiol. 5:1213-1221.
Allagheny, N., Obanu, Z.A., Campbell-Platt, G., & Owens, J.D. (1996). Control of
ammonia formation during Bacillus subtilis fermentation of legumes. Int. J. Food
Microbiol. 29: 321-333.
Ampe, F., Omar, N.b., & Guyot, J.P. (1998). Recovery of total microbial RNA from lactic
acid fermented foods with a high starch content. Lett. Appl. Microbiol. 27:270-274.
Ampe, F., Sirvent, A. & Zakhia, N. (2001). Dynamics of the microbial community
responsible for traditional sour cassava starch fermentation studied by denaturing gradient
gel electrophoresis and quantitative rRNA hybridization. Int. J. Food Microbiol. 65:45-54.
Andrighetto, C., De Dea, P., Lombardi, A., Neviani, E., Rossetti, L., & Giraffa, G. (1998).
Molecular identification and cluster analysis of homofermentative thermophilic lactobacilli
isolated from dairy products. Res. Microbiol. 149:631-643.
AOAC (1990). Official Methods of Analysis of the Association of Official Analytical
Chemists. (15th ed.). Virginia: Association of Official Chemists.
Atanassova, M., Choiset, Y., Dalgalarrondo, M., Chobert, J. M., Dousset, X., Ivanova, I. &
Haertle, T. 2003. Isolation and partial biochemical characterization of a proteinaceous anti-
bacteria and anti-yeast compound produced by Lactobacillus paracasei subsp. paracasei
strain M3. Int. J. Food Microbiol. 87, 63-73.
Axelsson, L. (1998). Lactic acid bacteria: classification and physiology. In: Salminen, S. &
Von Wright, A. (Eds.), Lactic acid bacteria: microbiology and functional aspects, 2nd ed (1-
72). New York: Marcel Dekker, Inc.
Banwo, K., Sanni, A., & Tan, H. (2013). Technological properties and probiotic potential of
Enterococcus faecium strains isolated from cow milk. J. Appl. Microbiol. 114:229-241.
ben Omar, N., & Ampe, F. (2000). Microbial community dynamics during production of the
mexican fermented maize dough pozol. Appl. Environ. Microbiol. 66: 3664–3673.
23
Boyd, M.A., Antonio, M.A.D., & Hillier, S.L. (2005). Comparison of API 50 CH strips to
whole-chromosomal DNA probes for identification of Lactobacillus species. J. Clin.
Microbiol. 43:5309-5311.
Chantawannakul, P., Oncharoen, A., Klanbut, K., Chukeatirote, E. & Lumyong, S. 2002.
Characterization of proteases of Bacillus subtilis strain 38 isolated from traditionally
fermented soybean in Northern Thailand. ScienceAsia. 28, 241 - 245.
Chen, H.-C., Wang, S.-Y., & Chen, M.-J. (2008). Microbiological study of lactic acid
bacteria in kefir grains by culture-dependent and culture-independent methods. Food
Microbiol. 25: 492-501.
Chukeatirote, E., Dajanta, K., & Apichartsrangkoon, A. (2010). Thua nao, indigenous Thai
fermented soybean: A Review. J. Biol. Sci. 10:581-583.
Cocolin, L., Innocente, N., Biasutti, M., & Comi, G. (2004). The late blowing in cheese: a
new molecular approach based on PCR and DGGE to study the microbial ecology of the
alteration process. Int. J. Food Microbiol. 90: 83-91.
Criado, R., Diep, D.B., Aakra, A., Gutierrez, J., Nes, I.F., Hernandez, P.E., & Cintas, L.M.
(2006). Complete sequence of the enterocin Q-encoding plasmid pCIZ2 from the multiple
bacteriocin producer Enterococcus faecium L50 and genetic characterization of enterocin Q
production and immunity. Appl. Environ. Microbiol. 72:6653-6666.
Cui, Y., Qu, X., Li, H., He, S., Liang, H., Zhang, H., & Ma, Y. (2012). Isolation of
halophilic lactic acid bacteria from traditional Chinese fermented soybean paste and
assessment of the isolates for industrial potential. Eur. Food Res. Technol. 234: 797-806.
CYE Consult (2009). Value chain analysis of selected commodities institutional
development across the agri-food sector (IDAF) – 9 ACP Mai 19.
http://www.moafsmw.org/ocean/docs/Agricultural%20Marketing/D%20Value%20chain%2
0Final%20Report%20Revised%2001.08.09.pdf. Last accessed 18 November 2013.
Dajanta, K., Apichartsrangkoon, A., Chukeatirote, E. & Frazier, R.A. (2011). Free-amino
acid profiles of thua nao, a Thai fermented soybean. Food Chem. 125: 342-347.

24
Dakwa , S., Sakyi-Dawson, E., Diako, C., Annan, N.T., & Amoa-Awua, W.K. (2005).
Effect of boiling and roasting on the fermentation of soybeans into dawadawa (soy-
dawadawa). Int. J. Food Microbiol. 104:69 - 82.
De Vuyst, L. & Neysens, P. (2005). The sourdough microflora: biodiversity and metabolic
interactions. Trends Food Sci Technol. 16:43-56.
Esaki, H., Kawakishi, S., Morimitsu, Y., Osawa, T. (1999). New potent antioxidative o-
dihydroxyisoflavones in fermented Japanese soybean products. Biosci. Biotech. Bioch.
63:1637-1639.
Feligini, M., Panelli, S., Buffoni, J.N., Bonacina, C., Andrighetto, C., & Lombardi, A.
(2012). Identification of microbiota present on the surface of Taleggio cheese using PCR–
DGGE and RAPD–PCR. J. Food Sci. 77:M609-M615.
Ferguson, J.E., Dickinson, D.B., & Rhodes, A.M. (1979). Analysis of endosperm sugars in a
sweet corn inbred (Illinois 677a) which contains the sugary enhancer (se) gene and
comparison of se with other corn genotypes. Plant Physiol. 63:416-420.
Ferris, M. J., Muyzer, G. & Ward, D. M. (1996). Denaturing gradient gel electrophoresis
profiles of 16S rRNA-defined populations inhabiting a hot spring microbial mat community.
Appl. Environ. Microbiol. 62:340-6.
Franz, C.M.A.P., Stiles, M.E., Schleifer, K.H., & Holzapfel, W.H. (2003). Enterococci in
foods—A conundrum for food safety. Int. J. Food Microbiol. 88:105-122.
Galle, S. & Arendt, E. K. (2014). Exopolysaccharides from sourdough lactic acid bacteria.
Crit Rev Food Sci Nutr. 54: 891-901.
Hammes, W.P., Weiss, N., Holzapfel, W. (1992). The Genera Lactobacillus and
Carnobacterium In: Balows, A., Trüper, H.G., Dworkin, M., Harder, W., Schleifer, K.H.
(Eds.), The prokaryotes (pp. 1535-1594), 2nd ed. Heidelberg, Germany: Springer.
Harrigan, W. (1998). Laboratory Methods in Food Microbiology (3rd ed.). United Kingdom:
University of Reading.
Holzapfel, W.H. (2002). Appropriate starter culture technologies for small-scale
fermentation in developing countries. Int. J. Food Microbiol. 75: 197-212.
25
Kalimbira, A.A., Mtimuni, B.M., & Mtimuni, J.P. (2004). Effect of incorporating legumes
on nutritive value of cassava-based complementary foods. Bunda J. Agri. Environ. Sci.
Technol. 2: 13-21.
Kalui, C.M., Mathara, J.M., & Kutima, P.M. (2010). Probiotic potential of spontaneously
fermented cereal based foods – A review. Afr. J. Biotechnol. 9:2490-2498.
Kandler, O., & Weiss, N. (1986). Genus Lactobacillus. In Sneath, P.H.A., Mair, N.S.,
Sharpe, M.E., Holt, J.G. (Eds.), Bergey's manual of Systematic Bacteriology (pp. 1209 –
1234). Baltimore: Williams & Wilkins.
Kim, T., Lee, J.-H., Park, M.-H., & Kim, H.-Y. (2010). Analysis of bacterial and fungal
communities in Japanese- and Chinese-fermented soybean pastes using nested PCR–DGGE.
Curr. Microbiol. 60:315-320.
Kim, T.-W., Lee, J.-H., Kim, S.-E., Park, M.-H., Chang, H.C., & Kim, H.-Y. (2009).
Analysis of microbial communities in doenjang, a Korean fermented soybean paste, using
nested PCR-denaturing gradient gel electrophoresis. Int. J. Food Microbiol. 131:265-271.
Kitabatake, N., Gimbi, D.M., & Oi, Y. (2003). Traditional non-alcoholic beverage, Togwa,
in East Africa, produced from maize flour and germinated finger millet. Int. J. Food Sci.
Nutr. 54: 447-455.
Lattanzi, A., Minervini, F., Di Cagno, R., Diviccaro, A., Antonielli, L., Cardinali, G.,
Cappelle, S., De Angelis, M., & Gobbetti, M. (2013). The lactic acid bacteria and yeast
microbiota of eighteen sourdoughs used for the manufacture of traditional Italian sweet
leavened baked goods. Int. J. Food Microbiol. 163:71-79.
Lei, V., Jakobsen, M. (2004). Microbiological characterization and probiotic potential of
koko and koko sour water, African spontaneously fermented millet porridge and drink. J.
Appl. Microbiol. 96:384-397.
Leroy, F., & De Vuyst, L. (2004). Lactic acid bacteria as functional starter cultures for the
food fermentation industry. Trends Food Sci. Tech. 15:67-78.
Lund, B. & Edlund, C. (2001). Probiotic Enterococcus faecium strain is a possible recipient
of the vanA gene cluster. Clin. Infect. Dis. 32:1384-1385.
Maleta, K. (2006). Undernutrition. Malawi Medical J. 18:191-207.
26
Medic, J., Atkinson, C. & Hurburgh, C., JR. (2014). Current Knowledge in Soybean
Composition. J. Am Oil Chem Soc. 91:363-384.
Mensah, P. (1997). Fermentation — the key to food safety assurance in Africa? Food
Control, 8: 271-278.
Meroth, C. B., Walter, J., Hertel, C., Brandt, M. J. & Hammes, W. P. (2003). Monitoring the
Bacterial Population Dynamics in Sourdough Fermentation Processes by Using PCR-
Denaturing Gradient Gel Electrophoresis. Appl. Environ Microbiol. 69:475-482.
Miambi, E., Guyot, J.-P., & Ampe, F. (2003). Identification, isolation and quantification of
representative bacteria from fermented cassava dough using an integrated approach of
culture-dependent and culture-independent methods. Int. J. Food Microbiol. 82: 111-120.
Motarjemi, Y. (2002). Impact of small scale fermentation technology on food safety in
developing countries. Int J Food Microbiol: 75:213-29.
Mugula, J. K., Nnko, S. A. M., Narvhus, J. A. & Sørhaug, T. (2003). Microbiological and
fermentation characteristics of togwa, a Tanzanian fermented food. Int. J. Food Microbiol.
80: 187-199.
Mukisa, I.M., Porcellato, D., Byaruhanga, Y.B., Muyanja, C.M.B.K., Rudi, K., Langsrud,
T., & Narvhus, J.A. (2012). The dominant microbial community associated with
fermentation of obushera (sorghum and millet beverages) determined by culture-dependent
and culture-independent methods. Int. J. Food Microbiol. 160:1-10.
Muyanja, C. M. B. K., Narvhus, J. A., Treimo, J. & Langsrud, T. (2003). Isolation,
characterisation and identification of lactic acid bacteria from bushera: a Ugandan
traditional fermented beverage. Int. J. Food Microbiol. 80:201-210.
Muyzer, G. (1999). DGGE/TGGE a method for identifying genes from natural ecosystems.
Curr. Opin. Microbiol. 2:317-322.
Muyzer, G., & Smalla, K. (1998). Application of denaturing gradient gel electrophoresis
(DGGE) and temperature gradient gel electrophoresis (TGGE) in microbial ecology. Anton.
Van Leeuw. 73:127-141.

27
Narvhus, J.A., & Axelsson, L. (2003). Lactic acid bacteria. In Caballero, B., Trugo, L., &
Finglas, P. (Eds.). Encyclopedia of Food Science, Technology and Nutrition (pp. 3465 –
3472) 2nd ed. Amsterdam, The Netherlands: Academic Press.
Narvhus, J.A., Hulbækdal, A., Thorvaldsen, K.R., Baugerød, M., & Abrahamsen, R.K.
(1992). Measurement of CO2 production and O2 metabolism by pure and mixed cultures of
lactic acid bacteria growing in milk. Centre de Publications de I’Universite´ de Caen, Caen,
France, Actes du Colloque LACTIC 91.
Ng'ong'ola-Manani, T. A., Mwangwela, A. M., Schüller, R. B., Østlie, H. M. & Wicklund,
T. (2014). Sensory evaluation and consumer acceptance of naturally and lactic acid bacteria-
fermented pastes of soybeans and soybean–maize blends. Food Sci. Nutr. 2:114-131.
Nout, M.J.R. (1991). Ecology of accelerated natural lactic fermentation of sorghum-based
infant food formulas. Int. J. Food Microbiol. 12:217-224.
Nübel, U., Engelen, B., Felske, A., Snaidr, J., Wieshuber, A., Amann, R.I., Ludwig, W., &
Backhaus, H. (1996). Sequence heterogeneities of genes encoding 16S rRNAs in
Paenibacillus polymyxa detected by temperature gradient gel electrophoresis. J. Bacteriol.
178:5636-5643.
Odunfa, S. A. & Adeyele, S. (1985). Microbiological changes during the traditional
production of ogi-baba, a West African fermented sorghum gruel. J. Cereal Sci. 3:173-180.
Odunfa, S.A. (1983). Carbohydrate changes in fermenting locust bean (Parkia filicoidea)
during iru preparation. Plant. Food. Hum. Nutr. 32:3 -10.
Oguntoyinbo, F.A. (2007). Identification and functional properties of dominant lactic acid
bacteria isolated at different stages of solid state fermentation of cassava during traditional
gari production. World J. Microbiol. Biotechnol. 23:1425-1432.
Østlie, H.M., Eliassen, L., Florvaag, A., Skeie, S. (2004). Phenotypic and PCR-based
characterization of the microflora in Norvegia cheese during ripening. Int. J. Food
Microbiol. 94:287 -299.
Øvreås, L., Forney, L., Daae, F.L., & Torsvik, V. (1997). Distribution of bacterioplankton in
meromictic Lake Saelenvannet, as determined by denaturing gradient gel electrophoresis of

28
PCR-amplified gene fragments coding for 16S rRNA. Appl. Environ. Microbiol. 63:3367-
3373.
Oyewole, O. B. (1997). Lactic fermented foods in Africa and their benefits. Food Control.
8: 289-297.
Park, K.-Y., Jung, K.-O., Rhee, S.-H., Choi, Y.H. (2003). Antimutagenic effects of
doenjang (Korean fermented soypaste) and its active compounds. Mutat. Res-Fund Mol. M.
523–524: 43-53.
Parkouda, C., Nielsen, D.S., Azokpota, P., Ouoba, I.I.L., Amoa-Awua, W.K., Thorsen, L.,
Hounhouigan, J.D., Jensen, J.S., Tano-Debrah, K., Diawara, B., & Jakobsen, M. (2009). The
microbiology of alkaline-fermentation of indigenous seeds used as food condiments in
Africa and Asia. Crit. Rev. Microbiol. 35:139-156.
Peng, Y., Huang, Q., Zhang, R.-h., & Zhang, Y.-Z. (2003). Purification and characterization
of a fibrinolytic enzyme produced by Bacillus amyloliquefaciens DC-4 screened from
douchi, a traditional Chinese soybean food. Comp. Biochem. Phys. B. 134:45-52.
Porcellato, D., Grønnevik, H., Rudi, K., Narvhus, J., & Skeie, S.B. (2012). Rapid lactic acid
bacteria identification in dairy products by high-resolution melt analysis of DGGE bands.
Lett. Appl. Microbiol. 54:344-351.
Praphailong, W., Fleet, G.H. (1997). The effect of pH, sodium chloride, sucrose, sorbate and
benzoate on the growth of food spoilage yeasts. Food Microbiol. 14:459-468.
Redondo-Cuenca, A., Villanueva-Suárez, M.J., Rodríguez-Sevilla, M.D., & Mateos-
Aparicio, I. (2007). Chemical composition and dietary fibre of yellow and green commercial
soybeans (Glycine max). Food Chem. 101:1216-1222.
Rosenfeld, E. & Beauvoit, B. 2003. Role of the non-respiratory pathways in the utilization
of molecular oxygen by Saccharomyces cerevisiae. Yeast, 20, 1115-1144.
Ruas-Madiedo, P., Hugenholtz, J., & Zoon, P. (2002). An overview of the functionality of
exopolysaccharides produced by lactic acid bacteria. Int. Dairy J. 12:163-171.
Samelis, J., Maurogenakis, F., & Metaxopoulos, J. (1994). Characterisation of lactic acid
bacteria isolated from naturally fermented Greek dry salami. Int. J. Food Microbiol. 23:179-
196.

29
Sánchez, I., Palop, L., & Ballesteros, C. (2000). Biochemical characterization of lactic acid
bacteria isolated from spontaneous fermentation of ‘Almagro’ eggplants. Int. J. Food
Microbiol. 59:9-17.
Sarkar, P.K., & Tamang, J.P. (1995). Changes in the microbial profile and proximate
composition during natural and controlled fermentations of soybeans to produce kinema.
Food Microbiol. 12:317-325.
Sarkar, P.K., Cook, P.E., & Owens, J.D. (1993). Bacillus fermentation of soybeans. World
J. Microbiol. Biotechnol. 9: 295-299.
Sarkar, P.K., Hasenack, B., & Nout, M.J.R., (2002). Diversity and functionality of Bacillus
and related genera isolated from spontaneously fermented soybeans (Indian Kinema) and
locust beans (African Soumbala). Int. J. Food Microbiol. 77: 175-186.
Sarkar, P.K., Tamang, J.P., Cook, P.E., Owens, J.D. (1994). Kinema — a traditional
soybean fermented food: proximate composition and microflora. Food Microbiol. 11:47-55.
Scheirlinck, I., Van der Meulen, R., Van Schoor, A., Vancanneyt, M., De Vuyst, L.,
Vandamme, P., & Huys, G. (2008). Taxonomic structure and stability of the bacterial
community in Belgian sourdough ecosystems as assessed by culture and population
fingerprinting. Appl. Environ. Microbiol. 74:2414-2423.
Schillinger, U., & Lucke, F.-K. (1987). Identification of Lactobacilli from meat and meat
products. Food Microbiol. 4: 199 – 208.
Steinkraus, K. H. (1997). Classification of fermented foods: worldwide review of household
fermentation techniques. Food Control, 8, 311-317
Steinkraus, K.H. (2002). Fermentations in world food processing. Compr. Rev. Food Sci. F
1:23-32.
Temmerman, R., Huys, G., Swings, J. (2004). Identification of lactic acid bacteria: culture-
dependent and culture-independent methods. Trends Food Sci. Technol. 15: 348-359.
Tieking, M., Korakli, M., Ehrmann, M. A., Gänzle, M. G. & Vogel, R. F. (2003). In situ
production of exopolysaccharides during sourdough fermentation by cereal and intestinal
isolates of lactic acid bacteria. Appl. Environ Microbiol. 69:945-952.
30
Torres-Penaranda, A.V., Reitmeier, C.A., Wilson, L.A., Fehr, W.R., & Narvel, J.M. (1998).
Sensory characteristics of soymilk and tofu made from lipoxygenase-free and normal
soybeans. J. Food Sci. 63:1084-1087.
Vandamme, P., Pot, B., Gillis, M., de Vos, P., Kersters, K., & Swings, J. (1996). Polyphasic
taxonomy, a consensus approach to bacterial systematics. Microbiol. Rev. 60: 407-438.
Walter, J., Hertel, C., Tannock, G. W., Lis, C. M., Munro, K. & Hammes, W. P. (2001).
Detection of Lactobacillus, Pediococcus, Leuconostoc, and Weissella Species in human
feces by using group-specific PCR primers and denaturing gradient gel electrophoresis.
Appl. Environ. Microbiol. 67:2578-2585.
Wang, Y.-C., Yu, R.-C., Yang, H.-Y., & Chou, C.-C. (2003). Sugar and acid contents in
soymilk fermented with lactic acid bacteria alone or simultaneously with bifidobacteria.
Food Microbiol. 20:333 – 338.
Yang, H.J., Park, S., Pak, V., Chung, K.R., & Kwon, D.Y. (2011). Fermented soybean
products and their bioactive compounds. In: El-Shemy, P.H. (Ed.), Soybean and health.
Croatia: InTech
Europe.http://cdn.intechopen.com/pdfs/19742/InTechFermented_soybean_products_and_th
eir_bioactive_compounds.pdf Last accessed 18 November 2013.
Yoon, M.Y., & Hwang, H.-J. (2008). Reduction of soybean oligosaccharides and properties
of α-D-galactosidase from Lactobacillus curvatus R08 and Leuconostoc mesenteriodes
JK55. Food Microbiol. 25:815-823.
Yoon, M.Y., Kim, Y.J., & Hwang, H.-J. (2008). Properties and safety aspects of
Enterococcus faecium strains isolated from Chungkukjang, a fermented soy product. LWT -
Food Sci. Technol. 41:925-933.
Yousif, N.M.K., Dawyndt, P., Abriouel, H., Wijaya, A., Schillinger, U., Vancanneyt, M.,
Swings, J., Dirar, H.A., Holzapfel, W.H., & Franz, C.M.A.P. (2005). Molecular
characterization, technological properties and safety aspects of enterococci from ‘Hussuwa’,
an African fermented sorghum product. J. Appl. Microbiol. 98:216-228.

31
Table 1: Biochemical and physiological characteristics of lactic acid bacteria strains
isolated during fermentation
Group I (Rods) II (Cocci) Characteristics A (n=
142) B (n= 55) C (n=35) D (n=7)
CO2 production from glucose +a + -b - Hydrolysis of arginine + - + - Growth at 4 oC 70 +c 28 + 20 + 5 + 15 oC 120 + 47 + 33 + + 45 oC 141 + 52 + + + pH 3.9 138 + 54 + + + Growth in 7% NaCl 136 + 46 + + 6 + 10% NaCl 93 + 32 + 24 + 3 + Exopolysaccharide production 54 + 34 + 14 + 4 + Amylolytic activity 3 w+d 8 w+ 3 w+ 1 w+ a+, all isolates positive b-, all isolates negative cNumber then +, e.g. (70 +), 70 isolates positive dNumber then w+, e.g. (3 w+), 3 isolates weakly positive
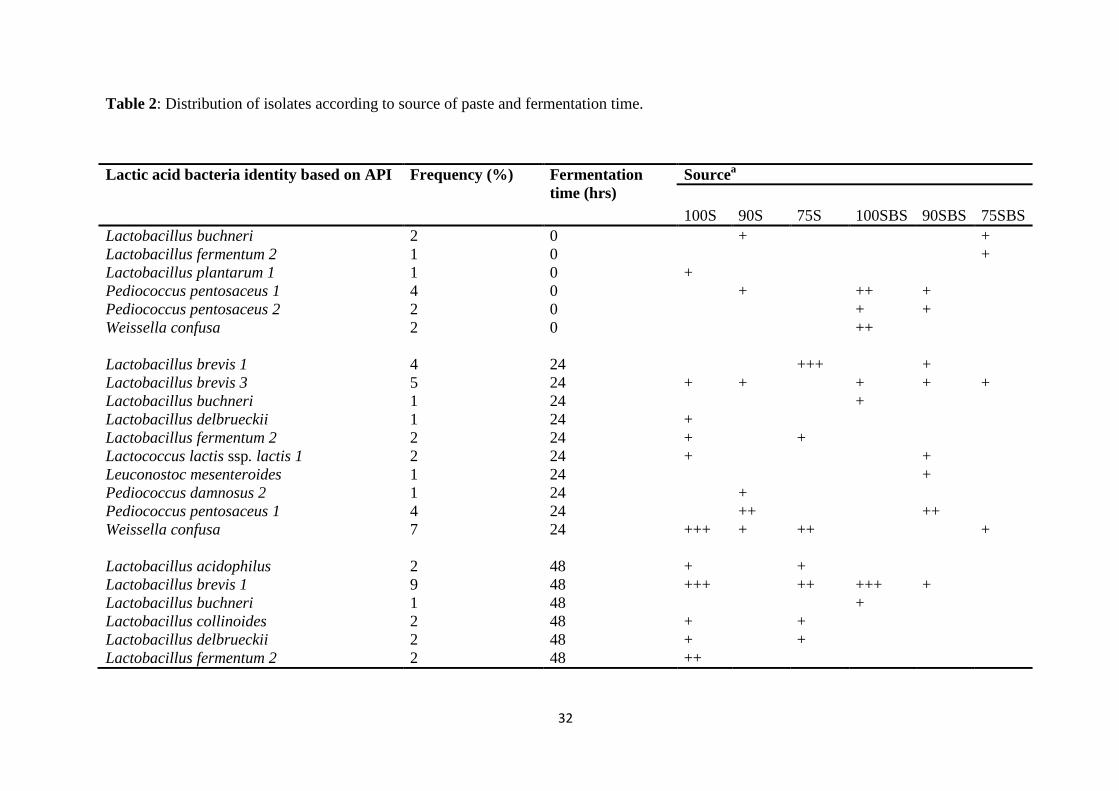
32
Table 2: Distribution of isolates according to source of paste and fermentation time.
Lactic acid bacteria identity based on API Frequency (%) Fermentation time (hrs)
Sourcea
100S 90S 75S 100SBS 90SBS 75SBS Lactobacillus buchneri 2 0 + + Lactobacillus fermentum 2 1 0 + Lactobacillus plantarum 1 1 0 + Pediococcus pentosaceus 1 4 0 + ++ + Pediococcus pentosaceus 2 2 0 + + Weissella confusa 2 0 ++ Lactobacillus brevis 1 4 24 +++ + Lactobacillus brevis 3 5 24 + + + + + Lactobacillus buchneri 1 24 + Lactobacillus delbrueckii 1 24 + Lactobacillus fermentum 2 2 24 + + Lactococcus lactis ssp. lactis 1 2 24 + + Leuconostoc mesenteroides 1 24 + Pediococcus damnosus 2 1 24 + Pediococcus pentosaceus 1 4 24 ++ ++ Weissella confusa 7 24 +++ + ++ + Lactobacillus acidophilus 2 48 + + Lactobacillus brevis 1 9 48 +++ ++ +++ + Lactobacillus buchneri 1 48 + Lactobacillus collinoides 2 48 + + Lactobacillus delbrueckii 2 48 + + Lactobacillus fermentum 2 2 48 ++
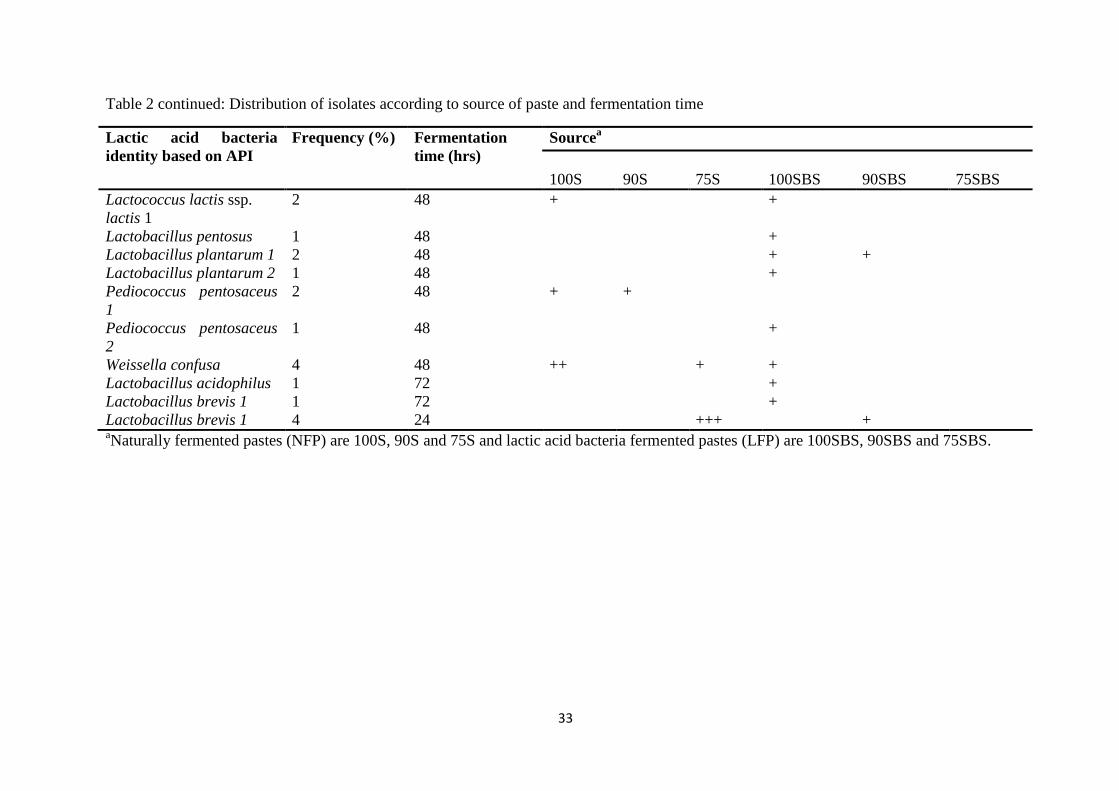
33
Table 2 continued: Distribution of isolates according to source of paste and fermentation time
Lactic acid bacteria identity based on API
Frequency (%) Fermentation time (hrs)
Sourcea
100S 90S 75S 100SBS 90SBS 75SBS Lactococcus lactis ssp. lactis 1
2 48 + +
Lactobacillus pentosus 1 48 + Lactobacillus plantarum 1 2 48 + + Lactobacillus plantarum 2 1 48 + Pediococcus pentosaceus 1
2 48 + +
Pediococcus pentosaceus 2
1 48 +
Weissella confusa 4 48 ++ + + Lactobacillus acidophilus 1 72 + Lactobacillus brevis 1 1 72 + Lactobacillus brevis 1 4 24 +++ + aNaturally fermented pastes (NFP) are 100S, 90S and 75S and lactic acid bacteria fermented pastes (LFP) are 100SBS, 90SBS and 75SBS.

34
Table 3. Comparison of identification by phenotyping (API) and 16S rDNA sequencing of the LAB isolates
No of Strains (Isolate identity number)
Fermentation type API Identificationa 16 S rDNA Identificationb
2 (189, 369) Heterofermentative Lactobacillus acidophilus 1 W. cibaria 2 (314, 127) Heterofermentative Lactobacillus brevis 1 Lb. fermentum 2(172, 122) Heterofermentative Lactobacillus brevis 1 W. cibaria 2(116(1), 152) Heterofermentative Lactobacillus brevis 3 Lb. brevis 2(336, 342b) Heterofermentative Lactobacillus buchneri Lb. fermentum 1(317) Heterofermentative Lactobacillus collinoides Lb. fermentum 1(188b) Heterofermentative Lactobacillus collinoides W. cibaria
1(187,) Heterofermentative Lactobacillus delbrueckii ssp. delbrueckii W. cibaria
1(76) Heterofermentative Lactobacillus delbrueckii ssp. delbrueckii W. confusa
2(109T, 297) Heterofermentative Lactobacillus fermentum 2 Lb. fermentum 1(221a) Heterofermentative Lactobacillus plantarum 2 W. cibaria 2(5)
Homofermentative
Lactococcus lactis ssp. lactis 1
E. faecium strain D-TSB-8/ E. durans
1(53s)
Heterofermentative Leuconostoc mesenteroides ssp. mesenteroides/dextranicum 2
W. cibaria
1(301) Homofermentative Pediococcus damnosus 2 P. pentosaceus 3(280, 120, 315) Homofermentative Pediococcus pentosaceus P. pentosaceus 1(125) Heterofermentative Weissella confusa Bacillus spp. JS-37 2(184, 205) Heterofermentative Weissella confusa W. cibaria 5(107, 71, 67, 105, 218) Heterofermentative Weissella confusa W. confusa
a Only isolates with API percent identity >90% are presented. bSimilarity for 16S rDNA was between 98 and 100%, except in Bacillus spp. where % similarity was 81; E-values for all isolates were < 0.0
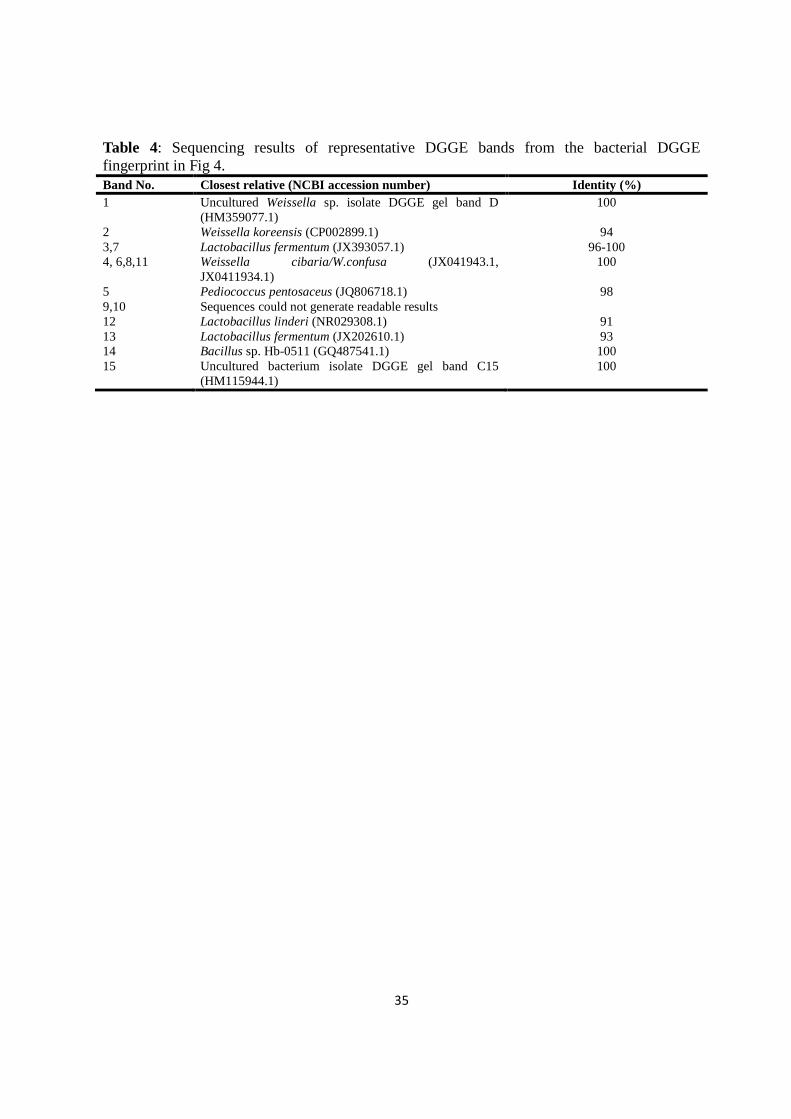
35
Table 4: Sequencing results of representative DGGE bands from the bacterial DGGE fingerprint in Fig 4. Band No. Closest relative (NCBI accession number) Identity (%) 1 Uncultured Weissella sp. isolate DGGE gel band D
(HM359077.1) 100
2 Weissella koreensis (CP002899.1) 94 3,7 Lactobacillus fermentum (JX393057.1) 96-100 4, 6,8,11 Weissella cibaria/W.confusa (JX041943.1,
JX0411934.1) 100
5 Pediococcus pentosaceus (JQ806718.1) 98 9,10 Sequences could not generate readable results 12 Lactobacillus linderi (NR029308.1) 91 13 Lactobacillus fermentum (JX202610.1) 93 14 Bacillus sp. Hb-0511 (GQ487541.1) 100 15 Uncultured bacterium isolate DGGE gel band C15
(HM115944.1) 100
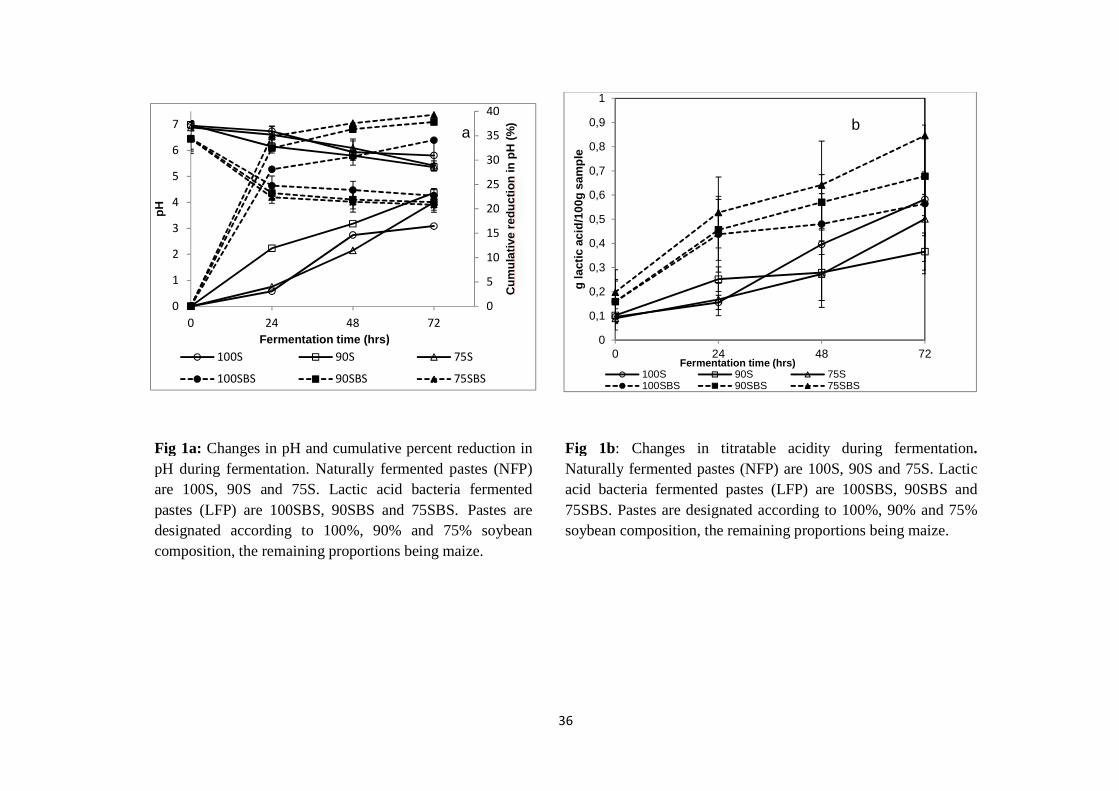
36
0
5
10
15
20
25
30
35
40
0
1
2
3
4
5
6
7
0 24 48 72
Cu
mu
lati
vere
du
ctio
nin
pH
(%
)
pH
Fermentation time (hrs)
100S 90S 75S
100SBS 90SBS 75SBS
a
0
0,1
0,2
0,3
0,4
0,5
0,6
0,7
0,8
0,9
1
0 24 48 72
g la
ctic
aci
d/1
00g
sam
ple
Fermentation time (hrs) 100S 90S 75S100SBS 90SBS 75SBS
b
Fig 1a: Changes in pH and cumulative percent reduction in pH during fermentation. Naturally fermented pastes (NFP) are 100S, 90S and 75S. Lactic acid bacteria fermented pastes (LFP) are 100SBS, 90SBS and 75SBS. Pastes are designated according to 100%, 90% and 75% soybean composition, the remaining proportions being maize.
Fig 1b: Changes in titratable acidity during fermentation. Naturally fermented pastes (NFP) are 100S, 90S and 75S. Lactic acid bacteria fermented pastes (LFP) are 100SBS, 90SBS and 75SBS. Pastes are designated according to 100%, 90% and 75% soybean composition, the remaining proportions being maize.

37
Fig 2: Extent of microbial growth during fermentation at 30 oC. a) Aerobic mesophillic counts; b)
Bacteria spore counts; c) Lactic acid bacteria counts; d) Lactobacillus counts; e) Yeasts and molds
count. Naturally fermented pastes (NFP) are 100S, 90S and 75S. Lactic acid bacteria fermented
pastes (LFP) are 100SBS, 90SBS and 75SBS. Pastes are designated according to 100%, 90% and
75% soybean composition, the remaining proportions being maize.
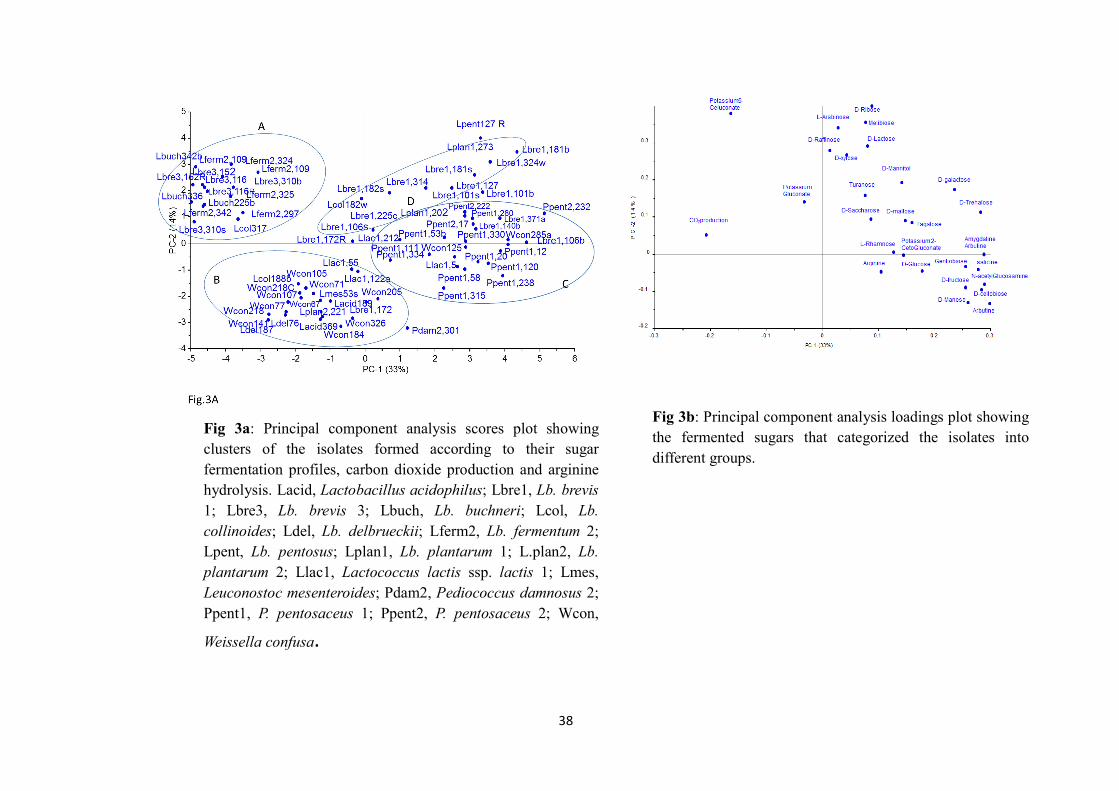
38
Fig 3a: Principal component analysis scores plot showing
clusters of the isolates formed according to their sugar
fermentation profiles, carbon dioxide production and arginine
hydrolysis. Lacid, Lactobacillus acidophilus; Lbre1, Lb. brevis
1; Lbre3, Lb. brevis 3; Lbuch, Lb. buchneri; Lcol, Lb.
collinoides; Ldel, Lb. delbrueckii; Lferm2, Lb. fermentum 2;
Lpent, Lb. pentosus; Lplan1, Lb. plantarum 1; L.plan2, Lb.
plantarum 2; Llac1, Lactococcus lactis ssp. lactis 1; Lmes,
Leuconostoc mesenteroides; Pdam2, Pediococcus damnosus 2;
Ppent1, P. pentosaceus 1; Ppent2, P. pentosaceus 2; Wcon,
Weissella confusa.
Fig 3b: Principal component analysis loadings plot showing
the fermented sugars that categorized the isolates into
different groups.
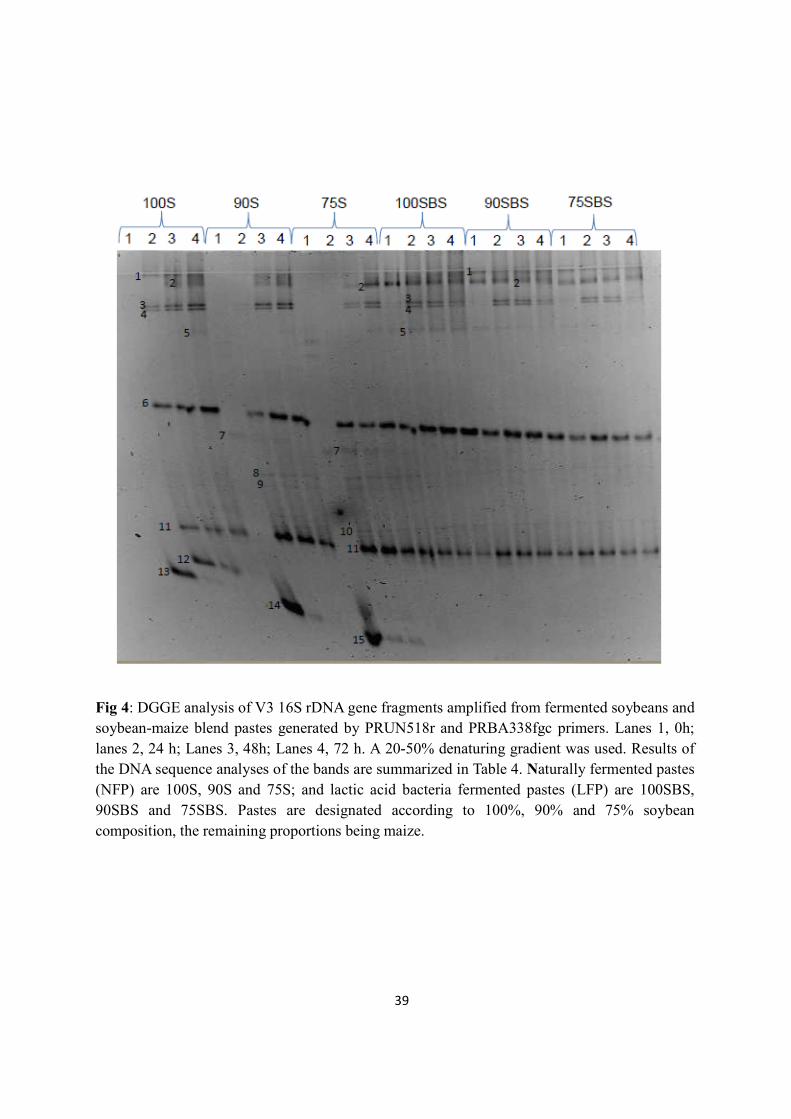
39
Fig 4: DGGE analysis of V3 16S rDNA gene fragments amplified from fermented soybeans and
soybean-maize blend pastes generated by PRUN518r and PRBA338fgc primers. Lanes 1, 0h;
lanes 2, 24 h; Lanes 3, 48h; Lanes 4, 72 h. A 20-50% denaturing gradient was used. Results of
the DNA sequence analyses of the bands are summarized in Table 4. Naturally fermented pastes
(NFP) are 100S, 90S and 75S; and lactic acid bacteria fermented pastes (LFP) are 100SBS,
90SBS and 75SBS. Pastes are designated according to 100%, 90% and 75% soybean
composition, the remaining proportions being maize.

40
Fig 5: Cluster analysis of bacteria DGGE fingerprints showing similarity in microbial profiles
during fermentation of the pastes. Dendrogram was generated by an UPMGA cluster analysis
based on DGGE bands. Scale shown is Dice’s coefficient of similarity. Naturally fermented
pastes (NFP) are 100S, 90S and 75S; and lactic acid bacteria fermented pastes (LFP) are
100SBS, 90SBS and 75SBS. Pastes are designated according to 100%, 90% and 75% soybean
composition, the remaining proportions being maize.

41

�
�
�
�
�
�
�
�
�
�
�
�
�
�
�
�
�
�
�
�
�
�
�
�
�
�
�

�
�
�

ORIGINAL RESEARCH
Sensory evaluation and consumer acceptance of naturallyand lactic acid bacteria-fermented pastes of soybeans andsoybean–maize blends
Tinna A. Ng’ong’ola-Manani1,2, Agnes M. Mwangwela1, Reidar B. Sch€uller2, Hilde M. Østlie2 &Trude Wicklund2
1Department of Food Science and Technology, Lilongwe University of Agriculture and Natural Resources, Bunda College Campus, PO Box 219,
Lilongwe, Malawi2Department of Chemistry, Biotechnology and Food Science, Norwegian University of Life Sciences, PO Box 5003, "As, 1430, Norway
Keywords
Drivers of liking, lactic acid bacteria
fermentation, natural fermentation,
preference mapping, soybean pastes
Correspondence
Tinna A. Ng’ongo’la-Manani, Lilongwe
University of Agriculture and Natural
Resources, Bunda College Campus, PO Box
219, Lilongwe, Malawi. Tel: +265 1 277 260/
+265 1 277 222; Fax: +265 1 277 364;
E-mail: [email protected]
Funding Information
This research was financially supported by
the Norwegian Programme for Development,
Research and Education (NUFU).
Received: 9 April 2013; Revised: 21 October
2013; Accepted: 12 November 2013
Food Science & Nutrition 2014; 2(2): 114–
131
doi: 10.1002/fsn3.82
Abstract
Fermented pastes of soybeans and soybean–maize blends were evaluated to
determine sensory properties driving consumer liking. Pastes composed of
100% soybeans, 90% soybeans and 10% maize, and 75% soybeans and 25%
maize were naturally fermented (NFP), and lactic acid bacteria fermented
(LFP). Lactic acid bacteria fermentation was achieved through backslopping
using a fermented cereal gruel, thobwa. Ten trained panelists evaluated intensi-
ties of 34 descriptors, of which 27 were significantly different (P < 0.05). The
LFP were strong in brown color, sourness, umami, roasted soybean- and maize-
associated aromas, and sogginess while NFP had high intensities of yellow
color, pH, raw soybean, and rancid odors, fried egg, and fermented aromas and
softness. Although there was consumer (n = 150) heterogeneity in preference,
external preference mapping showed that most consumers preferred NFP. Driv-
ers of liking of NFP samples were softness, pH, fermented aroma, sweetness,
fried egg aroma, fried egg-like appearance, raw soybean, and rancid odors.
Optimization of the desirable properties of the pastes would increase utilization
and acceptance of fermented soybeans.
Introduction
Diets of most rural Malawian households are poorly
diversified and are predominantly maize-based. Maize
contributes to over 60% of energy, total iron, zinc, ribo-
flavin, and about half of protein consumption, when ani-
mal-source foods are scarce (Ecker and Qaim 2011). Yet,
maize has low protein content (9.42%) and is limited in
micronutrients (Nuss and Tanumihardjo 2010). Such
maize-based diets increase the risk of various types of
malnutrition. In Malawi, the prevalence of chronic mal-
nutrition among under-5 children is high, that is 47%
(National Statistics Office and ICF Macro 2011), and
micronutrient deficiencies were reported among under-5
children, women, and men (National Statistics Office and
Macro 2005). Malnutrition in Malawi is attributed to
insufficient energy and nutrient intake, among other fac-
tors (Maleta 2006). Animal-source foods provide good
114 ª 2013 The Authors. Food Science & Nutrition published by Wiley Periodicals, Inc. This is an open access article under the terms of
the Creative Commons Attribution License, which permits use, distribution and reproduction in any medium,
provided the original work is properly cited.
quantities of protein and other nutrients, but they are
expensive. This calls for alternative low-cost source of
nutrient-dense food that can be consumed by adults and
children.
Legumes, including soybeans (Glycine max), provide
good quantities of protein, riboflavin, calcium, and iron
(Messina 1999). Soybeans have been used in the prevention
and treatment of protein energy malnutrition in young
children, and in improving the nutritional status of
communities. Therefore, soybean is a good alternative to
expensive animal-source proteins (United Nations Indus-
trial Development Organization 2003). In Malawi, soybean
is produced mainly as a cash crop with limited household-
based consumption (CYE Consult 2009; Tinsley 2009).
Production increased over the past 5 years and in 2010,
73,000 tonnes of soybeans were produced. Most of the
soybeans (63,000 tonnes) were used within the country.
However, the demand for production is driven by the poul-
try feed industry (Markets and Economic Research Centre
of the National Agricultural Marketing Council 2011) while
there is limited demand from the corn–soy blend industry
(Tinsley 2009). Unfortunately, there is no statistics indicat-
ing the percent consumption of both industries. Neverthe-
less, various reports show that direct human consumption
of soybeans in Malawian households is through enriched
maize flour containing up to 20% soybean flour (Katona-
Apte 1993; Kalimbira et al. 2004; Maleta 2006; CYE Con-
sult 2009; Tinsley 2009). The enriched flour locally known
as Likuni Phala is used as a weaning food in children
(Kalimbira et al. 2004; Maleta 2006; CYE Consult 2009)
and is also distributed by nongovernmental organizations
for school feeding programs, for hospitals, orphanages, and
refugee camp usage (Katona-Apte 1993; Tinsley 2009).
Consumption of maize together with soybeans provide
high-quality protein diet comparable to diets containing
animal protein (Asgar et al. 2010), because limiting amino
acids in maize are complemented by those found in
soybeans (Siegel and Fawcett 1976; FAO 1992).
Despite the nutritional benefits, household soybean uti-
lization in Malawi is still minimal due to limited knowl-
edge in processing (Coulibaly et al. 2009). Processing is
required to eliminate antinutritional factors and the
undesirable characteristic “beany” taste. Various process-
ing methods such as boiling, steaming, roasting, germina-
tion, fermentation, and milling improve soybean
utilization (Siegel and Fawcett 1976; Anderson and Wolf
1995; Golbitz 1995; Wang and Murphy 1996). Use of fer-
mented soybean products in Asia is widely documented
(Sarkar et al. 1994; Kwon et al. 2010; Dajanta et al. 2012;
Park et al. 2012).
In order to increase direct household consumption of
soybeans in Malawian diets, pastes of fermented soybeans
and soybean–maize blends were developed as an alternative
low-cost source of protein. The pastes were naturally fer-
mented or lactic acid bacteria (LAB) fermented through
backslopping using a traditional fermented cereal gruel,
thobwa. The developed pastes were to be used as side
dishes, such as in kinema (Sarkar et al. 1994) and other
similar products of the Orient. Most soybean-
fermented products are naturally fermented by Bacillus
subtilis (Steinkraus 1997), a proteolytic microorganism that
produces ammonia during fermentation (Sarkar and Ta-
mang 1995; Dakwa et al. 2005). High amounts of ammo-
nia result in strong odor, which some people find
objectionable (Allagheny et al. 1996; Parkouda et al. 2009).
LAB fermentations, on the other hand, improve flavor of
traditional foods (Steinkraus 1997).
The developed products were new to Malawian consum-
ers; therefore, it was important to obtain consumer feed-
back for improvement of the products. Preference
mapping (PREFMAP) techniques were used to find out the
potential of the developed products for future use and to
determine the sensory properties driving consumer prefer-
ences. PREFMAP techniques have been widely used in dif-
ferent food products (Helgesen et al. 1997; Lawlor and
Delahunty 2000; Guinard et al. 2001; Thompson et al.
2004) to understand sensory attributes that drive consumer
acceptability (Murray and Delahunty 2000; Thompson
et al. 2004; van Kleef et al. 2006; Dooley et al. 2010; Resa-
no et al. 2010). Thus, the objectives of this study were to
describe sensory properties of the fermented pastes, to
determine consumer acceptance of the pastes, and to find
out sensory properties that drive acceptance of the pastes.
Material and Methods
Preparation of pastes of soybeans and
soybean–maize blends
Pastes of soybeans and soybean–maize blends were pre-
pared in the laboratory. Soybeans (Nasoko, variety code
427/6/7) were sorted, washed, and boiled for 30 min and
dehulled by rubbing between palms in cold water, washed
again, and then boiled for 1 h (Dakwa et al. 2005). Maize
(DK8071) was boiled for 2 h (to make it soft) before
being ground together with soybeans into a paste. Grind-
ing was done for 10–15 min in a Waring Commercial
blender (800ES; Waring, Torrington, CT), which was ster-
ilized by boiling for 5 min. Sterile water (100 mL) was
added during the grinding to make the pastes. LAB fer-
mentation was facilitated by the addition of fermented
maize and finger millet (Eleusine coracana) gruel (tho-
bwa). The preparation of thobwa was according to Kitaba-
take et al. (2003). Pastes for LAB fermentation (LFP)
were backslopped (BS) using 10% (v/w) thobwa. The pH
of the thobwa was around 4.5 with a LAB population of
ª 2013 The Authors. Food Science & Nutrition published by Wiley Periodicals, Inc. 115
T. A. Ng’ong’ola-Manani et al. Sensory and Consumer Studies of Fermented Soybean

108 cfu/mL. Naturally fermented pastes (NFP) were made
by similar treatments but without adding the fermented
gruel. Paste composition was determined based on preli-
minary laboratory trials whereby pastes containing 100%,
75%, and 50% soybeans (the remaining proportions being
maize) were studied. The preliminary study showed no
significant differences in pH reduction and microbial
loads (total aerobic count and LAB count) in pastes con-
taining 75% and 50% soybeans. Thus for the study, pastes
were prepared according to the following compositions:
pastes of soybeans only; pastes of soybean and maize
blends containing 90% and 75% soybeans. NFP were des-
ignated as 100S, 90S, and 75S according to 100%, 90%,
and 75% soybean composition in the pastes, the remain-
ing proportions being maize. Similarly, BS LAB-fermented
pastes were designated 100SBS, 90SBS, and 75SBS. Por-
tions of 500 g for all treatments were fermented at 30°C
for 72 h in glass jars.
Analyses of chemical and physicalproperties
Titratable acidity (g lactic acid/100 g sample) and pH
were determined according to AOAC (1990). The pH was
measured using a pH meter (WTW pH 525; D. Jurgens
and Co., Bremen, Germany) fitted with a glass electrode
(WTW SenTix 97T). Amino acids were extracted from
freeze-dried homogenized samples and were determined
using High-performance liquid chromatography according
to B€utikofer and Ard€o (1999). Salt content was deter-
mined using a Sherwood MK II Chloride Analyzer
(Model 926; Sherwood Scientific Ltd., Cambridge, U.K.)
according to the manufacturer’s operating instructions.
Freeze-dried samples (1.00 g) were mixed with 20 mL of
distilled water. The mixtures were heated to 55°C for
30 min and were filtered before chloride analysis. Visco-
elastic properties of the samples were analyzed using a
Physica MCR301 rheometer (Paar Physica, Antony Paar,
Germany) fitted with a 50-mm plate/plate geometry,
PP50. The temperature was kept at 20°C by the Peltier
control of the bottom plate. The sample was placed on
the bottom plate and gently compressed. The gap was
~3 mm, and a constant normal force of 5 N was applied
to the sample while testing took place. Amplitude sweeps
were then done in oscillation at a frequency of 1 Hz vary-
ing the amplitude from 0.01% to 110% strain.
Descriptive sensory analysis
Panel selection and training
Ten people interested in sensory evaluation of the fer-
mented pastes were recruited among Nutrition and
Food Science students in the Department of Home
Economics and Human Nutrition; and staff members at
Lilongwe University of Agriculture and Natural
Resources, Bunda College campus. Panelists with ability
to discriminate five tastes (salty, sweet, sour, umami,
and bitter) in a solution system were selected by con-
ducting five sets of directional paired comparison tests.
Four men and six women in the age range of 20–
32 years were selected as panelists. Consensus training
as explained by Lawless and Heymann (1998) was con-
ducted. Panelists were exposed to soybean-fermented
pastes to be tested in the descriptive analysis sessions.
Through consensus, panelists generated terms (descrip-
tors) and definitions to describe the sensory differences
among the samples. Panelists also decided on words to
anchor the descriptive terms and some reference stan-
dards to be used. Trial evaluations were performed to
enable decision on panelists’ reproducibility. Thirty-four
descriptors/attributes describing appearance, aroma/odor,
taste, and texture were generated. The descriptors, their
meanings, and the reference standards used are pre-
sented in Table 1. Four training sessions per week were
held for 1.5 months and each session lasted ~1 h
30 min.
Sample preparation and presentation
Maize starch (1%, w/w) was added to the fermented
pastes to prevent crumbling during frying. The pastes
were molded into rounds ca. 5 g each, and were fried in
heated (180–195°C) soybean oil for 3–5 min. Fresh oil
was used for each sample. One hour before sensory evalu-
ation, four pieces of 5 g of each fried sample were trans-
ferred to a separate glass serving container before
covering with aluminum foil. Each sample was coded
with a three-digit random number and the samples were
presented in random order to the panelists for evaluation.
The temperature of the samples at the time of evaluation
was room temperature (around 25°C).
Descriptive analysis procedure
Ten panelists were trained to rate attribute intensities of
the six products using a 15-point unstructured line scale
labeled with either “none, weak, or least” as point 1 and
“very strong” as point 15. Each panelist evaluated the
products individually. Products were evaluated in three
sessions and all products were served at each session,
hence the sessions acted as replicates. Tap water was pro-
vided to panelists to rinse their palate before and between
tasting. The evaluation was conducted in a well-ventilated
laboratory fitted with fluorescent lights. The temperature
in the evaluation room was between 23°C and 25°C.
116 ª 2013 The Authors. Food Science & Nutrition published by Wiley Periodicals, Inc.
Sensory and Consumer Studies of Fermented Soybean T. A. Ng’ong’ola-Manani et al.

Table 1. Descriptors and definitions used to explain sensory characteristics of the fermented pastes.
Descriptors Abbreviations Meanings of the descriptors
Reference/standards
used
Appearance
Brown Brown Intensity of brown color of the fried
pastes
Color wheel
Yellow Yellow Intensity of the yellow color of the
fried pastes
Color wheel
Fried egg-like EggL Appearance associated with fried
egg
Fried egg
Chitumbuwa-like ChituL Appearance associated with a local
snack, chitumbuwa, made from
deep frying maize flour batter
Chitumbuwa
Mandazi-like MandL Appearance associated with local
fritters, mandazi, made from deep
frying wheat flour batter
Mandazi
Aroma/odors
Raw soybean odor RawS Characteristic soybean odor strong
in soymilk made from raw
soybeans hydrated in cold water
Raw soymilk
Roasted soybean aroma RoastS Aroma associated with roasted
soybean
Crushed roasted
soybean
Burnt roasted soybean
odor
BRoastS Odor associated with burnt roasted
soybean
Crushed burnt
roasted soybean
Roasted maize aroma RoastM Aroma associated with roasted dried
maize
Crushed roasted
maize
Burnt roasted maize odor BRoastM Odor associated with burnt roasted
dried maize
Crushed burnt
roasted maize
Soaked burnt roasted
maize odor
SBRoastM Odor associated with soaked burnt
roasted dried maize
Soaked burnt roasted
maize
Chitumbuwa aroma ChituA Aroma associated with a local snack,
chitumbuwa, made from deep
frying maize flour batter
Chitumbuwa
Mandazi aroma MandA Aroma associated with local fritters,
mandazi, made from deep frying
bread flour batter
Mandazi
Chigumuyoyo aroma Chigumu Aroma associated with a local snack,
chigumuyoyo, made from baking
maize flour batter
Chigumuyoyo
Fried egg aroma EggA Aroma associated with fried egg Fried egg
Fermented aroma FermA Aroma associated with fermented
cereals
Sugar solution (20%)
fermented for 24 h
by 1.5 g yeast.
Matsukwa odor Matsukwa Odor associated with water for
soaking degermed maize
Water from
degermed maize
soaked for 2 days
Kondoole aroma Kondoole Aroma associated with fermented
cassava, kondoole
Fermented cassava
Thobwa aroma Thobwa Aroma associated with a local
fermented beverage “thobwa”
Thobwa
Chambiko aroma Chambiko Aroma associated with fermented
milk, chambiko
Commercially
available
Chambiko’
Fermented beans aroma FBeans Aroma associated with fermented
kidney beans
Cooked beans
fermented for 24 h
Mafuta a chiwisi odor Chiwisi Odor associated with partially
heated cooking oil
Soybean cooking oil
heated at 100°C
for 2 min
ª 2013 The Authors. Food Science & Nutrition published by Wiley Periodicals, Inc. 117
T. A. Ng’ong’ola-Manani et al. Sensory and Consumer Studies of Fermented Soybean
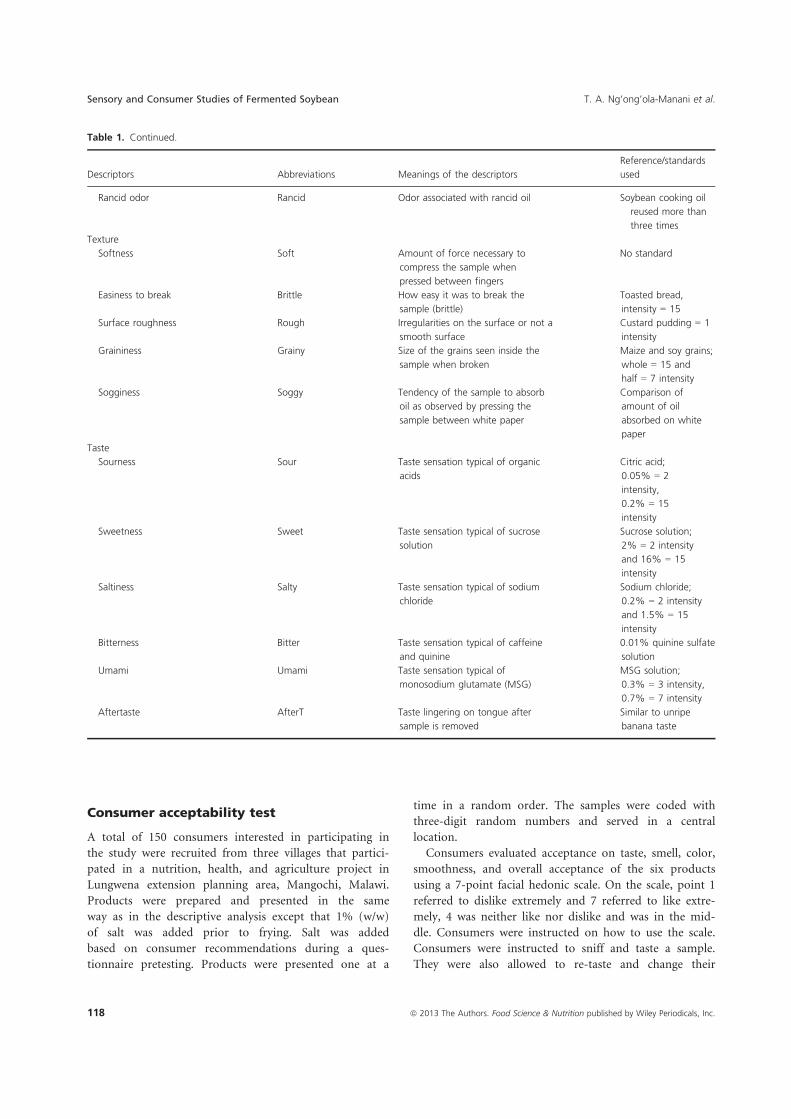
Consumer acceptability test
A total of 150 consumers interested in participating in
the study were recruited from three villages that partici-
pated in a nutrition, health, and agriculture project in
Lungwena extension planning area, Mangochi, Malawi.
Products were prepared and presented in the same
way as in the descriptive analysis except that 1% (w/w)
of salt was added prior to frying. Salt was added
based on consumer recommendations during a ques-
tionnaire pretesting. Products were presented one at a
time in a random order. The samples were coded with
three-digit random numbers and served in a central
location.
Consumers evaluated acceptance on taste, smell, color,
smoothness, and overall acceptance of the six products
using a 7-point facial hedonic scale. On the scale, point 1
referred to dislike extremely and 7 referred to like extre-
mely, 4 was neither like nor dislike and was in the mid-
dle. Consumers were instructed on how to use the scale.
Consumers were instructed to sniff and taste a sample.
They were also allowed to re-taste and change their
Table 1. Continued.
Descriptors Abbreviations Meanings of the descriptors
Reference/standards
used
Rancid odor Rancid Odor associated with rancid oil Soybean cooking oil
reused more than
three times
Texture
Softness Soft Amount of force necessary to
compress the sample when
pressed between fingers
No standard
Easiness to break Brittle How easy it was to break the
sample (brittle)
Toasted bread,
intensity = 15
Surface roughness Rough Irregularities on the surface or not a
smooth surface
Custard pudding = 1
intensity
Graininess Grainy Size of the grains seen inside the
sample when broken
Maize and soy grains;
whole = 15 and
half = 7 intensity
Sogginess Soggy Tendency of the sample to absorb
oil as observed by pressing the
sample between white paper
Comparison of
amount of oil
absorbed on white
paper
Taste
Sourness Sour Taste sensation typical of organic
acids
Citric acid;
0.05% = 2
intensity,
0.2% = 15
intensity
Sweetness Sweet Taste sensation typical of sucrose
solution
Sucrose solution;
2% = 2 intensity
and 16% = 15
intensity
Saltiness Salty Taste sensation typical of sodium
chloride
Sodium chloride;
0.2% = 2 intensity
and 1.5% = 15
intensity
Bitterness Bitter Taste sensation typical of caffeine
and quinine
0.01% quinine sulfate
solution
Umami Umami Taste sensation typical of
monosodium glutamate (MSG)
MSG solution;
0.3% = 3 intensity,
0.7% = 7 intensity
Aftertaste AfterT Taste lingering on tongue after
sample is removed
Similar to unripe
banana taste
118 ª 2013 The Authors. Food Science & Nutrition published by Wiley Periodicals, Inc.
Sensory and Consumer Studies of Fermented Soybean T. A. Ng’ong’ola-Manani et al.

previous scores, if needed. Tap water was provided to
consumers to rinse their palate before and between
tasting.
Statistical analysis
During training, panelists’ reproducibility was determined
using analysis of variance (ANOVA) at P = 0.05. Scores
of each panelist were compared with the rest of the panel-
ists for each sample. When significant differences were
found, Duncan’s test was performed to identify panelists
that differed and the specific descriptors they scored dif-
ferently. Panelists who were not reproducible were
assisted to improve performance. Panel consensus was
checked using profile plots generated from PanelCheck.
At the end of the descriptive analysis, PanelCheck was
used to assess panelists’ consensus and discrimination
ability of the attributes (Tomic et al. 2010). Mean inten-
sity scores of the descriptors were compared using three-
way ANOVA and least square difference test (P = 0.05) as
post hoc, with panelists, replicates, and products as fac-
tors. Correlations between sensory attributes were also
obtained.
To understand sensory attributes that characterized the
products, principal component analysis (PCA) was per-
formed. In order to identify attributes driving consumer
liking, external PREFMAP was obtained by performing a
partial least squares regression (PLSR) analysis. Mean
intensity scores of attributes that were significantly differ-
ent (P < 0.05) on product effect and mean values of
chemical and physical properties were used in PCA and
PLSR. Data in PCA and PLSR were centered, full cross-
validated, and standardized. Sensory data and data on
chemical and physical properties of the pastes were used
as explanatory variables (X matrix) while means of over-
all consumer acceptance data were used as response vari-
ables (Y matrix) (Helgesen et al. 1997; Resano et al.
2010).
To identify consumer subgroups sharing common
preference patterns, hierarchical cluster analysis using
complete linkage and squared Euclidian distance was
performed on consumer overall acceptance data. Means
of overall acceptance obtained for each cluster and data
on sensory, chemical, and physical properties of the
pastes were used to obtain a PREFMAP of the clusters.
The sensory, chemical, and physical properties data
provided the X matrix while means of overall accep-
tance of clusters provided the Y matrix. Demographic
information of the subgroups obtained through cross-
tabulations provided an understanding of cluster
compositions.
ANOVA, cluster analysis, cross-tabulations, and corre-
lations were performed in SPSS 15.0 (SPSS Inc., Chicago,
IL) while PCA and PLSR were performed in Unscram-
blerX 10.2 (CAMO Software, AS, Norway).
Results and Discussion
Chemical and physical properties of the
pastes
There were significant differences (P < 0.05) in pH of the
samples between the NFP and the LFP. LAB-fermented
pastes had lower pH values ranging from 3.91 to 4.26
compared to NFP that had pH values ranging from 5.36
to 5.81 (Table 2). There was an agreement between lactic
acid content, presented as titratable acidity, and pH levels
in the pastes and the sensory perception of sourness. Lac-
tic acid contents were higher in LFP than in NFP and so
were the perceived sourness intensities. On the contrary,
the amino acid contents did not agree with umami, bit-
terness, and sweetness taste perceptions. Amino acids in
their free state (as L, D, and DL) contribute to bitter,
sweet, and umami tastes in most foods. In this study,
amino acids responsible for bitterness and umami were
generally high in NFP while those responsible for sweet-
ness were high in LFP (Table 2). However, perceived
intensities of these tastes by descriptive sensory panel
(Table 3) differed from the expectation from the chemical
analyses. Panelists rated LFP high in bitterness and um-
ami while NFP were rated high in sweetness. Descriptive
sensory perception of bitterness was high in LFP probably
because of interactions of the bitter compounds and the
other tastants in the fermented pastes. According to
Mukai et al. (2007), mixtures of bitter and sweet tastes
resulted in variable effects at low intensity/concentration,
while mixtures at moderate and high intensity/concentra-
tions were mutually suppressive. In LFP, mixtures of
sweet and bitter tastes were at low concentrations result-
ing in enhancement of bitter taste. While in NFP, the
concentrations of sweet tastes were moderate and the
overall concentrations of bitter tastes were high, resulting
in suppression of bitterness. Furthermore, bitterness in
LFP could have been enhanced due to interactions
between sour and bitter compounds at low concentrations
(Mukai et al. 2007). On the other hand, bitterness in
NFP could have been reduced by aspartic and glutamic
acids. Although there were no significant differences in
aspartic acid contents among all samples, 90S had the
highest content. Furthermore, glutamic acid content was
highest in 100S and the content was significantly different
between 100S and the rest of the pastes except 90S
(Table 2). Thus overall, the amino acids imparting um-
ami flavor were higher in NFP. Aspartic and glutamic
acids were reported to be effective in reducing bitterness
of solutions comprising bitter amino acids in low
ª 2013 The Authors. Food Science & Nutrition published by Wiley Periodicals, Inc. 119
T. A. Ng’ong’ola-Manani et al. Sensory and Consumer Studies of Fermented Soybean
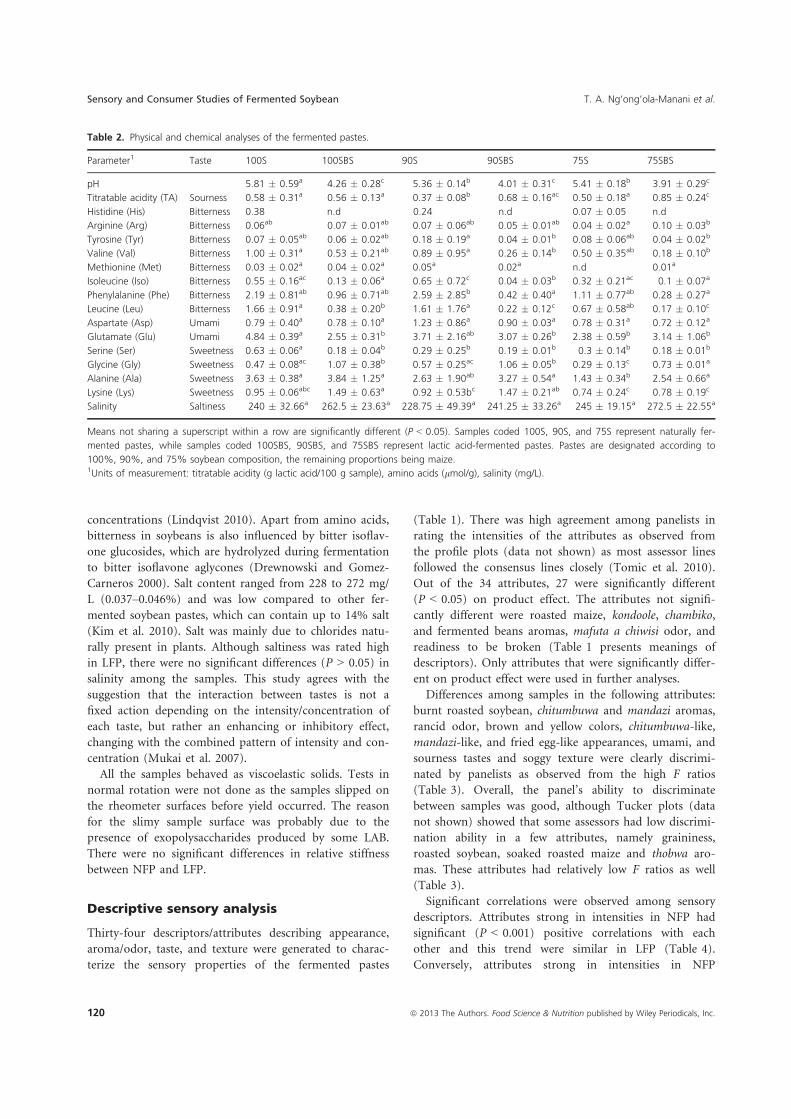
concentrations (Lindqvist 2010). Apart from amino acids,
bitterness in soybeans is also influenced by bitter isoflav-
one glucosides, which are hydrolyzed during fermentation
to bitter isoflavone aglycones (Drewnowski and Gomez-
Carneros 2000). Salt content ranged from 228 to 272 mg/
L (0.037–0.046%) and was low compared to other fer-
mented soybean pastes, which can contain up to 14% salt
(Kim et al. 2010). Salt was mainly due to chlorides natu-
rally present in plants. Although saltiness was rated high
in LFP, there were no significant differences (P > 0.05) in
salinity among the samples. This study agrees with the
suggestion that the interaction between tastes is not a
fixed action depending on the intensity/concentration of
each taste, but rather an enhancing or inhibitory effect,
changing with the combined pattern of intensity and con-
centration (Mukai et al. 2007).
All the samples behaved as viscoelastic solids. Tests in
normal rotation were not done as the samples slipped on
the rheometer surfaces before yield occurred. The reason
for the slimy sample surface was probably due to the
presence of exopolysaccharides produced by some LAB.
There were no significant differences in relative stiffness
between NFP and LFP.
Descriptive sensory analysis
Thirty-four descriptors/attributes describing appearance,
aroma/odor, taste, and texture were generated to charac-
terize the sensory properties of the fermented pastes
(Table 1). There was high agreement among panelists in
rating the intensities of the attributes as observed from
the profile plots (data not shown) as most assessor lines
followed the consensus lines closely (Tomic et al. 2010).
Out of the 34 attributes, 27 were significantly different
(P < 0.05) on product effect. The attributes not signifi-
cantly different were roasted maize, kondoole, chambiko,
and fermented beans aromas, mafuta a chiwisi odor, and
readiness to be broken (Table 1 presents meanings of
descriptors). Only attributes that were significantly differ-
ent on product effect were used in further analyses.
Differences among samples in the following attributes:
burnt roasted soybean, chitumbuwa and mandazi aromas,
rancid odor, brown and yellow colors, chitumbuwa-like,
mandazi-like, and fried egg-like appearances, umami, and
sourness tastes and soggy texture were clearly discrimi-
nated by panelists as observed from the high F ratios
(Table 3). Overall, the panel’s ability to discriminate
between samples was good, although Tucker plots (data
not shown) showed that some assessors had low discrimi-
nation ability in a few attributes, namely graininess,
roasted soybean, soaked roasted maize and thobwa aro-
mas. These attributes had relatively low F ratios as well
(Table 3).
Significant correlations were observed among sensory
descriptors. Attributes strong in intensities in NFP had
significant (P < 0.001) positive correlations with each
other and this trend were similar in LFP (Table 4).
Conversely, attributes strong in intensities in NFP
Table 2. Physical and chemical analyses of the fermented pastes.
Parameter1 Taste 100S 100SBS 90S 90SBS 75S 75SBS
pH 5.81 ! 0.59a 4.26 ! 0.28c 5.36 ! 0.14b 4.01 ! 0.31c 5.41 ! 0.18b 3.91 ! 0.29c
Titratable acidity (TA) Sourness 0.58 ! 0.31a 0.56 ! 0.13a 0.37 ! 0.08b 0.68 ! 0.16ac 0.50 ! 0.18a 0.85 ! 0.24c
Histidine (His) Bitterness 0.38 n.d 0.24 n.d 0.07 ! 0.05 n.d
Arginine (Arg) Bitterness 0.06ab 0.07 ! 0.01ab 0.07 ! 0.06ab 0.05 ! 0.01ab 0.04 ! 0.02a 0.10 ! 0.03b
Tyrosine (Tyr) Bitterness 0.07 ! 0.05ab 0.06 ! 0.02ab 0.18 ! 0.19a 0.04 ! 0.01b 0.08 ! 0.06ab 0.04 ! 0.02b
Valine (Val) Bitterness 1.00 ! 0.31a 0.53 ! 0.21ab 0.89 ! 0.95a 0.26 ! 0.14b 0.50 ! 0.35ab 0.18 ! 0.10b
Methionine (Met) Bitterness 0.03 ! 0.02a 0.04 ! 0.02a 0.05a 0.02a n.d 0.01a
Isoleucine (Iso) Bitterness 0.55 ! 0.16ac 0.13 ! 0.06a 0.65 ! 0.72c 0.04 ! 0.03b 0.32 ! 0.21ac 0.1 ! 0.07a
Phenylalanine (Phe) Bitterness 2.19 ! 0.81ab 0.96 ! 0.71ab 2.59 ! 2.85b 0.42 ! 0.40a 1.11 ! 0.77ab 0.28 ! 0.27a
Leucine (Leu) Bitterness 1.66 ! 0.91a 0.38 ! 0.20b 1.61 ! 1.76a 0.22 ! 0.12c 0.67 ! 0.58ab 0.17 ! 0.10c
Aspartate (Asp) Umami 0.79 ! 0.40a 0.78 ! 0.10a 1.23 ! 0.86a 0.90 ! 0.03a 0.78 ! 0.31a 0.72 ! 0.12a
Glutamate (Glu) Umami 4.84 ! 0.39a 2.55 ! 0.31b 3.71 ! 2.16ab 3.07 ! 0.26b 2.38 ! 0.59b 3.14 ! 1.06b
Serine (Ser) Sweetness 0.63 ! 0.06a 0.18 ! 0.04b 0.29 ! 0.25b 0.19 ! 0.01b 0.3 ! 0.14b 0.18 ! 0.01b
Glycine (Gly) Sweetness 0.47 ! 0.08ac 1.07 ! 0.38b 0.57 ! 0.25ac 1.06 ! 0.05b 0.29 ! 0.13c 0.73 ! 0.01a
Alanine (Ala) Sweetness 3.63 ! 0.38a 3.84 ! 1.25a 2.63 ! 1.90ab 3.27 ! 0.54a 1.43 ! 0.34b 2.54 ! 0.66a
Lysine (Lys) Sweetness 0.95 ! 0.06abc 1.49 ! 0.63a 0.92 ! 0.53bc 1.47 ! 0.21ab 0.74 ! 0.24c 0.78 ! 0.19c
Salinity Saltiness 240 ! 32.66a 262.5 ! 23.63a 228.75 ! 49.39a 241.25 ! 33.26a 245 ! 19.15a 272.5 ! 22.55a
Means not sharing a superscript within a row are significantly different (P < 0.05). Samples coded 100S, 90S, and 75S represent naturally fer-
mented pastes, while samples coded 100SBS, 90SBS, and 75SBS represent lactic acid-fermented pastes. Pastes are designated according to
100%, 90%, and 75% soybean composition, the remaining proportions being maize.1Units of measurement: titratable acidity (g lactic acid/100 g sample), amino acids (lmol/g), salinity (mg/L).
120 ª 2013 The Authors. Food Science & Nutrition published by Wiley Periodicals, Inc.
Sensory and Consumer Studies of Fermented Soybean T. A. Ng’ong’ola-Manani et al.

negatively correlated with those strong in intensities in
LFP. Strong correlations were observed amongst appear-
ance attributes (r = "0.439 to "0.844). Brown color
strongly positively correlated with chitumbuwa-like and
mandazi-like appearances and also negatively corre-
lated with yellow color and fried egg-like appearance.
Table 3. Mean intensity scores, F ratios and P-values of descriptors/attributes based on product effect.
Attribute 100S 100SBS 90S 90SBS 75S 75SBS F ratio P-value
Raw
soybean odor
7.17 ! 3.52a 4.37 ! 1.65bc 5.07 ! 2.35ab 3.43 ! 1.65 cd 6.00 ! 2.84ab 2.80 ! 1.73d 7.51 <0.000
Roasted
soybean aroma
4.21 ! 1.65a 5.1 ! 1.90b 4.67 ! 2.31ab 4.53 ! 2.85ab 4.4 ! 2.90 4.40 ! 2.55a 2.67 0.03
Burnt roasted
soybean odor
2.55 ! 1.15a 4.9 ! 2.23b 3.67 ! 2.22c 4.93 ! 1.99b 3 ! 1.51ac 5.10 ! 2.34b 10.15 <0.000
Roasted
maize aroma
3.2 ! 1.63a 4.6 ! 1.96b 4.21 ! 2.04ab 3.33 ! 1.45a 4.33 ! 3.03b 3.87 ! 1.78ab 2.12 0.07
Burnt roasted
maize odor
2.7 ! 1.68a 4.57 ! 2.37b 3.43 ! 2.25ac 4.03 ! 1.87bc 3.4 ! 2.65ac 4.43 ! 2.16b 3.80 0.00
Soaked burnt
roasted maize
odor
3.07 ! 1.99ab 3.53 ! 2.92a 3.55 ! 2.72a 3.13 ! 2.33ac 2.37 ! 1.47bc 4.00 ! 3.04a 2.41 0.04
Chigumuyoyo
aroma
2.13 ! 1.36a 4.17 ! 2.33b 3.33 ! 1.99c 4.47 ! 2.42b 2.83 ! 1.84ac 5.67 ! 2.42d 8.62 <0.000
Chitumbuwa
aroma
1.9 ! 1.03a 4.87 ! 2.74b 3.53 ! 2.37c 9.07 ! 2.75d 2.83 ! 1.86ac 9.44 ! 3.19e 48.82 <0.000
Mandazi
aroma
3.4 ! 1.48ac 3.57 ! 2.03ab 3 ! 1.58a 4.55 ! 2.38b 3.9 ! 2.07bc 6.73 ! 3.05d 12.54 <0.000
Fermented aroma 6.93 ! 3.66a 4.07 ! 2.08b 4.2 ! 2.12b 5.63 ! 2.76c 4.87 ! 3.09bc 4.53 ! 2.37bc 5.37 0.00
Matsukwa odor 3.2 ! 1.92a 3.97 ! 1.94a 3.37 ! 1.94a 3.4 ! 2.21a 3.13 ! 2.01a 3.20 ! 2.37a 0.44 0.83
Kondoole aroma 3.8 ! 2.66a 3.43 ! 1.89ab 2.87 ! 1.63bc 2.8 ! 1.81c 2.9 ! 2.01ac 2.66 ! 1.80bc 1.26 0.29
Thobwa aroma 4.10 ! 2.55a 3.71 ! 2.53ab 2.71 ! 1.65c 3.33 ! 2.18ac 2.91 ! 1.81bc 3.35 ! 2.35bc 2.55 0.03
Chambiko aroma 2.73 ! 1.57a 2.97 ! 1.87a 2.7 ! 1.91a 2.73 ! 2.24a 2.63 ! 1.94a 2.77 ! 2.15a 0.37 0.87
Fermented beans
aroma
2.57 ! 1.55ab 2.73 ! 2.02b 2.27 ! 1.51a 2.6 ! 2.04ab 1.8 ! 1.03a 2.3 ! 1.78ab 1.18 0.33
Fried egg aroma 3.43 ! 1.91a 3.2 ! 1.83a 3.13 ! 1.53a 2.5 ! 1.59b 3.67 ! 2.43a 2.2 ! 1.38b 4.12 0.00
Mafuta a
chiwisi odor
2.57 ! 2.27a 2.5 ! 2.10a 2.5 ! 1.94a 2.43 ! 1.92a 2.33 ! 2.26a 2.67 ! 2.37a 0.10 0.99
Rancid odor 9.07 ! 4.02a 4.87 ! 2.36bcd 5.07 ! 2.42c 3.4 ! 2.16d 5.8 ! 2.46c 3.57 ! 2.22bd 13.37 <0.000
Brown 2.83 ! 2.10a 7.2 ! 3.03b 3.07 ! 2.09a 11.03 ! 2.40c 2.8 ! 1.86a 12.97 ! 1.40d 101.65 <0.000
Yellow 10.07 ! 2.82a 5.5 ! 2.95b 9.8 ! 2.59a 2.5 ! 1.31c 10.6 ! 2.40d 1.33 ! 0.55c 74.90 <0.000
Chitumbuwa-like 3.37 ! 2.95a 6.43 ! 2.25b 3.7 ! 2.55a 8.35 ! 2.98c 2.7 ! 1.56d 8 ! 3.62c 23.78 <0.000
Mandazi-like 2.67 ! 2.16ac 5.23 ! 2.43b 3.47 ! 2.36c 6.97 ! 3.30bd 2.57 ! 1.72a 7.63 ! 2.79d 19.36 <0.000
Fried egg-like 7.73 ! 2.74a 4.37 ! 2.55b 7.5 ! 2.70a 1.69 ! 0.81c 7.73 ! 2.84a 1.3 ! 0.60c 42.25 <0.000
Sweetness 2.07 ! 1.36ac 1.67 ! 0.71b 1.83 ! 0.83bc 1.4 ! 0.50b 2.63 ! 1.97a 1.7 ! 0.65b 4.77 0.001
Saltiness 1.93 ! 0.91acd 2.53 ! 1.91ab 1.57 ! 0.77c 2.63 ! 2.55a 1.83 ! 0.95 cd 2.7 ! 1.97ad 3.39 0.007
Umami 3.5 ! 1.72a 5.23 ! 2.58b 3.5 ! 1.81a 6.07 ! 2.86b 3.47 ! 1.80a 7 ! 3.09c 17.29 <0.000
Sourness 3 ! 1.49a 7.08 ! 3.05b 5.47 ! 2.85c 10.07 ! 3.29d 4.4 ! 2.28c 10.9 ! 3.24d 32.17 <0.000
Bitterness 1.8 ! 1.49ad 2.48 ! 2.38ab 1.6 ! 1.16ac 2.9 ! 2.86b 1.47 ! 0.78 cd 3.0 ! 3.49b 3.11 0.01
Aftertaste 3.13 ! 2.16ac 4.27 ! 2.42ab 2.6 ! 1.59c 4.6 ! 2.96ab 2.53 ! 1.80c 5.1 ! 2.68b 5.09 0.000
Surface
roughness
5.2 ! 2.55a 6.07 ! 2.83a 5.7 ! 2.44a 7.5 ! 3.15b 7.73 ! 2.52b 8.4 ! 2.94b 6.01 <0.000
Softness 7.63 ! 3.46a 6.6 ! 3.29ab 5.93 ! 3.26a 5.03 ! 3.40c 5.17 ! 2.89bc 4.03 ! 2.76c 7.08 <0.0001
Easiness to
break
6.47 ! 2.97a 6.97 ! 2.91a 6.83 ! 2.65a 7.5 ! 4.02a 6.37 ! 3.05a 6.77 ! 3.38a 0.58 0.72
Graininess 3.9 ! 1.90a 4.35 ! 2.35a 4.5 ! 2.42a 4.53 ! 2.30a 6.17 ! 2.96b 4.97 ! 3.09a 2.89 0.02
Sogginess 8.5 ! 2.55a 7.11 ! 3.05a 6.31 ! 2.52b 8.6 ! 2.81a 5.31 ! 2.42b 11.12 ! 2.85c 20.79 <0.000
Intensity based on a scale of 1–15 (1 = none or least or very weak, 15 = very strong intensity). Means not sharing a superscript within a row are
significantly different (P < 0.05). Samples coded 100S, 90S, and 75S represent naturally fermented pastes, while samples coded 100SBS, 90SBS,
and 75SBS represent lactic acid-fermented pastes. Pastes are designated according to 100%, 90%, and 75% soybean composition, the remaining
proportions being maize. Full names of terms and their meanings are given in Table 1.
ª 2013 The Authors. Food Science & Nutrition published by Wiley Periodicals, Inc. 121
T. A. Ng’ong’ola-Manani et al. Sensory and Consumer Studies of Fermented Soybean
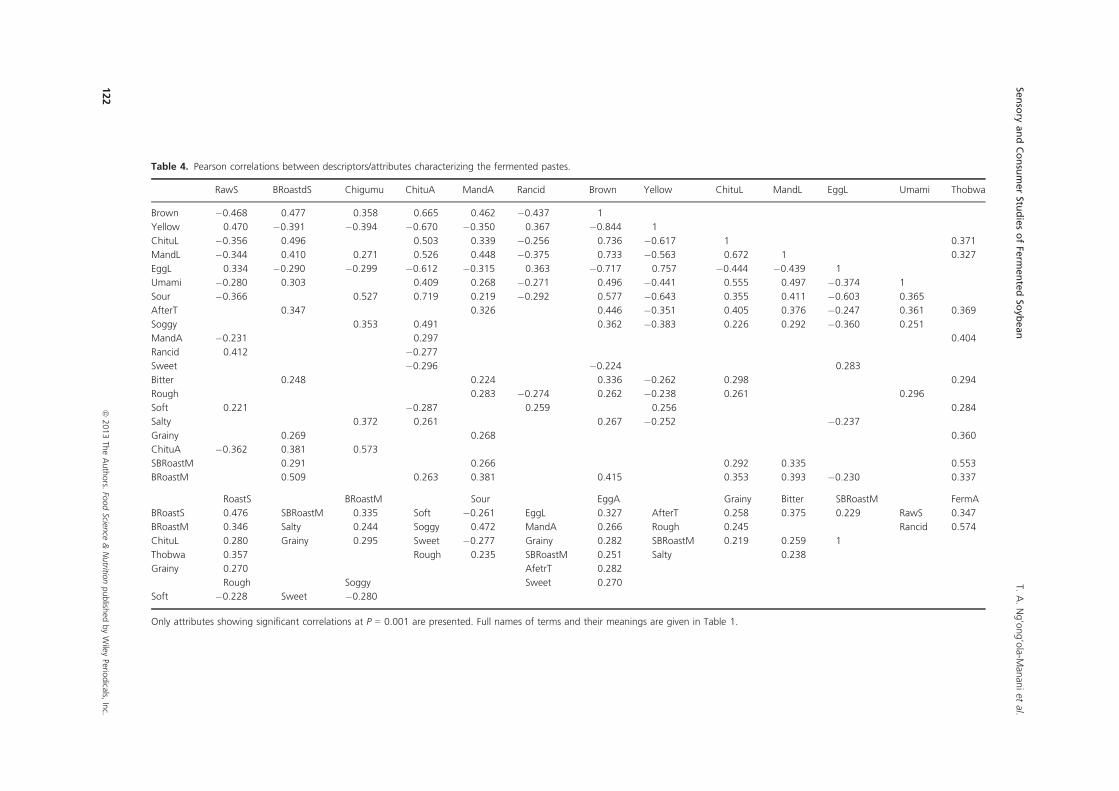
Table 4. Pearson correlations between descriptors/attributes characterizing the fermented pastes.
RawS BRoastdS Chigumu ChituA MandA Rancid Brown Yellow ChituL MandL EggL Umami Thobwa
Brown "0.468 0.477 0.358 0.665 0.462 "0.437 1
Yellow 0.470 "0.391 "0.394 "0.670 "0.350 0.367 "0.844 1
ChituL "0.356 0.496 0.503 0.339 "0.256 0.736 "0.617 1 0.371
MandL "0.344 0.410 0.271 0.526 0.448 "0.375 0.733 "0.563 0.672 1 0.327
EggL 0.334 "0.290 "0.299 "0.612 "0.315 0.363 "0.717 0.757 "0.444 "0.439 1
Umami "0.280 0.303 0.409 0.268 "0.271 0.496 "0.441 0.555 0.497 "0.374 1
Sour "0.366 0.527 0.719 0.219 "0.292 0.577 "0.643 0.355 0.411 "0.603 0.365
AfterT 0.347 0.326 0.446 "0.351 0.405 0.376 "0.247 0.361 0.369
Soggy 0.353 0.491 0.362 "0.383 0.226 0.292 "0.360 0.251
MandA "0.231 0.297 0.404
Rancid 0.412 "0.277
Sweet "0.296 "0.224 0.283
Bitter 0.248 0.224 0.336 "0.262 0.298 0.294
Rough 0.283 "0.274 0.262 "0.238 0.261 0.296
Soft 0.221 "0.287 0.259 0.256 0.284
Salty 0.372 0.261 0.267 "0.252 "0.237
Grainy 0.269 0.268 0.360
ChituA "0.362 0.381 0.573
SBRoastM 0.291 0.266 0.292 0.335 0.553
BRoastM 0.509 0.263 0.381 0.415 0.353 0.393 "0.230 0.337
RoastS BRoastM Sour EggA Grainy Bitter SBRoastM FermA
BRoastS 0.476 SBRoastM 0.335 Soft "0.261 EggL 0.327 AfterT 0.258 0.375 0.229 RawS 0.347
BRoastM 0.346 Salty 0.244 Soggy 0.472 MandA 0.266 Rough 0.245 Rancid 0.574
ChituL 0.280 Grainy 0.295 Sweet "0.277 Grainy 0.282 SBRoastM 0.219 0.259 1
Thobwa 0.357 Rough 0.235 SBRoastM 0.251 Salty 0.238
Grainy 0.270 AfetrT 0.282
Rough Soggy Sweet 0.270
Soft "0.228 Sweet "0.280
Only attributes showing significant correlations at P = 0.001 are presented. Full names of terms and their meanings are given in Table 1.
122
ª2013TheAuthors.
FoodScie
nce
&Nutritio
npublish
edbyWileyPerio
dica
ls,Inc.
Sensory
andConsumerStudiesofFerm
entedSoybean
T.A.Ng’ong’ola-M
ananietal.

Appearance attributes also strongly correlated with aroma
attributes and some tastes. For instance, brown color,
chitumbuwa-like, and mandazi-like appearances showed
significant (P < 0.001) positive correlations with chit-
umbuwa aroma, umami, bitterness, aftertaste, and sour-
ness. Mandazi aroma positively correlated with thobwa
aroma, fried egg aroma, umami, and aftertaste. Egg-like
appearance positively correlated with sweetness. The
intensities of attributes with significant positive correla-
tions with brown color were high in LFP, while the inten-
sities of attributes with significant positive correlations
with yellow color were high in NFP. Therefore, the type
of fermentation greatly influenced the appearance of the
fermented pastes. Among aromas that strongly correlated
with each other were fermented aroma and rancidity. Fer-
mented aroma intensity and rancidity were highest in
100S; in addition, rancidity was high in all NFP (Table 3).
High fermented aroma intensity in 100S could be due to
uneven fermentation in NFP due to spontaneous
fermentation by natural microflora over a long period
(Kim et al. 2010). Significant positive correlations were
also observed between textural properties, including
roughness and graininess, which were attributes influ-
enced by composition.
Sensory properties of the fermented pastes
Sensory properties characterizing the products are shown
in PCA map in Figure 1. The first two principal compo-
nents (PC1 and PC2) explained 74% of the variation.
This highly explained variance in PC1 and PC2 shows
that there was high systematic variation within the data,
indicating that the panel discriminated well between the
products. The score plot (Fig. 1A) shows product distri-
bution in multivariate space and PC1 explains differences
in the products according to type of fermentation, distin-
guishing NFP on the left from LFP on the right. Attri-
butes responsible for this categorization were appearance,
PC-1 (54%)
–1 –0.8 –0.6 –0.4 –0.2 0 0.2 0.4 0.6 0.8 1
PC
-2 (
20
%)
–1
–0.8
–0.6
–0.4
–0.2
0
0.2
0.4
0.6
0.8
–6 –5 –4–4
–3
–3
–2
–2
–1
–1
1
2
3
4
0
0
PC-1 (54%)
PC
-2 (
20
%)
1 2 3 4 5 6 7
1
RawS RoastS BRoastSBRoastM
SRoastM
ChigumuChituAMandA
FermA
Thobwa
EggA
Rancid Brown
Yellow
ChituL MandL
EggL
Sweet
100S 100SBS
90SBS
75SBS
90S75S
Salty Umami
Sour
BitterAfterT
Rough
Soft
Grainy
Soggy
pH
TA
His
Arg
Tyr
ValIso
Phe
Leu
Glu
Ser
Gly
Ala
Lys
(a)
(b)
Figure 1. Principal component analysis of fermented pastes and sensory attributes. (A) Score plot showing relatedness of samples in terms of
sensory, chemical, and physical properties of the pastes. (B) Correlations loading plot showing sensory properties of the pastes. On the map,
100S, 90S, and 75S represent naturally fermented pastes (NFP) while 100SBS, 90SBS, and 75SBS represent lactic acid-fermented pastes (LFP).
Pastes are designated according to 100%, 90%, and 75% soybean composition, the remaining proportions being maize.
ª 2013 The Authors. Food Science & Nutrition published by Wiley Periodicals, Inc. 123
T. A. Ng’ong’ola-Manani et al. Sensory and Consumer Studies of Fermented Soybean
some odors/aromas, taste, and pH. The mean intensities
of yellow color, fried egg-like appearance, raw soybean
odor, fried egg aroma, and pH were high in NFP. These
attributes also loaded highly on the negative side of PC1
(Fig. 1B) and were sensory properties characterizing NFP.
On the positive side of PC1, brown color, chitumbuwa-
and mandazi-like appearances, burnt roasted soybean
odor, chigumuyoyo and chitumbuwa aromas, umami,
bitterness, aftertaste, and sourness loaded highly (Fig. 1B).
These attributes had high intensities in LFP, hence
characterized LFP. Most of the amino acids responsible
for bitterness (histidine, arginine, tyrosine, valine, isoleu-
cine, phenylalanine, leucine) and glutamate responsible
for umami loaded highly on the negative side of PC1.
Due to the comparatively higher content of bitter amino
acids, it would be expected that NFP would have higher
bitterness intensity compared to LFP. On the contrary,
LFP were perceived to be more bitter than NFP, probably
because of taste interactions in which glutamate could
have suppressed bitterness in NFP and sourness could
have enhanced bitterness in LFP.
The proximity of 90S and 75S; and 90SBS and 75SBS
on the PCA map (Fig. 1A) indicates close similarity in
terms of sensory properties, unlike 100S and 100SBS,
which are clearly separated from the other NFP and LFP,
respectively. This delineation is along PC2 on which
graininess and sweetness loaded highly on the positive
dimension, while thobwa aroma, fermented aroma, and
softness loaded highly on the negative dimension
(Fig. 1B). The intensities of fermented aroma and softness
were high in 100S, while the intensities of sweetness and
graininess were high in 90S and 75S.
Yellow color of NFP originated from the color of soy-
beans, while brown color in LFP could be due to caramel-
ization and Maillard reactions. Color of fermented
soybean pastes like doenjang/miso is due to the raw mate-
rials used, amino carbonyl reaction of Maillard browning,
oxidative browning, enzymatic browning, and browning
enhancers (Chung and Chung 2007). In this study, 100S,
90S, and 75S underwent natural fermentation, while
100SBS, 90SBS, and 75SBS were BS with a LAB-fermented
product; hence, type of fermentation had a major influ-
ence on color, giving the strong browning intensity in
LFP. LAB fermentations increase the amount of reducing
sugars in products (Sripriya et al. 1997) and the sugars
could be responsible for the browning intensity due to
caramelization and participation in Maillard reactions
with amino carbonyls during frying. As increasing pH
values enhance both caremelization and Maillard
reactions (Ajandouz and Puigserver 1999; Ajandouz et al.
2001), it would be expected that NFP would have
stronger browning intensities than LFP. However, all the
samples had pH values below 6.0, thus were slightly acidic
and offered some stability of the amino acids that were
heated in the presence of reducing sugars (Ajandouz and
Puigserver 1999). The difference in browning intensity
was probably due to the difference in the amount of
reducing sugars, which were more in LFP than in NFP
(data not shown).
Tastes of the pastes were significantly different
(P < 0.05). NFP had low sourness intensity and their pH
values were only slightly reduced from the initial.
However, sweetness intensities were higher in NFP and
particularly in 75S, probably because of its high maize con-
tent; hence high content of sugars resulted in higher sweet
intensity. On the other hand, LFP were positively associ-
ated with sourness, umami, bitterness, saltiness, and after-
taste. The intensities of these tastes were highest in 75SBS.
Chung and Chung (2007) found that fermented soybean
products with high saltiness also had high umami (mono-
sodium glutamate, MSG) and sour tastes. Although salt
was not added to all the samples, its perception could be
due to the presence of NaCl and KCl, which were attrib-
uted to saltiness perception in Korean-fermented soybean
pastes, doenjang (Kim and Lee 2003). Besides, salt content
alone does not sufficiently predict perceived saltiness
intensity as synergistic interactions of salt and other flavor
compounds also affect saltiness perception (Kim et al.
2010). Sourness in fermented products is due to organic
acids, which increase during LAB fermentations. Because
75SBS had the highest maize content, it provided more fer-
mentable sugars as substrate for organic acid production
by LAB. In soybean-fermented pastes, malic, citric, succi-
nic, and lactic acids are responsible for the sour taste (Kim
et al. 2010). In this study, sour taste could have been due
to succinic, lactic, and acetic acids, which were detected
(data not shown). Umami taste is related to glutamic and
aspartic acids (Kim and Lee 2003), which are present in
soybeans and tend to increase with fermentation (Dajanta
et al. 2011). Another study on similar products (Kim et al.
2010) reported high bitterness intensities, which were
attributed to bitter amino acids produced during fermen-
tation. Amino acids responsible for bitter taste include leu-
cine and isoleucine (Namgung et al. 2010). Salts, sugars,
organic acids, umami compounds, amino acids, Maillard
peptides, types of base ingredients, microorganisms, and
various aroma compounds contribute to flavors of fer-
mented soybean products (Chung and Chung 2007).
A range of aromas and odors were described. NFP had
high intensities of raw soybean odor, rancid odor,
fermented aroma, and fried egg aroma. Raw soybean and
rancid odors are among the flavors that reduce consumer
acceptance of soy products (Torres-Penaranda et al.
1998). The two odors were highest in 100S. On the other
hand, LFP were characterized by aromas associated
with roasted soybeans and maize. In this case, LAB
124 ª 2013 The Authors. Food Science & Nutrition published by Wiley Periodicals, Inc.
Sensory and Consumer Studies of Fermented Soybean T. A. Ng’ong’ola-Manani et al.
fermentation was able to mask the characteristic beany
and rancid odors of soybeans that are due to oxidation of
polyunsaturated lipids catalyzed by lipoxygenase (Ediriwe-
era et al. 1987). Rancid odor is associated with volatile
compounds such as 3-methylbutanoic acid, 2-methyl-
propanoic acid, and butanoic acid, a major compound in
different fermented soybean foods (Jo et al. 2011).
Textural differences were also described. 100S was rated
softer than the rest of the samples while graininess and
roughness intensities were high in products containing
maize, particularly 75S, 75SBS, and 90SBS. Differences in
composition of the products accounted for the differences
in textural properties, resulting in rough appearance and
large particle sizes in the products containing maize.
Additionally, LFP absorbed more oil during frying than
NFP; this tendency could have been due to their slightly
higher moisture content (data not shown), which led to
more oil uptake as the water evaporated during frying
(Krokida et al. 2000).
Consumer acceptance
A total of 150 consumers participated in the consumer
acceptance study but demographic information was col-
lected on 148. A consumer was defined as a person who
occasionally consumed soybeans and soybean-based prod-
ucts. At the time of the study, 32.4% of the participants
had consumed soybean-based products within the past
2 months from the date of data collection. Soybeans were
mostly consumed in porridge (69%), although some of
the consumers used texturized soy products locally known
as soya pieces as relish (side dish), roasted beans as snack,
soy flour as a condiment in vegetables and other foods, in
addition to using soybeans in porridge (Table 5). Soybean
flour is used together with maize flour in a weaning food
prepared as porridge and locally known as Likuni Phala.
Most consumers (88%) were aware that soybeans are
nutritious as they associated the promotion of its use in
growth-monitoring centers and in nutrition rehabilitation
programs for under-5 children.
External PREFMAP
To understand the attributes driving consumer liking, sen-
sory, chemical, and physical data were regressed with con-
sumer acceptance data using PLSR. The sensory, chemical,
and physical data were used as predictor variables, while
overall consumer acceptance data were used as response
variables. In Figure 2, PC1 and PC2 together explain 73%
of the variation in the pastes in terms of their properties
and 47% of the variation in consumer preference for the
pastes. The location of the samples on the map is based
mainly on sensory attributes and the preference pattern
shows that consumers also used the same underlying
sensory properties to make their acceptability. The high
density of consumers in the two left quadrants (Fig. 2B)
indicates that the direction of preference was toward NFP.
These samples were characterized by strong yellow color,
higher pH, fried egg-like appearance, and aroma, sweetness,
softness, rancid odor, and raw soybean odor. It appears that
the positive impact of higher pH (low sourness intensity),
sweetness, and fried egg aroma exceeded the negative
impact of rancid and raw soybean odors. These two odors
have been documented as deterring consumer acceptance
of soybeans (Gupta 1997; Torres-Penaranda et al. 1998).
Therefore, higher pH (low sourness intensity), fried egg
aroma, and sweet taste seem to be the drivers of liking of
the fermented soybean pastes, especially for NFP for most
consumers. Nevertheless, other consumers preferred LAB-
fermented pastes, which had strong brown color, sourness,
bitterness, saltiness, umami, burnt roasted soybeans, and
maize aromas. These attributes seem to be drivers of liking
of 90SBS and 75SBS and as they load directly opposite driv-
ers of liking of NFP, they can be considered as drivers of
disliking for consumers preferring 75S, 90S, and 100S.
Taste and pleasure are among the most important pre-
dictors of food choice (Brunsø et al. 2002). Bitterness and
strong sourness could have been the key attributes leading
to little acceptance of LFP. Bitter taste is a major problem
in the food and pharmaceutical industries due to its neg-
ative hedonic impact on ingestion (Drewnowski and
Gomez-Carneros 2000; Ley 2008). In most cases, the bit-
ter taste is not desirable and has to be eliminated from or
masked in the product to increase a product’s acceptance.
Umami is the savory delicious taste in meat, poultry, sea
foods, and fermented beans (Yamaguchi and Ninomiya
2000). Although umami is among the drivers of dislike in
this study, it could not have been the reason for dislike
of LFP. Its inclusion among drivers of disliking in this
study is because of its significant (P < 0.001) correlation
with sourness and aftertaste (r = 0.365 and 0.361, respec-
tively) intensities. Consumption of foods that are strong
in sourness is typically avoided (Breslin and Spector
2008).
Table 5. Ways of household soybean consumption by the
consumers.
Ways of consumption
Consumers (%)
n = 129
Porridge only 89 (69)
Porridge and soya pieces 8 (6.2)
Soya pieces only 11 (8.5)
Porridge and roasted soybeans as snack 7 (5.4)
Porridge and soy flour vegetable condiment 8 (6.2)
Porridge, roasted soybeans, and soya pieces 4 (3.1)
Used in maize flour-based snacks 2 (1.6)
ª 2013 The Authors. Food Science & Nutrition published by Wiley Periodicals, Inc. 125
T. A. Ng’ong’ola-Manani et al. Sensory and Consumer Studies of Fermented Soybean

In this study, mixed strains of LAB from thobwa were
used in the fermentation of LFP. To improve acceptance
of LAB-fermented soybeans, selection of strains that
results in desirable sensory properties would be recom-
mended. This strain selection can be achieved through
identification and characterization of LAB involved in
soybean fermentation.
Consumer preferences according to clusters
A visual inspection of the PREFMAP (Fig. 2) reveals
heterogeneity in consumers’ acceptability, although more
consumers liked the NFP. Figure 2A shows four clusters
as follows: 100S; 90S and 75S; 75SBS and 90SBS; and
100SBS. These clusters are mainly based on sensory prop-
erties as the PREFMAP is based on the PCA representa-
tion of sensory attributes (Resano et al. 2010). To
understand this heterogeneity in consumer preference
pattern more, a cluster analysis using a 6 9 150 matrix of
pastes and overall consumer acceptance scores was per-
formed. Cluster analysis assigned consumers with similar
preference patterns to one group resulting in four clusters
as well. A PCA of mean overall acceptance of the clusters
and the pastes was then obtained (Fig. 3). The clustering
pattern was slightly different from the pattern in Figure 2.
Clusters 1 and 3 were composed of consumers who liked
100S and 90S, cluster 2 was composed of consumers who
preferred LFP with a bias of 100SBS and 75SBS, while
cluster 4 was composed of consumers that liked 75S. As
seen in Figure 2, the direction of preference is biased
toward NFP. The composition of consumers in each clus-
ter is shown in Table 6. Consumers in cluster 2 disliked
NFP and preferred LFP, particularly 100SBS. Consumers
in cluster 3 liked 90S and 100S and disliked all the sour
Factor-1 (54%, 27%)
–6 –5 –4 –3 –2 –1 0 1 2 3 4 5 6 7–3
–2
–1
0
1
2
3
4
5
100S
100SBS
75S
75SBS
90S
90SBS
Sensory, chemical and physical properties of
fermented pastes
Consumer distribution in multivariate
space (C1 - C150)
Factor-1 (54%, 27%)
–1 –0.8 –0.6 –0.4 –0.2 0 0.2 0.4 0.6 0.8 1
Facto
r-2 (
19%
, 20%
)F
acto
r-2 (
19%
, 20%
)
–1
–0.8
–0.6
–0.4
–0.2
0
0.2
0.4
0.6
0.8
1
RawS
RoastS
BRoastS
BRoastMSRoastM
Chigumu
ChituAMandA
FermA
Thobwa
EggARancid
Brown
Yellow
ChituL
MandL
EggL Sweet
Salty
Umami
Sour
BitterAfterT
Rough
Soft
Grainy
Soggy
pH
TA
His
Arg
TyrVal
Iso
Phe
Leu
Glu
Ser
Gly
Ala
Lys
C1C2
C3
C4C5
C6
C7
C8C9
C10 C11C12
C13
C14
C15
C16
C17
C18
C20
C21
C22
C23
C24
C25
C26
C27
C28 C29
C30
C31
C32
C33C34
C35
C36
C37
C38C39
C40
C41
C42
C43
C44
C45
C46
C47
C48
C49C50
C51
C52
C53
C54
C55
C57
C58
C59
C60
C61
C62
C63
C64
C65
C66
C67
C68
C69
C70
C71
C72C73
C74
C75
C76
C77
C78
C79 C80
C81
C82 C84
C85
C86
C87
C89
C91
C92
C93
C94
C95C96
C97
C99
C100
C101
C102
C103
C104
C105C106
C107
C108
C109
C110
C111
C115C116
C117
C119
C120
C121
C122
C123
C124
C125C126
C127
C128
C129
C130
C131
C132
C133
C134
C135
C136
C137C138
C139
C140
C141
C142
C143
C144
C145
C146C147
C148
C149
C150
(a)
(b)
Figure 2. External preference mapping showing sensory attributes driving consumer preference of the pastes. (A) Grouping of pastes according
to sensory, chemical, and physical properties and consumer preference. (B) Consumer preference pattern as influenced by sensory, chemical, and
physical properties. On the map, 100S, 90S, and 75S represent naturally fermented pastes, while 100SBS, 90SBS, and 75SBS represent lactic acid-
fermented pastes. Pastes are designated according to 100%, 90%, and 75% soybean composition, the remaining proportions being maize.
126 ª 2013 The Authors. Food Science & Nutrition published by Wiley Periodicals, Inc.
Sensory and Consumer Studies of Fermented Soybean T. A. Ng’ong’ola-Manani et al.

LFP products and 75S, while consumers in cluster 4 liked
75S and were slightly tolerant of the sour products except
for 90SBS (Table 7).
Although 100SBS was rated lowest with an overall
acceptance score of 1.31 by consumers in cluster 3
(Table 7), the same sample was rated 6.25 by consumers
in cluster 2. Differences in overall acceptances of the same
sample by different clusters underscore consumer hetero-
geneity. Attributes characterizing 100SBS also character-
ized LFP. These attributes were also considered as drivers
of disliking by many consumers. Although the sensory
attributes characterizing LFP were not necessarily highest
in 100SBS, this paste stood out in terms of thobwa and
roasted soybean aromas. These aromas loaded highly on
PC2 (Fig. 2) and distinguished 100SBS from the other
LFP samples, which were mainly characterized by attri-
butes loading highly on PC1. These findings agree with
the concept that consumer perception is complex and
multidimensional. Consumers respond not only to a
certain sensory input but also to other inputs perceived
–1 –0.8 –0.6 –0,4 –0.2 0 0.2 0.4 0.6 0.8 1–1
–0.5
0
0.5
1
100S
100SBS
75S
75SBS
90S
90SBS
Cluster1
Cluster2
Cluster3
Cluster4
PC
-1 (
28
%)
PC-1 (59%)
Figure 3. Principal component analysis of fermented pastes and consumer clusters. Naturally fermented pastes (100S, 90S, 75S) and lactic acid
bacteria-fermented pastes (100SBS, 90SBS, and 75SBS). Pastes are designated according to 100%, 90%, and 75% soybean composition, the
remaining proportions being maize.
Table 6. Demographic information of the clusters (numbers in parentheses are percentages).
Demography Cluster 1 Cluster 2 Cluster 3 Cluster 4 Total
Sex
Male 22 (14.9) 3 (2.0) 2 (1.4) 4 (2.7) 31 (20.9)
Female 79 (53.4) 9 (6.1) 11 (7.4) 18 (12.2) 117 (79.1)
Total 101 (68.2) 12 (6.1) 13 (8.8) 22 (14.9) 148 (100)
Age
14–29 53 (35.8) 5 (3.4) 5 (3.4) 16 (10.8) 79 (53.4)
30–49 28 (18.9) 5 (3.4) 4 (2.7) 4 (2.7) 41 (27.7)
50–80 20 (13.5) 2 (1.4) 4 (2.7) 2 (1.4) 28 (18.9)
Table 7. Mean overall acceptance scores for consumer clusters.
Cluster 100S 100SBS 90S 90SBS 75S 75SBS
1 6.25 ! 1.35a 5.20 ! 2.1a 6.23 ! 1.46a 6.23 ! 0.90a 6.39 ! 1.10a 5.51 ! 1.84a
2 2.67 ! 2.01b 6.25 ! 0.87a 2.75 ! 2.18b 3.17 ! 2.86b 6.50 ! 0.8a 5.50 ! 2.02ac
3 5.00 ! 2.35c 1.31 ! 0.75b 6.15 ! 1.68a 2.69 ! 2.39bc 4.38 ! 2.96b 2.77 ! 2.49b
4 6.46 ! 0.67a 5.36 ! 1.18a 6.32 ! 1.09a 2.00 ! 1.31c 6.00 ! 1.35a 4.18 ! 2.04c
Means not sharing a superscript within a column are significantly different (P < 0.05). 100S, 90S, and 75S represent naturally fermented pastes,
while 100SBS, 90SBS, and 75SBS represent lactic acid-fermented pastes. Pastes are designated according to 100%, 90%, and 75% soybean com-
position, the remaining proportions being maize.
ª 2013 The Authors. Food Science & Nutrition published by Wiley Periodicals, Inc. 127
T. A. Ng’ong’ola-Manani et al. Sensory and Consumer Studies of Fermented Soybean
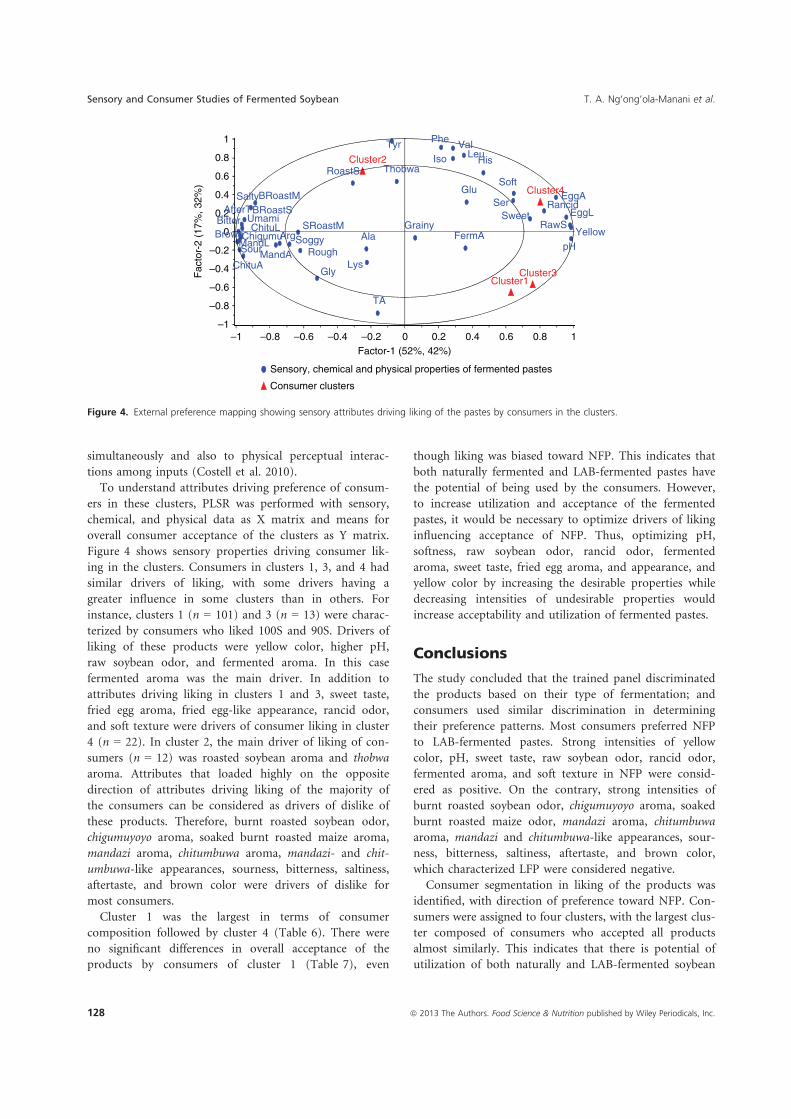
simultaneously and also to physical perceptual interac-
tions among inputs (Costell et al. 2010).
To understand attributes driving preference of consum-
ers in these clusters, PLSR was performed with sensory,
chemical, and physical data as X matrix and means for
overall consumer acceptance of the clusters as Y matrix.
Figure 4 shows sensory properties driving consumer lik-
ing in the clusters. Consumers in clusters 1, 3, and 4 had
similar drivers of liking, with some drivers having a
greater influence in some clusters than in others. For
instance, clusters 1 (n = 101) and 3 (n = 13) were charac-
terized by consumers who liked 100S and 90S. Drivers of
liking of these products were yellow color, higher pH,
raw soybean odor, and fermented aroma. In this case
fermented aroma was the main driver. In addition to
attributes driving liking in clusters 1 and 3, sweet taste,
fried egg aroma, fried egg-like appearance, rancid odor,
and soft texture were drivers of consumer liking in cluster
4 (n = 22). In cluster 2, the main driver of liking of con-
sumers (n = 12) was roasted soybean aroma and thobwa
aroma. Attributes that loaded highly on the opposite
direction of attributes driving liking of the majority of
the consumers can be considered as drivers of dislike of
these products. Therefore, burnt roasted soybean odor,
chigumuyoyo aroma, soaked burnt roasted maize aroma,
mandazi aroma, chitumbuwa aroma, mandazi- and chit-
umbuwa-like appearances, sourness, bitterness, saltiness,
aftertaste, and brown color were drivers of dislike for
most consumers.
Cluster 1 was the largest in terms of consumer
composition followed by cluster 4 (Table 6). There were
no significant differences in overall acceptance of the
products by consumers of cluster 1 (Table 7), even
though liking was biased toward NFP. This indicates that
both naturally fermented and LAB-fermented pastes have
the potential of being used by the consumers. However,
to increase utilization and acceptance of the fermented
pastes, it would be necessary to optimize drivers of liking
influencing acceptance of NFP. Thus, optimizing pH,
softness, raw soybean odor, rancid odor, fermented
aroma, sweet taste, fried egg aroma, and appearance, and
yellow color by increasing the desirable properties while
decreasing intensities of undesirable properties would
increase acceptability and utilization of fermented pastes.
Conclusions
The study concluded that the trained panel discriminated
the products based on their type of fermentation; and
consumers used similar discrimination in determining
their preference patterns. Most consumers preferred NFP
to LAB-fermented pastes. Strong intensities of yellow
color, pH, sweet taste, raw soybean odor, rancid odor,
fermented aroma, and soft texture in NFP were consid-
ered as positive. On the contrary, strong intensities of
burnt roasted soybean odor, chigumuyoyo aroma, soaked
burnt roasted maize odor, mandazi aroma, chitumbuwa
aroma, mandazi and chitumbuwa-like appearances, sour-
ness, bitterness, saltiness, aftertaste, and brown color,
which characterized LFP were considered negative.
Consumer segmentation in liking of the products was
identified, with direction of preference toward NFP. Con-
sumers were assigned to four clusters, with the largest clus-
ter composed of consumers who accepted all products
almost similarly. This indicates that there is potential of
utilization of both naturally and LAB-fermented soybean
Factor-1 (52%, 42%)
–1 –0.8 –0.6 –0.4 –0.2
Sensory, chemical and physical properties of fermented pastes
Consumer clusters
0 0.2 0.4 0.6 0.8 1
Fa
cto
r-2
(1
7%
, 3
2%
)
–1
–0.8
–0.6
–0.4
–0.2
0
0.2
0.4
0.6
0.8
1
RawS
RoastS
BRoastS
BRoastM
SRoastMChigumu
ChituAMandA
FermA
Thobwa
EggARancid
Brown YellowChituL
MandL
EggLSweet
Salty
Umami
Sour
BitterAfterT
Rough
Soft
Grainy
SoggypH
TA
His
Arg
Tyr Val
Iso
Phe
Leu
Glu
Ser
Gly
Ala
Lys
Cluster1
Cluster2
Cluster3
Cluster4
Figure 4. External preference mapping showing sensory attributes driving liking of the pastes by consumers in the clusters.
128 ª 2013 The Authors. Food Science & Nutrition published by Wiley Periodicals, Inc.
Sensory and Consumer Studies of Fermented Soybean T. A. Ng’ong’ola-Manani et al.
pastes. However, optimization either by increasing or
reducing intensities of drivers of liking or disliking would
be recommended to increase utilization of the fermented
pastes. Because of heterogeneity, optimization of attributes
which were the main drivers of liking in different clusters
such as pH, raw soybean odor, rancid odor, soft texture,
sweet taste, egg aroma, yellow color, egg-like appearance,
fermented aroma, and roasted soybean aroma would be
recommended. However, as pH values of NFP were rela-
tively high, a food safety challenge is recognized for NFP.
Being the first study on fermented soybean and
soybean/maize blend pastes in Malawi, the information
provided could be used in future developments of similar
products for wide acceptance and utilization of soybeans.
Acknowledgments
We acknowledge financial support from the Norwegian
Programme for Development, Research and Education
(NUFU) and Norwegian State Education Fund (L"anekas-
sen). We are also grateful to Nutrition and Food Science
students and staff at Bunda College who participated in
the descriptive sensory analysis. We also acknowledge
Ellen Skuterud for rheometer measurements. Last but not
least, we also acknowledge Margrethe Hersleth at NOF-
IMA, "As, Norway, for guidance during data analysis.
Conflict of Interest
None declared.
References
Ajandouz, E. H., and A. Puigserver. 1999. Nonenzymatic
browning reaction of essential amino acids: effect of pH on
caramelization and Maillard reaction kinetics. J. Agric. Food
Chem. 47:1786–1793.
Ajandouz, E. H., L. S. Tchiakpe, F. D. Ore, A. Benajiba, and A.
Puigserver. 2001. Effects of pH on caramelization and
Maillard reaction kinetics in fructose-lysine model systems.
J. Food Sci. 66:926–931.
Allagheny, N., Z. A. Obanu, G. Campbell-Platt, and J. D.
Owens. 1996. Control of ammonia formation during
Bacillus subtilis fermentation of legumes. Int. J. Food
Microbiol. 29:321–333.
Anderson, R. L., and W. J. Wolf. 1995. Overview of soybean
processing and products: compositional changes in trypsin
inhibitors, phytic acid, saponins and isoftavones related to
soybean processing. J. Nutr. 125:581S–588S.
AOAC. 1990. Official methods of analysis. 15th ed. Association
of Official Analytical Chemists Inc, Washington, DC.
Asgar, M. A., A. Fazilah, N. Huda, R. Bhat, and A. A. Karim.
2010. Nonmeat protein alternatives as meat extenders and
meat analogs. Compr. Rev. Food Sci. Food Saf. 9:513–529.
Breslin, P. A. S., and A. C. Spector. 2008. Mammalian taste
perception. Curr. Biol. 18:R148–R155.
Brunsø, K., T. A. Fjord, and K. G. Grunert. 2002. Consumers’
food choice and quality perception. The Aarhus School of
Business, Working paper no. 77 ISSN 0907 2101, June 2002.
Available at http://pure.au.dk/portal/files/32302886/wp77.pdf
(accessed 18 September 2013).
B€utikofer, U., and Y. Ard€o. 1999. Quantitative determination
of free amino acids in cheese. Bull. Int. Dairy Fed. 337:24–
32.
Chung, L., and S. J. Chung. 2007. Cross-cultural comparisons
among the sensory characteristics of fermented soybean
using Korean and Japanese descriptive analysis panels. J.
Food Sci. 72:S676–S688.
Costell, E., A. T#arrega, and S. Bayarri. 2010. Food acceptance:
the role of consumer perception and attitudes. Chemosens.
Percept. 3:42–50.
Coulibaly, O., A. D. Alene, V. Manyong, D. Sanogo, T.
Abdoulaye, J. Chianu, et al. 2009. Situation and outlook for
cowpea and soybean in Sub-Saharan Africa. International
Crops Research Institute for the Semi- Arid Tropics
(ICRISAT). Available at http://www.icrisat.org/what-we-do/
impi/projects/tl2-publications/
regional-situation-outlook-reports/
rso-cwp-sbean-sub-SaharaAfrica.pdf (accessed 10 February
2013).
CYE Consult. 2009. Value chain analysis of selected
commodities institutional development across the agri-food
sector (IDAF)—9 ACP Mai 19. Available at http://www.
moafsmw.org/ocean/docs/Agricultural%20Marketing/D%
20Value%20chain%20Final%20Report%20Revised%2001.08.
09.pdf (accessed 12 February 2013).
Dajanta, K., A. Apichartsrangkoon, E. Chukeatirote, and R.
A. Frazier. 2011. Free-amino acid profiles of thua nao, a
Thai fermented soybean. Food Chem. 125:342–347.
Dajanta, K., E. Chukeatirote, and A. Apichartsrangkoon. 2012.
Improvement of thua nao production using protein-rich
soybean and Bacillus subtilis TN51 starter culture. Ann.
Microbiol. 62:785–795.
Dakwa, S., E. Sakyi-Dawson, C. Diako, N. T. Annan, and W.
K. Amoa-Awua. 2005. Effect of boiling and roasting on the
fermentation of soybeans into dawadawa (soy-dawadawa).
Int. J. Food Microbiol. 104:69–82.
Dooley, L., Y.-S. Lee, and J.-F. Meullenet. 2010. The
application of check-all-that-apply (CATA) consumer
profiling to preference mapping of vanilla ice cream and its
comparison to classical external preference mapping. Food
Qual. Prefer. 21:394–401.
Drewnowski, A., and C. Gomez-Carneros. 2000. Bitter taste,
phytonutrients, and the consumer: a review. Am. J. Clin.
Nutr. 72:1424–1435.
Ecker, O., and M. Qaim. 2011. Analyzing nutritional impacts
of policies: an empirical study for Malawi. World Dev.
39:412–428.
ª 2013 The Authors. Food Science & Nutrition published by Wiley Periodicals, Inc. 129
T. A. Ng’ong’ola-Manani et al. Sensory and Consumer Studies of Fermented Soybean
Ediriweera, N., Y. Akiyama, and K. Saio. 1987. Inactivation of
lipoxygenase in soybeans with retention of protein
solubility. J. Food Sci. 52:685–690.
FAO. 1992. Maize in human nutrition. Food And Agriculture
Organization of the United Nations, Rome.
Golbitz, P. 1995. Overview of soybean processing and
production. Traditional soyfoods: processing and products.
J. Nutr. 125:570S–572S.
Guinard, J.-X., B. Uotani, and P. Schlich. 2001. Internal and
external mapping of preferences for commercial lager beers:
comparison of hedonic ratings by consumers blind versus
with knowledge of brand and price. Food Qual. Prefer.
12:243–255.
Gupta, R. P. 1997. Nutrition vs taste—meet the soya challenge.
ProSoya Inc, Ottawa, ON, Canada.
Helgesen, H., R. Solheim, and T. Næs. 1997. Consumer
preference mapping of dry fermented lamb sausages. Food
Qual. Prefer. 8:97–109.
Jo, Y.-J., I. H. Cho, C. K. Song, H. W. Shin, and Y.-S. Kim.
2011. Comparison of fermented soybean paste (doenjang)
prepared by different methods based on profiling of volatile
compounds. J. Food Sci. 76:C368–C379.
Kalimbira, A. A., B. M. Mtimuni, and J. P. Mtimuni. 2004.
Effect of incorporating legumes on nutritive value of
cassava-based complementary foods. Bunda J. Agric.
Environ. Sci. Technol. 2:13–21. Available at http://www.cabi.
org/gara/FullTextPDF/2008/20083325248.pdf (accessed 10
February 2013).
Katona-Apte, J. 1993. Issues in food aid and nutrition. Pp.
4–19 in V. Elliot and S. Gillespie, eds. Nutritional issues in
food aid—nutrition policy discussion paper no. 12. Papers
from a Symposium held at the Administrative Committee
on Coordination—Subcommittee on Nutrition (ACC/SCN)
19th Session hosted by the World Food Programme, Rome.
24"25 February 1992. Available at http://www.unscn.org/
layout/modules/resources/files/Policy_paper_No_12.pdf
(accessed 18 February 2013).
Kim, S.-H., and K.-A. Lee. 2003. Evaluation of taste
compounds in water-soluble extract of a doenjang (soybean
paste). Food Chem. 83:339–342.
Kim, H. G., J. H. Hong, C. K. Song, H. W. Shin, and K. O.
Kim. 2010. Sensory characteristics and consumer
acceptability of fermented soybean paste (Doenjang). J. Food
Sci. 75:S375–S383.
Kitabatake, N., D. M. Gimbi, and Y. Oi. 2003. Traditional
non-alcoholic beverage, Togwa, in East Africa, produced
from maize flour and germinated finger millet. Int. J. Food
Sci. Nutr. 54:447–455.
van Kleef, E., H. C. M. van Trijp, and P. Luning. 2006. Internal
versus external preference analysis: an exploratory study on
end-user evaluation. Food Qual. Prefer. 17:387–399.
Krokida, M. K., V. Oreopoulou, and Z. B. Maroulis. 2000.
Water loss and oil uptake as a function of frying time. J.
Food Eng. 44:39–46.
Kwon, D. Y., J. W. Daily III, H.J. Kim, and S. Park. 2010.
Antidiabetic effects of fermented soybean products on type
2 diabetes. Nutr. Res. 30:1–13.
Lawless, H.T., and H. Heymann. 1998. Pp. 341–378 in Sensory
evaluation of food: principles and practices. Chap. 10.
Chapman & Hall, New York, NY.
Lawlor, J. B., and C. M. Delahunty. 2000. The sensory profile
and consumer preference for ten speciality cheeses. Int. J.
Dairy Technol. 53:28–36.
Ley, J. 2008. Masking bitter taste by molecules. Chemosens.
Percept. 1:58–77.
Lindqvist, M. 2010. Flavor improvement of water solutions
comprising bitter amino acids. Degree thesis in Food
Science, Swedish University of Agricultural Sciences.
Available at http://stud.epsilon.slu.se/2232/1/Lindqvist_
M_110201.pdf (accessed 25 September 2013).
Maleta, K. 2006. Undernutrition. Malawi Med. J. 18:191–207.
Markets and Economic Research Centre of the National
Agricultural Marketing Council. 2011. The South African
soybean value chain. Available at http://www.namc.co.za/dnn/
LinkClick.aspx?fileticket=hmnbvBkExdY%
3D&tabid=92&mid=635 (accessed 12 February 2013).
Messina, M. J. 1999. Legumes and soybeans: overview of their
nutritional profiles and health effects. Am. J. Clin. Nutr.
70:439S–450S.
Mukai, J., E. Tokuyama, T. Ishizaka, S. Okada, T. Uchida.
2007. Inhibitory effect of aroma on the bitterness of
branched-chain amino acid solutions. Chem. Pharm. Bull.
55:1581–1584.
Murray, J. M., and C. M. Delahunty. 2000. Mapping consumer
preference for the sensory and packaging attributes of
cheddar cheese. Food Qual. Prefer. 11:419–435.
Namgung, H.-J., H.-J. Park, I. H. Cho, H.-K. Choi, D.-Y.
Kwon, S.-M. Shim, et al. 2010. Metabolite profiling of
doenjang, fermented soybean paste, during fermentation. J.
Sci. Food Agric. 90:1926–1935.
National Statistics Office and ICF Macro. 2011. Malawi
demographic and health survey 2010. National Statistics
Office and ICF Macro, Zomba, Malawi and Calverton, MD.
National Statistics Office and Macro. 2005. Malawi
demographic and healthy survey 2004. National Statistical
Office, ORC Macro, Zomba, Malawi and Calverton, MD.
Nuss, E. T., and S. A. Tanumihardjo. 2010. Maize: a
paramount staple crop in the context of global nutrition.
Compr. Rev. Food. Sci. Food Saf. 9:417–436.
Park, S.-L., S.-Y. Lee, Y.-D. Nam, S.-H. Yi, and S.-I. Lim.
2012. Fermentation properties of low-salted Doenjang
supplemented with licorice and mustard. Food Sci.
Biotechnol. 21:91–99.
Parkouda, C., D. S. Nielsen, P. Azokpota, L. Ivetteir$eneouoba,
W. K. Amoa-Awua, L. Thorsen, et al. 2009. The
microbiology of alkaline-fermentation of indigenous seeds
used as food condiments in Africa and Asia. Crit. Rev.
Microbiol. 35:139–156.
130 ª 2013 The Authors. Food Science & Nutrition published by Wiley Periodicals, Inc.
Sensory and Consumer Studies of Fermented Soybean T. A. Ng’ong’ola-Manani et al.

Resano, H., A. I. Sanju#an, I. Cilla, P. Roncal#es, and L. M.
Albisu. 2010. Sensory attributes that drive consumer
acceptability of dry-cured ham and convergence with
trained sensory data. Meat Sci. 84:344–351.
Sarkar, P. K., and J. P. Tamang. 1995. Changes in the
microbial profile and proximate composition during natural
fermentations of soybeans to produce kinema. Food
Microbiol. 12:317–325.
Sarkar, P. K., J. P. Tamang, P. E. Cook, and J. D. Owens.
1994. Kinema—a traditional soybean fermented food:
proximate composition and microflora. Food Microbiol.
11:47–55.
Siegel, A. S., and B. Fawcett. 1976. Food legume processing
and utilization: (with special emphasis on application in
developing countries). International Development Research
Centre, Ottawa, ON, Canada.
Sripriya, G., U. Antony, and T. S. Chandra. 1997. Changes in
carbohydrate, free amino acids, organic acids, phytate and
HCl extractability of minerals during germination and
fermentation of finger millet (Eleusine coracana). Food
Chem. 58:345–350.
Steinkraus, K. H. 1997. Classification of fermented foods:
worldwide review of household fermentation techniques.
Food Control 8:311–317.
Thompson, J. L., M. Drake, K. Lopetcharat, and M. Yates.
2004. Preferencce mapping of commercial chocolate milks.
J. Food Sci. 69:406–413.
Tinsley, R. L. 2009. Value chain analysis for soybeans in
Malawi. Citizens Network for Foreign Affairs. Available at
http://lamar.colostate.edu/~rtinsley/ValueChainAnalysis
SoybeansMalawi.pdf (accessed 12 February 2013).
Tomic, O., G. Luciano, A. Nilsen, G. Hyldig, K. Lorensen,
and T. Næs. 2010. Analysing sensory panel performance in a
proficiency test using the panelcheck software. Eur. Food
Res. Technol. 230:497–511.
Torres-Penaranda, A. V., C. A. Reitmeier, L. A. Wilson, W. R.
Fehr, and J. M. Narvel. 1998. Sensory characteristics of
soymilk and tofu made from lipoxygenase-free and normal
soybeans. J. Food Sci. 63:1084–1087.
United Nations Industrial Development Organization. 2003.
Soya bean and its recipes. United Nations Industrial
Development Organization, Vienna, Austria.
Wang, H.-J., and P. A. Murphy. 1996. Mass balance study of
isoflavones during soybean processing. J. Agric. Food Chem.
44:2377–2383.
Yamaguchi, S., and K. Ninomiya. 2000. Umami and food
palatability 1. The use and utility of glutamates as flavoring
agents in food. J. Nutr. 130:921S–926S.
ª 2013 The Authors. Food Science & Nutrition published by Wiley Periodicals, Inc. 131
T. A. Ng’ong’ola-Manani et al. Sensory and Consumer Studies of Fermented Soybean

CORRIGENDUM
Sensory evaluation and consumer acceptance of naturallyand lactic acid bacteria-fermented pastes of soybeans andsoybean–maize blends
Tinna A. Ng’ong’ola-Manani, Agnes M. Mwangwela, Reidar B. Sch€uller, Hilde M. Østlie & TrudeWicklund
The original article to which this Corrigendum refers was published in Food Science & Nutrition 2(2):114–131 (DOI:
10.1002/fsn3.82).
In the published article, a funding source was omitted. The omitted information is as follows:
This research was partly financed by the International Foundation for Science (IFS) through grant no. E/4889-1 awarded
to Tinna A. Ng’ong’ola-Manani.
doi: 10.1002/fsn3.120
298 ª 2014 Food Science & Nutrition published by Wiley Periodicals, Inc.

�
�
�
�
�
�
�
�
�
�
�
�
�
�
�
�
�
�
�
�
�
�
�
�
�
�
�

�
�
�
�
�
�
�
�
�
�
�
�
�
�
�
�
�
�
�
�
�
�
�
�
�
�
�

�
�
�
�
�
�
�
�
�
�
�
�
�
�
�
�
�
�
�
�
�
�
�
�
�
�
�

1
Effect of natural and lactic acid bacteria fermentations on growth and
survival of Bacillus cereus and Escherichia coli in pastes of soybeans and
soybean-maize blends
Tinna Austen Ng’ong’ola-Manania,b*, Trude Wicklunda, Agnes Mbachi Mwangwelab, Hilde
Marit Østliea
aNorwegian University of Life Sciences, Department of Chemistry, Biotechnology and Food
Science, P.O Box 5003, 1430, Ås, Norway.
bLilongwe University of Agriculture and Natural Resources, Bunda College Campus,
Department of Food Science and Technology, P.O Box 219, Lilongwe, Malawi.
*Corresponding author’s e-mail address: [email protected]
2
Abstract
Growth of Escherichia coli and Bacillus cereus in pastes of soybeans and soybean-maize
blends during natural and lactic acid bacteria fermentations was investigated. Pastes
containing 100% or 90% soybeans were either fermented naturally (100S, 90S) or fermented
with Lactobacillus fermentum as starter culture (100SC, 90SC) or fermented through back-
slopping using a tradition fermented cereal gruel, thobwa as an inoculum (100SBS, 90SBS).
Each sample was singly inoculated with each pathogen. The pH of back-slopped samples
decreased faster and the lowest pH was 4.8 at 24 hrs in pastes inoculated with E. coli. The pH
values in B. cereus inoculated pastes were higher than in E. coli inoculated pastes at each
sampling time from 24 hrs to 72 hrs. In NFP, the pH increased to 6.86 in 100S and 7.2 in 90S
by 72 hrs. Back-slopping inhibited growth of the two pathogens more than the other two types
of fermentation. At the end of the fermentations, highest E. coli counts were 3.1, 7.3 and 9.2
log cfu/g in 90SBS, 100SC and 100S, respectively. In pastes inoculated with B. cereus,
highest counts by 72 hrs were 3.0, 5.0 and 8.72 cfu/g in 100SBS, 100SC and 90S,
respectively. In 90SBS, B. cereus cells were less than 10 cfu/g at 24 and during further
fermentation. There was preferential inhibition of B. cereus compared to E. coli in all
fermentations. However, failure to reach critical pH value of 5.0 for B. cereus in Lb.
fermentum fermentation and in natural fermentation; and pH value of 4.4 for E. coli at the end
of all fermentations suggested food safety challenges. Therefore, a thermal processing step
prior to consumption was recommended and in order to ascertain the safety of the pastes,
studies on toxin production during fermentation were suggested.
Keywords: Fermentation, back-slopping, lactic acid bacteria, Escherichia coli, Bacillus
cereus, soybean
3
Introduction
Fermentation is one of the oldest food processing techniques that improves food safety and
leads to food preservation. Various fermentations that have been used traditionally are still
practiced to produce lactic acid fermented cereal gruels, lactic acid fermented sourdoughs and
alkaline fermented legumes among other foods (Kingamkono et al., 1998; De Vuyst et al.,
2002; Chukeatirote et al., 2010). Fermented soybeans (Glycine max) have been traditionally
produced and widely consumed in Asia (Chukeatirote et al., 2010). Soybeans contain 35-40%
protein, 18% oil and physiologically beneficial phytochemicals (Dixit et al., 2011).
Fermentation of soybeans improves nutritional quality and functional properties of the beans
due to increased digestibility (Visessanguan et al., 2005) degradation of anti-nutritional
factors (Reddy and Pierson, 1994; Chitra et al., 1996; Ari et al., 2012) and increased content
of small bioactive compounds (Yang et al., 2011). However, high proteolytic activities in
alkaline fermentations result in high ammonia production leading to a strong odor which some
people find objectionable (Allagheny et al., 1996; Parkouda et al., 2009). In Malawi,
utilization of soybeans is limited to a flour blend containing 80% maize and 20% soybean,
used as a complimentary food (Kalimbira et al., 2004). Utilization is minimal due to the
characteristic beany flavor and due to limited knowledge in processing (Coulibaly et al.
2009).
Low cost processing techniques that would eliminate or minimize objectionable flavors would
increase utilization of soybeans in Malawi. With the aim of increasing soybean’s utilization
and acceptance in Malawi, fermented soybean pastes to be used as side dishes or meat
alternatives were developed (Ng’ong’ola-Manani et al., 2014a). These pastes were naturally
fermented and lactic acid bacteria (LAB) fermented. Both fermentations improved nutritional
quality through increased solubility of amino acids and proteins and degradation of phytic
acid (Ng’ong’ola-Manani et al., 2014b). Although consumer acceptance was biased in favor
of naturally fermented pastes (NFP), relatively higher pH and lower organic acid production
in NFP than in LAB fermented pastes (LFP), suggested food safety could be a challenge in
NFP.
Diarrheal diseases are a major health problem in developing countries due to challenges in
observing basic principles of food hygiene. Lack of cold storage facilities or fuel for hot
holding in most rural households limit the implementation of principles of hygiene and
4
increase the risk of foodborne diseases (Nout and Motarjemi, 1997; Bonkoungou et al., 2013).
On the other hand, LAB fermentation of cereal products such as togwa (Tanzania) were
suggested as an alternative technology to safeguard food when cold and hot storage was not
feasible (Nout and Motarjemi, 1997).
Moreover, Kingamkono et al. (1994, 1995, and 1998) and Svanberg et al. (1992) showed that
during LAB fermentations of maize gruels inoculated with power flour (germinated sorghum
flours) as starter culture to produce togwa, growths of different species of enteropathogens
were inhibited. In the production of LAB fermented soybean pastes, Ng’ong’ola-Manani et al.
(2014a) had used thobwa as a back-slopping material to facilitate the LAB fermentations.
Thobwa is produced from maize gruels normally fermented using flour from germinated
grains as power flour. Since LFP produced more lactic acid than NFP (Ng’ong’ola-Manani et
al., 2014b) it was anticipated that LFP could be safer than NFP. Moreover, Bacillus cereus
(6.3 to 8.3 log cfu/g) and Escherichia coli have been isolated from soybean alkaline
fermented foods (Nout et al., 1998; Sarkar et al., 2002; Dakwa et al., 2005; Chukeatirote et
al., 2010; Lee et al., 2010; Thorsen et al., 2010; Nam et al., 2012a; Nam et al., 2012b). In
view of this, the fate of two enteropathogens, E. coli and B. cereus during natural and LAB
fermentations were investigated. Therefore, the aim of this study was to investigate the effect
of back-slopping and natural fermentations on growth of E. coli and B. cereus during
fermentation.
Materials and Methods
Three types of fermentations namely natural (spontaneous) fermentation; LAB accelerated
fermentation by back – slopping using a traditional fermented cereal gruel, thobwa; and
controlled fermentation using a starter culture of a Lactobacillus fermentum strain previously
isolated from the fermented pastes of soybeans and soybean-maize blends were studied.
Bacteria strains used
Nine Lb. fermentum strains previously isolated from fermented pastes of soybeans and
soybean-maize blends were screened for rapid acidification in De Man, Rogosa and Sharpe
(MRS) broth (Merck, Darmstadt, Germany). The strains had been stored in MRS broth
containing 15% glycerol at -80 oC and were resuscitated by sub culturing three times in MRS
broth at 30 oC. Following resuscitation, the ability of the strains to acidify MRS broth at 30 oC
5
was determined by measuring pH. The pH was measured at 6 hrs intervals until 24 hrs and
thereafter a strain that reduced pH the most was selected. The strain, Lb. fermentum 324c
reduced pH to 4.06 by 24 hrs was used for inoculation of pastes in controlled fermentations.
The Lb. fermentum was isolated from soybean paste at 48 hrs, was able to grow at pH 3.9, at
15 oC and 45 oC. Two enteropathoges, E. coli and B. cereus were also used. Escherichia coli
HMG 021002 strain was isolated from traditional spontaneously fermented milk from
Zimbabwe (Gran et al., 2002). Bacillus cereus NVH 45 isolated from whipping cream, was a
gift from Professor P.E. Granum, Norwegian University of Life Sciences. The B.cereus strain
contained the non-haemolytic enterotoxin gene (nhe), the haemolytic enterotoxin gene (hbl)
and the enterotoxin T gene (Borge et al., 2001; Røssland et al., 2005). The minimum growth
temperature of this strain in milk was 7 oC, and its minimum pH for growth was pH 4.9–5.0
(Borge et al., 2001; Røssland et al., 2005).
Preparation of stock cultures
Brain heart infusion broth (BHI, Merck) was used for B. cereus and E. coli culturing while
MRS broth was used for Lb. fermentum culturing during preparation of stock cultures.
Bacillus cereus, E. coli and Lb. fermentum strains were sub-cultured three times in their
respective broths before finally inoculating in 9 ml of the broths and incubating at 30 oC for
18 hrs. After incubation, the cells were harvested by centrifugation at 3, 500 x g for 10 min at
4 oC (Eppendorf Centrifuge 5804, Hamburg, Germany). Thereafter, the cells were
resuspended in 1.8 ml of BHI and MRS broths containing 15% (v/v) glycerol before
transferring into sterile Eppendorf tubes and storage at -80 oC. Cell concentration of the stock
cultures was predetermined before inoculating into the pastes.
To determine cell densities, stock cultures frozen at -80 oC for one week were thawed at 0 oC
and serially diluted before culturing on selective media according to strain. Bacillus cereus
was spread plated on Cereus selective agar (CSA; Fluka Analytical, Buchs, Switzerland)
containing polymyxin B sulphate (50,000 units; P9602 Polymyxin B selective supplement,
Fluka Analytical) and egg yolk emulsion (Merck) added according to manufacturer’s
instructions. Escherichia coli and Lb. fermentum were pour plated on Violet red bile agar
(VRBA; Oxoid), and MRS agar (Merck), respectively. Cereus selective agar plates and
VRBA plates were incubated at 37 oC for 24 hrs while MRS agar was incubated at 37 oC for
48 hrs before enumeration. One hour prior to inoculation into the pastes, tubes containing
stock cultures were thawed at 0 oC. Suspensions containing cell densities of 102 – 103 cfu/g
6
for B.cereus and E.coli, and 107 - 108 cfu/g for Lb. fermentum (starter culture) were prepared
in sterile water for inoculation into the pastes.
Sample preparation
Samples were prepared according to Ng’ong’ola-Manani et al. (2014a) with slight
modifications (Fig 1). Samples were composed of 100% soybeans or 90% soybeans plus 10%
maize. Naturally fermented pastes were designated as 100S and 90S; back-slopped samples
were designated as 100SBS and 90SBS while samples containing Lb. fermentum as starter
culture were designated 100SC and 90SC. Samples to be inoculated with Lb fermentum were
ground after dehulling and were autoclaved at 121 oC for 15 min instead of boiling for 1 hr
(Fig 1). When all the samples were prepared, a single pathogen was inoculated into the pastes
to be fermented naturally. In the other fermentations, a single pathogen was simultaneously
inoculated with the back-slopping material or with the Lb. fermentum starter culture. Sample
compositions and pathogen combinations are shown in Table 1. Portions of 50 g of each
sample treatment were packed in four sterile glass jars and were incubated at 30 oC. Duplicate
analyses were done on all samples at 0 hrs, 24 hrs, 48 hrs, and 72 hrs. Three independent
experiments were run.
Microbiological and pH Analyses
From each sample, 10 g was transferred aseptically into a sterile stomacher bag before adding
90 mL sterile diluent containing quarter strength ringer’s solution (VWR International,
Leuven, Belgium) and homogenising in a Colworth stomacher blender (STOMACHER 400,
London, Britain) for 120 s. From the homogenates, appropriate ten-fold dilutions were
prepared for enumeration of aerobic mesophiles on Plate Count Agar (PCA, Merck) and LAB
on MRS Agar (Merck). Bacillus cereus was enumerated on CSA (Fluka Analytical)
containing polymyxin B (Fluka Analytical) and egg yolk emulsions (Merk) added according
to manufacturer’s instructions. Escherichia coli was enumerated on VRBA (Oxoid). All
incubations for CSA and VRBA were done at 37 oC for 24 hrs and for MRS and PCA were
done at 37 oC for 48 hrs. Pour plate technique was used for E. coli, Lb. fermentum, LAB and
PCA enumerations while spread plate technique was used for B. cereus enumerations.
The remaining homogenate from each sample was used for pH analysis. A pH meter
(PHM210 65R048 N022, Radiometer, Copenhagen, Denmark) fitted with glass electrodes
(135R 012, Radiometer, Denmark) was used.

7
Statistical Analysis
Analysis of variance (ANOVA) at p = 0.05 was performed in SPSS 15.0 (SPSS Inc., Chicago,
Illinois, USA) and least squares difference test was used to separate means.
Results and Discussion
Effect of fermentation on pH and growth of E. coli
Fig 2 and Fig 3 show changes in pH and viable cells of E. coli, respectively, in pastes
fermented naturally (100S, 90S), fermented with Lb. fermentum as starter culture (100SC,
90SC), and in pastes fermented through back-slopping using thobwa as inoculum (100SBS,
90SBS). In all these fermentation types, E. coli was added as an enteropathogen test strain.
There were significant differences (p <0.05) in pH according to fermentation type at 24 hrs.
The pH of the back-slopped pastes (BSP) decreased significantly (p<0.05) faster than in the
other fermentations, and BSP had the lowest pH of 4.84 and 5.0 at 24 hrs in 90SBS and
100SBS, respectively. Naturally fermented pastes (NFP) had pH of 6.21 and 6.58 in 90S and
100S, while pastes fermented with Lb. fermentum as starter culture (SCP) had pH of 5.69 and
5.74 in 90SC and 100SC, respectively. At 48 hrs, only NFP had significantly higher pH and at
72 hrs only 100S had significantly higher pH. After 72 hrs, BSP and SCP had a pH of 5.2
while NFP had pH of 5.74 and 6.14 in 90S and 100S, respectively (Fig 2). Although the pH of
BSP decreased faster than the rest, failure to reach critical values of pH ≤ 4.4 which is the
minimum pH for E. coli growth (Bell, 2002) raises a food safety concern. In our earlier
studies, pH dropped to 4.36 at 24 hrs and by 72 hrs, the pH had reached 4.01 in 90SBS. In
100SBS, pH dropped to 4.26 by 72 hrs (Ng’ong’ola-Manani, 2014b). Thus although back-
slopping accelerates the initial phase of the fermentation process and minimizes failure risks
to fermentation (Svanberg et al., 1992; Holzapfel, 2002), it is still subject to variation in
product quality (Holzapfel, 2002).
Nevertheless, back-slopping significantly inhibited E. coli proliferation in the fermented
pastes (Fig 3). Significant differences in E. coli populations due to fermentation types were
observed from 24 hrs and during further fermentation. Viable cells of E. coli in BSP increased
1.3 fold of the initial level throughout fermentation, while in NFP and SCP, E. coli cells
increased 4.0 and 3.0-3.5 fold, respectively. In BSP, E. coli increased from 2.4 log cfu/g at 0
hrs to 3.2 - 3.5 log cfu/g at 24 hrs and remained at a constant level of 3.0 log cfu/g during
further fermentation. In SCP, E. coli increased from 2.0 – 2.3 log cfu/g at 0 hrs to 6.8-7.6 log

8
cfu/g at 24 hrs and by 72 hrs, the cell count was 7.2 log cfu/g. In NFP, E. coli increased from
2.3 log cfu/g at 0 hrs to 8.8-9.2 log cfu/g and by 72 hrs, viable cells of E. coli were about 9.1
log cfu/g.
Failure of all the fermentations to reach pH of ≤ 4.4 explains the survival and growth of E.
coli during fermentation. The relatively faster acidification in BSP compared to SCP and
NFP, partly explains the higher inhibition of E. coli growth. In BSP, it can be suggested that
other inhibitory compounds in addition to increasing acidity were responsible for the higher
E.coli growth inhibition. In a study by Drago et al. (1997), the effect of Lactobacillus strains
on growth of E. coli and Salmonella enteritidis was investigated in culture media that were
periodically replaced by freshly prepared medium in order to keep the pH value constant.
Growth of the two enteropathogens was inhibited; therefore they concluded that the inhibition
of the pathogens could not be ascribed simply to acidification of the medium. Even though in
their experiment, Drago et al. (1997) could not fully explain the mechanism of inhibition, but
they could also not rule out the possibility of the production of bacteriocins and antibiotics by
the lactobacillus strains under study. Besides, lactobacilli are known to exert antibacterial
activity through production of lactic acid, hydrogen peroxide, short chain fatty acids,
antibiotics and bacteriocins (Drago et al., 1997).
Trends in LAB counts (Fig 4) and total aerobic bacteria counts (Fig 5) in pastes inoculated
with E. coli were almost similar throughout fermentation. An initial LAB count of 6.0 – 8 log
cfu/g in BSP and SCP and the counts reached ca. 9.0 log cfu/g at 24 hrs and remained
unchanged during further fermentation (Fig 4). On the contrary, a low initial LAB count of
2.0 to 2.5 log cfu/g was observed in NFP. This increased to 5.5 – 6.3 log cfu/g after 24 hrs
fermentation and after 72 hrs, the counts were 7.6 and 9.4 log cfu/g in 100S and 90S,
respectively (Fig 4). Although the LAB population increased significantly (p<0.05)
throughout fermentation in NFP, a high initial LAB population is required in order to inhibit
enteropathogen growth as observed in BSP and SCP. These results agree with the report of
Sahlin (1999) in which initial LAB numbers as well as their rate of growth were important in
relation to rate of production of lactic acid, development of pH and E. coli growth inhibition.
The microbial profile of BSP and SCP was almost similar for LAB (Fig 4) and total aerobic
(Fig 5) counts. However, BSP were more effective in suppressing proliferation of E. coli than
the single strain culture in SCP (Fig 3). The mixture of LAB strains in BSP probably offered a
competitive advantage over the single strain culture in SCP. Interactions of mixed strains in

9
BSP could have been synergistic resulting in fast acidification of the medium (as evidenced
by a relatively fast pH drop in BSP) and hence pronounced suppression of E. coli growth.
This was in accordance with Holzapfel (2002), who reported that mixed strain cultures
produce favorable synergistic effects such as degradation of undesirable factors, flavor
production and accelerated ripening and maturation. Drago et al. (1997) also reported that
mixed lactobacilli strains exerted more inhibitory effect on the growth of E. coli and
Salmonella enteritidis than single culture strains.
Effect of fermentation on pH and growth of B. cereus
In pastes inoculated with B. cereus, BSP and SCP showed pH trends (Fig 6) similar to those
observed in pastes inoculated with E. coli. In BSP, the pH dropped to 5.0 after 24 hrs
fermentation and after 72 hrs the pH of 90SBS was 4.8 while that of 100SBS was 5.2 (Fig 6).
On the contrary, increases in pH were observed during further fermentation in NFP. For
instance, in 100S, the pH increased after 48 hrs from 6.11 to 6.86 while in 90S, the pH
increased from 5.87 after 24 hrs to 7.2 after 72 hrs (Fig 6). The increases in pH could be
attributed to B. cereus metabolism. Bacillus spp. are highly proteolytic and may degrade
proteins into amino acids, subsequently producing ammonia which leads to an increase in pH
(Sarkar and Tamang, 1995; Dakwa et al., 2005; Parkouda et al., 2009).
Higher B. cereus population in NFP (Fig 7) compared to BSP and SCP explains the increase
in pH in NFP and not in the other pastes. Viable cells of B. cereus in NFP increased from 2.2
log cfu/g to ca. 8.0 log cfu/g after 24 hrs and remained relatively unchanged throughout
fermentation. While in SCP, the counts increased to about 5.0 log cfu/g after 24 hrs
fermentation and the count remained as such during further fermentation in 100SC. On the
other hand, B. cereus population began to decline after 48 hrs in 90SC and by 72 hrs, the
count was 3.7 log cfu/g. The decline could probably be explained in terms of increasing
acidity due to availability of more fermentable sugars provided by the maize in 90SC than in
100SC. This could have allowed the less competitive LAB which was already high in
numbers to metabolize faster in 90SC than in 100SC and produce more acids that could have
led to more inhibition of B. cereus growth in 90SC than in 100SC. Back-slopping resulted in
most B. cereus growth inhibition than SCP and NFP (Fig 7). Viable cell counts fluctuated
between 2.0 and 3.0 log cfu/g in 100SBS while in 90SBS, the highest counts were 2.4 log
cfu/g and after 24 hrs and during further fermentation, viable cells were less than 10 cfu/g
(indicated as 1 log cfu/g) hence they could not be detected. This could also be due to high

10
LAB metabolic activities in 90SBS due to presence of more fermentable sugars resulting in
more production of metabolites with inhibitory effects.
Since BSP and SCP were inoculated, their LAB populations were between 7.4 to 8.0 log cfu/g
at 0 hrs, the populations increased to ca. 9.0 log cfu/g and remained relatively unchanged
during further fermentation (Fig 8). On the other hand, LAB population of NFP was between
2.0 and 2.5 log cfu/g at the beginning of the fermentations, and the highest LAB count was
6.0 log cfu/g in 90S while in 100S the count increased to 5.0 log cfu/g after 48 hrs and
decreased to 1.4 log cfu/g by 72 hrs. Higher LAB in 90S than in 100S could be due to the
presence of more fermentable sugars in the former. Low LAB population in NFP explains
high proliferation of the two enteropathogens. The trends of total aerobic count of pastes
inoculated with B. cereus (Fig 9) were similar to those of the pastes inoculated with E. coli.
Escherichia coli and Bacillus cereus growth inhibition
The results indicated that the use of back-slopping or single strain starter culture, inhibited
growth of B. cereus more than growth of E. coli. However, only a single strain of each
pathogen was used in this study. Kingamkono et al. (1998) also observed a preferential
growth inhibition rate of LAB between Campylobacter jejuni and E. coli. In their study, C.
jejuni was inhibited to a higher level. In another study, Kingamkono et al. (1994; 1995) used
fermenting cereal gruel togwa to determine growth inhibition of seven species of
enteropathogens. They observed that B. cereus was more sensitive than enterotoxigenic E.
coli (ETEC) for LAB. They attributed this to the inducible acid-tolerance response system in
some E. coli strains that protects them against severe acid stress for longer periods and to the
presence a double cell membrane in ETEC that make them less sensitive to growth-inhibiting
factors such as bacteriocins. Acid tolerance has also been reported in E. coli O157:H7 (Leyer
et al., 1995). The above reasons could also explain the relatively higher survival of E. coli in
the fermented pastes, especially in BSP and SCP.
Although it is generally agreed that the critical pH for B. cereus inhibition is 5.0 (Røssland et
al., 2005; Senesi and Ghelardi, 2010; Valero et al., 2003), the growth of this organism has
also been inhibited at higher pH values. Wong and Chen (1988) observed that when B. cereus
and LAB were inoculated at the same time into nonfat milk medium, B. cereus growth was
not inhibited until after 16 hrs when the pH values of the mixed cultures were about 5.3 to 5.7.
Therefore, it was concluded that the inhibition of vegetative cells of B. cereus in mixed
cultures may be attributed to higher lactic acid levels production by LAB cultures, or to other
11
factors such as hydrogen peroxide production, nutrient depletion, or a decrease in the
oxidation-reduction potential. From Wong and Chen (1988) studies, B. cereus seemed to be
more sensitive to low pH, such that even at pH 5.7 its growth could still be inhibited. On the
other hand E. coli can tolerate lower pH values down to 3.42 for some hrs (Leyer et al., 1995).
The failure of NFP to inhibit both enteropathogens was because of the low initial LAB flora
(Fig. 4 and Fig 8). The low initial LAB flora resulted in a delayed decrease in pH and
eventually, delayed inhibition of the growth of the enteropathogens (Kingamkono et al.,
1995). A fast lactic acid production during early hours of fermentation is required to achieve
inhibition even in B. cereus (Røssland et al., 2005) whose minimum pH for growth is higher
than for E. coli. The use of a previously fermented gruel, thobwa in back-slopped samples
also had an added advantage. Cereal gruels prepared from previously germinated grains
contain amylolytic enzymes (Mosha & Svanberg 1983) that hydrolyse starch into fermentable
sugars which are the main substrates for LAB. Availability of fermentable sugars facilitates
rapid metabolism and growth of LAB (Kingamkono et al., 1994).
Food safety implications
Bacillus food-poisoning usually occurs because spores survive cooking or pasteurization and
then germinate and multiply when food is inadequately refrigerated or reheated (Ehling-
Schulz et al., 2004). Two types of foodborne illnesses namely emetic and diarrhea syndromes
are due to B. cereus. The emetic syndrome is an intoxication caused by a preformed heat
stable emetic toxin called cereulide. The infectious dose is estimated to be around 105–108
cells/g of ingested food, however some studies reported illnesses from foods containing 103
cells/g food (Ehling-Schulz et al., 2004; Ceuppens et al., 2011). Heat stability in cereulide for
90 min at 121°C and for 2 hrs at 121 oC and pH 7 has been reported, withstanding frying,
roasting and microwave cooking. In addition, the toxin withstands exposure to a pH range of
2.0 – 11.0 and is resistant to pepsin and trypsin digestion (Ceuppens et al., 2011; Kotiranta et
al., 2000). Cereulide production can occur at a wide temperature range of 8 oC to 40 °C
(optimum is 20 °C and 30 oC), and its production is impaired by reduced O2 levels
(atmospheres of 0–2% O2 and 20% CO2 in N2 inhibit production) and by low pH values i.e. <
5.6 (Ceuppens et al., 2011).
The diarrhoeal syndrome on the other hand, is an infection requiring live cells or spores to be
ingested together with food to cause an illness (Ceuppens et al., 2011). The vegetative cells
produce enterotoxins in the small intestines (Ceuppens et al., 2011). Various infectious dose
12
ranges of 104 – 108 cells/g (Logan, 2012), 105 – 107 cells/g (Granum and Lund, 1997) and 103
– 107 cells ingested (Schraft and Griffiths, 2006) have been reported. Heat labile enterotoxins
Hbl, Nhe, CytK (Ghelardi et al., 2002; Granum and Lund, 1997) and hemolysin II (HlyII) are
the most important in diarrhoeal syndrome (Ceuppens at al., 2011). Optimal temperature for
production is 30 oC and minimum is 6 oC. Anaerobic conditions lead to slow bacteria growth
but increased toxin production, and low glucose is required for the production. The optimal
pH for production is 7.0 – 9.0 and slow production has been reported between 5.0 – 6.0
(Ceuppens et al., 2011).
Since viable cells of B. cereus at 72 hrs ranged from 0 to 3 log cfu/g in BSP and 3.7 to 5.3 log
cfu/g in SCP while it was > 5 log cfu/g in NFP and pH values at 72 hrs were 5.30 and 5.35 in
90SC and 100SC, respectively; 4.86 and 5.30 in 90SBS and 100SBS, respectively; and 7.2
and 6.86 in 90S and 100S, respectively. Therefore BSP could be considered relatively safe
with regards to B. cereus poisonings based on the facts presented above. However, because
the minimum pH for growth for B. cereus is 5.0 (Senesi and Ghelardi, 2010), then pH values
slightly higher than 5.0 should be considered borderline. Further, there could be a risk of
production of the diarrhea toxins even under slow growth due to creation of anaerobic
environment. Another challenge with B. cereus is the possibility of sporulation which enables
the organism to survive certain heat treatments like pasteurization. Therefore, to establish the
safety of use of back-slopping in these pastes, further studies on enterotoxin production and
sporulation during fermentation are recommended.
Although natural and B. subtilis fermentations of soybeans and other legumes have generally
been regarded as safe (Allagheny et al., 1996; Steinkraus, 1997; Chukeatirote et al., 2010;
Parkouda et al., 2009), the presence of B. cereus in some of these products (Sarkar et al.,
2002; Leejeerajumnean, 2003; Chukeatirote et al., 2010) and the fact that the preparation and
the fermentation is usually made in homes using rudimentary equipment and sometimes under
poor hygienic conditions, means that the risk of food borne diseases is still existent (Parkouda
et al., 2009). Therefore, this study suggested that NFP could only be safe if there were no
pathogen contamination during food preparation and during fermentation. Besides, the
environmental factors during fermentation in this study (limited O2, and increase in pH)
suggested the possibility of enterotoxin production in case of contamination; therefore,
investigation of enterotoxin production in NFP was also recommended.

13
Escherichia coli are a diverse group of organisms that are normally harmless as commensals
in humans and animals (Moriel et al., 2012). However, its acquisition of a combination of
mobile genetic elements makes E. coli a highly adapted pathogen capable of causing
gastroenteritis as well as extraintestinal infections of the urinary tract, bloodstream and central
nervous system (Croxen and Finlay, 2010; Moriel et al., 2012). Diseases from E. coli affect
hundreds of millions of people annually. Eight E. coli pathovars and their mechanisms of
disease have been extensively studied. These pathovars can be broadly classified as either
diarrhoeagenic E. coli or extraintestinal E. coli (ExPEC) (Croxen and Finlay, 2010; Moriel et
al., 2012). Diarrhoeagenic E. coli strains include enteropathogenic E. coli (EPEC),
enterohaemorrhagic E. coli (EHEC), enterotoxigenic E. coli (ETEC), enteroinvasive E. coli
(EIEC), enteroaggregative E. coli (EAEC) and diffusely adherent E. coli (DAEC) (Croxen
and Finlay, 2010; Nataro and Kaper,, 1998). EPEC is a major cause of infant diarrhea in
developing countries (Nataro and Kaper, 1998).
Escherichia coli are facultative anaerobes that do not require oxygen for growth although they
grow better in aerobic conditions (Jones et al., 2007). The temperature range for growth of
pathogenic E. coli is 7 – 8°C to 46°C, with an optimum temperature of 35 – 40 °C (ICMSF
1996). The minimum pH for growth is 4.4 (Bell, 2002), but some EHEC strains like E. coli
O157:H7 have a high degree of acid tolerance surviving 2 to 7 hrs exposures at pH 2.5 and
37°C (Buchanan and Doyle, 1997). Escherichia coli O157:H7 has an acid-adaptive response,
and the expression of this system enhances its survival in the presence of lactic acid and in
acidified food products including fermented foods (Leyer at al., 1995). Acid tolerance is
probably an important component of virulence for E. coli O157:H7 and it allows a small
number of cells to cause illness by their being protected in the gastric tract (Leyer et al.,
1995). Leyer et al. (1995) demonstrated that acid-adapted E. coli O157:H7 cells survived
substantially longer in cider. In their study, acid-adapted cell population decreased about 10-
folds from 105 cfu/ml after 28 hrs and the cells were detected at 60 cfu/ml after 81 hrs in cider
that had an initial pH of 3.42 and was stored at 6.8 oC.
The infectious dose for some Shiga toxin-producing Escherichia coli (STEC) strains
(O111:H2 and O157:H7) is as low as 1 to 100 cells while those for ETEC and EPEC are
higher (Paton and Paton, 1998). For ETEC, the infectious dose is 106 to 1010 cells/g (Qadri et
al., 2005). In this study, the final pH values for all fermentations containing E.coli were above
4.4 with minimum population of 3 log cfu/g in BSP. Thus for the fermentations to inhibit E.

14
coli growth to safe levels, process optimization of back-slopping material through repetitive
recycling of inoculum before final use in the pastes to select the best adapted strains is
recommended. Further, strain selection for starter cultures with attributes like fast
acidification, degradation of anti-nutritional factors, and improvement of aroma and texture as
criteria would be desirable. Possibly mixed strain cultures could be suitable for improved
inhibition of pathogens in the fermented pastes.
Although fermentation improves safety of foods, this study suggested that it cannot be
considered as a critical control point for elimination of risks of biological hazards in these
pastes. Thus prevention of contamination with pathogenic strains would be the best way to
ensure safety. Nevertheless, the pastes were to be heat treated before consumption.
Fortunately, the E. coli strain with lowest infectious dose (E. coli O157:H7) can be controlled
readily through traditional thermal processing techniques; although the heating process ought
to be sufficient to assure a low probability of the pathogen surviving (Buchanan and Dowley,
1997).
Conclusions
From this study, it was concluded that back-slopping has potential of producing fermented
soybean pastes with reduced risk of foodborne illnesses from Bacillus cereus, although
process optimization is recommended through repeated recycling of inoculum to select the
best adapted strains. Soybean pastes naturally fermented with Bacillus subtilis have always
been considered as safe, but they could pose a risk of infection if contamination by pathogens
occurs during fermentation and food preparation. Because of acid tolerance of some E. coli
strains during fermentation, then a thermal processing step should be applied before
consumption to ensure safety.
Acknowledgements
We would like to acknowledge financial support from the Norwegian Programme for
Development, Research and Education (NUFU) and Norwegian State Education Fund
(Lånekassen).
15
References
ALLAGHENY, N., OBANU, Z. A., CAMPBELL-PLATT, G. & OWENS, J. D. 1996.
Control of ammonia formation during Bacillus subtilis fermentation of legumes. International
Journal of Food Microbiology, 29, 321-333.
ARI, M. M., AYANWALE, B. A., ADAMA, T. Z. & OLATUNJ I, E. A. 2012. Effects of
different fermentation methods on the proximate composition, amino acid profile and some
antinutritional factors (ANFs) in soyabeans (Glycine Max). Fermentation Technology and
Bioengineering, 2, 6-13.
BELL C. 2002. Approach to the control of entero-haemorrhagic Escherichia coli (EHEC).
International Journal of Food Microbiology, 78, 197-216.
BONKOUNGOU, I. J. O., HAUKKA, K., OSTERBLAD, M., HAKANEN, A., TRAORE,
A., BARRO, N. & SIITONEN, A. 2013. Bacterial and viral etiology of childhood diarrhea in
Ouagadougou, Burkina Faso. BMC Pediatrics, 13, 36.
BORGE, A. G. I., SKEIE, M., SØRHAUG, T., LANGSRUD, T. & GRANUM, P. E. 2001.
Growth and toxin profiles of Bacillus cereus isolated from different food sources.
International Journal of Food Microbiology, 69, 237-246.
BUCHANAN, R.L. and DOYLE, M.P. 1997. Foodborne Disease Significance of Escherichia
coli O157:H7 and other enterohemorrhagic E. coli. Food Technology, 51, 69 – 76.
CEUPPENS, S., RAJKOVIC, A., HEYNDRICKX, M., TSILIA, V., VAN DE WIELE, T.,
BOON, N. & UYTTENDAELE, M. 2011. Regulation of toxin production by Bacillus cereus
and its food safety implications. Critical Reviews in Microbiology, 37, 188-213.
CHITRA, U., SINGH, U. & VENKATESWARA RAO, P. 1996. Phytic acid, in vitro protein
digestibility, dietary fiber, and minerals of pulses as influenced by processing methods. Plant
Foods for Human Nutrition, 49, 307-316.
CHUKEATIROTE, E., DAJANTA, K. & APICHARTSRANGKOON, A. 2010. thua nao,
Indigenous Thai Fermented Soybean: A Review. Journal of Biological Sciences, 10, 581-583.
COULIBALY, O., A. D. ALENE, V. MANYONG, D. SANOGO, T. ABDOULAYE, J.
CHIANU. 2009. Situation and outlook for cowpea and soybean in Sub-Saharan Africa.
International Crops Research Institute for the Semi- Arid Tropics (ICRISAT). Available at

16
http://www.icrisat.org/what-we-do/impi/projects/tl2-publications/regional-situation-outlook-
reports/rso-cwp-sbean-sub-SaharaAfrica.pdf. Last accessed 13 June 2014.
CROXEN, M. A. & FINLAY, B. B. 2010. Molecular mechanisms of Escherichia coli
pathogenicity. Nature Reviews Microbiology, 8, 26-38.
DAKWA , S., SAKYI-DAWSON, E., DIAKO, C., ANNAN, N. T. & AMOA-AWUA, W. K.
2005. Effect of boiling and roasting on the fermentation of soybeans into dawadawa (soy-
dawadawa). International Journal of Food Microbiology, 104, 69 - 82.
DE VUYST, L., SCHRIJVERS, V., PARAMITHIOTIS, S., HOSTE, B., VANCANNEYT,
M., SWINGS, J., KALANTZOPOULOS, G., TSAKALIDOU, E. & MESSENS, W. 2002.
The biodiversity of lactic acid bacteria in Greek traditional wheat sourdoughs is reflected in
both composition and metabolite formation. Applied Environmental Microbiology, 68, 6059-
69.
DIXIT, A.K., ANTONY, J.I.X., SHARMA, N.K., AND TIWARI, R.K. (2011). Soybean
constituents and their functional benefits. Opportunity, challenge and scope of natural
products in medicinal chemistry. Research Signpost 37/661 (2), Kerala, India. Pp 367-383.
DRAGO, L., GISMONDO, M. R., LOMBARDI, A., DE HAËN, C. & GOZZINI, L. 1997.
Inhibition of in vitro growth of enteropathogens by new Lactobacillus isolates of human
intestinal origin. FEMS Microbiology Letters, 153, 455-463.
EHLING-SCHULZ, M., FRICKER, M. & SCHERER, S. 2004. Bacillus cereus, the causative
agent of an emetic type of food-borne illness. Molecular Nutrition & Food Research, 48, 479-
87.
GHELARDI, E., CELANDRONI, F., SALVETTI, S., BARSOTTI, C., BAGGIANI, A. &
SENESI, S. 2002. Identification and characterization of toxigenic Bacillus cereus isolates
responsible for two food-poisoning outbreaks. FEMS Microbiology Letters, 208, 129-34.
GRAN, H. M., MUTUKUMIRA, A. N., WETLESEN, A. & NARVHUS, J. A. 2002.
Smallholder dairy processing in Zimbabwe: the production of fermented milk products with
particular emphasis on sanitation and microbiological quality. Food Control, 13, 161-168.
GRANUM, P. E. & LUND, T. 1997. Bacillus cereus and its food poisoning toxins. FEMS
Microbiology Letters, 157, 223-228.
17
HOLZAPFEL, W. H. 2002. Appropriate starter culture technologies for small-scale
fermentation in developing countries. International Journal of Food Microbiology, 75, 197-
212.
ICMSF. 1996. Intestinally pathogenic Escherichia coli. Ch 7 In: Microorganisms in food 5:
Characteristics of Microbial Pathogens. Blackie Academic and Professional, London, p. 126–
140
JONES, S. A., CHOWDHURY, F. Z., FABICH, A. J., ANDERSON, A., SCHREINER, D.
M., HOUSE, A. L., AUTIERI, S. M., LEATHAM, M. P., LINS, J. J., JORGENSEN, M.,
COHEN, P. S. & CONWAY, T. 2007. Respiration of Escherichia coli in the mouse intestine.
Infection and Immunity, 75, 4891-4899.
KALIMBIRA, A. A., MTIMUNI, B. M. & MTIMUNI, J. P. 2 004. Effect of incorporating
legumes on nutritive value of cassava-based complementary foods. Bunda Journal of
Agriculture, Environvironmental Science & Technology, 2, 13-21.
KINGAMKONO, R. R., SJÖGREN, E. & SVANBERG, U. 1998. Inhibition of enterotoxin
production by, and growth of enteropathogens in a lactic acid-fermenting cereal gruel. World
Journal of Microbiology and Biotechnology, 14, 661-667.
KINGAMKONO, R., SJÖGREN, E., SVANBERG, U. & KAIJSER, B. 1994. pH and acidity
in lactic-fermenting cereal gruels: effects on viability of enteropathogenic microorganisms.
World Journal of Microbiology and Biotechnology, 10, 664-669.
KINGAMKONO, R., SJÖGREN, E., SVANBERG, U. & KAIJSER, B. 1995. Inhibition of
different strains of enteropathogens in a lactic-fermenting cereal gruel. World Journal of
Microbiology and Biotechnology, 11, 299-303.
KOTIRANTA, A., LOUNATMAA, K. & HAAPASALO, M. 2000. Epidemiology and
pathogenesis of Bacillus cereus infections. Microbes & Infection, 2, 189-98.
LEE, J. H., KIM, T. W., LEE, H., CHANG, H. C. & KIM, H. Y. 2010. Determination of
microbial diversity in meju, fermented cooked soya beans, using nested PCR-denaturing
gradient gel electrophoresis. Letters in Applied Microbiology, 51, 388-394.
LEEJEERAJUMNEAN, A. 2003. Thua nao : Alkali Fermented Soybean from Bacillus
subtitis. Silpakorn University Journal of Social Sciences, Humanities, and Arts, 3, 277-292.
18
LEYER, G. J., WANG, L. L. & JOHNSON, E. A. 1995. Acid adaptation of Escherichia coli
O157:H7 increases survival in acidic foods. Applied and Environmental Microbiology, 61,
3752-5.
LOGAN N. A. 2012. Bacillus and relatives in foodborne illness. Journal of Applied
Microbiology, 112, 417-429.
MORIEL, D. G., ROSINI, R., SEIB, K. L., SERINO, L., PIZZA, M. & RAPPUOLI, R. 2012.
Escherichia coli: Great diversity around a common core. mBio, 3.
MOSHA, A.C. & SVANBERG, U.H. 1983. Preparation of weaning foods with high nutrient
density using flour of germinated cereals. Food and Nutrition Bulletin, 5, 10-14.
NAM, Y.-D., LEE, S.-Y. & LIM, S.-I. 2012a. Microbial community analysis of Korean
soybean pastes by next-generation sequencing. International Journal of Food Microbiology,
155, 36-42.
NAM, Y.-D., YI, S.-H. & LIM, S.-I. 2012b. Bacterial diversity of cheonggukjang, a
traditional Korean fermented food, analyzed by barcoded pyrosequencing. Food Control, 28,
135-142.
NATARO, J. P. & KAPER, J. B. 1998. Diarrheagenic Escherichia coli. Clinical
Microbiology Reviews, 11, 142-201.
NG'ONG'OLA-MANANI, T. A., MWANGWELA, A. M., SCHÜLLER, R. B., ØSTLIE, H.
M. & WICKLUND, T. 2014a. Sensory evaluation and consumer acceptance of naturally and
lactic acid bacteria-fermented pastes of soybeans and soybean–maize blends. Food Science &
Nutrition, 2, 114-131.
NG'ONG'OLA-MANANI, T. A., MWANGWELA, A. M., ØSTLIE, H. M. & WICKLUND,
T. 2014b. Metabolite changes during natural and lactic acid bacteria fermentations in pastes of
soybeans and soybean-maize blends. Unpublished results.
NOUT, M. J. R. & MOTARJEMI, Y. 1997. Assessment of fermentation as a household
technology for improving food safety: a joint FAO/WHO workshop. Food Control, 8, 221-
226.
NOUT, M. J. R., BAKSHI, D. & SARKAR, P. K. 1998. Microbiological safety of kinema, a
fermented soya bean food. Food Control, 9, 357-362.
19
PARKOUDA, C., NIELSEN, D. S., AZOKPOTA, P., IVETTE IRÈNE OUOBA, L., AMOA-
AWUA, W. K., THORSEN, L., HOUNHOUIGAN, J. D., JENSEN, J. S., TANO-DEBRAH,
K., DIAWARA, B. & JAKOBSEN, M. 2009. The microbiology of alkaline-fermentation of
indigenous seeds used as food condiments in Africa and Asia. Critical Reviews in
Microbiology, 35, 139-156.
PATON, J. C. & PATON, A. W. 1998. Pathogenesis and diagnosis of shiga toxin-producing
Escherichia coli infections. Clinical Microbiology Reviews, 11, 450-479.
QADRI, F., SVENNERHOLM, A.-M., FARUQUE, A. S. G. & SACK, R. B. 2005.
Enterotoxigenic Escherichia coli in developing countries: epidemiology, microbiology,
clinical features, treatment, and revention. Clinical Microbiology Reviews, 18, 465-483.
REDDY, N. R. & PIERSON, M. D. 1994. Reduction in antinutritional and toxic components
in plant foods by fermentation. Food Research International, 27, 281-290.
RØSSLAND, E., LANGSRUD, T. & SØRHAUG, T. 2005. Influence of controlled lactic
fermentation on growth and sporulation of Bacillus cereus in milk. International Journal of
Food Microbiology, 103, 69-77.
SAHLIN, P. 1999. Fermentation as a Method of Food Processing: Production of organic
acids, pH-development and microbial growth in fermenting cereals. Division of Applied
Nutrition and Food Chemistry, Center for Chemistry and Chemical Engineering, Lund
Institute of Technology, Lund University, Sweden. Thesis.
SARKAR, P. K. & TAMANG, J. P. 1995. Changes in the microbial profile and proximate
composition during natural fermentations of soybeans to produce kinema. Food
Microbiology, 12, 317 – 325.
SARKAR, P. K., HASENACK, B. & NOUT, M. J. R. 2002. Diversity and functionality of
Bacillus and related genera isolated from spontaneously fermented soybeans (Indian Kinema)
and locust beans (African Soumbala). International Journal of Food Microbiology, 77, 175-
186.
SCHRAFT H. AND GRIFFITHS M. W. 2006. Bacillus cereus gastroenteritis. Foodborne
Infections and Intoxications 3e: Elsevier Science. p. 563-577.

20
SENESI, S. & GHELARDI, E. 2010. Production, secretion and biological activity of Bacillus
cereus enterotoxins. Toxins, 2, 1690-1703.
STEINKRAUS, K. H. 1997. Classification of fermented foods: worldwide review of
household fermentation techniques. Food Control, 8, 311-317.
SVANBERG, U., SJÖGREN, E., LORRI, W., SVENNERHOLM, A. M. & KAIJSER, B.
1992. Inhibited growth of common enteropathogenic bacteria in lactic-fermented cereal
gruels. World Journal of Microbiology and Biotechnology, 8, 601-606.
THORSEN, L., AZOKPOTA, P., HANSEN, B. M., HOUNHOUIGAN, D. J. & JAKOBSEN,
M. 2010. Identification, genetic diversity and cereulide producing ability of Bacillus cereus
group strains isolated from Beninese traditional fermented food condiments. International
Journal of Food Microbiology, 142, 247-50.
VALERO, M., FERNÁNDEZ, P. S. & SALMERÓN, M. C. 2003. Influence of pH and
temperature on growth of Bacillus cereus in vegetable substrates. International Journal of
Food Microbiology, 82, 71-79.
VISESSANGUAN, W., BENJAKUL, S., POTACHAREON, W., PANYA, A. & RIEBROY,
S. 2005. Accelerated proteolysis of soy proteins during fermentation of thua-nao inoculated
with Bacillus subtilis. Journal of Food Biochemistry, 29, 349-366.
WONG, H. C. & CHEN, Y. L. 1988. Effects of Lactic Acid Bacteria and Organic Acids on
Growth and Germination of Bacillus cereus. Applied and Environmental Microbiology, 54,
2179-84.
YANG, H. J., PARK, S., PAK, V., CHUNG, K. R. & KWON, D. Y. 2011. Fermented
soybean products and their bioactive compounds In: EL-SHEMY, P. H. (ed.) Soybean and
Health. Croatia: InTech Europe. Available from: http://www.intechopen.com/books/soybean-
and-health/fermentedsoybean-products-and-their-bioactive-compounds. Last accessed 13 June
2014.

21
Table 1: Sample composition, fermentation type and pathogen combination
Pathogen Natural fermentation
Back-slopping Controlled fermentation
E. coli 100S + E. coli 100SBS + E. coli 100SC + Lb. fermentum + E. coli
90S + E. coli 90SBS + E. coli 90SC + Lb. fermentum + E. coli
B. cereus 100S + B. cereus 100SBS + B. cereus 100SC + Lb. fermentum + B. cereus
90S + B. cereus 90SBS + B. cereus 90SC + Lb. fermentum + B. cereus
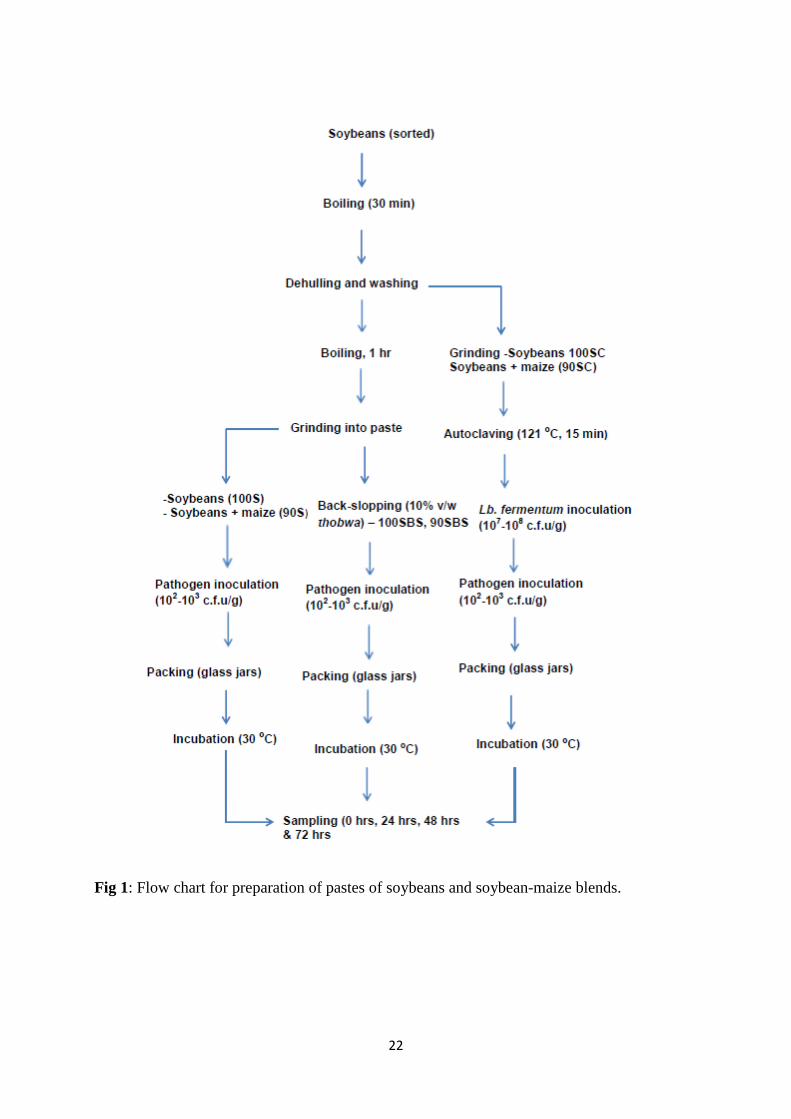
22
Fig 1: Flow chart for preparation of pastes of soybeans and soybean-maize blends.

23
0
2
4
6
8
10
12
0 24 48 72
Log
10
cfu
/g
Fermentation Time (hrs)
100SC + E. coli
90SC+E. coli
100SBS+E. coli
90SBS+E. coli
100S+E. coli
90S+E. coli
3
3,5
4
4,5
5
5,5
6
6,5
7
7,5
0 24 48 72
pH
Fermentation Time (hrs)
100SC + E. coli
90SC+E. coli
100SBS+E. coli
90SBS+E. coli
100S+E. coli
90S+E. coli
Fig 2: Changes in pH during fermentation of pastes of soybeans and soybean-maize blends inoculated with E. coli. Samples coded 100SC and 90SC represent pastes fermented with Lb. fermentum; 100S, and 90S represent naturally
fermented pastes; while 100SBS and 90SBS represent back-slopped pastes. Pastes are designated according to 100% and 90% soybean composition, the remaining proportions being maize.
Fig 3: Changes in E. coli population during fermentation of pastes of soybeans and soybean-maize blends. Samples coded 100SC and 90SC represent pastes fermented with Lb. fermentum; 100S, and 90S
represent naturally fermented pastes; while 100SBS and 90SBS
represent back-slopped pastes. Pastes are designated according to 100% and 90% soybean composition, the remaining proportions being maize.
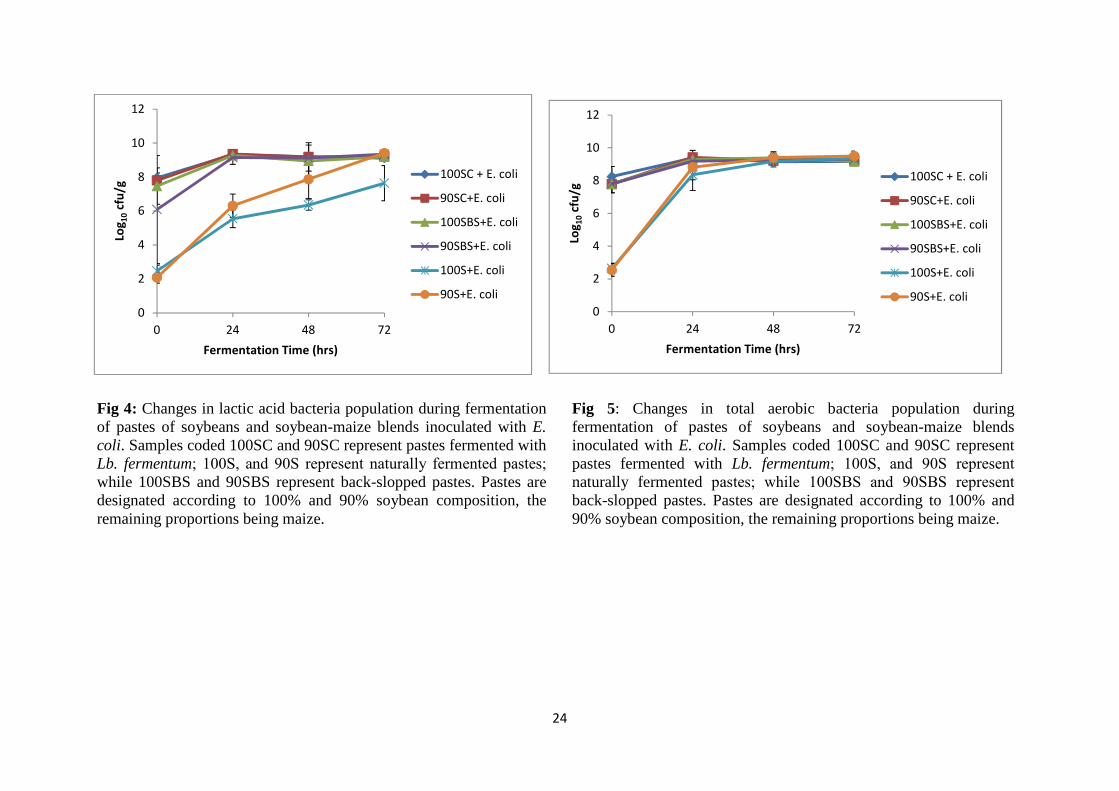
24
0
2
4
6
8
10
12
0 24 48 72
Log
10
cfu
/g
Fermentation Time (hrs)
100SC + E. coli
90SC+E. coli
100SBS+E. coli
90SBS+E. coli
100S+E. coli
90S+E. coli
0
2
4
6
8
10
12
0 24 48 72
Log
10
cfu
/g
Fermentation Time (hrs)
100SC + E. coli
90SC+E. coli
100SBS+E. coli
90SBS+E. coli
100S+E. coli
90S+E. coli
Fig 4: Changes in lactic acid bacteria population during fermentation of pastes of soybeans and soybean-maize blends inoculated with E. coli. Samples coded 100SC and 90SC represent pastes fermented with Lb. fermentum; 100S, and 90S represent naturally fermented pastes;
while 100SBS and 90SBS represent back-slopped pastes. Pastes are designated according to 100% and 90% soybean composition, the remaining proportions being maize.
Fig 5: Changes in total aerobic bacteria population during fermentation of pastes of soybeans and soybean-maize blends inoculated with E. coli. Samples coded 100SC and 90SC represent pastes fermented with Lb. fermentum; 100S, and 90S represent
naturally fermented pastes; while 100SBS and 90SBS represent
back-slopped pastes. Pastes are designated according to 100% and 90% soybean composition, the remaining proportions being maize.

25
3,5
4,5
5,5
6,5
7,5
8,5
0 24 48 72
pH
Fermentation Time (hrs)
100SC+B. cereus
90SC+B. cereus
100SBS+B. cereus
90SBS+B. cereus
100S+B. cereus
90S+B. cereus
0
1
2
3
4
5
6
7
8
9
10
0 24 48 72
Log
10
cfu
/g
Fermentation Time (hrs)
100SC+B. cereus
90SC+B. cereus
100SBS+B. cereus
90SBS+B. cereus
100S+B. cereus
90S+B. cereus
Fig 6: Changes in pH during fermentation of pastes of soybeans and soybean-maize blends inoculated with B. cereus. Samples coded 100SC and 90SC represent pastes fermented with Lb. fermentum; 100S, and 90S represent naturally fermented pastes;
while 100SBS and 90SBS represent back-slopped pastes. Pastes are designated according to 100% and 90% soybean composition, the remaining proportions being maize.
Fig 7: Changes in B. cereus population during fermentation of pastes of soybeans and soybean-maize blends. Samples coded 100SC and 90SC represent pastes fermented with Lb. fermentum; 100S, and 90S
represent naturally fermented pastes; while 100SBS and 90SBS
represent back-slopped pastes. Pastes are designated according to 100% and 90% soybean composition, the remaining proportions being maize.

26
0
2
4
6
8
10
12
0 24 48 72
Log
10
cfu
/g
Fermentation Time (hrs)
100SC+B. cereus
90SC+B. cereus
100SBS+B. cereus
90SBS+B. cereus
100S+B. cereus
90S+B. cereus0
2
4
6
8
10
12
0 24 48 72
Log
10
cfu
/g
Fermentation Time (hrs)
100SC+B. cereus
90SC+B. cereus
100SBS+B. cereus
90SBS+B. cereus
100S+B. cereus
90S+B. cereus
Fig 8: Changes in lactic acid bacteria population during fermentation of pastes of soybeans and soybean-maize blends inoculated with B. cereus. Samples coded 100SC and 90SC represent pastes fermented with Lb. fermentum; 100S, and 90S
represent naturally fermented pastes; while 100SBS and 90SBS
represent back-slopped pastes. Pastes are designated according to 100% and 90% soybean composition, the remaining proportions being maize.
Fig 9: Changes in total aerobic bacteria population during fermentation of pastes of soybeans and soybean-maize blends inoculated with B. cereus. Samples coded 100SC and 90SC represent pastes fermented with Lb. fermentum; 100S and 90S
represent naturally fermented pastes; while 100SBS and
90SBS represent back-slopped pastes. Pastes are designated according to 100% and 90% soybean composition, the remaining proportions being maize.

27