Vladana_Grabež_(IKBM)_Thesis_2015-77.pdf - Brage NMBU
184
QUALITY CHANGES IN LAMB/SHEEP AND BEEF MEAT RELATED TO OXIDATIVE PROCESSES IN MUSCLE SYSTEMS KVALITETSENDRINGER I LAM/SAU OG STORFEKJØTT RELATERT TIL OKSIDATIVE PROSESSER I MUSKELSYSTEMER Philosophiae Doctor (PhD) Thesis Vladana Grabež Department for Chemistry, Biotechnology and Food Science Norwegian University of Life Sciences Ås 2015 Thesis number 2015:77 ISSN 1894-6402 ISBN 978-82-575-1314-6
-
Upload
khangminh22 -
Category
Documents
-
view
1 -
download
0
Transcript of Vladana_Grabež_(IKBM)_Thesis_2015-77.pdf - Brage NMBU

QUALITY CHANGES IN LAMB/SHEEP AND BEEF MEAT RELATED TO OXIDATIVE PROCESSES IN MUSCLE SYSTEMS
KVALITETSENDRINGER I LAM/SAU OG STORFEKJØTT RELATERT TIL OKSIDATIVE PROSESSER I MUSKELSYSTEMER
Philosophiae Doctor (PhD) Thesis
Vladana Grabež
Department for Chemistry, Biotechnology and Food Science Norwegian University of Life Sciences
Ås 2015
Thesis number 2015:77 ISSN 1894-6402
ISBN 978-82-575-1314-6

A doctoral thesis was submitted to the Department of Chemistry, Biotechnology and Food
Sciences at the Norwegian University of Life Sciences (NMBU, Ås, Norway). The thesis has
been carried during the time period of 2012-2015 and consists of a theoretical introduction with
five scientific papers.
Supervisors:
Bjørg Egelandsdal, Dr. (main supervisor)
Professor. Department for Chemistry, Biotechnology and Food Science
Norwegian University of Life Sciences (NMBU)
P.O. Box 5003, IKBM, N-1432, Ås, Norway
Gunnar Klemetsdal, Dr. (co-supervisor)
Professor. The Department of Animal and Aquacultural Sciences
Norwegian University of Life Sciences (NMBU)
P.O. Box 5003, IHA, N-1432, Ås, Norway
Božo Važić, Dr. (co-supervisor)
Associate Professor. Department for Animal Husbandry
Agricultural Faculty, University of Banja Luka
Bulevar vojvode Petra Bojovića 1A, BA-78 000 Banja Luka, Bosnia and Herzegovina
Milena Bjelanović, M Sc. (co-supervisor)
Project Manager. Department for Chemistry, Biotechnology and Food Science
Norwegian University of Life Sciences (NMBU)
P.O. Box 5003, IKBM, N-1432, Ås, Norway

Evaluation Committee:
Jana Pickova, Dr.
Professor. Department of Food Science
Swedish University of Agricultural Sciences (SLU)
P.O. Box 7051, SE-750 07, Uppsala, Sweden
Vibeke Lind, Dr.
Senior researcher.
Norwegian Institute of Bioeconomy Research (NIBIO)
N-8860, Tjøtta, Norway
Tove Gulbrandsen Devold, Dr.
Researcher. Department of Chemistry, Biochemistry and Food Science
Norwegian University of Life Sciences (NMBU)
P.O. Box 5003 NMBU, N-1432, Ås, Norway
Copyright © Vladana Grabež
Department for Chemistry, Biotechnology and Food Science
Norwegian University of Life Sciences
P.O. box 5003, IKBM, N-1432, Ås, Norway


Dedication
TTo my family


i
Preface
The thesis consists of a theoretical introduction and five scientific papers discussing the
importance of oxidative processes as involved in tenderization mechanisms and flavour
development in post mortem muscle. Paper I and Paper II emphasize mitochondria as
antioxidants using beef as meat matrix. Paper I defines the relation between mitochondrial
activity early post mortem and mechanical properties of beef meat. In Paper II, mixtures of
Krebs cycle substrates that stabilize colour of minced meat were tested for their ability to
provoke or retard (lipid) oxidation.
In the next three papers (Paper III, IV and V) sheep and lamb meat quality was studied, from
grading to production of dry cured hams. The quality characteristics of fresh lamb and sheep
meat from different production systems were first investigated (Paper III). Flavour compounds
and sensory attributes of adipose tissue and lean meat were then studied subsequently (Paper
IV). Paper IV also returns to the importance of Krebs cycle compounds. Flavour development
and sensory properties of sheep hams produced from the raw material characterized in Paper
III and IV using two different production processes from Western Balkan countries, were
defined in the Paper V.

ii
Acknowledgements
Creating PhD thesis presents a teamwork and implies many people who I would like to
acknowledge. First of all, I would like to thank my main PhD supervisor, Professor Bjørg
Egelandsdal for being enthusiastic, energetic and supportive during these years. I feel fortunate
to have collaborated with Professor Egelandsdal who has been patient and encouraging during
difficult moments. Professor, your high scientific and professional standards were inspiring and
helped me to grow as a researcher. In addition, I would like to thank to my PhD co-supervisors,
Professors Gunnar Klemetsdal and Božo Važić for their help and suggestions. Also, I would
like to express my gratitude the leader of the HERD Project, Milena Bjelanović, for a fruitful
cooperation and support in all segments of the project. I owe a big thank to Professor Erik Slinde
for inspiring research discussions, support and assistance in completing my doctoral program.
I gratefully acknowledge co-authors, professors and colleagues for their time and valuable help
in research and scientific papers’ creation: Professor Anna Haug, Professor Vladimir Tomović,
Professor Snježana Mandić, Dr. Kim Marius Moe, Dr. Vinh T. Phung, Dr. Morten Skaugen, Dr.
Kristin Saarem, Dr. Torunn T. Håseth, Dr. Øyvind Langsrud, MSc Mamatha Kathri and Ana
Velemir. I would like to give a special thank Dr. Jens Rohloff, Adj. Associate Professor at
NTNU; not only did you provide instrumentation and methodology when my research progress
declined, but you have taught me so much about metabolomic studies in our joint research.
I have greatly enjoyed working with the colleagues from Dairy lab at IKBM. Specially, I would
like to thank Kari Olsen for great help and for providing a pleasant working atmosphere during
long “chromatography-analysis” days.
Professor Solve Sæbø, Dr. Daniel Münch, and Senior Advisor Yngve Rekdal are acknowledged
for constructive comments and suggestions.
My gratitude is also extended to the members of my scientific group: Marije Oostindjer, Gu Yi,
Qing Wang, Lene Ruud Lima, Pia Kjelsaas, and Han Zhu for being invaluable support, friends
and colleagues. My work has greatly benefited from kind encouragement and the enjoyable
discussions with Dr. Marije Oostindjer. Ladies, thank you for many precious moments!

iii
I owe a big thank to the personnel of IKBM for their help and technical support. I would like to
thank Vilma Bischof, Wenche Johnsrød and Laila Falleth for the administrative help during this
PhD project.
Furthermore, I would gratefully acknowledge the funding provided by the Research Council of
Norway: (NFR184846/I10; “Formation of flavour components from polyunsaturated lipids and
how these are influenced by the presence of molecular pro- and antioxidants and mitochondria”
and Grant No. 225309; “Small ruminant flavour”) and the Norwegian Ministry for Foreign
Affairs (No. 19028; HERD – Program for Higher Education, Research and Development,
Agriculture). I would also like to express my gratitude for the PhD scholarship that was provided
by the Norwegian State Educational Loan fund “Lånekassen”. The fact that I have depended on
several funding sources has given me insight into many different aspects of meat science and
technology. In particular, these funding sources have introduced me into meat production in
Norway and Western Balkans.
I would like to thank the members of HERD project: Professor Aleksandra Martinović,
Professor Božidarka Marković, Dr. Biljana Rogić, MSc Sandra Stojković, MSc Goran Vučić,
master students Sanja Kostić and Slobodan Momić for cooperation and assistance in realization
of lamb/sheep studies. I owe a great thank to Per Berg from Nortura SA for support and
encouragement. The staff at Nortura Gol, “BB” Kotor Varoš and “Franca” Bijelo Polje are
thanked for their great assistance in sample collection.
I would like to thank Slađa, ‘drug moj’, for being such a supportive and a patient friend during
the years of my PhD life. Long distance has not changed us.
‘Cimaki’ Neno thank you for being such a gentle friend and amazing flat-mate in the past three
years. Thank you for your kind support in all segments: professional, social, emotional even
gastronomical. Cimaki, thank you for many wonderful moments that I will never forget.
Dimitris, Tzimorota, and Christos, thank you for enjoyable time, gastronomic experiences and
endless discussions on various life topics. ‘Filarakia’, you warmed long Nordic winters with the
stories about your motherland, beloved Greece.
I would also like to thank to Goca, Đorđe, Ognjen, Mladen, Boris, Kristina and Nenad for your
friendship during these years.

iv
Significant part of this work belongs to my Mom and Dad who have been supportive and
unconditionally loved me their entire life; to my brother and his wife for encouraging me to
continue my scientific career; Teodora, your angel smile gave me the strength to complete this
work. Part of the work also belongs to my ‘Scandinavian family’: aunt, uncle, and cousins, who
provided continuous support and care throughout. There are no words to thank you all for
believing in me and helping me to reach my goal!

v
Summary
The oxidative processes in meat post mortem maintain the formation of free radicals. Behavior
of reactive oxygen species is closely related to the energy metabolism of the muscle cell,
mitochondrial activity and efficiency of antioxidant systems. The role of mitochondria as a
natural antioxidant in a cell has been investigated. Biochemical changes in meat activated by
oxidation processes provoke different pathways in tenderization and flavour formation.
In Paper I, a predictive model for meat tenderness was created based on the oxygen
consumption rate measurements early post mortem using partial least square regression (that
explained minimum 15-20% variation in beef tenderness). A major challenge was related to
mitochondria isolation approximately 2.5 hours post mortem at the slaughter-line. The protein
expression of isolated mitochondria was studied for tender and tough beef samples.
Mitochondrial proteins were separated on 2-dimensional SDS-PAGE gels and image analysis
was performed using Delta2D. Protein spots of interest were analyzed by mass spectrometry
techniques (MALDI-TOF or LC-MS). Higher mitochondrial respiration and antioxidant
activity, abundant Krebs cycle and electron transport system proteins as well as energy
production enzymes were correlated with tender beef.
In Paper II, the effect of Krebs cycle substrates (KCS) used as colour stabilizers of oxidation
processes in minced meat during chill-storage was investigated. Mixtures of succinate,
pyruvate, glutamate, malate and citrate in various combinations were added to minced beef meat
with either pork or beef fat, and packaged in modified atmosphere or high oxygen atmosphere
for 13 and 8 days, respectively. Development of lipid derivated volatiles was to a large extent
affected by the type of fat tissue. Lipid oxidation increased when the KCS were metabolized to
eliminate oxygen and keep colour stable. The increase in lipid oxidation was too small to
deteriorate flavour and nutritive characteristics of meat, and was offset by the positive effect of
KCS additives on meat colour.

vi
In Paper III and IV, significant differences in quality characteristics of lamb and sheep meat
representative of three production systems were identified. The selected animals of different
breed, age and from specific grazing regions reflected the consumption and cultural habits
typical for Bosnia and Herzegovina, Montenegro and Norway. Animals belonging to
autochthonous Pramenka breed (types Vlašićka and Pivska) were in general smaller, with higher
fat content, better tenderness (only for Bosnia and Herzegovina muscles), and better colour
stability and antioxidant capacity compared to the presently dominating Norwegian White
breed, that had a better nutritional value. Additional differentiation of observed animal groups
was done by sensory and flavour analysis. The volatile and metabolite profile of each animal
group were described by specific compounds that were isolated from adipose tissue and lean
meat, respectively. Large sensory and flavour differences among the two types of Pramenka
breed were found. This is probably due to the local production systems and suggested that
sheep/lamb sensory differences cannot be related to the distance between the grazing areas.
In Paper V, dry-cured sheep hams produced in Bosnia and Herzegovina (B&H) and
Montenegro (MN) using old traditional recipes in the facilities commonly used in these two
countries were investigated. The results for sensory, volatile and organic acid analysis were
studied using multivariate analysis. Adding garlic and pepper during the salting phase of B&H
ham production had a significant effect on sensory and flavour profile. Intense smoking of MN
sheep ham gave a heavy, smoked flavour. The selected processing technology in B&H produced
low-salt sheep hams, apparently by using a fermentation step, while MN hams were produced
with higher salt levels.

vii
Sammendrag
Oksidative prosesser i kjøtt opprettholder post mortem dannelsen av frie radikaler. Virkemåten
til reaktive oksygen forbindelser er nært knyttet til energimetabolismen i muskelceller,
mitokondrie aktivitet og effektiviteten av antioksidant systemer. Mitokondrienes rolle som
naturlige antioksidanter i celler har blitt undersøkt. Biokjemiske endringer i kjøtt aktivert ved
oksidasjons- prosesser leder til ulike metabolske veier som påvirker mørhet og smaksdannelse.
I artikkel I ble det laget en prediktiv modell ved bruk av partiell minste kvadraters metode for
mørhet i kjøtt. Modellen forklarte minimum 15-20% variasjon i kjøttets mørhet. Denne
modellen baserte seg på hvor høyt oksygen forbruket i muskelen er tidlig post mortem. En stor
praktisk utfordring var knyttet til mitokondrie isolasjonen som ble utført ca. 2.5 timer post
mortem på slaktelinjen. Protein uttrykket i de isolerte mitokondriene ble studert for møre og
seige kjøttprøver. Mitokondriets proteiner ble skilt ved 2-dimensjonal SDS- PAGE og
bildeanalysen ble utført ved hjelp av Delta2D. Protein flekker av interesse ble analysert med
masse-spektrometri teknikker (MALDI-TOF eller LC-MS). Høyere mitokondrie respirasjon og
antioksidantaktivitet, rikelig med Krebs syklus og elektron transport system proteiner samt
energi produserende enzymer ble korrelert med kjøttets grad av mørhet.
I artikkel II, ble effekten på oksidative prosesser av å benytte Krebs syklus forbindelser (KCS)
som farge stabilisatorer i kjølelagret kjøttdeig undersøkt. Blandinger av ravsyre, pyruvat,
glutamat, eplesyre og sitronsyre i ulike kombinasjoner ble satt til kjøttdeig laget fra magert
storfekjøtt tilsatt svine- eller storfefett. Kjøttdeigen ble pakket i modifisert atmosfære eller høy
oksygen atmosfære i henholdsvis 13 og 8 dager. Utviklingen av lipid avledede flyktige
forbindelser var i stor grad påvirket av type fettvev. Lipid oksideringen øker når KCS
forbindelsene metaboliseres for å eliminere oksygen og for å holde fargen stabil. Økningen i
lipid nedbrytningsprodukter var for liten til å gi harsk smak og redusere ernæringsverdi. Den
positive effekten av KCS tilsetning på kjøttets fargen ansees som viktigere.

viii
I artikkel III og IV, ble det identifisert betydelige forskjeller i kvalitet for lamme- og sauekjøtt
fra tre produksjonssystemer. De utvalgte dyrene av ulike raser, alder og fra ulike beite regioner
reflekterte konsum og kulturelle vaner typisk for Bosnia og Hercegovina (B&H), Montenegro
(MN) og Norge. Dyr tilhørende autochtonous Pramenka rase (typene Vlašićka og Pivska) var
generelt mindre, med høyere fettinnhold, bedre mørhet (dog bare for kjøtt fra Bosnia og
Hercegovina), bedre farge stabilitet og antioksidant kapasitet sammenlignet med den
dominerende norske hvite rasen, som til gjengjeld utviste en bedre ernæringsmessig verdi.
Ytterligere differensiering av kjøttet fra observerte dyregrupper ble gjort ved hjelp av sensorikk
og instrumentelle metabolitt analyser. Profilene av flyktige og mindre flyktige komponenter
(metabolitter) fra hvert dyr ble beskrevet av bestemte forbindelser, som var isolert fra
henholdsvis fettvev og fra magert kjøtt. Store sensoriske og metabolitt forskjeller, særlig
mellom de to typer Pramenka typene, ble funnet. Dette tolkes som at stedet som sauen beiter på
har mye å bety og at disse forskjellene ikke nødvendigvis kan måles i antall km mellom beite-
stedene.
I artikkel V ble kvaliteten til en type spekede saueskinker produsert i Bosnia og Hercegovina
(B&H) og Montenegro (MN) etter gamle tradisjonelle oppskrifter i anlegg brukt i disse to
landene undersøkt. Resultatene for sensorisk, flyktige komponenter og organisk syre analyse
ble studert ved bruk av multivariabel analyse. Hvitløk og pepper som benyttes i saltefasen i
B&H sin spekeskinke produksjon hadde betydelig effekt på sensoriske profil samt på kjemiske
metabolitter. Intens røyking som benyttes i MN for å produsere deres tradisjonelle
sauespekeskinke, var kjennetegnet av intens røykt smak. Den undersøkte speketeknologien fra
B&H produserer lav-salt spekeskinker fra sau, tilsynelatende med et fermenteringstrinn, mens
MN sine spekeskinker fra sau produseres med høyere salt nivåer.

ix
Садржај
Оксидациони процеси који се одвијају у месу пост мортем утичу на стварање слободних
радикала. Дјеловање реактивних кисеоничних врста је уско повезано са енергетским
метаболизмом мишићне ћелије, активности митохондрија и ефикасности
антиоксидационог система. Улога митохондрија као природног антиоксиданта у ћелији
је испитивана. Биохемијске промјене у месу активиране оксидационим процесима
изазивају различите процесе омекшавања и формирања ароме.
У Раду I, предпостављени модел за њежност меса формиран је на основу мјерења
потрошње кисеоника рано пост мортем примјеном парцијалне регресије (објашњава
минимално 15-20% варијације у њежности говеђег меса у клаоничним условима).
Највећи изазов представља изолација митохондрија приближно 2.5 часа пост мортем на
линији клања. Експресије протеина из изолованих митохондрија у њежном и тврдим месу
је истраживана. Протеини митохондрија су раздвајани примјеном 2-димензионалне СДС-
ПАГЕ електрофорезе, док је обрада гелова извршена у програму „Делта2Д“. Протеини
од значаја су анализирани масеном спектрометријском техником (''МАЛДИ-ТОФ'' или
ЛЦ-МС). Већа респирација митохондрија и антиоксидативна активност, већа
концентрација протеина Кребсовог циклуса и система за транспорт електрона, као и
ензима неопходних за производњу енегрије су у корелацији са њежнијим месом.
У Раду II се испитује утицај супстрата Кребсовог циклуса, који су коришћени као
стабилизатори боје, на оксидационе процесе у охлађеном мљевеном месу током чувања.
Мјешавине сукцината, пирувата, глутамата, малата и цитрата у различитим
комбинацијама додате су мљевеном говеђем месу са свињском или говеђом масти,
пакованом у модификованој атмосфери или у атмосфери високе концентрације
кисеоника и чуваном у периоду од 13, односно 8 дана, респективно. На формирање
испарљивих деривата из масти у великој мјери утиче врста масног ткива. Оксидација
масти се повећава када су супстрати Кребсовог циклуса метаболизовани за уклањање
кисеоника и стабилизацију боје. Међутим, повећање је релативно, сувише мало да би

x
погоршало арому и нутритивна својства меса и компезовано је позитивним утицајем
субстрата Кребсовог циклуса на боју меса.
У Раду III и IV су идентификоване значајне разлике у својствима квалитета јагњећег и
овчијег меса животиња узгојених у три различита производна система. Одабране
животиње различитих раса, старости и узгајане у специфичним условима испаше
одражавају културолошке и навике у исхрани типичне за Босну и Херцеговину, Црну
Гору и Норвешку. Грла аутохтоне расе праменке (влашићки и пивски сој) су у основи
мања, са већим садржајем масти, њежнијим месом (само животиње и Босне и
Херцеговине), бољом стабилношћу боје и антиоксидационим капацитетом у односу на
тренутно доминантну норвешку бијелу овцу чије месо има бољу нутритивну вриједност.
Додатна диференцијација испитиваних група животиња је урађена на бази сензорских и
инструменталних анализа. Профили испарљивих компоненти и метаболита свих
испитаних група су описани специфичним компонентама изолованим из масног ткива,
односно меса, респективно. Велике разлике у сензорским својствима и у ароми између
два соја расе параменке су утврђене што указује на специфичност локалних
продукционих система.
У Раду V је испитивано суво саламурено овчије месо (бут) произведено у Босни и
Херцеговини и Црној Гори примјеном традиционалне рецептуре и у условима
производње типичним за ове двије земље. Резултати сензорских анализа, испарљивих
компоненти и органских киселина су изучавани примјеном мултиваријативних анализа.
Коришћење бијелог лука и бибера у фази усољавања у производњи суво саламуреног
овчијег меса (бут) у Босни и Херцеговини у значајној мјери је утицало на сензорска
својства и арому готовог производа. Интензивно димљење суво саламуреног овчијег меса
(бут) у Црној Гори је довело до интензивне ароме дима. Специфичан начин производње
суво саламуреног овчијег меса (бут) са ниским садржајем соли у Босни и Херцеговини је
очигледно праћен процесом ферментације, док суво саламурено овчије месо (бут) из
Црне Горе има већи садржај соли.

xi
List of papers
I. Grabež, V., Kathri, M., Phung, V., Moe, K. M., Slinde, E., Skaugen, M., Saarem, K., &
Egelandsdal, B. (2015) Protein expression and oxygen consumption rate of early
postmortem mitochondria relate to meat tenderness. Journal of Animal Science, 93(4),
1967-1979.
II. Yi, G., Grabež, V., Bjelanovic, M., Slinde, E., Olsen, K., Langsrud, O., Phung, V. T.,
Haug, A., Oostindjer, M. & Egelandsdal, B. (2015) Lipid oxidation in minced beef meat
with added Krebs substrates to stabilize color. Food Chemistry, 187, 563-571.
III. Bjelanović, M., Grabež, V., Vučić, G., Martinović, A., Lima, L. R., Marković, B., &
Egelandsdal, B. (2015) Effect of different production systems on carcass and meat
quality of sheep and lamb from Western Balkan and Norway. Journal of Biotechnology
in Animal Husbandry, 31(2), 203-221.
IV. Grabež, V., Bjelanović, M., Rohloff, J., Martinović, A., Berg, P., Tomović, V., Rogić,
B., & Egelandsdal, B. (2015) Characterization of sensory profile and metabolites of lean
lamb/sheep meat with flavour volatiles in adipose tissues: different breed, age and
production system. Ready for submission to Food Chemistry.
V. Stojković, S., Grabež, V., Bjelanović, M., Mandić, S., Vučić, G., Martinović, A., Håseth,
T. T., Velemir, A., & Egelandsdal, B. (2015) Production process and quality of two
different dry-cured sheep hams from Western Balkan countries. LWT – Food Science
and Technology, 64(2), 1217-1224.

xii
Abbreviations
ADP Adenosine di-phosphate
ANOVA Analysis of variance
ATP Adenosine tri-phosphate
DPPH 2,2-diphenyl-1-picrylhydrazyl / total antioxidant capacity
ES Electrical stimulation
ETS Electron transport system
FADH2 Reduced flavin adenine dinucleotide
FAME Fatty acid methyl esters
FCCP p-trifluoromethoxy carbonyl cyanide phenyl-hydrazone
GC/MS Gas chromatography mass spectrometry
HS-GC/MS Headspace gas chromatography mass spectrometry
HPLC High pressure liquid chromatography
LC/MS Liquid chromatography mass spectrometry
MALDI Matrix assisted laser desorption/ionisation
NADH2 Reduced nicotinamide adenine dinucleotide
OCR Oxygen consumption rate
PCA Principal component analysis
PLSR Part least square regression analysis
ROS Reactive oxygen species
SDS Sodium dodecyl sulphate
SOD Superoxide dismutase
TBARS Thiobarbituric acid reactive substances
TOF Time of flight

xiii
Contents
1. Introduction ……………………………………………………………………………….. 1
2. Objectives ………………………………………………………………………………..... 6
3. Theoretical background …………………………………………………………………… 8
3.1. From muscle to meat ……………………………………………………............. 8
3.1.1. Muscle structure …………………………………..................................... 8
3.1.2. Experimental units / muscles ……………………...................................... 9
3.2. Early postmortem biochemical pathways in the muscle system …....................... 10
3.2.1. Mitochondrial energy production …………………………....................... 11
3.2.2. Mitochondrial control over postmortem process ………………………… 13
3.2.3. Oxidative processes ……………………………………………………… 14
3.2.4. Lipid oxidation ………………………………………………………....... 14
3.2.5. Protein oxidation ………………………………………………………… 15
3.3. Factors affecting oxidative processes (tenderness/flavour) in meat …………...... 16
3.3.1. Pre-mortem factors ………………………………………………………. 16
3.3.2. Post-mortem factors ……………………………………………............... 19
3.3.3. Antioxidants ……………………………………………………............... 20
3.3.3.1. Endogenous antioxidants ………………………………………… 20
3.3.3.2. Exogenous antioxidants ……………………………...................... 21
3.4. Selected additives in meat industry ……………………………........................... 22
3.4.1. Pyruvate …………………………………………………………………... 22
3.4.2. Citrate (citric acid; E330) ……………………………………………….... 23
3.4.3. Glutamate (glutamic acid; E620) …………………………………............ 23
3.4.4. Succinate (succinic acid; E363) ………………………………………….. 24
3.4.5. Malate (malic acid; E296) ………………………………………………... 24
3.4.6. Lactate (lactic acid; E270) ………………………………………………... 25
3.5. Basic analytical methods in meat science and technology ……………………… 26

xiv
3.5.1. Warner Bratzler measurements …………………………………………... 26
3.5.2. Meat colour ………………………………………………………………. 27
3.5.3. Water binding/ cooking loss ………………………………………............ 27
3.6. Statistical analysis ……………………………………………………………… 27
4. Methodology …………………………………………………………………………….... 29
4.1. Direct volatile (headspace) analysis .…………………………………………… 29
4.2. Gas chromatographic metabolite analysis following derivatization .…………… 30
4.3. Sensory analysis ………………………………………………………………… 30
4.4. Proteomic studies ……………………………………………………………….. 31
5. Main results and discussion ……………………………………………………………….. 33
6. Conclusions ……………………………………………………………………………….. 38
7. Future perspectives ………………………………………………………………………... 39
References ………………………………………………………………………………… 41
Papers (individual numbering)

QUALITY CHANGES IN LAMB/SHEEP AND BEEF MEAT RELATED TO OXIDATIVE PROCESSES IN MUSCLE SYSTEMS
KVALITETSENDRINGER I LAM/SAU OG STORFEKJØTT RELATERT TIL OKSIDATIVE PROSESSER I MUSKELSYSTEMER
LIST OF ERRATA
Written Should be
Page xiii, Line 8 postmortem post mortem
Page xiii, Line 10 postmortem post mortem
Page 6, Line 7 post mortem post mortem
Page 11, Line 14 (Huang & Lametsch) (ETS)
Page 14, Line 9 (Huang & Lametsch) (ETS)
Page 22, Line 10 (Andrés, Cava, Mayoral, Tejeda, Morcuende, & Ruiz, 2001)
(Cu)
Page 30, Line 20 can accurately way can accurately
Page 35, Line 4 from microbial metabolites from microbial metabolism
Page 38, Line 11 strategies how for strategies for
Page 40, Line 6 the metallic flavour the bitter flavour
Paper I, page 1969 Line 3 O2 O2
Paper I, page 1971 Line 39 OCR3-4 h OCR3-4 h
Paper III, page 204 Line 5 The purcase motives The purchase motives
Paper III, page 205 Line 3-4 of C18:3 (n-3) fatty acids and intensity of acid taste
of C18:1 (t-11) fatty acid
Paper III, page 206 Line 1 Longisimus thoracis at lumborum Longissimus thoracis et lumborum

Paper III, page 210 Line 20 samples lower protein content samples had lower protein content
Paper III, page 210 Line 30 dependent depend
Paper III, page 213 Line 17 isinteresting is interesting
Paper III, page 214 footnotes differencesat differences at
Paper III, page 214 Line 4 NWS NO
Paper III, page 215 Line 26 VP lamb B&H lamb
Paper III, page 215 Line 37 PS meat B&H meat
Paper IV, page 14 Line 310 (P ≤ 0.05) (P < 0.05)
Paper IV, page 29 Line 657 BH ord BH lamb

1
1. Introduction
Meat consumption and the inclusion of different species of meat-producing animals in the diet
are strongly related to the ethnic, cultural and religious backgrounds. Growing demands from
consumers for specific quality characteristics of meat drive the industry towards new knowledge
about underlying mechanisms which affect the final quality.
From consumers’ perspective, meat quality is defined by “eating quality characteristics”.
Tenderness and flavour appear to be the most important sensory attributes in consumers’
perception of meat quality (Joo, Kim, Hwang, & Ryu, 2013), in particular for meat from
ruminants. Variations in meat quality are related to pre-slaughter factors, including genetics,
diet, management practices, environmental conditions, and in addition post-slaughter handling
and processing (Mullen, Stapleton, Corcoran, Hamill, & White, 2006). In individual consumer
assessment, the most valuable beef sensory attribute is tenderness. A set of complex
biochemical reactions during conversion of muscle to meat is strongly related to the final meat
quality (Paredi, Raboni, Bendixen, de Almeida, & Mozzarelli, 2012). Controlled meat texture
is the key priority for the red meat industry (Mullen et al., 2006). Some studies show that
consumers are willing to pay more for tender meat (Boleman, Boleman, Miller, Taylor, Cross,
Wheeler, et al., 1997; Huffman, Miller, Hoover, Wu, Brittin, & Ramsey, 1996).
Consumers’ perception and acceptance of ruminant meat are related to the flavour
characteristics (Watkins, Frank, Singh, Young, & Warner, 2013), although quantity of
intramuscular fat and slaughter weight of animal could affect eating quality (Guerrero, Valero,
Campo, & Sañudo, 2013). Sheep meat characterized by its unique flavour presents an obstacle
for some consumers (Watkins et al., 2013). Animal feeding systems affect fatty acid
composition of ruminant adipose and muscle tissue (Prache, 2009). Lipid oxidation products,
lipid- and water-soluble components (Melton, 1990), may affect characteristic meat flavour.
Adipose tissue is the main source of volatile compounds responsible for the species-specific
flavour. In addition, formation of off-flavour and off-odours may be associated with microbial
growth and meat spoilage. The accumulation of microbial metabolites, such as alcohols,

2
aldehydes, acids, amines, ketones, esters, and sulphur compounds may make the meat
unacceptable for consumers (Ercolini, Ferrocino, Nasi, Ndagijimana, Vernocchi, La Storia, et
al., 2011).
This thesis partly focuses on tenderization mechanisms governed by mitochondria and the
activity of complex antioxidant system at early post mortem conditions. Prolonged
mitochondrial activity preserves proteases’ activities, modulates cell death (apoptosis/necrosis
switch) and thereby increases meat tenderness. Further studies were focused on identification
of biomarkers significant for flavour development in a different muscle system during the post
mortem period.
In general, of practical importance for a stabile meat production system is the establishment of
a suitable combination of breeds adapted to specific environmental conditions, with optimal
growth performance and increased uniformity contributing to acceptability of meat and meat
products. In addition, the combined effect of breed and environmental conditions of meat
quality are of specific interest to enhance market opportunities.
Cattle production in Norway combines different systems such as milk and meat production and
bull production, raised under semi-extensive or extensive systems. Feeding is 50% silage/
roughage and concentrate. However, beef production in Norway is based predominantly on
“dual-purpose” Norwegian Red Cattle (Norsk Rødt fe; Fig.1).
Figure 1. Norwegian production of beef meat (Source: Haugen, 2014). Minor breeds are not
coded.

3
The Norwegian Red Cattle has been bred for important health and reproductive performances,
feed efficiency, combining superior milk together with meat production (Kirkland, Patterson,
Keady, Moss, & Steen, 2007). Furthermore, like most meat breeds, Charolais is produced
predominantly for its meat, or more precisely, its large muscles. On the other hand, dominance
of Norwegian Red Cattle in beef meat production is balanced with milk production and the
quality characteristics (e.g. colour and tenderness).
Figure 2. Dominant cattle breeds in: 1.) Norway (Norwegian Red Cattle); 2.) Montenegro
(Brown Swiss); and 3.) Bosnia and Herzegovina (Simmental)
(Source: http://www.genoglobal.com/Start/Norwegian-Red/about-norwegian-red/Norwegian-
red-breeding-program/; http://brownswiss.org.nz/brown swisshistory.htm;
http://cattleinternationalseries.weebly.com/simmental.html).
Ruminant production in Western Balkan countries is greatly influenced by environmental
conditions, i.e. natural resources. Cattle production systems in Montenegro and Bosnia and
Herzegovina are related to the farm production and combined farm/pasture feeding systems (4-
1.) 2.)
3.)

4
6 months grazing period). Dominant breeds are Brown Swiss, Holstein, Simmental, Tyrol Gray,
Buša, and crossbreeds (Alibegovic-Grbic, 2009; Rajović & Bulatović, 2014).
Buša is an autochthonous breed from the Balkan Peninsula, with a relatively low live weight,
high fertility, and high disease resistance (Jovanovic, Savic, & Trailovic, 2003). Domestic breed
Gatačko cattle as a crossbreed of Buša and Tyrol Gray represents a small cattle population in
Bosnia and Herzegovina (Alibegovic-Grbic, 2009). Similar to Norway, beef meat production in
Western Balkan countries is connected to dairy production and fattening of calves for
slaughtering, if not needed for reproduction and milk production. These breeds are medium
sized, adopted to pasture feeding regime with efficient conversion of food into proteins (Rajović
& Bulatović, 2014).
Norwegian lamb/sheep production is dominated by Norwegian White, a crossbreed composed
of Dala, Rygja, Steigar, and Texel breeds, for meat and wool production (Eikje, Ådnøy, &
Klemetsdal, 2008).
Figure 3. Dominant sheep breeds/types in: 1.) Norway (Norwegian White sheep); 2.)
Montenegro (Pivska Pramenka), and 3.) Bosnia and Herzegovina (Vlašićka Pramenka) (Source:
Christie, 2007; http://see.efncp.org/download/sofia2013/Montenegro.pdf; Alibegovic-Grbic,
2009).
1.) 2.)
3.)

5
It was accepted as a new breed in 2000/2001. Sheep farming meets consumers’ demands
through traceability, respecting ethical production values, and aims to provide unique meat
quality. The economic advantage of Norwegian White is related to higher muscularity compared
to Dala breed, high fertility and growth rate (Eikje et al., 2008). Highly appreciated on the
Norwegian market is the Gourmet lamb meat, which originates from animals raised in
Hallingskarvet mountain region in southern Norway. Although the meat carries an origin label
that signals a special meat quality, the real quality properties are not well documented.
Sheep and lamb production in Western Balkan countries is predominantly a nomadic
production, especially in mountain areas with dominant autochthonous triple-purpose Pramenka
breed (Zackel sheep), reared for meat, milk, and wool (Gavojdian, Cziszter, Sossidou, & Pacala,
2013). Dominant types of Pramenka breed in Montenegro are Pivska and Sjenička, while
Vlašićka (Dubska), Privorska, Kupreška, Stolačka and Podveleška are dominant in Bosnia and
Herzegovina. As a primitive breed, Pramenka is adapted to almost exclusive pasture feeding in
rough environmental conditions (Alibegovic-Grbic, 2009; Dubljević, 2009) together with high
resistance to parasite infections (Savić, Baltić, Becskei, Dimitrijević, Dimitrijević, Savić, et al.,
2014).

6
2. Objectives
Figure 4. The picture links ruminants used from Norway and Western Balkans, the meat quality
and the meat processing studies (the grey square is a Short Paper VI that is not included in the
thesis). In addition, Fig. 4. shows how the papers are linked to each other. Ruminants presented
in Fig. 4. are: 1.) Norwegian Red Cattle; 2.) Norwegian White Sheep; 3.) Vlašićka Pramenka;
and 4.) Pivska Pramenka, respectively.
The five papers have the following specific objectives:
I. The proteomic study of mitochondria isolated ~ 2.5 h post mortem from the muscle
system was set up to identify their protein modifications and relation to beef meat
tenderization processes based on mitochondrial oxygen consumption early post
mortem.
1.) 2.) 3.) 4.)

7
II. Krebs cycle substrates, as stabilizers of meat colour, were tested regarding whether they
accelerate or suppress lipid oxidation in beef meat packed in low (60% CO2 and 40%
N2) and high (75% O2 and 25% CO2) oxygen atmosphere at different storage conditions.
III. The meat and carcass quality characteristics and oxidative stability of lamb/sheep meat
from different production systems, breed, and age were examined.
IV. Oxidation progression and metabolic status and its relation to sensory properties of
meat.
V. The characteristics of sheep ham produced using different process technologies were
studied. This was achieved by analyzing flavour compounds and metabolites developed
with respect to production process.
According to our knowledge, the mitochondrial activity and protein modification early post
mortem (isolated ~ 2.5 h post mortem) had not been examined previously with regard to its
relation to tenderness. Of special interest are several enzyme complexes of the electron transport
chain for studies of early post mortem events.
Similarly, the in vitro consumption of oxygen by the electron transport chain post mortem had
not been examined before regarding oxidation progress and production of reactive oxygen
species.
An effort was made to understand the quality of the meat from Pramenka breed, from the farm
to a ready product, such as dry cured sheep. The focus was on lipid oxidation, energy
metabolites, Krebs cycle compounds and amino acids. The sensory properties of two types of
Pramenka breed were investigated. Knowledge about the quality of meat from the Pramenka
breed is close to non-existing in the scientific literature.

8
3. Theoretical background
3.1. From muscle to meat
The conversion of muscle to meat starts with animal bleeding. The blood circulation is
interrupted: loss of oxygen and nutrients transfer to the muscle cells leads to anaerobic
metabolism. Levels of ATP production still remain low early post mortem. As a result of
anaerobic glycolysis lactic acid is formed and the muscle pH declines from 7.44 to
approximately 5.3−5.8. Cooling the carcasses too quickly may trigger a powerful contraction
of muscle causing a toughening effect known as cold shortening when it is thawed. A rapid pH
decline at body temperature results in greatly reduced water holding capacity and loss of colour
stability, as commonly observed for pork meat and is termed PSE-meat (Pale Soft and
Exudative). Thicker fat layers may prevent cold shortening during chilling, fast enzyme
inactivation and improve tenderization process in the muscle system (Savell, Mueller, & Baird,
2005).
3.1.1. Muscle structure
Characteristics of skeletal muscles are influenced by various genetic and environmental factors.
Skeletal muscles are composed (75−90% of the muscle volume) of different types of fibers
(Lee, Joo, & Ryu, 2010). The morphological, contractile, and metabolic properties of muscle
fibers have a direct effect on muscle biochemical pathways in ante- and post mortem period and
characterize the differences between skeletal muscles or/and carcasses (Klont, Brocks, &
Eikelenboom, 1998). There are four different fiber types: type I (slow-twitch, oxidative), type
IIA (fast-twitch, oxidative and glycolytic), types IIB and IIX (fast-twitch, glycolytic) (Joo et al.,
2013). Muscle fiber types’ composition correlates with type of mechanism involved in the
conversion of muscle to meat and the final meat quality. Muscle fiber type IA is rich in
myoglobin and mitochondria with high oxidative mitochondrial enzyme activity, while type IIB
has a high content of glycogen and glucose and a high glycogen enzyme activity (Choe, Choi,
Lee, Shin, Ryu, Hong, et al., 2008).

9
3.1.2. Experimental units / muscles
Variation in meat quality may be large within animals, breed and production system and is
affected by different metabolic factors (Klont et al., 1998). Thus the composition of muscle
fiber types may provide large variation in post mortal biochemical processes and quality
characteristics (Klont et al., 1998; Waritthitham, Lambertz, Langholz, Wicke, & Gauly, 2010).
Different muscle types showed large variations in tenderness (Von Seggern, Calkins, Johnson,
Brickler, & Gwartney, 2005). The round muscles were described as less tender compared to
loin and chuck muscles, but from the perspective of the consumer, often appreciated as having
a better quality (Hildrum, Rødbotten, Høy, Berg, Narum, & Wold, 2009; Voges, Mason,
Brooks, Delmore, Griffin, Hale, et al., 2007). Improved tenderness of round muscles such as M.
semimembranosus would have a great impact on consumers’ acceptability (Miller, Carr,
Ramsey, Crockett, & Hoover, 2001; Voges et al., 2007).
M. semimembranosus is a large round muscle primarily used during locomotion, and shows
relatively large variation of sensory traits (Reuter, Wulf, & Maddock, 2002). According to
Hwang, Kim, Jeong, Hur, & Joo (2010) a relatively high degree of type IIB fibers is present in
bovine semimembranosus muscle.
The M. longissimus thoracis et lumborum (loin, LTL) is a back muscle, generally accepted as a
tender muscle, and often studied and used as a reference muscle for quality assessment of other
muscles and classification of carcasses in tenderness groups (Polkinghorne, Thompson, Watson,
Gee, & Porter, 2008). Peinado, Latorre, Váquez-Autón, Poto, Ramírez, López-Albors, et al.
(2004) reported high percentage of type IIB fibers with intense oxidative activity in the loin
sheep muscle (53%) and of 90 days old lamb (59%).

10
3.2. Early post mortem biochemical pathways in the muscle system
Energy is produced in the in vivo cell through the conversion of glucose into pyruvate and by
the Krebs cycle and oxidative phosphorylation. In post mortem phase, the cell is mainly fuelled
with energy obtained through glycogen degradation by glycolysis to lactate (D'Alessandro &
Zolla, 2013). Metabolic processes in the early post mortem period are presumed to be
determinants of meat quality (Herrera-Mendez, Becila, Boudjellal, & Ouali, 2006; Klont et al.,
1998; Lee, 1986; Luciano, Anton, & Rosa, 2007). Complex biochemical reactions during
tenderization are mediated by a particular group of enzymes (Koohmaraie, 1994, 1996; Luciano
et al., 2007; Takahashi, 1996). The enzymes cathepsins, calpains, multicatalytic proteinase
complex (MCP) and caspases have been designated roles at different time points in the
tenderization process (Herrera-Mendez et al., 2006; Kemp, Sensky, Bardsley, Buttery, & Parr,
2010; Ouali, Herrera-Mendez, Coulis, Becila, Boudjellal, Aubry, et al., 2006).
A possible route of conversion of muscle into meat was observed from the perspective of
programmed cell death – apoptosis. This concept recognizes a central role of mitochondria in
the cells’ response to oxidative stress early post mortem. Apoptosis presents a normal
mechanism and its function is to maintain cells during ageing in the living organism (Ouali,
Herrera-Mendez, Coulis, Becila, Boudjellal, Harhoura, et al., 2007). The key role of apoptosis
is in the elimination process of cells damaged by reactive oxygen species (Elmore, 2007; Ouali
et al., 2007). A critical point in apoptosis involves caspase activation that depends on controllers
(i.e. B-cell lymphoma 2, Bcl-2) (Nicotera & Melino, 2004). Intracellular energy (ATP) level
maintained from the respiratory chain and the glycolytic process will affect the mode of the cell
death (Leist, Single, Castoldi, Kühnle, & Nicotera, 1997). Overexpression of glycolytic and
Krebs cycle enzymes early post mortem indicates great aerobic and anaerobic energy
metabolism (Jia, Hildrum, Westad, Kummen, Aass, & Hollung, 2006). In addition, necrosis is
considered as another mechanism of cell death, but is morphologically and biochemically
different from apoptosis. Extreme conditions (i.e. hypoxia) will lead to rapid exhaustion of
energy, extensive tissue damaging, cell lysis and necrosis (Nicotera, Leist, & Ferrando-May,
1998).

11
3.2.1. Mitochondrial energy production
Mitochondria are organelles of eukaryotic cells responsible for the energy production (ATP)
through oxidative phosphorylation. Cell respiration occurs through three main metabolic
pathways: glycolysis, Krebs cycle, and mitochondrial electron transport system. The key
importance of these pathways is in energy production with wide range of other cellular functions
(Fernie, Carrari, & Sweetlove, 2004).
Figure 5. Mitochondrial energy production is located in the matrix.
The Krebs cycle (Fig. 6), located in the mitochondrial matrix is a chain of chemical reactions
that contributes to ATP production by producing NADH. The first stage in aerobic energy
production is degradation of proteins into amino acids, fats to fatty acids and carbohydrates to
hexoses. Oxidized substrates are transferred through inner mitochondrial membrane (IMM) to
the matrix as pyruvate, further converted into acetyl CoA (Nazaret, Heiske, Thurley, & Mazat,
2009). Energy rich molecules, reduced nicotinamide adenine dinucleotide (NADH) and flavin
adenine dinucleotide (FADH2) donate electrons to the electron transport system (Huang &
Lametsch), composed of respiratory complexes I-V (Fig. 7). The NADH, dominantly produced
in the Krebs cycle, donate reducing equivalence to complex I (NADH dehydrogenase complex).
The second molecule, FADH2 generated from succinate, donates electrons to complex II

12
(succinate dehydrogenase). Electron transfer generates an electrochemical gradient generation
across the IMM. Phosphorylation of ADP into ATP is a function of complex V (ATP-ase; Bratic
& Trifunovic, 2010).
Figure 6. The sugars, fats and proteins are completely oxidized in various metabolic pathways
within mitochondria. Glycolysis converts glucose into pyruvate with the production of ATP. A
series of 8 biochemical reactions (Krebs cycle) convert pyruvate to high-energy molecules
(NADH and FADH2) that are fuelled into the electron transport system.

13
Figure 7. Four protein structures of electron transport system (ETS) involved in generation of
an electrochemical gradient and the fifth protein for ATP production are located in the inner
mitochondrial membrane. Mitochondrial complexes I, II, III, IV and V are marked with roman
letters. Cross-circle represents some common ETS inhibitors and an uncouple FCCP, tick
arrows show reducing equivalents, medium arrows show redox reactions and thin arrows show
the flow of electrons. ETF – electron transferring flavoproteins; C – cytochrome C; Q −
ubiquinone (Source: Phung, Khatri, Liland, Slinde, Sørheim, Almøy, et al., 2013)
3.2.2. Mitochondrial control over post mortem process
Mitochondria are involved in a number of cellular processes: cell cycle regulation, oxidative
stress, and cell death (Sierra & Oliván, 2013). It is well known that mitochondria, during a
normal respiration or reduced oxygen, produce less beneficial reactive oxygen species (ROS).
The main sources of electron leak and ROS production are complex I and III (Bratic &
Trifunovic, 2010). Although ROS generation is related to many sources, mitochondria produce
approximately 90% of all reactive oxygen species (Balaban, Nemoto, & Finkel, 2005).
Activation of enzymatic and non-enzymatic antioxidants leads to ROS detoxification that
prevents mitochondrial damage and oxidative stress (Turrens, 2003). If normal mitochondrial
respiration is disrupted, ROS accumulation leads to oxidative stress and oxidation of cellular
proteins and lipids. Therefore, mitochondria have a pivotal role in metabolic pathway when cell
death catabolism (apoptosis/necrosis) is triggered by oxidative stress (Chandra, Samali, &
Orrenius, 2000; Proskuryakov, Konoplyannikov, & Gabai, 2003; Sierra & Oliván, 2013)
influencing quality changes, i.e. flavour and tenderness. Immediately after slaughtering, the

14
programmed cell death (apoptosis) undergoes further morphological changes in muscle cells
(Elmore, 2007).
3.2.3. Oxidative processes
Oxidative mechanisms and proteolysis are responsible both for tenderness and for flavour
development (Ouali et al., 2006). The autocatalytic process in the muscle system starts
immediately after death; free radicals are generated by the mitochondrial enzymatic system
affecting apoptosis and complex oxidative processes. As mentioned above, mitochondrial
respiration is the main source of ROS. The molecular oxygen is still consumed the first few
hours post mortem by the mitochondrial electron transport system (Huang & Lametsch) which
also forms various radicals (Ott, Gogvadze, Orrenius, & Zhivotovsky, 2007). The level of ROS
will promote oxidation processes that affect flavour development and proteolysis (Bekhit,
Hopkins, Fahri, & Ponnampalam, 2013). The increased accumulation of ROS provided by
reduced ability of ETS to oxidize molecular oxygen immediately after slaughtering and during
post mortem period leads to disruption of lipid membranes and damaging of mitochondrial
metabolism (Ouali et al., 2006).
3.2.4. Lipid oxidation
The interaction between pre-slaughter phase conditions (stress level) and post-slaughtering
factors (pH decline, chilling conditions, and electrical stimulation) will affect oxidative
processes (Morrissey, Sheehy, Galvin, Kerry, & Buckley, 1998). Lipid oxidation appears to be
affected by breed, muscle type, diet, age, sex, and the fatty acid composition of the meat
(Kanner, 1994; Rhee, Anderson, & Sams, 1996). The polyunsaturated fatty acids (PUFAs) are
the first targets of ROS and which leads to lipid oxidation.
The oxidative processes are implicated in several changes in meat quality due to lipid and
protein oxidation, having both desirable and undesirable effects (Bekhit et al., 2013). Thermo-
oxidation of the lipid fraction promotes formation of a range of volatile products, some desirable
for meat flavour (Kanner, 1994). The undesirable effect of lipid oxidation is related to formation

15
of off-flavour. The number of volatile compounds generated by lipid oxidation includes
hydrocarbons (alkane and alkene), carbonyls (aldehydes and ketones), alcohols, carboxylic
acids and esters (Ba, Hwang, Jeong, & Touseef, 2012; Min & Ahn, 2005). Certain products may
contribute to rancid flavour and odour. The interaction of lipid oxidation products with proteins
compromises its stability and function (Lynch, Faustman, Silbart, Rood, & Furr, 2001).
Figure 8. Schematic overview of lipid oxidation associated with undesirable changes in meat.
3.2.5. Protein oxidation
Protein oxidation in post mortem muscle is recognized as a significant factor for meat quality.
The protein oxidation will lead to formation of carbonyl derivates, disulfide cross-links, and
reduced activity of proteolytic enzymes (Bekhit et al., 2013; Huff Lonergan, Zhang, &
Lonergan, 2010). In addition, these processes affect tenderization and modify metabolic
pathway post mortem. According to Rowe, Maddock, Lonergan, & Huff-Lonergan (2004)
tenderization of beef meat can be significantly reduced by increased protein oxidation during

16
the first 24 hours post mortem. The primary and secondary products of lipid oxidation promote
protein oxidation and degradation. Peptides and amino acids formed by proteolysis clearly
affect meat flavour, directly or by acting as precursors of flavour development (Gorbatov &
Lyaskovskaya, 1980; Sentandreu, Stoeva, Aristoy, Laib, Voelter, & Toldrá, 2003). During the
ageing period, the antioxidative defense of the muscle system decreases, while ROS and other
oxidative species accumulate.
3.3. Factors affecting oxidative processes (tenderness/flavour) in meat
Meat flavour and tenderness biochemistry are largely influenced by pre mortem and post
mortem factors. In agreement with approach “from farm to fork” each step in the production
chain presents potential critical control point. Differences in oxidizing processes in a post
mortem phase may increase due to differences in feeding regime, genetic, stress resistance,
transportation, starvation, carcass manipulation, muscle type, etc.
3.3.1. Pre-mortem factors
Numerous factors, such as on-farm (nutrition, management practices, environmental
conditions) and pre mortem factors (genetic, age, live weight), influence the development of
ruminant meat traits. Production systems, observed as a multiple-factor effect, can induce
differences in growth rate, fat content, fatty acid composition, and muscle energy status
affecting final meat quality (Webb & Erasmus, 2013). An increased activity of animals relates
to the abundance of different metabolites in a muscle system (Terlouw & Rybarczyk, 2008).
Thus biochemical and oxidative processes in a muscle system are influenced by nutrient and
caloric characteristics of feed (Bekhit et al., 2013; Gerhart-Hines, Rodgers, Bare, Lerin, Kim,
Mostoslavsky, et al., 2007). Different environmental conditions of ruminant production may or
may not improve meat quality traits. Extensive growth conditions, diet composition and feed
availability, may significantly affect changes in energy metabolism, i.e. higher glycogen level.

17
Feeding systems, either based on grazing or on feeding on concentrate, are common for
ruminants (Bouwman, Van der Hoek, Eickhout, & Soenario, 2005). High or low energy diet
and pre-slaughtering fasting period determine the utilization of glycogen in the muscle system.
McVeigh & Tarrant (1982) suggested that high-energy diet protects glycogen from fast
depletion and provides higher concentration of residual glycogen in a muscle system when
animals/heifers have been exposed to stress conditions. Animals fed on a high-energy diet are
supposed to have higher glycogen levels which provide lower ultimate pH and more tender meat
during pre-slaughter stress conditions (Devine, Graafhuis, Muir, & Chrystall, 1993). On the
other hand, meat flavour can also vary with respect to the animal feeding system. Meat flavour
of ruminants from pasture feeding system is often described as “pastoral” or “wild” and
considered both as positive and negative attribute depending of the consumers’ preferences
(Sañudo, Nute, Campo, María, Baker, Sierra, et al., 1998). Lamb fed with concentrate has
showed superior sensory qualities (lower intensity of undesirable flavour, stronger lamb flavour
and better tenderness) than pasture-fed animals (Resconi, Campo, Furnols, Montossi, &
Sañudo, 2009). In a similar study Resconi, Campo, Font i Furnols, Montossi, & Sañudo (2010)
reported negative effects of high-energy diet (concentrate-fed animals) on beef flavour and meat
tenderness. Differences in sensory attributes are related to various factors such as pre-slaughter
handling of animals and/or post-slaughter manipulation of the carcass.
Genetics/breed is a complex source of carcass variation related to morphology and tissue
characteristics. The total phenotype variation, genetic effect on beef quality traits, is
approximately 5 − 30% (Warner, Greenwood, & Ferguson, 2011). In general, breed has a minor
influence on sheep flavour compared to the feeding regime (Duckett & Kuber, 2001). New
breeds, sometimes called synthetic breeds, may be less susceptible to pre-slaughter stress, i.e.
during and after transportation, because they can adapt to environmental conditions (Mpakama,
Chulayo, & Muchenje, 2014) if built into the breeding goals.
Live weight and age are often observed together, and greater weight implies older animals,
except when the animals are exposed to feed restrictions (Guerrero et al., 2013). Sañudo,
Alfonso, Sanchez, Berge, Dransfield, Zygoyiannis, et al. (2003) could not find differences in
tenderness between lamb types by age alone, because neither chronological age nor

18
physiological maturity presents accurate predictor of lamb meat tenderness. Tough meat is often
related to older and heavier lambs (Abdullah & Qudsieh, 2009) although muscle type and pH
have significant effects. On the other hand, heavier carcasses showed more tender meat because
of higher fat content (Landim, Castanheira, Fioravanti, Pacheco, Cardoso, Louvandini, et al.,
2011; Martı nez-Cerezo, Sañudo, Panea, Medel, Delfa, Sierra, et al., 2005).
Generally, greater amount of fat (or high energy diets) is associated with more tender ruminant
meat. Light lamb carcasses with low subcutaneous fat thickness have much less marbling and
may suffer a negative effect of chilling rate, while fatter carcasses are noticeably protected
(Savell et al., 2005). Fat tissue possibly has more of an indirect effect on meat tenderness than
a causative one. The effect of intramuscular fat on tenderness is generally small, but due to its
link to sensory juiciness, it is very important to have some intramuscular fat (Sañudo, Enser,
Campo, Nute, Marı a, Sierra, et al., 2000).
Pre-slaughter manipulation (loading of animals, transportation, unloading in the slaughterhouse,
slaughtering procedure and fasting period) of animals involves a number of stressful events.
The stress activates hormonal mechanism, i.e. adrenaline, breakdown of glycogen and increased
rate of glucose utilization in a muscle system is observed. In addition, stress hormones will
induce protein catabolism, increasing the level of free amino acids (Hogan, Petherick, &
Phillips, 2007). The type of diet and the level of stress animals are exposed to pre mortem will
have strong impact on post mortem metabolism in muscle tissue. Daly, Young, Graafhuis,
Moorhead, & Easton (1999) reported that grain fed cattle had 20% higher pre-slaughter
glycogen level compared to pasture fed animals, although ultimate pH was low for both groups.
In general, during the post mortem period, low glycogen reserves will lead to lower lactic acid
content and high ultimate pH (Terlouw et al., 2005). Limited acidification (higher ultimate pH)
has a profound effect on the tenderization mechanism (Hogan et al., 2007). Furthermore, Li,
Wang, Mao, Zhang, Niu, Liang, et al. (2014) reported that each of the pre-slaughter factors, i.e.
diet, pre-slaughter stress, and lairage time, can explain only 50% of variation in the ultimate
pH.

19
3.3.2. Post-mortem factors
Electrical stimulation (ES) of a hot carcass immediately after slaughtering initiates increased
pH decline and anaerobic glycolysis (Mombeni, Mombeini, Figueiredo, Siqueira, & Dias, 2013;
Savell et al., 2005). The application of ES is linked to rapid rigor mortis and prevention of cold
shortening when carcasses are cooled below 10 °C (Tornberg, 1996). Nevertheless, low voltage
(and high) ES enhances tenderness due to ATP depletion and prevention of muscle contraction
in cold storage (Adeyemi & Sazili, 2014). In addition, the magnitude of changes induced by ES
may be affected by pre- and post-slaughtering manipulation steps and/or differences between
individual carcasses and muscles (Adeyemi & Sazili, 2014).
The chilling phase is considered important in meat processing since it reduces post mortem
glycolysis, pH decline, and microbial growth giving an extended shelf life. Phung et al. (2013)
suggested a positive effect of rapid chilling on colour stability maintaining mitochondrial
oxygen consumption after storage with possible negative effect on meat tenderness.
The quality of fresh meat, i.e. odour, texture and flavour, can be affected by storage temperature,
oxygen concentration, endogenous enzymes (lipolysis and proteolysis), microbial growth, and
oxidation processes (Zhou, Xu, & Liu, 2010). Packaging of fresh meat in high oxygen
atmosphere (20% CO2 and 80% O2) accelerates lipid and protein oxidation processes involved
in generation of typical off-flavours and odours (Mohamed, Jamilah, Abbas, & Rahman, 2008;
Zakrys-Waliwander, O'Sullivan, Walsh, Allen, & Kerry, 2011) and increased level of protein-
crosslinks with decreased tenderness (Lund, Heinonen, Baron, & Estévez, 2011; Lund, Hviid,
& Skibsted, 2007), respectively. However, modified atmosphere (CO2, N2, CO2/N2) prevents
microbial growth and extends the shelf life maintaining oxidation processes at lower level
(Jongberg, Wen, Tørngren, & Lund, 2014; Zakrys, Hogan, O’Sullivan, Allen, & Kerry, 2008).

20
3.3.3. Antioxidants
Antioxidant defense system of the muscle tissue is a complex system equipped with various
enzymes and antioxidants that protect cells from ROS attack. System of endogenous
antioxidants prevents uncontrolled formation of free radicals and their reaction with biological
structures (Chaudière & Ferrari-Iliou, 1999). Natural (exogenous) antioxidants incorporated in
a muscle system, within cell membranes, through dietary delivery retard lipid and protein
oxidation, preserve the colour and prevent rancid flavour development in fresh and stored meat
(Descalzo & Sancho, 2008). Pasture feeding increases the level of natural antioxidants; the most
powerful being tocopherols (Descalzo & Sancho, 2008). Additionally, supplementation of diet
with vitamin E can improve oxidative stability, although benefits of vitamin supplementation
may vary with animal species, diet and muscle type (Castillo, Pereira, Abuelo, & Hernández,
2013).
3.3.3.1. Endogenous antioxidants
In vivo mitochondria have a crucial role in metabolic processes regulating the balance between
free radical generation and antioxidant defense. Naturally high antioxidant capacity of the
organelle is related to several antioxidant enzymes, i.e. superoxide dismutase (SOD), catalase,
thioredoxin reductase, peroxiredoxin, and selenium-glutathione peroxidase (GSHPx) (Masella,
Di Benedetto, Varí, Filesi, & Giovannini, 2005). The superoxide dismutase enzymes in animal
tissue may be present as mitochondrial matrix enzyme Mn-SOD and mitochondrial/cytosol
Cu/Zn-SOD. A reactive molecule of superoxide can be converted to hydrogen peroxide by SOD
and further to oxygen and water by catalase or glutathione peroxidase (GPx) (Milbury & Richer,
2008). In mammalia, the GSHPx family are involved in cellular, extracellular, phospholipid
hydroperoxide, and gastrointestinal selenoproteins (Arthur, 2000). Daun & Åkesson (2004)
reported significance of both soluble and total content of selenium for GSHPx activity.
Some studies have suggested a relation between endogenous antioxidant activity in a muscle
system and genotype component. Hernández, Zomeño, Ariño, & Blasco (2004) reported the
effect of genotype on SOD and catalase activity in pork meat, while GSHPx was not affected.

21
Differences of antioxidant enzymes activity appeared in different muscles depending on the
post-slaughter conditions (Pastsart, De Boever, Claeys, & De Smet, 2013). The relation between
antioxidative mechanism of the cell and diet has been investigated but is not fully understood.
Pasture finishing diet showed positive effect on SOD activity, negative effect on GPx activity
in beef meat, while catalase were not diet dependent (Mercier, Gatellier, & Renerre, 2004).
Furthermore, Petron, Raes, Claeys, Lourenço, Fremaut, & De Smet (2007) reported the effect
of different pastures on antioxidant enzyme activities of lamb meat, i.e. type of pasture affected
GPx activity, but had no effect both on SOD and catalase activity. In stressed conditions cell
mitochondrial antioxidant system has limiting efficiency when ROS production is enhanced
(Masella et al., 2005).
3.3.3.2. Exogenous antioxidants
Diet rich in plants is a significant source of bio-active substances affecting activity of
antioxidant enzymes in a muscle system (Park, Kang, Shin, & Shim, 2015). Pasture feeding is
often associated with the efficient exogenous antioxidants such as vitamin E, ascorbic acid,
carotenoids and flavonoids. Uptake of additional antioxidant agents as dietary supplements
increase the cell protection scavenging ROS produced in stress conditions decreasing damage
to mitochondria. Vitamin E (α-tocopherol) as a lipid soluble antioxidant which has s specific
position in the membrane, interacts with unsaturated fatty acyl chains and molecules’ mobility,
providing protection of highly unsaturated fatty acids from ROS. It can directly react with
molecular oxygen (O2), as well as with oxide radicals (O∙2-, ∙OH, ROO∙) (Machlin & Bendich,
1987). The effect of animal diet and type of plant species on vitamin E content and its prevention
of damage caused by free radicals was recently reviewed by Howes, Bekhit, Burritt, &
Campbell (2015). Pasture-fed animals showed higher β-carotene (pro-vitamin A) content
compared to grain-fed (Descalzo & Sancho, 2008). Furthermore, Walshe, Sheehan, Delahunty,
Morrissey, & Kerry (2006) found no significant difference in α-tocopherol (isomer of vitamin
E), β-carotene and retinol (vitamin A) between organically and conventionally produced beef.
Carotenoids and tocopherols have synergistic relationship in radical scavenging within lipid
membranes. Addition of plant compounds, i.e. polyphenols, has been used to increase

22
antioxidant effect of vitamin E and suppress lipid oxidation (Gobert, Gruffat, Habeanu, Parafita,
Bauchart, & Durand, 2010). Ascorbic acid and polyphenols are involved in regeneration of
tocopherol molecules, maintaining antioxidant status of the cells. Ascorbic acid on the other
hand can act as a pro-oxidant in the presence of Fe 3+ and Cu 2+, promoting ROS generation
(Descalzo & Sancho, 2008).
Antioxidant elements delivered through the diet in sufficient amounts are important for normal
intracellular function of metalloenzymes. The protective role of selenium (Se) as a structural
component of selenoenzymes is related to the metabolic regulation of oxidative processes
(Hefnawy & Tórtora-Pérez, 2010). Antioxidant/free radical balance also involves several other
trace elements, such as zinc (Zn), copper (Andrés, Cava, Mayoral, Tejeda, Morcuende, & Ruiz,
2001), iron (Fe) and magnesium (Mg). The role of Zn and Cu is essential for SOD enzymes, as
previously mentioned. Many biochemical processes are related to iron, i.e. catalase which is
involved in oxido-reduction processes, the electron transport chain and other metabolic
processes (Andrieu, 2008).
3.4. Selected additives in meat industry
3.4.1. Pyruvate
The presumed antioxidant effect of pyruvate is related to its capacity to scavenge ∙OH species
preventing peroxidation of mitochondria, activity of metabolic enzymes, and the effect is
concentration-dependent (Dobsak, Courderot-Masuyer, Zeller, Vergely, Laubriet, Assem, et al.,
1999). Furthermore, pyruvate and its derivates have shown a protective role of mitochondrial
function in oxidative stress conditions both in vivo and in vitro models, suppressing ROS
generation and maintaining mitochondrial membrane potential (Esposito, Capasso, di Tomasso,
Corona, Pellegrini, Uncini, et al., 2007; Wang, Perez, Liu, Yan, Mallet, & Yang, 2007). As a
glycolytic end product and a metabolic intermediate, pyruvate can be decarboxylated by
pyruvate dehydrogenase to acetyl CoA and then transported into mitochondrial matrix
(Crestanello, Kamelgard, & Whitman, 1995) with NADH production. In the Krebs cycle

23
condensation of acetyl CoA and oxaloacetate forms citrate. Jia et al. (2006) suggested that
during the post mortem period when oxygen is depleted, lactate dehydrogenase converts
pyruvate into lactate, regenerating NADH and decreasing pH in a muscle. Addition of lactate
generates pyruvate and stabilizes colour due to formation of NADH.
In the industry, pyruvate is used as an enhancer of fatty acid metabolism and a dietary
supplement, which stimulates weight loss (Stanko, Reynolds, Lonchar, & Arch, 1992). Some
have suggested pyruvate as an efficient additive that stabilizes meat color during storage
(Ramanathan, Mancini, & Dady, 2011; Ramanathan, Mancini, Van Buiten, Suman, & Beach,
2012), while others found small, no or even a negative effect on colour (Mohan, Hunt, Barstow,
Houser, & Muthukrishnan, 2010; Phung, Bjelanovic, Langsrud, Slinde, Sørheim, Isaksson, et
al., 2012).
3.4.2. Citrate (citric acid; E330)
Citrate is the first intermediate in the Krebs cycle and an organic acid that creates bioactive
complexes with Fe2+ or Fe3+ ions (Puntel, Nogueira, & Rocha, 2005). These complexes can act
both as antioxidants and pro-oxidants in a muscle system (Ke, Huang, Decker, & Hultin, 2009).
Jerez, Calkins, & Velazco (2000) suggested a positive effect of a mixture sodium citrate and
sodium fluoride on beef meat tenderness, by increasing pH in pre-rigor muscle. In addition,
citrate in a combination with ascorbate inhibited lipid oxidation but promoted protein oxidation
in minced beef patties (Lund et al., 2007). Phung et al. (2012) suggested a positive effect of
citrate on the color of minced beef, in particular when oxygen was present in the headspace of
the package with meat.
3.4.3. Glutamate (glutamic acid; E620)
Glutamate participates in mitochondrial respiration through an oxidative metabolism.
Glutamate conversion by glutamate dehydrogenase yields α-ketoglutarate and NADH (Frigerio,
Casimir, Carobbio, & Maechler, 2008). ROS production in ETS (complex I, II, and III)

24
provokes glutamine catabolism (Weinberg, Hamanaka, Wheaton, Weinberg, Joseph, Lopez, et
al., 2010).
Glutamate is a dietary amino acid with multiple functions: it is involved in the mitochondrial
metabolism, provides umami taste, and acts as a flavour enhancer often used for dietetic
purposes (Jinap & Hajeb, 2010). Naturally, glutamate presents an important taste component of
vegetables, cheese, meat, and seafood (Kurihara, 2009). Glutamate also functions as
neurotransmitter in the brain (Meldrum, 2000).
3.4.4. Succinate (succinic acid; E363)
Succinate is oxidized by succinate dehydrogenase (complex II) to fumarate giving FADH at the
inner membrane of mitochondria and is involved in both the Krebs cycle and ETS. The
stimulation of mitochondrial respiration and ATP synthesis, when complex I is inhibited, can
be observed by succinate addition (Protti, Carré, Frost, Taylor, Stidwill, Rudiger, et al., 2007).
Antioxidative effect of succinate is attributed to ubiquinol generation, prevention of lipid
oxidation induced by Fe2+, ADP, NADH, and NADPH (Puntel, Nogueira, & Rocha, 2005).
Succinate is a flavour enhancer used in ham and sausage production. As a taste active
compound, succinate contributes to both sour and an umami-related taste (Chen & Zhang,
2007).
3.4.5. Malate (malic acid; E296)
Malate is a Krebs cycle intermediate that is synthesized from fumarate by the enzyme fumarase.
The conversion of malate and oxaloacetate is catalyzed by malate dehydrogenase with
utilization of NAD+/NADH. Puntel et al. (2007) reported malate, oxaloacetate and citrate as
effective antioxidants decreasing TBARS production.

25
3.4.6. Lactate (lactic acid; E270)
Lactate is formed from pyruvate by lactate dehydrogenase in the glycolytic pathway. Anaerobic
conditions in post mortem muscle yield lactic acid from glycogen degradation, decreasing pH
and promoting rigor mortis development. Starvation periods and the level of stress animals are
exposed will affect the final concentration of lactic acid in meat (Peres, Bridi, da Silva, Andreo,
Tarsitano, & Stivaletti, 2014; Pighin, Brown, Ferguson, Fisher, & Warner, 2014).
Figure 9. Traditional sheep and lamb products: 1.) smoked dry-cured sheep carcass in Bosnia
and Herzegovina (typical Western Balkan sheep product); 2.) deboned, salted and dried sheep
ham in Norway; and 3.) salted and dry-cured sheep ham in Norway called Fenalår (Source:
Egelandsdal, Stojković, Grabež, Bjelanović, Vučić, Martinović, et al., 2014).
Lactic acid is a product of lactic acid bacteria and functions as a biopreservative of fermented
meat products (Stiles, 1996). Spontaneous lactic acid bacteria growth in ham production is less
pronounced due to minute amounts of carbohydrates on the surface of the green ham (Arnau,
Serra, Comaposada, Gou, & Garriga, 2007). In ham production, sometimes, pure culture of
1.)
2.)
3.)

26
lactic acid bacteria is used to reduce pH and prevent Clostridium botulinum from growing on
the surface (Nip, 2004). Spontaneous (natural) fermented meat products often have different
sensory properties compared to fermented products under controlled conditions. The
disadvantage of natural fermentation caused by “house-flora” is the lack of uniformity (Ojha,
Kerry, Duffy, Beresford, & Tiwari, 2015) and it is more difficult to control safety.
3.5. Basic analytical methods in meat science and technology
3.5.1. Warner Bratzler measurements
Globally used Warner-Bratzler shear force (WBSF) value, expressed in Newtons (N), is an
instrumental measure for meat tenderness. Compared to sensory analysis, WBSF is an objective,
relatively fast, cheap, and gives comparable measurement, which provides insight into
consumers’ expectations of tenderness (Holman, Alvarenga, van de Ven, & Hopkins, 2015). A
typical protocol for WBSF measurements requires: heating steaks to 71 °C (internal
temperature), cooling to a constant (room) temperature, than meat is cut in pieces parallel to the
fiber direction and sheared across the fiber direction on Warner-Bratzler shear head connected
with Texture analyzer (our laboratory performs measurements with shear cell HDP/BSK
Warner Bratzler, load cell 25 kg, TA-HDi Texture Analyser, Stable Micro Systems, Godalming,
UK). Different protocols will give different results. Thus, the American ranking scale presented
in Table 1 may not be relevant in other countries.
Table 1. Relationship between WBSF values and meat tenderness (Daveya, Gilberta, & Carsea,
1972)
WBSF range (N/cm2) Descriptors for tenderness
< 30 very tender to tender
30−40 marginally tender
40−50 tough
> 50 very tough

27
3.5.2. Meat colour
Instrumental evaluation of meat colour with a chroma meter (CR-400/410, Konica Minolta
Sensing Inc., Osaka, Japan) is based on measuring CIE L*, a* and b* of the colour space. The
CIE L*, a* and b* system allows colour specification in three co-ordinates (dimensions), the
colour components present: L* − lightness, a* − red/green, and b* − yellow/blue, i.e.
white/black (AMSA, 1991; CIE, 1976). Meat colour largely depends on the content and state
of myoglobin; oxymyoglobin (OMb), deoxymyoglobin (DMb), and metmyoglobin (MMb).
3.5.3. Water binding/ cooking loss
An important functional characteristic of proteins is their ability to retain water in a muscle,
described as drip loss. This characteristic is of huge importance for quality of fresh meat and
meat products, i.e. juiciness and tenderness. Difference in weight between fresh and heated meat
presents cooking loss as one of predictors of the sensory traits (Hopkins, Hegarty, Walker, &
Pethick, 2006). Water binding is most often measured gravimetrical but low field Nuclear
Magnetic Resonance (NMR) is often suggested as an option.
3.5. Statistical analysis
Analysis of variance (ANOVA)
One-way ANOVA compares the variance between groups with the variability within the group
indicating whether significant differences in mean scores are present.
Principal component analysis (PCA)
Principal component analysis is a member of multidimensional factorial methods used to
identify the group of variables which contribute to the specific phenomena (Pasikanti, Ho, &
Chan, 2008). PCA allows simplified plot, clustering data set in different patterns. In order to

28
minimize dimensionality, complex data are compressed, maintaining the maximum
information. The first principal component has the highest explained variance presenting the
main piece of information, followed by the second principal component which represents
smaller amount of information, and so forth with respect to decreasing order (Cordella, 2012).
Partial least square regression (PLS regression)
PLS regression, a technique similar to PCA, is used to correlate matrix X (predicted variables)
to a matrix Y (response variables). The aim of PLS models is to predict the set of the relevant
components in matrix X that define the maximum covariance of matrix Y (Abdi, 2010). PLSR
approach allows quantitative modeling of Y (Wold, Sjöström, & Eriksson, 2001).

29
4. Methodology
The methods used in this thesis were employed to study tenderization mechanisms and flavour
development in a muscle system. An overview of analytical methods is presented below and a
detailed description is given in Papers I−V.
4.1. Direct volatile (headspace) analysis
The analysis of volatile compounds (VOC) in meat and meat products in normally accomplished
by gas chromatography (GC) / mass spectrometry (MS). An often used analytical technique for
separation and identification of VOC is the dynamic headspace/GC-MS (HS/GC-MS). This
method does not require sample preparation that may affect the nature of the volatile compounds
(Nam, Cordray, & Ahn, 2004). The advantage of this method is loading of many samples on an
auto sampler. The four steps in volatile analysis are: (i) collection and removal of volatiles from
the headspace, (ii) extracted volatiles are trapped on porous polymer, (iii) thermal desorption
from adsorption trap to capillary column, (iv) separation of volatiles on GC (Kolb & Ettre,
2006), and (v) data processing.
The method was used in Paper II to identify volatile as lipid degradation products in minced
meat with added Krebs cycle components that could lead to rancid flavour development. In
Paper V, the applied method was aimed to detect volatile of different origin, i.e. lipid
degradation products, smoke components, spices, etc. in dry-cured ham. In Paper IV, adipose
tissue was subjected to HS/GC-MS, to define the influence of breed × age × diet on volatile
profile. In Paper IV and V we used the untargeted method, meaning that we were not, in
advance, looking for a specific compound in meat. However, in Paper II we used targeted
approach where the concentration of few flavour compounds was investigated.

30
4.2. Gas chromatographic metabolite analysis following derivatization
Metabolomic research is focused on identification and quantification of small molecules (Mw
1500), i.e. peptides, amino acids, amines, nucleic acids, organic acids, carbohydrates, vitamins,
etc. (Wishart, 2008). The complete set of molecules in a biological system is unique and
influenced by the environmental conditions.
Another non-targeted study was performed on auto-sampler/GC-MS to understand the specific
molecular composition which participates in characteristic lamb/sheep meat flavour. Compared
to the volatile analysis above, we used derivatization to reduce polarity and provide volatility
so more compounds would be detected. Derivatization reaction implies replacement of
hydrogen atom in a polar group (–NH2, –OH, –COOH, and –SH) by alkylation, acylation, or
silylation. Typical silylation reagent N-methyl-N-trimethylsilyl-trifluoroacetamide (MSTFA)
gives stabile derivates with higher volatility and forms more distinct MS spectra (Dettmer,
Aronov, & Hammock, 2007).
In Paper IV, this improved metabolomic GC/MS method was used to identify intermediates
and products of metabolism contributing to the sensory profile of lamb/sheep meat.
4.3. Sensory analysis
Sensory analysis of meat and meat products consider evaluation of quality characteristics such
as colour, flavour and tenderness. Relationships between preferences and sensory attribute
(hedonic profile) can be obtained from consumer sensory evaluation or trained sensory panel
that can accurately way describe the sensory attributes. Quantitative descriptive analysis is
accepted in sensory evaluation of various types of food, with line scales used to describe the
intensity of specific attributes. The sensory method can be used for comparison of meat from
different production systems, or to investigate effect of ingredients and processing variables on
the final quality of a product. Trained panelists are calibrated for narrow differences between
samples (Murray, Delahunty, & Baxter, 2001).

31
In Paper IV, sensory evaluation was used to define differences between lean meat samples of
different animal groups, while in Paper V it was used as the instrument to define differences
between traditional and industrial sheep ham.
4.4. Proteomic studies
Proteomics is an important tool in research related to animal production and meat quality.
Developments in mass spectrometry and bioinformatics help proteomic studies in identification
and characterization of a whole set of proteins (Bendixen, 2005) that are involved in complex
molecular events, i.e. muscle growth, conversion of muscle into meat, meat quality variations,
and effects of meat processing (Yu, Morton, Clerens, & Dyer, 2015). In the meat science area
proteomic analysis provides information about protein composition, post-transitional
modifications (PTMs), and expression patterns (Huang & Lametsch, 2012).
Figure 10. Scheme of two-dimensional gel-based proteomic analysis. The first two steps are: (i)
first dimension isoelectric focusing (IEF) separation according to the isoelectric point; (ii)
second dimension SDS-PAGE separation based on molecular size. After 2D-gel development
image analysis is performed in order to determinate the spots of interest. Those spots are
subjected to trypsin digestion. Eluted peptides are analyzed by mass spectrometry. Mass spectra
of analyzed peptides are compared to database masses leading to protein identification.

32
Challenging point in proteomic studies is sample preparation, performed in order to avoid
additional proteome transformation. Gel-based proteomic approach can be used for studying
protein oxidation, phosphorylation, and degradation, presenting a combination of two-step
protein separation (see Figure 10). 2-D gel electrophoresis has the advantage of being easier to
control if a large protein appears as degraded or with its intact Mw before trypsin digestion.
In Paper I, a gel proteomic approach was applied to define mitochondrial protein modification
and its possible role in protein structure, energy production, cell signaling and defense pathways
in an early post mortem phase.

33
5. Main results and discussion
Tenderness and flavour have been identified as the most important characteristics of ruminant
meat, determining consumers’ acceptance of the product. The large variations in eating quality
characteristics of meat are presumed to be related to complex underlying mechanisms ongoing
in the pre mortem and early post mortem period.
The aim of Paper I was to identify the protein modification of mitochondria (mitochondria
isolated ~ 2.5 h post mortem) and its relation with measured and predicted beef meat tenderness
from oxygen consumption rate measurements 3−4 h and 3 weeks post mortem. Significant
relations (P < 0.05) were found between oxygen consumption rate and Warner−Bratzler shear
force measurements. High mitochondrial respiration and low residual oxygen-consuming side
reactions early post mortem in bovine M. semimembranosus had a positive effect on
tenderization mechanism, correlating with decreased Warner-Bratzler shear force.
Mitochondrial proteins isolated from tender (22.92 ± 2.2 N/cm2) and tough (72.98 ± 7.2 N/cm2)
meat samples were separated on 2-dimensional gels showing significant expression difference
(P < 0.05) in a total of 45 proteins and peptide fragments. The higher abundance of glycolytic,
Krebs cycle, and electron transport system (ETS) enzymes in tender meat suggested the
following hypothesis: energy supply of ETS and prolonged oxygen removal stimulated by ETS
activity may reduce reactive oxygen species accumulation and prevent proteolytic inactivation
in the muscle system. Furthermore, prevalent antioxidant and chaperon enzymes (e.g.
thioredoxin; thioredoxin-dependent peroxide reductase; superoxide dismutase [Mn] and
stress−70 protein) may protect proteases and ETS enzymes, and modulate cell death
(apoptosis/necrosis switch) with beneficial effects on meat tenderness.
Combinations of Krebs cycle substrates used for colour stabilization were evaluated in Paper
II whether the mixture stimulated generation of reactive oxygen species and lipid oxidation
progression in minced beef meat stored in modified atmosphere packaging (MAP; 60% CO2
and 40% N2) and high (75% O2 and 25% CO2) oxygen atmosphere for the maximum storage
period of 13 and 8 days, respectively. Stabilization of colour with the combination of

34
mitochondrial substrates was previously investigated (Phung, et al., 2012; Slinde, Bjelanovic,
Langsrud, Sørheim, Phung, & Egelandsdal, 2012). MAP keeps deoxymyoglobin at a maximum
level when a combination of succinate and glutamate/malate (50:50 molar ration) was used. On
the other hand, in high oxygen atmosphere maximum oxymyoglobin was maintained by
glutamate/malate and citrate. The level of lipid degradation was related to the level of PUFA,
while the mixture of Krebs substrates affected the concentration of volatile compounds (hexanal
and 2-octen-1-ol). Pyruvate showed a beneficial effect in prevention of lipid oxidation, while
citrate, glutamate and malate mixture increased hexanal formation together with 2-octen-1-ol.
This result is a clear indication that colour stability and lipid oxidation are not of the same kind.
Although KCS increased the total of peroxides, the TBARS values were still regarded as too
low to affect sensory properties of the product. Peroxide forming potential was not influenced
by KCS added to MAP packaged meat, although higher amounts of KCS should be avoided due
to higher hexanal/ROS formation. High oxygen atmosphere increased ROS production and
volatile formation when KCS were added, but the small increase of lipid oxidation products
may not be sensory relevant.
The aim of Paper III and Paper IV was to define quality characteristics of lamb/sheep meat
from different production systems in order to maintain competitive advantage based on a set of
unique attributes. These papers present 3 different production systems that are horizontally
compared as opposed to following each production system from slaughter to dry-cured sheep
products. The three different production systems were: 1.) Bosnia and Herzegovina (BH) –
Vlašićka Pramenka, 2.) Montenegro (MN) – Pivska Pramenka, and 3.) Norway (NW) –
Norwegian White. Ecologically and conventionally produced NW lamb meat was compared.
The samples of M. longissimus thoracis et lumborum (LTL) and surface adipose tissue of the
muscle were collected.
Paper III and Paper IV are largely dedicated investigating how the raw material from sheep
relates to the sheep ham production in Western Balkans (Table 2). In addition, flavour and
sensory difference between lamb and sheep and between ecological and conventional lamb was
included. In particular, the focus on oxidation and tenderness was maintained. The comparison

35
between Norwegian dry-cured sheep ham and Western Balkan dry-cured sheep ham showed
that most of the discriminating volatiles were in higher amounts in Western Balkan meat
products. The components were from smoke, lipid degradation and derived lipid degradation
products, as well as from microbial metabolites. This indicated more intense flavours in the
Western Balkan products.
Table 2. Sheep meat characterization from carcass to dry-cured sheep meat (Paper III, IV and
V)
Production system Bosnia and
Herzegovina Montenegro Norway
Paper III Carcass and meat quality characteristics
Paper IV Volatiles of adipose tissue, metabolite and sensory profiles of meat
Paper V Sensory and volatile analysis Sensory and volatiles* * Egelandsdal, B., Stojković, S., Grabež, V., Bjelanović, M., Vučić, G., Martinović, A., Pallin, E., Marković, B., & Berg, P. (2014). In Proceedings from 60th International Congress of Meat Science and Technology, 17-22nd August 2014, Punta del Este, Uruguay.
In Paper III, characteristics of the carcasses (carcass weight, EU fatness and conformation, pH,
cooking loss, and Warner-Bratzler shear force values) and meat quality characteristics were
examined. In general, smaller carcasses of MN and BH animals and higher pH24h compared to
NW animals can be explained as due to variations among autochthonous and new breed, i.e.
Norwegian White. Lower Warner-Bratzler value and better colour stability was found for BH
and MN sheep. Older animals had higher heme and lower water content compared with young
animals. In addition, NW animals showed higher protein, lower fat content and less tender meat.
There were no significant variations in the activity of cathepsin B among production systems
(only within animal groups). Cathepsin B is an important enzyme in ham production (Toldrá,
Rico, & Flores, 1993). Fatty acid composition and the oxidative stability of LTL muscle were
studied. Older and fattier animal groups, i.e. MN animals, had higher total fat and vitamin E
content. Furthermore, NW animal groups showed the lowest values for 2,2-diphenyl-1-
picrylhydrazyl/total antioxidant capacity (DPPH) and higher oxidative stability. Development
of lipid oxidation was studied using thiobarbituric acid reactive substances (TBARS) and

36
hydroperoxide value (PV) measurements. High TBARS value for MN animal group together
with low vitamin E/fat ratio and high fatty acid content led to low oxidative stability in a muscle
system. TBARS and PV measurements of sheep showed similar pattern: MN sheep > NW sheep
> BH sheep and NW sheep > MN sheep > BH sheep, respectively. In addition, TBARS and PV
were BH lamb > NW lamb. Taking into consideration quality characteristics of NW lamb meat
from ecological and conventional production, the significant difference was found in a lower
level of C22:6 (n-3) fatty acid in ecological lamb meat.
In Paper IV the variation among flavour profiles of different lamb and sheep, volatiles and
metabolites isolated from adipose tissue and lean meat were examined. In addition to the flavour
precursors, sensory attributes of lamb/sheep meat were evaluated. Volatile and metabolite
profiles of heated adipose tissue and lean meat of NW lamb produced under ecological and
conventional conditions showed significant differences in twenty-three compounds. However,
no differences were found in sensory attributes among NW lamb meat from different production
systems and was further observed as one animal group.
Volatiles extracted and identified from heated adipose tissue varied between animal groups,
reflecting the level of accumulated diet tracers and thermal oxidation products. Principal
component analysis (PCA) revealed the importance of specific volatiles of different production
systems. Abundance of lipid degradation products differed the MN profile from other animal
groups. Although relatively minute differences were found among NW young and old sheep
volatile profiles, NW lamb had an unique profile. Thus, large differences were found among
BH animals (lamb vs. sheep). Metabolite profiles and evaluated sensory attributes of BH (lamb,
old sheep), MN (old sheep), and NW (lamb, young sheep, and old sheep) animals showed broad
variations attributed to differences in energy metabolism of the muscle system, breed, age, and
production conditions (diet and environment). Despite substantial metabolite differences, these
are not necessarily useful for picking out one biomarker and using it to claim a specific sensory
quality of meat originating from a specific mountain region. All identified compounds must be
validated over several grazing years and preferably related to positive traits.

37
Paper V was designed to describe the traditional processing of sheep ham in facilities
commonly used in Bosnia and Herzegovina (B&H) and Montenegro (MN) using the raw
material in Paper III and Paper IV. The flavour differences between two typical sheep ham
products from the two Western Balkan regions were obtained through sensory and aroma-active
compound (volatile and organic acids) analysis. For better understanding of sheep ham flavour
development and the effect of production process, the differences in raw material were defined.
The volatile compounds were extracted from two types of sheep ham and identified using the
dynamic headspace-GC/MS method. In addition, sensory profiles on final hams were measured.
Volatile and sensory profiles of B&H and MN hams were defined in bi-plot applying principal
component analysis. The flavour differences between two typical sheep ham products from the
two Western Balkan regions were obtained through aroma-active compounds (volatile and
organic acids). For better understanding of sheep ham flavour development and the effect of
production process results from Paper III and Paper IV were used. Salting phase has also a
strong influence on flavour development in BH ham, while on the other side, MN ham flavour
was strongly affected by smoking. Organic acid content and specific volatiles identified in B&H
ham suggested that fermentation occurred in the salting phase.

38
6. Conclusions
The mechanism of biochemical processes in a muscle system is partly modulated by
mitochondrial antioxidant activity. The implication of mitochondria in mechanical properties of
meat was demonstrated by oxygen consumption profiles of tender and tough beef meat. Protein
expression profile defined status of mitochondria in early post mortem phase, the complexes I,
III, IV and V most probably modulated cell death (apoptosis/necrosis switch). Furthermore,
added mitochondrial substrates, Krebs cycle substrates, can stabilize colour of minced meat
during storage (low and high oxygen atmosphere). The substrates support lipid oxidation to a
limited extent, but below the amounts that would be detected by sensory analysis.
Lamb/sheep meat quality was defined for animals traditionally consumed in the three
geographical regions. In order to define future strategies how for achieving consumers’
acceptance of lamb/sheep fresh meat and meat products, sensory and flavour characteristics
were studied. Quality differences between fresh sheep meat produced in two Western Balkan
regions and differences between Norwegian lamb and sheep are of the specific interest. Specific
processing technology applied in Bosnia and Herzegovina sheep-ham production and flavour
characteristics of product have the potential to position such products in the market.

39
7. Future perspectives
Studies of mitochondrial respiration and protein expression have shown the significance
of oxygen removal through electron transport system (ETS) in early post mortem
conditions to be beneficial for meat tenderness. Our study showed that complexes I, III,
IV, and V are of special interest for apoptosis/necrosis switch, and the pathway of
electrons formed in ETS post mortem. The investigation carried out here could be
towards better understanding of what proteolytic enzyme systems are effected by the
activity of respiratory enzymes and how different endogenous antioxidants affect this.
The area of application (whole sample or surface) and minimum amount of Krebs cycle
substrates used for colour stabilization in minced meat should be further tested in order
to reduce lipid degradation and protect antioxidants. Taste characteristics of minced
meat generated with minimum amount of additives should be further tested.
The increased consumers’ interest in the authenticity of the meat leads towards better
characterization of lamb and sheep meat from Western Balkan and Norway. It is of the
special interest to measure characteristic values for lamb and sheep meat which can be
presented to the consumers based on meat attributes: geographical location, sensory
properties, and nutritional value. The acceptable level of tenderness as an important
sensory trait that should be explored as an asset for sale.
From an analytical point of view, the authentication of flavour properties of lamb/sheep
meat is challenging. Further studies should be focused on seasonal effect on meat quality
and more precise relation between identified flavour compounds (volatiles and
metabolites) and sensory attributes. Biomarkers should be validating for robustness
regarding ecological and conventional meat by carrying out these types of measurements
for several consecutive years. The same can be said for using biomarkers as measures
of region or origin.

40
The fermentation seemed to be involved in a salting phase of the B&H ham production
and may be of critical importance for the safety of low-salt dry cured ham. The beneficial
microbial flora in B&H ham production should be isolated and characterized, and a
starter culture should be produced and marketed. It would be relevant to do consumer
studies to identify how important the fermentation process is for acceptance, and also to
find out to what extent the metallic flavour originating from the raw material is disliked
in the dry-cured hams.

41
8. References
Abdi, H. (2010). Partial least squares regression and projection on latent structure regression
(PLS Regression). Wiley Interdisciplinary Reviews: Computational Statistics, 2(1), 97-
106.
Abdullah, A. Y., & Qudsieh, R. I. (2009). Effect of slaughter weight and aging time on the
quality of meat from Awassi ram lambs. Meat Science, 82(3), 309-316.
Adeyemi, K. D., & Sazili, A. Q. (2014). Efficacy of carcass electrical stimulation in meat quality
enhancement: A Review. Asian-Australasian Journal of Animal Sciences, 27(3), 447-
456.
Alibegovic-Grbic, S. (2009). Country Pasture/Forage Resource Profiles. Bosnia and
Herzegovina. In J. M. Suttie & S. G. Reynolds (Eds.), FAO Country Report, 1-23, FAO.
AMSA. (1991). Guidelines for meat color evaluation. In Reciprocal Meat Conference, vol. 44.
Manhattan, KS: American Meat Science Association.
Andrés, A. I., Cava, R., Mayoral, A. I., Tejeda, J. F., Morcuende, D., & Ruiz, J. (2001).
Oxidative stability and fatty acid composition of pig muscles as affected by rearing
system, crossbreeding and metabolic type of muscle fiber. Meat Science, 59(1), 39-47.
Andrieu, S. (2008). Is there a role for organic trace element supplements in transition cow
health? The Veterinary Journal, 176(1), 77-83.
Arnau, J., Serra, X., Comaposada, J., Gou, P., & Garriga, M. (2007). Technologies to shorten
the drying period of dry-cured meat products. Meat Science, 77(1), 81-89.
Arthur, J. R. (2000). The gluthatione peroxidases. CMLS Cellular and Molecular Life Sciences,
57, 1825-1835.
Ba, H. V., Hwang, I., Jeong, D., & Touseef, A. (2012). Principle of meat aroma flavors and
future prospect.
Balaban, R. S., Nemoto, S., & Finkel, T. (2005). Mitochondria, oxidants, and aging. Cell,
120(4), 483-495.

42
Bekhit, A. E. D. A., Hopkins, D. L., Fahri, F. T., & Ponnampalam, E. N. (2013). Oxidative
processes in muscle systems and fresh meat: sources, markers, and remedies.
Comprehensive Reviews in Food Science and Food Safety, 12(5), 565-597.
Bendixen, E. (2005). The use of proteomics in meat science. Meat Science, 71, 138-149.
Boleman, S. J., Boleman, S. L., Miller, R. K., Taylor, J. F., Cross, H. R., Wheeler, T. L.,
Koohmaraie, M., Shackelford, S. D., Miller, M. F., West, R. L., Johnson, D. D., &
Savell, J. W. (1997). Consumer evaluation of beef of known categories of tenderness.
Journal of Animal Science, 75(6), 1521-1524.
Bouwman, A. F., Van der Hoek, K. W., Eickhout, B., & Soenario, I. (2005). Exploring changes
in world ruminant production systems. Agricultural Systems, 84(2), 121-153.
Bratic, I., & Trifunovic, A. (2010). Mitochondrial energy metabolism and ageing. Biochimica
et Biophysica Acta (BBA) - Bioenergetics, 1797(6–7), 961-967.
Castillo, C., Pereira, V., Abuelo, Á., & Hernández, J. (2013). Effect of supplementation with
antioxidants on the quality of bovine milk and meat production. The Scientific World
Journal, 2013, 8.
Chandra, J., Samali, A., & Orrenius, S. (2000). Triggering and modulation of apoptosis by
oxidative stress. Free Radical Biology and Medicine, 29(3–4), 323-333.
Chaudière, J., & Ferrari-Iliou, R. (1999). Intracellular antioxidants: from chemical to
biochemical mechanisms. Food and Chemical Toxicology, 37(9–10), 949-962.
Chen, D. W., & Zhang, M. (2007). Non-volatile taste active compounds in the meat of Chinese
mitten crab (Eriocheir sinensis). Food Chemistry, 104(3), 1200-1205.
Choe, J. H., Choi, Y. M., Lee, S. H., Shin, H. G., Ryu, Y. C., Hong, K. C., & Kim, B. C. (2008).
The relation between glycogen, lactate content and muscle fiber type composition, and
their influence on postmortem glycolytic rate and pork quality. Meat Science, 80(2),
355-362.
Christie, H. (2007). Fenalår. Historien om en norsk delikatesse og spesialitet. Oslo, Norway:
Kolofon.
CIE. (1976). International Commission on Illumination, Colorimetry: Official
Recommendations of the International Commision on Illumination. CIE No. 15 (E
1.3.1). Paris, France: Bireau Central de la CIE.

43
Cordella, C. B. Y. (2012). PCA: The Basic Building Block of Chemometrics.
Crestanello, J. A., Kamelgard, J., & Whitman, G. J. R. (1995). The cumulative nature of
pyruvate's dual mechanism for myocardial protection. Journal of Surgical Research,
59(1), 198-204.
D'Alessandro, A., & Zolla, L. (2013). Meat science: From proteomics to integrated omics
towards system biology. Journal of Proteomics, 78, 558-577.
Daly, C. C., Young, O. A., Graafhuis, A. E., Moorhead, S. M., & Easton, H. S. (1999). Some
effects of diet on beef meat and fat attributes. New Zealand Journal of Agricultural
Research, 42(3), 279-287.
Daun, C., & Åkesson, B. (2004). Comparison of glutathione peroxidase activity, and of total
and soluble selenium content in two muscles from chicken, turkey, duck, ostrich and
lamb. Food Chemistry, 85(2), 295-303.
Daveya, C. L., Gilberta, K. V., & Carsea, W. A. (1972). Carcass electrical stimulation to prevent
cold shortening toughness in beef. New Zealand Journal of Agricultural Research,
19(1), 13-18.
Descalzo, A. M., & Sancho, A. M. (2008). A review of natural antioxidants and their effects on
oxidative status, odor and quality of fresh beef produced in Argentina. Meat Science,
79(3), 423-436.
Dettmer, K., Aronov, P. A., & Hammock, B. D. (2007). Mass spectrometry-based
metabolomics. Mass Spectrometry Reviews, 26(1), 51-78.
Devine, C. E., Graafhuis, A. E., Muir, P. D., & Chrystall, B. B. (1993). The effect of growth
rate and ultimate pH on meat quality of lambs. Meat Science, 35(1), 63-77.
Dobsak, P., Courderot-Masuyer, C., Zeller, M., Vergely, C., Laubriet, A., Assem, M., Eicher,
J. C., Teyssier, J. R., Wolf, J. E., & Rochette, L. (1999). Antioxidative properties of
pyruvate and protection of the ischemic rat heart during cardioplegia. Journal of
Cardiovascular Pharmacology, 34(5), 651-659.
Dubljević, R. (2009). Country pasture/forage resource profiles. Montenegro. In J. M. Suttie &
S. G. Reynolds (Eds.), FAO country report, 1-26, FAO.
Duckett, S. K., & Kuber, P. S. (2001). Genetic and nutritional effects on lamb flavor. Journal
of Animal Science, 79, 249-254.

44
Egelandsdal, B., Stojković, S., Grabež, V., Bjelanović, M., Vučić, G., Martinović, A., Pallin,
E., Marković, B., & Berg, P. (2014). Dry-cured sheep/lamb meat: Norwegian
birkebeiner "fenalår" compared with sheep pastrma from Bosnia & Herzegovina and
Montenegro. In Poster session presented at 60th International Congress of Meat
Science and Technology. Punta del Este, Uruguay.
Eikje, L. S., Ådnøy, T., & Klemetsdal, G. (2008). The Norwegian sheep breeding scheme:
description, genetic and phenotypic change. Animal, 2(2), 167-176.
Elmore, S. (2007). Apoptosis: A review of programmed cell death. Toxicologic Pathology,
35(4), 495-516.
Ercolini, D., Ferrocino, I., Nasi, A., Ndagijimana, M., Vernocchi, P., La Storia, A., Laghi, L.,
Mauriello, G., Guerzoni, M. E., & Villani, F. (2011). Monitoring of microbial
metabolites and bacterial diversity in beef stored under different packaging conditions.
Applied and Environmental Microbiology, 77(20), 7372-7381.
Esposito, E., Capasso, M., di Tomasso, N., Corona, C., Pellegrini, F., Uncini, A., Vitaglione,
P., Fogliano, V., Piantelli, M., & Sensi, S. L. (2007). Antioxidant strategies based on
tomato-enriched food or pyruvate do not affect disease onset and survival in an animal
model of amyotrophic lateral sclerosis. Brain Research, 1168(0), 90-96.
Fernie, A. R., Carrari, F., & Sweetlove, L. J. (2004). Respiratory metabolism: glycolysis, the
TCA cycle and mitochondrial electron transport. Current Opinion in Plant Biology,
7(3), 254-261.
Frigerio, F., Casimir, M., Carobbio, S., & Maechler, P. (2008). Tissue specificity of
mitochondrial glutamate pathways and the control of metabolic homeostasis.
Biochimica et Biophysica Acta (BBA) - Bioenergetics, 1777(7–8), 965-972.
Gavojdian, D., Cziszter, L. T., Sossidou, E., & Pacala, N. (2013). Improving performance of
Zackel sheep through cross-breeding with prolific Bluefaced Leicester under semi-
intensive and extensive production systems. Journal of Applied Animal Research, 41(4),
432-441.
Gerhart-Hines, Z., Rodgers, J. T., Bare, O., Lerin, C., Kim, S. H., Mostoslavsky, R., Alt, F. W.,
Wu, Z., & Puigserver, P. (2007). Metabolic control of muscle mitochondrial function
and fatty acid oxidation through SIRT1/PGC-1α. The EMBO Journal, 26(7), 1913-1923.

45
Gobert, M., Gruffat, D., Habeanu, M., Parafita, E., Bauchart, D., & Durand, D. (2010). Plant
extracts combined with vitamin E in PUFA-rich diets of cull cows protect processed
beef against lipid oxidation. Meat Science, 85(4), 676-683.
Gorbatov, V. M., & Lyaskovskaya, Y. N. (1980). Review of the flavour-contributing volatiles
and water-soluble non-volatiles in pork meat and derived products. Meat Science, 4(3),
209-225.
Guerrero, A., Valero, M. V., Campo, M. M., & Sañudo, C. (2013). Some factors that affect
ruminant meat quality: from the farm to the fork. Review. Acta Scientiarum. Animal
Sciences, 35(4), 335-347.
Haugen, M. (2014). The nutritional value of Norwegian beef meat. Norwegian University of
Life Sciences, Ås, Norway.
Hefnawy, A. E. G., & Tórtora-Pérez, J. L. (2010). The importance of selenium and the effects
of its deficiency in animal health. Small Ruminant Research, 89(2–3), 185-192.
Hernández, P., Zomeño, L., Ariño, B., & Blasco, A. (2004). Antioxidant, lipolytic and
proteolytic enzyme activities in pork meat from different genotypes. Meat Science,
66(3), 525-529.
Herrera-Mendez, C. H., Becila, S., Boudjellal, A., & Ouali, A. (2006). Meat ageing:
Reconsideration of the current concept. Trends in Food Science & Technology, 17(8),
394-405.
Hildrum, K. I., Rødbotten, R., Høy, M., Berg, J., Narum, B., & Wold, J. P. (2009). Classification
of different bovine muscles according to sensory characteristics and Warner Bratzler
shear force. Meat Science, 83(2), 302-307.
Hogan, J. P., Petherick, J. C., & Phillips, C. J. C. (2007). The physiological and metabolic
impacts on sheep and cattle of feed and water deprivation before and during transport.
Nutrition Research Reviews, 20(01), 17-28.
Holman, B. W. B., Alvarenga, T. I. R. C., van de Ven, R. J., & Hopkins, D. L. (2015). A
comparison of technical replicate (cuts) effect on lamb Warner–Bratzler shear force
measurement precision. Meat Science, 105(0), 93-95.

46
Hopkins, D. L., Hegarty, R. S., Walker, P. J., & Pethick, D. W. (2006). Relationship between
animal age, intramuscular fat, cooking loss, pH, shear force and eating quality of aged
meat from sheep. Australian Journal of Experimental Agriculture, 46(7), 879-884.
Howes, N. L., Bekhit, A. E. D. A., Burritt, D. J., & Campbell, A. W. (2015). Oportunitties and
implications of pasture-based lamb fattening to enhance the long-chain fatty acid
composition in meat. Comprehensive Reviews in Food Science and Food Safety, 14, 22-
36.
Huang, H., & Lametsch, R. (2012). Application of proteomics for analysis of protein
modifications in postmortem meat. In F. Toldrá & L. M. L. Nollet (Eds.), Proteomics in
Foods: Principles and Applications. New York: Springer Science.
Huff Lonergan, E., Zhang, W., & Lonergan, S. M. (2010). Biochemistry of postmortem muscle
— Lessons on mechanisms of meat tenderization. Meat Science, 86(1), 184-195.
Huffman, K. L., Miller, M. F., Hoover, L. C., Wu, C. K., Brittin, H. C., & Ramsey, C. B. (1996).
Effect of beef tenderness on consumer satisfaction with steaks consumed in the home
and restaurant. Journal of Animal Science, 74(1), 91-97.
Hwang, Y. H., Kim, G. D., Jeong, J. Y., Hur, S. J., & Joo, S. T. (2010). The relationship between
muscle fiber characteristics and meat quality traits of highly marbled Hanwoo (Korean
native cattle) steers. Meat Science, 86(2), 456-461.
Jerez, N., Calkins, C. R., & Velazco, J. (2000). Adding value to low-quality beef muscles
through glycolytic inhibition in pre-rigor muscle. Nebraska Beef Report, 79-81.
Jia, X., Hildrum, K. I., Westad, F., Kummen, E., Aass, L., & Hollung, K. (2006). Changes in
enzymes associated with energy metabolism during the early post mortem period in
longissimus thoracis bovine muscle analyzed by proteomics. Journal of Proteome
Research, 5(7), 1763-1769.
Jinap, S., & Hajeb, P. (2010). Glutamate. Its applications in food and contribution to health.
Appetite, 55(1), 1-10.
Jongberg, S., Wen, J., Tørngren, M. A., & Lund, M. N. (2014). Effect of high-oxygen
atmosphere packaging on oxidative stability and sensory quality of two chicken muscles
during chill storage. Food Packaging and Shelf Life, 1(1), 38-48.

47
Joo, S. T., Kim, G. D., Hwang, Y. H., & Ryu, Y. C. (2013). Control of fresh meat quality
through manipulation of muscle fiber characteristics. Meat Science, 95(4), 828-836.
Jovanovic, S., Savic, M., & Trailovic, R. (2003). Some milk trait characteristics in autochtonous
Busha cattle (Bos taurus brachyceros) in Serbia and Montenegro. In Y. V. D. Honing
(Ed.), 54th Annual Meeting of the European Association for Animal Production, vol. 9.
Rome, Italy: Wageningen Academic.
Kanner, J. (1994). Oxidative processes in meat and meat products: Quality implications. Meat
Science, 36(1–2), 169-189.
Ke, S., Huang, Y., Decker, E. A., & Hultin, H. O. (2009). Impact of citric acid on the tenderness,
microstructure and oxidative stability of beef muscle. Meat Science, 82(1), 113-118.
Kemp, C. M., Sensky, P. L., Bardsley, R. G., Buttery, P. J., & Parr, T. (2010). Tenderness – An
enzymatic view. Meat Science, 84(2), 248-256.
Kirkland, R. M., Patterson, D. C., Keady, T. W. J., Moss, B. W., & Steen, R. W. J. (2007). Beef
production potential of Norwegian Red and Holstein-Friesian bulls slaughtered at two
ages. Animal, 1(10), 1506-1514.
Klont, R. E., Brocks, L., & Eikelenboom, G. (1998). Muscle fiber type and meat quality. Meat
Science, 49, 219-229.
Kolb, B., & Ettre, L. S. (2006). Static Headspace-Gas Chromatography: Theory and Practice,
Edition 2. Hoboken, New Jersey: John Wiley & Sons.
Koohmaraie, M. (1994). Muscle proteinases and meat aging. Meat Science, 36(1–2), 93-104.
Koohmaraie, M. (1996). Biochemical factors regulating the toughening and tenderization
processes of meat. Meat Science, 43, 193-201.
Kurihara, K. (2009). Glutamate: from discovery as a food flavor to role as a basic taste (umami).
American Journal of Clinical Nutrition, 90(3), 719-722.
Landim, A. V., Castanheira, M., Fioravanti, M. C. S., Pacheco, A., Cardoso, M. T. M.,
Louvandini, H., & Mc Manus, C. (2011). Physical, chemical and sensorial parameters
for lambs of different groups, slaughtered at different weights. Tropical Animal Health
and Production, 43(6), 1089-1096.
Lee, S. H., Joo, S. T., & Ryu, Y. C. (2010). Skeletal muscle fiber type and myofibrillar proteins
in relation to meat quality. Meat Science, 86(1), 166-170.

48
Lee, Y. B. (1986). Early-Postmortem Measurements and Conditioning in Assessing and
Enhancing Meat Quality. Journal of Animal Science, 63, 622-632.
Leist, M., Single, B., Castoldi, A. F., Kühnle, S., & Nicotera, P. (1997). Intracellular adenosine
triphosphate (ATP) concentration: a switch in the decision between apoptosis and
necrosis. Journal of Experimental Medicine, 185, 1481-1486.
Li, P., Wang, T., Mao, Y., Zhang, Y., Niu, L., Liang, R., Zhu, L., & Lou, X. (2014). Effect of
ultimate pH on postmortem myofibrillar protein degradation and meat quality
characteristics of Chinese Yellow crossbreed cattle. The Scientific World Journal, 1-8.
Luciano, F. B., Anton, A. A., & Rosa, C. F. (2007). Biochemical aspects of meat tenderness: A
brief review. Archivos de Zootecnia, 56(1-8).
Lund, M. N., Heinonen, M., Baron, C. P., & Estévez, M. (2011). Protein oxidation in muscle
foods: A review. Molecular Nutrition & Food Research, 55(1), 83-95.
Lund, M. N., Hviid, M. S., & Skibsted, L. H. (2007). The combined effect of antioxidants and
modified atmosphere packaging on protein and lipid oxidation in beef patties during
chill storage. Meat Science, 76(2), 226-233.
Lynch, M. P., Faustman, C., Silbart, L. K., Rood, D., & Furr, H. C. (2001). Detection of lipid-
derived aldehydes and aldehyde: protein adducts in vitro and in beef. Journal of Food
Science, 66(8), 1093-1099.
Machlin, L. J., & Bendich, A. (1987). Free radical tissue damage: protective role of antioxidant
nutrients. The FASEB Journal, 1(6), 441-445.
Martı nez-Cerezo, S., Sañudo, C., Panea, B., Medel, I., Delfa, R., Sierra, I., Beltrán, J. A.,
Cepero, R., & Olleta, J. L. (2005). Breed, slaughter weight and ageing time effects on
physico-chemical characteristics of lamb meat. Meat Science, 69(2), 325-333.
Masella, R., Di Benedetto, R., Varí, R., Filesi, C., & Giovannini, C. (2005). Novel mechanisms
of natural antioxidant compounds in biological systems: involvement of glutathione and
glutathione-related enzymes. Journal of Nutritional Biochemistry, 16, 577-586.
McVeigh, J. M., & Tarrant, P. V. (1982). Glycogen content and repletion rates in beef muscle,
effect of feeding and fasting. Journal of Nutrition, 112, 1306-1314.
Meldrum, B. S. (2000). Glutamate as neurotransmitter in the brain: review of physiology and
pathology. Journal of Nutrition, 130, 1007-1015.

49
Melton, S. L. (1990). Effects of feeds on flavor of red meat: a review. Journal of Animal Science,
68(12), 4421-4435.
Mercier, Y., Gatellier, P., & Renerre, M. (2004). Lipid and protein oxidation in vitro, and
antioxidant potential in meat from Charolais cows finished on pasture or mixed diet.
Meat Science, 66, 467-473.
Milbury, P. E., & Richer, A. C. (2008). Understanding the antioxidant controversy. 88 Post
Road West, Westport, CT, USA: Praeger Publishers.
Miller, M. F., Carr, M. A., Ramsey, C. B., Crockett, K. L., & Hoover, L. C. (2001). Consumer
thresholds for establishing the value of beef tenderness. Journal of Animal Science, 79,
3062-3068.
Min, B., & Ahn, D. U. (2005). Mechanism of lipid peroxidation in meat and meat products -A
Review. Food Science and Biotechnology, 14(1), 152-163.
Mohamed, A., Jamilah, B., Abbas, K. A., & Rahman, R. A. (2008). A review on lipid oxidation
of meat in active and modified atmosphere packaging and usage of some stabilizers.
Journal of Food, Agriculture & Environment, 6(3&4), 76-81.
Mohan, A., Hunt, M. C., Barstow, T. J., Houser, T. A., & Muthukrishnan, S. (2010). Effects of
malate, lactate, and pyruvate on myoglobin redox stability in homogenates of three
bovine muscles. Meat Science, 86(2), 304-310.
Mombeni, E. G., Mombeini, M. G., Figueiredo, L. C., Siqueira, L. S. J., & Dias, D. T. (2013).
Effects of high voltage electrical stimulation on the rate of pH decline, meat quality and
color stability in chilled beef carcasses. Asian Pacific Journal of Tropical Biomedicine,
3(9), 716-719.
Morrissey, P. A., Sheehy, P. J. A., Galvin, K., Kerry, J. P., & Buckley, D. J. (1998). Lipid
stability in meat and meat products. Meat Science, 49, Supplement 1(0), S73-S86.
Mpakama, T., Chulayo, A. Y., & Muchenje, V. (2014). Bruising in slaughter cattle and its
relationship with creatine kinase levels and beef quality as affected by animal related
factors. Asian-Australasian Journal of Animal Sciences, 27(5), 717-725.
Mullen, A. M., Stapleton, P. C., Corcoran, D., Hamill, R. M., & White, A. (2006).
Understanding meat quality through the application of genomic and proteomic
approaches. Meat Science, 74(1), 3-16.

50
Murray, J. M., Delahunty, C. M., & Baxter, I. A. (2001). Descriptive sensory analysis: past,
present and future. Food Research International, 34, 461-471.
Nam, K. C., Cordray, J., & Ahn, D. U. (2004). Automated dynamic headspace/GC-MS analyses
affect the repeatability of volatiles in irradiated turkey. Journal of Agricultural and Food
Chemistry, 52(6), 1735-1741.
Nazaret, C., Heiske, M., Thurley, K., & Mazat, J. P. (2009). Mitochondrial energetic
metabolism: A simplified model of TCA cycle with ATP production. Journal of
Theoretical Biology, 258(3), 455-464.
Nicotera, P., Leist, M., & Ferrando-May, E. (1998). Intracellular ATP, a switch in the decision
between apoptosis and necrosis. Toxicology Letters, 102-103, 139-142.
Nicotera, P., & Melino, G. (2004). Regulation of the apoptosis-necrosis switch. Oncogene,
23(16), 2757-2765.
Nip, W. K. (2004). Fermented product manufacturing. In J. S. Smith & Y. H. Hui (Eds.), Food
Processing: Principles and Applications Hardcover. Oxford, UK: Blackwell Publishing
Ltd.
Ojha, K. S., Kerry, J. P., Duffy, G., Beresford, T., & Tiwari, B. K. (2015). Technological
advances for enhancing quality and safety of fermented meat products. Trends in Food
Science & Technology, 44(1), 105-116.
Ott, M., Gogvadze, V., Orrenius, S., & Zhivotovsky, B. (2007). Mitochondria, oxidative stress
and cell death. Apoptosis, 12(5), 913-922.
Ouali, A., Herrera-Mendez, C. H., Coulis, G., Becila, S., Boudjellal, A., Aubry, L., &
Sentandreu, M. A. (2006). Revisiting the conversion of muscle into meat and the
underlying mechanisms. Meat Science, 74(1), 44-58.
Ouali, A., Herrera-Mendez, C. H., Coulis, G., Becila, S., Boudjellal, A., Harhoura, K., Aubry,
L., & Sentandreu, M. A. (2007). Meat tenderisation and muscle cell death, two highly
related events. Tehnologija mesa, 48(1-2), 1-15.
Paredi, G., Raboni, S., Bendixen, E., de Almeida, A. M., & Mozzarelli, A. (2012). “Muscle to
meat” molecular events and technological transformations: The proteomics insight.
Journal of Proteomics, 75(14), 4275-4289.

51
Park, J. H., Kang, S. N., Shin, D., & Shim, K. S. (2015). Antioxidant enzyme activity and meat
quality of meat type ducks fed with dried oregano (Origanum vulgare L.) powder. Asian-
Australasian Journal of Animal Sciences, 28(1), 79-85.
Pasikanti, K. K., Ho, P. C., & Chan, E. C. Y. (2008). Gas chromatography/mass spectrometry
in metabolic profiling of biological fluids. Journal of Chromatography B, 871(2), 202-
211.
Pastsart, U., De Boever, M., Claeys, E., & De Smet, S. (2013). Effect of muscle and post-
mortem rate of pH and temperature fall on antioxidant enzyme activities in beef. Meat
Science, 93(3), 681-686.
Peinado, B., Latorre, R., Váquez-Autón, J. M., Poto, A., Ramírez, G., López-Albors, O.,
Moreno, F., & Gil, F. (2004). Histochemical skeletal muscle fiber types in the sheep.
Anatomia, Histologia, Embryologia, 33(4), 236-243.
Peres, L. M., Bridi, A. M., da Silva, C. A., Andreo, N., Tarsitano, M. A., & Stivaletti, E. L. T.
(2014). Effect of low or high stress in pre-slaughter handling on pig carcass and meat
quality. Revista Brasileira de Zootecnia, 43, 363-368.
Petron, M. J., Raes, K., Claeys, E., Lourenço, M., Fremaut, D., & De Smet, S. (2007). Effect of
grazing pastures of different botanical composition on antioxidant enzyme activities and
oxidative stability of lamb meat. Meat Science, 75(4), 737-745.
Phung, V. T., Bjelanovic, M., Langsrud, O., Slinde, E., Sørheim, O., Isaksson, T., &
Egelandsdal, B. (2012). Color of ground beef as affected by mitochondrial substrate
respiration and exposure to oxygen. Submitted to Meat Science.
Phung, V. T., Khatri, M., Liland, K. H., Slinde, E., Sørheim, O., Almøy, T., Saarem, K., &
Egelandsdal, B. (2013). Mitochondrial oxygen consumption in permeabilized fibers and
its link to colour changes in bovine M. semimembranosus muscle. Meat Science, 93(1),
128-137.
Pighin, D. G., Brown, W., Ferguson, D. M., Fisher, A. D., & Warner, R. D. (2014). Relationship
between changes in core body temperature in lambs and post-slaughter muscle glycogen
content and dark-cutting. Animal Production Science, 54(4), 459-463.

52
Polkinghorne, R., Thompson, J. M., Watson, R., Gee, A., & Porter, M. (2008). Evolution of the
meat standards Australia (MSA) beef grading system. Australian Journal of
Experimental Agriculture, 48(11), 1351-1359.
Prache, S. (2009). Diet authentication in sheep from the composition of animal tissues and
products. Revista Brasileira de Zootecnia, 38, 362-370.
Proskuryakov, S. Y., Konoplyannikov, A. G., & Gabai, V. L. (2003). Necrosis: a specific form
of programmed cell death? Experimental Cell Research, 283(1), 1-16.
Protti, A., Carré, J., Frost, M. T., Taylor, V., Stidwill, R., Rudiger, A., & Singer, M. (2007).
Succinate recovers mitochondrial oxygen consumption in septic rat skeletal muscle.
Critical Care Medicine, 35(9), 2150-2155.
Puntel, R. L., Nogueira, C. W., & Rocha, J. B. T. (2005). Krebs cycle intermediates modulate
thiobarbituric acid reactive species (TBARS) production in rat brain in vitro.
Neurochemical Research, 30(2), 225-235.
Puntel, R. L., Roos, D. H., Grotto, D., Garcia, S. C., Nogueira, C. W., & Batista Teixeira Rocha,
J. (2007). Antioxidant properties of Krebs cycle intermediates against malonate pro-
oxidant activity in vitro: A comparative study using the colorimetric method and HPLC
analysis to determine malondialdehyde in rat brain homogenates. Life Sciences, 81(1),
51-62.
Rajović, G., & Bulatović, J. (2014). Structural changes in livestock production: A case study in
Montenegro. International letters of Social and Humanistic Sciences, 26, 125-137.
Ramanathan, R., Mancini, R. A., & Dady, G. A. (2011). Effects of pyruvate, succinate, and
lactate enhancement on beef longissimus raw color. Meat Science, 88(3), 424-428.
Ramanathan, R., Mancini, R. A., Van Buiten, C. B., Suman, S. P., & Beach, C. M. (2012).
Effects of pyruvate on lipid oxidation and ground beef color. Journal of Food Science,
77(8), C886-C892.
Resconi, V. C., Campo, M. M., Font i Furnols, M., Montossi, F., & Sañudo, C. (2010). Sensory
quality of beef from different finishing diets. Meat Science, 86(3), 865-869.
Resconi, V. C., Campo, M. M., Furnols, M. F. i., Montossi, F., & Sañudo, C. (2009). Sensory
evaluation of castrated lambs finished on different proportions of pasture and
concentrate feeding systems. Meat Science, 83(1), 31-37.

53
Reuter, B. J., Wulf, D. M., & Maddock, R. J. (2002). Mapping intramuscular tenderness
variation in four major muscles of the beef round. Journal of Animal Science, 80(10),
2594-2599.
Rhee, K. S., Anderson, L. M., & Sams, A. R. (1996). Lipid oxidation potential of beef, chicken,
and pork. Journal of Food Science, 61(1), 8-12.
Rowe, L. J., Maddock, K. R., Lonergan, S. M., & Huff-Lonergan, E. (2004). Influence of early
postmortem protein oxidation on beef quality. Journal of Animal Science, 82, 785-793.
Sañudo, C., Alfonso, M., Sanchez, A., Berge, P., Dransfield, E., Zygoyiannis, D., Stamataris,
C., Thorkelsson, G., Valdimarsdottir, T., Piasentier, E., Mills, C., Nute, G. R., & Fischer,
A. V. (2003). Meat texture of lambs from different European production systems.
Australian Journal of Agricultural Research, 54(6), 551-560.
Sañudo, C., Enser, M. E., Campo, M. M., Nute, G. R., Marı a, G., Sierra, I., & Wood, J. D.
(2000). Fatty acid composition and sensory characteristics of lamb carcasses from
Britain and Spain. Meat Science, 54(4), 339-346.
Sañudo, C., Nute, G. R., Campo, M. M., María, G., Baker, A., Sierra, I., Enser, M. E., & Wood,
J. D. (1998). Assessment of commercial lamb meat quality by British and Spanish taste
panels. Meat Science, 48(1–2), 91-100.
Savell, J. W., Mueller, S. L., & Baird, B. E. (2005). The chilling of carcasses. Meat Science,
70(3), 449-459.
Savić, M., Baltić, M., Becskei, Z., Dimitrijević, B., Dimitrijević, V., Savić, Đ., & Vegara, M.
(2014). Evaluation of Zackel lamb meat quality with the aim of increasing the
conservation value of the breed. Acta Veterinaria, 64(4), 438.
Sentandreu, M. A., Stoeva, S., Aristoy, M. C., Laib, K., Voelter, W., & Toldrá, E. (2003).
Identification of small peptides generated in Spanish dry-cured ham. Journal of Food
Science, 68(1), 64-69.
Sierra, V., & Oliván, M. (2013). Role of mitochondria on muscle cell death and meat
tenderization. Recent Patents on Endocrine, Metabolic & Immune Drug Discovery, 7(2),
1-10.
Slinde, E., Bjelanovic, M., Langsrud, Ø., Sørheim, O., Phung, V. T., & Egelandsdal, B. (2012).
Stabilizing color of ground beef in high and low oxygen atmosphere using added Krebs

54
cycle ingredients. 58th international congress of meat science and technology, Montreal,
Canada.
Stanko, R. T., Reynolds, H. R., Lonchar, K. D., & Arch, J. E. (1992). Plasma lipid
concentrations in hyperlipidemic patients consuming a high-fat diet supplemented with
pyruvate for 6 wk. American Journal of Clinical Nutrition, 56, 950-954.
Stiles, M. (1996). Biopreservation by lactic acid bacteria. Antonie van Leeuwenhoek, 70(2-4),
331-345.
Takahashi, K. (1996). Structural weakening of skeletal muscle tissue during post-mortem
ageing of meat: the non-enzymatic mechanism of meat tenderization. Meat Science, 43,
Supplement 1(0), 67-80.
Terlouw, E. M. C., Porcher, J., & Fernandez, X. (2005). Repeated handling of pigs during
rearing. II. Effect of reactivity to humans on regression during mixing and on meat
quality. Journal of Animal Science, 83, 1664-1672.
Toldrá, F., Rico, E., & Flores, J. (1993). Cathepsin B, D, H and L activities in the processing of
dry-cured ham. Journal of the Science of Food and Agriculture, 62(2), 157-161.
Tornberg, E. (1996). Biophysical aspects of meat tenderness. Meat Science, 43, 175-191.
Turrens, J. F. (2003). Mitochondrial formation of reactive oxygen species. Journal of
Physiology, 552(2), 335-344.
Voges, K. L., Mason, C. L., Brooks, J. C., Delmore, R. J., Griffin, D. B., Hale, D. S., Henning,
W. R., Johnson, D. D., Lorenzen, C. L., Maddock, R. J., Miller, R. K., Morgan, J. B.,
Baird, B. E., Gwartney, B. L., & Savell, J. W. (2007). National beef tenderness survey
– 2006: Assessment of Warner–Bratzler shear and sensory panel ratings for beef from
US retail and foodservice establishments. Meat Science, 77(3), 357-364.
Von Seggern, D. D., Calkins, S. R., Johnson, D. D., Brickler, J. E., & Gwartney, B. L. (2005).
Muscle profiling: Characterizing the muscle of the beef chuck and round. Meat Science,
71, 39-51.
Walshe, B. E., Sheehan, E. M., Delahunty, C. M., Morrissey, P. A., & Kerry, J. P. (2006).
Composition, sensory and shelf life stability analyses of Longissimus dorsi muscle from
steers reared under organic and conventional production systems. Meat Science, 73(2),
319-325.

55
Wang, X., Perez, E., Liu, R., Yan, L. J., Mallet, R. T., & Yang, S. H. (2007). Pyruvate protects
mitochondria from oxidative stress in human neuroblastoma SK-N-SH cells. Brain
Research, 1132, 1-9.
Waritthitham, A., Lambertz, C., Langholz, H. J., Wicke, M., & Gauly, M. (2010). Assessment
of beef production from Brahman x Thai native and Charolais x Thai native crossbred
bulls slaughtered at different weights. II: Meat quality. Meat Science, 85(1), 196-200.
Warner, R. D., Greenwood, P. L., & Ferguson, D. M. (2011). Understanding genetic and
environmental effects for assurance of meat quality. In S. T. Joo (Ed.), Control of meat
quality. Kerala, India: Research Signpost.
Watkins, P. J., Frank, D., Singh, T. K., Young, O. A., & Warner, R. D. (2013). Sheep meat
flavor and the effect of different feeding systems: A Review. Journal of Agricultural
and Food Chemistry, 61(15), 3561-3579.
Webb, E. C., & Erasmus, L. J. (2013). The effect of production system and management
practices on the quality of meat products from ruminant livestock. South African Journal
of Animal Science, 43(3), 413-423.
Weinberg, F., Hamanaka, R., Wheaton, W. W., Weinberg, S., Joseph, J., Lopez, M.,
Kalyanaraman, B., Mutlu, G. M., Budinger, G. R. S., & Chandel, N. S. (2010).
Mitochondrial metabolism and ROS generation are essential for Kras-mediated
tumorigenicity. Proceedings of the National Academy of Sciences, 107(19), 8788-8793.
Wishart, D. S. (2008). Metabolomics: applications to food science and nutrition research.
Trends in Food Science & Technology, 19(9), 482-493.
Wold, S., Sjöström, M., & Eriksson, L. (2001). PLS-regression: a basic tool of chemometrics.
Chemometrics and Intelligent Laboratory Systems, 58(2), 109-130.
Yu, T. Y., Morton, J. D., Clerens, S., & Dyer, J. M. (2015). In-depth characterisation of the
lamb meat proteome from longissimus lumborum. EuPA Open Proteomics, 6, 28-41.
Zakrys-Waliwander, P. I., O'Sullivan, M. G., Walsh, H., Allen, P., & Kerry, J. P. (2011).
Sensory comparison of commercial low and high oxygen modified atmosphere packed
sirloin beef steaks. Meat Science, 88(1), 198-202.

56
Zakrys, P. I., Hogan, S. A., O’Sullivan, M. G., Allen, P., & Kerry, J. P. (2008). Effects of oxygen
concentration on the sensory evaluation and quality indicators of beef muscle packed
under modified atmosphere. Meat Science, 79(4), 648-655.
Zhou, G. H., Xu, X. L., & Liu, Y. (2010). Preservation technologies for fresh meat – A review.
Meat Science, 86(1), 119-128.

Paper I


1967
INTRODUCTION
Tenderness is an important aspect of meat qual-ity and an important criterion in acceptance of the product (Huffman et al., 1996; Moloney et al., 2001). Despite extensive research, tenderness variation in beef meat is still too large and presumed to be related
to metabolic processes in the early postmortem period (Lee, 1986; Klont et al., 1998; Herrera-Mendez et al., 2006; Luciano et al., 2007) but still not understood.
The conversion from muscle to meat and the sub-sequent tenderization process are complex phenom-ena related to enzymatic (proteolytic) degradation
approaches to better understanding of meat tenderiza-tion are connected to apoptosis (controlled cell death;
involves the release of proteases (caspases) to achieve cell destruction (Fuentes-Prior and Salvesen, 2004). In addition, mitochondrial proteins are implicated in the apoptosis and caspases activation; for example, mitochondrial Bcl-2 proteins control protease release (Adams and Cory, 1998). Phung et al. (2013) found that the condition of mitochondria through early post-mortem slaughter procedures (e.g., chilling rate) clearly affects meat color. Thus, mitochondria may determine
conditions of commercial slaughterhouse.
Protein expression and oxygen consumption rate of early postmortem mitochondria relate to meat tenderness1
2
-
P
-tochondrial oxygen consumption gave more tender meat. Tender (22.92 ± 2.2 N/cm2) and tough (72.98 ± 7.2 N/cm2) meat samples (4 samples each), separated
for proteomic studies using mitochondria isolated -
ently expressed proteins (Ptender meat and 19 in tough meat. In tender meat, the more prevalent antioxidant and chaperon enzymes may reduce reactive oxygen species and prolong oxy-gen removal by the electron transport system (ETS).
more abundant in tender meat.
apoptosis/necrosis, bovine semimembranosus muscle, mitochondria, oxygen consumption rate, proteomics, tenderness
© 2015 American Society of Animal Science. All rights reserved doi:10.2527/jas2014-8575
1
funding. The author from Nortura SA contributed to the planning phase by organizing the sample collection and also by assisting
of methodology, registration of data, and choice of statistical
statistics and Marije Oostindjer and Daniel Münch for critical
2Corresponding author: [email protected]
Accepted January 30, 2015.
Published May 1, 2015

1968
-dition of the electron transport system ( ) early postmortem, 2) isolate mitochondria at the earliest possible time point at a commercial slaughter plant and subject their proteins to a proteomic analysis, 3) measure tenderness and identify if tenderness could be related to the early postmortem condition of the ETS, and 4) identify if such a relationship could be explained by the presence of mitochondrial proteins.
SamplingForty-one bovine semimembranosus muscles ( )
from the hot boning slaughter line in a commercial ab-
85 V, 35 s duration, 5 ms pulse duration, and 65 ms pulse -
done in order to get a more balanced data set (regarding
represented the diversity of animals that arrived in this slaughterhouse plus their slaughter routines. Selected
-
The rest are several common breeds selected for meat or
-
4h)
-ture on the surface of the proximal end of the SM at 3
(Ebro Electronic GmbH & Co., Ingolstadt, Germany).
3/m
stored overnight at 10°C as an extra precaution to pre-
) measure-
ments. For mitochondria isolation, tissue permeabiliza-tion, and oxygraph measurements, a neighboring slice
Warner–Bratzler Shear Force Measurements
-nal temperature of 70°C. Temperature measurements
1-2t-313; Ebro Electronic GmbH & Co.) in a dummy -
til the temperature reached approximately 20°C and -
cell, and 4 cm/min cross head speed; TA-HDi Texture
Preparation of Fibers for Oxygen Consumption Measurements
postmortem prior to oxygen consumption rate (OCR)
a relaxing solution containing 15 mM phosphocreatine, 10 mM ; 0.1 mM free calcium), 20 mM imidazole, 20 mM taurine, 6.6 mM MgCl2, 50 mM K-2-(N-morpholino) ethane-sulfonic acid, 0.5 mM dithiothreitol (DTT), and 5.8 mM
-oC in the respiration
Oxygen Consumption Rate
carried out at both 3 to 4 h postmortem (OCR3–4 h) OCR ). All chemi-
-
-

Mitochondrial activity and meat tenderness 1969
-
M O2. The closed chambers had a volume of 2/
--
zyme complexes in a sequence. Adding chemicals is pos-sible as the responses are additive and incremental, so that
-ing octanoylcarnitine. Beta-oxidation donates electrons
-
stimulated by the addition of ADP. Complex II respira-
-zone ( ) addition. At this point, rotenone addition
adding malonic acid. Finally, inhibition of complex III
consumption after complete inhibition of the ETS using -
al oxygen-consuming side reaction (ROX-
tion medium consisted of 0.5 mM EGTA, 3 mM MgCl2, 60 mM potassium methanesulfonate, 20 mM taurine, 10 mM KH2PO4 (Calbiochem, Darmstadt, Germany), 20 mM HEPES, 110 mM sucrose (Alfa Aesar, Karlsruhe, Germany), and 1.0 g/L BSA (Pesta and Gnaiger, 2012). The respiration medium had pH 7.1. For more details, see Phung et al. (2013).
Mitochondria Isolation
(muscle center at proximal end) after fat and connective -
M K2HPO4, 2 mM KH2PO4, and 0.25 M sucrose supple-
M -bated in 10 mM PBS, 10 mMtrypsin on ice for 30 min. After 10 mg/mL of albumin
Potter Elvehjem homogenizer (at 400 rpm; 10 mL). The -
M 3-(N-morpholino)propansulfonic acid [pH 7.5], 550 mM
KCl, and 5 mM -
at 600 × g for 5 min at 4°C and 11,000 × g for 10 min
and purchased from Sigma Chemicals Corp.
the Mitochondria Isolation Kit (MITOISO1 Sigma; Sigma-Aldrich, St. Louis, Mo.). Although the time
-
laboratory routine (Phung et al., 2011). The isolation
concentration analysis.
Two-Dimensional Electrophoresis (Isoelectric Focusing and Two-Dimensional SDS-PAGE)
-
Kyoto, Japan) using BSA as protein standard. No signif--
Te) and tough (To)
diluted in rehydration solution (8 M3-[(3-cholamidopropyl)dimethylammonio]-1-propane-sulfonate, 2 M thiourea, and 50 mM -bilized pH gradient (IPG) buffer (GE Healthcare Bio-
blue (applied onto the isoelectric focusing cell system (Bio-
--
ditions: 30 min of linear ramp to 250 V, 1 h rapid ramp to 500 V, 1 h to 1,000 V, and from 10,000 V to 70,000
next step in analysis.
equilibration buffer (6 M urea, 50 mM Tris-HCl [pH
-IAA). Proteins

1970
SDS-PAGE gel at 10°C at 5 mA/gel for 3 h and then 15 mA/gel until BPB reached the bottom of gel using
Gel Image Analysis
scanned using an Epson Perfection 4990 Photo scanner (16-bit grayscale and 400 dots per inch; Epson, Long Beach, CA). Image analysis of 24 gels (3 technical
-
2) presented the reference gel. As a measure of relative protein abundance, spot vol-
-tein spots in a gel. Classical student t-test (available in
-
-ferences, used to establish differences among proteins
average mean protein value for Te vs. To.
Protein Preparation for Mass Spectrometry
-
(ACN) and 50 mM NH4HCO3 at room temperature
-
incubated in the reduction solution (0.1 mM NH4HCO3 and 10 mM DTT) for 30 min at 56°C. After removing
M NH4HCO3 and 55 mM
ACN, 25 mM NH4HCO3 -
M NH4HCO3 -gested for 12 to 16 h at 37°C. Centrifuged (600 × g dur-
) and sonicated for
tandem mass spectrometry ( ) or applied directly to a matrix-assisted laser desorption/ionization
ACN
Desorption/Ionization–Tandem Time-of-Flight and
-
Other Mammalia-
amidomethylation of cysteine, and variable methionine
-
loaded onto a trap column (Acclaim PepMap100, C18,
rate of 300 nL/min. The Q-Exactive mass spectrom-
collision energy setting of 28. Singly charged precur-

Mitochondrial activity and meat tenderness 1971
Other Mammalia; --
tolerance for MS and MS/MS, respectively; 2) up to 2 missed -methylation and variable methionine oxidation. The
-
isoelectric point (pI Mw) of
Statistical Analysis
h (2 times × 2 replicates × 41 animals).
Minitab (version 16 from Minitab Inc., State Collage, t-test (P
univariate regression analysis.
squares (
XY) in the multivariate regression. The
PLS analysis actively connects the X and Y data matri-ces directly. Partial least squares models are interpreted through PLS loadings that expresses the relationship
X matrix and PLS scores. A mul-Y XW × + ;
W × . W X) and al., 2001). -
i) can be )
of a given X -surements) provides some information regarding their relative importance. Partial least squares regression is
among X
The Relation between Oxygen Consumption Rate and Warner–Bratzler Shear Force
-mercial slaughterhouse. Partial least squares regression
-
predominantly due to 2 outlier samples (sample 4 and
2) are
-nal temperature and pH4 h -
shear values had close to the same range and the same
measured during the earlier sample collection period for
-
2). The reason might also be because of larger analytical
and 2.4 (pmol O2/s)/mg protein) for both groups.The nominally highest correlation (r
(group 2; Table 1). A com-
--
-
greatest correlations. The poorer models (Table 1)
encompass all samples optimally, response to ADP ad-dition had to be included. Furthermore, only Te sam-

1972
--
cipal components; Fig. 2). This is typical of a method -
of PLS factors increases, the magnitudes of the regres--
come more comparable to those obtained in ordinary re-
-
2 outlier samples removed, and no validation) to ADP, glutamate, and octanoylcarnitine addition (PP P
-ables (Table 1), the additional protocol additives given in Fig. 2 (e.g., succinate, FCCP) needed to be included in a multivariate regression model. Complete separation of the tougher samples from the more tender samples
-ing of the response to ADP addition (Fig. 2).
to the response of succinate and FCCP addition and -
gen-consuming side reactions may possibly have an ef-
r2; Table 1) of the
full cross-validation, this high value for explained vari-
r2
under commercial conditions.
initial mitochondrial enzyme activities and the better
for proteomic analysis on early postmortem isolated
Proteomic Results for Tender vs. Tough Meat Samples
A subgroup of 8 animals (obtained from the sec-
-
samples belonged to 2 different groups that maximized differences in oxygen consumption properties and
-sis (t
Mitochondrial proteins isolated from Te and
t-test (P < 0.05) -
tein spots closer, as revealed from the statistical test, to a To sample than to the other 3 Te samples. At the
Table 1. Partial least squares regression relationship
2/s)/mg pro-r
1
Samples Variables 2 3
4 0.38 (2)* 0.42 (2)** 0.40 (2)*0.72 (3)*** 0.43 (3)** 0.75 (6) ***
1The number of principal components obtained from partial least
2
3
4 -
*P < 0.05; **P < 0.01; ***P < 0.001.
Table 2. Quality variables for semimembranosus muscle samples1
Animal group
T ,2 °C pH4 h3 pH24 h
4 5 N/cm2
Mean ± SD33.1 ± 2.9 6.25 ± 0.23 5.56 ± 0.10
29.9 ± 2.3*** 6.49 ± 0.23*** 5.54 ± 0.08
1± standard deviation of the mean.2T3pH4 h4pH24 h5
***P

Mitochondrial activity and meat tenderness 1973
P < 0.05), the number of differently
and protein degradation (proteolysis), indicating pres-ence of fragments or isoforms of the parent protein.
Out of the 45 differently expressed protein spots, -
-
5) as previously reported by Laville et al. (2009).
Effect of Mitochondria Isolation
A critical point in the methodology of mitochon--
--
dria pellets is acceptable (Taylor et al., 2003; Forner et al., 2006; Egan et al., 2011). In general, mitochondria
---
---
drial proteins upon trypsin exposure, or sedimented as
Early Postmortem Effects of Electron Transport System
High response to succinate addition gave more Te samples (Fig. 2), suggesting prevention of proteases oxidation by mitochondrial respiration. The ETS ac-
loses reactive oxygen species (
Table 3. ; (pmol O2/s)/mg protein) and changes in per-1
Animal group Malate Glutamate ADP OctanoylC2 Succinate FCCP3 4
2 3.35 ± 0.42 3.33 ± 0.40 1.43 ± 0.19 5.89 ± 0.62 5.79 ± 0.60 5.83 ± 0.73 1.23 ± 0.085 0.21 ± 0.12 3.49 ± 0.40 3.55 ± 0.40 1.69 ± 0.21 4.17 ± 0.60 4.17 ± 0.76 4.17 ± 0.61 0.09 ± 0.07
1± SEM.2
3
4
5
-
obtained from the fully cross-validated partial least squares regression
; dimension (N/m2)/(pmolO2/s)/
bars; X
-
oxygen-consuming side reactions.

1974
by prolonging ETS activity and protecting mitochon--
tanoylcarnitine addition (Fig. 2) and more abundant Krebs enzymes (Table 4) in Te samples.
In To samples, mitochondrial respiration may also cease to remove O2 earlier (lose electrochemical gra-dient across inner mitochondrial membrane), inducing a high concentration of O2 in mitochondria and giv-
of proteolytic enzymes.
-mals) early postmortem. In addition, a reduced activ-ity of complex I enzyme (NADH dehydrogenase) in
-paired electron transfer, causing accumulation of re-
(Turrens et al., 1991; Zeng et al., 2013). Bc1 complex is thermosensitive (Brasseur et al., 1997); therefore,
protein) possibly decreased complex III activity. The neighboring complex IV also exhibited an activity de-
supply stimulated ATP production through the gly-
muscle system. The extended mitochondrial respira-
tion positively affected activity of proteolytic enzymes and the tenderization processes.
Maintaining the ATP Production Postmortem
Activity of metabolic enzymes early postmortem
production after animal slaughtering. The glycolytic enzyme triosephosphate isomerase subunits and Krebs cycle enzymes (2 fragments of pyruvate dehydrogenase E1), presumably upregulated to fuel energy to the cell,
Four subunits of FoF1
proteins that most probably hydrolyze available ATP early postmortem. Dihydrolipoyllysine-residue succi-nyltransferase component of 2-oxoglutarate dehydro-
suggest also the presence of additional mechanisms in ATP reduction early postmortem (e.g., muscle cell and connective tissue differences, stress).
The Apoptosis/Necrosis Switch
strictly regulated cell death, and/or necrosis, an acute
-2
80.6 N/cm2

Mitochondrial activity and meat tenderness 1975
Table 4. Differently expressed (P-
phy/mass spectrometry after separation by 2-dimensional gel electrophoresis (see Fig. 3a and 3b) Spot no.1 (Bos taurus)
Accession num-ber (source)2
Mr,3
exp/theory3pI4
exp/theoryMatch
peptidesSeq.
cov.,5Mascot6
score
Protein function
Inner mitochondrial membrane proteinsS1a Chain F, structure of Bovine Heart Cytochrome C
Oxidase At the Fully Oxidized Stategi|1942991 12.0 / 10.9 6.48 / 6.06 11 93 126 ETS7
S3a gi|1364245 26.0 / 23.8 6.16 / 5.71 15 66 147 ETSS4a ATP synthase subunit d, mitochondrial gi|27807305 23.0 / 18.7 6.16 / 5.99 9 54 108 ATP synthesisS7a Chain E, structure of Bovine Hart Cytochrome C
oxidase at the Fully Oxidized Stategi|1942990 12.0 / 12.5 4.84 / 5.01 6 57 76 ETS
S12a Cytochrome b-c1 complex subunit 6, mitochon-drial
P00126 11.0 / 10.9 4.30 / 4.45 5 23 24 ETS
S22a Chain A, Cytochrome Bc1 Complex from Bovine gi|4139392 47.0 / 49.9 5.96 / 5.46 24 64 322 ETSMitochondrial matrix proteins
S9a Isocitrate dehydrogenase [NAD] subunit alpha, mitochondrial
P41563 43.0 / 40.1 6.32 / 6.76 41 36 2,571 Krebs cycle
S10a 8Pyruvate dehydrogenase E1 component subunit beta, mitochondrial isoform 2
gi|426249337 35.0 / 37.5 5.83 / 5.51 8 26 90 Krebs cycle
S11a Pyruvate dehydrogenase E1 component subunit beta, mitochondrial precursor
gi|164420789 34.0 / 39.4 5.82 / 6.21 17 54 166 Krebs cycle
S15a Superoxide dismutase [Mn], mitochondrial P41976 24.0 / 24.8 6.85 / 8.70 11 22 139 Cell defenseS17a -
nase, mitochondrial precursorgi|27806205 43.0 / 70.9 7.01 / 8.48 15 24 165 Lipid metabolism
S19a Chain A, Aldehyde Dehydrogenase from Bovine Mitochondria
gi|2624886 50.0 / 54.9 6.84 / 6.05 15 34 195 Cell defense
S26a NADH dehydrogenase [ubiquinone] 1 alpha subcomplex subunit 10, mitochondrial precursor
gi|296488732 39.0 / 36.5 6.74 / 6.33 4 11 47 ETS
Cell structure proteinsS6a gi|27819614 44.0 / 42.5 5.54 / 5.31 25 55 251 Muscle contractionS18a gi|27819614 44.0 / 42.5 5.44 / 5.31 21 58 294 Muscle contractionS20a gi|27819614 44.0 / 42.5 5.65 / 5.31 10 37 136 Muscle contraction
Contractile apparatusS5a
isoformQ0P571 14.0 / 19.1 4.19 / 4.91 33 7 1.199 Muscle contraction
S13a Tropomyosin alpha-1 chain 35.0 / 32.7 4.73 / 4.69 23 25 372 Muscle contractionS14a Tropomyosin alpha-1 chain 35.0 / 32.7 4.76 / 4.69 23 39 957 Muscle contractionS23a Myosin-7 gi|41386711 48.0 / 223.9 5.93 / 5.58 12 4 66 Muscle contraction
Other proteinsS2a Thioredoxin-dependent peroxide reductase,
mitochondrial precursorgi|27806083 25.0 / 28.4 6.26 / 7.15 5 29 52 Cell defense
S8a Thioredoxin O97680 11.0 / 12.1 4.87 / 4.97 3 10 24 Cell defense and ETS
S16a Thioredoxin-dependent peroxide reductase, mitochondrial precursor
gi|27806083 25.0 / 28.4 6.00 / 7.15 5 29 90 Cell defense
S21a Stress-70 protein, mitochondrial Q3ZCH0 59.0 / 74.0 6.08 / 5.97 193 62 3,374 Cell defenseS24a Triosephosphate isomerase Q5E956 27.0 / 26.9 6.74 / 6.45 68 47 216S25a Triosephosphate isomerase gi|61888856 27.1 / 26.9 6.86 / 6.45 6 29 84
Inner mitochondrial membrane proteinsS1b Chain F, structure of Bovine Heart Cytochrome C
Oxidase At the Fully Oxidized Stategi|1942991 17.0 / 10.9 6.54 / 6.06 10 93 162 ETS
S2b Chain E, structure of Bovine Hart Cytochrome C oxydase at the Fully Oxidized State
gi|1942990 16.0 / 12.5 4.96 / 5.01 7 57 112 ETS
S3b Chain B, subcomplex of the stator of bovine mitochondrial ATP synthase
gi|110591027 28.0 / 18.6 6.20 / 6.02 9 51 115 ATP synthase
S6b gi|1364245 31.0 / 23.8 6.22 / 5.71 12 58 118 ETS
Table 4. Continued

1976
processes is strongly dependent on the capability of mitochondria to recover ATP at anaerobic conditions (Kroemer et al., 1998; Lemasters et al., 2002; Kim et al., 2003; Tatsuta and Langer, 2008), leading to hypo-tesis of a prolonged apoptotic phase in Te meat.
Antioxidants, as a part of the stress regulatory mechanism, play important role in tenderness-related phenomena. Thioredoxin and thioredoxin-dependent peroxide reductase (Prx III), mitochondrial precursor
and electron-transfer steps most probably caused the
structural changes in local conformation of the ac-
-
and III on the matrix side of mitochondria (Turrens et al., 1991; Oh-ishi et al., 1997; Egan et al., 2011) are removed by superoxide dismutase [Mn]. Thus, identi-
cells from the oxidative stress through the oxidation of toxic aldehyde derivates (Ohta et al., 2004). Stress-70
Spot no.1 (Bos taurus)
Accession num-ber (source)2
Mr,3
exp/theory3pI4
exp/theoryMatch
peptidesSeq.
cov.,5Mascot6
score
Protein functionS17b Chain A, Cytochrome Bc1 Complex from bovine gi|4139392 56.0 / 49.9 6.28 / 5.46 29 69 309 ETS7
Intermembrane space proteinsS7b Superoxide dismutase [Cu-Zn] P00442.2 18.0 / 15.8 6.09 / 5.85 6 28 37 Cell defense
Mitochondrial matrix proteinsS19b Isocitrate dehydrogenase [NAD] subunit alpha,
mitochondrial precursorgi|27807161 46.0 / 40.1 6.48 / 6.76 14 37 153 Krebs cycle
Cell structure proteinsS12b gi|27819614 50.0 / 42.5 5.51 / 5.31 25 55 251 Muscle contractionS13b gi|27819614 50.0 / 42.5 5.61 / 5.31 24 71 267 Muscle contraction
Contractile apparatusS4b gi|118601750 26.0 / 21.0 4.85 / 4.96 6 40 82 Muscle contractionS8b gi|4001708 32.0 / 11.5 6.30 / 4.93 7 49 84 Muscle contractionS14b Myosin-7 gi|41386711 36.0 / 223.9 5.71 / 5.58 15 6 52 Muscle contraction
Other proteinsS5b Thioredoxin-dependent peroxide reductase, gi|529009145 31.0 / 26.5 6.30 / 6.75 5 31 64 Cell defense
S9b Chain D, Crystal Structure of Bovine F1-C8 Sub-Complex of ATP Synthase
gi|306991567 55.0 / 50.3 5.40 / 4.96 35 84 430 ATP synthesis
S10b Chain D, Crystal Structure of Bovine F1-C8 Sub-Complex of ATP Synthase
gi|306991567 55.0 / 50.3 5.33 / 4.96 26 72 317 ATP synthesis
S11b Chain D, Crystal Structure of Bovine F1-C8 Sub-Complex of ATP Synthase
gi|306991567 53.0 / 50.3 5.26 / 4.96 19 56 196 ATP synthesis
S15b Protein-L-isoaspartate (D-aspartate) O-methyltransferase
P15246 30.0 / 24.7 6.84 / 7.07 8 25 38degradation of damaged proteins
S16b Tripartite motif-containing protein 72 gi|119917044 34.0 / 54.1 5.98 / 6.05 11 22 124S18b Dihydrolipoyllysine-residue succinyltransferase
component of 2-oxoglutarate dehydrogenase complex, mitochondrial
gi|115497112 57.0 / 49.3 6.60 / 9.11 8 16 79 Krebs cycle
1Spot no. as given in Fig. 3.2
Database/).3Mr4
5
6
7
8Protein originates from Ovis aries.
Table 4. (Cont.)

Mitochondrial activity and meat tenderness 1977
--
2011) may be related to reparation or degradation of misfolded proteins and preventing protein aggregation
On the other hand, superoxide dismutase (Cu-Zn)
Zn superoxide dismutase is related to conversion of re-active O2 species (O2 2O2 -
previous studies (Dimmeler et al., 1999; Guillemin et
protection by Cu/Zn superoxide dismutase, because
The cell function of Prx III, mitochondrial precur-
During the early postmortem period, acute meta-
L-isoaspartate-(D-aspartate) O-methyltransferase in To samples played a role in reparation of damaged proteins and prevention of protein accumulation (DeVry and
--
ably involved in removal of cell protein fragments ac-cumulated under progressive apoptotic processes.
Conclusions
-tions implicated in mechanical properties of beef meat
--
slaughter conditions. Proteomic analysis on mitochon-dria from 2 groups (Te and To), based on measured and
Te compared to To samples, supporting a relationship
early postmortem may preserve proteases, reducing their oxidation, and thereby increase tenderness. High response to ADP addition early postmortem suggested
activity, and apoptotic promotion.
Adams, J. M., and S. Cory. 1998. The Bcl-2 protein family: Arbiters doi:10.1126/sci-
ence.281.5381.1322.Blum, H., H. Beier, and H. J. Gross. 1987. Improved silver stain-
. Electrophoresis 8:93 99. doi:10.1002/elps.1150080203.
Brasseur, G., P. Tron, G. Dujardin, P. P. , and P. Brivet-Chevillotte. 1997. The nuclear ABC1 gene is essential for the correct conformation and functioning of the cytochrome bc1 complex and the neighbouring complexes II and IV in the mi-tochondrial respiratory chain. Eur. J. Biochem. 246:103 111. doi:10.1111/j.1432-1033.1997.t01-1-00103.x., V. I., M. S. Kabysheva, E. I. , T. P. ,
and V. G. Pinelis. 2009. Phosphono analogues of 2-oxogluta-rate protect cerebellar granule neurons upon glutamate exci-totoxicity. Ann. N. Y. Acad. Sci. 1171:521 529. doi:10.1111/j.1749-6632.2009.04709.x.
De Jong, S. 1995. . J. Chemometr. 9:323 326. doi:10.1002/cem.1180090406.
DeVry, C. G., and S. . 1999. Polymorphic forms of the protein L-isoaspartate (D-aspartate) O-methyltransferase in-volved in the repair of age-damaged proteins. J. Hum. Genet. 44:275 288. doi:10.1007/s100380050161.
Table 5. The difference in intensity (Psemimembranosus muscle
(Bos taurus)Tender Tough Percentage
Mean,1 SE SEChain F, structure of Bovine Heart Cytochrome C Oxidase At the Fully Oxidized State 1.715 0.308 1.649 0.303 3.9
0.831 0.118 0.740 0.071 10.9Chain E, structure of Bovine Hart Cytochrome C oxidase at the Fully Oxidized State 1.370 0.454 0.981 0.231 28.4Isocitrate dehydrogenase [NAD] subunit alpha, mitochondrial 0.238 0.028 0.209 0.026 12.2Chain A, Cytochrome Bc1 Complex from Bovine 0.297 0.070 1.314 0.112 75.0Myosin-7 0.257 0.074 0.212 0.045 17.5
2.181 0.329 2.362 0.182 8.30.892 0.260 1.824 0.156 51.1
1Average intensity of normalized expression amount for group of samples.

1978
Dimmeler, S., C. Hermann, J. Galle, and A. M. Zeiher. 1999. -
thase mediates the apoptosis-suppressive effects of shear stress on endothelial cells. Arterioscler. Thromb. Vasc. Biol. 19:656 664. doi:10.1161/01.ATV.19.3.656.
Egan, B., P. , P. L. , M. Henry, P. Meleady, J. Zierath, and D. J. . 2011. 2-D DIGE analysis
reveals time course-dependent remodelling in response to 14 consecutive days of endurance exercise training. Proteomics 11:1413 1428. doi:10.1002/pmic.201000597.
Forner, F., L. J. Foster, S. Campanaro, G. Valle, and M. Mann. 2006. Quantitative proteomic comparison of rat mitochon-dria from muscle, heart, and liver. Mol. Cell. Proteomics 5:608 619. doi:10.1074/mcp.M500298-MCP200.
Fuentes-Prior, P., and G. S. Salvesen. 2004. The protein structures -
tion. Biochem. J. 384:201 232. doi:10.1042/BJ20041142.Gnaiger, E. 2001.
respiration and phosphorylation on oxygen and adenosine di-phosphate supply. 128:277 297.
Gnaiger, E. 2008. Polarographic oxygen sensors, the oxygraph, and high-resolution respirometry to assess mitochondrial function. In: J. A. and Y. , editors, Drug-induced mitochondrial dysfunction. ,
. p. 327 352.Goutis, C. 1996. -
age estimators. Ann. Stat. 24:816 824. doi:10.1214/aos/1032894467.
Görg, A., A. Klaus, C. , F. , and . 2007.
. Technische .
Guillemin, N., M. Bonnet, C. Jurie, and B. Picard. 2011. Functional analysis of beef tenderness. J. Proteomics 75:352 365. doi:10.1016/j.jprot.2011.07.026.
Herrera-Mendez, C. H., S. Becila, A. Boudjellal, and A. Ouali. 2006. . Trends
Food Sci. Technol. 17:394 405. doi:10.1016/j.tifs.2006.01.011.Huffman, K. L., M. F. Miller, L. C. Hoover, C. K. , H. C.
Brittin, and C. B. . 1996. Effect of beef tenderness on
restaurant. J. Anim. Sci. 74:91 97.Jia, , M. , H. Grove, E. M. , L. Aass, K. I. Hildrum,
and K. Hollung. 2007. Proteome changes in bovine longissimus thoracis muscle during the early postmortem storage period. J.
6:2720 2731. doi:10.1021/pr070173o.Jia, , K. I. Hildrum, F. , E. Kummen, L. Aass, and K.
Hollung. 2006. metabolism during the early post mortem period in longis-simus thoracis bovine muscle analyzed by proteomics. J.
5:1763 1769. doi:10.1021/pr060119s., T., and S. . 2011. -
. EMBO Mol. Med. 3:513 527. doi:10.1002/emmm.201100160.
Kim, J. S., T. Qian, and J. J. Lemasters. 2003. Mitochondrial per-
cell death in ischemic rat hepatocytes. Gastroenterology 124:494 503. doi:10.1053/gast.2003.50059.
Klont, , L. , and G. . 1998. -bre type and meat quality. Meat Sci. 49(Suppl. 1):S219 229.
Koohmaraie, M. 1994. Muscle proteinases and meat aging. Meat Sci. 36:93 104. doi:10.1016/0309-1740(94)90036-1.
Koohmaraie, M. 1996. Biochemical factors regulating the toughening and tenderization processes of meat. Meat Sci. 43(Suppl. 1):193 201. doi:10.1016/0309-1740(96)00065-4.
, N. 2007. partial least squares regression. Comput. Stat. 22:249 273. doi:10.1007/s00180-007-0038-z.
Kroemer, G., B. Dallaporta, and M. . 1998. The mito-chonrial death/life regulator in apoptosis and necrosis. Physiol. 60:619 642. doi:10.1146/annurev.physiol.60.1.619.
Laville, E., T. Sayd, M. Morzel, S. Blinet, C. Chambon, J. Lepetit, G. , and J. F. Hocquette. 2009. Proteome changes during
meat aging in tough and tender beef suggest the importance of apoptosis and protein solubility for beef aging and tenderization. J. Agric. Food Chem. 57:10755 10764. doi:10.1021/jf901949r.
Lee, Y. B. 1986. Early-postmortem measurements and conditioning in assessing and enhancing meat quality. J. Anim. Sci. 63:622 632.
Lemasters, J. J., T. Qian, L. He, J. S. Kim, S. P. Elmore, Cascio, and D. A. Brenner. 2002. -ner membrane permeabilization in necrotic cell death, apop-tosis, and autophagy. 4:769 781. doi:10.1089/152308602760598918.
Luciano, F. B., A. A. Anton, and C. F. . 2007. Biochemical as-. Arch. Zootec. 56:1 8.
Moloney, A. P., M. T. Mooney, J. P. Kerry, and D. J. Troy. 2001.
nutritional characteristics. Proc. Nutr. Soc. 60:221 229. doi:10.1079/PNS200077.
, K., and K. . 2009. Proteomic DIGE analysis of -
cle. Proteomics 9:5509 5524. doi:10.1002/pmic.200900472.Oh-ishi, S., T. , J. , T. , T. Komabayashi, N.
Nagata, K. , N. Taniguchi, and H. Ohno. 1997. Effects of endurance training on superoxide dismutase activity, content
. Clin. Exp. Pharmacol. Physiol. 24:326 332. doi:10.1111/j.1440-1681.1997.tb01196.x.
Ohta, S., I. , K. Kamino, F. Ando, and H. . 2004. . Ann.
N. Y. Acad. Sci. 1011:36 44. doi:10.1196/annals.1293.004.Ouali, A., C. H. Herrera-Mendez, G. Coulis, B. Samira, A.
Boudjellal, K. Harhoura, L. Aubry, and M. A. Sentandreu. 2007
from Small Biopsies of Human Muscle. In: C. M. Palmeira and A. J. Moreno, editors, Mitochondrial Bioenergetics. Methods in Molecular Biology No. 810. Humana Press. p 25-58.
Phung, V. T., M. Khatri, K. H. Liland, E. Slinde, O. , T. , K. Saarem, and B. Egelandsdal. 2013. Mitochondrial
to colour changes in bovine M. semimembranosus muscle. Meat Sci. 93:128 137. doi:10.1016/j.meatsci.2012.08.016.
Phung, V. T., E. , B. Egelandsdal, J. Volden, and E. Slinde. 2011. Oxygen consumption rate of permeabilized cells and iso-
. J. Food Sci. 76:C929 936. doi:10.1111/j.1750-3841.2011.02275.x.
, J., Y. Ishihama, and M. Mann. 2003. Stop and go ex-traction tips for matrix-assisted laser desorption/ionization, nanoelectrospray, and LC/MS sample pretreatment in pro-teomics. Anal. Chem. 75:663 670. doi:10.1021/ac026117i.
Scandalios, J. 1993. Oxygen stress and superoxide dismutases. Plant Physiol. 101:7 12.

Mitochondrial activity and meat tenderness 1979
Scheibye-Knudsen, M., and B. Quistorff. 2009. -tochondrial respiration by inorganic phosphate; comparing
-. Eur. J. Appl.
Physiol. 105:279 287. doi:10.1007/s00421-008-0901-9., A., M. , O. Vorm, and M. Mann. 1996. Mass spec-
trometric sequencing of proteins from silver-stained polyacryl-amide gels. Anal. Chem. 68:850 858. doi:10.1021/ac950914h.
Sperl, , D. , E. Gnaiger, M. , Mayr, J. Hager, and F. N. Gellerich. 1997. High resolution respirometry
neuromuscular disorders. Mol. Cell. Biochem. 174:71 78. doi:10.1023/A:1006880529195.
, K. 1996. -sue during post-mortem ageing of meat: The non-enzymat-ic mechanism of meat tenderization. Meat Sci. 43(Suppl. 1):67 80. doi:10.1016/0309-1740(96)00056-3.
, T., F. Hosoi, Y. , H. , H. Masutani, S. , A. Nishiyama, S. , H. , G. Spyrou, and J. Yodoi. 2002. -sential gene regulating mitochondria-dependent apoptosis. EMBO J. 21:1695 1703. doi:10.1093/emboj/21.7.1695.
Tatsuta, T., and T. Langer. 2008. Quality control of mitochondria: Protection against neurodegeneration and ageing. EMBO J. 27:306 314. doi:10.1038/sj.emboj.7601972.
Taylor, , E. Fahy, B. Zhang, G. M. Glenn, D. E. , S. , A. N. Murphy, S. P. Gaucher, Capaldi, Gibson, and S. S. Ghosh. 2003. Characterization of the hu-man heart mitochondrial proteome. Nat. Biotechnol. 21:281286. doi:10.1038/nbt793.
Turrens, J. F., M. Beconi, J. Barilla, Chavez, and J. M. McCord. 1991. Mitochondrial generation of oxygen radicals during reoxygenation of ischemic tissues. 13:681 689. doi:10.3109/10715769109145847.
, I., H. Arlt, L. , T. Langer, and Neupert. 1994.
degradation of misfolded proteins in mitochondria. EMBO J. 13:5135 5145., S., M. Sjöström, and L. . 2001. PLS-regression: A basic tool of chemometrics. Chemom. Intell. Lab. Syst. 58:109 130. doi:10.1016/S0169-7439(01)00155-1.
Zeng, T., Jiang, J. Li, D. , G. Li, L. Lu, and G. . 2013. Comparative proteomics analysis of the hepatic response to
tolerance related to energy metabolism. PLoS ONE 8:1 17.


Paper II


Lipid oxidation in minced beef meat with added Krebs cycle substratesto stabilise colour
G. Yi a,⇑, V. Grabez a, M. Bjelanovic a, E. Slinde a, K. Olsen a, O. Langsrud c, V.T. Phung a, A. Haug b,M. Oostindjer a, B. Egelandsdal a
aDepartment of Chemistry, Biotechnology and Food Science, Norwegian University of Life Sciences, P.O. Box 5003, N-1432 Aas, NorwaybDepartment of Animal and Aquacultural Sciences, Norwegian University of Life Sciences, P.O. Box 5003, N-1432 Aas, NorwaycØyvind Langsrud’s Company, Vardeveien 2, N-1430 Aas, Norway
a r t i c l e i n f o
Article history:Received 5 September 2014Received in revised form 26 March 2015Accepted 2 April 2015Available online 7 April 2015
Keywords:Krebs cycle substratesMinced meatColour stabilityLipid oxidation
a b s t r a c t
Krebs cycle substrates (KCS) can stabilise the colour of packaged meat by oxygen reduction. This studytested whether this reduction releases reactive oxygen species that may lead to lipid oxidation in mincedmeat under two different storage conditions.KCS combinations of succinate and glutamate increased peroxide forming potential (PFP,
1.18–1.32 mmol peroxides/kg mince) and thiobarbituric acid reactive substances (TBARS,0.30–0.38 mg malondialdehyde (MDA) equivalents/kg mince) under low oxygen storage conditions.Both succinate and glutamate were metabolised. Moreover, under high oxygen (75%) storage conditions,KCS combinations of glutamate, citrate and malate increased PFP (from 1.22 to 1.29 mmol peroxides/kg)and TBARS (from 0.37 to 0.40 mg MDA equivalents/kg mince). Only glutamate was metabolised.The KCS combinations that were added to stabilise colour were metabolised during storage, and acted
as pro-oxidants that promoted lipid oxidation in both high and low oxygen conditions.� 2015 Published by Elsevier Ltd.
1. Introduction
Beef meat has been demonstrated to contain the strongest per-oxide forming potential (PFP) among the most commonly con-sumed fresh meats in western population. The dominant reasonfor its high PFP is likely due to the meat’s high myoglobin or haemlevels (Yi, Haug, Nyquist, & Egelandsdal, 2013). All forms of myo-globin are reactive, and the highest iron oxidation levels are alwaysthe most reactive. Cycling of haem in myoglobin between differentoxidation states is undesirable as it keeps oxidation in progress.This can lead to protein crosslinking (reduced tenderness) anddegradation of lipids, resulting in an unwanted rancid flavour(Campo et al., 2006; Lepetit, 2008).
The Krebs cycle is an important metabolic pathway that oxi-dises Krebs cycle substrates (KCS) like succinate for the productionof nicotinamide adenine dinucleotide (NADH) and flavine adeninedinucleotide (FADH2) that feed into the electron transport system(ETS). In vivo the ETS produces adenosine triphosphate (ATP) andremoves oxygen. The latter reaction is crucial for colour stabilityin meat. Specific combinations of Krebs cycle substrates (KCS) will
stabilise and maintain myoglobin in the deoxymyoglobin (DMb)state in modified atmosphere (low oxygen) or in the desired fulloxymyoglobin (OMb) state (high oxygen packaging) (Slinde et al.,2012). However, a certain amount of metmyoglobin (MMb) willalways be present, in both low and high oxygen packaging, dueto oxidation. It is the oxidation of KCS such as succinate and gluta-mate, that produces reducing equivalents that are transportedfrom the mitochondrial membrane to reduce MMb (Phung et al.,2012, 2013; Tang et al., 2005). However, the mitochondrial mem-brane is a major source of reactive oxygen species (ROS) and thisis especially true in meat due to the deterioration of the electrontransport chain (ETC) (Barksdale, Perez-Costas, Melendez-Ferro,Roberts, & Bijur, 2010; Lenaz, 2001; Werner, Natter, & Wicke,2010). This may suggest that some combinations of KCS could alsoact as pro-oxidants and promote lipid oxidation by feeding into thedisintegrating ETC.
So far only KCS have been identified that have an effect on sta-bilisation of myoglobin states. Little is known about their effect onPFP or lipid degradation (Liu, Fiskum, & Schubert, 2002). However,the mitochondrial ETC as one of the major cellular generators ofROS, produces superoxide, hydrogen peroxide and hydroxyl freeradicals which can lead to lipid degradation (Boveris, Oshino, &Chance, 1972; Loschen, Flohé, & Chance, 1971).
http://dx.doi.org/10.1016/j.foodchem.2015.04.0020308-8146/� 2015 Published by Elsevier Ltd.
⇑ Corresponding author. Tel.: +47 64966154; fax: +47 64965901.E-mail address: [email protected] (G. Yi).
Food Chemistry 187 (2015) 563–571
Contents lists available at ScienceDirect
Food Chemistry
journal homepage: www.elsevier .com/locate / foodchem

Substrates of the ETC that can lead to ROS production are gluta-mate/malate through NADH to the flavine mononucleotide group(FMN) of complex I (Liu et al., 2002). Pyruvate/malate may act sim-ilarly (Chen, Vazquez, Moghaddas, & Hoppel, 2003). Some recentstudies suggest that there are substantial changes in complexes Iand III-V of the ETC in beef 4 h post mortem. Although oxygen con-sumption remains, sometimes for several weeks, it is reduced inintensity (Barksdale et al., 2010; Phung et al., 2012, 2013; Werneret al., 2010). It seems therefore relevant to identify if there areany indications of enhanced lipid oxidation when KCS are addedpost mortem to secure oxygen removal and myoglobin stability.
The aim of the present study was to explore how different com-binations of KCS used to stabilise colour in minced meat may affect(lipid) oxidation using three different measurements: (1) volatilelipid degradation compounds; (2) peroxide; (3) thiobarbituric acidreactive substances (TBARS). We also aimed to document whetherKCS were metabolised during storage, which would supportinvolvement of ETC-ROS formation.
2. Materials and methods
2.1. Chemicals
All chemicals used in the study were of analytical grade.Butanedioic acid disodium salt (succinate hexahydrate disodiumsalt), butanedioic acid (succinic acid), and 2-oxopropanoic acid(pyruvic acid) were purchased from Alfa Aesar GmbH & Co. KG(Karlsruhe, Germany), whereas 2-oxopropanoic acid disodium salt(pyruvic acid sodium salt), 2-aminopentanedioic acid (glutamicacid), 2-hydroxybutanedioic acid (L-(�)-malic acid disodium salt)and DL-hydroxybutanedioic acid (DL-malic acid disodium salt) werefrom Sigma–Aldrich Chemie GmbH (Steinheim, Germany). Sodium2-aminopentanedioate (sodium glutamate) was obtained fromVWR International BVBA (Leuven, Belgium). 2-Hydroxypropane-1,2,3-tricarboxylic acid monohydrate (citric acid monohydrate)and 2-hydroxypropane-1,2,3-tricarboxylate (trisodium citrate)were purchased from Merck KGaA (Darmstadt, Germany).
2.2. Animal tissues
BeefM. semimembranosus and beef fat tissue were collected fourdays post mortem (Fatland A/S, Oslo, Norway). The packaging daywas defined as day zero, i.e., four days post mortem. Pork fat tissues(from HKScan, Ruokatalo, Finland) were obtained from pigs fedrapeseed oil and vitamin E to obtain and preserve a high contentof polyunsaturated fatty acids.
2.3. Preparation of minced meat
Minces (lean M. semimembranosus) were prepared as describedby Slinde et al. (2012), and contained 14% w/w fat from beef orpork fat tissues. The ground meat was blended manually with solu-tions (all at pH 5.8) containing various KCS. The experiment usedfour combinations of raw materials: meat from young (1.5 years)cattle with pork or bovine fat; meat from old (4–5 years) cattleand pork or bovine fat.
2.4. Preparation of solutions
The solutions added to the minced meat were prepared usingsuccinate, pyruvate, glutamate, malate and citrate in differentcombinations, either as pure sodium/acid based chemicals or asmixtures of 2, 3, 4 and 5 chemicals of varying concentrations. Inorder to maintain pH at 5.8 the solutions were prepared by mixingthe acid form and the corresponding sodium salt of these
chemicals. Forty grams of 0.5 M or 1 M solutions were added toground 360 g minced meat. The solution was stirred into the minceand subsequently packed. The final concentration of KCS were0.05 mol/kg succinate, 0.025 mol/kg citrate, 0.0125 mol/kg malateand 0.05 mol/kg glutamate. Eight control samples were includedwhich comprised of 360 g mince with 40 mL of distilled wateradded.
2.5. Modified atmosphere packaging (MAP) and storage
The minced meat with solutions were packed as described pre-viously by Bjelanovic et al. (2013). Briefly, packaging was carriedout within 1 h after grinding. The samples were stored in darknessat 4 �C for 8 days in high-oxygen atmosphere (75% oxygen and 25%CO2) and for 13 days in a low-oxygen atmosphere (60% CO2 and40% N2). A shorter storage period in high-oxygen was chosen toreduce the influence of bacterial growth. Low oxygen is used as aconcept because often approximately 1% oxygen prevails afterMAP packaging. The food grade gas mixtures used for packagingwere supplied by AGA (Oslo, Norway). The gas-to-meat ratio in apackage was approximately 2:1. The thickness of the minced meatlayer in the packages was approximately 3 cm.
2.6. Fatty acid composition analysis
Fatty acids of the selected fat tissues were transformed intomethyl esters and then analysed by gas chromatography–massspectrometry GC–MS (7890A GC, Agilent Technologies, Palo Alto,USA). Transesterification of lipids to fatty acid methyl esters(FAME) was performed by using method described previously withminor modifications (Devle, Rukke, Naess-Andresen, & Ekeberg,2009). Briefly, 0.01 g fat was dissolved in 2.0 mL hexane and1.5 mL of 3.33 mg/mL sodium methanolate solution was added.The mixture was then placed on a shaker for 30 min, left to settlefor 10 min and 200 lL of the top layer was transferred into anew vial. Fatty acid analysis was performed by auto injection of1 lL at a split ratio of 80/1; constant flow mode; velocity20.4 cm/s; two replicates. To identify FAMEs, their retention timeswere compared to those of a known 37-component standard FAMEmix, and the mass spectra were compared with spectra availablefrom the NIST (National Institute of Standards and Technology)database.
2.7. Headspace analysis
The headspace analyses were performed according to a modi-fied method by Volden et al. (2011). Each sample was randomlycollected three times from inner and surface parts, blended andmixed. Two gram of this mixture was placed in a 20 mL tightlysealed headspace vial and used for volatile compound measure-ments. The headspace volatile compounds were analysed by adynamic headspace analyser (Teledyne Tekmar HT3, TeledyneTekmar, Ohio, USA) coupled to a gas chromatograph (Agilent6890N, Agilent Technologies Santa Clara, CA, USA). The GC columnwas connected to the ion source (at 230 �C) of a quadruple massspectrometer (Agilent 5975, Agilent Technologies, Santa, CA, USA,interface line 250 �C). The carrier gas was helium at a flow of1.0 mL/min. The oven temperature programmed as 35 �C for10 min, heating rate 1.5 �C/min up to 40 �C, 4.0 �C/min up to70 �C, 7.5 �C/min up to 230 �C and 1 min at 230 �C. The retentiontimes of the components of interest were compared with theretention times of the analytical standards and/or mass spectraof compounds in the NIST 05 Mass spectral Library (AgilentTechnologies, Santa Clara, CA, USA). Minitab version 16 (mixturedesign procedure) was used for graphical representation of the
564 G. Yi et al. / Food Chemistry 187 (2015) 563–571

volatile mixtures presentations while the analysis of variance wasperformed according to Slinde et al. (2012).
Transformation to quantitative values of volatile marker com-pounds: In order to convert the measured area values of hexanaland 2-octen-1-ol to mg/kg mince, hexanal and 2-octen-1-ol wereadded to minced fresh meat samples that did not contain thesecomponents in detectable amounts. The samples were thereafterfrozen at �80 �C. One sample high (2.5 mg/kg hexanal; 6 lg/kg2-octen-1-ol) and one low (0.15 mg/kg hexanal; 0.25 lg/kg2-octen-1-ol) in these two compounds were always measuredtogether with unknown samples to keep track of the stability ofthe measuring system. A multipoint (5 different concentrations)calibration curve was run at the end of the measurements. Thefive-point calibration curve was used to calculate concentrationsof hexanal and 2-octen-1-ol in unknown samples.
2.8. Hydroperoxide value (PV) measurements by using the ferric-xylenol orange method
Triplicates of minced meat (0.1 g) were incubated in 1 mLRinger’s solution for 2 h at 37 �C. The samples were then mixedwith 1 mL chloroform and methanol (2:1, volume-ratio), vortexedand centrifuged at 25,186�g for 10 min at 4 �C. After centrifugationthe mixture was separated in three phases: a polar phase, aninterphase (the meat protein aggregate) and an unpolar phase(chloroform phase) containing soluble lipids. Each of the threephases was removed respectively for separate hydroperoxide mea-surements. Chemicals used were as described by Yi et al. (2013).Hydroperoxide values were calculated by first subtracting theabsorbance of the negative control, then the absorbance wasdivided by the pigments’ (ferric-xylenol orange) molar absorptivi-ties of e = 14,840 and 87,583 M�1 cm�1 for the upper phase/interphase and the lower phase, respectively, before correcting fordilution. The peroxides distributed through the three phasesrepresent the total amount of peroxides.
2.9. Thiobarbituric acid reactive substances (TBARS) measurements
TBARS were measured using the reaction between2-thiobarbaturic acid (TBA) and compounds reacting with it in ameat extract. Two grams of comminuted meat were added to10 mL of TBA-stock solution (0.375% TBA and 15% trichloroaceticacid in 0.25 N HCl). Following homogenisation, the suspensionwas heated in capped tubes at 98 �C for 10 min. The systems werethen chilled on ice for another 30 min. Solutions (1.5 mL) under theupper fat layer were carefully removed and centrifuged for 25 minat 25,186g at 4 �C. After centrifugation, the absorption of the super-natant was measured by spectrophotometer at 532 nm usinge = 156,000 M�1 cm�1 (Buege & Aust, 1978).
2.10. High-performance liquid chromatography (HPLC) measurementsfor organic acids
Minced meat samples (2 g), encompassing the inner part of themince, were transferred into glass tubes (Pyrex 22). Milli Q water(5 mL), 0.5 M H2SO4 (0.7 mL) and CH3CN (20 mL) were added toeach tube. All the tubes were hand-mixed for 2 min, then mixedin a Multifix turning machine (WEG, Balingen, Germany) for30 min. Meat samples were then centrifuged at 14,243�g(Funke-Gerber, Germany) at room temperature for 15 min. Thesupernatant (1 mL) was filtered through a PTFE filter (pore0.2 lm) into HPLC-vials before analysis. HPLC was used to analysethe organic acids, following a method modified from Marsili,Ostapenko, Simmons, and Green (1981). All the samples were anal-ysed on an Aminex HPX-87H column (Bio-Rad Laboratories,Hercules, CA) which was initially held at 30 �C, connected to the
pump (Perkin Elmer Series 200), the autosampler and an LC oven101 (Perkin Elmer, Waltham, MA). The Perkin Elmer Series 200UV/VIS detector was used to detect organic acids. H2SO4 (5 mM)at a flow of 0.4 mL/min was used as the mobile phase. Standardsolutions for external calibration were prepared similarly to thesamples, and the compounds were identified according to theirretention times compared with the standard solution.
2.11. Amino acid analysis for glutamate
Free AAs were analysed by adding 15 mL of internal standardsolution (0.1 M HCl; 0.4 lmol/mL L-norvalin; Sigma, St. Louis,MO) to 1.5 g of the minced meat (inner part). The samples werehomogenised on an Ultra-Turrax (IKA, USA) for 5 min at20,000 rpm followed by sonication for 30 min. The sample werecentrifuged (Thermo Scientific, Heraeus Multifuge X3R, Germany)at 3309�g for 40 min at 4 �C. One mL of 4% TCA (Sigma) was addedto 1 mL of the supernatant, mixed in a mini shaker (Gene 2, NewYork, NY), and placed on ice for 30 min. After centrifugation at15,700�g for 5 min at 4 �C, the samples were filtered (0.2 lm cel-lulose acetate filter, Advantec, Dublin, CA) and stored in a freezer(�20 �C) until analysis.
Prior to analysis, 350 lL of borate buffer (0.4 M, pH 10.2, AgilentTechnologies) was added to 50 lL of sample. Separation of AAs wasperformed using an Agilent series 1200 pump and autosampler(Agilent Technologies, Singapore), a Perkin Elmer 200 columnoven, and an Agilent 1200 series thermostat and fluorescencedetector (Agilent Technologies). The system used software fromEZChrom Elite (Agilent Technologies). An XTerra RP 18 column(150 � 4.6 mm; Waters, Milford, MA) was used for separation ofAAs at 42 �C. Derivatisation with o-phthalaldehyde/3-mercatopropionic (OPA/MPA) was done according to Bütikofer and Ardö(1999).
2.12. Reflectance spectra
The reflectance spectra were used to predict OMb, MMb andDMb according to a principle reported by Khatri et al. (2012). Allthe minced meat samples were scanned at 400–1100 nm, with aFoss NIRSystems OptiProbe™ 6500 Analyzer (Foss NIRSystemsInc., Maryland, USA) equipped with an interactance fibre opticprobe (NR-6770-A, Foss NIRSystems) and software from Vision(2001, NIRSystems) without opening the meat package. The pack-age was turned upside-down before measurements so that themeat would fall on the packaging film of ethylene vinyl alcohol(EVOH). The samples were scanned with three random placementsof the probe on the package surface in order to increase the scan-ning area and reduce the measurement errors. Thirty-two scans ofboth the references and the samples were acquired and averagedfor each measured area. All measurements were performed atroom temperature (approx. 20 �C), otherwise in accordance toKhatri et al. (2012). Colour of the samples packed in O2 was mea-sured after 0, 1, 3, 6 and 8 days of storage from packaging day,while samples with trapped O2 were measured after 13 days ofstorage using reflectance measurements.
2.13. Experimental design and statistical analysis
Animal and fat tissues were prepared as a 2 � 2 design (4 sys-tems that contained a mixture design each). To each corner of this2 � 2 design a 3-component (succinate, pyruvate andglutamate-malate additions; 0, 50 and 100%) simplex lattice mix-ture design with 2 additional centre experiments was added.Each of these eight experimental points had 4-factors(glutamate-malate ratio, total added mixture levels, citrateconcentrations, oxygen concentrations) at 2-levels; i.e., a 24 design.
G. Yi et al. / Food Chemistry 187 (2015) 563–571 565

A quarter fraction of the full design was prepared and the 128 sam-ples were selected by using methodology for two-level fractionalfactorial designs (29-2 design). Details are given by Slinde et al.(2012) regarding the calculation of effects from MANOVA for thesedata. Surfaces are the most appropriate way of illustrating theeffect of mixtures. Response surfaces were drawn in MinitabStatistical Software version 16 (State College, PA 16801-3008,USA). It will be realised below that despite oxygen being a designvariable when the experiment was planned, the nature of the datarequired the observations to be split into separate models for lowand high oxygen packaging.
3. Results
3.1. Myoglobin state changes due to use of optimal combinations forpreserving colour during storage
Two combinations were found optimal for colour stabilisation:a KCS combination containing succinate and glutamate/malate(molar ratio 50:50) in MAP and a KCS combination containing glu-tamate, citrate and malate (molar ratio 56:25:19) in high oxygenconditions during storage (Slinde et al., 2012). The effect of thesetwo combinations on myoglobin states is shown in Fig. 1.
DMb quickly became the dominant state and remained in thisstate throughout the experimental period in Map (Fig. 1 A). Onceformed, DMb remained stable at �1.0 for the complete observa-tions period of 13 days. Glutamate, citrate and malate additionkept the fraction of OMb higher and remained high for a longertime in high oxygen packaging; adding water gave OMb equal to0.5 after 8 days of chill storage (Slinde et al., 2012).
3.2. The effect of type of fat tissue on volatile formation
Type of fat tissue explained the largest (20–40%; MANOVA anal-ysis) cause of variation in the lipid derived volatile compounds onthe final observation day (13 days chill storage in MAP; 8 days chillstorage in high oxygen). Pork fat tissue combined with beef meatfrom either younger or older cattle gave the highest amounts ofhexanal and 2-octen-1-ol (Table 1). Meat from young bulls(�18 months) and beef fat is most common in commercial mincedmeat in Norway.
As expected, a higher percentage of PUFA (16.2% in pork fat;1.2% in beef fat) increased the prevalence of volatile lipid compo-nents (Table 1). Hexanal is a good marker of n-6 fatty acids degra-dation and in particular of linoleic acid degradation while
2-octen-1-ol is more typically a marker for degradation of arachi-donic acid (Volden et al., 2011) although these markers may alsobe associated with other fatty acids (Elmore et al., 2004; Larick,Turner, Schoenherr, Coffey, & Pilkington, 1992).
The average amount (both pork and beef minces) of C18:2 (lino-leic acid) was 11 g/kg mince and the average amount of C20:4 was0.13 g/kg mince. Thus these suggest that, on average, the degrada-tion of C18:2 and C20:4 was at a comparable rate provided thathexanal and 2-octen-1-ol were not also derived from other fattyacids. The fatty acid C20:2 has been reported to give2-octen-1-ol, but this fatty acid is only present in small amountscompared to C20:4 (Raes et al., 2003). Hexanal and 2-octen-1-olwere, as expected, the highest in high oxygen packaging (Ullrich& Grosch, 1987).
3.3. Lipid degradation products from stored minced meat systems withadded Krebs cycle substrates
The effect of KCS mixture on volatile formation was small (max5% explained variance, ANOVA). This means that the effect of mix-ture is expected to be small if conditions for lipid oxidation pre-vails, i.e., the presence of relatively larger amount of PUFA andoxygen. The effect of mixture depended on the measuring system(P = 0.04 for interaction effect). Thus the mixture had an effect onthe volatile profile but the magnitude of the effect depended onthe specific fat/beef muscle batch used. The nominally largesteffect of KCS was observed for meat from older cattle with added
Fig. 1. Myoglobin fractions on surfaces of minces in two different packaging. (A) Myoglobin states with added succinate, glutamate and malate (molar ratio 50:37.5:12.5) inMAP; (B) myoglobin states with added glutamate, citrate and malate (molar ratio 56:25:19) in high oxygen. Total concentration of KCS was 0.075 mol/kg. Bars indicatestandard errors. OMb was not included in panel A as its fraction was very low; the same was the situation for DMb in panel B.
Table 1Mean values of selected markers of lipid oxidation in minced meat (with 10% w/w ofbrine added) made from cattle of different ages and containing either pork or beef fattissue.
Animal Fattissue
Low oxygen (8 days) High oxygen (13 days)
Hexanal(mg/kg)
2-Octen-1-al (lg/kg)
Hexanal(mg/kg)
2-Octen-1-al (lg/kg)
Young Beef 0.00 ± 0.14*,a 0.00 ± 0.34a 0.01 ± 0.26*,a 0.00 ± 0.22a
Young Pork 0.65 ± 0.20b 1.50 ± 0.37b 0.81 ± 0.21b 3.40 ± 0.43b
Older Beef 0.00 ± 0.06*,a 0.00 + 0.40a 0.01 + 0.21a 0.00 ± 0.33a
Older Pork 0.81 ± 0.16b 1.50 ± 0.27b 1.12 ± 0.21b 5.20 ± 0.51b
* Standard errors; negative values were predicted from the calibration equationfor some samples with volatiles close to the detection threshold of marker com-pound. The letters in superscript, column by column, indicate significant differences(P < 0.05). The average CV was 0.34 for these measurements. The values are aver-aged over the combinations of KCS used. Minces in MAP and high oxygen werestored 8 and 13 days in low and high oxygen, respectively.
566 G. Yi et al. / Food Chemistry 187 (2015) 563–571

beef fat tissue, i.e., where the endogenous oxidation of the meatand fat tissue was low (Table 1).
Fig. 2 shows the effect of KCS on hexanal and 2-octen-1-ol levels,averaged over animal age and fat tissue. All 4 systems (Table 1)ranking KCS similarly regarding hexanal and 2-octen-1-ol produc-tion. After 13 days of chill storage, hexanal and 2-octen-1-ol forma-tion was highest for glutamate/malate additions. To preserve DMbin MAP, a 50:50 mixture (molar ratio) of succinate: glutamate/-malatemay be themost efficient (Slinde et al., 2012). Fig. 2 suggeststhat such a combination would not provide the highest hexanalvalues, but values just below 1 mg/kg. However, it seemed that
pyruvate addition mixed with glutamate/malate worked best as aprotector of lipid degradation. Regarding 2-octen-1-ol, it also seemsthat adding a 50:50 mixture of succinate: glutamate/malate wouldbe acceptable with respect to lipid oxidation. For the water sample(control), hexanal was not detected after 13 days and 2-octen-1-olwas only detected in one of the three replicates (then at 0.8 lg/kg).Thus, the average water sample was less oxidised than many sam-ples containing KCS.
Fig. 3 suggests that pure succinate and pure glutamate/malateshould not be used if lipid degradation should be avoided. Pureglutamate/malate or glutamate/malate with added citrate have
Fig. 2. Hexanal (A) and 2 octen-1-ol (B) concentration as a function of the composition of succinate, pyruvate and glutamate/malate (KCS, mean conc. = 0.075 mol/kg) forminces chill stored for 13 days in MAP. The slopes of the response surfaces were significant (P < 0.05). Square indicates the area with the most suitable (combination topreserve DMb). The control sample (added only water) had no detectable hexanal and maximum 0.8 lg 2-octen-1-ol/kg mince.
Fig. 3. Hexanal concentration (A) and 2 octen-1-ol (B) as a function of the composition of succinate, pyruvate and glutamate/malate (Krebs cycle substrates, meanconc. = 0.075 mol/kg) for minces chill stored for 8 days in high oxygen. The slopes of the response surfaces were significant (P < 0.05). Squares indicate area most suitable topreserve OMb. Hexanal (C) concentration and 2-octen-1-ol (D) as a function of the composition of succinate/glutamate/malate, pyruvate and citrate (KCS, meanconc. = 0.075 mol/kg) for minces chill stored for 8 days in high oxygen. The control sample (added only water) had no detectable hexanal and 2.5 lg 2-octen-1-ol/kg.
G. Yi et al. / Food Chemistry 187 (2015) 563–571 567

been suggested as the most suitable additives to preserve OMb(Slinde et al., 2012). In high oxygen the effect of citrate additionwas significant on day 8. Most samples containing KCS had nomi-nally lower values for the volatile 2-octen-1-ol than the mincescontaining only water (i.e., control). This was not the case for thehexanal where many samples had higher amounts of hexanal thanthe control samples. There was a significant O2 reduction in head-space on the third day of chill storage in response to KCS addition(P = 0.026, ANOVA).
3.4. PFP and TBARS in all the beef system
For the most common commercial minced meat system thetime series was analysed. The total peroxides (Fig. 4A and B) werehighest in the system with added KCS, at least at the end of theexperiment. The total peroxides increased with time for all sys-tems. Typically, PFP increased quickly in MAP when KCS wereadded. The major part of PFP was endogenous, however, and pre-sumed dominantly due to the combination of haem and fatty acids(Yi et al., 2013). All types of peroxides (unpolar, polar andprotein-bound peroxides) nominally increased with storage timealthough the increase in protein-bound peroxides in high oxygenwas not significant (P > 0.05, not shown). Unpolar peroxides werealways significantly higher, if KCS were added on the final day ofchill-storage. However, the increase in PFP was small (max 12%increase in MAP).
TBARS were higher after 13 days when KCS were added com-pared to adding only water in MAP (Fig. 4C). This was also the caseunder high oxygen. In both systems, the nominal value a few hoursafter addition of KCS favoured lower TBARS values (significant inhigh oxygen). Again, the changes inducible by KCS were relatively
small compared to the volatiles produced endogenously. TheTBARS values were below the thresholds assumed detectable bysensory analysis, even after 8 days high oxygen storage (Resconiet al., 2012). The TBARS data suggest that the added KCS initiallyacted like antioxidants and then gradually become pro-oxidants.The increase in TBARS due to KCS addition was small (from 0.30to 0.38 mg/kg after 13 days chill storage).
After 3 days succinate and glutamate were not reduced furtherin MAP. The nominal amount of succinate removed during 3 dayswas �0.025 mol/kg mince. This value is in agreement with valuessuggested by Zhu, Liu, Li, and Dai (2009). The nominal reductionin glutamate was 0.019 mol/kg mince. It looks like malate is con-sumed in MAP, but the metabolism is unaffected (same slope) byaddition of glutamate and succinate. Endogenous glutamate waslow (�0.5 mmol/kg) in minces stored in MAP. Endogenous succi-nate was substantially higher (�5 mmol/kg) than the endogenousglutamate level. Apparently, the amount of succinate only declinedinitially when it needed to remove oxygen, and thereafter this sub-strate increased somewhat (Fig. 5A).
Apparently, the initial amount of succinate only declined whenthe oxygen present was removed, thereafter this substrateincreased somewhat (Fig. 5A). In high oxygen, the added citratemetabolised only to a small extent, whereas glutamate consis-tently metabolised (Fig. 5B). However, the addition of citrate andglutamate may build-up malate in high oxygen packaging.
4. Discussion
Although fatty acid composition and other endogenous compo-nents were more important for the degradation of lipids than theeffect of adding KCS, specific lipid degradation products (in this
Fig. 4. (A) Total PFP over time for a succinate and glutamate mixture in MAP; (B) total PFP over time for a glutamate, citrate and malate mixture in high oxygen; (C) TBARSformed over time for a succinate and glutamate mixture in MAP; (D) TBARS formed with time for glutamate, citrate and malate mixture in high oxygen (succinate:glutamatewas in molar ratio 50:50, totally 0.1 mol KCS/kg; glutamate, citrate and malate was in molar ratio 56:25:19, totally 0.1 mol KCS/kg; c was control with water).
568 G. Yi et al. / Food Chemistry 187 (2015) 563–571

study exemplified by the degradation products of hexanal and2-octen-1-ol) still depended on the addition of KCS substrates.
4.1. Lipid degradation when the colour is optimally stabilised
The motivation for adding KCS to minced meat would be toinduce and keep the DMb state in MAP. The substrates (succinateand glutamate) that rapidly resulted in a dominance of the DMbstate also result in the lower production of 2-octen-1-ol thoughthis was not evident for the oxidation marker hexanal. Peroxideand TBARS measurements also supported that a small increase inlipid oxidation may be inducible by the addition ofsuccinate-glutamate. This would be in line with the ability of suc-cinate and glutamate to generate H2O2 in mitochondria (Skulachev,1996). No measurement of hemin degradation due to peroxide for-mation was carried out, but in principle, hemin could also beaffected by ROS production.
Reducing the KCS addition to the minimum level needed mayprovide an insignificant increase in TBARS. Pyruvate protectedagainst lipid oxidation/degradation and has previously beenreported as an antioxidant (Lund, Hviid, & Skibsted, 2007) butthe compound is not suitable to preserve DMb (Slinde et al., 2012).
Correspondingly, the best combination to maintain the OMbstate in high oxygen would be a 1:3 M ratio of citrate-glutamate(Slinde et al., 2012). However, maintaining OMb seemed generallyin conflict with maintaining low lipid oxidation at least after 8 days
of chill storage. This interpretation was supported by TBARSmeasurements.
Pyruvate seems more useful to prevent lipid oxidation while thecitrate, glutamate and malate combination (molar ratio 1:3) wasactually providing maximum hexanal formation and was not opti-mal regarding the marker 2-octen-1-ol either. These results meanthat at least in high oxygenpackaging, itmay not necessarily be pos-sible to use only the four compounds tested here to stabilise colourand lipid oxidation. However, before concluding this, it is worthexamining the conditions in which the citrate ratio is increasedbeyond1:3 to glutamate.Maintenanceof oxymyoglobin cannot takeplace without some production of ROS and thereby lipid degrada-tion after some time.Despite the fact that theKCS addition increasedtotal peroxide formation, the TBARS increment seemed small andmay not have any contribution to the products’ sensory profile.
4.2. Metabolism of substrates
As expected, succinate and glutamate were metabolised in MAPuntil all the oxygen was removed. This happens within a few days;presumably within a few hours for some parts like the surface ofthe meat (Slinde et al., 2012). The later increase in succinate maypartly be from other metabolites, including glutamate. Since succi-nate and glutamate were only consumed to some extent, it isexpected that it is possible to reduce these additives to 0.03 and0.02 mol/kg mince, respectively, if added as a brine to the whole
Fig. 5. (A) Succinate and glutamate concentrations (molar ratio 50:50, totally 0.1 mol KCS/kg) in minces stored in MAP; (B) glutamate, citrate and malate in high oxygen(molar ratio 56:25:19, totally 0.1 mol KCS/kg); (C and D) malate concentration in the same minces stored in MAP and in high oxygen, respectively (c = control with water).
G. Yi et al. / Food Chemistry 187 (2015) 563–571 569

mince. Lower amounts of KCS may be used if it is only added toimprove surface colour. It also seemed that the endogenous succi-nate in mince may provide reducing equivalent to the electrontransport system (ETS) in fresh meat (here 4 days), but that wouldnot be the case for glutamate since its endogenous concentration isquite low. Malate seemed to be used in MAP but we have no indi-cation of it affecting colour stability or lipid degradation.
In high oxygen, a very important additive is citrate. Citrate didnot become metabolised and it minimised lipid degradation. Itseems therefore that its presence is not important regarding pro-viding reduction equivalents to ETS, but that a different mecha-nism prevails as a chelator for iron (Ke, Huang, Decker, & Hultin,2009). However, glutamate is clearly metabolised and thus a veryimportant additive in high oxygen, if the OMb state is desired. Itcannot be concluded how much glutamate is needed as OMb wasmeasured on the surface, whereas glutamate was measured inthe complete sample. Thus, it is possible that glutamate isexhausted and therefore it is the limiting substrate for preservingOMb in the meat surface, but that glutamate still remains in theinner layer of the mince. The need for glutamate may be localised;high need (>0.1 mol/kg mince) in the surface but not needed ininner layers. This hypothesis needs to be further explored, butsome support has already been given by Slinde et al. (2012).Succinate was not a very relevant additive in high oxygen packag-ing. Addition of succinate seemed to boost lipid oxidation anddegradation. Ramanathan, Mancini, and Dady (2011) reported thatOMb formation is not supported by succinate.
Malate seemed to be an end point substrate when citrate andglutamate were added. It is not metabolised, but produced. It ispossible that oxidation of (endogenous) succinate with the gluta-mate available creates malate. When pyruvate is unavailable, theKrebs cycle will stop at malate as large amounts of oxaloacetategive negative feedback on malate dehydrogenase.
4.3. ROS formation
It is not desirable to increase the PFP of foods and in particularnot in meat as it is speculated to already be high due to the pres-ence of hemin (Yi et al., 2013). MAP packaged meat seemed toretain increased PFP when KCS was added. This could be becausethe remaining succinate and glutamate was oxidised and producedperoxides when assayed. With time there may also be someexhaustion of antioxidants, also in MAP packaging and thus thiscould explain the increased PFP observed in the control (addedonly water). It is questionable whether the small increase in PFPhad any relevance for health as this increase, upon addition ofKCS, relies largely on enzymatically formed ROS and therefore thissource of increased PFP may not be present in heated foods and inheated, digested foods. However, KCS should not be added beyondwhat is needed to stabilise colour. Since hexanal was observed inhigher concentration when KCS was added, it appears that O2
reduction generates ROS, and that glutamate/malate is involvedas suggested by Liu et al. (2002).
In high oxygen packaging, additions of KCS also increased ROSformation as assessed from hexanal production, but the differencebetween the control and the sample with the additives was smallafter 8 days. This may actually suggest that some of the ROS forma-tion is actually exhausted during the storage in high oxygen pack-aging. This is in agreement with the formation of volatiles; lipidbreakdown products were more abundant in high oxygen packag-ing. These compounds emerge after peroxide formation.
4.4. Flavour aspects and legislation
We are left with the suggestion that up to 0.03 mol/kg succinateand 0.02 mol/kg glutamate should be added to minces in MAP.
Succinate’s taste (seashell) threshold of 0.03% in pure water is byfar exceeded then. Even the endogenous concentration of succinateexceeds this taste threshold. The taste threshold in a meat matrix isnot established. There are reasons to believe that the recom-mended addition of succinate (up to 0.03 mol/kg) and glutamate(up to 0.02 mol/kg) could be identified by sensory assessors(Baron & Jaromír, 2012; Byrne, Brediea, Mottram, & Martensa,2002). Succinate is transformed to fumarate (accepted as a foodadditive as well, and has an acid taste) but even this flavour’sthreshold is not defined in a meat matrix. Oxoglutarate (producedfrom glutamate) flavour is not well described in the literature.
The flavour threshold of L-glutamate (only L has the umami fla-vour) is 1–8% (g/kg) depending on sensor physiology(Luscombe-Marsh, Smeets, & Westerterp-Plantenga, 2008). Thismeans that at least some people will detect the minimum additionrequired. Succinate has been suggested as an umami (glutamate)taste enhancer (Gangyang Flavors & L., 2014). In principle, the com-bination of glutamate and succinate may be appreciated, even ifdetected,while the glutamate/fumarate taste needs to be examined.
The amount of citrate that can be added appears limited only bytaste. Thus, an upper limit of addition needs to be defined.Glutamate addition is challenged by concerned consumers and itshould be verified if simply adding high glutamate concentrationsto the surface could be a better alternative. What is said aboutoxoglutarate above is also valid here.
L-malate is not really needed as an additive, but it should beaddressed if it would accumulate in meat with KCS addition.
L-malate is an accepted food additive. However, we do not thinkadding this component is needed for colour stability Slinde et al.(2012).
5. Conclusion
The optimal KCS combinations succinate and glutamate in MAPand glutamate, citrate and malate in high oxygen for colour stabil-isation increased lipid degradation when oxygen was removed inthe package. The increase was too small to be sensory relevantcompared to endogenous lipid oxidation. Succinate and glutamatein MAP was consumed when oxygen was removed, but the citrateneeded in high oxygen packaging was not.
Acknowledgements
This work was supported by Grant No. NFR184846/I10 from theResearch Council of Norway and from HERD project ‘‘Comparisonof lamb Carcass and meat quality of Breeds in Western Balkanand Norway achieving improved palatability, sale and sustainabil-ity’’. We also thank TINE SA and Nortura SA for their support. Thetwo companies provided funding, but had no influence on thedesign, choice of methodology or interpretation of the results.
References
Barksdale, K. A., Perez-Costas, E. C. G. J., Melendez-Ferro, M., Roberts, R. C., & Bijur, G.N. (2010). Mitochondrial viability in mouse and human postmortem brain.FASEB Journal, 24(9), 10.
Baron, M., & Jaromír, F. (2012). Chasing after minerality, relationship to yeastnutritional stress and succinic acid production. Czech Journal of Food Sciences, 30,6.
Bjelanovic, M., Sørheim, O., Slinde, E., Puolanne, E., Isaksson, T., & Egelandsdal, B.(2013). Determination of the myoglobin states in ground beef using non-invasive reflectance spectrometry and multivariate regression analysis. MeatScience, 95(3), 7.
Boveris, A., Oshino, N., & Chance, B. (1972). The cellular production of hydrogenperoxide. Biochemical Journal, 128(3), 14.
Buege, J. A., & Aust, S. D. (1978). Microsomal lipid peroxidation. Methods inEnzymology, 52, 9.
Bütikofer, U., & Ardö, Y. (1999). Quantitative determination of free amino acids incheese. Bulletin of the International Dairy Federation, 337, 9.
570 G. Yi et al. / Food Chemistry 187 (2015) 563–571

Byrne, D. V., Brediea, W. L. P., Mottram, D. S., & Martensa, M. (2002). Sensory andchemical investigations on the effect of oven cooking on warmed-over flavourdevelopment in chicken meat. Meat Science, 61(2), 13.
Campo, M. M., Nute, G. R., Hughes, S. I., Enser, M., Wood, J. D., & Richardson, R. I.(2006). Flavour perception of oxidation in beef. Meat Science, 72(2), 9.
Chen, Q., Vazquez, E. J., Moghaddas, S., & Hoppel, C. L. (2003). Production of reactiveoxygen species by mitochondria central role of complex III. The Journal ofBiological Chemistry, 278, 5.
Devle, H., Rukke, E. O., Naess-Andresen, C. F., & Ekeberg, D. (2009). A GC – Magneticsector MS method for identification and quantification of fatty acids in ewe milkby different acquisition modes. Journal of Separation Science, 32(21), 8.
Elmore, J. S., Warren, H. E., Mottram, D. S., Scollan, N. D., Enser, M., Richardson, R. I.,et al. (2004). A comparison of the aroma volatiles and fatty acid compositions ofgrilled beef muscle from Aberdeen Angus and Holstein-Friesian steers fed dietsbased on silage or concentrates. Meat Science, 68(1), 7.
Gangyang Flavors and Fragrances Technology Co., L. (2014). Disodium succinate forumami taste.
Ke, S., Huang, Y., Decker, E. A., & Hultin, H. O. (2009). Impact of citric acid on thetenderness, microstructure and oxidative stability of beef muscle. Meat Science,82(1), 6.
Khatri, M., Phung, V. T., Isaksson, T., Sørheim, O., Slinde, E., & Egelandsdal, B. (2012).New procedure for improving precision and accuracy of instrumental colormeasurements of beef. Meat Science, 91(3), 9.
Larick, D. K., Turner, B. E., Schoenherr, W. D., Coffey, M. T., & Pilkington, D. H. (1992).Volatile compound content and fatty acid composition of pork as influenced bylinoleic acid content of the diet. Journal of Animal Science, 70(5), 7.
Lenaz, G. (2001). The mitochondrial production of reactive oxygen species:Mechanisms and implications in human pathology. IUBMB Life, 52(3–5), 6.
Lepetit, J. (2008). Collagen contribution to meat toughness: Theoretical aspects.Meat Science, 80(4), 5.
Liu, Y., Fiskum, G., & Schubert, D. (2002). Generation of reactive oxygen species bythe mitochondrial electron transport chain. Journal of Neurochemistry, 80(5), 8.
Loschen, G., Flohé, L., & Chance, B. (1971). Respiratory chain linked H2O2 productionin pigeon heart mitochondria. FEBS Letters, 18(2), 4.
Lund, M. N., Hviid, M. S., & Skibsted, L. H. (2007). The combined effect ofantioxidants and modified atmosphere packaging on protein and lipid oxidationin beef patties during chill storage. Meat Science, 76(2), 8.
Luscombe-Marsh, N. D., Smeets, A. J. P. G., & Westerterp-Plantenga, M. S. (2008).Taste sensitivity for monosodium glutamate and an increased liking of dietaryprotein. British Journal of Nutrition, 99(4), 5.
Marsili, R. T., Ostapenko, H., Simmons, R. E., & Green, D. E. (1981). High performanceliquid chromatographic determination of organic acids in dairy products.Journal of Food Science, 46(1).
Phung, V. T., Bjelanovic, M., Langsrud, O., Slinde, E., Sorheim, O., Isaksson, T., &Egelandsdal, B. (2012). Color of ground beef as affected by mitochondrialsubstrate respiration and exposure to oxygen. Meat Science. Submitted forpublication.
Phung, V. T., Khatri, M., Liland, K. H., Slinde, E., Sorheim, O., Almoy, T., et al. (2013).Mitochondrial oxygen consumption in permeabilized fibers and its link tocolour changes in bovine M. semimembranosus muscle. Meat Science, 93(1),128–137.
Raes, K., Balcaen, A., Dirinck, P., De Winne, A., Claeys, E., Demeyer, D., et al. (2003).Meat quality, fatty acid composition and flavour analysis in Belgian retail beef.Meat Science, 65(4), 10.
Ramanathan, R., Mancini, R. A., & Dady, G. A. (2011). Effects of pyruvate, succinate,and lactate enhancement on beef longissimus raw color. Meat Science, 88(3), 5.
Resconi, V. C., Escudero, A., Beltrán, J. A., Olleta, J. L., Sañudo, C., & del Mar Campo, M.(2012). Color, lipid oxidation, sensory quality, and aroma compounds of beefsteaks displayed under different levels of oxygen in a modified atmospherepackage. Journal of Food Science, 77(1), 11.
Skulachev, V. P. (1996). Role of uncoupled and non-coupled oxidations inmaintenance of safely low levels of oxygen and its one-electron reductants.Quarterly Reviews of Biophysics, 29(02), 33.
Slinde, E., Bjelanovic, M., Langsrud, Ø., Sørheim, O., Phung, V. T., & Egelandsdal, B.(2012). Stabilizing color of ground beef in high and low oxygen atmosphereusing added Krebs cycle ingredients. In 58th international congress of meatscience and technology, Montreal, Canada.
Tang, J., Faustman, C., Hoagland, T. A., Mancini, R. A., Seyfert, M., & Hunt, M. C.(2005). Postmortem oxygen consumption by mitochondria and its effects onmyoglobin form and stability. Journal of Agriculture and Food Chemistry, 53(4), 8.
Ullrich, F., & Grosch, W. (1987). Identification of the most intense volatile flavourcompounds formed during autoxidation of linoleic acid. Zeitschrift fürLebensmittel-Untersuchung und-Forschung, 184, 6.
Volden, J., Bjelanovica, M., Vogt, G., Slinde, E., Skaugen, M., Nordvi, B., et al. (2011).Oxidation progress in an emulsion made from metmyoglobin and differenttriacylglycerols. Food Chemistry, 128(4), 10.
Werner, C., Natter, R., & Wicke, M. (2010). Changes of the activities of glycolytic andoxidative enzymes before and after slaughter in the longissimus muscle ofPietrain and Duroc pigs and a Duroc–Pietrain crossbreed. Journal of AnimalScience, 88(12), 4016–4025.
Yi, G., Haug, A., Nyquist, N. F., & Egelandsdal, B. (2013). Hydroperoxide formation indifferent lean meats. Food Chemistry, 141(3), 10.
Zhu, J., Liu, F., Li, X., & Dai, R. (2009). Effect of succinate sodium on themetmyoglobin reduction and color stability of beef patties. J. Agric. FoodChem, 57(13), 6.
G. Yi et al. / Food Chemistry 187 (2015) 563–571 571


Paper III


Biotechnology in Animal Husbandry 31 (2), p 203-221 , 2015 ISSN 1450-9156 Publisher: Institute for Animal Husbandry, Belgrade-Zemun UDC 637.5'636.3
DOI: 10.2298/BAH1502203B
EFFECTS OF DIFFERENT PRODUCTION SYSTEMS ON CARCASS AND MEAT QUALITY OF SHEEP AND LAMB FROM WESTERN BALKAN AND NORWAY
M. Bjelanović1, V. Grabež1, G. Vučić2, A. Martinović3, L. R. Lima1, B. Marković4, B. Egelandsdal1 1Department of Chemistry, Biotechnology and Food Science, University of Life Sciences, P. O. Box 5003, NO-1432 Ås, Norway
2 Department of Food Science and Technology, Faculty of Technology, University of Banja Luka, Vojvode Stepe Stepanovića 73,78 000 Banja Luka, B&H 3University of Donja Gorica, Faculty of Food Technology, Food Safety and Ecology, Donja Gorica bb, 81000 Podgorica, Montenegro 4Biotechnical Faculty, Mihaila Lalića 1 81000 Podgorica, Montenegro Corresponding author: [email protected] Original scientific paper
Abstract: The identification of meat quality characteristics from selected
breeds grazing in specific regions is particularly relevant to achieve a marketing advantage. Longisimus thoracis at lumborum (LTL) from the indigenous Western Balkan (WB) sheep - VlašićkaPramenka (VP) sheep and lambs, and Pivska Pramenka (PP) sheep grazing in Bosnia & Herzegovina (B&H) and Montenegro (MN), respectively, was compared regarding carcass and meat qualities to the crossbred Norwegian white sheep (NWS) - sheep and lambs, grazing in wide Hardangervidda and Jotunheimen regions where the lamb meat is marketed as gourmet meat. The WB sheep had lower average carcass weights and antioxidant capacity, higher ultimate pH, intramuscular fat and n-6/n-3 ratio, but better tenderness and color stability compared to NWS. The WB lambs were lighter, had higher n-6/n-3 ratio, lower antioxidant capacity and became more easily rancid despite a higher fat α-tocopherol content. The marketing advantage of WB meat is its tenderness properties while NO's NWS lambs displayed a better nutritional profile.
Key words: production system, sheep meat quality, physical and chemical traits, meat color, fatty acid composition.
Introduction
The consumers’ have an increasing interest in more healthy meat products and lower production costs. EU’s Common Agricultural Policy stimulates

M. Bjelanović et al.
204
at the same time pasture-based production systems resulting in meat with higher content of omega 3 polyunsaturated fatty acids (PUFA) (Enser et al., 1998; Carrasco et al., 2009). The consumers in Western Balkan (WB) are becoming more aware of claimed organic meat advantages, but prefer domestic meat from non-conventional production systems. The purcase motives for such meat are safety, "natural" content, health, good meat quality and a distinctive taste (Vukasovič, 2013). The Norwegian consumers also prefer domestic meat from mountain pastures with perceived elements of naturalness, healthiness and environmental friendly production combined with good meat quality (Hersleth et al., 2012).
Meat quality differ among animal species (Guerrero et al., 2013), and can be used to promote sheep and lamb sale, such as done for the Texel sheep (Cockett et al., 2004) and lamb from Aragosa (Martinez-Royo et al., 2008). The producers in EU were encouraged to continue producing lamb meat according to the traditional methods (Texiera, 2005) in agreement with consumers’ requirements and acceptance. In Europe the Spanish scientists have carried out a substantial amount of research on their autochthonous breed Aragonese in order to obtain the PGI (Protected Geographical Indication) label (Martınez-Cerezo et al., 2005).
The predominant sheep breed in the WB is the Pramenka sheep (PS). It makes up 80 to 90% of the sheep population and belongs to indigenous primitive sheep type (Robic, Liker, and Rupic, 1992). In the 20th century, most PS types were crossed with different exotic breeds, mostly Merino, but the last indigenous PS types remain in the high mountain regions of the Balkan Peninsula, where the environmental conditions and quality of pastures are less favorable for conventional sheep grazing (Cinkulov et al., 2008).
In B&H, the dominant sheep is Vlašićka Pramenka (VP) (synonym Dubska) with female adults weighing 60-70 kg (Porcu and Markovic, 2006), while PP (synonym Jezeropivska) is the predominant sheep in MN, with female adults weighing 51-54 kg (Markovic, Markovic, and Adzic, 2007). Farming in WB is done semi extensively, oriented towards utilization of grassland and pasture areas.
A predominant sheep breed in Norway is the Norwegian White Sheep (NWS). It constitutes 76.2% of all sheep flocks in Norway (Domke et al., 2011). NWS is a crossbreed composed of Dala, Rygja, Steigal and Texel breeds selected for fast growing lambs, good reproduction and high meat yield (Boman, et al., 2010). NWS rearing is intensive, but lamb and sheep graze outdoors during the summer. An adult sheep can reach up to 100 kg live weight. Norwegian lambs grazing in specific regions are marketed by origin (e.g. Gourmet lamb from the mountains in Central Norway; Lofot-lamb from the mountainous islands of North Norway).
The research on NWS meat quality began in 1990, but is still not extensive. Meat quality characteristics such as typical EU grade scores, fat content, fatty acid composition (only adipose tissue), color, flavor and sensory traits have

Effects of different production systems…
205
been reported to depend on grazing regions (Ådnøy et al., 2005; Lind et al., 2009). The fattening of lambs on nutrition rich pastures lowered n-6/n-3 FA ratio, while fattening on a concentrate-based diet lowered the content of C18:3 (n-3) fatty acids and intensity of acid taste (Lind et al., 2009).
The aim of this study was to: 1) describe the meat quality characteristics of Western Balkan PP and VP breeds grazing in typical regions; 2) compare sheep and lamb meat quality from WB regions with a crossbreed NWS from Norwegian mountains developed for intensive meat production; 3) describe the meat quality variations within each meat production group.
Materials and Methods Grazing regions
All three grazing regions are characterized by a complex, but different floristic composition.
WB: PP animals were collected in 2012 from the grazing region Ljubišnja, at an altitude of 900-1300m. The MN pastures are unique areas of fragmented mountain grasslands with trees and bushes. Poetum violaceae, Festucetum ovinae, Festucetum rubra-falax, Festucetumvalesiaca, Nardetum strictae, Brometum erectistrictae predominate the floristic composition of the grasslands up to 1200 m (Dubljevic, 2009). VP animals were collected in 2012 from the Vlašić grazing region, at an altitude of about 1500 m. The grazing region of VP is characterized by fragmented mountain grasslands, separated by trees and bushes. Poa pratensis, Bromus racemosus, Dactylis glomerata, Briza media, Lotus corniculatus, Trifolium pratense, Trifolium repens, Vicia sativa and Pteridium aquilinum dominate floristic composition (Alibegovic-Grbic, 2009).
Norway: NWS animals were collected in 2012 from grazing regions in central and southeast Norway at an altitude 500-1700 m. The region is about 40 000 km2, and covers the production of Gourmet lamb. At an elevation of 500-900 m, the grazing area is characterized by spruce and pine forests, while at an elevation of 900-1700 m by scarce birch forests with little grass. Avenella flexuosa, Luzula pilosa, Festuca ovina, Anthoxanthum odoratum, Agrostisca pillaris, Deschampsia cespitosassp.cespitosa, Carex spp. are floristically predominant (Lunnan and Todnem, 2011).
Only the 4 years old NWS were fed indoor their last 3 months after the outdoor grazing period on the concentrate and local grass silage.
Slaughtering

M. Bjelanović et al.
206
Totally 92 Longisimus thoracis at lumborum (LTL) sheep/lamb samples were collected from 3 countries.
B&H: LTL was collected at “BB” Kotor Varoš, a traditional slaughterhouse, from 15 female sheep (age 4-5 years) and 15 lambs (age 5-6 months). Traditional slaughtering without stunning was used. The handling of post mortem (pm) was set up to reduce the effect of cold shortening, i.e. by a controlled temperature drop. MN: LTL was collected from 15 female sheep (age 4-5 years) at the meat production company Franca, Bijelo Polje. We were not able to collect the lambs from MN, because there was not a sufficient number of female lambs ageing 5-6 months from the same herd in a small production area. In addition, lambs are not commonly raised to age 5-6 months to be slaughtered for meat consumption. Norway: LTL from 14 female sheep (age 4-5 years) and 15 female sheep (age 2 years) as well as from18 lambs in an early fattening phase (9 ecologically fed) were collected at the Nortura Gol slaughter plant. The only difference between ecological and conventional production was the lower level of the fatty acid C22:6 (n-3) in ecological lamb, and therefore these two groups were merged into a single group in all analysis.
The carcasses in Norway and MN were exposed to low electrical stimulation, and then returned to the chiller (4 C). All LTL samples were cut along the carcass length and vacuum-packed in the cutting room ≤ 5 h at 10 C, before being returned to the chiller. The vacuum packaged samples were transported on ice to the laboratories 24 h pm.
One LTL from each animal was stored at 4°C for 7 days and then sliced, vacuum-packed and frozen. The second LTL was cut in pieces suitable for the intended measurements, vacuum-packaged and stored at – 80°C, for tenderness measurements at – 40°C.
Meat quality assessments
pH: In Norway and MN, the pH value was measured 24 h pm (pH24) using the Knick Portamess Model 913 (Knick, Berlin Germany), while in B&H using the HANNA Model 99161 (Cluj-Napoca, Romania). Both instruments were calibrated with commercial standard solutions.
Color stability: Fresh meat samples (24 h pm) were sliced into 2 cm thick
cuts, and placed on trays (Polystyrene Weigh Boats 85x85x24mm, VWR International, Darmstadt, Germany) over-wrapped with oxygen-permeable polyvinyl chloride film (PVC) and stored at 4°C. One hour after slicing was denoted as time zero. The meat color was determined in triplicates on slices after 4, 72 and 144 h chill storage. The meat surfaces were turned up, towards the cling wrap, during measurements at a temperature of 19°C. Norway: Konica Minolta Spectrophotometer CM 700d (Konica Minolta Sensing Inc., Osaka, Japan)

Effects of different production systems…
207
calibrated by a white ceramic calibration cap (CM-A177) was used. The light source was a pulsed xenon lamp. Illuminant D65 (Daylight, color temperature 6504 K) with a 10º observer (CIE Konica-Minolta 1964) was used. B&H: Konica Minolta Spectrophotometer CM 2600d (Konica Minolta Sensing Inc., Osaka, Japan) calibrated by a white ceramic calibration plate (CM-A145). The light source, standard illuminant and observer was the same as in Norway. MN: Color-Tec PCM+ (ColorTec, Clinton-New Jersey, USA) 20 mm reflectance colorimeter was used. The light source was a light emitting diode (LED) array.
To secure that the measurements were comparable in the 3 countries, seven paint codes (black, white and 5 shades of red) from ”JOTUN" A/S (Sandefjord) were measured in Norway, B&H and MN and used to calculate and correct for instrumental differences.
Warner Bratzler tenderness measurements: Slices (4 cm), thawed
overnight and heated at 72°C in the core of the samples, were cooled on ice up to approximately 20°C. Sensors inserted in dummy samples recorded internal temperatures. Muscle samples (1×1×4 cm) were cut in parallel to the fiber direction, and sheared across the fiber direction. Norway: shear cell HDP/BSK Warner Bratzler, load cell 25 kg, TA-HDi Texture Analyser, Stable Micro Systems, Godalming, UK. MN/B&H: Shear cell HDP/BS Warner Bratzler, load cell 25 kg, TA.XT, PLUS, Texture Analyser, Stable Micro Systems, Godalming, UK. The number of replicates was 6-8. In order to transfer data between labs, a rubber was split in two and each half was measured in each country, and a factor was calculated to transfer data from one instrument to another one.
Cooking loss (% weight loss): Cooking loss (%) was calculated as a
percent difference between the fresh and heated samples weights. Chemical composition
Protein Content: Nitrogen content was determined using the Kjeldahl method as described by ISO 937:1992 (ISO, 1992). Total Kjeldahl nitrogen was converted to protein by conversion factor 6.25.
Water content: Water content in meat samples was determined, according to the AOAC Official Method (AOAC 950.46, 1950) in three replicates.
Fat content and fatty acid composition: Fat content was determined according to the AOAC Official Method (AOAC 991.36, 1996), and fatty acid composition according to the O’Fallon method (2012).
Vitamin E content: The measurements were carried out by applying the procedure of Triumf et al. (2012), with modification of the centrifugation time.
2,2-diphenyl-1-picrylhydrazyl (DPPH), total antioxidant capacity: The
antioxidant capacity was determined by using DPPH, according to the procedure

M. Bjelanović et al.
208
described by Brand-Williams et al. (1995), with some modifications. Meat pieces (0.5 g) were added to 4 ml of DPPH in ethanol (0.050mg/ml). The homogenates were incubated (50 min) in the dark at room temperature. Trolox solutions were used as a standard. The samples were shortly vortexed and centrifuged at 2534 x g for 5 min. The reduction of DPPH was measured by Synergy H4, Hybrid Multi-Mode Microplate Reader from BioTek Instruments Inc., P.O. Box 998 (Highland Park, Winooski, Vermont 05404-0998 USA) at 515 nm after 60 min incubation (until stable absorptions values were obtained). The percentage of DPPH-scavenging activity was calculated as (Ao-At)/(Ao)x100, where Ao was the absorbance of the control and At was the absorbance in the presence of the sample after 1 h of incubation.
Cathepsin B analysis: The assay was based on the procedure of Barret
and Kirschke (1981), with some modifications. The frozen meat was pulverized (IKA 11 basic Analytical mill, Germany). Meat (1 gram) was mixed with 10 ml extraction buffer (containing 0.25 M of sucrose and 1 mM EDTA in 0.2 M KCL; pH 6.0, adjusted with NaOH). After adjusting the pH of the extraction buffer 0.2 (w/v) Triton X100 was added. The meat homogenates were vigorously shaken and centrifuged (VWR by Hitachi Koki, CT 15E, Japan) at 1946 x g for 20 min at 4°C.The supernatant was mixed with 100 μl buffer, 50 μl Milli-Q water and 100 μl stock solution (15mM Z-Arg-Arg-AMC in 100% DMSO). The blank sample contained 150 μl Milli-Q water, 100 μl assay buffer (containing 0.2 sodium acetate, 4mM EDTA and 8 mM DTT, the final pH 6.0 was adjusted with NaOH) and 50 μl supernatant.
The stock solution of the standard contained Milli-Q water, 7-methyl-coumarin amide MCA (1mM MCA in 100% DMSO) and assay buffer. The assay buffer and the diluted extract were incubated in Synergy H4 Hybrid Multi - Mode Microplate Reader (BioTek Instruments. Inc. USA) at 40°C for 30 min. The excitation wavelength was 340 nm, and the emission was monitored at 460 nm.
Heme pigment /hemin analysis: The method was based on the procedure
described by Lombardi-Boccia et al. (2002), adapted to Eppendorf tubes. Total peroxide value using the ferric-xylenol orange method: The
frozen and aged samples were prepared according to the procedure described by Yi et al. (2013).
TBARS: Lipid oxidation was assessed by the TBARS (thiobarbituric acid reactive substances) assay on the aged samples.Two g frozen meat was pulverized (IKA 11 basic Analytical mill, Germany) and mixed with 10 ml stock solution (0.375 % TBA and 15% TCA in 0.25 N HCl). All samples were treated in a water bath at 98 °C for 10 min and cooled on ice for the next 30 min. Solutions under the upper fat layer (1.5 ml) were carefully removed and centrifuged for 25 min at

Effects of different production systems…
209
25 186 x g and 4oC. The absorption (at 532 nm) of the supernatant was measured immediately after centrifugation using Shimadzu UV-1800 (Shimadzu corp. Kyoto, Japan).
Statistical analysis: All statistical analyses were performed using one way ANOVA or a general linear model (Minitab version 16 or 17, Minitab Ltd., Coventry) in combination with Tukey's test for individual comparisons. Significant differences were reported for P≤0.05. Results and Discussion Physical characteristics of sheep/lamb LTL
Carcass characteristics: Carcass weight, fat and conformation grading, tenderness, cooking loss and pH24 for the six different age and breed categories are shown in Table 1. NO carcasses had nominally higher slaughter weights when compared to carcasses from WB. The carcasses from NO and B&H lambs had similar slaughter weights. The B&H sheep were small, had more fat, but good conformation score (Table 1), while the B&H lamb had the lowest fat and conformation score. The conformation score was highest for NO lambs. Due to unusual WB weather conditions in 2012 with pasture in surplus, the WB sheep and lamb were slaughtered one month later than usual; consequently the animals were also fatter (Bjelanovic et al., 2013). A significant difference (P< 0.001) in fatness and conformation score was found between groups.
Table 1. Carcass and meat physical quality assessments (mean and standard error square).
Norwegian white sheep WB Pramenka sheep NO old NO young NO lamb MN sheep B&H sheep B&H lamb
Age (years) 4-5 2 0.5 4-5 4-5 0.5-0.6 Carcass w. (kg) 30.4(±5.2)ab 33.1(±3.2)a 17.1(±2.6)d 27.3(±3.6)bc 25.0(±3.1)c 16.0(±1.7)d
EU fatness s.* 8.0(±1.4)b 7.4(±0.8)b 5.6(±1.3)c 7.7(±1.3)b 9.8(±1.0)a 5.1(±1.2)c
EU conformation s.** 5.0(±0.0)b 7.6(±0.6)a 8.0(±0.0) a 5.3(±1.5)b 7.9(±1.6) a 3.4(±0.9)c
pH 5.55(±0.12)b 5.61(±0.07)ab 5.64(±0.07)ab 5.75(±0.08)a 5.75(±0.25)a 5.75(±0.15)a >pH 5.8 0/14 0/15 0/18 4/15 2/15 0/15 SF (N/cm2)*** Range
52.4(±10.4)a
38-70 54.6(±12.3)a
37-77 40.1(11.06)bc
25-60 47.4(±7.9)ab
28-83 38.9(±6.1)bc
25-66 31.8(±5.9)c
25-42 >50 (N/cm2) 4/14 8/15 4/18 3/15 1/15 0/15 Cooking loss (%) 20.5(±5.1)ab 19.3(±4.2)b 21.8(±5.1)ab 25.4(±4.9)a 18.1(±1.7)b 21.5(±5.2)ab
*Scale 1-15 points:1=P-; 2=P (poor);3=P+; 4=O-; 5=O(normal); 6=O+; 7=R-; 8=R (good), 9=R+; 10=U-; 11=U(very good); 12=U+, 13=E-; 14=E (excellent), and 15=E+ **Scale 1-15 points:1=1-; 2=1(very scarce); 3=1+; 4=2-;5=2 (scarce); 6=2+; 7=3-; 8= 3 (medium); 9=3+; 10=4-; 11=4 (important), 12=4+; 13=5-; 14=5 (excellent), and 15=5+ ***8 days p.m. abcd Row means within factors with different letters indicate statistically significant differences at (P< 0.001).

M. Bjelanović et al.
210
Sheep and lamb meat quality related characteristics: Mean pH24 ranged from 5.55 to 5.75 (Table 1). A significant difference between groups in pH24 (P< 0.001) was found. pH was higher in WB than in NO samples. This may indicate less stress in NO animals when slaughtered (Martınez-Cerezo et al., 2005), or less type I fibers (Park et al., 1987). PS is an indigenous breed, and may uphold its natural instincts (i.e. fear) and sensitivity to stress. Stress results in excretion of adrenaline causing a series of biochemical changes that indirectly catalyze the breakdown of glycogen ante mortem (am), leading to an elevated muscle pH24 (Voisinet et al., 1997). Priolo et al. (2002), also connected higher ultimate pH to physical activity of animals and extensive production system.
Generally, the samples from WB sheep and lamb were significantly tenderer when compared to NO sheep and lamb, and this may depend both on breed and production system in agreement with Guerrero et al., (2013). Meat samples from B&H sheep and lamb were tenderer compared to the other groups. The samples from young NO were the toughest, while the MN sheep varied the most (Table 1). Meat with shear force scores above 50 N/cm2 is regarded as tough (Davey, Gilbert, and Carse, 1976) and will be discounted by consumers. The breeding aim for higher muscular mass is often at the expense of lower tenderness and lower IMF content (Więcek et al., 2008). Cooking losses were highest in the MN samples (Table 1). This may reflect these samples lower protein content (Table 2).
The average changes in surface meat color parameters (L*a*b*) during the aerobic storage were significantly different among groups (Figure 1 a,b). The first measurement (4 h) would reflect a bloomed sample with dominantly oxy-myoglobin (OMb) in the surface. A decline in L* and a* with time would be interpreted as conversion to meat-myoglobin (MMb). Surface L* may increase due to microbial growth after prolonged storage in air.
L* (lightness) was always higher in WB animals (Figure 1a) with B&H lamb having the highest initial L* value. L* increased/remained the same for 72 h, except for the young NO and B&H sheep. L* may dependent on production system. Some authors have reported darker meat from extensive production systems (Mancini and Hunt, 2005;Priolo et al., 2002), but Lorenzo et al. (2014), reported a higher L* value in meat from a free extensive production system. This phenomenon may be explained by a higher IMF level in meat from extensive production systems (Priolo et al., 2002).

Effects of different production systems…
211
Figure 1a. The average changes in L* during aerobic incubation for different sheep/lamb groups and times. Different letters indicate significant (P<0.05) differences.
The variable a* was not dependent on production system. Four h post mortem, only the NO lamb and B&H sheep had low a* values. This could be due to low color stability for the NO lamb or the higher fat level in B&H sheep (Table 1). The variable a* of MN sheep declined after 72 h, but still retained a higher level than in the other groups. a* of the B&H sheep declined only moderately from 4 to 72 h. The color stability of NO sheep, using a* as an indicator, was lower than in MN sheep and B&H sheep (Figure 1b). For lamb, a* declined the least for the NO lamb.
Figure 1b. The average changes in a* during aerobic incubation for different sheep/lamb groups and times. Different letters indicate significant (P<0.05) differences.

M. Bjelanović et al.
212
NO young sheep and NO lamb had the lowest b* and a much lower b* than NO old (not presented). Interestingly, b* was also high in B&H meat. Differences in muscle lightness and yellowness can be attributed to dietary effects on pre-slaughter glycogen and on marbling levels (Mancini and Hunt, 2005) while differences in a* depend largely on heme amount, myoglobin states plus marbling.
Composition of sheep/lamb LTL
The iron concentration in meat is highly dependent on breeding, age, sex and muscle type of the animal (Lombardi-Boccia et al., 2002). As expected, heme was highest in older sheep and lowest in lambs (Table 2). There was no difference in heme between NO and B&H lambs, but NO lambs had the nominally lowest heme concentration (0.15 mg/ml).
Water content depended on age and was higher in younger compared to older and more fatty animals. The low water content in B&H sheep meat was related to its higher fat content (supported by Table 1 and 2). Breed combined with production system had no significant impact on dry matter.
Table 2. Meat chemical quality assessments (mean and standard error square). Norwegian white sheep WB Pramenka sheep NO old NO young NO lamb MN sheep B&H sheep B&H lamb
Heme (mg/ml) 0.23(±0.05)a 0.21(±0.04)ab 0.15(±0.03)c 0.24(±0.04)a 0.21(±0.05)ab 0.18(±0.03)bc
Water content* 73.13(±0.6)b 73.42(±1.0)b 75.30(±0.9)b 73.15(±0.4)b 70.93(±0.6)c 75.83(±0.4)a Dry matter* 26.87(±0.6)b 26.58(±0.9)b 24.69(±0.6)b 26.85(±0.4)b 29.07(±0.6)a 24.17(±0.4)c Protein content* 21.38(±0.9)a 21.61(±0.9)a 20.56(±0.6)b 17.12(±0.4)c 20.49(±0.6)b 20.63(±0.4)b
Fat content* 3.88(±0.5)b 3.38(±0.2)b 2.58(±0.6)c 7.46(±0.8)a 7.39(±0.4)a 2.35(±0.1)c Vitamin E (mg/100g) 0.23(±0.04)ab 0.12(±0.05)c 0.09(±0.07)c 0.29(±0.15)a 0.22(±0.08)ab 0.16(±0.06)bc
Vitamin E/Fat (mg/100g) 0.07(±0.05)ab 0.03(±0.03)b 0.05(±0.04)b 0.04 (±0.02)b 0.04(±0.02)b 0.11(±0.05)a
DPPH (total antioxidant)* 66.2(±5.2)b 66.5(±3.3)b 66.3(±4.8)b 70.9(±2.6)a 68.7(±3.7)ab 72.7(±3.7)a
Cathepsin B** 0.33(±0.07)ns 0.33(±0.04)ns 0.30(±0.03)ns 0.32(±0.05)ns 0.31(±0.04)ns 0.32(±0.03)ns TBARS*** 0.33(±0.13)ab 0.33(±0.21) ab 0.22(±0.05)b 0.47(±0.25)a 0.23(±0.23)b 0.43(±0.03)a
* expressed in % ** μM MCA/min/g meat *** 8 days p.m. / mg malondialdehyde/kg abcdRow means within factors with different letters indicate statistically significant differences at(P< 0.001) except TBARS (P<0.005).
Protein content was significantly different among all animal groups (Table 2). Both old and young NO had higher protein content than B&H and MN sheep. MN sheep had the lowest protein content, but with no difference for lamb groups. Hofman et al. (2003) reported that the muscles with the highest protein content were characterized by lower fat content. NO sheep had a more favourable fat/protein ratio (Table 2) in agreement with general breeding goals. The results also indicated that old and young NO sheep, with the highest protein content, were

Effects of different production systems…
213
less tender (Table 1). This can again relate to types of muscular fibers. Wood et al. (1999) suggested that genetic selection for modern breeds with increased meat yield and lean content increases the proportion of white glycolytic fibers (type IIB), and consequently less tender meat (Karlsson et al., 1993).
Vitamin E (α-Tocoferol) is a fat-soluble vitamin. Its content was significantly different among all six animal groups (Table 2). Green pasture or supplementation in feeds increase vitamin E in meat (Jose et al., 2008). Vitamin E can delay OMb oxidation via inhibition of lipid oxidation (Faustman et al., 1998). Color and lipid stability of fresh beef longissimus muscle can be improved if α-tocopherol concentrations of tissues is between 3.0 to 3.3 μg α-tocopherol/g meat (Faustman et al., 1989). MN sheep had a high concentration of vitamin E (0.29 mg/100g), close to this threshold. This can be a possible explanation of the delayed OMb convertion to MMb in MN sheep. Older sheep groups had a higher vitamin E concentration than younger groups. Unexpectedly, vitamin E/fat (mg/100g fat) was nominally highest in B&H lamb, and significantly different from the other groups (Table 2).
α-Tocoferol level isinteresting from a nutritional perspective, assuming that its antioxidative power protects cells against the effects of free radicals which can contribute to the development of chronic diseases like cancer and cardiovascular diseases. This vitamin can enhance the immune function and block the formation of cancerogenous nitrosamines in the stomach from nitrates used as additive in food products. Vitamin E also prevents against cataracts (Daley et al., 2010).
Cathepsin B is a relevant enzyme for dry cured sheep production since its level is closely related to textural defects during the ripening phase of pig hams (Priolo et al., 2002). The activity of cathepsin B in LTL (Table 2) did not differenciate between groups, only within groups; the highest variation was for old NO and MN sheep. The variation was lowest for NO lamb and B&H lamb.
Table 3 shows average values and standard errors (SE) of intramuscular fatty acid composition (mg/100 g meat). The concentrations of total fatty acids were age dependent. Sheep had more total fatty acids than lambs, and WB sheep more than NO in agreement with their amount of total fat (Table 2). The concentration of the polyunsaturated fatty acids C18:2 (n-6) and C18:3 (n-3) showed the greatest variation, as indicated by their SE, while the concentration of C20:4 (n-6), C20:5 (n-3), C22:5 (n-3) and C22:6 (n-3) showed the lowest SE. The total amount of saturated fatty acids (SFA), monounsaturated fatty acids (MUFA) and PUFA was also age dependent, and significantly higher in older animals. The percentage of PUFA dropped with age, but was also significantly dependent on production systems, as described by Enser et al. (1998). The nominally highest % SFA was found in MN sheep.

M. Bjelanović et al.
214
Table 3. Fatty acid composition (mean and standard error square). Norwegian white sheep WB Pramenka sheep NO old NO young NO lamb MN sheep B&H sheep B&H lamb
C18:2 n-6 Linoleic acid*
1.81(±1.58)ab 1.93(±0.72)ab 0.98(±0.27)c 2.34(0.84)a 2.21(±0.69)a 1.17(±0.24)bc
C18:3 n-3 α-Linolenic acid*
1.15(±1.33)a 1.49(±0.73)a 0.49(±0.17)b 1.42(±0.76)a 1.06(±0.45)ab 0.43(±0.10)b
C20:4 n-6 Arachidonic acid*
0.32(±0.03)b 0.39(±0.08)ab 0.33(±0.06)b 0.33(±0.04)b 0.38(±0.04)ab 0.43(±0.07)a
C20:5 n-3 Eicosapentaenoic acid*
0.20(±0.02)b 0.24(±0.05)a 0.20(±0.04)b 0.17(±0.03)bc 0.17(±0.03)c 0.16(±0.03)c
C22:5 n-3 Docosapentaenoic acid*
0.26(±0.11)b 0.36(±0.10)a 0.21(±0.04)b 0.27(±0.06)b 0.25(±0.05)b 0.22(±0.04)b
C22:6 n-3 Docosahexaenoic acid*
0.07(±0.02)bc 0.10(±0.04)a 0.06(±0.02)c 0.09(±0.03)ab 0.09(±0.01)ab 0.09(±0.02)ab
n-6/n-3* 1.37(±0.17)b 1.12(±0.15)c 1.44(±0.15)b 1.46(±0.15)b 1.73(±0.20)a 1.84(±0.14)a
SFA* 30.87(±42.48)a 27.66(±14.77)ab 8.67(±1.87)b 47.41(±23.20)a 29.51(±10.61)a 7.51(±2.69)b
MUFA* 29.12(±41.93)a 22.11(±12.69)abc 6.78(±1.68)c 36.77(±16.54)a 24.97(±10.41)ab 6.5(±2.57)bc
PUFA* 3.88(±3.09)ab 4.58(±1.65)a 2.33(±0.55)c 4.71(±1.70)a 4.23(±1.21)a 2.55(±0.46)bc
* mg/100g meat abcdRow means within factors with different letters indicate statistically significant differencesat (P< 0.001).
Total amounts of C18:2 (n-6) was higher in sheep compared to lamb. Total amounts of α-Linolenic acid C18:3 (n-3) tended to follow this pattern. Sañudo et al. (2006) reported similar results for Spanish and British lambs. Old NWS had the greatest amount of n-3 LC-PUFA.
The ratio n-6/n-3 was still favorable for lamb/sheep (Russo, 2009). Interestingly, this ratio showed no variation with age in both NO and B&H systems. But the n-6/n-3 ratio was significantly higher for B&H sheep and lamb (Table 3) than other systems. The ratio n-6/n-3 was the lowest in young NO sheep. C18:3 (n-3) is regarded as the preferred fatty acids leading to C20:5 (n-3), docosapentaenoic acid C22:5 (n-3), and docosahexaenoic acid C22:6 (n-3) (Brenna et al., 2009). Additionally, it inhibits the conversion of C18:2 into the others n-6 LC-PUFA (Smink et al., 2012).
A favorable n-6/n-3 ratio is important for the regulation of SFA in human body. The dietary SFA can raise unfavorable blood lipids, but sufficient intake of n-3 PUFA can neutralize this effect (Dias et al., 2014), and prevent coronary heart diseases, diabetes 2, obesity and cancer. The SFA intake is a major contributor to calcium, vitamin D, vitamin B12 and the other essential nutrients absorption; a reducing of SFA without substituting lower-fat versions may result in serious unintended nutritional consequences (Huth et al., 2013).

Effects of different production systems…
215
Oxidative stability measurements
The total antioxidant activity method detects the ability of a matrix to eliminate an unpaired valence electron in DPPH (Dawidowicz, Wianowska, and Olszowy, 2011). Low DPPH values are therefore favorable. The total antioxidant activity was highest in NO meat (Table 2). Antioxidant activity was not affected by the age of the animals.
TBARS values above 0.5 are considered as critical and indicate a lipid oxidation level which produces a rancid odor and taste that can be recognized by consumers (Wood et al., 2008). TBARS was significantly different among the groups (Table 2). After 7 days of aging at 4ºC, TBARS acumulation in NO old and young was equal. NO lamb had the lowest TBARS value, while MN sheep and B&H lamb had the highest. B&H sheep had the lowest TBARS among sheep groups. The TBARS value of 0.47 in MN sheep was near the threshold of 0.5 suggesting that the high fat content and poor ratio vitamin E/fat content may have some impact on its low oxidative stability (Table 2). All together factors such as concentration of the fat, heme pigment and antioxidant status in the muscle tissue can influence color stability and FA oxidation, and are tightly related to the diet (Ponnampalam et al., 2012). Lourenço et al. (2007) suggested that different grazing regions can induce changes in the rumen microbial population, and therefore differences in the biohydrogenation of PUFA. Dietary effects in form of different grass types might have an impact on the FA composition in ruminants. Lee et al. (2003) suggested that white clovers (Trifolium repens) can limit biohydrogenation of n-3 PUFA. It seems that vitamin E had a positive impact on color stability in MN sheep, but not on FA oxidation stability.
Polar peroxides (0.12-0.39 mmol/kg meat) originating from lipids (Volden et al., 2011) were highest in VP lamb followed by NO old and young. Proteins bound peroxides (Yi et al., 2013) also varied significantly among groups from 0.09 in MN sheep to 0.191 mmol/kg in NO old. No significant difference was found for unpolar (chloroform soluble) peroxides. These data are partly in agreement with TBARS (Table 2).
Conclusion
The different production systems influenced meat color, pH, tenderness and fatty acid composition. Pramenka sheep, collected from their natural grazing areas, were smaller animals with more fatty carcasses relative to NWS from Hardangerevidda and Jotunheimen regions. WB meat (LTL) had higher pH24, and a low protein to IMF ratio. Its total antioxidant capacity was lower, and the n-6/n-3 ratio tended to be higher. The marketing potential of PS meat seems to be related to its higher color stability and good tenderness. This quality can be used to

M. Bjelanović et al.
216
encourage the production of B&H sheep and lamb in future. The marketing advantages of NO carcasses seemed related to their high protein/fat ratio, low n-6/n-3 ratio and good antioxidant capacity.
B&H sheep were muscular but with more fat, lower water content and lower cooking losses, lower L*a* b* with higher n-6/n-3 and became more rancid than MN sheep. The B&H lambs were smaller than NO lambs, with a higher level of vitamin E, but lower antioxidant capacity, more TBARS and less EPA and higher n-6:/n-3 ratio. Its marketing potential seemed only related to its high vitamin E content while the marketing potential of NO lamb seems related to its good oxidative stability with a favorable n-6/n-3 ratio.
Acknowledgment
The work was supported by grant no. FR184846/I10 and no 225309
(Small ruminant flavor; Norway part) from the Research Council of Norway and from HERD project “Comparison of lamb Carcass and meat quality of Breeds in Western Balkan and Norway achieving improved palatability, sale and sustainability”. We thank Yngve Rekdal, and Gunnar Klemestsdal for their constructive comments for the manuscript. Special thanks to Biljana Rogić and BožoVažić for support of this project.
Uticaj različitih proizvodnih sistema na kvalitet mesa trupova ovaca i jagnjadi Zapadnog Balkana i Norveške M. Bjelanović, V. Grabež, G. Vučić, A. Martinović, L. R. Lima, B. Marković, B. Egelandsdal Rezime
Definisanje kvaliteta mesa odabranih rasa ovaca i jagnjadi koje su bile na ispaši u posebnim regijama je od velike važnosti u postizanju tržišne konkurentnosti. U ovom eksperimentu korišten je mišić Longisimus thoracis at lumborum (LTL) autohtonih zapadno-balkanskih(WB) ovaca i jagnjadi vlašićke pramenke (VP) koje su bile na ispaši na planiniVlašić u Bosni i Hercegovini. Također je korišten LTL od ovaca pivske pramenke (PP) koje su bile na ispaši na planini Ljubišnja u Crnoj Gori. Kvalitet mesa trupova i LTL-a autohtonih balkanskih ovaca upoređivani su sa trupovima norveških belih ovaca i jagnjadi (NWS), koje su bile na ispaši u regionu hardangerske visoravni i Jotunheimen regiona. Jagnjeće meso iz ovih regiona smatra se gurmanskim proizvodom.

Effects of different production systems…
217
U poređenju sa NWS ovcama rase pramenka ovaca imale su nižu prosečnu težinu, manji oksidativni kapacitet, veću konačnu pH vrednost, intramuskularnu masnoću kao i viši odnos n-6/n-3, bolju mekoću mesa i stabilnost boje. Jagnjad zapadno-balkanske pramenke su imala nešto manju masu, viši odnos n-6/n-3, slabiji oksidativni kapacitet, njihovo meso je veoma brzo užeglo, bez obzira na viši sadržaj α- tocopherola. Tržišna prednost mesa zapadno-balkanskih rasa je u njihovoj mekoći, dok NWS jaganjci imaju bolji nutritivni profil.
References
ÅDNØY, T. H., SØRHEIM, O., THOMASSEN, M. S., VARSZEGI, Z., & EIK, L. O. (2005): Grazing on mountain pastures - does it affect meat quality in lambs? Livestock Production Science, 94, 25-31. ALIBEGOVIC-GRBIC, S. (2009):Country Pasture/Forage Resource Profiles. FAO Country Report. FAO. BARRET, J., & KIRSCHKE, H. (1981): Methods in Enzymology, Proteolytic Enzymes Part C. 535-561. BJELANOVIC, M., VUCIC, G., MARKOVIC, B., BERG, P., & EGELANDSDAL, B. (2013): Comparison of Meat and Quality Characteristics Between Norwegian White Sheep and Western Balkan Pramenka Sheep. http://icomst2013.org/t/e-book/papers/poster/S5-59.pdf BOMAN, I. A., KLEMETSDAL, G., NAFSTAD, O., BLICHFELDT, D., & VÅGE, D. I. (2010):Impact of two myostatin (MSTN) mutations on weight gain and lamb carcass classification in Norwegian White Sheep (Ovis aries). Genetics Selection Evolution (42-4). BRAND-WILLIAMS, W., CUVELIER, M. E., & BERSET, C. (1995): Use of a free radical method to evaluate antioxidant activity. LWT - Food Science and Technology ,28, 25-30. BRENNA, J. T., SALEM, N. J., SINCLAIR, A. J., & CUNNANE, S. C. (2009): α-Linolenic acid supplementation and conversion to n-3 long-chain polyunsaturated fatty acids in humans. Prostaglandins, Leukotrienes and Essential Fatty Acids, 80, 85-91. CALKINS, C. R., & SEIDEMAN, S. C. (1988): Relationships Among Calcium-Dependent Protease, Cathepsins B and H, Meat Tenderness and the Response of Muscle to Aging. Journal of Animal Science, 66, 1186-1193. CARRASCO, S., RIPOLL, G., SANZ, A., ÁLVAREZ-RODRÍGUEZ, J., PANEA, B., REVILLA, R., JOY, M. (2009): Effect of feeding system on growth and carcass characteristics of Churra Tensina light lambs. Livestock Science, 121, 56-63. CINKULOV, M., POPOVSKI, Z., PORCUK., TANASKOVSKA, B., HODZIĆ, A., BYTYQI, H., MEHMETI, H., MARGETA, V., DJEDOVIĆ, R., HODA, A., TRAILOVIĆ, R., BRKA, M., MARKOVIĆ, B., VAZIĆ, B., VEGARA, M.,

M. Bjelanović et al.
218
OLSAKER, I., & Kantanen, J. (2008): Genetic diversity and structure of the West Balkan Pramenka sheep types as revealed by microsatellite and mitochondrial DNA analysis. Journal of Animal Breeding and Genetics, 125, 417-426. COCKETT, N. E., SMIT, M. A., BIDWELL, C. A., SEGERS, K., HADFIELD, T., SNOWDER, G. D., GEORGES, M., & CHARLIER, C. L. (2004): The callipyge mutation and other genes that affect muscle hypertrophy in sheep. Genetics Selection Evolution,27, 65-81. DALEY, C. A., ABBOTT, A., DOYLE, P. S., NADER, G. A., & LARSON, S. (2010): A review of fatty acid profiles and antioxidant content in grass-fed and grain-fed beef. Nutrition Journal, 9:10. DAVEY, C., GILBERT, K., & CARSE, W. (1976): Carcass electrical stimulation to prevent cold shortening toughness in beef. New Zealand Journal of Agricultural Research, 19, 13-18. DAWIDOWICZ, A., WIANOWSKA, D., & OLSZOWY, M. (2011): On practical problems in estimation of antioxidant activity of compaunds by DPPH method (Problems in estimation of antioxidant activity). Food Chemistry, 131, 1037-1043. DIAS, C. B., GARG, R., WOOD, L. G., & GARG, M. L. (2014): Saturated fat consumption may not be the main cose of increased blood lipid levels. Medical Hypotheses, 82, 187-195. DOMKE, A. V., CHARTIER, C., GJERDE, B., LEINE, N., VATN, S., ØSTERÅS, O., & STUEN, S. (2011):Worm control practice against gastro-intestinal parasites in Norwegian sheep and goat flocks. Acta Veterinaria Scandinavica, 1-9. DUBLJEVIC, R. (2009). Country Pasture/Forage Resource Profiles. FAO Country Report. FAO. ENSER, M., HALLETT, K., HEWITT, B., FURSEY, G., & WOOD, J. (1998): Fatty acid content and composition of UK beef and lamb muscle in relation to production system and implications for human nutrition. Meat Science, 49, 329-341. FAUSTMAN, C., CASSENS, R. G., SCHAEFER, D. M., BUEGE, D. R., WILLIAMS, S. N., & SCHELLER, K. K. (1989): Improvement of pigment and lipid stability in Holstein steer beef by dietary supplementation with vitamin E. Journal of Food Science, 54, 858-862. FAUSTMAN, C., CHAN, W. K., SCHAEFER, D. M., & HAVENS, A. (1998): Beef Color Update: The Role for Vitamin E. Journal of Animal Science, 76, 1019-1026. GUERRERO, A., VALERO, M. V., CAMPO, M. M., & SAÑUDO, C. (2013): Some factors that affect ruminant meat quality: from the farm to the fork. Review. Acta Scientiarum. Animal Sciences, 35, 335-347. HERSLETH, M., NÆS, T., RØDBOTTEN, M., LIND, V., & MOTELEONE, E. (2012): Land meat- Importance of otrigin and grazing system for Italian and Norwegian consumers. Meat Science, 90, 899-907.

Effects of different production systems…
219
HOFMAN, L. C., MULLER, M., CLOETE, S. W., & SCHMIDT, D. (2003): Comparison of six crossdbred lamb types: sensory, physical and nutritional meat quality characteristics. Meat Science, 65, 1265-1274. HUTH, P. J., FULGONI, V. L., KEAST, D. R., PARK, K., & AUIESTAD, N. (2013): Major food sources of calories, added sugars, and saturated fat and their contribution to essential nutrient intakes in the U.S. diet: data from the national health and nutrition examination survey (2003-2006). Nutrition Journal, 12:116. JOSE, C. G., PETHICK, D. W., GARDNER, G. E., & JACOB, R. H. (2008): Vitamin E Will Improve the Colour Stability in Lamb; a Dose Rate Investigation. Proceedings of the 54th International Congress of Meat Science and Technology, 1-3. KARLSSON, A., ENFÄLT, A. C., ESSÉN-GUSTAVSSON, B., LUNDSTRÖM, K., RYDHMER, L., & STERN, S. (1993):Muscle histochemical and biochemical properties in relation to meat quality during selection for increased lean tissue grovth rate in pigs. Journal of Animal Science, 71, 930-938. LEE, M. R., HARRIS, L. J., DEWHURST, R. J., MERRY, R. J., & SCOLLAN, N. D. (2003): The effect of clover silages on long chain fatty acid rumen transformations and digestion in beef steers. Animal Science, 76, 491-501. LIND, V., BERG, J., EIK, L., EILERTSEN, S., MØLMANN, J., HERSLETH, M., AFSETH, N.K., HAUGLAND, E. (2009): Effects of concentrate or ryegrass-based diets (Lolium multiflorum) on the meat quality of lambs grazing on semi-natural pastures. Acta Agriculturae Scandinavica, Section A — Animal Science, 59, 230-238. LOMBARDI-BOCCIA, G., MARTÍNEZ-DOMÍNGUEZ, B., AGUZZI, A., & RINCÓN-LEÓN, F. (2002): Optimization of heme iron analysis in raw and cooked red meat. Food Chemistry, 78, 505-510. LORENZO, J., CRECENTE, S., FRANCO, D., SARRIÉS, M., & GÓMEZ, M. (2014): The effect of livestock production system and concetrate level on carcass traits and meat quality of foals slaughtered at 18 months of age. Animal, 8, 494-503. LOURENÇO, M., VAN RANST, G., DE SMET, S., RAES, K., & FIEVEZ, V. (2007): Effect of grazing pastures with different botanical composition by lambs on rumen fatty acid metabolism and fatty acid pattern of longissimus muscle and subcutaneous fat. Animal , 1, 537-545. LUNNAN, T., & TODNEM, J. (2011): Forage quality of native grasses in mountain pastures of southern Norway. Grassland Science in Europe, 16, 568-570. MANCINI, R. A., & HUNT, M. C. (2005): Current research in meat color. Meat Science, 71, 100-121. MARKOVIC, B., MARKOVIC, M., & ADZIC, N. (2007): The farm animal genetic resources of Montenegro. Biotechnology in Animal Husbandry, Belgrade-Zemun, 1-9.

M. Bjelanović et al.
220
MARTÍNEZ-CEREZO, S., SAÑUDOA, C., PANEA, B., MEDEL, I., DELFA, R. S., BELTRÁN, J., CEPERO, R., & OLLETA, J. L. (2005): Breed, slaughter weight and ageing time effects on physico-chemical characteristics of lamb meat. Meat Science, 69, 325-333. MARTINEZ-ROYO, A., JURADO, J. J., SMULDERS, J. P., MARTI, J. I., ALABART, J. L., ROCHE, A., FANTOVA, E., BODIN, L., MULSANT, P., SERRANO, M., FOLCH, J., & CALVO, J. H. (2008): A deletion in the bone morphogenetic protein 15 gene causes sterility and increased prolificacy in Rasa Aragonesa sheep. Animal Genetics, 39, 294-297. PARK, J. H., BROWN, R. L., PARK, C. R., MCCULLY, K., COHN, M., & HASELGROVE, J. (1987): Functional pools of oxidative and glycolytic fibers in human muscle observed by 31p magnetic resonance spectroscopy during exercise. Proceedings of the National Academy of Sciences of the USA, 84, 8976-8980. PONNAMPALAM, E. N., BURNETT, V. F., NORNG, S., WARNER, R. D., & JACOBS, J. L. (2012): Vitamin E and fatty acid content of lamb meat from perennial pasture or annual pasture systems with supplements. Animal Production Science, 52, 255-262. PORCU, K., & MARKOVIC, B. (2006): Catalogue of West Balkan Pramenka Sheep Breed Types. Identification and Conservation of Animal Genetic Resources in South Eastern Europe . Skopje, Macedonia. PRIOLO, A., MICOLA, D., AGABRIELA, J., PRACHEA, S., & DRANSFIELDB, E. (2002): Effect of grass or concentrate feeding systems on lamb carcass and meat quality. Meat Science, 62, 179-185. RUSSO, G. L. (2009): Dietary n S 6 and n S 3 polyunsaturated fatty acids: From biochemistry to clinical implications in cardiovascular prevention. Biochemical pharmacology, 77, 937-946. SAÑUDO, C., ENSER, M. E., CAMPO, M. M., NUTE, G. R., SIERRA, I., & WOOD, J. D. (2006): Fatty acid composition and sensory characteristics of lamb carcasses from Britain and Spain. Meat Science, 54 , 339-346. SMINK, W., GERRITS, W. J., GLOAGUEN, M., RUITER, A., & VAN BAAL, J. (2012): Linoleic acid and α-linolenic acid as precursor and inhibitor for the synthesis of long chain polyunsaturated fatty acids in liver and brain of growing pigs. Animal , 6, 262-270. TEXIERA, A., BATISTA, S., DELFA, R., CADAVEZ, V. (2005): Lamb meat quality of two breeds with protected origin designation. Influence of breed, sex and live weight. Meat Science, 71, 530-536. TRIUMF, E. C., PURCHAS, R. W., MIELNIK, M., MEHRE, H. K., ELVEVOLL, E., SLINDE, E., & EGELANDSDAL, B. (2012): Composition and some quality characteristics of the longissimus muscle of reindeer in Norway compared to farmed New Zealand red deer. Meat Science, 90, 122-129. VOISINET, B. D., GEANDIN, T., O'CONNOR, S. F., TATUM, J. D., & DEESING, M. (1997): Bos Indicus-Cross Feedlot Cattle with Excitable

Effects of different production systems…
221
Temperaments have Tougher Meat and a Higher Incidence of Borderline Dark Cutters. Meat Science, 46, 367-377. VOLDEN, J., BJELANOVIC, M., VOGT, G., SLINDE, E., SKAUGEN, M., NORDVI, B., & EGELANDSDAL, B. (2011):Oxidation progress in an emulsion made from metmyoglobin and different triacylglycerols. Food Chemistry, 128, 854–863. VUKASOVIČ, T. (2013): Attitude towards organic meat: an empirical investigation on West Balkans Countries (WBC) consumers. World's Polutry Science Journal, 69, 527-540. WIĘCEK, J., SKOMIAŁ, J., REKIEL, A., FLOROWSKI, T., DASIEWICZ, K., & KOSIŃSKA, M. (2008): Fattening and slaughter parameters in the first period of fattening of pigs fed restrictive or semi ad libitum diets. Polish Journal of Food and Nutrition Science , 58, 325-329. WOOD, J. D., ENSER, A., FISHER, A. V., NUTE, G. R., RICHARDSON, R. I., & SHEARD, P. R. (1999): Manipulating meat quality and composition. Proceedings of the Nutrition Society , 58, 363-370. WOOD, J. D., ENSER, M., FISHER, A. V., NUTE, G. R., SHEARD, P. R., RICHRDSON, R. I., & HUGHES, S. I., & WHITTINGTON, F. M. (2008): Fat deposition, fatty acid composition and meat quality: A review. Meat Science, 78, 343-358. YI, G., HAUG, A., NYQUIST, N., & EGELANDSDAL, B. (2013): Hydroperoxide formation in different lean meats. Food Chemistry , 141, 2656-2665.
Received 2 April 2015; accepted for publication 20 May 2015


Paper IV


1
Volatile profiles of adipose tissue, metabolites of lean meat and sensory attributes of 1
lamb/sheep meat from different production systems 2
3
Vladana Grabež a,*, Milena Bjelanović a, Jens Rohloff b, Aleksandra Martinović c, Per Berg d, 4
Vladimir Tomović e, Biljana Rogić f, Bjørg Egelandsdal a 5
6
a Department of Chemistry, Biotechnology and Food Science, Norwegian University of Life 7
Sciences, P.O. Box 5003, NO-1432 Ås, Norway 8
b Department of Biology, Norwegian University of Science and Technology, NO-7491 9
Trondheim, Norway 10
c Faculty of Food Technology, Food Safety and Ecology, University of Donja Gorica, ME-11
81000 Podgorica, Montenegro 12
d Nortura SA, Postbox 360 Økern, NO-0513 Oslo, Norway 13
e Faculty of Technology, University of Novi Sad, Bulevar cara Lazara 1, RS-21000 Novi Sad, 14
Serbia 15
f Agricultural Faculty, University of Banja Luka, Bulevar vojvode Petra Bojovića 1A, BA-16
78 000 Banja Luka, Bosnia and Herzegovina 17
18
19
*Corresponding author 20
Email: [email protected] 21
Phone: +47 948 82 626 22
Fax: +47 649 65 901 23

2
Abstract 24
25
Flavour characteristics of female lamb and sheep meat from Norway (NW; n=47), Bosnia and 26
Herzegovina (BH; n=30), Montenegro (MN; n=15) were investigated. Sensory analysis, Gas 27
Chromatography (GC)/Mass Spectrometry analysis were used on heated adipose tissue 28
(headspace, HS) and extracted lean meat were conducted. HS-GC differentiated NW lambs 29
(e.g. 5-ethyl-3-nonanal, 2-heptadecanone) from 4 y NW sheep (e.g. 2-ethylfuran). NW 4 y 30
sheep were more gamy and grassy but less acidic than NW lambs. HS-GC analysis 31
differentiated BH lamb (e.g. dimethyl sulfone) from sheep adipose tissue (e.g. β-32
caryophyllene). Lean meat from BH sheep had higher prevalence of free amino acids than 33
lambs. BH lamb meat was more bitter and metallic than BH sheep. Sheep from NW, BH and 34
MN had distinct flavour profiles. No single sensory attribute separated all 3 sheep meat. BH 35
lambs differed from NW lambs by their higher taste intensity and different flavour profile. 36
37
38
39
40
41
42
43
44
Keywords: sheep; adipose tissue volatiles; lean meat metabolites; sensory attributes; principal 45
component analysis; partial least squares regression 46

3
1. Introduction 47
48
Several ante-mortem factors, i.e. breed, age, diet and production system contribute to sensory 49
properties of lamb/sheep meat (Ekiz, Yilmaz, Ozcan, Kaptan, Hanoglu, Erdogan, et al., 2009; 50
Resconi, Escudero, & Campo, 2013; Watkins, Frank, Singh, Young, & Warner, 2013). Meat 51
flavour is an important quality criterion with a key role in the overall lamb/sheep meat 52
acceptability (Wood, Enser, Fisher, Nute, Richardson, & Sheard, 1999). In general, the effect 53
of genetics on lamb/sheep flavour development still remains unresolved. Although some 54
authors emphasize the breed effects (Ekiz et al., 2009; Hoffman, Muller, Cloete, & Schmidt, 55
2003), the conclusions differ significantly with regard to genetic effect on lamb and sheep 56
meat flavour. The effects of the production system and diet on flavour constituents, chemical 57
composition and overall ruminant meat acceptability are not fully understood, even though 58
some studies suggested diet as a powerful tool in interfering with sensory attributes of lamb 59
meat (Juárez, Horcada, Alcalde, Valera, Polvillo, & Molina, 2009; Resconi, Campo, Furnols, 60
Montossi, & Sañudo, 2009). However, the animals’ diet can induce a different degree of 61
carcass fatness (Aurousseau, Bauchart, Faure, Galot, Prache, Micol, et al., 2007) and fatty acid 62
composition (Dewhurst, Scollan, Lee, Ougham, & Humphreys, 2003; Resconi et al., 2009). 63
Variations in meat flavour have been associated with pasture differences, and sheep fed with 64
white clover, lucerne, phalaris and rape (Brassica) had an unacceptable meat flavour (Watkins 65
et al., 2013). The metabolites obtained through the diet or metabolized by animals and 66
deposited in the muscle cells or adipose tissue have been described as compounds that 67
contribute to flavour (Watkins et al, 2013). 68

4
Two types of the indigenous breed Pramenka (Vlašićka and Pivska Pramenka) from the 69
Western Balkans region were studied. Vlašićka Pramenka is a dominant sheep in the mountain 70
region Vlašić in Bosnia and Herzegovina (Sinanović, Katica, Varatanović, & Ališah, 2011). In 71
the Vlašić region, grasses (Poa pratensis, Bromus racemosus, Dactylis glomerata, and Briza 72
media) as well as some cloves (Lotus corniculatus, Trifolium pratense, Trifolium repens, and 73
Vicia sativa) are dominant (Rogić, personal communication). The lambing period for Vlašićka 74
Pramenka is early winter. During the winter months sheep herds return to lowland areas. In 75
the period from November until the end of April the feeding system mostly consists of hay 76
and corn. 77
Pivska Pramenka is a characteristic Pramenka type for Northern Montenegro for having a 78
cold, mountain climate and a long winter period. Ljubišnja grazing area is characterized by 79
Poa violacea, Festuca ovina, Festuca rubrassp. fallax, Festuca valesiaca, Nardus stricta, and 80
Brometum erectistrictae as the most dominant species (Dubljević, 2009). In the period from 81
May until the middle of October the feeding system of Pivska Pramenka is based on semi-82
natural mountain pasture, fertilized areas (moving sheepfold), and during other periods of the 83
year animals are fed with hay. From late December until the end of March, diet is 84
supplemented with concentrate. 85
Norwegian White sheep, a crossbreed composed of Dala, Rygja, Steigar, and Texel breeds, is 86
the dominant breed in Norway (Bjelanović, Grabež, Vučić, Martinović, Lima, Marković, et 87
al., 2015). Typical production systems consist of mountain pasture from May to 88
September/October, grazing on fenced areas during spring and autumn. According to common 89
practice, lambs with lower live weight are finished on rich pasture. The botanical composition 90
of meadows is a mix of mainly Phleum pratense, Festuca pratensis, Poa pratensis, Trifolium 91

5
sp., and Elymus repens (Lunnan & Tondem, 2014). During winter, lamb and sheep are indoor 92
and fed a diet based on roughage and concentrate supplements (Asheim, & Mysterud, 1999). 93
The lambing period occurs in early spring when sheep and lamb are still housed. Lambs are 94
pasture-fed, grown under conventional and ecological production systems. 95
In general, Wong, Nixon, & Johnson (1975) define sheep flavour as sweaty, oily, acidic, acrid, 96
urinary, fecal, barnyard and sharp. The mutton-like flavour was associated with branched 97
chain fatty acids (BCFA; C8 – C10), more abundant in adipose tissue of aged animals (Watkins 98
et al., 2013). However, discrimination of lamb from sheep meat according to BCFA 99
concentration was not possible (Watkins, Rose, Salvatore, Allen, Tucman, Warner, et al., 100
2010). Pastoral sheep flavour, defined as animal, barnyard, grassy, sheep-like, gamey, milky, 101
and fecal, was related to skatole, indole and phenols (Priolo, Cornu, Prache, Krogmann, 102
Kondjoyan, Micol, et al., 2004; Young, Lane, Priolo, &Fraser, 2003). According to our 103
knowledge, compounds responsible for increased odour intensity in aged sheep, for identical 104
or similar sheep breeds have not been studied yet. Detailed comparison of production systems 105
(ecological vs. conventional production) and age-related unique compounds with the 106
concentration changes are particularly important for understanding changes in lamb and sheep 107
flavour and odour. In addition, flavour development and sensory characteristics of Vlašićka 108
and Pivska Pramenka have not been described so far. To define representative biomarkers, 109
flavour analysis should be repeated due to seasonal changes. 110
In order to understand the variation in flavour profiles among different lamb and sheep meat, 111
volatile compounds and metabolites from adipose tissue and lean meat were studied, plus 112
sensory attributes of 2 types of lamb and 4 different sheep meat. Meat from sheep and lamb is 113
also used for production of dry-cured hams and it was also of interest to elucidate flavour 114

6
differences that may be relevant after dry-curing (Stojković, Grabež, Bjelanović, Mandić, 115
Vučić, Martinović, et al., 2015). The aim of our study was to: 1.) Identify and quantify 116
volatiles and metabolites as constituents of lamb/sheep meat flavour; 2.) Evaluate sensory 117
properties of different animal groups; 3.) Elucidate how volatiles and metabolites correlated 118
with sensory attributes. 119
120
2. Materials and methods 121
122
2.1. Experimental design 123
Ninety-two animals used in the study were classified into seven animal groups. To reflect 124
consumption and cultural habits typical for each country, the studied animals were: lambs 125
(5−6 months), young sheep (~2 years) and old sheep (4−5 years). All animals were females 126
and representative of the production system of the country of origin (Bosnia and Herzegovina, 127
Montenegro and Norway). The relatively small sheep production in Montenegro could not 128
provide an optimal number of 5−6 months old lambs of Pivska Pramenka from the same herd, 129
therefore this group was not examined in this study (for more information see Bjelanović et 130
al., 2015). 131
132
Bosnia and Herzegovina: Sheep (BH 4y) and lambs from conventional production (BH lamb; 133
15 animals each) belonged to two flocks of Vlašićka Pramenka. Lambs, born in December, 134
were raised on maternal milk with access to pasture, and stayed with sheep until April when 135
they were slaughtered. Sheep were slaughtered in November directly from the pasture. 136
137

7
Montenegro: Fifteen sheep of Pivska Pramenka (MN 4y) were included in this experiment. 138
Sheep were slaughtered in November directly from the pasture. 139
140
Norway: Lamb (ecological−NW eco and conventional−NW ord; later presented as a joined 141
group NW lamb), young (NW 2y) and old sheep (NW 4y) belonged to the Norwegian White. 142
Lambs from ecological and conventional production (9 animals each), and young sheep (15 143
animals) were transported directly from the rangeland and slaughtered in October. Old sheep 144
(14 animals) were indoor-finished (hay + concentrate supplemented) for a period of 3 months 145
before slaughtering. This is a tradition in Norway since the number of older sheep in Norway 146
is regulated in January. All animals were from the Hallingskarvet mountain region in Southern 147
Norway, i.e. areas with origin labeling and signaling a special meat quality that is not well 148
documented. 149
150
2.2. Tissue sampling 151
All animals were slaughtered in the country of origin as described by Bjelanović et al. (2015). 152
The M. longissimus thoracis et lumborum from both sides of carcass were removed and 153
adipose tissue above the muscle was excised within 24 h post mortem, vacuum-packed and 154
stored at -80 °C. Vacuum-packed meat, refrigerated for 7 days (at 4 °C), was divided into 5 155
cm slices, vacuum-packed and stored at -80 °C for sensory and GC/MS analysis. 156
157
2.3. Quality measurements 158
159

8
2.3.1. Headspace gas chromatography-mass spectrometry (HS-GC/MS) analysis of volatile 160
compounds 161
Frozen adipose tissue was homogenized with a crushing machine (IKA® A11 Basic Analytical 162
Mill, Staufen, Germany) to a fine powder. Four grams of homogeneous powder were placed in 163
a glass vial (50 mL) and stored at -80 °C until the next preparation step. In order to increase 164
the volatile compounds extraction and generate representative volatile profiles, the 165
homogenized sample was heated at 75 °C in water bath for 30 min on the day of analysis. The 166
liquid fat phase (1 g) was transferred to a clean glass vial and kept at 4 °C for ~ 4 h before 167
measured. All samples were analyzed in two replicates. 168
A mixture of five compounds in Mygiol (AXO INDUSTRY, Warve, Belgium) was used as a 169
control sample. These compounds were: butanal (99%), cis-2-penten-1-ol (95%), 2-170
undecanone (99%), and dimethyl sulfone (98%) (Sigma-Aldrich Chemie GmbH, Schnelldorf, 171
Germany), and acetic acid (100%, VWR, Fontenay-saus-Bois, France). 172
HS-GC/MS analysis was performed according to a modified method by Volden et al. (2011). 173
Fat volatiles were extracted by dynamic headspace analyzer Teledyne Tekmar HT3 (Teledyne 174
Tekmar, Ohio, USA) coupled to an Agilent gas chromatograph 6890N (Agilent Technologies, 175
Santa Clara, CA, USA). The DB - WAXetr fused silica capillary column (30 m × 0.25 mm 176
i.d., 0.50 μm film thickness; J&W Sientific, USA ) was connected to the ion source (230 °C) 177
of a Agilent 5975 (Agilent Technologies, Santa Clara, USA) quadruple mass spectrometer 178
(interface line 250 °C). The carrier gas was He with a flow rate of 1.0 mL/min. Samples were 179
heated at 150 °C in the headspace. The temperature program for GC was: 35 °C for 10 min, 180
ramped 1.5 °C/min up to 40 °C, ramped 4.0 °C/min up to 70 °C, ramped 7.5 °C/min up to 230 181
°C, and 1 min at 230 °C. Analysis time was 54.62 min, and recorded mass range was m/z 182

9
33−300. Volatiles were tentatively identified by computer-matching of generated mass spectra 183
with NIST05 database (National Institute of Standards and Technology/Gaithersburg, MD, 184
USA). Identified volatile compounds are presented in Table S-1 as % of total area in a specific 185
chemical group. 186
187
2.3.3. Extraction, derivatization, and GC/MS analysis of meat metabolites 188
One gram of lean meat was transferred into a 15 mL tube, and 5 mL of a water: methanol: 189
chloroform (1 : 2.5 : 1) mixture with internal standard ribitol (66 μg/mL) was added. The 190
sample was incubated at 60 °C for 60 min in sonication bath and centrifuged for 10 min at 3 191
000 rpm at 4 °C. An aliquot of 1 mL was transferred into a 1.5 mL Eppendorf tube, dried in a 192
SpeedVac (Thermo Scientific, Waltham, MA, USA) overnight and stored at -80 °C. The dried 193
residues were resuspended in 80 μL methoxyamine hydrochloride with pyridine (20 mg/mL) 194
at 30 °C for 60 min and sonicated at 30 °C for 30 min. Finally, samples were treated with 80 195
μL of N-methyl-N-(trimethylsilyl) trifluoroacetamide at 37°C for 30 min. 196
GC/MS analyses were performed according to Sissener et al. (2011). Derivatized sample in 197
the amount of 1 μL was analyzed on an Agilent 6890 GC connected with an Agilent 5975 MS 198
detector. A HP-5MS capillary column (i.d. 30 m × 0.25 mm, film thickness 0.25 μm) was 199
used. The carrier gas (He) flow rate through the column was 1 mL/min. The GC temperature 200
program: 70 °C for 5 min, ramped at 5 °C/min until 310°C. Analysis time was 60 min. The 201
MS operated at 230 °C, and the recorded mass range was m/z 50−700. 202
MS files from Agilent ChemStation (Agilent Technologies, Waldbronn, Germany) were 203
exported in the netCDF format (OPENChrom, Eclipse Public License 1.0) to MetAlign 204
(version 041012, RIKILT Wageningen UR, Plant Research International) for data pre-205

10
processing and alignment. Metabolites were identified with the AMDIS software (version 206
2.71, National Institute of Standards and Technology, Boulder, CO, USA) in combination 207
with NIST05 (National Institute of Standards and Technology/Gaithersburg, MD, USA) and 208
GOLM metabolome database (Max-Planck Institute for Molecular Plant Physiology, Golm, 209
Germany). Normalization of the peak area was performed on the internal standard ribitol and 210
expressed as mg/kg of meat. Samples were run randomized. Metabolites are presented in a 211
Table S-2. All samples were analyzed in the same laboratory. 212
213
2.4. Sensory analysis 214
For sensory testing meat samples were defrosted at 4 °C overnight. The 2.5 cm slices of lean 215
meat were heated in water bath set to 80 °C until internal temperature of 71 °C was achieved 216
(AMSA, 1995). A panel consisting of 8 trained (ISO 8586–1:1993) assessors (4 females and 4 217
males 30−59 years old) was selected for the sensory analysis. The laboratory for sensory 218
analysis at Faculty of Technology in Novi Sad was designed according to ISO 8589:2007. 219
During the evaluation, water and bread were served to assessors to cleanse their palate 220
between samples. All samples were randomly served. Sensory traits of lamb/sheep meat were 221
evaluated by the quantitative-descriptive analysis (Lawless & Heymann, 2010), using a scale 222
from one (none) to nine (very intense) according to ISO 4121:2003. Assessors were asked to 223
evaluate the following: odour (gamy, grass, rancid), taste (acidic, bitter, metallic), as well as 224
tenderness, fattiness, and juiciness. These attributes were selected as they have been observed 225
to distinguish Norwegian lamb samples earlier (Lind, Berg, Eilertsen, Hersleth, & Eik, 2011). 226
All samples were analyzed in the same sensory laboratory. 227
228

11
2.5. Statistical analysis 229
Identified instrumental variables (volatile compounds and metabolites) were tested using One-230
way ANOVA (Minitab, version 16 from Minitab Inc., State College, PA, USA). Means were 231
separated by the Tukey’s test at P < 0.001 to determine the significance level of each 232
instrumental variable for each animal group. 233
Principal component analysis (PCA) models were performed to visualize the complete data set 234
in reduced dimension plot. The first PCA model included all volatile compounds identified in 235
adipose tissue in six animal groups corresponding to the Fig. 2a, while the second PCA model 236
(Fig. 2b) included only four animal groups that showed poor separation in the first PCA 237
model. Seventy-six volatile compounds were included in each case. The third PCA model 238
included 69 metabolites identified in six animal groups (Fig. 3). Sample names were coded as 239
described in the Experimental design section. 240
The correlation between instrumental data (X-matrix) and each sensory attribute (Y-matrix) 241
was evaluated by partial least squares regression (PLSR). Models were developed using 242
Unscrambler, version X10.1 software (Camo, Trondheim, Norway). Instrumental variables 243
were mean-centered and weighted using the inverse of the standard deviation of each variable 244
to have unit variance and zero mean before applying the PLSR analysis. Sensory variables 245
were not centered, the same category scoring scheme was used for measurements. Validation 246
of regression models was performed by full cross-validation. Regression coefficients (bk) for 247
volatile compounds (bk ≥ 0.03) and metabolites (bk ≥ 0.06) obtained from PLSR analysis were 248
used in linear regression analysis to indicate their significance for each sensory attribute. In 249
addition, significant (P < 0.01) instrumental data were selected and related to odour, taste and 250
texture attributes. 251

12
3. Results and discussion 252
253
The variations in muscle composition were a result of interactions between breed, diet, age 254
and production systems, but represent typical productions from the regions. These variations 255
resulted in differences in fatty acids, chemical composition and sensory traits. 256
257
3.1. Characterization of intramuscular fatty acids 258
Intramuscular fatty acids were analyzed for the seven animal groups, two groups from Bosnia 259
and Herzegovina (BH lamb and BH 4y), Montenegro (MN 4y), and four groups from Norway 260
(NW eco, NW ord, NW 2y, and NW 4y). According to Bjelanović et al. (2015), the content of 261
saturated fatty acids (SFA), monounsaturated fatty acids (MUFA) and polyunsaturated fatty 262
acids (PUFA) was highest in the intramuscular fat of MN 4y sheep (47.4 mg/100 g of tissue, 263
36.8 mg/100 g of tissue, and 4.7 mg/100 g of tissue, respectively) compared with other animal 264
groups (Fig. 1). 265
266
Figure 1 267
268
3.1.1. Differences between Norwegian White lambs from ecological and conventional 269
production 270
The concentration levels in SFA (9.2 and 8.1 mg/100 g of tissue), MUFA (7.2 and 6.3 mg/100 271
g meat) and PUFA (2.1 and 2.7 mg/100 g tissue) content were, however, not significantly 272
different between the two groups of NW lamb, from ecological (NW eco) and conventional 273
(NW ord) production (Fig. 1; Bjelanović, personal communication). Angood, Wood, Nute, 274

13
Whittington, Hughes, & Sheard (2008) found no significant differences in MUFA and PUFA 275
content among organic and conventional lamb meat, while SFA was higher (P < 0.05) in 276
organically produced lamb. 277
The headspace analysis of heated adipose tissue trimmed above M. longissimus thoracis et 278
lumborum muscle showed significant difference (P < 0.05) in thirteen volatile compounds 279
between the two NW lambs. NW eco was characterized by a higher content of propanal, 280
hexanal, heptanal, hexane, 1-octen-3-ol, (E, Z)-2,4-heptadienal, 1-pentanol and dimethyl 281
sulfone. On the other side, the content of volatile compounds such as (E)-2-hexenal, (E)-2-282
octenal, 2-pentadecanone, γ-butyrolactone and benzonitrile was higher in adipose tissue of 283
conventionally produced lamb. Most of the identified volatile compounds were degradation 284
products of different unsaturated fatty acids. In addition, NW eco had significantly (P < 0.05) 285
higher content of ten metabolites (arginine, β-alanine, fructose-6-phosphate, glycerol-3-286
phosphoethanolamine, glycerol-3-phosphate, fumaric acid, malic acid, pyroglutamic acid, 287
succinic acid, and thymine), identified in both NW lamb groups. Schønheyder & Lyngbye 288
(1962) suggested that better fed animals and longer starvation period before slaughtering 289
increased the abundance of metabolites identified in NW lamb meat. The presence of specific 290
amino acids, organic acids, and many other metabolite compounds may contribute to the 291
overall meat flavour, i.e.β-alanine and sugar phosphates contributed to the sweet taste of meat 292
(Watkins et al., 2013). The concentration of arginine (bitter/sweet) in NW eco samples (0.83 293
mg/kg) was far below the taste detection threshold reported by Chen & Zhang (2007). 294
Fumaric acid may contribute to acidic taste while succinic acid appears to have a matrix 295
dependent taste from sweet/umami taste (Watkins et al., 2013; Schlichtherle-Cerny & Grosch, 296
1998) to seashell (Yi, Grabež, Bjelanovic, Slinde, Olsen, Langsrud, et al., 2015). Differences 297

14
in the concentration of free amino acids and organic acids may suggest a more desirable 298
flavour of lamb meat from ecological production, although the panelists indicated no 299
significant differences in sensory attributes among the two groups of NW lambs. 300
Considering the significant differences in abundance of volatile compounds from heated 301
adipose tissue and metabolites of lean meat between NW eco and NW ord, on one side and no 302
significant difference in fatty acid composition and sensory attributes on the other side, the 303
two lamb groups were merged into one group (NW lamb) below, to make graphs easier to 304
read. 305
306
3.2. Volatile profile of heated adipose tissues 307
Adipose tissues of lamb and sheep from the Western Balkans (BH and MN) and Norway were 308
subjected to HS-GC/MS analysis simulating oven-roasting temperature effect (150°C). 309
Seventy-six volatile compounds were identified as significant (P ≤ 0.05) representing flavour 310
profiles of adipose tissues (see Table S-1). In order to define a relationship between identified 311
volatile compounds and the animals that belonged to different groups defined by breed, age 312
and production systems, two PCA models were run. The first PCA included all VOCs and 313
animal groups (Fig. 2a) showing a clear separation of BH 4y and MN sheep’s volatile profiles. 314
The magnified graph (Fig. 2b) included animal groups that apparently showed poor separation 315
in Fig. 2a, i.e. BH lamb and NW animals. The results may reflect differences in rumen 316
microbial communities of different breeds (Pramenka vs. Norwegian White), large variations 317
in fatty acid composition, annual variation in a quality and availability of mountain vegetation. 318
Approximately 50% of all identified volatile compounds were products of thermal oxidation 319
processes of long-chain fatty acids. Thus, high temperatures (150−200°C) increased formation 320

15
of aldehydes and ketones with reduction in hydrocarbons and furans in agreement with 321
Almela, Jordán, Martínez, Sotomayor, Bedia, & Bañón (2010). 322
According to Fig. 2a, it can be generally concluded that typical diet tracers, β-caryophyllene 323
and γ-butyrolactone, discriminated the volatile profile of BH 4y sheep adipose tissue from 324
MN 4y. Sesquiterpenes, such as β-caryophyllene, are almost exclusively synthesized by plants 325
and found in high concentration in adipose tissue of lamb raised and finished on grass (Priolo 326
et al., 2004). The absence of terpenes in adipose tissues of other pasture-fed animal groups on 327
one hand and very minute amounts in BH 4y sheep samples on the other hand, could be due 328
to: (i) lack of sensitivity of the dynamic headspace method; (ii) low concentrations of these 329
compounds compared to other volatile compounds; (iii) terpenes were metabolized during the 330
period animals spent in lairage; (iv) BH 4y sheep were slaughtered directly from the pasture. 331
Plant diversity of grazing region may affect the absence of terpenes in analyzed samples. 332
Mariaca, Berger, Gauch, Imhof, Jeangros, & Bosset (1997) reported a low terpene content in 333
pasture more rich in Gramineae than Dicotyledons. However, terpenes allow discrimination 334
between pasture and concentrate feeding systems, but their impact on sensory characteristics 335
is not clear yet (Resconi et al., 2013). γ-butyrolactone was the most abundant volatile in 336
adipose tissue of BH 4y sheep. Lactones are derivates of the thermal oxidation of lipids in the 337
rumen partly reflecting animal diet (Resconi et al., 2013). Sivadier, Ratel, Bouvier, & Engel 338
(2008) reported presence of butyrolactone in adipose tissue of pasture fed lambs. Dominant 339
volatile compounds in MN adipose tissue were lipid degradation products, i.e. alkanes, 340
alkenes, alcohols, and esters. Although the lean meat of MN sheep had a higher vitamin E 341
content and total antioxidant capacity (Bjelanović et al., 2015), it did not maintain oxidative 342
stability of adipose tissue probably due to a higher content of unsaturated fatty acids (see Fig. 343

16
1). Furthermore, 3-methylphenol was a significant (P < 0.001) contributor to MN volatile 344
profile. The botanical composition of the MN pastures clearly influenced the accumulation of 345
a phenolic compound in adipose tissue. Various phenolic compounds present in plants are 346
transferred to the meat in ruminants due to fermentation of dietary phenolic precursors, such 347
as lignin (Almela et al., 2010). 348
Figure 2b outlines a clear separation of BH lamb and NW animals (lamb, 2y sheep, and 4y 349
sheep). Dimethyl sulfone was the most abundant and significant (P < 0.001) compound of the 350
flavour profile of BH lamb adipose tissue. In general, pasture feeding system increases the 351
concentration of sulphur compounds, such as dimethyl sulfone (Tansawat, Maughan, Ward, 352
Martini, & Cornforth, 2013) that contributes to the sulphur odor and meat flavour. Tansawat et 353
al. (2013) reported a correlation between bitterness and higher concentrations of dimethyl 354
sulfone in pasture-fed beef. The production systems and digestive activity contributed to 355
different lamb flavour profiles (Fig. 2b); BH lamb adipose tissue had a low abundance of lipid 356
degradation products. Although the production systems were presumed to be basically 357
different, the fatty acid composition of lamb groups was not significantly affected (see Fig.1). 358
In general, the age groups of NW animals (lamb, 2y, and 4y sheep) yielded small differences 359
in volatile profiles due to differences in fatty acid content. The existence of a number of 360
aldehydes in NW lamb adipose tissue indicated the progression of lipid oxidation in adipose 361
tissue of young animals. Apparently, significant (P < 0.001) and abundant oxidation markers 362
such as propanal, 2-propenal and (Z)-2-nonenal present in NW lamb suggested lower 363
oxidative stability for unsaturated lipids. Jo & Ahn (2000) reported that 2-propenal generates 364
an unpleasant odour. Compared to NW lamb, there were no specific volatiles for NW 2y 365
sheep. Thus, NW 2y volatile profile was close to BH lambs. On the other side, 2-ethylfuran 366

17
belonged significantly (P < 0.01) to the NW 4y animal group. A low number of significant 367
compounds impeded a more detailed characterization of NW 4y sheep volatile profiles. It is 368
reasonable to state that breed combined with production system had different volatile profiles 369
(Fig. 2a and 2b) leading to the identification of local, specific meat volatile profiles. 370
371
Figure 2a 372
373
Figure 2b 374
375
3.3. Metabolites (flavour precursors) identified in raw lean meat 376
In total, 69 metabolites were separated and identified in the lean meat of six animal groups 377
using GC/MS analysis (Table S-2). Thirty-five significantly different (P ≤ 0.001) metabolites 378
among animal groups are presented in Figure 3. The first two principal components separated 379
the Western Balkans animal groups (BH lamb, BH 4y, and MN 4y) and NW animals (NW 380
lamb, NW 2y, and NW 4y). BH lamb were characterized by compounds with antioxidant 381
function. Prevalence of ascorbic acid and threonic acid, as a metabolic product of ascorbic 382
acid catabolism (Kagawa, 1962), may reduce formation of volatile compounds originated 383
from lipid degradation (Fig. 2b). Furthermore, hypotaurine levels were also significantly 384
higher (P ≤ 0.001) in the BH lamb metabolite profile. The metabolic precursor of taurine, 385
hypotaurine has an antioxidant function in vivo removing highly reactive hydroxyl radicals 386
(Aruoma, Halliwell, Hoey, & Butler, 1988). Amino acids were the most abundant metabolites 387
for BH 4y. The broad variation among animal groups can be attributed to differences in 388
metabolic activity, breed, age, and production system (diet, environmental conditions). 389

18
Differences in amounts of free amino acids could be related to differences in enzyme activities 390
(Koutsidis, Elmore, Oruna-Concha, Campo, Wood, & Mottram, 2008), although Bjelanović et 391
al. (2015) reported no significant difference in cathepsin B among studied animal groups. 392
Glutamic acid content was the most abundant amino acid (see Table S-2), as previously 393
reported for ruminants (Williams, 2007). An interesting result was the significantly higher 394
level of essential amino acids (isoleucine, leucine, lysine, methionine, phenylalanine, 395
threonine, tryptophan, and valine) for BH 4y. The amount of essential amino acids may relate 396
to the protein metabolism in the rumen, availability and efficiency in the use of nutrients by 397
rumen bacteria (Bach, Calsamiglia, & Stern, 2005). Amino acids can directly or indirectly 398
affect flavour due to generation of different volatiles through Maillard and Strecker reactions, 399
which are thermal degradation reactions. Abundant metabolites in MN 4y were free fatty acids 400
(C17:0, C18:1 cis-9 and C18:3) and Krebs cycle intermediates and acids (pyruvic, citric, and 401
ribonic acid). Utilization of glucose stimulates ATP production in Krebs cycle. Abundance of 402
pyruvic acid in MN 4y animals can indicate well-fed animals and/or exposure to stress. 403
Furthermore, a significant effect of fatty acids on MN 4y metabolite profile is in agreement 404
with high fatty acid content (Fig. 1). Some of the PUFA and intermediate products ingested by 405
ruminants may escape biohydrogenation to their saturated counterparts by direct incorporation 406
in body fat (Dervishi, Serrano, Joy, Serrano, Rodellar, & Calvo, 2010). Thus, we expect that 407
MN 4y animals have more fiber type I, more mitochondria and intramuscular fat to be used 408
for cell energy production. Apparently, in lean meat of all animal groups, small amounts of 409
sucrose were identified, being the most abundant in MN 4y samples. Animal groups differed 410
in the abundance of carbohydrates, presented in Table S-2. Quantitatively, glucose and sugar 411
phosphates (glucose-6-phosphate, fructose-6-phosphate, and mannose-6-phosphate) were 412

19
most abundant in NW lamb. Koutsidis et al. (2008) reported higher concentration of glucose, 413
glucose-6-phosphate, fructose-6-phosphate, and mannose-6-phosphate in concentrate-fed 414
steers. The carbohydrate content is directly related to feed availability and the level of stress 415
animals were exposed to. Animals finished on high energy diet compared to low energy diet 416
contained higher glycogen level (Immonen, Ruusunen, Hissa, & Puolanne, 2000). Elevated 417
glucose concentration gave a higher level of glucose-6-phosphate. Although NW lamb group 418
showed a different metabolite pattern characterized by carbohydrates, again, differences 419
among NW 2y and NW 4y animals were relatively small. Increased abundance of urea in NW 420
4y may be a result of pre-slaughter stress that affected the physiological variables (Knowles & 421
Warriss, 2000). The six animal groups (BH lamb, BH 4y sheep, MN 4y sheep, NW lamb, NW 422
2y sheep, and NW 4y sheep) showed clear separation related to specific dominant metabolites. 423
424
Figure 3 425
426
3.4. Sensory attributes 427
The sensory attributes, odour, taste and texture for all animal groups are presented in Figure 4. 428
MN 4y had the strongest gamy and grassy odour, affected by pasture, environmental 429
conditions, breed type and lipid degradation products. Thus, NW 4y animals had a high score 430
for grassy flavour, as expected for an animal breed towards increased growth. On the other 431
side, NW 4y had the lowest intensity of acidic taste among the examined animal groups. 432
Furthermore, bitterness and metallic taste were highest for BH lamb. Panelists did not identify 433
a rancid odour. The sensory evaluation showed consistency for tenderness measured by the 434
Warner-Bratzler shear force (Bjelanović et al., 2015). Tenderness is often associated with 435

20
meat of younger animals. According to the panelists, BH animals (lamb and sheep) and NW 436
lamb were the most tender, while MN sheep was the toughest. The difference in juiciness 437
between lamb and sheep could be due to the age effect, because juiciness was the highest in 438
lamb, both BH and NW lamb. Sensory fattiness had no clear relation to fat content 439
(Bjelanović et al., 2015) or to the age of examined animals, suggesting different fat 440
distribution. Samples of NW 2y were rated as fattiest, followed by NW 4y and BH animals. 441
442
Figure 4 443
444
3.5. Correlation among volatile compounds, metabolites and sensory attributes 445
PLS1 regression models were developed to correlate volatile compounds and metabolites with 446
sensory attributes (Fig. 5). Positive correlation (P < 0.01) was found between gamy flavour 447
and several alkanes, alkenes, alcohols, phenol (3-methylphenol), amino acid and acids. The 448
relation of 3-methylphenol with lamb pastoral flavour has been noted previously by Young et 449
al. (2003). The taste active aspartic acid has been associated with acidity (Watkins et al., 450
2013), possibly together with citric, gluconic and pyruvic acid, all indirectly contributing to 451
the gamy flavour perception. Glycine and succinic acid were negatively correlated (P < 0.01) 452
to the gamy odour together with six volatile compounds. Glycine was characterized as a sweet 453
compound (Watkins et al., 2013). (Z)-2-nonenal with plastic/chlorine odour (Watkins et al, 454
2013) showed negative correlation both to gamey and grass odour. Jo et al. (2000) reported 2-455
propenal as a generator of unpleasant odour, and here it had a negative effect on grass odour. 456
Bitter and metallic taste showed positive correlation to hexane and dimethyl sulfone (sulfur 457
odour). Thus both taste attributes had negative correlation to heptanal and (E, Z)-2,4-458

21
heptadienal. Tenderness was positively associated with higher levels of metabolites in lean 459
meat such as ascorbic acid, β-alanine, 2-amino-butyric acid, 4-hydroxybutyric acid, succinic 460
acid, and uridine. Oxidative-stress induced changes in energy metabolism, affected enzymes 461
of Krebs cycle and increased formation of succinate and 4-hydroxybutyric acid. In addition, 462
ascorbic acid as a scavenger of free radicals protects muscle tissue against reactive oxygen 463
species (ROS). Antioxidants support the activity of respiratory mitochondrial chain and 464
energy formation processes (Kanunnikova, Bashun, & Moiseenok, 2012). Mechanical 465
properties of meat, i.e. tenderness, depend on mitochondrial activity, prolonged enzyme 466
activity and apoptotic promotion early post mortem (Grabež, Kathri, Phung, Moe, Slinde, 467
Skaugen, et al., 2015). A negative correlation was found between tenderness and higher levels 468
of citric acid, gluconic acid, and pyruvic acid content, either related to a pro-oxidative 469
function in the cell or to the role of enzyme inhibitors. 470
471
Figure 5 472
473
4. Conclusion 474
475
Sheep from Bosnia and Herzegovina had more complex lipid degradation products, diet 476
tracers (β-caryophyllene and γ-butyrolactone) and were abundant in essential amino acids. 477
Typical sulphur compounds (dimethyl sulfone) found in BH lamb contributed to the bitter and 478
metallic taste attributes. Furthermore, sheep meat from Montenegro showed a higher content 479
of unsaturated fatty acids, responsible for the occurrence of many lipid degradation products 480
and had a gamy and grassy odour. Also, organic acids and diet tracers (3-methylphenol) 481

22
characteristic for MN 4y sheep were identified. The volatile active compounds of BH and MN 482
adipose tissue were influenced by different feeding systems. In addition, a clear separation 483
among volatile profiles of NW animals and higher content of lipid degradation products in 484
NW lamb suggested lower antioxidant stability of younger animals. An abundance of 485
carbohydrates observed for NW lamb was associated with better-fed animals with less intense 486
flavour compared to BH lambs. In general, the Norwegian samples typically scored lower for 487
taste and odour attributes except for the grassy odour. 488
The present study provided an aroma signature for two types of Pramenka breed. NW lamb 489
had a unique volatile profile compared to NW sheep. 490
491
Acknowledgements 492
493
The staff at Nortura Gol, "BB" Kotor Varoš, and "Franca" Bijelo Polje are thanked for their 494
assistance at the slaughter line. The author from Nortura SA contributed to the planning phase 495
by organizing the collection of samples and also assisted during the manuscript writing, but 496
had no influence on the choice of methodology, registration of data, choice of statistical 497
methods and interpretation of results. We would like to thank Kari Olsen for the technical help 498
using HS-GC/MS analysis, Goran Vučić and Božidarka Marković for their help in sample 499
collection. The work was financed partly from grant no. FR184846/I10 and no. 225309 500
(“Small ruminant flavor”) of the Research Council of Norway, partly from the HERD project 501
No. 19028 (“Comparison of lamb carcass and meat quality of breeds in the Western Balkans 502
and Norway achieving improved palatability, sale and sustainability”) and a PhD scholarship 503
provided by the Norwegian State Educational Loan fund (“Lånekassen”). 504

23
References 505
506
Almela, E., Jordán, M. J., Martínez, C., Sotomayor, J. A., Bedia, M., & Bañón, S. (2010). 507
Ewe’s diet (pasture vs grain-based feed) affects volatile profile of cooked meat from 508
light lamb. Journal of Agricultural and Food Chemistry, 58(17), 9641-9646. 509
AMSA. (1995). Research guidelines for cookery, sensory evaluation and instrumental 510
tenderness measurements of fresh meat. Chicago, Illinois, USA: American Meat 511
Science Association, National Live Stock and Meat Board. 512
Angood, K. M., Wood, J. D., Nute, G. R., Whittington, F. M., Hughes, S. I., & Sheard, P. R. 513
(2008). A comparison of organic and conventionally-produced lamb purchased from 514
three major UK supermarkets: Price, eating quality and fatty acid composition. Meat 515
Science, 78(3), 176-184. 516
Aruoma, O. I., Halliwell, B., Hoey, B. M., & Butler, J. (1988). The antioxidant action of 517
taurine, hypotaurine and their metabolic precursors. Biochemical Journal, 256(1), 251-518
255. 519
Asheim, L. J., & Mysterud, I. (1999). The Norwegian sheep farming production system. In 520
Rubino R (ed.) & Morand-Fehr P. (ed.), System of sheep and goat production: 521
organization of husbandry and role of extension services, vol. 38 (pp. 249-253). 522
Zaragoza: CIHEAM (Options Méditerranéennes: Série A. Séminaires Méditerranéens). 523
Aurousseau, B., Bauchart, D., Faure, X., Galot, A. L., Prache, S., Micol, D., & Priolo, A. 524
(2007). Indoor fattening of lambs raised on pasture. Part 1: Influence of stall finishing 525
duration on lipid classes and fatty acids in the longissimus thoracis muscle. Meat 526
Science, 76(2), 241-252. 527

24
Bach, A., Calsamiglia, S., & Stern, M. D. (2005). Nitrogen metabolism in the rumen. Journal 528
of Dairy Science, 88, 9-21. 529
Bjelanović, M., Grabež, V., Vučić, G., Martinović, A., Lima, L. R., Marković, B., & 530
Egelandsdal, B. (2015). Effect of different production system on carcass and meat 531
quality of sheep and lamb from Western Balkan and Norway. Journal of 532
Biotechnology and Animal Husbandry, 31(2), 203-221. 533
Chen, D. W., & Zhang, M. (2007). Non-volatile taste active compounds in the meat of 534
Chinese mitten crab (Eriocheir sinensis). Food Chemistry, 104, 1200-1205. 535
Dervishi, E., Serrano, C., Joy, M., Serrano, M., Rodellar, C., & Calvo, J. H. (2010). Effect of 536
feeding system on the fatty acid composition, expression of the Δ9-desaturases 537
peroxisome proliferator-activated receptor alpha, gamma, and sterol regulatory 538
element binding protein 1 genes in the semitendinosus muscle of light lambs of the 539
Rasa aragonesa breed. BMC Veterinary Research, 6 (40), 1-11. 540
Dewhurst, R. J., Scollan, N. D., Lee, M. R. F., Ougham, H. J., & Humphreys, M. O. (2003). 541
Forage breeding and management to increase the beneficial fatty acid content of 542
ruminant products. Proceedings of the Nutrition Society, 62(02), 329-336. 543
Dubljević, R. (2009). Country pasture/forage resource profiles Montenegro. FAO country 544
Report. FAO. 545
Ekiz, B., Yilmaz, A., Ozcan, M., Kaptan, C., Hanoglu, H., Erdogan, I., & Yalcintan, H. 546
(2009). Carcass measurements and meat quality of Turkish Merino, Ramlic, Kivircik, 547
Chios and Imroz lambs raised under an intensive production system. Meat Science, 548
82(1), 64-70. 549

25
Grabež, V., Kathri, M., Phung, V., Moe, K. M., Slinde, E., Skaugen, M., Saarem, K., & 550
Egelandsdal, B. (2015). Protein expression and oxygen consumption rate of early 551
postmortem mitochondria relate to meat tenderness. Journal of Animal Science, 93(4), 552
1967-1979. 553
Hoffman, L. C., Muller, M., Cloete, S. W. P., & Schmidt, D. (2003). Comparison of six 554
crossbred lamb types: sensory, physical and nutritional meat quality characteristics. 555
Meat Science, 65(4), 1265-1274. 556
Immonen, K., Ruusunen, M., Hissa, K., & Puolanne, E. (2000). Bovine muscle glycogen 557
concentration in relation to finishing diet, slaughter and ultimate pH. Meat Science, 558
55(1), 25-31. 559
Jo, C., & Ahn, D. U. (2000). Production of volatile compounds from irradiated oil emulsion 560
containing amino acids or proteins. Journal of Food Science, 65(4), 612-616. 561
Juárez, M., Horcada, A., Alcalde, M. J., Valera, M., Polvillo, O., & Molina, A. (2009). Meat 562
and fat quality of unweaned lambs as affected by slaughter weight and breed. Meat 563
Science, 83(2), 308-313. 564
Kanunnikova, N. P., Bashun, N. Z., & Moiseenok, A. G. (2012). Use of CoA biosynthesis 565
modulators and selenoprotein model substance in correction of brain ischemic and 566
reperfusion injuries. In D. A. Catala (Ed.), Lipid Peroxidation: InTech. 567
Kagawa, Y. (1962). Enzymatic studies on ascorbic catabolism in animals. I. Catabolism of 568
2,3-diketo-L-gluconic acid. The Journal of Biochemistry, 51(2), 134-144. 569
Knowles, T. G., & Warriss, P. D. (2000). Stress physiology of animals during transport. In T. 570
Grandin (Ed.), Livestock Handling and Transport, (pp. 385-407). Wallingford, UK: 571
CABI Publishing. 572

26
Koutsidis, G., Elmore, J. S., Oruna-Concha, M. J., Campo, M. M., Wood, J. D., & Mottram, 573
D. S. (2008). Water-soluble precursors of beef flavour: I. Effect of diet and breed. 574
Meat Science, 79(1), 124-130. 575
Lawless, H. T., & Heymann, H. (2010). Sensory evaluation of food, Principles and Practices, 576
Second Edition: Springer. 577
Lind, V., Berg, J., Eilertsen, S. M., Hersleth, M., & Eik, L. O. (2011). Effect of gender on 578
meat quality in lamb from extensive and intensive grazing systems when slaughtered 579
at the end of the growing season. Meat Science, 88, 305-310. 580
Lunnan, T., & Tondem, J. (2014). Grassland yield variation and botanical composition in 581
mountainous areas of Norway. Options Méditerranéennes, A, 109, 179-183. 582
Mariaca, R. G., Berger, T. F. H., Gauch, R., Imhof, M. I., Jeangros, B., & Bosset, J. O. (1997). 583
Occurrence of volatile mono- and sesquiterpenoids in highland and lowland plant 584
species as possible precursors for flavor compounds in milk and dairy products. 585
Journal of Agricultural and Food Chemistry, 45(11), 4423-4434. 586
Priolo, A., Cornu, A., Prache, S., Krogmann, M., Kondjoyan, N., Micol, D., & Berdagué, J. L. 587
(2004). Fat volatiles tracers of grass feeding in sheep. Meat Science, 66(2), 475-481. 588
Resconi, V. C., Campo, M. M., Furnols, M. F. i., Montossi, F., & Sañudo, C. (2009). Sensory 589
evaluation of castrated lambs finished on different proportions of pasture and 590
concentrate feeding systems. Meat Science, 83(1), 31-37. 591
Resconi, V. C., Escudero, A., & Campo, M. M. (2013). The development of aromas in 592
ruminant meat. Molecules, 18, 6748-6781. 593
Schlichtherle-Cerny, H., & Grosch, W. (1998). Evaluation of taste compounds of stewed beef 594
juice. Zeitschrift für Lebensmittel-Untersuchung und -Forschung A, 207, 369-376. 595

27
Schønheyder, F., & Lyngbye, J. (1962). Influence of partial starvation and of acute scurvy on 596
the free amino acids in blood plasma and muscle in the guinea-pig. British Journal of 597
Nutrition, 16, 75-82. 598
Sinanović, N., Šakić., V., Katica, V., Varatanović, M., & Ališah, A. (2011). Possibilities of 599
enrichment of Pramenka with Awassi sheep in Bosnia and Herzegovina. Veterinaria, 600
60(3-4), 245-250. 601
Sissener, N. H., Hemre, G. I., Lall, S. P., Sagstad, A., Petersen, K., Williams, J., Rohloff, J., & 602
Sanden, M. (2011). Are apparent negative effects of feeding GM MON810 maize to 603
Atlantic salmon, Salmo salar, caused by confounding factors? British Journal of 604
Nutrition, 106(1), 42-56. 605
Sivadier, G., Ratel, J., Bouvier, F., & Engel, E. (2008). Authentication of meat products: 606
Determination of animal feeding by parallel GC-MS analysis of three adipose tissues. 607
Journal of Agricultural and Food Chemistry, 56(21), 9803-9812. 608
Stojković, S., Grabež, V., Bjelanović, M., Mandić, S., Vučić, G., Martinović, A., Håseth, T. 609
T., Velemir, A., & Egelandsdal, B. (2015). Production process and quality of two 610
different dry-cured sheep hams from Western Balkan countries. LWT-Food Science 611
and Technology, 64, 1217-1224. 612
Tansawat, R., Maughan, C. A. J., Ward, R. E., Martini, S., & Cornforth, D. P. (2013). 613
Chemical characterization of pasture- and grain-fed beef related to meat quality and 614
flavour attributes. International Journal of Food Science and Technology, 48, 484-615
495. 616

28
Volden, J., Bjelanovic, M., Vogt, G., Slinde, E., Skaugen, M., Nordvi, B., & Egelandsdal, B. 617
(2011). Oxidation progress in an emulsion made from metmyoglobin and different 618
triacylglycerols. Food Chemistry, 128(4), 854-863. 619
Watkins, P. J., Frank, D., Singh, T. K., Young, O. A., & Warner, R. D. (2013). Sheep meat 620
flavour and the effect of different feeding systems: A Review. Journal of Agricultural 621
and Food Chemistry, 61, 3561-3579. 622
Watkins, P. J., Rose, G., Salvatore, L., Allen, D., Tucman, D., Warner, R. D., Dunshea, F. R., 623
& Pethick, D. W. (2010). Age and nutrition influence the concentrations of three 624
branched chain fatty acids in sheep fat from Australian abattoirs. Meat Science, 86(3), 625
594-599. 626
Williams, P. (2007). Nutritional composition of red meat. Nutrition & Dietetics, 64, 113-119. 627
Wong, E., Nixon, L. N., & Johnson, C. B. (1975). Volatile medium chain fatty acids and 628
mutton flavor. Journal of Agricultural and Food Chemistry, 23(3), 495-498. 629
Wood, J. D., Enser, M., Fisher, A. V., Nute, G. R., Richardson, R. I., & Sheard, P. R. (1999). 630
Manipulating meat quality and composition. Proceedings of the Nutrition Society, 631
58(02), 363-370. 632
Yi, G., Grabež, V., Bjelanovic, M., Slinde, E., Olsen, K., Langsrud, O., Phung, V. T., Haug, 633
A., Oostindjer, M., & Egelandsdal, B. (2015). Lipid oxidation in minced beef meat 634
with added Krebs cycle substrates to stabilise colour. Food Chemistry, 187, 563-571. 635
Young, O. A., Lane, G. A., Priolo, A., & Fraser, K. (2003). Pastoral and species flavour in 636
lambs raised on pasture, lucerne or maize. Journal of the Science of Food and 637
Agriculture, 83(2), 94-104. 638
639

29
Figure Captions 640
641
Fig. 1. Means of fatty acids (mg/100 g of tissue) of intramuscular fat of M. longissimus 642
thoracis et lumborum: BH lamb – Bosnia and Herzegovina lambs from conventional 643
production; BH 4y – Bosnia and Herzegovina 4y old sheep; MN 4y − Montenegro 4y old 644
sheep; NW ord – Norwegian White lambs from conventional production; NW eco – 645
Norwegian White lambs from ecological production; NW 2y – Norwegian White 2y old 646
sheep; NW 4y – Norwegian White 4y old. Animals are from typical production systems of 647
three countries. Saturated fatty acids (SFA) include 12:0, 13:0, 14:0, 15:0, 16:0, 17:0, 18:0 and 648
20:0. Monounsaturated fatty acids (MUFA) include 16:1 and 18:1. Polyunsaturated fatty acids 649
(PUFA) include 18:2, 18:3, 20:2, 20:3, 20:4, 20:5, 22:5 and 22:6. Error bars indicate standard 650
error of means. Significant differences between mean values at the P ≤ 0.001 level are 651
indicated using different letters. 652
653
Fig. 2. Principal component analysis of significant (P < 0.001) volatiles identified in heated 654
adipose tissues. The components 1 and 2 discriminated volatile profiles of: (a) six animal 655
groups (BH lamb, BH 4y, MN 4y, NW lamb, NW 2y, and NW 4y) and (b) four animal groups 656
(BH ord, NW lamb, NW 2y and NW 4y). Volatiles extracted from adipose tissue of all animal 657
groups are summarized in Table S-1. 658
659
Fig. 3. Principal component analysis of metabolites extracted from M. longissimus thoracis et 660
lumborum. Bi-plot of the first two principal components discriminated six animal groups 661
according to significant metabolites (P ≤ 0.001) presented in Table S-2. 662

30
Fig. 4. Sensory quality profile (evaluated on a 1−9 scale) assessed by trained assessors on lean 663
meat of six animal groups. Mean scores for each attribute were tested at significance level P < 664
0.001 using one-way ANOVA (n = 92; eight trained panelists tested each sample in all animal 665
groups). Different letters (a−d) define significant differences (P < 0.05). 666
667
Fig. 5. Estimated regression coefficients (bk; dimension (1/area) for VOC and (1/(mg/kg)) for 668
metabolites) obtained from Partial Least Squares Regression (PLS1) analysis of instrumental 669
(X) and sensory attributes (Y). Values for bk ≥ 0.03 and bk ≥ 0.06 were used for relation 670
between sensory attributes and volatiles and between sensory attributes and metabolites, 671
respectively. 672

Fig. 1.

Fig. 2.

Fig. 3.

Fig.
4.

Fig. 5.

App
endi
x A
. Sup
plem
enta
ry d
ata
Tabl
e S-
1. T
he v
olat
ile c
ompo
unds
iden
tifie
d in
aliq
uot o
f 1g
lam
b/sh
eep
fat b
y H
S-G
C/M
S.
RT
1 R
I 2 C
ompo
unds
%
of t
otal
are
a
(min
)
B
H la
mb
3
(n =
15)
B
H 4
y 3
(n =
15)
M
N 4
y 3
(n =
15)
N
W e
co 3
(n =
9)
NW
ord
3
(n =
9)
NW
2y
3
(n =
15)
N
W 4
y 3
(n =
14)
Alka
nes
2.09
65
4 he
xane
***
0.79
6 a,
4
n.d.
5 n.
d.
0.48
2b 0.
107b
0.72
6a 0.
176b
2.27
67
4 3-
met
hylh
exan
e***
n.
d.
n.d.
0.
039
n.d.
n.
d.
n.d.
n.
d.
2.39
68
7 he
ptan
e***
0.
047b
n.d.
0.
097a
0.28
9b 0.
089b
0.08
6b 0.
056b
2.52
70
0 2,
4-di
met
hylh
exan
e***
n.
d.
n.d.
0.
087
n.d.
n.
d.
n.d.
n.
d.
2.83
73
2 2-
met
hylh
epta
ne**
* n.
d.
n.d.
0.
179a
n.d.
n.
d.
n.d.
0.
038b
2.93
74
1 3-
met
hylh
epta
ne**
* n.
d.
n.d.
0.
360
n.d.
n.
d.
n.d.
n.
d.
2.98
74
6 m
ethy
lcyc
lohe
xane
**
n.d.
n.
d.
n.d.
n.
d.
0.23
5 n.
d.
n.d.
3.
25
771
octa
ne**
* 0.
015c
0.04
0c 0.
225a
0.21
6bc
0.51
7b 0.
100bc
0.
440bc
5.25
91
4 no
nane
***
n.d.
0.
033a
n.d.
n.
d.
n.d.
n.
d.
n.d.
8.
44
1022
2-
met
hyld
ecan
e**
n.d.
n.
d.
n.d.
n.
d.
n.d.
n.
d.
0.28
6
17.3
4 10
80
unde
cane
***
0.14
2b 0.
927a
0.00
8b n.
d.
n.d.
0.
088b
n.d.
25
.83
1187
2-
prop
yl-1
,1,3
-trim
ethy
l-cyc
lohe
xane
* n.
d.
n.d.
0.
004
n.d.
n.
d.
n.d.
n.
d.
32.6
2 13
93
tetra
deca
ne**
n.
d.
n.d.
n.
d.
0.01
4a 0.
005ab
n.
d.
n.d.
34
.96
1488
pe
ntad
ecan
e***
n.
d.
n.d.
0.
001b
n.d.
0.
047a
n.d.
n.
d.
37.0
6 15
84
hexa
deca
ne**
n.
d.
n.d.
n.
d.
n.d.
n.
d.
n.d.
0.
003
Tota
l are
a
2,23
E+08
1,
28E+
08
1,20
E+09
7,
08E+
07
1,43
E+08
2,
15E+
08
1,16
E+08
Alke
nes
2.20
66
6 (E
)-2-
hexe
ne**
n.
d.
n.d.
n.
d.
n.d.
n.
d.
n.d.
1.
000
4.60
87
5 (E
)-2-
octe
ne**
* 0.
100b
n.d.
0.
998a
n.d.
n.
d.
n.d.
n.
d.
11.2
3 10
43
(E)-
3-de
cene
**
n.d.
0.
545
n.d.
n.
d.
n.d.
n.
d.
n.d.
12
.73
1044
(Z
)-5-
tride
cene
***
n.d.
0.
154
n.d.
n.
d.
n.d.
n.
d.
n.d.

14.8
7 10
50
(Z)-
3,7-
dim
ethy
l-2-o
cten
e***
n.
d.
n.d.
0.
002
n.d.
n.
d.
n.d.
n.
d.
14.7
7 10
50
(E)-
3-m
ethy
l-2-n
onen
e***
n.
d.
n.d.
0.
002
n.d.
n.
d.
n.d.
n.
d.
26.7
6 12
09
(E)-
3-do
dece
ne**
* n.
d.
0.13
8 n.
d.
n.d.
n.
d.
n.d.
n.
d.
40.6
3 17
72
[R-[
R*,
R*-
(E)]
]-3,
7,11
,15-
tetra
met
hyl-2
-he
xade
cene
**
n.d.
0.
163a
n.d.
0.
100ab
0.
100ab
n.
d.
n.d.
Tota
l are
a 3,
22E+
07
4,68
E+07
2,
15E+
09
4,84
E+06
1,
80E+
06
7,20
E+05
4,
92E+
06
Alco
hols
7.
36
998
ethy
l alc
ohol
* n.
d.
0.92
3ab
0.94
0ab
n.d.
0.
957a
n.d.
n.
d.
16.1
6 10
64
5-et
hyl-3
-non
anol
***
n.d.
n.
d.
n.d.
0.
010a
0.00
4b n.
d.
n.d.
22
.57
1126
bu
tano
l***
n.
d.
n.d.
0.
004
n.d.
n.
d.
n.d.
n.
d.
23.5
9 11
43
1-pe
nten
-3-o
l*
n.d.
0.
035a
0.01
7ab
0.37
0a 0.
010ab
0.
336ab
0.
282ab
25
.83
1187
2-
hept
yn-1
-ol*
n.
d.
n.d.
n.
d.
n.d.
n.
d.
n.d.
0.
050
28.3
6 12
51
1-pe
ntan
ol**
n.
d.
0.02
2ab
0.02
0ab
0.43
2a 0.
020a
0.66
0ab
0.52
4a
31.7
4 13
60
hexa
nol*
n.
d.
0.00
9a n.
d.
0.10
6a 0.
005a
n.d.
0.
070a
34.2
5 14
58
1-oc
ten-
3-ol
***
n.d.
0.
012a
0.01
1a 0.
082ab
0.
003ab
n.
d.
0.05
4ab
35.0
1 14
90
2-et
hyl-1
-hex
anol
***
n.d.
n.
d.
0.00
4 n.
d.
n.d.
n.
d.
n.d.
36.5
6 15
61
6-m
ethy
l-1-h
epta
nol*
**
n.d.
n.
d.
0.00
1 n.
d.
n.d.
n.
d.
n.d.
36
.57
1561
1-
octa
nol*
n.
d.
n.d.
0.
002ab
n.
d.
0.00
2a n.
d.
0.02
0ab
42.6
9 18
93
benz
yl a
lcoh
ol*
n.d.
n.
d.
0.00
1 n.
d.
n.d.
n.
d.
n.d.
To
tal a
rea
1,08
E+06
4,
51E+
08
5,69
E+08
5,
20E+
07
1,11
E+09
2,
51E+
07
3,97
E+07
Alde
hyde
s 2.
58
707
acet
alde
hyde
**
0.16
3ab
0.38
9ab
n.d.
0.
052b
0.33
9a 0.
084b
0.27
8ab
3.37
78
2 pr
opan
al**
* n.
d.
0.04
1b n.
d.
0.08
4a 0.
013b
0.03
4b n.
d.
3.41
78
5 bu
tane
dial
**
n.d.
0.
031ab
n.
d.
0.01
1ab
0.03
1a n.
d.
0.02
6ab
4.20
84
8 2-
met
hylp
ropa
nal*
n.
d.
n.d.
n.
d.
n.d.
n.
d.
0.03
1 n.
d.
4.38
86
0 2-
prop
enal
***
n.d.
0.
035b
n.d.
0.
077a
0.01
9b n.
d.
n.d.
5.
01
900
buta
nal*
n.
d.
0.02
3 n.
d.
n.d.
n.
d.
n.d.
n.
d.

6.33
96
4 3-
met
hylb
utan
al*
0.14
7ab
0.04
8ab
n.d.
0.
033ab
0.
037a
0.09
6ab
n.d.
6.
88
984
pent
anal
**
0.03
3a 0.
023ab
n.
d.
0.00
1ab
0.04
7ab
0.02
6ab
n.d.
14
.20
1047
2-
bute
nal*
* n.
d.
n.d.
0.
111
n.d.
n.
d.
n.d.
n.
d.
17.3
7 10
80
hexa
nal*
**
0.30
4a n.
d.
0.25
8ab
0.24
3a 0.
196a
0.19
6a 0.
198ab
21.2
3 11
08
(E)-
2-pe
nten
al *
**
0.25
6a n.
d.
0.00
5b n.
d.
n.d.
n.
d.
n.d.
24
.89
1167
he
ptan
al**
* n.
d.
0.25
4b 0.
507ab
0.
288a
0.18
3ab
0.31
1ab
0.23
0b
27.9
0 12
38
(E)-
2-he
pten
al*
n.d.
0.
011a
n.d.
0.
003ab
0.
003ab
n.
d.
0.00
4ab
26.7
7 12
09
(E)-
2-he
xena
l**
n.d.
0.
025a
0.03
0ab
0.01
0ab
0.01
3ab
n.d.
0.
022ab
29
.61
1288
oc
tana
l*
0.02
3ab
n.d.
0.
019ab
0.
032ab
0.
018ab
0.
050a
0.06
2ab
32.7
9 13
99
nona
nal*
* 0.
074ab
0.
048ab
0.
057a
0.09
9a 0.
065ab
0.
120a
0.10
1ab
33.8
2 14
40
(E)-
2-oc
tena
l**
n.d.
0.
013ab
c 0.
009bc
0.
008ab
c 0.
014a
0.01
4ab
0.01
1abc
34.7
6 14
79
(E,Z
)-2,
4-he
ptad
iena
l***
n.
d.
0.05
8a 0.
085a
0.05
0a 0.
020ab
0.
038a
0.06
7a 36
.24
1546
(Z
)-2-
none
nal*
**
n.d.
n.
d.
n.d.
0.
013ab
0.
028a
n.d.
n.
d.
Tota
l are
a 2,
69E+
08
2,60
E+08
1,
53E+
08
4,04
E+08
4,
62E+
08
3,17
E+08
2,
39E+
08
Ket
ones
4.
16
845
acet
one*
0.
481a
0.04
1ab
n.d.
0.
045ab
0.
102ab
0.
039ab
0.
008b
29.6
1 12
88
3-hy
drox
y-2-
buta
none
**
n.d.
0.
333a
n.d.
n.
d.
n.d.
n.
d.
0.24
6ab
30.8
8 13
30
2,3-
octa
nedi
one*
* 0.
519b
0.59
5ab
0.94
4ab
0.92
6a 0.
797ab
0.
955a
0.74
6ab
37.4
4 16
03
2-un
deca
none
***
n.d.
0.
005ab
0.
015a
0.00
9a 0.
029a
0.00
5ab
n.d.
38
.83
1674
ac
etop
heno
ne**
n.
d.
0.01
3 n.
d.
n.d.
n.
d.
n.d.
n.
d.
44.7
8 20
26
2-pe
ntad
ecan
one*
**
n.d.
0.
022a
0.04
1a 0.
017a
0.05
7a n.
d.
n.d.
48
.01
2252
2-
hept
adec
anon
e***
n.
d.
n.d.
n.
d.
0.00
3ab
0.01
6a n.
d.
n.d.
To
tal a
rea
9,34
E+07
4,
54E+
08
3,10
E+08
5,
39E+
08
1,54
E+08
5,
10E+
08
2,35
E+08
Ac
ids
35.7
2 15
22
form
ic a
cid*
* n.
d.
n.d.
n.
d.
n.d.
n.
d.
n.d.
0.
422
36.8
4 15
74
2-m
ethy
lpro
pano
ic a
cid*
n.
d.
0.17
5a 0.
156a
0.06
1a 0.
122a
n.d.
n.
d.
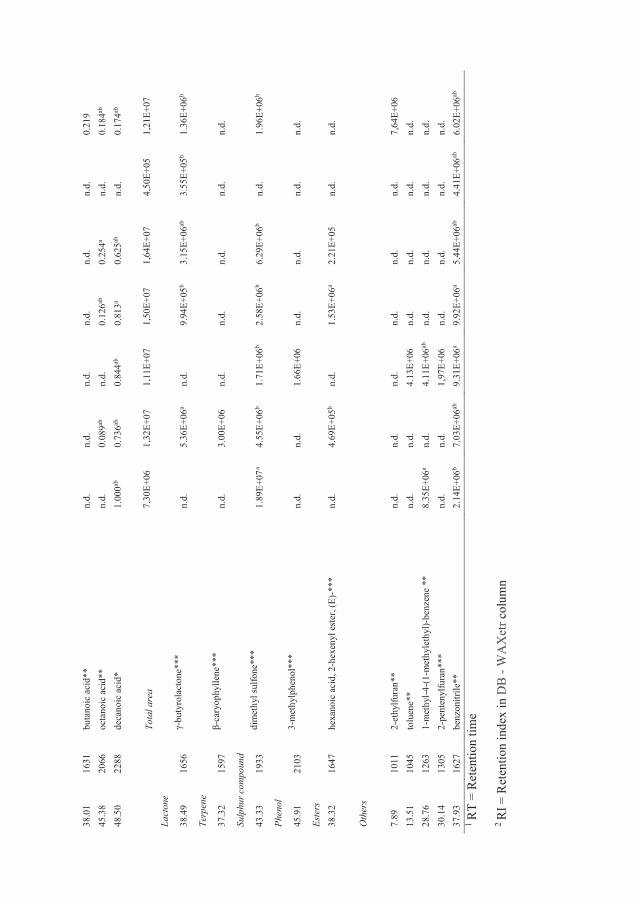
38.0
1 16
31
buta
noic
aci
d**
n.d.
n.
d.
n.d.
n.
d.
n.d.
n.
d.
0.21
9 45
.38
2066
oc
tano
ic a
cid*
* n.
d.
0.08
9ab
n.d.
0.
126ab
0.
254a
n.d.
0.
184ab
48.5
0 22
88
deca
noic
aci
d*
1.00
0ab
0.73
6ab
0.84
4ab
0.81
3a 0.
625ab
n.
d.
0.17
4ab
Tota
l are
a 7,
30E+
06
1,32
E+07
1,
11E+
07
1,50
E+07
1,
64E+
07
4,50
E+05
1,
21E+
07
Lact
one
38.4
9 16
56
γ-bu
tyro
lact
one*
**
n.
d.
5.36
E+06
a n.
d.
9.94
E+05
b 3.
15E+
06ab
3.
55E+
05b
1.36
E+06
b
Terp
ene
37.3
2 15
97
β-ca
ryop
hylle
ne**
*
n.d.
3.
00E+
06
n.d.
n.
d.
n.d.
n.
d.
n.d.
Sulp
hur c
ompo
und
43.3
3 19
33
dim
ethy
l sul
fone
***
1.
89E+
07 a
4.55
E+06
b 1.
71E+
06b
2.58
E+06
b 6.
29E+
06b
n.d.
1.
96E+
06b
Phen
ol
45.9
1 21
03
3-m
ethy
lphe
nol*
**
n.
d.
n.d.
1.
66E+
06
n.d.
n.
d.
n.d.
n.
d.
Este
rs
38.3
2 16
47
hexa
noic
aci
d, 2
-hex
enyl
est
er, (
E)-*
**
n.d.
4.
69E+
05b
n.d.
1.
53E+
06a
2.21
E+05
n.
d.
n.d.
O
ther
s
7.
89
1011
2-
ethy
lfura
n**
n.d.
n.
d.
n.d.
n.
d.
n.d.
n.
d.
7,64
E+06
13
.51
1045
to
luen
e**
n.d.
n.
d.
4.13
E+06
n.
d.
n.d.
n.
d.
n.d.
28
.76
1263
1-
met
hyl-4
-(1-
met
hyle
thyl
)-be
nzen
e **
8.
35E+
06a
n.d.
4.
11E+
06ab
n.
d.
n.d.
n.
d.
n.d.
30
.14
1305
2-
pent
enyl
fura
n***
n.
d.
n.d.
1,
97E+
06
n.d.
n.
d.
n.d.
n.
d.
37.9
3 16
27
benz
onitr
ile**
2.
14E+
06b
7.03
E+06
ab
9.31
E+06
a 9.
92E+
06a
5.44
E+06
ab
4.41
E+06
ab
6.02
E+06
ab
1 R
T =
Ret
entio
n tim
e
2 R
I = R
eten
tion
inde
x in
DB
- W
AX
etr c
olum
n

3 A
dipo
se ti
ssue
s of s
even
ani
mal
gro
ups:
BH
lam
b –
Bos
nia
and
Her
zego
vina
lam
bs fr
om c
onve
ntio
nal p
rodu
ctio
n; B
H 4
y –
Bos
nia
and
Her
zego
vina
4y
old
shee
p; M
N 4
y −
Mon
tene
gro
4y o
ld sh
eep;
NW
ord
– N
orw
egia
n W
hite
lam
bs fr
om c
onve
ntio
nal p
rodu
ctio
n; N
W e
co –
Nor
weg
ian
Whi
te la
mbs
from
eco
logi
cal p
rodu
ctio
n; N
W 2
y –
Nor
weg
ian
Whi
te 2
y ol
d sh
eep;
NW
4y
– N
orw
egia
n W
hite
4y
old.
4 ab
cd M
eans
of a
rea
valu
es (%
) with
diff
eren
t let
ters
in th
e sa
me
row
indi
cate
stat
istic
ally
sign
ifica
nt d
iffer
ence
s
5 n.d
. = N
ot d
etec
ted
in th
e sa
mpl
e
* =
P ˂
0.05
** =
P ˂
0.0
1
***
= P ˂
0.00
1

Tabl
e S-
2. L
ist o
f met
abol
ites d
etec
ted
in la
mb/
shee
p M
. lon
giss
imus
thor
acis
et l
umbo
rum
and
iden
tifie
d by
GC
/MS.
RI1
Met
abol
ites
Con
cent
ratio
n (m
g/kg
)
BH
lam
b 2
(n =
15)
B
H 4
y 2
(n =
15)
M
N 4
y 2
(n =
15)
N
W e
co 2
(n =
9)
NW
ord
2
(n =
9)
NW
2y
2
(n =
15)
N
W 4
y 2
(n =
14)
Amin
o ac
ids
10
90.7
0 al
anin
e 17
4.51
ab
196.
91a
146.
68bc
16
3.77
ab
136.
26bc
d 10
8.04
d 12
2.05
cd
1162
.23
2-am
inob
utyr
ic a
cid
0.
86ab
c 1.
16a
0.62
c 1.
08ab
0.
95ab
c 0.
70bc
0.
67c
1526
.53
4-am
inob
utyr
ic a
cid
8.36
ab
10.5
0a 5.
11bc
4.
89bc
5.
03bc
3.
16c
3.58
c
1814
.43
argi
nine
0.
64ab
0.
32c
0.52
bc
0.83
a 0.
59ab
c 0.
41bc
0.
44bc
1666
.44
aspa
ragi
ne
1.58
b 2.
72a
1.20
b 1.
37b
1.42
b 0.
86b
1.09
b
1509
.77
aspa
rtic
acid
5.
98b
10.9
5a 15
.40a
2.36
b 2.
87b
2.53
b 5.
27b
1424
.73
β-al
anin
e 29
.48ab
13
.89cd
11
.28d
39.3
1a 23
.34bc
11
.36d
12.4
2d
1140
.39
buty
ro-1
,4-la
ctam
0.
16c
0.88
a 0.
57ab
0.
11bc
0.
30bc
0.
18bc
0.
33bc
1366
.92
cycl
o-le
ucin
e 5.
29ab
6.
56a
6.32
a 3.
86bc
3.
52c
3.92
bc
4.97
abc
1549
.83
cyst
eine
4.
80b
7.38
a 2.
10c
2.07
c 2.
50bc
1.
88c
2.59
bc
1615
.40
glut
amic
aci
d 86
.53b
228.
66a
28.1
0b 56
.56b
55.3
5b 40
.80b
53.0
9b
1304
.47
glyc
ine
184.
42bc
22
0.23
ab
180.
56bc
23
0.10
ab
266.
70a
139.
73c
176.
73bc
16
61.3
0 ho
moc
yste
ine
0.51
ab
0.67
a 0.
60a
0.47
ab
0.31
b 0.
41b
0.52
ab
1518
.00
4-hy
drox
ypro
line
8.57
a 2.
36b
2.66
b 6.
16a
6.10
a 2.
38b
2.32
b 16
05.8
9 hy
pota
urin
e 2.
72a
0.94
b 0.
90b
0.55
b 0.
48b
0.39
b 0.
42b
1288
.60
isol
euci
ne
42.6
3b 69
.03a
32.6
6bc
27.8
2bc
25.6
9bc
22.4
3c 25
.75c
1264
.43
leuc
ine
69.6
8b 12
3.60
a 56
.73bc
42
.97bc
40
.47bc
36
.77c
41.5
5bc
1912
.30
lysi
ne
15.9
7bc
35.0
6a 22
.27b
14.4
3bc
12.5
8c 12
.61c
15.2
0bc
1514
.50
met
hion
ine
18.2
4b 29
.64a
17.3
5bc
9.96
c 10
.77bc
10
.45c
13.2
6bc
1809
.10
orni
thin
e 5.
89b
12.6
0a 4.
86b
2.45
b 2.
43b
3.24
b 3.
16b
1629
.33
phen
ylal
anin
e 45
.36b
83.9
1a 41
.87bc
29
.24bc
27
.78bc
24
.88c
30.6
6bc
1519
.43
pyro
glut
amic
aci
d 64
.31b
90.0
9a 44
.33b
62.9
1ab
41.2
3b 49
.75b
54.8
3b 13
79.4
3 th
reon
ine
32.1
9b 63
.04a
29.8
9bc
28.5
6bc
22.3
3bc
19.1
1c 20
.83bc
2214
.74
trypt
opha
n 6.
94bc
12
.89a
7.50
b 3.
32c
3.51
bc
3.72
c 5.
34bc
1932
.60
tyro
sine
24
.25bc
64
.06a
44.2
1ab
24.7
2bc
25.2
8bc
24.2
3c 30
.06bc
1208
.77
valin
e 52
.13b
98.4
3a 42
.19bc
35
.62bc
32
.06bc
28
.48c
30.4
7bc
Tota
l con
cent
ratio
n 89
2.00
13
86.4
7 74
6.46
79
5.47
74
9.83
55
2.43
65
7.60
Acid
s
1937
.87
asco
rbic
aci
d 0.
89a
0.76
ab
0.17
c 0.
74ab
0.
77ab
0.
39bc
0.
38bc

1804
.57
citri
c ac
id
4.84
b 2.
04bc
23
.09a
2.08
bc
2.36
bc
1.92
c 2.
72bc
20
10.0
0 di
ethy
l tar
trate
1.
06a
0.86
ab
0.56
b 0.
90ab
0.
56ab
0.
42b
0.39
b 13
46.2
3 fu
mar
ic a
cid
9.79
a 3.
84c
4.30
c 9.
15ab
5.
91ab
c 4.
91bc
8.
51ab
19
80.4
9 ga
lact
onic
aci
d 0.
11c
0.31
abc
0.24
bc
0.57
a 0.
51a
0.47
a 0.
46ab
19
89.0
7 gl
ucon
ic a
cid
6.16
b 2.
27b
51.4
4a 2.
16b
2.62
b 2.
46b
3.38
b 19
27.5
7 gl
ucur
onic
aci
d 0.
44a
0.49
a 0.
09b
0.21
b 0.
20b
0.16
b 0.
11b
1321
.67
glyc
eric
aci
d 32
.34ab
6.
85c
42.7
2a 27
.78b
19.9
4bc
26.3
9b 22
.95b
1149
.20
3-hy
drox
ybut
yric
aci
d 8.
42ab
12
.09a
5.01
b 3.
08b
2.96
b 2.
50b
2.93
b
1228
.67
4-hy
drox
ybut
yric
aci
d 2.
95a
2.59
ab
1.13
d 2.
29ab
c 1.
68bc
d 1.
08d
1.36
cd
1477
.30
mal
ic a
cid
17.3
2abc
11.6
0bcd
22.5
0a 22
.59ab
15
.06ab
cd
7.07
d 10
.05cd
1037
.80
pyru
vic
acid
0.
84b
0.39
b 8.
57a
0.54
b 0.
42b
0.74
b 0.
43b
1750
.53
ribon
ic a
cid
1.16
b 1.
05b
7.00
a 0.
84b
0.97
b 0.
77b
1.07
b
1310
.17
succ
inic
aci
d 22
8.61
ab
273.
02a
94.9
5e 20
7.67
bc
173.
95cd
14
1.96
d 17
2.92
cd
1546
.43
thre
onic
aci
d 1.
01a
0.63
b 0.
81ab
0.
85ab
0.
70b
0.60
b 0.
66b
To
tal c
once
ntra
tion
315,
96
318,
79
262,
58
281,
45
228,
61
191,
85
228,
32
Al
coho
ls
1707
.80
arab
itol
5.71
c 8.
29a
1.67
d 5.
98ab
c 5.
81bc
5.
12c
7.70
ab
1031
.00
2,3-
buta
nedi
ol
8.09
b 28
.17a
4.47
b 6.
68b
7.32
b 11
.71b
14.2
0b
1927
.45
gala
ctito
l 24
.43b
34.0
8a 11
.13c
14.9
0bc
13.1
8c 14
.47bc
12
.00c
2083
.87
myo
-inos
itol
319.
19a
326.
71a
206.
81b
327.
69a
313.
34ab
31
5.73
a 20
6.34
b
Tota
l con
cent
ratio
n 35
7,42
39
7,24
22
4,08
35
5,26
33
9,65
34
7,03
24
0,24
Suga
rs
18
56.2
3 fru
ctos
e 23
7.09
a 13
0.63
bc
114.
28c
291.
32a
212.
06ab
c 18
6.38
ab
228.
33a
1897
.67
gala
ctos
e 60
7.04
a 50
2.74
ab
330.
67b
630.
09a
605.
67a
570.
28a
634.
11a
1878
.20
gluc
ose
926.
08ab
67
6.39
bc
454.
17c
1112
.88a
982.
31ab
78
9.82
ab
867.
94ab
2629
.63
sucr
ose
0.16
b 0.
11b
2.20
a 0.
39b
0.64
b 0.
41b
0.16
b
To
tal c
once
ntra
tion
1770
.37
1309
.86
901.
32
2034
.68
1800
.69
1546
.89
1730
.54
Ph
osph
ates
2292
.77
fruct
ose-
6-ph
osph
ate
216.
99bc
d 16
5.94
cd
163.
96d
391.
42a
285.
84ab
c 29
9.11
ab
328.
34a
2329
.63
gluc
ose-
6-ph
osph
ate
720.
40bc
53
0.50
c 53
7.61
c 12
96.9
2a 10
10.4
3ab
909.
11ab
10
20.3
3ab
2236
.42
glyc
ero-
3-ph
osph
oeth
anol
amin
e 5.
11bc
7.
13ab
5.
57bc
8.
62a
4.86
bc
4.93
bc
4.12
c
1748
.53
glyc
erol
-3-p
hosp
hate
25
.00bc
58
.07a
36.4
4abc
44.7
1ab
24.8
3bc
40.6
3abc
16.7
9c
2307
.10
man
nose
-6-p
hosp
hate
37
.19bc
21
.92c
26.7
3c 84
.68a
61.4
4ab
47.0
6b 52
.05b

1779
.12
O-p
hosp
hory
l-eth
anol
amin
e 4.
29a
2.67
b 2.
86b
2.12
b 1.
88b
1.73
b 1.
63b
To
tal c
once
ntra
tion
1008
,98
786,
24
773,
17
1828
,47
1389
,28
1302
,56
1423
,27
Lipi
ds
24
51.6
3 ei
cosa
noic
aci
d (C
20:0
) 3.
60cd
2.
21d
2.68
d 8.
16a
5.98
ab
4.52
bc
5.03
bc
2144
.58
hept
adec
anoi
c ac
id (C
17:0
) 0.
47b
0.66
ab
0.85
a 0.
32b
0.39
b 0.
48b
0.58
ab
2382
.00
1-m
onom
yris
tin
0.18
b 0.
12b
0.26
ab
0.48
a 0.
33ab
0.
24b
0.28
ab
2208
.23
octa
deca
dien
oic
acid
, 9,1
2-(Z
,Z)-
(18:
2)
1.11
abc
2.15
a 1.
77ab
0.
55c
0.64
bc
0.76
bc
0.93
bc
2214
.83
octa
deca
noic
aci
d, 9
-(Z)
- (C
18:1
) 4.
48b
7.62
ab
14.9
2a 2.
35b
3.20
b 3.
89b
5.61
b 22
17.4
1 oc
tade
catri
enoi
c ac
id, 9
,12,
15-(Z
,Z,Z
)- (C
18:3
) 0.
06c
0.31
ab
0.36
a 0.
08bc
0.
06bc
0.
13bc
0.
13bc
To
tal c
once
ntra
tion
9,90
13
,08
20,8
4 11
,94
10,6
0 10
,00
12,5
6
Oth
er N
-con
tain
ing
com
poun
ds
11
35.7
7 3-
hydr
oxyp
yrid
ine
1.22
a 0.
85b
1.14
a 1.
41a
1.33
a 1.
14a
1.28
a 25
77.3
0 in
osin
e 21
5.92
a 18
0.22
ab
154.
39b
192.
75ab
16
5.69
b 14
0.01
b 17
1.29
b
1274
.00
nico
tinic
aci
d 1.
73b
3.06
a 2.
15b
2.15
b 2.
11b
1.87
b 2.
02b
1984
.50
pant
hote
nic
acid
0.
51ab
0.
78a
0.39
b 0.
24b
0.28
b 0.
66a
0.78
a 13
96.9
1 th
ymin
e 1.
97a
2.17
a 1.
38ab
1.
26ab
0.
88b
1.10
b 1.
40ab
19
10.6
3 ty
ram
ine
46.7
8a 58
.68a
3.70
b 1.
00b
0.69
b 0.
58b
0.85
b 12
35.6
0 ur
ea
70.5
7c 75
.27bc
11
4.07
ab
117.
21ab
11
1.66
abc
115.
68a
68.2
0c 24
63.6
7 ur
idin
e 6.
84a
4.31
bc
2.90
d 4.
99b
4.87
b 3.
49cd
3.
28cd
To
tal c
once
ntra
tion
345.
54
325.
33
280.
11
321.
01
287.
52
264.
53
249.
09
1
RI =
Ret
entio
n in
dex
2 M
. lon
giss
imus
thor
acis
et lu
mbo
rum
of s
even
ani
mal
gro
ups:
BH
lam
b –
Bos
nia
and
Her
zego
vina
lam
bs fr
om c
onve
ntio
nal p
rodu
ctio
n; B
H 4
y
– B
osni
a an
d H
erze
govi
na 4
y ol
d sh
eep;
MN
4y −
Mon
tene
gro
4y o
ld sh
eep;
NW
ord
– N
orw
egia
n W
hite
lam
bs fr
om c
onve
ntio
nal p
rodu
ctio
n;
NW
eco
– N
orw
egia
n W
hite
lam
bs fr
om e
colo
gica
l pro
duct
ion;
NW
2y
– N
orw
egia
n W
hite
2y
old
shee
p; N
W 4
y –
Nor
weg
ian
Whi
te 4
y ol
d.
abcd
e M
ean
valu
es w
ith d
iffer
ent l
ette
rs in
dica
te si
gnifi
cant
diff
eren
ce a
t (P ≤
0.00
1).


Paper V


Production process and quality of two different dry-cured sheep hamsfrom Western Balkan countries
Sandra Stojkovi�c a, Vladana Grabe�z b, Milena Bjelanovi�c b, Snje�zana Mandi�c a,Goran Vu�ci�c a, Aleksandra Martinovi�c c, Torunn Thauland Håseth d, Ana Velemir a,Bjørg Egelandsdal b, *
a University of Banja Luka, Faculty of Technology, Department of Food Technology and Biotechnology, Vojvode Stepe Stepanovi�ca 73, 78 000 Banja Luka,Bosnia and Herzegovinab Norwegian University of Life Sciences, Department of Chemistry, Biotechnology and Food Science, P.O. Box 5003, N-1432 Aas, Norwayc University of Donja Gorica, Faculty of Food Technology, Food Safety and Ecology, Donja Gorica bb, 81000 Podgorica, Montenegrod Animalia, Lørenveien 38, P.O. Box 396 Økern, N-0513 Oslo, Norway
a r t i c l e i n f o
Article history:Received 14 January 2015Received in revised form26 June 2015Accepted 10 July 2015Available online 13 July 2015
Keywords:SteljaSheep hamVolatile compoundsSensory properties
a b s t r a c t
Differences in the production process, the composition of volatile compounds (VOCs), physicochemicalparameters and sensory properties were studied in Stelja sheep ham, produced in Bosnia and Herze-govina (B&H) and Montenegro (MN) using different technologies. Gas Chromatography�Mass Spec-trometry was used for the analysis of volatile compounds. MN sheep hams were featured with moreintense smoke flavour, relatively higher salt content (6.4% w/w) and a one week salting period. The mostprominent smoke compounds identified in MN hams were furans and phenols. Furthermore, lipiddegradation compounds (butanal, hexanal, heptanal, 2,3-pentanedione, and 1-hydroxy-2-propanone)differed among the two ham productions, being more abundant in MN hams, yet the products were notevaluated as rancid. B&H hams were less salty (4% w/w after 3 weeks of salting), with a distinct garlic andmetallic flavour and a more acidic taste compared to MN hams. Metabolites of the B&H hams impliedthat, due to the longer salting step, fermentation by microorganisms could have occurred. Differences inprocess technology significantly influenced the composition of volatile compounds and sensorial prop-erties of these products produced in neighboring geographical areas.
© 2015 Elsevier Ltd. All rights reserved.
1. Introduction
Dry-cured sheep meat traditionally produced in the WesternBalkan countries is often made using sheep aged between 1 and 6years. The name Pastrma refers to salted, smoked and dried sheepcarcasses (Stamenkovi�c & Devi�c, 2006). U�zice sheep Pastrma(Serbia) consists of the whole carcass after cutting along sternumand pelvic and removing head, organs and spinal cord from theinside of the carcass. Kidneys with fat are kept on the carcass. Legmuscles are removed for ham production. Salted and dried sheepmeat without bones is called Stelja. In Zlatibor (Serbia) mountainregion, sheep ham and Stelja were produced by using nitrite andnitrate during a 28e42 days period (Troeger, Veskovi�c-Mora�canin,Turubatovi�c, Risti�c, & Dederer, 2009). In B&H Stelja, ham and
shoulder are typical sheep products (Gani�c, �Cau�sevi�c, Karahmet,Stojkovi�c, & Ratkovi�c, 2013; Operta, Smaji�c, Tahmaz, & Gani�c,2010). In B&H garlic and pepper are added in some regions withsalt to achieve characteristic aroma to the product (Gani�c et al.,2013). The eastern part of B&H uses dry spruce branches duringthe first few days of smoking to obtain gold-yellow colour andspecific aroma (Gani�c, 2012). The former Yugoslav Republic ofMacedonia has its own Pastrma produced from deboned sheepcarcass using characteristic processing steps like wrapping of theproduct in sheep skin or sprinkling it with corn flour (D�zinleski,1969). Kastradina (Croatia) is produced during 43 and 73 daysfrom sheep haunch, shoulder, and “kora” (remaining part ofcarcass) using salting (sea salt, with or without spices), washing,drying-smoking, and ripening (Krvavica, Friganovi�c, Ðugum, &Kegalj, 2009; Krvavica et al., 2011).
Mediterranean countries consider dry-salted and dried sheepmeat as a regional, traditional product (Villalobos-Delgado et al.,* Corresponding author.
E-mail address: [email protected] (B. Egelandsdal).
Contents lists available at ScienceDirect
LWT - Food Science and Technology
journal homepage: www.elsevier .com/locate/ lwt
http://dx.doi.org/10.1016/j.lwt.2015.07.0220023-6438/© 2015 Elsevier Ltd. All rights reserved.
LWT - Food Science and Technology 64 (2015) 1217e1224

2014). However, NortheEurope has also traditionally produceddried sheep and lamb in the Faeroe Islands, Iceland and Norway(Håseth, Thorkelsson, Puolanne, & Sidhu, 2014). The Faeroe Islandshave a unique air-dried and unsalted lamb meat product namedSkerpikjøt. Norway has a protected product from dry-cured lamb orsheep leg called Fenalår. The production varies in salt content, theuse of nitrite, smoke, and flavour additives, and the entire pro-cessing takes 90 days (Håseth et al., 2014).
The number of publications related toWestern Balkan lamb andsheep dry-cured ham is small (Gani�c, 2012; Gani�c et al., 2013;Krvavica et al., 2009, 2011; Operta et al., 2010; Stamenkovi�c &Devi�c, 2006; Troeger et al., 2009) as for other parts of Europe(Håseth et al., 2014; Villalobos-Delgado et al., 2014). Chemicalcharacterization of sheep hams is useful for understanding andcomparing sensory properties of specific regional products, but islargely missing in the literature.
The present study focuses on Stelja production from two regionsof Western Balkan, i.e. from B&H and Montenegro. From B&H thedry-cured product studied was typical for the Vla�si�c region whileMontenegro has only one production process. Both products areproduced by the local sheep Pramenka. The dry-cured sheep meatin B&H and MN is mostly produced in local butchers' during thewinter and spring season (Stamenkovi�c & Devi�c, 2006) in smallquantities. Nevertheless, larger scale production has been estab-lished during the last decade mimicking the old traditional pro-duction processes.
This study was designed to describe the differences in saltcontent, development of volatile compounds, organic acid profilesand sensory attributes of traditional, dry cured sheep ham pro-duced in different regions of Western Balkan (B&H and MN).
2. Materials and methods
Fifteen sheep of the Vla�si�cka Pramenka from mountain Vla�si�c(B&H) and 15 sheep of Pivska Pramenka from Pljevlja area (MN)were obtained. The animals were approximately 5 years old, takenfrom the same herd and production system.
2.1. Raw materials and processing
After slaughtering (at 10 �C), the carcasses were chilled at þ4 �Cfor 24 h. Carcasses were deboned, but shin bones (Os tibia et Osfibula) were kept for hanging the carcass in a smoke house. The pHwas measured 24 h post mortem in M. semimembranosus using pHmeters: HANNA 99161 (Cluj-Napoca, Romania) for B&H animalsand Knick Portamess 913 (Berlin, Germany) for MN animals.
2.1.1. Bosnia and HerzegovinaThe weight of sheep carcasses used in B&H ham productionwas
25.0 ± 3.1 kg with EU fat scores in a range 8e12 (scale 1e15 points).Average pH24 h of the thigh was 5.87. The hamwas cut by a butcher.Salting was done by rubbing coarse salt (no nitrite) on the surface(35 g NaCl/kg) with peppercorn (0.3% w/w) and crushed garlic(~0.3% w/w). Salted carcasses were placed horizontally in plasticcontainers, pressed with 100 kg during the first week, up to 200 kgduring the second week, and to 300 kg during the third week tofacilitate removal of blood and brine. Carcasses were left in theirown brined juice for 21 days (at 4e10 �C, RH 85e90%). Drying andcold smoking with beech wood and sometimes sawdust was con-ducted in a traditional smoke house (12e18 �C, RH 70e80%),approximately 2 h per day for 14 days. The distance between sto-kehole and meat was about 2e3 m. Ripening in an aerated roomwithout smoke (7e10 �C, RH 70e80%) lasted 7 days. The Steljaproduction process lasted for 42 days. The weight loss was 14.73%.
2.1.2. MontenegroSheep carcasses for MN ham productionwere 27.3 ± 3.6 kg with
EU fat score in the range 6e11 (scale 1e15 points). Average pH24 hwas 5.58. The production took place in an industrial facility,following the same steps that are used in the traditional produc-tion. Carcasses were covered by salt (35e40 g NaCl/kg) and kept inplastic containers for 7 days (4e8 �C, RH 85e90%). Surplus salt wasremoved by quick immersion into water, followed by drying for 8 h(13e15 �C, RH 70%). The cold smoking process, regulated withairflow, was conducted 4 h/day for 7 days with controlled param-eters: 15e18 �C, RH 75e80%. Smoke was generated by glowingbeech wood in a smoke generator. The ripening phase continued ina chamber with controlled conditions (10 �C, RH 65e70%) foradditional 15 days. Industrial production of Stelja lasted 29 days andthe weight loss was 28%.
2.2. Chemical and sensory analysis of the products
Sheep ham was removed from dry-cured carcass called Steljaand sample of M. Semimembranosus was vacuum-packed in plasticbags and stored (þ4 �C, in the dark, up to 2 months). The sampleswere than subjected to sensory analysis while the samples forvolatile and chemical analysis were manually cut (2 � 2 � 2 mm3
pieces) and frozen at �80 �C until analysis.Chloride content was determined using the methodology sug-
gested by Håseth, Egelandsdal, Bjerke, and Sørheim (2007). Theobtained results are presented as % w/w NaCl.
Samples for HPLC quantitative analysis of organic acids wereprepared and analysed by the method described by Narvhus,Østeraas, Mutukumira, and Abrahamsen (1998).
Volatile compounds were analysed using Gas Chromatogra-phy�Mass Spectrometry (GCeMS) using 2 g of the sample, in threereplicates. The samples were analysed by a dynamic headspacecollector (Teledyne Tekmar HT3, Ohio, USA) coupled with gaschromatograph 6890 and mass spectrometer 5975 (Agilent tech-nologies Santa Clara, CA, USA). Volatiles were separated using a DB-water fused silica capillary column (J&WScientific; 30 m; 0.25 mmi.d., film thickness 0.50 mm). Helium flow was 1 mL/min. Thetemperature program was as follows: 30 �C for 10 min, ramped1 �C/min to 40 �C than 3 �C/min to 70 �C, and 6.5 �C/min to 230 �C,holding 5 min at 230 �C. GC/MS interface was set on 250 �C. Massspectrumwas obtained by electronic impact at 70 eV with recordedmass range 30e550 m/z. The volatiles were identified comparingthe obtainedmass spectrumwith themass spectrum in the NIST 05(Mass Spectral Library, Agilent technologies Santa Clara, CA, USA). Ifthe probability of correct identification of each volatile was below60%, the component was discarded.
To exclude contamination from GC data set, GCeMS analysiswere performed with samples of plastic bags in laboratory air un-der the same conditions as volatile analysis. Semi-quantitativeamounts of volatiles were calculated using pentanal run routinelyas an external standard at low and high concentrations. Otherchemical groups were also run as external standards but pentanalhad, in retrospective, the most suitable dynamic range.
The slices (1.5 mm thick) of M. Semimembranosus were sensoryevaluated by 8 trained panellists in a room equipped with fluo-rescent lighting (at 25 �C). The evaluators were provided with50 mL of water and 20 g of unsalted bread to rinse their palate. Thepanel was trained on different sensory attributes of Stelja, such as,appearance (fat yellowness, redness, marbling), texture (fat firm-ness, hardness, dryness, juiciness), flavour (smoke, garlic, saltiness,bitterness, acidity, mature, cured, metallic, rancid, and soapy), andaroma intensity. The sensory evaluation of sheep ham was carriedout by a 9 point structured scale, using quantitative-descriptiveanalysis (Hootman, 1992).
S. Stojkovi�c et al. / LWT - Food Science and Technology 64 (2015) 1217e12241218

2.3. Statistical analysis
Differences in sensory properties between B&H and MN sam-ples were calculated using t-test (Minitab 16, Minitab Ltd.,Coventry, United Kingdom).
VOCs present in only 1/3 of replicates were removed. VOCspresent at the same level in all samples were also removed sincethe study focused on characteristic volatiles from two hams. Fifty-three VOCswere significantly different (p < 0.05) between B&H andMN samples as assessed from one-way ANOVA with Tukey's com-parison test (Minitab 16). Results were expressed as % of totalamount in a specific chemical group (e.g. acids).
Principal component analysis (PCA) was used for explorativeexamination of the data, as well as to link the set of samples withsensory attributes and volatile data. Furthermore, correlations be-tween volatiles and sensory attributes were obtained throughPartial Least Square Regression (PLSR). PLS1 models showed cor-relation between individual sensory attributes (2 matrices) thatwere significantly different (p < 0.001) among two dry-cured sheephams. The volatile variables were weighed by their standard de-viation before subjected to PCA and PLS analysis. Estimatedregression coefficients from PLS regression models were analysedby jack-knife uncertainty test.
The PCA and PLSR calculations were done using UnscramblerX10.1 (Camo, Trondheim, Norway).
3. Results and discussion
3.1. Sensory properties
Fig. 1 shows the average values obtained for sensory propertiesof the two different sheep hams. The sheep hams were character-ized by high redness, yellow fat, dry but juicy texture, high aromaintensity and a smoked, salty, mature and cured flavour. Existingliterature has described sheep ham from Serbia as brownish, withsoft elastic texture, slightly marbled with yellow fat tissue, andhaving smoke aroma, moderately to distinctly salted and dried, aslight acidic taste with smell of fermented sheep cheese(Stamenkovi�c & Devi�c, 2006). Troeger et al. (2009) reported that25% of Serbian sheep hams randomly sampled at an exhibition, hadintensive smoke flavour and some were very salty (measured as6.2e6.7% w/w of salt). Sheep ham from B&H was more red, moremarbled, with more yellow fat compared to MN's ham (Figs. 1
and 2). No significant differences were found between B&H andMN hams in terms of dryness (p ¼ 0.38), juiciness (p¼ 0.47), aromaintensity (p ¼ 0.21), and mature flavour (p ¼ 0.14). Intensivelysmoked flavour of MN production presumed due to a more intensesmoking of a shorter period, compared to the production in B&H.Garlic addition had a significant contribution for the flavour of B&Hhams. Saltiness, cured flavour and hardness were significantlyhigher (p < 0.001) in MN sheep hams compared to the B&H hams.The higher weight loss (28% w/w) and salt content (6.3% w/w) leadto higher saltiness and hardness of theMN hams. Bitterness, acidityand metallic taste were more intense in B&H sheep hams (Figs. 1and 2). Bitter and metallic taste is generally less desirable, at leastin pork hams (Morales, Guerrero, Aguiar, Gu�ardia, & Gou, 2013). Inagreement with Arnau (2000), the shorter ripening period devel-oped stronger metallic taste in B&H sheep hams (Figs. 1 and 2). Theassessors did not identify any soapy and rancid flavour.
3.2. Volatile profiles
GCeMS analysis of sheep ham from twoWestern Balkan regions(B&H and MN) resulted in 53 volatiles (Table 1) significant fordifferent production processes.
Principal component analysis (PCA) was carried out on all 53identified volatile components of the 30 sheep hams. The bi-plot inFig. 2 reveals relations between VOCs and sensory attributes of thesheep hams from the two production systems. Sheep hams fromB&H andMNwere separated along PC1 (Fig. 2). B&H samples are onthe left and MN on the right side of the plot. There was, however,more variation in the sheep ham produced in Montenegro thanamong B&H samples.
Volatile profiles of B&H sheep hams were defined by sulphurcompounds and ketones (Fig. 2). Allyl methyl sulphide, allyl methyldisulphide, diallyl disulphide and methyl thiirane in B&H hamsoriginated from garlic (Wagner, da Silva, & Franco, 2008). TheseVOCs were not present in MN hams since garlic was not used duringthe salting stage. Garlic addition in B&H serves primarily as a flavourand secondly as an antimicrobial agent. Furthermore, ketones (2-pentanone, 1-hydroxy-2-butanone, 3-hydroxy-2-butanone, 2,3-dimethyl-2-cyclopenten-1-one, and 2-methyl-2-cyclopenten-1-one) were the second dominant group of volatiles in B&H ham(for identified compounds see Table 1). 2-pentanone can reflect lipiddegradation or mould metabolism (Muriel, Antequera, Petr�on,Andr�es, & Ruiz, 2004), while 3-hydroxy-2-butanone may beformed via microbial glycolysis (Kandler, 1983). Among other vola-tiles, pentanal and 1-pentanol were significantly related to theprofile of B&H hams. Pentanal's prevalence may reflect differencesin fatty acid composition between B&H and MN ham or processdifferences, since B&H hams had shorter ripening period.
Dominant volatiles in MN sheep hams were smoke components(furans and phenols), acids, aldehydes, alcohols, and esters (Fig. 2).The smoke components (furan, furfural, 3-furaldehyde, 1-(2-furanyl)-ethanone, 2-furanmethanol, 5-methyl-2(5H)-furanone,and 4-ethyl-2-methoxy-phenol) played a significant role in thevolatile profile. The higher concentration of smoke componentsidentified in MN sheep ham compared to B&H was unexpectedsince the smoking process can be better controlled in an industrialfacility. Possibly the preference for smoked flavour is, by tradition,more pronounced in MN.
Furans and derivates are classified by the International Agencyfor Research on Cancer (IRAC, 1997) as possible carcinogenic com-pounds. Increased attention is paid to their derivates (furan, 2-furfural, furfuryl alcohol, and penthylfuran), which are consideredto be toxic for human and animal health (P�erez-Palacios, Petisca,Pinho, & Ferreira, 2012). According to GCeMS analysis furfuralcontent (see Table 1) in MN ham was 13.8 mg/kg while in B&H
Fig. 1. Sensory attributes of 15 sheep ham samples from B&H (grey bars) and 15samples from MN (black bars); *** ¼ p < 0.001; ** ¼ p < 0.01; *p < 0.05. Error bars arestandard errors.
S. Stojkovi�c et al. / LWT - Food Science and Technology 64 (2015) 1217e1224 1219

samples it was much lower (1.7 mg/kg). Despite the distinctsmoked flavour, these smoke components were at the safe level.Furthermore, four polycyclic aromatic hydrocarbons (PAH4) ofconcern in smoked meat and meat products are benzo(a)pyrene,benz(a)anthracene, benzo(b)fluoranthene and chrysene (EuropeanCommission, 2014). According to Bjelanovic (personalcommunication), PAH4 concentration in dry-cured pork and beefmeat, traditionally and industrially produced in B&H and MN, wasbelow maximum acceptable level of 30 mg/kg.
Acids were important volatiles for MN products. Acetic acid, as aderivate of microbial metabolism of glucides (Pugliese et al., 2009)andwood degradation product, was higher for MN hams (32.17mg/kg) compared to B&H samples (17.64 mg/kg; see Table 1). Higherconcentration of acetic acid most likely reflected the intensivesmoking of MN hams. Presence of alcohols (ethanol and 2-propen-1-ol) in MN sheep ham is possibly related to lipolysis, proteolysis,and microbial activity. Esters also contributed to the MN volatileprofile. Methyl derivatives of short chain esters are particularlyimportant for flavour, i.e. methyl acetate. Formation of ethyl esterscan be connected to the presence of ethanol and can be result of themicrobial enzymatic mechanisms (e.g. esterification) reported inspecies belonging to Microccaceae and other bacterial species oftenfound in meat (Lori, Grisenti, Parolari, & Barbuti, 2005; Montel,Reitz, Talon, Berdagu�e, & Rousset- Akrim, 1996).
The following aldehydes contributed to MN sheep ham volatileprofile: butanal, 3-methyl-butanal, hexanal and heptanal (see MN3& MN4 and hexanal as an example; Fig. 2). Aldehydes are productsof fatty acid oxidation, particularly monounsaturated fatty acids(MUFA) and polyunsaturated fatty acids (PUFA). Sheep meat fromMN had the larger fraction of MUFA and PUFA, with a significantlylower ratio of n-6/n-3 fatty acids (Bjelanovic et al., 2015). Hexanal,which comes from linoleic acid is characterized by a rancid odour(Pugliese et al., 2009). The fact that assessors did not identify rancidflavour as sensory attribute can be related to the strong smokeflavour of MN ham that may camouflage rancid odour.
Branched aldehydes (i.e. 3-methylbutanal) are often found indry and fermented sausages and are generated bymicrobial activity(Herranz, de la Hoz, Hierro, Fern�andez, & Ord�o~nez, 2005).
3.2.1. The raw material's sensorial and volatile differencesThe raw material used here for ham production has been
examined in detail (Bjelanovic et al., 2015; Grabe�z, personalcommunication). Fresh meat from MN was more bitter than freshmeat from B&H. However, no significant differences in juiciness(p¼ 0.70), acidity (p¼ 0.66) andmetallic (p¼ 0.42) tastewere foundbetween B&H and MN samples (Grabe�z, personal communication).
The volatile compounds identified in the raw materials re-flected lipid degradation products of the dry-cured sheep hamsto some extent. Only nine volatiles (3-methyl-butanal, pentanal,hexanal, heptanal, 3-hydroxy-2-butanone, ethanol, 1-pentanol,2-methylpropanoic acid, butanoic acid) isolated from fresh adi-pose tissue remained in the volatile profile of dry-cured B&Hand MN sheep hams. Furthermore, 3-methylbutanal and 3-hydroxy-2-butanone were detected only in fresh B&H samples,while hexanal was only observed in fresh adipose tissue fromMN. Only bitterness for B&H hams seemed to be an obvious rawmaterial flavour that was also observed in the final dry-curedham.
3.3. Relationship between volatile compounds and sensory attributes
Fig. 3 shows the results of PLS2 regression analysis used toreveal relationships between volatiles from the two dry-curedsheep hams (X-matrix; Table 1) and their sensory attributes (Y-matrix; Fig. 1). Sensory attributes were separated along PC1 withacidity, bitterness, metallic and garlic taste on a right side andsmoke, cured and salt on the left side of the plot.
The following compounds 1-(2-furanyl)-ethanone, 2-methoxy-phenol, allyl methyl sulphide, pentanal, 1-hydroxy-2-butanone, 3-hydroxy-2-butanone, 2,3-pentanedione, benzene, ethanol, 1-
Fig. 2. Principal component analysis bi-plot with volatiles compounds and sensory attributes as well as the different samples used (blue diamonds are individual hams; red spotsare volatile compounds; green triangles are sensory attributes). B stands for B&H hams and MN denotes Montenegro hams. Volatile compounds were removed for improvedgraphical clarity (see Table 1 for other significantly different compounds). (For interpretation of the references to colour in this figure legend, the reader is referred to the webversion of this article.)
S. Stojkovi�c et al. / LWT - Food Science and Technology 64 (2015) 1217e12241220

Table 1Volatile compounds in sheep ham of Stelja produced in the traditional way in B&H (n ¼ 15) and industrial conditions in MN (n ¼ 15); identified by HS-GC/MS in both types.
RTa Volatile compound B&H MN Assumed origin
% Of total amount
Furans3.5 Furan**,b n.d 0.005 ± 0.014c Maillard; pyrolysis of wood/pentose and cysteine reaction34.9 Furfural*** 0.570 ± 0.718 0.650 ± 0.418 Maillard; pyrolysis of wood/pentose and cysteine reaction38.9 2-Furanmethanol n.d 0.010 ± 0.282 Maillard; pyrolysis of wood/pentose and cysteine reaction34.0 3-Furaldehyde*** n.d 0.010 ± 0.014 Maillard; pyrolysis of wood/pentose and cysteine reaction37.3 5-Methylfurfural 0.120 ± 0.060 0.140 ± 0.031 Maillard; pyrolysis of wood/pentose and cysteine reaction41.0 5-Methyl-2(5H)-furanone* 0.060 ± 0.046 0.020 ± 0.039 Maillard; pyrolysis of wood/pentose and cysteine reaction40.4 4-Methyl-5H-furan-2-one 0.007 ± 0.010 0.003 ± 0.008 Maillard; pyrolysis of wood/pentose and cysteine reaction35.8 1-(2-furanyl)-ethanone*** n.d 0.080 ± 0.095 Maillard; pyrolysis of wood/pentose and cysteine reaction38.6 Butyrolactone 0.260 ± 0.105 0.060 ± 0.068 Lipid oxidation/Maillard reactionsAmount (B&H ¼ 3.0 mg/kg ± 3.4 mg/kg; MN ¼ 21.4 mg/kg ± 11.5 mg/kg)
Phenols42.3 2-Methoxy-phenol** 0.500 ± 0.347 0.710 ± 0.405 Degraded wood/smoke44.1 4-Methyl-2-methoxy-phenol 0.260 ± 0.046 0.140 ± 0.063 Degraded wood/smoke45.3 4-Ethyl-2-methoxy-phenol* 0.240 ± 0.126 0.140 ± 0.087 Degraded wood/smokeAmount (B&H ¼ 0.20 mg/kg ± 0.04 mg/kg; MN ¼ 0.89 mg/kg ± 0.50 mg/kg)
Sulphur compounds8.1 Allyl methyl sulphide*** 0.480 ± 0.217 n.d Allicin originated from garlic, in Strecker degradation29.1 Allyl methyl disulphide** 0.060 ± 0.081 n.d Allicin originated from garlic, in Strecker degradation35.1 Diallyl disulphide** 0.360 ± 0.532 n.d Allicin originated from garlic, in Strecker degradation5.4 Methyl thiirane** 0.110 ± 0.169 n.d Metabolite derived from methionine, cysteine and cystine in
Strecker degradationAmount (B&H ¼ 8.7 mg/kg ± 12.5 mg/kg; MN ¼ n.d.)
Aldehydes3.7 Butanal 0.110 ± 0.162 0.130 ± 0.111 Lipid degradation6.5 3-Methyl-butanal* 0.610 ± 0.675 0.630 ± 0.799 Strecker degradation of valine, isoleucine &leucine6.3 Pentanal* 0.013 ± 0.016 0.003 ± 0.002 Lipid degradation/oxidation17.6 Hexanal 0.069 ± 0.136 0.055 ± 0.054 Degradation of n-6 fatty acid6.9 Heptanal* 0.200 ± 0.011 0.180 ± 0.034 Lipid degradationAmount (B&H ¼ 0.81 mg/kg ± 0.43 mg/kg; MN ¼ 0.52 mg/kg ± 0.45 mg/kg)
Ketones32.7 1-Hydroxy-2-butanone*** 0.010 ± 0.030 0.210 ± 0.216 Decarboxylation b-keto acids or b-oxidation fatty acids30.1 3-Hydroxy-2-butanone** 0.290 ± 0.399 n.d. Microbial fermentation of glucides10.0 2-Pentanone 0.050 ± 0.107 n.d Decarboxylation b-keto acids or b-oxidation fatty acids16.5 2,3-Pentanedione*** 0.007 ± 0.016 0.028 ± 0.008 Decarboxylation b-keto acids or b-oxidation fatty acids30.7 1-Hydroxy-2-propanone* 0.640 ± 0.426 0.750 ± 0.743 Decarboxylation b-keto acids or b-oxidation fatty acids40.2 4,5-Dimethyl-4-hexen-3-one 0.003 ± 0.008 0.002 ± 0.007 Lipid oxidationAmount (B&H ¼ 7.6 mg/kg ± 0.85 mg/kg; MN ¼ 12.3 mg/kg ± 11.5 mg/kg)
Ketones-cyclic25.1 Cyclopentanone* 0.270 ± 0.623 0.470 ± 0.422 Lipid oxidation36.7 2,3-Dimethyl 2-cyclopenten-1-one*** 0.043 ± 0.106 0.009 ± 0.131 Lipid oxidation31.5 3,4-Dimethyl-2-cyclopenten-1-one* 0.070 ± 0.090 0.040 ± 0.107 Lipid oxidation42.0 3-Methyl-2-hydroxy-2-cyclopenten-1-one 0.590 ± 0.127 0.450 ± 0.275 Lipid oxidation43.1 3-Ethyl 2-hydroxy-2-cyclopenten-1-one 0.033 ± 0.054 0.036 ± 0.083 Lipid oxidationAmount (B&H ¼ 0.90 mg/kg ± 0.5 mg/kg; MN ¼ 0.85 mg/kg ± 0.34 mg/kg)
Hydrocarbons-cyclic40.7 Naphthalene* 0.080 ± 0.088 0.150 ± 0.120 Lipid degradation11.9 Benzene** 0.004 ± 0.003 0.073 ± 0.125 Lipid degradation35.3 1-Ethynyl-4-methylbenzene 0.120 ± 0.308 0.170 ± 0.103 Lipid degradation32.3 2-Methyl-2-cyclohexen-1-one 0.060 ± 0.175 0.040 ± 0.158 Lipid degradation32.5 2-Methyl-2-cyclopenten-1-one 0.730 ± 0.426 0.560 ± 0.494 Lipid degradationAmount (B&H ¼ 0.69 mg/kg ± 0.52 mg/kg; MN ¼ 0.65 mg/kg ± 0.4 mg/kg)
Alcohols7.6 Ethanol*** 0.040 ± 0.158 0.990 ± 0.982 Lipolysis and proteolysis28.7 1-Pentanol*** 0.960 ± 0.836 0.002 ± 0.004 Lipolysis and proteolysis23.7 2-Propen-1-ol* 0.006 ± 0.006 0.008 ± 0.014 Lipolysis and proteolysisAmount (B&H ¼ 0.45 mg/kg ± 0.34 mg/kg; MN ¼ 2.6 mg/kg ± 2.0 mg/kg)
Acids34.4 Acetic acid* 0.910 ± 0.881 0.917 ± 0.875 Microbial metabolism of glucides36.9 2-Methylpropanoic acid 0.004 ± 0.006 0.003 ± 0.004 Hydrolysis of triglycerides&phospholipids/lipid oxidation36.4 Propanoic acid 0.057 ± 0.092 0.060 ± 0.090 Hydrolysis of triglycerides&phospholipids/lipid oxidation38.1 Butanoic acid* 0.029 ± 0.028 0.020 ± 0.024 Hydrolysis of triglycerides&phospholipids/lipid oxidationAmount (B&H ¼ 19.1 mg/kg ± 19.3 mg/kg; MN ¼ 35.4 mg/kg ± 27.5 mg/kg)
Esters4.1 Methyl acetate*** 0.940 ± 0.923 0.920 ± 0.848 Esterification of carboxylic acids and alcohols9.9 Ethyl acetate** 0.060 ± 0.077 0.080 ± 0.147 Esterification of carboxylic acids and alcohols33.8 Carbamic acid, phenyl ester** n.d. 0.003 ± 0.005 Esterification of carboxylic acids and alcoholsAmount (B&H ¼ 0.78 mg/kg ± 0.77 mg/kg; MN ¼ 5.31 mg/kg ± 0.44 mg/kg)
Nitrogen-compounds26.1 Pyridine 0.190 ± 0.663 0.370 ± 0.455 Amino acids and aldehyde reaction/Maillard37.6 3-Methoxy-pyridine 0.070 ± 0.146 0.100 ± 0.180 Amino acids and aldehyde reaction/Maillard
(continued on next page)
S. Stojkovi�c et al. / LWT - Food Science and Technology 64 (2015) 1217e1224 1221

pentanol, butanoic acid, 2H-pyran-2-one, and ethoxy-ethene weresignificantly (p < 0.05, jack-knife uncertainty test used) relatedwith one or more sensory attributes of sheep hams.
PLS1 regression analysis used to identify volatiles were signifi-cantly (p < 0.05, jack-knife uncertainty test) correlated to hamflavour (salt, bitter, acidity, cured, metallic, smoke, and garlicflavour) and aroma. The smoke flavour was positively correlatedwith ethyl acetate, ethoxy-ethane, ethanol, benzene, 2,3-pentanedione, 1-(2-furanyl)-ethanone, 3,4-dimethyl-2-cyclopenten-1-one, 2H-pyran-2-one, and 4-methyl-2-methoxy-phenol. Allyl methyl sulphide, pentanal, 2-pentanone, 1-pentanol,3-hydroxy-2-butanone, 1-hydroxy-2-propanone, 1-hydroxy-2-butanone, 2-methylpropanoic acid, butyrolactone, 5-methyl-2(5H)-furanone, and 2-methoxy-phenol had negative correlationwith smoke flavour. The compounds allyl methyl sulphide, 1-pentanol, 3-hydroxy-2-butanone, and 1-hydroxy-2-butanonerelated positively, while ethoxy-ethene, ethanol, benzene, 2,3-pentanedione, 3-furaldehyde, 1-(2-furanyl)-ethanone, and 2H-py-ran-2-one related negatively with garlic flavour. Saltiness corre-lated negatively with allyl methyl sulphide and 1-pentanol.Bitterness was positively correlated with allyl methyl sulphide andnegatively with benzene. The acidity attribute had positive corre-lation with sulphur compounds and negative with ethyl acetate, 2-pentanone and benzene. Cured flavour was positively associatedwith ethanol and benzene. Allyl methyl sulphide, 3-hydroxy-2-butanone, 1-hydroxy-2-butanone, allyl methyl disulphide, and
diallyl disulphide were compounds with negative effect on curedflavour. Allyl methyl sulphide, benzene and 2-methylpropanoicacid showed positive correlation with metallic taste, whileethoxy-ethene and ethanol were negatively correlated. However,these correlations may not reflect causal relationship; i.e. benzene(sweet smell) and bitterness seem unrelated. But other compoundsco-vary with the causal compound that has smoke flavour (i.e. 4-methyl-2-methoxy-phenol).
3.4. Salt content, safety and sensory properties
The lower salt content (4%w/w) in B&H ham had no influence onthe red colour of ham (Fig. 1) and the level of lipid degradationproducts (Table 1). All sheep hamswere appreciated as acidic, despitethe fact that higher salt and smoke contentmaymask acidity. Aciditywasamorepronouncedsensoryattribute forB&Hsheephamthan forMN hams, but had no correlation with the amount of acetic acid orwith total amount of acids (see Table 1, Fig. 4).
The final content of 4.5% NaCl (or lower) in sheep ham is chal-lenging in terms of unwanted bacterial growth, but preferableregarding health recommendations. Salt content varies dependingon production routines; for Spanish lamb ham Villalobos-Delgadoet al. (2014) reported 7.96% NaCl and water activity (aw) of 0.88,and for Norwegian Fenalår 5e10% (Håseth et al., 2014). Skerpikjøt,with aw value 0.90 has no salt addition (Håseth et al., 2014). Threeincidences of botulism in 2007 were linked directly to the
Table 1 (continued )
RTa Volatile compound B&H MN Assumed origin
% Of total amount
41.2 2H-pyran-2-one*** 0.670 ± 0.055 0.240 ± 0.136 Amino acids and sugar reaction/Maillard33.6 Dihydro-2H-pyran-3(4H)-one* n.d 0.150 ± 0.186 Amino acids and sugars reaction/Maillard30.3 3-Methyl-pyridine 0.060 ± 0.136 0.140 ± 0.042 Amino acids and aldehyde reaction/MaillardAmount (B&H ¼ 0.11 mg/kg ± 0.08 mg/kg; MN ¼ 1.9 mg/kg ± 0.2 mg/kg)
Others5.9 Ethoxy-ethene** 6.67Eþ05 ± 5.67Eþ05 4.30Eþ06 ± 4.27Eþ06Amount (B&H ¼ 17 mg/kg ± 15 mg/kg; MN ¼ 11 mg//kg ± 1 mg/kg)
a RT ¼ retention time.b Compounds that were significantly different between B&H and MN are labelled; *p < 0.05; **p < 0.01; ***p < 0.001.c Standard deviation.
Fig. 3. Plot of Partial Least Square Regression (PLSR) analysis of the volatile compounds (X-matrix) and seven significantly different sensory attributes (Y-matrix) found for twotypes of sheep ham. Ellipses represent r2 ¼ 0.5 and 1.0, as defined by the PLSR model. Volatiles in a plot are listed in a Table 1; red spots are volatiles and green triangles are sensoryattributes. (For interpretation of the references to colour in this figure legend, the reader is referred to the web version of this article.)
S. Stojkovi�c et al. / LWT - Food Science and Technology 64 (2015) 1217e12241222

consumption of Skerpikjøt, and therewas also a total of six incidents(two deadly) in the years 1988, 1989, and 1997 (Annual Report fromthe Chief Medical Officer in the Faroes), in 1989e1990 (ISSN 0903-7772), 1997 (ISSN 0903-7772) and 2007 (ISSN 0903-7772).
The concentrations of lactic acid in green hams was 89.36 mg/kg for B&H and 85.83 mg/kg for MN (Grabe�z, personalcommunication). A significantly higher level of lactic acid in thefinal product suggests the presence of lactic acid bacteria duringham production. Low salt B&H sheep ham with higher acidity alsocontained higher amount of lactic acid (9.68 g/kg) compared toMN samples (5.45 g/kg; see Fig. 4). Microbial growth was alsosupported by some possible microbial volatiles being moreabundant in B&H hams, i.e. ethanol, and 1-hydroxy-2-butanone(not shown). The sensory threshold of lactic acid depends on foodmatrix (Korkeala, Alanko, M€akel€a, & Lindroth, 1990; Vermeiren,Devlieghere, & Debevere, 2004) so it is unclear if the increasedacidity in low salt ham is due to increased lactic/propionic acid(Fig. 4) content. Troeger et al. (2009) reported that a certainfraction of sheep ham from Serbia would be rejected because ofsourness. However, microbial activity could also be a desirabletrait, provided the product is safe, depending on consumer'spreferences.
Low salt sheep hams produced in butcher facilities deservefurther investigation regarding the technology applied in thesalting phase since it may rely on a suitable house flora. Managingthe salting phase is important for maintaining a low salt content,microbial safety and a more robust ham flavour. The characteristicsensory properties of the traditional B&H product should bemaintained without compromising the product's safety.
4. Conclusions
Significant differences in VOCs content and sensory propertiesbetween sheep ham produced in B&H, and those produced in MN,were found. B&H production differed from MN in: duration ofsmoking (14 versus 7 days), ripening time in air (7 versus 14 days)and additives; B&H hams were added garlic and peppercorn.
Sheep ham from MN had a strong smoke flavour (from furansand phenols) and salty taste. B&H sheep hams were rich insulphuric compounds due to added garlic, with less salty taste.
The salting phase of the B&H ham seemed to involve
fermentation andmay be of critical importance for the safety of lowsalt dry cured ham production.
Acknowledgement
This research was funded by grant 19028 from the Ministry ofForeign Affairs to HERD project (“Comparison of Lamb Carcass andMeat Quality of Breeds in Western Balkan and Norway AchievingImproved Palatability, Sale and Sustainability”). The authors wish tothank Kari R. Olson for technical help with GCeMS and HPLCanalysis.
References
Annual Report from the Chief Medical Officer in the Faroes. (1991). Årsberetning1989e1990. Landslægen på Færøerne, . ISSN: 0903-77721e71 (in Faroese).
Annual Report from the Chief Medical Officer in the Faroes. (1997). Årsberetning1997. Landslægen på Færøerne, . ISSN: 0903-77721e37 (in Faroese).
Arnau, J. (2000). Aspectos tecnol�ogicos que afectan al desarrollo de la textura y delflavor. In II Symposium internacional del jam�on curado (pp. 27e40). Eurocarne (inSpanish).
Bjelanovic M., personal communication.Bjelanovi�c, M., Grabe�z, V., Vu�ci�c, G., Martinovi�c, A., Lima, L. R., & Egelandsdal, B.
(2015). Effect of different production systems on carcass and meat quality ofsheep and lamb from Western Balkan and Norway. Journal of Biotechnology inAnimal Husbandry, 31, 203e221.
D�zinleski, B. (1969). Ov�cija pastrma u ishrani stanovni�stva. Tehnologija mesa, 10,175e179 (in Serbian).
European Commission. (2014). Commission Regulation (EU) No 1327/2014 of 12December 2014 amending Regulation (EC) No 1881/2006 as regards maximumlevels for polycyclic aromatic hydrocarbons (PAHs) in traditionally smokedmeat and meat products and traditionally smoked fish and fishery products.Official Journal of the European Union, 358, 13e14.
Gani�c, A. (2012). Investigation of the technological process and the cost of productionof indigenous sheep prosciutto with basic quality parameters. Ph.D Thesis. Uni-versity of Sarajevo, Faculty of Agricultural and Food Sciences (in Bosnian).
Gani�c, A., �Cau�sevi�c, A., Karahmet, E., Stojkovi�c, S., & Ratkovi�c, D. (2013). Contributionof technology and quality ham of sheep. Paper presented at the International 57thMeat Industry Conference, Belgrade, Serbia.
Grabe�z V., personal communication.Håseth, T. T., Egelandsdal, B., Bjerke, F., & Sørheim, O. (2007). Computed tomography
for quantitative determination of sodium chloride in ground pork and dry-cured hams. Journal of Food Science, 72, 420e427.
Håseth, T. T., Thorkelsson, G., Puolanne, E., & Sidhu, M. S. (2014). Nordic products. InF. Toldr�a (Ed.), Handbook of fermented meat and poultry (2nd ed., pp. 371e376).Wiley-Blackwell.
Herranz, B., de la Hoz, L., Hierro, E., Fern�andez, M., & Ord�o~nez, J. A. (2005).Improvement of the sensory properties of dry-fermented sausages by theaddition of free amino acids. Food Chemistry, 91(4), 673e682.
Hootman, R. C. (1992). Manual on descriptive analysis testing for sensory evaluation.1916 Race Street. Philadelphia, PA 19103: American Society for Testing andMaterials.
IRAC. (1997). Dry cleaning, some chlorinated solvents and other industrial chem-icals. In IARC monographs on the evaluation of carcinogenic risks to humans (Vol.63)Lyon: World Health Organization.
Kandler, O. (1983). Carbohydrate metabolism in lactic acid bacteria. Antonie vanLeeuwenhoek, 49, 209e224.
Korkeala, H., Alanko, T., M€akel€a, P., & Lindroth, S. (1990). Lactic acid and pH as in-dicators of spoilage for vacuum-packed cooked ring sausages. InternationalJournal of Food Microbiology, 10, 245e253.
Krvavica, M., Friganovi�c, E., Ðugum, J., & Kegalj, A. (2009). Dalmatinska ka�stradina(ko�stradina). Meso, XI, 285e290 (in Croatian).
Krvavica, M., Mioc, B., Konjacic, M., Friganovic, E., Ganic, A., & Kegalj, A. (2011).Weight loss in the processing of dry-cured mutton: effect of age, gender andprocessing technology. Agriculturae Conspectus Scientificus, 76, 345e348.
Lori, D., Grisenti, M. S., Parolari, G., & Barbuti, S. (2005). Microbiology of dry-curedham. Industria conserve, 80, 23e32.
Medical Report 2007 from the Chief Medical Officer in the Faroes. Sundhedsberet-ning for Færøerne 2007, . ISSN: 0903-7772, (2007)1e67 (in Faroese).
Minitab Inc. (2010). MINITAB user's guide, version 16. Coventry, United Kingdom:Minitab Ltd.
Montel, M. C., Reitz, J., Talon, R., Berdagu�e, J. L., & Rousset- Akrim, S. (1996).Biochemical activities of Micrococcaceae and their effects on the aromaticprofiles and odours of a dry sausage model. Food Microbiology, 13, 489e499.
Morales, R., Guerrero, L., Aguiar, A. P. S., Gu�ardia, M. D., & Gou, P. (2013). Factorsaffecting dry-cured ham consumer acceptability. Meat Science, 95, 652e657.
Muriel, E., Antequera, T., Petr�on, M. J., Andr�es, A. I., & Ruiz, J. (2004). Volatilecompounds in Iberian dry-cured loin. Meat Science, 68, 391e400.
Narvhus, J. A., Østeraas, K., Mutukumira, T., & Abrahamsen, R. K. (1998). Productionof fermented milk using a malty compound-producing strain of Lactococcus
Fig. 4. Principal component analysis with samples that present extremes in acidictaste and organic acids (blue diamonds are B e B&H hams and MN e Montenegrinhams; red squares are organic acids; grey hexagon is salt; green triangle is acidity astaste attribute; amount of lactic acid in each analyzed sample in parenthesis). (Forinterpretation of the references to colour in this figure legend, the reader is referred tothe web version of this article.)
S. Stojkovi�c et al. / LWT - Food Science and Technology 64 (2015) 1217e1224 1223

lactis subsp. lactis biovar. diacetylactis, isolated from Zimbabwean naturallyfermented milk. International Journal of Food Microbiology, 41, 73e80.
Operta, S., Smaji�c, A., Tahmaz, J., & Gani�c, A. (2010). Physico-chemical and sensoryproperties sheep prosciutto produced traditional methods. Paper presented at the21st Scientific-Expert Conference of Agriculture and Food Industry, Neum. (inBosnian).
P�erez-Palacios, M. T., Petisca, C., Pinho, O., & Ferreira, I. M. P. L. V. O. (2012).Headspace solid-phase microextraction of volatile and furanic compounds incoated fish sticks: effect of the extraction temperature. World Academy ofScience, Engineering and Technology, 6, 975e980.
Pugliese, C., Sirtori, F., Ruiz, J., Martin, D., Parenti, S., & Franci, O. (2009). Effect ofpasture on chestnut or acorn on fatty acid composition and aromatic profile offat of Cinta Senese dry-cured ham. Grasas y Aceites, 60, 271e276.
Stamenkovi�c, T., & Devi�c, B. (2006). Senzorska svojstva ov�cije stelje. Tehnologija
mesa, 47, 115e122 (in Serbian).Troeger, K., Veskovi�c-Mora�canin, S., Turubatovi�c, L., Risti�c, M., & Dederer, I. (2009).
Traditionelle serbische Rohp€okelwaren aus Rind- und Schaffleisch. Mittei-lungsblatt der Fleischforschung Kulmbach, 48, 115e121 (in German).
Vermeiren, L., Devlieghere, F., & Debevere, J. (2004). Evaluation of meat born lacticacid bacteria as protective cultures for the biopreservation of cooked meatproducts. International Journal of Food Microbiology, 96, 149e164.
Villalobos-Delgado, L. H., Caro, I., Blanco, C., Mor�an, L., Prieto, N., Bodas, R., et al.(2014). Quality characteristics of a dry-cured lamb leg as affected by tumblingafter dry-salting and processing time. Meat Science, 97, 115e122.
Wagner, R., da Silva, M. A. A. P., & Franco, M. R. B. (2008). Volatile compoundsimportant to the aroma of Italian type: assessment by OSME and detectionfrequency techniques. Paper presented at the Expression of MultidisciplinaryFlavour Science. In 12th Weurman Symposium, Interlaken, Switzerland.
S. Stojkovi�c et al. / LWT - Food Science and Technology 64 (2015) 1217e12241224