77 Annual Report - Tata Group
286
77 th Annual Report 2020-2021 INDUSTRIES
-
Upload
khangminh22 -
Category
Documents
-
view
0 -
download
0
Transcript of 77 Annual Report - Tata Group

77th Annual Report2020-2021
INDUSTRIES

CONTENTS
DIRECTORS 2
BOARD’S REPORT 3
ANNEXURES TO BOARD’S REPORT 12
STANDALONE FINANCIAL STATEMENTS
INDEPENDENT AUDITORS’ REPORT 49
ANNEXURE TO INDEPENDENT AUDITORS’ REPORT 54
BALANCE SHEET 60
STATEMENT OF PROFIT & LOSS 61
CASH FLOW STATEMENT 62
STATEMENT OF CHANGES IN EQUITY 64
NOTES FORMING PART OF THE FINANCIAL STATEMENTS 66
CONSOLIDATED FINANCIAL STATEMENTS
INDEPENDENT AUDITORS’ REPORT 163
ANNEXURE TO INDEPENDENT AUDITORS’ REPORT 171
BALANCE SHEET 174
STATEMENT OF PROFIT & LOSS 175
CASH FLOW STATEMENT 176
STATEMENT OF CHANGES IN EQUITY 178
NOTES FORMING PART OF THE FINANCIAL STATEMENTS 181
INFORMATION REGARDING MEETINGS OF THE BOARD 284
AND ITS COMMITTEES
Seventyseventh annual report
Tata Industries Limited

INDUSTRIES
Seventyseventh annual report
Tata Industries Limited
2
CORPORATE INFORMATION
R. N. Tata Chairman Emeritus
DIRECTORS
(As on April 29, 2021)
F. N. Subedar (DIN - 00028428)
N. Srinath (DIN - 00058133)
Aarthi Subramanian (DIN - 07121802)
K. R. S. Jamwal (DIN - 03129908) Executive Director
CHIEF FINANCIAL OFFICER
& COMPANY SECRETARY
S. Sriram
AUDITORS
Messrs B S R & Co. LLP
Chartered Accountants
REGISTERED OFFICE
Bombay House
24 Homi Mody Street
Mumbai 400 001
Tel : 022-6665 8282
Fax : 022-6665 7974
Email : [email protected]
Website : www.tata.com
CIN : U44003MH1945PLC004403

3
TO THE SHAREHOLDERS
1. The Directors hereby present their Seventy-Seventh Annual Report together with theaudited statements of accounts for the year ended on March 31, 2021.
2. The Standalone and Consolidated financial results for the year ended March 31, 2021are given below :
BOARD’S REPORT
Total Income 259.64 280.70 333.81 545.70
Total Expenditure 328.05 315.53 597.00 380.20
Profit / (Loss) from Continuing (68.41) (34.83) (263.19) 165.50
Operations, before share of
profit of equity accounted
investees and income tax
Share of (Loss) of equity accounted - - (401.03) (275.72)
investees (net of income tax)
Profit / (Loss) before Tax from (68.41) (34.83) (664.22) (110.22)
Continuing Operations
Tax Expense / (credit) (2.53) - (2.23) (3.66)
Profit / (Loss) after Tax (65.88) (34.83) (661.99) (106.56)
Profit / (Loss) for the year from - 327.85 - 343.13
discontinuing operations / disposal
of asset held for sale after tax
Profit / (Loss) for the year (65.88) 293.02 (661.99) 236.57
Other Comprehensive Income 1,825.33 (816.54) 1,703.56 (709.52)
for the year
Total Comprehensive Income 1,759.45 (523.52) 1,041.57 (472.94)
for the year – attributable to Owners
of the Parent Company
Continuing (6.10) (3.23) (61.32) (9.87)
Operations
Earnings Discontinuing
Per Share Operations / disposal
(Rs.) of asset held for sale - 30.37 - 31.78
Total Operations (6.10) 27.14 (61.32) 21.91
Pa r t i c u l a r s
STANDALONE CONSOLIDATED
FY 2020-21 FY 2019-20 FY 2020-21 FY 2019-20
In view of the loss for the year, the Board did not recommend a dividend.
Rs. Crores Rs. Crores Rs. Crores Rs. Crores

INDUSTRIES
Seventyseventh annual report
Tata Industries Limited
4
BOARD’S REPORT (Continued)
3. OPERATIONS OF THE COMPANY
(a) The Company’s valued investments are in the subsidiaries of the Company thathouse new and high technology businesses typically with a long gestation period,the benefits of which are expected to accrue to the Company in the long term, andin other Tata companies.
The fair value of the gross Investments of the Company as at March 31, 2021stood at Rs. 5,851.99 crores, cost price Rs. 4,350.43 crores (Previous Year :Rs. 3,966.07 crores, cost price Rs. 4,295.57 crores). The Company holds significantinvestments in Tata Motors Limited, Qubit Investments Pte. Ltd., Tata UniStoreLimited, Tata Smartfoodz Limited and Tata AutoComp Systems Limited.
(b) The Company holds a Certificate of Registration (CoR) No. N-13.02011 dated April27, 2012 issued by the Reserve Bank of India categorizing Tata Industries Limitedas a Core Investment Company, which is Systemically Important (SI), and notpermitted to accept public deposits.
(c) An internal project team is engaged in incubating/reviewing investments in growthareas such as Digital platforms, Health, Education, Energy, Food & Nutrition, apartfrom ideating and conceptualising investment in new businesses.
(d) Impact of COVID-19 pandemic:
During the FY 2020-21, the COVID-19 pandemic developed rapidly into a globalcrisis, forcing governments to enforce lockdowns, impacting economic activity.Even before the national lockdown was announced, the Company had formulateda Work From Home Policy and took measures to implement it in phases to ensurea smooth transition.
For the Company, the focus immediately shifted to ensuring the health and well-being of all employees, and on minimizing disruption to services for all ourcustomers within India. From centralized workspaces set in large premises/campuses, capable of accommodating a large number of employees, the switchto work from home for employees located all over India, was carried out seamlessly.
The Company made sufficient arrangements for the employees by means ofproviding the requisite hardware and software support to work from home. Beforeits implementation, the employees had an induction by the IT team of the newprocesses to be followed for an uninterrupted work experience.
In the current year, after the onset of the 2nd wave of the pandemic, the Companytook additional measures to increase digitisation and improve awareness onvaccination to employees. Arrangements to vaccinate employees and their relativesare being put in place, apart from continuation of its Work From Home Policy.
A note on estimation of uncertainties relating to the Covid-19 pandemic is providedin the Notes to the Accounts.
4. OPERATIONS OF THE DIVISIONS
a. Tata ClassEdge Division (TCE)
TCE continued to be the preferred digital partner of India’s leading schools,though the business was adversely impacted due to continued closure of schools

5
BOARD’S REPORT (Continued)
due to Covid pandemic in the year. The total number of TCE content installedclassrooms remained at around 30,000 classrooms as there were no significantorders in the year.
In response to the needs of schools and students during Covid, TCE introduceda range of new offerings – hardware, software and apps for virtual schooling,assessments, early child education and after school study for students at home,many of which will provide business growth in future years. TCE provided a videoconferencing product through a partner to enable online access to teachers andstudents to conduct virtual classroom and facilitate continuing learning in currentpandemic situation.
Effective utilization of the product development capex has enabled creation ofmeaningful and differentiated teaching, learning and student-centric offerings suchas Studi, that will allow TCE to engage even more deeply in the K-12 educationspace. TCE is targeting future expansion of the digital classroom base along withproducts designed to improve student learning outcomes.
b. Tata Strategic Management Group (TSMG)
During FY 2020-21, TSMG has delivered tangible impact for Tata Sons Private Ltd.and for other Tata group companies by supporting group level strategic initiatives,incubation of new ventures, driving transformation of large businesses, supportinggrowth agenda, partnering in innovation, and leveraging synergies between Tatagroup companies. In addition to supporting Tata Sons’ Chairman’s Office, TSMGhas established itself as a strategy partner for group companies, with multipleengagements spanning Automotive, Consumer & Retail, Steel and Chemicals, Hi-Tech and Digital businesses. TSMG has continued to hire high quality talent fromtop-tier strategy firms and has collaborated with global strategy firms to supportthe Tata ecosystem in strategy and transformation initiatives. Over the last 2 years,16 employees from TSMG have moved to group companies, making it a sourcefor quality lateral talent.
In 2021-22, TSMG proposes to build on the capability platform developed, andrelationships built in FY 2020-21, and support the Group in strategic transformation.
c. Tata Insights & Quants (Tata iQ)
Tata iQ has continued its partnership with several Tata companies across keysectors in furthering their data and analytics journey. The focus on analyticssolutions in predictive asset maintenance, predictive quality management, supplychain & logistics, strategic procurement, customer analytics, customer lifecyclemanagement, HR analytics, and customer & market insights continued during theyear.
The value that Tata iQ was able to drive through partnership with group companiessaw recognition at various forums. Tata iQ’s partnership with Tata Steel in theareas of digital twins and predictive quality management contributed to theJamshedpur plant being recognised as the World Economic Forum’s Advanced4th Industrial Revolution (4IR) Lighthouse 2021. Their retention propensity model

INDUSTRIES
Seventyseventh annual report
Tata Industries Limited
6
BOARD’S REPORT (Continued)
for Tata AIG was recognized at The Economic Times Digital Warrior Summit &Awards as the Best Disruptive Deployment and won the Tata AIG InnoVista 2021award. The Tata Steel and Tata iQ teams also won the Tata Innovista 2020 awardin the core process innovations category. Tata iQ received the ‘Value creation’award at the Tata Power Business Associates conclave 2021 for their work onthermal coal price forecasting.
Solutions backed by Assets & Accelerators (A&A), especially computer vision,commodity price forecasting, virtual assistants and narrative sciences saw a greateradoption across Group Companies.
In the current year, several key partnerships were forged with companies – bothinternal to the group and external - that complement the offerings of Tata iQ. Thishas enabled Tata iQ to extend its offerings of holistic end-to-end solutions forgroup companies. Tata iQ has partnered with the Tata Management Training Centre(TMTC) to set up the Analytics Academy.
Tata iQ is on a positive trajectory as a Centre of Excellence and geared up toleverage solution-led analytics offerings across the Group, and an ecosystem ofcomplementary partners, to further drive value through data and analytics.
d. Tata Health
Tata Health enhanced its online consultation services during the year. InstaDoc,the 24x7 GP consultation services attracted significantly higher traffic and wasused by consumers across 300+ towns nationally. Online Speciality consultationsare now being provided in “Instant” as well as “Scheduled” formats and across8 specialities.
The Tata Health platform has been made more robust and intelligent. A machinelearning based Clinical Decision Support System (CDSS) has been introduced.This learning engine (patent pending) provides inputs to doctors and patients,and will progressively enable intelligent automation of consultations and symptomchecking. To enable enhanced reach and to effectively leverage specialist doctors,a mobile-based Specialist app has been custom developed.
In the coming year, Tata Health will focus on monetizing its portfolio of servicesand scaling up services across the country including specialist consult, online laband E-pharmacy. It also proposes to pilot differentiated new format clinics andcondition specific care programs in Bangalore, before scaling clinics nationally.
5. EXTRACT OF ANNUAL RETURN
As per the requirements of Section 92(3) of the Companies Act, 2013 (“Act”) and Rulesframed thereunder, the extract of the Annual Return for FY 2020-21 is given in Annexure-A in the prescribed Form No. MGT- 9, which is a part of this report.
6. NUMBER OF MEETINGS OF THE BOARD
The Board met 6 times during the financial year viz., on April 29, 2020, June 24, 2020,July 28, 2020, October 30, 2020, January 27, 2021 and March 30, 2021. The maximuminterval between any two meetings did not exceed 120 days.

7
7. DIRECTORS’ RESPONSIBILITY STATEMENT
Based on the framework of internal financial controls and compliance systems establishedand maintained by the Company, work performed by the internal, statutory and secretarialauditors including audit of internal financial controls over financial reporting by thestatutory auditors and the reviews performed by Management, the Board is of the opinionthat the Company’s internal financial controls and compliance systems were adequateand effective during the financial year 2020-21.
Accordingly, pursuant to Section 134(5) of the Act, the Board of Directors, to the bestof their knowledge and ability, confirm that:
i. in the preparation of the annual accounts for financial year ended 31st March,2021, the applicable accounting standards have been followed and there are nomaterial departures;
ii. they have selected such accounting policies and applied them consistently andmade judgments and estimates that are reasonable and prudent so as to give atrue and fair view of the state of affairs of the Company as on March 31, 2021 andof the loss of the Company for the year ended on that date;
iii. they have taken proper and sufficient care for the maintenance of adequateaccounting records in accordance with the provisions of this Act for safeguardingthe assets of the Company and for preventing and detecting fraud and otherirregularities;
iv. they have prepared the Annual Accounts for financial year ended March 31, 2021on a ‘going concern’ basis; and
v. they have devised proper systems to ensure compliance with the provisions of allapplicable laws which are adequate and operating effectively.
8. PARTICULARS OF LOANS, GUARANTEES OR INVESTMENTS UNDER SECTION 186
The Company being a Core Investment Company, the provisions of Section 186 of theAct, pertaining to investment and lending activities are not applicable to the Company.Details of loans, investments and guarantees are given in the financial statements.
9. RELATED PARTY TRANSACTIONS
In line with the requirements of the Act, the Company has formulated a Framework forRelated Party Transactions (RPTs) and all the RPTs were either within the Frameworkapproved by the Board or were separately approved by the Board. None of the RPTswere required to be approved by the Shareholders.
None of the transactions with related parties was under the scope of Section 188(1) ofthe Act.
BOARD’S REPORT (Continued)

INDUSTRIES
Seventyseventh annual report
Tata Industries Limited
8
10. MATERIAL CHANGES AND COMMITMENTS AFFECTING THE FINANCIAL POSITION
OF THE COMPANY
There have been no material changes and commitments, affecting the financial positionof the Company which have occurred between the end of the financial year of theCompany to which the financial statements relate and the date of the report.
11. i. CONSERVATION OF ENERGY AND TECHNOLOGY ABSORPTION
The Company’s activities involve low energy consumption. However, efforts aremade to further reduce energy consumption.
Meanwhile, measures are taken to improve energy efficiency at the Company’swork places, on a continuous basis.
The Company continues to adopt and use the latest technologies to improve theefficiency and effectiveness of its business operations.
ii. FOREIGN EXCHANGE EARNINGS AND OUTGO
The Company has incurred expenditure in foreign currency amounting to Rs. 2.99crores (Previous Year: Rs. 4.34 crores) and has earned income in foreign currencyamounting to Rs. 0.04 crores during the year (Previous Year: Rs. NIL).
12. i. RISK MANAGEMENT POLICY
The Company has formulated a Risk Management Policy as contemplated underSection 134(3)(n) of the Act, for major activities of the Company.
The Company has in place a mechanism to identify, assess, monitor and mitigatevarious risks to key business objectives. Major risks identified by the businessesand functions are systematically addressed through mitigating actions on acontinuing basis.
ii. INTERNAL FINANCIAL CONTROLS
The Company’s internal control systems are commensurate with the nature of itsbusiness and the size and complexity of its operations with reference to the financialstatements presented by the Company.
13. ANNUAL PERFORMANCE EVALUATION BY THE BOARD
The performance of the Board was evaluated after seeking inputs from all the Directorson the basis of criteria such as the Board composition and structure, effectiveness ofBoard processes, information and functioning, etc.
The performance of the individual Directors was evaluated on the basis of criteria suchas the contribution of the individual Director to the Board Meetings, preparedness onthe issues to be discussed, meaningful and constructive contribution and inputs inmeetings, attendance, etc.
BOARD’S REPORT (Continued)
9
The criteria for evaluation is modelled based on the Guidance Note on Board Evaluationdated January 05, 2017, issued by Securities and Exchange Board of India.
The Board in its meeting held on March 30, 2021 reviewed the performance of the Boardand individual Directors and approved the same.
14. DETAILS OF SIGNIFICANT AND MATERIAL ORDERS PASSED BY THE REGULATORS
OR COURTS OR TRIBUNALS IMPACTING THE GOING CONCERN STATUS AND
COMPANY’S OPERATIONS IN FUTURE
During the year, no order has been passed by the Regulators or Courts or Tribunalsimpacting the Going Concern status and Company’s operations in future. Therefore, theprovisions relating to disclosure of details of material orders are not applicable to theCompany.
15. DIRECTORS
In accordance with Articles 126 & 127 of the Articles of Association of the Company, Mr.Srinath Narasimhan would retire by rotation at the forthcoming Annual General Meetingand he is eligible for re- appointment. A resolution seeking shareholders’ approval forhis re-appointment forms part of the Notice.
Mr. K.R.S. Jamwal was reappointed as Executive Director of the Company with effectfrom July 1, 2020 for a period of 5 years, by the Board of Directors at its meeting heldon June 24, 2020 subject to the approval of the Shareholders of the Company.The approval of the shareholders for his appointment as Executive Director and forpayment of remuneration to him was obtained at the Annual General Meeting held onSeptember 3, 2020.
During the year under review, the non-executive Directors of the Company had nopecuniary relationship or transactions with the Company, other than sitting fees for thepurpose of attending meetings of the Board of the Company.
Pursuant to the provisions of Section 203 of the Act, the Key Managerial Personnel ofthe Company as on March 31, 2021 are :
- Mr. K. R. S. Jamwal, Executive Director
- Mr. S. Sriram, Chief Financial Officer & Company Secretary
16. SUBSIDIARIES, JOINT VENTURES AND ASSOCIATE COMPANIES
A statement containing details relating to the subsidiaries, joint ventures and associatesof the Company, including the performance and financials of such companies in FormAOC-1 is appended to this Report as Annexure B.
17. DEPOSITS
The Company has not accepted any deposits falling in the ambit of Section 73 of theAct and therefore the provisions relating to disclosure of details of deposits are notapplicable to the Company.
BOARD’S REPORT (Continued)

INDUSTRIES
Seventyseventh annual report
Tata Industries Limited
10
18. CONSTITUTION OF CORPORATE SOCIAL RESPONSIBILITY (CSR) COMMITTEE
The brief outline of the Corporate Social Responsibility (CSR) policy of the Companyand the initiatives undertaken by the Company on CSR activities during the year underreview are set out in Annexure-C which is attached to the report, in the format prescribedin the Companies (Corporate Social Responsibility Policy) Rules, 2014.
The members of the CSR Committee are Mr. F.N. Subedar and Mr. K.R.S. Jamwal.
19. VIGIL MECHANISM
The Company has established a Vigil Mechanism for its Directors and employees toreport their genuine concerns or grievances. The said mechanism encompasses theWhistle Blower Policy, the Fraud Risk Management Process, the Ethics mechanism underTCoC, etc. and provides for adequate safeguards against victimization of persons whouse such mechanism.
20. DISCLOSURES AS PER THE SEXUAL HARASSMENT OF WOMEN AT WORKPLACE
(PREVENTION, PROHIBITION AND REDRESSAL) ACT, 2013
The Company has zero tolerance for sexual harassment at workplace and has adopteda Policy on prevention, prohibition and redressal of sexual harassment at workplace inline with the provisions of the Sexual Harassment of Women at Workplace (Prevention,Prohibition and Redressal) Act, 2013 and the Rules thereunder for prevention andredressal of complaints of sexual harassment at workplace. The Company has formedInternal Committees as required under the above Act.
The Company received 1 (one) complaint regarding sexual harassment during theFinancial Year 2020- 21, which was taken up by the respective POSH committeeand resolved during the year. There was no pending complaint with the Company onMarch 31, 2021.
21. SECRETARIAL AUDIT REPORT
The Board of Directors of the Company had appointed M/s. Parikh & Associates,Practicing Company Secretaries, to conduct the Secretarial Audit and their Report onCompany’s Secretarial Audit is appended to this Report as Annexure-D.
The Secretarial Audit Report does not contain any qualification, reservation or adverseremark or disclaimer.
22. AUDITORS’ REPORT
There are no qualifications, reservations, adverse remarks or disclaimers made in theIndependent Auditors’ Report on the Standalone Financial Statements as well as on theConsolidated Financial Statements of the Company.
BOARD’S REPORT (Continued)

11
23. AUDITORS
Members of the Company at the AGM held on August 1, 2017, approved the appointmentof Messrs BSR & Co. LLP, Chartered Accountants (ICAI Firm Registration No. 101248W/W-100022) as the Statutory Auditors of the Company for a period of five yearscommencing from the conclusion of the 73rd AGM held on August 1, 2017 until theconclusion of 78th AGM of the Company to be held in the year 2022. The Board ofDirectors is authorised to fix their remuneration.
24. SECRETARIAL STANDARDS
The Company has devised proper systems to ensure compliance with the provisions ofall the applicable Secretarial Standards issued by the Institute of Company Secretariesof India and that such systems are adequate and operating effectively.
25. CORPORATE GOVERNANCE REPORT
The Corporate Governance Report is appended to this Report as Annexure-E.
26. MANAGEMENT DISCUSSION AND ANALYSIS REPORT
The Management Discussion and Analysis Report is appended to this Report asAnnexure-F.
27. ACKNOWLEDGEMENTS
The Directors thank the Company’s employees, customers, vendors, investors andacademic partners for their continuous support.
The Directors also thank the Government of India, Governments of various States inIndia, Governments of various countries and concerned Government departments andagencies for their co-operation.
The Directors appreciate and value the contribution made by every member of the TataIndustries family.
Finally, we appreciate and value the contributions made by all our employees and theirfamilies for making the Company what it is today.
BOARD’S REPORT (Continued)
Place : MumbaiDate : 29th April, 2021
Registered Office :
Bombay House24 Homi Mody StreetMumbai 400 001
CIN : U44003MH1945PLC004403
For and on behalf of the Board of Directors,
K.R.S. Jamwal F. N. SubedarExecutive Director Director

INDUSTRIES
Seventyseventh annual report
Tata Industries Limited
12
ANNEXURE - A
FORM NO. MGT-9
EXTRACT OF ANNUAL RETURN
As on the financial year ended on March 31, 2021
[Pursuant to section 92(3) of the Companies Act, 2013 and Rule 12(1) of the Companies(Management and Administration) Rules, 2014]
I. REGISTRATION AND OTHER DETAILS
i) CIN: U44003MH1945PLC004403
ii) Registration Date: 07/04/1945
iii) Name of the Company: Tata Industries Limited
iv) Category of the Company: Public Limited Company
Sub-category of the Company: Limited by Shares
v) Address of the Registered office: Bombay House, 24 Homi Mody Street,Mumbai 400 001
vi) Contact details: Tel : 022 6665 8282 - Fax 022 6665 7974
E-mail id: [email protected]
vii) Whether listed company: No
viii) Name, Address and M/s. TSR Darashaw ConsultantsContact details of Registrar Private Limitedand Transfer Agent, if any C-101, 1st Floor, 247 Park,
Lal Bahadur Shastri Marg, Vikhroli (West),Mumbai - 400 083.Tel: +91 22 6656 8484 Fax: + 91 22 6656 8494
II. PRINCIPAL BUSINESS ACTIVITIES OF THE COMPANY
All the business activities contributing 10 % or more of the total turnover of the companyshall be stated:
1 Head Office
Activities of Holding Companies 642 16.47
2 Tata Strategic Management Group
Management consultancy activities 702 20.12
3 Tata ClassEdge Division
Educational support services 855 27.08
4 Tata Digital Health 477 31.23
Sr.No.
Name and Description ofmain products / services
NIC Codeof the
Product /service
% to totalturnover
of thecompany
Note : Turnover for respective products/services is revenue from external customers.

13
ANNEXURE - A
FORM NO. MGT-9 - EXTRACT OF ANNUAL RETURN (Continued)
III. PARTICULARS OF HOLDING, SUBSIDIARY AND ASSOCIATE COMPANIES
Sr.No.
Name and Address ofthe Company
Holding /Subsidiary /Associate
% ofSharesHeld
CIN / GLNApplicable
Section
1 Tata Sons Private U99999MH1917PTC000478 Holding 53.62 2(46)Limited (*)Bombay House,1st Floor,24 Homi Mody Street,Mumbai 400 001.
2 Tata Unistore Limited U74999MH2007PLC173035 Joint 92.83 2(87)(ii)1st Floor, Empire Plaza 2, VentureChandan Nagar, CompanyLBS Marg,Vikhroli West,Mumbai 400 083.
3 Inzpera Healthsciences U74999MH2016PLC282701 Joint 76.92 2(87)(ii)Limited. Venture407, The Summit CompanyBusiness Bay,Nr. WEH Metro Station,Off Andheri-Kurla Road,Andheri (East),Mumbai 400 093.
4 Qubit Investments Pte Ltd. Subsidiary 100 2(87)(ii)78 Shenton Way,#17-01/02,Singapore 079120.
5 Tata AutoComp Systems U34100MH1995PLC093733 Associate 34.40 2(6)LimitedTACO House,Damle Path,Off Law College Road,Pune 411 004.
6 Oriental Floratech U01110MH1990PLC057600 Associate 24.19 2(6)(India) LimitedDarabshaw House,2nd Floor, Ballard Estate,Mumbai 400 038.

INDUSTRIES
Seventyseventh annual report
Tata Industries Limited
14
ANNEXURE - A
FORM NO. MGT-9 - EXTRACT OF ANNUAL RETURN (Continued)
III. PARTICULARS OF HOLDING, SUBSIDIARY AND ASSOCIATE COMPANIES
Sr.No.
Name and Address ofthe Company
Holding /Subsidiary /Associate
% ofSharesHeld
CIN / GLNApplicable
Section
7 Oriental Seritech Limited U74999MH1993PLC072118 Associate 48.72 2(6)Bombay House, 1st Floor,24 Homi Mody Street,Mumbai 400 001.
8 ITel Industries Limited U84200MH1992PLC066138 Associate 30 2(6)Bombay House, 1st Floor,24 Homi Mody Street,Mumbai 400 001.
9 Indigene Associate 32.96 2(6)Pharmaceuticals Inc.115, Flanders Road,Westborough,MA 01581, USA.
10 Niskalp Infrastructure U67120MH1989PLC054778 Associate 50.00 2(6)Services LimitedUnit No. 101, First Floor,Matulya Centre CHSL,Senapati Bapat Marg,Lower Parel,Mumbai 400 013.
11 Flisom AG Subsidiary 84.10 2(87)(ii)Überlandstrasse 129CH-8600,Dübendorf, Switzerland.(a subsidiary of QubitInvestments Pte. Ltd.)
12 Impetis Biosciences U74999MH2017PLC295474 Associate 34.37 2(6)LimitedC/o. 407, The SummitBusiness Bay,Nr. WEH Metro Station,Off Andheri-Kurla Road,Andheri (East),Mumbai 400 093.

15
ANNEXURE - A
FORM NO. MGT-9 - EXTRACT OF ANNUAL RETURN (Continued)
III. PARTICULARS OF HOLDING, SUBSIDIARY AND ASSOCIATE COMPANIES
Sr.No.
Name and Address ofthe Company
Holding /Subsidiary /Associate
% ofSharesHeld
CIN / GLNApplicable
Section
13 Tata SmartFoodz Limited U15549MH2017PLC301841 Subsidiary 100 2(87)(ii)(formerly SmartFoodzLimited)Godrej Bhavan 4th Floor,4A Home Street, Fort,Mumbai 400 001.
14 915 Labs LLC Subsidiary 100 2(87)(ii)4949 S SYRACUSE ST.STE 300 DENVER,CO 80237,United States of America(a subsidiary ofQubit InvestmentsPte. Ltd.)
15 Flisom Hungary Kft Subsidiary 84.10 2(87)(ii)1055, Budapest,Bajcsy - Zsilinszkyút 78, Hungary(a subsidiary ofFlisom AG)
(*) Tata Sons Private Limited, collectively with its subsidiaries, holds 53.62% of Tata Industries’share capital.

INDUSTRIES
Seventyseventh annual report
Tata Industries Limited
16
ANNEXURE - A
FORM NO. MGT-9 - EXTRACT OF ANNUAL RETURN (Continued)
IV. SHARE HOLDING PATTERN
(Equity Share Capital Breakup as percentage of Total Equity)
(i) Category-wise Share Holding
A. Promoters No Change
(1) Indian
a) Individual/HUF
b) Central Govt
c) State Govt (s)
d) Bodies Corp. 5,78,80,448 - 5,78,80,448 53.62* 5,78,80,448 - 5,78,80,448 53.62* -
e) Banks / FI
f) Any Other….
Sub-total (A) (1):- 5,78,80,448 - 5,78,80,448 53.62 5,78,80,448 - 5,78,80,448 53.62 -
(2) Foreign
a) NRIs-Individuals
b) Other-Individuals
c) Bodies Corp.
d) Banks / FI
e) Any Other….
Sub-total (A) (2):-
Total shareholdingof Promoter (A) =(A) (1) + (A) (2) 5,78,80,448 - 5,78,80,448 53.62 5,78,80,448 - 5,78,80,448 53.62 -
B. PublicShareholding
1. Institutions
a) Mutual Funds
b) Banks / FI
c) Central Govt
d) State Govt(s)
e) VentureCapital Funds
f) InsuranceCompanies
Category ofShareholders
No. of Shares heldat the beginning of the year
No. of Shares heldat the end of the year
% Changeduring
the year
Demat Physical Total
% ofTotal
SharesDemat Physical Total
% ofTotal
Shares

17
ANNEXURE - A
FORM NO. MGT-9 - EXTRACT OF ANNUAL RETURN (Continued)
IV. SHARE HOLDING PATTERN
(Equity Share Capital Breakup as percentage of Total Equity)
(i) Category-wise Share Holding (Continued)
Category ofShareholders
No. of Shares heldat the beginning of the year
No. of Shares heldat the end of the year
% Changeduring
the year
Demat Physical Total
% ofTotal
SharesDemat Physical Total
% ofTotal
Shares
g) FIIs
h) Foreign VentureCapital Funds
i) Others (specify)
Sub-total (B)(1):-
2. Non-Institutions
a) Bodies Corp.
i) Indian 5,00,74,154 - 5,00,74,154 46.38 5,00,74,154 - 5,00,74,154 46.38 -
ii) Overseas
b) Individuals
i) Individualshareholdersholding nominalshare capitalupto Rs. 1 lakh
ii) Individualshareholdersholding nominalshare capitalin excess ofRs. 1 lakh
c) Others
Sub-total (B)(2):- 5,00,74,154 - 5,00,74,154 46.38 5,00,74,154 - 5,00,74,154 46.38 -
Total PublicShareholding (B) =(B) (1)+ (B) (2) 5,00,74,154 - 5,00,74,154 46.38 5,00,74,154 - 5,00,74,154 46.38 -
C. Shares held byCustodian forGDRs & ADRs - - - - - - - - -
Grand Total(A+B+C) 10,79,54,602 - 10,79,54,602 100 10,79,54,602 - 10,79,54,602 100 -
* Tata Sons Private Limited, collectively with its subsidiaries, holds 53.62% of Tata Industries’ share capital.

INDUSTRIES
Seventyseventh annual report
Tata Industries Limited
18
ANNEXURE - A
FORM NO. MGT-9 - EXTRACT OF ANNUAL RETURN (Continued)
IV. SHARE HOLDING PATTERN
(Equity Share Capital Breakup as percentage of Total Equity)
(ii) Shareholding of Promoters (Equity Share Capital)
1 Tata Sons 5,78,80,448 53.62 - 5,78,80,448 53.62 - NILPrivate Ltd. *
Total 5,78,80,448 53.62 - 5,78,80,448 53.62 - NIL
Sr.No.
Shareholder’sName
Shareholding at thebeginning of the year
Share holding at the end of the year
No. ofShares
% oftotal
Sharesof the
Company
% ofShares
Pledged /encum-bered to
totalshares
No. ofShares
% oftotal
Sharesof the
Company
% ofShares
Pledged /encum-bered to
totalshares
%changein shareholdingduring
the year
* Tata Sons Private Limited, collectively with its subsidiaries, holds 53.62% of Tata Industries’ share capital.
(iii) Change in Promoters’ Shareholding (Equity Share Capital) (please specify, if
there is no change):
There is no change in promoter’s shareholding during FY 2020-21.
(iv) Shareholding Pattern (Equity Share Capital) of top ten Shareholders (other than
Directors, Promoters and Holders of GDRs and ADRs):
1. Tata Motors Ltd. 1,03,10,242 9.55 - No change N.A. 1,03,10,242 9.55 at the endof the year
2. Tata Steel Ltd. 99,80,436 9.24 - -do- N.A. 99,80,436 9.24
3. Tata Chemicals Ltd. 98,61,303 9.13 - -do- N.A. 98,61,303 9.13
4. Tata Consumer 65,19,441 6.04 - -do- N.A. 65,19,441 6.04Products Ltd.
5. The Tata Power 58,28,126 5.40 - -do- N.A. 58,28,126 5.40Company Ltd.
Sr.
No.Name Shareholding Date
Increase /
Decrease
in
shareholding
Reason
Cumulative
Shareholding during
the year
(1.4.2020 to 31.3.2021)
No. of
Shares at
the beginning
(1.4.2020)
% of
total
shares
of the
Company
No. of
Shares
% of
total
shares
of the
Company

19
ANNEXURE - A
FORM NO. MGT-9 - EXTRACT OF ANNUAL RETURN (Continued)
IV. SHARE HOLDING PATTERN
(Equity Share Capital Breakup as percentage of Total Equity)
(iv) Shareholding Pattern (Equity Share Capital) of top ten Shareholders (other than
Directors, Promoters and Holders of GDRs and ADRs) (Continued)
6. The Indian Hotels 42,74,590 3.96 - -do- N.A. 42,74,590 3.96Company Ltd.
7. Voltas Ltd. 13,05,720 1.21 - -do- N.A. 13,05,720 1.21
8. Af –taab Investment 10,00,543 0.93 - -do- N.A. 10,00,543 0.93Company Ltd.
9. Tata Motors Finance 9,93,753 0.92 - -do- N.A. 9,93,753 0.92Limited
Sr.
No.Name Shareholding Date
Increase /
Decrease
in
shareholding
Reason
Cumulative
Shareholding during
the year
(1.4.2020 to 31.3.2021)
No. of
Shares at
the beginning
(1.4.2020)
% of
total
shares
of the
Company
No. of
Shares
% of
total
shares
of the
Company
(v) Shareholding (Equity Shares) of Directors and Key Managerial Personnel: Nil
Sr.
No.Name Shareholding Date
Increase /
Decrease
in
shareholding
Reason
Cumulative
Shareholding during
the year
(1.4.2020 to 31.3.2021)
No. of
Shares at
the beginning
(1.4.2020)
% of
total
shares
of the
Company
No. of
Shares
% of
total
shares
of the
Company
At the beginning None of the directors hold sharesof the year in the Company
Date wise Increase / None of the directors hold sharesDecrease in Share in the Companyholding during the yearspecifying the reasonsfor increase / decrease(e.g. allotment/transfer/bonus/sweat equity etc):
At the end of the year None of the directors hold sharesin the Company

INDUSTRIES
Seventyseventh annual report
Tata Industries Limited
20
ANNEXURE - A
FORM NO. MGT-9 - EXTRACT OF ANNUAL RETURN (Continued)
V. INDEBTEDNESS
Indebtedness of the Company including interest outstanding / accruedbut not due for payment:
(Rs. in crore)
Indebtedness at the beginning
of the financial year
i) Principal Amount Nil Nil Nil Nil(Commercial Paper)
ii) Interest due but not paid Nil Nil Nil Nil
iii) Interest accrued but not due Nil Nil Nil Nil
Total (i+ii+iii) Nil Nil Nil Nil
Change in Indebtedness
during the financial year
• Addition
Short/long Term Revolving Loan
December 8, 2020 Nil 100 Nil 100
February 25, 2021 Nil 50 Nil 50
March 25, 2021 Nil 100 Nil 100
Issue of Non-convertibleDebentures
January 18, 2021 Nil 250 Nil 250
• Reduction
Short/long Term Revolving Loan Nil Nil Nil Nil
Issue of Non-convertible Nil Nil Nil NilDebentures
Net Change Nil 500 Nil 500
Indebtedness at the
end of the financial year
i) Principal Amount Nil 500 Nil 500(Loans & NCDs)
ii) Interest due but not paid Nil Nil Nil Nil
iii) Interest accrued but not due Nil 2.98 Nil 2.98
Total (i+ii+iii) Nil 502.98 Nil 502.98
Secured Loansexcluding deposits
UnsecuredLoans
Deposits TotalIndebtedness

21
VI. REMUNERATION OF DIRECTORS AND KEY MANAGERIAL PERSONNEL
A. Remuneration to Managing Director, Whole-time Directors and/or Manager:(Rs.)
Sr.No.
1. Gross salary
(a) Salary as per provisions 3,14,16,105 3,14,16,105contained in section 17(1)of the Income-tax Act, 1961
(b) Value of perquisites u/s 17(2) 39,58,568 39,58,568of the Income-tax Act, 1961
(c) Profits in lieu of salary - -under section 17(3) of theIncome- tax Act, 1961
2. Stock Option - -
3. Sweat Equity - -
4. Commission - -- as % of profit- others
5. Others - -
Total (A) 3,53,74,673 3,53,74,673
Ceiling as per the 174.46 lakhsCompanies Act, 2013*
Particulars of Remuneration Name of MD / WTD / ManagerTotal
Amount
Mr. K. R. S. Jamwal
ANNEXURE - A
FORM NO. MGT-9 - EXTRACT OF ANNUAL RETURN (Continued)
* The Company has fulfilled all the conditions laid down in Sections 196 & 197 read withSchedule V to the Companies Act, 2013 regarding the payment of remuneration to the ExecutiveDirector in excess of the limits specified therein.

INDUSTRIES
Seventyseventh annual report
Tata Industries Limited
22
Remuneration to other directors:(Rs.)
ANNEXURE - A
FORM NO. MGT-9 - EXTRACT OF ANNUAL RETURN (Continued)
VI. REMUNERATION OF DIRECTORS AND KEY MANAGERIAL PERSONNEL (Continued)
Sr.No.
Particulars of Remuneration Name of Directors Total Amount
3. Other Non-Executive Directors
• Fee for attending 2,40,000 2,40,000*board meetings
• Commission NIL NIL
• Others NIL NIL
Total (3) 2,40,000 2,40,000*
Mr. Srinath Narasimhan
Sr.No.
Particulars of Remuneration Name of Directors Total Amount
2. Other Non-Executive Directors
• Fee for attending 2,40,000 2,40,000*board meetings
• Commission NIL NIL
• Others NIL NIL
Total (2) 2,40,000 2,40,000*
Mr. F. N. Subedar
Sr.No.
Particulars of Remuneration Name of Directors
1. Independent Directors None
• Fee for attending - -board meetings
• Commission - -
• Others - -
Total (1) NIL NIL
Total Amount

23
Sr.No.
Particulars of Remuneration Name of Directors Total Amount
4. Other Non-Executive Directors
• Fee for attending 2,00,000 2,00,000*board meetings
• Commission NIL NIL
• Others NIL NIL
Total (3) 2,00,000 2,00,000*
Total (B)=(1+2+3) 6,80,000*
Total Managerial Remuneration 3,60,54,673
Overall Ceiling as per the Act** 174.46 lakhs
Ms. Aarthi Subramanian
* gross amount.
** The Company has fulfilled all the conditions laid down in Sections 196 & 197 read with Schedule V to the
Companies Act, 2013 regarding the payment of remuneration to the Executive Director in excess of the limits
specified therein.
Remuneration to other directors: (Continued)(Rs.)
ANNEXURE - A
FORM NO. MGT-9 - EXTRACT OF ANNUAL RETURN (Continued)
VI. REMUNERATION OF DIRECTORS AND KEY MANAGERIAL PERSONNEL (Continued)
B. Remuneration to Key Managerial Personnel other than MD / Manager / WTD(Rs.)
Sr.No.
1. Gross salary
(a) Salary as per provisions contained in - 1,75,10,358 1,75,10,358section 17(1) of the Income-tax Act, 1961
(b) Value of perquisites u/s 17(2) of the - 2,48,232 2,48,232Income-tax Act, 1961
(c) Profits in lieu of salary under section - - -17(3) of the Income-tax Act, 1961
2. Stock Option (Number) - - -
3. Sweat Equity - - -
4. Commission - - -
- as % of profit
- others
5. Others - - -
Total - 1,77,58,590 1,77,58,590
Particulars of Remuneration Key Managerial Personnel
CEOCompany
Secretary & CFOTotal
VI. REMUNERATION OF DIRECTORS AND KEY MANAGERIAL PERSONNEL (Continued)

INDUSTRIES
Seventyseventh annual report
Tata Industries Limited
24
ANNEXURE - A
FORM NO. MGT-9 - EXTRACT OF ANNUAL RETURN (Continued)
VII. PENALTIES / PUNISHMENT / COMPOUNDING OF OFFENCES:
A. COMPANY
PenaltyPunishment None
Compounding
B. DIRECTORS
PenaltyPunishment None
Compounding
C. OTHER OFFICERS
IN DEFAULT
PenaltyPunishment None
Compounding
Type
Sectionof the
CompaniesAct
BriefDescription
Details ofPenalty /
Punishment/Compoundingfees imposed
Authority[RD / NCLT /
COURT]
Appealmade,if any(give
Details)
Place : MumbaiDate : 29th April, 2021
Registered Office :
Bombay House24 Homi Mody StreetMumbai 400 001
CIN : U44003MH1945PLC004403
For and on behalf of the Board of Directors,
K.R.S. Jamwal F. N. SubedarExecutive Director Director

25
AN
NE
XU
RE
- B
FO
RM
NO
. M
GT-9
- E
XT
RA
CT
OF
AN
NU
AL
RE
TU
RN
(C
on
tin
ue
d)
Fo
rm A
OC
- I
Sta
tem
en
t p
urs
ua
nt
to f
irs
t p
rovis
o t
o s
ub
-se
cti
on
(3
) o
f s
ec
tio
n 1
29
of
the
Co
mp
an
ies
Ac
t, 2
01
3,
rea
d w
ith
ru
le 5
of
Co
mp
an
ies
(A
cc
ou
nts
)
Ru
les
, 2
01
4 i
n t
he
pre
sc
rib
ed
Fo
rm A
OC
-1
Sta
tem
en
t c
on
tain
ing
sa
lie
nt
fea
ture
s o
f th
e f
ina
nc
ial
sta
tem
en
t o
f S
ub
sid
iari
es
/ A
ss
oc
iate
co
mp
an
ies
/ J
oin
t V
en
ture
s
Pa
rt A
: S
ub
sid
iari
es
(` la
kh
s)
Ad
dit
ion
al
de
tail
s :
1T
he
re a
re n
o s
ub
sid
iari
es w
hic
h a
re y
et
to c
om
me
nc
e o
pe
rati
on
s.
2F
liso
m A
G a
nd
Fliso
m H
un
ga
ry K
ft h
ave
ce
ase
d to
be
ass
oci
ate
s a
nd
be
cam
e s
ub
sid
iari
es
of
the
Co
mp
an
y w
. e
. f.
Ma
rch
25
, 2
02
0.
3Tu
rno
ve
r re
po
rte
d a
bo
ve
are
th
e a
mo
un
ts r
ep
ort
ed
in th
e fin
an
cia
l sta
tem
en
ts o
f re
sp
ec
tive
su
bsid
iari
es.
4In
ve
stm
en
ts i
nc
lud
e C
urr
en
t a
nd
No
n C
urr
en
t In
ve
stm
en
ts.
Pla
ce
:M
um
ba
i
Da
te:
29
th A
pri
l, 2
02
1
Fo
r a
nd
on
be
ha
lf o
f th
e B
oa
rd o
f D
ire
cto
rs o
f Ta
ta I
nd
ustr
ies L
imit
ed
,
CIN
: U
44
00
3M
H1
94
5P
LC
00
44
03
K.
R.
S.
Ja
mw
al
F.
N.
Su
be
da
rS
. S
rir
am
Exe
cu
tive
Dir
ec
tor
Dir
ec
tor
Ch
ief
Fin
an
cia
l O
ffic
er
&C
om
pa
ny S
ec
reta
ry
Rep
ort
ing
cu
rren
cy
US
Do
llars
Ind
ian
Ru
pees
US
Do
llars
CH
FE
UR
Exch
an
ge r
ate
as o
n t
he last
date
of
the r
ele
van
tfin
an
cia
l year
in c
ase o
f fo
reig
n s
ub
sid
iari
es
73.2
1-
73.2
177.5
585.8
4
Sh
are
Cap
ital
141,1
22.5
325,5
90.0
01,3
09.0
81,2
01.8
19.4
4
Reserv
es &
Su
rplu
s16,1
98.6
9(1
5,0
32.1
9)
(1,6
30.8
0)
8,1
40.6
27,2
23.3
5
Tota
l A
ssets
157,5
56.5
330,6
55.0
81,7
22.1
333,5
54.9
745,5
28.8
5
Tota
l Lia
bili
ties
235.3
120,0
96.4
72,0
43.8
424,2
12.5
438,2
96.0
5
Investm
en
ts79,4
82.5
9575.0
5-
9,6
86.8
8-
Tu
rno
ver
2,1
20.0
41,4
37.2
157.9
93,3
84.6
2130.0
5
Pro
fit
befo
re t
axatio
n3,4
47.0
1(8
,892.0
6)
(781.5
2)
(6,5
45.2
6)
(2,2
94.4
2)
Pro
vis
ion
fo
r ta
xatio
n147.3
0-
(117.2
6)
--
Pro
fit
after
taxatio
n3,2
99.7
2(8
,892.0
6)
(664.2
6)
(6,5
45.2
6)
(2,2
94.4
2)
Pro
po
sed
div
iden
d-
--
--
% o
f sh
are
ho
ldin
g100%
100%
100%
84.1
0%
84.1
0%
Na
me
of
the
su
bsid
iary
Qu
bit
In
ve
stm
en
ts
Pte
. L
td.
Tata
Sm
art
Fo
od
z
Lim
ite
d9
15
La
bs,
Inc
Fli
so
m A
G
(Re
fer
No
te 2
)
Flis
om
Hu
ng
ary
Kft
(Re
fer
No
te 2
)
Th
e d
ate
sin
ce
wh
en
su
bsid
iary
wa
s a
cq
uir
ed
19
-Ju
l-1
61
6-N
ov-1
70
8-M
ar-
19
25
-Ma
r-2
02
5-M
ar-
20
Re
po
rtin
g p
eri
od
fo
r th
e s
ub
sid
iary
co
nce
rne
d,
if d
iffe
ren
t fr
om
th
e h
old
ing
co
mp
an
y’s
rep
ort
ing
pe
rio
d
Sam
e a
s th
eh
old
ing
Co
mp
an
y’s
rep
ort
ing
peri
od
Sam
e a
s th
eh
old
ing
Co
mp
an
y’s
rep
ort
ing
peri
od
Fin
an
cial
Year
en
din
g31 D
ecem
ber
2020
Fin
an
cial
Year
en
din
g31 D
ecem
ber
2020
Fin
an
cial
Year
en
din
g31 D
ecem
ber
2020

INDUSTRIES
Seventyseventh annual report
Tata Industries Limited
26
AN
NE
XU
RE
- B
FO
RM
NO
. M
GT-9
- E
XT
RA
CT
OF
AN
NU
AL
RE
TU
RN
(C
on
tin
ue
d)
Fo
rm A
OC
- I
Sta
tem
en
t p
urs
ua
nt
to S
ec
tio
n 1
29
(3)
of
the
Co
mp
an
ies
Ac
t, 2
01
3 r
ela
ted
to
As
so
cia
te C
om
pa
nie
s a
nd
Jo
int
Ve
ntu
res
Pa
rt B
: A
ss
oc
iate
s a
nd
Jo
int
Ve
ntu
res
(` la
kh
s)
Ad
dit
ion
al
de
tail
s :
1T
he
re a
re n
o a
sso
cia
tes
an
d j
oin
t ve
ntu
res
wh
ich
are
ye
t to
co
mm
en
ce
op
era
tio
ns.
2F
liso
m A
G a
nd
Flis
om
Hu
ng
ary
Kft
hav
e ce
ased
to b
e as
soci
ates
and
bec
ame
subs
idia
ries
of t
he
Co
mp
an
yw
. e
. f.
Ma
rch
25
, 2
02
0.
3A
mo
un
t o
f In
vest
me
nt
in A
sso
cia
tes
an
d J
oin
t V
en
ture
s a
re n
et
of
ori
gin
al c
ost
of
inve
stm
en
ts w
ritt
en
off
.4
Inve
stm
en
t in
Ass
oc
iate
s a
nd
Jo
int
Ve
ntu
res
are
ac
co
un
ted
in
co
nso
lida
tio
n b
asi
s e
qu
ity
me
tho
d.
5T
he
Nu
mb
ers
are
ba
sed
on
Un
au
dit
ed
fin
an
cia
ls f
or
the
ye
ar.
6A
mo
un
t is
me
nti
on
ed
as
Nil
we
re a
sso
cia
tes
an
d j
oin
t ve
ntu
res
ha
ve N
eg
ati
ve N
et
wo
rth
.7
Pro
fit
/ L
oss
fo
r th
e y
ea
r d
oe
s n
ot
inc
lud
e O
the
r c
om
pre
he
nsi
ve i
nc
om
e.
Pla
ce
:M
um
ba
iD
ate
:2
9th
Ap
ril,
20
21
Fo
r a
nd
on
be
ha
lf o
f th
e B
oa
rd o
f D
ire
cto
rs o
f Ta
ta I
nd
ustr
ies L
imit
ed
,C
IN :
U4
40
03
MH
19
45
PL
C0
04
40
3
K.
R.
S.
Ja
mw
al
F.
N.
Su
be
da
rS
. S
rir
am
Exe
cu
tive
Dir
ec
tor
Dir
ec
tor
Ch
ief
Fin
an
cia
l O
ffic
er
&
Co
mp
an
y S
ec
reta
ry
Nam
e of
the
Ass
ocia
tes
and
Join
t Ve
ntur
es
Asso
ciat
esAs
soci
ates
Asso
ciat
esAs
soci
ates
Asso
ciat
esAs
soci
ates
Asso
ciat
esAs
soci
ates
Asso
ciat
esJo
int V
entu
res
Join
t Ven
ture
s
Late
st a
udite
d ba
lanc
e sh
eet d
ate
31-M
ar-2
131
-Dec
-20
31-D
ec-2
031
-Mar
-21
31-M
ar-2
131
-Mar
-21
31-M
ar-2
131
-Mar
-21
31-M
ar-2
131
-Mar
-21
31-M
ar-2
1
Dat
e on
whi
ch th
e As
soci
ate
or J
oint
25-A
pr-9
601
-Apr
-09
26-J
un-1
904
-Oct
-17
22-J
ul-0
523
-Sep
-94
25-M
ay-9
310
-Dec
-02
20-J
an-0
613
-Aug
-07
22-J
un-1
6Ve
ntur
e w
as a
ssoc
iate
d or
acq
uire
d
Rep
ortin
g cu
rren
cyIn
dian
Rup
ees
CH
FEU
RIn
dian
Rup
ees
US
Dol
lars
Indi
an R
upee
sIn
dian
Rup
ees
Indi
an R
upee
sIn
dian
Rup
ees
Indi
an R
upee
sIn
dian
Rup
ees
Tata
Aut
ocom
pS
yste
ms
Lim
ited
(Ref
er N
ote
5)
Flis
om A
G(R
efer
Not
e 2)
Flis
omH
unga
ry K
ft(R
efer
Not
e 2)
Impe
tis
Bio
scie
nces
Lim
ited
Indi
gene
Pha
rma-
ceut
ical
sIn
c
Ori
enta
lFl
orat
ech
(Ind
ia)
Lim
ited
Ori
enta
lS
erit
ech
Lim
ited
ITeL
Indu
stri
esLi
mit
ed
Nis
kalp
Infr
astr
uctu
reLi
mit
ed
Tata
Uni
Sto
reLi
mit
ed
No
of s
hare
s he
ld69
,245
,203
--
1,28
2,89
27,
800,
000
750,
000
190
150
40,0
00,0
001,
116,
905,
741
1,61
3,46
0by
the
com
pany
inas
soci
ate/
join
t ven
ture
Shar
es o
f the
Ass
ocia
te /
Joi
ntA
mou
nt o
f inv
estm
ent
10,2
51.0
4-
-76
2.22
--
0.01
0.01
0.00
107,
439.
9516
1.35
Vent
ures
hel
d by
the
Com
pany
in a
ssoc
iate
/ jo
int
as o
n M
arch
31,
202
0ve
ntur
e (`
lakh
s)(R
efer
Not
e 3)
Exte
nt o
f hol
ding
34.4
0%0.
00%
0.00
%34
.37%
32.9
6%24
.19%
28.2
1%20
.00%
50.0
0%92
.83%
76.9
2%(i
n pe
rcen
tage
)
Des
crip
tion
of h
ow th
ere
issi
gnifi
cant
inf
luen
ce
Reas
on w
hy th
e As
soci
ate/
Join
t Ven
ture
NA
NA
NA
NA
NA
NA
NA
NA
NA
NA
NA
is n
ot c
onso
lidat
ed (
Ref
er N
ote
4)
Net
wor
th a
ttrib
utab
le to
33,3
19.6
9-
-74
2.76
NA
--
--
--
shar
ehol
ding
as
per
late
st b
alan
cesh
eet (
Rs.
lakh
s) (
Ref
er N
ote
6)
Con
side
red
in(4
,103
.31)
(1,9
54.7
0)(8
4.33
)92
.58
NA
--
--
(33,
761.
03)
(291
.83)
Con
solid
atio
n (`
lakh
s)Pr
ofit
/ Lo
ss fo
r th
e ye
arN
ot C
onsi
dere
d in
(535
.30)
(1,6
45.1
1)(7
0.97
)17
6.79
NA
(0.2
8)(1
.55)
(0.7
5)-
(2,4
09.8
0)(5
73.0
3)(R
efer
Not
e 7)
Con
solid
atio
n ( `
lakh
s)
By
virt
ue o
fsh
areh
oldi
ng
Inzp
era
Hea
lths
cien
ces
Lim
ited
By
virt
ue o
fsh
areh
oldi
ngag
reem
ent
By
virt
ue o
fsh
areh
oldi
ngag
reem
ent
By
virt
ue o
fsh
areh
oldi
ngB
y vi
rtue
of
shar
ehol
ding
By
virt
ue o
fsh
areh
oldi
ngB
y vi
rtue
of
shar
ehol
ding
By
virt
ue o
fsh
areh
oldi
ngB
y vi
rtue
of
shar
ehol
ding
By
virt
ue o
fsh
areh
oldi
ngag
reem
ent
By
virt
ue o
fsh
areh
oldi
ngag
reem
ent

27
ANNEXURE - C
ANNUAL REPORT ON CSR ACTIVITIES FOR THE FINANCIAL YEAR 2020-21
1. A brief outline of the Company’s Corporate Social Responsibility (CSR) policy,
including overview of projects or programs proposed to be undertaken and a
reference to the web-link to the CSR policy and projects or programs:
Company’s endeavour is to protect the interests of all its stakeholders and contribute to
society at large, by making a measurable and positive difference through the four causes
we support viz.:
i. Livelihood & Employability
ii. Health
iii. Education
iv. Environment
and improve the quality of life of those we serve through long term stakeholder value
creation. The following activities have been undertaken by the Company during the
financial year:
Ambherpada is one of the backward villages in Karjat in the Sahyadri
Ranges attached to Pune District Boundary. This village was chosen
along with Rallis India Ltd., for undertaking village development/
water rejuvenations work, as this village is suffering from extreme
water scarcity during 6/7 months of the year and hence there is a
large-scale migration to the cities for casual/ manual labour.
This project was carefully chosen in consultation with the Village
Panchayat as they highlighted dire need for water availability to
ensure that most of the working population remain in the village
and improve their agricultural requirements (second crop) and also
avoid hardship for their water needs. This project intends to provide
a long-term sustainable solution for the water needs of this and
neighbouring villages.
This project is for strengthening & repairing of the village pond and
laying gravity pipelines up to the vil lage and soil & water
conservation measures. The villagers have committed to provide
the manual labour for the entire project and requested the Company
for a contribution towards the following activities:
• Repairing and strengthening parapet wall around the pond
• Loose boulder & Gabion Structure
• Recharging wells, etc.
1. Ambherpada
Rainwater
Harvesting
Proposal
Sr.
No.Project Details

INDUSTRIES
Seventyseventh annual report
Tata Industries Limited
28
After evaluating competitive proposals, a contractor has been
appointed to carry out the work for a total project cost of Rs.23.75
lakhs (excluding taxes). Out of the entire project cost, a sum of Rs.
12.23 lakhs has been spent to mobilise materials and do the initial
work for the project. The remaining part of the project is expected
to be complete by June 2021 before the onset of the monsoon.
Sr.
No.Project Details
2. Machineries /
Equipment for
villages in the
Karjat District
Alongwith Rallis India Ltd. an evaluation was done for providing
alternate employment/ new vocation for women and working groups
in the villages, based on which certain opportunities were identified.
Accordingly, for the 4 tribal villages of Karjat district, namely,
Ambherpada, Saraiwadi, Tadwadi and Mogh Raj, several machines,
as discussed below, were provided to selected individuals/ working
groups for generating income as well as exposing them to a new
vocation/ sustainable growth for the future.
• 42 sewing machines have been distributed to women in the
aforementioned villages.
• 3 oil machines installed in the villages to provide a means of
livelihood to working groups, who do not own agricultural lands
and are presently not employed in such activities.
3. Digital
Classrooms in
Government
Schools
It was decided to make a contribution to World Vision India (WVI), a
charitable society based in Chennai, which is registered under the
Tamil Nadu Societies Registration Act, 1975 and serves vulnerable
children in 26 states.
Overall goal of the project is to improve quality of education for
children studying in the selected 4 government schools in 3 different
geographies in India by providing Digital Classrooms with required
equipment/devices and tieup for content alongwith support for a
certain period.
Digital classroom equipment installed in the schools will be
maintained through school management committees overseen by
the teachers. They will ensure that the intended results are achieved,
and capital investments made in installing these systems are made
use of in the best possible way.
WVI will be using the CSR contribution to improve the quality of
learning for certain government schools in Mumbai, Chennai and
Hyderabad, by carrying out the following activities over a period of
4 months from March 2021:
29
Sr.
No.Project Details
• Setting up of 10 Digital classroom equipment in selected schools
• Strengthening of digital classrooms (Painting, repair/upgrade
of door and windows for safety, electrification, wiring etc.)
• Baseline assessment will be conducted to assess present level
of learning outcome of the students
• Meetings with Parents and Teachers Associations (PTAs) and
School Management Committees (SMCs)
• Conducting End line Assessments.
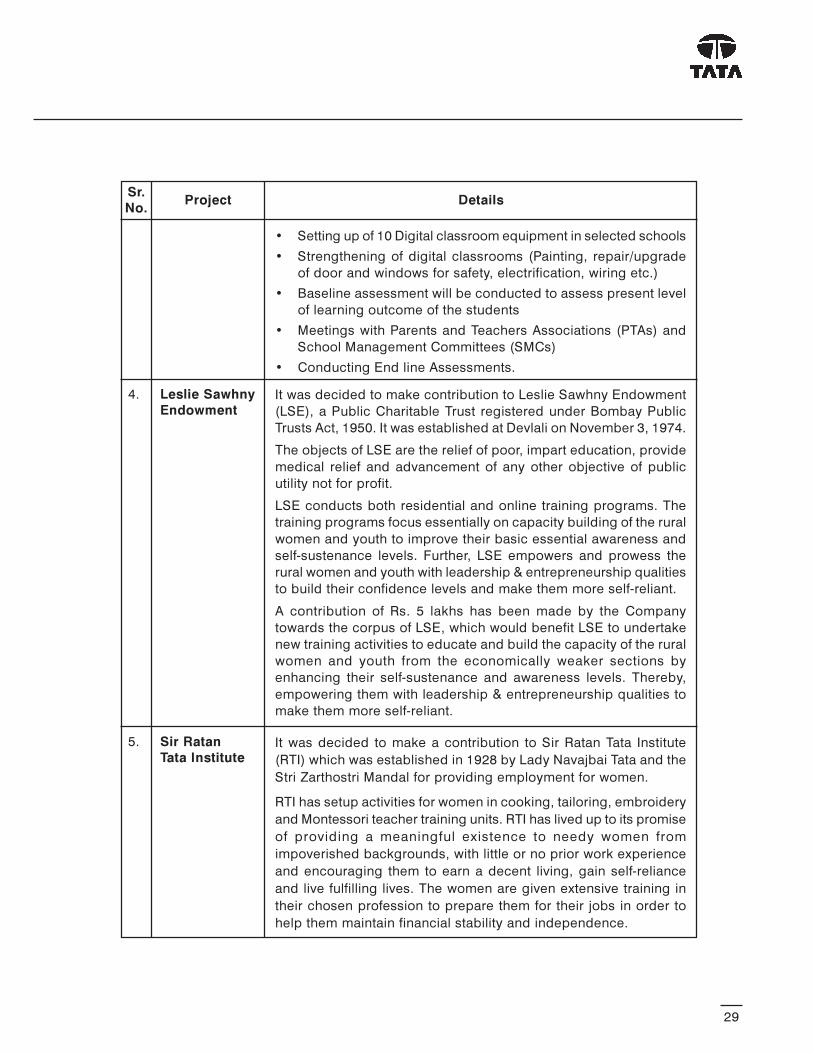
4. Leslie Sawhny
EndowmentIt was decided to make contribution to Leslie Sawhny Endowment
(LSE), a Public Charitable Trust registered under Bombay Public
Trusts Act, 1950. It was established at Devlali on November 3, 1974.
The objects of LSE are the relief of poor, impart education, provide
medical relief and advancement of any other objective of public
utility not for profit.
LSE conducts both residential and online training programs. The
training programs focus essentially on capacity building of the rural
women and youth to improve their basic essential awareness and
self-sustenance levels. Further, LSE empowers and prowess the
rural women and youth with leadership & entrepreneurship qualities
to build their confidence levels and make them more self-reliant.
A contribution of Rs. 5 lakhs has been made by the Company
towards the corpus of LSE, which would benefit LSE to undertake
new training activities to educate and build the capacity of the rural
women and youth from the economically weaker sections by
enhancing their self-sustenance and awareness levels. Thereby,
empowering them with leadership & entrepreneurship qualities to
make them more self-reliant.
5. Sir Ratan
Tata InstituteIt was decided to make a contribution to Sir Ratan Tata Institute
(RTI) which was established in 1928 by Lady Navajbai Tata and the
Stri Zarthostri Mandal for providing employment for women.
RTI has setup activities for women in cooking, tailoring, embroidery
and Montessori teacher training units. RTI has lived up to its promise
of providing a meaningful existence to needy women from
impoverished backgrounds, with little or no prior work experience
and encouraging them to earn a decent living, gain self-reliance
and live fulfilling lives. The women are given extensive training in
their chosen profession to prepare them for their jobs in order to
help them maintain financial stability and independence.

INDUSTRIES
Seventyseventh annual report
Tata Industries Limited
30
Sr.
No.Project Details
RTI supports the differently abled and senior citizens by finding
roles for them within the Institute, helping to employ those deemed
unemployable by mainstream society.
A contribution of Rs.11.80 lakhs has been made by the Company
towards the corpus of RTI, which would aid RTI to carry out its goals
and objectives towards the weaker sections of the society, namely,
women in need, differently abled and senior citizens.
6. Other
contributionsThe Company has made contributions to the following trusts during
the year:·
• Tata Community Initiative Trust (TCIT): Rs. 50 lakhs
TCIT has set up a replicable model for training and skill
development, creating training capacity in select sectors and
trades along with appropriate certification and measurement of
outcomes. TCIT is aligned with the 25 sectors of focus identified
by the Union Government as well as skill gaps identified by the
National Skill Development Corporation.
The contribution by the Company towards TCIT is to promote
the training programmes which aim to be accessible to the
underprivileged and those who have traditionally been denied
access to such training, on account of gender, disabilities or
ethnicity.
• Tata Education Development Trust (Tata Trust) : Rs.50 lakhs
An initiative named ‘Response to COVID-19 – Mission Gaurav
(Migrants Support Programme)’ has been started by the Tata
Trust, to support migrant workers and to empower and build
resilience to withstand future shocks by providing access to
entitlements and schemes, facilitate banking operations,
connect to non-farm based livelihood opportunities, skill
mapping, and linkage to available skilling opportunities. Under
this program the Tata Trust is working with its associate
organization and ongoing partners in 6 states, namely,
Rajasthan, Madhya Pradesh, Uttar Pradesh, Jharkhand, Odisha
and Chhattisgarh.
The funds received from Company are allocated to one of the
partner organizations in Uttar Pradesh – Trust Community
Livelihood.

31
2. Composition of CSR Committee:
Sl.
No.
Name of Director
(Identity of
the Chairman)
Designation /
Nature of
Directorship
1. Mr. F.N. Subedar, Non-Independent 1 1
Chairman of the Non-Executive
Committee Meeting Director 1 1
2. Mr. K. R. S. Jamwal Executive Director 1 1
Number of meetings
of CSR Committee
held during
the year
Number of meetings
of CSR Committee
attended during
the year
3. Web-link where Composition of CSR committee, CSR Policy and CSR projects
approved by the board are disclosed on the website of the company. – Not Applicable
4. Impact assessment of CSR projects carried out in pursuance of sub-rule (3) of rule
8 of the Companies (Corporate Social Responsibility Policy) Rules, 2014, if applicable
(attach the report). – Not Applicable
5. Details of the amount available for set off in pursuance of sub-rule (3) of rule 7 of the
Companies (Corporate Social Responsibility Policy) Rules, 2014 and amount required
for set off for the financial year, if any – Not Applicable
6. Average net profit of the company as per section 135(5) : Rs. 81.40 crores
7. (a) Two percent of average net profit of the company as per section 135(5):
Rs.1,62,80,000
(b) Surplus arising out of the CSR projects or programmes or activities of the
previous financial years: Nil
(c) Amount required to be set off for the financial year, if any: Nil
(d) Total CSR obligation for the financial year (7a+7b-7c) : Rs. 1,62,80,000
Sl.
No.Financial Year
Amount available for set-off
from preceding financial
years (in Rs.)
Amount required to be set-off
for the financial year,
if any (in Rs.)
1
2
3
TOTAL

INDUSTRIES
Seventyseventh annual report
Tata Industries Limited
32
8. (a) CSR amount spent or unspent for the financial year:
Total Amount Spent
for the
Financial Year
(in Rs.)
Amount Unspent (in Rs.)
Total Amount
transferred to Unspent
CSR Account as per
section 135(6).
Amount
Amount transferred to any fund
specified under Schedule VII
as per second proviso
to section 135(5).
Date of
transfer
Name of
the FundAmount
Date of
transfer
1,64,73,420 N.A. N.A. N.A. N.A. N.A.
8. (b) Details of CSR amount spent against ongoing projects for the financial year:
1. Contribution xii N.A. N.A. N.A. N.A. 50,00,000 50,00,000 N.A. No N.A.to TataCommunity
Initiative Trust
2. Contribution to xii N.A. N.A. N.A. N.A. 50,00,000 50,00,000 N.A. No N.A.Tata Education
DevelopmentTrust
3. Contribution ii No Mumbai Mumbai N.A. 24,82,800 24,82,800 N.A. No N.A.to World Chennai Chennai
Vision India Hyderabad Hyderabad
4. Ambherpada i Yes Ambherpada Karjat N.A. 12,39,000 12,39,000 N.A. Yes N.A.RainwaterHarvesting
Proposal
5. Contribution iii N.A. N.A. N.A. N.A. 11,80,000 11,80,000 N.A. No N.A.to Sir RatanTata Institute
6. Installation of iii Yes Ambherpada Karjat N.A. 7,48,620 7,48,620 N.A. Yes N.A.3 oil machines Saraiwadifor the usage of Tadwadi and
tribal villagers Mogh Raj
7. Contribution to iii N.A. N.A. N.A. N.A. 5,00,000 5,00,000 N.A. No N.A.Leslie SawhnyEndowment
8. Distribution iii Yes Ambherpada Karjat N.A. 3,23,000 3,23,000 N.A. Yes N.A.
of 42 sewing Saraiwadimachines to Tadwadi andtribal villagers Mogh Raj
TOTAL 1,64,73,420 1,64,73,420
Sl.No.
(1) (2) (3) (4) (5) (6) (7) (8) (9) (10) (11)
Name ofthe Project
Itemfrom the
list ofactivities
inSchedule
VII tothe Act
Localarea(Yes/No)
Location of the projectProjectduration
Amountallocatedfor theproject(in Rs.)
Amountspent in
the currentfinancial
Year(in Rs.)
Amounttransferredto Unspent
CSRAccountfor the
project asper Section
135(6)(in Rs.)
Modeof
Imple-mentation
Direct(Yes/No)
Mode ofImple-
mentationThroughImple-
mentingAgency
State DistrictName
CSRregistration
number

33
8. (c) Details of CSR amount spent against other than ongoing projects
for the financial year – Not Applicable
Sl.No.
(1) (2) (3) (4) (5) (6) (7) (8)
Name ofthe Project
Item fromthe list of
activities inSchedule VII
to the Act
Local area(Yes/No)
Location of the projectAmount
spent for theproject(in Rs.)
Mode ofImplementation
Direct(Yes/ No)
Mode ofImplementation
ThroughImplementing
Agency
State District NameCSR registration
number
1
2
3
TOTAL
(d) Amount spent in Administrative Overheads : NIL
(e) Amount spent on Impact Assessment, if applicable – Not Applicable
(f) Total amount spent for the Financial Year (8b+8c+8d+8e) – Rs. 1,64,73,420
(g) Excess amount for set off, if any : NIL
(i) Two percent of average net profit of the company as per section 135(5)
(ii) Total amount spent for the Financial Year
(iii) Excess amount spent for the financial year [(ii)-(i)]
(iv) Surplus arising out of the CSR projects or programmes or activities
of the previous financial years, if any
(v) Amount available for set off in succeeding financial years [(iii)-(iv)]
Sl.No.
ParticularsAmount(in Rs.)

INDUSTRIES
Seventyseventh annual report
Tata Industries Limited
34
9. (b) Details of CSR amount spent in the financial year for ongoing projects of the
preceding financial year(s) – Not Applicable
10. In case of creation or acquisition of capital asset, furnish the details relating to the
asset so created or acquired through CSR spent in the financial year (asset-wise
details) – Not Applicable
(a) Date of creation or acquisition of the capital asset(s).
(b) Amount of CSR spent for creation or acquisition of capital asset.
(c) Details of the entity or public authority or beneficiary under whose name such
capital asset is registered, their address etc.
(d) Provide details of the capital asset(s) created or acquired (including complete
address and location of the capital asset).
11. Specify the reason(s), if the company has failed to spend two per cent of the average
net profit as per section 135(5). – Not Applicable
9. (a) Details of Unspent CSR amount for the preceding three financial years – Not Applicable
Sl.No.
PrecedingFinancial
Year
Amounttransferred toUnspent CSRAccount undersection 135 (6)
(in Rs.)
Amountspent in thereporting
Financial Year(in Rs.)
Amount transferred to any fundspecified under Schedule VIIas per section 135(6), if any.
Amount remaining to bespent in succeeding
financial years.(in Rs.)
1
2
3
TOTAL
Name ofthe Fund
Amount(in Rs)
Date oftransfer
Sl.No.
(1) (2) (3) (4) (5) (6) (7) (8) (9)
Project IDNameof theProject
Financial Yearin which theproject wascommenced
Projectduration
Total amountallocated forthe project
(in Rs.)
Amount spenton the project
in the repor tingFinancial Year
(in Rs.)
Cumulativeamount spentat the end of
repor tingFinancial Year
(in Rs.)
1
2
3
TOTAL
Status ofthe project -Completed /
Ongoing
K. R. S. JAMWAL F. N. SUBEDAR
Executive Director Director
(Member – CSR Committee) (Member - CSR Committee)
Place : Mumbai
Date : 29th April, 2021

35
To,
The Members,
TATA INDUSTRIES LIMITED
We have conducted the secretarial audit of the compliance of applicable statutory provisions
and the adherence to good corporate practices by TATA INDUSTRIES LIMITED (hereinafter
called “the Company”). Secretarial Audit was conducted in a manner that provided us a
reasonable basis for evaluating the corporate conducts/statutory compliances and expressing
our opinion thereon.
Based on our verification of the Company’s books, papers, minute books, forms and returns
filed and other records maintained by the Company, to the extent the information provided by
the Company, its officers, agents and authorised representatives during the conduct of
secretarial audit, the explanations and clarifications given to us and the representations made
by the Management and considering the relaxations granted by the Ministry of Corporate
Affairs and Securities and Exchange Board of India warranted due to the spread of the COVID-
19 pandemic, we hereby report that in our opinion, the Company has, during the audit period
covering the financial year ended on 31st March, 2021, generally complied with the statutory
provisions listed hereunder and also that the Company has proper Board processes and
compliance mechanism in place to the extent, in the manner and subject to the reporting
made hereinafter:
We have examined the books, papers, minute books, forms and returns filed and other records
made available to us and maintained by the Company for the financial year ended on 31st
March, 2021 according to the applicable provisions of:
(i) The Companies Act, 2013 (‘the Act’) and the rules made thereunder;
(ii) The Securities Contract (Regulation) Act, 1956 (‘SCRA’) and the rules made thereunder;
(iii) The Depositories Act, 1996 and the Regulations and Bye-laws framed thereunder;
(iv) Foreign Exchange Management Act, 1999 and the rules and regulations made thereunder
to the extent of Foreign Direct Investment, Overseas Direct Investment and External
Commercial Borrowings;
(v) The following Regulations and Guidelines prescribed under the Securities and Exchange
Board of India Act, 1992 (‘SEBI Act’):
(a) The Securities and Exchange Board of India (Substantial Acquisition of Shares
and Takeovers) Regulations, 2011; (Not applicable to the Company during the
audit period)
ANNEXURE - D
FORM No. MR-3
SECRETARIAL AUDIT REPORT
FOR THE FINANCIAL YEAR ENDED 31ST MARCH, 2021
(Pursuant to Section 204 (1) of the Companies Act, 2013 and Rule No. 9 of the Companies
(Appointment and Remuneration of Managerial Personnel) Rules, 2014)

INDUSTRIES
Seventyseventh annual report
Tata Industries Limited
36
ANNEXURE - D
FORM No. MR-3
SECRETARIAL AUDIT REPORT
FOR THE FINANCIAL YEAR ENDED 31ST MARCH, 2021 (Continued)
(b) The Securities and Exchange Board of India (Prohibition of Insider Trading)
Regulations, 2015;
(c) The Securities and Exchange Board of India (Issue of Capital and Disclosure
Requirements) Regulations, 2018 and amendments from time to time; (Not
applicable to the Company during the audit period)
(d) The Securities and Exchange Board of India (Share Based Employee Benefits)
Regulations, 2014; (Not applicable to the Company during the audit period)
(e) The Securities and Exchange Board of India (Issue and Listing of Debt Securities)
Regulations, 2008; (Not applicable to the Company during the audit period)
(f) The Securities and Exchange Board of India (Registrars to an Issue and Share
Transfer Agents) Regulations, 1993 regarding the Companies Act and dealing with
client; (Not applicable to the Company during the audit period)
(g) The Securities and Exchange Board of India (Delisting of Equity Shares)
Regulations, 2009; (Not applicable to the Company during the audit period) and
(h) The Securities and Exchange Board of India (Buyback of Securities) Regulations,
2018; (Not applicable to the Company during the audit period)
(vi) Other laws applicable specifically to the Company namely:-
1. Directions issued by the Reserve Bank of India with regard to Core Investment
Companies and Overseas Direct Investments, 2016;
2. Systematically Important Non Banking Financial (Non Deposit Accepting or
Holding) Companies Prudential Norms (RB) Directions, 2015; and
3. The Reserve Bank of India Act,1934
We have also examined compliance with the applicable clauses of the following:
(i) Secretarial Standards issued by The Institute of Company Secretaries of India
with respect to board and general meetings.
During the period under review, the Company has complied with the provisions of the
Act, Rules, Regulations, Guidelines, standards etc. mentioned above.
37
We further report that:
The Board of Directors of the Company as on 31st March, 2021 was duly constituted with
proper balance of Executive Directors, Non-Executive Directors. The changes in the composition
of the Board of Directors that took place during the period under review were carried out in
compliance with the provisions of the Act.
Adequate notice was given to all directors to schedule the Board Meetings, agenda and detailed
notes on agenda were sent at least seven days in advance, and a system exists for seeking
and obtaining further information and clarifications on the agenda items before the meeting
and for meaningful participation at the meeting.
Decisions at the Board Meetings were taken unanimously.
We further report that there are adequate systems and processes in the Company
commensurate with the size and operations of the Company to monitor and ensure compliance
with applicable laws, rules, regulations and guidelines etc.
We further report that during the audit period the Company had following events which had
bearing on the Company’s affairs in pursuance of the above referred laws, rules, regulations,
guidelines, standards etc.
- The Company has on 18th January, 2021 allotted 6.69% XIRR, Unsecured, Unlisted, Rated,
Redeemable, Non-Convertible Debentures aggregating to Rs. 250 crores.
ANNEXURE - D
FORM No. MR-3
SECRETARIAL AUDIT REPORT
FOR THE FINANCIAL YEAR ENDED 31ST MARCH, 2021 (Continued)
This Report is to be read with our letter of even date which is annexed as Annexure A and forms
an integral part of this report.
Place : Mumbai
Date : 29th April, 2021
For Parikh & Associates
Company Secretaries
Jigyasa N. Ved
Partner
FCS No. : 6488 CP No: 6018
UDIN : F006488C000204257

INDUSTRIES
Seventyseventh annual report
Tata Industries Limited
38
‘Annexure A’
To,
The Members
TATA INDUSTRIES LIMITED
Our report of even date is to be read along with this letter.
1. Maintenance of secretarial record is the responsibility of the management of the Company.
Our responsibility is to express an opinion on these secretarial records based on our
audit.
2. We have followed the audit practices and process as were appropriate to obtain
reasonable assurance about the correctness of the contents of the secretarial records.
The verification was done on test basis to ensure that correct facts are reflected in
secretarial records. We believe that the process and practices, we followed provide a
reasonable basis for our opinion.
3. We have not verified the correctness and appropriateness of financial records and Books
of Accounts of the Company.
4. Where ever required, we have obtained the Management Representation about the
Compliance of laws, rules and regulations and happening of events etc.
5. The Compliance of the provisions of Corporate and other applicable laws, rules,
regulations, standards is the responsibility of management. Our examination was limited
to the verification of procedure on test basis.
6. The Secretarial Audit report is neither an assurance as to the future viability of the
Company nor of the efficacy or effectiveness with which the management has conducted
the affairs of the Company.
ANNEXURE - D
FORM No. MR-3
SECRETARIAL AUDIT REPORT
FOR THE FINANCIAL YEAR ENDED 31ST MARCH, 2021 (Continued)
For Parikh & Associates
Company Secretaries
Jigyasa N. Ved
Partner
FCS No. : 6488 CP No: 6018
UDIN : F006488C000204257
Place : Mumbai
Date : 29th April, 2021

39
ANNEXURE - E
CORPORATE GOVERNANCE REPORT
Company’s Philosophy on Corporate Governance
The Company recognises its role as a corporate citizen and endeavours to adopt the best
practices and the highest standards of corporate governance through transparency in business
ethics, accountability to its customers, Government, and others.
The Company’s activities are carried out in accordance with good corporate practices and the
Company is constantly striving to better these practices by adopting best practices.
The Company believes that governance practices enable the Management to direct and control
the affairs of the Company in an efficient manner and to achieve the Company’s goal of
maximising value for all its stakeholders. The Company will continue to focus its resources,
strengths and strategies to achieve its vision, while upholding the core values of transparency,
integrity, honesty and accountability, which are fundamental to Tata companies.
As a part of the Tata Group, Tata Industries Limited has a strong legacy of fair, transparent and
ethical governance practices. The Corporate Governance philosophy is further strengthened
with the adherence to the principles of Tata Business Excellence Model as a means to drive
excellence, the Key Performance Metrics for tracking progress on long-term strategic objectives
and the TCOC, which articulates the values, ethics and business principles and serves as a
guide to the Company, its directors and employees, supplemented with an appropriate
mechanism to report any concern pertaining to non-adherence to the TCOC. In addition, the
Company has adopted a Policy against Sexual Harassment in the Workplace, a Fit and Proper
Policy for ascertaining the fit and proper criteria of the directors at the time of appointment
and on a continuing basis, an Anti-Bribery and Anti-Corruption Policy, an Anti- Money Laundering
Policy, a Gifts and Hospitality Policy and a Whistle Blowers’ Policy.
The Company has signed the Tata Brand Equity and Business Promotion (“BEBP”) Agreement
with Tata Sons Private Limited for subscribing to the TATA BEBP Scheme. The Company abides
by the TCOC and the norms for using the Tata Brand identity.
a. Board of Directors
The Board of Directors, along with its Committees, provides leadership and guidance to
the Company’s Management and directs, supervises, and controls the activities of the
Company.
The size of the Board is commensurate with the size and business of the Company. As
on March 31, 2021, the Board comprised four Directors viz., Mr. F. N. Subedar, Mr. N.
Srinath, Ms. Aarthi Subramanian and Mr. K. R. S. Jamwal.
Mr. Subedar, Mr. Srinath and Ms. Subramanian are Non-Independent Non-Executive
Directors, while Mr. Jamwal is the Executive Director.
During FY 2020-21, six Meetings of the Board of Directors were held on the following
dates: April 29, 2020, June 24, 2020, July 28, 2020, October 30, 2020, January 27, 2021
and March 30, 2021.

INDUSTRIES
Seventyseventh annual report
Tata Industries Limited
40
ANNEXURE - E
CORPORATE GOVERNANCE REPORT (Continued)
b. Remuneration to the Directors
The Company paid Sitting fees to Non-Executive Directors for attending meetings of
the Board is within the maximum prescribed limits.
The details of the same are, as under:
None of the Non-Executive Directors had any pecuniary relationships or transactions
with the Company during the year under review.
Mr. F. N. Subedar Rs. 2,40,000
Mr. N. Srinath Rs. 2,40,000
Ms. Aarthi Subramanian Rs. 2,00,000
Name of Director (s)Sitting Fees paid for attending
Board Meetings during FY 2020-21
c. Committees of the Board
The Board has constituted Committees with specific terms of reference to focus effectively
on specific issues and ensure expedient resolution of diverse matters. The Company
Secretary is the Secretary of the Committees. The Board of Directors and the Committees
also take decisions by Resolutions passed through Circulation which are noted by the
Board / Committee of the Board at their next meetings. The Minutes of meetings of the
Committees of the Board are circulated to the Board of Directors for noting.
i) Corporate Social Responsibility (“CSR”) Committee
Composition
The composition of the CSR Committee during FY 2020-21 is, given below:
Mr. F. N. Subedar Non-Executive
Mr. K. R. S. Jamwal Executive
Name of the Member Category
Terms of reference
Given below, inter alia, is a gist of the responsibilities of the CSR Committee :
– To formulate and recommend to the Board, a CSR Policy which shall indicate the
activities to be undertaken by the Company as specified in Schedule VII of the Act
(“CSR Activities”);
– To recommend the amount of expenditure to be incurred on CSR activities;
– To monitor the CSR Policy from time to time and instituting a transparent monitoring
mechanism for implementation of the CSR projects or programs or activities
undertaken by the Company; and
– To oversee the Company’s conduct with regard to its corporate and societal
obligations and its reputation as a responsible corporate citizen.
41
ANNEXURE - E
CORPORATE GOVERNANCE REPORT (Continued)
ii) Approvals Committee
Composition
The composition of the Approvals Committee during FY 2020-21 is, given below :
Mr. F. N. Subedar Non-Executive
Mr. N. Srinath Non-Executive
Mr. K. R. S. Jamwal Executive
Name of the Member Category
Terms of reference
Given below, inter alia, is a gist of the responsibilities of the Approvals Committee:
– Opening and closing of bank accounts and demat accounts;
– Modifying instructions/changing signatories for the operation of existing bank and
demat accounts;
– Approve renewal of facilities with banks;
– Appointing representatives of the Company to attend and vote at general meetings
of companies in which Tata Industries Limited (TIL) is a shareholder/debenture
holder;
– Grant Specific Powers of Attorney or Authorisations to executives of the Company
or other persons in connection with the business of TIL and its Divisions; and
– Approve the affixing of the Common Seal of the Company on any document
executed/to be executed by the Directors/officials authorised by the Company.
d. Secretarial Standards
The Company is in compliance with SS – 1 i.e., Secretarial Standard on Meetings of the
Board of Directors and SS – 2 i.e., Secretarial Standard on General Meetings issued by
The Institute of Company Secretaries of India.
e. General Information for Members and Debenture holders
The Company is registered with the Registrar of Companies, Maharashtra, Mumbai. The
Corporate Identification Number (“CIN”) allotted to the Company by the Ministry of
Corporate Affairs (“MCA”) is U44003MH1945PLC004403.

INDUSTRIES
Seventyseventh annual report
Tata Industries Limited
42
ANNEXURE - E
CORPORATE GOVERNANCE REPORT (Continued)
Details of Debenture Trustees and the Registrar and Transfer Agents for the Debentures
issued by the Company are, given below:
Debenture Trustees
Axis Trustee Services Limited
Address : The Ruby, 2nd Floor, SW 29 Senapati Bapat Marg,
Dadar West, Mumbai -400 028. Tel : 022 – 62300446, Fax : 022 – 62300700
E-mail : [email protected]
Registrar and Transfer Agents
TSR Darashaw Consultants Private Limited
Address : C-101, 1st Floor, 247 Park, Lal Bahadur Shastri Marg,
Vikhroli (West), Mumbai - 400 083.
Tel : +91 22 6656 8484 Fax : + 91 22 6656 8494
Place : Mumbai
Date : 29th April, 2021
Registered Office :
Bombay House
24 Homi Mody Street
Mumbai 400 001
CIN : U44003MH1945PLC004403
For and on behalf of the Board of Directors,
K.R.S. Jamwal F. N. Subedar
Executive Director Director

43
ANNEXURE - F
MANAGEMENT DISCUSSION AND ANALYSIS REPORT
1. Industry structure and developments
Tata Industries Limited is registered with the Reserve Bank of India as a Core Investment
Company (“CIC”). The Company is an investment holding company and is part of the
promoter group with shareholding in group companies apart from being engaged in
incubation / promotion of new business ventures such as Tata Unistore Ltd. (TataCLiQ)
and Tata Smartfoodz Ltd. (Tata Q ready-to-eat meals).
Tata Industries Ltd. divisions operate in the sectors of Data Analytics, Digital Health, EdTech
and Strategy and Management Consulting. These are high growth sectors that provide
an opportunity to build high-technology scalable and sustainable businesses for the group,
which is the core mandate of Tata Industries.
• Data Analytics
India is currently among the top 10 big data analytics markets in the world and
NASSCOM has set a target of making the country one of the top three markets.
An increasing need for analytical services and products that are focused on business
outcomes and customer experience are encouraging organizations to engage with
experts in data analytics. Highly regulated industries including BFSI, telecom and
healthcare are driving the need for analytical models for scalability, digitization,
accessibility and cost reduction.
Key growth drivers for the sector include: an exponential increase in data generation,
presence of cost-effective infrastructure, enhancement in innovative, scalable
solutions, ease of data consolidation, presence of regulatory and risk compliances
and increase in SaaS (Software as a Service) solutions.
• Digital Health
The healthcare system in India remains severely under-resourced, reflecting
inconsistent quality and inadequate medical infrastructure. This often leads to
expensive hospitalizations in avoidable cases. 75% of the Indian population living
outside urban areas can access only 31.5% of hospitals. Access to quality primary
care, which is the first line of defence, is particularly scarce.
Digital health has the potential to narrow this gap by removing the need for heavy
infrastructural requirements and reducing the time taken for getting consultations.
Additionally, patients benefit from affordable prices and convenience.
The Covid-19 pandemic has created the need for a digitally integrated ecosystem
that enables consultation and care for patients remotely. The need is both for acute
ailments, where patients fear risk of infection and for chronic care, where patients
increasingly use digital channels for disease management.
The top 8 health-tech startups have raised over $700 Mn from 2014-2019. Of the top
12 pharmaceutical companies in India, 80% have tied–up with one or more market
place teleconsultation platforms and 8% have launched their own platform.
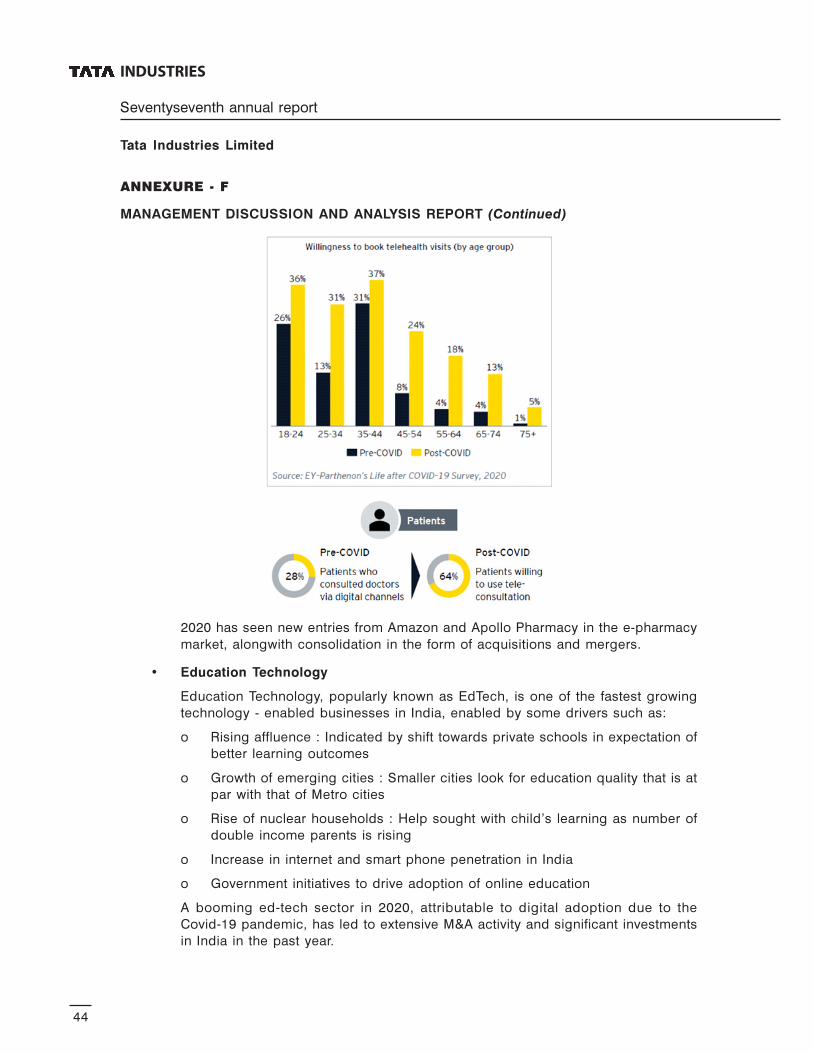
INDUSTRIES
Seventyseventh annual report
Tata Industries Limited
44
2020 has seen new entries from Amazon and Apollo Pharmacy in the e-pharmacy
market, alongwith consolidation in the form of acquisitions and mergers.
• Education Technology
Education Technology, popularly known as EdTech, is one of the fastest growing
technology - enabled businesses in India, enabled by some drivers such as:
o Rising affluence : Indicated by shift towards private schools in expectation of
better learning outcomes
o Growth of emerging cities : Smaller cities look for education quality that is at
par with that of Metro cities
o Rise of nuclear households : Help sought with child’s learning as number of
double income parents is rising
o Increase in internet and smart phone penetration in India
o Government initiatives to drive adoption of online education
A booming ed-tech sector in 2020, attributable to digital adoption due to the
Covid-19 pandemic, has led to extensive M&A activity and significant investments
in India in the past year.
ANNEXURE - F
MANAGEMENT DISCUSSION AND ANALYSIS REPORT (Continued)

45
ANNEXURE - F
MANAGEMENT DISCUSSION AND ANALYSIS REPORT (Continued)
• Strategy and Management Consulting
Additionally, Tata Industries’ Division, Tata Strategic Management Group (TSMG),
serves as a Strategy Center of Excellence for Tata companies. It offers strategy
advisory services to Tata Sons Pvt. Ltd. and various other Tata companies. It also
collaborates closely with the other Tata companies to identify and facilitate synergy
initiatives across various companies. It partners with external experts and firms as
needed to deliver its services. TSMG has consistently been able to recruit high quality
talent from the market. TSMG has implemented structured training interventions for
its employees and built strong knowledge management capabilities to support its
core advisory services.
2. Opportunities and Threats
• Data Analytics
Opportunities : The explosion of data – both structured and unstructured as well as
digitization of processes, is driving the opportunity to leverage analytics and data
science in supporting and driving decisions across functions and domains.
Industries and companies are at varying levels of analytics maturity, providing an
opportunity for data and analytics products and services across the value chain –
data management, visualizations, business analysis, predictive and prescriptive
analytics using machine learning / artificial intelligence and optimization.
The overall revenues from analytics offerings by Indian firms stood at $35.9 Billion
in 2020. The share of advanced analytics, predictive modelling, and data science
stood at 16% of total analytics revenues in 2020, i.e. around $ 5.7 Billion.
Threats: One of the global threats to the growing data analytics industry is an
increasing threat of cyber security, especially as more sensitive information is made
available and liable to attack. Apart from this, data rights and ownership is a topic
that needs to be managed sensitively and ethically. A purely for-profit approach to
data analysis could be myopic and has the risk of creating irreversible long-term
damage to an organization.
Other challenges that may reduce the pace of analytics adoption include the lack
of pre-requisites (such as effort-and cost-intensive modernization of legacy systems,
investments and capital focused on traditional ROI projects), inability to deal with
ambiguity (such as fuzzy value measurement, unforeseen risks, security and privacy
concerns) and the lack of skills, capabilities and mindset.
• Digital Health
Opportunities: Virtual care in India constitutes tele–consultation, telepathology,
teleradiology and e–pharmacy. India’s eHealth sector reached ~$1.4 Bn GMV in
2020, followed by a 1.7x expansion in the household base. While tele-consultation
and e- pharmacy have made strides due to Covid, teleradiology and telepathology
are still at nascent stages.

INDUSTRIES
Seventyseventh annual report
Tata Industries Limited
46
The range of diagnosis made possible by tele-consultations is set to improve with
an increased adoption of teleradiology and telepathology. Tier-2 and tier-3 towns
are the major growth areas owing to quality care at affordable prices.
Threats : Ineffective policy and inappropriate regulation, data security, customer data
privacy and misuse by interested parties, lack of infrastructure and reach and low
adoption by doctors are some of the factors that can stall adoption.
• Education Tech
Opportunities : Technology exposure and digital literacy are some of major thrusts
for the adoption of EdTech solutions. Student behaviours are also evolving, as they
seek a detailed understanding of concepts as opposed to studying only for exams.
Increased digitalization of schools, with traditional rote learning methods being
replaced by more interactive learning, is driving a need for more digital solutions
that complement traditional learning.
There is also a growing demand from tier-2 and tier-3 cities as well as fast-growing
consumer spending on digital education. It is estimated that over 70 million students
across India supplement school education with some form of tuition. This indicates
a potential for strong growth of online adoption of supplementary education.
Threats : The pandemic, and subsequent lockdowns, have led to a massive disruption
to children’s school education, thus creating a mixed effect for the sector. Closure
of schools for long periods of time impacts learning by children, and the funds
available to schools, as also the use of digital classrooms and to pay for
supplementary solutions. However, this has perhaps forced a massive shift towards
adoption of online solutions, a trend that has been accelerated by digital adoption
and is likely to be irreversible. The growth scenario is also fraught with opportunists
looking to acquire customers. Other threats also include a lack of awareness of online
offerings, abundance of free content online and therefore, a lower perceived value
of paid content.
3. Segment
Please refer to Para 4 of the Board’s Report.
4. Outlook
• Data Analytics
Estimates placed the analytics function in India earning consolidated revenues at
$35.9 Bn in FY2020, a 19% growth over the previous year. Analytics services cover
descriptive, predictive, and prescriptive analytics and include data reporting, business
intelligence, visualization, and analysis.
The analytics domain’s revenue is expected to grow at a CAGR of 16% till 2025, by
when the Indian analytics market would touch $75 Billion, about 30% of the $ 255
Billion IT industry by 2025.
ANNEXURE - F
MANAGEMENT DISCUSSION AND ANALYSIS REPORT (Continued)

47
• Digital Health
The digital health market is expected to grow to US $35 Bn by 2030. The key enablers
that are driving this change are rising income levels, shifts in disease mix and
demography, increased affordability, accessibility, awareness of health and wellness
and growth of digital technology.
Long-term trends include increased adoption of wellness-based offerings, technology
innovations, portable sensors for non-invasive monitoring of disease conditions such
as anaemia, diabetes etc., creation of scalable and interoperable system that leverage
rich data to yield analytical insights. 15%-20% of healthcare is expected to shift to
virtual care, across triaging, consults, remote monitoring, home health among many
others.
• Education Tech
The Indian EdTech market is expected to grow to ~$10 Bn by 2025 from ~$2.8 Bn
in 2020, with an increase in paid users of K-12 learning solutions to 11.3 Mn by 2025.
Contributory factors include high customization in content delivery, assessment and
result analyses, availability of affordable content, provision of value-added services
and merging of online and offline modes, among others.
There is a need for continuous learning which is enabled by rapid advancements in
technology and a regular need for new skills and competencies. Technologies
providing increased personalization of course content and delivery are expected to
find greater adoption in the sector.
5. Risks and Concerns
• Data Analytics
Key risks involve data privacy and storage, data ownership and a dearth of capabilities
and skill sets vis-à-vis the demand with increased amount of data, the cyber security
risk is continuously growing.
Digital solutions have made the sharing of data easy but tracking the ownership to
avoid any dispute as well as the regulatory requirements in few countries pose high
risk for the data analytics industry and can hamper the growth if a sustainable solution
is not found in next few years. India has a shortage of data science talent and current
education streams are lagging in supplying the skill sets being demanded by a rapidly
growing industry.
• Digital Health
Concerns around data privacy and reservations about sharing health data online
can inhibit both the adoption of digital health and the range of offerings that can be
made possible by digital health. For a society that is used to physical interaction like
personal touch, digital health may face trust deficit barriers.
ANNEXURE - F
MANAGEMENT DISCUSSION AND ANALYSIS REPORT (Continued)
INDUSTRIES
Seventyseventh annual report
Tata Industries Limited
48
ANNEXURE - F
MANAGEMENT DISCUSSION AND ANALYSIS REPORT (Continued)
Regulations around digital health, both in India and globally, are still developing.
Concerns about specialization-specific limitations (lighting near patients for
dermatologists etc.), lack of remote diagnostic solutions and delayed payments hinder
on boarding of qualified doctors required for a successful patient diagnosis and
positive user experience.
• Education Tech
Lockdowns (driven by Covid-19), economic slowdown or reduction in school fees
by state governments - leading to deferment of purchase decisions by schools or
restriction in school budgets - will delay the eventual classroom digitalization
requirements. Abrupt regulatory changes or alterations in board curriculum may
require revamping of select digital content, which leads to increase in costs.
6. Internal control systems and their adequacy
Please refer to Para 12 of the Board’s Report.
7. Discussion on financial performance with respect to operational performance
Please refer to Paras 2 to 4 of the Board’s Report.
8. Material developments in Human Resources / Industrial Relations front, including
number of people employed
Number of People Employed : Approximately 700.
Additional measures by all the Divisions
• 100% Work From Home arrangement due to Covid-19 for employee health and safety.
• Partnership with 3rd Party Employee Assistance Program for employee counselling
and well-being consultation during Work From Home arrangements.
• Launch of “Employee Connect Platform” by Data Analytics Division for employee
engagement, employees health and well-being communication.
• Employee participation in online skill development courses during lockdown as
Learning and Development initiatives.
• Employee assistance for safety and related hospital tie-up for any COVID related
illness.
Place : Mumbai
Date : 29th April, 2021
Registered Office :
Bombay House
24 Homi Mody Street
Mumbai 400 001
CIN : U44003MH1945PLC004403
For and on behalf of the Board of Directors,
K.R.S. Jamwal F. N. Subedar
Executive Director Director

49
INDEPENDENT AUDITORS’ REPORT
To the Members of
Tata Industries Limited
Report on the Audit of the Standalone Financial Statements
Opinion
We have audited the standalone financial statements of Tata Industries Limited (“the Company”),
which comprise the standalone balance sheet as at 31 March 2021, and the standalone
statement of profit and loss (including other comprehensive income), standalone statement
of changes in equity and standalone statement of cash flows for the year then ended and
notes to the standalone financial statements, including a summary of the significant accounting
policies and other explanatory information.
In our opinion and to the best of our information and according to the explanations given to
us, the aforesaid standalone financial statements give the information required by the
Companies Act, 2013 (“Act”) in the manner so required and give a true and fair view in conformity
with the accounting principles generally accepted in India, of the state of affairs of the Company
as at 31 March 2021, and loss and other comprehensive income, changes in equity and its
cash flows for the year ended on that date.
Basis for Opinion
We conducted our audit in accordance with the Standards on Auditing (SAs) specified under
section 143(10) of the Act. Our responsibilities under those SAs are further described in the
Auditor’s Responsibilities for the Audit of the Standalone Financial Statements section of our
report. We are independent of the Company in accordance with the Code of Ethics issued by
the Institute of Chartered Accountants of India together with the ethical requirements that are
relevant to our audit of the standalone financial statements under the provisions of the Act and
the Rules thereunder, and we have fulfilled our other ethical responsibilities in accordance
with these requirements and the Code of Ethics. We believe that the audit evidence we have
obtained is sufficient and appropriate to provide a basis for our opinion on the standalone
financial statements.
Other Information
The Company’s management and Board of Directors are responsible for the other information.
The other information comprises the information included in the Company’s annual report but
does not include the financial statements and our auditors’ report thereon.
Our opinion on the standalone financial statements does not cover the other information and
we do not express any form of assurance conclusion thereon.

INDUSTRIES
Seventyseventh annual report
Tata Industries Limited
50
INDEPENDENT AUDITORS’ REPORT (Continued)
Other Information (Continued)
In connection with our audit of the standalone financial statements, our responsibility is to
read the other information and, in doing so, consider whether the other information is materially
inconsistent with the standalone financial statements or our knowledge obtained in the audit
or otherwise appears to be materially misstated. If, based on the work we have performed,
we conclude that there is a material misstatement of this other information, we are required
to report that fact. We have nothing to report in this regard.
Management’s and Board of Directors’ Responsibility for the Standalone Financial
Statements
The Company’s Management and Board of Directors are responsible for the matters stated
in section 134(5) of the Act with respect to the preparation of these standalone financial
statements that give a true and fair view of the state of affairs, profit/loss and other
comprehensive income, changes in equity and cash flows of the Company in accordance with
the accounting principles generally accepted in India, including the Indian Accounting
Standards (Ind AS) specified under section 133 of the Act. This responsibility also includes
maintenance of adequate accounting records in accordance with the provisions of the Act for
safeguarding of the assets of the Company and for preventing and detecting frauds and other
irregularities; selection and application of appropriate accounting policies; making judgments
and estimates that are reasonable and prudent; and design, implementation and maintenance
of adequate internal financial controls that were operating effectively for ensuring accuracy
and completeness of the accounting records, relevant to the preparation and presentation of
the standalone financial statements that give a true and fair view and are free from material
misstatement, whether due to fraud or error.
In preparing the standalone financial statements, the Management and Board of Directors are
responsible for assessing the Company’s ability to continue as a going concern, disclosing,
as applicable, matters related to going concern and using the going concern basis of accounting
unless the Board of Directors either intends to liquidate the Company or to cease operations,
or has no realistic alternative but to do so.
The Board of Directors is also responsible for overseeing the Company’s financial reporting
process.
Auditor’s Responsibilities for the Audit of the Standalone Financial Statements
Our objectives are to obtain reasonable assurance about whether the standalone financial
statements as a whole are free from material misstatement, whether due to fraud or error, and
to issue an auditor’s report that includes our opinion. Reasonable assurance is a high level

51
INDEPENDENT AUDITORS’ REPORT (Continued)
of assurance but is not a guarantee that an audit conducted in accordance with SAs will always
detect a material misstatement when it exists. Misstatements can arise from fraud or error and
are considered material if, individually or in the aggregate, they could reasonably be expected
to influence the economic decisions of users taken on the basis of these standalone financial
statements.
As part of an audit in accordance with SAs, we exercise professional judgment and maintain
professional skepticism throughout the audit. We also:
• Identify and assess the risks of material misstatement of the standalone financial
statements, whether due to fraud or error, design and perform audit procedures responsive
to those risks, and obtain audit evidence that is sufficient and appropriate to provide a
basis for our opinion. The risk of not detecting a material misstatement resulting from
fraud is higher than for one resulting from error, as fraud may involve collusion, forgery,
intentional omissions, misrepresentations, or the override of internal control.
• Obtain an understanding of internal control relevant to the audit in order to design audit
procedures that are appropriate in the circumstances. Under section 143(3)(i) of the Act,
we are also responsible for expressing our opinion on whether the company has adequate
internal financial controls with reference to financial statements in place and the operating
effectiveness of such controls.
• Evaluate the appropriateness of accounting policies used and the reasonableness of
accounting estimates and related disclosures in the standalone financial statements made
by the Management and Board of Directors.
• Conclude on the appropriateness of the Management and Board of Directors use of the
going concern basis of accounting and, based on the audit evidence obtained, whether
a material uncertainty exists related to events or conditions that may cast significant doubt
on the Company’s ability to continue as a going concern. If we conclude that a material
uncertainty exists, we are required to draw attention in our auditor’s report to the related
disclosures in the standalone financial statements or, if such disclosures are inadequate,
to modify our opinion. Our conclusions are based on the audit evidence obtained up to
the date of our auditor’s report. However, future events or conditions may cause the
Company to cease to continue as a going concern.
• Evaluate the overall presentation, structure and content of the standalone financial
statements, including the disclosures, and whether the standalone financial statements
represent the underlying transactions and events in a manner that achieves fair
presentation.

INDUSTRIES
Seventyseventh annual report
Tata Industries Limited
52
INDEPENDENT AUDITORS’ REPORT (Continued)
We communicate with those charged with governance regarding, among other matters, the
planned scope and timing of the audit and significant audit findings, including any significant
deficiencies in internal control that we identify during our audit.
We also provide those charged with governance with a statement that we have complied with
relevant ethical requirements regarding independence, and to communicate with them all
relationships and other matters that may reasonably be thought to bear on our independence,
and where applicable, related safeguards.
Report on Other Legal and Regulatory Requirements
1. As required by the Companies (Auditors’ Report) Order, 2016 (“the Order”) issued by the
Central Government in terms of section 143 (11) of the Act, we give in the “Annexure A”
a statement on the matters specified in paragraphs 3 and 4 of the Order, to the extent
applicable.
2. (A) As required by Section 143(3) of the Act, we report that:
a) We have sought and obtained all the information and explanations which to the
best of our knowledge and belief were necessary for the purposes of our audit.
b) In our opinion, proper books of account as required by law have been kept by
the Company so far as it appears from our examination of those books.
c) The standalone balance sheet, the standalone statement of profit and loss
(including other comprehensive income), the standalone statement of changes
in equity and the standalone statement of cash flows dealt with by this Report
are in agreement with the books of account.
d) In our opinion, the aforesaid standalone financial statements comply with the
Ind AS specified under section 133 of the Act.
e) On the basis of the written representations received from the directors as on
31 March 2021 taken on record by the Board of Directors, none of the directors
is disqualified as on 31 March 2021 from being appointed as a director in terms
of Section 164(2) of the Act.
f) With respect to the adequacy of the internal financial controls with reference to
financial statements of the Company and the operating effectiveness of such
controls, refer to our separate Report in “Annexure B”.

53
INDEPENDENT AUDITORS’ REPORT (Continued)
(B) With respect to the other matters to be included in the Auditors’ Report in accordance
with Rule 11 of the Companies (Audit and Auditors) Rules, 2014, in our opinion and
to the best of our information and according to the explanations given to us:
i. The Company has disclosed the impact of pending litigations as at 31 March
2021 on its financial position in its standalone financial statements - Refer Note
45 and 46 to the standalone financial statements.
ii. The Company did not have any long-term contracts including derivative contracts
for which there were any material foreseeable losses.
iii. There has been no delay in transferring amounts, required to be transferred,
to the Investor Education and Protection Fund by the Company.
iv. The disclosures in the standalone financial statements regarding holdings as
well as dealings in specified bank notes during the period from 8 November
2016 to 30 December 2016 have not been made in these financial statements
since they do not pertain to the financial year ended 31 March 2021.
(C) With respect to the matter to be included in the Auditors’ Report under section 197(16):
In our opinion and according to the information and explanations given to us, the
remuneration paid by the company to its directors during the current year is in
accordance with the provisions of Section 197 of the Act. The remuneration paid to
any director is not in excess of the limit laid down under Section 197 of the Act. The
Ministry of Corporate Affairs has not prescribed other details under Section 197(16)
which are required to be commented upon by us.
For B S R & Co. LLP
Chartered Accountants
Firm’s Registration No : 101248W/W-100022
Rekha Shenoy
Partner
Place : Mumbai Membership No : 124219
Date : 29th April, 2021 UDIN : 21124219AAAABA8959

INDUSTRIES
Seventyseventh annual report
Tata Industries Limited
54
ANNEXURE A TO THE INDEPENDENT AUDITORS’ REPORT – 31 MARCH 2021
Land / No. of Gross block Net blockRemarksBuilding cases (Rs. in lakhs) (Rs. in lakhs)
Freehold 14 301.20 274.63 The original agreements
Building were not available
(owned) for verification.
With reference to the Annexure A referred to in the Independent Auditors’ Report to the members
of the Company on the standalone financial statements for the year ended 31 March 2021,
we report the following:
(i) (a) The Company has maintained proper records showing full particulars, including
quantitative details and situation of property, plant and equipment and investment
properties.
(b) The Company has a regular programme of physical verification of its property, plant
and equipment and investment properties by which the property, plant and equipment
and investment properties are verified by the management according to a programme
designed to cover all the items in a period of three years. In our opinion, this periodicity
of physical verification is reasonable having regard to the size of the Company and
the nature of its assets. In accordance with the policy, the Company has physically
verified property, plant and equipment and investment properties during the year
and we are informed that no material discrepancies were noticed on such verification
and the same have been properly dealt with in the books of account.
(c) According to the information and explanations given to us and on the basis of our
examination of the records of the Company, the title deeds of immovable properties
of land and buildings as disclosed in Note 12 to the standalone financial statements
are held in the name of the Company, except the following:
(ii) The inventory of medicines, equipment’s, packing material and stores and spares has
been physically verified by the management during the year. In our opinion, the frequency
of such verification is reasonable. The discrepancies noticed on verification between the
physical stocks and the book records were not material and have been dealt with in
books of account.
(iii) According to the information and explanations given to us the Company has not granted
any loans, secured or unsecured, to companies, firms, limited liability partnerships or
other parties covered in the register maintained under Section 189 of the Companies Act,
2013 (‘the Act’). Accordingly, paragraphs 3 (iii) (a), (b) and (c) of the Order are not
applicable to the Company.

55
ANNEXURE A TO THE INDEPENDENT AUDITORS’ REPORT – 31 MARCH 2021
(Continued)
(iv) In our opinion and according to the information and explanation given to us, the Company
has not granted any guarantees to the parties covered under Section 185 of the Act. The
Company complied with the provisions of Section 186 of the Act in respect of the grant
of loans, investments made, to the extent applicable to Company.
(v) In our opinion, and according to the information and explanations given to us, the Company
has not accepted deposits as per the directives issued by the Reserve Bank of India and
the provisions of Sections 73 to 76 or any other relevant provisions of the Act and the
rules framed thereunder. Accordingly, paragraph 3 (v) of the Order is not applicable to
the Company.
(vi) The Central Government has not prescribed the maintenance of cost records under Section
148 (1) of the Act for any of the products sold and services rendered by the Company.
Accordingly, paragraph 3 (vi) of the Order is not applicable to the Company.
(vii) (a) According to the information and explanations given to us and on the basis of our
examination of the records of the Company, amounts deducted / accrued in the
books of account in respect of undisputed statutory dues including Provident fund,
Employees’ State Insurance, Income tax, Professional tax, Duty of customs, Goods
and Service tax, Cess and other material statutory dues have been regularly deposited
during the year with the appropriate authorities. As explained to us, the Company
did not have any dues on account of wealth tax, sales tax, value added tax and duty
of excise.
According to the information and explanations given to us, no undisputed amounts
payable in respect of Provident fund, Employees’ State Insurance, Profession tax,
Income-tax, Duty of customs, Goods and Service tax and, Cess and other material
statutory dues were in arrears as at 31 March 2021 for a period of more than six
months from the date they became payable.
(b) According to the information and explanations given to us, there are no dues of
Income-tax, Sales tax, Duty of customs, Duty of excise, Goods and Service tax and
Value added tax as at 31 March 2021, which have not been deposited with the
appropriate authorities on account of any dispute, except as stated below:

INDUSTRIES
Seventyseventh annual report
Tata Industries Limited
56
ANNEXURE A TO THE INDEPENDENT AUDITORS’ REPORT – 31 MARCH 2021
(Continued)(Rs in lakhs)
Name
of Act
Nature of
Dues
Amount
Disputed
Amount
not
Deposited
Under
Disputes
Period to
which
amount
relates
Forum where
dispute is
pending
Income-Tax Income tax 1,073.26 - A.Y. 2006-07 Income-tax
Act, 1961 Appellate Tribunal
Income-Tax Income tax 437.92 - A.Y. 2011-12 High Court
Act, 1961
Income-Tax Income tax 1,274.90 - A.Y. 2015-16 Income-tax
Act, 1961 Appellate Tribunal
Income-Tax Income tax 2.588.45 - A.Y. 2016-17 Income-tax
Act, 1961 Appellate Tribunal
Income-Tax Income tax 4,540.13 - A.Y. 2006-07 Commissioner of
Act, 1961 Income Tax (Appeals)
Income-Tax Income tax 250.90 - A.Y. 2010-11 High Court
Act, 1961
Madhya Value Added 2.67 1.99 A.Y. 2014-15 Commercial
Pradesh VAT Tax including Tax Officer
Act, 2002 interest and
penalty
Jharkhand Value Added 7.26 0.12 2014-15 Deputy Commissioner
Value Added Tax of Sales Tax
Tax Act, 2005
Maharashtra Value Added 0.45 0.45 2014-15 Deputy Commissioner
Value Added Tax of Sales Tax
Tax Act, 2002
(viii) In our opinion and according to the information and explanations given to us, the Company
has not defaulted in repayment of loans to the financial institutions and debenture holders.
The Company did not have any outstanding dues to government or bankers during the
year.
(ix) According to information and explanation given to us and based on our examination of
records of the Company, the Company has not raised any moneys by way of initial public
offer or further public offer during the year. In our opinion and according to information
and explanation given to us, the term loans taken by the Company has been applied for
the purpose for which they are raised.

57
ANNEXURE A TO THE INDEPENDENT AUDITORS’ REPORT – 31 MARCH 2021
(Continued)
(x) During the course of our examination of the books and records of the Company, carried
out in accordance with the generally accepted auditing practices in India, and according
to the information and explanations given to us, we have neither come across any instance
of material fraud by the Company or on the Company by its officers or employees, noticed
or reported during the year, nor have we been informed of any such case by the
management.
(xi) According to the information and explanations given to us and based on our examination
of the records of the Company, the Company has paid / provided for managerial
remuneration in accordance with the requisite approvals mandated by the provisions of
Section 197 read with Schedule V to the Act.
(xii) According to the information and explanation given to us, the Company not a Nidhi
company and the Nidhi Rules, 2014 are not applicable to it. Accordingly, paragraph 3
(xii) of the Order is not applicable to the Company.
(xiii) According to the information and explanations given to us and based on our examination
of the records of the Company, transactions with the related parties are in compliance
with Sections 188 of the Act where applicable and details of such transactions have been
disclosed in the standalone financial statements as required by applicable Ind AS. Further,
the Company is not required to constitute an Audit Committee under Section 177 of the
Act, and accordingly to the extend the paragraph 3(xiii) of the Order is not applicable to
the Company.
(xiv) According to the information and explanations given to us and based on our examination
of the records of the Company, the Company has not made any preferential allotment or
private placement of shares or fully or partly convertible debentures during the year.
Accordingly, paragraph 3 (xiv) of the Order is not applicable to the Company.
(xv) According to the information and explanations given to us and based on our examination
of the records of the Company, the Company has not entered into any non-cash
transactions with directors or persons connected with them. Accordingly, paragraph 3
(xv) of the Order is not applicable to the Company.
(xvi) The Company is required to be registered under Section 45-IA of the Reserve Bank of
India Act, 1934 and is registered as a core investment Company with the Reserve Bank
of India vide registration no. N-13.02011 dated 27 April 2012.
For B S R & Co. LLP
Chartered Accountants
Firm’s Registration No : 101248W/W-100022
Rekha Shenoy
Partner
Place : Mumbai Membership No : 124219
Date : 29th April, 2021 UDIN : 21124219AAAABA8959

INDUSTRIES
Seventyseventh annual report
Tata Industries Limited
58
ANNEXURE B TO THE INDEPENDENT AUDITORS’ REPORT – 31 MARCH 2021
Annexure – “B” to the Independent Auditors’ report on the standalone financial statements
of Tata Industries Limited for the period ended 31 March 2021
Report on the internal financial controls with reference to the aforesaid standalone
financial statements under Clause (i) of Sub-section 3 of Section 143 of the Companies
Act, 2013
(Referred to in paragraph 2(A) (f) under ‘Report on Other Legal and Regulatory
Requirements’ section of our report of even date)
Opinion
We have audited the internal financial controls with reference to standalone financial statements
of Tata Industries Limited (“the Company”) as of 31 March 2021 in conjunction with our audit
of the standalone financial statements of the Company for the year ended on that date.
In our opinion, the Company has, in all material respects, adequate internal financial controls
with reference to financial statements and such internal financial controls were operating
effectively as at 31 March 2021, based on the internal financial controls with reference to
financial statements criteria established by the Company considering the essential components
of internal control stated in the Guidance Note on Audit of Internal Financial Controls Over
Financial Reporting issued by the Institute of Chartered Accountants of India (the “Guidance
Note”).
Management’s Responsibility for Internal Financial Controls
The Company’s management and the Board of Directors are responsible for establishing and
maintaining internal financial controls based on the internal financial controls with reference
to financial statements criteria established by the Company considering the essential
components of internal control stated in the Guidance Note. These responsibilities include the
design, implementation and maintenance of adequate internal financial controls that were
operating effectively for ensuring the orderly and efficient conduct of its business, including
adherence to company’s policies, the safeguarding of its assets, the prevention and detection
of frauds and errors, the accuracy and completeness of the accounting records, and the timely
preparation of reliable financial information, as required under the Companies Act, 2013
(hereinafter referred to as “the Act”).
Auditors’ Responsibility
Our responsibility is to express an opinion on the Company’s internal financial controls with
reference to financial statements based on our audit. We conducted our audit in accordance
with the Guidance Note and the Standards on Auditing, prescribed under section 143(10) of
the Act, to the extent applicable to an audit of internal financial controls with reference to
financial statements. Those Standards and the Guidance Note require that we comply with
ethical requirements and plan and perform the audit to obtain reasonable assurance about
whether adequate internal financial controls with reference to standalone financial statements
were established and maintained and whether such controls operated effectively in all material
respects.

59
ANNEXURE B TO THE INDEPENDENT AUDITORS’ REPORT – 31 MARCH 2021
(Continued)
Our audit involves performing procedures to obtain audit evidence about the adequacy of the
internal financial controls with reference to financial statements and their operating effectiveness.
Our audit of internal financial controls with reference to financial statements included obtaining
an understanding of such internal financial controls, assessing the risk that a material weakness
exists, and testing and evaluating the design and operating effectiveness of internal control
based on the assessed risk. The procedures selected depend on the auditor’s judgement,
including the assessment of the risks of material misstatement of the standalone financial
statements, whether due to fraud or error.
We believe that the audit evidence we have obtained is sufficient and appropriate to provide
a basis for our audit opinion on the Company’s internal financial controls with reference to
financial statements.
Meaning of Internal Financial controls with Reference to Financial Statements
A Company’s internal financial controls with reference to financial statements is a process
designed to provide reasonable assurance regarding the reliability of financial reporting and
the preparation of financial statements for external purposes in accordance with generally
accepted accounting principles. A company’s internal financial controls with reference to
financial statements include those policies and procedures that (1) pertain to the maintenance
of records that, in reasonable detail, accurately and fairly reflect the transactions and
dispositions of the assets of the company; (2) provide reasonable assurance that transactions
are recorded as necessary to permit preparation of financial statements in accordance with
generally accepted accounting principles, and that receipts and expenditures of the company
are being made only in accordance with authorisations of management and directors of the
company; and (3) provide reasonable assurance regarding prevention or timely detection of
unauthorised acquisition, use, or disposition of the company’s assets that could have a material
effect on the standalone financial statements.
Inherent Limitations of Internal Financial controls with Reference to Financial Statements
Because of the inherent limitations of internal financial controls with reference to financial
statements, including the possibility of collusion or improper management override of controls,
material misstatements due to error or fraud may occur and not be detected. Also, projections
of any evaluation of the internal financial controls with reference to standalone financial
statements to future periods are subject to the risk that the internal financial controls with
reference to standalone financial statements may become inadequate because of changes in
conditions, or that the degree of compliance with the policies or procedures may deteriorate.
For B S R & Co. LLP
Chartered Accountants
Firm’s Registration No : 101248W/W-100022
Rekha Shenoy
Partner
Place : Mumbai Membership No : 124219
Date : 29th April, 2021 UDIN : 21124219AAAABA8959

INDUSTRIES
Seventyseventh annual report
Tata Industries Limited
60
STANDALONE BALANCE SHEET AS AT 31 MARCH 2021
(Currency: Indian rupees in lakhs)Note 31 March 2021 31 March 2020
AssetsFinancial assets
Cash and cash equivalents 4 725.21 817.91Bank balances other than cash and cash equivalents 5 43.42 40.81Receivables 6(i) Trade Receivables 3,814.06 3,703.93(ii) Other Receivables 3,267.13 699.80Loans 7 36,700.78 1.85Investments 8 585,199.33 396,594.34Other financial assets 9 1,223.19 1,021.84
630,973.12 402,880.48Non-financial assets
Inventories 10 426.69 344.27Non-Current tax assets (net) 11 11,421.29 14,481.29Proper ty, plant and equipment 12 3,133.79 3,480.14Capital work-in-progress 313.86 185.27Right of use assets 39 4,007.42 5,162.89Intangible assets under development 1,518.45 2,153.38Intangible assets 13 6,175.93 3,945.77Other non-financial assets 14 2,593.67 2,198.39
29,591.10 31,951.40
Assets classified as held for sale and discontinued operations 36 0.73 12.88
0.73 12.88
Total Assets 660,564.95 434,844.76
Liabilities and equityLiabilitiesFinancial liabilities
Lease liabilities 4,948.19 5,767.74(I) Trade payables 15(i) total outstanding dues of micro and small enterprises 0.31 55.54(ii) total outstanding dues of creditors other than
micro and small enterprises 1,431.66 2,089.43(II) Other payables(i) total outstanding dues of micro and small enterprises - -(ii) total outstanding dues of creditors other than
micro and small enterprises 12.74 10.54Debt Securities 16 25,264.61 -Borrowings (Other than Debt Securities) 17 25,000.00 -Other financial liabilities 18 2,815.43 2,610.99
59,472.94 10,534.24Non-financial liabilities
Current tax liabilities (net) 19 9.46 57.84Provisions 20 4,014.46 3,126.19Other non-financial liabilities 21 2,174.83 2,741.50
6,198.75 5,925.53Equity
Equity share capital 22 107,954.60 107,954.60Other equity 23 486,938.66 310,430.39
Total equity 594,893.26 418,384.99
Total liabilities and equity 660,564.95 434,844.76
For and on behalf of the Board of Directors ofTata Industries LimitedCIN: U44003MH1945PLC004403
K. R. S. Jamwal F. N. SubedarExecutive Director DirectorDIN: 03129908 DIN: 00028428
S. SriramChief Financial Officer& Company SecretaryCS Membership Number: A10083
As per our repor t of even date attachedFor B S R & Co. LLPChartered AccountantsFirm’s Registration Number: 101248W/W-100022
Rekha ShenoyPartnerMembership Number: 124219
Place : MumbaiDate : 29th April, 2021
Significant accounting policies 1-3
Notes to the Standalone Financial Statements 4-54
The notes are an integral par t of these Standalone Financial Statements

61
STANDALONE STATEMENT OF PROFIT AND LOSS FOR THE YEAR ENDED 31 MARCH 2021
(Currency: Indian rupees in lakhs)Note For the year ended For the year ended
31 March 2021 31 March 2020
For and on behalf of the Board of Directors ofTata Industries LimitedCIN: U44003MH1945PLC004403
K. R. S. Jamwal F. N. SubedarExecutive Director DirectorDIN: 03129908 DIN: 00028428
S. SriramChief Financial Officer& Company SecretaryCS Membership Number: A10083
As per our repor t of even date attachedFor B S R & Co. LLPChartered AccountantsFirm’s Registration Number: 101248W/W-100022
Rekha ShenoyPartnerMembership Number: 124219
Place : MumbaiDate : 29th April, 2021
Significant accounting policies 1-3
Notes to the Standalone Financial Statements 4-54
The notes are an integral par t of these Standalone Financial Statements
A. Continuing operations
Revenue from operations
Interest income 24 2,573.52 1,210.74Dividend income 25 432.41 1,918.43
Net gain on fair value changes 26 1,198.63 2,644.75
Sale of products 27 8,813.15 8,171.51Sale of services 28 12,413.08 14,005.92
Other income 29 533.46 118.72
Total income 25,964.25 28,070.07
Expenses
Finance costs 30 1,256.74 888.16Purchases of stock-in-trade 31 8,559.08 7,247.70
Changes in inventories of stock-in-trade 32 (82.42) (147.13)
Employee benefits expenses 33 12,819.71 11,988.85Depreciation, impairment and amor tisation 12 - 13 4,294.94 3,746.09
Other expenses 34 5,957.00 7,829.11
Total expenses 32,805.05 31,552.78
Profit / (loss) for the year from continuing operations before tax (6,840.80) (3,482.71)
Tax expense of continuing operations
- Current tax - -- Deferred tax - -
- Shor t/(Excess) provision of tax for earlier years (252.53) -
Profit / (loss) for the year from continuing operations after tax (6,588.27) (3,482.71)
B. Discontinued operations / Disposal of asset held for sale
Profit for the year from discontinued operations / disposal of asset held for sale before tax - 32,784.80
Less: Tax expense of discontinued operations / disposal of asset held for sale - -
Profit for the year from discontinued operations after tax / disposal
of asset held for sale - 32,784.80
C. Profit / (loss) for the year (A + B) (6,588.27) 29,302.09
D. Other comprehensive income (‘OCI’)
(I) Items that will not be reclassified to profit or loss:
- Changes in fair value of investments in equities 182,715.55 (81,507.39)carried at fair value through OCI
- Remeasurement of defined employee benefit plans (182.09) (146.43)
Other comprehensive income 182,533.46 (81,653.82)
E. Total comprehensive income for the year (C + D) 175,945.19 (52,351.73)
F. Earnings per equity share from continuing operations (face value of Rs. 100 each)
Basic and diluted (in Rs.) (6.10) (3.23)
G. Earnings per equity share from discontinued operations / disposal of asset
held for sale (face value of Rs. 100 each)
Basic and diluted (in Rs.) - 30.37
H. Earnings per equity share from continuing and discontinued operations / disposal of
asset held for sale (face value of Rs. 100 each)Basic and diluted (in Rs.) (6.10) 27.14

INDUSTRIES
Seventyseventh annual report
Tata Industries Limited
62
STANDALONE CASH FLOW STATEMENT FOR THE YEAR ENDED 31 MARCH 2021
(Currency: Indian rupees in lakhs)
PARTICULARSFor the year ended
31 March 2021 31 March 2020
A. Cash flows from operating activitiesProfit / (Loss) before tax from continuing operations (6,840.80) (3,482.71)
Profit before tax from discontinued operation - (6,840.80) 32,784.80 29,302.09
Adjustments:Depreciation, impairment and amortisation 4,294.94 3,746.09(Profit) / Loss on sale/write off of Property,plant and equipment (net) (2.92) 0.18(Profit) / Loss on sale of assets held for sale - (3.68)Impairment charge on Property, plant and equipment - 169.00Provision for doubtful debts / advances made (net) 520.85 431.83Provision for unbilled revenue 4.29 (35.10)Interest income on unwinding of financial assetsat amortised cost (208.89) (185.67)Fair value gain on investmentsin preference shares (net) (227.75) (116.69)Fair value (gain)/loss on investment in mutual funds 1,069.55 (1,061.91)Lease Payments (2,470.15) (2,101.38)Provision for onerous lease rentals written back (net) - (1.42)Provision for standard assetsprovided / (written back)(net) 151.07 (7.34)Finance costs - Interest on borrowings 684.68 507.94Credit / sundry balances written back (1.24) (97.26)Impairment provision as per RBI guidelines 563.08 324.04(Profit)/ Loss on sale of long term investments (0.68) (32,784.80)Profit on sale of current investments (2,040.43) (1,466.15)Interest on Income Tax Refund (411.35) -
1,925.05 (32,682.32)
Operating cash flowbefore working capital changes (4,915.75) (3,380.23)(Increase) / decrease in trade and other receivables (3,198.31) (2,317.27)(Increase) / decrease in inventories (82.42) (147.13)(Increase) / decrease in loans, other financial assetsand other non-financial assets (655.98) (227.95)Increase / (decrease) in trade payables, otherfinancial liabilities and other non-financial liabilities 199.28 (3,737.43) 1,176.29 (1,516.06)
Cash used in operations (8,653.18) (4,896.29)
Direct taxes received /(paid) 3,675.50 32,952.51
Net cash flow generated / (used in)operating activities (4,977.68) 28,056.22
B. Cash flows from Investing activitiesPurchase of Property, plant and equipment (3,516.68) (2,388.91)
Sale of Property, plant and equipment 5.93 1.18Purchase of investment in subsidiaries (12,000.00) (18,500.00)Purchase of investment in Joint Venture (3,153.85) (32,202.54)
Buy back of share of Associates 174.70 -Inter Corporate Deposits to Joint Venture /Subsidiary Company (36,700.00) 2,500.00
Purchase of investments in other companies (1,888.26) -Sale of investments in subsidiaries - 63,757.00Sale of investments in other companies 0.68 -
Sale of Assets held for sale - 6.09Sale / (purchase) of current investments (net) 12,351.59 (31,499.55)

63
STANDALONE CASH FLOW STATEMENT FOR THE YEAR ENDED 31 MARCH 2021
(Continued)(Currency: Indian rupees in lakhs)
PARTICULARSFor the year ended
31 March 2021 31 March 2020
Bank balances not considered as cash andcash equivalents (2.61) 136.15
Net cash flow used in investing activities (44,728.50) (18,190.58)
C. Cash flows from financing activities
(Repayment) of / proceeds fromshort term borrowings (net) 50,000.00 (10,000.00)
Repayment of Interest cost (228.12) -
Other borrowing cost paid (158.39) (2.40)
Net cash flow (used in) / generatedfrom financing activities 49,613.48 (10,002.40)
Net increase / (decrease) in cashand cash equivalents (A+B+C) (92.70) (136.76)
Cash and cash equivalents as at thebeginning of the year (see note 4) 817.91 954.67
Cash and cash equivalents as at end of the year 725.21 817.91(see note 4)
Notes to cash flow statement31 March 2021 31 March 2020
1. Components of cash and cash equivalents:(a) Cash on hand 1.12 1.77(b) Balances with banks
- In current accounts 724.09 816.14- In demand deposit accounts - -
725.21 817.91
2. Dividend earned and interest income has been considered as part of “Cash flow from operating activities” since theCompany is an Investment Company.
3. Direct taxes paid is treated as operating expenses and is not bifurcated between investing and financing activities.4. The fixed deposits placed as security deposit are not available for use by the Company and hence not considered
as cash and cash equivalents.5. Debt reconcilaition statement in accordance with Ind AS 7.
31 March 2021 31 March 2020Opening balance - 9,936.51Movement 50,000.00 (9,936.51)
Closing 50,000.00 -
For and on behalf of the Board of Directors ofTata Industries LimitedCIN: U44003MH1945PLC004403
K. R. S. Jamwal F. N. SubedarExecutive Director DirectorDIN: 03129908 DIN: 00028428
S. SriramChief Financial Officer& Company SecretaryCS Membership Number: A10083
As per our repor t of even date attachedFor B S R & Co. LLPChartered AccountantsFirm’s Registration Number: 101248W/W-100022
Rekha ShenoyPartnerMembership Number: 124219
Place : MumbaiDate : 29th April, 2021
Significant accounting policies 1-3
Notes to the Standalone Financial Statements 4-54
The notes are an integral par t of these Standalone Financial Statements

INDUSTRIES
Seventyseventh annual report
Tata Industries Limited
64
STA
TE
ME
NT
OF C
HA
NG
ES
IN
EQ
UIT
Y
for
the
ye
ar
en
de
d 3
1 M
arc
h 2
02
1
(Cu
rre
ncy:
Ind
ian
ru
pe
es i
n l
akh
s)
(b)
Oth
er
eq
uit
y
Par
ticu
lars
Rese
rves
and s
urp
lus
Item
s of
Oth
erco
mpr
ehen
sive
inco
me (
‘OC
I’)
Tota
l
Capit
al
rese
rves
Secu
riti
es
pre
miu
mA
mal
gam
atio
nre
serv
eR
ese
rve
fund
Genera
lre
serv
eR
eta
ined
earn
ings*
Equit
y in
stru
ments
thro
ugh O
CI
Bala
nce
as
at
1 A
pri
l 2020
174,5
22.5
460,4
80.0
12,4
98.7
650,1
99.2
2324.0
417,0
40.3
79,3
67.9
4(4
,002.4
9)
310,4
30.3
9
Pro
fit /
(Lo
ss)
for
the
year
--
--
--
(6,5
88.2
7)
-(6
,588.2
7)
Oth
er c
ompr
ehen
sive
inco
me
/ (l
oss)
(net
of
tax)
--
--
--
(182.0
9)
182,7
15.5
5182,5
33.4
6
Tota
l co
mpre
hensi
ve i
nco
me /
(lo
ss)
174,5
22.5
460,4
80.0
12,4
98.7
650,1
99.2
2324.0
417,0
40.3
72,5
97.5
8178,7
13.0
6486,3
75.5
8
Tran
sfer
to
Impa
irm
ent
rese
rve
--
--
563.0
8-
--
563.0
8Tr
ansf
er t
o R
eser
ve f
und
- un
der
sect
ion
45IC
of
the
Res
erve
Ban
k of
Ind
ia A
ct,
1934
--
--
--
--
-
Bala
nce
as
at
31 M
arc
h 2
021
174,5
22.5
460,4
80.0
12,4
98.7
650,1
99.2
2887.1
217,0
40.3
72,5
97.5
8178,7
13.0
6486,9
38.6
6
Bala
nce
as
at
1 A
pri
l 2019
174,5
22.5
460,4
80.0
12,4
98.7
644,3
38.8
0-
17,0
40.3
746,3
83.3
717,4
77.4
9362,7
41.3
5
Cha
nge
in o
peni
ng r
etai
ned
earn
ings
on im
plem
enta
tion
of Ind
AS
116
--
--
--
(283.2
6)
-(2
83.2
6)
Pro
fit /
(Lo
ss)
for
the
year
--
--
--
29,3
02.0
9-
29,3
02.0
9O
ther
com
preh
ensi
ve in
com
e /
(los
s)(n
et o
f ta
x)-
--
--
-(1
46.4
3)
(81,5
07.3
9)
(81,6
53.8
2)
Impa
ct o
f W
rite
-off
of
Equ
ity S
hare
s of
TTS
L#-
--
--
-(6
0,0
27.4
1)
60,0
27.4
1-
Tota
l co
mpre
hensi
ve i
nco
me /
(lo
ss)
174,5
22.5
460,4
80.0
12,4
98.7
644,3
38.8
0-
17,0
40.3
715,2
28.3
6(4
,002.4
9)
310,1
06.3
5
Tran
sfer
to
Impa
irm
ent
rese
rve
--
--
324.0
4-
--
324.0
4Tr
ansf
er t
o R
eser
ve f
und
- un
der
sect
ion
45IC
of
the
Res
erve
Ban
k of
Ind
ia A
ct,
1934
--
-5,8
60.4
2-
-(5
,860.4
2)
--
Bala
nce
as
at
31 M
arc
h 2
020
174,5
22.5
460,4
80.0
12,4
98.7
650,1
99.2
2324.0
417,0
40.3
79,3
67.9
4(4
,002.4
9)
310,4
30.3
9
Impair
ment
rese
rve
*In
clu
din
g r
emea
sure
men
t o
f net
def
ined
ben
efit p
lans
#D
uri
ng
the
pre
vio
us
year
Co
mp
any
has
wri
te-o
ff t
he
shar
es o
f Ta
ta T
eles
ervi
ces
Lim
ited
(T
TS
L).
(a)
Eq
uit
y s
hare
cap
ital
Part
icu
lars
31 M
arc
h 2
021
31
Marc
h 2
02
0
Bala
nce a
t th
e b
eg
inn
ing
of
the y
ear
1,0
7,9
54.6
01
,07
,95
4.6
0
Ch
an
ge
s in
th
e e
qu
ity s
hare
cap
ital d
uri
ng
th
e y
ear
--
Bala
nce a
t th
e e
nd
of
the y
ear
1,0
7,9
54.6
01
,07
,95
4.6
0

65
(b)
Oth
er
eq
uit
y (Continued)
No
tes:
1.
Ca
pit
al
rese
rve
Cap
ital
res
erve
is
cre
ated
on a
cco
unt
of
mer
ger
of
Ap
ex I
nve
stm
ents
(M
auri
tius)
Ho
ldin
g P
riva
te L
imited
.
2.
Se
curi
tie
s p
rem
ium
Sec
uri
ties
pre
miu
m i
s use
d t
o r
eco
rd t
he
pre
miu
m r
ecei
ved
on i
ssue
of
shar
es.
It i
s utilis
ed i
n a
cco
rdan
ce
with t
he
pro
visi
ons
of
the
Co
mp
anie
s A
ct,
20
13
(‘t
he
Act’
).
3.
Am
alg
am
ati
on
re
serv
e
Am
alg
amat
ion r
eser
ve i
s cre
ated
on a
cco
unt
of
amal
gam
atio
n o
f Ta
ta T
elev
entu
res
(Ho
ldin
gs)
Lim
ited
.
4.
Re
serv
e f
un
d
Res
erve
fund
is
cre
ated
und
er s
ectio
n 4
5IC
of
the
Res
erve
Ban
k o
f In
dia
Act,
19
34
.
5.
Genera
l re
serv
e
Gen
eral
res
erve
is
a fr
ee r
eser
ve w
hic
h i
s cre
ated
by
tran
sfer
ring
fund
s fr
om
ret
ained
ear
nin
g t
o m
eet
futu
re o
blig
atio
ns
or
pur
po
se.
6.
Re
tain
ed
ea
rnin
gs
Ret
ained
ear
nin
gs
are
the
pro
fits
/ (
loss
es)
that
the
Co
mp
any
has
ear
ned
till
dat
e, l
ess
any
tran
sfer
to
gen
eral
res
erve
, d
ivid
end
s o
r o
ther
dis
trib
utio
n p
aid
to
shar
eho
lder
s.
7.
Eq
uit
y in
stru
me
nts
th
rou
gh
OC
I
The
Co
mp
any
has
ele
cte
d t
o r
eco
gnis
e chan
ges
in t
he
fair
val
ue
of
cer
tain
inve
stm
ents
in e
quity
securi
ties
in o
ther
co
mp
rehen
sive
inco
me.
Thes
e chan
ges
are
accum
ula
ted
within
‘E
quity
inst
rum
ents
thro
ug
h O
CI’
. T
he
Co
mp
any
tran
sfer
s am
ounts
ther
efro
m t
o r
etai
ned
ear
nin
gs
when
the
rele
vant
equity
securi
ties
are
der
eco
gnis
ed.
8.
Imp
air
me
nt
rese
rve
Wher
e im
pai
rmen
t al
low
ance
(Exp
ecte
d c
redit l
oss
) under
Ind A
S i
s lo
wer
than
the
pro
visi
onin
g r
equir
ed u
nder
IR
AC
P g
uid
elin
es,
Co
mp
any
shal
l ap
pro
pri
ate
the
dif
fere
nce
fro
m t
hei
r net
pro
fit
or
loss
aft
er t
ax t
o a
sep
arat
e im
pai
rmen
t re
serv
e.
STA
TE
ME
NT
OF C
HA
NG
ES
IN
EQ
UIT
Y (C
on
tin
ue
d)
for
the
ye
ar
en
de
d 3
1 M
arc
h 2
02
1
(Cu
rre
ncy:
Ind
ian
ru
pe
es i
n l
akh
s)
For
and
on b
ehal
f o
f th
e B
oar
d o
f D
irec
tors
of
Tata
In
du
stri
es
Lim
ite
dC
IN:
U4
40
03
MH
19
45
PL
C0
04
40
3
K.
R.
S.
Jam
wal
F. N
. S
ubedar
Exe
cuti
ve D
irecto
rD
irecto
rD
IN:
03
12
99
08
DIN
: 0
00
28
42
8
S.
Sri
ram
Chie
f Fi
nan
cia
l O
ffic
er
& C
om
pan
y S
ecre
tary
CS
Mem
ber
ship
Num
ber
: A
10
08
3
As
per
our
rep
ort
of
even
dat
e at
tach
edFo
r B
S R
& C
o.
LL
PC
har
tere
d A
ccounta
nts
Firm
’s R
egis
trat
ion N
um
ber
: 1
01
24
8W
/W-1
00
02
2
Rekh
a S
henoy
Par
tner
Mem
ber
ship
Num
ber
: 1
24
21
9
Pla
ce
:M
um
bai
Dat
e:
29
th A
pri
l, 2
02
1
Sig
nif
ica
nt
acc
ou
nti
ng
po
lici
es
1-3
No
tes
to t
he
Sta
nd
alo
ne
Fin
an
cia
l S
tate
me
nts
4-5
4
The
note
s ar
e an
int
egra
l par
t of
thes
e S
tand
alone
Fin
anci
al S
tate
men
ts

INDUSTRIES
Seventyseventh annual report
Tata Industries Limited
66
NOTES TO STANDALONE FINANCIAL STATEMENTS
as at and for the year ended 31 March 2021
1. Background
Tata Industries Limited (‘TIL’) was incorporated on April 7, 1945 at Mumbai under the
Companies Act, VII of 1913 and has been carrying on the business of an investment
holding company engaged in the incubation / promotion of new business ventures.
From April 2012 onwards, TIL is categorised as a Core Investment Company (‘CIC’) by
the Reserve Bank of India (‘RBI’) on account of its investments being made prominently
in other Tata companies. Earlier, it was registered with RBI as a Non-Banking Financial
Company.
Besides carrying out investment activities from Head office, TIL has four operating
divisions engaged into management consultancy, digital classroom solutions, digital
health business and data analytics business.
The Board of Directors approved the standalone financial statements for the year ended
31 March 2021 and authorised for issue on 29 April 2021.
2. Summary of statement of compliance, basis of preparation and presentation, critical
accounting estimates, assumptions and judgements
A. Statement of compliance
These Standalone Financial Statements have been prepared in accordance with
Indian Accounting Standards notified under Section 133 of the Companies Act,
2013 (the Act) read with Companies (Indian Accounting Standards) Rules as
amended from time to time, other relevant provisions of the Act and the Prudential
norms directions issued by the Reserve Bank of India as applicable to Core
Investment Companies.
B. Functional and presentation currency
These Standalone financial statements are presented in Indian Rupees (INR), which
is also Company’s functional currency. All amounts have been rounded-off to the
nearest lakhs, unless otherwise indicated.
C. Basis of preparation
The standalone financial statements have been prepared on the historical cost
basis, except for certain financial instruments and defined benefit plans which are
measured at fair value at the end of each reporting period. Historical cost is
generally based on the fair value of the consideration given in exchange for goods
and services. Fair value is the price that would be received to sell an asset or paid
to transfer a liability in an orderly transaction between market participants at the
measurement date.

67
NOTES TO STANDALONE FINANCIAL STATEMENTS
as at and for the year ended 31 March 2021
D. Use of estimates and judgements
The preparation of standalone financial statements in conformity with Ind AS
requires management to make judgments, estimates and assumptions, that affect
the application of accounting policies and the reported amounts of assets, liabilities
and disclosures of contingent assets and liabilities at the date of these Ind AS
standalone financial statements and the reported amounts of revenues and
expenses for the periods presented. Actual results may differ from these estimates.
Estimates and underlying assumptions are reviewed at each balance sheet date.
Revisions to accounting estimates are recognised in the period in which the
estimate is revised and future periods affected.
The estimates and assumptions that have a significant risk of causing a material
adjustment to the carrying values of assets and liabilities within the next financial
year are discussed below:
(i) Useful lives of property, plant and equipment and intangible assets
Determination is done to evaluate the estimated useful lives of tangible assets
and also assessment as to which components of the cost may be capitalised.
Useful lives of tangible assets are based on the life prescribed in Schedule
II of the Companies Act, 2013. In cases, where the useful lives are different
from that prescribed in Schedule II, they are based on technical advice,
considering the nature of the asset, the estimated usage of the asset, the
operating conditions of the asset, past history of replacement, anticipated
technological changes, manufacturers’ warranties and maintenance support.
Assumptions are also made, when the Company assesses whether an asset
may be capitalised and which components of the cost of the asset may be
capitalised.
(ii) Recognition and measurement of defined benefit obligations
The obligation arising from defined benefit plan and other long-term
employment benefits is determined based on actuarial assumptions. Key
actuarial assumptions include discount rate, trends in salary escalation and
vested future benefits and life expectancy. The discount rate is determined
by reference to market yields at the end of the reporting period on
government bonds. The period to maturity of the underlying bonds
correspond to the probable maturity of the post-employment benefit
obligations.
2. Summary of statement of compliance, basis of preparation and presentation, critical
accounting estimates, assumptions and judgements (Continued)

INDUSTRIES
Seventyseventh annual report
Tata Industries Limited
68
NOTES TO STANDALONE FINANCIAL STATEMENTS
as at and for the year ended 31 March 2021
(iii) Recognition of deferred tax assets
Significant management judgment is required to determine the amount of
deferred tax assets that can be recognised, based upon the likely timing
and the level of future taxable profits.
The amount of total deferred tax assets could change if estimates of projected
future taxable income or if tax regulations undergo a change.
(iv) Revenue recognition
The Company uses the percentage-of-completion method in accounting for
its fixed-price contracts. Use of the percentage-of-completion method
requires the Company to estimate the efforts or costs expended to date as
a proportion of the total efforts or costs to be expended. Efforts or costs
expended have been used to measure progress towards completion as there
is a direct relationship between input and productivity.
Provisions for estimated losses, if any, on uncompleted contracts are
recorded in the period in which such losses become probable based on the
expected contract estimates at the reporting date.
(v) Impairment of trade receivables
The Company reviews its trade receivables to assess impairment at regular
intervals. The Company’s credit risk is primarily attributable to its trade
receivables. In determining whether impairment losses should be reported
in the statement of profit and loss, the Company makes judgments as to
whether there is any observable data indicating that there is a measurable
decrease in the estimated future cash flows. Accordingly, an allowance for
expected credit loss is made where there is an identified loss event or
condition which, based on previous experience, is evidence of a reduction
in the recoverability of the cash flows.
(vi) Impairment losses on investments
The Company reviews its carrying value of investments carried at amortised
cost annually, or more frequently when there is indication for impairment.
If the recoverable amount is less than its carrying amount, the impairment
loss is accounted for.
2. Summary of statement of compliance, basis of preparation and presentation, critical
accounting estimates, assumptions and judgements (Continued)
D. Use of estimates and judgements (Continued)

69
NOTES TO STANDALONE FINANCIAL STATEMENTS
as at and for the year ended 31 March 2021
E. Measurement of fair values
The Company’s accounting policies and disclosures require the measurement of
fair values, for both financial and non-financial assets and liabilities.
The Company has an established control framework with respect to the
measurement of fair values, which includes overseeing all significant fair value
measurement, including Level 3 fair values by the management. The management
regularly reviews significant unobservable inputs and valuation adjustments. If
third party information, such as broker quotes or pricing services is used to measure
fair values, then the management assesses the evidence obtained from the third
parties to support the conclusion that such valuations meet the requirements of
Ind AS, including the level in the fair value hierarchy in which such valuations
should be classified.
When measuring the fair value of a financial asset or a financial liability, the
Company uses observable market data as far as possible. Fair values are
categorised into different levels in a fair value hierarchy based on the inputs used
in the valuation techniques as follows:
Level 1: quoted prices (unadjusted) in active markets for identical assets or
liabilities.
Level 2: inputs other than quoted prices included in Level 1 that are observable
for the asset or liability, either directly (i.e. as prices) or indirectly (i.e. derived
from prices).
Level 3: inputs for the asset or liability that are not based on observable market
data (unobservable inputs).
If the inputs used to measure the fair value of an asset or a liability fall into different
levels of the fair value hierarchy, then the fair value measurement is categorised
in its entirety in the same level of the fair value hierarchy as the lowest level input
that is significant to the entire measurement. The Company recognises transfers
between levels of the fair value hierarchy at the end of the reporting period during
which the change has occurred.
3. Significant accounting polices
A. Foreign currency translation
On initial recognition, all foreign currency transactions are translated into the
functional currency using the exchange rates prevailing on the date of the
transaction. As at the reporting date, foreign currency monetary assets and liabilities
are translated at the exchange rate prevailing on the Balance Sheet date and the
exchange gains or losses are recognised in the Statement of Profit and Loss.
2. Summary of statement of compliance, basis of preparation and presentation, critical
accounting estimates, assumptions and judgements (Continued)

INDUSTRIES
Seventyseventh annual report
Tata Industries Limited
70
NOTES TO STANDALONE FINANCIAL STATEMENTS
as at and for the year ended 31 March 2021
3. Significant accounting policies (Continued)
B. Financial instruments
(i) Investments and other financial assets
Classification
The Company classifies its financial assets in the following measurement
categories:
i) those to be measured subsequently at fair value (either through other
comprehensive income (‘OCI’), or through profit and loss), and
ii) those measured at amortised cost
The classification depends on the entity’s business model for
managing the financial assets and the contractual terms of the cash
flows. For assets measured at fair value, gains and losses will either
be recorded in statement of profit and loss or OCI. For investments
in debt instruments, this will depend on the business model in which
the investment is held. For investment in equity instruments, this will
depend on whether the Company has made an irrevocable election
at the time of initial recognition to account for the equity investment
at fair value through OCI.
The Company reclassifies debt investments when and only when its
business model for managing those assets changes.
Debt instruments
At initial recognition, the Company measures a financial asset at its
fair value plus, in the case of a financial asset not at fair value through
profit or loss, transaction costs that are directly attributable to the
acquisition of the financial asset. Transaction costs of financial assets
carried at fair value through profit or loss are expensed in profit or
loss. Subsequent measurement of debt instruments depends on the
Company’s business model for managing the asset and the cash flow
characteristics of the asset. There are three measurement categories
into which the Company classifies its debt instruments:
Amortised cost
Assets that are held for collection of contractual cash flows where
those cash flows represent solely payments of principal and interest
are measured at amortised cost. A gain or loss on a debt investment
that is subsequently measured at amortised cost and is not part of a
hedging relationship is recognised in profit or loss when the asset is
derecognised or impaired. Interest income from these financial assets
is included in finance income using the effective interest rate method.

71
NOTES TO STANDALONE FINANCIAL STATEMENTS
as at and for the year ended 31 March 2021
3. Significant accounting policies (Continued)
B. Financial instruments (Continued)
(i) Investments and other financial assets (Continued)
Fair value through other comprehensive income (‘FVTOCI’)
Assets that are held for collection of contractual cash flows and for
selling the financial assets, where the assets’ cash flows represent
solely payments of principal and interest, are measured at fair value
through other comprehensive income (‘FVTOCI’).
Movements in the carrying amount are taken through OCI, except for
the recognition of impairment gains or losses, interest revenue and
foreign exchange gains or losses which are recognised in Statement
of Profit and Loss. When the financial asset is derecognised, the
cumulative gain or loss previously recognised in OCI is reclassified
from equity to profit or loss and recognised as gains/ (losses) within
other income or other expense. Interest income from these financial
assets is included in other income using the effective interest rate
method.
Fair value through profit or loss (‘FVTPL’)
Assets that do not meet the criteria for amortised cost or FVTOCI are
measured at fair value through profit or loss. A gain or loss on a debt
investment that is subsequently measured at FVTPL and is not part
of a hedging relationship is recognised in profit or loss and presented
net in the Statement of Profit and Loss as gains/(losses) within other
income or other expense in the period in which it arises. Interest
income from these financial assets is included in other income.
Equity instruments
The Company subsequently measures all equity investments at fair
value. Where the Company’s management has elected to present fair
value gains and losses on equity investments in OCI, there is no
subsequent reclassification of fair value gains and losses to the
Statement of Profit and Loss. Dividends from such investments are
recognised in the Statement of Profit and Loss as Other Income when
the Company’s right to receive payments is established. Changes in
the fair value of financial assets at FVTPL are recognised as gains/
(losses) in the Statement of Profit and Loss. Impairment losses (and
reversal of impairment losses) on equity investments measured at
FVTOCI are not reported separately from other changes in fair value.

INDUSTRIES
Seventyseventh annual report
Tata Industries Limited
72
NOTES TO STANDALONE FINANCIAL STATEMENTS
as at and for the year ended 31 March 2021
3. Significant accounting policies (Continued)
B. Financial instruments (Continued)
(i) Investments and other financial assets (Continued)
Cash and cash equivalents
The Company considers all highly liquid financial instruments, which
are readily convertible into known amounts of cash that are subject
to an insignificant risk of change in value and having original maturities
of three months or less from the date of purchase, to be cash
equivalents. Cash and cash equivalents consist of balances with banks
which are unrestricted for withdrawal and usage.
De-recognition of financial assets
A financial asset is derecognised only when the Company
• has transferred the rights to receive cash flows from the financial
asset; or
• retains the contractual rights to receive the cash flows of the
financial assets but assumes a contractual obligation to pay the
cash flows to one or more recipients.
Where the Company transfers an asset, it evaluates whether it has
transferred substantially all risks and rewards of ownership of the
financial asset. Where the Company has transferred substantially all
risks and rewards of ownership, the financial asset is derecognised.
Where the Company has not transferred substantially all risks and
rewards of ownership of the financial asset, the financial asset is not
derecognised. Where the Company has neither transferred a financial
asset nor retained substantially all risks and rewards of ownership of
the financial asset, the financial asset is derecognised if the Company
has not retained control of the financial asset.
Where the Company retains control of the financial asset, the asset
is continued to be recognised to the extent of continuing involvement
in the financial asset.
(ii) Debt and equity instruments (liabilities)
Debt and equity instruments are classified as either financial liabilities or as
equity in accordance with the substance of the contractual arrangement.
An equity instrument is any contract that evidences a residual interest in the
assets of an entity after deducting all of its liabilities. Equity instruments
issued by the Company are recorded at the proceeds received, net of direct
issue costs.

73
NOTES TO STANDALONE FINANCIAL STATEMENTS
as at and for the year ended 31 March 2021
(iii) Financial liabilities
The Company’s financial liabilities comprise borrowings, trade payables and
other liabilities. These are initially measured at fair value, net of transaction
costs, and are subsequently measured at amortised cost using the effective
interest method.
The effective interest method is a method of calculating the amortised cost
of a financial liability and of allocating interest expense over the relevant
period. The effective interest rate is the rate that exactly discounts estimated
future cash payments through the expected life of the financial liability, or,
where appropriate, a shorter period.
Changes to the carrying amount of a financial liability as a result of
renegotiation or modification of terms that do not result in derecognition of
the financial liability, is recognised in the Statement of Profit and Loss.
De-recognition of financial liabilities
The Company derecognises financial liabilities when, and only when, its
obligations are discharged, cancelled or they expire.
(iv) Derivative financial instruments and hedge accounting
The Company holds derivative financial instruments to hedge its foreign
currency exposures. Derivative instruments are initially measured at fair
value. Subsequent to initial recognition, derivatives are measured at fair
value and changes therein are generally recognised in profit and loss.
The Company designates certain derivatives as hedging instruments to
hedge the variability in cash flows associated with highly probable forecast
transactions arising from changes in foreign exchange rates. At inception
of designated hedging relationships, the Company documents the risk
management objective and strategy for undertaking the hedge. The
Company also documents the economic relationship between hedged item
and hedging instrument, including whether the changes in cash flows of the
hedged item and the hedging instrument are expected to offset each other.
Cash Flow Hedge
When a derivative is designated as a cash flow hedging instrument, the
effective portion of the changes in the fair value of the derivatives is
recognised in OCI and accumulated in the other equity under ‘effective
3. Significant accounting policies (Continued)
B. Financial instruments (Continued)
INDUSTRIES
Seventyseventh annual report
Tata Industries Limited
74
NOTES TO STANDALONE FINANCIAL STATEMENTS
as at and for the year ended 31 March 2021
portion of cash flow hedges’. The effective portion of the changes in the fair
value of the derivative that is recognised in the OCI is limited to the cumulative
change in fair value of the hedge item, determined on a present value basis,
from the inception of the hedge. Any ineffective portion of the changes in
the fair value of the derivative is recognised immediately in profit and loss.
The amount accumulated in other equity is reclassified to profit and loss in
the same period or periods during which the hedged expected future cash
flows affect profit and loss.
If the hedge no longer meets the criteria for hedge accounting or the hedging
instrument is sold, expires, is terminated or is exercised, then the hedge
accounting is discontinued prospectively. When the hedge accounting for
cash flow hedges is discontinued, the amount that has been accumulated
in other equity is reclassified to profit and loss in the same period or periods
as the hedged expected future cash flows affect profit and loss.
If the hedged future cash flows are no longer expected to occur, then the
amounts that have been accumulated in other equity are immediately
reclassified in profit and loss.
(v) Financial guarantee contracts
The Company on a case to case basis elects to account for financial
guarantee contracts as a financial instrument or as an insurance contract,
as specified in Ind AS 109 on Financial Instruments and Ind AS 104 on
Insurance Contracts. The Company has regarded all its financial guarantee
contracts as insurance contracts. At the end of each reporting period the
Company performs a liability adequacy test, (i.e. it assesses the likelihood
of a pay-out based on current undiscounted estimates of future cash flows),
and any deficiency is recognized in profit or loss.
(vi) Offsetting of financial instruments
Financial assets and financial liabilities are offset when it currently has a
legally enforceable right (not contingent on future events) to off-set the
recognised amounts and the Company intends either to settle on a net basis,
or to realise the assets and settle the liabilities simultaneously.
3. Significant accounting policies (Continued)
B. Financial instruments (Continued)
(iv) Derivative financial instruments and hedge accounting (Continued)
75
NOTES TO STANDALONE FINANCIAL STATEMENTS
as at and for the year ended 31 March 2021
C. Property, plant and equipment
Recognition and measurement
All items of property, plant and equipment are stated at their historical cost of
acquisition or construction less accumulated depreciation and accumulated
impairment losses if any. Historical cost includes expenditure that is directly
attributable to the acquisition of the items.
Subsequent costs are included in the asset’s carrying amount or recognised as
a separate asset, as appropriate, only when it is probable that future economic
benefits associated with the item will flow to the Company and the cost of the item
can be measured reliably. The carrying amount of any component accounted for
as a separate asset is derecognised when replaced. All other repairs and
maintenance are charged to statement of profit and loss during the reporting period
in which they are incurred.
The cost of a self-constructed item of property, plant and equipment comprises
the cost of materials and direct labor, any other costs directly attributable to bringing
the item to working condition for its intended use, and estimated costs of
dismantling and removing the item and restoring the site on which it is located.
Any gain or loss on disposal of an item of property, plant and equipment is
recognised in profit or loss.
Assets in the course of construction are capitalized in capital work in progress
account. At the point when an asset is capable of operating in the manner intended
by management, the cost of construction is transferred to the appropriate category
of property, plant and equipment. Costs associated with the commissioning of an
asset are capitalised until the period of commissioning has been completed and
the asset is ready for its intended use.
Depreciation on tangible fixed assets of the Company has been provided on
Straight Line Method (SLM), considering the useful lives and residual value
prescribed in Schedule II of the Companies Act, 2013 except in respect of the
following categories of assets, in whose case the life of the assets has been
assessed as under based on technical advice, taking into account the nature of
the asset, the estimated usage of the asset, the operating conditions of the asset,
past history of replacement, anticipated technological changes, manufacturers
warranties and maintenance support:
3. Significant accounting policies (Continued)

INDUSTRIES
Seventyseventh annual report
Tata Industries Limited
76
NOTES TO STANDALONE FINANCIAL STATEMENTS
as at and for the year ended 31 March 2021
3. Significant accounting policies (Continued)
C. Property, plant and equipment (Continued)
Assets Useful life
Mobile phones 2 / 3 years
Medical demo devices 3 years
ClassEdge implementation and installation Over the period of
expenses and assets deployed at schools licensing contract
Leasehold improvements Period of Lease
Depreciation
D. Intangible assets
Recognition and measurement
Intangible assets are measured at historical cost. All the intangible assets have
a finite useful life and are subsequently carried at cost less accumulated
amortisation and impairment losses, if any.
Amortisation
Intangible assets are amortised over their estimated useful life on straight line
basis as follows:
Assets Amortisation
SAP Software Four years
ClassEdge Content Ten years
(Internally generated)
ClassEdge Content – Technological Five years
upgrades / Value Education Content
(Internally generated)
Digital Content Videos Over the expected pattern of
(Internally generated) consumption of economic benefit
over a period of five years
Licensed Content Over the licencing
contract period
PlanEdge and TestEdge platforms Over the balance period to expiry
of ClassEdge content amortisation.
Digital Health Platform Three years
and Analytics Software
Licenses, software (other than SAP) One - Ten years
and right to use third party systems etc.

77
NOTES TO STANDALONE FINANCIAL STATEMENTS
as at and for the year ended 31 March 2021
Research and development expenses
Revenue expenses pertaining to research is charged to the standalone statement
of profit and loss. Development cost of products are also charged to standalone
statement of profit and loss unless a product’s technical feasibility has been
established, in which case such expenditure is capitalized. The amount capitalized
comprises expenditure that can be directly attributed or allocated on a reasonable
and consistent basis to creating, producing and making the asset ready for its
intended use. Property, plant and equipment utilized for research and development
are capitalized and depreciated in accordance with the policies stated for the
property, plant and equipment.
E. Inventories
Stock-in-trade is valued at cost and net realisable value whichever is lower. Net
realisable value is the estimated selling price in the ordinary course of business
less the estimated costs of completion and the estimated costs necessary to make
the sale. Cost of traded goods is determined on First-in-First out (FIFO) basis and
includes the cost of purchases and other costs incurred in bringing the inventories
to their present location and condition. The comparison of cost and net realizable
value is made on an item by item basis. Provision is made for the cost of
obsolescence and other anticipated losses, whenever considered necessary.
F. Impairment
Impairment of financial instruments (other than at fair value)
The Company assesses on a forward-looking basis the expected credit loss
associated with its assets carried at amortised cost and FVTOCI debt instruments.
The impairment methodology applied depends on whether there has been a
significant increase in credit risk. For trade receivables only, the Company applies
the simplified approach permitted by Ind AS 109 - Financial Instruments, which
requires expected lifetime losses to be recognised from initial recognition of the
receivables.
Impairment of non-financial assets
The carrying values of assets / cash generating units at each Balance Sheet date
are reviewed to determine whether there is any indication that an asset may be
impaired. If any indication of such impairment exists, the recoverable amount of
such assets / cash generating unit is estimated and in case the carrying amount
of these assets exceeds their recoverable amount, an impairment is recognised.
3. Significant accounting policies (Continued)
D. Intangible assets (Continued)

INDUSTRIES
Seventyseventh annual report
Tata Industries Limited
78
NOTES TO STANDALONE FINANCIAL STATEMENTS
as at and for the year ended 31 March 2021
The recoverable amount is the higher of the net selling price and their value in
use. Value in use is arrived at by discounting the future cash flows to their present
value based on an appropriate discount factor. Assessment is also done at each
Balance Sheet date as to whether there is indication that an impairment loss
recognised for an asset in prior accounting periods no longer exists or may have
decreased, such reversal of impairment loss is recognised in the Statement of
Profit and Loss.
G. Non-current assets or disposal group held for sale
Non-current assets, or disposal groups comprising assets and liabilities are
classified as held for sale if it is highly probable that they will be recovered primarily
through sale rather than through continuing use.
Such assets, or disposal groups, are generally measured at the lower of their
carrying amount and fair value less costs to sell. Any resultant loss on a disposal
group is allocated first to goodwill, and then to remaining assets and liabilities on
pro rata basis, except that no loss is allocated to inventories, financial assets,
deferred tax assets, employee benefit assets, and biological assets, which continue
to be measured in accordance with the Company’s other accounting policies.
Losses on initial classification as held for sale and subsequent gains and losses
on re-measurement are recognised in profit or loss.
Once classified as held-for-sale, intangible assets, property, plant and equipment
and investment properties are no longer amortised or depreciated.
H. Employee benefits
Short-term employee benefits
All employee benefits payable wholly within twelve months of rendering the service
are classified as short-term employee benefits. These benefits include
compensated absences such as paid annual leave. The undiscounted amount of
short-term employee benefits expected to be paid in exchange for the services
rendered by employees is recognised during the year.
Defined Contribution plans
The Company makes monthly contributions to the Superannuation fund and
National pension scheme for all qualifying employees, until retirement or
resignation of the employee. The Company recognizes such contributions as an
expense when incurred. The Company has no further obligation beyond its monthly
contribution.
3. Significant accounting policies (Continued)
F. Impairment (Continued)

79
NOTES TO STANDALONE FINANCIAL STATEMENTS
as at and for the year ended 31 March 2021
Defined benefit plans
The Company operates the post-employment schemes such as Gratuity, Provident
fund and Post-retirement medical benefits (PRMB) and Pension to an ex-director
which are defined benefit plans.
The liability or asset recognised in the balance sheet in respect of defined benefit
plans is the present value of the defined benefit obligation at the end of the reporting
period less the fair value of plan assets. The defined benefit obligation is calculated
annually by actuaries using the projected unit credit method.
The actuarial valuation method, carried out by an independent actuary, used for
measuring the liability for provident Fund is Projected Accrued Benefit method.
This approach determines the present value of the interest rate guarantee to
employees. Provident fund trusts are treated as Defined Benefit Plans, since the
Company is obliged to meet interest shortfall, if any, with respect to covered
employees.
The present value of the defined benefit obligation is determined by discounting
the estimated future cash outflows by reference to market yields at the end of the
reporting period on government bonds that have terms approximating to the terms
of the related obligation.
The net interest cost is calculated by applying the discount rate to the net balance
of the defined benefit obligation and the fair value of the plan assets. This cost
is included in employee benefit expense in the statement of profit and loss.
Remeasurement gains and losses arising from experience adjustments and
changes in actuarial assumptions are recognised in the period in which they occur,
directly in the other comprehensive income.
Changes in the present value of the defined benefit obligation resulting from plan
amendments or enhancements are recognised in profit and loss as past service
cost.
Other long-term employee benefits
The liabilities for earned leave and sick leave are not expected to be settled wholly
after the end of the period in which the employees render the related services.
They are therefore measured at the present value of expected future payments to
be made in respect of services provided by employees up to the end of the reporting
period using the projected unit credit method. The benefits are discounted using
the market yields at the end of the reporting period that have terms approximating
3. Significant accounting policies (Continued)
H. Employee benefits (Continued)

INDUSTRIES
Seventyseventh annual report
Tata Industries Limited
80
NOTES TO STANDALONE FINANCIAL STATEMENTS
as at and for the year ended 31 March 2021
to the terms of the related obligation. Remeasurement as a result of experience
adjustments and changes in actuarial assumptions are recognised in statement
of profit and loss.
The obligations are presented as liabilities in the balance sheet after the reporting
period, regardless of when the actual settlement is expected to occur.
I. Revenue recognition
The Company has applied Ind AS 115 Revenue from Contracts with Customers
which establishes a comprehensive framework for determining whether, how much
and when revenue is to be recognised.
Revenue is recognized upon transfer of control of promised products or services
to customers in an amount that reflects the consideration expected to receive in
exchange for those products or services.
The core principle of Ind AS 115 is that an entity should recognise revenue to
depict the transfer of promised goods or services to customers in an amount that
reflects the consideration to which the entity expects to be entitled in exchange
for those goods or services. Specifically, the standard introduces a 5-step approach
to revenue recognition:
• Step 1 : Identify the contract(s) with a customer
• Step 2 : Identify the performance obligation in contract
• Step 3 : Determine the transaction price
• Step 4 : Allocate the transaction price to the performance obligations
in the contract
• Step 5 : Recognise revenue when (or as) the entity satisfies
a performance obligation
Under Ind AS 115, an entity recognises revenue when (or as) a performance
obligation is satisfied, i.e. when ‘control’ of the goods or services underlying the
particular performance obligation is transferred to the customer.
Rendering of services
In respect of contracts, other than ClassEdge license and support fees, revenue
on time-and-material contracts are recognized as the related services are
performed and revenue from the end of the last invoicing to the reporting date is
recognized as unbilled revenue. Revenue from fixed-price, fixed-timeframe
contracts, where the performance obligations are satisfied over time and where
there is no uncertainty as to measurement or collectability of consideration, is
3. Significant accounting policies (Continued)

81
NOTES TO STANDALONE FINANCIAL STATEMENTS
as at and for the year ended 31 March 2021
recognized as per the percentage-of-completion method. Efforts or costs expended
have been used to measure progress towards completion. Projected losses, if
any, are provided in entirety as per Ind AS based on management’s current
estimates of cost to completion arrived at on the basis of technical assessment
of time and effort required and estimates of future expenditure.
Revenue from licensing of ClassEdge content to schools is recognized, on a pro-
rata basis over the contract period, commensurate with the services rendered /
cost incurred for the same. The Company has applied the guidance in Ind AS 115
by applying the revenue recognition criteria for each distinct performance
obligation. The arrangements with customers generally meet the criteria for
considering equipment, software licenses and support services as distinct
performance obligations. The performance obligations are satisfied as and when
the services are rendered since the customer consumes the services as time
progresses.
Revenue is measured based on the transaction price, which is the consideration,
adjusted for volume discounts, service level credits, performance bonuses, price
concessions and incentives, if any, as specified in the contract with the customer.
Revenue also excludes taxes collected from customers.
Revenues in excess of invoicing are classified as contract assets (which are referred
to as unbilled revenue) while invoicing in excess of revenues are classified as
contract liabilities (which are referred to as unearned revenues).
Contract assets are recognised when there is excess of revenue earned over billings
on contracts. Contract assets are classified as unbilled receivables (only act of
invoicing is pending) when there is unconditional right to receive cash, and only
passage of time is required, as per contractual terms.
Unearned and deferred revenue (“contract liability”) is recognised when there are
billings in excess of revenues.
Sale of goods
Revenue from sale of goods is recognised on transfer of control over to the goods
to the customer. Sales are recorded net of returns (if any), trade discounts, rebates,
and goods and service tax.
Deferred contract costs are incremental costs of obtaining a customer contract.
Deferred contract costs are recognised as assets and amortized over the term of
the customer contract, except in case where the amortisation period is one year
or less, in which case the costs are expensed as and when incurred.
3. Significant accounting policies (Continued)
I. Revenue recognition (Continued)

INDUSTRIES
Seventyseventh annual report
Tata Industries Limited
82
NOTES TO STANDALONE FINANCIAL STATEMENTS
as at and for the year ended 31 March 2021
Interest income
Interest income from debt instruments is recognised using the effective interest
rate method. The effective interest rate is the rate that exactly discounts estimated
future cash receipts through the expected life of the financial asset to the gross
carrying amount of a financial asset. When calculating the effective interest rate,
the Company estimates the expected cash flows by considering all the contractual
terms of the financial instruments (for example, prepayment, extension) but does
not consider the expected credit loss.
Dividend income
Dividend income is recognised in profit or loss on the date on which the Company’s
right to receive payment is established.
J. Leases
A contract is, or contains, a lease if the contract conveys the right to control the
use of an identified asset for a period of time in exchange for consideration.
Company as a lessee
The Company accounts for each lease component within the contract as a lease
separately from non-lease components of the contract and allocates the
consideration in the contract to each lease component on the basis of the relative
stand-alone price of the lease component and the aggregate stand-alone price of
the non-lease components.
The Company recognises right-of-use asset representing its right to use the
underlying asset for the lease term at the lease commencement date. The cost
of the right-of-use asset measured at inception shall comprise of the amount of
the initial measurement of the lease liability adjusted for any lease payments made
at or before the commencement date less any lease incentives received, plus any
initial direct costs incurred and an estimate of costs to be incurred by the lessee
in dismantling and removing the underlying asset or restoring the underlying asset
or site on which it is located. The right-of-use assets is subsequently measured
at cost less any accumulated depreciation, accumulated impairment losses, if
any and adjusted for any remeasurement of the lease liability. The right-of-use
assets is depreciated using the straight-line method from the commencement date
over the shorter of lease term or useful life of right-of-use asset. The estimated
useful lives of right-of-use assets are determined on the same basis as those of
property, plant and equipment. Right-of-use assets are tested for impairment
3. Significant accounting policies (Continued)
I. Revenue recognition (Continued)

83
NOTES TO STANDALONE FINANCIAL STATEMENTS
as at and for the year ended 31 March 2021
whenever there is any indication that their carrying amounts may not be
recoverable. Impairment loss, if any, is recognised in the statement of profit and
loss.
The Company measures the lease liability at the present value of the lease
payments that are not paid at the commencement date of the lease. The lease
payments are discounted using the interest rate implicit in the lease, if that rate
can be readily determined. If that rate cannot be readily determined, the Company
uses incremental borrowing rate. For leases with reasonably similar characteristics,
the Company, on a lease by lease basis, may adopt either the incremental
borrowing rate specific to the lease or the incremental borrowing rate for the
portfolio as a whole. The lease payments shall include fixed payments, variable
lease payments, residual value guarantees, exercise price of a purchase option
where the Company is reasonably certain to exercise that option and payments
of penalties for terminating the lease, if the lease term reflects the lessee exercising
an option to terminate the lease.
The lease liability is subsequently remeasured by increasing the carrying amount
to reflect interest on the lease liability, reducing the carrying amount to reflect the
lease payments made and remeasuring the carrying amount to reflect any
reassessment or lease modifications or to reflect revised in-substance fixed lease
payments.
The Company recognises the amount of the re-measurement of lease liability as
an adjustment to the right-of-use asset. Where the carrying amount of the right-
of-use asset is reduced to zero and there is a further reduction in the measurement
of the lease liability, the Company recognises any remaining amount of the re-
measurement in statement of profit and loss.
The Company has elected not to apply the requirements of Ind AS 116 to short-
term leases of all assets that have a lease term of 12 months or less and leases
for which the underlying asset is of low value. The lease payments associated
with these leases are recognized as an expense on a straight-line basis over the
lease term.
Company as a lessor
At the inception of the lease the Company classifies each of its leases as either
an operating lease or a finance lease. The Company recognises lease payments
received under operating leases as income on a straight- line basis over the lease
term. In case of a finance lease, finance income is recognised over the lease term
3. Significant accounting policies (Continued)
J. Leases (Continued)

INDUSTRIES
Seventyseventh annual report
Tata Industries Limited
84
NOTES TO STANDALONE FINANCIAL STATEMENTS
as at and for the year ended 31 March 2021
based on a pattern reflecting a constant periodic rate of return on the lessor’s net
investment in the lease. When the Company is an intermediate lessor it accounts
for its interests in the head lease and the sub-lease separately. It assesses the
lease classification of a sub-lease with reference to the right-of-use asset arising
from the head lease, not with reference to the underlying asset. If a head lease
is a short term lease to which the Company applies the exemption described
above, then it classifies the sub-lease as an operating lease.
If an arrangement contains lease and non-lease components, the Company applies
Ind AS 115 Revenue to allocate the consideration in the contract.
Transition to Ind AS 116
Ministry of Corporate Affairs (“MCA”) through Companies (Indian Accounting
Standards) Amendment Rules, 2019 and Companies (Indian Accounting
Standards) Second Amendment Rules, has notified Ind AS 116 Leases which
replaces the existing lease standard, Ind AS 17 leases and other interpretations.
Ind AS 116 sets out the principles for the recognition, measurement, presentation
and disclosure of leases for both lessees and lessors. It introduces a single, on-
balance sheet lease accounting model for lessees.
The Company has adopted Ind AS 116, effective annual reporting period beginning
April 1, 2019 and applied the standard to its leases, retrospectively, with the
cumulative effect of initially applying the Standard, recognised on the date of initial
application (April 1, 2019). Accordingly, the Company has not restated comparative
information, instead, the cumulative effect of initially applying this standard has
been recognised as an adjustment to the opening balance of retained earnings
as on April 1, 2019.
The company has applied the Covid -19 related concession – amendment to Ind
AS 116. The amendment did not have any impact on the amounts recognized in
prior periods and will affect the current & future periods only.
K. Income Tax
Income tax comprises current and deferred tax. It is recognised in profit or loss
except to the extent that it relates to a business combination or to an item
recognised directly in equity or in other comprehensive income.
Current tax
Current tax comprises the expected tax payable or receivable on the taxable income
or loss for the year and any adjustment to the tax payable or receivable in respect
3. Significant accounting policies (Continued)
J. Leases (Continued)

85
NOTES TO STANDALONE FINANCIAL STATEMENTS
as at and for the year ended 31 March 2021
of previous years. The amount of current tax reflects the best estimate of the tax
amount expected to be paid or received after considering the uncertainty, if any,
related to income taxes. It is measured using tax rates (and tax laws) enacted or
substantively enacted by the reporting date.
Current tax assets and current tax liabilities are offset only if there is a legally
enforceable right to set off the recognised amounts, and it is intended to realise
the asset and settle the liability on a net basis or simultaneously.
Deferred tax
Deferred tax is recognised in respect of temporary differences between the carrying
amounts of assets and liabilities for financial reporting purposes and the
corresponding amounts used for taxation purposes. Deferred tax is also recognised
in respect of carried forward tax losses and tax credits. Deferred tax is not
recognised for:
• temporary differences arising on the initial recognition of assets or liabilities
in a transaction that is not a business combination and that affects neither
accounting nor taxable profit or loss at the time of the transaction;
a. temporary differences related to investments in subsidiaries, associates and
joint arrangements to the extent that the Company is able to control the
timing of the reversal of the temporary differences and it is probable that
they will not reverse in the foreseeable future; and
b. taxable temporary differences arising on the initial recognition of goodwill.
Deferred tax assets are recognised to the extent that it is probable that future
taxable profits will be available against which they can be used. The existence of
unused tax losses is strong evidence that future taxable profit may not be available.
Therefore, in case of a history of recent losses, the Company recognises a deferred
tax asset only to the extent that it has sufficient taxable temporary differences or
there is convincing other evidence that sufficient taxable profit will be available
against which such deferred tax asset can be realised. Deferred tax assets-
unrecognised or recognised, are reviewed at each reporting date and are
recognised/ reduced to the extent that it is probable/ no longer probable
respectively that the related tax benefit will be realised.
Deferred tax is measured at the tax rates that are expected to apply to the period
when the asset is realised or the liability is settled, based on the laws that have
been enacted or substantively enacted by the reporting date.
3. Significant accounting policies (Continued)
K. Income Tax (Continued)

INDUSTRIES
Seventyseventh annual report
Tata Industries Limited
86
NOTES TO STANDALONE FINANCIAL STATEMENTS
as at and for the year ended 31 March 2021
The measurement of deferred tax reflects the tax consequences that would follow
from the manner in which the Company expects, at the reporting date, to recover
or settle the carrying amount of its assets and liabilities.
Deferred tax assets and liabilities are offset if there is legally enforceable right to
offset current tax liabilities and assets, and they relate to income taxes levied by
the same tax authority on the same taxable entity, or on different tax entities, but
they intend to settle current tax liabilities and assets on a net basis or their tax
assets and liabilities will be realised simultaneously.
Tax benefits acquired as part of a business combination, but not satisfying the
criteria for separate recognition at that date, are recognised subsequently if new
information about facts and circumstances change. Acquired deferred tax benefits
recognised within the measurement period reduce goodwill related to that
acquisition if they result from new information obtained about facts and
circumstances existing at the acquisition date. If the carrying amount of goodwill
is zero, any remaining deferred tax benefits are recognised in OCI/ capital reserve
depending on the principle explained for bargain purchase gains. All other acquired
tax benefits realised are recognised in profit or loss.
Minimum Alternate Tax (MAT) credit is recognised as an asset only when and to
the extent there is convincing evidence that the Company will pay normal income
tax during the specified period. Such asset is reviewed at each Balance Sheet
date and the carrying amount of the MAT credit asset is written down to the extent
there is no longer a convincing evidence to the effect that the Company will pay
normal income tax during the specified period.
L. Discontinued Operations
A discontinued operation is a component of the Company’s business, the
operations and cash flows of which can be clearly distinguished from those of the
rest of the Company and which represents a separate major line of business or
geographical area of operations and
a. is part of a single coordinated plan to dispose of a separate major line of
business or geographic area of operations; or
b. is a subsidiary acquired exclusively with a view to re-sale.
Classification as a discontinued operation occurs upon disposal or when the
operation meets the criteria to be classified as held for sale, if earlier.
3. Significant accounting policies (Continued)
K. Income Tax (Continued)

87
NOTES TO STANDALONE FINANCIAL STATEMENTS
as at and for the year ended 31 March 2021
When an operation is classified as a discontinued operation, the comparative
statement of profit and loss is re-presented as if the operation had been
discontinued from the start of the comparative period.
M. Borrowing costs
Borrowing costs are interest and other costs (including exchange differences
relating to foreign currency borrowings to the extent that they are regarded as an
adjustment to interest costs) incurred in connection with the borrowing of funds.
Borrowing costs directly attributable to acquisition or construction of an asset
which necessarily take a substantial period of time to get ready for their intended
use are capitalised as part of the cost of that asset. Other borrowing costs are
recognised as an expense in the period in which they are incurred.
N. Operating Segments
An operating Segment is a component of the Company that engages in business
activities from which it may earn revenues and incur expenses, including revenues
and expenses that relates to transactions with any of Company’s other components,
and for which discrete financial information is available. All operating segments
operating results are reviewed regularly by the Company’s Board to make decisions
about resources to be allocated to the segment and assess their performance.
O. Earnings per share
Basic earnings per share is calculated by dividing the net profit or loss for the year
attributable to equity shareholders by the weighted average number of equity
shares outstanding during the year. For the purpose of calculating diluted earnings
per share, the net profit or loss for the period attributable to equity shareholders
and the weighted average number of shares outstanding during the period is
adjusted for the effects of all dilutive potential equity shares.
P. Business combinations
Business combinations under common control
Business combinations arising from transfers of interests in entities that are under
the common control are accounted in accordance with “Pooling of Interest Method”
laid down by Appendix C of Indian Accounting Standard 103 (Ind AS 103) Business
combinations of entities under common control, notified under the Companies
Act, 2013.
All assets, liabilities and reserves of the combining entity are recorded in the books
of account of the Company at their existing carrying amounts. Inter-company
balances are eliminated. The difference, between the investments held by the
3. Significant accounting policies (Continued)
L. Discontinued Operations (Continued)

INDUSTRIES
Seventyseventh annual report
Tata Industries Limited
88
NOTES TO STANDALONE FINANCIAL STATEMENTS
as at and for the year ended 31 March 2021
Company and all assets, liabilities and reserves of the combining entity are
recognised in capital reserve and presented separately from other capital reserves.
Comparative accounting period presented in the financial statements of the
Company has been restated for the accounting impact of the merger, as stated
above, as if the merger had occurred from the beginning of the comparative period
in the financial statements.
Any non-controlling interest in an acquiree is measured at fair value or as the non-
controlling interest’s proportionate share of the acquiree’s net identifiable assets.
This accounting choice is made on a transaction by transaction basis.
Business combinations not under common control
Business combinations except under common control are accounted for using
the acquisition method. The cost of an acquisition is measured as the aggregate
of the consideration transferred measured at acquisition date fair value and the
amount of any non-controlling interests in the acquiree. For each business
combination, the Company elects whether to measure the non-controlling interests
in the acquiree at fair value or at the proportionate share of the acquiree’s
identifiable net assets. Acquisition-related costs are expensed as incurred.
At the acquisition date, the identifiable assets acquired and the liabilities assumed
are recognised at their acquisition date fair values. For this purpose, the liabilities
assumed include contingent liabilities representing present obligation and they
are measured at their acquisition fair values irrespective of the fact that outflow
of resources embodying economic benefits is not probable.
When the Company acquires a business, it assesses the financial assets and
liabilities assumed for appropriate classification and designation in accordance
with the contractual terms, economic circumstances and pertinent conditions as
at the acquisition date. This includes the separation of embedded derivatives in
host contracts by the acquiree.
Any contingent consideration to be transferred by the acquirer is recognised at
fair value at the acquisition date. Contingent consideration classified as an asset
or liability that is a financial instrument and within the scope of Ind AS 109 Financial
Instruments, is measured at fair value with changes in fair value recognised in
profit or loss. If the contingent consideration is not within the scope of Ind AS 109,
it is measured in accordance with the appropriate Ind AS. Contingent consideration
that is classified as equity is not re-measured at subsequent reporting dates and
subsequent its settlement is accounted for within equity.
Goodwill is initially measured at cost, being the excess of the aggregate of the
consideration transferred and the amount recognised for non-controlling interests,
3. Significant accounting policies (Continued)
P. Business combinations (Continued)

89
NOTES TO STANDALONE FINANCIAL STATEMENTS
as at and for the year ended 31 March 2021
and any previous interest held, over the net identifiable assets acquired and
liabilities assumed. If the fair value of the net assets acquired is in excess of the
aggregate consideration transferred, the Company re-assesses whether it has
correctly identified all of the assets acquired and all of the liabilities assumed and
reviews the procedures used to measure the amounts to be recognised at the
acquisition date. If the reassessment still results in an excess of the fair value of
net assets acquired over the aggregate consideration transferred, then the gain
is recognised in OCI and accumulated in equity as capital reserve. However, if
there is no clear evidence of bargain purchase, the entity recognises the gain
directly in equity as capital reserve, without routing the same through OCI.
If the initial accounting for a business combination is incomplete by the end of the
reporting period in which the combination occurs, the Company reports provisional
amounts for the items for which the accounting is incomplete. Those provisional
amounts are adjusted through goodwill during the measurement period, or
additional assets or liabilities are recognised, to reflect new information obtained
about facts and circumstances that existed at the acquisition date that, if known,
would have affected the amounts recognised at that date. These adjustments are
called as measurement period adjustments. The measurement period does not
exceed one year from the acquisition date.
After initial recognition, goodwill is measured at cost less any accumulated
impairment losses. For the purpose of impairment testing, goodwill acquired in
a business combination is, from the acquisition date, allocated to each of the
Company’s cash-generating units that are expected to benefit from the
combination, irrespective of whether other assets or liabilities of the acquiree are
assigned to those units.
A cash generating unit to which goodwill has been allocated is tested for impairment
annually, or more frequently when there is an indication that the unit may be
impaired. If the recoverable amount of the cash generating unit is less than its
carrying amount, the impairment loss is allocated first to reduce the carrying
amount of any goodwill allocated to the unit and then to the other assets of the
unit pro rata based on the carrying amount of each asset in the unit. Any impairment
loss for goodwill is recognised in profit or loss. An impairment loss recognised for
goodwill is not reversed in subsequent periods.
Where goodwill has been allocated to a cash-generating unit and part of the
operation within that unit is disposed of, the goodwill associated with the disposed
operation is included in the carrying amount of the operation when determining
the gain or loss on disposal. Goodwill disposed in these circumstances is measured
based on the relative values of the disposed operation and the portion of the
cash-generating unit retained.
3. Significant accounting policies (Continued)
P. Business combinations (Continued)

INDUSTRIES
Seventyseventh annual report
Tata Industries Limited
90
NOTES TO STANDALONE FINANCIAL STATEMENTS
as at and for the year ended 31 March 2021
Q. Provisions and contingencies
A provision is recognised if, as a result of a past event, the Company has a present
legal or constructive obligation that can be estimated reliably, and it is probable
that an outflow of economic benefits will be required to settle the obligation.
Provisions are determined by discounting the expected future cash flows
(representing the best estimate of the expenditure required to settle the present
obligation at the balance sheet date) at a pre-tax rate that reflects current market
assessments of the time value of money and the risks specific to the liability. The
unwinding of the discount is recognised as finance cost. Expected future operating
losses are not provided for.
A contract is considered to be onerous when the expected economic benefits to
be derived by the Company from the contract are lower than the unavoidable cost
of meeting its obligations under the contract. The provision for an onerous contract
is measured at the present value of the lower of the expected cost of terminating
the contract and the expected net cost of continuing with the contract. Before
such a provision is made, the Company recognises any impairment loss on the
assets associated with that contract.
Contingent liabilities are disclosed when there is a possible obligation arising
from past events, the existence of which will be confirmed only by the occurrence
or non-occurrence of one or more uncertain future events not wholly within the
control of the Company or a present obligation that arises from past events where
it is either not probable that an outflow of resources will be required to settle or
a reliable estimate of the amount cannot be made.
Contingent assets are not disclosed in the financial statements unless an inflow
of economic benefits is probable.
R. Recent pronouncements
On March 24, 2021, the Ministry of Corporate Affairs (“MCA”) through a notification,
amended Schedule III of the Companies Act, 2013. The amendments revise Division
I, II and III of Schedule III and are applicable from April 1, 2021.
The amendments are extensive and the Company will evaluate the same to give
effect to them as required by law.
3. Significant accounting policies (Continued)

91
NOTES TO STANDALONE FINANCIAL STATEMENTS
as at and for the year ended 31 March 2021
(Currency: Indian rupees in lakhs)
4 Cash and cash equivalents
Cash on hand 1.12 1.77
Balances with banks
In current accounts 724.09 816.14
725.21 817.91
5 Bank balance other than cash
and cash equivalents
Bank deposits 43.42 40.81
(Fixed deposits placed with banks and statutory
authorities as securities against performance
guarantees issued / legal proceedings)
43.42 40.81
6 Receivables
Trade receivables
(a) Considered good- Secured - -
(b) Considered good- Unsecured 3,814.06 3,703.93
(c) Receivables which have significant
increase in Credit Risk; 2,868.26 2,347.41
Less: Allowance for impairment loss (2,868.26) (2,347.41)
(d) Receivables - credit impaired - -
Less: Allowance for impairment loss - -
3,814.06 3,703.93
Other receivables
(a) Considered good- Secured - -
(b) Considered good- Unsecured 3,267.13 699.80
(c) Receivables which have significant
increase in Credit Risk; - -
Less: Allowance for impairment loss - -
(d) Receivables - credit impaired - -
Less: Allowance for impairment loss - -
3,267.13 699.80
7 Loans
(Unsecured, considered good)
Loans to Others (in India)
- Loans to employees 0.78 1.85
- Inter Corporate Deposits to related party 36,700.00 -
(at amortised cost)
36,700.78 1.85
31 March 2021 31 March 2020

INDUSTRIES
Seventyseventh annual report
Tata Industries Limited
92
NOTES TO STANDALONE FINANCIAL STATEMENTS
as at and for the year ended 31 March 2021
(Currency: Indian rupees in lakhs)
Investments
Mutual funds - - 41,692.80 41,692.80 - 41,692.80
Debt securities
Subsidiaries 14,900.00 - - - - 14,900.00
Joint Venture - - 973.36 973.36 - 973.36
Associates - - - - - -
Others 1,716.49 - 0.06 0.06 - 1,716.55
Equity instruments
Subsidiaries - - - - 146,102.01 146,102.01
Joint Venture - - - - 104,908.99 104,908.99
Associates - - - - 11,187.98 11,187.98
Others (unquoted) - 15,228.62 - 15,228.62 - 15,228.62
Others (quoted) - 58,576.36 - 58,576.36 - 58,576.36
Deemed Investments - - 1,307.67 1,307.67 - 1,307.67
Total – Gross (A) 16,616.49 73,804.98 43,973.89 117,778.87 262,198.98 396,594.34
(i) Investments outside India - - - - 132,512.01 132,512.01
(ii) Investments in India 16,616.49 73,804.98 43,973.89 117,778.87 129,686.97 264,082.33
Total (B) 16,616.49 73,804.98 43,973.89 117,778.87 262,198.98 396,594.34
31 March 2020
Amortised
cost
At Fair Value
Sub-Total Others TotalThrough
OCI
(1) (2) (3) (4)=(2)+(3) (5) (6)=(1)+(4)+(5)
Through
profit or loss
8 Investments
Investments
Mutual funds - - 30,312.09 30,312.09 - 30,312.09
Debt securities
Subsidiaries 14,900.00 - - - - 14,900.00
Joint Venture - - 1,201.11 1,201.11 - 1,201.11
Others 1,879.38 - - - - 1,879.38
Equity instruments
Subsidiaries - - - - 158,102.01 158,102.01
Joint Venture - - - - 108,062.84 108,062.84
Associates - - - - 11,013.28 11,013.28
Others (unquoted) - 20,573.51 - 20,573.51 - 20,573.51
Others (quoted) - 237,847.44 - 237,847.44 - 237,847.44
Deemed Investments - - 1,307.67 1,307.67 - 1,307.67
Total – Gross (A) 16,779.38 258,420.95 32,820.87 291,241.82 277,178.13 585,199.33
(i) Investments outside India - - - - 132,512.01 132,512.01
(ii) Investments in India 16,779.38 258,420.95 32,820.87 291,241.82 144,666.12 452,687.32
Total (B) 16,779.38 258,420.95 32,820.87 291,241.82 277,178.13 585,199.33
31 March 2021
Amortised
cost
At Fair Value
Sub-Total Others TotalThrough
OCI
(1) (2) (3) (4)=(2)+(3) (5) (6)=(1)+(4)+(5)
Through
profit or loss

93
NOTES TO STANDALONE FINANCIAL STATEMENTS
as at and for the year ended 31 March 2021
(Currency: Indian rupees in lakhs)
31 March 2021 31 March 2020
9 Other financial assets
Security deposits 1,024.05 970.03
Less: Impairment loss allowance - -
1,024.05 970.03
Interest accrued on fixed deposits 0.18 0.26
Other receivables 198.96 51.55
1,223.19 1,021.84
10 Inventories
(At lower of cost and net realisable value)
Stock-in-trade - -
- Medicines, food and nutritional items 74.87 60.61
- Equipments 351.82 283.66
426.69 344.27
11 Non current tax assets (net)
Taxes paid [net of provision] 11,421.29 14,481.29
11,421.29 14,481.29

INDUSTRIES
Seventyseventh annual report
Tata Industries Limited
94
NOTES TO STANDALONE FINANCIAL STATEMENTS
as at and for the year ended 31 March 2021
(Currency: Indian rupees in lakhs)
12
Pro
pe
rty,
pla
nt
an
d e
qu
ipm
en
t
Gro
ss
Blo
ck
Ba
lan
ce
at
1 A
pri
l 2
02
02
,23
7.0
31
72
.39
76
8.7
06
2.0
22
13
.85
67
7.7
82
95
.29
1,0
54
.53
5,4
81
.59
Ad
dit
ion
s-
25
.84
2.6
73
.38
-8
9.5
46
9.1
82
3.0
92
13
.70
De
leti
on
s-
(20
.70
)-
(2.0
7)
(12
.90
)(1
3.7
3)
(38
.50
)-
(87
.90
)
Re
cla
ssific
ati
on
--
-0
.82
(2.9
8)
2.1
6-
--
Ba
lan
ce
at
31
Ma
rch
20
21
2,2
37
.03
17
7.5
37
71
.37
64
.15
19
7.9
77
55
.75
32
5.9
71
,07
7.6
25
,60
7.3
9
Ac
cu
mu
late
d d
ep
rec
iati
on
Ba
lan
ce
at
1 A
pri
l 2
02
01
29
.80
47
.39
46
8.9
52
5.5
16
0.6
03
55
.71
17
6.9
27
36
.57
2,0
01
.45
De
pre
cia
tio
n4
0.3
22
3.5
51
08
.01
9.8
55
2.1
31
35
.72
67
.73
11
0.7
45
48
.05
Imp
air
me
nt
--
3.2
5-
--
-5
.74
8.9
9
De
leti
on
-(1
8.9
5)
-(2
.07
)(1
2.9
0)
(13
.00
)(3
7.9
7)
-(8
4.8
9)
Re
cla
ssific
ati
on
--
-0
.53
(1.9
3)
1.4
0-
--
Ba
lan
ce
at
31
Ma
rch
20
21
17
0.1
25
1.9
95
80
.21
33
.82
97
.90
47
9.8
32
06
.68
85
3.0
52
,47
3.6
0
Ne
t b
loc
k
At
1 A
pri
l 2
02
02
,10
7.2
31
25
.00
29
9.7
53
6.5
11
53
.25
32
2.0
71
18
.37
31
7.9
63
,48
0.1
4
At
31
Ma
rch
20
21
2,0
66
.91
12
5.5
41
91
.16
30
.33
10
0.0
72
75
.92
11
9.2
92
24
.57
3,1
33
.79
Off
ice
prem
ises
/ow
ners
hip
flat
s
Veh
icle
s
Furn
itur
eat
sch
ools
for
Cla
ssEd
ge
Furn
itur
efo
rof
fice
s
Leas
ehol
dim
prov
emen
tsC
ompu
ters
Off
ice
equi
pmen
t(i
nclu
ding
med
ical
dem
ode
vice
s)
Cla
ssEd
geim
plem
enta
tion
and
inst
alla
tion
Tota
l

95
NOTES TO STANDALONE FINANCIAL STATEMENTS
as at and for the year ended 31 March 2021
(Currency: Indian rupees in lakhs)
13
Inta
ng
ible
asse
ts
Gro
ss
Blo
ck
Ba
lan
ce
at
1 A
pri
l 2
02
03
05
.35
77
9.4
56
.43
5,5
38
.31
68
5.4
31
39
.54
45
9.2
67
,91
3.7
7
Ad
ditio
ns
14
2.6
1-
-3
,57
7.6
5-
--
3,7
20
.26
De
leti
on
s(3
.62
)-
--
--
-(3
.62
)
Ba
lan
ce
at
31
Ma
rch
20
21
44
4.3
47
79
.45
6.4
39
,11
5.9
66
85
.43
13
9.5
44
59
.26
11
,63
0.4
1
Ac
cu
mu
late
d d
ep
rec
iati
on
Ba
lan
ce
at
1 A
pri
l 2
02
02
50
.24
42
2.0
16
.43
2,6
46
.39
25
2.9
49
5.9
02
94
.09
3,9
68
.00
De
pre
cia
tio
n5
9.7
31
47
.08
-1
,07
0.4
06
3.4
72
5.2
61
24
.16
1,4
90
.10
Imp
air
me
nt
--
--
--
--
De
leti
on
(3.6
2)
--
--
--
(3.6
2)
Ba
lan
ce
at
31
Ma
rch
20
21
30
6.3
55
69
.09
6.4
33
,71
6.7
93
16
.41
12
1.1
64
18
.25
5,4
54
.48
Ne
t b
loc
k
At
1 A
pri
l 2
02
05
5.1
13
57
.44
-2
,89
1.9
24
32
.49
43
.64
16
5.1
73
,94
5.7
7
At
31
Ma
rch
20
21
13
7.9
92
10
.36
-5
,39
9.1
73
69
.02
18
.38
41
.01
6,1
75
.93
Soft
ware
Dig
ital
healt
hpla
tform
soft
ware
Consu
mer
analy
tics
soft
ware
Cla
ssEdge c
onte
nt,
Pla
nEdge a
nd
Test
Edge p
latf
orm
(inte
rnally
genera
ted)
Lic
ense
dco
nte
nt
Val
ueeduca
tion
and v
ideos
Dig
ital
conte
nt
videos
Tota
l

INDUSTRIES
Seventyseventh annual report
Tata Industries Limited
96
NOTES TO STANDALONE FINANCIAL STATEMENTS
as at and for the year ended 31 March 2021
(Currency: Indian rupees in lakhs)
14 Other non-financial assets
Capital advances 0.18 10.30
Trade advance 282.32 149.91
Other advance 73.51 29.19
Less: Provision for doubtful advances (1.23) (21.25)
Unbilled revenue (work done not billed) 550.29 630.11
Less: Provision for unbilled revenue (6.42) (2.14)
Balances with statutory authorities 1,247.32 892.80
Prepaid expenses 441.75 374.30
Others 5.95 135.17
2,593.67 2,198.39
31 March 2021 31 March 2020
15 Payables
Trade Payables
- Payable to micro and small enterprises 0.31 55.54
- Payable to others 1,431.66 2,089.43
1,431.97 2,144.93
Other Payables
- Payable to micro and small enterprises - -
- Payable to others 12.74 10.54
12.74 10.54
16 Debt Securities
(Unsecured, at amortised cost)
Loans and advances (in India)
- Non-Convertible Debentures 25,264.61 -
(Zero coupon, Rated, Unlisted,
Taxable, Redeemable,
Non-Convertible Debentures
issued on 18 January 2021,
Annualised yield of 6.69% with the
maturity of 4 years and 363 days
i.e. 16 January 2026)
25,264.61 -

97
NOTES TO STANDALONE FINANCIAL STATEMENTS
as at and for the year ended 31 March 2021
(Currency: Indian rupees in lakhs)
17 Borrowings (Other than Debt Securities)
(Unsecured, at amortised cost)
Loans and advances (in India)
Term loan (From other parties)
- Short term revolving loan facility 15,000.00 -
- Rupee Term loan facility 10,000.00 -
(12 months annual renewable
facility of 6.95% - 7%)
25,000.00 -
31 March 2021 31 March 2020
18 Other financial liabilities
Interest accured but not due 33.56 -
Capital creditors 325.64 424.82
Employee benefit payables 2,301.23 2,031.17
Security deposits 155.00 155.00
2,815.43 2,610.99
19 Current tax liabilities (net)
Provision for taxation 9.46 57.84
9.46 57.84
20 Provisions
Provision for employee benefits
- Compensated absences 1,716.04 1,156.00
- Post retirement medical benefits 236.10 293.85
- Pension benefits to an ex-director 1,883.85 1,541.94
- Gratuity Benefit (funded) 11.95 118.95
Other provisions
- Contingency provision for standard assets 166.52 15.45
4,014.46 3,126.19
21 Other non-financial liabilities
Revenue received in advance 878.91 1,031.68
Advance received from customers 997.94 1,381.59
Deferred rent - 2.01
Statutory dues payable 297.98 326.22
2,174.83 2,741.50

INDUSTRIES
Seventyseventh annual report
Tata Industries Limited
98
NOTES TO STANDALONE FINANCIAL STATEMENTS
as at and for the year ended 31 March 2021
(Currency: Indian rupees in lakhs)
31 March 2021 31 March 2020
22 Share Capital
Authorised
11,10,00,000 (31 March 2020: 11,10,00,000) 111,000.00 111,000.00
Equity shares of Rs. 100 each
50,00,000 (31 March 2020: 50,00,000) 5,000.00 5,000.00
Redeemable preference shares of
Rs. 100 each
116,000.00 116,000.00
Issued, subscribed and fully paid-up
10,79,54,602 (31 March 2020: 10,79,54,602)
Equity shares of Rs 100 each, fully paid-up 107,954.60 107,954.60
107,954.60 107,954.60
(a) Reconciliation of the number of equity shares outstanding
at the beginning and at the end of the year:
31 March 2021
At the beginning and 107,954,602 107,954.60 107,954,602 107,954.60
at the end of the year
31 March 2020
No. of Shares Rs. Lakhs No. of Shares Rs. Lakhs
(b) Terms/rights attached to equity shares:
In the event of liquidation of the Company the holders of equity shares will be entitled to
receive remaining assets of the company after distribution of all preferential amount. The
distribution will be in proportion to the number of equity shares held by the shareholders.
The equity shares have rights, preferences and restrictions which are in accordance with
the provisions of law, in particular the Companies Act, 2013.

99
NOTES TO STANDALONE FINANCIAL STATEMENTS
as at and for the year ended 31 March 2021
(Currency: Indian rupees in lakhs)
(c) Shareholders holding more than 5% shares in the Company:
31 March 2021 31 March 2020
No. of shares % holding No. of shares % holding
Tata Sons Pvt Ltd. 53,521,229 49.58% 53,521,229 49.58%
Tata Motors Ltd. 10,310,242 9.55% 10,310,242 9.55%
Tata Steel Ltd. 9,980,436 9.24% 9,980,436 9.24%
Tata Chemicals Ltd. 9,861,303 9.13% 9,861,303 9.13%
Tata Consumer 6,519,441 6.04% 6,519,441 6.04%
Products Limited
(formerly Tata Global
Beverages Ltd.)
The Tata Power 5,828,126 5.40% 5,828,126 5.40%
Company Ltd.
Name of the
Shareholder
23 Other equity
(a) Capital reserve
At the commencement and
at the end of the year 174,522.54 174,522.54
(b) Securities premium
At the commencement and
at the end of the year 60,480.01 60,480.01
(c) Amalgamation reserve
At the commencement and
at the end of the year 2,498.76 2,498.76
(d) Impairment reserve
At the commencement of the year 324.04 -
Addition during the year 563.08 324.04
At the end of the year 887.12 324.04
31 March 2021 31 March 2020

INDUSTRIES
Seventyseventh annual report
Tata Industries Limited
100
NOTES TO STANDALONE FINANCIAL STATEMENTS
as at and for the year ended 31 March 2021
(Currency: Indian rupees in lakhs)
31 March 2021 31 March 2020
23 Other equity (Continued)
(e) Reserve fund - under section 45IC
of the Reserve Bank of India Act, 1934
At the commencement of the year 50,199.22 44,338.80
Addition during the year - 5,860.42
At the end of the year 50,199.22 50,199.22
(f) General reserve
At the commencement and
at the end of the year 17,040.37 17,040.37
(g) Retained earnings
At the commencement of the year 9,367.94 46,383.37
Add: Addition at the beginning of the year
on account of impact due to Ind AS 116 - (283.26)
Add: Profit / (loss) for the year (6,588.27) 29,302.09
Add: Other comprehensive income for the year (182.09) (146.43)
Less: Transfer to reserve fund - 5,860.42
Transfer from Equity instruments through OCI - (60,027.41)
At the end of the year 2,597.58 9,367.94
(h) Equity instruments through OCI
At the commencement of the year (4,002.49) 17,477.49
Addition during the year 182,715.55 (81,507.39)
Transferred to the retained earnings - 60,027.41
At the end of the year 178,713.06 (4,002.49)
486,938.66 310,430.39

101
NOTES TO STANDALONE FINANCIAL STATEMENTS
as at and for the year ended 31 March 2021
(Currency: Indian rupees in lakhs)
For the Year ended
31 March 2021
24 Interest income
(on financial assets measured at amortised cost)
Interest on Inter corporate deposits / loans 1,146.62 379.19
Interest on deposits with banks 2.35 8.09
Interest on Investments 1,215.65 637.78
Interest on unwinding of financial assets 208.89 185.67
Other interest income 0.01 0.01
2,573.52 1,210.74
25 Dividend income
Dividends from long-term investments 432.41 1,918.43
432.41 1,918.43
26 Net gain on fair value changes
(on financial instruments
at fair value through profit or loss)
Net gain /(loss) on financial instruments
at fair value through profit or loss:
- Fair value gain on investments
in preference shares (net) 227.75 116.69
- Fair value gain on investments
in mutual funds 970.88 2,528.06
1,198.63 2,644.75
Fair Value changes :
Realised 970.88 2,528.06
Unrealised 227.75 116.69
27 Sale of products
Sale of Traded goods
- Equipments 1,140.39 3,367.62
- Medicines 7,672.76 4,803.89
8,813.15 8,171.51
For the Year ended
31 March 2020

INDUSTRIES
Seventyseventh annual report
Tata Industries Limited
102
NOTES TO STANDALONE FINANCIAL STATEMENTS
as at and for the year ended 31 March 2021
(Currency: Indian rupees in lakhs)
For the Year ended
31 March 2021
For the Year ended
31 March 2020
28 Sale of services
ClassEdge licence and support fee 5,735.65 7,083.22
Management consultancy services 5,244.75 5,583.01
Data analytics fees 1,295.44 1,237.53
Others 137.24 102.16
12,413.08 14,005.92
29 Other income
Profit on sale of investments 0.68 -
Lease concession as per Ind AS 116 13.18 -
Profit on sale of Property, plant and equipment 2.92 -
Recovery of common sharing expenses 101.24 -
Provision for onerous lease rentals
written back (net) - 1.42
Credit / sundry balances written back 1.24 97.26
Interest on Income tax refund 411.35 -
Miscellaneous income 2.85 20.04
533.46 118.72
30 Finance costs
(on financial liabilities
measured at amortised cost)
Interest on borrowings 261.68 316.73
Interest on debt securities 322.98 -
Other borrowing costs 100.02 2.40
Unwinding interest 572.06 569.03
1,256.74 888.16
31 Purchases of stock-in-trade
- Medicines 7,543.96 4,634.63
- Equipments 1,015.12 2,613.07
8,559.08 7,247.70
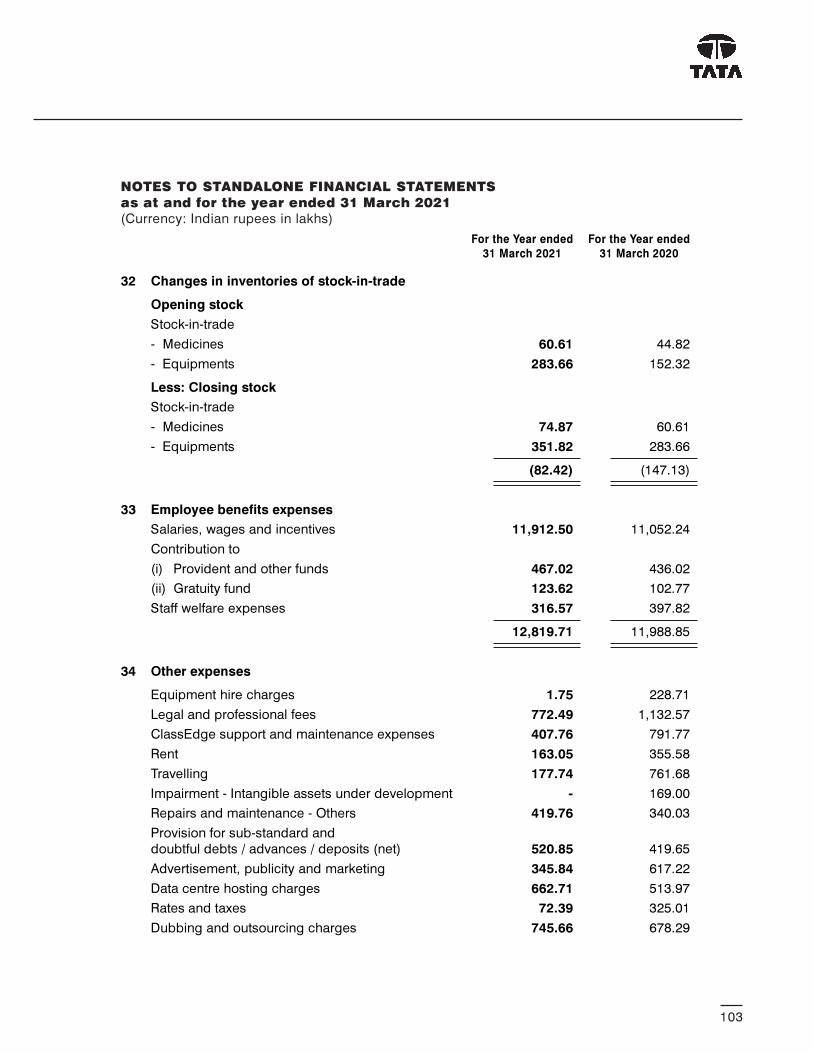
103
NOTES TO STANDALONE FINANCIAL STATEMENTS
as at and for the year ended 31 March 2021
(Currency: Indian rupees in lakhs)
For the Year ended
31 March 2021
For the Year ended
31 March 2020
32 Changes in inventories of stock-in-trade
Opening stock
Stock-in-trade
- Medicines 60.61 44.82
- Equipments 283.66 152.32
Less: Closing stock
Stock-in-trade
- Medicines 74.87 60.61
- Equipments 351.82 283.66
(82.42) (147.13)
33 Employee benefits expenses
Salaries, wages and incentives 11,912.50 11,052.24
Contribution to
(i) Provident and other funds 467.02 436.02
(ii) Gratuity fund 123.62 102.77
Staff welfare expenses 316.57 397.82
12,819.71 11,988.85
34 Other expenses
Equipment hire charges 1.75 228.71
Legal and professional fees 772.49 1,132.57
ClassEdge support and maintenance expenses 407.76 791.77
Rent 163.05 355.58
Travelling 177.74 761.68
Impairment - Intangible assets under development - 169.00
Repairs and maintenance - Others 419.76 340.03
Provision for sub-standard and
doubtful debts / advances / deposits (net) 520.85 419.65
Advertisement, publicity and marketing 345.84 617.22
Data centre hosting charges 662.71 513.97
Rates and taxes 72.39 325.01
Dubbing and outsourcing charges 745.66 678.29

INDUSTRIES
Seventyseventh annual report
Tata Industries Limited
104
NOTES TO STANDALONE FINANCIAL STATEMENTS
as at and for the year ended 31 March 2021
(Currency: Indian rupees in lakhs)
For the Year ended
31 March 2021
For the Year ended
31 March 2020
Content Licence Charges 10.45 25.27
Recruitment expenses 199.50 255.30
Telephone and communication expenses 58.34 115.01
Conveyance and transportation 3.09 66.63
Insurance 26.11 24.86
Conference courses and training expenses 52.09 153.57
Motor Car expenses 36.34 55.37
Exchange loss (net) 10.16 0.45
Housekeeping and Security Charges 68.04 53.88
Membership and Subscriptions 27.96 58.44
Electricity, power and fuel 32.82 42.32
Printing & Stationery 8.79 37.38
Lab Test Charges 88.44 70.93
Bad debts / advances written off - 12.18
Impairment provision as per RBI guidelines 563.08 324.04
Provision for standard assets (net) 151.07 (7.34)
Provision for unbilled revenue 4.29 (35.10)
Loss on sale/write off of PPE, Intangible assets
under development (net) 45.50 0.18
Director’s sitting fees 6.80 0.80
Auditors’ remuneration
- As auditors 37.40 37.83
- For tax audit and tax services 4.14 6.39
- For other services 3.00 6.54
- For reimbursement of out-of-pocket expenses 0.40 3.55
Bank Charges 4.88 (5.30)
Postage / Courier Expenses 12.65 20.84
Corporate Social Responsibility contribution 164.65 -
Group’s Share of Expenses 29.23 71.77
Miscellaneous expenses 17.78 99.84
5,957.00 7,829.11
34 Other expenses (Continued)

105
NOTES TO STANDALONE FINANCIAL STATEMENTS
as at and for the year ended 31 March 2021
(Currency: Indian rupees in lakhs)
35
Inve
stm
en
ts
As
at
31
Ma
rch
20
21
As
at
31
Ma
rch
20
20
No
.R
s.
lak
hs
No
.R
s. la
kh
s
Fa
ce
Va
lue
Rs
.
Inv
es
tme
nts
in
mu
tua
l fu
nd
s
(at
Fa
ir v
alu
e t
hro
ug
h p
rofi
t a
nd
lo
ss
)
ICIC
I P
rud
en
tia
l L
iqu
id F
un
d -
Dir
ect
- G
row
th-
-2
,77
1,5
17
.57
8,1
42
.21
LIC
MF
Liq
uid
Fu
nd
- D
ire
ct
- G
row
th-
-1
09
,00
4.7
43
,92
8.3
1
Tata
Liq
uid
Fu
nd
- D
ire
ct
- G
row
th4
0,1
11
.29
1,3
02
.62
94
5,7
98
.90
29
,62
2.2
8
Tata
Mo
ne
y M
ark
et
- D
ire
ct
- G
row
th5
77
,30
6.6
32
1,1
86
.42
--
ICIC
I P
rud
en
tia
l M
on
ey M
ark
et
Fu
nd
- D
ire
ct
- G
row
th2
,64
9,3
79
7,8
23
.05
--
Tota
l (A
)-
30
,31
2.0
9-
41
,69
2.8
0
Inv
es
tme
nts
in
Pre
fere
nc
e S
ha
res
(U
nq
uo
ted
)
Jo
int
Ve
ntu
re (
at
Fa
ir v
alu
e t
hro
ug
h p
rofi
t a
nd
lo
ss
)
Inzp
era
He
alt
hsc
ien
ce
s L
td.
- 0
.00
01
% N
on
cu
mu
lati
ve
no
n c
on
vert
ible
re
de
em
ab
le p
refe
ren
ce
sh
are
s1
02
5,9
25
,38
41
,20
1.1
12
5,9
25
,38
49
73
.36
Tota
l (B
)-
1,2
01
.11
-9
73
.36
As
so
cia
tes
(a
t F
air
va
lue
th
rou
gh
pro
fit
an
d l
os
s)
ITe
l In
du
stri
es
Ltd
. -
7%
Re
de
em
ab
le N
on
-cu
mu
lati
ve
Pre
fere
nce
Sh
are
s1
05
0,0
00
-5
0,0
00
-
Ori
en
tal
Se
rite
ch
Ltd
. -
7%
Re
de
em
ab
le N
on
-cu
mu
lati
ve
Pre
fere
nce
Sh
are
s1
05
0,0
00
-5
0,0
00
-
Nis
ka
lp I
nfr
ast
ructu
re S
erv
ice
s L
td.
- 1
2.5
%
No
n C
um
ula
tive
Re
de
em
ab
le P
refe
ren
ce
Sh
are
s1
00
50
0,0
00
-5
00
,00
0-
Tota
l (C
)-
--
-
Oth
ers
(a
t a
mo
rtis
ed
co
st)
Co
nco
rde
Mo
tors
In
dia
Ltd
. -
7%
Cu
mu
lati
ve R
ed
ee
ma
ble
Pre
fere
nce
Sh
are
s1
00
1,0
80
,80
51
,87
7.4
41
,08
0,8
05
1,7
14
.55
Dri
ve I
nd
ia E
nte
rpri
se S
olu
tio
ns
Ltd
.- 0
.00
01
% C
um
ula
tive
Re
de
em
ab
le N
on
-Co
nve
rtib
le P
refe
ren
ce
Sh
are
s1
11
7,4
43
1.1
71
17
,44
31
.17
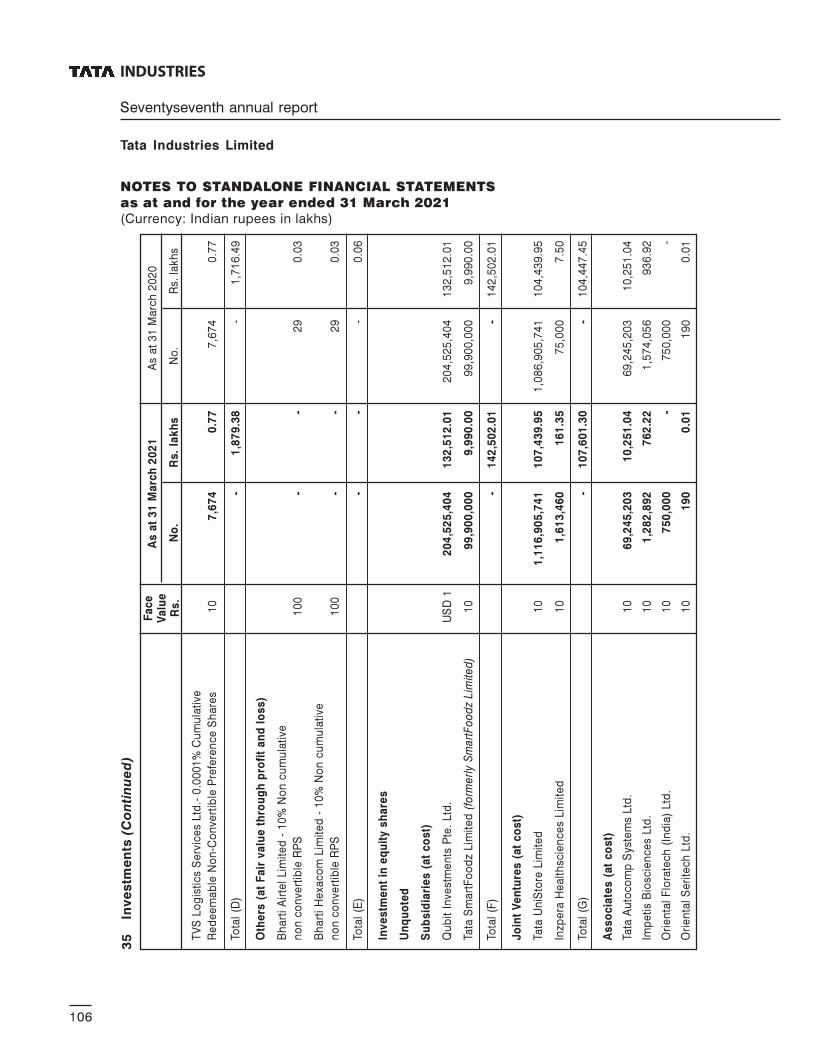
INDUSTRIES
Seventyseventh annual report
Tata Industries Limited
106
NOTES TO STANDALONE FINANCIAL STATEMENTS
as at and for the year ended 31 March 2021
(Currency: Indian rupees in lakhs)
35
Inve
stm
en
ts (Continued)
TV
S L
og
isti
cs
Se
rvic
es
Ltd
.- 0
.00
01
% C
um
ula
tive
Re
de
em
ab
le N
on
-Co
nve
rtib
le P
refe
ren
ce
Sh
are
s1
07
,67
40
.77
7,6
74
0.7
7
Tota
l (D
)-
1,8
79
.38
-1
,71
6.4
9
Oth
ers
(a
t F
air
va
lue
th
rou
gh
pro
fit
an
d l
os
s)
Bh
art
i A
irte
l L
imit
ed
- 1
0%
No
n c
um
ula
tive
no
n c
on
vert
ible
RP
S1
00
--
29
0.0
3
Bh
art
i H
exa
co
m L
imit
ed
- 1
0%
No
n c
um
ula
tive
no
n c
on
vert
ible
RP
S1
00
--
29
0.0
3
Tota
l (E
)-
--
0.0
6
Inv
es
tme
nt
in e
qu
ity
sh
are
s
Un
qu
ote
d
Su
bs
idia
rie
s (
at
co
st)
Qu
bit
In
vest
me
nts
Pte
. L
td.
US
D 1
20
4,5
25
,40
41
32
,51
2.0
12
04
,52
5,4
04
13
2,5
12
.01
Tata
Sm
art
Fo
od
z Lim
ite
d (
form
erl
y S
ma
rtF
oo
dz
Lim
ite
d)
10
99
,90
0,0
00
9,9
90
.00
99
,90
0,0
00
9,9
90
.00
Tota
l (F
)-
14
2,5
02
.01
-1
42
,50
2.0
1
Jo
int
Ve
ntu
res
(a
t c
os
t)
Tata
Un
iSto
re L
imit
ed
10
1,1
16
,90
5,7
41
10
7,4
39
.95
1,0
86
,90
5,7
41
10
4,4
39
.95
Inzp
era
He
alt
hsc
ien
ce
s L
imit
ed
10
1,6
13
,46
01
61
.35
75
,00
07
.50
Tota
l (G
)-
10
7,6
01
.30
-1
04
,44
7.4
5
As
so
cia
tes
(a
t c
os
t)
Tata
Au
toco
mp
Syst
em
s L
td.
10
69
,24
5,2
03
10
,25
1.0
46
9,2
45
,20
31
0,2
51
.04
Imp
eti
s B
iosc
ien
ce
s L
td.
10
1,2
82
,89
27
62
.22
1,5
74
,05
69
36
.92
Ori
en
tal
Flo
rate
ch
(In
dia
) Ltd
.1
07
50
,00
0-
75
0,0
00
-
Ori
en
tal
Se
rite
ch
Ltd
.1
01
90
0.0
11
90
0.0
1
As
at
31
Ma
rch
20
21
As
at
31
Ma
rch
20
20
No
.R
s.
lak
hs
No
.R
s. la
kh
s
Fa
ce
Va
lue
Rs
.

107
NOTES TO STANDALONE FINANCIAL STATEMENTS
as at and for the year ended 31 March 2021
(Currency: Indian rupees in lakhs)
35
Inve
stm
en
ts (Continued)
As
at
31
Ma
rch
20
21
As
at
31
Ma
rch
20
20
No
.R
s.
lak
hs
No
.R
s. la
kh
s
Fa
ce
Va
lue
Rs
.
ITe
l In
du
stri
es
Ltd
.1
01
50
0.0
11
50
0.0
1
Nis
ka
lp I
nfr
ast
ructu
re S
erv
ice
s L
td.
10
40
,00
0,0
00
0.0
04
0,0
00
,00
00
.00
Ind
ige
ne
Ph
arm
ace
uti
ca
ls I
nc -
Pre
ferr
ed
Sto
ck -
Se
rie
s A
US
D.0
01
3,0
00
,00
0-
3,0
00
,00
0-
Ind
ige
ne
Ph
arm
ace
uti
ca
ls I
nc -
Pre
ferr
ed
Sto
ck -
Se
rie
s B
US
D.0
01
2,0
00
,00
0-
2,0
00
,00
0-
Ind
ige
ne
Ph
arm
ace
uti
ca
ls I
nc -
Pre
ferr
ed
Sto
ck -
Se
rie
s C
US
D.0
01
2,8
00
,00
0-
2,8
00
,00
0-
Tota
l (H
)-
11
,01
3.2
8-
11
,18
7.9
8
Oth
ers
(a
t F
air
va
lue
th
rou
gh
oth
er
co
mp
reh
en
siv
e i
nc
om
e)
Ave
sth
ag
en
Ltd
73
01
,48
4-
30
1,4
84
-
Ass
ocia
ted
Bu
ildin
g C
o L
td.
90
01
00
0.9
01
00
0.9
0
Pa
na
ton
e F
inve
st L
td.
10
45
,00
01
2.1
54
5,0
00
12
.15
Tata
Ho
usi
ng
De
velo
pm
en
t C
om
pa
ny L
imit
ed
10
28
4,3
38
76
.77
28
4,3
38
11
4.8
7
Tata
In
tern
ati
on
al L
td.
10
00
25
,68
37
,39
6.7
01
7,1
22
3,8
69
.57
Tata
Pro
jects
Ltd
.1
00
60
,75
09
,08
3.3
46
0,7
50
6,9
96
.49
Tata
Se
rvic
es
Ltd
.1
00
01
04
1.0
41
04
1.0
4
Tata
So
ns
Pri
vate
Ltd
.1
00
02
,29
53
,08
6.8
52
,29
53
,08
6.8
5
Tata
Te
lese
rvic
es
Ltd
.*1
0-
-3
38
,51
1,1
12
-
Tata
Ca
pit
al L
td1
02
,27
2,3
46
91
5.7
62
,27
2,3
46
1,1
58
.90
Inve
ste
ch
Ad
viso
ry S
erv
ice
s (I
nd
ia)
Pvt
Ltd
.1
00
1,2
00
-1
,20
0-
Na
mte
ch
Ele
ctr
on
ic D
evi
ce
s L
td.
10
45
0,0
00
-4
50
,00
0-
Elc
ot
Po
we
r C
on
tro
ls L
td.
10
30
,00
0-
30
,00
0-
Tota
l (I
)-
20
,57
3.5
1-
15
,24
0.7
7
* I
nve
stm
en
ts o
f Ta
ta T
ele
serv
ice
s L
imit
ed
are
so
ld d
uri
ng
the
ye
ar,
wh
ich
we
re w
ritt
en
off
in
pre
vio
us
ye
ar.
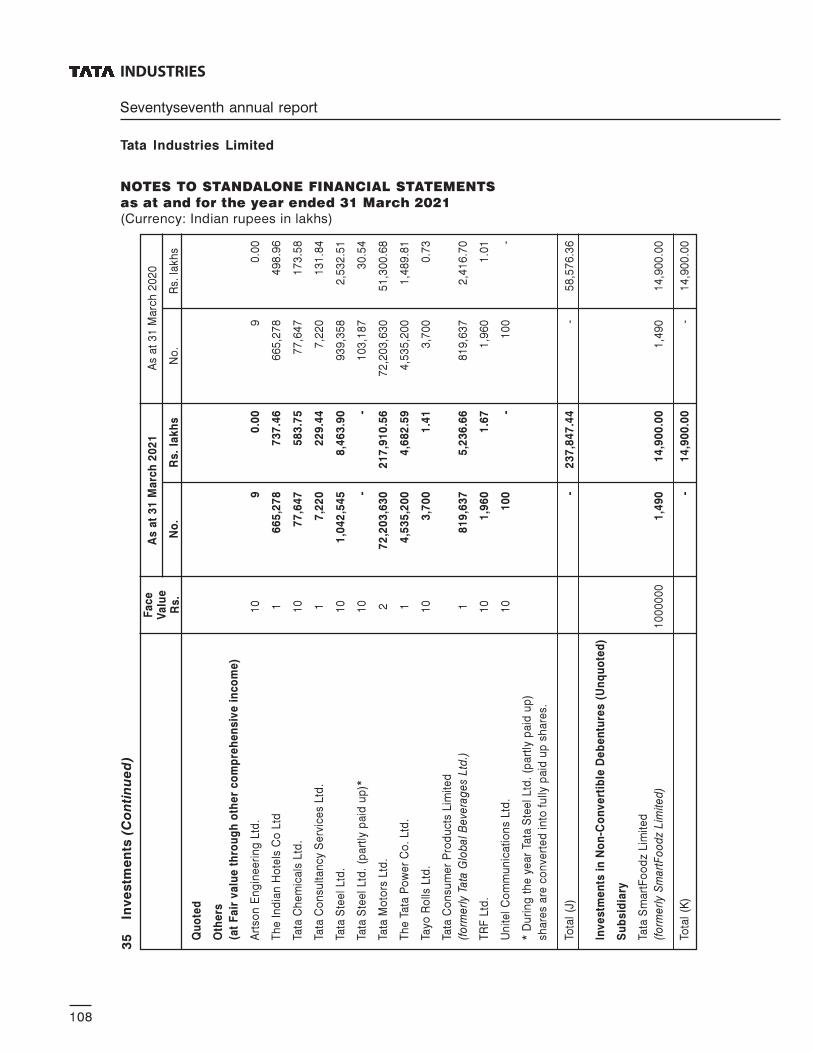
INDUSTRIES
Seventyseventh annual report
Tata Industries Limited
108
NOTES TO STANDALONE FINANCIAL STATEMENTS
as at and for the year ended 31 March 2021
(Currency: Indian rupees in lakhs)
35
Inve
stm
en
ts (Continued)
As
at
31
Ma
rch
20
21
As
at
31
Ma
rch
20
20
No
.R
s.
lak
hs
No
.R
s. la
kh
s
Fa
ce
Va
lue
Rs
.
Qu
ote
d
Oth
ers
(at
Fa
ir v
alu
e t
hro
ug
h o
the
r c
om
pre
he
ns
ive
in
co
me
)
Art
son
En
gin
ee
rin
g L
td.
10
90
.00
90
.00
Th
e I
nd
ian
Ho
tels
Co
Ltd
16
65
,27
87
37
.46
66
5,2
78
49
8.9
6
Tata
Ch
em
ica
ls L
td.
10
77
,64
75
83
.75
77
,64
71
73
.58
Tata
Co
nsu
lta
ncy S
erv
ice
s L
td.
17
,22
02
29
.44
7,2
20
13
1.8
4
Tata
Ste
el
Ltd
.1
01
,04
2,5
45
8,4
63
.90
93
9,3
58
2,5
32
.51
Tata
Ste
el
Ltd
. (p
art
ly p
aid
up
)*1
0-
-1
03
,18
73
0.5
4
Tata
Mo
tors
Ltd
.2
72
,20
3,6
30
21
7,9
10
.56
72
,20
3,6
30
51
,30
0.6
8
Th
e T
ata
Po
we
r C
o.
Ltd
.1
4,5
35
,20
04
,68
2.5
94
,53
5,2
00
1,4
89
.81
Tayo
Ro
lls L
td.
10
3,7
00
1.4
13
,70
00
.73
Tata
Co
nsu
me
r P
rod
ucts
Lim
ite
d
(fo
rme
rly
Tata
Glo
bal
Be
vera
ge
s L
td.)
18
19
,63
75
,23
6.6
68
19
,63
72
,41
6.7
0
TR
F L
td.
10
1,9
60
1.6
71
,96
01
.01
Un
ite
l C
om
mu
nic
ati
on
s L
td.
10
10
0-
10
0-
* D
uri
ng
th
e y
ea
r Ta
ta S
tee
l Ltd
. (p
art
ly p
aid
up
)
sha
res
are
co
nve
rte
d in
to f
ully
pa
id u
p s
ha
res.
Tota
l (J
)-
23
7,8
47
.44
-5
8,5
76
.36
Inv
es
tme
nts
in
No
n-C
on
ve
rtib
le D
eb
en
ture
s (
Un
qu
ote
d)
Su
bs
idia
ry
Tata
Sm
art
Fo
od
z Lim
ite
d
(fo
rme
rly
Sm
art
Fo
od
z L
imite
d)
10
00
00
01
,49
01
4,9
00
.00
1,4
90
14
,90
0.0
0
Tota
l (K
)-
14
,90
0.0
0-
14
,90
0.0
0

109
NOTES TO STANDALONE FINANCIAL STATEMENTS
as at and for the year ended 31 March 2021
(Currency: Indian rupees in lakhs)
35
Inve
stm
en
ts (Continued)
As
at
31
Ma
rch
20
21
As
at
31
Ma
rch
20
20
No
.R
s.
lak
hs
No
.R
s. la
kh
s
Fa
ce
Va
lue
Rs
.
Inv
es
tme
nts
in
Op
tio
na
lly
Co
nv
ert
ible
De
be
ntu
res
(Un
qu
ote
d)
- E
qu
ity
in
str
um
en
t
Su
bs
idia
ry
Tata
Sm
art
Fo
od
z Lim
ite
d (
form
erl
y S
ma
rtF
oo
dz
Lim
ite
d)
10
00
01
56
,00
01
5,6
00
.00
36
,00
03
,60
0.0
0
Tota
l (L
)-
15
,60
0.0
0-
3,6
00
.00
Inv
es
tme
nts
in
0.0
1%
Op
tio
na
lly
Co
nv
ert
ible
No
n-C
um
ula
tiv
e P
refe
ren
ce
Sh
are
s (
Un
qu
ote
d)
-
Eq
uit
y i
ns
tru
me
nt
Su
bs
idia
ry
Inzp
era
He
alt
hsc
ien
ce
s L
imit
ed
10
4,6
15
,38
44
61
.54
4,6
15
,38
44
61
.54
Tota
l (M
)-
46
1.5
4-
46
1.5
4
De
em
ed
In
ve
stm
en
t in
su
bs
idia
ry a
nd
Jo
int
Ve
ntu
re
Inzp
era
He
alt
hsc
ien
ce
s L
imit
ed
-1
,30
7.6
7-
1,3
07
.67
Tota
l (N
)-
1,3
07
.67
-1
,30
7.6
7
Gra
nd
To
tal
(A)+
(B)+
(C)+
(D)+
(E)+
(F)+
(G)+
(H)+
(I)+
(J)+
(K)+
(L)+
(M)+
(N)
-5
85
,19
9.3
3-
39
6,6
06
.48
Le
ss:
Re
cla
ssifie
d a
s h
eld
fo
r sa
le-
--
12
.15
Ne
t to
tal
-5
85
,19
9.3
3-
39
6,5
94
.34

INDUSTRIES
Seventyseventh annual report
Tata Industries Limited
110
NOTES TO STANDALONE FINANCIAL STATEMENTS
as at and for the year ended 31 March 2021
(Currency: Indian rupees in lakhs)
36 Held for sale and discontinued operation
31 March 2021 31 March 2020
Assets classified as held for sale
and discontinued operation
Assets held for sale 0.73 0.73
Investments held for sale - 12.15
0.73 12.88
Particulars
Rs. in Lakhs
37 Segment reporting
A. An operating segment is a component of the Company that engages in businessactivities from which it may earn revenues and incur expenses and for which discretefinancial information is available. Operating results of all operating segments arereviewed regularly by the management to make decisions about resources to beallocated to the segments and assess their performance.
The Company has five reportable segments as described below, which are theCompany’s strategic business units. These business units offer different products andservices, and are managed separately because they require different technology andmarketing strategies. For each of the business units, the Company’s managementreviews internal management reports on at least a monthly basis.The following summarydescribes the operations in each of the Company’s reportable / reported segments:
Investment held for sale ceases to be classified as held for sale due to change in decision
to sell the investment.
31 March 2021 31 March 2020
Investment in others (at FVOCI)
Panatone Finvest Ltd. - 12.15
- 12.15
Particulars
Reportable/Reported segments Operations
Investment, Finance & The Company’s operations predominantly
Promotion (IFP) relate to Incubation, Investment, financing
and promotion of new / existing ventures.
Tata ClassEdge (TCE) Providing digital classrooms and related tools,
to schools and educational institutions across India.
Tata Strategic Management Providing management / strategic consultancy
Group (TSMG) services to various clients within the Tata Group
Tata Digital Health (DHP) Providing health services by using
digital technology.
Tata Insights & Quants (TIQ) Providing data analytics services for various
Tata Group companies, across industries.

111
NOTES TO STANDALONE FINANCIAL STATEMENTS
as at and for the year ended 31 March 2021
(Currency: Indian rupees in lakhs)
37
Se
gm
en
t re
po
rtin
g (
Co
nti
nu
ed
)
B.
Info
rma
tio
n a
bo
ut
rep
ort
ab
le /
re
po
rte
d s
eg
me
nts
Info
rma
tio
n r
eg
ard
ing
th
e r
esu
lts o
f e
ach
re
po
rta
ble
/ r
ep
ort
ed
se
gm
en
t is
in
clu
de
d b
elo
w.
Pe
rfo
rma
nce
is
me
asu
red
ba
se
d o
n s
eg
me
nt
pro
fit
(be
fore
ta
x),
as i
nc
lud
ed
in
th
e i
nte
rna
l m
an
ag
em
en
t re
po
rts t
ha
t a
re
revie
we
d b
y t
he
Co
mp
an
y’s
Exe
cu
tive
Dir
ec
tor.
Se
gm
en
t p
rofi
t is
use
d t
o m
ea
su
re p
erf
orm
an
ce
as
ma
na
ge
me
nt b
elie
ve
s th
at su
ch
info
rma
tio
n is
th
e m
ost re
leva
nt in
eva
lua
tin
g th
e r
esu
lts o
f ce
rta
in s
eg
me
nts
rela
tive
to
oth
er
en
titie
s t
ha
t o
pe
rate
with
in t
he
se
in
du
str
ies.
Inte
r-se
gm
en
t p
ricin
g i
s d
ete
rmin
ed
on
an
arm
’s l
en
gth
ba
sis
.
Ye
ar
en
de
d 3
1 M
arc
h 2
02
1R
s.
In L
akh
s
Se
gm
en
t R
eve
nu
e
Ext
ernal
rev
enues
4,1
88
.44
5,1
16
.24
6,8
85
.46
7,9
42
.56
1,2
98
.09
-2
5,4
30
.79
Inte
r-se
gm
ent
reve
nues
1,7
97
.84
--
-3
2.4
5-
1,8
30
.29
Tota
l S
eg
me
nt
reve
nu
e5
,98
6.2
85
,11
6.2
46
,88
5.4
67
,94
2.5
61
,33
0.5
4-
27
,26
1.0
8
Se
gm
en
t re
sult
Seg
men
t p
rofi
t/(l
oss
) b
efo
re t
ax2
,36
9.7
31
,07
0.9
4(5
,22
5.4
2)
(3,7
64
.52
)(1
,29
4.8
3)
3.3
0(6
,84
0.8
0)
Les
s: T
ax e
xpen
ses
/ (r
ever
sal)
--
--
-(2
52
.53
)(2
52
.53
)
Seg
men
t p
rofi
t/(l
oss
) af
ter
tax
--
--
--
(6,5
88
.27
)
Se
gm
en
t a
sse
ts6
26
,59
8.8
14
,08
7.6
61
5,5
33
.68
2,1
53
.36
77
0.1
51
1,4
21
.29
66
0,5
64
.95
Se
gm
en
t li
ab
ilit
ies
54
,38
9.8
61
,31
7.1
77
,85
3.8
71
,39
0.0
37
11
.30
9.4
66
5,6
71
.69
Oth
er
Info
rma
tio
n
Cap
ital
exp
end
iture
duri
ng
the
year
5.3
01
39
.68
3,2
42
.33
81
.46
22
.15
-3
,49
0.9
2
Dep
reci
atio
n a
nd
am
ort
isat
ion
13
4.2
75
9.0
23
,65
5.4
63
48
.72
97
.47
-4
,29
4.9
4
Oth
er n
on-c
ash ite
ms
(26
8.4
6)
(3.7
3)
99
0.6
65
8.0
33
3.9
0-
81
0.4
0
Pa
rtic
ula
rsC
on
tin
uin
g O
pe
rati
on
sU
na
llo
cate
dTo
tal
IFP
TS
MG
TC
ED
HP
TIQ

INDUSTRIES
Seventyseventh annual report
Tata Industries Limited
112
NOTES TO STANDALONE FINANCIAL STATEMENTS
as at and for the year ended 31 March 2021
(Currency: Indian rupees in lakhs)
37
Se
gm
en
t re
po
rtin
g (
Co
nti
nu
ed
)
B.
Info
rma
tio
n a
bo
ut
rep
ort
ab
le /
re
po
rte
d s
eg
me
nts
(C
on
tin
ue
d)
Ye
ar
en
de
d 3
1 M
arc
h 2
02
0R
s.
In L
akh
s
Se
gm
en
t R
eve
nu
e
Ext
ernal
rev
enues
38
,54
8.1
95
,46
1.1
21
0,4
60
.43
5,0
28
.88
1,2
37
.53
-6
0,7
36
.15
Inte
r-se
gm
ent
reve
nues
1,4
11
.79
--
-5
.70
-1
,41
7.4
9
Tota
l S
eg
me
nt
reve
nu
e3
9,9
59
.98
5,4
61
.12
10
,46
0.4
35
,02
8.8
81
,24
3.2
3-
62
,15
3.6
4
Se
gm
en
t re
sult
Seg
men
t p
rofi
t/(l
oss
) b
efo
re t
ax3
6,1
38
.06
1,1
76
.99
(3,0
72
.94
)(3
,68
0.5
5)
(1,2
55
.87
)(3
.60
)2
9,3
02
.09
Les
s: T
ax e
xpen
ses
--
--
--
-
Seg
men
t p
rofi
t/(l
oss
) af
ter
tax
--
--
--
29
,30
2.0
9
Se
gm
en
t a
sse
ts3
98
,97
2.8
13
,96
0.7
31
4,0
01
.30
2,5
63
.83
86
4.8
01
4,4
81
.29
43
4,8
44
.76
Se
gm
en
t li
ab
ilit
ies
3,9
36
.39
98
9.3
49
,29
2.3
31
,51
6.6
86
67
.18
57
.84
16
,45
9.7
7
Oth
er
Info
rma
tio
n
Cap
ital
exp
end
iture
duri
ng
the
year
64
.16
19
.50
2,3
31
.40
56
1.7
96
3.7
9-
3,0
40
.64
Dep
reci
atio
n a
nd
am
ort
isat
ion
13
8.9
05
8.7
33
,22
9.5
12
22
.40
96
.55
-3
,74
6.0
9
Oth
er n
on-c
ash ite
ms
(77
.56
)(2
.27
)3
76
.81
(17
.52
)(0
.93
)-
27
8.5
3
Pa
rtic
ula
rsC
on
tin
uin
g O
pe
rati
on
sU
na
llo
cate
dTo
tal
IFP
TS
MG
TC
ED
HP
TIQ
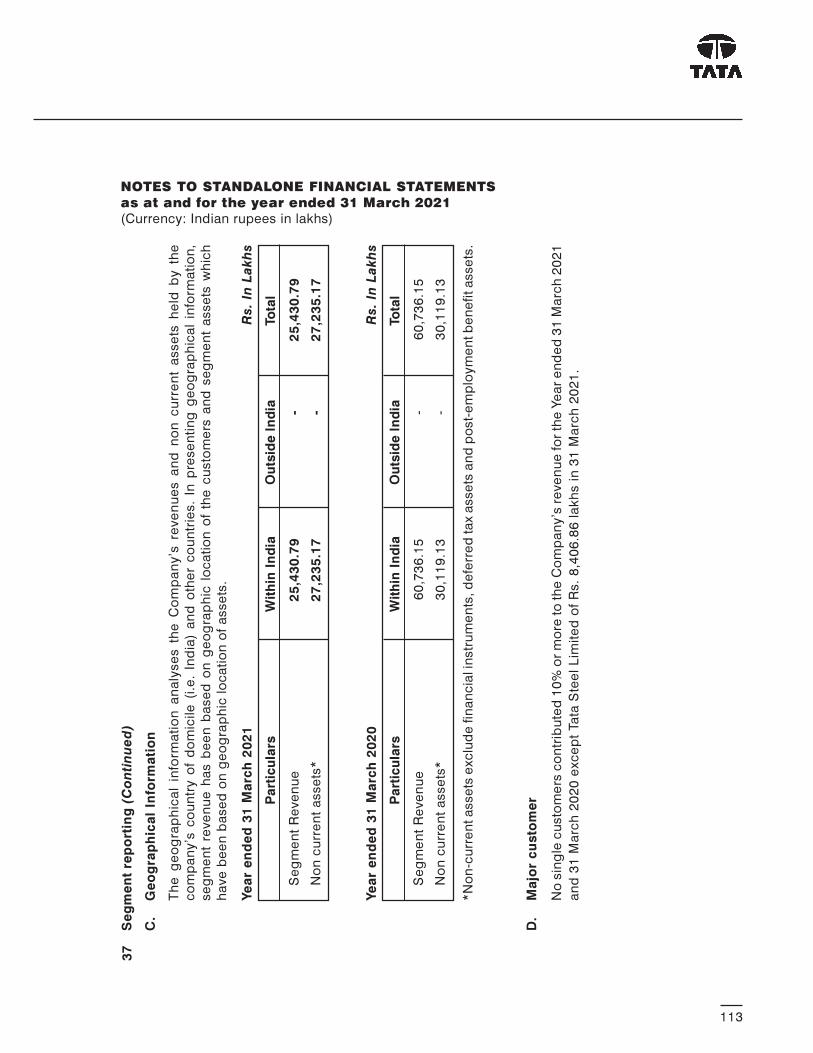
113
NOTES TO STANDALONE FINANCIAL STATEMENTS
as at and for the year ended 31 March 2021
(Currency: Indian rupees in lakhs)
Se
gm
en
t R
eve
nu
e2
5,4
30
.79
-2
5,4
30
.79
No
n c
urr
en
t a
sse
ts*
27
,23
5.1
7-
27
,23
5.1
7
Ye
ar
en
de
d 3
1 M
arc
h 2
02
1R
s.
In L
akh
s
Part
icu
lars
Wit
hin
In
dia
Ou
tsid
e I
nd
iaTo
tal
Se
gm
en
t R
eve
nu
e6
0,7
36
.15
-6
0,7
36
.15
No
n c
urr
en
t a
sse
ts*
30
,11
9.1
3-
30
,11
9.1
3
Ye
ar
en
de
d 3
1 M
arc
h 2
02
0R
s.
In L
akh
s
Part
icu
lars
Wit
hin
In
dia
Ou
tsid
e I
nd
iaTo
tal
*N
on
-cu
rre
nt a
sse
ts e
xclu
de
fin
an
cia
l in
str
um
en
ts, d
efe
rre
d ta
x a
sse
ts a
nd
po
st-
em
plo
ym
en
t b
en
efit a
sse
ts.
D.
Ma
jor
cu
sto
me
r
No
sin
gle
cu
sto
me
rs c
on
trib
ute
d 1
0%
or
mo
re to
th
e C
om
pa
ny’s
re
ve
nu
e fo
r th
e Y
ea
r e
nd
ed
31
Ma
rch
20
21
an
d 3
1 M
arc
h 2
02
0 e
xce
pt
Ta
ta S
tee
l L
imite
d o
f R
s.
8,4
06
.86
la
kh
s i
n 3
1 M
arc
h 2
02
1.
37
Se
gm
en
t re
po
rtin
g (
Co
nti
nu
ed
)
C.
Ge
og
rap
hic
al
Info
rma
tio
n
Th
e g
eo
gra
ph
ica
l in
form
ati
on
an
aly
se
s t
he
Co
mp
an
y’s
re
ve
nu
es a
nd
no
n c
urr
en
t a
sse
ts h
eld
by t
he
co
mp
an
y’s
co
un
try o
f d
om
icile
(i.
e.
Ind
ia)
an
d o
the
r c
ou
ntr
ies.
In p
rese
nti
ng
ge
og
rap
hic
al
info
rma
tio
n,
se
gm
en
t re
ve
nu
e h
as b
ee
n b
ase
d o
n g
eo
gra
ph
ic l
oc
ati
on
of
the
cu
sto
me
rs a
nd
se
gm
en
t a
sse
ts w
hic
h
ha
ve
be
en
ba
se
d o
n g
eo
gra
ph
ic l
oc
ati
on
of
asse
ts.

INDUSTRIES
Seventyseventh annual report
Tata Industries Limited
114
NOTES TO STANDALONE FINANCIAL STATEMENTS
as at and for the year ended 31 March 2021
(Currency: Indian rupees in lakhs)
38
Ea
rnin
gs p
er
sh
are
Ba
sic
an
d d
ilu
ted
ea
rnin
gs p
er
sh
are
Pro
fit
/ (l
oss)
att
rib
uta
ble
to e
qu
ity s
ha
reh
old
ers
(A
)
(Rs.
in L
akh
s)
(6,5
88
.27
)-
(6,5
88
.27
)(3
,48
2.7
1)
32
,78
4.8
02
9,3
02
.09
We
igh
ted
ave
rag
e n
um
be
r o
f
eq
uity s
ha
res (
B)
(No
s)
10
7,9
54
,60
21
07
,95
4,6
02
10
7,9
54
,60
21
07
,95
4,6
02
10
7,9
54
,60
21
07
,95
4,6
02
Fa
ce
va
lue
of
eq
uity s
ha
res (
Rs.)
10
01
00
10
01
00
10
01
00
Ba
sic
an
d d
ilu
ted
ea
rnin
gs
pe
r s
ha
re (
A/B
) (R
s.)
(6.1
0)
-(6
.10
)(3
.23
)3
0.3
72
7.1
4
Pa
rtic
ula
rs
31
Ma
rch
20
21
31
Ma
rch
20
20
Co
nti
nu
ing
op
era
tio
ns
Dis
co
nti
nu
ed
op
era
tio
nTo
tal
Co
nti
nu
ing
op
era
tio
ns
Dis
co
nti
nu
ed
op
era
tio
nTo
tal

115
NOTES TO STANDALONE FINANCIAL STATEMENTS
as at and for the year ended 31 March 2021
(Currency: Indian rupees in lakhs)
39 Disclosure of assets taken on Lease
Right-of-use assets
Cost
As at 1 April 2020 47.96 5,245.60 1,703.88 6,997.44
Additions - 1,079.81 13.52 1,093.33
Disposals - - - -
Balance at 31 March 2021 47.96 6,325.41 1,717.40 8,090.77
Accumulated depreciation
and impairment
As at 1 April 2020 20.87 1,456.28 357.40 1,834.55
Depreciation 16.09 1,723.31 509.41 2,248.81
Balance at 31 March 2021 36.96 3,179.59 866.81 4,083.35
Carrying amounts
As at 1 April 2020 27.09 3,789.32 1,346.48 5,162.89
Balance at 31 March 2021 11.00 3,145.82 850.59 4,007.42
ParticularsVehicles IT assets
Premises
on leaseTotal
INR’ Lakhs INR’ Lakhs INR’ Lakhs INR’ Lakhs
Breakdown of lease expenses (other than interest and depreciation)
Short-term lease expense 167.45 571.07
Low value lease expense - -
Variable lease cost (2.64) 13.22
Total lease expense 164.81 584.29
ParticularsYear ended 31/03/20
INR Lakhs
Cash outflow on leases
Cash outflow for leases 2,470.15 2,101.38
ParticularsYear ended 31/03/20
INR Lakhs
Year ended 31/03/21
INR Lakhs
Year ended 31/03/21
INR Lakhs

INDUSTRIES
Seventyseventh annual report
Tata Industries Limited
116
NOTES TO STANDALONE FINANCIAL STATEMENTS
as at and for the year ended 31 March 2021
(Currency: Indian rupees in lakhs)
39 Disclosure of assets taken on Lease (Continued)
Maturity analysis
Lease liabilities 2,181.25 2,770.74 - 4,951.99
2,181.25 2,770.74 - 4,951.99
ParticularsLess than
1 year
Between
1 and 5
years
Over
5 yearsTotal
INR’ Lakhs INR’ Lakhs INR’ Lakhs INR’ Lakhs
Year ended 31 March 2020
Lease liabilities 2,323.82 3,993.86 - 6,317.68
2,323.82 3,993.86 - 6,317.68
ParticularsLess than
1 year
Between
1 and 5
years
Over
5 yearsTotal
INR’ Lakhs INR’ Lakhs INR’ Lakhs INR’ Lakhs
40 Employee benefits
a) Defined contribution plans
The Company makes monthly contributions to Superannuation fund and National
pension scheme as defined contribution retirement benefit plans for qualifying
employees.
The Company recognised Rs. 26.85 lakhs; (31 March 2020: Rs. 22.40 lakhs) for
superannuation contribution and Rs.25.27 lakhs; (31 March 2020: Rs.23.35 lakhs)
for National pension scheme in the Statement of profit and loss for the year ended
31 March 2021. These amounts are included in “Employee benefits expense” (See
note 33) under “Contribution to Provident and other funds” head. The contributions
payable to these plans by the Company are at the rates specified in the rules of the
schemes.
b) Defined benefit plans
Provident Fund
All eligible employees of the Company are entitled to receive benefits under the
provident fund plan in which both the employee and employer (at a determined rate)
contribute monthly to a Trust set up by the Company to manage the investments and
117
NOTES TO STANDALONE FINANCIAL STATEMENTS
as at and for the year ended 31 March 2021
(Currency: Indian rupees in lakhs)
distribute the amounts entitled to employees. This plan is a defined benefit plan as
the Company is obligated to provide its employees a rate of return which should,
at the minimum, meet the interest rate declared by Government administered
provident fund. A part of the Company’s contribution is transferred to Government
administered pension fund. The contributions made by the Company and the shortfall
of interest, if any, are recognized as an expense in the statement of profit and loss
under employee benefits expense. In accordance with an actuarial valuation of
provident fund liabilities on the basis of guidance issued by Actuarial Society of
India, there is no deficiency in the interest cost as the present value of the expected
future earnings of the fund is greater than the expected amount to be credited to the
individual members based on the expected guaranteed rate of interest of Government
administered provident fund.
The Company recognised Rs. 384.89 lakhs; (31 March 2020: Rs. 350.67 lakhs) for
provident fund contributions and Rs. 43.10 lakhs; (31 March 2020: Rs.37.43 lakhs)
for Employee pension scheme in the Statement of profit and loss for the year ended
31 March 2021. These amounts are included in “Employee benefits expense” (See
note 33) under “Contribution to Provident and other funds” head. The contributions
payable to these plans by the Company are at the rates specified in the rules of the
schemes.
Gratuity plan
The Company makes annual contributions to the Employees’ Group Gratuity-cum-
Life Assurance Scheme of the Tata AIA Life Insurance Company Limited, a funded
defined benefit plan for qualifying employees. The scheme provides for lump sum
payment to vested employees at retirement, death while in employment or on
termination of employment of an amount equivalent to 15 days salary for service
less than 15 years, three-fourth month’s salary for service of 15 years to 19 years,
one month salary for service of 20 years and one and half month salary for service
over 20 years, payable for each completed years of service or part thereof in excess
of six months. Vesting occurs upon completion of five years of service and is restricted
to a maximum of 30 months’ salary.
Post retirement medical benefits (PRMB) and pension to an ex-director
The Company is providing post retirement medical benefits to qualifying employees
based on the premium limit applicable to them at the time of retirement. Upon death
40 Employee benefits (Continued)
b) Defined benefit plans (Continued)
Provident Fund (Continued)

INDUSTRIES
Seventyseventh annual report
Tata Industries Limited
118
NOTES TO STANDALONE FINANCIAL STATEMENTS
as at and for the year ended 31 March 2021
(Currency: Indian rupees in lakhs)
of an employee while in service or retirement, the benefit payable to the spouse will
be restricted only to the extent of 50% of the relevant premium limit. No benefit will
be payable in case of resignation. The Company has procured a Group Mediclaim
policy from an insurance company for providing these benefits to the beneficiaries.
The Company is providing pension and medical benefit to two ex-directors. Upon
death of the directors, the benefit payable to the spouse will be restricted to the
extent of 50% of the benefit.
The following tables summarise the components of net benefit expense recognized
in the statement of profit and loss and the funded status and amounts recognised
in the balance sheet for the plan:
40 Employee benefits (Continued)
b) Defined benefit plans (Continued)
Provident Fund (Continued)
Reconciliation of present value of defined benefit obligation:
Rs. In Lakhs
Balance at the beginning of the year 1,365.31 293.85 1,541.94 1,088.78 287.96 1,491.97
Interest cost 91.48 19.69 104.20 83.51 22.09 114.43
Current service cost 126.38 12.99 - 105.15 14.50 -
Liability transferred in 16.41 - - - -
Liability transferred out - - - 0.53 - -
Benefit paid directly by the employer - (5.87) (147.98) - (20.65) (152.25)
Benefit paid from the fund (58.51) - - (54.41) - -
Actuarial (Gains) / Losses
on Obligations - Due to Change
in Demographic Assumptions (16.02) - - (0.94) 2.29 -
Actuarial (Gains) / Losses
on Obligations - Due to Change in
Financial Assumptions (5.83) (10.60) 72.86 71.04 35.36 104.56
Actuarial (Gains) / Losses
on Obligations - Due to Experience (61.23) (73.95) 312.83 71.65 (47.69) (16.78)
Balance at the end of the year 1,458.00 236.10 1,883.85 1,365.31 293.85 1,541.94
Particulars31 March 2021 31 March 2020
Gratuity PRMB Pension Gratuity PRMB Pension

119
NOTES TO STANDALONE FINANCIAL STATEMENTS
as at and for the year ended 31 March 2021
(Currency: Indian rupees in lakhs)
40 Employee benefits (Continued)
b) Defined benefit plans (Continued)
Reconciliation of the present value of plan assets:Rs. In Lakhs
Balance at the beginning of the year 1,246.37 - - 1,022.38 - -
Interest income 83.51 - - 78.42 - -
Contributions made 125.66 - - 130.33 - -
Assets transferred in 13.05 - - - - -
Assets transferred out - - - - - -
Benefit paid (58.51) - - (54.41) - -
Return on plan assets,
excluding interest income 35.97 - - 69.66 - -
Balance at the end of the year 1,446.05 - - 1,246.37 - -
Particulars31 March 2021 31 March 2020
Gratuity PRMB Pension Gratuity PRMB Pension
Expense recognised in profit and loss:
Rs. In Lakhs
Current service cost 126.38 12.99 - 105.15 14.50 -
Net interest cost 7.97 19.69 104.20 5.09 22.09 114.43
Expenses recognised 134.35 32.68 104.20 110.25 36.59 114.43
Expense Capitalised (Refer Note 49) (10.73) - - (6.56) - -
Recovery from Tata Digital - - - (0.92) - -
Expenses recognised (Net) 123.62 32.68 104.20 102.77 36.59 114.43
Particulars31 March 2021 31 March 2020
Gratuity PRMB Pension Gratuity PRMB Pension
Rs. In Lakhs
Present value of benefit obligation
at the end of the year 1,458.00 236.10 1,883.85 1,365.31 293.85 1,541.94
Less : Fair value of plan assets
at the end of the year (1,446.05) - - (1,246.37) - -
Net (liability) / asset recognized
in the balance sheet 11.95 236.10 1,883.85 118.95 293.85 1,541.94
Particulars31 March 2021 31 March 2020
Gratuity PRMB Pension Gratuity PRMB Pension
Amount recognised in the Balance Sheet:
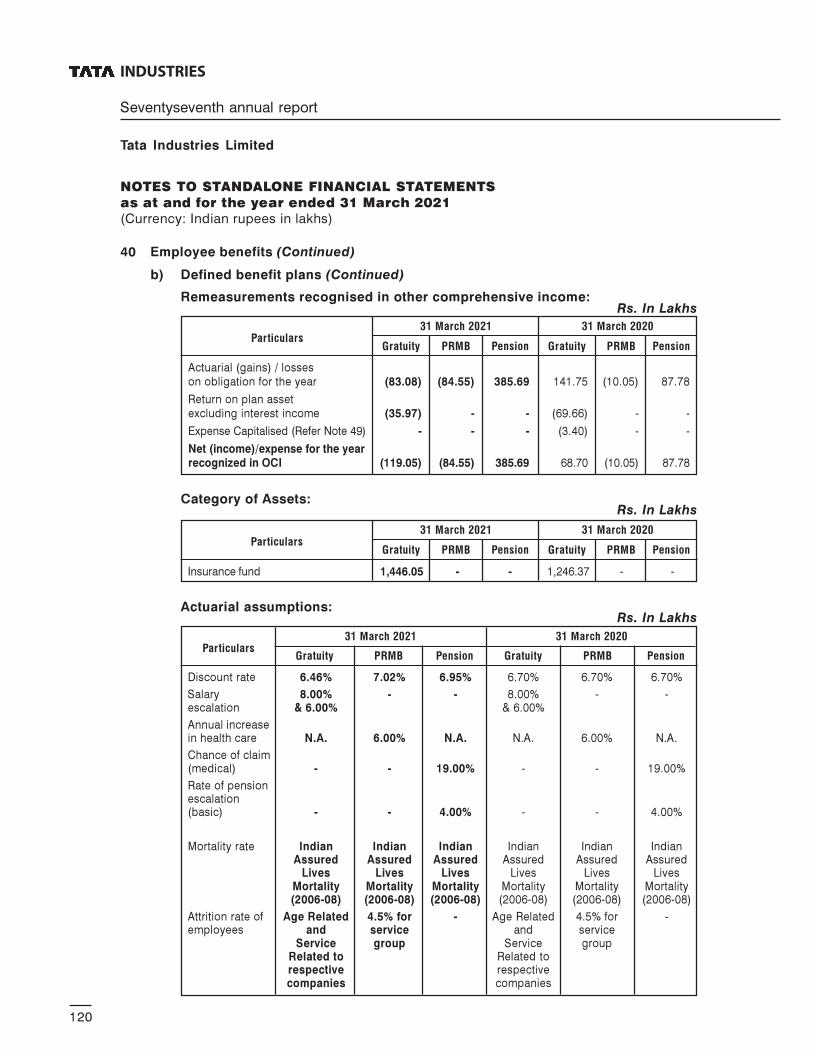
INDUSTRIES
Seventyseventh annual report
Tata Industries Limited
120
NOTES TO STANDALONE FINANCIAL STATEMENTS
as at and for the year ended 31 March 2021
(Currency: Indian rupees in lakhs)
40 Employee benefits (Continued)
b) Defined benefit plans (Continued)
Remeasurements recognised in other comprehensive income:
Actuarial (gains) / losseson obligation for the year (83.08) (84.55) 385.69 141.75 (10.05) 87.78
Return on plan assetexcluding interest income (35.97) - - (69.66) - -
Expense Capitalised (Refer Note 49) - - - (3.40) - -
Net (income)/expense for the yearrecognized in OCI (119.05) (84.55) 385.69 68.70 (10.05) 87.78
Particulars31 March 2021 31 March 2020
Gratuity PRMB Pension Gratuity PRMB Pension
Rs. In Lakhs
Category of Assets:Rs. In Lakhs
Insurance fund 1,446.05 - - 1,246.37 - -
Particulars31 March 2021 31 March 2020
Gratuity PRMB Pension Gratuity PRMB Pension
Actuarial assumptions:
Discount rate 6.46% 7.02% 6.95% 6.70% 6.70% 6.70%
Salary 8.00% - - 8.00% - -escalation & 6.00% & 6.00%
Annual increasein health care N.A. 6.00% N.A. N.A. 6.00% N.A.
Chance of claim(medical) - - 19.00% - - 19.00%
Rate of pensionescalation(basic) - - 4.00% - - 4.00%
Mortality rate Indian Indian Indian Indian Indian IndianAssured Assured Assured Assured Assured Assured
Lives Lives Lives Lives Lives LivesMortality Mortality Mortality Mortality Mortality Mortality(2006-08) (2006-08) (2006-08) (2006-08) (2006-08) (2006-08)
Attrition rate of Age Related 4.5% for - Age Related 4.5% for -employees and service and service
Service group Service groupRelated to Related torespective respectivecompanies companies
Particulars31 March 2021 31 March 2020
Gratuity PRMB Pension Gratuity PRMB Pension
Rs. In Lakhs

121
NOTES TO STANDALONE FINANCIAL STATEMENTS
as at and for the year ended 31 March 2021
(Currency: Indian rupees in lakhs)
40 Employee benefits (Continued)
b) Defined benefit plans (Continued)
Actuarial assumptions: (Continued)
Notes:
a) Discount rate is based on the prevailing market yields of Indian Government
securities as at the Balance Sheet date for the estimated term of the obligations.
(b) The estimates of future salary increases, considered in actuarial valuation, take
into account inflation, seniority, promotion and other relevant factors.
Sensitivity analysis:
Reasonably possible changes at the reporting date to one of the relevant actuarial
assumptions, holding other assumptions constant, would have affected the defined
benefit obligation by the amounts shown below:Rs. In Lakhs
Discount rate
1% change (60.36) 66.33 (29.02) 35.62 (134.07) 154.02
Salary Escalation
1% change 65.07 (60.38) - - - -
Employee Turnover
1% change (6.55) 6.83 - - - -
Pension escalation
1% change - - - - 121.74 (107.54)
Medical cost inflation
1% change - - 35.62 (29.52) - -
Particulars
31 March 2021
Gratuity PRMB Pension
Increase Decrease Increase Decrease Increase Decrease
Rs. In Lakhs
Discount rate
1% change (72.56) 82.21 (36.34) 44.84 (107.57) 123.78
Salary Escalation
1% change 80.51 (72.45) - - - -
Employee Turnover
1% change (6.58) 8.29 - - - -
Pension escalation
1% change - - - - 110.67 (97.37)
Medical cost inflation
1% change - - 44.70 (36.87) - -
Particulars
31 March 2020
Gratuity PRMB Pension
Increase Decrease Increase Decrease Increase Decrease
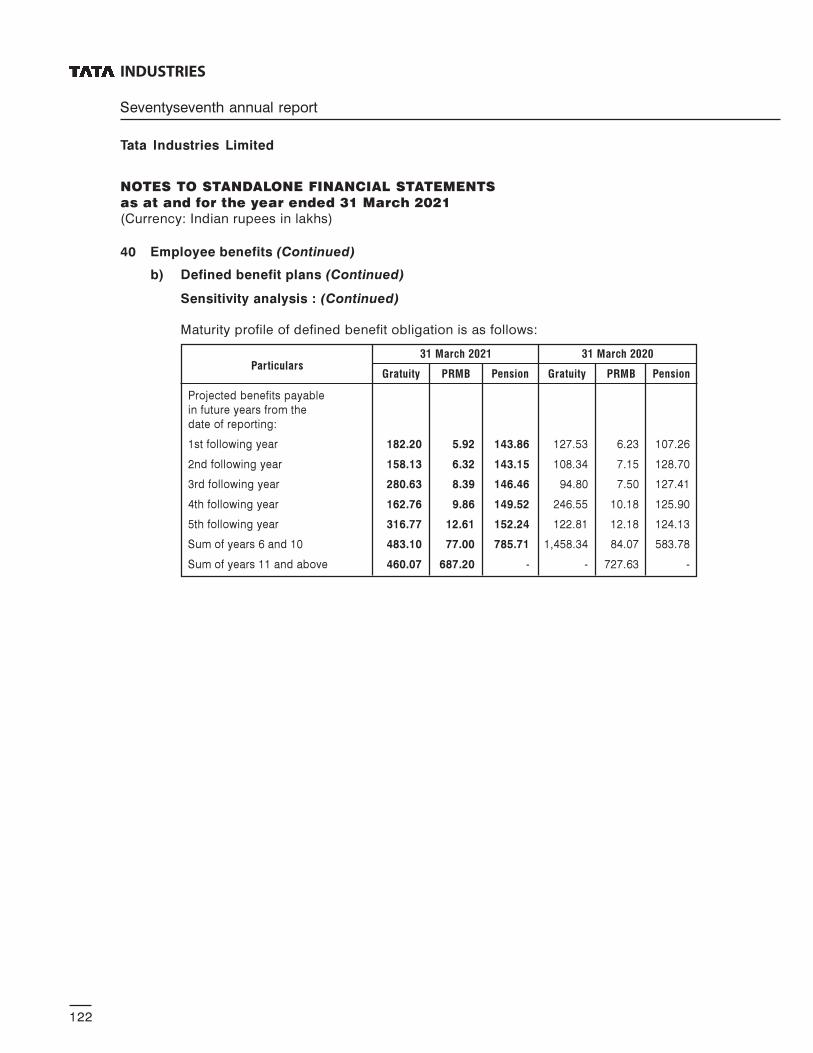
INDUSTRIES
Seventyseventh annual report
Tata Industries Limited
122
NOTES TO STANDALONE FINANCIAL STATEMENTS
as at and for the year ended 31 March 2021
(Currency: Indian rupees in lakhs)
40 Employee benefits (Continued)
b) Defined benefit plans (Continued)
Sensitivity analysis : (Continued)
Maturity profile of defined benefit obligation is as follows:
Projected benefits payable
in future years from the
date of reporting:
1st following year 182.20 5.92 143.86 127.53 6.23 107.26
2nd following year 158.13 6.32 143.15 108.34 7.15 128.70
3rd following year 280.63 8.39 146.46 94.80 7.50 127.41
4th following year 162.76 9.86 149.52 246.55 10.18 125.90
5th following year 316.77 12.61 152.24 122.81 12.18 124.13
Sum of years 6 and 10 483.10 77.00 785.71 1,458.34 84.07 583.78
Sum of years 11 and above 460.07 687.20 - - 727.63 -
Particulars31 March 2021 31 March 2020
Gratuity PRMB Pension Gratuity PRMB Pension

123
NOTES TO STANDALONE FINANCIAL STATEMENTS
as at and for the year ended 31 March 2021
(Currency: Indian rupees in lakhs)
41 Financial instruments
A. Accounting classification and fair values
The following table shows the carrying amounts and fair values of financial assets and financial
liabilities, including their levels in the fair value hierarchy.Rs. In Lakhs
Carrying amount
Financial assets
Cash and cash equivalents - - 725.21 725.21 - - - -
Bank balances
other than above - - 43.42 43.42 - - - -
Trade receivables - - 3,814.06 3,814.06 - - - -
Other receivables - - 3,267.13 3,267.13
Loans - - 36,700.78 36,700.78 - - - -
Investments 32,820.87 258,420.95 293,957.51 585,199.33 268,159.53 - 23,082.29 291,241.82
Other financial assets - - 1,223.19 1,223.19 - - - -
32,820.87 258,420.95 339,731.30 630,973.12 268,159.53 - 23,082.29 291,241.82
Financial liabilities
Trade payables - - 1,431.97 1,431.97 - - - -
Other payables - - 12.74 12.74 - - - -
Lease liability - - 4,948.19 4,948.19 - - - -
Debt Securities - - 25,264.61 25,264.61 - - - -
Borrowings - - 25,000.00 25,000.00 - - - -
Other financial liabilities - - 2,815.43 2,815.43 - - - -
- - 59,472.94 59,472.94 - - - -
Fair value
31 March 2021FVTPL FVOCI
AmortisedCost Total Level 1 Level 2 Level 3 Total
Carrying amount
Financial assets
Cash and cash equivalents - - 817.91 817.91 - - - -
Bank balancesother than above - - 40.81 40.81 - - - -
Trade receivables - - 3,703.93 3,703.93 - - - -
Other receivables - - 699.80 699.80 - - -
Loans - - 1.85 1.85 - - - -
Investments 43,973.89 73,804.98 278,815.47 396,594.34 100,269.16 - 17,509.71 117,778.87
Other financial assets - - 970.29 970.29 - - - -
43,973.89 73,804.98 285,050.06 402,828.93 100,269.16 - 17,509.71 117,778.87
Financial liabilities
Trade payables - - 2,144.97 2,144.97 - - - -
Other payables - - 10.54 10.54 - - - -
Borrowings - - 5,767.74 5,767.74 - - - -
Other financial liabilities - - 2,610.99 2,610.99 - - - -
- - 10,534.24 10,534.24 - - - -
Fair value
31 March 2020FVTPL FVOCI
AmortisedCost Total Level 1 Level 2 Level 3 Total
Rs. In Lakhs

INDUSTRIES
Seventyseventh annual report
Tata Industries Limited
124
NOTES TO STANDALONE FINANCIAL STATEMENTS
as at and for the year ended 31 March 2021
(Currency: Indian rupees in lakhs)
41 Financial instruments (Continued)
B. Measurement of fair values
The following table provides an analysis of financial instruments that are measured
subsequent to initial recognition at fair value, grouped into Level 1 to Level 3, as described
below:
Quoted prices in an active market (Level 1):
This level of hierarchy includes financial assets that are measured by reference to quoted
prices (unadjusted) in active markets for identical assets or liabilities. This category consists
of investment in quoted equity shares, and mutual fund investments.
Valuation techniques with observable inputs (Level 2) :
This level of hierarchy includes financial assets and liabilities, measured using inputs
other than quoted prices included within Level 1 that are observable for the asset or
liability, either directly (i.e. as prices) or indirectly (i.e. derived from prices). This level of
hierarchy includes derivative contracts.
Valuation techniques with significant unobservable inputs (Level 3):
This level of hierarchy includes financial assets and liabilities measured using inputs that
are not based on observable market data (unobservable inputs). Fair values are determined
in whole or in part, using a valuation model based on assumptions that are neither
supported by prices from observable current market transactions in the same instrument
nor are they based on available market data. This level of hierarchy includes investments
in unquoted equity shares and preference shares.
C. Valuation technique to determine fair value
The following methods and assumptions were used to estimate the fair values of financial
instruments:
(i) Financial assets and liabilities such as cash and cash equivalents, trade and other
receivables, loans (measured at amortised cost), trade and other payables,
borrowings, other financial assets and other financial liabilities are stated at carrying
value because their carrying amounts are a reasonable approximation of the fair
values due to their predominant short term nature.
(ii) Investments in quoted equity shares carried at fair value are based on market price
quotations as on 31 March. Costs of certain unquoted equity instruments has been
considered as an appropriate estimate of fair value because of a wide range of
possible fair value measurements and cost represents the best estimate of fair value
within that range. These investments in equity instruments are not held for trading.
Instead, they are held for medium or long term strategic purpose. Upon the application
of Ind AS 109, the Company has chosen to designate these investments in equity

125
NOTES TO STANDALONE FINANCIAL STATEMENTS
as at and for the year ended 31 March 2021
(Currency: Indian rupees in lakhs)
instruments at FVOCI as the directors believes this provides a more meaningful
presentation for medium or long term strategic investments, than reflecting changes
in fair value immediately in profit or loss.
(iii) Investments in unquoted preference shares carried at fair value are based on
discounted cash flow approach. The valuation model considers the present value of
expected cash inflows, discounted using a risk adjusted discount rate.
(iv) Management uses its best judgement in estimating the fair value of its financial
instruments. However, there are inherent limitations in any estimation technique.
(v) There have been no transfers between Level 1, Level 2 and Level 3 for the year
ended 31 March 2021 and 31 March 2020.
41 Financial instruments (Continued)
C. Valuation technique to determine fair value (Continued)
42 Financial Risk Management
The Company has exposure to the following risks arising from financial instruments:
- credit risk;
- market risk; and
- liquidity risk
Risk management framework
The Company’s Board of Directors has overall responsibility for the establishment and
oversight of the risk management framework. The Company’s management is responsible
for developing and monitoring the risk management policies.
The Company’s risk management policies are established to identify and analyse the
risks faced by the Company, to set appropriate risk limits and controls and to monitor
risks and adherence to limits. Risk management policies and systems are reviewed
regularly to reflect changes in market conditions and the Company’s activities. The
Company, through its training and management standards and procedures, aims to
maintain a disciplined and constructive control environment in which all employees
understand their roles and obligations.
The Company’s Board of Directors oversees how management monitors compliance with
the Company’s risk management policies and procedures, and reviews the adequacy of
the risk management framework in relation to the risks faced by the Company. The Board
of Directors is assisted in its oversight role by internal audit. Internal audit undertakes
both regular and ad hoc reviews of risk management controls and procedures, the results
of which are reported to the Board of Directors.

INDUSTRIES
Seventyseventh annual report
Tata Industries Limited
126
NOTES TO STANDALONE FINANCIAL STATEMENTS
as at and for the year ended 31 March 2021
(Currency: Indian rupees in lakhs)
i) Credit risk
Credit risk is the risk of financial loss to the Company if a customer or counterparty
to a financial instrument fails to meet its contractual obligations, and arises principally
from the Company’s receivables from customers, loans and investments in debt
securities.
The carrying amounts of financial assets represent the maximum credit risk exposure.
Trade receivables
Trade receivables of the Company are typically unsecured and derived from sales
made to a large number of independent customers. Customer credit risk is managed
by each business unit subject to established policies, procedures and control relating
to customer credit risk management. Before accepting any new customer, the
Company has appropriate level of control procedures to assess the potential
customer’s credit quality. The credit-worthiness of its customers are reviewed based
on their financial position, past experience and other relevant factors. Outstanding
customer receivables are reviewed periodically.
The credit risk related to the Trade receivables is mitigated by taking security deposits
/ bank guarantee / letter of credit / post dated negotiable instruments - as and where
considered necessary, setting appropriate credit terms and by setting and monitoring
internal limits on exposure to individual customers.
There is no substantial concentration of credit risk as the Revenue / Trade receivables
pertaining to any of the single external customer do not exceed 10% of Company
revenue.
The Company recognises a loss allowance for expected credit losses on Trade
Receivables that is at amortised cost. Loss allowance in respect of financial assets
is measured at an amount equal to life time expected credit losses and is calculated
as the difference between their carrying amount and the present value of the expected
future cash flows discounted at the original effective interest rate.
The movement in the allowance for impairment in respect of trade and other
receivables during the Year was as follows:
42 Financial Risk Management (Continued)
31 March 2021 31 March 2020
Opening balance 2,347.41 1,927.76
Add : Impairment loss recognised during the year 520.85 419.65
Less : Bad debts / advances written off / written back - -
Less: Provision pertaining to discontinued operation - -
Closing balance 2,868.26 2,347.41

127
NOTES TO STANDALONE FINANCIAL STATEMENTS
as at and for the year ended 31 March 2021
(Currency: Indian rupees in lakhs)
42 Financial Risk Management (Continued)
i) Credit risk (Continued)
Trade Receivables
Period (in Months)
(a) Not Due 1,673.15 2% 36.58 1,757.68 3% 54.75
(b) Overdue upto 3 months 1,284.51 8% 96.60 1,622.21 11% 174.93
(c) Overdue 3-6 months 658.34 33% 217.28 661.35 25% 166.68
(d) Overdue 6-12 months 947.00 64% 608.12 463.15 87% 404.11
(d) Overdue over 12 months 2,119.32 90% 1,909.68 1,546.95 100% 1,546.95
Total 6,682.32 43% 2,868.26 6,051.34 39% 2,347.41
As at 31 March 2021 As at 31 March 2020
Carrying
Amount
Weighted
Average
Loss Rate
Carrying
Amount
Weighted
Average
Loss Rate
Loss
Allowance
Loss
Allowance
Financial instruments and cash deposits
Credit risk from balances/investments with banks and financial institutions is managed
in accordance with the Company’s treasury risk management policy. Investments of
surplus funds are made only with approved counterparties and within limits assigned
to each counterparty. The limits are assigned based on corpus of investable surplus
and corpus of the investment avenue. The limits are set to minimize the concentration
of risks and therefore mitigate financial loss through counterparty’s potential failure
to make payments.
Financial guarantees
In respect of financial guarantees provided by the Company to banks and financial
institutions, the maximum exposure which the Company is exposed to is the maximum
amount which the Company would have to pay if the guarantee is called upon. Based
on the expectation at the end of the reporting period, the Company considers that it
is more likely than not that such an amount will not be payable under the guarantees
provided.
ii) Market risk
Market risk is the risk that the fair value of future cash flows of a financial instrument
will fluctuate because of changes in market prices. Market risk comprises three types
of risk: currency risk, interest rate risk and other price risk, such as equity price risk
and commodity risk. The value of a financial instrument may change as a result of
changes in the interest rates, foreign currency exchange rates, equity price
fluctuations, liquidity and other market changes. Financial instruments affected by
market risk include loans and borrowings, deposits, investments and derivative
financial instruments.

INDUSTRIES
Seventyseventh annual report
Tata Industries Limited
128
NOTES TO STANDALONE FINANCIAL STATEMENTS
as at and for the year ended 31 March 2021
(Currency: Indian rupees in lakhs)
(a) Currency risk
Foreign exchange risk arises on future commercial transactions and on all
recognised monetary assets and liabilities, which are denominated in a currency
other than the functional currency of the Company. The Company’s management
has set policy wherein exposure is identified, benchmark is set and monitored
closely, and accordingly suitable hedges are undertaken.
The Company’s foreign currency exposure arises mainly from foreign exchange
imports and exports, primarily with respect to USD, GBP and AED.
As at the end of the reporting period, the carrying amounts of the company’s
foreign currency denominated monetary financial assets and financial liabilities
in respect of the foreign currencies are as follows:
42 Financial Risk Management (Continued)
ii) Market risk (Continued)
Financial assets
USD - - - -
GBP - - - -
AED - - - -
Financial liabilities
USD 5,106 3.67 313,811 214.32
GBP - - - -
AED - - 14,875 2.91
Particulars
31 March 2021 31 March 2020
Amountin FC
Amountin Rs. Lakhs
Amountin FC
Amountin Rs. Lakhs
Foreign currency sensitivity analysis
A reasonably possible strengthening or (weakening) of the INR against all other
currencies at 31 March would have affected the measurement of financial
instruments denominated in a foreign currency and affected profit or loss by
the amounts shown below. This analysis assumes that all other variables remain
constant.
If INR had (strengthened)/weakened against foreign currency by 5%:
(Decrease) / increase
in profit for the year
USD (0.18) 0.18 (10.72) 10.72
AED - - (0.15) 0.15
Particulars31 March 2021 31 March 2020
Strengthening Weakening Strengthening Weakening
Rs. In Lakhs
129
NOTES TO STANDALONE FINANCIAL STATEMENTS
as at and for the year ended 31 March 2021
(Currency: Indian rupees in lakhs)
(b) Equity price risk
Equity Price Risk is related to the change in market reference price of the
investments in equity securities. The fair value of some of the Company’s
investments measured at fair value through other comprehensive income
exposes the Company to equity price risks. These investments are subject to
changes in the market price of securities. The fair value of Company’s investment
in quoted equity securities as at 31 March 2021 and 31 March 2020 was Rs.
237,847.44 and Rs. 58,576.37 respectively. A 10% change in equity price as at
31 March 2021 and 31 March 2020 would result in an impact of Rs.23,784.74
and Rs. 5,857.63, respectively. The impact is indicated on equity before
consequential tax impact, if any.
(c) Interest rate risk
Interest rate risk is the risk that the fair value or future cash flows of a financial
instrument will fluctuate because of changes in market rates.
As the Company does not have exposure to any floating-interest bearing assets
or liabilities, or any significant long-term fixed-interest bearing assets, its interest
income / expenses and related cash inflows / outflows are not affected by
changes in market interest rates.
The Company has investments in redeemable preference shares of subsidiaries,
associates and other companies. Future cash flows from these investments in
the form of dividends have fixed coupon rate and will not fluctuate due to changes
in market interest rates. However, the dividend distribution will be subject to
availability of adequate profits in the books of respective companies.
iii) Liquidity risk
Liquidity risk refers to the risk that the Company cannot meet its financial obligations.
The objective of liquidity risk management is to maintain sufficient liquidity and ensure
that funds are available for use as per requirements.
The following are the remaining contractual maturities of financial liabilities at the
reporting date. The amounts are gross and undiscounted, and include estimated
interest payments, if any:
42 Financial Risk Management (Continued)
ii) Market risk (Continued)

INDUSTRIES
Seventyseventh annual report
Tata Industries Limited
130
NOTES TO STANDALONE FINANCIAL STATEMENTS
as at and for the year ended 31 March 2021
(Currency: Indian rupees in lakhs)
42 Financial Risk Management (Continued)
iii) Liquidity risk (Continued)
Contractual maturities of Non-derivative financial liabilitiesRs. In Lakhs
Trade payables 1,444.71 - - 1,444.71
Lease liabilities 2,181.25 2,770.74 - 4,951.99
Debt Securities - 25,264.61 - 25,264.61
Borrowings (Other than
Debt Securities) 25,000.00 - - 25,000.00
Other financial liabilities 2,660.43 155.00 - 2,815.43
Total 31,286.39 28,190.35 - 59,476.74
As at 31 March 2021 Upto 1 year 1 to 5 year Above 5 year Total
Trade payables 2,155.51 - - 2,155.51
Lease liabilities 2,323.82 3,993.86 - 6,317.68
Other financial liabilities 2,455.99 155.00 - 2,610.99
Total 6,935.32 4,148.86 - 11,084.18
As at 31 March 2020 Upto 1 year 1 to 5 year Above 5 year Total
43 Capital management
The Company’s capital management is intended to create long term value for shareholders
by defining and meeting long-term and short-term goals of the Company.
The following additional information (other than what is already disclosed else-where) is
disclosed in terms of RBI Circular (Ref. No. DBNS.200/CGM CPR-2008) dated 1st August,
2008.
a) Capital Adequacy Ratio (CAR) - (CIC) / Capital to Risk Assets Ratio (CRAR)- (NBFC)
i) CAR 74 % 107 %
Sr.
No.Items
31 March 2021
(CAR-CIC)
31 March 2020
(CAR-CIC)

131
NOTES TO STANDALONE FINANCIAL STATEMENTS
as at and for the year ended 31 March 2021
(Currency: Indian rupees in lakhs)
43 Capital management (Continued)
b) Exposure to Real Estate Sector -Rs. In Lakhs
a) Direct exposure
(i) Residential Mortgages -
Lending fully secured by mortgages on residential - -
property that is or will be occupied by the borrower
or that is rented; (Individual housing loan upto Rs.15
lakhs may be shown separately)- Housing Loans to
employees
(ii) Commercial Real Estate -
Lending secured by mortgages on commercial real - -
estates (office buildings, retail space, multipurpose
commercial premises, mult i - family residential
buildings, multi-tenanted commercial premises,
industr ial or warehouse space, hotels, land
acquisition, development and construction, etc.).
Exposure would also include non-fund based (NFB)
limits;
(iii) Investments in Mortgage Backed Securities (MBS)
and other securitised exposures -
a. Residential, - -
b. Commercial Real Estate. - -
b) Indirect Exposure
Fund based and non-fund based exposures on National - -
Housing Bank (NHB) and Housing Finance Companies
(HFCs).
Others - -
Particular31 March
2021
31 March
2020

INDUSTRIES
Seventyseventh annual report
Tata Industries Limited
132
NOTES TO STANDALONE FINANCIAL STATEMENTS
as at and for the year ended 31 March 2021
(Currency: Indian rupees in lakhs)
43 Capital management (Continued)
c) Asset Liability Management
Maturity pattern of certain items of assets and liabilitiesRs. In Lakhs
# Mutual fund investments amounting to Rs. 30,312.09 lacs are not included above, since there is no setmaturity pattern for the same.
Figures in italics are in respect of the previous year.
1 dayto 1
month
Liabilities
Borrowings - - - - - - - - -from banks - - - - - - - - -
Market - - - - 15,000.00 10,000.00 25,264.61 - 50,264.61Borrowings - - - - - - - - -
Assets
Advances - - - - - - - - -- - - - - - - - -
Fixed Deposits - - - - 5.78 - - 37.64 43.42- - - - 5.37 - - 35.44 40.81
Investments# - 3,000.00 - 5,000.00 6,900.00 15,600.00 1,877.44 522,509.80 554,887.23- - - - - 18,500.00 2,176.09 334,225.45 354,901.54
Over 1month
to 2months
Over 2monthsupto 3
months
Over 3monthsupto 6months
Over 6monthsupto 1year
Over1 year
to 3years
Over3 years
to 5years
Over5 years
TotalParticular
d) Disclosure based on RBI guidelines for Ind AS compliant
NBFCs issued on 13th March 2020
Performing Assets
Standard Stage 1 3,195.99 145.96 3,050.03 12.78 133.18
Subtotal 3,195.99 145.96 3,050.03 12.78 133.18
Non-PerformingAssets (NPA)
Sub-standard Stage 2 3,755.38 2,735.09 1,020.29 3,755.38 (1,020.29)
Subtotal for NPA 3,755.38 2,735.09 1,020.29 3,755.38 (1,020.29)
Other items such as guarantee,loan commitment, etc. whichare in the scope of the Ind AS109, but not covered under RBI - - - - -
Subtotal - - - - -
Total Stage 1 3,195.99 145.96 3,050.03 12.78 133.18
Stage 2 3,755.38 2,735.09 1,020.29 3,755.38 (1,020.29)
Total 6,951.37 2,881.05 4,070.32 3,768.16 (887.12)
Rs. In Lakhs
Assets Classificationas per RBI norms
Net carryingamount
Differencebetween
provisions asper Ind AS 109
and RBI
(1) (2) (3) (4) (5)=(3)-(4) (6) (7)=(4)-(6)
Assetsclassification
as perInd AS 109
Grosscarrying
amount asper Ind AS
Lossallowance
(provisions)as per
Ind As 109
Provisionrequired
as per RBI
133
NOTES TO STANDALONE FINANCIAL STATEMENTS
as at and for the year ended 31 March 2021
(Currency: Indian rupees in lakhs)
43 Capital management (Continued)
d) Disclosure based on RBI guidelines for Ind AS compliant NBFCs issued on
13th March 2020 (Continued)
Year ended 31 March 2020
Performing Assets
Standard Stage 1 3,404.84 243.30 3,161.55 13.62 229.68
Subtotal 3,404.84 243.30 3,161.55 13.62 229.68
Non-PerformingAssets (NPA)
Sub-standard Stage 2 2,671.45 2,117.73 553.72 2,671.45 (553.72)
Subtotal for NPA 2,671.45 2,117.73 553.72 2,671.45 (553.72)
Other items such asguarantee, loan commitment,etc. which are in the scopeof the Ind As 109, but notcovered under RBI - - - - -
Subtotal - - - - -
Total Stage 1 3,404.84 243.30 3,161.55 13.62 229.68
Stage 2 2,671.45 2,117.73 553.72 2,671.45 (553.72)
Total 6,076.29 2,361.03 3,715.26 2,685.07 (324.04)
Rs. In Lakhs
Assets Classificationas per RBI norms
Net carryingamount
Differencebetween
provisions asper Ind AS 109
and RBI
(1) (2) (3) (4) (5)=(3)-(4) (6) (7)=(4)-(6)
Assetsclassification
as perInd AS 109
Grosscarrying
amount asper Ind AS
Lossallowance
(provisions)as per
Ind As 109
Provisionrequired
as per RBI

INDUSTRIES
Seventyseventh annual report
Tata Industries Limited
134
NOTES TO STANDALONE FINANCIAL STATEMENTS
as at and for the year ended 31 March 2021
(Currency: Indian rupees in lakhs)
Liabilities Side:
(1) Loans and Advances availed by the
Non-Banking Financial Company
inclusive of interest accrued thereon
but not paid [Refer Note 2]
(a) Debentures (Other than those
falling within the meaning of
Public Deposits)
(i) Secured - - - -
(ii) Unsecured 25,264.61 - - -
(b) Deferred Credits - - - -
(c) Term Loans 25,033.56 - - -
(d) Inter-corporate
Loans and Borrowings - - -
(e) Commercial Paper - - - -
(f) Other Loans:
(i) Loans repayable
on demand from banks - - - -
(ii) Others - - - -
(g) Subordinated Liabilities - - - -
Particulars
31 March 2021 31 March 2020
AmountOutstanding
AmountOutstanding
AmountOverdue
AmountOverdue
43 Capital management (Continued)
(e) Disclosures as required in terms of paragraph 21 of the Master Direction - Core
Investment Companies (Reserve Bank) Directions, 2016 :
Particulars
31 March 2021 31 March 2020
AmountOutstanding
AmountOutstanding
Assets Side:
(2) Break-up of Loans and Advances
including Bills Receivables
(other than those included in (4) below)
(a) Secured - -
(b) Unsecured 36,700.78 1.85
(3) Break-up of Leased Assets and stock — Not Applicable —
on hire and other assets counting
towards AFC activities [Refer Note 3]

135
NOTES TO STANDALONE FINANCIAL STATEMENTS
as at and for the year ended 31 March 2021
(Currency: Indian rupees in lakhs)
43 Capital management (Continued)
(e) Disclosures as required in terms of paragraph 21 of the Master Direction - Core
Investment Companies (Reserve Bank) Directions, 2016 : (Continued)
Particulars
31 March 2021 31 March 2020
AmountOutstanding
AmountOutstanding
(4) Break-up of Investments:
Current Investments:
1. Quoted:
(i) Shares : (a) Equity - -
(b) Preference - -
(ii) Debentures and Bonds - -
(iii) Units of Mutual Funds - -
(iv) Government Securities - -
(v) Others - -
2. Unquoted:
(i) Shares : (a) Equity - 12.15
(b) Preference - -
(ii) Debentures and Bonds 14,900.00 14,900.00
(iii) Units of Mutual Funds - -
(iv) Government Securities - -
(v) Others - -
Long term Investments:
1. Quoted:
(i) Shares : (a) Equity 237,847.44 58,576.36
(b) Preference - -
(ii) Debentures and Bonds - -
(iii) Units of Mutual Funds - -
(iv) Government Securities - -
(v) Others - -
2. Unquoted:
(i) Shares : (a) Equity 282,997.77 274,673.72
(b) Preference 3,542.03 3,151.45
(ii) Debentures and Bonds 15,600.00 3,600.00
(iii) Units of Mutual Funds 30,312.09 41,692.80
(iv) Government Securities - -
(v) Others
(a) Warrants - -
(b) Application Money pending allotment - -

INDUSTRIES
Seventyseventh annual report
Tata Industries Limited
136
NOTES TO STANDALONE FINANCIAL STATEMENTS
as at and for the year ended 31 March 2021
(Currency: Indian rupees in lakhs)
43 Capital management (Continued)
(e) Disclosures as required in terms of paragraph 21 of the Master Direction - Core
Investment Companies (Reserve Bank) Directions, 2016 : (Continued)
(5) Borrower group-wise classification of assets financed as in (2) and (3) above
1. Related Parties [Refer Note 4]
(a) Subsidiaries - - - - - -
(b) Companies in the same group - 36,700.00 36,700.00 - - -
(c) Other Related Parties - - - - - -
2. Other than Related Parties - 0.78 0.78 - 1.85 -
Total - 36,700.78 36,700.78 - 1.85 -
Category
31 March 2021 31 March 2020
SecuredSecured Total
Amount net of provision Amount net of provision
Unsecured Total Unsecured
(6) Investor group-wise classification of all investments (current and long-term) in shares
and securities (both quoted and unquoted):
1. Related Parties [Refer Note 4]
(a) Subsidiaries [Refer Note 5] 173,002.01 173,002.01 161,002.01 161,002.01
(b) Companies in the same group 381,883.29 381,883.29 193,909.67 193,909.67
(c) Other Related Parties - - - -
2. Other than Related Parties 1.94 1.94 2.00 2.00
Total 554,887.24 554,887.24 354,913.68 354,913.68
Category
31 March 2021 31 March 2020
Market Value /
Break up or
fair value or
NAV
[Refer Note 5]
Book Value
(Net of
Provisions/
Write-off)
Market Value /
Break up or
fair value or
NAV
[Refer Note 5]
Book Value
(Net of
Provisions/
Write-off)

137
NOTES TO STANDALONE FINANCIAL STATEMENTS
as at and for the year ended 31 March 2021
(Currency: Indian rupees in lakhs)
Notes :
1. The Company is registered as a Core Investment Company (CIC) with the Reserve Bank of
India and classified as a Systemically Important Non-Deposit Taking Core Investment Company
(CIC-ND-SI).
2. Includes interest accrued but not due amounting to Rs. 33.56 lacs (31st March, 2020 - Rs. Nil).
3. The Company is registered as a CIC-ND-SI and is not in the business of asset financing.
4. Includes Companies as defined in Para 3 (v) of the Core Investment Companies (Reserve
Bank) Directions, 2016.
5. All investment are stated at fair value as disclosed in note 35.
43 Capital management (Continued)
(e) Disclosures as required in terms of paragraph 21 of the Master Direction - Core
Investment Companies (Reserve Bank) Directions, 2016 : (Continued)
(7) Other Information
Particulars 31 March 2021 31 March 2020
(i) Gross Non-Performing Assets
(a) Related Parties [Refer Note 4] - -
(b) Other than Related Parties - -
(ii) Net Non-Performing Assets
(a) Related Parties [Refer Note 4] - -
(b) Other than Related Parties - -
(iii) Assets acquired in satisfaction of Debt - -
(f) Disclosures as required in terms of paragraph 30 of the Master Direction -
Core Investment Companies (Reserve Bank) Directions, 2016 : (Continued)
1 Components of ANW and other related information
Particulars 31/03/2021 31/03/2020
i ANW as a % of Risk Weighted Assets 73.95% 107.41%
ii unrealized appreciation in the book value of
quoted investments (Based on Average market
price of last 26 weeks) 76,956.11 19,228.71
iii diminution in the aggregate book value of
quoted investments (Based on Average market
price of last 26 weeks) 0.02 2,427.17
iv Leverage Ratio 0.14 0.02

INDUSTRIES
Seventyseventh annual report
Tata Industries Limited
138
NOTES TO STANDALONE FINANCIAL STATEMENTS
as at and for the year ended 31 March 2021
(Currency: Indian rupees in lakhs)
(f) Disclosures as required in terms of paragraph 30 of the Master Direction -
Core Investment Companies (Reserve Bank) (Continued)
2 Investment in Other CICs
Particulars 31/03/2021 31/03/2020
a Total amount representing any direct or
indirect capital contribution made by one CIC
in another CIC (including name of CICs)
Panatone Finvest Ltd. 12.15 12.15
Tata Sons Private Ltd. 3,086.85 3,086.85
Tata Capital Ltd 915.76 1,158.90
Total 4,014.75 4,257.90
b Number of CICs with their names wherein the
direct or indirect capital contribution exceeds
10% of Owned Funds Nil Nil
c Number of CICs with their names wherein
the direct or indirect capital contribution is
less than 10% of Owned Funds 3 3
3 Off Balance Sheet Exposure
Particulars 31/03/2021 31/03/2020
i Off balance sheet exposure 15,308.62 14,756.03
ii Financial Guarantee as a % of
total off-balance sheet exposure - -
iii Non-Financial Guarantee as a% of
total off-balance sheet exposure - -
iv Off balance sheet exposure
to overseas subsidiaries - -
v Letter of Comfort issued to any subsidiary - -

139
NOTES TO STANDALONE FINANCIAL STATEMENTS
as at and for the year ended 31 March 2021
(Currency: Indian rupees in lakhs)
(f) Disclosures as required in terms of paragraph 30 of the Master Direction -
Core Investment Companies (Reserve Bank) (Continued)
4 Investments
Particulars 31/03/2021 31/03/2020
Value of Investments
i Gross Value of Investments
a In India 452,687.32 264,094.47
b Outside India 132,512.01 132,512.01
ii Provisions for Depreciation
a In India - -
b Outside India - -
iii Net Value of Investments
a In India 452,687.32 264,094.47
b Outside India 132,512.01 132,512.01
Movement of provisions held towards
depreciation on investments.
i Opening Balance - -
ii Add : Provisions made during the year - -
iii Less : Write-off / write-back of excess
provisions during the year - -
iv Closing balance - -
Particulars 31/03/2021 31/03/2020
Return on Equity (RoE) (1.11)% 7.00%
Return on Assets (RoA) (1.00)% 6.74%
Net profit per employee (Rs. Lakhs) (11.11) 48.19
5 Business Ratios
31/03/2021 31/03/2020
Provisions for depreciation on Investment - -
Provision towards NPA 3,755.38 2,671.45
Provision made towards Income tax (252.53) -
Other Provision and Contingencies (with details) - -
Provision for Standard Assets 166.52 15.45
6 Provisions and ContingenciesRs. Lakhs
Break up of ‘Provisions and Contingencies’
shown under the Profit and Loss Account

INDUSTRIES
Seventyseventh annual report
Tata Industries Limited
140
NOTES TO STANDALONE FINANCIAL STATEMENTS
as at and for the year ended 31 March 2021
(Currency: Indian rupees in lakhs)
(f) Disclosures as required in terms of paragraph 30 of the Master Direction -
Core Investment Companies (Reserve Bank) (Continued)
Qubit Investments Pte. Ltd. None Singapore 157,560.94
8 Overseas Assets (for those with Joint Ventures and Subsidiaries abroad)
Rs. Lakhs
Name of the Joint Venture/SubsidiaryOther Partner
in the JVCountry Total Assets
7 Concentration of NPAs
ParticularsAmount in
Rs. lacs
Exposure as a
% of total assets
Total Exposure to top five NPA accounts - -
Note : Company do not have any financial NPA hence disclosed NIL in above table.
44a. Related Party and their Relationship
1 Joint Venture Partners
Tata Sons Private Limited
Tata Chemicals Limited
2 Subsidiary Company
Qubit Investments Pte. Ltd
*915 Labs, Inc.
Tata SmartFoodz Limited (formerly SmartFoodz Limited)
*Flisom - AG
*Flisom Hungary Kft
3 Associate Company
Indigene Pharmaceuticals Inc., USA.
ITel Industries Ltd.
Oriental Floratech India Ltd.
Oriental Seritech Ltd.
Tata Autocomp Systems Ltd.
Niskalp Infrastructure Services Ltd. (formerly Niskalp Energy Ltd.)
Impetis Biosciences Limited

141
NOTES TO STANDALONE FINANCIAL STATEMENTS
as at and for the year ended 31 March 2021
(Currency: Indian rupees in lakhs)
44a. Related Party and their Relationship (Continued)
6 Associates of Joint Venture Partners with whom transactions have been made
The Indian Hotels Company Limited
Voltas Limited
Tata Steel Limited
Tata Consumer Products Limited (formerly Tata Global Beverages Limited)
Tata Motors Limited
The Tata Power Company Limited
Titan Company Limited
Tata Elxsi Limited
*Tata Steel BSL Limited (formerly Bhushan Steel Limited) (under amalgamation)
*Tata Coffee Limited
*Piem Hotels Limited
*Tata Power Solar Systems Limited
*Roots Corpoartion Limited
*Concorde Motors Ltd
*The Tata Pigments Limited
*The Tinplate Company of India Limited
*Tata Steel Foundation
*Jamshedpur Football and Sporting Private Limited
*Noamundi Steel Limited (under strike off)
*Bamnipal Steel Limited (under amalgamation)
*Tata Steel Long Products Limited (formerly Tata Sponge Iron Limited)
*Jamshedpur Utilities & Services Company Limited
*Tata Steel Utilities and Infrastructure Services Limited
(formerly Jamshedpur Utilities & Services Company Limited)
5 Post Employment Benefit Plans of Tata Industries Limited
Tata Industries Employees PF Trust
Tata Industries Superannuation Fund Trust
Tata Industries Employees Gratuity Fund Trust
4 Joint Ventures
Inzpera Healthsciences Limited
Tata UniStore Limited

INDUSTRIES
Seventyseventh annual report
Tata Industries Limited
142
NOTES TO STANDALONE FINANCIAL STATEMENTS
as at and for the year ended 31 March 2021
(Currency: Indian rupees in lakhs)
7 Joint Venture of Joint Venture Partner with whom transactions have been made
Tata AIA Life Insurance Company Limited
Tata Sky Limited
44a. Related Party and their Relationship (Continued)
8 Key Management Personnel of the company
Mr. K. R. S. Jamwal (Executive Director)
Mr. F. N. Subedar
Mr. N. Srinath
Ms. Aarthi Subramanian
*Associate and subsidiary includes subsidiary of Associate and subsidiary of Subsidiary.
Note: KMPs of parent company has not been disclosed as there were no transactions
with them during the year.

143
NOTES TO STANDALONE FINANCIAL STATEMENTS
as at and for the year ended 31 March 2021
(Currency: Indian rupees in lakhs)
44
b.
Re
late
d P
art
y D
isc
losu
res f
or
the
ye
ar
en
de
d M
arc
h 3
1,
20
21
(C
on
tin
ue
d)
b)
Tra
nsa
cti
on
s a
nd
ba
lan
ce
s w
ith
re
late
d p
art
ies
Tra
nsa
ctio
ns
Rs.
In L
akh
s
Join
tV
en
ture
Pa
rtn
ers
Su
bsi
dia
rie
sA
sso
cia
tes
Ass
oci
ate
so
f Jo
int
Ve
ntu
reP
art
ne
r
Ke
yM
an
ag
em
en
tP
ers
on
ne
l
Join
tV
en
ture
JVs
of
Join
tV
en
ture
Pa
rtn
er
Po
stE
mp
loym
en
tB
en
efi
tTr
ust
Pu
rch
ase
of fix
ed
ass
ets
--
-26.0
9-
0.0
8-
-26.1
6-
--
--
--
--
Ren
deri
ng
of
serv
ices
2,2
40.3
66.2
1-
3,2
06.7
4-
29.6
9-
-5,4
82.9
92,0
49.0
3-
2.5
04,3
46.0
0-
10.7
7-
-6,4
08.3
1
Div
iden
d in
com
e238.0
4-
-192.2
7-
--
-430.3
1239.2
1-
1,3
84.9
0202.7
1-
--
-1,8
26.8
2
Bu
yback
of sh
are
s b
y-
-174.7
0-
--
--
174.7
0In
vest
ee c
om
pan
y-
--
--
--
--
Inte
rest
receiv
ed
-1,2
15.6
5-
--
1,1
46.6
2-
-2,3
62.2
7-
962.9
9-
--
53.9
8-
-1,0
16.9
8
Receiv
ing
of
serv
ices
2.9
9-
-50.7
3-
0.2
7-
-53.9
9164.1
5-
-27.6
5-
(0.1
2)
--
191.6
7
Insu
ran
ce e
xpen
ses
--
--
--
41.4
8-
41.4
8-
--
--
-35.0
3-
35.0
3
Eq
uity
/ p
refe
ren
ce
--
-475.6
9-
3,1
53.8
5-
-3,6
29.5
4co
ntr
ibu
tion
by
--
--
-32,2
02.5
4-
-32,2
02.5
4th
e c
om
pan
y
ICD
giv
en
to
--
--
-36,7
00.0
0-
-36,7
00.0
0R
ela
ted
part
y-
--
--
4,5
00.0
0-
-4,5
00.0
0
Rem
un
era
tion
to
--
--
353.7
5-
--
353.7
5
Exe
cu
tive D
irecto
rs-
--
-354.8
0-
--
354.8
0
Sitt
ing
Fees
to D
irect
ors
--
--
6.8
0-
--
6.8
0-
--
-0.8
0-
--
0.8
0
Reim
bu
rsem
en
ts o
f1.8
8-
--
--
--
1.8
8exp
en
ses
mad
e4.9
8-
--
-27.7
9-
-32.7
7
Reim
bu
rsem
en
t o
f139.0
80.8
00.7
7148.7
9-
--
-289.4
4o
ut
of
po
cket
exp
en
se290.3
713.7
0-
180.5
8-
-0.9
2-
485.5
7re
ceiv
ed
Rep
aym
en
t o
f IC
D-
--
--
--
--
by
Rela
ted
part
y-
2,5
00.0
0-
--
4,5
00.0
0-
-7,0
00.0
0
Tota
l

INDUSTRIES
Seventyseventh annual report
Tata Industries Limited
144
NOTES TO STANDALONE FINANCIAL STATEMENTS
as at and for the year ended 31 March 2021
(Currency: Indian rupees in lakhs)
44
b.
Re
late
d P
art
y D
isc
losu
res f
or
the
ye
ar
en
de
d M
arc
h 3
1,
20
21
(C
on
tin
ue
d)
b)
Tra
nsa
cti
on
s a
nd
ba
lan
ce
s w
ith
re
late
d p
art
ies
Tra
nsa
ctio
ns
Rs.
In L
akh
s
Join
tV
en
ture
Pa
rtn
ers
Su
bsi
dia
rie
sA
sso
cia
tes
Ass
oci
ate
so
f Jo
int
Ve
ntu
reP
art
ne
r
Ke
yM
an
ag
em
en
tP
ers
on
ne
l
Join
tV
en
ture
JVs
of
Join
tV
en
ture
Pa
rtn
er
Po
stE
mp
loym
en
tB
en
efi
tTr
ust
Tota
l
Sale
of fix
ed
ass
ets
--
--
--
--
-
-0.0
6-
--
--
-0.0
6
Inve
stm
en
t in
NC
D/O
CD
-12,0
00.0
0-
--
--
12,0
00.0
0
--
--
18,5
00.0
0-
18,5
00.0
0
Tran
sfers
to
Po
st2.5
3-
-1.7
8-
--
785.8
3790.1
3
em
plo
ymen
t b
en
efit
--
-6.7
7-
--
979.2
9986.0
7
Pu
rch
ase
of G
ift c
ard
s-
--
--
5.5
6-
-5.5
6
--
--
-5.6
9-
-5.6
9
Sale
of
med
icin
e-
--
5,1
76.4
5-
--
-5,1
76.4
5
--
-4,1
53.2
7-
--
-4,1
53.2
7
De
bit
Ba
lan
ce
s
Ou
tsta
nd
ing
as a
t
Ma
rch
31
, 2
02
1
Lo
an
s &
ad
van
ces
--
--
-36,7
00.0
0-
36,7
00.0
0
--
--
--
--
Inte
rest
accru
ed
-1,8
51.3
3-
--
--
-1,8
51.3
3
--
--
--
--
-
Receiv
ab
les
:278.0
02.9
9-
1,7
41.9
2-
17.1
6-
-2,0
40.0
7
Trad
e r
eceiv
ab
les
269.0
6-
2.9
51,8
71.9
3-
0.6
3-
-2,1
44.5
7
Receiv
ab
les
:-
0.7
6-
--
--
-0.7
6
Oth
er
receiv
ab
les
13.9
9-
--
--
--
13.9
9
Oth
er
no
n-f
inan
cia
l-
-1.0
0-
-1,1
46.6
225.4
1-
1,1
73.0
3
ass
ets
: O
ther
Ad
van
ces
--
5.4
7224.5
4-
-0.1
0-
230.1
2
Cre
dit
Ba
lan
ce
s
Ou
tsta
nd
ing
as a
t
Ma
rch
31
, 2
02
1
Am
ou
nts
paya
ble
--
-90.0
0-
--
-90.0
0
151.6
4-
--
-0.6
17.1
2-
159.3
7
Fig
ure
s i
n italics a
re i
n r
esp
ect
of
the
pre
vio
us y
ea
r

145
NOTES TO STANDALONE FINANCIAL STATEMENTS
as at and for the year ended 31 March 2021
(Currency: Indian rupees in lakhs)
44c. Related Party Disclosures for the year ended March 31, 2021 (Continued)
c) Disclosure of material transactions with related parties
Particulars 31 March 2021 31 March 2020
Rs. In Lakhs
1 Purchase of fixed assets -
Tata Elxsi Limited 26.09 -
2 Purchase of Gift cards -
Tata UniStore Limited 5.56 5.69
3 Sale of Goods (medicines) -
Tata Steel Limited 4,981.34 4,153.27
4 Rendering of services -
Tata Sons Private Limited 1,935.88 1,855.05
Tata Motors Ltd 1,431.86 1,930.24
Tata Steel Ltd 1,068.71 2,136.30
5 Receiving of services -
Tata Sons Private Limited 1.40 151.87
The Indian Hotels Co. Ltd. 18.37 10.92
Tata Elxsi Limited 30.50 -
6 Dividend income -
Tata Sons Private Limited 229.50 229.50
Tata Autocomp Systems Ltd. - 1,384.90
Tata Steel Ltd 96.52 125.47
The Tata Power Co. Ltd. 70.30 58.96
7 Interest income -
Tata Smartfoodz Limited 1,215.65 962.99
Tata UniStore Limited 1,146.62 53.98
8 Insurance expenses -
Tata AIA Life Insurance Company Ltd 41.48 35.03
9 Reimbursement of expenses made -
Tata UniStore Ltd - 27.79
Tata Sons Private Limited 1.88 4.98
10 Reimbursement of out of pocket expense received -
Tata Sons Private Limited 107.15 287.07
Tata Chemicals Limited 31.93 -
Tata Steel Limited 114.09 118.63

INDUSTRIES
Seventyseventh annual report
Tata Industries Limited
146
NOTES TO STANDALONE FINANCIAL STATEMENTS
as at and for the year ended 31 March 2021
(Currency: Indian rupees in lakhs)
44c. Related Party Disclosures for the year ended March 31, 2021 (Continued)
c) Disclosure of material transactions with related parties
Particulars 31 March 2021 31 March 2020
Rs. In Lakhs
Note: Therefore company has disclosed material transactions in excess of 10% of the
total related party transactions of the same type.
11 Directors’ remuneration -
Executive Directors’ Remuneration: 353.75 354.80
- K.R.S. Jamwal 353.75 354.80
Including :-
- Short term employee benefits 319.97 331.31
- Post employment benefits 33.78 23.49
12 Equity / preference contribution by the company
and share application money -
Tata UniStore Ltd 3,000.00 31,100.00
Tata Steel Ltd 475.69 -
13 Buyback of shares by Investee company
Impetis Biosciences Limited 174.70 -
14 Investment in NCD/OCD -
Tata SmartFoodz Limited 12,000.00 -
Tata UniStore Ltd - 18,500.00
15 ICD given
Tata UniStore Ltd 36,700.00 4,500.00
16 Repayment of ICD by Related party
Tata UniStore Ltd - 4,500.00
Tata SmartFoodz Limited - 2,500.00
17 Transfer to Post employment benefit trusts
Tata Industries Employees Gratuity Fund Trust
(Gratuity liability) 125.66 66.40
Tata Industries Employees PF Trust (PF liability) 779.74 879.48

147
NOTES TO STANDALONE FINANCIAL STATEMENTS
as at and for the year ended 31 March 2021
(Currency: Indian rupees in lakhs)
45 Contingent liabilities and commitments
Rs. In Lakhs
Commitments31 March
2020
a. Estimated amount of contracts remaining to be executed 1,501.93 379.59
on capital account and not provided for (net of advances)
b. Uncalled liability on investments in partly paid-up shares - 475.69
Contingent liabilities
c. Income tax matters in appeal 9,377.09 9,509.19
d. Demand order in relation to Value added tax (VAT) matters 3.24 3.59
e. Demand order in relation to Service tax matters - -
f. Show cause notices in relation to Service tax matters - -
g. Show cause notices in relation to - -
Goods and Services Tax matters
h. Other contingent liabilities and claims not acknowledged 136.35 97.96
as debt by the Company
31 March
2021
i. During the financial Year 2015-16, as per the Share Purchase Agreement (“SPA”) dated
May 22, 2015 entered into between Tata Industries Limited (“TIL”) and Tata International
Limited (the “Selling Shareholders”), Drive India Enterprise Solutions Limited (“DIESL”)
and TVS Logistics Services Limited (“TLSL”), the Selling Shareholders have jointly sold
their entire shareholding in DIESL to TLSL for a total consideration of Rs. 8,581.00 lakhs
(TIL share Rs. 4,290.00 lakhs).
As per the SPA, the Selling Shareholders have severally provided certain general and
specific indemnities to TLSL. General indemnities up to 100% of total consideration
received for breach of Representations and Warranties (R&W) relating to title of sale shares
and demand, if any, raised on TLSL/DIESL under Section 281 of the Income Tax Act,
1961. Specific indemnity up to Rs. 3,003.00 lakhs on account of liabilities in respect of
demands from statutory authorities presently pending against DIESL and claims that may
arise in future in respect of certain matters identified in SPA. Specific indemnities up to
20% of total consideration received in respect of claims arising from breaches of R&W
relating to tax compliances, no pending investigations and inquiries (10%) and other
general representations (10%).

INDUSTRIES
Seventyseventh annual report
Tata Industries Limited
148
NOTES TO STANDALONE FINANCIAL STATEMENTS
as at and for the year ended 31 March 2021
(Currency: Indian rupees in lakhs)
However, within the sub limits applicable to general and specific indemnities as specified
above, the maximum aggregate liability of each Selling Shareholder under this agreement
shall not exceed the aggregate amounts received by it from TLSL under the SPA and/or
DIESL under the Preference Share Agreement entered into on May 19, 2015 and the
liability of each Selling Shareholder to indemnify TLSL/DIESL shall be proportionate to
their respective pre-closing equity shareholding percentage. The claims can be made
before expiration of eight years from the closing date which is August 31, 2015.
The Selling Shareholders are also liable to indemnify, without limit, TLSL/DIESL in respect
of one legal proceeding identified in the SPA for which there are no claims on DIESL
presently. The potential future impact of such indemnities provided, if any, cannot be
ascertained presently.
46 The Company has terminated ClassEdge licensing contracts with 164 schools (2019-20
– 123 schools) which were not paying the amounts due as per such licensing contracts
and pursuant to such termination were resisting to hand over the possession of the assets
deployed at schools for display of ClassEdge content. The Company has filed legal suits
against such schools in City Civil Court at Mumbai for recovery of assets deployed and
amounts due under the licensing contract along with damages. The Company has taken
appropriate charge in its books of account for receivables from such schools amounting
to Rs. 906.39 lakhs (net of deferred revenue of Rs. 48.74 lakhs) [Rs. 591.47 lakhs (net
of deferred revenue of Rs. 54.11 lakhs)].
45 Contingent liabilities and commitments (Continued)

149
NOTES TO STANDALONE FINANCIAL STATEMENTS
as at and for the year ended 31 March 2021
(Currency: Indian rupees in lakhs)
47 Dues to micro and small enterprises
No companies have been identified under the Micro, Small and Medium Enterprises
Development Act, 2006 except those mentioned below. This disclosure has been
determined to the extent such parties have been identified on the basis of information
available with the Company. Accordingly, the disclosures as required by Notification No.
GSR 719(E) dated November 16, 2007 are not applicable. This has been relied upon by
the auditors.
Rs. In Lakhs
Particulars
As at
31 March
2020
As at
31 March
2021
The principal amount remaining unpaid to any supplier 0.31 55.54
as at the Year end of each accounting year.
The interest due thereon remaining unpaid to any - -
supplier at end of each accounting year.
The amount of interest paid by the Company in terms of - -
section 16 of the Micro, Small and Medium Enterprises
Development Act, 2006, along with the amount of the
payment made to the supplier beyond the appointed day
during the accounting year.
The amount of interest due and payable for the Year of - -
delay in making payment (which have been paid but beyond
the appointed day during the year) but without adding the
interest specified under the Micro, Small and Medium
Enterprises Development Act, 2006.
The amount of interest accrued and remaining unpaid - -
at the end of the accounting year.
The amount of further interest remaining due and payable - -
even in the succeeding years, until such date when the
interest dues as above are actually paid to the small
enterprise for the purpose of disallowance as a deductible
expenditure under section 23 of the Micro, Small and
Medium Enterprises Development Act, 2006.
INDUSTRIES
Seventyseventh annual report
Tata Industries Limited
150
NOTES TO STANDALONE FINANCIAL STATEMENTS
as at and for the year ended 31 March 2021
(Currency: Indian rupees in lakhs)
48 Capitalisation of Expenditure
During the year, the Company has capitalised the following expenses of revenue nature
to the cost of Intangible Assets. Consequently, expenses disclosed under the respective
notes are net of amounts capitalised by the Company.
Rs. In Lakhs
ParticularsYear ended
31 March 2021
Year ended
31 March 2020
Employee benefit expenses* 702.87 587.72
Other Expenses - 2.79
702.87 590.50
* includes Rs. 10.73 Lakhs pertaining to Gratuity for FY 2020-21.
49 Provisions
I) A brief description of the nature of the provisions made and the expected timing of any
resulting outflows of economic benefits;
a) Contingency provision for standard assets is a statutory provision made in accordance
with the Reserve Bank of India guidelines for NBFCs. No outflow of economic benefits
is expected for the same.
b) Provision for onerous lease rentals is on contracts where the unavoidable cost of
meeting the obligation under the contract exceeds the economic benefits expected
to be received under it. The lease contracts are for a period of four years and the
outflow will happen over the balance period of lease contract which is approximately
one to two years.
II) The movement in the above provisions is as follows:
As at 31 March 2021Rs. In Lakhs
Particulars
Contingency
provision for
standard assets
Balance at the beginning of the year 15.45 -
Add : Provision made during the year 151.07 -
Less : Payments / written back
during the year - -
Less : Provision pertaining to
discontinued operation - -
Balance at the Year end 166.52 -
Provision for
Onerous
lease rentals

151
NOTES TO STANDALONE FINANCIAL STATEMENTS
as at and for the year ended 31 March 2021
(Currency: Indian rupees in lakhs)
Rs. In Lakhs
Particulars
Contingency
provision for
standard assets
Balance at the beginning of the year 22.80 1.42
Add : Provision made during the year 2.83 -
Less : Payments / written back
during the year (10.17) (1.42)
Less : Provision pertaining to
discontinued operation - -
Balance at the Year end 15.45 -
Provision for
Onerous
lease rentals
49 Provisions (Continued)
II) The movement in the above provisions is as follows: (Continued)
As at 31 March 2020
50 Income tax
A. Amounts recognised in profit and loss
Tax expense of continuing operations does not include the following:
Current tax expense / (credit) - -
Short/(Excess) provision of tax for earlier years (252.53) -
Deferred tax (refer note D below) - -
Tax expense of continuing operations (252.53) -
31 March 2021 31 March 2020
Current tax expense / (credit) of - -
discontinuing operations
31 March 2021 31 March 2020

INDUSTRIES
Seventyseventh annual report
Tata Industries Limited
152
NOTES TO STANDALONE FINANCIAL STATEMENTS
as at and for the year ended 31 March 2021
(Currency: Indian rupees in lakhs)
50 Income tax (Continued)
B. Reconciliation of effective tax rate (for continuing operations)
The reconciliation between the statutory income tax rate applicable to the Company and
the effective Income tax rate of the Company is as follows:
The Company has decided to exercise the option for lower tax rate permitted under Section
115BAA of the Income-tax Act, 1961 as introduced by the Taxation Laws (Amendment)
Ordinance dated 20 September 2019.
Profit / (Loss) before tax (6,840.80) (3,482.71)
Company’s domestic tax rate 25.17% 25.17%
Current tax using Company’s domestic tax rates (1,721.69) (876.53)
Add / (Less): Difference due to
Non-deductible tax expenses 52.16 56.67
Effect of Overseas tax - -
Effect of earlier years tax (252.53) -
Utilisation/Carried forward of unrecognised losses 1,073.32 (1,676.53)
Tax free income - (482.83)
Unrecognised deferred tax assets / (liabilities) 82.68 (108.09)
Impact of different tax rate - -
Amount taxable on realised gains 513.53 2,969.82
Others 117.49
(252.53) -
31 March 2021 31 March 2020
C. Tax asset and liability
Non-current tax asset (net) 11,421.29 14,481.29
Current tax liability (net) 9.46 57.84
As at
31 March 2021
As at
31 March 2020

153
NOTES TO STANDALONE FINANCIAL STATEMENTS
as at and for the year ended 31 March 2021
(Currency: Indian rupees in lakhs)
50 Income tax (Continued)
D. Deferred tax asset/(liability)
Deferred tax assets
Property, plant and equipment and 105.02 165.40
Intangible assets
Unabsorbed depreciation - -
Provision for doubtful debts 721.88 590.80
Provision for employee benefits and 473.80 294.83
other provisions
Provision for advances 1.93 5.89
Lease liability 1,246.32 1,451.62
2,548.95 2,508.54
Deferred tax liabilities
Investments in mutual fund (269.18) 267.26
Right of use assets 1,008.53 1,299.40
739.35 1,566.65
Net deferred tax assets 1,809.60 941.89
Net deferred tax assets recognised - -
31 March 2021 31 March 2020
Note : The Company does not expect to generate sufficient taxable income against which
deferred tax asset could be realised. Accordingly, the net deferred tax assets has not
been recognised in the absence of convincing evidence for utilising the deferred tax
assets in the foreseeable future.
INDUSTRIES
Seventyseventh annual report
Tata Industries Limited
154
NOTES TO STANDALONE FINANCIAL STATEMENTS
as at and for the year ended 31 March 2021
(Currency: Indian rupees in lakhs)
50 Income tax (Continued)
E. Tax losses carried forward
Tax losses for which no deferred tax asset was recognised expire as follows:
Unabsorbed depreciation Never expire 7,153.61 72.43
7,153.61 72.43
Carried forward business loss
31-Mar-20 - 1,779.05
31-Mar-21 1,333.00 4,507.81
31-Mar-25 178.28 178.28
31-Mar-26 63,216.77 63,216.77
31-Mar-27 2,679.75 2,679.75
31-Mar-29 2,378.67 -
69,786.47 72,361.66
Long term capital loss
31-Mar-20 - -
31-Mar-21 - -
31-Mar-22 - -
31-Mar-24 5,040.08 3,909.63
31-Mar-25 724.11 724.11
31-Mar-26 3,715.58 3,715.58
31-Mar-27 64.06 64.06
31-Mar-29 167,212.39 -
176,756.21 8,413.37
Temporary deductible difference
on account of Indexation
on Investments Never expire 65,386.79 241,827.14
242,143.00 250,240.52
31 March
2021
31 March
2020
Expiry
date
Note: The amounts reflecting in previous year (i.e. 31 March 2020) are as per
the financial statements of the said year. However, tax losses reflecting in current year
(i.e. 31 March 2021) is based on income-tax return filed for FY 2019-20 and draft tax
computation for FY 2020-21.

155
NOTES TO STANDALONE FINANCIAL STATEMENTS
as at and for the year ended 31 March 2021
(Currency: Indian rupees in lakhs)
51 Disclosures under Ind AS 115 - Revenue from Contracts with Customers
A. In the following table, revenue from contracts with customers (including revenue related
to a discontinued operation) is disaggregated by primary geographical market, major
products and service lines and timing of revenue recognition:
Year ended 31 March 2021
Rs. In Lakhs
Particulars
Primary geographical
markets
Within India 5,116.24 6,876.04 7,938.51 1,295.44 21,226.23
Outside India - - - - -
Total revenue 5,116.24 6,876.04 7,938.51 1,295.44 21,226.23
Major Goods and
Service lines
Sale of traded goods - 1,140.39 7,672.76 - 8,813.15
Sale of services 5,116.24 5,735.65 265.75 1,295.44 12,413.08
Total revenue 5,116.24 6,876.04 7,938.51 1,295.44 21,226.23
Timing of Revenue
Recognition
Goods transferred
at point in time - 1,140.39 7,672.76 - 8,813.15
Service transferred
over time 5,116.24 5,735.65 265.75 1,295.44 12,413.08
Total revenue 5,116.24 6,876.04 7,938.51 1,295.44 21,226.23
Continuing Operations
Management
consultancy
Digital
classroom
solutions
Digital
health
platform
Insights &
quants
Total

INDUSTRIES
Seventyseventh annual report
Tata Industries Limited
156
NOTES TO STANDALONE FINANCIAL STATEMENTS
as at and for the year ended 31 March 2021
(Currency: Indian rupees in lakhs)
51 Disclosures under Ind AS 115 - Revenue from Contracts with Customers (Continued)
Year ended 31 March 2021
Rs. In Lakhs
Particulars
Primary geographical
markets
Within India 5,461.11 10,450.84 5,027.95 1,237.53 22,177.43
Outside India - - - - -
Total revenue 5,461.11 10,450.84 5,027.95 1,237.53 22,177.43
Major goods and
service lines
Sale of traded goods - 3,367.62 4,803.89 - 8,171.51
Sale of services 5,461.11 7,083.22 224.06 1,237.53 14,005.92
Total revenue 5,461.11 10,450.84 5,027.95 1,237.53 22,177.43
Timing of revenue
recognition
Goods transferred
at point in time - 3,367.62 4,803.89 - 8,171.51
Service transferred
over time 5,461.11 7,083.22 224.06 1,237.53 14,005.92
Total revenue 5,461.11 10,450.84 5,027.95 1,237.53 22,177.43
Continuing Operations
Management
consultancy
Digital
classroom
solutions
Digital
health
platform
Insights &
quants
Total
B. The following table provides information about receivables, contract assets and contract
liabilities from contracts with customers:
Particulars
Receivables, net of provisions 3,814.06 3,703.93
Unbilled Revenue, net of provisions
(contract assets) 543.87 627.97
Advance received from customers
(contract liabilities) 1,876.85 2,413.27
Continuing operations
31 March 2021 31 March 2020
157
NOTES TO STANDALONE FINANCIAL STATEMENTS
as at and for the year ended 31 March 2021
(Currency: Indian rupees in lakhs)
The unbilled revenue (contract assets) primarily relates to the Company’s rights to
consideration for work completed but not billed at the reporting date. The amount of
contract assets during the Year ended 31 March 2021 and 31 March 2020 were impacted
by impairment charges of Rs. 6.42 Lakhs and Rs. 2.14 Lakhs respectively. The contract
assets are transferred to receivables when the rights become unconditional. This usually
occurs when the Company issues an invoice to the customer.
The advance from customers (contract liabilities) primarily relate to the advance
consideration received from customers while invoicing in excess of revenues are classified
as income received in advance, both of which constitute contract liabilities. These will be
recognised as revenue when the Company fulfils the performance obligations.
The Company expects to fulfil the unsatisfied performance obligations over the contract
term ranging from 1 to 5 years.
51 Disclosures under Ind AS 115 - Revenue from Contracts with Customers (Continued)
52 Corporate social responsibility expenditure
As per the requirements of the provisions of Section 135 of the Companies Act, 2013
(the Act), the Company has constituted a CSR Committee of the Board consisting of
2 Directors.
Further, the Board of the Company is required to ensure that the company spends in
every financial year atleast 2% of the average net profits of the company made during the
three immediately preceding financial years in pursuance of its CSR Policy.
The Average net profit of the Company for the last 3 financial years was Rs. 8,139.83
lakhs and accordingly, total amount of Rs. 162.80 lakhs was required to be spent on CSR
activities in FY 2020-21.
The Company has spent a total of Rs. 164.65 lakhs during the year on the activities other
than construction/acquisition of any asset, the details of which are given below.
Company further confirms that no asset has been created in Company’s books from the
CSR spend listed below.

INDUSTRIES
Seventyseventh annual report
Tata Industries Limited
158
NOTES TO STANDALONE FINANCIAL STATEMENTS
as at and for the year ended 31 March 2021
(Currency: Indian rupees in lakhs)
52 Corporate social responsibility expenditure (Continued)
The Company does not carry any provisions for Corporate social responsibility expenses
for current year and previous year.
Rs. In Lakhs
Donation to Tata Community Initiatives Trust 50.00 -
Donation to Tata Education and
Development Trust 50.00 -
Donation to RTI 11.80 -
Donation to Leslie Sawhny Endowment 5.00 -
Contribution to World Vision India - Education
and vocational skill development 24.83 -
Vocational skill development for women and
self help groups at Karjat village
(sewing machines & oil machines) 10.63 -
Payment to Contractor engaged for
Rural Development water rejuvenation
project at Karjat village 12.39 -
164.65 -
Year ended
31 March 2021
Year ended
31 March 2020Particulars
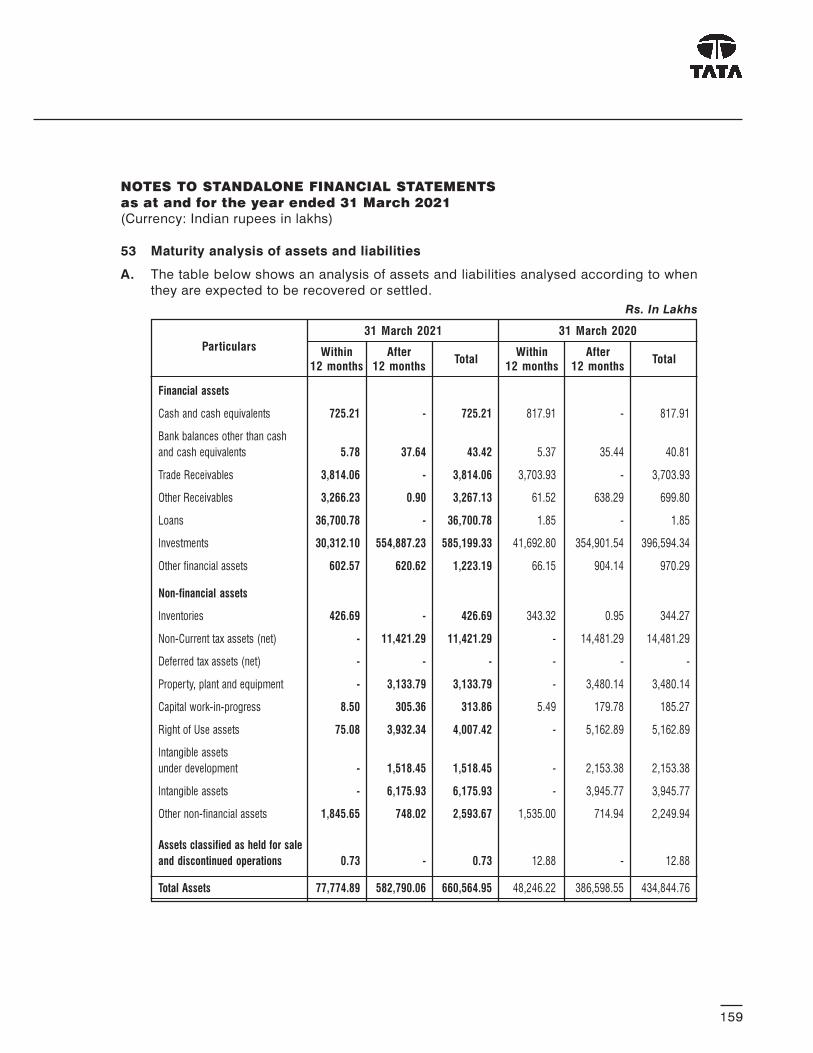
159
NOTES TO STANDALONE FINANCIAL STATEMENTS
as at and for the year ended 31 March 2021
(Currency: Indian rupees in lakhs)
53 Maturity analysis of assets and liabilities
A. The table below shows an analysis of assets and liabilities analysed according to when
they are expected to be recovered or settled.
Financial assets
Cash and cash equivalents 725.21 - 725.21 817.91 - 817.91
Bank balances other than cash
and cash equivalents 5.78 37.64 43.42 5.37 35.44 40.81
Trade Receivables 3,814.06 - 3,814.06 3,703.93 - 3,703.93
Other Receivables 3,266.23 0.90 3,267.13 61.52 638.29 699.80
Loans 36,700.78 - 36,700.78 1.85 - 1.85
Investments 30,312.10 554,887.23 585,199.33 41,692.80 354,901.54 396,594.34
Other financial assets 602.57 620.62 1,223.19 66.15 904.14 970.29
Non-financial assets
Inventories 426.69 - 426.69 343.32 0.95 344.27
Non-Current tax assets (net) - 11,421.29 11,421.29 - 14,481.29 14,481.29
Deferred tax assets (net) - - - - - -
Property, plant and equipment - 3,133.79 3,133.79 - 3,480.14 3,480.14
Capital work-in-progress 8.50 305.36 313.86 5.49 179.78 185.27
Right of Use assets 75.08 3,932.34 4,007.42 - 5,162.89 5,162.89
Intangible assets
under development - 1,518.45 1,518.45 - 2,153.38 2,153.38
Intangible assets - 6,175.93 6,175.93 - 3,945.77 3,945.77
Other non-financial assets 1,845.65 748.02 2,593.67 1,535.00 714.94 2,249.94
Assets classified as held for sale
and discontinued operations 0.73 - 0.73 12.88 - 12.88
Total Assets 77,774.89 582,790.06 660,564.95 48,246.22 386,598.55 434,844.76
Rs. In Lakhs
Particulars After
12 months
31 March 2021 31 March 2020
Within
12 monthsTotalTotal
Within
12 months
After
12 months

INDUSTRIES
Seventyseventh annual report
Tata Industries Limited
160
NOTES TO STANDALONE FINANCIAL STATEMENTS
as at and for the year ended 31 March 2021
(Currency: Indian rupees in lakhs)
53 Maturity analysis of assets and liabilities (Continued)
A. The table below shows an analysis of assets and liabilities analysed according to when
they are expected to be recovered or settled. (Continued)
Rs. In Lakhs
Particulars After
12 months
31 March 2021 31 March 2020
Within
12 monthsTotalTotal
Within
12 months
After
12 months
Financial liabilities
Trade payables 1,431.97 - 1,431.97 2,144.97 - 2,144.97
Other Payables 12.74 - 12.74 10.54 - 10.54
Debt Securities - 25,264.61 25,264.61 - - -
Borrowings
(Other than Debt Securities) 25,000.00 - 25,000.00 - - -
Other financial liabilities 2,660.43 155.00 2,815.43 2,455.99 155.00 2,610.99
Lease liability 1,444.74 3,503.45 4,948.19 2,173.99 3,593.75 5,767.74
Non-financial liabilities
Current tax liabilities (net) 9.46 - 9.46 57.84 - 57.84
Provisions 679.09 3,335.37 4,014.46 401.24 2,724.95 3,126.19
Other non-financial liabilities 2,174.83 - 2,174.83 2,739.47 2.03 2,741.50
Liabilities directly associated - - - - - -
with discontinued operations
Total liabilities 33,413.25 32,258.43 65,671.69 9,984.05 6,475.73 16,459.77
Net assets 44,361.64 550,531.63 594,893.26 38,262.18 380,122.82 418,384.99

161
NOTES TO STANDALONE FINANCIAL STATEMENTS
as at and for the year ended 31 March 2021
(Currency: Indian rupees in lakhs)
54 Estimation of uncertainties relating to the global health pandemic from COVID-19:
The Management has made an assessment of its liquidity position for next one year and
the impact of these circumstances on its operations as well as on financials reporting
areas i.e. Inventory, Impairment on Non-Financial Assets, Financial Instruments, Lease,
Revenue, Provisions, Contingent Liabilities and Contingent Assets, Modification or
termination of contracts or agreements, Going Concern Assessment, Income Taxes,
Property, Plant and Equipment, Presentation of Financial Statements and Borrowing Costs.
Management has concluded that no material adjustments are required in the financial
statements and believes that all possible impacts of known events arising from COVID
19 pandemic have been taken into account in preparation of these financial statements.
Management will continue to monitor and reassess the situation for future impact on the
financial statements.
Financial assets carried at fair value as at March 31, 2021 is Rs. 291,241.82 lakhs and
financial assets are carried at amortised cost as at March 31, 2021 is Rs. 339,731.30
lakhs. A significant part of the financial assets are classified as Level 1 having fair value
of Rs. 268,159.53 lakhs as at March 31,2021. The fair value of these assets is marked to
an active market which factors the uncertainties arising out of COVID-19.
As per our report of even date attached
For B S R & Co. LLP
Chartered Accountants
Firm’s Registration Number: 101248W/W-100022
Rekha Shenoy
Partner
Membership Number: 124219
Place : Mumbai
Date : 29th April, 2021
For and on behalf of the Board of Directors of
Tata Industries Limited
CIN: U44003MH1945PLC004403
K. R. S. Jamwal F. N. Subedar
Executive Director Director
DIN: 03129908 DIN: 00028428
S. Sriram
Chief Financial Officer &
Company Secretary
CS Membership Number: A10083
NOTES TO STANDALONE FINANCIAL STATEMENTS
as at and for the year ended 31 March 2021
(Currency: Indian rupees in lakhs)

THIS
PAG
E IS L
EFT I
NTE
NTIO
NALL
Y B
LAN
K

INDEPENDENT AUDITORS’ REPORT
To the Members of
Tata Industries Limited
Report on the Audit of Consolidated Financial Statements
Opinion
We have audited the consolidated financial statements of Tata Industries Limited (hereinafter
referred to as the “Holding Company”) and its subsidiaries (Holding Company and its
subsidiaries together referred to as “the Group”), its associates and its joint ventures, which
comprise the consolidated balance sheet as at 31 March 2021, and the consolidated statement
of profit and loss (including other comprehensive income), consolidated statement of changes
in equity and consolidated statement of cash flows for the year then ended, and notes to the
consolidated financial statements, including a summary of significant accounting policies and
other explanatory information (hereinafter referred to as “the consolidated financial statements”).
In our opinion and to the best of our information and according to the explanations given to
us, and based on the consideration of reports of other auditors on separate financial statements
of such subsidiaries, associates and joint ventures as were audited by the other auditors, the
aforesaid consolidated financial statements give the information required by the Companies
Act, 2013 (“Act”) in the manner so required and give a true and fair view in conformity with
the accounting principles generally accepted in India, of the consolidated state of affairs of
the Group, its associates and joint ventures as at 31 March 2021, of its consolidated loss and
other comprehensive income, consolidated changes in equity and consolidated cash flows
for the year then ended.
Basis for Opinion
We conducted our audit in accordance with the Standards on Auditing (SAs) specified under
section 143(10) of the Act. Our responsibilities under those SAs are further described in the
Auditor’s Responsibilities for the Audit of the Consolidated Financial Statements section of our
report. We are independent of the Group, its associates and joint ventures in accordance with
the ethical requirements that are relevant to our audit of the consolidated financial statements
in terms of the Code of Ethics issued by the Institute of Chartered Accountants of India and
the relevant provisions of the Act, and we have fulfilled our other ethical responsibilities in
accordance with these requirements. We believe that the audit evidence obtained by us along
with the consideration of audit reports of the other auditors referred to in sub paragraph (a)
of the “Other Matters” paragraph below, is sufficient and appropriate to provide a basis for our
opinion on the consolidated financial statements.
163

INDUSTRIES
Seventyseventh annual report
Tata Industries Limited
164
INDEPENDENT AUDITORS’ REPORT (Continued)
Other Information
The Holding Company’s management and Board of Directors are responsible for the other
information. The other information comprises the information included in the holding Company’s
annual report but does not include the financial statements and our auditors’ report thereon.
Our opinion on the consolidated financial statements does not cover the other information and
we do not express any form of assurance conclusion thereon.
In connection with our audit of the consolidated financial statements, our responsibility is to
read the other information and, in doing so, consider whether the other information is materially
inconsistent with the consolidated financial statements or our knowledge obtained in the audit
or otherwise appears to be materially misstated. If, based on the work we have performed and
based on the work done/ audit report of other auditors, we conclude that there is a material
misstatement of this other information, we are required to report that fact. We have nothing
to report in this regard.
Management’s and Board of Directors’ Responsibilities for the Consolidated Financial
Statements
The Holding Company’s Management and Board of Directors are responsible for the preparation
and presentation of these consolidated financial statements in term of the requirements of the
Act that give a true and fair view of the consolidated state of affairs, consolidated profit/ loss
and other comprehensive income, consolidated statement of changes in equity and
consolidated cash flows of the Group including its associates and joint ventures in accordance
with the accounting principles generally accepted in India, including the Indian Accounting
Standards (Ind AS) specified under section 133 of the Act. The respective Management and
Board of Directors of the companies included in the Group and of its associates and joint
ventures are responsible for maintenance of adequate accounting records in accordance with
the provisions of the Act for safeguarding the assets of each company and for preventing and
detecting frauds and other irregularities; the selection and application of appropriate accounting
policies; making judgments and estimates that are reasonable and prudent; and the design,
implementation and maintenance of adequate internal financial controls, that were operating
effectively for ensuring accuracy and completeness of the accounting records, relevant to the
preparation and presentation of the consolidated financial statements that give a true and fair
view and are free from material misstatement, whether due to fraud or error, which have been
used for the purpose of preparation of the consolidated financial statements by the Management
and Directors of the Holding Company, as aforesaid.
165
INDEPENDENT AUDITORS’ REPORT (Continued)
In preparing the consolidated financial statements, the respective Management and Board of
Directors of the companies included in the Group and of its associates and joint ventures are
responsible for assessing the ability of each company to continue as a going concern,
disclosing, as applicable, matters related to going concern and using the going concern basis
of accounting unless the respective Board of Directors either intends to liquidate the Company
or to cease operations, or has no realistic alternative but to do so.
The respective Board of Directors of the companies included in the Group and of its associates
and joint ventures is responsible for overseeing the financial reporting process of each company.
Auditor’s Responsibilities for the Audit of the Consolidated Financial Statements
Our objectives are to obtain reasonable assurance about whether the consolidated financial
statements as a whole are free from material misstatement, whether due to fraud or error, and
to issue an auditor’s report that includes our opinion. Reasonable assurance is a high level
of assurance but is not a guarantee that an audit conducted in accordance with SAs will always
detect a material misstatement when it exists. Misstatements can arise from fraud or error and
are considered material if, individually or in the aggregate, they could reasonably be expected
to influence the economic decisions of users taken on the basis of these consolidated financial
statements.
As part of an audit in accordance with SAs, we exercise professional judgment and maintain
professional skepticism throughout the audit. We also:
• Identify and assess the risks of material misstatement of the consolidated financial
statements, whether due to fraud or error, design and perform audit procedures responsive
to those risks, and obtain audit evidence that is sufficient and appropriate to provide a
basis for our opinion. The risk of not detecting a material misstatement resulting from
fraud is higher than for one resulting from error, as fraud may involve collusion, forgery,
intentional omissions, misrepresentations, or the override of internal control.
• Obtain an understanding of internal control relevant to the audit in order to design audit
procedures that are appropriate in the circumstances. Under section 143(3)(i) of the Act,
we are also responsible for expressing our opinion on the internal financial controls with
reference to the consolidated financial statements and the operating effectiveness of such
controls based on our audit.
• Evaluate the appropriateness of accounting policies used and the reasonableness of
accounting estimates and related disclosures made by the Management and Board of
Directors.

INDUSTRIES
Seventyseventh annual report
Tata Industries Limited
166
INDEPENDENT AUDITORS’ REPORT (Continued)
• Conclude on the appropriateness of Management and Board of Directors use of the going
concern basis of accounting in preparation of consolidated financial statements and,
based on the audit evidence obtained, whether a material uncertainty exists related to
events or conditions that may cast significant doubt on the appropriateness of this
assumption. If we conclude that a material uncertainty exists, we are required to draw
attention in our auditor’s report to the related disclosures in the consolidated financial
statements or, if such disclosures are inadequate, to modify our opinion. Our conclusions
are based on the audit evidence obtained up to the date of our auditor’s report. However,
future events or conditions may cause the Group and its associates and joint ventures
to cease to continue as a going concern.
• Evaluate the overall presentation, structure and content of the consolidated financial
statements, including the disclosures, and whether the consolidated financial statements
represent the underlying transactions and events in a manner that achieves fair
presentation.
• Obtain sufficient appropriate audit evidence regarding the financial information of such
entities or business activities within the Group and its associates and joint ventures to
express an opinion on the consolidated financial statements. We are responsible for the
direction, supervision and performance of the audit of financial information of such entities
included in the consolidated financial statements of which we are the independent auditors.
For the other entities included in the consolidated financial statements, which have been
audited by other auditors, such other auditors remain responsible for the direction,
supervision and performance of the audits carried out by them. We remain solely
responsible for our audit opinion. Our responsibilities in this regard are further described
in para (a) of the section titled ‘Other Matters’ in this audit report.
We believe that the audit evidence obtained by us along with the consideration of audit reports
of the other auditors referred to in sub-paragraph (a) of the Other Matters paragraph below,
is sufficient and appropriate to provide a basis for our audit opinion on the consolidated financial
statements.
We communicate with those charged with governance of the Holding Company and such
other entities included in the consolidated financial statements of which we are the independent
auditors regarding, among other matters, the planned scope and timing of the audit and
significant audit findings, including any significant deficiencies in internal control that we identify
during our audit.
We also provide those charged with governance with a statement that we have complied with
relevant ethical requirements regarding independence, and to communicate with them all
relationships and other matters that may reasonably be thought to bear on our independence,
and where applicable, related safeguards.

167
INDEPENDENT AUDITORS’ REPORT (Continued)
Other Matters
(a) We did not audit the financial statements of two (2) subsidiaries namely Qubit Investments
Pte. Limited and 915 Labs, Inc. whose financial statements reflect total assets (before
consolidation adjustments) of Rs. 159,285 lakhs as at 31 March 2021, total revenues
(before consolidation adjustments) of Rs. 4,549 lakhs and net cash inflows (before
consolidation adjustments) amounting to Rs. 433 lakhs for the year ended on that date,
as considered in the consolidated financial statements. The consolidated financial
statements also include the Group’s share of net loss (before consolidation adjustments)
(and other comprehensive income) of Rs. 571 lakhs for the year ended 31 March 2021,
in respect of an associate namely Impetis Biosciences Limited and joint ventures namely
Inzpera Healthsciences Limited whose financial statements have not been audited by us.
These financial statements have been audited by other auditors whose reports have been
furnished to us by the Management and our opinion on the consolidated financial
statements, in so far as it relates to the amounts and disclosures included in respect of
these subsidiaries, associate and joint venture , and our report in terms of sub-section
(3) of Section 143 of the Act, in so far as it relates to the aforesaid subsidiaries, joint
ventures and associates is based solely on the audit reports of the other auditors.
Certain of these subsidiaries are located outside India whose financial statements and
other financial information have been prepared in accordance with accounting principles
generally accepted in their respective countries and which have been audited by other
auditors under generally accepted auditing standards applicable in their respective
countries. The Company’s management has converted the financial statements of such
subsidiaries located outside India from accounting principles generally accepted in their
respective countries to accounting principles generally accepted in India. We have audited
these conversion adjustments made by the Company’s management. Our opinion in so
far as it relates to the balances and affairs of such subsidiaries located outside India is
based on the report of other auditors and the conversion adjustments prepared by the
management of the Company and audited by us.
(b) The financial statements of two (2) subsidiaries namely Flisom AG and Flisom Hungary
Kft., whose financial statements reflect total assets (before consolidation adjustments) of
Rs. 70,421 lakhs as at 31 March 2021, total revenues (before consolidation adjustments)
of Rs. 4,861 lakhs and net cash inflows amounting (before consolidation adjustments) to
Rs. 1,782 lakhs for the year ended on that date, as considered in the consolidated financial
statements, have not been audited either by us or by other auditors. The consolidated
financial statements also include the Group’s share of net loss (and other comprehensive
income) (before consolidation adjustments) of Rs. 683 lakhs for the year ended 31 March
2021, as considered in the consolidated financial statements, in respect of one (1)

INDUSTRIES
Seventyseventh annual report
Tata Industries Limited
168
INDEPENDENT AUDITORS’ REPORT (Continued)
associate namely Tata Autocomp Systems Limited, whose financial statements/financial
information have not been audited by us or by other auditors. These unaudited financial
statements/financial information have been furnished to us by the Management and our
opinion on the consolidated financial statements, in so far as it relates to the amounts
and disclosures included in respect of these Subsidiaries and associates, and our report
in terms of sub-sections (3)of Section 143 of the Act in so far as it relates to the aforesaid
subsidiaries and associate, is based solely on such unaudited financial statements /
financial information. In our opinion and according to the information and explanations
given to us by the Management, these financial statements/financial information are not
material to the Group.
(c) The financial statements / financial information of four (4) associates namely, Oriental
Seritech Ltd, Oriental Floratech (India) Ltd, ITEL Industries Ltd and Niskalp Infrastructure
Services Ltd, valued at Rs. Nil in the consolidated financial statements, have not been
considered in the consolidated financial statements. In our opinion and according to the
information and explanations given to us by the management, the financial information
of these associates is not material to the Group.
(d) The financial statements of one (1) associate Indigene Pharmaceuticals Inc. valued at Rs
Nil in the consolidated financial statements, are not available for past several years and
no adjustment is made for the same in the consolidated financial statements. In our opinion
and according to the information and explanations given to us by the management, the
financial information of this associate is not material to the Group.
Our opinion on the consolidated financial statements, and our report on Other Legal and
Regulatory Requirements below, is not modified in respect of the above matters with
respect to our reliance on the work done and the reports of the other auditors referred
to in sub paragraphs (a) above and the financial statements/financial information certified
by the Management of Holding Company referred to in sub paragraph (b), (c) and (d).
Report on Other Legal and Regulatory Requirements
A. As required by Section 143(3) of the Act, based on our audit and on the consideration
of reports of the other auditors on separate financial statements of such subsidiaries,
associates, joint ventures as were audited by other auditors, as noted in the ‘Other Matters’
paragraph, we report, to the extent applicable, that:
a) We have sought and obtained all the information and explanations which to the best
of our knowledge and belief were necessary for the purposes of our audit of the
aforesaid consolidated financial statements.

169
INDEPENDENT AUDITORS’ REPORT (Continued)
b) In our opinion, proper books of account as required by law relating to preparation
of the aforesaid consolidated financial statements have been kept so far as it appears
from our examination of those books and the reports of the other auditors.
c) The consolidated balance sheet, the consolidated statement of profit and loss
(including other comprehensive income), the consolidated statement of changes in
equity and the consolidated statement of cash flows dealt with by this Report are in
agreement with the relevant books of account maintained for the purpose of
preparation of the consolidated financial statements.
d) In our opinion, the aforesaid consolidated financial statements comply with the Ind
AS specified under section 133 of the Act.
e) On the basis of the written representations received from the directors of the Holding
Company as on 31 March 2021 taken on record by the Board of Directors of the
Holding Company and the reports of the statutory auditors of its subsidiary
companies, associate companies and joint ventures incorporated in India, none of
the directors of the Group companies, its associate companies, and joint ventures
incorporated in India is disqualified as on 31 March 2021 from being appointed as
a director in terms of Section 164(2) of the Act.
f) With respect to the adequacy of the internal financial controls with reference to
financial statements of the Holding Company, its subsidiary companies, associate
companies and joint ventures incorporated in India and the operating effectiveness
of such controls, refer to our separate Report in “Annexure A”.
B. With respect to the other matters to be included in the Auditor’s Report in accordance
with Rule 11 of the Companies (Audit and Auditor’s) Rules, 2014, in our opinion and to
the best of our information and according to the explanations given to us and based on
the consideration of the reports of the other auditors on separate financial statements of
the subsidiaries, associates and joint ventures, as noted in the ‘Other Matters’ paragraph:
i. The consolidated financial statements disclose the impact of pending litigations as
at 31 March 2021 on the consolidated financial position of the Group, its associates
and joint ventures. Refer Note 50 to the consolidated financial statements.
ii. The Group, its associates and joint ventures did not have any material foreseeable
losses on long-term contracts including derivative contracts during the year ended
31 March 2021.

INDUSTRIES
Seventyseventh annual report
Tata Industries Limited
170
INDEPENDENT AUDITORS’ REPORT (Continued)
iii. There are no amounts which are required to be transferred to the Investor Education
and Protection Fund by the Holding Company or its subsidiary companies, associate
companies and joint ventures incorporated in India during the year ended 31 March
2021.
iv. The disclosures in the consolidated financial statements regarding holdings as well
as dealings in specified bank notes during the period from 8 November 2016 to 30
December 2016 have not been made in the financial statements since they do not
pertain to the financial year ended 31 March 2021.
C. With respect to the matter to be included in the Auditor’s report under section 197(16):
In our opinion and according to the information and explanations given to us and based
on the reports of the statutory auditors of such subsidiary companies, associate companies
and joint ventures incorporated in India which were not audited by us, the remuneration
paid during the current year by the Holding Company, its subsidiary companies, associate
companies and joint ventures to its directors is in accordance with the provisions of Section
197 of the Act. The remuneration paid to any director by the Holding Company, its
subsidiary companies, associate companies and joint ventures is not in excess of the
limit laid down under Section 197 of the Act. The Ministry of Corporate Affairs has not
prescribed other details under Section 197(16) which are required to be commented
upon by us.
For B S R & Co. LLP
Chartered Accountants
Firm’s Registration No : 101248W/W-100022
Rekha Shenoy
Partner
Place : Mumbai Membership No : 124219
Date : 29th April, 2021 UDIN : 21124219AAAAAZ5832

171
ANNEXURE A TO THE INDEPENDENT AUDITORS’ REPORT
Annexure A to the Independent Auditors’ report on the consolidated financial statements
of Tata Industries Limited for the year ended 31 March 2021
Report on the internal financial controls with reference to the aforesaid consolidated
financial statements under Clause (i) of Sub-section 3 of Section 143 of the Companies
Act, 2013
(Referred to in paragraph A (f) under ‘Report on Other Legal and Regulatory Requirements’
section of our report of even date)
Opinion
In conjunction with our audit of the consolidated financial statements of the Company as of
and for the year ended 31 March 2021, we have audited the internal financial controls with
reference to consolidated financial statements of Tata Industries Limited (hereinafter referred
to as “the Holding Company”) and such companies incorporated in India under the Companies
Act, 2013 which are its subsidiary companies, its associate companies and its joint venture
companies, as of that date.
In our opinion, the Holding Company and such companies incorporated in India which are its
subsidiary companies, its associate companies and joint venture companies, have, in all
material respects, adequate internal financial controls with reference to consolidated financial
statements and such internal financial controls were operating effectively as at 31 March 2021,
based on the internal financial controls with reference to consolidated financial statements
criteria established by such companies considering the essential components of such internal
controls stated in the Guidance Note on Audit of Internal Financial Controls Over Financial
Reporting issued by the Institute of Chartered Accountants of India (the “Guidance Note”).
Management’s Responsibility for Internal Financial Controls
The respective Company’s management and the Board of Directors are responsible for
establishing and maintaining internal financial controls with reference to consolidated financial
statements based on the criteria established by the respective Company considering the
essential components of internal control stated in the Guidance Note. These responsibilities
include the design, implementation and maintenance of adequate internal financial controls
that were operating effectively for ensuring the orderly and efficient conduct of its business,
including adherence to the respective company’s policies, the safeguarding of its assets, the
prevention and detection of frauds and errors, the accuracy and completeness of the accounting
records, and the timely preparation of reliable financial information, as required under the
Companies Act, 2013 (hereinafter referred to as “the Act”).

INDUSTRIES
Seventyseventh annual report
Tata Industries Limited
172
Auditors’ Responsibility
Our responsibility is to express an opinion on the internal financial controls with reference to
consolidated financial statements based on our audit. We conducted our audit in accordance
with the Guidance Note and the Standards on Auditing, prescribed under section 143(10) of
the Act, to the extent applicable to an audit of internal financial controls with reference to
consolidated financial statements. Those Standards and the Guidance Note require that we
comply with ethical requirements and plan and perform the audit to obtain reasonable assurance
about whether adequate internal financial controls with reference to consolidated financial
statements were established and maintained and if such controls operated effectively in all
material respects.
Our audit involves performing procedures to obtain audit evidence about the adequacy of the
internal financial controls with reference to consolidated financial statements and their operating
effectiveness. Our audit of internal financial controls with reference to consolidated financial
statements included obtaining an understanding of internal financial controls with reference
to consolidated financial statements, assessing the risk that a material weakness exists, and
testing and evaluating the design and operating effectiveness of the internal controls based
on the assessed risk. The procedures selected depend on the auditor’s judgement, including
the assessment of the risks of material misstatement of the consolidated financial statements,
whether due to fraud or error.
We believe that the audit evidence we have obtained and the audit evidence obtained by the
other auditors of the relevant subsidiary companies, associate companies and joint venture
companies in terms of their reports referred to in the Other Matters paragraph below, is sufficient
and appropriate to provide a basis for our audit opinion on the internal financial controls with
reference to consolidated financial statements.
Meaning of Internal Financial controls with Reference to Consolidated Financial
Statements
A company’s internal financial controls with reference to consolidated financial statements is
a process designed to provide reasonable assurance regarding the reliability of financial
reporting and the preparation of consolidated financial statements for external purposes in
accordance with generally accepted accounting principles. A company’s internal financial
controls with reference to consolidated financial statements includes those policies and
procedures that (1) pertain to the maintenance of records that, in reasonable detail, accurately
and fairly reflect the transactions and dispositions of the assets of the company; (2) provide
reasonable assurance that transactions are recorded as necessary to permit preparation of
financial statements in accordance with generally accepted accounting principles, and that
receipts and expenditures of the company are being made only in accordance with
ANNEXURE A TO THE INDEPENDENT AUDITORS’ REPORT (Continued)

173
authorisations of management and directors of the company; and (3) provide reasonable
assurance regarding prevention or timely detection of unauthorised acquisition, use, or
disposition of the company’s assets that could have a material effect on the financial statements.
Inherent Limitations of Internal Financial controls with Reference to consolidated Financial
Statements
Because of the inherent limitations of internal financial controls with reference to consolidated
financial statements, including the possibility of collusion or improper management override
of controls, material misstatements due to error or fraud may occur and not be detected. Also,
projections of any evaluation of the internal financial controls with reference to consolidated
financial statements to future periods are subject to the risk that the internal financial controls
with reference to consolidated financial statements may become inadequate because of
changes in conditions, or that the degree of compliance with the policies or procedures may
deteriorate.
Other Matters
(A) Our aforesaid reports under Section 143(3)(i) of the Act on the adequacy and operating
effectiveness of the internal financial controls with reference to consolidated financial
statements insofar as it relates to four associate companies namely Impetis Biosciences
Limited, Itel Industries Limited, Oriental Floratech (India) Limited and Oriental Seritech
Limited and one joint venture company namely Inzpera Healthsciences Limited, which
are companies incorporated in India, is based on the corresponding reports of the auditors
of such companies incorporated in India.
(B) The adequacy and operating effectiveness of the internal financial controls over financial
reporting insofar as it relates to one associate incorporated in India, namely Tata AutoComp
Systems Limited, is unaudited. In our opinion and according to the information and
explanations given to us by the management, the adequacy and operating effectiveness
of the internal financial controls over financial reporting of the associate is not material
to the Group.
ANNEXURE A TO THE INDEPENDENT AUDITORS’ REPORT (Continued)
For B S R & Co. LLP
Chartered Accountants
Firm’s Registration No : 101248W/W-100022
Rekha Shenoy
Partner
Place : Mumbai Membership No : 124219
Date : 29th April, 2021 UDIN : 21124219AAAAAZ5832

INDUSTRIES
Seventyseventh annual report
Tata Industries Limited
174
CONSOLIDATED BALANCE SHEET AS AT 31 MARCH 2021
(Currency: Indian rupees in lakhs)Note 31 March 2021 31 March 2020
AssetsFinancial assets
Cash and cash equivalents 4 8,380.54 17,968.53Bank balances other than cash and cash equivalents 5 6,089.58 9,399.87Receivables 6(i) Trade Receivables 3,946.62 4,200.57(ii) Other Receivables 1,630.88 260.98Loans 7 84,431.41 49,141.59Investments 8 303,318.31 128,234.73Other financial assets 9 5,864.71 4,909.65
413,662.05 214,115.92Non-financial assets
Equity accounted investees 10 64,157.60 98,954.80Inventories 11 3,541.05 2,501.63Non-current tax assets (net) 12 11,421.29 14,489.65Deferred tax assets (net) 581.99 364.77Proper ty, plant and equipment 13 34,482.05 29,265.86Capital work-in-progress 23,149.10 11,619.22Right of Use assets 15,651.47 7,620.96Intangible assets under development 1,518.60 2,153.38Intangible assets 14 54,905.37 8,892.38Goodwill 8,581.84 51,816.29Other non-financial assets 15 9,158.77 4,615.67
227,149.13 232,294.61Assets classified as held for sale and discontinued operations 37 0.73 12.88
0.73 12.88Total Assets 640,811.91 446,423.41
Liabilities and equityLiabilitiesFinancial liabilities
Lease Liabilities 14,899.92 6,055.76Trade payables 16 - -- total outstanding dues of micro and small enterprises 64.47 55.67- total outstanding dues of creditors other than micro and small enterprises 2,691.70 7,411.78Other payables 16- total outstanding dues of micro and small enterprises - -- total outstanding dues of creditors other than micro and small enterprises 272.05 73.22Debt Securities 17 25,264.61 -Borrowings (Other than Debt Securities) 18 46,507.05 -Other financial liabilities 19 9,720.09 5,511.70
99,419.89 19,108.13Non-financial liabilities
Current tax liabilities (net) 20 202.89 329.05Provisions 21 4,217.81 3,417.43Other non-financial liabilities 22 2,514.44 2,897.75
6,935.14 6,644.23Total liabilities 106,355.03 25,752.36Equity
Equity share capital 23 107,954.60 107,954.60Other equity 24 426,977.75 310,958.10
Total equity attributable to owners of the parent 534,932.35 418,912.70Non Controlling Interest (475.47) 1,758.35
Total liabilities and equity 640,811.91 446,423.41
For and on behalf of the Board of Directors ofTata Industries LimitedCIN: U44003MH1945PLC004403
K. R. S. Jamwal F. N. SubedarExecutive Director DirectorDIN: 03129908 DIN: 00028428
S. SriramChief Financial Officer& Company SecretaryCS Membership Number: A10083
As per our repor t of even date attachedFor B S R & Co. LLPChartered AccountantsFirm’s Registration Number: 101248W/W-100022
Rekha ShenoyPartnerMembership Number: 124219
Place : MumbaiDate : 29th April, 2021
Significant accounting policies 1-3
Notes to the Consolidated Financial Statements 4-60
The notes are an integral par t of these Consolidated Financial Statements

175
CONSOLIDATED STATEMENT OF PROFIT AND LOSS FOR THE YEAR ENDED 31 MARCH 2021
(Currency: Indian rupees in lakhs)Note For the year ended For the year ended
31 March 2021 31 March 2020A. Continuing operationsRevenue from operationsInterest income 25 2,483.09 2,181.17Dividend income 26 432.41 533.52Net gain on fair value changes 27 2,112.80 638.46Sale of goods 28 11,027.48 8,391.32Sale of services 29 12,425.62 14,080.97Other income 30 4,900.01 28,744.08Total income 33,381.41 54,569.52ExpensesFinance costs 31 1,657.96 1,014.61Cost of material consumed 32 3,802.66 696.00Purchases of stock-in-trade 33 8,559.08 7,249.07Changes in inventories of stock-in-trade 34 (568.61) (448.16)Employee benefits expenses 35 20,439.23 14,195.64Depreciation, impairment and amor tisation 13 - 14 12,208.77 4,323.87Other expenses 36 13,601.22 10,988.57Total expenses 59,700.31 38,019.60Profit / (loss) before exceptional items and tax (26,318.90) 16,549.92Exceptional items:Hedging loss on forward contracts (net) - -Total exceptional items - -Profit for the year from continuing operations before shareof profit of equity accounted investees and income tax (26,318.90) 16,549.92Share of loss of equity accounted investees (net of income tax) (40,102.61) (27,572.12)Loss for the year from continuing operations before income tax (66,421.52) (11,022.19)Tax expense of continuing operations 0.00 0.00- Current tax expense/(income) 260.93 44.26- Deferred tax expense/(income) (230.89) (410.30)- Shor t/(Excess) provision of tax for earlier years (252.52) -Loss for the year from continuing operations after tax (66,199.04) (10,656.15)
B. Discontinued operationsProfit for the year from discontinued operations before tax - 34,313.24Tax expense of discontinued operations - -- Current tax expense/ (income) - -- Deferred tax - -Profit for the year from discontinued operations after tax - 34,313.24
C. Profit / (loss) for the year (A + B) (66,199.04) 23,657.09D. Other comprehensive income (‘OCI’)(I) Items that will not be reclassified to profit or loss:
- Changes in fair value of investments in equities carried at fair value through OCI 183,314.44 (81,413.23)- Remeasurement of defined employee benefit plans (173.48) (168.16)- Income tax relating to items that will not be reclassified to profit or loss - -- Share of Joint Venture/Associate’s OCI items 287.69 (525.13)
(II) Items that will be reclassified to profit or loss: - -- Net gains / (losses) in cash flow hedges - -- Foreign currency translation gain/(loss) (13,072.86) 11,154.96- Share of Joint Venture/Associate’s OCI items - -Total other comprehensive income 170,355.79 (70,951.56)
E. Total comprehensive income for the Year (C + D) 104,156.75 (47,294.47)Profit/(loss) attributable toOwners of the Parent Company (64,793.53) 23,657.09Non-controlling interest (1,405.51) -Other comprehensive income attributable toOwners of the Parent Company 170,355.79 (70,951.56)Non-controlling interest - -Total comprehensive income / (loss) attributable to:Owners of the Parent Company 105,562.26 (47,294.47)Non-controlling interest (1,405.51) -
104,156.75 (47,294.47)F. Earnings per equity share from continuing operations (face value of Rs. 100 each) (See note 47)
Basic and diluted (in Rs.) (61.32) (9.87)G. Earnings per equity share from discontinued operations (face value of Rs. 100 each) (See note 47)
Basic and diluted (in Rs.) - 31.79H. Earnings per equity share from continuing and discontinued operations
(face value of Rs. 100 each) (See note 47) Basic and diluted (in Rs.) (61.32) 21.91
For and on behalf of the Board of Directors ofTata Industries LimitedCIN: U44003MH1945PLC004403
K. R. S. Jamwal F. N. SubedarExecutive Director DirectorDIN: 03129908 DIN: 00028428
S. SriramChief Financial Officer& Company SecretaryCS Membership Number: A10083
As per our repor t of even date attachedFor B S R & Co. LLPChartered AccountantsFirm’s Registration Number: 101248W/W-100022
Rekha ShenoyPartnerMembership Number: 124219
Place : MumbaiDate : 29th April, 2021
Significant accounting policies 1-3
Notes to the Consolidated Financial Statements 4-60
The notes are an integral part of these Consolidated Financial Statements
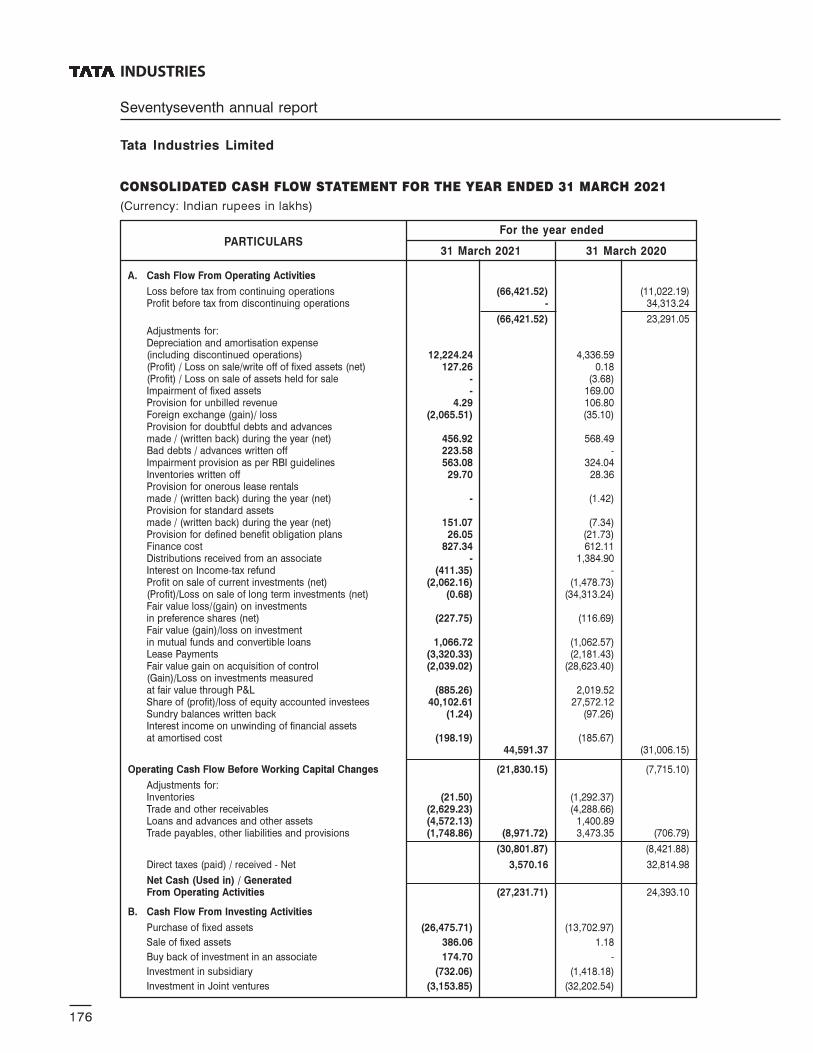
INDUSTRIES
Seventyseventh annual report
Tata Industries Limited
176
CONSOLIDATED CASH FLOW STATEMENT FOR THE YEAR ENDED 31 MARCH 2021
(Currency: Indian rupees in lakhs)
PARTICULARSFor the year ended
31 March 2021 31 March 2020
A. Cash Flow From Operating Activities
Loss before tax from continuing operations (66,421.52) (11,022.19)Profit before tax from discontinuing operations - 34,313.24
(66,421.52) 23,291.05Adjustments for:Depreciation and amortisation expense(including discontinued operations) 12,224.24 4,336.59(Profit) / Loss on sale/write off of fixed assets (net) 127.26 0.18(Profit) / Loss on sale of assets held for sale - (3.68)Impairment of fixed assets - 169.00Provision for unbilled revenue 4.29 106.80Foreign exchange (gain)/ loss (2,065.51) (35.10)Provision for doubtful debts and advancesmade / (written back) during the year (net) 456.92 568.49Bad debts / advances written off 223.58 -Impairment provision as per RBI guidelines 563.08 324.04Inventories written off 29.70 28.36Provision for onerous lease rentalsmade / (written back) during the year (net) - (1.42)Provision for standard assetsmade / (written back) during the year (net) 151.07 (7.34)Provision for defined benefit obligation plans 26.05 (21.73)Finance cost 827.34 612.11Distributions received from an associate - 1,384.90Interest on Income-tax refund (411.35) -Profit on sale of current investments (net) (2,062.16) (1,478.73)(Profit)/Loss on sale of long term investments (net) (0.68) (34,313.24)Fair value loss/(gain) on investmentsin preference shares (net) (227.75) (116.69)Fair value (gain)/loss on investmentin mutual funds and convertible loans 1,066.72 (1,062.57)Lease Payments (3,320.33) (2,181.43)Fair value gain on acquisition of control (2,039.02) (28,623.40)(Gain)/Loss on investments measuredat fair value through P&L (885.26) 2,019.52Share of (profit)/loss of equity accounted investees 40,102.61 27,572.12Sundry balances written back (1.24) (97.26)Interest income on unwinding of financial assetsat amortised cost (198.19) (185.67)
44,591.37 (31,006.15)
Operating Cash Flow Before Working Capital Changes (21,830.15) (7,715.10)
Adjustments for:Inventories (21.50) (1,292.37)Trade and other receivables (2,629.23) (4,288.66)Loans and advances and other assets (4,572.13) 1,400.89Trade payables, other liabilities and provisions (1,748.86) (8,971.72) 3,473.35 (706.79)
(30,801.87) (8,421.88)
Direct taxes (paid) / received - Net 3,570.16 32,814.98
Net Cash (Used in) / GeneratedFrom Operating Activities (27,231.71) 24,393.10
B. Cash Flow From Investing Activities
Purchase of fixed assets (26,475.71) (13,702.97)
Sale of fixed assets 386.06 1.18
Buy back of investment in an associate 174.70 -
Investment in subsidiary (732.06) (1,418.18)
Investment in Joint ventures (3,153.85) (32,202.54)

177
CONSOLIDATED CASH FLOW STATEMENT FOR THE YEAR ENDED 31 MARCH 2021
(Continued)(Currency: Indian rupees in lakhs)
PARTICULARSFor the year ended
31 March 2021 31 March 2020
Loan to an associate company now become subsidiary - (20,642.18)Net (Purchase)/sale of investmentsin other companies/funds (1,639.37) (1,706.91)Sale / (Purchase) of current investments (net) 11,850.70 (31,459.59)Sale of investments in subsidiaries - 63,757.00Cash and bank balances of a company ceasingto be an associates and becoming subsidiary - 6,701.12Inter Corporate Deposits to Joint Venture (36,700.00) -Loan given / repayment - (141.82)Sale of Assets held for sale - 6.09Bank deposits (having original maturity ofmore than three months) 3,310.29 32,377.78
Net Cash (Used in)/Generated From Investing Activities (52,979.24) 1,568.98
C. Cash Flow From Financing Activities
Proceeds from borrowings (net) 71,460.63 -Repayment of borrowings (net) - (10,000.00)Other borrowing cost (464.12) -Share issue expenses paid - (2.40)
Net Cash (Used in) / Generated From Financing Activities 70,996.51 (10,002.40)
Net increase / (decrease) in cash and cash equivalents (9,214.44) 15,959.68
Cash and cash equivalents as at the beginning of the year 17,968.53 1,508.50
Add : Translation adjustments on opening cash &bank balance of foreign subsidiaries (373.55) 12.21
Add : Translation adjustmenton acquisition of foreign subsidiaries - 488.14
Cash and cash equivalents as at end of the year 8,380.54 17,968.53
31 March 2021 31 March 2020
Opening balance - 9,936.51Borrowed 71,460.63 -
Repaid - (9,936.51)
Closing 71,460.63 -
For and on behalf of the Board of Directors ofTata Industries LimitedCIN: U44003MH1945PLC004403
K. R. S. Jamwal F. N. SubedarExecutive Director DirectorDIN: 03129908 DIN: 00028428
S. SriramChief Financial Officer& Company SecretaryCS Membership Number: A10083
As per our repor t of even date attachedFor B S R & Co. LLPChartered AccountantsFirm’s Registration Number: 101248W/W-100022
Rekha ShenoyPartnerMembership Number: 124219
Place : MumbaiDate : 29th April, 2021
Significant accounting policies 1-3
Notes to the Consolidated Financial Statements 4-60
The notes are an integral part of these Consolidated Financial Statements
Notes to cash flow statement
1 Interest earned / paid and dividend earned from investment Financing and Business Promotion (IFP) segment have beenconsidered as part of “Cash flow from operating activities” since the major activities relates to investment and financing.
2 Direct taxes paid is treated as operating expenses and is not bifurcated between investing and financing activities.
3 The bank balances in earmarked accounts and fixed deposit placed as security deposits are not available for use and hence,not considered as cash and cash equivalents.
4 Debt reconciliation statement in accordance with Ind AS 7.

INDUSTRIES
Seventyseventh annual report
Tata Industries Limited
178
CO
NS
OL
ID
AT
ED
STA
TE
ME
NT
OF
CH
AN
GE
S I
N E
QU
IT
Y F
OR
TH
E Y
EA
R E
ND
ED
31
MA
RC
H 2
02
1
(Cu
rre
ncy:
Ind
ian
ru
pe
es i
n l
akh
s)
(a)
Eq
uit
y s
ha
re c
ap
ita
l
(b)
Oth
er
eq
uit
y
Part
icul
ars
Attr
ibut
able
to O
wne
rs o
f the
Com
pany
Item
s of
Oth
erco
mpr
ehen
sive
inco
me
(‘O
CI’)
Tota
lat
trib
utab
leto
Ow
ners
of th
eC
ompa
ny
Res
erve
s an
d su
rplu
s
Att
ribu
tabl
eto
NC
ITo
tal
Cap
ital
rese
rves
Impa
irm
ent
allo
wan
cere
serv
e
Sec
uriti
espr
emiu
mAm
alga
mat
ion
rese
rve
Res
erve
fund
Gen
eral
rese
rve
Ret
aine
dea
rnin
gs*
Equi
tyin
stru
men
tsth
roug
hO
CI
Fore
ign
curr
ency
tran
slat
ion
rese
rve
Bala
nce
as a
t 1 A
pril
2020
10.3
232
4.04
60,4
80.0
12,
498.
7650
,199
.21
17,0
40.3
711
4,41
6.65
(3,9
08.3
3)69
,897
.07
310,
958.
101,
758.
3531
2,71
6.45
Rem
easu
rem
ent o
f NCI
--
--
--
--
--
(828
.31)
(828
.31)
Loss
for t
he y
ear
--
--
--
(64,
793.
53)
--
(64,
793.
53)
(1,4
05.5
1)(6
6,19
9.04
)
Othe
r co
mpr
ehen
sive
inco
me/
(loss
)(n
et o
f tax
)-
--
--
-11
4.18
183,
314.
44(3
,178
.52)
180,
250.
10-
180,
250.
10
Tota
l com
preh
ensi
ve in
com
e/(lo
ss)
--
--
--
(64,
679.
35)
183,
314.
44(3
,178
.52)
115,
456.
57(1
,405
.51)
114,
051.
06
Tran
sfer
to R
eser
ve fu
nd -
unde
r sec
tion
45IC
of t
heRe
serv
e Ba
nk o
f Ind
ia A
ct, 1
934
--
--
--
--
--
--
Impa
irmen
t re
serv
e re
cogn
ised
as p
er R
BI g
uide
lines
-56
3.08
--
--
--
-56
3.08
-56
3.08
Disc
ontin
ue o
f OCI
impa
ct o
fAs
soci
ate
beco
me
Subs
idia
ry-
--
--
-9,
894.
34-
(9,8
94.3
4)-
--
Bala
nce
as a
t 31
Mar
ch 2
021
10.3
288
7.12
60,4
80.0
12,
498.
7650
,199
.21
17,0
40.3
759
,631
.64
179,
406.
1156
,824
.21
426,
977.
75(4
75.4
7)42
6,50
2.28
Pa
rtic
ula
rs3
1 M
arc
h 2
02
13
1 M
arc
h 2
02
0
Ba
lan
ce
at
the
be
gin
nin
g o
f th
e y
ea
r1
,07
,95
4.6
01
,07
,95
4.6
0
Ch
an
ge
s i
n t
he
eq
uit
y s
ha
re c
ap
ita
l d
uri
ng
th
e y
ea
r -
-
Ba
lan
ce
at
the
en
d o
f th
e y
ea
r1
,07
,95
4.6
01
,07
,95
4.6
0

179
Part
icul
ars
Attr
ibut
able
to O
wne
rs o
f the
Com
pany
Item
s of
Oth
erco
mpr
ehen
sive
inco
me
(‘O
CI’)
Tota
lat
trib
utab
leto
Ow
ners
of th
eC
ompa
ny
Res
erve
s an
d su
rplu
s
Att
ribu
tabl
eto
NC
ITo
tal
Cap
ital
rese
rves
Impa
irm
ent
allo
wan
cere
serv
e
Sec
uriti
espr
emiu
mAm
alga
mat
ion
rese
rve
Res
erve
fund
Gen
eral
rese
rve
Ret
aine
dea
rnin
gs*
Equi
tyin
stru
men
tsth
roug
hO
CI
Fore
ign
curr
ency
tran
slat
ion
rese
rve
Bala
nce
as a
t 1 A
pril
2019
10.3
2-
60,4
80.0
12,
498.
7644
,338
.80
17,0
40.3
715
7,64
0.10
17,4
77.4
958
,742
.11
358,
227.
96-
358,
227.
96
Addi
tion
at th
e be
ginn
ing
of th
e ye
aron
acc
ount
of I
nd A
S 11
6-
--
--
-(2
99.4
3)-
-(2
99.4
3)-
(299
.43)
Prof
it fo
r the
yea
r-
--
--
-23
,657
.09
--
23,6
57.0
9-
23,6
57.0
9
Othe
r co
mpr
ehen
sive
inco
me
/ (lo
ss)
(net
of t
ax)
--
--
--
(693
.29)
(81,
413.
23)
11,1
54.9
6(7
0,95
1.56
)-
(70,
951.
56)
Tota
l com
preh
ensi
ve in
com
e/ (
loss
)-
--
--
-22
,963
.80
(81,
413.
23)
11,1
54.9
6(4
7,29
4.47
)-
(47,
294.
47)
Impa
ct o
f Writ
e-of
f of
Equi
ty S
hare
s of
TTS
L #
--
--
--
(60,
027.
41)
60,0
27.4
1-
--
-
Tran
sfer
to R
eser
ve fu
nd -
unde
r sec
tion
45IC
of t
heRe
serv
e Ba
nk o
f Ind
ia A
ct, 1
934
--
--
5,86
0.41
-(5
,860
.41)
--
--
-
Impa
irmen
t re
serv
e re
cogn
ised
as p
er R
BI g
uide
lines
-32
4.04
--
--
--
-32
4.04
-32
4.04
Addi
tion
due
to B
usin
ess
Com
bina
tion
(Ref
er n
ote
46)
--
--
--
--
--
1,75
8.35
1,75
8.35
Bala
nce
as a
t 31
Mar
ch 2
020
10.3
232
4.04
60,4
80.0
12,
498.
7650
,199
.21
17,0
40.3
711
4,41
6.65
3,90
8.33
69,8
97.0
731
0,95
8.10
1,75
8.35
312,
716.
45
(b)
Oth
er
eq
uit
y (Continued)
# D
urin
g th
e pr
evio
us y
ear
Com
pany
has
wri
te-o
ff t
he s
hare
s of
Tat
a Te
lese
rvic
es L
imite
d (T
TSL)
.
* in
clud
ing
rem
easu
rem
ent
of n
et d
efin
ed b
enef
it pl
ans.
CO
NS
OL
ID
AT
ED
STA
TE
ME
NT
OF
CH
AN
GE
S I
N E
QU
IT
Y F
OR
TH
E Y
EA
R E
ND
ED
31
MA
RC
H 2
02
1
(Cu
rre
ncy:
Ind
ian
ru
pe
es i
n l
akh
s)

INDUSTRIES
Seventyseventh annual report
Tata Industries Limited
180
(b)
Oth
er
eq
uit
y (Continued)
No
tes
:
1.
Ca
pit
al
res
erv
e
Ca
pit
al re
serv
e is
no
t a
vaila
ble
fo
r d
istr
ibu
tio
n a
s d
ivid
en
d t
o t
he
sh
are
ho
lde
rs.
2.
Se
cu
riti
es
pre
miu
m
Se
cu
riti
es
pre
miu
m is
use
d t
o r
eco
rd t
he
pre
miu
m r
ece
ive
d o
n iss
ue
of
sha
res.
It
is u
tilis
ed
in
acco
rda
nce
wit
h t
he
pro
visi
on
s o
f th
e C
om
pa
nie
s A
ct,
20
13
(‘t
he
Act’
).
3.
Am
alg
am
ati
on
re
se
rve
Am
alg
am
ati
on
re
serv
e i
s cre
ate
d o
n a
cco
un
t o
f a
ma
lga
ma
tio
n o
f Ta
ta T
ele
ven
ture
s (H
old
ing
s) L
imit
ed
wit
h t
he
Co
mp
an
y.
4.
Re
se
rve
fu
nd
Re
serv
e f
un
d i
s cre
ate
d u
nd
er
secti
on
45
IC o
f th
e R
ese
rve
Ba
nk o
f In
dia
Act,
19
34
5.
Ge
ne
ral
res
erv
e
Th
e G
en
era
l re
serv
e i
s u
sed
fro
m t
ime
to
tim
e t
o t
ran
sfe
r p
rofits
fro
m r
eta
ine
d e
arn
ing
s fo
r a
pp
rop
ria
tio
n p
urp
ose
s.
6.
Re
tain
ed
ea
rnin
gs
Re
tain
ed
ea
rnin
gs
are
th
e p
rofits
/ (
loss
es)
th
at
the
Co
mp
an
y h
as
ea
rne
d t
ill d
ate
, le
ss a
ny t
ran
sfe
r to
ge
ne
ral re
serv
e,
div
ide
nd
s o
r o
the
r d
istr
ibu
tio
n
pa
id t
o s
ha
reh
old
ers
.
7.
Eq
uit
y i
ns
tru
me
nts
th
rou
gh
OC
I
Th
e C
om
pa
ny h
as
ele
cte
d t
o r
eco
gn
ise
ch
an
ge
s in
th
e f
air
va
lue
of
ce
rta
in i
nve
stm
en
ts i
n e
qu
ity s
ecu
riti
es
in o
the
r co
mp
reh
en
sive
in
co
me
. T
he
se
ch
an
ge
s a
re a
ccu
mu
late
d w
ith
in ‘E
qu
ity in
stru
me
nts
th
rou
gh
OC
I’.
Th
e C
om
pa
ny t
ran
sfe
rs a
mo
un
ts t
he
refr
om
to
re
tain
ed
ea
rnin
gs
wh
en
th
e r
ele
van
t
eq
uit
y s
ecu
riti
es
are
de
reco
gn
ise
d.
8.
Imp
air
me
nt
res
erv
e
Wh
ere
im
pa
irm
en
t a
llow
an
ce
(E
xpe
cte
d c
red
it l
oss
) u
nd
er
Ind
AS
is
low
er
tha
n t
he
pro
visi
on
ing
re
qu
ire
d u
nd
er
IRA
CP
gu
ide
line
s, C
om
pa
ny s
ha
ll
ap
pro
pri
ate
th
e d
iffe
ren
ce
fro
m t
he
ir n
et
pro
fit
or
loss
aft
er
tax
to a
se
pa
rate
im
pa
irm
en
t re
serv
e.
CO
NS
OL
ID
AT
ED
STA
TE
ME
NT
OF
CH
AN
GE
S I
N E
QU
IT
Y F
OR
TH
E Y
EA
R E
ND
ED
31
MA
RC
H 2
02
1
(Cu
rre
ncy:
Ind
ian
ru
pe
es i
n l
akh
s)
Fo
r a
nd
on
be
ha
lf o
f th
e B
oa
rd o
f D
ire
cto
rs o
fTa
ta I
nd
us
trie
s L
imit
ed
CIN
: U
44
00
3M
H1
94
5P
LC
00
44
03
K.
R.
S.
Ja
mw
al
F.
N.
Su
be
da
r
Exe
cu
tive
Dir
ec
tor
Dir
ec
tor
DIN
: 0
31
29
90
8D
IN:
00
02
84
28
S.
Sri
ram
Ch
ief
Fin
an
cia
l O
ffic
er
& C
om
pa
ny S
ec
reta
ryC
S M
em
be
rsh
ip N
um
be
r: A
10
08
3
As p
er
ou
r re
po
rt o
f e
ve
n d
ate
att
ac
he
dF
or
B S
R &
Co
. L
LP
Ch
art
ere
d A
cc
ou
nta
nts
Fir
m’s
Re
gis
tra
tio
n N
um
be
r: 1
01
24
8W
/W-1
00
02
2
Re
kh
a S
he
no
y
Pa
rtn
er
Me
mb
ers
hip
Nu
mb
er:
12
42
19
Pla
ce
:M
um
ba
iD
ate
:2
9th
Ap
ril,
20
21
Sig
nif
ica
nt
ac
co
un
tin
g p
oli
cie
s1-3
No
tes
to
th
e C
on
so
lid
ate
d F
ina
nc
ial
Sta
tem
en
ts4-60
Th
e n
ote
s a
re a
n i
nte
gra
l p
art
of
the
se C
on
solid
ate
d F
ina
ncia
l S
tate
me
nts

181
NOTES TO CONSOLIDATED FINANCIAL STATEMENTS
as at and for the year ended 31 March 2021
1. Background
Tata Industries Limited (‘TIL’) was incorporated on April 7, 1945 at Mumbai under the
Companies Act, VII of 1913 and has been carrying on the business of an investment
holding company engaged in the incubation / promotion of new business ventures.
From April 2012 onwards, TIL is categorised as a Core Investment Company (‘CIC’) by
the Reserve Bank of India (‘RBI’) on account of its investments being made prominently
in other Tata companies. Earlier, it was registered with RBI as a Non-Banking Financial
Company.
Besides carrying out investment activities from Head office, TIL has four operating
divisions engaged into management consultancy, digital classroom solutions, digital
health business and analytic business.
These are the consolidated financial statements of TIL and its subsidiaries (collectively
“the Group”) and joint ventures and associate companies are mentioned in Note 56 of
the financials.
The Board of Directors approved the consolidated financial statements for the year ended
31 March 2021 and authorised for issue on 29 April 2021.
2. Summary of statement of compliance, basis of preparation and presentation, critical
accounting estimates, assumptions and judgements and basis of consolidation
A. Statement of compliance
The Consolidated Financial Statements (‘CFS’) comply, in all material aspects,
with Indian Accounting Standards (‘Ind AS’) notified under Section 133 of the
Companies Act, 2013 (‘the 2013 Act’) read with Rule 3 of Companies (Indian
Accounting Standards) Rules, 2015 and other relevant provisions of the Act.
B. Functional and presentation currency
These consolidated financial statements are presented in Indian Rupees (INR),
which is also TIL’s functional currency. All amounts have been rounded-off to the
nearest lakhs, unless otherwise indicated.
C. Basis of preparation
The consolidated financial statements have been prepared on the historical cost
basis, except for certain financial instruments and defined benefit plans which are
measured at fair value at the end of each reporting period. Historical cost is
generally based on the fair value of the consideration given in exchange for goods
and services. Fair value is the price that would be received to sell an asset or paid
to transfer a liability in an orderly transaction between market participants at the
measurement date.

INDUSTRIES
Seventyseventh annual report
Tata Industries Limited
182
NOTES TO CONSOLIDATED FINANCIAL STATEMENTS
as at and for the year ended 31 March 2021
D. Basis of consolidation
The consolidated financial statements comprise the financial statements of the
Company, its subsidiaries and the Group’s interest in joint ventures and associates
as at the reporting date.
Subsidiaries
Subsidiaries include all the entities over which the Group has control. The Group
controls an entity when the Group is exposed to, or has rights to, variable returns
through its involvement in the entity and has the ability to affect those returns
through its power to direct the relevant activities of the entity. The Company
reassesses whether or not it controls an investee if facts and circumstances indicate
that there are changes to one or more of the three elements listed above.
Subsidiaries are consolidated from the date control commences until the date
control ceases.
Inter-company transactions and balances including unrealised profits are
eliminated in full on consolidation.
Non-controlling interests in the net assets (excluding goodwill) of consolidated
subsidiaries are identified separately from the Company’s equity. The interest of
non-controlling shareholders may be initially measured either at fair value or at
the non-controlling interests’ proportionate share of the fair value of the acquiree’s
identifiable net assets. The choice of measurement basis is made on an acquisition-
by-acquisition basis. Subsequent to acquisition, the carrying amount of non-
controlling interests is the amount of those interests at initial recognition plus the
non-controll ing interests’ share of subsequent changes in equity. Total
comprehensive income is attributed to non-controlling interests even if it results
in the non-controlling interest having a deficit balance.
Changes in the Company’s interests in subsidiaries that do not result in a loss of
control are accounted for as equity transactions. The carrying amount of the
Company’s interests and the non-controlling interests are adjusted to reflect the
changes in their relative interests in the subsidiaries. Any difference between the
amount by which the non-controlling interests are adjusted and the fair value of
the consideration paid or received is recognised directly in equity and attributed
to owners of the Company.
When the Company loses control of a subsidiary, the profit or loss on disposal is
calculated as the difference between (i) the aggregate of the fair value of
2. Summary of statement of compliance, basis of preparation and presentation, critical
accounting estimates, assumptions and judgements and basis of consolidation
(Continued)

183
NOTES TO CONSOLIDATED FINANCIAL STATEMENTS
as at and for the year ended 31 March 2021
consideration received and the fair value of any retained interest and (ii) the
previous carrying amount of the assets (including goodwill), and liabilities of the
subsidiary and any non-controlling interests. Amounts previously recognised in
other comprehensive income in relation to the subsidiary are accounted for (i.e.,
reclassified to profit or loss) in the same manner as would be required if the relevant
assets or liabilities were disposed off. The fair value of any investment retained
in the former subsidiary at the date when control is lost is regarded as the fair
value on initial recognition for subsequent accounting under Ind-AS 109 Financial
Instruments or, when applicable, the cost on initial recognition of an investment
in an associate or jointly controlled entity.
Joint ventures
A joint venture is a joint arrangement whereby the parties that have joint control
of the arrangement have rights to the net assets of the arrangement. The results
assets and liabilities of a joint venture are incorporated in these financial statements
using the equity method of accounting.
A Joint arrangement is an arrangement of which two or more parties have joint
control. Joint control is considered when there is contractually agreed sharing of
control of an arrangement, which exists only when decisions about the relevant
activities require the unanimous consent of the parties sharing control. Investments
in joint arrangements are classified as either joint operations or joint venture. The
classification depends on the contractual rights and obligations of each investor,
rather than the legal structure of the joint arrangement. A joint operation is a joint
arrangement whereby the parties that have joint control of the arrangement have
rights to the assets, and obligations for the liabilities, relating to the arrangement.
A joint venture is a joint arrangement whereby the parties that have joint control
of the arrangement have rights to the net assets of the arrangement.
Associates
Associates are those entities in which the Group has significant influence.
Significant influence is the power to participate in the financial and operating policy
decisions of the investee but not control or joint control those policies. Significant
influence is presumed to exist when the Group holds between 20 and 50 percent
of the voting power of another entity. The results, assets and liabilities of associates
are incorporated in these financial statements using the equity method of
accounting.
2. Summary of statement of compliance, basis of preparation and presentation, critical
accounting estimates, assumptions and judgements and basis of consolidation
(Continued)
D. Basis of consolidation (Continued)

INDUSTRIES
Seventyseventh annual report
Tata Industries Limited
184
NOTES TO CONSOLIDATED FINANCIAL STATEMENTS
as at and for the year ended 31 March 2021
Equity method of accounting (equity accounted investees)
An interest in an associate or joint venture is accounted for using the equity method
from the date in which the investee becomes an associate or a joint venture and
are recognised initially at cost. The Group’s investment includes goodwill identified
on acquisition, net of any accumulated impairment losses. The consolidated
financial statements include the Group’s share of profits or losses and equity
movements of equity accounted investees, from the date that significant influence
or joint control commences until the date that significant influence or joint control
ceases. When the Group’s share of losses exceeds its interest in an equity
accounted investee, the carrying amount of that interest (including any long-term
investments in the nature of net investments) is reduced to nil and the recognition
of further losses is discontinued except to the extent that the Group has an
obligation or has made payments on behalf of the investee.
Dividend received or receivable from associates and joint-ventures are recognised
as a reduction in carrying amount of the investment.
The carrying amount of equity accounted investments are tested for impairment
in accordance with the policy described in Note 2F below.
Changes in the proportion held by NCI
Changes in the proportion of the equity held by NCI are accounted for as equity
transactions. The carrying amount of the controlling interests and NCI are adjusted
to reflect the changes in their relative interests in the subsidiaries. Any difference
between the amount by which the NCI are adjusted and the fair value of the
consideration paid or received is recognised directly in equity and attributed to
owners of the Group.
E. Use of estimates and judgements
The preparation of consolidated financial statements in conformity with Ind AS
requires management to make judgments, estimates and assumptions, that affect
the application of accounting policies and the reported amounts of assets, liabilities
and disclosures of contingent assets and liabilities at the date of these Ind AS
consolidated financial statements and the reported amounts of revenues and
expenses for the periods presented. Actual results may differ from these estimates.
2. Summary of statement of compliance, basis of preparation and presentation, critical
accounting estimates, assumptions and judgements and basis of consolidation
(Continued)
D. Basis of consolidation (Continued)

185
NOTES TO CONSOLIDATED FINANCIAL STATEMENTS
as at and for the year ended 31 March 2021
Estimates and underlying assumptions are reviewed at each balance sheet date.
Revisions to accounting estimates are recognised in the period in which the
estimate is revised and future periods affected.
The estimates and assumptions that have a significant risk of causing a material
adjustment to the carrying values of assets and liabilities within the next financial
year are discussed below:
(i) Useful lives of property, plant and equipment and intangible assets
Determination is done to evaluate the estimated useful lives of tangible assets
and also assessment as to which components of the cost may be capitalised.
Useful lives of tangible assets are based on the life prescribed in Schedule
II of the Companies Act, 2013. In cases, where the useful lives are different
from that prescribed in Schedule II, they are based on technical advice,
considering the nature of the asset, the estimated usage of the asset, the
operating conditions of the asset, past history of replacement, anticipated
technological changes, manufacturers’ warranties and maintenance support.
Assumptions also need to be made, when the Group assesses, whether an
asset may be capitalised and which components of the cost of the asset
may be capitalised.
(ii) Recognition and measurement of defined benefit obligations
The obligation arising from defined benefit plan and other long-term
employment benefits is determined based on actuarial assumptions. Key
actuarial assumptions include discount rate, trends in salary escalation and
vested future benefits and life expectancy. The discount rate is determined
by reference to market yields at the end of the reporting period on
government bonds. The period to maturity of the underlying bonds
correspond to the probable maturity of the post-employment benefit
obligations.
(iii) Recognition of deferred tax assets
Significant management judgment is required to determine the amount of
deferred tax assets that can be recognised, based upon the likely timing
and the level of future taxable profits.
2. Summary of statement of compliance, basis of preparation and presentation, critical
accounting estimates, assumptions and judgements and basis of consolidation
(Continued)
E. Use of estimates and judgements (Continued)

INDUSTRIES
Seventyseventh annual report
Tata Industries Limited
186
NOTES TO CONSOLIDATED FINANCIAL STATEMENTS
as at and for the year ended 31 March 2021
The amount of total deferred tax assets could change if estimates of projected
future taxable income or if tax regulations undergo a change.
(iv) Revenue recognition
The Group uses the percentage-of-completion method in accounting for its
fixed-price contracts. Use of the percentage-of-completion method requires
the Group to estimate the efforts or costs expended to date as a proportion
of the total efforts or costs to be expended. Efforts or costs expended have
been used to measure progress towards completion as there is a direct
relationship between input and productivity.
Provisions for estimated losses, if any, on uncompleted contracts are
recorded in the period in which such losses become probable based on the
expected contract estimates at the reporting date.
(v) Impairment of trade receivables
The Group reviews its trade receivables to assess impairment at regular
intervals. The Group’s credit risk is primarily attributable to its trade
receivables. In determining whether impairment losses should be reported
in the statement of profit and loss, the Group makes judgments as to whether
there is any observable data indicating that there is a measurable decrease
in the estimated future cash flows. Accordingly, an allowance for expected
credit loss is made where there is an identified loss event or condition which,
based on previous experience, is evidence of a reduction in the recoverability
of the cash flows.
(vi) Impairment losses on investments
The Group reviews its carrying value of investments carried at amortised
cost annually, or more frequently when there is indication for impairment.
If the recoverable amount is less than its carrying amount, the impairment
loss is accounted for.
F. Measurement of fair values
The Group’s accounting policies and disclosures require the measurement of fair
values, for both financial and non-financial assets and liabilities.
2. Summary of statement of compliance, basis of preparation and presentation, critical
accounting estimates, assumptions and judgements and basis of consolidation
(Continued)
E. Use of estimates and judgements (Continued)

187
NOTES TO CONSOLIDATED FINANCIAL STATEMENTS
as at and for the year ended 31 March 2021
The Group has an established control framework with respect to the measurement
of fair values, which includes overseeing all significant fair value measurement,
including level 3 fair values by the management. The management regularly reviews
significant unobservable inputs and valuation adjustments. If third party information,
such as broker quotes or pricing services is used to measure fair values, then the
management assesses the evidence obtained from the third parties to support
the conclusion that such valuations meet the requirements of Ind AS, including
the level in the fair value hierarchy in which such valuations should be classified.
When measuring the fair value of a financial asset or a financial liability, the Group
uses observable market data as far as possible. Fair values are categorised into
different levels in a fair value hierarchy based on the inputs used in the valuation
techniques as follows:
Level 1: quoted prices (unadjusted) in active markets for identical assets or
liabilities.
Level 2: inputs other than quoted prices included in Level 1 that are observable
for the asset or liability, either directly (i.e. as prices) or indirectly (i.e. derived
from prices).
Level 3: inputs for the asset or liability that are not based on observable market
data (unobservable inputs).
If the inputs used to measure the fair value of an asset or a liability fall into different
levels of the fair value hierarchy, then the fair value measurement is categorised
in its entirety in the same level of the fair value hierarchy as the lowest level input
that is significant to the entire measurement. The Group recognises transfers
between levels of the fair value hierarchy at the end of the reporting period during
which the change has occurred.
3. Significant accounting polices
A. Foreign currency translation
On initial recognition, all foreign currency transactions are translated into the
functional currency using the exchange rates prevailing on the date of the
transaction. As at the reporting date, foreign currency monetary assets and liabilities
are translated at the exchange rate prevailing on the Balance Sheet date and the
exchange gains or losses are recognised in the Statement of Profit and Loss.
2. Summary of statement of compliance, basis of preparation and presentation, critical
accounting estimates, assumptions and judgements and basis of consolidation
(Continued)
F. Measurement of fair values (Continued)

INDUSTRIES
Seventyseventh annual report
Tata Industries Limited
188
NOTES TO CONSOLIDATED FINANCIAL STATEMENTS
as at and for the year ended 31 March 2021
B. Financial instruments
(i) Investments and other financial assets
Classification
The Group classifies its financial assets in the following measurement
categories:
i) those to be measured subsequently at fair value (either through other
comprehensive income (‘OCI’), or through profit and loss), and
ii) those measured at amortised cost
The classification depends on the entity’s business model for managing the
financial assets and the contractual terms of the cash flows. For assets
measured at fair value, gains and losses will either be recorded in statement
of profit and loss or OCI. For investments in debt instruments, this will depend
on the business model in which the investment is held. For investment in
equity instruments, this will depend on whether the Group has made an
irrevocable election at the time of initial recognition to account for the equity
investment at fair value through OCI.
The Group reclassifies debt investments when and only when its business
model for managing those assets changes.
Debt instruments
At initial recognition, the Group measures a financial asset at its fair value
plus, in the case of a financial asset not at fair value through profit or loss,
transaction costs that are directly attributable to the acquisition of the financial
asset. Transaction costs of financial assets carried at fair value through profit
or loss are expensed in profit or loss. Subsequent measurement of debt
instruments depends on the Group’s business model for managing the asset
and the cash flow characteristics of the asset. There are three measurement
categories into which the Group classifies its debt instruments:
Amortised cost
Assets that are held for collection of contractual cash flows where those
cash flows represent solely payments of principal and interest are measured
at amortised cost. A gain or loss on a debt investment that is subsequently
measured at amortised cost and is not part of a hedging relationship is
recognised in profit or loss when the asset is derecognised or impaired.
Interest income from these financial assets is included in finance income
using the effective interest rate method.
3. Significant accounting policies (Continued)

189
NOTES TO CONSOLIDATED FINANCIAL STATEMENTS
as at and for the year ended 31 March 2021
Fair value through other comprehensive income (‘FVTOCI’)
Assets that are held for collection of contractual cash flows and for selling
the financial assets, where the assets’ cash flows represent solely payments
of principal and interest, are measured at fair value through other
comprehensive income (‘FVTOCI’). Movements in the carrying amount are
taken through OCI, except for the recognition of impairment gains or losses,
interest revenue and foreign exchange gains or losses which are recognised
in Statement of Profit and Loss. When the financial asset is derecognised,
the cumulative gain or loss previously recognised in OCI is reclassified from
equity to profit or loss and recognised as gains/ (losses) within other income
or other expense. Interest income from these financial assets is included in
other income using the effective interest rate method.
Fair value through profit or loss (‘FVTPL’)
Assets that do not meet the criteria for amortised cost or FVTOCI are
measured at fair value through profit or loss. A gain or loss on a debt
investment that is subsequently measured at FVTPL and is not part of a
hedging relationship is recognised in profit or loss and presented net in the
Statement of Profit and Loss as gains/(losses) within other income or other
expense in the period in which it arises. Interest income from these financial
assets is included in other income.
Equity instruments
The Group subsequently measures all equity investments at fair value. Where
the Group’s management has elected to present fair value gains and losses
on equity investments in OCI, there is no subsequent reclassification of fair
value gains and losses to the Statement of Profit and Loss. Dividends from
such investments are recognised in the Statement of Profit and Loss as
Other Income when the Group’s right to receive payments is established.
Changes in the fair value of financial assets at FVTPL are recognised as
gains/(losses) within other income or other expense in the Statement of
Profit and Loss. Impairment losses (and reversal of impairment losses) on
equity investments measured at FVTOCI are not reported separately from
other changes in fair value.
Cash and cash equivalents
The Group considers all highly liquid financial instruments, which are readily
convertible into known amounts of cash that are subject to an insignificant
risk of change in value and having original maturities of three months or
3. Significant accounting policies (Continued)
B. Financial instruments (Continued)
(i) Investments and other financial assets (Continued)

INDUSTRIES
Seventyseventh annual report
Tata Industries Limited
190
NOTES TO CONSOLIDATED FINANCIAL STATEMENTS
as at and for the year ended 31 March 2021
less from the date of purchase, to be cash equivalents. Cash and cash
equivalents consist of balances with banks which are unrestricted for
withdrawal and usage.
De-recognition of financial assets
A financial asset is derecognised only when the Group
• has transferred the rights to receive cash flows from the financial asset;
or
• retains the contractual rights to receive the cash flows of the financial
assets but assumes a contractual obligation to pay the cash flows to
one or more recipients.
Where the Group transfers an asset, it evaluates whether it has transferred
substantially all risks and rewards of ownership of the financial asset. Where
the Group has transferred substantially all risks and rewards of ownership,
the financial asset is derecognised. Where the Group has not transferred
substantially all risks and rewards of ownership of the financial asset, the
financial asset is not derecognised. Where the Group has neither transferred
a financial asset nor retained substantially all risks and rewards of ownership
of the financial asset, the financial asset is derecognised if the Group has
not retained control of the financial asset. Where the Group retains control
of the financial asset, the asset is continued to be recognised to the extent
of continuing involvement in the financial asset.
(ii) Debt and equity instruments (liabilities)
Debt and equity instruments are classified as either financial liabilities or as
equity in accordance with the substance of the contractual arrangement.
An equity instrument is any contract that evidences a residual interest in the
assets of an entity after deducting all of its liabilities. Equity instruments
issued by the Group are recorded at the proceeds received, net of direct
issue costs.
(iii) Financial liabilities
The Group’s financial liabilities comprise borrowings, trade payables and
other liabilities. These are initially measured at fair value, net of transaction
costs, and are subsequently measured at amortised cost using the effective
interest method.
3. Significant accounting policies (Continued)
B. Financial instruments (Continued)
(i) Investments and other financial assets (Continued)

191
NOTES TO CONSOLIDATED FINANCIAL STATEMENTS
as at and for the year ended 31 March 2021
The effective interest method is a method of calculating the amortised cost
of a financial liability and of allocating interest expense over the relevant
period. The effective interest rate is the rate that exactly discounts estimated
future cash payments through the expected life of the financial liability, or,
where appropriate, a shorter period.
Changes to the carrying amount of a financial liability as a result of
renegotiation or modification of terms that do not result in derecognition of
the financial liability, is recognised in the Statement of Profit and Loss.
De-recognition of financial liabilities
The Group derecognises financial liabilities when, and only when, its
obligations are discharged, cancelled or they expire.
(iv) Derivative financial instruments and hedge accounting
The Group holds derivative financial instruments to hedge its foreign currency
exposures. Derivative instruments are initially measured at fair value.
Subsequent to initial recognition, derivatives are measured at fair value and
changes therein are generally recognised in profit and loss.
The Group designates certain derivatives as hedging instruments to hedge
the variability in cash flows associated with highly probable forecast
transactions arising from changes in foreign exchange rates. At inception
of designated hedging relationships, the Group documents the risk
management objective and strategy for undertaking the hedge. The Group
also documents the economic relationship between hedged item and
hedging instrument, including whether the changes in cash flows of the
hedged item and the hedging instrument are expected to offset each other.
Cash Flow Hedge
When a derivative is designated as a cash flow hedging instrument, the
effective portion of the changes in the fair value of the derivatives is
recognised in OCI and accumulated in the other equity under ‘effective
portion of cash flow hedges’. The effective portion of the changes in the fair
value of the derivative that is recognised in the OCI is limited to the cumulative
change in fair value of the hedge item, determined on a present value basis,
from the inception of the hedge. Any ineffective portion of the changes in
the fair value of the derivative is recognised immediately in profit and loss.
The amount accumulated in other equity is reclassified to profit and loss in
the same period or periods during which the hedged expected future cash
flows affect profit and loss.
3. Significant accounting policies (Continued)
B. Financial instruments (Continued)
(iii) Financial liabilities (Continued)

INDUSTRIES
Seventyseventh annual report
Tata Industries Limited
192
NOTES TO CONSOLIDATED FINANCIAL STATEMENTS
as at and for the year ended 31 March 2021
If the hedge no longer meets the criteria for hedge accounting or the hedging
instrument is sold, expires, is terminated or is exercised, then the hedge
accounting is discontinued prospectively. When the hedge accounting for
cash flow hedges is discontinued, the amount that has been accumulated
in other equity is reclassified to profit and loss in the same period or periods
as the hedged expected future cash flows affect profit and loss.
If the hedged future cash flows are no longer expected to occur, then the
amounts that have been accumulated in other equity are immediately
reclassified in profit and loss.
(v) Financial guarantee contracts
The Group on a case to case basis elects to account for financial guarantee
contracts as a financial instrument or as an insurance contract, as specified
in Ind AS 109 on Financial Instruments and Ind AS 104 on Insurance
Contracts. The Group has regarded all its financial guarantee contracts as
insurance contracts. At the end of each reporting period the Group performs
a liability adequacy test, (i.e. it assesses the likelihood of a pay-out based
on current undiscounted estimates of future cash flows), and any deficiency
is recognized in profit or loss.
(vi) Offsetting of financial instruments
Financial assets and financial liabilities are offset when it currently has a
legally enforceable right (not contingent on future events) to off-set the
recognised amounts and the Group intends either to settle on a net basis,
or to realise the assets and settle the liabilities simultaneously.
C. Property, plant and equipment
Recognition and measurement
All items of property, plant and equipment are stated at their historical cost of
acquisition or construction less accumulated depreciation and accumulated
impairment losses if any. Historical cost includes expenditure that is directly
attributable to the acquisition of the items.
Subsequent costs are included in the asset’s carrying amount or recognised as
a separate asset, as appropriate, only when it is probable that future economic
benefits associated with the item will flow to the Group and the cost of the item
can be measured reliably. The carrying amount of any component accounted for
as a separate asset is derecognised when replaced. All other repairs and
3. Significant accounting policies (Continued)
B. Financial instruments (Continued)
(iv) Derivative financial instruments and hedge accounting (Continued)

193
NOTES TO CONSOLIDATED FINANCIAL STATEMENTS
as at and for the year ended 31 March 2021
maintenance are charged to statement of profit and loss during the reporting period
in which they are incurred.
The cost of a self-constructed item of property, plant and equipment comprises
the cost of materials and direct labor, any other costs directly attributable to bringing
the item to working condition for its intended use, and estimated costs of
dismantling and removing the item and restoring the site on which it is located.
Any gain or loss on disposal of an item of property, plant and equipment is
recognised in profit or loss.
Assets in the course of construction are capitalized in capital work in progress
account. At the point when an asset is capable of operating in the manner intended
by management, the cost of construction is transferred to the appropriate category
of property, plant and equipment. Costs associated with the commissioning of an
asset are capitalised until the period of commissioning has been completed and
the asset is ready for its intended use.
Depreciation on tangible fixed assets of the Company and its Indian subsidiaries
and associates has been provided on Straight Line Method (SLM), considering
the useful lives and residual value prescribed in Schedule II of the Companies
Act, 2013 except in respect of the following categories of assets, in whose case
the life of the assets has been assessed as under based on technical advice,
taking into account the nature of the asset, the estimated usage of the asset, the
operating conditions of the asset, past history of replacement, anticipated
technological changes, manufacturers warranties and maintenance support:
3. Significant accounting policies (Continued)
C. Property, plant and equipment (Continued)
Assets Useful life
Leasehold improvements Period of lease / 6 years
Leasehold land & Infrastructure facilities 99 years
Mobile phones 2 / 3 years
Medical demo devices 3 years
ClassEdge implementation and installation Over the period of
expenses and assets deployed at schools licensing contract
Buildings and Roads 30 to 70 years and 10 years
Plant and Machinery 2 to 35 years
Furniture & Fixtures 2 to 10 years
Vehicles 4 to 5 years

INDUSTRIES
Seventyseventh annual report
Tata Industries Limited
194
NOTES TO CONSOLIDATED FINANCIAL STATEMENTS
as at and for the year ended 31 March 2021
D. Intangible assets
Recognition and measurement
Intangible assets are measured at historical cost. All the intangible assets have
a finite useful life and are subsequently carried at cost less accumulated
amortisation and impairment losses, if any.
Amortisation
Intangible assets are amortised over their estimated useful life on straight line
basis as follows:
3. Significant accounting policies (Continued)
Assets Amortization
SAP Software 4 years
Computer Software 10 years
ClassEdge Content 10 years
(Internally generated)
ClassEdge Content – Technological 5 years
upgrades / Value Education
Content (Internally generated)
Digital Content Videos Over the expected pattern of
(Internally generated) consumption of economic benefit
over a period of five years
Licensed Content Over the licencing contract period
PlanEdge and Over the balance period to expiry
TestEdge platforms of ClassEdge content amortisation.
Digital Health Platform 3 years
and Analytics Software
Licenses, software (other than SAP) 1 - 10 years
and right to use third party systems etc.
Product Development 5 years
Licenses, Patents and Other Rights 10 -15 years
Technology Fee Over the period of contract

195
NOTES TO CONSOLIDATED FINANCIAL STATEMENTS
as at and for the year ended 31 March 2021
Research and development expenses
Revenue expenses pertaining to research is charged to the consolidated statement
of profit and loss. Development cost of products are also charged to consolidated
statement of profit and loss unless a product’s technical feasibility has been
established, in which case such expenditure is capitalized. The amount capitalized
comprises expenditure that can be directly attributed or allocated on a reasonable
and consistent basis to creating, producing and making the asset ready for its
intended use. Fixed assets utilized for research and development are capitalized
and depreciated in accordance with the policies stated for the property, plant and
equipment.
E. Inventories
Stock-in-trade is valued at cost and net realisable value whichever is lower. Net
realisable value is the estimated selling price in the ordinary course of business
less the estimated costs of completion and the estimated costs necessary to make
the sale. Cost of traded goods is determined on First-in-First out (FIFO) basis and
includes the cost of purchases and other costs incurred in bringing the inventories
to their present location and condition. The comparison of cost and net realizable
value is made on an item by item basis. Provision is made for the cost of
obsolescence and other anticipated losses, whenever considered necessary.
F. Impairment
Impairment of financial instruments (other than at fair value)
The Group assesses on a forward-looking basis the expected credit loss associated
with its assets carried at amortised cost and FVTOCI debt instruments. The
impairment methodology applied depends on whether there has been a significant
increase in credit risk. For trade receivables only, the Group applies the simplified
approach permitted by Ind AS 109 - Financial Instruments, which requires expected
lifetime losses to be recognised from initial recognition of the receivables.
Impairment of non-financial assets
The carrying values of assets / cash generating units at each Balance Sheet date
are reviewed to determine whether there is any indication that an asset may be
impaired. If any indication of such impairment exists, the recoverable amount of
such assets / cash generating unit is estimated and in case the carrying amount
of these assets exceeds their recoverable amount, an impairment is recognised.
The recoverable amount is the higher of the net selling price and their value in
3. Significant accounting policies (Continued)
D. Intangible assets (Continued)

INDUSTRIES
Seventyseventh annual report
Tata Industries Limited
196
NOTES TO CONSOLIDATED FINANCIAL STATEMENTS
as at and for the year ended 31 March 2021
use. Value in use is arrived at by discounting the future cash flows to their present
value based on an appropriate discount factor. Assessment is also done at each
Balance Sheet date as to whether there is indication that an impairment loss
recognised for an asset in prior accounting periods no longer exists or may have
decreased, such reversal of impairment loss is recognised in the Statement of
Profit and Loss.
G. Non-current assets or disposal group held for sale
Non-current assets, or disposal groups comprising assets and liabilities are
classified as held for sale if it is highly probable that they will be recovered primarily
through sale rather than through continuing use.
Such assets, or disposal groups, are generally measured at the lower of their
carrying amount and fair value less costs to sell. Any resultant loss on a disposal
group is allocated first to goodwill, and then to remaining assets and liabilities on
pro rata basis, except that no loss is allocated to inventories, financial assets,
deferred tax assets, employee benefit assets, and biological assets, which continue
to be measured in accordance with the Group’s other accounting policies. Losses
on initial classification as held for sale and subsequent gains and losses on re-
measurement are recognised in profit or loss.
Once classified as held-for-sale, intangible assets, property, plant and equipment
and investment properties are no longer amortised or depreciated.
H. Employee benefits
Short-term employee benefits
All employee benefits payable wholly within twelve months of rendering the service
are classified as short-term employee benefits. These benefits include
compensated absences such as paid annual leave. The undiscounted amount of
short-term employee benefits expected to be paid in exchange for the services
rendered by employees is recognised during the year.
Defined Contribution plans
The Group makes monthly contributions to the Superannuation fund and National
pension scheme for all qualifying employees, until retirement or resignation of the
employee. The Group recognizes such contributions as an expense when incurred.
The Group has no further obligation beyond its monthly contribution.
3. Significant accounting policies (Continued)
F. Impairment (Continued)

197
NOTES TO CONSOLIDATED FINANCIAL STATEMENTS
as at and for the year ended 31 March 2021
Defined benefit plans
The Group operates the post-employment schemes such as Gratuity, Provident
fund and Post-retirement medical benefits (PRMB) and Pension to an ex-director
which are defined benefit plans.
The liability or asset recognised in the balance sheet in respect of defined benefit
plans is the present value of the defined benefit obligation at the end of the reporting
period less the fair value of plan assets. The defined benefit obligation is calculated
annually by actuaries using the projected unit credit method.
The actuarial valuation method, carried out by an independent actuary, used for
measuring the liability for provident Fund is Projected Accrued Benefit method.
This approach determines the present value of the interest rate guarantee to
employees. Provident fund trusts are treated as Defined Benefit Plans, since the
Group is obliged to meet interest shortfall, if any, with respect to covered
employees.
The present value of the defined benefit obligation is determined by discounting
the estimated future cash outflows by reference to market yields at the end of the
reporting period on government bonds that have terms approximating to the terms
of the related obligation.
The net interest cost is calculated by applying the discount rate to the net balance
of the defined benefit obligation and the fair value of the plan assets. This cost
is included in employee benefit expense in the statement of profit and loss.
Remeasurement gains and losses arising from experience adjustments and
changes in actuarial assumptions are recognised in the period in which they occur,
directly in the other comprehensive income.
Changes in the present value of the defined benefit obligation resulting from plan
amendments or enhancements are recognised in profit and loss as past service
cost.
Other long-term employee benefits
The liabilities for earned leave and sick leave are not expected to be settled wholly
after the end of the period in which the employees render the related services.
They are therefore measured at the present value of expected future payments to
be made in respect of services provided by employees up to the end of the reporting
period using the projected unit credit method. The benefits are discounted using
3. Significant accounting policies (Continued)
H. Employee benefits (Continued)

INDUSTRIES
Seventyseventh annual report
Tata Industries Limited
198
NOTES TO CONSOLIDATED FINANCIAL STATEMENTS
as at and for the year ended 31 March 2021
the market yields at the end of the reporting period that have terms approximating
to the terms of the related obligation. Remeasurement as a result of experience
adjustments and changes in actuarial assumptions are recognised in statement
of profit and loss.
The obligations are presented as liabilities in the balance sheet after the reporting
period, regardless of when the actual settlement is expected to occur.
I. Provisions
A provision is recognised if, as a result of a past event, the Group has a present
legal or constructive obligation that can be estimated reliably, and it is probable
that an outflow of economic benefits will be required to settle the obligation.
Provisions are determined by discounting the expected future cash flows
(representing the best estimate of the expenditure required to settle the present
obligation at the balance sheet date) at a pre-tax rate that reflects current market
assessments of the time value of money and the risks specific to the liability. The
unwinding of the discount is recognised as finance cost. Expected future operating
losses are not provided for.
A contract is considered to be onerous when the expected economic benefits to
be derived by the Group from the contract are lower than the unavoidable cost
of meeting its obligations under the contract. The provision for an onerous contract
is measured at the present value of the lower of the expected cost of terminating
the contract and the expected net cost of continuing with the contract. Before
such a provision is made, the Group recognises any impairment loss on the assets
associated with that contract.
J. Revenue recognition
The Group has applied Ind AS 115 Revenue from Contracts with Customers which
establishes a comprehensive framework for determining whether, how much and
when revenue is to be recognised.
Revenue is recognized upon transfer of control of promised products or services
to customers in an amount that reflects the consideration expected to receive in
exchange for those products or services.
The core principle of Ind AS 115 is that an entity should recognise revenue to
depict the transfer of promised goods or services to customers in an amount that
reflects the consideration to which the entity expects to be entitled in exchange
3. Significant accounting policies (Continued)
H. Employee benefits (Continued)

199
NOTES TO CONSOLIDATED FINANCIAL STATEMENTS
as at and for the year ended 31 March 2021
for those goods or services. Specifically, the standard introduces a 5-step approach
to revenue recognition:
• Step 1 : Identify the contract(s) with a customer
• Step 2 : Identify the performance obligation in contract
• Step 3 : Determine the transaction price
• Step 4 : Allocate the transaction price to the performance obligations in
the contract
• Step 5 : Recognise revenue when (or as) the entity satisfies a performance
obligation
Under Ind AS 115, an entity recognises revenue when (or as) a performance
obligation is satisfied, i.e. when ‘control’ of the goods or services underlying the
particular performance obligation is transferred to the customer.
Rendering of services
In respect of contracts, other than ClassEdge license and support fees, revenue
on time-and-material contracts are recognized as the related services are
performed and revenue from the end of the last invoicing to the reporting date is
recognized as unbilled revenue. Revenue from fixed-price, fixed-timeframe
contracts, where the performance obligations are satisfied over time and where
there is no uncertainty as to measurement or collectability of consideration, is
recognized as per the percentage-of-completion method. Efforts or costs expended
have been used to measure progress towards completion. Projected losses, if
any, are provided in entirety as per Ind AS based on management’s current
estimates of cost to completion arrived at on the basis of technical assessment
of time and effort required and estimates of future expenditure.
Revenue from licensing of ClassEdge content to schools is recognized, on a pro-
rata basis over the contract period, commensurate with the services rendered /
cost incurred for the same. The Group has applied the guidance in Ind AS 115
by applying the revenue recognition criteria for each distinct performance
obligation. The arrangements with customers generally meet the criteria for
considering equipment, software licenses and support services as distinct
performance obligations. The performance obligations are satisfied as and when
the services are rendered since the customer consumes the services as time
progresses.
3. Significant accounting policies (Continued)
J. Revenue recognition (Continued)

INDUSTRIES
Seventyseventh annual report
Tata Industries Limited
200
NOTES TO CONSOLIDATED FINANCIAL STATEMENTS
as at and for the year ended 31 March 2021
3. Significant accounting policies (Continued)
J. Revenue recognition (Continued)
Revenue is measured based on the transaction price, which is the consideration,
adjusted for volume discounts, service level credits, performance bonuses, price
concessions and incentives, if any, as specified in the contract with the customer.
Revenue also excludes taxes collected from customers.
Revenues in excess of invoicing are classified as contract assets (which are referred
to as unbilled revenue) while invoicing in excess of revenues are classified as
contract liabilities (which are referred to as unearned revenues).
Contract assets are recognised when there is excess of revenue earned over billings
on contracts. Contract assets are classified as unbilled receivables (only act of
invoicing is pending) when there is unconditional right to receive cash, and only
passage of time is required, as per contractual terms.
Unearned and deferred revenue (“contract liability”) is recognised when there are
billings in excess of revenues.
Sale of goods
Revenue from sale of goods is recognised on transfer of control over to the goods
to the customer. Sales are recorded net of returns (if any), trade discounts, rebates,
and goods and service tax.
Deferred contract costs are incremental costs of obtaining a customer contract.
Deferred contract costs are recognised as assets and amortized over the term of
the customer contract, except in case where the amortisation period is one year
or less, in which case the costs are expensed as and when incurred.
Interest income
Interest income from debt instruments is recognised using the effective interest
rate method. The effective interest rate is the rate that exactly discounts estimated
future cash receipts through the expected life of the financial asset to the gross
carrying amount of a financial asset. When calculating the effective interest rate,
the Group estimates the expected cash flows by considering all the contractual
terms of the financial instruments (for example, prepayment, extension) but does
not consider the expected credit loss.
Dividend income
Dividend income is recognised in profit or loss on the date on which the Group’s
right to receive payment is established.

201
NOTES TO CONSOLIDATED FINANCIAL STATEMENTS
as at and for the year ended 31 March 2021
3. Significant accounting policies (Continued)
K. Leases
A contract is, or contains, a lease if the contract conveys the right to control the
use of an identified asset for a period of time in exchange for consideration.
Group as a lessee
The Group accounts for each lease component within the contract as a lease
separately from non-lease components of the contract and allocates the
consideration in the contract to each lease component on the basis of the relative
stand-alone price of the lease component and the aggregate stand-alone price of
the non-lease components.
The Group recognises right-of-use asset representing its right to use the underlying
asset for the lease term at the lease commencement date. The cost of the right-
of-use asset measured at inception shall comprise of the amount of the initial
measurement of the lease liability adjusted for any lease payments made at or
before the commencement date less any lease incentives received, plus any initial
direct costs incurred and an estimate of costs to be incurred by the lessee in
dismantling and removing the underlying asset or restoring the underlying asset
or site on which it is located. The right-of-use assets is subsequently measured
at cost less any accumulated depreciation, accumulated impairment losses, if
any and adjusted for any remeasurement of the lease liability. The right-of-use
assets is depreciated using the straight-line method from the commencement date
over the shorter of lease term or useful life of right-of-use asset. The estimated
useful lives of right-of-use assets are determined on the same basis as those of
property, plant and equipment.
Right-of-use assets are tested for impairment whenever there is any indication
that their carrying amounts may not be recoverable. Impairment loss, if any, is
recognised in the statement of profit and loss.
The Group measures the lease liability at the present value of the lease payments
that are not paid at the commencement date of the lease. The lease payments are
discounted using the interest rate implicit in the lease, if that rate can be readily
determined. If that rate cannot be readily determined, the Company uses
incremental borrowing rate. For leases with reasonably similar characteristics,
the Company, on a lease by lease basis, may adopt either the incremental
borrowing rate specific to the lease or the incremental borrowing rate for the
portfolio as a whole.

INDUSTRIES
Seventyseventh annual report
Tata Industries Limited
202
NOTES TO CONSOLIDATED FINANCIAL STATEMENTS
as at and for the year ended 31 March 2021
3. Significant accounting policies (Continued)
K. Leases (Continued)
The lease payments shall include fixed payments, variable lease payments, residual
value guarantees, exercise price of a purchase option where the Company is
reasonably certain to exercise that option and payments of penalties for terminating
the lease, if the lease term reflects the lessee exercising an option to terminate
the lease.
The lease liability is subsequently remeasured by increasing the carrying amount
to reflect interest on the lease liability, reducing the carrying amount to reflect the
lease payments made and remeasuring the carrying amount to reflect any
reassessment or lease modifications or to reflect revised in-substance fixed lease
payments.
The Group recognises the amount of the re-measurement of lease liability as an
adjustment to the right-of-use asset. Where the carrying amount of the right-of-
use asset is reduced to zero and there is a further reduction in the measurement
of the lease liability, the Company recognises any remaining amount of the re-
measurement in statement of profit and loss.
The Group has elected not to apply the requirements of Ind AS 116 to short-term
leases of all assets that have a lease term of 12 months or less and leases for
which the underlying asset is of low value. The lease payments associated with
these leases are recognized as an expense on a straight-line basis over the lease
term.
Group as a lessor
At the inception of the lease the Group classifies each of its leases as either an
operating lease or a finance lease. The Group recognises lease payments received
under operating leases as income on a straight-line basis over the lease term. In
case of a finance lease, finance income is recognised over the lease term based
on a pattern reflecting a constant periodic rate of return on the lessor’s net
investment in the lease. When the Group is an intermediate lessor it accounts for
its interests in the head lease and the sub-lease separately. It assesses the lease
classification of a sub-lease with reference to the right-of-use asset arising from
the head lease, not with reference to the underlying asset. If a head lease is a
short term lease to which the Group applies the exemption described above, then
it classifies the sub-lease as an operating lease.
If an arrangement contains lease and non-lease components, the Group applies
Ind AS 115 Revenue to allocate the consideration in the contract.

203
NOTES TO CONSOLIDATED FINANCIAL STATEMENTS
as at and for the year ended 31 March 2021
3. Significant accounting policies (Continued)
K. Leases (Continued)
The Group has adopted Ind AS 116, effective annual reporting period beginning
April 1, 2019 and applied the standard to its leases, retrospectively, with the
cumulative effect of initially applying the Standard, recognised on the date of initial
application (April 1, 2019). Accordingly, the Company has not restated comparative
information, instead, the cumulative effect of initially applying this standard has
been recognised as an adjustment to the opening balance of retained earnings
as on April 1, 2019.
The Group has applied the Covid -19 related concession – amendment to Ind AS
116. The amendment did not have any impact on the amounts recognized in prior
periods and will affect the current & future periods only.
L. Income Tax
Income tax comprises current and deferred tax. It is recognised in profit or loss
except to the extent that it relates to a business combination or to an item
recognised directly in equity or in other comprehensive income.
Current tax
Current tax comprises the expected tax payable or receivable on the taxable income
or loss for the year and any adjustment to the tax payable or receivable in respect
of previous years. The amount of current tax reflects the best estimate of the tax
amount expected to be paid or received after considering the uncertainty, if any,
related to income taxes. It is measured using tax rates (and tax laws) enacted or
substantively enacted by the reporting date.
Current tax assets and current tax liabilities are offset only if there is a legally
enforceable right to set off the recognised amounts, and it is intended to realise
the asset and settle the liability on a net basis or simultaneously.
Deferred tax
Deferred tax is recognised in respect of temporary differences between the carrying
amounts of assets and liabilities for financial reporting purposes and the
corresponding amounts used for taxation purposes. Deferred tax is also recognised
in respect of carried forward tax losses and tax credits. Deferred tax is not
recognised for:
• temporary differences arising on the initial recognition of assets or liabilities
in a transaction that is not a business combination and that affects neither
accounting nor taxable profit or loss at the time of the transaction;
INDUSTRIES
Seventyseventh annual report
Tata Industries Limited
204
NOTES TO CONSOLIDATED FINANCIAL STATEMENTS
as at and for the year ended 31 March 2021
3. Significant accounting policies (Continued)
L. Income Tax (Continued)
• temporary differences related to investments in subsidiaries, associates and
joint arrangements to the extent that the Group is able to control the timing
of the reversal of the temporary differences and it is probable that they will
not reverse in the foreseeable future; and
• taxable temporary differences arising on the initial recognition of goodwill.
Deferred tax assets are recognised to the extent that it is probable that future
taxable profits will be available against which they can be used. The existence of
unused tax losses is strong evidence that future taxable profit may not be available.
Therefore, in case of a history of recent losses, the Group recognises a deferred
tax asset only to the extent that it has sufficient taxable temporary differences or
there is convincing other evidence that sufficient taxable profit will be available
against which such deferred tax asset can be realised. Deferred tax assets-
unrecognised or recognised, are reviewed at each reporting date and are
recognised/ reduced to the extent that it is probable/ no longer probable
respectively that the related tax benefit will be realised.
Deferred tax is measured at the tax rates that are expected to apply to the period
when the asset is realised or the liability is settled, based on the laws that have
been enacted or substantively enacted by the reporting date.
The measurement of deferred tax reflects the tax consequences that would follow
from the manner in which the Group expects, at the reporting date, to recover or
settle the carrying amount of its assets and liabilities.
Deferred tax assets and liabilities are offset if there is legally enforceable right to
offset current tax liabilities and assets, and they relate to income taxes levied by
the same tax authority on the same taxable entity, or on different tax entities, but
they intend to settle current tax liabilities and assets on a net basis or their tax
assets and liabilities will be realised simultaneously.
Tax benefits acquired as part of a business combination, but not satisfying the
criteria for separate recognition at that date, are recognised subsequently if new
information about facts and circumstances change. Acquired deferred tax benefits
recognised within the measurement period reduce goodwill related to that
acquisition if they result from new information obtained about facts and
circumstances existing at the acquisition date. If the carrying amount of goodwill
is zero, any remaining deferred tax benefits are recognised in OCI/ capital reserve
depending on the principle explained for bargain purchase gains. All other acquired
tax benefits realised are recognised in profit or loss.

205
NOTES TO CONSOLIDATED FINANCIAL STATEMENTS
as at and for the year ended 31 March 2021
Minimum Alternate Tax (MAT) credit is recognised as an asset only when and to
the extent there is convincing evidence that the Group will pay normal income tax
during the specified period. Such asset is reviewed at each Balance Sheet date
and the carrying amount of the MAT credit asset is written down to the extent
there is no longer a convincing evidence to the effect that the Group will pay
normal income tax during the specified period.
M. Discontinued Operations
A discontinued operation is a component of the Group’s business, the operations
and cash flows of which can be clearly distinguished from those of the rest of the
Group and which represents a separate major line of business or geographical
area of operations and
• is part of a single coordinated plan to dispose of a separate major line of
business or geographic area of operations; or
• is a subsidiary acquired exclusively with a view to re-sale.
Classification as a discontinued operation occurs upon disposal or when the
operation meets the criteria to be classified as held for sale, if earlier.
When an operation is classified as a discontinued operation, the comparative
statement of profit and loss is re-presented as if the operation had been
discontinued from the start of the comparative period.
N. Borrowing costs
Borrowing costs are interest and other costs (including exchange differences
relating to foreign currency borrowings to the extent that they are regarded as an
adjustment to interest costs) incurred in connection with the borrowing of funds.
Borrowing costs directly attributable to acquisition or construction of an asset
which necessarily take a substantial period of time to get ready for their intended
use are capitalised as part of the cost of that asset. Other borrowing costs are
recognised as an expense in the period in which they are incurred.
O. Operating Segments
An operating Segment is a component of the Group that engages in business
activities from which it may earn revenues and incur expenses, including revenues
and expenses that relates to transactions with any of Group’s other components,
and for which discrete financial information is available. All operating segments
operating results are reviewed regularly by the Group’s Board to make decisions
about resources to be allocated to the segment and assess their performance.
3. Significant accounting policies (Continued)
L. Income Tax (Continued)
INDUSTRIES
Seventyseventh annual report
Tata Industries Limited
206
NOTES TO CONSOLIDATED FINANCIAL STATEMENTS
as at and for the year ended 31 March 2021
P. Earnings per share
Basic earnings per share is calculated by dividing the net profit or loss for the year
attributable to equity shareholders by the weighted average number of equity
shares outstanding during the year. For the purpose of calculating diluted earnings
per share, the net profit or loss for the period attributable to equity shareholders
and the weighted average number of shares outstanding during the period is
adjusted for the effects of all dilutive potential equity shares.
Q. Business combinations
Business combinations under common control
Business combinations arising from transfers of interests in entities that are under
the common control are accounted in accordance with “Pooling of Interest Method”
laid down by Appendix C of Indian Accounting Standard 103 (Ind AS 103) Business
combinations of entities under common control, notified under the Companies
Act, 2013.
All assets, liabilities and reserves of the combining entity are recorded in the books
of account of the Group at their existing carrying amounts. Inter-company balances
are eliminated. The difference between the investments held by the Group and all
assets, liabilities and reserves of the combining entity are recognised in capital
reserve and presented separately from other capital reserves. Comparative
accounting period presented in the financial statements of the Group has been
restated for the accounting impact of the merger, as stated above, as if the merger
had occurred from the beginning of the comparative period in the financial
statements.
Any non-controlling interest in an acquiree is measured at fair value or as the non-
controlling interest’s proportionate share of the acquiree’s net identifiable assets.
This accounting choice is made on a transaction by transaction basis.
Business combinations not under common control
Business combinations except under common control are accounted for using
the acquisition method. The cost of an acquisition is measured as the aggregate
of the consideration transferred measured at acquisition date fair value and the
amount of any non-controlling interests in the acquiree. For each business
combination, the Group elects whether to measure the non-controlling interests
in the acquiree at fair value or at the proportionate share of the acquiree’s
identifiable net assets. Acquisition-related costs are expensed as incurred.
At the acquisition date, the identifiable assets acquired and the liabilities assumed
are recognised at their acquisition date fair values. For this purpose, the liabilities
assumed include contingent liabilities representing present obligation and they
3. Significant accounting policies (Continued)

207
NOTES TO CONSOLIDATED FINANCIAL STATEMENTS
as at and for the year ended 31 March 2021
are measured at their acquisition fair values irrespective of the fact that outflow
of resources embodying economic benefits is not probable.
When the Group acquires a business, it assesses the financial assets and liabilities
assumed for appropriate classification and designation in accordance with the
contractual terms, economic circumstances and pertinent conditions as at the
acquisition date. This includes the separation of embedded derivatives in host
contracts by the acquiree.
Any contingent consideration to be transferred by the acquirer is recognised at
fair value at the acquisition date. Contingent consideration classified as an asset
or liability that is a financial instrument and within the scope of Ind AS 109 Financial
Instruments, is measured at fair value with changes in fair value recognised in
profit or loss. If the contingent consideration is not within the scope of Ind AS 109,
it is measured in accordance with the appropriate Ind AS. Contingent consideration
that is classified as equity is not re-measured at subsequent reporting dates and
subsequent its settlement is accounted for within equity.
Goodwill is initially measured at cost, being the excess of the aggregate of the
consideration transferred and the amount recognised for non-controlling interests,
and any previous interest held, over the net identifiable assets acquired and
liabilities assumed. If the fair value of the net assets acquired is in excess of the
aggregate consideration transferred, the Group re-assesses whether it has correctly
identified all of the assets acquired and all of the liabilities assumed and reviews
the procedures used to measure the amounts to be recognised at the acquisition
date. If the reassessment still results in an excess of the fair value of net assets
acquired over the aggregate consideration transferred, then the gain is recognised
in OCI and accumulated in equity as capital reserve. However, if there is no clear
evidence of bargain purchase, the entity recognises the gain directly in equity as
capital reserve, without routing the same through OCI.
If the initial accounting for a business combination is incomplete by the end of the
reporting period in which the combination occurs, the Group reports provisional
amounts for the items for which the accounting is incomplete. Those provisional
amounts are adjusted through goodwill during the measurement period, or
additional assets or liabilities are recognised, to reflect new information obtained
about facts and circumstances that existed at the acquisition date that, if known,
would have affected the amounts recognised at that date. These adjustments are
called as measurement period adjustments. The measurement period does not
exceed one year from the acquisition date.
3. Significant accounting policies (Continued)
Q. Business combinations (Continued)
Business combinations under common control (Continued)

INDUSTRIES
Seventyseventh annual report
Tata Industries Limited
208
NOTES TO CONSOLIDATED FINANCIAL STATEMENTS
as at and for the year ended 31 March 2021
After initial recognition, goodwill is measured at cost less any accumulated
impairment losses. For the purpose of impairment testing, goodwill acquired in
a business combination is, from the acquisition date, allocated to each of the
Group’s cash-generating units that are expected to benefit from the combination,
irrespective of whether other assets or liabilities of the acquiree are assigned to
those units.
A cash generating unit to which goodwill has been allocated is tested for impairment
annually, or more frequently when there is an indication that the unit may be
impaired. If the recoverable amount of the cash generating unit is less than its
carrying amount, the impairment loss is allocated first to reduce the carrying
amount of any goodwill allocated to the unit and then to the other assets of the
unit pro rata based on the carrying amount of each asset in the unit. Any impairment
loss for goodwill is recognised in profit or loss. An impairment loss recognised for
goodwill is not reversed in subsequent periods.
Where goodwill has been allocated to a cash-generating unit and part of the
operation within that unit is disposed of, the goodwill associated with the disposed
operation is included in the carrying amount of the operation when determining
the gain or loss on disposal. Goodwill disposed in these circumstances is measured
based on the relative values of the disposed operation and the portion of the
cash-generating unit retained.
The excess of the consideration transferred, amount of the non-controlling interest,
and acquisition date fair value of any previous equity interest is the acquired entity
over the fair value of the net identifiable assets acquired is recorded as goodwill.
R. Provisions and contingencies
A provision is recognised when the Group has a present obligation as a result of
past events and it is probable that an outflow of resources will be required to
settle the obligation, in respect of which a reliable estimate of the amount can be
made. Provisions are determined based on best estimate required to settle the
obligation at the Balance Sheet date. When a provision is measured using the
cash flows estimated to settle the present obligation, its carrying amount is the
present value of those cash flows (when the effect of the time value of the money
is material). The increase in the provisions due to passage of time is recognized
as interest expense. Provisions are reviewed as at each reporting date and adjusted
to reflect the current estimate.
3. Significant accounting policies (Continued)
Q. Business combinations (Continued)
Business combinations under common control (Continued)

209
NOTES TO CONSOLIDATED FINANCIAL STATEMENTS
as at and for the year ended 31 March 2021
Contingent liabilities are disclosed when there is a possible obligation arising
from past events, the existence of which will be confirmed only by the occurrence
or non-occurrence of one or more uncertain future events not wholly within the
control of the Group or a present obligation that arises from past events where
it is either not probable that an outflow of resource will be required to settle or a
reliable estimate of the amount cannot be made.
Contingent assets are not disclosed in the financial statements unless an inflow
of economic benefits is probable.
S. Recent pronouncements
On March 24, 2021, the Ministry of Corporate Affairs (“MCA”) through a notification,
amended Schedule III of the Companies Act, 2013. The amendments revise Division
I, II and III of Schedule III and are applicable from April 1, 2021.
The amendments are extensive and the Group will evaluate the same to give effect
to them as required by law.
3. Significant accounting policies (Continued)
R. Provisions and contingencies (Continued)

INDUSTRIES
Seventyseventh annual report
Tata Industries Limited
210
NOTES TO CONSOLIDATED FINANCIAL STATEMENTS
as at and for the year ended 31 March 2021
(Currency: Indian rupees in lakhs)
31 March 2021 31 March 2020
4 Cash and cash equivalents
Cash on hand 1.77 1.89
- In current accounts 8,378.77 17,966.65
8,380.54 17,968.53
Balances with banks earns interest at floating
rates based on daily bank deposit rates.
Short-term deposits are made for varying
periods of between one day and three months,
depending on the immediate cash requirements
of the Group, and earn interest at the respective
short-term deposit rates.
5 Bank balance other than cash
and cash equivalents
Bank deposits 6,089.58 9,399.87
6,089.58 9,399.87
Fixed deposit and other balances with banks
earns interest at fixed rates.
6 Trade receivables
(a) Considered good - Secured - -
(b) Considered good - Unsecured 3,946.62 4,200.57
(c) Receivables which have
significant increase in Credit Risk; 2,921.70 2,347.41
Less: Allowance for impairment loss (2,921.70) (2,347.41)
(d) Receivables - credit impaired 144.23 -
Less: Allowance for impairment loss (144.23) -
3,946.62 4,200.57
6 Other receivables
(a) Considered good- Secured - -
(b) Considered good- Unsecured 1,630.88 260.98
(c) Receivables which have
significant increase in Credit Risk; - -
Less: Allowance for impairment loss - -
(d) Receivables - credit impaired - -
Less: Allowance for impairment loss - -
1,630.88 260.98

211
NOTES TO CONSOLIDATED FINANCIAL STATEMENTS
as at and for the year ended 31 March 2021
(Currency: Indian rupees in lakhs)
7 Loans
Loans to employees 0.78 1.85
Loan given to other than related parties 84,430.63 49,139.74
84,431.41 49,141.59
31 March 2021 31 March 2020
8 Investments
Investments in money market instruments -
mutual funds (at fair value through profit and loss) 30,887.14 41,738.57
Investments in preference shares
Unquoted
- Joint Ventures (at fair value through profit and loss) 1,201.11 973.36
- Others (at amortised cost) 1,879.38 1,716.55
Investments in equity instruments
Unquoted
- Others (at fair value through other
comprehensive income) 26,664.29 20,745.53
Quoted
- Others (at fair value through other
comprehensive income) 237,847.44 58,576.36
Investments in venture/investments funds -
Unquoted (at fair value through profit and loss) 4,838.95 4,484.38
303,318.31 128,234.73
9 Other financial assets
Security deposits 1,540.39 1,407.05
Less: Impairment loss allowance - -
1,540.39 1,407.05
Interest accrued on fixed deposits 29.20 60.79
Interest accrued on loan given 4,006.13 3,441.81
Other receivables 288.99 -
5,864.71 4,909.65

INDUSTRIES
Seventyseventh annual report
Tata Industries Limited
212
NOTES TO CONSOLIDATED FINANCIAL STATEMENTS
as at and for the year ended 31 March 2021
(Currency: Indian rupees in lakhs)
10 Equity Accounted Investees
Investment in Joint venture (Refer note 40) 30,096.95 60,996.53
Investment in Associate companies
(Refer note 39) 34,060.65 37,958.27
64,157.60 98,954.80
11 Inventories
(At lower of cost and net realisable value)
Raw materials and components - in transit 1,037.20 854.09
Work - in - progress 268.46 85.23
Finished goods 769.85 465.64
Stores and spares 564.90 357.19
Stock in trade
- Medicines, food and nutritional items 74.87 60.61
- Equipments 351.82 283.66
- Others 0.25 0.20
Packing Material 562.28 453.89
Less : Provision for obsolescence (88.58) (58.88)
3,541.05 2,501.63
12 Non current tax assets (net)
Taxes paid [net of provision] 11,421.29 14,489.65
11,421.29 14,489.65
31 March 2021 31 March 2020

213
NOTES TO CONSOLIDATED FINANCIAL STATEMENTS
as at and for the year ended 31 March 2021
(Currency: Indian rupees in lakhs)
13
Pro
pe
rty,
pla
nt
an
d e
qu
ipm
en
t
Offic
e
prem
ises
/
owne
rshi
p
flats
Build
ing
Plan
t &
mac
hine
ry
Labo
rato
ry
equi
pmen
tsVe
hicl
es
Furn
iture
at s
choo
ls
for
Clas
sEdg
e
Leas
ehol
d
impr
ove-
men
ts
Offic
e
equi
pmen
t
(incl
udin
g
med
ical
dem
o
devi
ces)
Mou
lds
Dies
and
Patte
rns
Com
pute
rs
Clas
sEdg
e
impl
e-
men
tatio
n
and
inst
alla
tion
Elec
tric
al
Inst
alla
tions
&
Equi
pmen
t
Leas
ehol
d
Land
Stor
age
equi
pmen
t
Furn
iture
for
offic
es
Wor
ksho
p
faci
lity,
tool
s an
d
devi
ces
Tota
l
Bala
nce
at 3
1 M
arch
202
02,
237.
0312
,932
.58
23,8
53.1
019
0.23
196.
0876
8.70
472.
3731
1.43
863.
851.
3859
4.04
1,05
4.53
719.
604.
338.
8965
.90
44,2
74.0
4
Asse
ts a
cqui
red
inBu
sine
ss c
ombi
ntio
n-
-50
.49
--
--
--
-2.
42-
--
2.45
-55
.36
Addi
tions
-13
3.41
4,84
9.41
63.9
329
.86
2.67
45.4
454
.68
179.
62-
92.4
723
.09
38.1
3-
4,68
9.57
-10
,202
.26
Del
etio
ns-
-(2
,768
.33)
-(2
0.70
)-
(2.5
7)(5
3.27
)(1
8.50
)-
(134
.15)
-(0
.05)
-(7
.68)
-(3
,005
.26)
Rec
lass
ifica
tion
-(5
,574
.49)
1.38
--
-0.
825,
571.
512.
16(1
.38)
--
--
65.9
0(6
5.90
)-
Fore
ign
exch
ange
--
(171
.47)
-(0
.25)
-(1
.23)
(579
.87)
--
(2.1
9)-
--
(3.2
6)-
(758
.27)
Bal
ance
at 3
1 M
arch
202
12,
237.
037,
491.
5025
,814
.57
254.
1620
4.99
771.
3751
4.84
5,30
4.48
1,02
7.12
-55
2.58
1,07
7.62
757.
674.
334,
755.
87-
50,7
68.1
3
Bala
nce
at 3
1 M
arch
202
012
9.79
3,89
8.87
8,67
2.64
9.01
62.0
046
8.95
100.
7093
.62
392.
480.
3136
8.93
736.
5726
.09
4.33
4.14
39.7
715
,008
.18
Asse
ts a
cqui
red
inBu
sine
ss c
ombi
ntio
n-
-52
1.99
-1.
22-
2.99
185.
19-
-5.
60-
--
2.60
-71
9.61
Dep
reci
atio
n40
.32
257.
762,
135.
8823
.50
27.2
610
8.01
74.8
562
8.52
209.
01-
115.
1311
0.74
69.3
8-
35.1
4-
3,83
5.50
Impa
irmen
t-
--
--
3.25
--
--
-5.
74-
--
-8.
99
Del
etio
n-
-(2
,349
.40)
-(1
8.95
)-
(2.2
8)(1
5.08
)(1
5.28
)-
(144
.61)
-(0
.01)
-(5
.04)
-(2
,550
.65)
Rec
lass
ifica
tion
-(3
,781
.67)
0.31
--
-0.
533,
779.
741.
40(0
.31)
--
--
39.7
7(3
9.77
)-
Fore
ign
exch
ange
--
(140
.22)
-(0
.33)
-(1
.01)
(587
.72)
(0.2
1)-
(2.5
8)-
--
(3.4
7)-
(735
.55)
Bal
ance
at 3
1 M
arch
202
117
0.11
374.
968,
841.
2032
.51
71.1
958
0.21
175.
794,
084.
2658
7.40
-34
2.47
853.
0595
.45
4.33
73.1
4-
16,2
86.0
8
Net
blo
ck
At 3
1 M
arch
202
02,
107.
249,
033.
7115
,180
.46
181.
2313
4.08
299.
7537
1.67
217.
8147
1.37
1.07
225.
1131
7.96
693.
51-
4.75
26.1
429
,265
.86
At 3
1 M
arch
202
12,
066.
927,
116.
5416
,973
.37
221.
6513
3.80
191.
1633
9.05
1,22
0.22
439.
72-
210.
1122
4.57
662.
22-
4,68
2.73
-34
,482
.05

INDUSTRIES
Seventyseventh annual report
Tata Industries Limited
214
NOTES TO CONSOLIDATED FINANCIAL STATEMENTS
as at and for the year ended 31 March 2021
(Currency: Indian rupees in lakhs)
14
Inta
ng
ible
asse
ts
Bal
ance
at
31 M
arch
202
072
8.71
779.
456.
445,
540.
305,
200.
1078
7.32
139.
5345
9.26
--
13,6
41.1
1
Add
ition
s22
9.56
--
3,57
7.65
999.
64-
--
40.4
1-
4,84
7.26
Del
etio
ns(2
8.98
)-
--
(2.7
3)-
--
--
(31.
71)
Ass
ets
acqu
ired
inB
usin
ess
com
bint
ion
11.4
8-
--
2.76
0.90
--
-46
,667
.29
46,6
82.4
4
Fore
ign
Exch
ange
(3.1
5)-
--
(54.
85)
(1.0
8)-
--
-(5
9.09
)
Bal
ance
at
31
Mar
ch 2
02
19
37
.62
77
9.4
56
.44
9,1
17
.95
6,1
44
.92
78
7.1
41
39
.53
45
9.2
64
0.4
14
6,6
67
.29
65
,08
0.0
1
Bal
ance
at
31 M
arch
202
051
2.73
422.
026.
432,
646.
3950
8.03
263.
1495
.90
294.
09-
-4,
748.
73
Dep
reci
atio
n13
3.90
147.
08-
1,07
0.40
599.
6171
.38
25.2
612
4.16
4.04
3,11
1.15
5,28
6.98
Del
etio
n(2
8.98
)-
--
--
--
--
(28.
98)
Ass
ets
acqu
ired
inB
usin
ess
com
bint
ion
3.94
--
-19
4.65
2.57
--
--
201.
16
Fore
ign
Exch
ange
(3.7
2)-
--
(29.
06)
(0.4
2)-
-(0
.04)
-(3
3.24
)
Bal
ance
at
31
Mar
ch 2
02
16
17
.86
56
9.1
06
.43
3,7
16
.79
1,4
67
.87
33
6.6
71
21
.16
41
8.2
54
.00
3,1
11
.15
10
,17
4.6
4
Net
blo
ck
At
31
Mar
ch 2
02
02
15
.98
35
7.4
30
.01
2,8
93
.91
4,6
92
.07
52
4.1
84
3.6
31
65
.17
--
8,8
92
.38
At
31
Mar
ch 2
02
13
19
.76
21
0.3
50
.01
5,4
01
.16
4,6
77
.05
45
0.4
71
8.3
74
1.0
13
6.4
14
3,5
56
.14
54
,90
5.3
7
Sof
twar
e
Dig
ital
heal
thpl
atfo
rmso
ftw
are
Con
sum
eran
alyt
ics
soft
war
e
Cla
ssEd
ge c
onte
nt,
Pla
nEdg
e an
dTe
stEd
ge p
latf
orm
(int
erna
llyge
nera
ted)
Cap
ital
ised
Dev
elop
men
tco
st
Valu
eed
ucat
ion
and
vide
os
Dig
ital
cont
ent
vide
os
Pro
pert
yri
ghts
Lice
nsed
cont
ent
Pate
nt(R
efer
note
46)
Tota
l
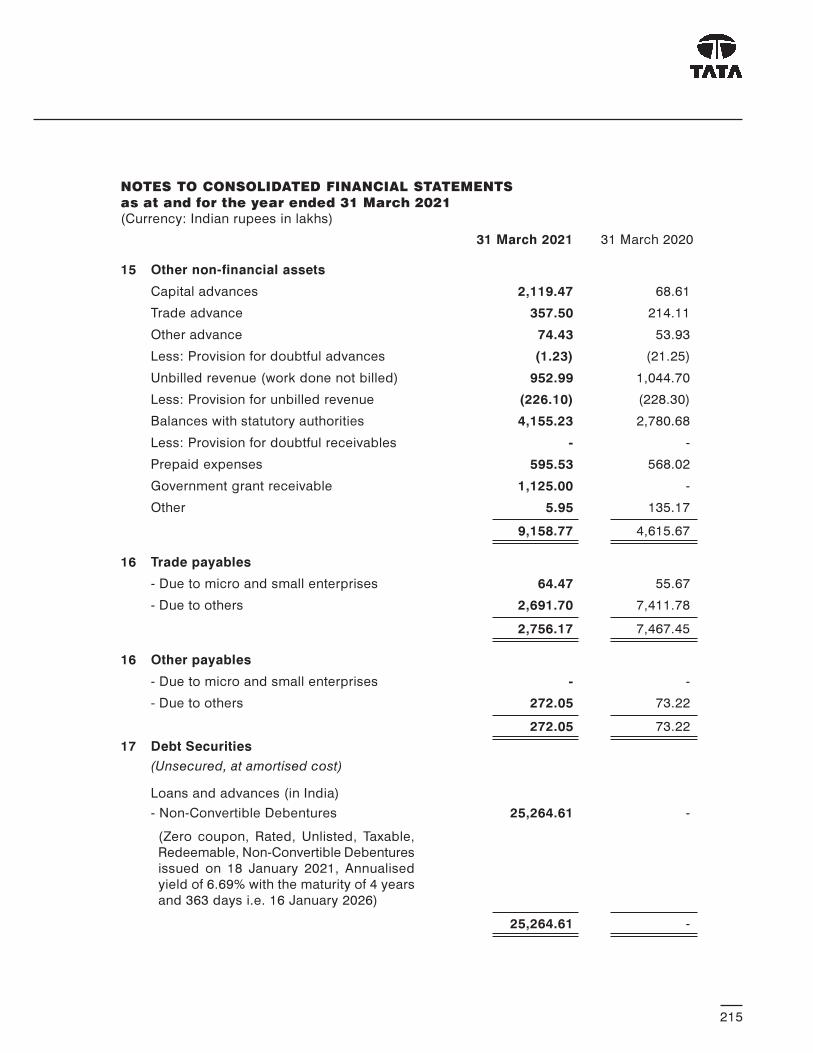
215
NOTES TO CONSOLIDATED FINANCIAL STATEMENTS
as at and for the year ended 31 March 2021
(Currency: Indian rupees in lakhs)
31 March 2021 31 March 2020
15 Other non-financial assets
Capital advances 2,119.47 68.61
Trade advance 357.50 214.11
Other advance 74.43 53.93
Less: Provision for doubtful advances (1.23) (21.25)
Unbilled revenue (work done not billed) 952.99 1,044.70
Less: Provision for unbilled revenue (226.10) (228.30)
Balances with statutory authorities 4,155.23 2,780.68
Less: Provision for doubtful receivables - -
Prepaid expenses 595.53 568.02
Government grant receivable 1,125.00 -
Other 5.95 135.17
9,158.77 4,615.67
16 Trade payables
- Due to micro and small enterprises 64.47 55.67
- Due to others 2,691.70 7,411.78
2,756.17 7,467.45
16 Other payables
- Due to micro and small enterprises - -
- Due to others 272.05 73.22
272.05 73.22
17 Debt Securities
(Unsecured, at amortised cost)
Loans and advances (in India)
- Non-Convertible Debentures 25,264.61 -
(Zero coupon, Rated, Unlisted, Taxable,
Redeemable, Non-Convertible Debentures
issued on 18 January 2021, Annualised
yield of 6.69% with the maturity of 4 years
and 363 days i.e. 16 January 2026)
25,264.61 -

INDUSTRIES
Seventyseventh annual report
Tata Industries Limited
216
NOTES TO CONSOLIDATED FINANCIAL STATEMENTS
as at and for the year ended 31 March 2021
(Currency: Indian rupees in lakhs)
31 March 2021 31 March 2020
18 Borrowings (Other than Debt Securities)
Term loans
- From banks 21,507.05 -
(Maturity 1-5 years.
Interest rate 3% - 3.30% plus EURIBOR)
- From Others
- Short term revolving loan facility 15,000.00 -
- Rupee Term loan facility 10,000.00 -
(12 months annual renewable facility
of 6.95% - 7%)
46,507.05 -
19 Other financial liabilities
Interest accrued and due on borrowings 418.60 -
Accrued Royalty - MPAC 156.49 -
Capital creditors 3,635.65 1,423.71
Employee benefit payables 3,309.35 2,491.07
Security deposits 155.00 155.00
Government grant 1,125.00 -
Deferred consideration for business combination - 718.21
Other payables 920.00 723.71
9,720.09 5,511.70
20 Current tax liabilities (net)
Provision for taxation [net of advance tax] 202.89 329.05
202.89 329.05
21 Provisions
Provision for employee benefits
- Compensated absences 1,820.55 1,372.23
- Post retirement medical benefits 236.10 293.85
- Pension benefits to an ex-director 1,883.85 1,541.94
- Gratuity Benefit 62.06 159.75
Other provisions
- Contingency provision for standard assets 166.52 15.45
- Provision for warranty 48.73 34.21
4,217.81 3,417.43

217
NOTES TO CONSOLIDATED FINANCIAL STATEMENTS
as at and for the year ended 31 March 2021
(Currency: Indian rupees in lakhs)
31 March 2021 31 March 2020
22 Other non-financial liabilities
Income received in advance 878.91 1,031.68
Advance received from customers 1,003.29 1,383.52
Deferred rent - 2.01
Statutory dues payable 632.24 480.54
2,514.44 2,897.75
23 Share Capital
Authorised
11,10,00,000 (31 March 2020: 11,10,00,000)
Equity shares of Rs. 100 each 1,11,000.00 1,11,000.00
50,00,000 (31 March 2020: 50,00,000)
Redeemable preference shares of Rs. 100 each 5,000.00 5,000.00
1,16,000.00 1,16,000.00
Issued, subscribed and fully paid-up
10,79,54,602 (31 March 2020: 10,79,54,602)
Equity shares of Rs 100 each, fully paid-up 1,07,954.60 1,07,954.60
1,07,954.60 1,07,954.60
(a) Reconciliation of the number of equity shares outstanding
at the beginning and at the end of the year:
(b) Terms/rights attached to equity shares:
In the event of liquidation of the Company the holders of equity shares will be entitled to
receive remaining assets of the company after distribution of all preferential amount. The
distribution will be in proportion to the number of equity shares held by the shareholders.
The equity shares have rights, preferences and restrictions which are in accordance with
the provisions of law, in particular the Companies Act, 2013.
At the beginning and
at the end of the year 10,79,54,602 1,07,954.60 10,79,54,602 1,07,954.60
31 March 2021 31 March 2020
No. of shares Rs. lakhs No. of shares Rs. lakhs

INDUSTRIES
Seventyseventh annual report
Tata Industries Limited
218
NOTES TO CONSOLIDATED FINANCIAL STATEMENTS
as at and for the year ended 31 March 2021
(Currency: Indian rupees in lakhs)
23 Share Capital (Continued)
(c) Shareholders holding more than 5% shares in the Company:
Tata Sons Pvt Ltd. 5,35,21,229 49.58% 5,35,21,229 49.58%
Tata Motors Ltd. 1,03,10,242 9.55% 1,03,10,242 9.55%
Tata Steel Ltd. 99,80,436 9.24% 99,80,436 9.24%
Tata Chemicals Ltd. 98,61,303 9.13% 98,61,303 9.13%
Tata Consumer Products Limited
(formerly Tata Global
Beverages Ltd.) 65,19,441 6.04% 65,19,441 6.04%
The Tata Power Company Ltd. 58,28,126 5.40% 58,28,126 5.40%
31 March 2021 31 March 2020
No. of shares % holding No. of shares
Name of the
Shareholder % holding
24 Other equity
(a) Capital reserve
At the end of the year 10.32 10.32
(b) Securities premium account
At the end of the year 60,480.01 60,480.01
(c) Amalgamation reserve
At the end of the year 2,498.76 2,498.76
(d) Impairment reserve
At the commencement of the period / year 324.04 -
Addition during the year 563.08 324.04
At the end of the year 887.12 324.04
(e) Foreign currency translation reserve
(arising on consolidation)
As per last balance sheet 69,897.07 58,742.10
Add: Effect of foreign exchange rate
variations during the year (13,072.86) 11,154.96
At the end of the year 56,824.21 69,897.07
(f) Reserve fund - under section 45IC of
the Reserve Bank of India Act, 1934
At the end of the year 50,199.21 50,199.21
31 March 2021 31 March 2020

219
NOTES TO CONSOLIDATED FINANCIAL STATEMENTS
as at and for the year ended 31 March 2021
(Currency: Indian rupees in lakhs)
(g) General reserve
At the end of the year 17,040.37 17,040.37
(h) Retained earnings
At the commencement of the year 114,416.65 157,640.10
Add : Addition at the beginning of
the year on account of Ind AS 116 - (299.43)
Add : Profit / (loss) for the year (64,793.53) 23,657.08
Add : Other comprehensive income
for the year 114.18 (693.29)
Add/(less): Realised gains/ (losses)
transferred to Retained Earnings - (60,027.41)
Less : Amount transfer to reserve fund - (5,860.41)
Less : Discontinue of OCI impact of
Associate become Subsidiary 9,894.34 -
At the end of the year 59,631.64 114,416.65
(i) Fair Value through OCI Reserve -
Equity Investments
At the commencement of the period / year (3,908.33) 17,477.49
Add/(less): Addition/(dedcution)
during the year 183,314.44 (81,413.23)
Add/(less) : Realised gains/ (losses)
transferred to Retained Earnings - 60,027.41
At the end of the year 179,406.11 (3,908.33)
426,977.75 310,958.10
31 March 2021 31 March 2020
24 Other equity (Continued)
25 Interest income
(on financial assets measured at amortised cost)
Interest on deposits with banks 100.89 828.11
Interest on loans 2,163.74 1,166.31
Interest on unwinding of financial assets 218.45 185.67
Other interest income 0.01 0.01
Interest income on financial assets measured at FVPL - 1.07
2,483.09 2,181.17

INDUSTRIES
Seventyseventh annual report
Tata Industries Limited
220
NOTES TO CONSOLIDATED FINANCIAL STATEMENTS
as at and for the year ended 31 March 2021
(Currency: Indian rupees in lakhs)
26 Dividend income
Dividends from long-term investments 432.41 533.52
432.41 533.52
27 Net gain on fair value changes
(on financial instruments at fair value
through profit or loss)
Net gain /(loss) on financial instruments
at fair value through profit or loss:
- Fair value gain/(loss) on investments 885.26 (2,096.41)
- Fair value gain/(loss) on investments
in preference shares (net) 227.75 116.69
- Fair value gain on investments in mutual funds 995.43 2,540.63
- Others 4.36 77.55
2,112.80 638.46
28 Sale of Products
Manufactured goods
- Sale of Ready-to-eat products 1,400.79 206.45
- Income eMetal 2.60 -
- Income eFlex 497.83 -
- Income R&D Projects 300.63 -
Traded goods
- Equipments 1,140.39 3,367.62
- Medicines, food and nutritional items 7,672.76 4,803.89
- Beverages 1.88 1.58
- Machines 4.19 6.97
- Others 6.41 4.81
11,027.48 8,391.32
29 Sale of services
ClassEdge licence and support fee 5,735.65 7,083.22
Management consultancy services 5,244.75 5,583.01
Data analytics fees 1,295.44 1,237.53
Others 149.78 177.21
12,425.62 14,080.97
31 March 2021 31 March 2020

221
NOTES TO CONSOLIDATED FINANCIAL STATEMENTS
as at and for the year ended 31 March 2021
(Currency: Indian rupees in lakhs)
31 March 2021 31 March 2020
30 Other income
Profit on sale of long term investments 0.68 -
Exchange gain (net) 2,167.08 -
Lease rent concession as per Ind AS 116 13.18 -
Profit on sale of Property, plant and equipment 2.92 -
Recovery of common sharing expenses 101.24 -
Provision for onerous lease rentals
written back (net) - 1.42
Sale of scrap 11.53 1.90
Interest on Income tax refund 411.35 -
Credit / sundry balances written back 1.24 97.26
Miscellaneous income 151.77 20.11
Fair value gain on acquisition of control 2,039.02 28,623.39
4,900.01 28,744.08
31 Finance costs
(on financial liabilities measured at amortised cost)
Interest expense - -
On borrowings 369.41 316.81
On debt securities 322.98 -
Unwinding interest 865.55 695.40
Other borrowing costs 100.02 2.40
1,657.96 1,014.61
32 Cost of raw materials consumed
Opening stock 1,293.65 -
Add : Purchases 4,417.56 1,440.12
Less : Closing stock 1,908.55 744.12
3,802.66 696.00
33 Purchases of stock-in-trade
Equipments 1,015.12 2,613.07
Medicines, food and nutritional items 7,543.96 4,634.63
Beverages - 1.37
8,559.08 7,249.07

INDUSTRIES
Seventyseventh annual report
Tata Industries Limited
222
NOTES TO CONSOLIDATED FINANCIAL STATEMENTS
as at and for the year ended 31 March 2021
(Currency: Indian rupees in lakhs)
34 Changes in inventories of finished goods,
work-in-progress and stock in trade - -
Opening stock - -
Work-in-progress 232.58 -
Finished goods 324.80 -
Stock in trade 344.27 197.14
901.65 197.14
Less: - -
Closing stock: - -
Work-in-progress 96.37 85.23
Finished goods 946.95 215.60
Stock in trade 426.94 344.47
(568.61) (448.16)
35 Employee benefits expenses
Salaries, wages and incentives 18,456.07 12,976.50
Contribution to
(i) Provident and other funds 1,162.19 488.53
(ii) Gratuity fund 141.53 113.50
Staff welfare expenses 679.44 617.11
20,439.23 14,195.64
36 Other expenses
Consumption of stores and spare parts 41.78 36.14
Gas, electricity, power and fuel 907.62 180.55
Rent 202.69 403.16
Repairs and maintenance - Plant and Machinery 329.43 14.17
Repairs and maintenance - Building 35.58 21.13
Repairs and maintenance - Others 437.00 342.92
Warehousing expense 144.16 130.85
Administrative expense 120.19 9.06
Insurance 127.92 81.54
Rates and taxes 122.10 347.17
Carriage outwards 67.66 46.86
Impairment provision as per RBI guidelines 563.08 324.04
Conference courses and training expenses 60.81 153.57
Recruitment expenses 199.79 255.30
Legal and professional fees 1,538.20 1,609.65
Equipment hire charges 17.88 231.82
Dubbing and outsourcing charges 1,685.73 1,070.53
31 March 2021 31 March 2020

223
NOTES TO CONSOLIDATED FINANCIAL STATEMENTS
as at and for the year ended 31 March 2021
(Currency: Indian rupees in lakhs)
Travelling,conveyance and transportation 368.33 987.42
Telephone and communication expenses 85.67 133.91
Advertisement, publicity and marketing 2,065.98 996.71
Technology Expenses 318.50 71.65
Corporate Social Responsibility contribution 164.65 -
ClassEdge support and maintenance expenses 407.76 791.77
Data centre hosting charges 699.26 513.97
Conveyance and transportation 3.09 91.38
Printing and Stationery 174.53 47.18
Bank charges 20.21 4.85
Exchange loss (net) 148.71 21.56
Content Licence Charges 10.45 -
Bad debts / advances written off 223.57 12.18
Commission 2.48 -
Provision for standard assets 151.07 (7.34)
Provision for sub-standard and doubtful debts /
advances / deposits (net) 456.91 556.30
Inventories written off 29.69 56.27
Loss on sale / write off of fixed assets (net) 130.17 0.18
Provision for unbilled revenue 4.29 (35.10)
Director’s sitting fees 6.80 0.80
Provision for warranty 15.43 -
Subscription fee 37.50 16.14
Auditors’ remuneration
- As auditors 48.85 49.06
- For tax audit and tax services 4.14 7.39
- For other services 3.00 6.69
- For reimbursement of out-of-pocket expenses 0.40 3.55
Intellectual Property Expenses 292.61 285.45
Research and Development Expense - Product 106.62 15.01
Impairment - Intangible assets under development - 169.00
Royalty Expenses 522.50 254.09
Motor Car expenses 36.34 55.37
Housekeeping and Security Charges 160.73 131.63
Membership and Subscriptions 27.96 200.25
Miscellaneous expenses 271.40 292.79
13,601.22 10,988.57
31 March 2021 31 March 2020
36 Other expenses (Continued)

INDUSTRIES
Seventyseventh annual report
Tata Industries Limited
224
NOTES TO CONSOLIDATED FINANCIAL STATEMENTS
as at and for the year ended 31 March 2021
(Currency: Indian rupees in lakhs)
37 Held for sale and discontinued operationRs. in Lakhs
Investment held for sale ceases to be classified as held for sale due to change in decision
to sell the investment.
Discontinued operations
In the year 2018-19, the Board of Directors decided to divest its stake in the subsidiary -
Tata Advanced Material Ltd (TAML), which was promoted by the Company in FY 1989
and held as strategic investment.
An agreement for selling the entire stake in TAML was entered into on May 9, 2018
with Tata Advanced Systems Limited, which got completed in the previous year on
May 31, 2019.
Accordingly, the operations of the said subsidiary have been classified as discontinued
operations. The comparative year results of the subsidiary have been restated as
discontinued operations as per the requirements of Ind AS 105.
Accordingly, the disclosures in relation to the said discontinued operations as per IND AS
105- Non-current Assets Held for Sale and Discontinued Operations are stated below:
31 March 2021Particulars
(a) Assets classified as held for sale
and discontinued operation
Assets held for sale 0.73 0.73
Investments held for sale - 12.15
0.73 12.88
31 March 2020
(i) Results of discontinued operations:
Rs. in Lakhs
Tata Advanced Material Ltd
Particulars
Total Discontinuing Operations
For the year ended
31 March 2021
For the year ended
31 March 2020
For the year ended
31 March 2021
For the year ended
31 March 2020
Revenue
Interest income - - - -
Dividend income - - - -
Commission income - - - -
Net gain on fair value changes - - - -
Sale of goods - 5,413.97 - 5,413.97
Sale of services - 1.77 - 1.77
Interest income - - - -
Other income - 118.60 - 118.60
Total (A) - 5,534.34 - 5,534.34

225
NOTES TO CONSOLIDATED FINANCIAL STATEMENTS
as at and for the year ended 31 March 2021
(Currency: Indian rupees in lakhs)
37 Held for sale and discontinued operation (Continued)
(i) Results of discontinued operations: (Continued)
Rs. in Lakhs
Tata Advanced Material Ltd
Particulars
Total Discontinuing Operations
For the year ended
31 March 2021
For the year ended
31 March 2020
For the year ended
31 March 2021
For the year ended
31 March 2020
Expenditure
Finance Costs - 338.82 - 338.82
Cost of material consumed - 2,435.09 - 2,435.09
Purchases of stock-in-trade - - - -
Changes in inventories of
stock-in-trade - 48.33 - 48.33
Employee benefits expenses - 1,179.28 - 1,179.28
Depreciation, impairment
and amortisation - 244.70 - 244.70
Other expenses - 1,186.49 - 1,186.49
Total (B) - 5,432.72 - 5,432.72
Profit /(loss) before tax (A-B) - 101.62 - 101.62
Less: Tax (expense) / credit - - - -
Profit /(loss) after tax - 101.62 - 101.62
Other comprehensive income:
Remeasurement gain / (loss)
on defined benefit plans - - - -
Net gains / (losses) in
cash flow hedges - - - -
Total other
comprehensive income - - - -
Total comprehensive
income / (losses) - 101.62 - 101.62

INDUSTRIES
Seventyseventh annual report
Tata Industries Limited
226
NOTES TO CONSOLIDATED FINANCIAL STATEMENTS
as at and for the year ended 31 March 2021
(Currency: Indian rupees in lakhs)
37 Held for sale and discontinued operation (Continued)
(i) Results of discontinued operations: (Continued)
Rs. in Lakhs
Particulars
Total Discontinuing Operations
For the year ended
31 March 2021
For the year ended
31 March 2020
Profit/(loss) from discontinued operations during the year - 101.62
Gain on disposal of discontinued operations -
Tata Interactive Systems Division, Tata Interactive Systems
Gmbh, Tata Interactive Systems AG and Tata Advanced
Material Ltd (including reclassification of foreign currency
translation reserve to profit and loss for CY Rs. NIL
(31 March 2019 : Rs. 2,592.19 Lakhs). - 34,211.62
Total Profit from Discontinued operations - 34,313.24
(ii) Cash flows (used in) / from discontinued operation:
Rs. in Lakhs
TAML
Particulars
Total Discontinuing Operations
For the year ended
31 March 2021
For the year ended
31 March 2020
For the year ended
31 March 2021
For the year ended
31 March 2020
Cash flow (used in) /
from operating activities - 101.62 - 101.62
Cash flow (used in) /
from investing activities - - - -
Cash flow (used in) /
from financing activities - - - -
Net cash inflows / (outflows) - 101.62 - 101.62
Cash flow from disposal
(classified in investing activities
in statement of cash flows) - 63,757.00 - 63,757.00

227
NOTES TO CONSOLIDATED FINANCIAL STATEMENTS
as at and for the year ended 31 March 2021
(Currency: Indian rupees in lakhs)
Tax expense of continuing operations does not include the following:
31 March 2021 31 March 2020
Current tax expense / (credit)
of discontinuing operations - -
Deferred tax expense / (credit)
of discontinuing operations - -
38 Income tax
A. Amounts recognised in profit and loss
B. Reconciliation of effective tax rate
The reconciliation between the statutory income tax rate applicable to the Company and
the effective Income tax rate of the Company is as follows:
31 March 2021 31 March 2020
Profit before tax from continuing operations (26,318.90) 16,549.93
Company’s domestic tax rate 25.17% 25.17%
Current tax using Company’s domestic tax rates (6,623.94) 4,165.29
Add / (Less) : Difference due to
Non-deductible tax expenses (395.61) 66.31
Effect of earlier years tax (252.53) (104.05)
Utilisation/Carried forward of unrecognised losses 1,073.32 (1,676.53)
Consolidation adjustments not (taxed) /
deducted for tax purpose 1,110.39 (6,719.36)
Tax free income (9.50) (264.19)
Unrecognised deferred tax assets / (liabilities) 3,375.80 1,097.64
Effect of differences in tax rates 870.81 3.84
Amount taxable on realised gains 513.53 2,969.82
Others 115.25 95.20
(222.48) (366.04)
The Company has decided to exercise the option for lower tax rate permitted under Section
115BAA of the Income-tax Act, 1961 as introduced by the Taxation Laws (Amendment)
Ordinance dated 20 September 2019.
31 March 2021 31 March 2020
Current tax expense / (credit) 260.93 44.26
Deferred tax (refer note D below) (230.89) (410.30)
Short/(Excess) provision of tax for earlier years (252.52) -
Tax expense of continuing operations (222.48) (366.04)

INDUSTRIES
Seventyseventh annual report
Tata Industries Limited
228
NOTES TO CONSOLIDATED FINANCIAL STATEMENTS
as at and for the year ended 31 March 2021
(Currency: Indian rupees in lakhs)
38 Income tax (Continued)
C. Tax asset and liability
Non-current tax asset (net) 11,421.29 14,489.65
Current tax liability (net) 202.89 329.05
As at
31 March 2021
As at
31 March 2020
Note : The Company does not expect to generate sufficient taxable income against which
deferred tax asset could be realised. Accordingly, the net deferred tax assets has not
been recognised in the absence of convincing evidence for utilising the deferred tax
assets in the foreseeable future.
D. Deferred tax asset/(liability)
Deferred tax assets
Property, plant and equipment and
Intangible assets 1,388.02 677.20
Provision for doubtful debts 721.88 590.80
Provision for employee benefits
and other provisions 504.32 320.82
Provision for unbilled revenue - -
Provision for advances 1.93 5.89
Investments in mutual fund 0.74 0.17
MAT - -
Carried Forward losses 576.87 400.96
Provision for Warranty Claim 28.55 29.39
Lease deposits 1,302.13 1,526.51
4,524.44 3,551.73
Deferred tax liabilities
Investments in mutual/venture fund (269.18) 267.26
Goodwill 23.43 65.57
Right of use assets 961.70 1,367.23
715.95 1,700.06
Net deferred tax assets 3,808.49 1,851.67
Net deferred tax assets/(liabilities) 581.99 364.77
recognised
31 March 2021 31 March 2020

229
NOTES TO CONSOLIDATED FINANCIAL STATEMENTS
as at and for the year ended 31 March 2021
(Currency: Indian rupees in lakhs)
38 Income tax (Continued)
E. Tax losses carried forward
Tax losses for which no deferred tax asset was recognised expire as follows:
Unabsorbed depreciation Never expire 13,503.47 2,798.40
13,503.47 2,798.40
Carried forward business loss 31-Mar-20 3,669.00 1,779.05
31-Mar-21 5,676.93 4,507.81
31-Mar-22 4,545.15 -
31-Mar-23 8,625.10 -
31-Mar-24 9,451.57 -
31-Mar-25 11,964.12 178.28
31-Mar-26 74,255.86 63,216.77
31-Mar-27 12,933.78 3,623.30
31-Mar-28 4,940.15 5,659.01
31-Mar-29 8,893.07 -
144,954.72 78,964.22
Long term capital loss 31-Mar-20 - -
31-Mar-21 - -
31-Mar-22 - -
31-Mar-24 5,040.08 3,909.63
31-Mar-25 724.11 724.11
31-Mar-26 3,715.58 3,715.58
31-Mar-27 64.06 64.06
31-Mar-29 167,212.39 -
176,756.21 8,413.37
Temporary deductible difference
on account of indexation
on investments 65,386.79 241,827.14
242,143.00 250,240.52
31 March 2021Expiry date 31 March 2020
Tata SmartFoodz Limited, a subsidiary, has not recognised deferred tax assets in respect of
deductible temporary difference on carried forward business losses under tax due to absence of
reasonable certainty that future taxable profits will be available for utilisation thereof.
The amounts reflecting in previous year (i.e. 31 March 2020) are as per the financial statements
of the said year. However, tax losses reflecting in current year (i.e. 31 March 2021) is based on
income-tax return filed for FY 2019-20 and draft tax computation for FY 2020-21.

INDUSTRIES
Seventyseventh annual report
Tata Industries Limited
230
NOTES TO CONSOLIDATED FINANCIAL STATEMENTS
as at and for the year ended 31 March 2021
(Currency: Indian rupees in lakhs)
39
Inve
stm
en
t in
Asso
cia
tes
Th
e G
rou
p h
as f
ollo
win
g i
nve
stm
en
ts i
n a
sso
cia
tes
Rs.
in L
akh
s
@T
he
In
ve
stm
en
ts i
n N
iska
lp I
nfr
astr
uctu
re L
imite
d h
as b
ee
n w
ritt
en
off
un
de
r p
revio
us G
AA
P.
Ma
teri
al
Asso
cia
tes
Tata
Au
toco
mp
Syste
ms L
imited
, In
dia
31-M
ar-
21
34.4
0%
10,2
51.0
4-
23,0
68.6
533,3
19.6
9
31-M
ar-
20
34.4
0%
10,2
51.0
4-
26,8
84.2
537,1
35.2
9
Imp
etis B
ioscie
nces L
imited
, In
dia
31-M
ar-
21
34.3
7%
762.2
2156.7
8(2
1.2
5)
740.9
7
31-M
ar-
20
34.9
4%
936.9
2156.7
8(1
13.8
3)
823.0
8
Flis
om
AG
31-M
ar-
21
--
--
-
31-M
ar-
20
54.3
0%
--
--
Imm
ate
ria
l A
sso
cia
tes
Ind
igen
e P
harm
aceu
ticals
Lim
ited
, U
SA
31-M
ar-
21
32.9
6%
--
--
31-M
ar-
20
32.9
6%
--
--
Ori
en
tal F
lora
tech
(In
dia
) Lim
ited
31-M
ar-
21
24.1
9%
--
--
31-M
ar-
20
24.1
9%
--
--
Ori
en
tal S
eri
tech
Lim
ited
, In
dia
31-M
ar-
21
28.2
1%
--
--
31-M
ar-
20
28.2
1%
--
--
ITeL I
nd
ustr
ies L
imited
, In
dia
31-M
ar-
21
20.0
0%
--
--
31-M
ar-
20
20.0
0%
--
--
Nis
kalp
In
frastr
uctu
re L
imited
, In
dia
@31-M
ar-
21
50.0
0%
--
--
31-M
ar-
20
50.0
0%
--
--
To
tal
Inve
stm
en
t in
Asso
cia
tes
31-M
ar-
21
11
,01
3.2
51
56
.78
23
,04
7.4
03
4,0
60
.65
31-M
ar-
20
11
,18
7.9
51
56
.78
26
,77
0.4
23
7,9
58
.37
Na
me
an
d C
ou
ntr
y o
f in
co
rpo
rati
on
As a
tO
wn
ers
hip
Inte
rest
Ori
gin
al
Co
st
of
Inve
stm
en
t
Am
ou
nt
of
Go
od
wil
l /
(Ca
pit
al
Re
se
rve
) in
Ori
gin
al
Co
st
Sh
are
of
po
st
acq
uis
itio
n
Re
se
rve
s
an
d S
urp
lus
Ca
rryin
g
co
st
of
inve
stm
en
t

231
NOTES TO CONSOLIDATED FINANCIAL STATEMENTS
as at and for the year ended 31 March 2021
(Currency: Indian rupees in lakhs)
Th
e f
ollo
win
g t
ab
le p
rovid
es t
he
su
mm
ari
se
d f
ina
nc
ial in
form
ati
on
of
the
Gro
up
’s in
ve
stm
en
t in
ma
teri
al a
sso
cia
tes.
Ta
ta A
uto
co
mp
Sy
ste
ms
Lim
ite
dIm
pe
tis
Bio
sc
ien
ce
s L
imit
ed
As
at
31
Ma
rch
20
21
As
at
31
Ma
rch
20
20
As
at
31
Ma
rch
20
21
Pa
rtic
ula
rsA
s a
t
31
Ma
rch
20
20
Cu
rre
nt
asse
ts1
77
,51
6.6
31
53
,77
2.8
21
,14
3.4
91
,39
1.2
0
No
n-c
urr
en
t a
sse
ts2
84
,27
1.7
12
95
,18
5.8
51
,03
0.6
21
,17
7.9
0
Cu
rre
nt
lia
bilitie
s2
07
,06
3.9
41
76
,05
2.8
81
3.0
47
3.3
5
No
n-c
urr
en
t lia
bilitie
s1
29
,55
1.3
31
24
,71
7.8
3-
14
0.3
0
To
tal
Eq
uit
y1
25
,17
3.0
71
48
,18
7.9
62
,16
1.0
72
,35
5.4
5
Eq
uit
y a
ttri
bu
ted
to
No
n-C
on
tro
llin
g I
nte
rest
28
,31
3.5
24
0,2
36
.54
--
Eq
uit
y a
ttri
bu
ted
to
Ow
ners
of
the A
sso
cia
te9
6,8
59
.55
10
7,9
51
.42
2,1
61
.07
2,3
55
.45
Pro
po
rtio
n o
f th
e G
rou
p’s
ow
ne
rsh
ip3
3,3
19
.69
37
,13
5.2
97
42
.76
82
3.0
8
Go
od
will
inclu
de
d i
n i
nve
stm
en
t-
--
-
Oth
er
ad
justm
en
t-
-(1
.79
)-
Ca
rryin
g a
mo
un
t o
f th
e i
nve
stm
en
t3
3,3
19
.69
37
,13
5.2
97
40
.97
82
3.0
8
39
Inve
stm
en
t in
Asso
cia
tes (
Co
nti
nu
ed
)
Tata
Au
toc
om
p S
yste
ms L
imit
ed
Ta
ta A
uto
co
mp
Syste
ms L
imit
ed
is a
n u
nliste
d c
om
pa
ny d
om
icile
d in
In
dia
. It
pro
vid
es p
rod
ucts
an
d s
erv
ice
s in
th
e a
uto
mo
tive
ind
ustr
y to
In
dia
n a
nd
Glo
ba
l
cu
sto
me
rs,
alo
ng
wit
h i
ts s
ub
sid
iari
es a
nd
jo
int
ve
ntu
res.
Fliso
m A
G (
ce
ase
d t
o b
e a
nF
liso
m A
G i
s a
n u
nli
ste
d c
om
pa
ny
do
mic
ile
d i
n S
wit
ze
rla
nd
, w
ith
an
asso
cia
te w
ef
25
Ma
rch
20
20
ob
jective
to
pro
du
ce
an
d m
ark
et fle
xib
le s
ola
r m
od
ule
s b
ase
d o
n p
ho
tovo
lta
ic
an
d b
eco
me
su
bsid
iary
)te
ch
no
log
ies.
It d
eve
lop
s p
rop
rie
tary
ro
ll-t
o-r
oll m
an
ufa
ctu
rin
g s
yste
ms f
or
ind
ustr
ial p
rod
uctio
n o
f so
lar
mo
du
les w
ith
R&
D u
nit a
nd
ma
nu
factu
rin
g fa
cility
loc
ate
d i
n S
wit
ze
rla
nd
. F
liso
m A
G c
ea
se
d t
o b
e a
n a
sso
cia
te w
ef
25
Ma
rch
20
20
an
d h
as b
ec
om
e a
su
bsid
iary
co
nse
qu
en
t to
th
e G
rou
p a
cq
uir
ed
ad
dit
ion
al
sta
ke
in
Fliso
m A
G.
Imp
etis B
ioscie
nce
s L
imite
dIm
pe
tis B
ioscie
nce
s L
imite
d i
s a
n u
nliste
d c
om
pa
ny d
om
icile
d i
n I
nd
ia w
ith
an
ob
jective
of
ca
rryin
g o
n b
usin
ess t
o a
cq
uir
e/d
eve
lop
in
telle
ctu
al p
rop
ert
y
asse
ts a
nd
se
ll t
he
rig
hts
to
use
fo
r w
hic
h t
he
Co
mp
an
y m
ay g
et
on
e t
ime
lum
p s
um
or
mile
sto
ne
an
d r
oya
lty p
aym
en
ts t
he
rea
fte
r.

INDUSTRIES
Seventyseventh annual report
Tata Industries Limited
232
NOTES TO CONSOLIDATED FINANCIAL STATEMENTS
as at and for the year ended 31 March 2021
(Currency: Indian rupees in lakhs)
39
Inve
stm
en
t in
Asso
cia
tes (
Co
nti
nu
ed
)
Ta
ta A
uto
co
mp
Sy
ste
ms
Lim
ite
dIm
pe
tis
Bio
sc
ien
ce
s L
imit
ed
Pa
rtic
ula
rs
Re
ve
nu
e4
21
,79
4.6
73
82
,36
0.7
06
50
.08
1,2
89
.20
Co
st
of
go
od
s s
old
26
2,3
77
.60
22
7,8
30
.61
--
De
pre
cia
tio
n2
9,0
60
.43
24
,16
1.7
21
93
.30
19
4.2
6
Fin
an
ce
co
st
10
,05
6.3
71
0,6
33
.91
27
.09
17
.15
Em
plo
ye
e b
en
efit
co
st
64
,46
0.0
96
7,6
12
.84
--
Oth
er
exp
en
se
60
,68
0.8
23
7,4
58
.22
61
.61
78
4.0
5
Pro
fit
be
fore
ta
x(4
,84
0.6
4)
14
,66
3.4
03
68
.09
29
3.7
4
Sh
are
of p
rofit
of jo
int
ve
ntu
re a
nd
asso
cia
tes
91
8.2
31
,97
4.3
6-
-
Inco
me
ta
x7
16
.20
(1,4
09
.77
)9
8.7
2(1
42
.64
)
Pro
fit
aft
er
tax
(4,6
38
.61
)1
8,0
47
.53
26
9.3
74
36
.38
Oth
er
co
mp
reh
en
siv
e i
nco
me
81
7.8
7(1
,52
2.0
5)
--
To
tal
co
mp
reh
en
siv
e i
nc
om
e(3
,82
0.7
4)
16
,52
5.4
82
69
.37
43
6.3
8
Gro
up
’s s
ha
re o
f p
rofi
t/(l
oss)
(4,1
03
.31
)6
,28
0.4
19
2.5
81
52
.47
Gro
up
’s s
ha
re o
f O
the
r
Co
mp
reh
en
siv
e I
nc
om
e2
87
.71
(49
8.7
1)
--
Gro
up
’s s
ha
re o
f To
tal
Co
mp
reh
en
siv
e I
nc
om
e(3
,81
5.6
0)
5,7
81
.70
92
.58
15
2.4
7
FY
20
20
-21
FY
20
19
-20
FY
20
20
-21
FY
20
19
-20
Th
e G
rou
p r
ece
ive
d d
ivid
en
d o
f R
s.
Nil (
31
Ma
rch
20
20
: R
s.1
,38
4 L
akh
s)
fro
m a
n a
sso
cia
te.

233
NOTES TO CONSOLIDATED FINANCIAL STATEMENTS
as at and for the year ended 31 March 2021
(Currency: Indian rupees in lakhs)
40
Inve
stm
en
t in
Jo
int
Ve
ntu
res
Th
e G
rou
p h
as f
ollo
win
g i
nve
stm
en
ts i
n j
oin
t ve
ntu
res.
Ta
ta U
niS
tore
Lim
ite
dTa
ta U
niS
tore
Lim
ite
d i
s i
n t
he
bu
sin
ess o
f p
rovid
ing
e-c
om
me
rce
se
rvic
es,
op
era
tin
g a
lso
in
a m
ark
etp
lac
e m
od
el,
wh
ere
in i
nd
ivid
ua
l c
usto
me
rs c
an
pu
rch
ase
pro
du
cts
an
d s
erv
ice
s f
rom
se
lle
rs a
nd
re
taile
rs a
cro
ss m
ult
iple
ca
teg
ori
es.
Th
e C
om
pa
ny h
as i
ts e
co
mm
erc
e p
ort
al
un
de
r th
e b
ran
d n
am
e o
f
“TA
TA
CL
iQ”.
Ta
ta U
nis
tore
Lim
ite
d c
ea
se
d t
o b
e a
su
bsid
iary
w.e
.f.
Ma
rch
29
,
20
18
an
d h
as b
ec
om
e a
jo
int
ve
ntu
re c
on
se
qu
en
t to
th
e C
om
pa
ny e
nte
rin
g
into
a j
oin
t ve
ntu
re a
rra
ng
em
en
t w
ith
th
e m
ino
rity
pa
rtn
er,
Tre
nt
Lim
ite
d.
Inzp
era
He
alth
scie
nce
s L
imite
dIn
zp
era
He
alth
scie
nce
s L
imite
d is c
arr
yin
g o
f th
e b
usin
ess o
f co
nce
ptu
alisin
g,
ma
nu
fac
turi
ng
an
d m
ark
eti
ng
un
iqu
e a
nd
in
no
va
tive
he
alt
h f
orm
ula
tio
ns a
nd
me
dic
ine
s a
lon
g w
ith
de
live
ry m
ech
an
ism
.
Pe
rce
nta
ge
ow
ne
rsh
ip i
nte
res
t9
2.8
3%
92
.65
%7
6.9
2%
76
.92
%-
-
Fin
an
cia
l A
ss
ets
Ca
sh a
nd
ca
sh e
qu
iva
len
ts1
,23
1.8
81
,39
5.4
52
.03
50
0.2
41
,23
3.9
11
,89
5.6
9
Ba
nk b
ala
nc
es
oth
er
tha
n c
ash
an
d c
ash
eq
uiv
ale
nts
23
.63
15
.69
--
23
.63
15
.69
Re
ce
iva
ble
s
(i)
Tra
de
Re
ce
iva
ble
s5
23
.77
-2
50
.08
88
.86
77
3.8
58
8.8
6
(ii)
Oth
er
Re
ce
iva
ble
s-
--
--
-
Lo
an
s5
99
.00
61
2.0
7-
-5
99
.00
61
2.0
7
Inve
stm
en
ts5
51
.62
1,2
21
.67
--
55
1.6
21
,22
1.6
7
Oth
er
fin
an
cia
l a
sse
ts4
,11
5.0
21
,73
9.2
89
.10
8.1
64
,12
4.1
21
,74
7.4
4
Tota
l F
ina
nc
ial
As
se
ts7
,04
4.9
24
,98
4.1
62
61
.21
59
7.2
57
,30
6.1
35
,58
1.4
1
Th
e f
ollo
win
g t
ab
le p
rovid
es t
he
su
mm
ari
se
d f
ina
nc
ial
info
rma
tio
n o
f th
e G
rou
p’s
in
ve
stm
en
t in
jo
int
ve
ntu
res.
Tata
UniS
tore
Lim
ited
Inzp
era
Healt
hsc
ience
s Lim
ited
Tota
l
As
at
31
Marc
h 2
02
1
As a
t 31
Marc
h 2
020
As
at
31
Marc
h 2
02
1
As a
t 31
Marc
h 2
020
As
at
31
Marc
h 2
02
1P
art
icula
rsA
s a
t 31
Marc
h 2
020
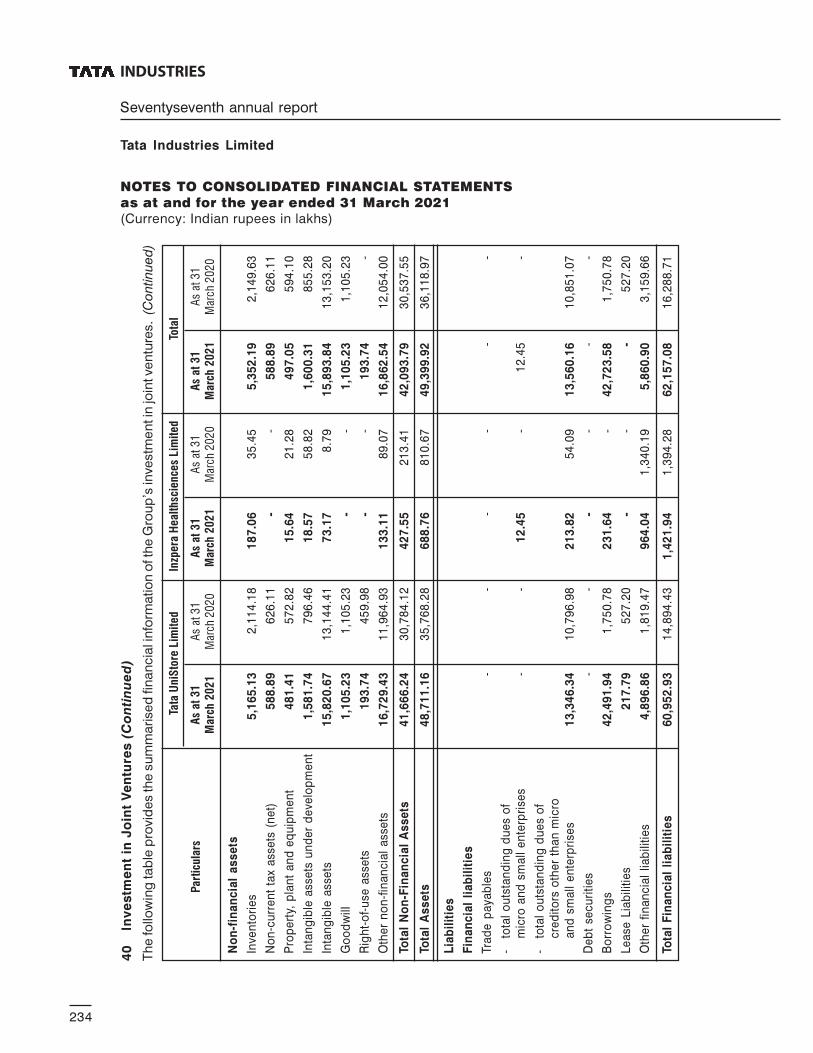
INDUSTRIES
Seventyseventh annual report
Tata Industries Limited
234
NOTES TO CONSOLIDATED FINANCIAL STATEMENTS
as at and for the year ended 31 March 2021
(Currency: Indian rupees in lakhs)
40
Inve
stm
en
t in
Jo
int
Ve
ntu
res (
Co
nti
nu
ed
)
No
n-f
ina
nc
ial
as
se
ts
Inve
nto
rie
s5
,16
5.1
32
,11
4.1
81
87
.06
35
.45
5,3
52
.19
2,1
49
.63
No
n-c
urr
en
t ta
x a
sse
ts (
ne
t)5
88
.89
62
6.1
1-
-5
88
.89
62
6.1
1
Pro
pe
rty,
pla
nt
an
d e
qu
ipm
en
t4
81
.41
57
2.8
21
5.6
42
1.2
84
97
.05
59
4.1
0
Inta
ng
ible
ass
ets
un
de
r d
eve
lop
me
nt
1,5
81
.74
79
6.4
61
8.5
75
8.8
21
,60
0.3
18
55
.28
Inta
ng
ible
ass
ets
15
,82
0.6
71
3,1
44
.41
73
.17
8.7
91
5,8
93
.84
13
,15
3.2
0
Go
od
will
1,1
05
.23
1,1
05
.23
--
1,1
05
.23
1,1
05
.23
Rig
ht-
of-
use
ass
ets
19
3.7
44
59
.98
--
19
3.7
4-
Oth
er
no
n-f
ina
nc
ial
ass
ets
16
,72
9.4
31
1,9
64
.93
13
3.1
18
9.0
71
6,8
62
.54
12
,05
4.0
0
Tota
l N
on
-Fin
an
cia
l A
ss
ets
41
,66
6.2
43
0,7
84
.12
42
7.5
52
13
.41
42
,09
3.7
93
0,5
37
.55
Tota
l A
ss
ets
48
,71
1.1
63
5,7
68
.28
68
8.7
68
10
.67
49
,39
9.9
23
6,1
18
.97
Lia
bil
itie
s
Fin
an
cia
l li
ab
ilit
ies
Tra
de
pa
ya
ble
s-
--
--
-
-to
tal
ou
tsta
nd
ing
du
es
of
mic
ro a
nd
sm
all
en
terp
rise
s-
-1
2.4
5-
12
.45
-
-to
tal
ou
tsta
nd
ing
du
es
of
cre
dit
ors
oth
er
tha
n m
icro
an
d s
ma
ll e
nte
rpri
ses
13
,34
6.3
41
0,7
96
.98
21
3.8
25
4.0
91
3,5
60
.16
10
,85
1.0
7
De
bt
sec
uri
tie
s-
--
--
-
Bo
rro
win
gs
42
,49
1.9
41
,75
0.7
82
31
.64
-4
2,7
23
.58
1,7
50
.78
Le
ase
Lia
bili
tie
s2
17
.79
52
7.2
0-
--
52
7.2
0
Oth
er
fin
an
cia
l lia
bili
tie
s4
,89
6.8
61
,81
9.4
79
64
.04
1,3
40
.19
5,8
60
.90
3,1
59
.66
Tota
l F
ina
nc
ial
lia
bil
itie
s6
0,9
52
.93
14
,89
4.4
31
,42
1.9
41
,39
4.2
86
2,1
57
.08
16
,28
8.7
1
Th
e fo
llow
ing
tab
le p
rovid
es th
e s
um
mari
se
d fin
an
cia
l in
form
atio
n o
f th
e G
rou
p’s
inve
stm
en
t in
join
t ve
ntu
res. (
Co
ntin
ue
d)
Tata
UniS
tore
Lim
ited
Inzp
era
Healt
hsc
ience
s Lim
ited
Tota
l
As
at
31
Marc
h 2
02
1
As a
t 31
Marc
h 2
020
As
at
31
Marc
h 2
02
1
As a
t 31
Marc
h 2
020
As
at
31
Marc
h 2
02
1P
art
icula
rsA
s a
t 31
Marc
h 2
020

235
NOTES TO CONSOLIDATED FINANCIAL STATEMENTS
as at and for the year ended 31 March 2021
(Currency: Indian rupees in lakhs)
40
Inve
stm
en
t in
Jo
int
Ve
ntu
res (
Co
nti
nu
ed
)
Th
e fo
llow
ing
tab
le p
rovid
es th
e s
um
mari
se
d fin
an
cia
l in
form
atio
n o
f th
e G
rou
p’s
inve
stm
en
t in
join
t ve
ntu
res. (
Co
ntin
ue
d)
Tata
UniS
tore
Lim
ited
Inzp
era
Healt
hsc
ience
s Lim
ited
Tota
l
As
at
31
Marc
h 2
02
1
As a
t 31
Marc
h 2
020
As
at
31
Marc
h 2
02
1
As a
t 31
Marc
h 2
020
As
at
31
Marc
h 2
02
1P
art
icula
rsA
s a
t 31
Marc
h 2
020
No
n-f
ina
nc
ial
lia
bil
itie
s
Pro
visi
on
s4
33
.46
40
9.9
41
1.7
63
.66
44
5.2
24
13
.60
Oth
er
no
n-f
ina
nc
ial
liab
iliti
es
1,4
77
.21
1,4
41
.57
13
.78
7.6
51
,49
0.9
91
,44
9.2
2
Tota
l N
on
-fin
an
cia
l li
ab
ilit
ies
1,9
10
.67
1,8
51
.51
25
.54
11
.31
1,9
36
.21
1,8
62
.82
Tota
l L
iab
ilit
ies
62
,86
3.6
01
6,7
45
.94
1,4
47
.48
1,4
05
.59
64
,09
3.2
91
8,1
51
.53
Ne
t A
ss
ets
(14
,15
2.4
4)
19
,02
2.3
4(7
58
.72
)(5
94
.92
)(1
4,9
11
.16
)1
8,4
27
.42
Gro
up
’s s
ha
re o
f n
et
as
se
ts(1
3,1
37
.71
)1
7,6
24
.41
(58
3.6
1)
(22
7.3
3)
(13
,72
1.3
2)
17
,39
7.0
8
Ga
in o
n F
air
Va
lua
tio
n o
f th
e r
eta
ine
d4
3,2
34
.45
43
,23
4.4
5-
-4
3,2
34
.45
43
,23
4.4
5
inte
rest
at
the
da
te o
f lo
ss o
f c
on
tro
l
in F
Y 2
01
7-1
8
Imp
ac
t o
f c
ap
pin
g o
f in
tere
st i
n-
-4
46
.49
-4
46
.49
-
join
t ve
ntu
re t
o N
IL u
nd
er
Ind
AS
28
Ca
rryin
g V
alu
e o
f n
et
inve
stm
en
ts3
0,0
96
.74
60
,85
8.8
6(1
37
.12
)(2
27
.33
)2
9,9
59
.62
60
,63
1.5
3
in J
oin
t V
en
ture
De
em
ed
in
vest
me
nt
in j
oin
t ve
ntu
re-
-1
37
.12
36
4.4
51
37
.12
36
4.4
5
ari
sin
g o
n f
air
va
lua
tio
n o
f in
vest
me
nts
in r
ed
ee
ma
ble
pre
fere
nc
e s
ha
res
Sh
are
of
ne
t lo
ss o
f jo
int
ven
ture
--
(13
7.1
2)
(22
7.3
3)
(13
7.1
2)
(22
7.3
3)
Ca
rryin
g V
alu
e o
f n
et
inve
stm
en
ts3
0,0
96
.74
60
,85
8.8
6-
13
7.1
23
0,0
96
.74
60
,99
5.9
8
in J
oin
t V
en
ture

INDUSTRIES
Seventyseventh annual report
Tata Industries Limited
236
NOTES TO CONSOLIDATED FINANCIAL STATEMENTS
as at and for the year ended 31 March 2021
(Currency: Indian rupees in lakhs)
40
Inve
stm
en
t in
Jo
int
Ve
ntu
res (
Co
nti
nu
ed
)
Tata
UniS
tore
Lim
ited
Inzp
era
Healt
hsc
ience
s Lim
ited
Tota
l
As
at
31
Marc
h 2
02
1
As a
t 31
Marc
h 2
020
As
at
31
Marc
h 2
02
1
As a
t 31
Marc
h 2
020
As
at
31
Marc
h 2
02
1P
art
icula
rsA
s a
t 31
Marc
h 2
020
Re
ve
nu
e f
rom
op
era
tio
ns
Inte
rest
in
co
me
73
.10
17
.60
6.6
80
.64
79
.78
18
.24
Div
ide
nd
in
co
me
--
--
--
Co
mm
issi
on
in
co
me
--
--
--
Ne
t g
ain
on
fa
ir v
alu
e c
ha
ng
es
53
.44
12
5.4
7-
9.3
35
3.4
41
34
.80
Sa
le o
f g
oo
ds
25
,92
7.7
31
7,4
68
.34
60
0.8
72
99
.92
26
,52
8.6
01
7,7
68
.26
Sa
le o
f se
rvic
es
9,7
26
.30
9,1
35
.10
--
9,7
26
.30
9,1
35
.10
Oth
er
inc
om
e8
2.2
23
.31
1.9
53
.46
84
.17
6.7
7
Tota
l in
co
me
35
,86
2.7
92
6,7
49
.82
60
9.5
03
13
.34
36
,47
2.2
92
7,0
63
.16
Exp
en
se
s
Fin
an
ce
co
sts
1,4
33
.79
21
6.0
67
9.4
56
4.8
01
,51
3.2
42
80
.86
Pu
rch
ase
s o
f st
oc
k-in
-tra
de
27
,23
6.7
51
8,2
89
.90
43
4.8
41
41
.01
27
,67
1.5
91
8,4
30
.91
Ch
an
ges
in in
ven
tories
of st
ock-
in-t
rad
e(3
,05
0.9
5)
(1,2
86
.33
)(1
38
.86
)(2
2.8
4)
(3,1
89
.81
)(1
,30
9.1
7)
Em
plo
ye
e b
en
efits
exp
en
ses
7,4
99
.11
5,7
31
.11
64
2.1
35
71
.17
8,1
41
.24
6,3
02
.28
De
pre
cia
tio
n,
imp
air
me
nt
an
da
mo
rtis
ati
on
3,3
71
.02
2,3
62
.24
16
.61
9.9
73
,38
7.6
32
,37
2.2
1
Oth
er
exp
en
ses
35
,57
2.8
52
8,5
24
.25
44
0.1
83
40
.25
36
,01
3.0
32
8,8
64
.50
Tota
l e
xp
en
se
s7
2,0
62
.57
53
,83
7.2
31
,47
4.3
61
,10
4.3
57
3,5
36
.93
54
,94
1.5
8
Pro
fit
/ (l
os
s)
be
fore
exc
ep
tio
na
l(3
6,1
99
.78
)(2
7,0
87
.41
)(8
64
.86
)(7
91
.01
)(3
7,0
64
.64
)(2
7,8
78
.42
)it
em
s a
nd
ta
x
Pro
fit
/ (l
os
s)
for
the
ye
ar
fro
m(3
6,1
99
.78
)(2
7,0
87
.41
)(8
64
.86
)(7
91
.01
)(3
7,0
64
.64
)(2
7,8
78
.42
)c
on
tin
uin
g o
pe
rati
on
sb
efo
re i
nc
om
e t
ax
Tax
exp
en
se o
f co
ntin
uin
g o
pe
ratio
ns
- C
urr
en
t ta
x-
--
--
-
- D
efe
rre
d t
ax
--
--
--
Ne
t ta
x e
xpe
nse
--
--
--
Pro
fit
/ (l
os
s)
for
the
ye
ar
(36
,19
9.7
8)
(27
,08
7.4
1)
(86
4.8
6)
(79
1.0
1)
(37
,06
4.6
4)
(27
,87
8.4
2)
Pro
fit
/ (l
os
s)
for
the
ye
ar
(36
,19
9.7
8)
(27
,08
7.4
1)
(86
4.8
6)
(79
1.0
1)
(37
,06
4.6
4)
(27
,87
8.4
2)

237
NOTES TO CONSOLIDATED FINANCIAL STATEMENTS
as at and for the year ended 31 March 2021
(Currency: Indian rupees in lakhs)
Th
e G
rou
p h
as
no
t re
ce
ive
d a
ny d
ivid
en
ds
fro
m t
he
jo
int
ven
ture
s.
Th
e j
oin
t ve
ntu
res
ha
ve c
on
tin
ge
nt
liab
iliti
es
of
Rs.
1,0
90
la
kh
s (3
1 M
arc
h 2
02
0:
Rs.
22
La
kh
s )
an
d c
ap
ita
l c
om
mit
me
nts
of
Rs.
NIL
(31
Ma
rch
20
20
: R
s.N
IL).
40
Inve
stm
en
t in
Jo
int
Ve
ntu
res (
Co
nti
nu
ed
)
Tata
UniS
tore
Lim
ited
Inzp
era
Healt
hsc
ience
s Lim
ited
Tota
l
As
at
31
Marc
h 2
02
1
As a
t 31
Marc
h 2
020
As
at
31
Marc
h 2
02
1
As a
t 31
Marc
h 2
020
As
at
31
Marc
h 2
02
1P
art
icula
rsA
s a
t 31
Marc
h 2
020
Dis
co
nti
nu
ed
op
era
tio
ns
28
.95
22
.91
--
28
.95
22
.91
Pro
fit
/ (l
oss
) fo
r th
e y
ea
r fr
om
dis
co
nti
nu
ed
op
era
tio
ns
be
fore
ta
x
Pro
fit
/ (l
os
s)
for
the
ye
ar
fro
m(3
6,1
70
.83
)(2
7,0
64
.50
)(8
64
.86
)(7
91
.01
)(3
7,0
35
.69
)(2
7,8
55
.51
)d
isc
on
tin
ue
d o
pe
rati
on
s a
fte
r ta
x
Oth
er
co
mp
reh
en
siv
e i
nc
om
e (
‘OC
I’)
(i)
Ite
ms
tha
t w
ill n
ot
be
re
cla
ssifie
dto
pro
fit
or
loss
:-
--
-R
em
ea
sure
me
nt
of
de
fin
ed
(0.9
5)
(28
.95
)2
.55
0.5
31
.60
(28
.42
)e
mp
loye
e b
en
efit
pla
ns
Tota
l o
the
r c
om
pre
he
ns
ive
in
co
me
(0.9
5)
(28
.95
)2
.55
0.5
31
.60
(28
.42
)
Tota
l c
om
pre
he
ns
ive
in
co
me
(36
,17
1.7
8)
(27
,09
3.4
5)
(86
2.3
0)
(79
0.4
8)
(37
,03
4.0
8)
(27
,88
3.9
3)
for
the
ye
ar
Gro
up
’s S
ha
re i
n(3
3,7
59
.12
)(2
6,9
86
.94
)(6
63
.28
)(6
08
.04
)(3
4,4
22
.41
)(2
7,5
94
.98
)To
tal
Co
mp
reh
en
siv
ein
co
me
of
the
Jo
int
Ve
ntu
re
Gro
up
’s S
ha
re i
n S
ha
re i
ssu
e(2
.78
)(1
00
.42
)-
-(2
.78
)(1
00
.42
)e
xpe
nse
an
d I
nd
AS
11
6 i
mp
ac
td
ire
ctl
y c
ha
rge
d t
o r
eta
ine
de
arn
ing
s b
y J
V
Gro
up
’s S
ha
re i
n T
ota
l-
-(1
37
.12
)(2
27
.33
)(1
37
.12
)(2
27
.33
)C
om
pre
he
nsi
ve i
nc
om
e o
f th
eJo
int
Ve
ntu
re d
ue
to
ca
pp
ing
up
toc
arr
yin
g a
mo
un
t o
f n
et
inve
stm
en
ts

INDUSTRIES
Seventyseventh annual report
Tata Industries Limited
238
NOTES TO CONSOLIDATED FINANCIAL STATEMENTS
as at and for the year ended 31 March 2021
(Currency: Indian rupees in lakhs)
41 Segment reporting
A. An operating segment is a component of the Group that engages in business activities
from which it may earn revenues and incur expenses and for which discrete financial
information is available. Operating results of all operating segments are reviewed regularly
by the management to make decisions about resources to be allocated to the segments
and assess their performance.
The Company has seven reportable segments and two reported segments, as described
below, which are the Company’s strategic business units. These business units offer
different products and services, and are managed separately because they require different
technology and marketing strategies. For each of the business units, the Company’s
management reviews internal management reports on at least a monthly basis.
The following summary describes the operations in each of the Group’s reportable /
reported segments :
Reportable/Reported segments Operations
Investment, Finance & Incubation, Investment, financing and
Business Promotion (IFP) promotion of new / existing ventures.
Tata ClassEdge (TCE) Providing digital classrooms and related tools,
to schools and educational institutions across India.
Tata Strategic Management Providing management / strategic consultancy
Group (TSMG) services to various clients within the Tata Group
Tata Digital Health (DHP) Providing health services by using
digital technology.
Tata Insights & Quants (TIQ) Providing data analytics services for various
Tata Group companies, across industries.
Ready-to-Eat (RTE) Manufacturing Ready-to-Eat food products using
MATS (Microwave Assisted Thermal sterilization)
technology and also maintaining the intellectual
property of MATS and MAPS (Microwave Assisted
Pasteurization system) technologies.
Flisom Manufacture flexible solar modules
based on CIGS photovoltaic technologies.
Armour and Products made Manufacturing of aerospace and defence
of composite material (AML) products using composites.

239
NOTES TO CONSOLIDATED FINANCIAL STATEMENTS
as at and for the year ended 31 March 2021
(Currency: Indian rupees in lakhs)
41
Se
gm
en
t re
po
rtin
g (
Co
nti
nu
ed
)
B.
Info
rma
tio
n a
bo
ut
rep
ort
ab
le /
re
po
rte
d s
eg
me
nts
Info
rma
tio
n r
eg
ard
ing
th
e r
esu
lts o
f e
ach
re
po
rta
ble
/ r
ep
ort
ed
se
gm
en
t is
in
clu
de
d b
elo
w.
Pe
rfo
rma
nce
is m
ea
su
red
ba
se
d o
n s
eg
me
nt
pro
fit
(be
fore
ta
x),
as i
nc
lud
ed
in
th
e i
nte
rna
l m
an
ag
em
en
t re
po
rts t
ha
t a
re r
evie
we
d b
y t
he
ma
na
ge
me
nt.
Se
gm
en
t p
rofit
is u
se
d t
o m
ea
su
re p
erf
orm
an
ce
as m
an
ag
em
en
t b
elie
ve
s t
ha
t su
ch
in
form
ati
on
is t
he
mo
st re
leva
nt in
eva
lua
tin
g th
e r
esu
lts o
f c
ert
ain
se
gm
en
ts r
ela
tive
to
oth
er
en
titi
es th
at o
pe
rate
wit
hin
th
ese
ind
ustr
ies.
Inte
r-se
gm
en
t p
ricin
g i
s d
ete
rmin
ed
on
an
arm
’s l
en
gth
ba
sis
.
Segm
ent R
even
ue
Ext
ern
al r
even
ues
4,97
4.20
5,11
6.24
6,88
5.46
7,94
2.56
1,44
1.40
823.
451,
298.
0928
,481
.40
--
28,4
81.4
0
Inte
r-se
gm
ent r
even
ues
3,13
2.06
--
-53
.80
2,69
1.22
32.4
55,
909.
52-
-5,
909.
52
Tota
l Se
gm
en
t re
ven
ue
8,1
06.2
65,1
16.2
46,8
85.4
67,9
42.5
61,4
95.2
03,5
14.6
71,3
30.5
434,3
90.9
3-
-34,3
90.9
3
Se
gm
en
t re
sult
Seg
men
t pro
fit/(
loss
) b
efo
re ta
x4,
493.
891,
070.
94(5
225.
42)
(376
4.52
)(9
197.
87)
(14,
440.
12)
(1,2
94.8
3)(2
8,35
7.93
)-
2,03
9.02
(26,
318.
90)
Ad
d/(
Less
): S
har
e o
f pro
fit/(
loss
)-
--
--
--
--
-(4
0,10
2.61
)o
f eq
uity
acc
ou
nte
d in
vest
ees
Ad
d/(
Less
): T
ax (
exp
ense
s)/in
com
e-
--
--
--
--
-22
2.48
Pro
fit/(
loss
) af
ter
tax
--
--
--
--
--
(66,1
99.0
4)
Se
gm
en
t ass
ets
464,
882.
244,
087.
6615
,533
.68
2,15
3.36
38,8
68.0
110
3,09
5.52
770.
1562
9,39
0.62
-11
,421
.29
640,8
11.9
1
Se
gm
en
t lia
bili
tie
s54
,431
.65
1,31
7.17
7,85
3.87
1,39
0.03
3,91
5.33
36,5
32.7
871
1.30
106,
152.
14-
202.
90106,3
55.0
3
Oth
er
Info
rmat
ion
Cap
ital e
xpen
ditu
re d
urin
g th
e ye
ar5.
3013
9.68
3,24
2.33
81.4
62,
533.
2222
,039
.03
22.1
528
,063
.17
--
28,0
63.1
7
Dep
reci
atio
n a
nd
am
ort
isat
ion
134.
2759
.02
3,65
5.46
348.
721,
299.
476,
614.
3697
.47
12,2
08.7
8-
-12
,208
.78
Oth
er n
on-
cash
item
s(2
68.4
6)(3
.73)
990.
6658
.03
1504
.36
3,53
7.91
33.9
05,
852.
67-
-5,
852.
67
Ye
ar
en
de
d 3
1 M
arc
h 2
02
1R
s.
In L
akh
s
Part
icul
ars
Con
tinu
ing
Ope
ratio
nsD
isco
ntin
ued
Ope
ratio
nsU
nallo
cate
d
IFP
TSM
GTC
ED
HP
RTE
Flis
omTo
tal
TIQ
Tota
l
AM
L

INDUSTRIES
Seventyseventh annual report
Tata Industries Limited
240
NOTES TO CONSOLIDATED FINANCIAL STATEMENTS
as at and for the year ended 31 March 2021
(Currency: Indian rupees in lakhs)
41
Se
gm
en
t re
po
rtin
g (
Co
nti
nu
ed
)
B.
Info
rma
tio
n a
bo
ut
rep
ort
ab
le /
re
po
rte
d s
eg
me
nts
(C
on
tin
ue
d)
Se
gm
en
t R
eve
nu
e
Ext
ern
al r
even
ues
37,6
41.1
75,
461.
1210
,460
.43
5,02
8.88
309.
55-
1,23
7.53
60,1
38.6
85,
534.
34-
65,6
73.0
2
Inte
r-se
gm
ent r
even
ues
2,23
4.04
--
-39
5.19
-5.
702,
634.
93-
-2,
634.
93
Tota
l Se
gm
en
t re
ven
ue
39,8
75.2
15,4
61.1
210,4
60.4
35,0
28.8
8704.7
4-
1,2
43.2
362,7
73.6
15,5
34.3
4-
68,3
07.9
5
Se
gm
en
t re
sult
Seg
men
t pro
fit/(
loss
) b
efo
re ta
x34
,653
.36
1,17
6.99
(3,0
72.9
4)(3
,680
.55)
(5,5
81.2
1)-
(1,2
55.8
7)22
,239
.79
101.
6228
,623
.39
50,9
64.8
0
Ad
d/(
Less
): S
har
e o
f pro
fit/(
loss
)-
--
--
--
--
-(2
7,57
2.12
)o
f eq
uity
acc
ou
nte
d in
vest
ees
Ad
d/(
Less
): T
ax (
exp
ense
s)/in
com
e-
--
--
--
--
-36
6.04
Pro
fit/(
loss
) af
ter
tax
--
--
--
--
--
23,7
58.7
1
Se
gm
en
t ass
ets
303,
198.
593,
960.
7314
,001
.30
2,56
3.83
34,6
01.8
587
,232
.31
864.
8044
6,42
3.41
--
446,4
23.4
1
Se
gm
en
t lia
bili
tie
s4,
932.
7798
9.34
9,29
2.33
1,51
6.68
3,11
3.44
5,24
0.75
667.
1825
,752
.49
--
25,7
52.4
9
Oth
er
Info
rmat
ion
Cap
ital e
xpen
ditu
re d
urin
g th
e ye
ar64
.16
19.5
02,
331.
4056
1.79
15,4
41.4
0-
63.7
918
,482
.04
--
18,4
82.0
4
Dep
reci
atio
n a
nd
am
ort
isat
ion
138.
9058
.73
3,22
9.51
222.
4057
7.78
-96
.55
4,32
3.87
--
4,32
3.87
Oth
er n
on
-cas
h it
ems
(77.
56)
(2.2
7)37
6.81
(17.
52)
(22.
39)
-(0
.93)
256.
14-
-25
6.14
Ye
ar
en
de
d 3
1 M
arc
h 2
02
0R
s.
In L
akh
s
Part
icul
ars
Con
tinu
ing
Ope
ratio
nsD
isco
ntin
ued
Ope
ratio
nsU
nallo
cate
d
IFP
TSM
GTC
ED
HP
RTE
Flis
omTo
tal
TIQ
Tota
l
AM
L

241
NOTES TO CONSOLIDATED FINANCIAL STATEMENTS
as at and for the year ended 31 March 2021
(Currency: Indian rupees in lakhs)
C. Geographical Information
The geographical information analyses the Company’s revenues and non current assetsheld by the company’s country of domicile (i.e. India) and other countries. In presentinggeographical information, segment revenue has been based on geographic location ofthe customers and segment assets which have been based on geographic location ofassets.
Year ended 31 March 2021
Continuing operations Rs. In Lakhs
Particulars
Segment Revenue 25,652.29 2,829.11 28,481.40
Non current assets* 41,648.65 93,661.27 135,309.92
Within India Outside India Total
*Non-current assets exclude investment in joint ventures, financial assets, income taxassets,goodwill and post-employment benefit assets.
D. Major customer
No single customers contributed 10% or more to the Company’s revenue for the Yearended 31 March 2021 and 31 March 2020 except Tata Steel Limited of Rs. 8,406.86 lakhsin 31 March 2021.
Year ended 31 March 2020 Rs. In Lakhs
Particulars
Segment Revenue 31,520.75 28,617.93 60,138.68
Non current assets* 36,196.94 24,064.31 60,261.25
Within India Outside India Total

INDUSTRIES
Seventyseventh annual report
Tata Industries Limited
242
NOTES TO CONSOLIDATED FINANCIAL STATEMENTS
as at and for the year ended 31 March 2021
(Currency: Indian rupees in lakhs)
42 Investments Rs. In Lakhs
Mutual funds - - 30,887.14 30,887.14 - 30,887.14Debt securities - - - - - -
Joint Ventures - - 1,201.11 1,201.11 - 1,201.11Associates - - - - - -Others 1,879.38 - 4,838.95 4,838.95 - 6,718.33
Equity instruments - - - - -Subsidiaries - - - - - -Associates - - - - - -Others (unquoted) - 26,664.29 - 26,664.29 - 26,664.29Others (quoted) - 237,847.44 - 237,847.44 - 237,847.44
Deemed Investments - - - - - -
Total – Gross (A) 1,879.38 264,511.73 36,927.20 301,438.93 - 303,318.31
(i) Investments outside India - 6,090.78 4,838.95 10,929.73 - 10,929.73(ii) Investments in India 1,879.38 258,420.95 32,088.25 290,509.20 - 292,388.58
Total (B) 1,879.38 264,511.73 36,927.20 301,438.93 - 303,318.31
Less: Allowance forImpairment loss (C) - - - - - -
Total – Net D= (A)-(C) 1,879.38 264,511.73 36,927.20 301,438.93 - 303,318.31
Investments
31 March 2021
At Fair ValueAmortised
costThrough
OCI
Through
profit or loss
Sub-Total Others
(1) (2) (3) (4)=(2)+(3) (5) (6)=(1)+(4)+(5)
Total
Rs. In Lakhs
Mutual funds - - 41,738.54 41,738.54 - 41,738.54Debt securities - - - - - -
Joint Ventures - - 973.36 973.36 - 973.36Associates - - 0.06 0.06 - 0.06Others 1,716.49 - 4,484.38 4,484.38 - 6,200.87
Equity instruments - - - - - -Subsidiaries - - - - - -Associates - - - - - -Others (unquoted) - 20,745.54 - 20,745.54 - 20,745.54Others (quoted) - 58,576.36 - 58,576.36 - 58,576.36
Deemed Investments - - - - - -
Total – Gross (A) 1,716.49 79,321.90 47,196.34 126,518.24 - 128,234.73
(i) Investments outside India - 5,516.92 4,484.38 10,001.30 - 10,001.30(ii) Investments in India 1,716.49 73,804.98 42,711.96 116,516.94 - 118,233.43
Total (B) 1,716.49 79,321.90 47,196.34 126,518.24 - 128,234.73
Less: Allowance forImpairment loss (C) - - - - - -
Total – Net D= (A)-(C) 1,716.49 79,321.90 47,196.34 126,518.24 - 128,234.73
Investments
31 March 2020
At Fair ValueAmortised
costThrough
OCI
Through
profit or loss
Sub-Total Others
(1) (2) (3) (4)=(2)+(3) (5) (6)=(1)+(4)+(5)
Total

243
NOTES TO CONSOLIDATED FINANCIAL STATEMENTS
as at and for the year ended 31 March 2021
(Currency: Indian rupees in lakhs)
43 Retirement benefits plans
a) Defined Contribution plans
The Company makes monthly contributions to Superannuation fund and National pension
scheme as defined contribution retirement benefit plans for qualifying employees.The
Group recognised Rs. 26.85 lakhs; (31 March 2020: Rs.22.40 lakhs) for superannuation
contribution and Rs. 25.27 lakhs; (31 March 2020: Rs. 25.35 lakhs) for National pension
scheme in the Statement of profit and loss for the year ended 31 March 2021. These
amounts are included in “Employee benefits expense” (See note 35) under “Contribution
to Provident and other funds” head. The contributions payable to these plans by the
Group are at the rates specified in the rules of the schemes. The Indian subsidiaries of
the Group also make monthly contributions to provident fund plan in which both the
employee and employer (at a determined rate) contribute to the Government administered
provident fund plan. A part of the Group’s contribution is transferred to Government
administered pension fund.
b) Defined benefit plans
Provident Fund
All eligible employees of the Group are entitled to receive benefits under the provident
fund plan in which both the employee and employer (at a determined rate) contribute
monthly to a Trust set up by the Group to manage the investments and distribute the
amounts entitled to employees. This plan is a defined benefit plan as the Group is obligated
to provide its employees a rate of return which should, at the minimum, meet the interest
rate declared by Government administered provident fund. A part of the Group’s
contribution is transferred to Government administered pension fund. The contributions
made by the Group and the shortfall of interest, if any, are recognized as an expense in
the statement of profit and loss under employee benefits expense. In accordance with
an actuarial valuation of provident fund liabilities on the basis of guidance issued by
Actuarial Society of India, there is no deficiency in the interest cost as the present value
of the expected future earnings of the fund is greater than the expected amount to be
credited to the individual members based on the expected guaranteed rate of interest of
Government administered provident fund.
The Group recognised Rs. 452.33 lakhs; (31 March 2020: Rs. 403.09 lakhs) for provident
fund contributions and Rs. 405.56 lakhs; (31 March 2020: Rs. 37.43 lakhs) for Employee
pension scheme in the Statement of profit and loss for the year ended 31 March 2021.
These amounts are included in “Employee benefits expense” (See note 35) under

INDUSTRIES
Seventyseventh annual report
Tata Industries Limited
244
NOTES TO CONSOLIDATED FINANCIAL STATEMENTS
as at and for the year ended 31 March 2021
(Currency: Indian rupees in lakhs)
“Contribution to Provident and other funds” head. The contributions payable to these
plans by the Group are at the rates specified in the rules of the schemes.
Gratuity
The Group makes annual contributions to the Employees’ Group Gratuity-cum-Life
Assurance Scheme of the Tata AIA Life Insurance Group Limited, a funded defined benefit
plan for qualifying employees. The scheme provides for lump sum payment to vested
employees at retirement, death while in employment or on termination of employment of
an amount equivalent to 15 days salary for service less than 15 years, three-fourth month’s
salary for service of 15 years to 19 years, one month salary for service of 20 years and
one and half month salary for service over 20 years, payable for each completed years
of service or part thereof in excess of six months. Vesting occurs upon completion of five
years of service and is restricted to a maximum of 30 months’ salary.
Post retirement medical benefits (PRMB) and pension to an ex-director
The Group is providing post retirement medical benefits to qualifying employees based
on the premium limit applicable to them at the time of retirement. Upon death of an
employee while in service or retirement, the benefit payable to the spouse will be restricted
only to the extent of 50% of the relevant premium limit. No benefit will be payable in case
of resignation. The Group has procured a Group Mediclaim policy from an insurance
Group for providing these benefits to the beneficiaries.The Group is providing pension
and medical benefit to two ex-directors. Upon death of the directors, the benefit payable
to the spouse will be restricted to the extent of 50% of the benefit.
The following tables summarise the components of net benefit expense recognized in
the statement of profit and loss and the funded status and amounts recognised in the
balance sheet for the plan:
43 Retirement benefits plans (Continued)
b) Defined benefit plans (Continued)

245
NOTES TO CONSOLIDATED FINANCIAL STATEMENTS
as at and for the year ended 31 March 2021
(Currency: Indian rupees in lakhs)
Rs. In Lakhs
Present Value of Benefit
Obligations at the
Beginning of the year 1,365.31 40.81 1,541.94 293.85 1,088.78 (9.35) 1,491.97 287.96
Pertaining to
discontinuing Operation - - - - - - - -
Interest Cost 91.48 2.69 104.20 19.69 83.51 1.71 114.43 22.09
Current Service cost 126.38 15.22 - 12.99 105.15 9.02 - 14.50
Past Service cost - - - - - - - -
Liabilities transferred
in / acquisitions 16.41 - - - - - - -
Liabilities transferred
out / divestments - - - - 0.53 31.37 - -
Benefits paid directly
by the employer - - (147.98) (5.87) - (13.67) (152.24) (20.66)
Benefits paid
from the funds (58.51) - - - (54.41) - - -
Actuarial (Gains) / Losses
on Obligations -
Due to changes in
demographic assumptions (16.02) - - - (0.94) - - 2.29
Actuarial (Gains) / Losses
on Obligations -
Due to changes in
financial assumptions (5.83) - 72.86 (10.60) 71.04 - 104.56 35.36
Actuarial (Gains) / Losses
on Obligations -
Due to experience (61.23) (8.61) 312.83 (73.95) 71.65 21.73 (16.78) (47.69)
Present Value of
Benefit Obligations
at the End of the year 1,458.00 50.11 1,883.85 236.10 1,365.31 40.81 1,541.94 293.85
Particulars
31-Mar-21 31-Mar-20
43 Retirement benefits plans (Continued)
b) Defined benefit plans (Continued)
Reconciliation of present value of defined benefit obligation :
Funded
Gratuity
Unfunded
Pension
Unfunded
PMRB
Unfunded
Gratuity
Funded
Gratuity
Unfunded
Pension
Unfunded
PMRB
Unfunded
Gratuity

INDUSTRIES
Seventyseventh annual report
Tata Industries Limited
246
NOTES TO CONSOLIDATED FINANCIAL STATEMENTS
as at and for the year ended 31 March 2021
(Currency: Indian rupees in lakhs)
Rs. In Lakhs
Fair Value of Plan Assets
at the Beginning of the year 1,246.37 - - - 1,022.38 31.37 - -
Pertaining to
discontinuing Operation - - - - - - - -
Interest income 83.51 - - - 78.42 - - -
Contributions by
the employer 125.66 - - - 130.33 0.00 - -
Assets transferred
in / acquisitions 13.05 - - - - - - -
Assets transferred
out / divestments - - - - - (31.37) - -
Benefits paid from the funds (58.51) - - - (54.41) - - -
Return on Plan Assets,
excluding interest income 35.97 - - - 69.66 - - -
Fair Value of Plan Assets
at the End of the year 1,446.05 - - - 1,246.37 - - -
Particulars
31-Mar-21 31-Mar-20
43 Retirement benefits plans (Continued)
b) Defined benefit plans (Continued)
Change in the fair value of plan assets :
Funded
Gratuity
Unfunded
Pension
Unfunded
PMRB
Unfunded
Gratuity
FundedGratuity
UnfundedPension
UnfundedPMRB
UnfundedGratuity
Rs. In LakhsAmount recognised in Balance Sheet :
Present Value of
Benefit Obligations
at the End of the year 1,458.00 50.11 1,883.85 236.10 1,365.31 40.81 1,541.94 293.85
Fair Value of Plan Assets
at the End of the year (1,446.05) - - - (1,246.37) - - -
Net (Liability) / Asset
recognised in
Balance Sheet 11.95 50.11 1,883.85 236.10 118.95 40.81 1,541.94 293.85
Particulars
31-Mar-21 31-Mar-20
Funded
Gratuity
Unfunded
Pension
Unfunded
PMRB
Unfunded
Gratuity
Funded
Gratuity
Unfunded
Pension
Unfunded
PMRB
Unfunded
Gratuity

247
NOTES TO CONSOLIDATED FINANCIAL STATEMENTS
as at and for the year ended 31 March 2021
(Currency: Indian rupees in lakhs)
43 Retirement benefits plans (Continued)
b) Defined benefit plans (Continued)
Net interest cost for current year :Rs. In Lakhs
Interest cost 91.48 2.69 104.20 19.69 83.51 1.71 114.43 22.09
Interest income (83.51) - - - (78.42) - - -
Net interest cost
for current year: 7.97 2.69 104.20 19.69 5.09 1.71 114.43 22.09
Particulars
31-Mar-21 31-Mar-20
Funded
Gratuity
Unfunded
Pension
Unfunded
PMRB
Unfunded
Gratuity
FundedGratuity
UnfundedPension
UnfundedPMRB
UnfundedGratuity
Expenses recognised in the Statement of profit and loss :Rs. In Lakhs
Expenses recognised in the Other comprehensive income:Rs. In Lakhs
Actuarial (gains)/losses
on obligations for the year (83.08) (8.61) 385.69 (84.55) 141.75 21.73 87.78 (10.05)
Return on Plan Assets,
excluding interest income (35.97) - - - (69.66) - - -
Expense Capitalised - - - - (3.40) - - -
Amount pertaining to
subsidiary become
Joint venture (unfunded) - - - - 0.00 - - -
Net (income)/expense for
the year recognised in OCI (119.05) (8.61) 385.69 (84.55) 68.70 21.73 87.78 (10.05)
Particulars
31-Mar-21 31-Mar-20
Funded
Gratuity
Unfunded
Pension
Unfunded
PMRB
Unfunded
Gratuity
Funded
Gratuity
Unfunded
Pension
Unfunded
PMRB
Unfunded
Gratuity
Current service cost 126.38 15.22 - 12.99 105.15 9.02 - 14.50
Interest (income)/expense 7.97 2.69 104.20 19.69 5.09 1.71 114.43 22.09
Expenses capitalised (10.73) - - - (6.56) - - -
Recovery from Tata Digital - - - - (0.92) - - -
Amount pertaining to
subsidiary become
Joint venture (unfunded) - - - - - - - -
Expenses recognised in
the Statement of
profit and loss: 123.62 17.91 104.20 32.68 102.77 10.73 114.43 36.59
Particulars
31-Mar-21 31-Mar-20
Funded
Gratuity
Unfunded
Pension
Unfunded
PMRB
Unfunded
Gratuity
Funded
Gratuity
Unfunded
Pension
Unfunded
PMRB
Unfunded
Gratuity

INDUSTRIES
Seventyseventh annual report
Tata Industries Limited
248
NOTES TO CONSOLIDATED FINANCIAL STATEMENTS
as at and for the year ended 31 March 2021
(Currency: Indian rupees in lakhs)
43 Retirement benefits plans (Continued)
b) Defined benefit plans (Continued)
Notes:(a) Discount rate is based on the prevailing market yields of Indian Government securities as at the Balance Sheet
date for the estimated term of the obligations.(b) The estimates of future salary increases, considered in actuarial valuation, take into account inflation, seniority,
promotion and other relevant factors.
Categories of assets Rs. In Lakhs
Insurance fund 1,446.05 - - - 1,246.37 - - -
Particulars
31-Mar-21 31-Mar-20
Funded
Gratuity
Unfunded
Pension
Unfunded
PMRB
Unfunded
Gratuity
FundedGratuity
UnfundedPension
UnfundedPMRB
UnfundedGratuity
Actuarial assumptions: Rs. In Lakhs
Discount Rate 6.46% 5.18% 6.95% 7.02% 6.70% 6.59% 6.70% 6.70%
Rate of Salary Increase 8.00% & 8.00% - - 8.00% & 8% - -6.00% 6.00%
Rate of Employee turnover Age Related Age Related - 4.5 % Age Related Age Related - 4.5 %and Service and Service for service and Service and Service for serviceRelated to Related to group Related to Related to grouprespective respective respective respectivecompanies companies companies companies
Mor tality Rate Indian Indian Indian Indian Indian Indian Indian Indianduring employment assured assured assured assured assured assured assured assured
lives lives lives lives lives lives lives livesmortality mortality mortality mortality mor tality mor tality mor tality mor tality(2006-08) (2006-08) (2006-08) (2006-08) (2006-08) (2006-08) (2006-08) (2006-08)Ultimate Ultimate Ultimate Ultimate Ultimate Ultimate Ultimate Ultimate
Rate of PensionEscalation (basic) - - 4% - - - 4% -
Chance of Claim (Medical) - - 19% - - - 19% -
Medical Cost Inflation - - - 6% - - - 6%
Particulars
31-Mar-21 31-Mar-20
Funded
Gratuity
Unfunded
Pension
Unfunded
PMRB
Unfunded
Gratuity
FundedGratuity
UnfundedPension
UnfundedPMRB
UnfundedGratuity
Maturity Analysis of Projected Benefit Obligation Rs. In Lakhs
1st Following Year 182.20 7.51 143.86 5.92 127.53 3.16 107.26 6.23
2nd Following Year 158.13 6.54 143.15 6.32 108.34 3.14 128.70 7.15
3rd Following Year 280.63 6.84 146.46 8.39 94.80 3.23 127.41 7.50
4th Following Year 162.76 7.56 149.52 9.86 246.55 3.77 125.90 10.18
5th Following Year 316.77 6.80 152.24 12.61 122.81 4.70 124.13 12.18
Sum of Years 6 to 10
and above 943.17 27.85 785.71 764.20 1,458.34 19.33 583.78 84.07
Particulars 31-Mar-21 31-Mar-20
Funded
Gratuity
Unfunded
Pension
Unfunded
PMRB
Unfunded
Gratuity
Funded
Gratuity
Unfunded
Pension
Unfunded
PMRB
Unfunded
GratuityProjected benefits payable in future
years from the date of reporting

249
NOTES TO CONSOLIDATED FINANCIAL STATEMENTS
as at and for the year ended 31 March 2021
(Currency: Indian rupees in lakhs)
43 Retirement benefits plans (Continued)
b) Defined benefit plans (Continued)
Sensitivity analysisRs. In Lakhs
Projected benefits
obligations on
current accounting - - - - - - - -
Delta effect of
+1% Change in
Rate of Discounting (60.36) (1.90) (134.07) (29.02) (72.56) (27.35) (107.57) (36.34)
Delta effect of
-1% Change in
Rate of Discounting 66.33 2.06 154.02 35.62 82.21 31.09 123.78 44.84
Delta effect of
+1% Change in
Rate of Salary Escalation 65.07 1.57 - - 80.51 2.26 - -
Delta effect of
-1% Change in
Rate of Salary Escalation (60.38) (1.52) - - (72.45) (2.13) - -
Delta effect of
+1% Change in
Rate of Employee Turnover (6.55) (0.71) - - (6.58) (0.51) - -
Delta effect of
-1% Change in
Rate of Employee Turnover 6.83 0.73 - - 8.29 0.52 - -
Delta effect of
+1% Change in
Rate of Pension Escalation - - 121.74 - - - 110.67 -
Delta effect of
-1% Change in
Rate of Pension Escalation - - (107.54) - - - (97.37) -
Delta effect of
+1% Change in
Medical Cost Inflation - - - 35.62 - - - 44.70
Delta effect of
-1% Change in
Medical Cost Inflation - - - (29.52) - - - (36.87)
Particulars
31-Mar-21 31-Mar-20
Funded
Gratuity
Unfunded
Pension
Unfunded
PMRB
Unfunded
Gratuity
FundedGratuity
UnfundedPension
UnfundedPMRB
UnfundedGratuity

INDUSTRIES
Seventyseventh annual report
Tata Industries Limited
250
NOTES TO CONSOLIDATED FINANCIAL STATEMENTS
as at and for the year ended 31 March 2021
(Currency: Indian rupees in lakhs)
44 Financial instruments
A. Accounting classification and fair values
The following table shows the carrying amounts and fair values of financial assets andfinancial liabilities, including their levels in the fair value hierarchy.
Rs. In Lakhs
Carrying amount
Financial assets
Cash and cash equivalents - - 8,380.54 8,380.54 - - - -
Bank balances
other than above - - 6,089.58 6,089.58 - - - -
Trade receivables - - 3,946.62 3,946.62 - - - -
Other receivables - - 1,630.88 1,630.88 - - - -
Loans - - 84,431.41 84,431.41 - - - -
Investments 36,927.20 264,511.73 1,879.38 303,318.31 268,734.58 - 32,704.35 301,438.93
Other financial assets - - 5,864.71 5,864.71 - - - -
36,927.20 264,511.73 112,223.12 413,662.05 268,734.58 - 32,704.35 301,438.93
Financial liabilities
Trade payables - - 2,756.17 2,756.17 - - - -
Other payables - - 272.05 272.05 - - - -
Lease liabilities - - 14,899.92 14,899.92 - - - -
Debt Securities - - 25,264.61 25,264.61 - - - -
Borrowings
(Other than Debt Securities) - - 46,507.05 46,507.05 - - - -
Other financial liabilities - - 9,720.09 9,720.09 - - - -
- - 99,419.89 99,419.89 - - - -
Fair value
31 March 2021FVTPL FVOCI
AmortisedCost Total Level 1 Level 2 Level 3 Total
Rs. In Lakhs
Carrying amount
Financial assets
Cash and cash equivalents - - 17,968.53 17,968.53 - - - -
Bank balances
other than above - - 9,399.87 9,399.87 - - - -
Trade receivables - - 4,200.57 4,200.57 - - - -
Other receivables - - 260.98 260.98 - - - -
Loans - - 49,141.59 49,141.59 - - - -
Investments 48,503.98 79,321.90 408.85 1,28,234.73 1,00,314.87 - 27,511.01 1,27,825.88
Other financial assets - - 4,909.65 4,909.65 - - - -
48,503.98 79,321.90 86,290.05 2,14,115.92 1,00,314.87 - 27,511.01 1,27,825.88
Financial liabilities
Trade payables - - 7,467.45 7,467.45 - - - -
Other payables - - 73.22 73.22 - - - -
Lease liabilities - - 6,055.76 6,055.76 - - - -
Other financial liabilities - - 5,511.70 5,511.70 - - - -
- - 19,108.13 19,108.13 - - - -
Fair value
31 March 2020FVTPL FVOCI
AmortisedCost Total Level 1 Level 2 Level 3 Total

251
NOTES TO CONSOLIDATED FINANCIAL STATEMENTS
as at and for the year ended 31 March 2021
(Currency: Indian rupees in lakhs)
44 Financial instruments (Continued)
B. Measurement of fair values
The following provides an analysis of financial instruments that are measured subsequent
to initial recognition at fair value, grouped into Level 1 to Level 3, as described below:
Quoted prices in an active market (Level 1):
This level of hierarchy includes financial assets that are measured by reference to quoted
prices (unadjusted) in active markets for identical assets or liabilities. This category consists
of investment in quoted equity shares, and mutual fund investments.
Valuation techniques with observable inputs (Level 2):
This level of hierarchy includes financial assets and liabilities, measured using inputs
other than quoted prices included within Level 1 that are observable for the asset or
liability, either directly (i.e. as prices) or indirectly (i.e. derived from prices). This level of
hierarchy includes derivative contracts.
Valuation techniques with significant unobservable inputs (Level 3):
This level of hierarchy includes financial assets and liabilities measured using inputs that
are not based on observable market data (unobservable inputs). Fair values are determined
in whole or in part, using a valuation model based on assumptions that are neither
supported by prices from observable current market transactions in the same instrument
nor are they based on available market data. This level of hierarchy includes investments
in unquoted equity shares and preference shares.
C. Valuation technique to determine fair value
The following methods and assumptions were used to estimate the fair values of financial
instruments:
(i) Financial assets and liabilities such as cash and cash equivalents, trade and other
receivables, loans (measured at amortised cost), trade and other payables,
borrowings, other financial assets and other financial liabilities are stated at carrying
value because their carrying amounts are a reasonable approximation of the fair
values due to their predominant short term nature.
(ii) Investments in quoted equity shares carried at fair value are based on market price
quotations as on 31 March. Costs of certain unquoted equity instruments has been
considered as an appropriate estimate of fair value because of a wide range of
possible fair value measurements and cost represents the best estimate of fair value

INDUSTRIES
Seventyseventh annual report
Tata Industries Limited
252
NOTES TO CONSOLIDATED FINANCIAL STATEMENTS
as at and for the year ended 31 March 2021
(Currency: Indian rupees in lakhs)
within that range. These investments in equity instruments are not held for trading.
Instead, they are held for medium or long term strategic purpose. Upon the application
of Ind AS 109, the Company has chosen to designate these investments in equity
instruments at FVOCI as the directors believes this provides a more meaningful
presentation for medium or long term strategic investments, than reflecting changes
in fair value immediately in profit or loss.
(iii) Investments in unquoted shares carried at fair value are based on discounted cash
flow approach. The valuation model considers the present value of expected cash
inflows, discounted using a risk adjusted discount rate.
(iv) Management uses its best judgement in estimating the fair value of its financial
instruments. However, there are inherent limitations in any estimation technique.
(v) There have been no transfers between Level 1 and Level 2 for the year ended March
31, 2021 and March 31, 2020.
44 Financial instruments (Continued)
C. Valuation technique to determine fair value (Continued)
45 Financial Risk Management
The Group has exposure to the following risks arising from financial instruments :
- credit risk;
- market risk; and
- liquidity risk
Risk management framework
The Company’s Board of Directors has overall responsibility for the establishment and
oversight of the risk management framework. The Company’s management is responsible
for developing and monitoring the risk management policies.
The Company’s risk management policies are established to identify and analyse the
risks faced by the Company, to set appropriate risk limits and controls and to monitor
risks and adherence to limits. Risk management policies and systems are reviewed
regularly to reflect changes in market conditions and the Company’s activities. The
Company, through its training and management standards and procedures, aims to
maintain a disciplined and constructive control environment in which all employees
understand their roles and obligations.

253
NOTES TO CONSOLIDATED FINANCIAL STATEMENTS
as at and for the year ended 31 March 2021
(Currency: Indian rupees in lakhs)
45 Financial Risk Management (Continued)
The Company’s Board of Directors oversees how management monitors compliance with
the Company’s risk management policies and procedures, and reviews the adequacy of
the risk management framework in relation to the risks faced by the Company. The Board
of Directors is assisted in its oversight role by internal audit. Internal audit undertakes
both regular and ad hoc reviews of risk management controls and procedures, the results
of which are reported to the Board of Directors.
i) Credit risk
Credit risk is the risk of financial loss to the Group if a customer or counterparty to a
financial instrument fails to meet its contractual obligations, and arises principally from
the Group’s receivables from customers, loans and investments in debt securities.The
carrying amounts of financial assets represent the maximum credit risk exposure.
Trade receivables
Trade receivables of the Company are typically unsecured and derived from sales made
to a large number of independent customers. Customer credit risk is managed by each
business unit subject to established policies, procedures and control relating to customer
credit risk management. Before accepting any new customer, the Company has
appropriate level of control procedures to assess the potential customer’s credit quality.
The credit-worthiness of its customers are reviewed based on their financial position,
past experience and other relevant factors. Outstanding customer receivables are reviewed
periodically.
The credit risk related to the Trade receivables is mitigated by taking security deposits /
bank guarantee / letter of credit / post dated negotiable instruments - as and where
considered necessary, setting appropriate credit terms and by setting and monitoring
internal limits on exposure to individual customers.
The Company recognises a loss allowance for expected credit losses on Trade Receivables
that is at amortised cost. Loss allowance in respect of financial assets is measured at an
amount equal to life time expected credit losses and is calculated as the difference between
their carrying amount and the present value of the expected future cash flows discounted
at the original effective interest rate.
The movement in the allowance for impairment in respect of trade and other receivables
during the year was as follows:
There is no substantial concentration of credit risk as the Revenue / Trade receivables
pertaining to any single external customer does not exceed 10% of Group’s revenue.

INDUSTRIES
Seventyseventh annual report
Tata Industries Limited
254
NOTES TO CONSOLIDATED FINANCIAL STATEMENTS
as at and for the year ended 31 March 2021
(Currency: Indian rupees in lakhs)
The movement in the allowance for impairment in respect of trade and other receivables
during the year was as follows :
45 Financial Risk Management (Continued)
i) Credit risk (Continued)
FY 2020-21 FY 2019-20
Opening balance 2,347.41 1,927.76
Add : Impairment loss recognised during the year 718.52 419.65
Less : Bad debts / advances written off / written back - -
Less: Provision pertaining to discontinued operation - -
Closing balance 3,065.93 2,347.41
Period (in Months)
(a) Not Due 1,738.91 2% 42.21 2,230.97 2% 54.75
(b) Overdue upto 3 months 1,314.10 8% 105.68 1,644.72 11% 174.93
(c) Overdue 3-6 months 694.64 34% 236.99 661.35 25% 166.68
(d) Overdue 6-12 months 970.05 64% 623.05 463.99 87% 404.11
(e) Overdue over 12 months 2,294.86 90% 2,058.00 1,546.95 100% 1,546.95
Total 7,012.55 44% 3,065.93 6,547.98 36% 2,347.41
As at 31 March 2021 As at 31 March 2020
Trade ReceivablesCarrying
Amount
Weighted
Average
Loss
Rate
Loss
Allowance
Carrying
Amount
Weighted
Average
Loss
Rate
Loss
Allowance
Financial instruments and cash deposits
Credit risk from balances/investments with banks and financial institutions is managed in
accordance with the Company’s treasury risk management policy. Investments of surplus
funds are made only with approved counterparties and within limits assigned to each
counterparty. The limits are assigned based on corpus of investable surplus and corpus
of the investment avenue. The limits are set to minimize the concentration of risks and
therefore mitigate financial loss through counterparty’s potential failure to make payments.
Financial guarantees
In respect of financial guarantees provided by the Group to banks and financial institutions,
the maximum exposure which the Group is exposed to is the maximum amount which the
Group would have to pay if the guarantee is called upon. Based on the expectation at the
end of the reporting period, the Group considers that it is more likely than not that such
an amount will not be payable under the guarantees provided.

255
NOTES TO CONSOLIDATED FINANCIAL STATEMENTS
as at and for the year ended 31 March 2021
(Currency: Indian rupees in lakhs)
ii) Market risk
Market risk is the risk that the fair value of future cash flows of a financial instrument will
fluctuate because of changes in market prices. Market risk comprises three types of risk:
currency risk, interest rate risk and other price risk, such as equity price risk and commodity
risk. The value of a financial instrument may change as a result of changes in the interest
rates, foreign currency exchange rates, equity price fluctuations, liquidity and other market
changes. Financial instruments affected by market risk include loans and borrowings,
deposits, investments and derivative financial instruments.
(a) Currency risk
Foreign exchange risk arises on future commercial transactions and on all recognised
monetary assets and liabilities, which are denominated in a currency other than the
functional currency of the Group. The Group’s management has set policy wherein
exposure is identified, benchmark is set and monitored closely, and accordingly
suitable hedges are undertaken.The Group’s foreign currency exposure arises mainly
from foreign exchange imports and exports, primarily with respect to USD, EURO,
SGD, AED, CHF, HUF, JPY and GBP.
As at the end of the reporting period, the carrying amounts of the company’s foreign
currency denominated monetary financial assets and financial liabilities in respect
of the foreign currencies are as follows:
45 Financial Risk Management (Continued)
Financial assetsUSD 32,324 24 - -HUF - - - -AED - - - -EURO 316,875 272 - -CHF - - - -SGD 165,431 90 22,520 11.93JPY - - - -
Financial liabilitiesUSD 145,837 107 396,235 273.54HUF 8,116,270 20 - -AED - - 14,875 2.91EURO 147,191 126 - -CHF 325,661 253 28,789 22.56SGD 75,566 41 61,418 184.85JPY 80,271,453 558 5,391,453 37.55
Particulars
31 March 2021 31 March 2020
Amountin FC
Amount inRs. Lakhs
Amountin FC
Amount inRs. Lakhs

INDUSTRIES
Seventyseventh annual report
Tata Industries Limited
256
NOTES TO CONSOLIDATED FINANCIAL STATEMENTS
as at and for the year ended 31 March 2021
(Currency: Indian rupees in lakhs)
45 Financial Risk Management (Continued)
ii) Market risk (Continued)
(a) Currency risk (Continued)
Foreign currency sensitivity analysis
A reasonably possible strengthening or (weakening) of the INR against all other
currencies at 31 March would have affected the measurement of financial instruments
denominated in a foreign currency and affected profit or loss by the amounts shown
below. This analysis assumes that all other variables remain constant.
If INR strengthens / weakens against foreign currency by 5%:
(Decrease) / increasein profit for the year
USD 4.16 (4.16) 13.68 (13.68)
HUF 0.98 (0.98) - -
AED - - 0.15 (0.15)
EURO (7.28) 7.28 - -
CHF 12.63 (12.63) 1.13 (1.13)
SGD (2.44) 2.44 8.65 (8.65)
JPY 27.90 (27.90) 1.88 (1.88)
Particulars31 March 2021 31 March 2020
Strengthening Weakening Strengthening Weakening
(b) Equity price risk
Equity Price Risk is related to the change in market reference price of the investments
in equity securities. The fair value of some of the Company’s investments measured
at fair value through other comprehensive income exposes the Company to equity
price risks. These investments are subject to changes in the market price of securities.
The fair value of Company’s investment in quoted equity securities as at 31 March
2021 and 31 March 2020 was Rs. 237,847.44 lakhs and Rs. 58,576.37 lakhs
respectively. A 10% change in equity price as at 31 March 2021 and 31 March 2020
would result in an impact of Rs. 23,784.74 lakhs and Rs. 5,857.63 lakhs respectively.
The impact is indicated on equity before consequential tax impact, if any.
(c) Interest rate risk
Interest rate risk is the risk that the fair value or future cash flows of a financial
instrument will fluctuate because of changes in market rates.
As the Group does not have exposure to any floating-interest bearing assets or
liabilities, or any significant long-term fixed-interest bearing assets, its interest income
/ expenses and related cash inflows / outflows are not affected by changes in market
interest rates.

257
NOTES TO CONSOLIDATED FINANCIAL STATEMENTS
as at and for the year ended 31 March 2021
(Currency: Indian rupees in lakhs)
45 Financial Risk Management (Continued)
ii) Market risk (Continued)
The Group has investments in redeemable preference shares of joint ventures,
associates and other companies. Future cash flows from these investments in the
form of dividends have fixed coupon rate and will not fluctuate due to changes in
market interest rates. However, the dividend distribution will be subject to availability
of adequate profits in the books of respective companies.
iii) Liquidity risk
Liquidity risk refers to the risk that the Group cannot meet its financial obligations. The
objective of liquidity risk management is to maintain sufficient liquidity and ensure that
funds are available for use as per requirements.
The following are the remaining contractual maturities of financial liabilities at the reporting
date. The amounts are gross and undiscounted, and include estimated interest payments,
if any:
Contractual maturities of Non-derivative financial liabilities
Rs. In Lakhs
Trade payables 2,756.17 - - 2,756.17
Other payables 272.05 - - 272.05
Lease liabilities 3,388.70 8,477.00 4,652.13 16,517.83
Debt Securities - 25,264.61 - 25,264.61
Borrowings (Other thanDebt Securities) 38,165.95 8,341.10 - 46,507.05
Other financial liabilities 8,440.09 1,280.00 - 9,720.09
Total 53,022.96 43,362.71 4,652.13 101,037.80
As at 31 March 2021 Upto 1 year 1 to 5 years Above 5 years Total
Rs. In Lakhs
Trade payables 7,467.45 - - 7,467.45
Other payables 73.22 - - 73.22
Lease liabilities 2,418.93 4,233.11 - 6,652.03
Other financial liabilities 5,356.70 155.00 - 5,511.70
Total 15,316.30 4,388.11 - 19,704.41
As at 31 March 2020 Upto 1 year 1 to 5 years Above 5 years Total

INDUSTRIES
Seventyseventh annual report
Tata Industries Limited
258
NOTES TO CONSOLIDATED FINANCIAL STATEMENTS
as at and for the year ended 31 March 2021
(Currency: Indian rupees in lakhs)
46 Business Combinations
During Financial Year 31 March 2021
Acquisition of Flisom AG on 25th March 2020
On 25 March 2020, Qubit Investment Pte. Ltd. (Qubit) acquired additional stake for US$11.9
million in Flisom AG (‘Flisom’) and now the Group holding becomes 80.6% (earlier stake
54.3%) of membership interest in Flisom AG.
Flisom’s goal is to produce and market flexible solar modules based on CIGS photovoltaic
technologies. Flisom has developed a proprietary roll-to-roll manufacturing systems for
industrial production of CIGS solar modules. Flisom’s R&D unit and manufacturing facility
are both located in Zurich, Switzerland.
Flisom has set up a large plant (LP) of 50 MW capacity in Hungary through its wholly
owned subsidiary, Flisom Hungary Kft, to manufacture CIGS solar modules, which was
commissioned in November 2020.
Qubit had also invested in Flisom through an instrument called Partially Convertible Loan
and Option Agreement (PCLOA). Through this instrument Qubit had a right to convert
part of the investment into equity at an agreed price, which has been exercised in March
2020.
The acquisition has been accounted for using the acquisition method. The consolidated
profit and loss of previous year do not include any profit or loss of Flisom AG.
As the acquisition was completed towards end of the previous financial year, the Group
had decided to avail the one year measurement period available as per Ind AS 103 for
completing the purchase price allocation exercise. Accordingly, for the year ended 31
March 2021, the Group has allocated the purchase consideration.
The fair value of net assets acquired on the acquisition date as a part of the acquisition
amounted to Rs. 4,794.04 lakhs. The excess of purchase consideration over the fair value
of net assets acquired has been attributed towards intangible assets acquired through
business combinations (patent) of Rs. 46,667.29 lakhs. Management has assessed the
average useful life of patents acquired in business combination as 15 years based on
which amortisation in current year has started.
The fair value of purchase consideration is Rs. 50,531.29 lakhs. The details are as follows:
Nature of consideration and terms of payment:
Previously held investments 55,134,197 41,553.38 55,134,197 41,553.38(at fair value)
Purchase consideration 11,912,150 8,977.91 11,912,150 8,977.91paid for acquisition
67,046,347 50,531.29 67,046,347 50,531.29
ParticularsGross Amount Fair Value
US $ Rs. in lakhs US $ Rs. in lakhs

259
NOTES TO CONSOLIDATED FINANCIAL STATEMENTS
as at and for the year ended 31 March 2021
(Currency: Indian rupees in lakhs)
46 Business Combinations (Continued)
During Financial Year 31 March 2021 (Continued)
Acquisition of Flisom AG on 25th March 2020 (Continued)
The purchase price has been allocated based on assessed fair values as follows:
Net Assets 6,360,870 4,794 12,045,487 9,064
Intangible assets acquired through
business combinations (Patent) 61,919,485 46,667 57,337,684 43,226
Non controlling interest (1,234,009) (930) (2,336,825) (1,758)
Purchase consideration 67,046,347 50,531 67,046,347 50,531
Particulars
As at 31 March 2021 -
Final
As at 31 March 2020 -
Provisional
USD Rs. in lakhs USD Rs. in lakhs
47 Earnings per share
Basic earnings per share (EPS) is calculated by dividing the net profit for the year
attributable to equity holders of Group by the weighted average number of equity shares
outstanding during the year.
Basic and diluted earnings per share
Profit / (loss)attributable to equityshareholders (A)(Rs.in Lakhs) (66,199.04) - (66,199.04) (10,656.15) 34,313.24 23,657.09
Weighted averagenumber of equityshares (B) (Nos) 107,954,602 107,954,602 107,954,602 107,954,602 107,954,602 107,954,602
Face value ofequity shares (Rs.) 100 100 100 100 100 100
Basic and dilutedearnings per share(A/B) (Rs.) (61.32) - (61.32) (9.87) 31.78 21.91
31 March 2020
Continuing
operationsParticulars Continuing
operations
31 March 2021
Discontinued
operationTotal
Discontinued
operationTotal

INDUSTRIES
Seventyseventh annual report
Tata Industries Limited
260
NOTES TO CONSOLIDATED FINANCIAL STATEMENTS
as at and for the year ended 31 March 2021
(Currency: Indian rupees in lakhs)
48 Disclosure of assets taken on Lease
Right-of-use assets
Breakdown of lease expenses (other than interest and depreciation)
Year ended31/03/21Particulars
INR Lakhs
Short-term lease expense 223.21 621.75
Low value lease expense - -
Variable lease cost (2.64) 13.22
Total lease expense 220.57 634.98
Year ended31/03/20
INR Lakhs
Cash outflow on leases
Year ended31/03/21Particulars
INR Lakhs
Cash outflow for leases 3,320.33 2,181.43
Year ended31/03/20
INR Lakhs
ParticularsVehicles
Cost
As at 1 April 2020 47.96 5,245.60 1,703.88 2,531.70 9,529.15
Additions - 1,079.81 10,036.94 - 11,116.75
Disposals - - - - -
Balance at 31 March 2021 47.96 6,325.41 11,740.82 2,531.70 20,645.89
Accumulated depreciation
and impairment
As at 1 April 2020 20.87 1,456.28 357.40 73.64 1,908.19
Depreciation 16.09 1,723.31 1,239.66 120.84 3,099.90
Foreign exchange - - (13.66) - (13.66)
Balance at 31 March 2021 36.96 3,179.58 1,583.40 194.48 4,994.43
Carrying amounts
As at 1 April 2020 27.09 3,789.32 1,346.48 2,458.06 7,620.96
Balance at 31 March 2021 11.00 3,145.83 10,157.42 2,337.22 15,651.47
IT assetsPremises
on lease
Leasehold
landTotal
INR’ LakhsINR’ LakhsINR’ LakhsINR’ LakhsINR’ Lakhs

261
NOTES TO CONSOLIDATED FINANCIAL STATEMENTS
as at and for the year ended 31 March 2021
(Currency: Indian rupees in lakhs)
48 Disclosure of assets taken on Lease (Continued)
Maturity analysis
Year ended 31 March 2020
Maturity analysis
49 Provisions
I) A brief description of the nature of the provisions made and the expected timing of any
resulting outflows of economic benefits;
a) Contingency provision for standard assets is a statutory provision made in accordance
with the Reserve Bank of India guidelines for NBFCs. No outflow of economic benefits
is expected for the same.
b) Provision for onerous lease rentals is on contracts where the unavoidable cost of
meeting the obligation under the contract exceeds the economic benefits expected
to be received under it. The lease contracts are for a period of four years and the
outflow will happen over the balance period of lease contract which is approximately
one to two years.
c) A provision is estimated for expected warranty claims in respect of products sold
during the year on the basis of technical evaluation and past experience regarding
failure trends of products and costs of rectification or replacement. It is expected
that most of this cost will be incurred beyond 12 months as per the warranty claims.
Lease liabilities 3,388.70 8,477.00 4,652.13 16,517.83
3,388.70 8,477.00 4,652.13 16,517.83
Less than1 yearParticulars
INR’ Lakhs
TotalBetween
1 and 5 yearsOver
5 years
INR’ Lakhs INR’ Lakhs INR’ Lakhs
Lease liabilities 2,418.93 4,233.11 - 6,652.03
2,418.93 4,233.11 - 6,652.03
Less than1 yearParticulars
INR’ Lakhs
TotalBetween
1 and 5 yearsOver
5 years
INR’ Lakhs INR’ Lakhs INR’ Lakhs

INDUSTRIES
Seventyseventh annual report
Tata Industries Limited
262
NOTES TO CONSOLIDATED FINANCIAL STATEMENTS
as at and for the year ended 31 March 2021
(Currency: Indian rupees in lakhs)
49 Provisions (Continued)
II) The movement in the above provisions is as follows :
As at 31 March 2021Rs. in Lakhs
Contingency
provision for
standard assets
Particulars
Provision for
Onerous lease
rentals
Provision
for
Warranties
Balance at the beginningof the year 15.44 - 34.21 49.66
Add : Provision made / writeback during the year 151.07 - 14.52 165.59
Less : Payments / writtenback during the year - - - -
Less : Provision pertainingto discontinued operation - - - -
Balance at the year end 166.52 - 48.73 215.25
Total
Rs. in Lakhs
Contingency
provision for
standard assets
Particulars
Provision for
Onerous lease
rentals
Provision
for
Warranties
Balance at the beginningof the year 22.80 1.42 - 24.22
Add : Provision madeduring the year 2.83 - 34.21 37.04
Less : Payments / writtenback during the year (10.18) (1.42) - (11.60)
Less : Provision pertainingto discontinued operation - - - -
Balance at the year end 15.44 0.00 34.21 49.66
Total
As at 31 March 2020

263
NOTES TO CONSOLIDATED FINANCIAL STATEMENTS
as at and for the year ended 31 March 2021
(Currency: Indian rupees in lakhs)
50 Contingent liabilities and commitmentsRs. In Lakhs
31 March
2020
31 March
2021
Commitments
a. Estimated amount of contracts remaining 1,501.93 1,114.38
to be executed on capital account and
not provided for (net of advances)
b Commitment for investments in Technology innovation 1,066.68 1,805.40
momentum fund, Pereg Venture Fund, i3 Equity Partners,
MIT Sandbox, Flisom AG and Tata Steel
Contingent liabilities
c Income tax matters in appeal 9,377.09 9,509.19
d Customs, Excise and Service tax matters - -
e Sales Tax / Value added tax (VAT) matters in Appeal 3.24 3.59
f Other contingent liabilities and claims 136.35 97.96
not acknowledged as debt by the Company
g In Flisom AG, contingent liability exists in connection to 1,157.70 1,120.72
project grants received from the European Commission
in the period 2012-2015. This potential claim of up to
1’348’627 EUR is due to a dispute over the maintenance
of project timesheets. However as all Technical Milestones
were signed off by the European Commission and that
Flisom holds Certificates on the Financial Statements of
the Projects Flisom has disputed this claim and thus
disagrees with the European Commission’s assessment
of the projects. Current status is “on hold”.
h During the financial Year 2015-16, as per the Share Purchase Agreement (“SPA”)
dated May 22, 2015 entered into between Tata Industries Limited (“TIL”) and Tata
International Limited (the “Selling Shareholders”), Drive India Enterprise Solutions
Limited (“DIESL”) and TVS Logistics Services Limited (“TLSL”), the Selling
Shareholders have jointly sold their entire shareholding in DIESL to TLSL for a total
consideration of Rs. 8,581.00 lakhs (TIL share Rs. 4,290.00 lakhs).
As per the SPA, the Selling Shareholders have severally provided certain general
and specific indemnities to TLSL. General indemnities up to 100% of total
consideration received for breach of Representations and Warranties (R&W) relating
to title of sale shares and demand, if any, raised on TLSL/DIESL under Section 281
of the Income Tax Act, 1961. Specific indemnity up to Rs. 3,003.00 lakhs on account
of liabilities in respect of demands from statutory authorities presently pending against
DIESL and claims that may arise in future in respect of certain matters identified in
SPA. Specific indemnities up to 20% of total consideration received in respect of

INDUSTRIES
Seventyseventh annual report
Tata Industries Limited
264
NOTES TO CONSOLIDATED FINANCIAL STATEMENTS
as at and for the year ended 31 March 2021
(Currency: Indian rupees in lakhs)
claims arising from breaches of R&W relating to tax compliances, no pending investigations
and inquiries (10%) and other general representations (10%).
However, within the sub limits applicable to general and specific indemnities as specified
above, the maximum aggregate liability of each Selling Shareholder under this agreement
shall not exceed the aggregate amounts received by it from TLSL under the SPA and/or
DIESL under the Preference Share Agreement entered into on May 19, 2015 and the
liability of each Selling Shareholder to indemnify TLSL/DIESL shall be proportionate to
their respective pre-closing equity shareholding percentage. The claims can be made
before expiration of eight years from the closing date which is August 31, 2015.
The Selling Shareholders are also liable to indemnify, without limit, TLSL/DIESL in respect
of one legal proceeding identified in the SPA for which there are no claims on DIESL
presently. The potential future impact of such indemnities provided, if any, cannot be
ascertained presently.
i The Company has terminated ClassEdge licensing contracts with 164 schools (2019-20
– 123 schools) which were not paying the amounts due as per such licensing contracts
and pursuant to such termination were resisting to hand over the possession of the assets
deployed at schools for display of ClassEdge content. The Company has filed legal suits
against such schools in City Civil Court at Mumbai for recovery of assets deployed and
amounts due under the licensing contract along with damages. The Company has taken
appropriate charge in its books of account for receivables from such schools amounting
to Rs. 906.39 lakhs (net of deferred revenue of Rs. 48.74 lakhs) [Rs. 591.47 lakhs (net
of deferred revenue of Rs. 54.11 lakhs)].
j The Subsidiary has imported capital goods under the EPCG Scheme, wherein the
subsidiary has saved custom duty of an amount of Rs. 1,752.36 lakhs of which Rs. 1,279.07
lakhs pertain to financial year 2018-19, Rs. 163.79 lakhs for the financial year 2019-20
and Rs 309.50 lakhs for the financials year 2020-21. The subsidiary has undertaken to
fulfill export obligation to the extent of 6 times of duty saved amount within a period of
6 years from the date of Import which amounts to obligation of Rs.10,514.15 lakhs. In the
event of non fulfilment of the said obligation, the subsidiary shall be called upon to pay
the amount of custom duty saved of Rs 1,752.36 lakhs plus interest thereon against the
said licenses, the subsidiary’s banker has given a guarantee of Rs. 264.10 lakhs to the
commissioner of customs of which Bank Guarantee amounting Rs. 193 lakhs was issued
during the financial year 2018-19, Rs. 24.60 lakhs was issued during the Financial Year
2019-20 and Rs. 46.50 lakhs was issued during the Financial Year 2020-21.The subsidiary
banker has also given performance bank guarantee of Rs 4.75 lakhs in favour of the
director general of fire service, Government of Andhra Pradesh.
50 Contingent liabilities and commitments (Continued)

265
NOTES TO CONSOLIDATED FINANCIAL STATEMENTS
as at and for the year ended 31 March 2021
(Currency: Indian rupees in lakhs)
50 Contingent liabilities and commitments (Continued)
Export obligation date of expiry Amount
26-Dec-24 5,647.99
07-Mar-25 2,026.40
25-Nov-25 982.73
23-Aug-26 1,857.03
Total 10,514.15
51 Disclosures under Ind AS 115 - Revenue from Contracts with Customers
A. In the following table, revenue from contracts with customers is disaggregated by primary
geographical market, major products and service lines and timing of revenue recognition:
Year ended 31 March 2021Rs. in Lakhs
Primary geographical markets
Within India 5,116.24 6,876.04 7,938.51 1,295.44 1,405.90 - 22,632.13
Outside India - - - - 4.19 816.78 820.97
Total revenue 5,116.24 6,876.04 7,938.51 1,295.44 1,410.09 816.78 23,453.10
Major Goods and Service lines
Sale of goods - 1,140.39 7,672.76 - 1,410.09 804.25 11,027.48
Sale of services 5,116.24 5,735.65 265.75 1,295.44 - 12.53 12,425.62
Total revenue 5,116.24 6,876.04 7,938.51 1,295.44 1,410.09 816.78 23,453.10
Timing of Revenue Recognition
Goods transferred at point in time - 1,140.39 7,672.76 - 1,410.09 804.25 11,027.48
Service transferred over time 5,116.24 5,735.65 265.75 1,295.44 - 12.53 12,425.62
Total revenue 5,116.24 6,876.04 7,938.51 1,295.44 1,410.09 816.78 23,453.10
Particulars
Continuing operation
TotalManagement
consultancy
Digital
classroom
solutions
Digital
health
platform
Insights
&
quants
Ready-
to-eat
Solar
modules
Rs. in Lakhs
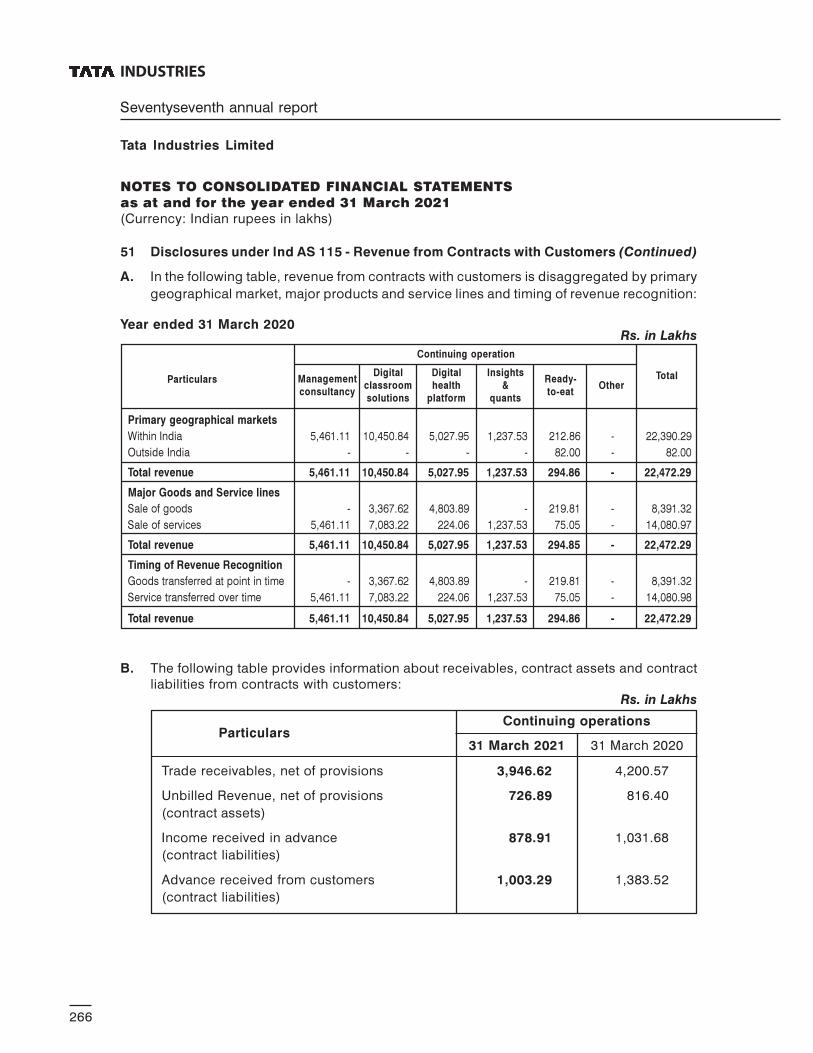
INDUSTRIES
Seventyseventh annual report
Tata Industries Limited
266
NOTES TO CONSOLIDATED FINANCIAL STATEMENTS
as at and for the year ended 31 March 2021
(Currency: Indian rupees in lakhs)
51 Disclosures under Ind AS 115 - Revenue from Contracts with Customers (Continued)
A. In the following table, revenue from contracts with customers is disaggregated by primary
geographical market, major products and service lines and timing of revenue recognition:
Year ended 31 March 2020Rs. in Lakhs
Primary geographical markets
Within India 5,461.11 10,450.84 5,027.95 1,237.53 212.86 - 22,390.29
Outside India - - - - 82.00 - 82.00
Total revenue 5,461.11 10,450.84 5,027.95 1,237.53 294.86 - 22,472.29
Major Goods and Service lines
Sale of goods - 3,367.62 4,803.89 - 219.81 - 8,391.32
Sale of services 5,461.11 7,083.22 224.06 1,237.53 75.05 - 14,080.97
Total revenue 5,461.11 10,450.84 5,027.95 1,237.53 294.85 - 22,472.29
Timing of Revenue Recognition
Goods transferred at point in time - 3,367.62 4,803.89 - 219.81 - 8,391.32
Service transferred over time 5,461.11 7,083.22 224.06 1,237.53 75.05 - 14,080.98
Total revenue 5,461.11 10,450.84 5,027.95 1,237.53 294.86 - 22,472.29
Particulars
Continuing operation
TotalManagement
consultancy
Digital
classroom
solutions
Digital
health
platform
Insights
&
quants
Ready-
to-eatOther
B. The following table provides information about receivables, contract assets and contractliabilities from contracts with customers:
Rs. in Lakhs
ParticularsContinuing operations
Trade receivables, net of provisions 3,946.62 4,200.57
Unbilled Revenue, net of provisions 726.89 816.40
(contract assets)
Income received in advance 878.91 1,031.68
(contract liabilities)
Advance received from customers 1,003.29 1,383.52
(contract liabilities)
31 March 2021 31 March 2020

267
NOTES TO CONSOLIDATED FINANCIAL STATEMENTS
as at and for the year ended 31 March 2021
(Currency: Indian rupees in lakhs)
The unbilled revenue (contract assets) primarily relate to the Group’s rights to consideration
for work completed but not billed at the reporting date. The amount of contract assets
during the period ended 31 March 2021 and 31 March 2020 were impacted by impairment
charges of Rs. 226.10 lakhs and Rs. 228.30 lakhs respectively. The contract assets are
transferred to receivables when the rights become unconditional. This usually occurs
when the Company issues an invoice to the customer.
Trade receivables are non-interest bearing and are generally on terms of 30 to 90 days.
The advance from customers (contract liabilities) primarily relate to the advance
consideration received from customers while invoicing in excess of revenues are classified
as income received in advance, both of which constitute contract liabilities. These will be
recognised as revenue when the Group fulfils the performance obligations.
The Group expects to fulfil the unsatisfied performance obligations over the contract term
ranging from 1 to 5 years.
51 Disclosures under Ind AS 115 - Revenue from Contracts with Customers (Continued)
53 Non-controlling interests (‘NCI’)
Subsidiaries that have material non-controlling interests share are listed below:
NameCountry
ofincorporation
Flisom AG Switzerland 84.10% 15.90% 80.60% 19.40%
Flisom Hungary Kft Hungary 84.10% 15.90% 80.60% 19.40%
As at 31 March 2021
Group %of holding
As at 31 March 2020
NCI % ofholding
Group %of holding
NCI % ofholding
52 Goodwill
Goodwill has been allocated to following individual cash generating units, which are alsoreportable segments, for impairment testing, as follows:
* Refer Note 46
Cash generating unit (CGU)
As at 31March 2021
Ready-to-Eat (RTE) 8,581.84 8,590.33
Flisom AG * - 43,225.96
As at 31March 2020
Rs. lakhs Rs. lakhs

INDUSTRIES
Seventyseventh annual report
Tata Industries Limited
268
NOTES TO CONSOLIDATED FINANCIAL STATEMENTS
as at and for the year ended 31 March 2021
(Currency: Indian rupees in lakhs)
53 Non-controlling interests (‘NCI’) (Continued)
Movement in non-controlling interestsYear ended
31 March 2021
Opening balance 1,758.35 -
Add / (Less) :
Profit / (loss) for the year (1,405.51) -
Other comprehensive income for the year - -
Non-controlling interests arising on businesscombination (Refer note 46) 1,758.35
Remeasurement of NCI (828.31) -
Closing balance (475.47) 1,758.35
Year ended31 March 2020
Rs. In Lakhs
ParticularsAs at
31 March 2021
Total liabilities 106,355.03 25,752.36
Less: Cash and cash equivalents 8,380.54 17,968.53
Adjusted net liabilities 97,974.49 7,783.83
Total equity 534,932.35 418,912.70
Adjusted net liabilties to total equity ratio 0.18 0.02
As at31 March 2020
Rs. In Lakhs
54 Capital Management:
The Group’s objectives when managing capital are to:
The primary objectives of the Group’s capital management policy are to ensure that the
Group complies with externally imposed capital requirements and maintains strong credit
ratings and healthy capital ratios in order to support its business and to maximise
shareholder value.
The Group manages its capital structure and makes adjustments to it according to changes
in economic conditions and the risk characteristics of its activities. In order to maintain or
adjust the capital structure, the Group may adjust the amount of dividend payment to
shareholders, return capital to shareholders or issue capital securities. No changes have
been made to the objectives, policies and processes from the previous years. However,
they are constantly reviewed by the Board of Directors of the Company.
The Group’s adjusted net debt to equity ratio at 31 March 2021 is as follows:

269
NOTES TO CONSOLIDATED FINANCIAL STATEMENTS
as at and for the year ended 31 March 2021
(Currency: Indian rupees in lakhs)
55
Ma
turi
ty a
na
lysis
of
asse
ts a
nd
lia
bil
itie
s
Th
e t
ab
le b
elo
w s
ho
ws a
n a
na
lysis
of
asse
ts a
nd
lia
bilit
ies a
na
lyse
d a
cc
ord
ing
to
wh
en
th
ey a
re e
xp
ec
ted
to
be
reco
ve
red
or
se
ttle
d.
Rs.
In L
akh
s
As
at
31
Ma
rch
20
21
As
at
31
Ma
rch
20
20
Wit
hin
12
mo
nth
sA
fte
r1
2 m
on
ths
To
tal
Wit
hin
12
mo
nth
sP
art
icu
lars
Fin
an
cia
l a
ss
ets
Ca
sh
an
d c
ash
eq
uiv
ale
nts
8,3
80
.54
-8
,38
0.5
41
7,9
68
.53
-1
7,9
68
.53
Ba
nk b
ala
nce
s o
the
r th
an
ca
sh
an
d c
ash
eq
uiv
ale
nts
6,0
47
.19
42
.39
6,0
89
.58
9,3
59
.68
40
.19
9,3
99
.87
De
riva
tive
fin
an
cia
l in
str
um
en
ts-
--
--
-
Re
ce
iva
ble
s-
--
--
-
(i)
Tra
de
Re
ce
iva
ble
s3
,94
6.6
2-
3,9
46
.62
4,2
00
.57
-4
,20
0.5
7
(ii)
Oth
er
Re
ce
iva
ble
s1
,62
9.9
80
.90
1,6
30
.88
25
8.7
52
.24
26
0.9
8
Lo
an
s8
4,4
31
.41
-8
4,4
31
.41
48
,99
0.8
61
50
.74
49
,14
1.5
9
Inve
stm
en
ts3
0,8
86
.34
27
2,4
31
.97
30
3,3
18
.31
41
,73
8.5
18
6,4
96
.22
12
8,2
34
.73
Oth
er
fin
an
cia
l a
sse
ts4
,94
5.0
29
19
.69
5,8
64
.71
3,5
65
.20
1,3
44
.46
4,9
09
.65
14
0,2
67
.09
27
3,3
94
.96
41
3,6
62
.05
12
6,0
82
.11
88
,03
3.8
42
14
,11
5.9
2
No
n-f
ina
nc
ial
as
se
ts
Eq
uity a
cco
un
ted
in
ve
ste
es
-6
4,1
57
.60
64
,15
7.6
0-
98
,95
4.8
09
8,9
54
.80
Inve
nto
rie
s3
,54
1.0
4-
3,5
41
.04
2,5
00
.68
0.9
52
,50
1.6
3
No
n-c
urr
en
t ta
x a
sse
ts (
ne
t)-
11
,42
1.2
91
1,4
21
.29
-1
4,4
89
.65
14
,48
9.6
5
De
ferr
ed
ta
x a
sse
ts (
ne
t)-
58
1.9
95
81
.99
-3
64
.77
36
4.7
7
Pro
pe
rty,
pla
nt
an
d e
qu
ipm
en
t-
34
,48
2.0
53
4,4
82
.05
-3
0,9
92
.03
30
,99
2.0
3
Rig
ht
of
Use
Asse
t7
5.0
81
5,5
76
.39
15
,65
1.4
7-
5,8
94
.79
5,8
94
.79
Ca
pita
l w
ork
-in
-pro
gre
ss
-2
3,1
49
.10
23
,14
9.1
05
.49
11
,61
3.7
31
1,6
19
.22
Inta
ng
ible
asse
tsu
nd
er
de
ve
lop
me
nt
-1
,51
8.6
01
,51
8.6
0-
2,1
53
.38
2,1
53
.38
Inta
ng
ible
asse
ts-
54
,90
5.3
65
4,9
05
.36
-8
,89
2.3
88
,89
2.3
8
Go
od
will
-8
,58
1.8
48
,58
1.8
4-
51
,81
6.2
95
1,8
16
.29
Oth
er
no
n-f
ina
ncia
l a
sse
ts3
,40
5.2
65
,75
3.5
19
,15
8.7
73
,90
0.7
37
14
.94
4,6
15
.67
7,0
21
.40
22
0,1
27
.74
22
7,1
49
.13
6,4
06
.90
22
5,8
87
.70
23
2,2
94
.61
As
se
ts c
las
sif
ied
as
he
ld f
or
sa
lea
nd
dis
co
nti
nu
ed
op
era
tio
ns
0.7
3-
0.7
31
2.8
8-
12
.88
To
tal
As
se
ts1
47
,28
9.2
24
93
,52
2.6
96
40
,81
1.9
11
32
,50
1.8
93
13
,92
1.5
44
46
,42
3.4
1
Aft
er
12
mo
nth
sTo
tal

INDUSTRIES
Seventyseventh annual report
Tata Industries Limited
270
NOTES TO CONSOLIDATED FINANCIAL STATEMENTS
as at and for the year ended 31 March 2021
(Currency: Indian rupees in lakhs)
55
Ma
turi
ty a
na
lysis
of
asse
ts a
nd
lia
bil
itie
s (
Co
nti
nu
ed
)
Th
e t
ab
le b
elo
w s
ho
ws a
n a
na
lysis
of
asse
ts a
nd
lia
bilit
ies a
na
lyse
d a
cc
ord
ing
to
wh
en
th
ey a
re e
xp
ec
ted
to
be
reco
ve
red
or
se
ttle
d.
Rs.
In L
akh
s
As
at
31
Ma
rch
20
21
As
at
31
Ma
rch
20
20
Wit
hin
12
mo
nth
sA
fte
r1
2 m
on
ths
To
tal
Wit
hin
12
mo
nth
sP
art
icu
lars
Lia
bil
itie
s
Fin
an
cia
l li
ab
ilit
ies
Tra
de
pa
ya
ble
s2
,75
6.1
7-
2,7
56
.17
7,4
67
.45
-7
,46
7.4
5
Oth
er
pa
ya
ble
s2
72
.05
-2
72
.05
73
.22
-7
3.2
2
De
bt
Se
cu
riti
es
-2
5,2
64
.61
25
,26
4.6
1-
--
Bo
rro
win
gs
(Oth
er
tha
n D
eb
t se
cu
ritie
s)
38
,16
5.9
58
,34
1.1
04
6,5
07
.05
--
-
Oth
er
fin
an
cia
l lia
bilitie
s8
,44
0.0
91
,28
0.0
09
,72
0.0
95
,35
6.7
01
55
.00
5,5
11
.70
Le
ase
lia
bility
2,4
20
.66
12
,47
9.2
51
4,8
99
.92
2,2
47
.36
3,8
08
.40
6,0
55
.76
52
,05
4.9
34
7,3
64
.96
99
,41
9.8
91
5,1
44
.73
3,9
63
.40
19
,10
8.1
3
No
n-f
ina
nc
ial
lia
bil
itie
s
Cu
rre
nt
tax l
iab
ilit
ies (
ne
t)2
02
.89
-2
02
.89
32
9.0
5-
32
9.0
5
Pro
vis
ion
s7
96
.48
3,4
21
.33
4,2
17
.81
40
1.2
33
,01
6.2
03
,41
7.4
3
De
ferr
ed
ta
x l
iab
ilitie
s-
--
--
-
Oth
er
no
n-f
ina
ncia
l lia
bilitie
s2
,51
4.4
4-
2,5
14
.44
2,8
95
.70
2.0
32
,89
7.7
5
3,5
13
.81
3,4
21
.33
6,9
35
.14
3,6
25
.97
3,0
18
.24
6,6
44
.23
Lia
bil
itie
s d
ire
ctl
y a
ss
oc
iate
dw
ith
dis
co
nti
nu
ed
op
era
tio
ns
--
--
--
To
tal
Lia
bil
itie
s5
5,5
68
.74
50
,78
6.2
91
06
,35
5.0
31
8,7
70
.71
6,9
81
.64
25
,75
2.3
6
Aft
er
12
mo
nth
sTo
tal

271
NOTES TO CONSOLIDATED FINANCIAL STATEMENTS
as at and for the year ended 31 March 2021
(Currency: Indian rupees in lakhs)
56 Group Information
(a) Particulars of subsidiary companies
SN Name
1 Qubit Investments Pte. Limited Singapore 100.00% 100.00%
2 Tata SmartFoodz Limited India 100.00% 100.00%
3 915 Labs, Inc USA 100.00% 100.00%
(subsidiary w.e.f. March 8, 2019)
4 Flisom AG Switzerland 84.10% 80.60%
(subsidiary w.e.f. March 25, 2020)
5 Flisom Hungary Kft Hungary 84.10% 80.60%
(Wholly owned subsidiary of Flisom AG)
Country
of
incorporation
Group % of holding
As at 31
March 2021
As at 31
March 2020
(b) Particulars of joint venture companies
SN Name
1 Tata UniStore Limited India 92.83% 92.65%
2 Inzpera Healthsciences Limited India 76.92% 76.92%
Country
of
incorporation
Group % of holding
As at 31
March 2021
As at 31
March 2020
(c) Particulars of associate companies
SN Name
1 Impetis Biosciences Limited India 34.37% 34.94%
2 Indigene Pharmaceuticals Limited USA 32.96% 32.96%
3 Tata Autocomp Systems Limited India 34.40% 34.40%
4 Oriental Floratech (India) Limited India 24.19% 24.19%
5 Oriental Seritech Limited India 28.21% 28.21%
6 ITeL Industries Limited India 20.00% 20.00%
7 Niskalp Infrastructure Limited India 50.00% 50.00%
Country
of
incorporation
Group % of holding
As at 31
March 2021
As at 31
March 2020

INDUSTRIES
Seventyseventh annual report
Tata Industries Limited
272
NOTES TO CONSOLIDATED FINANCIAL STATEMENTS
as at and for the year ended 31 March 2021
(Currency: Indian rupees in lakhs)
57
Ad
dit
ion
al in
form
ati
on
as
re
qu
ire
d b
y P
ara
gra
ph
2 o
f th
e G
en
era
l In
str
uc
tio
ns
fo
r P
rep
ara
tio
n o
f C
on
so
lid
ate
d F
ina
nc
ial
Sta
tem
en
ts t
o S
ch
ed
ule
III
to
th
e C
om
pa
nie
s A
ct,
20
13
fo
r Ye
ar
en
de
d 3
1 M
arc
h 2
02
1
Nam
e of
the
entit
y
Net a
sset
s, i.
e. to
tal a
sset
sm
inus
tota
l lia
bilit
ies
Shar
e of
pro
fit /
(loss
)Sh
are
of o
ther
com
preh
ensi
ve in
com
e
As %
of
cons
olid
ated
net a
sset
s
Amou
ntRs
. Lak
hs
As %
of
cons
olid
ated
prof
it / (
loss
)
Amou
ntRs
. Lak
hs
As %
of
cons
olid
ated
othe
rco
mpr
ehen
sive
inco
me
Amou
ntRs
. Lak
hs
As %
of
cons
olid
ated
tota
lco
mpr
ehen
sive
inco
me
Amou
ntRs
. Lak
hs
-5
34
,45
6.8
8-
(66
,19
9.0
4)
-1
70
,35
5.7
9-
10
4,1
56
.75
Pa
ren
t56
.08%
299,
719.
999.
14%
(6,0
52.4
6)10
7.15
%18
2,53
3.34
167.
48%
174,
441.
86
Su
bs
idia
rie
s
Ind
ian
Tata
Sm
artF
oo
dz
Lim
ited
4.77
%25
,471
.14
11.5
3%(7
,633
.97)
0.01
%8.
61(7
.32%
)(7
,625
.37)
Fo
reig
n
Qu
bit
Inve
stm
ents
Pte
. Lt
d.
12.9
2%69
,064
.07
(4.8
2%)
3,18
9.21
(2.0
7%)
(3,5
31.0
6)(0
.33%
)(3
41.8
5)
915
Lab
s, I
nc
1.77
%9,
481.
542.
19%
(1,4
47.0
0)(0
.03%
)(5
2.77
)(1
.44%
)(1
,499
.77)
Flis
om
AG
(S
ub
sid
iary
w.e
.f.
25 M
arch
202
0)10
.20%
54,5
13.1
618
.32%
(12,
127.
87)
(0.2
0%)
(335
.29)
(11.
97%
)(1
2,46
3.16
)
Flis
om
Hu
ng
ary
Kft
(Su
bsi
dia
ry w
.e.f
. 25
Mar
ch 2
020)
2.25
%12
,049
.59
3.49
%(2
,312
.05)
(5.0
2%)
(8,5
54.7
4)(1
0.43
%)
(10,
866.
78)
Jo
int
Ve
ntu
res
(In
vest
me
nt
as
pe
r th
e e
qu
ity
me
tho
d)
Ind
ian
Tata
Un
iSto
re L
imite
d5.
63%
30,0
96.7
451
.00%
(33,
761.
03)
0.00
%(0
.88)
(32.
41%
)(3
3,76
1.91
)
Inzp
era
Hea
lthsc
ien
cs L
imite
d0.
00%
-0.
44%
(291
.83)
0.00
%0.
86(0
.28%
)(2
90.9
7)
Ass
oci
ate
s
(In
vest
me
nt
as
pe
r th
e e
qu
ity
me
tho
d)
Ind
ian
Tata
Au
toco
mp
Sys
tem
s Li
mite
d6.
23%
33,3
19.6
95.
76%
(3,8
15.6
0)0.
17%
287.
71(3
.39%
)(3
,527
.89)
Imp
etis
Bio
scie
nce
s Li
mite
d0.
14%
740.
97(0
.14%
)92
.58
0.00
%-
0.09
%92
.58
Flis
om
(S
ub
sid
iary
w.e
.f. 2
5 M
arch
202
0)0.
00%
-3.
08%
(2,0
39.0
2)0.
00%
0.00
%-
Ori
enta
l S
erite
ch L
imite
d0.
00%
-0.
00%
-0.
00%
-0.
00%
-
Ori
enta
l F
lora
tech
(In
dia
) Li
mite
d0.
00%
-0.
00%
-0.
00%
-0.
00%
-
ITeL
In
du
stri
es L
imite
d0.
00%
-0.
00%
-0.
00%
-0.
00%
-
Nis
kalp
In
fras
tru
ctu
re S
ervi
ces
Ltd
.0.
00%
-0.
00%
-0.
00%
-0.
00%
-
Fo
reig
n
Ind
igen
e P
har
mac
eutic
als
Inc.
US
A0.
00%
-0.
00%
-0.
00%
-0.
00%
-
Shar
e of
tota
lco
mpr
ehen
sive
inco
me

273
NOTES TO CONSOLIDATED FINANCIAL STATEMENTS
as at and for the year ended 31 March 2021
(Currency: Indian rupees in lakhs)
57
Ad
dit
ion
al in
form
ati
on
as
re
qu
ire
d b
y P
ara
gra
ph
2 o
f th
e G
en
era
l In
str
uc
tio
ns
fo
r P
rep
ara
tio
n o
f C
on
so
lid
ate
d F
ina
nc
ial
Sta
tem
en
ts t
o S
ch
ed
ule
III
to
th
e C
om
pa
nie
s A
ct,
20
13
fo
r Ye
ar
en
de
d 3
1 M
arc
h 2
02
0
Nam
e of
the
entit
y
Net a
sset
s, i.
e. to
tal a
sset
sm
inus
tota
l lia
bilit
ies
Shar
e of
pro
fit /
(loss
)Sh
are
of o
ther
com
preh
ensi
ve in
com
e
As %
of
cons
olid
ated
net a
sset
s
Amou
ntRs
. Lak
hs
As %
of
cons
olid
ated
prof
it / (
loss
)
Amou
ntRs
. Lak
hs
As %
of
cons
olid
ated
othe
rco
mpr
ehen
sive
inco
me
Amou
ntRs
. Lak
hs
As %
of
cons
olid
ated
tota
lco
mpr
ehen
sive
inco
me
Amou
ntRs
. Lak
hs
-42
0,67
1.05
-23
,657
.09
-(7
0,95
1.56
)-
(47,
294.
47)
Pa
ren
t33
.12%
139,
341.
7221
4.95
%50
,850
.82
118.
19%
(83,
860.
59)
69.8
0%(3
3,00
9.78
)
Su
bs
idia
rie
s
Ind
ian
Tata
Sm
artF
oo
dz
Lim
ited
5.32
%22
,374
.39
(16.
75%
)(3
,963
.55)
0.03
%(2
1.73
)8.
43%
(3,9
85.2
8)
Fo
reig
n
Qu
bit
Inve
stm
ents
Pte
. Lt
d.
16.3
8%68
,895
.01
(2.7
0%)
(638
.80)
(19.
04%
)13
,511
.04
(27.
22%
)12
,872
.24
915
Lab
s, I
nc
2.17
%9,
114.
02(5
.39%
)(1
,274
.46)
0.08
%(5
5.14
)2.
81%
(1,3
29.6
0)
Flis
om
AG
(S
ub
sid
iary
w.e
.f.
25 M
arch
202
0)17
.38%
73,1
10.8
30.
00%
-0.
00%
-0.
00%
-
Flis
om
Hu
ng
ary
Kft
(Su
bsi
dia
ry w
.e.f
. 25
Mar
ch 2
020)
2.11
%8,
880.
730.
00%
-0.
00%
-0.
00%
-
Jo
int
Ve
ntu
res
(In
vest
me
nt
as
pe
r th
e e
qu
ity
me
tho
d)
Ind
ian
Tata
Un
iSto
re L
imite
d14
.47%
60,8
58.8
6(1
14.3
9%)
(27,
060.
53)
0.04
%(2
6.82
)57
.27%
(27,
087.
35)
Inzp
era
Hea
lthsc
ien
cs L
imite
d0.
03%
137.
12(2
.91%
)(6
89.2
8)0.
00%
0.40
1.46
%(6
88.8
7)
Ass
oci
ate
s
(In
vest
me
nt
as
pe
r th
e e
qu
ity
me
tho
d)
Ind
ian
Tata
Au
toco
mp
Sys
tem
s Li
mite
d8.
83%
37,1
35.2
926
.55%
6,28
0.41
0.70
%(4
98.7
1)(1
2.22
%)
5,78
1.70
Imp
etis
Bio
scie
nce
s Li
mite
d0.
20%
823.
080.
64%
152.
470.
00%
-(0
.32%
)15
2.47
Ori
enta
l S
erite
ch L
imite
d0.
00%
-0.
00%
-0.
00%
-0.
00%
-
Ori
enta
l F
lora
tech
(In
dia
) Li
mite
d0.
00%
-0.
00%
-0.
00%
-0.
00%
-
ITeL
In
du
stri
es L
imite
d0.
00%
-0.
00%
-0.
00%
-0.
00%
-
Nis
kalp
In
fras
tru
ctu
re S
ervi
ces
Ltd
.0.
00%
-0.
00%
-0.
00%
-0.
00%
-
Fo
reig
n
Ind
igen
e P
har
mac
eutic
als
Inc.
US
A0.
00%
-0.
00%
-0.
00%
-0.
00%
-
Shar
e of
tota
lco
mpr
ehen
sive
inco
me

INDUSTRIES
Seventyseventh annual report
Tata Industries Limited
274
NOTES TO CONSOLIDATED FINANCIAL STATEMENTS
as at and for the year ended 31 March 2021
(Currency: Indian rupees in lakhs)
58 Related Party Disclosures for the year ended March 31, 2021
A. Related Party and their Relationship
1 Joint Venture Partners
Tata Sons Private Limited
Tata Chemicals Limited
2 Subsidiary Company
Qubit Investments Pte. Ltd
915 Labs, Inc
Tata SmartFoodz Limited (formerly SmartFoodz Limited)
Flisom - AG
Flisom Hungary Kft
4 Joint Ventures
Inzpera Healthsciences Limited
Tata Unistore Limited
3 Associate Company
Indigene Pharmaceuticals Inc., USA.
ITel Industries Ltd.
Oriental Floratech (India) Ltd.
Oriental Seritech Ltd.
Tata Autocomp Systems Ltd.
Niskalp Infrastructure Services Ltd. (formerly Niskalp Energy Ltd.)
Impetis Biosciences Limited
5 Post Employment Benefit Plans of Tata Industries Limited
Tata Industries Employees PF Trust
Tata Industries Superannuation Fund Trust
Tata Industries Employees Gratuity Fund Trust

275
NOTES TO CONSOLIDATED FINANCIAL STATEMENTS
as at and for the year ended 31 March 2021
(Currency: Indian rupees in lakhs)
58 Related Party Disclosures for the year ended March 31, 2021 (Continued)
A. Related Party and their Relationship
6 Associates of Joint Venture Partners with whom transactions have been made
The Indian Hotels Company Limited
Voltas Limited
Tata Steel Limited
Tata Consumer Products Limited (formerly Tata Global Beverages Limited)
Tata Motors Limited
The Tata Power Company Limited
Titan Company Limited
Tata Elxsi Limited
* Tata Steel BSL Limited (formerly Bhushan Steel Limited) (under amalgamation)
* Tata Coffee Limited
* Piem Hotels Limited
* Tata Power Solar Systems Limited
* Roots Corporation Limited
* Concorde Motors Ltd
* The Tata Pigments Limited
* The Tinplate Company of India Limited
* Tata Steel Foundation
* Jamshedpur Football and Sporting Private Limited
* Noamundi Steel Limited (under strike off)
* Bamnipal Steel Limited (under amalgamation)
* Tata Steel Long Products Limited (formerly Tata Sponge Iron Limited)
* Jamshedpur Utilities & Services Company Limited
* Tata Steel Utilities and Infrastructure Services Limited
(formerly Jamshedpur Utilities & Services Company Limited)
* BAHC 5 Pte. Ltd
* Titan Engineering & Automation Limited

INDUSTRIES
Seventyseventh annual report
Tata Industries Limited
276
NOTES TO CONSOLIDATED FINANCIAL STATEMENTS
as at and for the year ended 31 March 2021
(Currency: Indian rupees in lakhs)
*Associate and subsidiary includes subsidiary of Associate and subsidiary of Subsidiary
Note : KMPs of parent company has not been disclosed as there were no transactions
with them during the year.
*Associate and subsidiary includes subsidiary of Associate and subsidiary of Subsidiary
58 Related Party Disclosures for the year ended March 31, 2021 (Continued)
A. Related Party and their Relationship
7 Joint Venture of Joint Venture Partner with whom transactions have been made
Tata AIA Life Insurance Company Limited
Tata Sky Limited
8 Key Management Personnel of the company
Mr. K. R. S. Jamwal (Executive Director)
Mr. F. N. Subedar
Mr. N. Srinath
Ms. Aarthi Subramanian

277
NOTES TO CONSOLIDATED FINANCIAL STATEMENTS
as at and for the year ended 31 March 2021
(Currency: Indian rupees in lakhs)
Pu
rch
ase
of
--
-26.0
9-
0.0
8-
-26.1
6
fixed
ass
ets
--
--
--
--
-
Ren
deri
ng
of
serv
ices
-2,2
40.3
6-
3,2
06.7
4-
29.6
9-
-5,4
76.7
8
-2,049.03
2.50
4,346.00
-10.77
--
6,408.31
Div
iden
d in
com
e-
238.0
4-
192.2
7-
--
-430.3
1
-239.21
1,384.90
202.71
--
--
1,826.82
Bu
yback
of sh
are
s b
y-
-174.7
0-
--
--
174.7
0
Inve
stee c
om
pan
y-
--
--
--
--
Inte
rest
receiv
ed
--
-999.2
7-
1,1
46.6
2-
-2,1
45.8
9
--
-970.56
-53.98
--
1,024.54
Receiv
ing
of
serv
ices
-2.9
9-
50.7
3-
0.2
7-
-53.9
9
-164.15
-36.16
-(0.12)
--
200.18
Insu
ran
ce e
xpen
ses
--
--
--
41.4
8-
41.4
8
--
--
--
35.03
-35.03
Eq
uity
/ p
refe
ren
ce c
on
trib
utio
n-
--
475.6
9-
3,1
53.8
5-
-3,6
29.5
4
by
the c
om
pan
y-
--
--
32,202.54
--
32,202.54
ICD
giv
en
to
Rela
ted
part
y-
--
--
36,7
00.0
0-
-36,7
00.0
0
--
--
-4,500.00
--
4,500.00
58
Re
late
d P
art
y D
isc
losu
res f
or
the
ye
ar
en
de
d M
arc
h 3
1,
20
21
(C
on
tin
ue
d)
B.
Tra
nsa
cti
on
s a
nd
ba
lan
ce
s w
ith
re
late
d p
art
ies
Tran
sact
ions
Rs.
In L
akh
s
Hol
ding
Com
pany
Join
tVe
ntur
eP
artn
ers
Ass
ocia
tes
Ass
ocia
tes
of J
oint
Vent
ure
Par
tner
Key
Man
agem
ent
Per
sonn
el
Join
tV
entu
re
JVs
ofJo
int
Vent
ure
Par
tner
Pos
tEm
ploy
men
tB
enef
it T
rust
Tota
l

INDUSTRIES
Seventyseventh annual report
Tata Industries Limited
278
NOTES TO CONSOLIDATED FINANCIAL STATEMENTS
as at and for the year ended 31 March 2021
(Currency: Indian rupees in lakhs)
58
Re
late
d P
art
y D
isc
losu
res f
or
the
ye
ar
en
de
d M
arc
h 3
1,
20
21
(C
on
tin
ue
d)
B.
Tra
nsa
cti
on
s a
nd
ba
lan
ce
s w
ith
re
late
d p
art
ies (
Co
nti
nu
ed
)
Tran
sact
ions
Rs.
In L
akh
s
Hol
ding
Com
pany
Join
tVe
ntur
eP
artn
ers
Ass
ocia
tes
Ass
ocia
tes
of J
oint
Vent
ure
Par
tner
Key
Man
agem
ent
Per
sonn
el
Join
tV
entu
re
JVs
ofJo
int
Vent
ure
Par
tner
Pos
tEm
ploy
men
tB
enef
it T
rust
Tota
l
Rem
un
era
tion
to
--
--
353.7
5-
--
353.7
5
Exe
cu
tive D
irecto
rs-
--
-354.80
--
-354.80
Sitt
ing
Fees
to D
irect
ors
--
--
6.80
--
-6.8
0
--
--
0.80
--
-0.80
Reim
bu
rsem
en
ts o
f-
1.8
8-
--
--
-1.8
8
exp
en
ses
mad
e-
4.98
--
-27.79
--
32.77
Reim
bu
rsem
en
t o
f o
ut
of
-139.0
80.7
7148.7
9-
--
-288.6
4
po
cket
exp
en
se r
ece
ived
-290.37
-180.58
--
0.92
-471.87
Rep
aym
en
t o
f IC
D b
y-
--
--
--
--
Rela
ted
part
y-
--
--
4,500.00
--
4,500.00
Inve
stm
en
t in
NC
D/O
CD
--
--
--
-
--
--
-18,500.00
--
18,500.00
Tran
sfers
to
-2.5
3-
1.7
8-
--
785.8
3790.13
Po
st e
mp
loym
en
t b
en
efit
--
-6.77
--
-979.29
986.07
Pu
rch
ase
of G
ift c
ard
s-
--
--
13.3
8-
-13.3
8
--
--
-5.69
--
5.69
Sale
of P
rod
uct
/ M
ed
icin
e-
--
5,1
76.4
5-
--
-5,1
76.4
5
--
-4,153.27
--
--
4,158.96

279
NOTES TO CONSOLIDATED FINANCIAL STATEMENTS
as at and for the year ended 31 March 2021
(Currency: Indian rupees in lakhs)
Fig
ure
s in
italics
are
in r
esp
ect
of th
e p
revi
ou
s ye
ar.
58
Re
late
d P
art
y D
isc
losu
res f
or
the
ye
ar
en
de
d M
arc
h 3
1,
20
21
(C
on
tin
ue
d)
B.
Tra
nsa
cti
on
s a
nd
ba
lan
ce
s w
ith
re
late
d p
art
ies (
Co
nti
nu
ed
)
Tran
sact
ions
Rs.
In L
akh
s
Hol
ding
Com
pany
Join
tV
entu
reP
artn
ers
Ass
ocia
tes
Ass
ocia
tes
of J
oint
Ven
ture
Par
tner
Key
Man
agem
ent
Per
sonn
el
Join
tV
entu
re
JVs
ofJo
int
Vent
ure
Par
tner
Pos
tEm
ploy
men
tB
enef
it T
rust
Tota
l
De
bit
Ba
lan
ce
s
Ou
tsta
nd
ing
as a
t M
arc
h 3
1,
20
21
Receiv
ab
les
:-
278.0
0-
1,7
41.9
2-
17.1
6-
-2,0
37.0
8
Trad
e r
eceiv
ab
les
-269.06
2.95
1,871.93
-0.63
--
2,144.57
Receiv
ab
les
:-
16.4
1-
3,9
99.8
3-
--
-4,0
16.2
4
Oth
er
receiv
ab
les
-13.99
-3,089.14
--
--
3,103.13
Fin
an
cia
l Ass
ets
:-
--
47,5
84.2
3-
36,7
00.0
0-
-84,2
84.2
3
Lo
an
s-
--
48,989.01
--
--
48,989.01
Oth
er
no
n-f
inan
cia
l ass
ets
:
Oth
er
Ad
van
ces
--
1.0
0-
-1,1
46.6
225.4
1-
1,1
73.0
3
--
5.47
224.54
--
0.10
-230.12
Cre
dit
Ba
lan
ce
s
Ou
tsta
nd
ing
as a
t M
arc
h 3
1,
20
21
Am
ou
nts
paya
ble
--
-90.0
0-
--
-90.0
0
-151.64
--
-0.61
7.12
-159.37

INDUSTRIES
Seventyseventh annual report
Tata Industries Limited
280
NOTES TO CONSOLIDATED FINANCIAL STATEMENTS
as at and for the year ended 31 March 2021
(Currency: Indian rupees in lakhs)
58 Related Party Disclosures for the year ended March 31, 2021 (Continued)
C. Disclosure of material transactions with related parties –
1 Purchase of fixed assets -
Tata Elxsi Limited 26.09 -
2 Purchase of Gift cards -
Tata UniStore Limited 13.38 5.69
3 Sale of Goods (medicines) -
Tata Steel Limited 4,981.34 4,153.27
4 Rendering of services -
Tata Sons Private Limited 1,935.88 1,855.05
Tata Motors Ltd 1,431.86 1,930.24
Tata Steel Ltd. 1,068.71 2,136.30
5 Receiving of services -
Tata Sons Private Limited 1.40 151.87
The Indian Hotels Co. Ltd. 18.37 10.92
Tata Elxsi Limited 30.50 -
6 Dividend income -
Tata Sons Private Limited 229.50 229.50
Tata Autocomp Systems Ltd. - 1,384.90
Tata Steel Ltd 96.52 125.47
The Tata Power Co. Ltd. 70.30 58.96
7 Interest received -
BAHC 5 Pte. Ltd. 999.27 970.56
Tata UniStore Limited 1,146.62 53.98
8 Insurance expenses -
Tata AIA Life Insurance Company Ltd. 41.48 35.03
9 Reimbursement of expenses made -
Tata Sons Private Limited 1.88 4.98
Tata UniStore Limited - 27.79
10 Reimbursement of out of pocket expense received -
Tata Sons Private Limited 107.15 287.07
Tata Chemicals Limited 31.93 -
Tata Steel Limited 114.09 118.63
Particulars 31 March 2021 31 March 2020
Rs. In Lakhs

281
NOTES TO CONSOLIDATED FINANCIAL STATEMENTS
as at and for the year ended 31 March 2021
(Currency: Indian rupees in lakhs)
58 Related Party Disclosures for the year ended March 31, 2021 (Continued)
C. Disclosure of material transactions with related parties – (Continued)
11 Directors’ remuneration -
Executive Directors’ Remuneration: 353.75 354.80
- K. R. S. Jamwal 353.75 354.80
Including :-
- Short term employee benefits 319.97 331.31
- Post employment benefits 33.78 23.49
12 Equity / preference contribution by the company
and share application money -
Tata UniStore Ltd
(formerly Tata Industrial Services Ltd) 3,000.00 31,100.00
Tata Steel Ltd 475.69 -
13 Buyback of shares by Investee company
Impetis Biosciences Limited 174.70 -
14 Investment in NCD/OCD -
Tata UniStore Ltd
(formerly Tata Industrial Services Ltd) - 18,500.00
15 ICD given
Tata UniStore Ltd
(formerly Tata Industrial Services Ltd) 36,700.00 4,500.00
16 Repayment of ICD by Related party
Tata UniStore Ltd
(formerly Tata Industrial Services Ltd) - 4,500.00
17 Transfer to Post employment benefit trusts
Tata Industries Employees Gratuity Fund Trust
(Gratuity liability) 125.66 66.40
Tata Industries Employees PF Trust
(PF liability) 779.74 879.48
Particulars 31 March 2021 31 March 2020
Rs. In Lakhs
Note : Therefore company has disclosed material transactions in excess of 10% of the
total related party transactions of the same type.

INDUSTRIES
Seventyseventh annual report
Tata Industries Limited
282
NOTES TO CONSOLIDATED FINANCIAL STATEMENTS
as at and for the year ended 31 March 2021
(Currency: Indian rupees in lakhs)
59 Going concern basis for certain components
a) A subsidiary, Flisom AG, generated losses in the previous years as it continued to
invest in the development of flexible solar modules. Flisom setup its pilot plant in
2015 and made its first sale of solar modules to 3rd party customers in 2016.
The ability of Flisom to continue its business is directly linked to further funding as
well as scale up of its operations in the large plant in Hungary, as the Pilot plant has
a limited customer production capacity.
The manufacturing facility at Kecskemet, Hungary, which is owned by the subsidiary
Flisom Hungary Kft, was commissioned in November-2020. The installation of all
plant and machinery and other production facilities was delayed by 2-3 months due
to the covid-19 pandemic outbreak. The production was commenced in November-
2020 and it is expected to be fully operational during the second half of 2021.
The Plant at Hungary is expected to support Flisom to scale-up the production to
become profitable. Considering this, the financial statements of Flisom AG have
been prepared on a going concern basis.
b) A subsidiary, Tata SmartFoodz Limited has accumulated losses and the fact that the
current liabilities exceeds the current assets as at the year end, the financial
statements have been prepared on a going concern basis in view of the business
plan of the subsidiary approved by its Board of Directors. The subsidiary also
recognizes the fact that it is in manufacturing business where company needs to
invest significantly upfront on property, plant and equipment. Considering this,
management believes that the subsidiary will continue as a going concern and will
be able to discharge its liabilities and realise the carrying amount of its assets.
c) The financial statements of four associates namely, Oriental Seritech Ltd., Oriental
Floratech (India) Ltd., ITel Industries Ltd. and Niskalp Infrastructure Services Ltd.,
valued at Rs Nil in the CFS, have not been prepared on going concern basis. The
financial statements of one associate Indigene Pharmaceuticals Inc. valued at Rs Nil
in the CFS, are not available for past several years and no adjustment is made for
the same in the CFS.

283
NOTES TO CONSOLIDATED FINANCIAL STATEMENTS
as at and for the year ended 31 March 2021
(Currency: Indian rupees in lakhs)
60 Estimation of uncertainties relating to the global health pandemic from COVID-19:
The Management has made an assessment of its liquidity position for next one year and
the impact of these circumstances on its operations as well as on financials reporting
areas i.e. Inventory, Impairment on Non-Financial Assets, Financial Instruments, Lease,
Revenue, Provisions, Contingent Liabilities and Contingent Assets, Modification or
termination of contracts or agreements, Going Concern Assessment, Income Taxes,
Consolidated Financial Statements, Property, Plant and Equipment, Presentation of
Financial Statements and Borrowing Costs.
Management has concluded that no material adjustments are required in the financial
statements and believes that all possible impacts of known events arising from COVID
19 pandemic have been taken into account in preparation of these financial statements.
Management will continue to monitor and reassess the situation for future impact on the
financial statements.
Financial assets carried at fair value as at March 31, 2021 is Rs. 301,438.93 lakhs and
financial assets are carried at amortised cost as at March 31, 2021 is Rs. 112,136.79
lakhs. A significant part of the financial assets are classified as Level 1 having fair value
of Rs. 268,734.58 lakhs as at March 31,2021. The fair value of these assets is marked to
an active market which factors the uncertainties arising out of COVID-19.
For and on behalf of the Board of Directors of
Tata Industries Limited
CIN: U44003MH1945PLC004403
K. R. S. Jamwal F. N. Subedar
Executive Director Director
DIN: 03129908 DIN: 00028428
S. Sriram
Chief Financial Officer
& Company Secretary
CS Membership Number: A10083
As per our report of even date attached
For B S R & Co. LLP
Chartered Accountants
Firm’s Registration Number: 101248W/W-100022
Rekha Shenoy
Partner
Membership Number: 124219
Place : Mumbai
Date : 29th April, 2021
NOTES TO CONSOLIDATED FINANCIAL STATEMENTS
as at and for the year ended 31 March 2021
(Currency: Indian rupees in lakhs)

INFO
RM
AT
ION
RE
GA
RD
ING
ME
ET
ING
S O
F T
HE
BO
AR
D A
ND
IT
S C
OM
MIT
TE
ES
1.
Mr.
F.
N.
Su
be
da
rN
on
-Exe
cu
tive
Ye
sYe
sYe
sYe
sYe
sYe
s
(DIN
00
02
84
28
)N
on
-In
de
pe
nd
en
t D
ire
cto
r
2.
Mr.
N.
Sri
na
thN
on
-Exe
cu
tive
Ye
sYe
sYe
sYe
sYe
sYe
s
(DIN
00
05
81
33
)N
on
-In
de
pe
nd
en
t D
ire
cto
r
3.
Ms.
Aa
rth
i S
ub
ram
an
ian
No
n-E
xe
cu
tive
No
Ye
sYe
sYe
sYe
sYe
s
(DIN
07
12
18
02
)N
on
-In
de
pe
nd
en
t D
ire
cto
r
4.
Mr.
K.
R.
S.
Ja
mw
al
Exe
cu
tive
Dir
ecto
rYe
sYe
sYe
sYe
sYe
sYe
s
(DIN
03
12
99
08
)Att
en
da
nc
e o
f D
ire
cto
rs o
f Ta
ta I
nd
us
trie
s L
imit
ed
at
the
Bo
ard
Me
eti
ng
s h
eld
in
FY
20
20
-20
21
29
/04
/20
20
(1/2
02
0-2
1)
24
/06
/20
20
(2/2
02
0-2
1)
28
/07
/20
20
(3/2
02
0-2
1)
30
/10
/20
20
(4/2
02
0-2
1)
27
/01
/20
21
(5/2
02
0-2
1)
Sr.
No
.N
am
e o
f th
eD
ire
cto
rC
ate
go
ry
Da
te a
nd
Nu
mb
er
of
the
Bo
ard
Me
eti
ng
s h
eld
an
d
att
en
de
d b
y t
he
Dir
ec
tors
in
FY
20
20
-21
30
/03
/20
21
(6/2
02
0-2
1)
Att
en
da
nc
e o
f D
ire
cto
rs o
f Ta
ta I
nd
us
trie
s L
imit
ed
at
the
An
nu
al
Ge
ne
ral
Me
eti
ng
he
ld i
n F
Y 2
02
0-2
02
1
Sr.
No
.N
am
e o
f th
e
Dir
ec
tor
Ca
teg
ory
Da
te o
f A
nn
ua
l G
en
era
l M
ee
tin
g h
eld
an
d a
tte
nd
ed
by
the
Dir
ec
tors
in
FY
20
20
-21
Da
te -
Se
pte
mb
er
3,
20
20
1.
Mr.
F.
N.
Su
be
da
rN
on
-Exe
cu
tive
Ye
s
(DIN
00
02
84
28
)N
on
-In
de
pe
nd
en
t D
ire
cto
r
2.
Mr.
N.
Sri
na
thN
on
-Exe
cu
tive
Ye
s
(DIN
00
05
81
33
)N
on
-In
de
pe
nd
en
t D
ire
cto
r
3.
Ms.
Aa
rth
i S
ub
ram
an
ian
No
n-E
xe
cu
tive
No
(DIN
07
12
18
02
)N
on
-In
de
pe
nd
en
t D
ire
cto
r
4.
Mr.
K.
R.
S.
Ja
mw
al
Exe
cu
tive
Dir
ecto
rYe
s
(DIN
03
12
99
08
)
Att
en
da
nc
e o
f D
ire
cto
rs o
f Ta
ta I
nd
us
trie
s L
imit
ed
at
the
CS
R C
om
mit
tee
Me
eti
ng
s h
eld
in
FY
20
20
-21
Sr.
No
.N
am
e o
f th
e
Dir
ec
tor
Ca
teg
ory
Da
te a
nd
Nu
mb
er
of
the
CS
R C
om
mit
tee
Me
eti
ng
he
ld a
nd
att
en
de
d b
y t
he
Dir
ec
tors
in
FY
20
20
-21
16
/12
/20
20
(1
/20
20
-21
)
1.
Mr.
F.
N.
Su
be
da
rN
on
-Exe
cu
tive
Ye
s
(DIN
00
02
84
28
)N
on
-In
de
pe
nd
en
t D
ire
cto
r
2.
Mr.
K.
R.
S.
Ja
mw
al
Exe
cu
tive
Dir
ecto
rYe
s
(DIN
03
12
99
08
)
INDUSTRIES
Seventyseventh annual report
Tata Industries Limited
284

Registered Office Bombay House 24 Homi Mody Street Mumbai 400 001
INDUSTRIES LIMITED