Petroleum Engineering / Reservoir Engineeri - UiS Brage
84
i FACULTY OF SCIENCE AND TECHNOLOGY MASTER’S THESIS Study programme/Specialisation: Petroleum Engineering / Reservoir Engineering Spring Semester, 2021 Open Access Author: Iyad Souayeh Programme coordinator: Supervisor(s): Skule Strand and Tina Puntervold Title of master’s thesis: The Effect of Injection Rate and Oil Viscosity on Oil Recovery by Water flooding on Sandstone Cores Credits: 30 Keywords: Waterflooding in Sandstone Reservoirs Capillary and Viscous Forces Injection Rate Viscosity Number of pages: 84……………… + supplemental material/other: ………… Stavanger, 15 th June 2021
-
Upload
khangminh22 -
Category
Documents
-
view
3 -
download
0
Transcript of Petroleum Engineering / Reservoir Engineeri - UiS Brage

i
FACULTY OF SCIENCE AND TECHNOLOGY
MASTER’S THESIS
Study programme/Specialisation:
Petroleum Engineering / Reservoir
Engineering
Spring Semester, 2021
Open Access
Author: Iyad Souayeh
Programme coordinator:
Supervisor(s): Skule Strand and Tina Puntervold
Title of master’s thesis:
The Effect of Injection Rate and Oil Viscosity on Oil Recovery by Water flooding on
Sandstone Cores
Credits: 30
Keywords:
Waterflooding in Sandstone Reservoirs
Capillary and Viscous Forces
Injection Rate
Viscosity
Number of pages: 84………………
+ supplemental material/other: …………
Stavanger, 15th June 2021

ii
ACKNOWLEDGEMENT
I would like to extend my sincerest gratitude to my associate professors and supervisors, Skule
Strand and Tina Puntervold, for granting me the opportunity to work with them on this project,
and constantly proving me with aid and support through beneficial discussions. I have learned
a lot from them.
I would also like to express my appreciation and gratitude to Panagiotis Aslanidis, who
supervised my work in the laboratory, and guided me through all the experimental procedures.
He taught me that failures are part of the experimental learning process and to remain positive.
I want to thank my classmates and friends who helped me in this semester, Kofi Yeboah,
Aleksander Mamonov, and special thanks to Novia Fazilani for being a wonderful colleague
who helped me countless times in many evenings, and for all the fun moments and memories
in this semester.
Much love and appreciation to my dear sister who supported me throughout this journey and
provided all the help she can.
Last but not least, all the gratitude to my beloved parents who granted me everything I have
and are the reason I am the person who I am today.
Iyad Souayeh
June 2021

iii
ABSTRACT
With every passing day, the rise for developing and optimizing oil recovery methods and
techniques grows, since the global demand for energy is increasing exponentially. Water
flooding is still regarded as the most widely used recovery method due to its easy accessibility
and applicability. Water flooding is usually performed by injecting the produced formation
water of the reservoir back into the reservoir to displace oil and maintain pressure. For the case
of offshore, sea water is used.
There had been laboratory studies on how to improve the effectiveness of water flooding to
achieve higher oil recovery. It is important to understand and investigate the role of the
displacement forces, mainly viscous and capillary forces. Some researches highlighted the
significance of injection velocity and viscosity of oil in analyzing the efficiency of water
flooding in recovering oil.
The objective of this thesis was to investigate the effect of injection rate and oil viscosity on
the oil recovery from two water-wet sandstone core samples by water flooding. Two outcrop
cores were used: Bandera Brown and Leopard. Several core flood experiments were performed
on each core using a modified non-polar mineral oil to prevent alteration of the initial wetting
conditions of the samples. The core was restored to initial conditions by mild cleaning using
heptane and low salinity brine. The modified mineral oil was made by mixing marcol and
heptane in different ratios by volume, causing a variation in the viscosity when the mixing
ratios were changed. The oil recovery and pressure drop when changing the injection rate,
followed by changing the viscosity, were presented, and compared to evaluate the effect of
viscous and/or capillary forces.
The results showed that there was minimal effect of changing injection rate for Bandera Brown
core, since both oil recoveries from high and low rates were the same. This was not the case
for the Leopard core, as lower injection rate yielded lower oil recovery. However, a possibility
of formation damage arose because the pressure drop has not changed when the injection rate
was lowered. Moreover, fine grains were found in effluent when the core was flooded with low
salinity during core cleaning, signifying a low consolidation of the core. As for viscosity of oil
effect, the oil recovery using a lower viscous oil was lower, which is an unusual observation.
Though there were abnormal continuous abnormal pressure drop build up, and since there were
issues encountered with the Leopard core at previous restorations. There were no conclusive
remarks for effect of oil viscosity on water flooding for Bandera Brown core, due to two failed

iv
experiment attempts. The first attempt led to breaking the core causing a reduction in length
and porosity. The second attempt resulted in achieving very low oil recovery (12%), after the
core was exposed to distilled water before the start of the experiment when the rubber sleeve
got punctured by the confining pressure.
Based on the results of the experiments on the Bandera Brown core, the possibility of the
importance of capillary forces in oil recovery in water-wet system can be seen. This is caused
by the imbibition of the wetting phase (formation water) into small pores of the core.

v
NOMENCLATURE
Ø = Porosity (%)
𝜃 = Contact angle between two fluids (°)
𝜆 = Mobility (Pa.s-1)
𝜏 = Shear stress (Pa)
�̇� = Shear rate (s-1)
σ = Interfacial tension (mN/m)
𝜎𝑜𝑤 = Interfacial tension between oil and brine (mN/m)
𝜎𝑠𝑜 = Interfacial tension between rock and oil (mN/m)
𝜎𝑠𝑤 = Interfacial tension between rock and brine (mN/m)
∆𝜌 = Difference in density (kg/m3)
µ = Viscosity (Pa.s)
µo = Viscosity of oil (Pa.s)
µw = Viscosity of water (Pa.s)
A = Cross sectional area (m2)
APES = Alkylphenol ethoxylates
C = Constant for capillary tube model equals to 0.4
C* = Wettability constant equals to 306.25 for water-wet cores and 5.45 for oil-wet cores
C12TAB = Dodecyltrimethylammonium bromide
CO2 = Carbon dioxide
D = Diameter (m)
DI = Deionized water
EOR = Enhanced oil recovery
FW = Formation water
g = Gravitational acceleration and it is equal to 9.8 m/s2
H = Height of the liquid column (m)
𝐻 = Interface’s mean curvature
Isc = Instability number
IFT = Interfacial tension (mN/m)
K = the permeability (m2)
Ka = Absolute permeability (m2)
Ke = Effective permeability (m2)
Kr = Relative permeability

vi
L = Length (m)
LS = Low salinity brine (1,000 ppm NaCl)
M = Mobility ratio
NB-1 = Inverse Bond number
Nca = Capillary number
Ncam = Modified Capillary number
P = Pressures (Psi)
ΔP = Differential pressure (Psi)
∆Pg = Differential pressure at the oil-water interface due to gravity (Psi)
P = Period of the speed of rotation
Q = Flow rate (cm3/s)
r = Capillary radius (m)
R = Interface curvature’s radius (m)
Soi = Initial oil saturation (%)
Sor = Residual oil saturation (%)
SW = Sea Water
TDS = Total dissolved solids
™ = Trade mark
Vb = Bulk volume (cm3)
Vp = Pore volume (cm3)
ν = Interstitial velocity (m/s)

vii
TABLE OF CONTENTS
ACKNOWLEDGEMENT ......................................................................................................... ii
ABSTRACT ............................................................................................................................. iii
NOMENCLATURE .................................................................................................................. v
TABLE OF CONTENTS ......................................................................................................... vii
LIST OF FIGURES .................................................................................................................. ix
LIST OF TABLES ................................................................................................................. xiii
1 INTRODUCTION .............................................................................................................. 1
1.1 Global energy consumption ........................................................................................ 1
1.2 Oil Recovery ............................................................................................................... 1
1.3 Thesis Objectives ........................................................................................................ 3
2 FUNDAMENTALS AND LITERATURE REVIEW ........................................................ 4
2.1 Rock and fluid properties: ........................................................................................... 4
2.1.1 Porosity ................................................................................................................ 4
2.1.2 Permeability ......................................................................................................... 5
2.1.3 Viscosity .............................................................................................................. 6
2.1.4 Mobility................................................................................................................ 8
2.1.5 Interfacial tension (IFT) ....................................................................................... 9
2.1.6 Wettability.......................................................................................................... 10
2.2 Displacement forces .................................................................................................. 12
2.2.1 Capillary forces .................................................................................................. 12
2.2.2 Gravity forces..................................................................................................... 13
2.2.3 Viscous forces .................................................................................................... 15
2.3 Sandstones ................................................................................................................. 19
2.4 Water flooding in sandstone reservoirs ..................................................................... 21
3 MATERIALS AND METHODOLOGIES ...................................................................... 28
3.1 Core Samples............................................................................................................. 28
3.2 Brine .......................................................................................................................... 30
3.3 Oil .............................................................................................................................. 31
3.4 Lab Apparatus ........................................................................................................... 32
3.5 Experimental procedure ............................................................................................ 33
3.5.1 Core Restorations and Experiments ................................................................... 34
3.5.1.1 Permeability Determination ........................................................................... 34
3.5.1.2 Establishing Initial Water Saturation ............................................................. 34

viii
3.5.1.3 Establishing Initial Oil Saturation .................................................................. 36
3.5.1.4 First Restoration ............................................................................................. 36
3.5.1.5 Second Restoration ......................................................................................... 37
3.5.1.6 Third Restoration............................................................................................ 38
3.5.1.7 Fourth Restoration .......................................................................................... 38
4 RESULTS ......................................................................................................................... 39
4.1 Permeability .............................................................................................................. 39
4.2 Fluid Properties ......................................................................................................... 39
4.3 First Core Restorations .............................................................................................. 44
4.4 Second Core Restoration ........................................................................................... 46
4.4.1 Bandera Brown (BB2-2) .................................................................................... 46
4.4.2 Leopard (LP2-2)................................................................................................. 48
4.5 Third Core Restoration .............................................................................................. 50
4.5.1 Bandera Brown (BB2-3) .................................................................................... 50
4.5.2 Leopard (LP2-3)................................................................................................. 53
4.6 Fourth Core Restoration ............................................................................................ 54
4.6.1 Bandera brown (BB2-4) ..................................................................................... 54
4.6.2 Leopard (LP2-4)................................................................................................. 56
5 DISCUSSION OF RESULTS .......................................................................................... 59
5.1 Permeability .............................................................................................................. 59
5.2 Initial Wetting ........................................................................................................... 59
5.3 Effect of Injection Rate ............................................................................................. 59
5.3.1 Bandera Brown .................................................................................................. 59
5.3.2 Leopard .............................................................................................................. 62
5.4 Effect of Oil Viscosity............................................................................................... 65
5.4.1 Leopard .............................................................................................................. 65
6 CONCLUSIONS .............................................................................................................. 67
6.1 Future Work .............................................................................................................. 67
7 REFERENCES ................................................................................................................. 69

ix
LIST OF FIGURES
Figure 1: Global energy consumption by source (Smil 2016, BP 2020). ................................. 1
Figure 2: Pores types................................................................................................................. 5
Figure 3: Measurement of absolute permeability using Darcy’s law ....................................... 5
Figure 4: Parallel plate model ................................................................................................... 6
Figure 5: Cannon-Fenske tube for viscosity measurement ....................................................... 7
Figure 6: Shape of oil droplet in surfactant solution during IFT measurement ........................ 9
Figure 7: Wettability of the oil/water/rock system (Anderson 1986a) ................................... 11
Figure 8: Spontaneous imbibition test (Standnes and Austad 2003) ...................................... 11
Figure 9: Capillary pressure in porous media (Moghadam and Salehi 2019) ........................ 13
Figure 10: (a) Gravity force over-ride (displacing > displaced). (b) Gravity force under-ride
(displacing < displaced) (Kantzas et al. 2018) ............................................................................... 14
Figure 11: Fluid distribution inside a core imbibed with (a) cationic surfactant solution
(C12TAB) and (b) anionic surfactant solution (APES) (Standnes and Austad 2000) .............. 15
Figure 12: Example of Viscous Fingering (Homsy 1987) ...................................................... 15
Figure 13: Correlation of Nca with residual oil saturation (Lake 1989) .................................. 17
Figure 14: Effect of pore size distribution on critical Nca (Lake 1989) .................................. 17
Figure 15: Correlating Ncam with residual oil saturation for rock samples having varying
properties (Abrams 1975) ........................................................................................................ 18
Figure 16: Classification of sandstones based on sand grains’ composition (McBride 1963)
.................................................................................................................................................. 19
Figure 17: Mineral structures of clays: kaolinite, illite, montmorillonite and chlorite (Bibi et
al. 2016) ................................................................................................................................... 20
Figure 18: (a) Effect of core length and (b) injection velocity on oil recovery (Rapoport and
Leas 1953) ................................................................................................................................ 22
Figure 19: Relationship between scaling coefficient and oil recovery at breakthrough for (a)
oil-wet Alundum cores, no connate water, (b) neutral-wet Alundum cores, no connate water,
and, (c) neutral-wet Alundum cores, connate water = 30% (Rapoport and Leas 1953) .......... 23
Figure 20: Oil recovery at breakthrough as a function of scaling coefficient defined by
Rapoport and Leas for (a) light oil, and, (b) heavy oil (Arab et al. 2020) ............................... 24
Figure 21: Calculated capillary number versus instability number for water flooding tests of
oil samples with varying viscosity at different injection velocities (Arab et al. 2020) ........... 26

x
Figure 22: Longitudinal and cross sections images of a typical Bandera Brown core sample
.................................................................................................................................................. 29
Figure 23: Longitudinal and cross sections images of a typical Leopard core sample .......... 29
Figure 24: Ultra high resolution image of a Bandera Brown core sample ............................. 30
Figure 25: Ultra high resolution image of a Leopard core sample ......................................... 30
Figure 26: Büchner filtration set-up ........................................................................................ 31
Figure 27: Anton Paar™ MCR 302 ........................................................................................ 32
Figure 28: Anton Paar™ DMA 4500 Density Meter ............................................................. 32
Figure 29: Mettler Toledo™ SevenCompact pH meter .......................................................... 33
Figure 30: KRÜSS™ Force Tensiometer ............................................................................... 33
Figure 31: Experimental procedure for each core restoration ................................................ 33
Figure 32: Description of the experiment for each core restoration ....................................... 34
Figure 33: Saturation of Bandera Brown core sample with 5 times diluted formation water
under vacuum conditions ......................................................................................................... 35
Figure 34: Leopard core sample placed in a desiccator .......................................................... 36
Figure 35: Images and scheme of core flooding set-up .......................................................... 37
Figure 36: Semi-log plot of viscosity measured at different shear rates at 20 °C of different
prepared fluid ........................................................................................................................... 40
Figure 37: Plot of viscosity measured at different shear rates at 60 °C of different prepared
fluids ........................................................................................................................................ 40
Figure 38: Measured viscosity versus heptane content in mixture with marcol mixed by
volume...................................................................................................................................... 42
Figure 39: Measured interfacial tension versus n-heptane content in mixture with marcol
mixed by volume...................................................................................................................... 43
Figure 40: Measured density versus n-heptane content in mixture with marcol mixed by
volume...................................................................................................................................... 44
Figure 41: Oil recovery of Leopard and Bandera Brown by spontaneous imbibition using
Total 100,000 ppm formation water at 60°C ........................................................................... 45
Figure 42: Oil recovery and pressure drop versus PV injected for Bandera Brown core by
water flooding using Total 100,000 ppm formation water at 60°C and 4 PV/day injection rate
.................................................................................................................................................. 47
Figure 43: Density and pH versus PV injected of produced water samples during oil recovery
test of Bandera Brown at 4 PV/day injection rate.................................................................... 48

xi
Figure 44: Oil recovery and pressure drop versus PV injected for Leopard core by water
flooding using Total 100,000 ppm formation water at 60°C and 4 PV/day injection rate ...... 49
Figure 45: Density and pH versus PV injected of produced water samples during oil recovery
test of Leopard at 4 PV/day injection rate ............................................................................... 50
Figure 46: Oil recovery and pressure drop versus PV injected for Bandera Brown core by
water flooding using Total 100,000 ppm formation water at 60°C and 1 PV/day injection rate
.................................................................................................................................................. 51
Figure 47: Density and pH versus PV injected of produced water samples during oil recovery
test Bandera Brown core at 4 PV/day injection rate ................................................................ 52
Figure 48: Oil recovery and pressure drop versus PV injected for Leopard core by water
flooding using Total 100,000 ppm formation water at 60°C and 1 PV/day injection rate ...... 53
Figure 49: Density and pH versus PV injected of produced formation water samples during
oil recovery test Leopard core at 4 PV/day injection rate ........................................................ 54
Figure 50: Longitudinal and cross sections of the punctured rubber sleeve used for BB2-4 . 55
Figure 51: Oil recovery and pressure drop versus PV injected for Bandera Brown core by
water flooding using Total 100,000 ppm formation water at 60°C and 4 PV/day injection rate
using different viscosity oil (50-50 marcol and n-heptane mixed by volume mineral oil) ..... 56
Figure 52: Oil recovery and pressure drop versus PV injected for Leopard core by water
flooding using Total 100,000 ppm formation water at 60°C and 4 PV/day injection rate using
different viscosity oil (50-50 marcol and heptane mixed by volume mineral oil)................... 57
Figure 53: Density and pH versus PV injected of produced water samples during oil recovery
test at of Leopard core at 4 PV/day injection rate using oil with lower viscosity (50-50 marcol
and n-heptane mixed by volume mineral oil) .......................................................................... 58
Figure 54: Oil recovery versus PV injected of second and third core restoration viscous
flooding experiments for Bandera Brown ................................................................................ 60
Figure 55: Pressure drop versus PV injected of second and third core restoration viscous
flooding experiments for Bandera Brown (BB2) ..................................................................... 61
Figure 56: Oil recovery versus pore volume injected of second restoration (high rate) and
third restoration (low rate) viscous flooding experiments for Leopard at 60°C ...................... 62
Figure 57: Pressure drop versus injected pore volume of second and third core restoration
viscous flooding experiments for Leopard .............................................................................. 63
Figure 58: Effluent collected after flooding Leopard core with low salinity brine after second
core restoration viscous flooding experiment .......................................................................... 63

xii
Figure 59: Effluent collected after flooding Leopard core with low salinity brine after fourth
core restoration viscous flooding experiment .......................................................................... 64
Figure 60: Oil recovery versus PV injected of second and fourth core restoration viscous
flooding experiments for Leopard core .................................................................................... 65
Figure 61: Pressure drop versus injected pore volume of second and fourth core restoration
viscous flooding experiments for Leopard .............................................................................. 66

xiii
LIST OF TABLES
Table 1: Mineral composition of Bandera Brown and Leopard outcrops from literature
(Garcia et al. 2016, Piñerez T et al. 2016) ............................................................................... 28
Table 2: Measured dimensions of Bandera Brown and Leopard core samples ...................... 29
Table 3: Ion composition of Total formation water ................................................................ 31
Table 4: Calculated permeability from pressure drop, area, flow rate and viscosity for
Leopard and Bandera Brown cores .......................................................................................... 39
Table 5: General summary of some of the measured fluid properties for a few of the prepared
fluids ........................................................................................................................................ 41
Table 6: Measured and reference interfacial tension of water-air, and the derived correction
factor ........................................................................................................................................ 43
Table 7: Measured and correct interfacial tension for oil mixtures with different n-heptane
content ...................................................................................................................................... 43
Table 8: Core properties, volume of oil in place and ultimate oil recovery from spontaneous
imbibition experiment on Bandera Brown and Leopard at 60°C ............................................ 45
Table 9: Core properties, volume of oil in place and ultimate oil recovery from high rate
viscous flooding experiment on Bandera Brown ..................................................................... 46
Table 10: Core properties, volume of oil in place and ultimate oil recovery from high rate
viscous flooding experiment on Leopard ................................................................................. 49
Table 11: Core properties, volume of oil in place and ultimate oil recovery from low rate
viscous flooding experiment on Bandera Brown ..................................................................... 51
Table 12: Core properties, volume of oil in place and ultimate oil recovery from low rate
viscous flooding experiment on Leopard ................................................................................. 53
Table 13: Core properties, volume of oil in place and ultimate oil recovery from high rate
viscous flooding experiment on Bandera Brown using lower viscosity oil at 60°C ............... 55
Table 14: Core properties, volume of oil in place and ultimate oil recovery from high rate
viscous flooding experiment on Leopard using lower viscosity oil at 60°C ........................... 57

1
1 INTRODUCTION
1.1 Global energy consumption
Figure 1 shows the global energy consumption for different sources. Oil and gas production
are still critical for the global energy demand as they contribute with more than half of the
global energy supply. Oil and gas are expected to remain important even in the far future (Johns
2004).
Figure 1: Global energy consumption by source (Smil 2016, BP 2020).
1.2 Oil Recovery
Oil recovery is defined as the process by which oil is extracted from underground. Oil
production undergoes three stages: primary, secondary and tertiary. In primary production, the
oil is produced with the aid of the natural reservoir energies. These energies include gravity
drainage, gas cap drive, solution gas drive, water aquifer influx, and, fluid and rock expansion
(Dake 2001). Reservoir pressure is depleted during primary production until it reaches a point
where there is no sufficient pressure to produce oil. At that point, secondary production
techniques are required. These techniques include the injection of fluids such as water and gas
to increase the reservoir pressure and/or to displace the oil towards the producing wells. The
injection of water and gas are referred to as water flooding and gas flooding, respectively. Oil
recovery after primary production generally is less than 30% and it can increase to 50% after
secondary recovery (Kokal and Al-Kaabi 2010). To further improve the oil recovery, tertiary

2
production techniques are implemented. These techniques also known as enhanced oil recovery
(EOR) techniques involve the addition of materials not normally presented in the reservoir.
EOR techniques are categorized into miscible gas, thermal, and chemical. Miscible EOR
comprises of injecting gases, such as CO2 and methane that will dissolve in oil and reduce its
viscosity which will lead to higher oil recovery. Thermal EOR processes such as steam
injection and in-situ combustion are applied to reservoirs containing viscous oil where the
elevated temperature will decrease the oil viscosity and facilitate its displacement. Chemical
EOR involve the injection of chemicals which creates desirable phase-behavior changes that
will result in an increase in oil recovery. Polymers, surfactants and alkaline or any
combinations of these three techniques namely Surfactant/Polymer, Surfactant/Alkaline, and
Alkaline/Surfactant/Polymer are used in chemical flooding. The mechanisms of chemical
flooding include interfacial tension (IFT) reduction, wettability alteration, and mobility control.
EOR techniques can boost the oil recovery to approximately 80% (Kokal and Al-Kaabi 2010).
EOR technologies have grown up during the past years and proved its potential in producing
more oil compared with water flooding. However, there is still no EOR process that received
widespread applicability similar to the case of water flooding. Many reasons are attributed to
the success and widespread applicability of water flooding such as, the availability of water
and its low cost compared with other chemicals and gases (Kokal and Al-Kaabi 2010), and,
less compatibility issues during injection into the formation when compared with chemical
injection (Smith and Cobb 1997). In addition to its high efficiency in displacing oil that can
reach up to 70% of oil initial in place (OIIP) for the reservoirs characterized with favorable
wettability and rock properties (permeability, porosity, and mineralogy). However, if the
reservoir is characterized by high degree of heterogeneity, unfavorable rock properties and
wettability, that would induce oil by-passing and capillary trapping reflecting in lower oil
recovery by water flooding. At this point, the interacting roles of forces responsible for fluid
displacements in porous media, especially, viscous and capillary forces is of great importance
and can control the oil recovery. Optimization of the injection velocity that was found directly
related to the oil viscosity can play a major role in improving the economics of water flooding
process.

3
1.3 Thesis Objectives
The objective of this study is to investigate the effect of injection rate and oil viscosity on the
oil recovery of water-wet sandstone through core flooding tests. Two sandstone outcrops with
different rock properties and mineralogies were utilized to study the interplay between the
capillary forces and viscous forces, and how it differs for heterogeneous sandstone cores. The
effect of rock wettability was not targeted in this study; hence, two non-polar oil samples with
different viscosities were used in order to maintain similar wetting conditions. The initial
wettability state was confirmed by the mean of spontaneous imbibition tests. Also, to eliminate
the effect of the connate water saturation of the oil recovery performance, the cores were
prepared to have the same initial water saturations.

4
2 FUNDAMENTALS AND LITERATURE REVIEW
This chapter will provide first the fundamental and engineering concepts and definitions of
fluid flow in porous medium. Then a tentative literature survey focused on factors affecting oil
recovery by water flooding process in sandstone reservoirs with a focus on flow rate and oil
viscosity will be presented.
2.1 Rock and fluid properties:
2.1.1 Porosity
Porosity is a measure of the rock storage capacity. It is defined as ratio of the void space
between the grains in a rock to the bulk volume of that rock and it is expressed with Equation
1:
Porosity (Ø) = Vp
Vb (Equation 1)
Where, Vp is the volume of void space or pore space and Vb is the bulk volume which is equal
to the sum of the pores volume and grains volume (Hook 2003). Porosity is classified based on
the pores’ interconnectivity into absolute porosity and effective porosity. The absolute porosity
is defined as the ratio of the total pores wither interconnected or disconnected to the bulk
volume. While the effective porosity is the ratio of the interconnected pores to the bulk volume
as shown in Figure 2. The effective porosity is the most important in reservoir engineering as
the fluids transport through the interconnected pores only. Porosity can be further classified
depending on the time of formation. The porosity created during the deposition time is known
as the primary porosity. Following the deposition, lithification processes such as cementing,
clay growth, dissolution of feldspar minerals, and dolomitization will take place and will affect
the porosity (Hook 2003). The porosity created by these processes is known as the secondary
porosity. The factors controlling porosity are grain shape, grains sorting and packing,
cementing, clay, dissolution of grains and fracturing.

5
Figure 2: Pores types
2.1.2 Permeability
Another important property of porous media is permeability. It is a measure of the rock ability
to transmit fluids through the interconnected pores. When a single fluid flow through the porous
media, the measured permeability is termed as the absolute permeability. Darcy’s law is used
to measure the absolute permeability. For measuring the permeability of a core in the lab
(Figure 3), Equation 2 is used:
Q = −𝐾 𝐴 𝛥𝑃
µ 𝐿 (Equation 2)
Where, Q is the flow rate, K is the absolute permeability of the rock, A is the cross sectional
area of the rock, µ is the viscosity of the fluid, ΔP is the differential pressure across the rock
and L is the length of the rock. The unit of permeability is Darcy (D) and it is equivalent to
m2.
Figure 3: Measurement of absolute permeability using Darcy’s law

6
When two or more fluids are present at the pores, the permeabilities of each fluid differ than
the single-phase condition and it is termed the effective permeability. The fluids will hinder
the flow of each other; therefore, the effective permeability is lower than the absolute
permeability of each fluid. The relationship between the effective and the absolute
permeabilities is expressed by the relative permeability (Equation 3):
𝐾𝑟 = 𝐾𝑒
𝐾𝑎 (Equation 3)
The relative permeability of each fluid is affected by its saturation and saturation history in
addition to the wettability and pore geometry (Anderson 1987c).
2.1.3 Viscosity
Viscosity is the property that depict the internal friction of a fluid to share when force is applied.
The flow becomes easier as the viscosity decreases. When a fluid is placed between two plates
as shown in Figure 4, and a force F (share stress) is applied to move the upper plate, the liquid
layer touching it will start to move in the same direction. The other adjacent liquid layers will
also start moving, but with lower magnitude (share rate). The velocity of each layer will
decrease as the layer gets closer to the bottom plate. This means that the velocity will be at its
minimum for the layer adjacent to the bottom plate. This illustration mechanism is called
parallel plate model (Figure 4).
Figure 4: Parallel plate model

7
Viscosity is calculated using Equation 4:
𝜇 =𝜏
�̇� (Equation 4)
Where 𝜇 is the viscosity, �̇� and 𝜏 are the shear rate and stress respectively.
According to the viscosity, fluids are categorized into two main categories which are
Newtonian and non-Newtonian. In the first category, the viscosity is constant regardless of the
applied share rate. On the other hand, the viscosity of the fluid in the latter category will change
according to the share rate. In general, viscosity of liquids highly depends on the temperature
as it decreases with increasing the temperature, but pressure is of minimal impact.
Viscosity can be directly measured using rotational viscometer or indirectly measured by the
Cannon-Fenske viscometer shown in Figure 5. The instrument measures the kinematic
viscosity which will be used with density to calculate the viscosity. To measure the kinematic
viscosity, the liquid sample should be placed in bulb A above mark B. Then the sample flows
freely through mark B and the time taken for the meniscus to pass from B to C is measured
(Cannon and Fenske 1938).
Figure 5: Cannon-Fenske tube for viscosity measurement
Tubes come in different sizes, and each size has its own calibration constant. This constant is
multiplied by the measured time to get the kinematic viscosity.
B
C
A

8
2.1.4 Mobility
Mobility of a fluid can be described as the ratio between its relative permeability to its viscosity
using Equation 5:
𝜆𝑖 =𝐾𝑟𝑖
𝜇𝑖 (Equation 5)
Where 𝜆 is the mobility, 𝐾𝑟 is the relative permeability and i is the fluid phase (gas, water or
oil). Mobility ratio (M) is the mobility of the displacing phase (𝜆𝑖1) over the mobility of the
displaced one (𝜆𝑖2) as described in Equation 6 (Holstein and Lake 2007):
𝑀 =𝜆𝑖1
𝜆𝑖2 (Equation 6)
Another used term is the end point mobility ratio (𝑀°), and it is calculated by Equation 7:
𝑀° =𝜆𝑟𝑖1
° 𝜇𝑖2
𝜆𝑟𝑖2° 𝜇𝑖1
(Equation 7)
Where 𝜆𝑟𝑖1° is the end-point relative permeability of the displacing fluid at residual saturation
of the displaced one, and 𝜆𝑟𝑖2° is the end-point relative permeability of the displaced fluid at
initial displacing fluid saturation.
When the mobility ratio is low (M ≤ 1), the displacement process is said to be stable. The
production’s tail will be smaller in this case and the water break-through will occur late. On
the contrary, when mobility ratio is high (M > 1), early break-through will occur with a long
production tail. To shift the mobility ratio to the desired range (M < 1), the viscosity of the
displacing fluid can be increased by adding polymer.

9
2.1.5 Interfacial tension (IFT)
The miscibility of two liquids depends on the difference in the intermolecular forces between
them. When the liquid molecules are strongly attracted to the same molecules type (the same
liquid), liquids are said to be immiscible with minimum contact area. On the other hand, if the
attraction forces between molecules of different type (different liquids) are greater or equal to
these in the same liquid, the liquids are miscible. The property is influenced by composition of
each liquid, temperature and pressure of the system (Myers 1999). One of the methods used to
measure interfacial tension is spinning drop, which is the formation of long oil drop (with oval
shape) in water (Figure 6) under the influence of centrifugal force, interfacial tension and
gravity. According the shape of the droplet, interfacial tension can be calculated based on the
following:
When L/D ≥ 4, Vonnegut equation (Equation 8) is used:
𝜎𝑜𝑤 = 0.521∆𝜌𝐷3
𝑃3 (Equation 8)
Where 𝜎𝑜𝑤 is the interfacial tension between oil and brine, ∆𝜌 is the difference in density
between oil and brine, D is the oil droplet diameter, L is the length of the droplet and P is the
period of the speed of rotation of the capillary tube.
When L/D < 4, Young-Laplace equation (Equation 9) is used:
PA − PB = −2𝐻σow (Equation 9)
Where PA and PB are the pressures of the two bulk phases and H is interface’s mean curvature.
Figure 6: Shape of oil droplet in surfactant solution during IFT measurement
L
D

10
2.1.6 Wettability
Wettability is defined as the tendency of one fluid to adhere to a solid surface in the presence
of another immiscible fluid (Craig 1971). The wettability controls the flow, distribution and
location of the fluids inside the reservoir. If the reservoir rock is water-wet, water (the wetting
phase) tends to occupy the small pores and contact majority of the rock surface while the oil
(the non-wetting phase) occupies the center of the large pores. The location of oil and water
are reversed in the case of oil-wet reservoir rock system. It is important to note that wettability
refer to the wetting preference of the rock and not necessarily to the fluid which in contact with
the rock surface at any given time (Anderson 1986b). Reservoir rocks can vary from strongly
water-wet to strongly oil-wet depending on the oil, water and rock interactions. When the rock
has no strong preference to either water or oil, it is called neutral-wet or intermediate-wet.
When a drop of water is placed on rock surface in the presence of oil as shown in Figure 7,
there will be oil/water, water/rock and oil/rock interaction. The equilibrium configuration of
the two fluids depends on the relative interfacial tension between the three interfaces as
represented by Young’s equation (Equation 10) (Anderson 1986a):
𝜎𝑜𝑤𝑐𝑜𝑠𝜃 = 𝜎𝑠𝑜 − 𝜎𝑠𝑤 (Equation 10)
Where 𝜎𝑜𝑤, 𝜎𝑠𝑤 and 𝜎𝑠𝑜 are the interfacial tension between oil/water, water/rock and oil/rock,
respectively, and, 𝜃 is the contact angle between the two fluids. The contact angle is always
measured through the denser fluid, typically water. Wettability can be determined directly by
measuring the contact angle from Equation 10. Rock is considered water-wet for 𝜃 < 75°,
intermediate-wet for contact angle between 75° < 𝜃 < 105°, and oil-wet for 𝜃 > 180° (Anderson
1986a). However, the contact angle method is associated with some limitations; contamination
of the surfaces and the apparatus, use of minerals instead of rock chips and contact angle
hysteresis arises from rock heterogeneity and roughness (Anderson 1986a).

11
Figure 7: Wettability of the oil/water/rock system (Anderson 1986a)
Beside contact angle, many methods were proposed for qualitative and quantitative
measurements of rock wettability and the most commonly used amongst them is spontaneous
imbibition test (Figure 8). This test measures the amount of oil that is displaced by water
imbibition into the core. The spontaneous imbibition performance is greatly related to the
pressure difference between the wetting and non-wetting phase which is referred to as capillary
pressure. Spontaneous imbibition test is conducted until equilibrium is reached which can take
up to more than three months in some of the cases (Standnes and Austad 2003).
Figure 8: Spontaneous imbibition test (Standnes and Austad 2003)

12
2.2 Displacement forces
The fluid flow in porous media is govern by three displacement forces: capillary forces, gravity
forces and viscous forces.
2.2.1 Capillary forces
The capillary forces have an important role in porous medium since the interface between the
fluids at the pore scale consists of many menisci (Løvoll et al. 2005). The capillary pressure
acts at these menisci. The concept of capillary pressure evolved from the representation of
porous media with capillary phenomenon in capillary tubes. The capillary pressure is defined
as the pressure difference between the wetting and non-wetting phase, which are two
immiscible fluids. It occurs due to the difference in the electrostatic forces (adhesive and
cohesive forces) in between both fluids. This fluid/rock property can be expressed in the
following Young-Laplace equation (Equation 11) (Anderson 1987a):
Pc,ow = Pnon − Pweting = 𝑝0 − 𝑝𝑤 = 𝜎𝑜𝑤(1
𝑅1−
1
𝑅2) (Equation 11)
Where 𝜎𝑜𝑤 is the interfacial tension between oil and water, 𝑅1 and 𝑅2 are the interface
curvature’s radii of the interface measured perpendicular to each other. Because of this
definition, the capillary pressure can be positive or negative depending on whether oil or water
is the wetting phase. When the interface is flat, the capillary pressure is zero as shown in Figure
9. For porous media, the interface can approximated as a portion of sphere with radius r and
the capillary pressure can be expressed with Equation 12 (Anderson 1987a):
𝑃𝑐 =2𝜎𝑐𝑜𝑠𝜃
𝑟 (Equation 12)
Where 𝜃 is the measured angle between the fluids and r is the capillary radius.

13
Figure 9: Capillary pressure in porous media (Moghadam and Salehi 2019)
2.2.2 Gravity forces
The gravity force is acting on the reservoir fluids due to its variation in density that result in
the fluids distribution in the reservoir. The buoyancy force that is exerted on the lighter fluids
pushing them to segregate upward enhances the gravity force. Equation 13 expresses the
buoyancy force:
∆Pg = ∆gH (Equation 13)
Where ∆Pg is pressure difference exerted at the oil-water interface due to gravity, ∆ρ is the
difference in density between displaced and displacing fluids, g is the gravitational acceleration
and it is equal to 9.8 m/s2, and H is the height of the liquid column. Depending on the magnitude
of the density differences and the capillary forces, gravity forces can be over-ride like the case
of solvent flooding or under-ride like the case of water flooding as shown in Figure 11 (Kantzas
et al. 2018). Gravity force will dominate when the relative influence of the capillary forces is
low which achieved at low IFT conditions.

14
Figure 10: (a) Gravity force over-ride (displacing > displaced). (b) Gravity force under-ride
(displacing < displaced) (Kantzas et al. 2018)
Schechter et al. (1994) estimated the relative influence of capillary and gravity forces acting
on the fluids inside a strong water-wet core using the inverse of Bond number (Equation 14):
𝑁𝐵−1 = 𝐶
𝜎𝑐𝑜𝑠𝜃√∅
𝐾
∆𝜌𝑔𝐻 (Equation 14)
Where, NB-1 is the inverse Bond number, C is a constant for capillary tube model and equals to
0.4, σ is the interfacial tension (mN/m), Ø is the porosity, K is the permeability (m2), Δρ is the
density difference between the fluids (oil and water) (Kg/m2), g is the gravitational acceleration
and it is equal to 9.8 m/s2, and, H is the height of the liquid column (m). When NB-1 < 0.2, the
spontaneous imbibition of the wetting phase is dominated by gravity forces, and when NB-1 >
5, the spontaneous imbibition is dominated by capillary forces. However, when 0.2 < NB-1 < 5,
spontaneous imbibition is dominated by both gravity and capillary forces (Standnes et al.
2002). During a spontaneous imbibition test of an oil saturated core and soaked in water, if the
oil recovery is dominated by gravity forces, the oil is expelled from the top surface of the core
only. However, when the oil recovery is dominated by capillary forces, the oil will be expelled
equally from all sides of the core (Standnes et al. 2002). Figure 11 shows a comparison example
of the fluids distribution in an oil saturated cores and imbibed with two types of surfactant
solutions from a study conducted by Standnes and Austad (Standnes and Austad 2000). Figure
11a shows a core imbibed with cationic surfactant solution (C12TAB) and as it appears, the oil
displacement was by counter current flow governed by capillary forces. On the other hand,
Figure 11b shows that fluid distribution inside the core imbibed with anionic surfactant solution
(APES) followed the gravity segregation and the oil displacement was by co-current flow
governed by gravity forces.

15
Figure 11: Fluid distribution inside a core imbibed with (a) cationic surfactant solution
(C12TAB) and (b) anionic surfactant solution (APES) (Standnes and Austad 2000)
2.2.3 Viscous forces
Viscous forces represents the fluids viscosity and it is proportional to injection viscosity (Satter
and Iqbal 2016). At pore scale, the viscous forces can stabilize the interface between the
displaced and displacing fluids if the displacing fluid has higher viscosity than the displaced
fluid. However, if the viscosity of the displaced fluid was higher than that of the displacing
fluid, the interface would destabilize and result in viscous fingering of the displacing fluid
through the displaced fluid (Løvoll et al. 2005). The fingering is referred to the instability
occurred during the displacement of fluids that led to the formation of fingers-like pattern
(Homsy 1987), as shown in Figure 12.
Figure 12: Example of Viscous Fingering (Homsy 1987)
a b

16
To initiate a flow through porous media, the magnitude of viscous must be higher than that of
capillary forces (Green and Willhite 1998). The dimensionless capillary number that relates the
magnitude of viscous and capillary forces was proposed by Melrose and Brandner (Melrose
1974). Equation 15 defines the capillary number:
𝑁𝑐𝑎 = 𝑉𝑖𝑠𝑐𝑜𝑢𝑠 𝑓𝑜𝑟𝑐𝑒𝑠
𝐶𝑎𝑝𝑖𝑙𝑙𝑎𝑟𝑦 𝑓𝑜𝑟𝑐𝑒𝑠=
𝑣𝜇𝑤
𝜎𝑜𝑤 (Equation 15)
Where, Nca is the capillary number, ν is the interstitial velocity (m/s), µw is the viscosity of
displacing fluid (Pa.s), and, σow is the IFT between oil and displacing fluid (mN/m). Based on
the relationship, when Nca << 1, capillary forces dominate and the local variations in the pore
throats size govern the flow path. However, when Nca >> 1, viscous forces dominate the
capillary forces and fingering may occur (Or 2008). Moreover, increasing the flow rate would
result in increasing of the viscous forces compared with the capillary forces and would modify
the flooding patterns depending on the viscosity ratios. For favorable mobility ratio (M < 1)
the flooding pattern would be compact. While, when the mobility ratio is unfavorable (M > 1),
viscous fingering flooding pattern would produce (Holtzman 2016). A correlation between the
Nca and the residual oil saturation was proposed and extensively verified (Moore and Slobod
1956, Abrams 1975, Chatzis and Morrow 1984). It has been shown that a reduction in residual
oil saturation was observed as the ratio of viscous forces to capillary forces increases. In other
words, as Nca increases, the residual oil saturation decreases as depicted in Figure 12. Increasing
Nca can be achieved by increasing the velocity and viscosity of water or decreasing the IFT.
Figure 13 shows that water flooding is usually in the range of low Nca. Once increasing Nca
beyond a critical value, a reduction in the residual oil saturation was seen. It was observed that
this critical Nca is higher for the wetting fluid compared with the non-wetting fluid. In addition
to wettability, the critical Nca was affected by pore size distribution. As the pore size
distribution becomes wider, the critical Nca decreases (Figure 14).

17
Figure 13: Correlation of Nca with residual oil saturation (Lake 1989)
Figure 14: Effect of pore size distribution on critical Nca (Lake 1989)
In field practice of water flooding, increasing the injection velocity of water is not practical
due to capacity and limitations of injection facilities. Therefore, water injection is conducted
at constant speed. Abrams (1975) modified the Nca to account for the water flooding at constant
injection rate (Equation 16):
18
𝑁𝑐𝑎𝑚 = 𝑣𝜇𝑤
(𝑆𝑜𝑖− 𝑆𝑜𝑟)𝜎𝑜𝑤 𝑐𝑜𝑠𝜃 (
𝜇𝑤
𝜇𝑜)
0.4
(Equation 16)
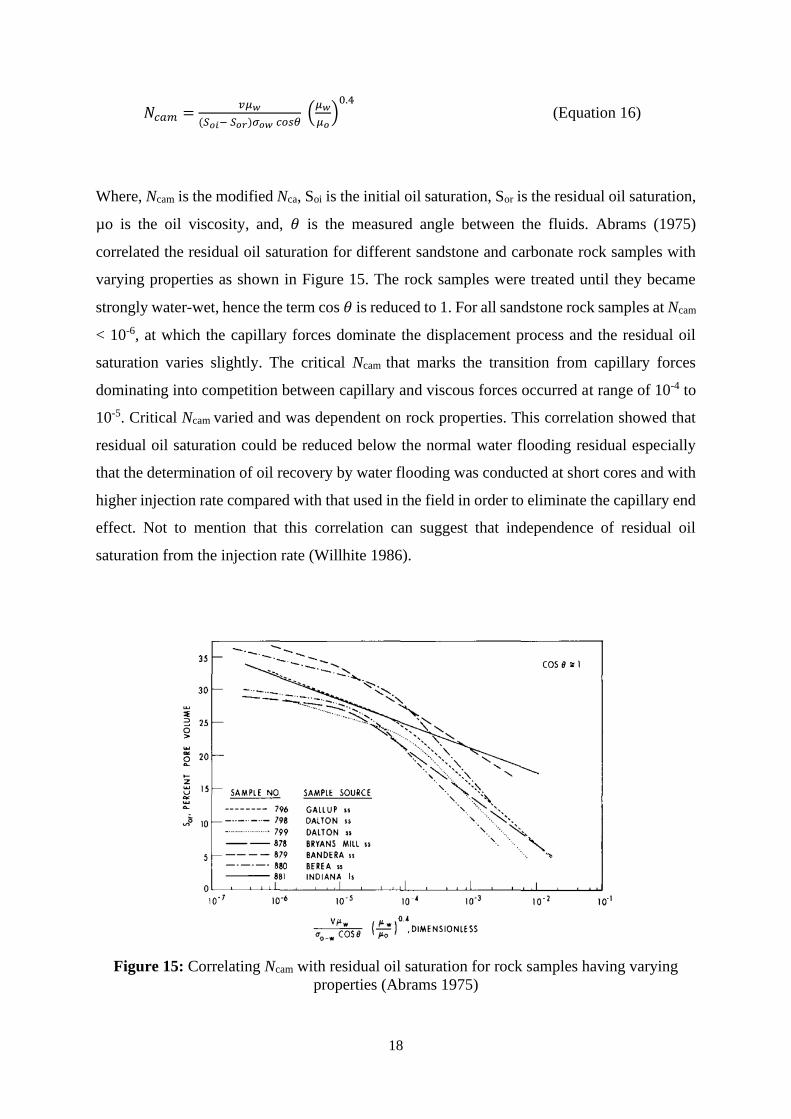
Where, Ncam is the modified Nca, Soi is the initial oil saturation, Sor is the residual oil saturation,
µo is the oil viscosity, and, 𝜃 is the measured angle between the fluids. Abrams (1975)
correlated the residual oil saturation for different sandstone and carbonate rock samples with
varying properties as shown in Figure 15. The rock samples were treated until they became
strongly water-wet, hence the term cos 𝜃 is reduced to 1. For all sandstone rock samples at Ncam
< 10-6, at which the capillary forces dominate the displacement process and the residual oil
saturation varies slightly. The critical Ncam that marks the transition from capillary forces
dominating into competition between capillary and viscous forces occurred at range of 10-4 to
10-5. Critical Ncam varied and was dependent on rock properties. This correlation showed that
residual oil saturation could be reduced below the normal water flooding residual especially
that the determination of oil recovery by water flooding was conducted at short cores and with
higher injection rate compared with that used in the field in order to eliminate the capillary end
effect. Not to mention that this correlation can suggest that independence of residual oil
saturation from the injection rate (Willhite 1986).
Figure 15: Correlating Ncam with residual oil saturation for rock samples having varying
properties (Abrams 1975)

19
2.3 Sandstones
Sandstones are sedimentary siliciclastic rocks that Sands or sandstones are composed of stable
minerals, such as quartz, feldspar and rock fragments, and cementing matrix minerals, such as
clay and silt, that binds the sand grains together (McBride 1963, Weimer and Tillman 1982,
Bjorlykke 2010). They are referred to as siliciclastic rocks due to its high silica contents. To be
classified as sandstone, the sand grain size should be between 1/8 mm to 2 mm in diameter. A
sandstone classification based on the sand grains composition was proposed as shown in Figure
16 (McBride 1963). For instance, a sandstone that has more than 25% feldspar and low rock
fragments content is called arkose.
Figure 16: Classification of sandstones based on sand grains’ composition (McBride 1963)
Clay minerals in sandstones may form during the diagenesis from the alteration of feldspar and
rock fragments. Clay cementing will result in poor grain sorting when compared by the time
of deposition that would reduce the permeability (Bjorlykke 2010). Clay minerals are
characterized with layered structure where each layer consists of a combination of tetrahedral
and octahedral sheets. They are fine grained particles with diameter less than 2μm. In addition
they have large surface area and high reactivity in reservoir (Austad et al. 2010). There are
various classes of clays such as kaolinite, illite, montmorillonite and chlorite, the minerals
structures are shown in Figure 17 (Yu 2019). The simplest structural type of clay mineral is
that of the kaolinite having the general chemical formula of Al4Si4O10(OH)8. It consist of a

20
sheet of tetrahedrally coordinated SiO4 connected to a sheet of octahedrally coordinated
Al(OH)3 through the apical oxygen in the tetrahedral sheet. As for the other clay minerals,
possible substitutions of Al3+ and possibly Fe3+ can occur widely for Si4+ on the tetrahedral site
whereas substitution of Al3+, Fe2+, Fe3+ and Mg2+ occurs on the octahedral layer.
Figure 17: Mineral structures of clays: kaolinite, illite, montmorillonite and chlorite (Bibi et
al. 2016)
Sandstone reservoirs are important as around 60% of oil reservoirs are held in sandstones. Not
to mention, sandstones provide reservoirs for oil, gas and ground water (Bjorlykke 2010).
Unlike the carbonates, sandstones were found commonly un-fractured which make it a good
candidate for water flooding.

21
2.4 Water flooding in sandstone reservoirs
Water flooding is considered the leading recovery technique since 1950s (Smith and Cobb
1997). The practice of water flooding began accidentally in Bradford field, USA, in 1890,
where some fresh water from shallower sources entered the producing interval through some
of the abandoned wells (Fettke 1938). The operators noticed that water entering the production
formation was stimulating the oil recovery. Since then the water flooding practice expanded
rapidly. Nowadays, it is the most widely applied oil recovery technique in both conventional
and unconventional oil reservoirs (Anderson 1987b). The water is injected to the reservoir in
order to increase the reservoir pressure upon the depletion of its natural energy at the primary
stage and to displace the oil in front of it towards the producing wells. The most common
practice of water flooding is to reinject the produced formation water (FW) in order to avoid
formation damage due to the incompatibility and it is a way to dispose the produced water. In
the case of offshore fields, some of these surface facilities are not available due to the limited
space on the platform. These reasons led to the use for sea water (SW) instead of produced
water for water flooding due to its abundance, low cost and convenience of offshore use
(Purswani et al. 2017).
Before water breakthrough, which is marked by the first appearance of water at the producing
well, only oil will be produced that would give an oil cut of 100%. After water breakthrough,
both oil and water will be produced that would result in an increase of the water cut and
subsequent decrease in the oil cut till the residual oil saturation is achieved. At that stage, water
cut will be very close to 100% and the water flooding process is uneconomical anymore, which
requires the implementation of EOR methods. Therefore, the proper design of water flooding
to delay the water breakthrough is crucial for the success of the whole process. As suggested
by the concept of capillary number, the balance between capillary forces and viscous forces
would affect the oil recovery. Based on that, oil viscosity and injection velocity are important
parameters controlling the performance of water flooding process. For light oil, the viscosity
ratio between oil and water is assumed to be close to 1, however, it is not the case for heavy oil
since the mobility of oil is much lower than the mobility of water (Arab et al. 2020). This
unfavorable mobility ratio induces the viscous fingering phenomenon. Increasing injection
velocity can promote fingering and increase the residual oil saturation. The effect of injection
rate on oil recovery during water flooding was vastly investigated since early 1950s (Rapoport
and Leas 1953, Moore and Slobod 1956, Perkins Jr 1957, Richardson and Perkins Jr 1957).
However, there was a huge debate on how the results from short laboratory cores could be

22
scaled to reservoir conditions. At lab scale the core flood experiments utilizing short cores
suffers from capillary end effects. This effect arises from the discontinuity of the capillarity of
wetting phase leading to its stuck at the outlet end of the core sample during the flow of two or
more phases (Hadley and Handy 1956, Huang and Honarpour 1998). The stuck wetting phase
will not be produced, hence the oil recovery at breakthrough will reduce. Oil recovery will be
lower for an oil-wet core in comparison with water-wet core. The capillary end effect was
found more pronounced at low injection rate as capillary forces will be dominating the
spreading of the displacement front. Therefore, core flooding experiments were conducted at
high injection rate to eliminate the capillary end effect (Anderson 1987b). However, effect is
not observed in the reservoir, which create a challenge in upscaling the lab results to reservoir
conditions as the balance between the viscous and capillary forces has major effect on the
residual oil saturation. Rapoport and Leas (1953) investigated the effects of injection rate and
core lengths on oil recovery (Figure 18). The cumulative oil recovery was found to increase
with increasing core length which indicates that the capillary end effects reduce with increasing
core length. In addition, the injection rate to reach the ultimate oil recovery at breakthrough
was found to decrease with increasing core length.
Figure 18: (a) Effect of core length and (b) injection velocity on oil recovery (Rapoport and
Leas 1953)
The shape of the curves and trends were seen similar however shifted sideways according to
the core lengths. A scaling coefficient was defined to make the curves coincide (Equation 17):
a b

23
Scaling coefficient = Lνµw (Equation 17)
Where, L is core length (cm), ν is injection velocity (cm/min), and, µw is the water viscosity
(mPa.s). The relationship between the scaling coefficient and oil recovery at breakthrough is
shown in Figure 19. A correlating trend between the oil recovery and the scaling coefficient
was obtained with minor degree of deviation mainly because the cores were not identical. The
trend revealed that oil recovery increases with increasing the scaling coefficient, however,
above a critical value the oil recovery stabilized and become independent of rate, length and
water viscosity. This critical scaling coefficient was approximately 1.5. Based on that it was
stated that to ensure no capillary end effect encountered and obtain the ultimate oil recovery,
1.5 ≤ Lνµw ≤ 5.
Figure 19: Relationship between scaling coefficient and oil recovery at breakthrough for (a)
oil-wet Alundum cores, no connate water, (b) neutral-wet Alundum cores, no connate water,
and, (c) neutral-wet Alundum cores, connate water = 30% (Rapoport and Leas 1953)
a b
c

24
Arab et al. (2020) recently reviewed and discussed the data of water flooding in light and heavy
oil systems. They replotted the data against the scaling coefficient defined by Rapoport and
Leas (1953) (Figure 20). For light oil (µo/µw ≥ 1.6), no further oil recovery was obtained above
scaling coefficient of 1.5 which is matching with Rapoport and Leas (1953). However, for
heavy oil systems (102 < µo ≤ 11500 mPa.s), it was observed that increasing the scaling
coefficient would result in a decrease in oil recovery which suggested that the effect of injection
rate on oil recovery is dependent on the oil viscosity as well.
Figure 20: Oil recovery at breakthrough as a function of scaling coefficient defined by
Rapoport and Leas for (a) light oil, and, (b) heavy oil (Arab et al. 2020)
For further investigation, Arab et al. (2020) conducted core flooding experiments for water
flooding using oil samples having wide range of viscosity (1 to 15000 mPa.s) at different
injection rates, in order to study the effect of viscous to capillary forces ratio on oil recovery.
It was found that the performance of water flooding of viscous oil can be predicted through the
combination of Ncam and Peters and Flock (1981) instability number. The instability number
describes the forces balances during a core flooding experiments. A displacement is considered
if unstable if the viscous forces are greater than the combination of gravity and capillary forces.
The instability number is defined by Equation 18:
𝐼𝑠𝑐 = (𝑀−1)𝑣𝜇𝑤𝐷2
𝐶∗𝜎𝐾𝑤𝑜𝑟 (Equation 18)
a b

25
Where, Isc is the instability number, M is the mobility ratio, 𝑣 is the velocity (m/s), µw is the
viscosity of water (mPa.s), D is the core diameter (m), σ is the interfacial tension (mN/m), Kwor
is the permeability to water at residual oil saturation (m2), and, C* is a wettability constant. C*
is equal to 306.25 for strong water-wet systems that would give low Isc. In water-wet system,
water imbibes into the small pores in transverse direction that would reduce the viscous
fingering. However, for oil-wet system, no water imbibition in transverse direction takes place
and the occurrence of viscous fingering is most likely that would result in instable
displacement. Therefore, C* for oil-wet is equal to 5.45 that would give high Isc. Peters and
Flock’s stated that stable displacement occur when Isc ≤ 13.56. Based on that, the displacement
front is stable at low injection rate for water-wet sandstone system. However, increasing the
injection rate to the point Isc becomes higher than 13.56 would result in unstable displacement.
It was observed that sharp increase in oil recovery at breakthrough would occur when 13.56 <
Isc < 1000. When increasing Isc beyond 1000, the oil recovery was very low and becomes
independent of injection velocity and Isc as the water flow at these conditions is dominant by
pseudo-stable flow that is defined by a single finger flow through which most of the water
passes through. Instability number analysis can only explain the water flooding behavior up to
the water breakthrough. On the other hand, Nca can explain the behavior of oil recovery at late
time as it relates the ultimate residual oil recovery to the balance between viscous and capillary
forces. As mentioned earlier, Abrams proposed Ncam by introducing oil and water viscosities
ratio in order to account for the water flooding at constant injection rate (Equation 16). Arab et
al. further modified the Abrams’s Ncam to account for a broader range of oil and water
viscosities ratio based on the results of 178 core flooding experiments from their study and the
literature. They considered the porosity (∅) in the velocity term and included the core length
(L), diameter (D), the permeability (K) into the Ncam as expressed in Equation 19:
𝑁𝑐𝑎𝑚 = (𝜇𝑤𝜐𝑤
𝜎𝑐𝑜𝑠𝜃∅)
0.26
(𝜇𝑤
𝜇𝑜)
0.5
(𝐾
𝐿𝐷)
0.18
(Equation
19)
Arab et al. plotted the new Ncam versus Isc for core flooding experiments of varying oil viscosity
and injection velocity and four regions were identified as shown in Figure 21. It was noted that
for core flooding experiments with stable displacement fronts (Isc < 13.56), increasing the

26
injection rate till Ncam ≥ 10-4 would result in reduction in residual oil saturation. At which, the
viscous forces are dominant. This is applied only for oil with viscosities lower than 37 mPa.s
as reported by Abrams (1975). For higher oil viscosities, the injection rate should be sufficient
to exceed the critical Ncam and reduce the residual oil saturation. For example in Figure 21,
when oil viscosity is 53.7 mPa.s, injection velocity higher than 0.7 ft/D should be used.
However, for viscous oil (> 494 mPa.s), increasing the injection velocity would result in the
transition of the displacement front from stable to unstable and the generation of viscous
fingering. Not to mention, increasing the injection velocity for viscous oil has no significant
improvement of the Ncam, hence no significant role of viscous forces and no reduction in the
residual oil saturation. Actually, it was observed that increasing the injection velocity for
viscous oil systems would increase the residual oil saturation by further promoting viscous
fingering. Reducing the injection velocity to low levels has no noticeable improvement of the
oil recovery of viscous oil at breakthrough. Still it was found effective in improving the oil
recovery at late time. Therefore, optimization of the injection velocity that is directly related to
the oil viscosity can play a major role in improving the economics of water flooding process.
Figure 21: Calculated capillary number versus instability number for water flooding tests of
oil samples with varying viscosity at different injection velocities (Arab et al. 2020)

27
It is interesting to highlight that most of the reported studies in the literature, sand packs were
used for the core flooding experiments and very few are available using heterogeneous systems.
Reservoir heterogeneities can lead to oil bypassing and low oil recovery at breakthrough and it
is a wide area for study.

28
3 MATERIALS AND METHODOLOGIES
In order to evaluate the effects of injection rate and viscosity, experimental investigation must
be conducted. A series of oil recovery tests with different controls will provide a good study of
these effects. The bulk of the laboratory studies revolve around viscous flooding. This section
provides a summary of the materials and apparatus used, along with the experimental
procedures followed.
3.1 Core Samples
The experiments were performed on two outcrop core samples, Leopard (LP2) and Bandera
Brown (BB2) ordered from Kocurek Industries™. Figures 22 and 23 show what the cores look
like. Both cores are sandstone and heterogeneous. Ultra resolution images of Bandera Brown
and Leopard core, provided by the supplier, are illustrated in Figures 24 and 25, respectively.
The mineral composition of the samples is shown in Table 1. Table 2 summarizes the
dimensions of both cores used.
Table 1: Mineral composition of Bandera Brown and Leopard outcrops from literature
(Garcia et al. 2016, Piñerez T et al. 2016)
Mineral Bandera Brown Leopard
(%) (%)
Quartz 66 93.9
Albite (Na-Feld) 13 0.5
Microcline (K-Feld) 2 1.2
Calcite 3 0.1
Pyrite 0 0.2
Barite 0 0.1
Hematite 0 0.1
Kaolinite 3 2.5
Illite 11 0
Chlorite 2 0
Smectite 0 1.2
Anatase 0 0.1
Insoluble organic matter 0 0.1
Total 100 100
Total clay 16 3.7

29
Table 2: Measured dimensions of Bandera Brown and Leopard core samples
Bandera Brown Leopard
Length (cm) 7.65 7.69
Diameter (cm) 3.79 3.79
Bulk Volume (ml) 86.49 86.80
Figure 22: Longitudinal and cross sections images of a typical Bandera Brown core sample
Figure 23: Longitudinal and cross sections images of a typical Leopard core sample

30
Figure 24: Ultra high resolution image of a
Bandera Brown core sample
Figure 25: Ultra high resolution image of a
Leopard core sample
3.2 Brine
The brine used for the water flooding process is Total formation water with salinity of 100,000
ppm. Low salinity brine (1,000 ppm NaCl) was also used in core cleaning processes. The
composition of the brines is shown in Table 3. The brines were prepared by mixing the salts
with deionized (DI) water. After the brines were mixed, they were filtered through a 0.45 µm
filter paper using Büchner filtration set-up (Figure 26) to ensure that the brines contained no
impurities or insoluble particles, since this can cause core blockage during the experiments.

31
Table 3: Ion composition of Total formation water
Ions Total formation water Low salinity water
ppm mM ppm mM
Cl- 60985.9 1720.2 606.6 17.1
Ca2+ 3611.3 90.1 0 0
Na+ 35402.8 1540 393.4 17.1
TDS (ppm) 100,000 1000
Figure 26: Büchner filtration set-up
3.3 Oil
Since this is a comparison study, it is important to have the initial wetting of the cores unaltered.
Therefore, a non-polar mineral oil (marcol-82™) was used. The viscosity of the oil was
changed by mixing marcol with n-heptane. Since n-heptane is also non-polar, hence, no wetting
alteration is expected. Marcol and n-heptane were mixed at different volume ratios, 25-75, 50-
50, 70-30, 80-20 and 85-15.

32
3.4 Lab Apparatus
Several instruments were used to measure the properties of the fluids. These properties are
viscosity, density, pH, and interfacial tension. The viscosity of the mineral oils and brines were
determined using Anton Paar™ MCR 302 rotational rheometer (Figure 27) equipped with a
cone and a plate having diameter of 50 mm and an inclination angle of 1°. Viscosity
measurements were conducted at varying shear rates (500 – 50 s-1) at the temperatures 20 °C
and 60 °C. The density was measured at room temperature using Anton Paar™ DMA 4500
Density Meter (Figure 28). A sample was injected using a syringe into a chamber with a known
volume. The sample in the chamber was weighed and then its density was calculated by
dividing the mass by volume. The pH was measured using a Mettler Toledo™ SevenCompact
pH meter (Figure 29) by submersing the electrode into the sample and obtaining the value of
the pH which is a measure of the amount of hydrogen ions in the sample. The interfacial tension
is measured the KRÜSS™ force tensiometer (Figure 30). The principle of the apparatus is that
it measures the interfacial tension using Du Noüy ring method. Two phases were filled into a
cup and the ring was submersed into the denser phase, beyond the interface between the two
phases. The ring was then slowly risen while ensuring the ring holder is centralized. When the
ring reached the interface between the water and oil, the attraction forces in the interface would
keep the ring at the interface. Continuous upward force caused the ring to break out of the
interface, and the interfacial tension at that moment was measured by the device.
Figure 27: Anton Paar™ MCR 302 Figure 28: Anton Paar™ DMA 4500
Density Meter

33
Figure 29: Mettler Toledo™ SevenCompact pH
meter
Figure 30: KRÜSS™ Force
Tensiometer
3.5 Experimental procedure
The steps for the core flooding experiments are illustrated in Figure 31. The process is done
for both core samples. A total of four core restorations were performed for every experiment,
which are summarized in Figure 32.
Figure 31: Experimental procedure for each core restoration
3. Core Aging
4. Establish Initial Oil Saturation
5. Oil Recovery Test
6. Analyze Samples
1. Core Mild Cleaning
2. Establish Initial Water Saturation

34
Figure 32: Description of the experiment for each core restoration
3.5.1 Core Restorations and Experiments
3.5.1.1 Permeability Determination
First, low salinity brine (1,000 ppm NaCl) was injected into the core at a rate of 0.1 ml/min to
clean it, and the differential pressure reading from the core flooding set up were recorded. The
permeability was calculated using Darcy’s equation (Equation 2). The core was then placed in
an oven set at 60°C for drying and the dry weight was measured.
3.5.1.2 Establishing Initial Water Saturation
Equation 19 shows the relationship between desired initial water saturation and the dilution of
formation water needed.
𝑆𝑤𝑖 =1
𝑛 (Equation 19)
Where 𝑆𝑤𝑖 is desired water saturation and 𝑛 is how many times of dilution needed. In order to
have an initial water saturation of 0.2, the core was saturated with five times diluted formation
water under vacuum conditions (Figure 33) and allowed to stay overnight to ensure maximum
imbibition of the formation water into the core. The weight of the fully brine saturated core
was measured, and the pore volume (and ultimately porosity) was calculated by Equation 20:
First Restoration
•Spontaneuos Imbibition
Second Restoration
•Viscous Flooding at 4 PV/day
Third Restoration
•Viscous Flooding at 1 PV/day
Fourth Restoration
•Viscous Flooding at 4 PV/day using lower viscosity oil

35
𝑃𝑉𝐶𝑜𝑟𝑒 =𝑊𝑆𝑎𝑡,𝐹𝑊𝐷−𝑊𝐷𝑟𝑦
𝜌𝐹𝑊𝐷 (Equation 20)
Where 𝑃𝑉𝐶𝑜𝑟𝑒 is total pore volume, 𝑊𝑆𝑎𝑡,𝐹𝑊𝐷 is weight of core saturated with diluted formation
water, 𝑊𝐷𝑟𝑦 is weight of dry core, and 𝜌𝐹𝑊𝐷 is density of diluted formation water used.
Figure 33: Saturation of Bandera Brown core sample with 5 times diluted formation water
under vacuum conditions
The target weight to achieve an initial water saturation of 0.2 was calculated using Equation
21:
𝑊𝑇 = 𝑊𝐷𝑟𝑦 + 𝜌𝐹𝑊 ∙ 𝑃𝑉𝐶𝑜𝑟𝑒 ∙ 𝑆𝑤𝑖 (Equation 21)
Where 𝑊𝑇 is the target weight of the core, 𝑊𝐷𝑟𝑦 is core dry weight, 𝜌𝐹𝑊 is density of Total
formation water, 𝑃𝑉𝐶𝑜𝑟𝑒 is pore volume and 𝑆𝑤𝑖is the desired initial water saturation.
The rock sample was placed in a desiccator to prevent rapid evaporation of the formation water
(Figure 34). The dissector contains silica gel that absorbs moisture. Then, the core was
monitored until the target weight was reached and the core was then stored in a dark place for
three days to have uniform water distribution in the pores.

36
Figure 34: Leopard core sample placed in a desiccator
3.5.1.3 Establishing Initial Oil Saturation
After three days, the core was saturated with the non-polar oil mixture in a similar way to the
brine. Next, the saturated (with oil) weight of the core was measured, and the pore volume
occupied by the oil was calculated with Equation 22:
𝑃𝑉𝑜 =𝑊𝑇−𝑊𝑆𝑎𝑡,𝑂
𝜌𝑂 (Equation 22)
Where 𝑃𝑉𝑂 is volume of oil in the pores, 𝑊𝑇 is target weight, 𝑊𝑆𝑎𝑡,𝑂 is weight of core when
saturated with oil, and 𝜌𝑂 is density of oil. Using the calculated pore volume of oil and total
pore volume, the initial oil saturation was determined (Equation 23)
𝑆𝑜𝑖 =𝑃𝑉𝑜
𝑃𝑉𝐶𝑜𝑟𝑒 (Equation 23)
3.5.1.4 First Restoration
A spontaneous imbibition was performed by placing the core inside Amett’s cell and filled
with Total 100,000 ppm formation water at 60°C. The produced oil was recorded periodically
until no more oil was produced.

37
3.5.1.5 Second Restoration
The core was subjected to mild cleaning with heptane and low salinity brine and dried in the
60°C oven. Then, the same procedure was repeated as done in the first restoration to prepare
the core for the viscous flooding experiment. The viscous flooding experiments were conducted
using the core flooding set-up illustrated in Figure 34. It consists of an oven, a pump, a core
holder, a backpressure regulator (BPR) and pressure transducers. The core holder is positioned
inside the oven and it is equipped with taps at both ends for pressure drop measurements across
the core. The pressure transducers are connected to an acquisition system for collection of
measured data. For the second restoration, the core flooding set-up was pre-flooded with the
Total 100,000 ppm formation water, and the core was flooded with the formation water at 4
PV/day at 60°C with a backpressure of 10 bar. The produced oil was collected in a burette and
periodic readings of oil production were taken. Produced formation water samples were taken
after water breakthrough and their pH and density were measured. The oil recovery test was
stopped when no more oil was being produced.
Figure 35: Images and scheme of core flooding set-up

38
3.5.1.6 Third Restoration
After mild cleaning and establishment of initial water and oil saturation, the viscous flooding
experiment was performed again at an injection rate of 1 PV/day. Similarly, oil recovery was
recorded and produced water samples were collected and analyzed, until the oil production has
come to a halt.
3.5.1.7 Fourth Restoration
For this restoration, after cleaning and establishing Swi, the core was saturated with
heptane/marcol 50-50 mixed by volume oil instead. The oil recovery test was done at an
injection rate of 1 PV/day using the same brine and temperature as before.

39
4 RESULTS
In this chapter, the results obtained from all the experimental work performed will be presented.
4.1 Permeability
Table 4 shows the measured initial permeability of both Bandera Brown (BB2) and Leopard
(LP2) cores. The permeability values of BB2 and LP2 were 5.9 and 17.7 mD, respectively.
Table 4: Calculated permeability from pressure drop, area, flow rate and viscosity for
Leopard and Bandera Brown cores
Core Pressure Drop
(mbar)
Area
(cm2)
Flow rate
(ml/min)
Water Viscosity
(cP)
Permeability
(mD)
LP2 68.9 11.3 0.1 1.1 17.7
BB2 204.9 11.3 0.1 1.1 5.9
4.2 Fluid Properties
Figure 36 shows the measured viscosity of the different brines and oil mixtures prepared at 20
°C, and Figure 37 shows the viscosities of the same fluids at 60 °C. There is no reported
viscosity for marcol/n-heptane 50-50 mixed by volume at 60 °C because it was hard to measure
its viscosity due to the fact that n-heptane is very volatile. Rapid evaporation of the heptane
components caused the viscosity to be higher due to the increasing ratio of the marcol oil.
Marcol and n-heptane 85-15 mixture was used for first, second, and third restoration whereas
marcol and n-heptane 50-50 mixture was used for fourth restoration. Viscosity results along
with the density and pH are summarized in Table 5.

40
Figure 36: Semi-log plot of viscosity measured at different shear rates at 20 °C of different
prepared fluid
Figure 37: Plot of viscosity measured at different shear rates at 60 °C of different prepared
fluids
1
10
100
0 50 100 150 200 250 300 350 400 450 500
Vis
cosi
ty (
cP)
Shear rate (s-1)
LS TOTAL FW 100KMARCOL MARCOL/C7 (50-50)MARCOL/C7 (85-15)
0
2
4
6
8
0 50 100 150 200 250 300 350 400 450 500
Vis
cosi
ty (
cP)
Shear rate (s-1)
LS TOTAL FW 100K
MARCOL MARCOL/C7 (85-15)

41
Table 5: General summary of some of the measured fluid properties for a few of the prepared
fluids
Fluid Density
(g/cm3)
Viscosity at shear rate 50 s-1
(cP) Bulk pH
20 °C 60 °C
Pure Marcol (100) 0.85 27.0 7.3 -
Marcol/n-Heptane (85-15) 0.83 11.3 5.2 -
Marcol/n-Heptane (50-50) 0.78 2.7 - -
Diluted Formation Water 1.01 1.1 0.8 6.9
Formation Water 1.07 1.3 0.8 6.4
The measured viscosities at 20 °C of the different prepared oil mixtures are illustrated in Figure
38. There is a clear trend that can be seen, as the n-heptane content increases in the oil mixture,
the viscosity decreases. An exponential relationship was derived from the viscosity
measurements. The fitting equation of the trend line was used to calculate the theoretical
viscosity of the marcol/n-heptane 25-75 ratio mixed by volume. The calculated viscosity was
0.95 cP. The viscosity was also measured and compared with the theoretical viscosity; the
measured value was 1.08 cP. The difference between both values is fairly close from an
experimental point of view, due to the possibility of human error. Moreover, if more oil
mixtures with low n-heptane content were analyzed, the model could be improved to reduce
the difference between the experimental and theoretical values which makes the model
constructed more accurate.

42
Figure 38: Measured viscosity versus heptane content in mixture with marcol mixed by
volume
A similar behavior was observed when the measured interfacial tension was plotted versus n-
heptane content in oil mixture (Figure 39). However, it is worth mentioning that the decrease
in IFT with increasing n-heptane content is small, the IFT ranges from 37 to approximately 45
mN/m. The values were corrected using a calibration factor based on the ratio of the measured
IFT of water-air to reference value of IFT of water-air, which is a table value from KRÜSS™.
Tables 6 and Table 7 summarize the measured and correct values of IFT using the correction
factor.
y = 22.188e-0.042x
R² = 0.9936
0
5
10
15
20
25
30
0 20 40 60 80 100
μ (
cP)
Heptane Content (%v)

43
Figure 39: Measured interfacial tension versus n-heptane content in mixture with marcol
mixed by volume
Table 6: Measured and reference interfacial tension of water-air, and the derived correction
factor
Measured IFT of water-air (mN/m) 69.10
Reference IFT of water-air (mN/m) 72.75
Correction factor 1.05
Table 7: Measured and correct interfacial tension for oil mixtures with different n-heptane
content
n-Heptane Content (%) IFT (mN/m) IFT corrected (mN/m)
0 44.6 47.0
15 42.8 45.1
20 42.2 44.4
30 40.8 43.0
50 38 40.0
75 37.2 39.2
0
10
20
30
40
50
0 20 40 60 80 100
IFT
(m
N/m
)
Heptane Content (%v)

44
As for density measurements, increasing the n-heptane content in the mixture decreases the
density of the prepared oil, as seen in Figure 40.
Figure 40: Measured density versus n-heptane content in mixture with marcol mixed by
volume
4.3 First Core Restorations
Table 8 shows the core properties of both core samples for the spontaneous imbibition
experiment. The results are plotted in Figure 41. The ultimate oil recovery from Leopard and
Bandera Brown cores are 37.7% and 40.4%, respectively.
0.600
0.700
0.800
0.900
1.000
0 25 50 75 100
Den
sity
(g/c
c)
n-Heptane content (%v)

45
Table 8: Core properties, volume of oil in place and ultimate oil recovery from spontaneous
imbibition experiment on Bandera Brown and Leopard at 60°C
Core Bandera Brown Leopard
Dry Weight (g) 169.24 176.25
Saturated Weight (g) 190.99 194.62
Target Weight (g) 173.82 180.12
Pore Volume (ml) 21.5 18.2
Porosity (%) 24.8 20.9
Initial Water Saturation 0.15 0.19
Oil in Place (ml) 18.3 14.8
Ultimate Recovery (%) 40.4 37.7
Figure 41: Oil recovery of Leopard and Bandera Brown by spontaneous imbibition using Total
100,000 ppm formation water at 60°C
0
10
20
30
40
50
0 1 2 3
Oil
rec
over
y (
% O
OIP
)
Time (Days)
Leopard
Bandera Brown

46
4.4 Second Core Restoration
4.4.1 Bandera Brown (BB2-2)
The core properties for the second restoration are illustrated in Table 9, it can be seen that the
porosity of the core is 1% higher than the first restoration (Table 8). This is caused by
experimental error during establishing the initial water saturation during the first restoration,
causing inconsistency in calculated properties. For the high rate viscous flooding of BB2 as
shown in Figure 42, the oil recovery was rapid in the beginning of the experiment up to water
breakthrough, where the production of oil declined until it reached production plateau. The
ultimate recovery is 47.2%. Similarly, the pressure drop was high and peaked in coincidence
with the oil recovery. After breakthrough, the pressure drop started to decrease.
Table 9: Core properties, volume of oil in place and ultimate oil recovery from high rate
viscous flooding experiment on Bandera Brown
Dry Weight (g) 168.94
Saturated Weight (g) 191.67
Target Weight (g) 173.73
Pore Volume (ml) 22.5
Porosity (%) 26.0
Initial Water Saturation 0.2
Oil in Place (ml) 18.2
Ultimate Recovery (%) 47.1

47
Figure 42: Oil recovery and pressure drop versus PV injected for Bandera Brown core by water
flooding using Total 100,000 ppm formation water at 60°C and 4 PV/day injection rate
0
100
200
300
0
20
40
60
0 1 2 3 4 5 6 7
Oil
rec
ov
ery
%
(O
OIP
)
Pre
ssu
re d
rop
(m
ba
r)
PV injected
BB2-2
dP

48
Figure 43 shows the measured pH and density of collected samples of the produced brine
during the experiment. There is a slight increase in pH observed from approximately 5 to 6.2,
which is not significant. There is no noticeable change in the density values.
Figure 43: Density and pH versus PV injected of produced water samples during oil recovery
test of Bandera Brown at 4 PV/day injection rate
4.4.2 Leopard (LP2-2)
The core properties in the second restoration are presented in Table 10. Figure 44 shows the
oil recovery (in % OOIP) and pressure drop (in mbar) for the high rate viscous flooding test
performed on the Leopard core. As expected, the rapid oil recovery shows a water wet behavior,
until water breakthrough where less oil is being produced and the water cut increases. The
ultimate oil recovery is 45.5%. A similar trend is observed for the pressure drop, a sharp
increase in pressure drop during the rapid oil production phase followed by a gradual decrease
when the production plateau had been reached.
0.99
1.04
1.09
1.14
1.19
0
2
4
6
8
10
0 1 2 3 4 5 6 7 8
Den
sity
(g
/cm
3)
pH
PV Injected
pH
Density

49
Table 10: Core properties, volume of oil in place and ultimate oil recovery from high rate
viscous flooding experiment on Leopard
Dry Weight (g) 176.2
Saturated Weight (g) 194.78
Target Weight (g) 180.11
Pore Volume (ml) 18.4
Porosity (%) 21.1
Initial Water Saturation 0.19
Oil in Place (ml) 15.2
Ultimate Recovery (%) 45.5
Figure 44: Oil recovery and pressure drop versus PV injected for Leopard core by water
flooding using Total 100,000 ppm formation water at 60°C and 4 PV/day injection rate
0
5
10
15
20
0
20
40
60
0 1 2 3 4 5 6 7 8
Oil
rec
over
y %
(O
OIP
)
Pre
ssu
re d
rop
(m
bar)
PV injected
LP2-
3

50
The samples of the produced formation water were analyzed, during which the pH and density
were measured (Figure 45). The measured properties show consistency throughout the
experiment.
Figure 45: Density and pH versus PV injected of produced water samples during oil recovery
test of Leopard at 4 PV/day injection rate
4.5 Third Core Restoration
4.5.1 Bandera Brown (BB2-3)
For this core restoration, the core properties and oil recovery are shown in Table 11. An
ultimate oil recovery of 47.6% can be seen in Figure 46. Similar trends of oil recovery and
pressure to BB2-2 can also be observed.
0.99
1.04
1.09
1.14
1.19
0
2
4
6
8
10
0 1 2 3 4 5 6 7
Den
sity
(g
/cm
3)
pH
PV Injected
pH
Density

51
Table 11: Core properties, volume of oil in place and ultimate oil recovery from low rate
viscous flooding experiment on Bandera Brown
Dry Weight (g) 169.14
Saturated Weight (g) 191.59
Target Weight (g) 173.87
Pore Volume (ml) 22.2
Porosity (%) 25.6
Initial Water Saturation 0.2
Oil in place (ml) 17.7
Ultimate Recovery (%) 47.6
Figure 46: Oil recovery and pressure drop versus PV injected for Bandera Brown core by water
flooding using Total 100,000 ppm formation water at 60°C and 1 PV/day injection rate
0
100
200
300
0
20
40
60
0 1 2 3 4 5 6
Oil
rec
over
y %
(O
OIP
)
Pre
ssu
re d
rop
(m
bar)
PV injected
BB2-3
dP

52
The density of the sampled formation water is very consistent throughout the experiment. There
is an insignificant change of 0.5 in the pH, as shown in Figure 47.
Figure 47: Density and pH versus PV injected of produced water samples during oil recovery
test Bandera Brown core at 4 PV/day injection rate
0.99
1.04
1.09
1.14
1.19
0
2
4
6
8
10
0 1 2 3 4
Den
sity
(g
/cm
3)
pH
PV Injected
pH
Density

53
4.5.2 Leopard (LP2-3)
The core properties and oil recovery are shown in Table 12. The oil recovery and pressure drop
from low rate oil recovery test for Leopard core are shown in Figure 48. The ultimate oil
recovery achieved from the experiment is 39.3%
Table 12: Core properties, volume of oil in place and ultimate oil recovery from low rate
viscous flooding experiment on Leopard
Dry Weight (g) 174.7
Saturated Weight (g) 193.78
Target weight (g) 178.72
Pore Volume (ml) 18.9
Porosity (%) 21.7
Initial Water Saturation 0.19
Oil in Place (ml) 15.3
Ultimate Recovery (%) 39.3
Figure 48: Oil recovery and pressure drop versus PV injected for Leopard core by water
flooding using Total 100,000 ppm formation water at 60°C and 1 PV/day injection rate
0
5
10
15
20
0
20
40
60
0 1 2 3 4
Oil
rec
ov
ery %
(O
OIP
)
Pre
ssu
re d
rop
(m
bar)
PV injected
LP2-3
dP

54
Figure 49 shows the measured density and pH of the produced formation water from the high
rate viscous flooding. No change in both pH and density
Figure 49: Density and pH versus PV injected of produced formation water samples during oil
recovery test Leopard core at 4 PV/day injection rate
4.6 Fourth Core Restoration
4.6.1 Bandera brown (BB2-4)
The experiment failed twice. During the first attempt, the core broke after encountering issues
with the confining pressure in the core flood unit that possibly subjected the core to extra high
pressure that led to its breakage. The core was collected and trimmed that resulted in the
reduction of its length from 7.7 to 5.9. Consequently, the pore volume reduced from 22.2 to
17.7 and porosity increased from 25.6 % to 26.7%, when compared with the third restoration.
In the second attempt, the confining pressure punctured the rubber sleeve (Figure 50) due to
the reduced length of the core compared with core holder, causing the DI water to flood into
the core and possibly prematurely produce oil from the core. In addition, according to the
mineral composition of Bandera Brown (Table 1), there is a considerable amount of clay
0.99
1.04
1.09
1.14
1.19
0
2
4
6
8
10
0 1 2 3
Den
sity
(g
/cm
3)
pH
PV Injected
pH
Density

55
minerals. These clay minerals can interact with the water allowing them to swell and damage
the core. An explanation of the results above could be caused by these possibilities.
Figure 50: Longitudinal and cross sections of the punctured rubber sleeve used for BB2-4
The core properties and oil recovery are shown in Table 13. Figure 51 shows the oil recovery
and pressure drop for the second attempt of fourth restoration core flooding experiment.
Table 13: Core properties, volume of oil in place and ultimate oil recovery from high rate
viscous flooding experiment on Bandera Brown using lower viscosity oil at 60°C
Dry Weight (g) 124.13
Saturated Weight (g) 142.02
Target Weight (g) 127.90
Pore Volume (ml) 17.7
Porosity (%) 26.7
Initial Water Saturation 0.18
Oil in Place (ml) 13.8
Ultimate Recovery (%) 12.3

56
Figure 51: Oil recovery and pressure drop versus PV injected for Bandera Brown core by water
flooding using Total 100,000 ppm formation water at 60°C and 4 PV/day injection rate using
different viscosity oil (50-50 marcol and n-heptane mixed by volume mineral oil)
It is clear from the plot that a problem was encountered with BB2-4 causing a very low oil
recovery of 12.3%. Higher oil recovery would have been expected from BB2-4 due to the lower
viscosity of oil used which results in a favorable displacement and better sweep efficiency.
4.6.2 Leopard (LP2-4)
The properties of the core are listed in Table 14. A different trend of pressure drop is observed
in Figure 52. The oil recovery follows a similar behavior as previous experiments (ultimate
recovery was 37.2%). However, an abnormal behavior was observed in the pressure drop data,
where the pressure was continuously increasing up to approximately 330 mbar.
1000
1100
1200
0
20
40
60
0 0.2 0.4 0.6 0.8 1
Oil
rec
over
y %
(O
OIP
)
Pre
ssu
re d
rop
(m
bar
)
PV injected
BB2-4
dP

57
Table 14: Core properties, volume of oil in place and ultimate oil recovery from high rate
viscous flooding experiment on Leopard using lower viscosity oil at 60°C
Dry Weight (g) 175.64
Saturated Weight (g) 193.16
Target Weight (g) 179.33
Pore Volume (ml) 17.3
Porosity (%) 19.9
Initial Water Saturation 0.19
Oil in Place (ml) 14.0
Ultimate Recovery (%) 37.2
Figure 52: Oil recovery and pressure drop versus PV injected for Leopard core by water
flooding using Total 100,000 ppm formation water at 60°C and 4 PV/day injection rate using
different viscosity oil (50-50 marcol and heptane mixed by volume mineral oil)
0
100
200
300
400
0
20
40
60
0 2 4 6 8 10 12
Oil
rec
over
y %
(O
OIP
)
Pre
ssu
re d
rop
(m
bar)
PV injected
LP2-4
dP

58
The density and pH of the produced formation water samples from the fourth restoration
experiment for Leopard are shown in Figure 53. There was no significant change in the
measured parameters.
Figure 53: Density and pH versus PV injected of produced water samples during oil recovery
test at of Leopard core at 4 PV/day injection rate using oil with lower viscosity (50-50 marcol
and n-heptane mixed by volume mineral oil)
0.99
1.04
1.09
1.14
1.19
0
2
4
6
8
10
0 2 4 6 8 10 12
Den
sity
(g
/cm
3)
pH
PV Injected
pH
Density

59
5 DISCUSSION OF RESULTS
5.1 Permeability
The pressure difference was measured after flooding 4 PV of low salinity brine to allow
stabilization of pressure drop. There was no backpressure applied and only one rate was used
(0.1 ml/min). The calculated permeability of BB2 core was 5.9 mD which indicating that it is
a tight core. According to core supplier, the permeability range for for Bandera Brown is about
30 – 45 mD. Whereas permeability range of Leopard cores is about to 1100 – 1300 mD. The
permeability value calculated for LP2 core was around 17.7 mD which is much lower than
expected unlike the case of BB2 where its permeability is not far from the expected range.
However, from the viscous flooding experiments performed on Leopard core (LP2-2 and LP2-
3), it was noticed that the pressure drop is rather low (5 – 15 mbar), signifying that the core has
a high permeability. The effective permeability of the formation water was estimated based on
the pressure drop data and it was found to be around 200 mD. Since the effective permeability
is less than the absolute permeability, the permeability of LP2 must be higher than 200 mD.
Piñerez T et al. (2016) reported water permeability of 294 mD for a Leopard core which further
supports that Leopard core permeability should be higher than the obtained value. Therefore,
it is very likely that the measured permeability for the LP2 core is wrong.
5.2 Initial Wetting
Based on the trends of the results of the spontaneous imbibition experiments (BB2-1 and LP2-
1) in Figure 41, it is concluded that both cores are water-wet, due to the high oil recovery
obtained (40.4% for Bandera Brown and 37.7% for Leopard), and the rapid oil production rate
during the first day.
5.3 Effect of Injection Rate
5.3.1 Bandera Brown
Figure 54 shows the comparison between the oil recovery of BB2-2 and BB2-3. The production
profiles for both experiments confirm that the initial wetting phase is water. As seen in the
Figure, the oil recovery for both second and third restorations was the same.

60
Figure 54: Oil recovery versus PV injected of second and third core restoration viscous
flooding experiments for Bandera Brown
It is observed that there was no effect of changing the velocity on the recovery of oil. The rapid
oil production in the initial stage is mostly attributed to the imbibition of formation water into
the small pores of the core, which highlights the importance of capillary forces. No change in
oil recovery with changing the velocity shows that the effect of viscous forces is minimum. In
other words, the oil recovery is independent of injection rate or velocity. The NCA was
calculated using Equation 16 and they were equal to 8.1 x 10⁻¹¹ and 1.9 x 10⁻¹¹ for BB2-2 and
BB2-3, respectively. This very low NCA supports that the oil recovery is dominant by capillary
forces. The scaling coefficient was also calculated using Equation 17 and it was found equal to
0.13 and 0.03 for BB2-2 and BB2-3, respectively. Rapoport and Leas (1953) stated that the
scaling coefficient must be higher than 1.5 to ensure no capillary end effect, hence the oil
recovery is independent on the injection rate during core flooding experiments. However, the
obtained scaling coefficient for BB2-2 and BB2-3 were lower than 1.5 and there was no
capillary end effect encountered as the recovery was similar at two different injection rates.
Based on these analysis it can be concluded that these correlations are not suitable for
representing water flooding process in heterogeneous sandstone rock sample. Not to mention
the presence of clays.
0
10
20
30
40
50
0 1 2 3 4 5 6
Oil
rec
ov
ery
(%
OO
IP)
PV injected
BB2-2
BB2-3

61
The pressure difference for BB2-2 and BB2-3 is illustrated in Figure 55. The rapid pressure
drop increase in the beginning is caused by the pressure increase when the water is imbibing
from the large pores to the small pores. Usually, the fluid will flow through the easiest path i.e.
large pores. However, the increase in pressure shows that capillary forces are significantly
contributing to the oil recovery.
Figure 55: Pressure drop versus PV injected of second and third core restoration viscous
flooding experiments for Bandera Brown (BB2)
As expected, the pressure drop for the higher rate viscous flooding is higher than the lower rate
experiment. Ideally, four times increase in flow rate would result increasing the pressure drop
by four times, according to Darcy’s law (Equation 2). However, in this case, the pressure drop
was approximately twice as much as in low rate. This difference could be due to the rock
heterogeneity. Not to mention, the clay content of Bandera Brown is 16%. The interactions
between the clays and the water during flooding would further impact the pressure.
0
50
100
150
0 1 2 3 4 5 6
dP
(m
bar)
PV injected
BB2-2
BB2-3

62
5.3.2 Leopard
The oil recovery curves of second and third core restoration experiments (LP2-2 and LP2-3)
exhibits a water wetness behavior, as shown in Figure 56. Unlike BB2, the oil recovery for
LP2-3 was lower than LP2-3. Usually, this trend indicates the presence of an effect of injection
rate on the oil recovery, and consequently, viscous forces. However, the calculated Nca were
6.8 x 10⁻¹¹ and 2 x 10-11 for LP2-2 and LP2-3, respectively, and they suggests that the oil
recovery is dominant by capillary forces.
Figure 56: Oil recovery versus pore volume injected of second restoration (high rate) and third
restoration (low rate) viscous flooding experiments for Leopard at 60°C
However, when analyzing the pressure drop during the oil recovery tests (Figure 57), an
unusual trend is observed. After reducing the injection rate by 4 times in the LP2-3 viscous
flooding, the pressure drop remained the same, rather than decreasing. According to Darcy’s
law (Equation 2), the flow rate is directly proportional to the pressure drop. This could mean
that something occurred to the core between second and third restoration and possibly affected
the core permeability. This is further backed up by the effluent collected during core cleaning
after the LP2-2. The effluent contained fine grains, as shown in Figure 58 and Figure 59. This
means that Leopard outcrop has low consolidation and suffered from fines migration that would
0
10
20
30
40
50
0 1 2 3 4 5 6
Oil
rec
over
y (
% O
OIP
)
PV injected
LP2-2
LP2-3

63
cause some permeability reduction. Another indication is the change in the dry weight core
restoration. Not to mention that Leopard contains 1.2% of smectite which known as a swelling
clay that it would contribute to the permeability reduction.
Figure 57: Pressure drop versus injected pore volume of second and third core restoration
viscous flooding experiments for Leopard
Figure 58: Effluent collected after flooding Leopard core with low salinity brine after second
core restoration viscous flooding experiment
0
2
4
6
8
10
12
14
0 1 2 3 4 5 6
dP
(m
ba
r)
PV injected
LP2-2
LP2-3

64
Figure 59: Effluent collected after flooding Leopard core with low salinity brine after fourth
core restoration viscous flooding experiment

65
5.4 Effect of Oil Viscosity
5.4.1 Leopard
Figure 60 shows the oil produced during second and fourth restoration viscous flooding
experiment. The oil recovery from fourth restoration (37.2%) is lower than that from second
restoration (45.5%).
Figure 60: Oil recovery versus PV injected of second and fourth core restoration viscous
flooding experiments for Leopard core
This observation is unusual because it is expected that the oil recovery would be higher with a
lower viscous oil, at a similar injection rate. A lower viscosity would result in a more favorable
mobility ratio and therefore, better displacement. However, this could further support the
possibility of a reduction in permeability of the core after subsequent restorations. Moreover,
as seen in Figure 61, the pressure drop was continuously building up throughout the experiment
flooding of fourth restoration (LP2-4), after approximately 1 day of being constant, until the
end of the experiment. This abnormal pressure increase shows that there is a blockage in the
core, restricting the fluid from flowing.
0
10
20
30
40
50
0 2 4 6 8 10 12
Oil
rec
over
y (
%O
OIP
)
PV injected
LP2-2
LP2-4

66
Figure 61: Pressure drop versus injected pore volume of second and fourth core restoration
viscous flooding experiments for Leopard
0
100
200
300
400
0 2 4 6 8 10 12
Pre
ssu
re d
rop
(m
bar)
PV injected
LP2-2
LP2-4

67
6 CONCLUSIONS
The objective of the thesis was to investigate the effect of injection rate and oil viscosity on the
oil recovery by waterflooding from two water-wet sandstones (Bandera Brown and leopard)
by performing multiple viscous flooding experiments on the core while changing each
parameter and comparing results. The main conclusive remarks are illustrated as follows:
1. The viscosity of the mineral oil marcol-82 can be modified by mixing it with heptane
in different ratios. It is possible to establish a relationship to predict the viscosity for
any ratios of marcol and heptane. The modified mineral oil did not affect the initial
wetting conditions of the system after a series of core restorations.
2. For Bandera Brown core sample, the oil recovery remained similar after reducing the
injection rate by four times, showing no dependance of injection rate on the oil
recovery. Even though the core had a low permeability, the oil recovery was high. This
observation indicates the importance of capillary forces and its contribution to oil
recovery which is seen to be much higher than the viscous forces, as illustrated by the
pressure data and the capillary number calculations. The pressure data also possibly
imply that the rapid increase in pressure drop is due to the imbibition of the formation
water into the smallest pores.
3. Experimental investigation on Leopard core proved to be challenging due to the nature
and possibly the minerology of the core. Pressure data and effluent containing fines
showed that the core experienced change in properties and behavior between core
restorations, indicating that the core had poor consolidation.
6.1 Future Work
Even though there is continuous research in the field of water flooding in sandstone reservoirs
and reservoir chemistry, there is always room for improvement. The main challenge is the
heterogeneity of the reservoirs and the variety in minerology and composition of oil and
formation water systems. Therefore, it is important to understand and reduce the uncertainties
associated with the rock characteristics and how factors affect the oil recovery.
The main future tasks are described as follows:

68
• Repeating the experimental investigation with more cores, to have clearer conclusive
remarks especially for tests conducted on heterogeneous core samples.
• Progressing in experiments from slow rates to high rates to avoid the possibility of
erosion of core material can establish a better comparison possibility as the core
material is more likely to be preserved during subsequent restorations.
• Determining the permeability of the core at each restoration to ensure consistency and
reliance of results after a series of experiments
• Analyzing and understanding the minerology of the cores and the role of clays and how
they are affected by factors such as flow rate and salinity.

69
7 REFERENCES
Abrams, Albert. 1975. The influence of fluid viscosity, interfacial tension, and flow velocity
on residual oil saturation left by waterflood. Society of Petroleum Engineers Journal
15 (05): 437-447.
Anderson, William. 1986a. Wettability literature survey-part 2: wettability measurement.
Journal of petroleum technology 38 (11): 1246-1262.
Anderson, William G. 1986b. Wettability literature survey-part 1: rock/oil/brine interactions
and the effects of core handling on wettability. Journal of petroleum technology 38
(10): 1,125-1,144.
Anderson, William G. 1987a. Wettability literature survey-part 4: Effects of wettability on
capillary pressure. Journal of petroleum technology 39 (10): 1,283-1,300.
Anderson, William G. 1987b. Wettability literature survey-part 6: the effects of wettability on
waterflooding. Journal of petroleum technology 39 (12): 1,605-1,622.
Anderson, William G. 1987c. Wettability literature survey part 5: The effects of wettability on
relative permeability. Journal of Petroleum Technology 39 (11): 1453-1468.
Arab, Danial, Apostolos Kantzas, Steven L Bryant. 2020. Water flooding of oil reservoirs:
Effect of oil viscosity and injection velocity on the interplay between capillary and
viscous forces. Journal of Petroleum Science and Engineering 186: 106691.
Austad, Tor, Alireza RezaeiDoust, Tina Puntervold. Chemical mechanism of low salinity water
flooding in sandstone reservoirs. Society of Petroleum Engineers.
Bibi, I, J Icenhower, NK Niazi et al. 2016. Clay minerals: structure, chemistry, and significance
in contaminated environments and geological CO2 sequestration. Environmental
materials and waste: 543-567.
Bjorlykke, Knut. 2010. Petroleum geoscience: From sedimentary environments to rock
physics, Springer Science & Business Media (Reprint).
BP. 2020. Statistical Review of World Energy.
Cannon, MR, MR Fenske. 1938. Viscosity measurement. Industrial & Engineering Chemistry
Analytical Edition 10 (6): 297-301.
Chatzis, Ioannis, Norman R Morrow. 1984. Correlation of capillary number relationships for
sandstone. Society of Petroleum Engineers Journal 24 (05): 555-562.
Craig, Forrest F. 1971. The reservoir engineering aspects of waterflooding, Vol. 3, HL Doherty
Memorial Fund of AIME New York (Reprint).
Dake, Laurie P. 2001. The practice of reservoir engineering (revised edition), Elsevier
(Reprint).
Fettke, Charles R. 1938. The Bradford oil field Pennsylvania and New York.
Garcia, Enrique A Reyes, Alyssa LaBlanc, Aaron Beuterbaugh et al. Developments in
sandstone HF acidizing: HF fluid compatible with Na or K brines and carbonate-laden
mineralogy for high temperatures (360 F). Society of Petroleum Engineers.

70
Green, Don W, G Paul Willhite. 1998. Enhanced oil recovery, Vol. 6, Henry L. Doherty
Memorial Fund of AIME, Society of Petroleum Engineers … (Reprint).
Hadley, GF, LL Handy. A theoretical and experimental study of the steady state capillary end
effect. Society of Petroleum Engineers.
Holstein, Edward D, Larry W Lake. 2007. Petroleum Engineering Handbook: Reservoir
Engineering and Petrophysics, Vol. 5, Society of Petroleum Engineers Richardson, TX
(Reprint).
Holtzman, Ran. 2016. Effects of pore-scale disorder on fluid displacement in partially-wettable
porous media. Scientific reports 6 (1): 1-10.
Homsy, George M. 1987. Viscous fingering in porous media. Annual review of fluid mechanics
19 (1): 271-311.
Hook, Jeffrey R. 2003. An introduction to porosity. Petrophysics 44 (03).
Huang, David D, Matt M Honarpour. 1998. Capillary end effects in coreflood calculations.
Journal of Petroleum Science and Engineering 19 (1-2): 103-117.
Johns, Russell T. 2004. Oil Recovery.
Kantzas, A, J Bryan, S Taheri. 2018. Fundamentals of Fluid Flow in Porous Media-Special
Core Analysis & EOR Laboratory: PERM Inc. Retrieved February 2, 2020 (Reprint).
Kokal, Sunil, Abdulaziz Al-Kaabi. 2010. Enhanced oil recovery: challenges & opportunities.
World Petroleum Council: Official Publication 64: 64-69.
Lake, Larry W. 1989. Enhanced oil recovery.
Løvoll, Grunde, Yves Méheust, Knut Jørgen Måløy et al. 2005. Competition of gravity,
capillary and viscous forces during drainage in a two-dimensional porous medium, a
pore scale study. Energy 30 (6): 861-872.
McBride, Earle F. 1963. A classification of common sandstones. Journal of Sedimentary
Research 33 (3): 664-669.
Melrose, JC. 1974. Role of capillary forces in detennining microscopic displacement efficiency
for oil recovery by waterflooding. Journal of Canadian Petroleum Technology 13 (04).
Moghadam, Asefe Mousavi, Mahsa Baghban Salehi. 2019. Enhancing hydrocarbon
productivity via wettability alteration: a review on the application of nanoparticles.
Reviews in Chemical Engineering 35 (4): 531-563.
Moore, TF, RL Slobod. 1956. The effect of viscosity and capillarity on the displacement of oil
by water. Producers Monthly 20 (10): 20-30.
Myers, Drew. 1999. Surfaces, interfaces, and colloids, Vol. 415, Wiley New York (Reprint).
Or, Dani. 2008. Scaling of capillary, gravity and viscous forces affecting flow morphology in
unsaturated porous media. Advances in water resources 31 (9): 1129-1136.
Perkins Jr, FM. 1957. An investigation of the role of capillary forces in laboratory water floods.
Journal of Petroleum Technology 9 (11): 49-51.

71
Peters, Ekwere J, Donald L Flock. 1981. The onset of instability during two-phase immiscible
displacement in porous media. Society of Petroleum Engineers Journal 21 (02): 249-
258.
Piñerez T, Iván D, Tor Austad, Skule Strand et al. Linking low salinity EOR effects in
sandstone to pH, mineral properties and water composition. Society of Petroleum
Engineers.
Purswani, Prakash, Miral S Tawfik, Zuleima T Karpyn. 2017. Factors and mechanisms
governing wettability alteration by chemically tuned waterflooding: a review. Energy
& Fuels 31 (8): 7734-7745.
Rapoport, LA, WJ Leas. 1953. Properties of linear waterfloods. Journal of Petroleum
Technology 5 (05): 139-148.
Richardson, JG, FM Perkins Jr. 1957. A laboratory investigation of the Effect of Rate on
Recovery of Oil by Water Flooding. Transactions of the AIME 210 (01): 114-121.
Satter, Abdus, Ghulam M Iqbal. 2016. Reservoir engineering. Waltham, Ma: Gulf professional
publishing.
Schechter, DS, D Zhou, FM Orr Jr. 1994. Low IFT drainage and imbibition. Journal of
Petroleum Science and Engineering 11 (4): 283-300.
Smil, Vaclav. 2016. Energy transitions: global and national perspectives, ABC-CLIO
(Reprint).
Smith, James T, William M Cobb. 1997. Waterflooding, Midwest Office of the Petroleum
Technology Transfer Council (Reprint).
Standnes, Dag C, Tor Austad. 2000. Wettability alteration in chalk: 2. Mechanism for
wettability alteration from oil-wet to water-wet using surfactants. Journal of Petroleum
Science and Engineering 28 (3): 123-143.
Standnes, Dag C, Tor Austad. 2003. Wettability alteration in carbonates: Interaction between
cationic surfactant and carboxylates as a key factor in wettability alteration from oil-
wet to water-wet conditions. Colloids and Surfaces A: Physicochemical and
Engineering Aspects 216 (1-3): 243-259.
Standnes, Dag C, Leslie AD Nogaret, Hung-Lung Chen et al. 2002. An evaluation of
spontaneous imbibition of water into oil-wet carbonate reservoir cores using a nonionic
and a cationic surfactant. Energy & Fuels 16 (6): 1557-1564.
Weimer, Robert J, RW Tillman. Sandstone reservoirs. Society of Petroleum Engineers.
Willhite, G Paul. 1986. Waterflooding.
Yu, QL. 2019. Application of nanomaterials in alkali-activated materials. In Nanotechnology
in Eco-efficient Construction, 97-121. Elsevier.