Untitled - UiS Brage
61
-
Upload
khangminh22 -
Category
Documents
-
view
0 -
download
0
Transcript of Untitled - UiS Brage


2
Abstract
The modern scientific and technological revolution in the development of hydrocarbon
resources of the World Ocean has led to a paradigm shift in the development of oil and gas fields.
The new paradigm for the development of resources in the Arctic is a new concept of values,
technological and technical solutions aimed at maximizing the growth of capitalization and the return
on the main assets of oil and gas companies in real-time.
Due to the growing interest in the development of hydrocarbon fields on the West Arctic shelf,
the issue of designing ice-resistant hydraulic structures capable of year-round operation in the harsh
conditions of the Arctic is of particular importance. Over the past 50 years, a rich material has been
accumulated on the natural-climatic characteristics of the Pechora Sea in the areas of proposed
production.
The master thesis contains information on the climatic conditions of the Pechora Sea, as well
as the hydrology of the region. Three structures of the North-West license area were selected for
cluster development: Mezhdusharskaya, Kostinosharskaya and Papaninskaya. Of the four proposed
concepts, the most reliable was proposed in terms of technological maturity and minimal risks during
operation. The choice of the platform, as well as the subsea production system of the cluster. The
calculation of the economic profitability of the project was made.
The purpose of this master's thesis:
Development of an economically and ecologically rational scenario for developing a cluster
of hydrocarbon fields (structures) of the Arctic shelf of the Pechora Sea to increase the efficiency of
their industrial development.
The objectives of this work are:
1. Description of natural and climatic features within the water area of the Pechora Sea;
2. Description of fields and prospective structures of the Pechora Sea;
3. Allocation of a group of fields (structures) of the Pechora Sea for the cluster concept of
their development;
4. Selection of facilities for the selected concept;
5. Assessment of economic profitability for the selected concepts;
6. Choosing the most effective concept.

3
Acknowledgements
First of all, I would like to thank my two scientific advisors - professors Yihan Xing and A.B.
Zolotukhin for their help in writing the master's thesis. I believe that their valuable advice and
guidance has contributed to the quality of this work.
I would also like to express my gratitude to Gazpromneft Shelf's company for providing the
necessary data for my dissertation.
Last but not least, I would like to thank my course leader Daniel Karunakaran from Subsea 7.
Thanks to the knowledge gained from the results of his lectures. I used some ideas for calculations in
my work.

4
Content
Abstract….. ................................................................................................................... 2
Acknowledgements ....................................................................................................... 3
List of figures ................................................................................................................ 6
List of tables .................................................................................................................. 8
List of abbreviations ...................................................................................................... 9
Introduction ................................................................................................................. 10
1. Natural and climatic features of the Pechora Sea ................................................... 11
1.1. General information and geographic location................................................... 11
1.2. Hydrological conditions .................................................................................... 11
1.2.1. Currents and tides ................................................................................. 11
1.2.2. Precipitation .......................................................................................... 12
1.2.3. Ice conditions ....................................................................................... 12
1.2.4. Water temperature ................................................................................ 14
2. Oil and gas fields of the Pechora Sea and perspective structures ........................... 17
2.1. Resource potential of the Barents-Pechora region ............................................ 17
2.2. Prirazlomnoye oil field ...................................................................................... 18
2.2.1. Geological and physical characteristics of the field ............................. 19
2.2.2. Production facility layout ..................................................................... 20
2.2.3. Description of the technological process ............................................. 21
2.3. Dolginskoye field .............................................................................................. 23
2.4. Other fields of the Pechora Sea ......................................................................... 25
2.4.1. Varandey-more field ............................................................................ 25
2.4.2. Medynskoye-more field ....................................................................... 25
2.4.3. Severo-Gulyaevskoye field .................................................................. 25
2.4.4. Pomorskoye field .................................................................................. 25
2.5. North-West license block .................................................................................. 25
3. Selecting a scenario for developing fields cluster ................................................... 27
3.1. Selection of a group of fields for arrangement ................................................. 27
3.2. The main types of offshore technical structures for hydrocarbon production .. 28
3.3. The main types of drilling rigs for the Arctic shelf conditions ......................... 29

5
3.4. Choosing a transport system for arctic conditions ............................................ 31
3.5. Cluster development concepts .......................................................................... 32
3.6. Selection of technology for enhanced oil recovery .......................................... 34
3.7. Production profiles ............................................................................................ 35
3.7.1. The production profile at the Mezhdusharskaya structure ................... 36
3.7.2. The production profile at the Kostinosharskaya structure ................... 37
3.7.3. The production profile at the Papaninskaya structure .......................... 37
3.8. Chapter Conclusions ......................................................................................... 38
4. Selection of equipment for arranging the cluster .................................................... 40
4.1. Gravity-based platform ..................................................................................... 40
4.1.1. Calculation of ice loads ........................................................................ 41
4.2. Subsea production systems ............................................................................... 45
4.2.1. Main elements of subsea production systems ...................................... 45
4.2.2. Choosing SPS for arranging a cluster .................................................. 46
4.3. Infield pipelines ................................................................................................. 47
4.3.1. Selection of pipelines installation technology ..................................... 47
4.3.2. Pipeline design ..................................................................................... 47
4.4. Offloading and transportation of oil ................................................................. 52
5. Assessment of the economic profitability of the project ........................................ 54
5.1. Net present value ............................................................................................... 54
5.2. Internal rate of return ........................................................................................ 55
5.3. Profitability index.............................................................................................. 55
5.4. Initial data for calculation and results ............................................................... 55
Conclusion.. ................................................................................................................. 58
References.. ................................................................................................................. 59

6
List of figures
Figure 1. Geographical location of the Barents and Pechora seas .................... 11
Figure 2. Illustration of the sea currents of the Pechora Sea ........................... 12
Figure 3. Average duration of the ice period since the 1982/83 season to the
season 2018/19 and the entire observation period ...................................................... 13
Figure 4. Probabilities of ice propagation of the Pechora Sea in winter and
summer for the period from the second half of XX to the present day ...................... 14
Figure 5. The temperatures of the upper layers of the Pechora Sea in summer 15
Figure 6. The temperatures of the bottom layer of the Pechora Sea in summer
..................................................................................................................................... 16
Figure 7. Residual resources of the Arctic shelf provinces by life cycle, measured
in billions of barrels (the Barents region also includes the Pechora Sea) .................. 17
Figure 8. Time from discovery to launch for selected Arctic projects (fields
currently being developed with an estimated year of commissioning) ..................... 18
Figure 9. The overview map of the Prirazlomnoye field and the installation site
of the Prirazlomnaya IRGBS ...................................................................................... 19
Figure 10. Layout of facilities on the Prirazlomnaya IRGBS ......................... 21
Figure 11. Schematic diagram of oil flow to the Prirazlomnaya IRGBS ......... 22
Figure 12. Map of licensed blocks of the Pechora Sea ..................................... 27
Figure 13. Comparison scheme of local structures within the North-West block
..................................................................................................................................... 28
Figure 14. Four possible concepts for the development of the NWLB cluster..
..................................................................................................................................... 33
Figure 15. Accumulated data on gas injection on the Norwegian continental shelf
..................................................................................................................................... 35
Figure 16. Stages of development of production facilities .............................. 35
Figure 17. The oil production profile of Mezhdusharskaya structure .............. 37
Figure 18. The oil production profile at the Kostinosharskaya structure ......... 37
Figure 19. Oil production profile at the Papaninskaya structure ...................... 38
Figure 20. Fields lifetime .................................................................................. 38
Figure 21. The total oil production profile of the selected structures ............... 39
Figure 22. Scheme of technological processes on the platform ....................... 41
Figure 23. Platform layout ............................................................................... 41
Figure 24. Values of ice loads obtained according to different standards ........ 44
Figure 25. Image of the Christmas tree for SPS .............................................. 45
Figure 26. Manifold and template .................................................................... 46
Figure 27. S-Lay Pipe Configuration ............................................................... 47
Figure 28. Moody diagram ............................................................................... 50

7
Figure 29. The layout of the CUPON offloading system and its constituent
elements ...................................................................................................................... 52
Figure 30. Comparison of indicators of net present value for two scenarios (with
the use of the water-gas impact method and without) ................................................ 57

8
List of tables
Table 1. Physical and chemical properties of oil and associated gas ............... 20
Table 2. Movement of hydrocarbon reserves at the Dolginskoye field ............ 24
Table 3. Prospective oil and gas fields of the North-West license block ......... 26
Table 4. Pros and cons of various types of structures ....................................... 29
Table 5. Major offshore drilling rigs and their suitability for Arctic conditions.
..................................................................................................................................... 30
Table 6. Pros and cons of the two main types of transport systems ................ 31
Table 7. Number of wells for each of the cluster structures ............................. 36
Table 8. Maximum loads on the GBS platforms for the Arctic seas ................ 44
Table 9. Properties of pipes from the American Petroleum Institute (API 5L)
..................................................................................................................................... 48
Table 10. Properties of steel X65 ...................................................................... 48
Table 11. Initial data for calculations ............................................................... 48
Table 12. Initial data for economic calculation ................................................ 55
Table 13. Results of economic calculations for the first and second (WAG)
scenarios ...................................................................................................................... 56

9
List of abbreviations
APG – Associated Petroleum Gas
CAPEX – Capital Expenditures
FPSO – Floating Production, Storage and Offloading
GBS – Gravity Based Structure
IRGBS – Ice-resistant Gravity Based Structure
MPa – Megapascal
NWLB – North-West License Block
OPEX – Operational Expenses
SPS – Subsea Production System
TOE – Tone of Oil Equivalent
WAG – Water-Alternating-Gas

10
Introduction
The Russian Federation possesses a truly huge reserve of natural resources, some of which
are oil and gas. As one of the world's largest oil and gas producing countries, Russia receives
significant revenues from the export of hydrocarbons abroad. Since hydrocarbon reserves on land are
depleted every year, there is a tendency to develop fields on the shelf. According to the revised results
of the quantitative assessment of hydrocarbon resources in 2012, it was found that the reserves of oil,
natural gas, dissolved gas and condensate in the amount of more than 120 billion tons of standard fuel
are concentrated on the shelves of the seas of Russia. At the same time, approximately 80% are
accumulated within the Kara, Okhotsk and Barents (including the Pechora) seas [1]. Thus, in recent
years, the Russian oil and gas industry has been actively entering a new stage in the development of
Arctic shelf fields.
Almost all fields and promising oil and gas structures of the Russian Federation are remote at
a considerable distance from the coastal infrastructure. It is also important to pay attention to the
difficult climate of the region, especially concerning ice conditions. In this regard, the development
of the Arctic fields requires huge capital expenditures for their construction [2]. Nevertheless, the
experience of developing the Prirazlomnoye project has shown a steady demand for Arctic oil of
ARCO grade. This oil is a good feedstock for European refineries with a deep refining cycle. In
addition, the experience of Prirazlomnaya has made it possible to hone offshore oil logistics in the
Arctic region. Therefore, the development of options for cluster arrangement of fields, allowing to
reduce capital and operating costs for the development of oil and gas fields on the continental shelf
of the Russian Federation, is an urgent task for research in this master's work.

11
1. Natural and climatic features of the Pechora Sea
1.1. General information and geographic location
The Pechora Sea is a shallow southeastern coastal part of the Barents Sea. The territory of
Pechora begins from Kolguev Island in the west. It continues up to Vaigach Island in the east and the
southern part of the Novaya Zemlya archipelago in the northeast. In addition, the sea washes the
shores of Russia on the territory of the Nenets Autonomous District and the Arkhangelsk Region. The
bottom of the Pechora Sea is characterized by a calm relief, which is a gentle plain, smoothly plunging
from the south-east to the north-west. Sea depths in the region range from 20 m in the south-east to
150-180 m in the north-west.
The total area of the water area is 81.3 km2; the volume of water is 4380 km³ [3]. Figure 1
shows the location of the Pechora Sea on the map.
Previously, this area of the sea was dry land. It was formed as a result of the melting of a large
glacier. It can explain the fact that the bottom level gradually decreases with distance from the
mainland.
Figure 1. Geographical location of the Barents and Pechora seas
In the vicinity of the Pechora Sea, there are several bays: Ramenka, Pakhancheskaya,
Kolokolkova Bolvanskaya, Khaipudyrskaya and Pechora (the largest of them) [4]. On the adjoining
land there is moss-lichen and shrub tundra. The tundra inhabitants are reindeer, bear, Arctic fox, wolf,
fox, hare, etc. The sea contains valuable commercial fish species [5].
1.2. Hydrological conditions
1.2.1. Currents and tides

12
The currents in the sea area are determined by the sum of the tidal, wind and density
components. The main movement of currents occurs from east to north-west. The maximum speeds
of tidal currents on the surface can reach 0.6 m / s, and wind currents with prolonged winds up to 0.3
- 0.4 m / s. Thus, the maximum speed of the total current can reach 1.2 m / s.
It should also be noted that the Pechora current arises in the summer season. It is formed with
the help of the freshwater runoff of the river of the same name. Cold current Litke refers to cold, ice
from the Kara Sea through the strait located in the south of the Novaya Zemlya archipelago. The
invariability of the above flows depends on the influence of several external factors, therefore they
are also called quasi-constant (Figure 2) [7].
Figure 2. Illustration of the sea currents of the Pechora Sea (blue arrow - warm currents,
orange - cold currents) [7]
The maximum possible for astronomical reasons, the magnitude of tides in the area is 0.7-
0.75 m. The rise in the level due to surges up to 1.8 m, the largest surge - 1 m. The maximum
amplitude of sea level fluctuations can reach 4.2 m [7]
1.2.2. Precipitation
The total amount of precipitation in the sea reaches 550 mm per year. The maximum
precipitation indicator is observed from the end of winter to the beginning of spring, and the minimum
is in August. Fallout of precipitation in winter in the amount of 13 mm / day or more is observed only
5 days a year from December to April. On some days, the maximum daily rainfall can reach 40-50
mm.
1.2.3. Ice conditions

13
The ice regime is formed due to the interaction of the Atlantic and Arctic oceans. For this
reason, one of the main factors determining the state of the ice cover is the variability of weather
conditions in the autumn and winter periods and the heat transfer of water from different parts of the
Barents Sea. In addition, wind activity directly affects the mixing of water and the rate of cooling of
the surface layer. The timing of ice formation also depends on this [8]. Figure 3 shows the average
length of the ice period since the 1982/83 season to the season 2018/19 and for the entire observation
period.
Figure 3. Average duration of the ice period since the 1982/83 season to the season 2018/19
and the entire observation period [8]
The average number of days with ice in the sea area is 240, and the minimum is 160. The
maximum duration of the ice period is 258 days. The regular appearance of ice occurs in the first half
of November, the early appearance of ice - at the end of October. The maximum late date for the
appearance of ice was recorded on January 5. The final clearing of the water area from ice occurs on
average on June 25. Late cleansing is observed in the second decade of July. In abnormally warm
years, ice is absent already at the end of May, and in abnormally cold years, ice remains until August.
In the period from August to October, the Pechora Sea is ice-free. The thickness of ice is on average
50 - 70 cm. During the period of its maximum development, it can reach 120 cm. The average
hummocking is 2 - 3 points, the maximum - 5 points on a five-point scale. The overall height of
hummocks is 1.0–1.5 m; the maximum is up to 4 m. Areas of water with increased hummocking are
located on the edge of the southeastern part of the Pechora Sea and in the area of the Prirazlomnoye
field [7]. The probabilities of ice movement by seasons are shown in Figure 4.

14
Figure 4. Probabilities of ice propagation of the Pechora Sea in winter (a) and summer (b)
for the period from the second half of XX to the present day [8]
Sea vessels begin to ice in October, and icing can continue until May. For October, unhurried
icing is characteristic (less than 1.5 tons of ice per hour) with a probability of 10%. For November -
slow and fast (from 1.7 to 4.5 tons/hour), the probability of rapid icing is quite small and amounts to
5 %. The latter type of icing (more than 4 tons/hour of ice) has a probability of up to 20% and is
dangerous even for large vessels with a displacement of up to 3000 tons.
1.2.4. Water temperature
In summer, the temperature of the near-surface layer of the Pechora water grows everywhere.
The isotherms acquire an orientation that is closest to the latitudinal one. The water temperature on
the surface reaches a maximum of 8-9 ° C. The 0 ° C isotherm occupies the northernmost position in
August at the ice edge. In some years, the maximum summer surface temperature in the Pechora Sea
reaches 16 ° C. In winter, the characteristic values of sea water temperature vary in the range from
minus 1.8 ° С to 0 ° С, in autumn - from 2 ° С to 4 ° С, in spring - from 0 ° С to plus 4 ° С and in
summer - from 5 ° C to 8 ° C. The maximum heating of water is observed in August and some years

15
it can reach 15 ° С, and in the Pechora Bay and other shallow bays - up to 22-23 ° С [7, 8]. The
temperatures of the surface and bottom layers are shown in Figure 5 and Figure 6, respectively.
Figure 5. The temperatures of the upper layers of the Pechora Sea in summer [7]

16
Figure 6. The temperatures of the bottom layer of the Pechora Sea in summer [7]

17
2. Oil and gas fields of the Pechora Sea and perspective structures
2.1. Resource potential of the Barents-Pechora region
The resource potential for the selected region is shown in Figure 7. (It should be noted that in
some literary sources, it is customary to combine the Pechora and the Barents Sea). The selection of
provinces in the chart is based on coastal regions north of the Arctic Circle. It includes some subarctic
provinces, such as Newfoundland-Labrador off the east coast of Canada and the Sea of Okhotsk in
the Russian Far East.
Figure 7. Residual resources of the Arctic shelf provinces by life cycle, measured in billions
of barrels (the Barents region also includes the Pechora Sea) [9]
Some of these provinces are believed to contain significant hydrocarbon reserves. However,
about 80% of this potential has not yet been discovered. It all depends on successful exploration,
which must be proven and justified [9].
To illustrate how Arctic issues affect projects, Figure 8 shows the historical lead times from
discovery to the first production for selected projects in the Arctic provinces. On average, these
projects took over 21 years to develop. By comparison, the last 40 autonomous projects on the
Norwegian Continental Shelf (NCS) have averaged 12 years from discovery to launch.
.

18
Figure 8. Time from discovery to launch for selected Arctic projects (fields currently being
developed with an estimated year of commissioning) [9]
From the course of lectures of Professor Zolotukhin A.B., it follows that the Barents and
Pechora seas have reserves of 31 billion TOE [10]. Thus, the region represents one of the most
promising areas for the development of shelf resources.
As of the beginning of 2021, 5 fields were discovered in the Russian territory of the Barents
Sea:
• 2 gas condensate - Shtokman and Ledovoye
• 3 gas fields - Ludlovskoye, Murmanskoye and Severo-Kildinskoye
Potentially interesting structures are located on the Fersmanovsko-Demidovskoe uplift, the
shafts of Vernadsky, Shatsky, Medvezhye and Admiralteysky [10].
In the article published on the Sherpa Konsult company website, it is said that the potential of
the Pechora Sea could be up to 2.7 billion TOE. This is enough to extract about 760 million tonnes
of oil equivalent between 2014 and 2040. This estimate is rather moderate compared to the data on
hydrocarbon resources published by Belonin and Prishchepa in 2006 (4.9 billion TOE) [11].
Six fields have already been discovered in the Pechora Sea, which will be discussed further.
2.2. Prirazlomnoye oil field
The Prirazlomnoye field is located on the shelf of the Pechora Sea, 60 km north of the village
of Varandey and 320 km north-east of Naryan-Mar. The field was discovered in 1989. The depth
within the field is 19-20 m. Oil reserves are estimated at more than 72 million tons. Maximum
production at the peak of exploitation will amount to 5.5 million tons per year. The main object of
the field is the Prirazlomnaya offshore ice-resistant oil production platform (IRGBS), installed on the
seabed in September 2011. Oil production at the facility began at the end of 2013. The overview map
of the Prirazlomnoye field and the Prirazlomnaya IRGBS installation site is shown in Figure 9 [12].

19
Figure 9. The overview map of the Prirazlomnoye field and the installation site of the
Prirazlomnaya IRGBS [12]
2.2.1. Geological and physical characteristics of the field
Three productive deposits are distinguished in the section of the deposit. Deposit I is an
operational development target with an effective thickness of 38-64 m.
Deposit II is not considered a reservoir with small oil reserves.
Deposit III has an effective thickness of only 6 m.
According to the group hydrocarbon composition, the oil of Deposit I belongs to the methane-
naphthenic type with a weight content (%):
− paraffin 0,14-1,8
− resins 8,70-10,61
− asphaltenes 1,60-3,80
− gas content of oil in the reservoir 40 - 49 м3/т
− viscosity to depth 2462 m – 3,9 mPa∙s
With the accepted oil recovery factor equal to 0.3, recoverable oil reserves in C1 + C2
categories amounted to 72 million tons, incl. in category C1 - 46.0 million tons.
The Central Reserves Committee approved the initial geological reserves of petroleum gas in
categories C1 + C2 of the Ministry of Natural Resources of the Russian Federation in 10.4 billion m3.
When performing predictive calculations of the main indicators of oil production, the
operating ratio of production and injection wells was taken equal to 0.895 for all the years of field
development under consideration [13]. Physical and chemical properties can be found in Table 1.

20
Table 1. Physical and chemical properties of oil and associated gas [13]
Indicator Value
Oil (crude)
Density, g / sm3 0,910 – 0,915
Density, API 24,00 – 23,08
Sulfur, wt% 2,31
Mercaptan sulfur, ppm 64 – 114
Paraffin, % of the mass. 1,78
Freezing point, ºС Minus 48
The beginning of waxing, ºС 22
Asphaltenes (insoluble heptane), wt% 0,85 – 1,61
Asphaltenes (insoluble pentane), wt% 2,90
Dynamic viscosity at 0 ºС, cP 120
Associated gas
Gas factor, m3 / m3 29 – 40
Relative density by air 0,72 – 0,76
Methane, mol% 78 – 80
Hydrogen sulfide, mol% 0,4
Nitrogen, mol% 3,7 – 5,0
Carbon dioxide, mol% 0,75 – 0,77
Density, g / sm3 0,910 – 0,915
2.2.2. Production facility layout
IRGBS is a gravity-type structure and consists of a support base (caisson) and a platform
topside, including a drilling, technological, power complex, a residential module, a helipad and other
systems (Figure 10).
To ensure the protection of the topside from ice impacts and wave loads, the caisson has ice
and wave deflectors built along the platform's perimeter. The total height of the deflectors is 16.4 m.
The platform topside was manufactured using the structures of the Norwegian Hutton TPL
platform.
The main dimensions of the platform:
• overall height - 141 m;
• overall width with the helicopter platform - 144;
• overall length with the platform for the helicopter – 140 [12].

21
Figure 10. Layout of facilities on the Prirazlomnaya IRGBS [13]
2.2.3. Description of the technological process
Technological processes at the IRGBS provide drilling of wells, collection of formation fluid
from wells, refining of oil to a marketable state and transporting it to the caisson storages. Produced
water after preparation through injection wells is injected into the formation. Associated gas is used
for own needs, emergency gas discharges from safety valves and gas discharges during the repair and
maintenance of technological equipment are burned in a flare unit [12].
The schematic diagram of oil flow to the Prirazlomnaya IRGBS is shown in Figure 11.

22
Figure 11. Schematic diagram of oil flow to the Prirazlomnaya IRGBS [14]

23
One of the options for arranging the cluster is joining the Dolginskoye field to the
Prirazlomnaya IRGBS. Technically, such a task is feasible.
Issues to be worked out:
• Compatibility of oils and formation waters;
• Limiting gas factor of the connected fluid;
• Superposition of the peak of production at the Prirazlomnoye field and the start of
production of other objects;
• Large peak excess of associated petroleum gas (APG);
• Volley discharge of hydrocarbons into the high-pressure flare during emergency shutdown
of the technological complex may require a change in its design and an increase in the
height of the flare stack;
• Replacement of the equipment of the drilling complex requires stopping the operation of
the field up to 1.5 years;
• Lack of calculation of weight loads on platform decks from newly installed equipment. It
is required to recalculate the strength of the platform structures and decks, taking into
account the point effect of weight loads.
To solve the tasks at hand, we will need:
• modernization of the IRGBS drilling complex - shutdowns in oil production or later
commissioning of wells will be required;
• modernization of the IRGBS power complex - Installing an additional gas turbine generator
or replacing them with more powerful units;
• modernization of the technological complex of the IRGBS - shutdowns in oil production
will be required for the period of work on the partial replacement of the equipment of the
technological complex with a new one;
• The need for APG utilization of the main development facility;
• Modernization of the reservoir pressure maintenance system [14].
As we can see from the above, solving such a complex problem requires a lot of engineering
calculations and proof of economic benefits. It should be noted that the issue of using the
Prirazlomnaya IRGBS as a production center for groups of fields is not in this master's work.
2.3. Dolginskoye field
That field is located north of Prirazlomnoye, about 80-110 km from Russia's Arctic coast.
Arktikmorneftegazrazvedka company discovered the Dolginskoye field in 1999 during geological
exploration for oil and gas on the shelf. As of 2020, 4 exploration wells have been drilled in the field.
The seabed is characterized by a calm relief - a gentle dip from the south-east to the north-west. Sea
depths in the field range from 22-26 m in the southeast to 40-48 m in the north-west.
At the Dolginskoye field, the oil-bearing capacity was established based on data from the
drilling of two wells: Severo-Dolginskaya-1 and South-Dolginskaya-1, as well as based on seismic
survey conducted in 2006. Based on these data, the oil-bearing capacity of the Lower Permian-
Carboniferous deposits was established, and the oil-bearing capacity of the Upper Permian deposits
is assumed based on the logging data. At first, it was believed that the Dolginskoye field is an oil field
with an insignificant amount of dissolved gas. However, the latest drilling results, in turn, have led to
significant changes in the structure of reserves in favor of gas. For example, in well Severo-
Dolginskaya-3, from the intervals of 3139-3168 m, 3217-3258 m of the Upper Visean-Lower Permian
reservoir, gas inflows with a hydrogen sulfide content up to 22% were obtained.

24
By the end of 2014, drilling of the Severo-Dolginskaya-3 well was completed. An industrial
gas flow was obtained during the testing of formations in the Lower Permian - Carboniferous
sediments. For this reason, the estimation of the reserves of the field has been rethought. Oil recovery
factors for the Dolginskoye field are taken by analogy with the same-age oil deposits in the carbonate
reservoirs of the Prirazlomnoye field [14,15].
The proposed in 2015 model of the geological structure of the Permian-Carboniferous
reservoir assumes the distribution of oil deposits only within the southern tectonic block, in the area
of well South-Dolginskaya-1. In turn, according to the test results, the deposits of the northern block
are considered as gas condensate (without an oil rim) [17].
Thus, it is currently believed that recoverable reserves in the C1 + C2 category for 2017 are
about 82.4 million tons of oil, 41 billion m3 of gas, 11 billion m3 of dissolved gas [16]. A more
detailed table with stocks is given below (Table 2).
Table 2. Movement of hydrocarbon reserves at the Dolginskoye field [17]
Reservoir Reserves
category
stocks as of 01.01.2015
(State balance of
mineral reserves)
Reserves as of
01.01.2017
Change in
recoverable
reserves
relative to the
State balance
of minerals of
the Russian
Federation geological recoverable geological recoverable
thousand
tons/mln
m3
%
Oil, million tons
P2
C1
C2 584 175 98 29.6 -145702 -83
C1 2.9 0.893 4.8 1.4 552 62
C2 198 59 171 51 -82 -14
786 235 274 82.4 -153 -65
Dissolved gas, billion m3
P2 C1
C2 1.9 0.593 1.9 100
P1+C C1 0.997 0.299 0.997 100
C2 35.4 10.62 35.4 100
IN TOTAL 38.4 11.512 38.4 100
Free gas (dry), billion m3
P1+C C1 7.5 7.5 7.5 100
C2 33.7 33.7 33.7 100
IN TOTAL 41.2 41.2 41.2 100

25
Continuation of Table 2.
Condensate, million tons
P1+C C1 1.7 0.85 0.85 100
C2 7.5 3.8 3.8 100
IN TOTAL 9.1 4.7 4.7 100
2.4. Other fields of the Pechora Sea
2.4.1. Varandey-More field
The history of the discovery of this field dates back to 1995 during exploratory drilling.
Varandey-More is located approximately 30 km from the Prirazlomnoye field. In the estimates, the
recoverable oil reserves of the field amount to 5.8 million tons [18].
Within the Varandey-More structure, oil was discovered as part of the Lower Permian-middle
carbonate complex reservoir due to drilling two prospecting wells. The size of the deposit is 19 × 3
km. In terms of physical and chemical properties, the oil of this field is close to the same-age oil of
the Prirazlomnoye field - 903 kg / m3, sulfur content - 2.02%, resins 14.3%, asphaltenes 5.5%,
paraffins 1.44%. [19].
2.4.2. Medynskoye-more field
That oil field was discovered at the end of the last century in the southern part of the Pechora
Sea. It is located 40 km from the village of Varandey. The sea depth within the field reaches 22 m.
Arktikmorneftegazrazvedka discovered the field during oil and gas exploration on the shelf.
The C1 + C2 recoverable oil reserves in the discovered field amount to 95 million tons. [20,21].
2.4.3. Severo-Gulyaevskoye field
The Severo-Gulyaevskoye field is one of the assets of Rosneft. It was discovered in 1986 by
Arktikmorneftegazrazvedka in the course of geological exploration for oil and gas on the shelf. The
sea depth within the field ranges from 10 to 30 m. One well was drilled in the field, in the section of
which two deposits were identified: oil and gas condensate.
The field belongs to the average hydrocarbon reserves - 13 million tons of oil, gas - 52 billion
m3 (C1 + C2) [22,23].
2.4.4. Pomorskoye field
The field was discovered in the southern part of the Pechora Sea in 1985 by
Arktikmorneftegazrazvedka during oil and gas exploration on the shelf. The sea depth within the field
is 20-30 m. One well was drilled at the field, in the section of which the presence of gas condensate
deposits in the carbonate deposits of the Asselian-Sakmarian stage of the Lower Permian was
established.
In terms of hydrocarbon reserves and resources, the Pomorskoye field belongs to the category
of medium-sized fields - 21 billion m3 of gas (in categories C1 + C2) [24].
2.5. North-West license block
The North-West license block (NWLB) is located within the Russian part of the Barents and
Pechora Seas in the vicinity of the Novaya Zemlya archipelago. On the nearest sea coast there is a

26
small village of Varandey, 100 km away, and the city of Naryan-Mar, 200 km away, where a
seaport is located. The nearest discovered field is Dolginskoye.
The license for the right to use the North-West subsoil block was issued to Gazpromneft-
Sakhalin for a period up to 01.10.2044 with the intended purpose and types of work for geological
exploration, exploration and production of hydrocarbons. Localized recoverable oil resources within
the area are estimated according to the Russian D1L category and amount to 273 million tons. Drilling
of prospecting and appraisal wells in this area is planned to begin in 2022-2023. The most promising
structures for industrial development are: Mezhdusharskaya, Papaninskaya and Rakhmanovskaya
group of structures [14,25]. Detailed information on structures is given in Table 3.
Table 3. Prospective oil and gas fields of the North-West license block [25]
Structure name Expected total
geological oil
resources,
million tons
Recoverable
oil resources,
million tons
The amount
of
associated
petroleum
gas, billion
m3
Coordinates Sea
depth,
m Latitude Longitude
Mezhdusharskaya 362.5 108.8 15.7 70.6 52 140-
180
Kostinosharskaya 50.3 15.1 3.07 70.65 52.2 140-
180
Papaninskaya 157.1 44.8 2.1 70.2 53.2 70-80
Rakhmanovskaya 225 67.6 25 69.9 54.7 60
Rakhmanovskaya
- 2
66.7 20 10 69.8 55.5 50
At the Mezhdusharskaya and Kostinosharskaya structures, the oil and gas potential of the
Upper Permian-Triassic deposits is primarily associated with the Lower Triassic, where the presence
of sandy strata with improved reservoir properties is assumed.
In the Papaninskaya area, the oil and gas potential of the Permian-Triassic complex may be
primarily associated with regressive Upper Permian sandstones. They have an areal distribution both
on the Papaninskaya uplift and in the areas of contoured lithological and lithological-stratigraphic
traps and Middle Triassic alluvial sandstones within the Papaninskaya structure [25].

27
3. Selecting a scenario for developing fields cluster
3.1. Selection of a group of fields for arrangement
Figure 12 shows LBs and fields of PJSC Gazpromneft and NK Rosneft.
Figure 12. Map of licensed blocks of the Pechora Sea (yellow - NK Rosneft; blue - PJSC
Gazpromneft) [14]
Since two companies hold licenses for the right to explore and produce hydrocarbons in the
Pechora Sea, it is necessary to consider the zones of influence of these companies in the legal
framework of the Russian Federation (for example, the Law "On Subsoil"). The most promising in
terms of the availability of oil and gas, as well as the relative proximity of the fields to each other, are
the LBs of PJSC Gazpromneft:
1. Prirazlomny license block
2. Dolginsky license block
3. North-West block
The object of research in this work is promising oil fields at the North-West license area,
namely: Mezhdusharskaya, Kostinosharskaya and Papaninskaya structures. The selection is based on
more resources than in the more southerly LB structures. Another important factor when choosing

28
groups of structures is the relatively close distance from each other. We can verify this with the help
of Figure 13.
3.2. The main types of offshore technical structures for hydrocarbon production
It is especially important take into consideration the peculiarities of natural climatic, mining
and geological, hydrometeorological conditions. It is they who determine the choice of the
development method and the corresponding type of marine production.
Modern offshore oil and gas fields are highly mechanized and automated systems for drilling
and operating wells, collecting, preparing and transporting oil and gas to the shore by tankers or using
pipelines. Table 4 summarizes the main pros and cons of various types of designs.
It is known that there are three main solutions for offshore fields using:
• Stationary structures:
- Gravity platforms;
- Artificial islands.
• Floating structures:
- FPSO vessels;
- TLP platforms;
- Semi-submersible platforms;
- SPAR Platforms.
• Subsea production complexes (tied to hub facilities) [26].
Figure 13. Comparison scheme of local structures within the North-West block [14]

29
Table 4. Pros and cons of various types of structures [27]
Pros Cons
1. Artificial islands
• Year-round production;
• Resistance to icebergs;
• "Dry" type of wellhead equipment;
• Large open area.
− Limited water depth;
− Possible lack of building materials;
− Marine spraying by waves;
− Island icing in the harsh regions of the
Arctic;
− Service.
2. Offshore gravity-based structure with vertical walls
• Year-round production;
• Drilling with GBS;
• Storage capacity;
• System of "dry" wellhead equipment;
• Large working area;
• Low wave loads.
− Restriction on water depth;
− Large ice loads can lead to the
destruction of the platform;
− Decommissioning.
3. Offshore gravity-based structure with inclined walls
• Year-round production;
• Drilling with CDP;
• Storage capacity;
• System of "dry" wellhead equipment;
• Large working area;
• Lower ice loads.
− Restriction on water depth;
− Large wave loads;
− Decommissioning.
4. FPSO vessel
• Especially effective in remote or deep-
water areas;
• there is no need to lay main pipelines;
• Storage capacity;
• Removal from service.
− Dependence on ice management;
− Large mooring forces;
− Dependence on storms;
− Higher likelihood of oil spills
compared to GBS platforms.
3.3. The main types of drilling rigs for the Arctic shelf conditions
When drilling in Arctic conditions, the main challenges are the short ice-free period and ice
loads on the rig. For these reasons, not every rig is suitable for the Arctic region.
Table 5 describes the main conventional drilling solutions for developing potential NWLB
fields and considers their suitability for Arctic conditions.

30
Table 5. Major offshore drilling rigs and their suitability for Arctic conditions [28]
A self-elevating or so-called Juck-Up drilling
rig is a mobile drilling rig that can reach the
drilling point by itself or with the help of tugs.
The lifting mechanisms are used mechanical
or hydraulic. In world practice, preference is
given to mechanical lifting mechanisms. This
is due to the simplicity of the design (they are
less difficult to operate) and other factors. This
type of drilling platform is suitable for
working at a water depth of up to 160 m. Jack-
up rigs are a very popular solution for offshore
drilling. However, they are not suitable for
year-round drilling in the Pechora Sea because
they can only operate in non-freezing waters
for approximately 90-120 days during the ice-
free season.
A rig is also often installed on fixed
production platforms and used for drilling
operations. The main advantage of this
solution is the ability to conduct year-round
drilling. The total number of wells that can be
drilled from one platform varies depending on
the reservoir conditions but is usually limited
to 50 wells. Typically, the rig is stationary, but
it can be removed and replaced during
workovers when all planned wells have been
drilled and completed.

31
Continuation of Table 5.
A semi-submersible drilling rig is the most
popular type of offshore drilling unit,
combining the advantages of
drilling at great depths. Such installations are
floating offshore structures with pontoons and
columns, which partially cause the installation
to submerge to a given depth when flooded
with water. The principle of operation is the
same as that of earthed submersible drilling
rigs. The exception is that semi-submersible
platforms are either moored with heavy
anchors weighing more than 10 tons or are
held in place using a dynamic positioning
system. Semi-submersible drilling rigs are
used for drilling at depths from 60 to 2500 m
and more, depending on the platform's age,
type, and technical characteristics. They are
pulled away from the drilling site with the help
of tugboats or by themselves.
3.4. Choosing a transport system for Arctic conditions
There are two main alternative delivery systems for offshore fields to the oil and gas markets:
pipelines and tankers (Table 6). The assessment of technical parameters made it clear that the most
realistic option is a tanker transport system at the initial stage of field development [27].
Pipeline transportation of oil is economically inexpedient for North-West license block, taking
into account the actual timing of field development. For tankers, the system is being considered (or
already adopted) to develop Arctic oil fields.
The peculiarity of the Pechora shelf is that both existing and planned development projects of
oil and gas companies are export-oriented. In general, the development project is focused on the direct
export of oil from offshore oil platforms to markets with or without intermediate transhipment [29].
Table 6. Pros and cons of the two main types of transport systems [29]
Pros Cons
Shipment by oil tankers
• Lower capital costs (CAPEX);
• Easier maintenance.
• Dependence on harsh sea conditions;
• Dependence on ice management;
• Large OPEX due to ice management;
• Prevention of oil spills in ice conditions.
Transportation by offshore pipeline

32
Continuation of Table 6.
• Independence from weather conditions;
• Fast and easy transportation;
• Smaller OPEX.
• Destruction of the pipeline by an
iceberg;
• Prevention of oil spills in ice conditions;
• Complicated service;
• Large capital expenditures (CAPEX).
3.5. Cluster development concepts
The main choice in favor of offshore development is based on a large number of factors. That
is why it is very important to have flexibility of stages in order to achieve the best result with possible
adjustments in the development stages. The following are some of the most significant factors:
•environmental conditions;
• compliance with all environmental and safety requirements;
• feasible technologies with a clear assessment of research and development needs;
• detailed analysis of capital and operating costs, including initial investment, maintenance,
etc. [30].
The most feasible solutions require technical and technological ideas that are appropriate for
a particular area. For offshore development, the following factors must play a decisive role in
choosing the right scenario:
• quantity of reserves (adjusted for oil recovery rate);
• water depth at the site of the field;
• distance from fields to the coast;
• availability of reserves closest to the considered region;
• environmental factors:
➢ presence of ice (icebergs, hummocks, ice windows, etc.)
➢ a seismic factor of the region
➢ waves (maximum wave height, wave period, etc.)
➢ wind loads;
• availability of a sufficient number of technologies;
• means of transportation of hydrocarbons (remoteness from the main sales markets);
• time of emergency response;
• political and economic instability can lead to high investment risks [30,31].
Considering all the above features of the development of offshore hydrocarbons in Russia, the
following concepts (Figure 14) are proposed for the development of the Mezhdusharskaya,
Kostinosharskaya and Papaninskaya structures.

33
Figure 14. Four possible concepts for the development of the NWLB cluster (the map of the
Pechora zone was made using the Google Earth program)
Concept 1. Arrangement using a stationary gravity platform (GBS), resistant to ice and
icebergs, can connect subsea production systems (SPSs). Oil transportation is carried out by tankers.
A similar development project was implemented on the east coast of Canada - the Hebron
platform with a drilling module installed in the Jeanne d'Arc Basin, which implements the concept of
protection from the effects of sea ice and icebergs.
Concept 2. Year-round ice-resistant FPSO. Drilling from a semi-submersible drilling rig.
Unloading from the buoy. Oil transportation is carried out by tankers.
Concept 3. Year-round cylindrical ice-resistant FDPSO (with a drilling complex). The
cylindrical hull FDPSO reduces ice loads when changing the direction of movement of the ice field.
As a result, the frequency of detachments is reduced compared to a detachable FPSO in a ship-type
hull with a turret mooring. The concept was investigated for application in the freezing waters off the
east coast of Canada and was found to be a feasible solution. The ice conditions at the NWLB differ
from the Jeanne d'Arc section.
Concept 4. SPS + Coastal technological facility. Drilling wells from a semi-submersible or
Jack-Up drilling rig. Oil treatment will be carried out on an offshore platform with subsequent
shipment by tankers.

34
As for the concepts mentioned above, the first scenario seems to be the most realistic in terms
of technological maturity and reliability of development in harsh Arctic conditions.
If we talk about the second and third cases, then the FPSO installation is considered a unique
option for the Russian shelf since there was no relevant experience in introducing such a vessel into
Russian projects. However, an important obstacle to the implementation of these projects may be the
sanctions of foreign states. It is impossible not to mention the price of such installations. For example,
the average cost of non-ice resistant vessels is about US $ 700 million [32]. Regarding the arctic
conditions of the NWLB, the FPSO should be designed to withstand ice loads on the hull or be
immediately disconnected from the wells.
In practice, the fourth option may be the longest since all wells will need to be drilled using
mobile rigs, and a short ice-free period (120-130 days at NWLB) will not allow drilling more than 1-
2 wells per year. As a result, there will be a need to attract more drilling rigs. In addition, some
pipelines to the onshore complex are tentatively estimated to be over 60 km. This will require a
significant increase in capital costs and a careful approach to ensuring the reliability of flow. Initially,
flow assurance only covered the analysis and assessment of problems caused by particulate matter in
pipelines but now covers all the risks associated with maintaining flow [43].
At the moment, no prospecting and exploration drilling has been carried out at the license
area, and there is also no information on the physicochemical properties of the oil. For these reasons,
it is necessary to assume that the properties of hydrocarbons are similar in their characteristics and
can be further trained at the same production facility.
In the future, it will be precisely the concept with the use of a GBS platform at
Mezhdusharskaya structure with the alternate connection of the Kostinosharskaya and Papaninskaya
oil structures will be considered.
3.6. Selection of technology for enhanced oil recovery
To date, the efficiency of oil recovery by the main development methods is considered
unsatisfactory, taking into account the consumption of oil products. The average final oil recovery
factor in Russia for various fields is 25-40% (NWLB - 30%). Since the deposits of the selected
structures contain a certain amount of associated petroleum gas, it makes sense to inject water and
gas into the reservoir alternately.
This method will work best if a gas cap is already in the reservoir or reservoirs with good
vertical permeability, ensuring good communication between the injected gas and the oil below it.
Gas injected into the gas cap helps slow the drop in reservoir pressure and aids in displacing oil into
the wellbore, ultimately increasing oil recovery. According to various studies, the Water-Alternating-
Gas (or the so-called WAG-process) injection implementation increases the oil recovery factor by 5-
10% to the waterflooding technology [33]. Another important factor during injection is the lack of
opportunities for gas export or a ban on gas flaring. According to the Ministry of Energy, the number
of fines for excess APG flaring at the end of 2018 reached 405 million rubles. As a result, more than
385 million rubles went to regional budgets. As of 2021, fines are imposed when producers utilize
less than 95% of the associated gas. Therefore, the decision to inject gas into the reservoir contributes
to the reduction of operating costs and significantly increases the ecological situation in the oil-
producing region [34].
Applying the Water-Alternating-Gas method is widely used on the continental shelf of
Norway, England and Denmark. This technology was first introduced in the North Sea in 1991 at the

35
Gullfaks field. The experience of using the water-gas stimulation method with the alternate injection
of a water-gas mixture in Norway is shown in Figure 15.
Figure 15. Accumulated data on gas injection on the Norwegian continental shelf [10]
The data obtained as a result of geological exploration at the NWLB indicate that gas injection
at the selected objects of the clusters is theoretically possible [14].
3.7. Production profiles
Within the framework of offshore projects for the extraction of resources from oil fields, four
main groups of technological stages of development can be distinguished (Figure 16).
Figure 16. Stages of development of production facilities [26]
Stage I - the beginning of production at the field. At this stage, the drilling of the production
facility of the field, the commissioning of production and injection wells takes place. The duration of
this stage on the shelf is 4 to 7 years.

36
Stage II - characterized by maximum oil production and transfer of wells to artificial lift using
centrifugal pumps.
Stage III - at this stage, a sharp drop in the current oil production is noticed, water cut
increases, and the well stock decreases due to water cut. This stage is the most difficult to develop.
The main challenge for engineers is to slow down the decline in oil production. At the third stage, as
a rule, methods of enhanced oil recovery are most often applied.
The first three stages define the main development period.
Stage IV - gradually decreasing rates of oil withdrawal. The water cut of products reaches 90-
95% and more. The cost of oil production during this period increases to the limits of profitability.
This period is the longest.
First, it is necessary to estimate the number of wells for each structure (Table 7). Then, we
need to design production profiles on the selected objects of the cluster. The construction of such
profiles is necessary for the initial selection of technological solutions to develop potential fields. It
should be noted that the obtained oil profiles are only estimates. When constructing them, data from
the website of the Norwegian Oil and Gas Directorate and internal data of the company PJSC
Gazprom Neft Shelf were studied [14,35]. All subsequent production profiles were built using
Microsoft Excel.
Table 7. Number of wells for each of the cluster structures
Mezhdusharskaya structure Production wells 24
Injection wells 12
Kostinosharskaya structure Production wells 4
Injection wells 2
Papaninskaya structure Production wells 12
Injection wells 4
The average gas-liquid mixture flow rate of a production well is 2,100 t/day (similar to the
average flow rate of wells in fields with similar geological characteristics of oil reservoirs). The
figures below show production profiles for each of the three selected cluster structures: with gravity
platform (drilling from platform simultaneously with production) and subsea production system. It
should be noted that for SPS, well construction prior to production will be done with a semi-
submersible drilling rig.
3.7.1. The production profile at the Mezhdusharskaya structure
Figure 17 presents the oil production profile at the Mezhdusharskaya structure. Since this
object contains the largest amount of resources, it is proposed first to introduce this structure into
development. The duration of the development of the structure is 25 years.

37
Figure 17. The oil production profile of Mezhdusharskaya structure
3.7.2. The production profile at the Kostinosharskaya structure
After oil production at the Mezhsharskaya structure drops, it is necessary to connect the
nearest structure to maintain production capacities. It is supposed to produce oil at the
Kostinosharskaya structure with the help of SPS. The oil production profile is shown below (Figure
18). It is planned to develop this object for 10 years.
Figure 18. The oil production profile at the Kostinosharskaya structure
3.7.3. The production profile at the Papaninskaya structure
Figure 19 shows the oil production profile at the Papaninskaya structure. The duration of oil
production at this structure is 15 years.
0
1
2
3
4
5
6
7
8
1 2 3 4 5 6 7 8 9 10 11 12 13 14 15 16 17 18 19 20 21 22 23 24 25
Oil
pro
du
ctio
n p
er y
ear,
mln
to
ns
Year
The oil production profile at the Mezhdusharskaya structure
0
0,5
1
1,5
2
2,5
3
3,5
1 2 3 4 5 6 7 8 9 10
Oil
pro
du
ctio
n p
er y
ear,
mln
to
ns
Year
The oil production profile at the Kostinosharskaya structure

38
Figure 19. Oil production profile at the Papaninskaya structure
3.8. Chapter Conclusions
A concept has been formed to develop a cluster of three structures of the NWLB -
Mezhdusharskaya, Kostinosharskaya and Papaninskaya. The development concept provides for the
following solutions:
• Installation of a stationary gravity platform, resistant to the effects of ice and icebergs, at the
Mezhsharskaya structure;
• Application of subsea production system for oil and associated gas production at the
Kostinosharskaya and Papaninskaya structures;
• Transportation of oil and associated gas to the platform via two-phase pipelines:
➢ Approximate length of the pipeline from Kostinosharskaya to Mezhdusharskaya
structure - 7 km;
➢ The approximate length of the pipeline from the Papaninskaya to the
Mezhdusharskaya structure is 40 km.
• Well fluid preparation will be carried out on the platform. Gas separated from oil will be
used for own needs, as well as injected into the reservoir to increase oil recovery;
• Delivery of oil to the market by tankers.
For a more uniform production profile and avoidance of excessively high annual production
values, it is necessary to bring potential fields into development sequentially. Figure 20 provides
information on putting fields into development; Figure 21 shows the total profile of oil production by
the traditional method and using Water-Alternating-Gas (WAG) technology:
Figure 20. Fields lifetime
0
0,5
1
1,5
2
2,5
3
3,5
4
4,5
5
1 2 3 4 5 6 7 8 9 10 11 12 13 14 15
Oil
pro
du
ctio
n p
er y
ear,
mln
to
ns
Year
The oil production profile at the Papaninskaya structure
1 2 3 4 5 6 7 8 9 10 11 12 13 14 15 16 17 18 19 20 21 22 23 24 25 26 27 28 29 30 31 32 33 34 35
Year
Mezhdusharskaya structure
Papaninskaya structure
Kostinosharskaya structure

39
Figure 21. The total oil production profile of the selected structures
0
1
2
3
4
5
6
7
8
9
1 2 3 4 5 6 7 8 9 10 11 12 13 14 15 16 17 18 19 20 21 22 23 24 25 26 27 28 29 30 31 32 33 34 35Oil
pro
du
ctio
n p
er y
ear
, mln
to
ns
Year
The total oil production profile

40
4. Selection of equipment for arranging the cluster
4.1. Gravity-based platform
The current design issue of GBS is the depth of water at the field. This is directly related to
the capital cost of the potential structure since a lot of building material must be used for
manufacturing. All previous projects of the Russian Arctic shelf were designed for shallower depths.
It is proposed to place the platform on the site of the Mezhdusharskaya structure. The main reasons
for this decision:
• the structure has the largest oil resources;
• a place suitable for further possible connection of other structures.
The existing record for the installation of gravity platforms on the shelf of the Russian
Federation was set in the Sea of Okhotsk as part of the Sakhalin-2 project at a water depth of 49 m
(LUN-A). Regarding the selected site, it is necessary to consider the estimated water depth of 149-
150 meters, measured at the sites of the Mezhdusharskaya structure. In world practice, there are
platforms with a higher height. For example, structures at the Draugen (251 m), Gullfaks (217 m) and
Troll (303 m) fields are being installed in much deeper areas. Platforms at the Statfjord field (150 m)
[36] are an identical example in terms of the depth of installation of the GBS. However, there is no
ice within these fields. This fact greatly simplifies the exploitation of the field.
As of 2021, two platforms have been built in the world, the design of which directly took into
account the iceberg pile scenario and therefore, they can be called “iceberg resistant”. One such
platform, Hibernia, was installed on the northeastern coast of Canada at a depth of 80 m and has a
diameter of about 110 m. Production at the field began in 1997. For example, for Khybernia, the
design case is a collision with an iceberg weighing 1 million tons (in other words, the bulk of such an
iceberg should not even cause structural damage). However, when exposed to an iceberg weighing 5
million tons, the structure may receive non-critical damage with a probable stop of oil production.
However, this will not lead to harm to the health of personnel and the environment [37].
The second example of an iceberg-resistant structure is the relatively new Hebron platform,
installed 32 km from Hibernia at a depth of 92 m. Production began in 2017 [37].
It should be noted that the NWLB region is characterized by the most "favourable" ice
conditions in comparison with the southeastern part of Pechora. The thickness of the ice is on average
50 - 75 cm. During the period of its maximum development, it can reach 120 cm. The average
hummocking is 2 - 3 points, the maximum - 5 points on a five-point scale. The overall height of
hummocks is 1.0–1.5 m. The maximum height is up to 4 m [8].
For the given water depth characteristics, the platform must meet the following requirements:
• weight of the topside - 65,000 tons;
• GBS height - 180 meters;
• width of the superstructure - 183 meters;
• width of the superstructure - 75 meters (without the helicopter deck);
• height of the superstructure - 113 meters;
• Diameter of the column- 35 m;
• oil storage capacity - 165,000 tons;
• well slots - 50 (including spare slots);
• the number of places to stay - 220.
These values have been determined based on analogue platform ratings and are approximate.
The key parameters for comparison are the similarity in water depth and the amount of oil reserves.

41
Figure 22 and Figure 23 show the technological scheme and the proposed view of the
platform.
Figure 22. Scheme of technological processes on the platform
Figure 23. Platform layout [38]
4.1.1. Calculation of ice loads
The Pechora sea are not strong seismically active region. Thus, the most likely dangerous
scenario for the development of events will be the level of ice loads exceeding the calculated values.
Ice load occurs due to the impact of the ice field on the object and depends on the mass, drift speed
42
and characteristics of the ice, as well as the shape of the object and its size. The consequence of
exceeding the ice loads of the maximum values for this project is the platform's shift from the place
of its operation. Therefore, improper design of the platform structure can cause an environmental
disaster. That is why the issue of forecasting ice loads on offshore ice-resistant stationary platforms
is so important.
There are several methods for calculating vertical ice loads on platforms. Below are the
standards for calculating ice fields:
• API RP*2N-95
• ISO 19906:2010 (E)
• STO Gazprom 2-3.7-29-2005
• Elforsk 09:55 [39]
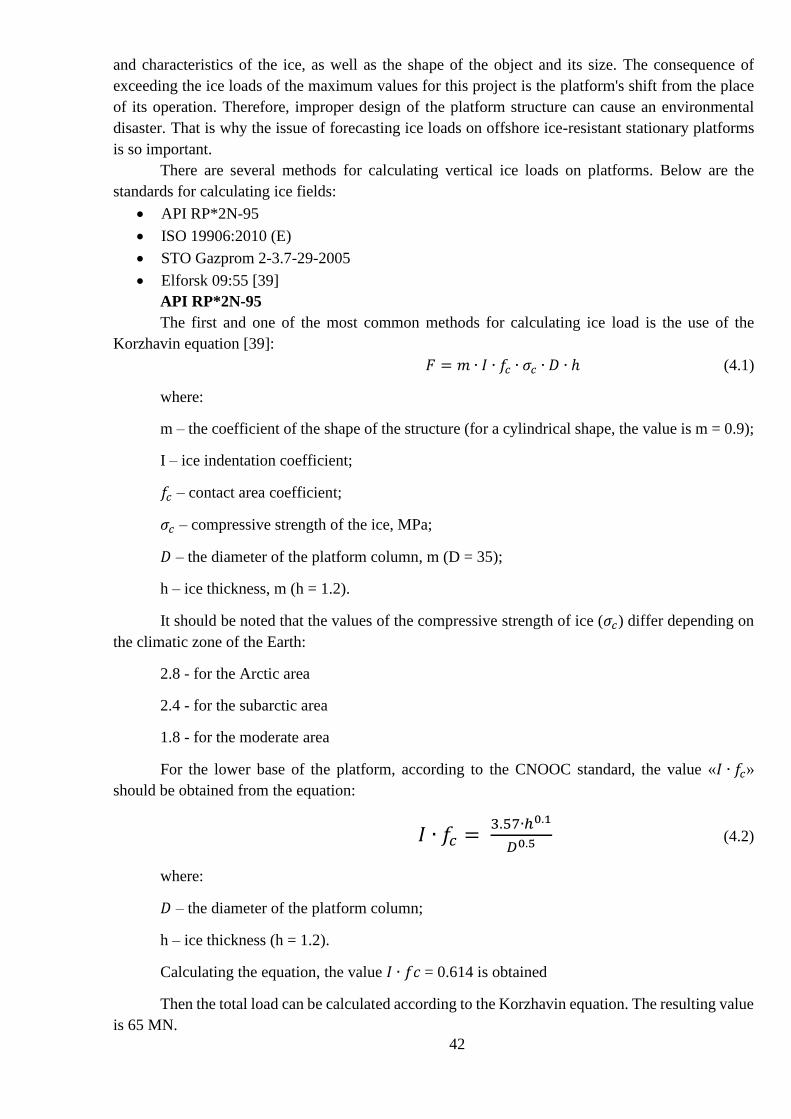
API RP*2N-95
The first and one of the most common methods for calculating ice load is the use of the
Korzhavin equation [39]:
𝐹 = 𝑚 ∙ 𝐼 ∙ 𝑓𝑐 ∙ 𝜎𝑐 ∙ 𝐷 ∙ ℎ (4.1)
where:
m – the coefficient of the shape of the structure (for a cylindrical shape, the value is m = 0.9);
I – ice indentation coefficient;
𝑓𝑐 – contact area coefficient;
𝜎𝑐 – compressive strength of the ice, MPa;
𝐷 – the diameter of the platform column, m (D = 35);
h – ice thickness, m (h = 1.2).
It should be noted that the values of the compressive strength of ice (𝜎𝑐) differ depending on
the climatic zone of the Earth:
2.8 - for the Arctic area
2.4 - for the subarctic area
1.8 - for the moderate area
For the lower base of the platform, according to the CNOOC standard, the value «𝐼 ∙ 𝑓𝑐»
should be obtained from the equation:
𝐼 ∙ 𝑓𝑐 = 3.57∙ℎ0.1
𝐷0.5 (4.2)
where:
𝐷 – the diameter of the platform column;
h – ice thickness (h = 1.2).
Calculating the equation, the value 𝐼 ∙ 𝑓𝑐 = 0.614 is obtained
Then the total load can be calculated according to the Korzhavin equation. The resulting value
is 65 MN.

43
ISO 19906:2010 (E)
Ice load from ice fields can be obtained from the equation in ISO 19906: 2010 (E) [39]:
𝐹 = 𝜎 ∙ 𝑑 ∙ ℎ (4.3)
where:
𝜎𝑐 – ice pressure, MPa;
𝜎 = 𝑅 ∙ (ℎ
ℎ1)
𝑛∙ (
𝑑
ℎ)
𝑚 (4.4)
where:
h1 - thickness taken as 1 m;
m – empirical coefficient, taken equal to (-0.16);
n - empirical coefficient equal to (-0.3);
d - diameter of a column;
R - standard value of ice strength for uniaxial compression, MPa (2.8 MPa for the Pechora
Sea).
Calculation of ice pressure (𝜎) according to (4.3) gives a value of 1.5 MPa. Then Calculation
of the total force (9) gives the value of F equal to 64.9.
STO Gazprom 2-3.7-29-2005
𝐹 = 𝑚 ∙ 𝑘 ∙ 𝑅 ∙ 𝑑 ∙ ℎ (4.5)
where:
m – the coefficient of the shape of the structure (for cylindrical structures it is taken as 0.85);
k – coefficient taking into account the tightness of the contact of the ice formation with the
structure and the effect of ice constraint upon destruction (taken as 0.95);
R – standard value of ice strength for uniaxial compression, MPa (2.8 MPa for the Pechora
Sea);
d - diameter of a column;
h - ice thickness.
The total load can be calculated according to (4.5). Therefore, the F value is 94.9 MN.
Elforsk rapport 09:55
Ice load calculation based on Elforsk report 09:55 [39] can be obtained using the following
equation (if the ratio between ice thickness and column diameter is less than 1):
𝐹 = 0,45 ∙ 𝑑 ∙ ℎ ∙ 𝑅 ∙ √1 + 5 ∙ℎ
𝑑 (4.6)
where;

44
h - ice thickness, m (1.2 m);
d - column diameter, m (130 m);
R - standard value of ice strength for uniaxial compression, MPa (2.8 MPa for the Pechora
Sea.
According to (4.6), the obtained value is 57.2 MN.
Figure 24 shows a comparison of ice loads calculated using the standards listed above:
Figure 24. Values of ice loads obtained according to different standards
According to the data obtained, the greatest load was obtained during calculating the STO
Gazprom 2-3.7-29-2005 standard - 94.9 MN. The smallest value was obtained when calculating by
the Elforsk method - 52.2 MN. The values of the maximum permissible platform loads are shown in
Table 8.
Table 8. Maximum loads on the GBS platforms for the Arctic seas [36]
Load Concrete Concrete
Fy, MN Mx, MN∙m Fx, MN My, MN∙m
Ice * 324 21.004 310.8 19813.8
Waves (irregular,
0.1% of
exceedance)
630 12.932 481.8 10131.3
Wind 0.722 43.36 0.681 40.9
Current 50 1.2 38.7 748
Ice* +wind+cirrent 344.3 22.14 330.1 21602.7
Wave+wind+current 649.3 14.255 521.2 10.92
* Load from adhered ice
65
94,9
64,9
57,2
0 10 20 30 40 50 60 70 80 90 100
API RP*2N-95
STO Gazprom 2-3.7-29-2005
ISO 19906:2010(E)
Elforsk rapport 09:55
Ice
load
s, M
N
Ice load values obtained according to different standards

45
As can be seen from the Table 8, the maximum permissible values of ice loads are much
higher than those obtained in calculations.
4.2. Subsea production systems
The use of subsea technology to extract hydrocarbons from deep-sea waters around the world
continues to grow rapidly. Such systems are usually wells located on the seabed. For oil production,
SPS can be linked to an existing production platform or onshore equipment. An oil well is drilled
with a mobile drilling rig, and the produced oil or natural gas is transported by pipeline and then lifted
to the processing plant. For the first time such technology of underwater pumping of hydrocarbons
was applied in the Gulf of Mexico in the 70s of the last century. In the world today there are already
more than 130 fields using SPS [40].
In Russia, production using SPS technology has been carried out only at the Kirinskoye field
as part of the Sakhalin-3 project. This field is not located in the Arctic Circle, but its operating
conditions are very close to the conditions for hydrocarbon production in the Pechora and Barents
Seas. According to experts, mass production of SPSs in Russia will begin in the mid-20s. The largest
oil and gas companies – Rosneft, Gazprom Neft, Lukoil and Novatek assess the demand for
equipment for subsea production complexes until 2035 as essential [41, 42].
4.2.1. Main elements of subsea production systems
The main elements are:
• Christmas tree;
• Manifold;
• Template.
The heart of a typical subsea production system is the subsea Christmas tree. It performs the
same tasks as valves in onshore fields, but its design is very different. This is due to the significant
loads on equipment caused by currents, waves and hydrostatic pressure. It is possible to remotely
control the Christmas tree using remotely operated crewless underwater vehicles (ROV). Figure 25
shows an image of the Christmas tree.
Figure 25. Image of the Christmas tree for SPS [43]
The following are the functions of the subsea Christmas tree system:
• Providing a protective barrier between the sea and hydrocarbon deposits;

46
• Providing injection of chemicals into a well or flowline;
• Supply of electrical signals to downhole sensors;
• Adjustment of fluid flow through the choke.
• Safe shutdown of produced or injected fluid;
• Control of hydrocarbon production.
A manifold is a special device, the main function of which is to collect oil and gas from several
production wells, as well as to inject an agent to maintain reservoir pressure. All produced products
are delivered to the onshore processing facility or to the platform via subsea pipeline through the
manifold. The size of the manifold is determined based on the data on the number of wells and their
drainage system.
The template is required to protect the manifold and X-mas tree from falling objects, as well
as from environmental influences.
Since the manifold is inserted into the template and can represent a single structure, the
concepts of template and manifold are considered a single whole. Together, they still perform the
functions of collecting and distributing products, as well as protecting against environmental impacts
on the Christmas tree (Figure 26) [43].
Figure 26. Manifold and template [43]
4.2.2. Choosing SPS for arranging a cluster
As mentioned earlier in the previous chapter, the Kostinosharskaya and Papaninskaya
structures are supposed to be developed using SPS. The depth of the sea at the sites varies from 70 to
150 m. Among the two existing development systems, such as the well cluster system and the system
using a template, the second option is considered. This is due to several features of the development
of such a project. First, cluster systems are believed to take longer to install [44]. In this case, a system
with a template collects several well slots inside one structure (standard blocks can include from 4 to
12 well slots [45]). For the ITS system, it should be noted that in harsh climatic conditions, the
installation time of such systems is reduced by combining several wells into a system of one design.
For the development of the Kostinosharskaya structure, it is proposed to use SPS of the
following configuration:
• One 6-slot template for 2 injection and 4 production wells.

47
At the Papaninskaya structure, it is proposed to establish:
• four 4-slot templates for 12 production and 4 injection wells.
4.3. Infield pipelines
4.3.1. Selection of pipelines installation technology
The installation of subsea pipelines is very different from the installation of onshore pipelines.
Overhead pipes are delivered to the site by overland transport (e.g. trailers). Then they are welded,
forming a pipeline, gradually lowered into the trench and covered with bedrock. In traditional subsea
pipelines, pipes are transported to a stacker vessel, which is used as a welder to weld the pipes into a
single string. In contrast to onshore pipelines, lowering the pipeline to the seabed is more difficult
because the bending stress generated in the pipeline is much greater and if not installed correctly, the
pipeline can bend. The lay vessel moves forward as more pipes are welded until all the necessary
pipes are welded. Open water subsea pipelines are subject to the dynamic effects of vessel movement
due to wind, waves and currents. All of these factors add more risks than land installations [46].
Based on the depth of the sea, it is proposed to carry out the S-method of laying the offshore
pipeline at NWLB (from 70 to 150 m) (Figure 27). This method is the most common and is usually
used for pipes up to 60 inches in diameter. A significant advantage is also the operating speed of pipe-
laying, which ranges from 3 to 7 km/day. This is especially important in view of the relatively short
ice-free window in this region.
Figure 27. S-Lay Pipe Configuration [46]
The installation technology is as follows: the pipe on the ship is in a horizontal position.
Then with the help of a special guide structure - a stinger, bending under its weight, it sinks to the
bottom, forming a convex bend. Then, before meeting the seabed, the pipe bends in the opposite
direction, forming a concave curve. The pipe must be under constant tension to prevent damage due
to excessive bending during installation [47].
4.3.2. Pipeline design
Oil pipelines under internal and external pressure were considered. Calculations were
performed according to the selected scheme for the development of NWLB structures (see Chapter
3.5). The diameters shown in Table 9 and other baseline data from Table 10 to 11 were used. In a
specific case, the pipeline was considered from the template at the Kostinoshar structure to the base
platform at the Mezhsharskaya oil structure. Due to the lack of prospecting and exploration drilling
at these structures, information on the reservoir fluid properties was taken from the nearest field,
Dolginskoye. The distance between the Dolginskoye field and the Papaninsky structure is about 100
km.

48
Table 9. Properties of pipes from the American Petroleum Institute (API 5L) [47]
Table 10. Properties of steel X65 [47]
Parameter Value
SMYS 448 MPa
Thermal expansion coefficient of steel 1.17E-5˚C
Poisson's ratio for steel 0.3
Young's modulus of steel 210 GPa
Table 11. Initial data for calculations [17]
Pipe data Value
Nominal pipe diameter, Do 273.1 mm
Nominal wall thickness, tw 9.3 mm
Internal roughness, k 0.05mm
Pipeline length, L 7 km
Flow line pressure 150 bar
Constant operating temperature 60 ˚C
Minimum intake pressure at the top of the
riser on the platform
50 bar
Installation site temperature 5 ˚C
Working data Value
Flow rate, Q 14562 m3/day
Fluid density, p 865 kg/m3
Dynamic viscosity, µ 2.3 ∙ 10-6 Pa ∙ s

49
To begin with, we need to select the required diameter that meets the required conditions for
the receipt of the process. Nominal 10" diameter and initial assumed wall thickness have been
verified. If the pressure drop in the pipeline section is more than 100 bar, it will be necessary to
change the nominal diameter later.
1. The Reynolds number can be obtained in the following way:
𝑅𝑒 =𝑣 ∙ 𝐷𝑖 ∙ 𝑝
µ=
4 ∙ 𝑁 ∙ 𝑝
𝜋 ∙ 𝐷𝑖 ∙ µ=
4 ∙ 4 ∙ 2427 ∙ 865
3.14 ∙ 86400 ∙ 0.2545 ∙ 2.3 ∙ 10−6= 2.12 ∙ 108
where: Q = N ∙ 𝑄 = 𝑁 ∙ 𝑞1𝑤– Volumetric flow rate, m3 / s;
𝑁 – number of wells, 𝑞1𝑤– oil production from one well, m3 / day.
Re > 2300 (turbulent flow).
2. Relative roughness:
𝑟 =𝜀
𝐷𝑖=
0.05
254.5= 1.962 ∙ 10−4
Using the Moody diagram (Figure 28), the Darcy-Weisbach friction coefficient can be found:
f = 0.0135
3. The actual pressure drop has two parts - frictional head loss + static head:
𝛥𝑝 = 𝑓∙𝑝∙𝐿∙𝑣2
2∙𝐷𝑖+ 𝑝 ∙ 𝑔 ∙ ℎ =
0.0135∙865∙7000∙8.452
2∙0.2545+ 865 ∙ 9.81 ∙ 150 = 9.14 MPa
4. The calculations have verified the actual pressure drop to meet the requirements for the
allowable pressure drop:
𝑃𝑖 − 𝛥𝑝 = 𝑃𝑚𝑖𝑛 = 15 – 9.14 = 5.86 (> 5 MPa)
where: 𝑃𝑖 – Wellhead pressure, MPa;
𝑃𝑚𝑖𝑛 – Minimum intake pressure at the top of the riser on the platform, MPa.

50
Figure 28. Moody diagram [47]

51
To check and optimize the pipeline's wall thickness, a design factor of 0.72 should be used.
1. The hoop stress can be found by the formula:
𝑆ℎ =𝑝𝑖𝐷𝑖 − 𝑃𝑂𝐷𝑂
2 ∙ 𝑡 =
15 ∙ 0.2545 − 1025 ∙ 9.81 ∙ 150 ∙ 0.2731
2 ∙ 9.3 = 183.09 𝑀𝑃𝑎
2. For the selected pipe X65 SMYS = 448 MPa.
𝑆𝑀𝑌𝑆 ∙ 𝐷𝑒𝑠𝑖𝑔𝑛 𝑓𝑎𝑐𝑡𝑜𝑟 = 448 ∙ 0.72 = 322 𝑀𝑃𝑎
322 MPa < 183.09 MPa (ok)
It is also necessary to calculate the combined stresses (von Mises criterion). The value of the
calculated coefficient is taken equal to 0.8.
σ𝑒𝑞 = √(σ𝑙2+σℎ
2) − σℎ ∙ σ𝑙
1. Moment of inertia could be calculated via the formula:
𝐽 =𝜋
64∙ (𝐷4 − (𝐷 − 2 ∙ 𝑇)4) =
3.14
64∙ (0.27314 − (0.2731 − 2 ∙ 0.0093)4) = 6.6 ∙ 10−5
2. Bending stress:
σ𝑏𝑒𝑛𝑑𝑖𝑛𝑔 = 𝐷
2∙
𝑀
𝐽=
0.2731
2∙
50 ∙ 103
6.6 ∙ 10−5= 103.14 𝑀𝑁
3. Longitudinal stress:
σ𝑙 = σ𝑎𝑥𝑖𝑎𝑙 ± σ𝑏𝑒𝑛𝑑𝑖𝑛𝑔 = 4 ∙ 𝐹𝑎𝑥𝑖𝑎𝑙
𝜋 ∙ 𝐷2=
4 ∙ 100 ∙ 103
0.27312+ 103.14 = 108.51 𝑀𝑁
4. Hoop stress:
σℎ =𝑝𝑖𝐷𝑖 − 𝑃𝑂𝐷𝑂
2 ∙ 𝑡 =
15 ∙ 0.2545 − 1025 ∙ 9.81 ∙ 150 ∙ 0.2731
2 ∙ 9.3 = 183.09 𝑀𝑃𝑎
5. Von Mises criterion:
σ𝑒𝑞 = √(σ𝑙2+σℎ
2) − σℎ ∙ σ𝑙 = √(108.512 + 183.092) − 183.09 ∙ 108.51 = 159.46 𝑀𝑁
6. Now we need to check the obtained values for convergence:
𝑆𝑀𝑌𝑆 ∙ 𝐷𝑒𝑠𝑖𝑔𝑛 𝑓𝑎𝑐𝑡𝑜𝑟 = 448 ∙ 0.8 = 358.4 𝑚𝑛
𝑆𝑀𝑌𝑆 ∙ 𝐷𝑒𝑠𝑖𝑔𝑛 𝑓𝑎𝑐𝑡𝑜𝑟 > σℎ
358.4 > 159.46 𝑀𝑁
Conclusion by calculation: The wall thickness of 9.3 mm is sufficient to withstand a pressure
drop of 9.14 MPa. Calculations of the hoop and longitudinal stresses, followed by the comparison of
the von Mises criterion, showed that such a wall thickness is sufficient to satisfy the condition.

52
4.4. Offloading and transportation of oil
For offloading oil from the platform, a special device is proposed, the analogs of which are
installed at the Prirazlomnaya (CUPON) IRGBS. This loading technology allows oil to be pumped
onto tankers in almost any difficult weather conditions. A diagram of the Coupon device is shown in
Figure 29.
Figure 29. The layout of the CUPON offloading system and its constituent elements [48]
Complexes of direct oil offloading devices provide contactless mooring and oil offloading on
special shuttle tankers equipped with a bow loading system and a dynamic positioning system [12].
CUPON provides a throughput of up to 10,000 m3 / h, while the pressure at the inlet to the
cargo system of the tanker is not less than 3 bar at the inlet pressure to the CUPON (8.9 ± 0.5) bar
[12].
CUPON equipment includes:
− electro-hydraulic crane (maximum working radius 70 m, swing sector during
operation ± 90 degrees);
− equipment for oil product pipeline;
− device for flushing the oil product pipeline;
− hose transfer equipment;
− shipping hose 2-section (length of each section 12.2 m);
− control and monitoring system of the complex;
− tanker mooring equipment.
The CUPON control and monitoring system is based on a PLC (programmable logic
controller). The system provides control and monitoring of CUPON equipment in all operating
modes.
The control is carried out from the crane cabin. In addition, an operator station and a fire and
gas alarm system panel are located in the cockpit [14].
Based on the expected annual oil production of the cluster and the distance from the platform
to the port of shipment, it is necessary to select a tanker with the following characteristics:

53
Oil tanker Arc6 (deadweight 140,000 tons);
• Number of tankers - 2;
• Draft 18 m;
• Tanker speed in ice - 7 knots (13 km / h);
• Tanker speed in open water - 30 knots (55 km / h);
• Swimming in seas with ice thickness up to 1.4 m.
The tanker mooring system should provide:
− storage and supply of a mooring line (length 80 m, breaking force 5700 kN), antifriction
chain and conductors;
− cable tension control;
− implementation of the emergency release of the mooring line.
An important parameter for shipment is the maximum oil production rate. It was calculated
that this value does not exceed 8 million tons/year (25,000 tons/day). Thus, when using the proposed
tanker, the shipment must be carried out every five days.

54
5. Assessment of the economic profitability of the project
This chapter aims to give a rough estimate of the economic viability of the concept for three
structures. Summarizing all the previous observations, the development should consider the concept
of no gas injection and injection into the reservoir.
A rough estimate of the economic viability is required at the preliminary stages of field
development. A typical offshore project can be divided into three main project cost categories:
• exploration costs;
• operating costs;
• development costs.
To analyze the economic profitability of a project, as a rule, three main calculation parameters
are used:
• Net Present Value (NPV);
• Internal rate of return (IRR);
• Index of profitability (PI).
5.1. Net present value
Before investing money in the implementation of a project, investors analyze its effectiveness
using various indicators. These include net present value (NPV).
NPV is the result of calculations used to determine the present value of the future cash flow.
It takes into account the time value of money and can be used to compare similar investment
alternatives. NPV is based on a discount rate that can be derived from the cost of capital required to
make an investment, and any projects or investments with negative NPV should be avoided. In other
words, a dollar earned in the future will not be worth the same as a dollar earned in the present. The
discount rate element of the NPV formula allows for this.
An important disadvantage of using NPV analysis is that it makes assumptions about future
events that may not be reliable.
NPV is calculated as follows:
𝑁𝑃𝑉 = −𝐼 + ∑𝐶𝐹𝑡
(1+𝑟)𝑡𝑁𝑡=1 (5.1)
where:
𝐼 – initial investment in the project;
𝐶𝐹𝑡 – cash flows;
𝑟 – discount rate.
Main conclusions:
• Net Present Value, is used to calculate the current total value of the future cash flow.
• If the NPV of a project or investment is positive, it means that the discounted present value
of all future cash flows associated with that project or investment will be positive and
therefore attractive.
• To calculate NPV, it is necessary to estimate future cash flows for each period and
determine the correct discount rate.
Depending on the value of this indicator, the investor evaluates the attractiveness of the
project. If:

55
• NPV> 1, then the investment project is profitable. In the end, the investor will make a
profit;
• NPV = 1, then the project will not bring any profit or loss;
• NPV <1, the project is unprofitable and promises losses to the investor [49].
5.2. Internal rate of return
Internal Rate of Return (IRR) is a mathematical and financial formula used to calculate the
discount rate at which a certain cash flow will be equal to zero NPV. In other words, this will be the
profitability of the considered investments.
To determine how the IRR is calculated, the following equation is used:
𝐼𝑅𝑅 = 𝑟1 +𝑁𝑃𝑉(𝑟1)
𝑁𝑃𝑉(𝑟1)−𝑁𝑃𝑉(𝑟2)∙ (𝑟2 − 𝑟1) (5.2)
Where 𝑟 – discount rate [49].
5.3. Profitability index
The profitability index (PI) measures the ratio between the present value of future cash flows
and the initial investment. This parameter is a useful tool for ranking investment projects and
displaying the value created per unit of investment. The profitability index is calculated in the
following way:
𝑃𝐼 = −𝐼 + ∑𝑁𝐶𝐹
𝐼𝑁𝑡=1 (5.3)
Depending on the value obtained, the investor can assess whether the project will be
profitable:
• 𝑃𝐼 < 1, the project is rejected;
• 𝑃𝐼 > 1, the project is accepted;
• 𝑃𝐼 = 1, the project is neutral [49].
5.4. Initial data for calculation and results
In general, it can be considered that the project itself consists of two categories of investments:
capital costs (CAPEX) and operating costs (OPEX). Due to the fact that offshore projects in Russia
are in difficult environmental conditions and political circumstances such as sanctions, the
government is applying tax incentives to develop such fields.
Regarding the development of the selected structures of the North-West license block, one of
the main uncertainties during this project is the amount of hydrocarbon resources. Below, two
scenarios will be compared: with gas injection and without WAG injection. Therefore, the following
costs should be considered, presented in Table 12.
Table 12. Initial data for economic calculation
Indicator The quantity unit of measurement
Maximum annual production 7.5 - 8 mln t/year
Project implementation period 35 years
Investments (CAPEX): 17 - 18 billion $
Oil price 70.0 $/bar.
Continuation of Table 12.
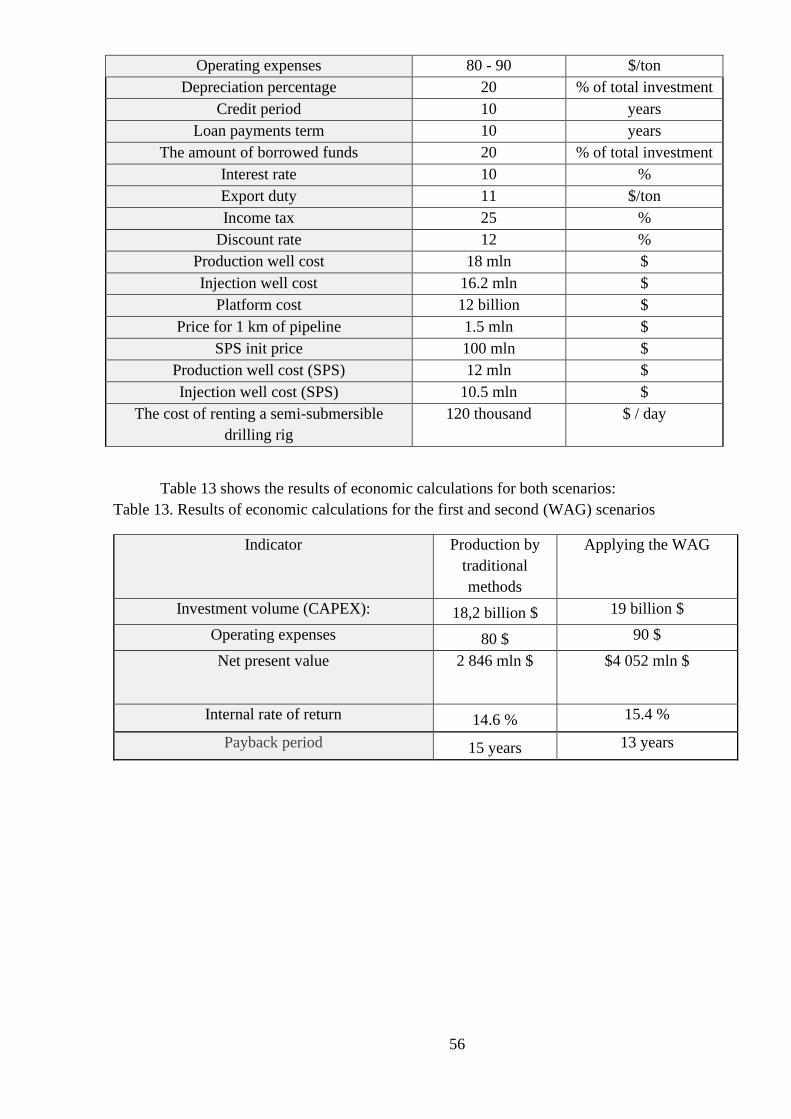
56
Operating expenses 80 - 90 $/ton
Depreciation percentage 20 % of total investment
Credit period 10 years
Loan payments term 10 years
The amount of borrowed funds 20 % of total investment
Interest rate 10 %
Export duty 11 $/ton
Income tax 25 %
Discount rate 12 %
Production well cost 18 mln $
Injection well cost 16.2 mln $
Platform cost 12 billion $
Price for 1 km of pipeline 1.5 mln $
SPS init price 100 mln $
Production well cost (SPS) 12 mln $
Injection well cost (SPS) 10.5 mln $
The cost of renting a semi-submersible
drilling rig
120 thousand $ / day
Table 13 shows the results of economic calculations for both scenarios:
Table 13. Results of economic calculations for the first and second (WAG) scenarios
Indicator Production by
traditional
methods
Applying the WAG
Investment volume (CAPEX): 18,2 billion $ 19 billion $
Operating expenses 80 $ 90 $
Net present value 2 846 mln $
$4 052 mln $
Internal rate of return 14.6 % 15.4 %
Payback period 15 years 13 years

57
The figure shows that the concept using water-alternating-gas injection is the most profitable
from an economic point of view, even despite the large capital costs. That occurs due to an additional
increase in oil production. The growth rate is estimated at 25 million tons.
-$16000000 000
-$14000000 000
-$12000000 000
-$10000000 000
-$8000000 000
-$6000000 000
-$4000000 000
-$2000000 000
$ 0
$2000000 000
$4000000 000
$6000000 000
0 1 2 3 4 5 6 7 8 9 10 11 12 13 14 15 16 17 18 19 20 21 22 23 24 25 26 27 28 29 30 31 32 33 34 35 36 37
Cu
mu
lati
ve c
ash
flo
w, $
Year
Applying the Water-Alternating-Gasmethod
Production bytraditional methods(waterflooding)
Figure 30. Comparison of indicators of Net present value for two scenarios (with the use of the water-
gas impact method and without)

58
Conclusion
The shelf of the Pechora Sea has significant prospects in terms of the extraction of
hydrocarbon resources. An integrated approach using the common infrastructure of the shelf fields
and their successive commissioning leads to the project's economic efficiency. The North-West
license area studied in the framework of the master's thesis has an approved commercial value.
Therefore, prospects for its development in the coming years can be assessed as very high.
For a detailed understanding of this region, climatic conditions, hydrological conditions of the
sea, and characteristics of the seabed were taken into account. The main difficulties that could
potentially affect the development of the NWLB territory were outlined. When developing the
concept, the experience of operating the Prirazlomnoye oil field was taken into account.
Based on the master thesis results, the concept of the development of a cluster of three
structures of the NWLB was selected and preliminarily substantiated: Mezhdusharskaya,
Kostinosharskaya and Papaninskaya. The total recoverable resources are estimated at more than 150
million tons.
The chosen concept includes the following solutions:
• Installation of a stationary gravity platform (GBS), resistant to the effects of ice and icebergs,
at the Mezhdusharskaya structure;
• Application of subsea production complexes (SPS) for oil and associated gas production at
the Kostinosharskaya and Papaninskaya structures;
• Transportation of oil and associated gas to the platform via two-phase pipelines:
➢ Approximate length of the pipeline from Kostinosharskaya to Mezhdusharskaya
structure - 7 km;
➢ The approximate length of the pipeline from the Papaninskaya to the
Mezhdusharskaya structure is 40 km.
• Well fluid preparation will be carried out on the platform. The gas separated from oil will be
used for own needs, as well as injected into the reservoir to increase oil recovery;
• Delivery of oil to the market is carried out by tankers.

59
References
1. D.A. Astafiev, A.V. Tolstikov, L.A. Naumova, M. Yu. Kabalin. Prospects for the
direction of gas oil exploration on the sea shelf of the Russian Federation in the 21st century. An
article from the scientific and technical collection "Vesti gazovoy nauki", 2018, No. 4.
2. О.А. Корниенко. Разработка рациональных методов обустройства УВ
месторождений Арктического шельфа РФ. Москва, 2007 г.
3. Википедия, «Печорское море». Режим доступа:
https://ru.wikipedia.org/wiki/Печорское_море [Accessed: 2 February 2021].
4. Болванская губа // Энциклопедический словарь Брокгауза и Ефрона: в 86 т. (82
т. и 4 доп.). — СПб., 1890—1907.
5. ООО "Газпром нефть шельф", Результаты реализации программы по
сохранению биоразнообразия, Санкт-Петербург, 2018.
6. В.И. Дымов, Г.К. Зубакин, Ю.П. Клеванцов, В.А. Рожков и Е.А. Скутина. Ветер
и волны в Печорском море //Проблемы Арктики и Антарктики. т. 94, № 4–2012. – с. 23-40.
7. ООО "Газпром нефть шельф", Экологический атлас Печорского моря, Санкт-
Петербург: Галлерея Печати, 2018.
8. Тематический отчет №2 по ледовым условиям Печорского моря. Северный
(Арктический) федеральный университет имени М. В. Ломоносова. 2019 г.
9. Jon Marsh Duesund, Senior Project Manager, Rystad Energy. March 2, 2015
Режим доступа: https://www.rystadenergy.com/newsevents/news/press-releases/arctic-
offshore-oil-and-gas-outlook/ [Accessed: 2 February 2021].
10. Zolotukhin A.B. Course of lectures "Development of offshore oil and gas fields"
Moscow, 2020
11. Sherpa Konsult, 2010 Режим доступа: www.sherpakonsult.com [Accessed: 4
February 2021]
12. Приразломное месторождение. Режим доступа:
https://www.gazprom.ru/projects/prirazlomnoye/ [Accessed: 2 February 2021].
13. Никитин Б. А, Хведчук И.И. «Нефтяное месторождение Приразломное на
Арктическом шельфе России». Геология нефти и газа, №2. Москва 1997 г.
14. Internal data of the company PJSC "Gazprom Neft Shelf".
15. «Проект поисково-оценочного бурения по Северо-Долгинской структуре». ООО
«Газпром ВНИИГАЗ», 1998.
16. Симаков А.Е., Заграновская Д.Е. Комбинированный проект поисковых и
разведочных работ на Долгинском лицензионном участке. ООО «Газпромнефть НТЦ», г.
Санкт-Петербург, 2014.
17. «Дополнение к комбинированному проекту поисковых и разведочных работ на
Долгинском лицензионном участке. Разведочные работы в пределах Долгинского
месторождения. 1 этап. Проведение сейсморазведочных работ МОГТ-3D». ООО
«Газпромнефть-Сахалин».
18. Перспективы выявления и разработки газовых, конденсатных и нефтяных
месторождений на шельфе морей России. Всероссийский научно-исследовательский институт
природных газов и газовых технологий. Москва. 1998 г.
19. Медынско-Варандейский лицензионный участок. Статья из журнала Neftegaz.ru
от 23 июня 2013 года.

60
https://neftegaz.ru/tech-library/mestorozhdeniya/141995-medynsko-varandeyskiy-
litsenzionnyy-uchastok/jr/ [Accessed: 15 Март 2021].
20. Основы разработки шельфовых нефтегазовых месторождений и строительство
морских сооружений в Арктике: Учебное пособие/А.Б.Золотухин, О.Т.Гудместад,
А.И.Ермаков и др. – М.:ГУП Изд-во «Нефть и газ» РГУ нефти и газа им.И.М.Губкина, 2000. –
770 с.
21. Neftegaz.ru, «Роснефть провела общественные слушания по лицензионному
участку в Печорском море», ноябрь, 2014. [Интернете]. Режим доступа:
https://neftegaz.ru/news/Geologicalexploration/236455-rosneft-provela-obshchestvennye-
slushaniya-politsenzionnomu-uchastku-v-pechorskom-more/. [Accessed: Марта 15 2021].
22. «Северо-Гуляевское месторождение» Нефтяники. Нефть и газ, [В
Интернете]. Режим доступа:
http://www.nftn.ru/oilfields/offshore/timano_pechorskij_bassejn/severo_guljaevskoe/18-1-0-57.
[Accessed: 12 Март 2021].
23. В.А. Кошелева и Э.И. Сергеева. «Особенности геологии и седиментогенеза на
Южно-Русском лицензионном участке, расположенном в юго-восточной части Баренцева
моря (Печорское море)» в Материалах VII Всероссйского литологического совещания, 2013.
24. «Поморское месторождение,» Нефтяники. Нефть и газ, [В Интернете].
Режим доступа: http://www.nftn.ru/oilfields/offshore/timano_pechorskij_bassejn/pomorskoe/1 8-1-
0-58. [Accessed: 10 Март 2021].
25. Проект поисково-оценочных работ на Северо-Западном участке недр. ООО
«Газпромнефть-Сахалин», 2015 г.
26. Фадеев А.Транспортно-логистические задачи в освоении углеводородных
месторождений Арктики. 2015.
27. Gudmestad, O.T. (2020). Lecture notes in course Marine Operations. University of
Stavanger (published on “It’s learning”). Stavanger. Norway.
28. Zolotukhin, A.B, Gudmestad, O.T., Jarlsby, E.T.: «Oil and gas resources», WIT Press,
Southampton, 2012, pp. 73-77, 153-169
29. Bilalov A. Different scenarious of the oil fields development in the Pechora sea,
Master thesis, Faculty of Science and Technology, University of Stavanger, 2014.
30. Gudmestad, O.T., Alhimenko, A., Løset, S., Shkhinek, K., Tørum,A.And Jensen,A.,
Engineering aspects related to Arctic offshore developments, Student’s Book for Institutes of Higher
Education, pages 24-25, 2007, LAN, St Petersburg.
31. Kurchatov, I.: Comparative analysis of the possible development concepts of the North
Wrangel license area based on Arctic best available technologies, Master thesis, Faculty of Science
and Technology, University of Stavanger, 2018.
32. https://www.investopedia.com/terms/f/fpso-floating-production-storage-and-
offloading.asp
33. Finaev A. C. Analysis of modern technologies of water-gas impact on a productive
reservoir, National Research Tomsk Polytechnic University, Tomsk, 2018.
34. Утилизация ПНГ может подорожать. Режим доступа:
http://neftianka.ru/utilizaciya-png-mozhet-podorozhat/ [Accessed: 20 Апрель 2021].
35. Norwegian Petroleum Directorate, "FACTPAGES," [Online]. Available:
https://factpages.npd.no/en/field/pageview/all/23410947. [Accessed: 20 Апрель 2021].

61
36. Jackson, G., Raine, B., Powell, J., Suwan, S., and Safaqah, O.: Gravity Based
Substructure Solutions for Arctic LNG, International Society of Offshore and Polar Engineers, The
Eighteenth International Offshore and Polar Engineering Conference, Vancouver, Canada 2008.
37. Д.А. Онищенко, В.С. Сафонов. О необходимости учета айсберговой опасности
при обосновании концепции освоения арктических месторождений углеводородов, Научно-
технический сборник, «Вести газовой науки», Москва 2017.
38. Режим доступа: https://www.hebronproject.com/ [Accessed: 2 May 2021].
39. С.Д. Ким, О.М. Финагенов, Т.Э. Уварова. Определение ледовых нагрузок на
сооружения континентального шельфа по нормам различных стран. № 3 (14) / 2013.
40. Subsea production complexes as a promising trend in the development of Arctic fields.
https://magazine.neftegaz.ru/articles/dobycha/505548-podvodnye-dobychnye-kompleksy-kak-
perspektivnyy-trend-v-osvoenii-arkticheskikh-mestorozhdeniy-i-neko/ [Accessed: 10 May 2021].
41. Режим доступа: https://tass.ru/ekonomika/5484592 [Accessed: 2 Апрель 2021].
42. Режим доступа: https://rogtecmagazine.com/russia-aims-test-domestic-subsea-
production-systems-2020/ [Accessed: 26 Апрель 2021].
43. L. Reinås, Lecture notes in course "Subsea Systems"., Stavanger: University of
Stanger, 2020.
44. Bai, Q., Bai, Y.: Subsea Engineering Handbook, Elsevier Science, January 2012,
ISBN: 9780123978042 67.
45. Pribytkov, E. A., Zolotukhin, A. B., and Gudmestad, O. T.: Optimization of Integrated
Template Structures for Arctic Subsea-Production Systems. Oil and Gas Facilities, 3(04), 47–
53.doi:10.2118/166879-pa, 2014
46. Xuexin Dai and Kia Hock Goh, Subsea 7; Eng-Bin Ng, Trend for Offshore Pipeline
Installation Methodologies as a Result of Evolution in the Oil & Gas industry.
47. D. Karunakaran, Lecture notes in course "Pipelines and risers"., Stavanger: University
of Stanger, 2020.
48. E. Subbotin, «Oil offloading solutions for the Pechora Sea exemplified by the
Prirazlomnaya field» Stavanger, 2015.
49. Ид, чдд, внд, точка безубыточности, дисконтный срок окупаемости кап.
вложений Режим доступа: https://lektsii.org/11-58631.html [Accessed: 15 May 2021].