Master's degree thesis - Brage HiM
111
Master’s degree thesis LOG953 Logistics Optimization Model For Drilling Fluid Circulation System: A Case Study From Edvard Grieg Field Authors: Muarif Sana Dar and Mohamed Salaheldin Ibrahim Number of pages including this page: 111 Molde, 23.05.2017
-
Upload
khangminh22 -
Category
Documents
-
view
0 -
download
0
Transcript of Master's degree thesis - Brage HiM
Master’s degree thesis
LOG953 Logistics
Optimization Model For Drilling Fluid Circulation
System: A Case Study From Edvard Grieg Field
Authors: Muarif Sana Dar and Mohamed Salaheldin
Ibrahim
Number of pages including this page: 111
Molde, 23.05.2017

Mandatory statement
Each student is responsible for complying with rules and regulations that relate to
examinations and to academic work in general. The purpose of the mandatory statement is
to make students aware of their responsibility and the consequences of cheating. Failure to
complete the statement does not excuse students from their responsibility.
Please complete the mandatory statement by placing a mark in each box for statements 1-6
below.
1. I/we hereby declare that my/our paper/assignment is my/our own
work, and that I/we have not used other sources or received
other help than mentioned in the paper/assignment.
2. I/we hereby declare that this paper
1. Has not been used in any other exam at another
department/university/university college
2. Is not referring to the work of others without
acknowledgement
3. Is not referring to my/our previous work without
acknowledgement
4. Has acknowledged all sources of literature in the text and in
the list of references
5. Is not a copy, duplicate or transcript of other work
Mark each
box:
1.
2.
3.
4.
5.
3.
I am/we are aware that any breach of the above will be
considered as cheating, and may result in annulment of the
examination and exclusion from all universities and university
colleges in Norway for up to one year, according to the Act
relating to Norwegian Universities and University Colleges,
section 4-7 and 4-8 and Examination regulations section 14 and
15.
4. I am/we are aware that all papers/assignments may be checked
for plagiarism by a software assisted plagiarism check
5. I am/we are aware that Molde University College will handle all
cases of suspected cheating according to prevailing guidelines.
6. I/we are aware of the University College’s rules and regulation
for using sources

Publication agreement
ECTS credits: 30
Supervisor: Bjørnar Aas
Agreement on electronic publication of master thesis
Author(s) have copyright to the thesis, including the exclusive right to publish the document (The
Copyright Act §2).
All theses fulfilling the requirements will be registered and published in Brage HiM, with the approval
of the author(s).
Theses with a confidentiality agreement will not be published.
I/we hereby give Molde University College the right to, free of
charge, make the thesis available for electronic publication: yes no
Is there an agreement of confidentiality? yes no
(A supplementary confidentiality agreement must be filled in)
- If yes: Can the thesis be online published when the
period of confidentiality is expired? yes no
Date: 23.05.2017

i
Standard agreement
Optimization model for drilling fluid circulation system

ii
Supplementary confidential agreement

iii
Preface
In the name of God, the Most Beneficent, the Most Merciful.
﴾And Allah will raise up in ranks those who believed among you and those who have been
given knowledge, Allah is aware of what you do﴿ Surat Al-Mujadila (Ch.58-11)
First of all, praise be to almighty Allah for His welfare, kindness and great mercy. We are
pleased to seize this opportunity to express our gratitude to everyone who supported us
throughout this master thesis project.
This thesis is the mandatory final part of Master of Science in Logistics (Petroleum
Logistics) at Molde University College and represents an independent and extensive
research work, which was carried out from December 2016 to June 2017 under the
guidance of our supervisor Bjørnar Aas.
We would like to express our acknowledgment to Molde University College for giving us
this opportunity to do this research work and providing all materials and facilities. To our
advisor Dr. Bjørnar Aas, we would like to thank you for his support and inspiring guidance
throughout the research. Many thanks to Lundin Norway for giving us the opportunity to
write this thesis, special thanks to the head of drilling and production department Bård
Fjellså.
We would also like to express our deepest gratitude to Eng. Trym Elseth, Eng. Bengt Sola
and Ph.D. student Yury Redutskiy for their truthful and illuminating advice. During their
supervision, we got inspiration and learned academic and professional knowledge.
We would also like thank to our family for what they are doing for us, a lot of things
would have been impossible without their support and encouragement. And we would like
to thank our teachers for making everything understandable and classmates for making this
studying period a memorable.
iv
Executive summary
The significant fall in oil and gas prices has led most oil and gas operating companies to
cut investments in exploration and production (E&P) and fund research and development
(R&D) to improve cost structure. Although drilling fluids count a small fraction of total
drilling cost, it contributes to a significant reduction in total drilling cost.
Maintaining drilling fluids is crucial to the success of drilling operations. When drilling
fluid carry drill cuttings, the solid content raises. Solid control equipment, a mechanical
processing facility, separates solids and maintain the properties of drilling fluid. If solid
equipment does not succeed to keep the solid content less than the maximum allowable
volume, diluting an extra volume of drilling fluid is a must to avoid many costly drilling
problems. One of the main problems with dilution, especially for lengthy sections is
storage space. Storage Space is a luxury offshore and must be managed carefully. In
addition, building excess fluids will cause extra logistic and material costs.
This thesis aims to answer the question how much will increase the efficiency of the
solid control system is going to influence total drilling fluid cost? By influence, we
mean the capacity of the centrifuge to have an effect on total drilling fluid cost. To
approach the research question we used data from four wells at the Edvard Grieg Field,
two were drilled by using the centrifuge and two before installing the centrifuge.
Several methods were applied to answer the research question. Firstly, an event tree
analysis was conducted to understand the role of the centrifuge in reducing dilution
volume and thereby, total drilling fluid cost. Secondly, a qualitative research was
conducted to demonstrate both drilling fluids and logistics activities. Finally, Algebraic
Mathematical Modeling Programing Language (AMPL) was used to optimize the drilling
fluid circulation system in the Edvard Grieg field.
The objective function of this study is to minimize the total system cost. The system cost
analysis equation proposed by Warren and Baltoiu, (2001) was used as starting point to
identify the drilling fluid system components. In order to precisely measure the cost of
offshore logistics, it was necessary to include logistics cost. In addition, the trouble time
v
cost and ROP impact were excluded as calculating these two elements require advance
technical details.
Two computational experiments for the 17 ½ inch section were conducted, with two
different solid build-up rates of 155 and 1055 liters per minute. The findings represent the
optimal operating parameters of the drilling circulation system in order to minimize total
cost. The results show that using the centrifuge is a must when the solid build up rate
exceeds 1000 liters. The use of the centrifuge, in this case, is going to reduce about 1000
liters of drilling fluid.

Contents
Standard agreement ................................................................................................................. i
Supplementary confidential agreement .................................................................................. ii
Preface ................................................................................................................................... iii
Executive summary ............................................................................................................... iv
List of figures ......................................................................................................................... 1
List of tables ........................................................................................................................... 2
List of abbreviations ............................................................................................................... 3
1.0 Introduction ................................................................................................................. 4
Offshore cost structure ................................................................................................. 5
Drilling fluids .............................................................................................................. 6
Offshore upstream logistics ......................................................................................... 6
Lundin petroleum ........................................................................................................ 9
1.4.1 Edvard Grieg field .............................................................................................. 10
Research structure ...................................................................................................... 10
2.0 Research problem and research methodology ........................................................... 12
Problem statement ..................................................................................................... 13
Background and context ............................................................................................ 13
Scope and relevance .................................................................................................. 14
Objective .................................................................................................................... 15
3.0 Methodology ............................................................................................................. 16
Case selection and data collection ............................................................................. 16
3.1.1 Data collection .................................................................................................... 17
Research study progress ............................................................................................ 19
Evaluating the quality of the research methodology ................................................. 22
3.3.1 Research trustworthiness .................................................................................... 22
4.0 Theory ....................................................................................................................... 23
Supply Chain Management (SCM) ........................................................................... 23
Supply chain in petroleum industry ........................................................................... 23
System Cost Analysis (SCA) ..................................................................................... 23
4.3.1 Drilling fluid system cost analysis ..................................................................... 24
Mathematical modelling ............................................................................................ 25
4.4.1 Algebraic Mathematical Programming Language (AMPL) ............................... 25
Event Tree Analysis (ETA) ....................................................................................... 26
5.0 Industrial background: Drilling fluids ....................................................................... 28
Introduction to drilling fluids .................................................................................... 28
Drilling rigs ................................................................................................................ 29
Drilling fluid circulation system ................................................................................ 29
Drilling fluid types ..................................................................................................... 31
5.4.1 Water-based mud ................................................................................................ 31
5.4.2 Oil-based mud .................................................................................................... 32
5.4.3 Mud design at Edvard Grieg field ...................................................................... 32
Solid control equipment ............................................................................................. 33
5.5.1 Shale-shakers ...................................................................................................... 34
5.5.2 Centrifuges ......................................................................................................... 35
Advantages of upgrading the solid control system in the Edvard Grieg field ........... 36
5.6.1 Drilling problems related to solid content .......................................................... 36
5.6.2 Maintaining drilling fluids ................................................................................. 37
5.6.3 Environment concern and mud disposal ............................................................ 37
6.0 Offshore upstream logistics ....................................................................................... 39
Offshore upstream logistics system ........................................................................... 39
Logistics management ............................................................................................... 40
Transportation ............................................................................................................ 40
6.3.1 Transportation cost elements .............................................................................. 41
Loading and unloading .............................................................................................. 43
6.4.1 Key factors ......................................................................................................... 43
Logistic activities in the Edvard Grieg field .............................................................. 44
6.5.1 Loading and unloading of drilling fluids ............................................................ 44
6.5.2 Storing drilling fluids in the Edvard Grieg field ................................................ 45
Transportation cost elements ..................................................................................... 46
6.6.1 Operating cost .................................................................................................... 46
6.6.2 Planning cost ...................................................................................................... 47
6.6.3 Additional cost ................................................................................................... 47
6.6.4 Summary ............................................................................................................ 47
7.0 Preliminary analysis: ................................................................................................. 48
Illustrative case study: ............................................................................................... 48

Data screening ........................................................................................................... 49
7.2.1 Well A1 .............................................................................................................. 49
7.2.2 Well A12 ............................................................................................................ 50
Drilling fluid consumption. ....................................................................................... 51
Event tree analysis ..................................................................................................... 52
8.0 Empirical analysis ..................................................................................................... 54
System description ..................................................................................................... 54
Algorithm description ................................................................................................ 56
8.2.1 Objective function .............................................................................................. 57
Mathematical formulation ......................................................................................... 58
Computational experiment ........................................................................................ 63
9.0 Summary and conclusion .......................................................................................... 67
Limitations and further research ................................................................................ 70
References ............................................................................................................................ 72
Appendix .............................................................................................................................. 77
Appendix 1 ........................................................................................................................... 77
Appendix 2 ........................................................................................................................... 90
Appendix 3 ........................................................................................................................... 91
Appendix 4 ........................................................................................................................... 94
1
List of figures
Figure 1-1 Macro-economic indicators for the petroleum sector, 2016. Source: Norwegian
Petroleum, 2016 (Norwegianpetroleum.no) refers to statistics Norway, Ministry of Finance .. 4
Figure 1-2 Composition of offshore drilling cost structure ........................................................ 5
Figure 1-3 Supply chain of drilling fluids .................................................................................. 7
Figure 1-4 Supply bases in Norway. Source (offshore Norway) ............................................... 8
Figure 1-5 Edvard Grieg field. Source: Norwegian Petroleum Directorate ............................. 10
Figure 2-1 Research problem ................................................................................................... 12
Figure 3-1 Supply chain of drilling fluids ................................................................................ 16
Figure 3-2 Data collection techniques ...................................................................................... 17
Figure 4-1 Supply chain of drilling fluids ................................................................................ 24
Figure 5-1 Drilling rig components .......................................................................................... 29
Figure 5-2 Drilling fluid circulation system. Source: (Williamson, 2013) .............................. 30
Figure 5-3 Drilling fluid types ................................................................................................. 31
Figure 5-4 Drilling fluids per section in the Edvard Grieg Field ............................................. 32
Figure 5-5 Solid control system consisting of shale-shakers and a centrifuge ........................ 33
Figure 5-6 Four sets of shale shaker in the Edvard Grieg field. Source: Lundin Norway AS . 34
Figure 5-7 The centrifuge device in the Edvard Grieg field. Source: Lundin Norway AS...... 35
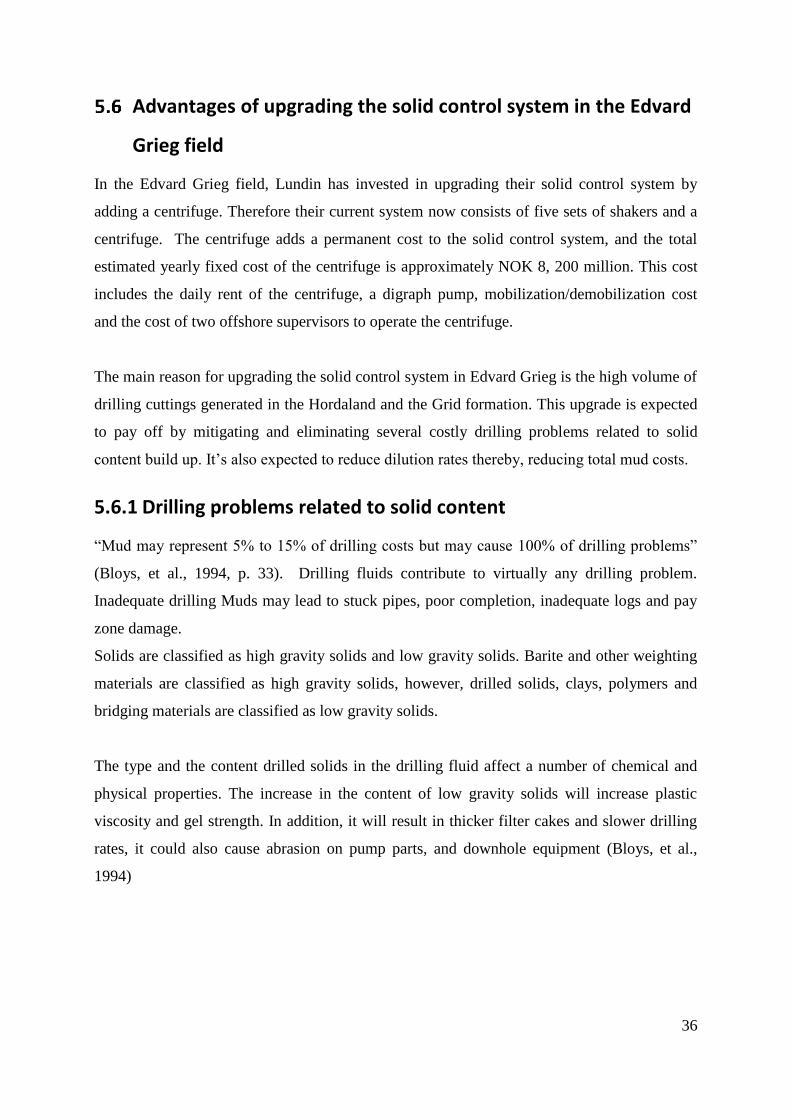
Figure 5-8 Hazardous waste from offshore activities on the Norwegian shelf. Source:
Norwegian Environmental Agency and Norwegian oil and gas Association License: NLOD.
.................................................................................................................................................. 38
Figure 6-1 The flow of cargo to the offshore units .................................................................. 39
Figure 6-2 The Edvard Grieg field. Source: Lundin Norway AS ............................................ 44
Figure 6-3 The loading and unloading of drilling fluids. Source: Lundin Norway AS ........... 45
Figure 6-4 Pit Layout at the Edvard Grieg field. Source: Lundin Norway AS ........................ 46
Figure 7-1 The operating times of centrifuge in well A-01 ..................................................... 49
Figure 7-2 The operating times of centrifuge in well A-12 ..................................................... 50
Figure 7-3 Comparison of drilling fluid consumption ............................................................. 51
Figure 7-4 The event tree analysis for high solid build up ....................................................... 52
Figure 8-1 Drilling fluid circulating system ............................................................................. 54
Figure 8-2 Results of computational experiment 1 .................................................................. 63
Figure 8-3 Results of computational experiment 2 .................................................................. 64

2
Figure 8-4 Dilution rate ............................................................................................................ 66
List of tables
Table 3-1 List of interviews ..................................................................................................... 18
Table 3-2 Study progress .......................................................................................................... 19
Table 6-1 Transportation cost elements in Edvard Grieg field ................................................ 47
Table 7-1 Running hours of centrifuge in well A-01 ............................................................... 50
Table 8-1 Operating parameters of section 17 ½" in the Edvard Grieg field ........................... 55
3
List of abbreviations
AMPL - Algebraic Mathematical Modeling Programing Language
CSCMP – Council of Supply Chain Management Professionals
DDR – Daily Drilling Report
DMR – Daily Mud Report
EOW – End of Waste
ETA – Event Tree Analysis
IRIS – International Research Institute of Stavanger
NCS – Norwegian Continental Shelf
OMV – Osterreichische Mineralölverwaltung
SCA – System Cost Analysis
SCM – Supply Chain Management
SCS – Solid Control System
ROP – Rate of Penetration

4
1.0 Introduction
The history of the petroleum industry in Norway is rather short. In 1969, Ekofisk was the first
significant discovery in the North Sea. Since then, oil and gas have been the most significant
industry in Norway and plays a vital role in the economy of the country. There are more than
50 oil and gas companies involved in the exploration, production and infrastructure
development at the Norwegian Continental Shelf (NCS). The Barents Sea, the Norwegian
Sea, and the North Sea are the main oil and gas production areas of Norwegian Continental
Shelf (NCS). The Barents is the less explored area, it considered to have wide oil and gas
reserves and companies are operating in the area and exploring more reserves (Facts, 2017).
As all operating activities are offshore. Offshore exploration and production is more
expensive than onshore and requires more efficient and effective logistics system (Aas, et al.,
2008a).
The Norwegian petroleum industry plays a vital role in financing the Norwegian welfare and
economy. Figure 1-1 shows the contribution of the petroleum industry in Norwegian economy
in 2016. This percentage is around 40% less than in 2015 because of the lower oil and gas
prices (Norwegianpetroleum.no).
The fall of oil prices affected the Norwegian economy as well as economies of many other
countries around the world in several aspects. This price decline is harmful to the Norwegian
and other oil and gas exporting economies as it results in lower revenues and higher
unemployment rate. On the other hand, it positively effects importing countries and some
industries where it led to lower operating costs.
Figure 1-1 Macro-economic indicators for the petroleum sector, 2016. Source: Norwegian
Petroleum, 2016 (Norwegianpetroleum.no) refers to statistics Norway, Ministry of
Finance

5
Offshore cost structure
As a rule of thumb, drilling offshore wells is more costly than drilling onshore. Efficient and
cost effective offshore logistic planning contributes a lot in reducing total offshore operation
cost (Aas, et al., 2008a).
Between 2000 and 2010, the average cost of an offshore well has increased with about 200%
to 250%. It includes higher rig rates (100%-150%), higher well and completion costs (25%-
50%) and process inefficiencies (50%-75%) (Brun, et al., 2015). This has motivated many
researchers to work in reducing total drilling operating costs. In this paper (Brun, et al., 2015)
refers to an operator in the Gulf of Mexico achieved a 19% reduction in average offshore well
cost by improving procurement and supply chain management.
During the recent crisis in the oil and gas industry in 2014, crude oil prices suddenly fell to
more than half, forcing many oil and gas companies to cut down their investments. Effective
logistics is predicted to contribute to reducing drilling cost. In average, drilling and
completion account for 40% to 50% of the total offshore capital expenditures, however,
drilling and completion cost about 65% of the total onshore well cost (Brun, et al., 2015).
Figure 1-2 illustrates the average cost structure for offshore installation. Rig hire, services,
and logistics are the major contributors to drilling cost structure (Osmundsen, et al., 2010).
Figure 1-2 Composition of offshore drilling cost structure
7 %
34 %
35 %
14 %
10 %
Offshore Drilling Cost Structure
Administration Rig hire Services Logistics Equipment & Materials

6
Drilling fluids
Drilling fluid accounts a small fraction of total system cost. Although drilling fluid represents
an as small portion of the total well cost, the right selection of drilling fluid and properties can
still contribute to minimizing the total well cost by reducing drilling problems (Caenn, et al.,
2011).
There are basically three types of drilling fluids; water based mud, oil based mud and
synthetic based mud (Bloys, et al., 1994). The cost of drilling fluid depends on many factors
including the drilling fluid design and the price of the base fluid. The price of base fluids such
as diesel and water and the accessibility to them varies across geographical location around
the world.
One of the main functions of drilling fluids is to carry drill cutting during drilling to the
surface. To control the solid content of the fluids, a solid control system (SCS) is used. This
system is a set of mechanical separators, separates the solids from the fluid and allows us to
reuse the drilling fluid (Caenn & Chillingar, 1995). The main component of the solid control
system is the shale shaker. In addition to shale shakers, the system can be upgraded by adding
a centrifuge. The centrifuge is used to separate the fine solids, something which extends the
working life of drilling fluid and reduce the probability of solids related problems.
Offshore upstream logistics
Logistics is a process of planning, implementing and controlling all the processes involved in
logistical activities (Choi, et al., 2016). Several actors are involved in the logistics system
including logistics planners, supply bases and supply vessels (Wiig, 2001).
A typical drilling supply chain include different transportation modes and inventory systems,
as illustrated in Figure 1-3. All contributors shown in the below figure are dependent on each
other; improving a part of this supply chain will usually impact other parts and could reduce
the total system cost unless the improvement is not suboptimal (Engh, 2015).

7
The Barents Sea, the Norwegian Sea, and the North Sea are the main oil and gas production
areas of the Norwegian Continental Shelf (NCS), with 78 oil and gas fields (Facts, 2017).
These offshore fields are served from several supply bases as illustrated in Figure 1-4. The
high activities on the supply base makes supply and services the second largest industry in
Norway with more than 1100 companies involved (Facts, 2017). The Barents Sea area is
served by Kirkenesbase, Vardø, Norbase and Polarbase supply bases. The Norwegian Sea is
served by Norbase, Helgelandsbase and Vestbase supply bases. Finally, the North Sea is
served by Tananger, NorSea Dusavik, Stordbase and Fjord Base (Norskolje museum, u.d.).
Purchasing phase
Operation phase
Figure 1-3 Supply chain of drilling fluids
Disposal phase
Operation phase

8
The Main activities at these supply bases include logistics planning, storing of spare parts and
in and outgoing cargo and loading and unloading activities. When a vessel arrives at a supply
base, loading and unloading start immediately. Loading and unloading time is defined as the
time between arrival and departure of a vessel (Aneichyk, 2009). Loading and unloading
process is a time-consuming process. The process of loading and unloading offshore is
usually more time consuming than onshore, the reason is that one vessel serves several
installations in one trip. However, the time of the loading and unloading depends on a number
of factors including the capability of the vessel and installation. (Aas, et al., 2009).
The schedule of the supply vessels is mainly done on weekly basis (Maisiuk & Gribkovskaia,
2014). The daily rent of supply vessels is the main cost element in the offshore logistics. A
good vessel management should aim to reach a high utilization factor and minimum loading
Figure 1-4 Supply bases in Norway. Source (offshore Norway)

9
and unloading times. The important of quick and efficient loading and unloading process
increases as the trip includes more installation. (Drift & Weeke, 2015).
Lundin petroleum
Lundin Petroleum is an independent Swedish company, working in oil and gas exploration
and production industry with a prime focus on operations in Norway. In addition to Norway,
Lundin operates internationally in Russia, Malaysia, France, and Netherlands. Lundin Norway
AS was established in 2004 and predominantly managed by Norwegians to carry out oil and
gas operating activities in the Norwegian Continental Shelf (NCS). The head quarter of
Lundin Norway AS is located in Lysaker, Oslo while the Northern Norway office is in
Harstad. There are approximately 300 full-time employees working in Lundin Norway.
(Lundin, 2017). Lundin Norway AS is operating in the following areas of the Norwegian
Continental Shelf (NSC):
Barents Sea: In 2013/2014 significant oil discoveries were announced in this area.
This area is the less explored on the NCS and yet expected to hold vast quantities of
oil and gas resources.
Central North Sea: Most of the company`s production is from this area consisting of
the fields such as Edvard Grieg, Luno South and Luno II in this area. Furthermore,
Lundin holds the owner interests of other fields, Alvheim, Volund, and Bøyla.
Northern North Sea: Lundin Norway AS is the owner for four licenses in this area.
In addition, the company holds owner interest in four other licenses.
Norwegian Sea: Lundin Norway is the operator of two exploration licenses in this
area and license partner in the five additional licenses.
Southern North Sea: Lundin Norway is operating several exploration and production
licenses in this area.
The focus of the company is to explore the hydrocarbons in the three core areas of Norwegian
Continental Shelf, the North Sea, the Norwegian Sea and the Barents Sea and prioritize the
exploration in areas with shallow depths less than 500 meters.

10
1.4.1 Edvard Grieg field
Lundin Norway has drilled more than 80 exploration and appraisal wells during the last
decade including the Edvard Grieg field, see Figure 1-5 (Lundin, 2017)
Edvard Grieg is a giant oil field, discovered in 2007 by Lundin Norway AS. The field is
located in block 16/1 of the North Sea area. The owners of the field`s license are Lundin
Norway AS 50%, OMV Norge 20%, Wintershall 15% and Statoil 15%. The field includes 11
production wells and 4 water injection wells. (Lundin, 2017)
Research structure
Chapter 2.0 of this study pursues the research problem and research methodology. The main
purpose of this chapter is to describe the research problem, the research tasks and the
objective of the study.
The methodology of this study is described in chapter 3.0. This chapter also includes the
techniques of data collection and research study progress.
Chapter 4.0 is devoted to the literature review. This chapter includes several theories; supply
chain management, system cost analysis, mathematical modeling and event tree analysis.
Figure 1-5 Edvard Grieg field. Source: Norwegian Petroleum Directorate

11
Chapter 5.0 of this study include a qualitative study about drilling rig components, drilling
fluid circulating system, solid control equipment, drilling fluid types and functions. It also
includes information, data, and pictures from our case study: Edvard Grieg Field, Norway.
Lundin petroleum, the operator of Edvard Grieg is the provider of all the information related
to the Edvard Grieg field.
Chapter 6.0 of this study include a qualitative study about offshore upstream logistics
activities. It discusses logistics management, transportation, loading unloading and drill
cutting disposal activities. It also includes information, data, and pictures from our case study:
Edvard Grieg Field, Lundin Norway AS. The collected information allowed us to identify the
cost elements of transporting drilling fluids and describe the loading and unloading activities
in Edvard Grieg.
Chapter 7.0 and 8.0 of this study are the preliminary and empirical analysis, these chapters are
carried out to answer the main research question of this study. These chapters include an
illustrative case-study, Event tree analysis, data screening and the empirical experiments.
Finally, chapter 9.0 concludes the research, the first part of this chapter summarizes our
findings. The second part is dedicated to the limitations and recommendations for further
studies.
12
2.0 Research problem and research methodology
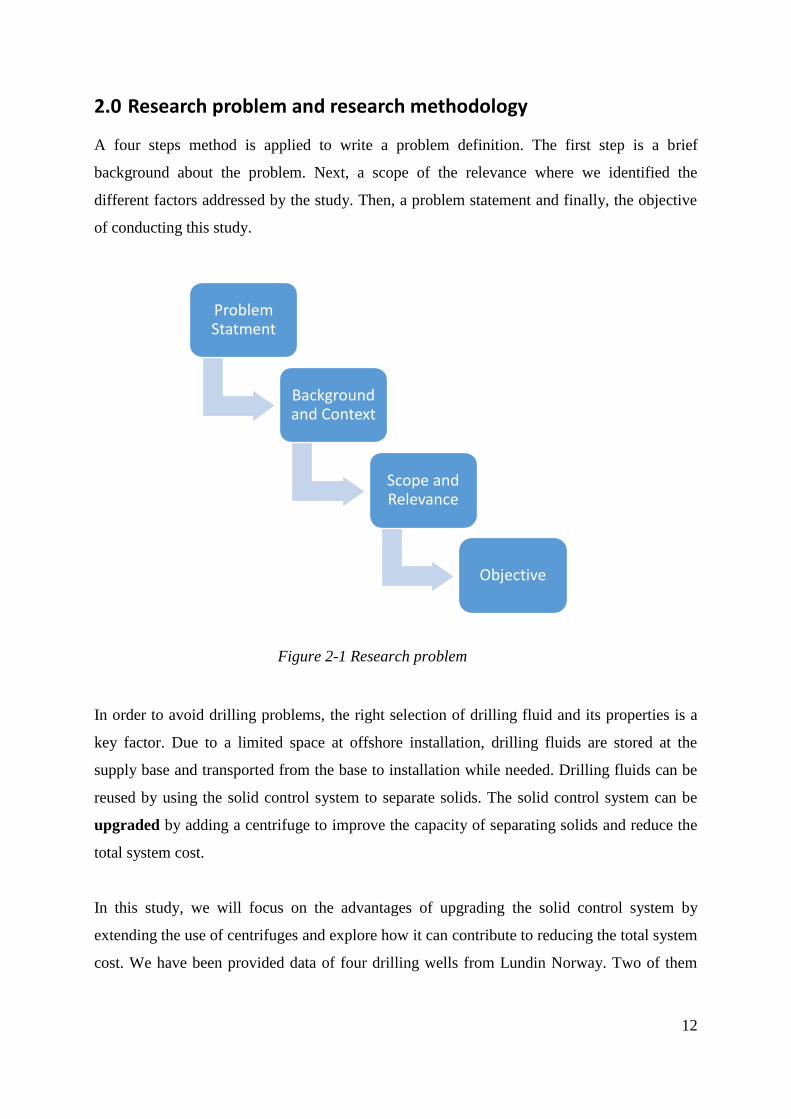
A four steps method is applied to write a problem definition. The first step is a brief
background about the problem. Next, a scope of the relevance where we identified the
different factors addressed by the study. Then, a problem statement and finally, the objective
of conducting this study.
In order to avoid drilling problems, the right selection of drilling fluid and its properties is a
key factor. Due to a limited space at offshore installation, drilling fluids are stored at the
supply base and transported from the base to installation while needed. Drilling fluids can be
reused by using the solid control system to separate solids. The solid control system can be
upgraded by adding a centrifuge to improve the capacity of separating solids and reduce the
total system cost.
In this study, we will focus on the advantages of upgrading the solid control system by
extending the use of centrifuges and explore how it can contribute to reducing the total system
cost. We have been provided data of four drilling wells from Lundin Norway. Two of them
Problem Statment
Background and Context
Scope and Relevance
Objective
Figure 2-1 Research problem

13
were drilled with an upgraded solid control system and the other two wells drilled with a
system consists of shale-shakers only. This will provide the data basis for our analysis.
Problem statement
How is this upgrade in the solid control system going to influence total drilling fluid
cost? The Centrifuge is a mechanical separation device use to separate fine solids from
drilling fluids. Reducing the solid content produces high-quality drilling fluid with good
physical and chemical properties. Changes in these properties can be harmful as it can cause
well stability related problems such as a stuck pipe. The centrifuge has been used recently in
the Edvard Grieg field to process high solid build up rates caused by the caving problem.
Caving problem is a partial collapse of the well-hole walls and it generates a high volume of
solids. In addition to solving this problem, the centrifuge is expected to contribute in
eliminating high solids build up related problems and reduce the total drilling system cost by
reducing both purchasing and logistic costs.
However, there are several limitations to using the centrifuge such as limited fluid processing
capacity, high operation cost and ability to operate in clay formation. Centrifuges have limited
processing capacity of about 25% of total active drilling fluid system, the practical parameters
in the Edvard Grieg show that the centrifuge can process up to 400 liters per minute which
account for less than 8% of total active drilling fluid system. The cost of installing and
operating the centrifuge at the Edvard Grieg is about NOK 8 million, this high cost and the
limited processing efficiency in clay formation are also among the limitations. (Bouse, 2005)
Background and context
The volume of drilling fluid consumption contributes significantly to the total well cost.
Optimizing the consumption of fluids will minimize fluid purchasing cost, generated drill
cuttings from a solid control system, disposal and waste volume and the associated logistics
activities.
In the last few years, the environment awareness increases as the total volume of hazardous
waste generated on the Norwegian continental shelf jumped to 465 000 tons. Wastes from
Drilling accounts for more than 80% of total waste, “this is largely due to the difficulties the

14
industry has experienced in injecting drill cuttings into the underground on several fields on
the Norwegian continental shelf”. (EnvironmentalNorwegianAgency, 2017)
"In fact, the research design is the conceptual structure within which research is conducted; it
constitutes the blueprint for the collection, measurement, and analysis of data." (Kothari,
2004, p. 31). In this research, different tasks are conducted to reach the concluding part. The
first task aims to identify all logistic activities associated with drilling fluids in the Edvard
Grieg Field. In this task, a qualitative discussion of the logistics activities and the cost
elements of planning, transporting and loading unloading of drilling fluids in Edvard Grieg
was determined. The second task aims to introduce the upgrade of the solid control system in
Edvard Grieg field. In this part, a qualitative study about “drilling fluid circulating system”
was conducted. It includes the components of the drilling fluid circulating system, the solid
control systems, types and functions of drilling fluids. Finally, how much of drilling fluid
consumption can be reduced by using the centrifuge? The third task is to build a mathematical
optimization model, coded by Algebraic Mathematical Programing Language (AMPL) to
predict the performance of the drilling fluid circulating system in different solid build up
rates. This task aims to calculate the total drilling fluid system cost.
Scope and relevance
The study focuses on comparing drilling fluid consumption while drilling with and without
using a centrifuge in the Edvard Grieg field, Norway. The study also describes different types
of drilling fluids and functions in drilling operations. Furthermore, it includes all logistic
activities associated with transporting the drilling fluid. Although this study focuses on the
Edvard Grieg offshore oil field, this study including the optimization model is considered
valid in other geographical locations both on and offshore. Drilling operations and are quite
similar in and offshore, however, logistics activities are slightly different, as the onshore
transportation mode is a vessel and the onshore transportation mode is truck or train.
There are several motivators to write this master thesis and answer the main research question
“how upgrading the solid control system can reduce the total system cost and reduce logistical
challenges. The significant fall in oil and gas prices in the second half of 2014 has led many
oil and gas operators to decommission most of their rigs and cut the investment in exploration
and production. Drilling fluid is a key cost element in drilling operations, this study proposes

15
a quantitative tool to contribute to better understand the role of a centrifuge in reducing total
drilling system cost. The increasing environmental awareness of hazardous drill cutting waste
generated in drilling fluid is another motivators, as this study aims to reduce total discharge
volume of drilling fluid.
Objective
The data used in this research study, obtained from a single company for a specific area of
study. Most parts of the data used in this study were derived by analyzing and interpreting the
information collected during the meetings and interviews.
The main objective of this study is to build a quantitative tool that allows us to simulate and
optimize the drilling fluid system. This tool considers all the system elements; 1) solids
generated while drilling, 2) solid control equipment shale shakers and centrifuge, 3) drilling
fluid dilution volume and 4) drill cutting waste volume.
16
3.0 Methodology
There are four primary objectives of conducting a research; exploration, explanation,
description and prediction. In this study, both qualitative and quantitative methods are used
for description and prediction. (Ellram, 1996)
This chapter describes the process and participants of this study. It illustrates the method of
case selection and data collection. In addition, it describes the progress of selecting a topic,
writing the thesis and building a mathematical model. Finally, a brief discussion on the
research trustworthiness and limitations is conducted.
Case selection and data collection
It was important to select an offshore oil and gas operator where all necessary information and
data of logistics, drilling operation, and disposal management was available for analysis
purposes.
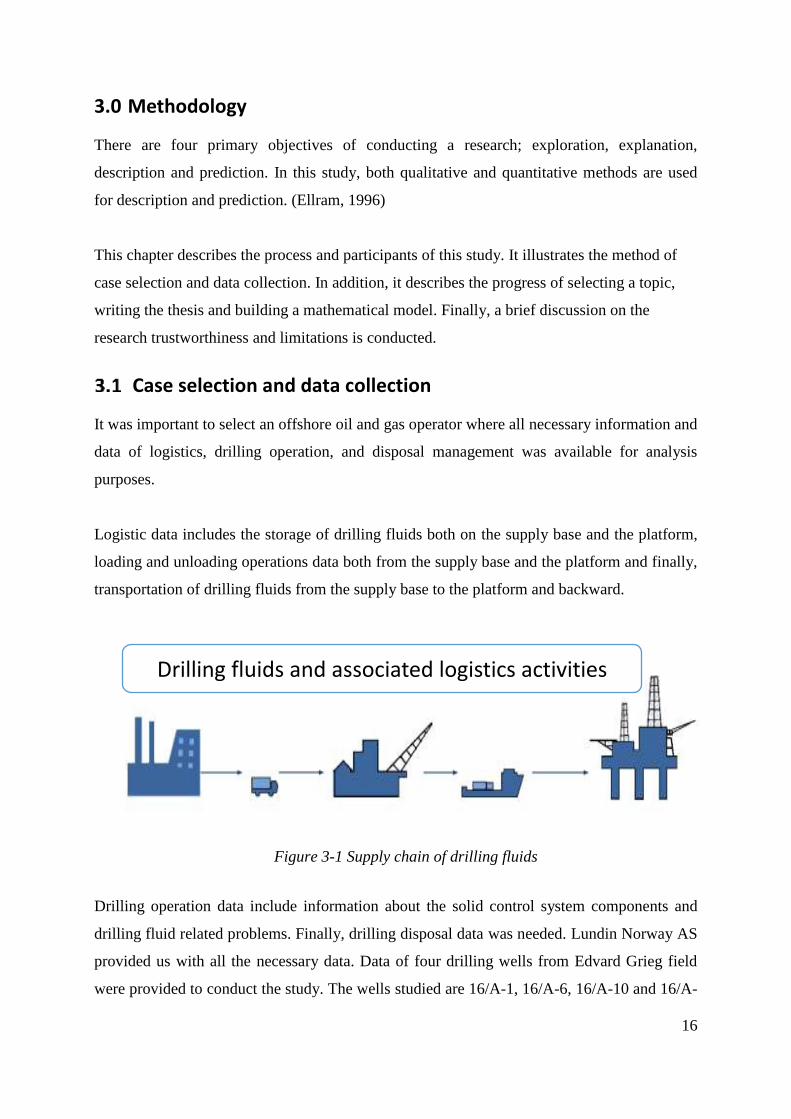
Logistic data includes the storage of drilling fluids both on the supply base and the platform,
loading and unloading operations data both from the supply base and the platform and finally,
transportation of drilling fluids from the supply base to the platform and backward.
Drilling operation data include information about the solid control system components and
drilling fluid related problems. Finally, drilling disposal data was needed. Lundin Norway AS
provided us with all the necessary data. Data of four drilling wells from Edvard Grieg field
were provided to conduct the study. The wells studied are 16/A-1, 16/A-6, 16/A-10 and 16/A-
Drilling fluids and associated logistics activities
Figure 3-1 Supply chain of drilling fluids

17
12. The following section will provide information about Lundin Norway AS and the process
of data collection.
3.1.1 Data collection
The task of data collection began after defining and designing the research problem. To
conduct the tasks of this study both qualitative and quantitative data collection technique are
conducted. “The three primary qualitative techniques that may be used as a part of the case
study method are direct observation, recordings and interviews” (Ellram, 1996, p. 100),
According to Ellram (1996), these techniques are described for qualitative data collection, it
can also be applied to collect quantitative data.
Figure 3-2 Data collection techniques
Primary data are the data collected for the first time in interviews, questionnaires or
observation methods while secondary data are the data which have already been collected and
analyzed. Secondary data can be found in states and government publications, magazines,
books and scientific reports and articles. (Kothari, 2004)

18
Interviewing have been used several times to collect data, furthermore, several techniques
have been applied to collect primary data including content analysis, conversational
interviews, historical analysis interviews and questionnaire interviews. Four meetings and
interviews with drilling engineers, drilling fluid specialists and logistics coordinators were
conducted during the study period. The collected data include daily drilling reports, daily
drilling fluids reports, environmental reports, and all necessary logistic data.
Primary data collected
The below Table 3-1 illustrates the interviews conducted to collect primary data, see
Appendix 1 for more details about interviews.
Secondary data collected
The collected secondary data include:
Daily drilling report (DDR) is a daily basis report shows drilling activities and results
of the past 24 hours of drilling operations.
Table 3-1 List of interviews
Date Employees Topic Technique
16
February
2017
Drilling engineer and mud
engineer
Analyzing the drilling
reports
Indirect
observation
23
February
2017
Logistics Coordinator and
mud engineer
Solid control system and
common drilling problems
Semi-structured
interview
9 March
2017
Drilling engineer, logistics
coordinator, and mud
engineer
Supply chain, storing and
transportation of drilling
fluids
Unstructured
interview
20 April
2017
Drilling engineer, logistics
coordinator, and mud
engineer
Presentation of results Conversational
interview
19
Daily drilling fluids (Mud) report (DMR) is a daily basis report shows drilling fluid
parameters, consumption and discharge volumes of drilling operations.
Environmental report (EOW) is a daily basis report shows drilling fluid parameters,
consumption and discharge volumes of drilling operations.
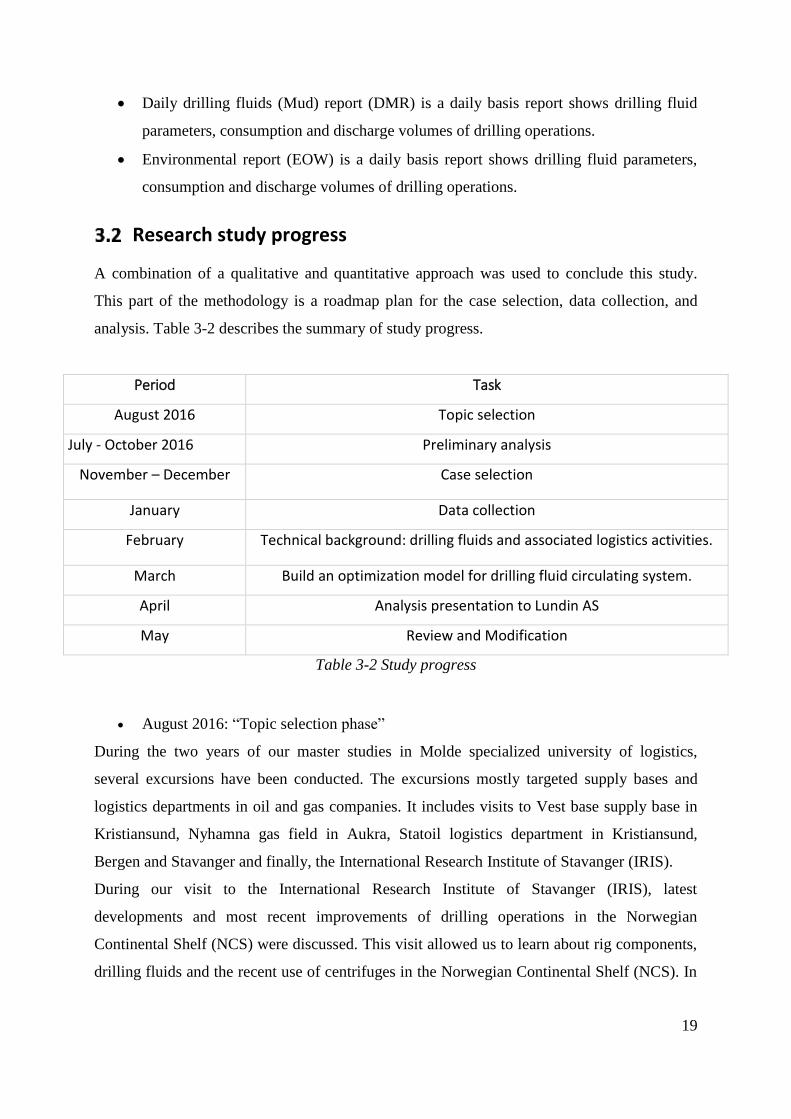
Research study progress
A combination of a qualitative and quantitative approach was used to conclude this study.
This part of the methodology is a roadmap plan for the case selection, data collection, and
analysis. Table 3-2 describes the summary of study progress.
Period Task
August 2016 Topic selection
July - October 2016 Preliminary analysis
November – December Case selection
January Data collection
February Technical background: drilling fluids and associated logistics activities.
March Build an optimization model for drilling fluid circulating system.
April Analysis presentation to Lundin AS
May Review and Modification
Table 3-2 Study progress
August 2016: “Topic selection phase”
During the two years of our master studies in Molde specialized university of logistics,
several excursions have been conducted. The excursions mostly targeted supply bases and
logistics departments in oil and gas companies. It includes visits to Vest base supply base in
Kristiansund, Nyhamna gas field in Aukra, Statoil logistics department in Kristiansund,
Bergen and Stavanger and finally, the International Research Institute of Stavanger (IRIS).
During our visit to the International Research Institute of Stavanger (IRIS), latest
developments and most recent improvements of drilling operations in the Norwegian
Continental Shelf (NCS) were discussed. This visit allowed us to learn about rig components,
drilling fluids and the recent use of centrifuges in the Norwegian Continental Shelf (NCS). In
20
addition, it motivated us to search for possible improvements and research studies in this field
of study.
July - October 2016: Preliminary analysis
For a period of three months, a wide online search about drilling fluids was conducted, several
drilling and drilling fluid professionals were interviewed. Furthermore, two proposed topic
were discussed with several potential supervisors. Two of the most common questions we
have received at that point are, how is this relevant to logistics? Are you considering a
qualitative or quantitative approach?
A preliminary analysis was conducted to measure the influence of drilling fluid consumption
on logistics activities in Saudi Arabia. The Results were discussed with our supervisor and
several specialized engineers. It was then necessary to contact companies to understand more
about real life situations and discuss applicability.
November – December 2016 : Case selection
It was necessary to select a horizontally integrated company, where both logistic and drilling
fluid operation data is available. Several oil and gas companies in the Middle East, Sudan and
Norway were contacted. At the end, Lundin Norway was selected. The recent upgrade of the
drilling fluid circulating system in Lundin by adding a centrifuge to their solid control system
was a key advantage for selecting Lundin Norway AS.
In December 2016, a meeting was held at Lysaker with drilling and production department,
Lundin Norway AS. An introductory presentation included a personal background, problem
definition, objectives and a preliminary analysis was presented at this meeting. In this meeting
Lundin agreed to work with us on this case and provide us with all necessary data. In addition,
a confidential agreement and contracts were signed.
January 2017: Data collection
Lundin AS provided us data of four drilling wells from Edvard Grieg field. Data includes
daily drilling reports, drilling fluid data and drill cuttings environmental reports. In addition,
logistics data and drilling system costs were provided.

21
In January, data screening analysis was conducted to understand offshore drilling operations,
the use of drilling fluid and total drilling system cost in Edvard Grieg.
February 2017: Technical background
For better understanding, different books, articles, magazines and websites were visited. In
several interviews with Lundin AS were conducted. In these meeting drilling engineers,
drilling fluid coordinators and logistics coordinators were interviewed. Each of the meetings
lasted for around two hours, a PowerPoint presentation was made by us followed by a
discussion.
In the first meeting, we discussed upgrading the solid control system and the most common
drilling problems related to it in Edvard Grieg field. Furthermore, a detailed information about
the contribution of the centrifuge in reducing solid contents and total drilling fluid
consumption.
In the second meeting, we interviewed the logistics coordinator on logistics activities in
Edvard Grieg and the cost elements of transporting drilling fluids. Furthermore, we asked him
whether the upgrade of solid control system influences any of logistics activities.
March 2017: Optimization model
Lundin has approved to build a mathematical model to optimize the operating parameters of
their solid control system in Edvard Grieg field. We have built this model under supervision
of Yury Redutskiy, Ph.D. student at Molde University College. A meeting with Lundin was
held in March 2017 to present a draft model and collect necessary data.
April 2017:
Presented findings to Lundin AS for discussion and suggestions. Meanwhile, a draft of the
thesis was sent to the supervisor to review and suggest modifications.
May 2017: Final review
Sent out findings to our supervisor for comments and continue on carrying out the conclusion
part.

22
Evaluating the quality of the research methodology
To conduct any qualitative, research a quality of research methodology has a great
importance, the research method has both advantages and disadvantages. The methodology
for any qualitative or quantitative cannot be right or wrong, but it may be less or more useful.
(Silverman, 2006; Silverman, 2001)
3.3.1 Research trustworthiness
It is very important for a researcher to generate a confidence about the research findings.
There are four basic elements of trustworthiness to examine the quality of the research, these
elements are credibility, transferability, dependability and conformability. (Guba, 1981;
Shenton, 2004).
23
4.0 Theory
This chapter describes concepts and theoretical approaches which have been used to complete
this research.
Supply Chain Management (SCM)
In the recent decade, supply chain management has been an effective tool to minimize the
order time, cost of supply chain and increase quality of customer services (Saad, et al., 2014).
The Council of Supply Chain Management Professionals (CSCMP) defines supply chain
management as “The planning and management of all activities involved in sourcing and
procurement, conversion, and all logistics management activities. Importantly, it also
includes coordination and collaboration with channel partners, which can be suppliers,
intermediaries, third party service providers, and customers. In essence, supply chain
management integrates supply and demand management within and across
companiesʺ. (CSCMP, 2017)
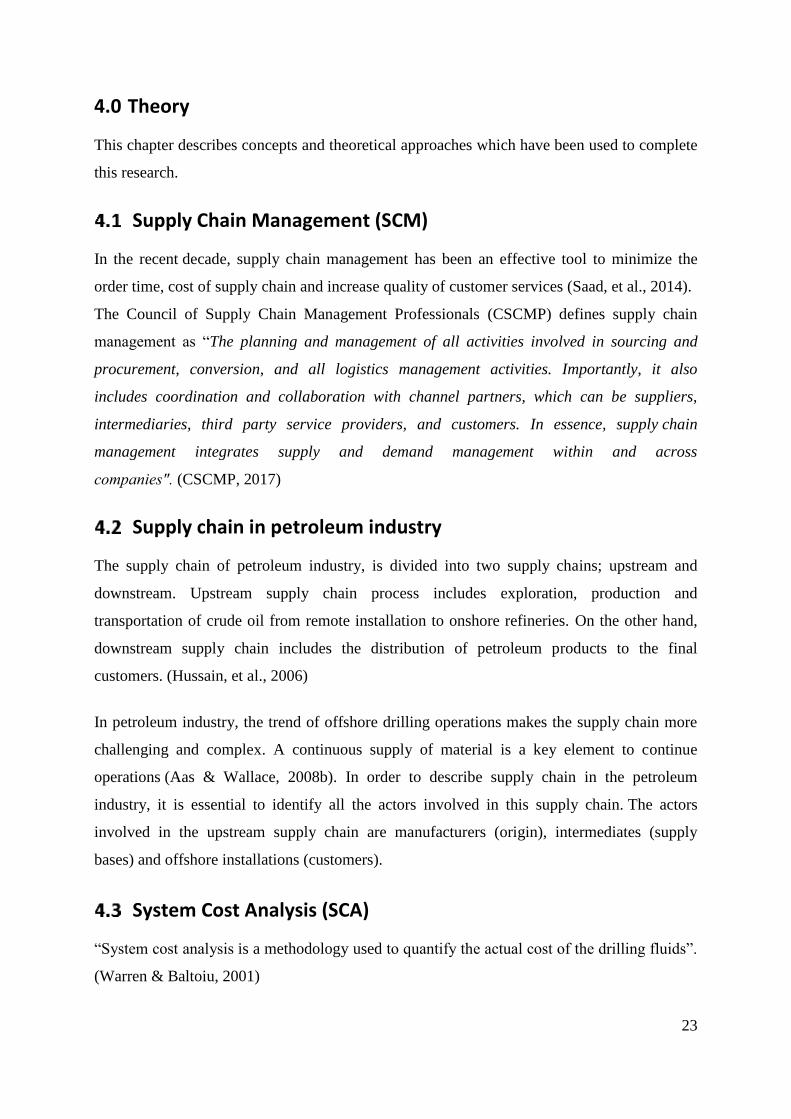
Supply chain in petroleum industry
The supply chain of petroleum industry, is divided into two supply chains; upstream and
downstream. Upstream supply chain process includes exploration, production and
transportation of crude oil from remote installation to onshore refineries. On the other hand,
downstream supply chain includes the distribution of petroleum products to the final
customers. (Hussain, et al., 2006)
In petroleum industry, the trend of offshore drilling operations makes the supply chain more
challenging and complex. A continuous supply of material is a key element to continue
operations (Aas & Wallace, 2008b). In order to describe supply chain in the petroleum
industry, it is essential to identify all the actors involved in this supply chain. The actors
involved in the upstream supply chain are manufacturers (origin), intermediates (supply
bases) and offshore installations (customers).
System Cost Analysis (SCA)
“System cost analysis is a methodology used to quantify the actual cost of the drilling fluids”.
(Warren & Baltoiu, 2001)

24
4.3.1 Drilling fluid system cost analysis
"The system cost analysis is a measuring stick on how well an operator and service company
perform." (Warren & Baltoiu, 2001). In order to explain and predict the performance
improvement, it is necessary to identify all system elements.
To apply the system cost analysis on a drilling fluid system, it is necessary to generate an
equation where all the related cost elements are included.
The first step is to identify all elements of the system. Warren and Baltoiu (2001) proposed a
simple and expanded version of a system cost analysis for drilling fluids.
System cost = Material Costs + unproductive time (1)
Material cost is the cost of purchasing drilling fluid materials. The cost of the material varies
depending on the type of drilling fluid, for instance, oil based drilling fluid is more costly than
water and synthetic based fluids. This cost also includes trucking and other associated
logistics services.
Unproductive time is the time consumed to solve drilling problems related to drilling fluid.
This depends on the governed rig cost which usually determined on an hourly basis. The
expanded form of equation (1), include three additional elements as they are also impacted by
drilling fluid. These elements are Rate of Penetration (ROP), volume of solid waste and
finally the production of hydrocarbons, given in equation (2).
Material and Logistics cost
Operations Disposal cost
Figure 4-1 Supply chain of drilling fluids
25
System Cost = Material Cost + (Trouble time * Rig cost/h) + ROP impact
+ Solid Control/disposal + Production (2)
This equation is used as a starting point to conduct the analysis part of this study. However,
several changes have been made to apply it on our case study. Logistics cost is one of the cost
element we added to the equation. Vessels is the offshore transportation mode, the higher cost
of vessel transportation comparing to trucks is the main reason for adding this element.
This system can give good results for any drilling project, but to get the best results, there are
some conditions set to implement this system. Warren and Batoiu, (2001) described two
conditions; Well which is included in the study should not be older than the two years because
improvements in the technology and should be with the same deviated design and possibly
drill through the same formation/lithology. Both conditions are satisfied in our case study. All
the wells in our case study have the same design and were drilled between 2014 and 2016.
Mathematical modelling
Mathematical modeling is a mathematical representation of large-scale optimization problems
in order to find the behavior of system. Mathematical modelling can be used to developing
scientific understanding, test the effect of changes in a system and predict the result of
decision making. (Lawson & Marion, 2008)
4.4.1 Algebraic Mathematical Programming Language (AMPL)
Algebraic Mathematical Programing Language (AMPL) is a tool designed specifically for
mathematical programming. The AMPL supports building, testing and analyzing optimization
models. To solve any problem, a number of steps are to be followed;
I. Formulate a model, to represent the general form of the problem, a set of variables,
objectives and constraints are required to represent the general form of the problem.
II. Specify the objective function and constraints.
III. Collect the data.
IV. Solve the problem, the solver will apply an algorithm to find the optimal solution of
the problem.
V. Analyze the results.

26
AMPL is used to code and formulate the drilling fluid circulation system in the Edvard Grieg
field. This model allows us to understand the current behaviour of the drilling fluid circulation
system, test the effect of the centrifuge to the system and predict the outputs in different
operating parameters.
Event Tree Analysis (ETA)
“This is an inductive logic and diagrammatic method, used to identify the possible risks
associated of initiating any event.” The main purpose to do this analysis is to find the most
important cause of the system failure or high cost and focus on the problem. (Huang, et al.,
2001)
Event tree analysis is a tool to find and deal with the problems, starts with an event, provide
inductive logical relationship and the information about the risks/outcomes associated with
the hazard (You & Tonon, 2012). Event tree analysis is an approach to find undesired and
desired results from the occurrence of initiating event (Ramzali, et al., 2015).
Event tree construction
Usually, event tree analysis has two outcomes “Yes (True)” or “No (False)”, but there are
possibilities to have more than two outcomes (You & Tonon, 2012). The methodology of
constructing an event and identifying the possible consequences are given below; (Rausand,
2013; Ramzali, et al., 2015)
i. Identification of the initial event that may lead to unwanted consequences.
ii. Identify the barriers that can mitigate or eliminate the resulted consequences.
iii. Construct an event tree.
iv. Describe the potential sequences.
v. Determine the frequency and the probabilities of each event tree.
vi. Calculate the probabilities/frequencies for the identified consequences
(outcomes).
vii. At the end, compile and present the results from the analysis.
27
Event tree analysis is conducted to understand the role of the centrifuge in the drilling fluid
circulation system. A three stages tree describes the main possible scenarios to overcome high
solids build up rates during drilling, more details are provided in section 7.4. Data to conduct
this analysis is collected from interviewing drilling and drilling fluids specialized engineers.

28
5.0 Industrial background: Drilling fluids
Introduction to drilling fluids
The cost of drilling fluids itself have a small contribution in the total well cost, but the right
selection of drilling fluid and properties can reduce the total well cost and potential drilling
problems (Caenn, et al., 2011).
Drilling operations are the processes of extracting subsurface hydrocarbons using a drilling
bit. To drill a well, it's necessary to use a drilling fluid, also named drilling mud. Water based
and oil based muds are the most popular drilling fluid types. Both water and oil based muds
are built by mixing/dissolving a group of raw materials in water or oil. Materials are such as
weighting materials and lost circulation materials. Each of these materials has its own
function. After preparing the drilling fluids, they are pumped into the bore hole through the bit
to perform its functions. The process of pumping drilling mud into the well and receiving
back at the surface is known as mud circulation. (Growcock & Harvey, 2005)
Drilling mud has several functions in drilling operations. They are formulated to control the
formation pressure, maintain well bore stability, lubricate and cool the drill-string and to
remove cuttings from the borehole. Drill cuttings contaminate the drilling fluid, as a result the
functionality and lifetime of drilling fluids decrease. To reuse the drilling fluid it is necessary
to remove the cuttings continuously and efficiently.
There are two basic methods to control the content of the cuttings in the mud. The first is to
dump some of the contaminated drilling fluid and replace it with a new diluted volume. The
second is to use the solid control system (SCS). The SCS allows us to mechanically control
the solid content, keeping the properties of drilling fluids within the required level. Today, to
keep the drilling fluids functioning properly, usually a combined method is used. (Growcock
& Harvey, 2005)
Finally, it very important to mention that drill cuttings management is governed by strict
regulations. Drilling fluids contain hazardous contaminants such as petroleum hydrocarbons
and heavy metal. Oil-based and synthetic drilling muds are more harmful to the environment

29
because of diesel and mineral oil content, however, there are strict regulations even for water-
based drill cutting disposal. (Leonard & Stegemann, 2010)
Drilling rigs
A typical drilling rig consists of five principle components. The Power system provides the
electrical power. Both hoisting and rotary systems are to handle, connect run-in and out the
drilling pipes and equipment. The well control system is the main safety system. It works as a
barrier to control well kicks and blow out. Finally, our main focus in this chapter is the
circulating system where drilling fluids are prepared, pumped through the drill-string into the
well, through the annulus to surface. When it reaches the surface it passes through the solid
control equipment. Typically, this system consists of shale Shakers, a Desander, a Degasser, a
Desilter and a Centrifuge (Growcock & Harvey, 2005). However, in recent applications,
modern solid control system consists of shakers and centrifuges only.
Drilling fluid circulation system
The circulation system is the complete path that the drilling fluid travels, this journey starts at
the mud pumps through the well. In a complete cycle, drilling mud travels from the suction
tank to the mud pump, mud is then pumped through a high-pressure surface connections
Figure 5-1 Drilling rig components

30
(standpipe) to the drill-string and then downhole through bit jets, the mud returns up the
annuals to the surface, at surface it passes through the solid control equipment for treatment
before it flows back to mud pits (Williamson, 2013). The complete circulation system is
shown in the figure below.
A major function of the circulation system is to carry the drilled cuttings to surface, remove
solids and pump it back to the well. The principal components of this system include mud
pumps, mud pits, mud mixing equipment, and solid control equipment, also known as
contaminant-removal equipment. (Bourgoyne Jr, et al., 1986)
Figure 5-2 Drilling fluid circulation system. Source: (Williamson, 2013)

31
Drilling fluid types
Drilling fluid is a suspension of clay and other materials in a base fluid. Traditionally, there
are two types of drilling fluids used in the industry, water, and oil based muds. In the recent
times, a synthetic based mud also used. This classification is based on the type of the base
fluid. The selection of the mud type depends on several factors such as well depth and
formation type (Caenn & Chillingar, 1995).
In the planning phase, drilling fluid experts design a mud system for each drilling section.
“The system is designed to meet several specifications including density requirements,
borehole stability, thermal gradient, logistics and environmental concern.” (Bloys, et al.,
1994)
5.4.1 Water-based mud
Water-based mud is widely used in the upper sections, where formation pressure and the
cutting rate is the lowest. The accessibility to water resources makes the cost of the water
based mud less than other mud types. The proprieties of water-based mud varies from one
well to another. (Yunita, et al., 2016).
Figure 5-3 Drilling fluid types
32
In many complex drilling structures, water based mud has unstable performance and
application limitations. Several properties of the oil-based mud make it a better option,
especially when drilling through a pay zone, the hydrocarbon producing formations.
5.4.2 Oil-based mud
The use of oil-based mud in such application is an advantage as we get less damage to the pay
zone, better lubrication and higher temperature resistance (Zhou, et al., 2016). Oil based
drilling fluids are more expensive than water based. However, the building cost of oil based
mud varies from one country to another depending on the diesel prices. The major
disadvantage of using oil based muds is the environmental concern. (Shah, et al., 2010)
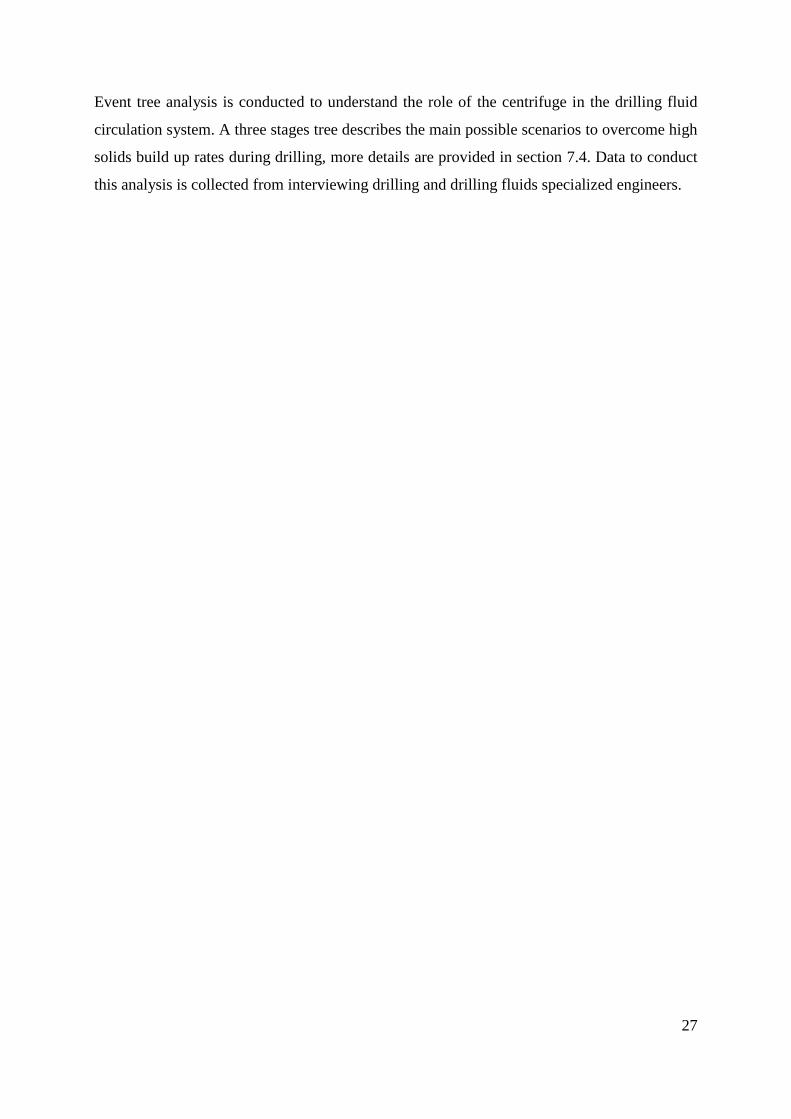
5.4.3 Mud design at Edvard Grieg field
Drilling in the Edvard Grieg is divided into five sections. Each of the section has different
formation type, therefore, the design of the drilling is different. Firstly, the conductor 36" hole
is drilled with water based mud then, the KCl-polymer mud is used to drill the surface hole of
24" as in this hole the formation is clay. In the intermediate section, 17 ½" section, the drilling
fluid is water-based mud. Next, oil-based mud is used to drill the production section and
finally, water-based mud is used to drill the 8 ½ " section.
8 ½ ’’ section Water based
Figure 5-4 Drilling fluids per section in the Edvard Grieg
Field
12 ¼ * 13’’ section Oil based
36 ’’ section spud mud
24 “section Water based
17 ½ ’’ section Water based

33
Solid control equipment
“Circulation of drilling fluid can be considered a chemical process with the wellbore acting as
a reactor vessel. In this reactor, the composition of the drilling fluid will be changed
dynamically" (Bloys, et al., 1994, p. 39). The solid control equipment strips solids out of
drilling fluids allowing the reuse of this fluid. The solid control system minimizes the risk of
several drilling problems related to solid content in the mud, it also contributes to reduce the
consumption of the drilling fluid and minimize the drill cuttings waste amount. (Bloys, et al.,
1994)
The solid control system is a set of mechanical-separation devices. Selecting and designing a
solid control system depends on several factors including well depth, drilling penetration
rates, formation type and size of solids. The right design of the solid control equipment is a
key factor in minimizing total system cost. In a recent application, including the Edvard Grieg
field, solid control equipment has downsized to include only two devices; shale-shakers and
centrifuges, Figure 5-5 shows the layout of the solid control equipment in Edvard Grieg.
Figure 5-5 Solid control system consisting of shale-shakers and a centrifuge
34
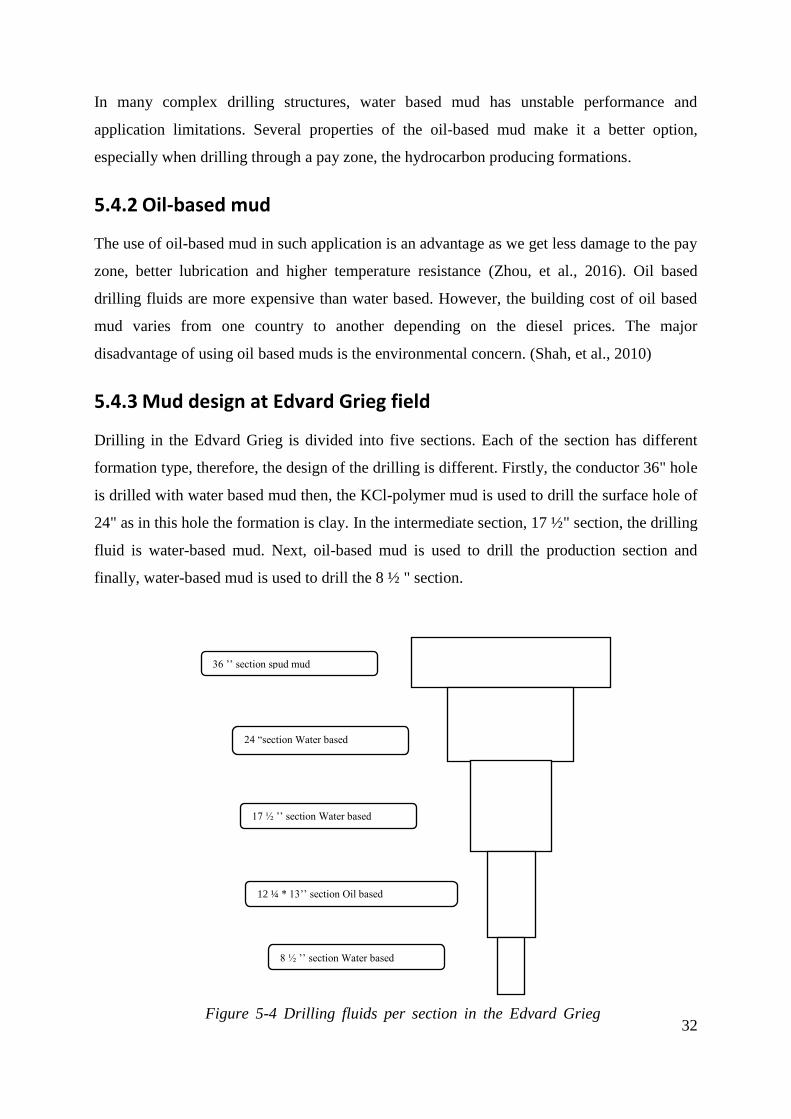
The system process solids allowing to reuse drilling fluids. The process of separating solids
out of drilling fluid results in separating some of the active drilling fluid this called slippage
volume. Slippage waste is approximately 10% for all case wells in the Edvard Grieg field.
5.5.1 Shale-shakers
Shale shakers have the advantage of a simple design, a wide range of solid size processing
and high flow rate processing capabilities. This device is used to screen a wide range of solid
sizes from the circulating drilling fluid. Shale shaking is the easiest way to remove the solids
but the improper design and use of this device may affect the other devices in the solid control
system.
In Edvard Grieg operations, a set of five Shale-shakers is used to process circulation drilling
fluids. The reason for using more than one shale shaker is to assure high processing efficiency
different flow rates and solid contents. The total solid separation efficiency of the five shakers
is slightly higher than 75% of the total solid content (interview, 2017). In 17 ½‘’ section
shakers handle 5000 liters per minute. In Figure 5-6, the blue part is where shale shaker
screens are. Contaminated drilling fluid passes through these screens down to the bottom part
then to underground pits.
Screens
Cuttings pit
(Discard)
Flow between
shakers to
active system
Figure 5-6 Four sets of shale shaker in the Edvard Grieg field. Source: Lundin Norway AS
35
5.5.2 Centrifuges
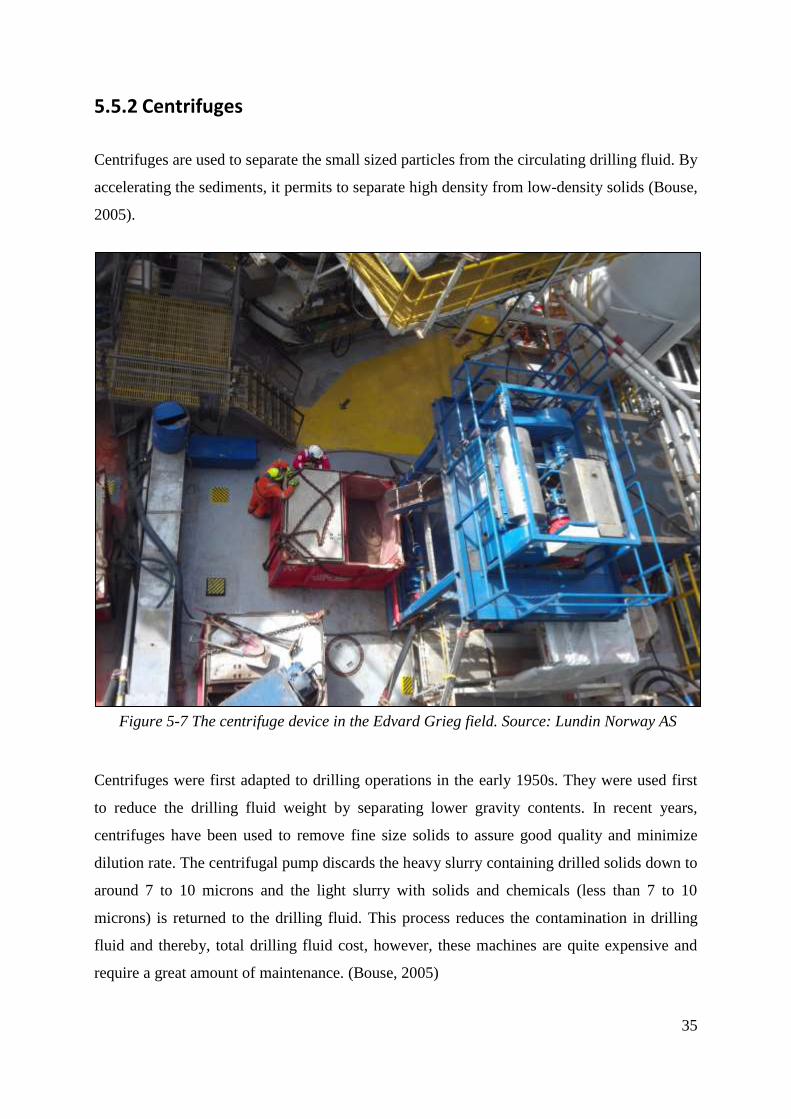
Centrifuges are used to separate the small sized particles from the circulating drilling fluid. By
accelerating the sediments, it permits to separate high density from low-density solids (Bouse,
2005).
Centrifuges were first adapted to drilling operations in the early 1950s. They were used first
to reduce the drilling fluid weight by separating lower gravity contents. In recent years,
centrifuges have been used to remove fine size solids to assure good quality and minimize
dilution rate. The centrifugal pump discards the heavy slurry containing drilled solids down to
around 7 to 10 microns and the light slurry with solids and chemicals (less than 7 to 10
microns) is returned to the drilling fluid. This process reduces the contamination in drilling
fluid and thereby, total drilling fluid cost, however, these machines are quite expensive and
require a great amount of maintenance. (Bouse, 2005)
Figure 5-7 The centrifuge device in the Edvard Grieg field. Source: Lundin Norway AS
36
Advantages of upgrading the solid control system in the Edvard
Grieg field
In the Edvard Grieg field, Lundin has invested in upgrading their solid control system by
adding a centrifuge. Therefore their current system now consists of five sets of shakers and a
centrifuge. The centrifuge adds a permanent cost to the solid control system, and the total
estimated yearly fixed cost of the centrifuge is approximately NOK 8, 200 million. This cost
includes the daily rent of the centrifuge, a digraph pump, mobilization/demobilization cost
and the cost of two offshore supervisors to operate the centrifuge.
The main reason for upgrading the solid control system in Edvard Grieg is the high volume of
drilling cuttings generated in the Hordaland and the Grid formation. This upgrade is expected
to pay off by mitigating and eliminating several costly drilling problems related to solid
content build up. It’s also expected to reduce dilution rates thereby, reducing total mud costs.
5.6.1 Drilling problems related to solid content
“Mud may represent 5% to 15% of drilling costs but may cause 100% of drilling problems”
(Bloys, et al., 1994, p. 33). Drilling fluids contribute to virtually any drilling problem.
Inadequate drilling Muds may lead to stuck pipes, poor completion, inadequate logs and pay
zone damage.
Solids are classified as high gravity solids and low gravity solids. Barite and other weighting
materials are classified as high gravity solids, however, drilled solids, clays, polymers and
bridging materials are classified as low gravity solids.
The type and the content drilled solids in the drilling fluid affect a number of chemical and
physical properties. The increase in the content of low gravity solids will increase plastic
viscosity and gel strength. In addition, it will result in thicker filter cakes and slower drilling
rates, it could also cause abrasion on pump parts, and downhole equipment (Bloys, et al.,
1994)

37
5.6.2 Maintaining drilling fluids
"Selecting a reliable chemical formulation for the drilling fluid so that it exhibits the required
properties is one part of the job, maintaining these properties during drilling is another"
(Bloys, et al., 1994).
As we mentioned earlier in this chapter, “to reuse drilling fluids, it is necessary to remove the
cuttings continuously and efficiently”. There are two possible methods used to treat the
content of cuttings in drilling fluids. The first is a mechanical separation, a solid control
system is a group of mechanical devices in which the solids are stripped out of the drilling
fluid.
The second treatment is to replace some or of contaminated fluid with a new diluted volume.
In drilling industry, dilution is the process of building and adding an extra volume of mud to
the existing volume in order to control mud proprieties. Dilution can be made by adding base
fluid or/and chemical additives such as weighting material, lost circulation materials or
bridging materials. (Bouse, 2005)
5.6.3 Environment concern and mud disposal
In 2015, about 465 000 tons of hazardous waste was generated on the Norwegian shelf. Most
of the waste are drilling waste, chemicals, and oil waste. Drilling wastes are 402895 tons,
accounts more than 80% of total waste.
38
Drilling waste skyrocketed from around 140 000 to 402 895 tons in the last few years, this
results in more greenhouse emissions while transporting the cuttings, higher risk of pollution
to soils, rivers, and lakes, and coastal waters. (EnvironmentalNorwegianAgency, 2017)
Figure 5-8 Hazardous waste from offshore activities on the Norwegian shelf. Source:
Norwegian Environmental Agency and Norwegian oil and gas Association License: NLOD.

39
6.0 Offshore upstream logistics
“Supply chain is a process of transformation of all the activities and goods from the origin of
the raw material to the final customers” (Arne Wiig, 2001). Logistics management is a part of
supply chain management and can be defined as “the process of planning, implementing and
controlling the procedures for efficient and effective transportation and storing the material
including services and related information from the origin to the final customers” (Choi, et al.,
2016).
Logistics activities are challenging for planners either onshore or offshore. In this chapter, we
will mainly focus on the offshore logistics activities. More specifically, the settings of
offshore upstream logistics in the Norwegian Continental shelf (NCS).
Offshore upstream logistics system
Logistics system can be divided into two groups, onshore logistics (transportation is usually
done by train and trucks) and offshore logistics (vessels are the main source of
transportation). The Figure 6-1 shows a simplified model of the logistics system.
Figure 6-1 The flow of cargo to the offshore units

40
In the petroleum industry, transportation of oil and gas from installation to land is called
“downstream logistics” and supply of the demanded material from supply base to offshore
installations is known as “upstream logistics” (Aas, et al., 2009).
Logistics management
This is a key part of supply chain and mostly cover the routing of the vessels, inventory
control at the supply base and installations. A complete, correct and in time information to all
the actors involved in the logistics activities is a key factor. Supply vessels and logistics
planning play a vital role in the offshore exploration and production (E&P) activities (Aas, et
al., 2008a; Maisiuk & Gribkovskaia, 2014).
Supply vessels are designed for multi-purposes. Supply vessels are used for transportation of
materials from the supply base to the installations and bring back waste and empty containers
to the supply base. The selection of vessels depends on the geographic location of targeted
installation and type of material to be transported because some materials require special
needs while transporting e.g. food and drinking water. (Aas, et al., 2009; Maisiuk &
Gribkovskaia, 2014). The offshore logistics planning is challenging due to the large variety of
items, different container size and distance from base to the installation, weather conditions
and storage availability (Aas, et al., 2009). Many actors are involved in offshore logistics
activities including planners, vessels, warehouse, ports, helicopters (usually for personnel
transportation) etc. All are dependent on each other and minor delay in any part of logistics
system will lead to high cost. This will become more challenging during the exploration
activities and an era of low oil and gas prices (Engh, 2015; Wiig, 2001).
Transportation
Vessels are used to providing the services to the offshore installations and transporting the
demanding material to the installations. There are two types of materials, bulk or deck cargo.
These vessels can transport deck like pipes and casing at the top and below the deck, there are
tanks used to transport drilling fluids, chemicals, fuel etc. The drilling fluids (mud) are
transported in tanks in a liquid form. (Drift & Weeke, 2015; Aas, et al., 2009)
The most common material, which is transported through supply vessels are fluids, diesel, dry
bulk, industrial water, food and drinking water, chemicals, pipes and risers, equipment, and

41
general goods, salt and other supplies for fluids, barite and bentonite, cement and waste
material.
6.3.1 Transportation cost elements
Several cost elements are associated with offshore upstream logistics but supply vessels are an
expensive (Norlund, et al., 2015). There are several cost elements associated with operating a
supply vessel. Some of these costs are fixed while others are variable. There are three
principle cost elements, the daily vessel rent, planning cost and operating cost. The daily rent
is the fixed cost that an operator pays to the vessel owner. Planning includes determining the
optimal routes, optimal fleet size, and the corresponding weekly voyages and schedules. The
operating cost is a variable and it includes the fuel consumption, (speed and weather and load)
crew and emission cost.
6.3.1.1 Vessel rent
Vessels are designed for multi-purposes and categories on the basis of their fleet size,
functions (transport or service) and usage. The rent of the vessel is a major cost element in
offshore upstream logistics. The cost depends on the capabilities and features of the vessel
and availability. Features are mainly operational capability, load carrying capacity for both
deck and bulk cargo, sailing capabilities and finally loading and unloading capabilities. (Aas,
et al., 2009)
The operation capability is the actual operation time a vessel is capable to operating within
rent period. An ideal vessel will have minimum routine maintenance and service time. A
bigger carrying capacity is usually an advantage for a supply vessel. Supplies transported are
classified into deck and bulk cargo. Deck cargo includes pipes, offshore containers and other
supplies transported on the deck of the vessel. Bulk cargo includes drill-fluids, brine, water
and oil. Most of the offshore cargo are loaded in offshore containers, skips or baskets. Sailing
capability is the capability of a vessel to operate in different weather conditions. “Unlike
carrying capacity, which is more of a fixed cost, sailing capability varies in accordance to the
weather and it influenced by the cargo transported” (Aas, et al., 2009; Aas, et al., 2007).
Minimizing the time of loading and unloading activities at the installation and supply base
increases the sailing time thereby, save money for the company. Lifting capability and
42
vessel’s capability are the key factors affecting the loading and unloading operations (Aas, et
al., 2009).
6.3.1.2 Planning
In Norway, the production of oil and gas in the remote areas e.g. the Barents Sea. The
planning of vessels is much difficult especially in the winter season the sailing and service
time increase (Norlund, et al., 2015). The Planning phase includes determining the optimal
routes, optimal fleet size, and the corresponding weekly voyages and schedules. An ideal
plan should include a minimum number of vessels to serve all installation, a maximum deck
utilization and a zero cargo delay time (Maisiuk & Gribkovskaia, 2014; Sopot &
Gribkovskaia, 2014).
Each installation has a demand of a different kind of material. Routing is to find the optimal
path, for each vessel, in which the maximum number of installations are served. The main
purpose of routing is to minimize the number of vessels, the operating times and thus the total
cost (Maisiuk & Gribkovskaia, 2014; Sopot & Gribkovskaia, 2014). As vessels are the main
cost element in the offshore upstream logistics, deck utilization is another factor through
which a significant cost saving can be produced. There are two basic ways to increase deck
utilization, effective supply chain management, and good demand management. Daily rent
cost of the offshore drilling activities is high. So, delay in deliveries will result in a high cost.
The cost is mainly associated with personnel or operations are waiting for equipment or
equipment is waiting for personnel. Different reasons have been reported for a delay in
offshore deliveries, weather conditions, poor material scheduling and unscheduled technical
maintenance of vessel (Aas, et al., 2009; Sopot & Gribkovskaia, 2014; Maisiuk &
Gribkovskaia, 2014).
6.3.1.3 Operating cost
The operating cost of vessels in offshore upstream logistics consist of cost of fuel
consumption, harbor fees, operating crew cost and the cost of greenhouse gasses. The
operating cost depends on sailing speed, load and weather condition.
Fuel consumption depends on the sailing time, speed and load. Especially in winter times, bad
weather conditions increases fuel consumption. High wind speed and waves result in longer
sailing times and lower the speed (Norlund, et al., 2015). The harbor fee is marginal in
Norwegian ports as compared to the other places. The operating crew on the supply vessel

43
depend on the size of vessel and weather conditions. Usually, there are up to 30 people on the
vessel. The job of the crew includes to operating the vessel, maintenance, and cargo handling.
Supply vessels are the main source of emission of greenhouse gasses in the upstream logistics.
Bad weather conditions lead to high fuel consumption or emissions (Norlund, et al., 2015). By
increasing the offshore oil and gas production, the vessel traffic also increased and air
pollution is a barrier for the supply vessels operations and planners. There are many
regulations have been proposed and design of vessel are given to overcome this problem.
(Diaz-de-Baldasano, et al., 2014)
Loading and unloading
The arrival and departure time of the supply vessels at the installations and supply base is
specified in a weekly plan (Maisiuk & Gribkovskaia, 2014). However, the time difference
between arrival and departure of the vessels from the supply base or installation is considered
as the time of loading and unloading process (Aneichyk, 2009).
The high daily rent of the vessel increases the importance of the loading and unloading times.
The efficient and effective process of loading and unloading at the installation and supply
base allows us to increase the sailing time thereby, cost saving as well.
Several factors make this process complicated especially at offshore installations. Before
talking about these factors, it’s necessary to mention that one vessel may visit more than one
installation and go through this process of loading and unloading many times in one trip
(Rowe, et al., 1995).
6.4.1 Key factors
Many incidents are reported in the past decades, many of them are due to the poor positioning
of the crew during the operations. We can sort the factors affects the offshore loading and
unloading activities into two main categories, controllable and uncontrollable. The
controllable factors include the lifting capability of the offshore installation and capability of
supply vessels. On the other hand, wind speed and weather conditions are the most common
uncontrollable factors. (Drift & Weeke, 2015)
The loading and unloading of a deck and bulk cargo can be done simultaneously if the
weather is suitable. However, in a case of high speed wind or waves, this process can be very

44
complex. The chief of the platform, crane operator, and the captain of the supply vessel are
the key personnel involved in the decision making to either pursue this process or not. This
decision may depend on the geographical location of the platform, the capability of the crane
and vessel capability in keeping its position in a high degree of accuracy during the operation
(Drift & Weeke, 2015; Aas, et al., 2009).
Logistic activities in the Edvard Grieg field
Edvard Grieg, the case study of this thesis, is an oil field located in the Utsira High area in the
central North Sea, about 180 Km west of Stavanger. This field contains more than 20 wells.
The main supply base of the logistics activities is Tananger (Lundin, 2017)
6.5.1 Loading and unloading of drilling fluids
On the base, Drilling fluids are prepared in tanks. Each type of drilling fluids (water based, oil
and Synthetic based) has a different onshore storing tank. Similarly, there are several tanks on
the vessel. A hose is used to Load/unload drilling fluids from the onshore tanks, or the
Figure 6-2 The Edvard Grieg field. Source: Lundin Norway AS

45
offshore installations to/from the vessels. The Figure 6-3 shows the loading and unloading of
drilling fluids by hose (an orange color pipe is a hose).
Drilling fluid loading and unloading activities are done twice each trip. First drilling fluids are
loaded in Tananger base and then unloaded as the Edvard Grieg installation. Two employees
are involved in the communication part of this operation, one at the base and the other is on
the vessel. The process starts when both parties confirm the settings of the process. When
drilling fluid flows, both inlet and outlet meters are used to measure the flow amount. The
amount to send depends on the storing capacity of the installation and the demand.
6.5.2 Storing drilling fluids in the Edvard Grieg field
Total drilling fluid storage capacity on Edvard Grieg is 1024 m3. Total brine (water) capacity
is 790m3. The Figure 6-4 below shows pit layout on Edvard Grieg. Total storage capacity
includes Pit 1, 2,3,4,5,6,7,8. Here are 2 brine tanks with 395m3 capacity each. In situations
where the drilling fluid need exceeds available capacity, a temporary vessel is used to as
storing facility to store drilling fluids
Figure 6-3 The loading and unloading of drilling fluids.
Source: Lundin Norway AS

46
Transportation cost elements
Lundin is renting two supply vessels to transport cargo from Tanager to the Edvard Grieg
field. The vessels are Viking prince and Island Commander. These vessels are multipurpose
vessels, meaning that they are used to transport both deck and bulk cargo. The daily rent of
the vessels is 80,000 and 189,000 NOK respectively. Each vessel is capable of transporting up
to 800 m3 of drilling fluids per trip.
6.6.1 Operating cost
A trip from Tananger to Edvard Grieg is about 180 kilometers. The fuel consumption is a
function of vessel load and sailing speed. In good weather conditions, the average fuel
consumption is 2 to 4 meter cubes. One meter cube of fuel costs 5,500 NOK. In case of an
urgent cargo, the consumption will jump to about 4 to 8 meter cubes. The average total cost of
fuel consumption in good weather is about NOK 18,000 per trip, however, the cost jumps to
NOK 35,000 in a case of urgent cargo. The cost is expected to be higher in a case of bad
weather condition. Loading and unloading of drilling fluids are done through hoses. There is
Figure 6-4 Pit Layout at the Edvard Grieg field. Source: Lundin Norway AS
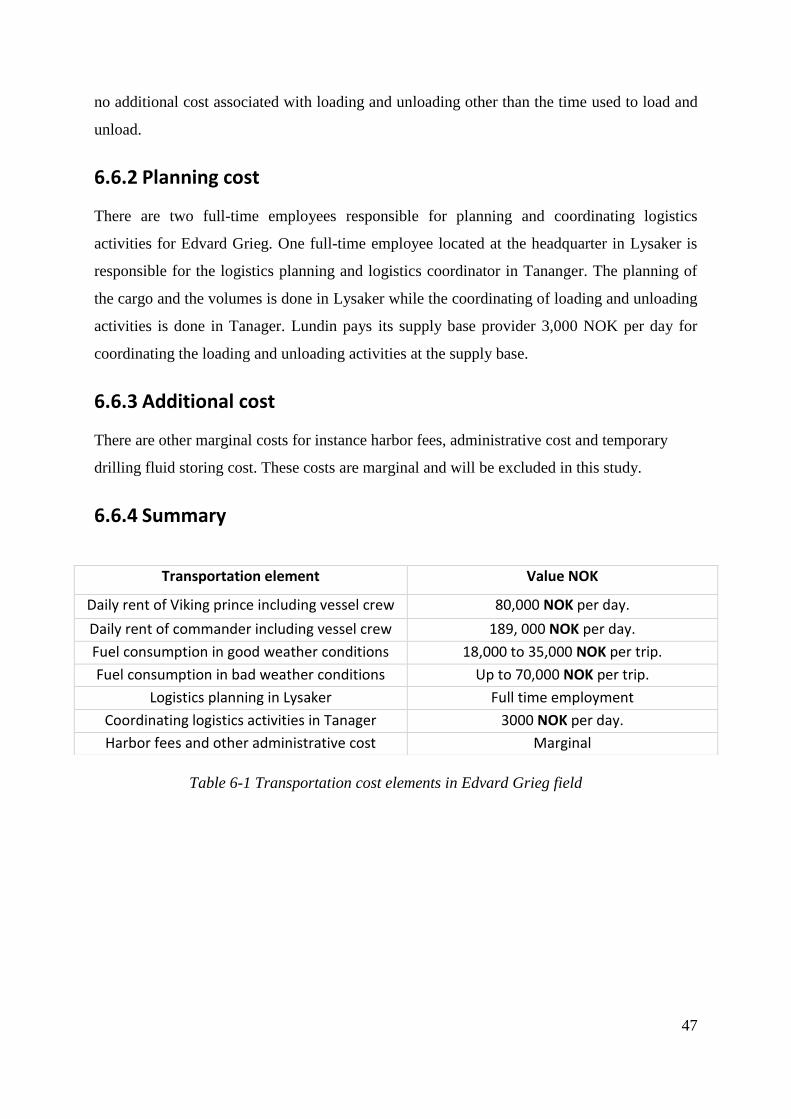
47
no additional cost associated with loading and unloading other than the time used to load and
unload.
6.6.2 Planning cost
There are two full-time employees responsible for planning and coordinating logistics
activities for Edvard Grieg. One full-time employee located at the headquarter in Lysaker is
responsible for the logistics planning and logistics coordinator in Tananger. The planning of
the cargo and the volumes is done in Lysaker while the coordinating of loading and unloading
activities is done in Tanager. Lundin pays its supply base provider 3,000 NOK per day for
coordinating the loading and unloading activities at the supply base.
6.6.3 Additional cost
There are other marginal costs for instance harbor fees, administrative cost and temporary
drilling fluid storing cost. These costs are marginal and will be excluded in this study.
6.6.4 Summary
Transportation element Value NOK
Daily rent of Viking prince including vessel crew 80,000 NOK per day.
Daily rent of commander including vessel crew 189, 000 NOK per day.
Fuel consumption in good weather conditions 18,000 to 35,000 NOK per trip.
Fuel consumption in bad weather conditions Up to 70,000 NOK per trip.
Logistics planning in Lysaker Full time employment
Coordinating logistics activities in Tanager 3000 NOK per day.
Harbor fees and other administrative cost Marginal
Table 6-1 Transportation cost elements in Edvard Grieg field
48
7.0 Preliminary analysis:
Before data collection, a preliminary analysis was conducted to understand and predict the
potential benefit of upgrading/adding a centrifuge to the solid control system. The preliminary
analysis consisted of an illustrative case study, data screening, and event tree analysis. The
aim of this preliminary analysis was to in general define the role of the centrifuge and
measure its contribution in reducing drilling fluid consumption.
Illustrative case study:
A preliminary illustrative case study was conducted on a drilling well in Saudi Arabia. The
availability of data was the main reason for selecting this case.
The case study showed that using a centrifuge reduce 1.2 m3 per meter, this results in saving
around 5000 USD dollars in total for the drilled section, the section length is 500 meter. In
addition to drilling fluids cost saving, each m3 of drilling fluid has an associated logistics cost.
This cost includes transportation, storing and drilling fluid disposal cost. See Appendix 2
From this study, we have learned that the use of the centrifuge contributes in reducing drilling
fluid consumption volume. It also has a positive effect on onshore logistics activities as it
provides more storage area, less transportation, and fewer disposal volumes and it’s expected
to have better results if applied offshore where logistics activities are more challenging and
expensive.
The main goal of our study is to investigate the influence of upgraded solid control system on
dilution rate and total system cost. In this onshore illustrative case, results show savings both
in drilling fluid cost and logistics. The higher offshore cost structure encouraged us to
investigate the influence of upgrading the solid control system offshore. Furthermore, in
Norway, the vast majority of drilling activities are offshore and the offshore penetrating
pattern is further expanding, thus, it was essential to select a Norwegian offshore operator.
The high offshore drilling activities in the Edvard Grieg, drilling more than 15 wells, and the
recent upgrade of the solid control system by adding the centrifuge were the main reasons for
selecting the Edvard Grief field for this study.
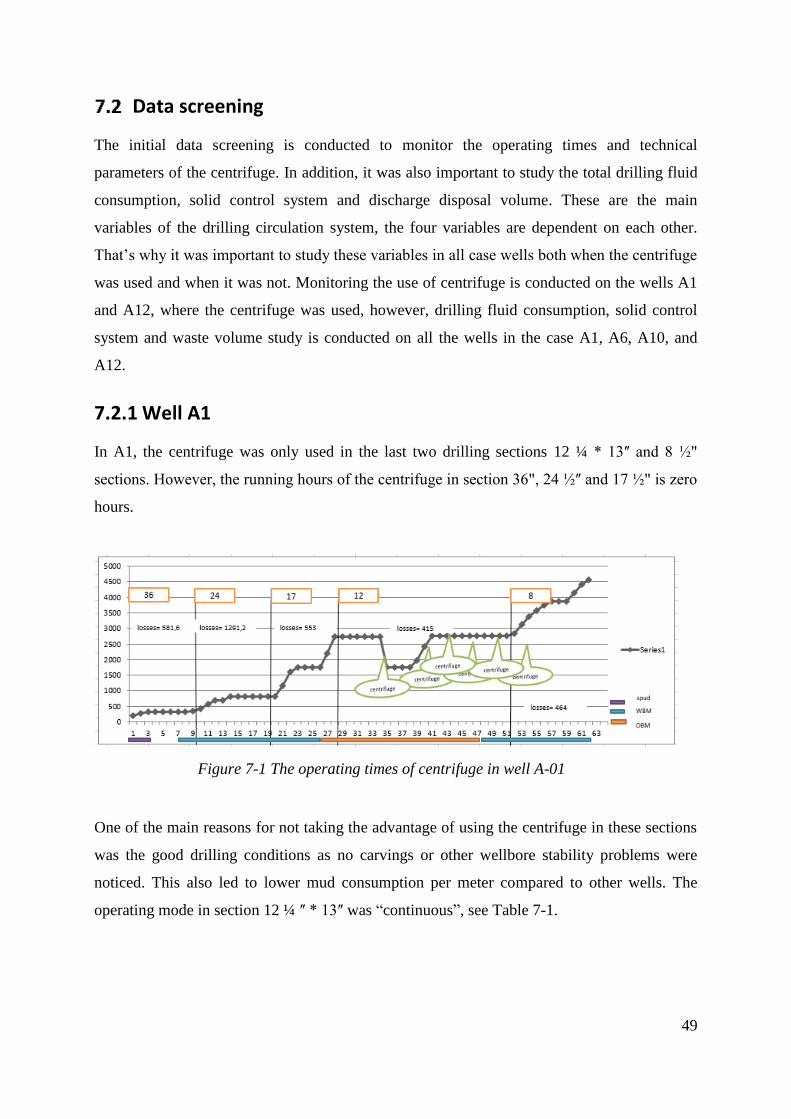
49
Data screening
The initial data screening is conducted to monitor the operating times and technical
parameters of the centrifuge. In addition, it was also important to study the total drilling fluid
consumption, solid control system and discharge disposal volume. These are the main
variables of the drilling circulation system, the four variables are dependent on each other.
That’s why it was important to study these variables in all case wells both when the centrifuge
was used and when it was not. Monitoring the use of centrifuge is conducted on the wells A1
and A12, where the centrifuge was used, however, drilling fluid consumption, solid control
system and waste volume study is conducted on all the wells in the case A1, A6, A10, and
A12.
7.2.1 Well A1
In A1, the centrifuge was only used in the last two drilling sections 12 ¼ * 13ʺ and 8 ½"
sections. However, the running hours of the centrifuge in section 36", 24 ½ʺ and 17 ½" is zero
hours.
One of the main reasons for not taking the advantage of using the centrifuge in these sections
was the good drilling conditions as no carvings or other wellbore stability problems were
noticed. This also led to lower mud consumption per meter compared to other wells. The
operating mode in section 12 ¼ ʺ * 13ʺ was “continuous”, see Table 7-1.
Figure 7-1 The operating times of centrifuge in well A-01
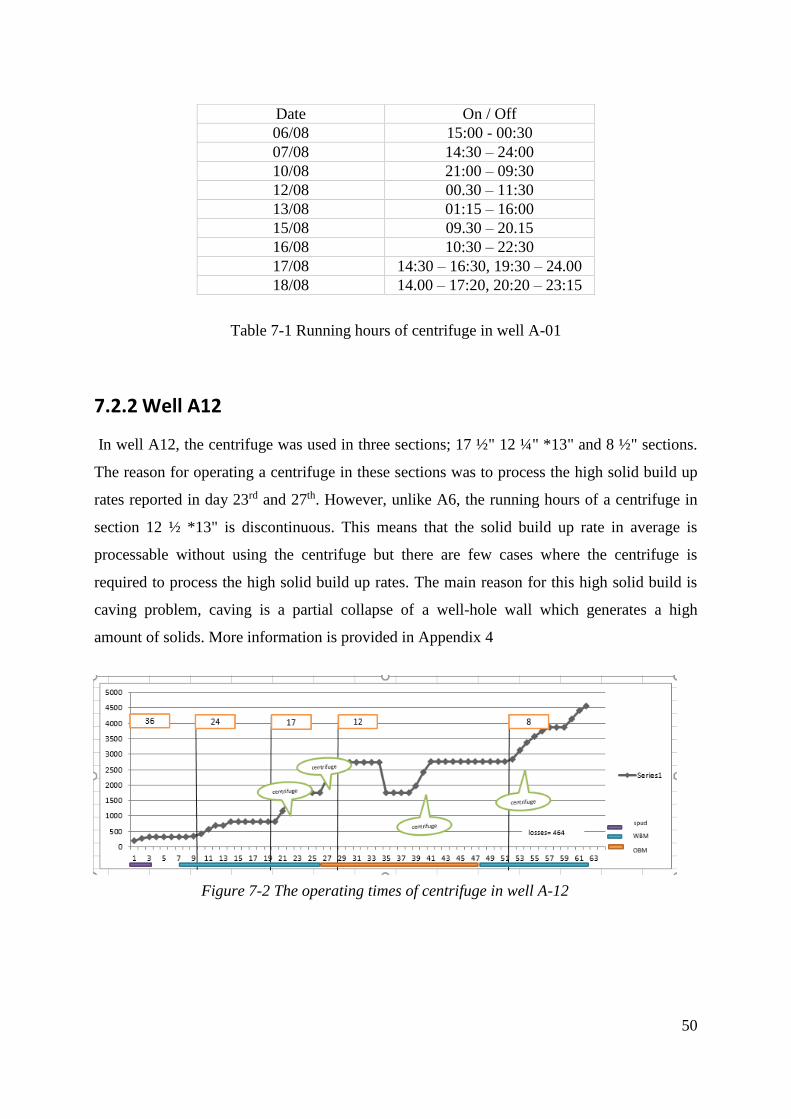
50
Table 7-1 Running hours of centrifuge in well A-01
7.2.2 Well A12
In well A12, the centrifuge was used in three sections; 17 ½" 12 ¼" *13" and 8 ½" sections.
The reason for operating a centrifuge in these sections was to process the high solid build up
rates reported in day 23rd and 27th. However, unlike A6, the running hours of a centrifuge in
section 12 ½ *13" is discontinuous. This means that the solid build up rate in average is
processable without using the centrifuge but there are few cases where the centrifuge is
required to process the high solid build up rates. The main reason for this high solid build is
caving problem, caving is a partial collapse of a well-hole wall which generates a high
amount of solids. More information is provided in Appendix 4
Date On / Off
06/08 15:00 - 00:30
07/08 14:30 – 24:00
10/08 21:00 – 09:30
12/08 00.30 – 11:30
13/08 01:15 – 16:00
15/08 09.30 – 20.15
16/08 10:30 – 22:30
17/08 14:30 – 16:30, 19:30 – 24.00
18/08 14.00 – 17:20, 20:20 – 23:15
Figure 7-2 The operating times of centrifuge in well A-12
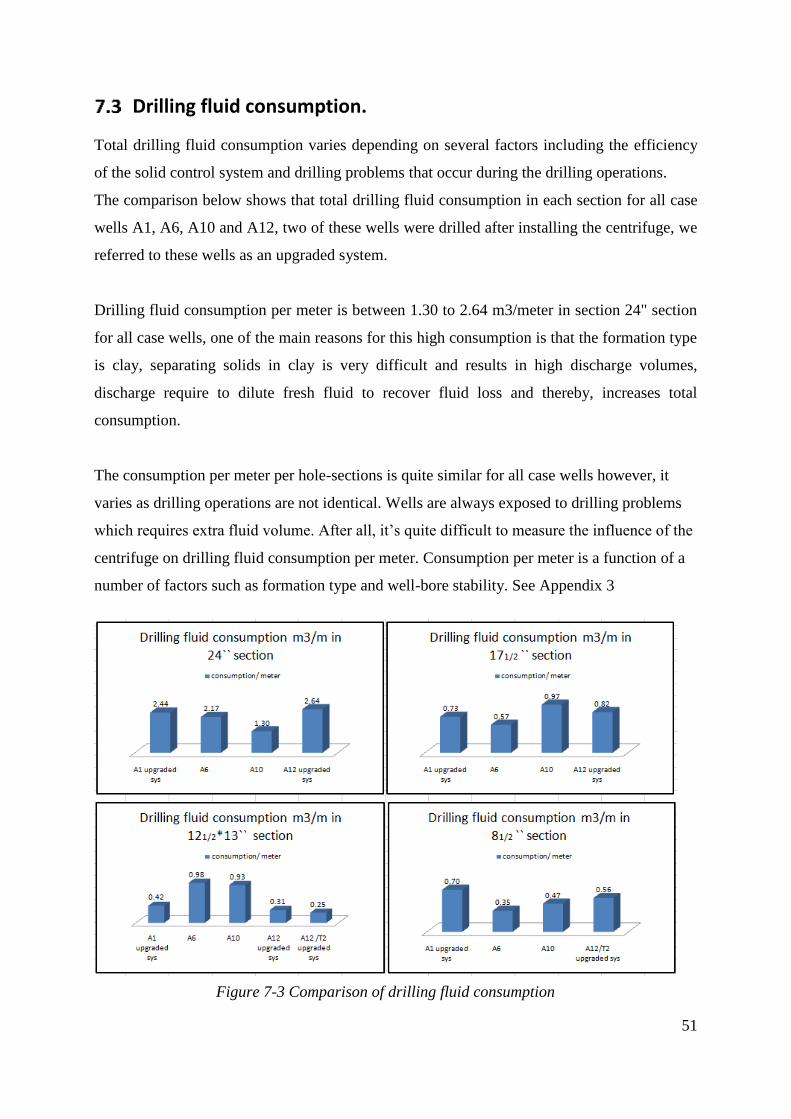
51
Drilling fluid consumption.
Total drilling fluid consumption varies depending on several factors including the efficiency
of the solid control system and drilling problems that occur during the drilling operations.
The comparison below shows that total drilling fluid consumption in each section for all case
wells A1, A6, A10 and A12, two of these wells were drilled after installing the centrifuge, we
referred to these wells as an upgraded system.
Drilling fluid consumption per meter is between 1.30 to 2.64 m3/meter in section 24" section
for all case wells, one of the main reasons for this high consumption is that the formation type
is clay, separating solids in clay is very difficult and results in high discharge volumes,
discharge require to dilute fresh fluid to recover fluid loss and thereby, increases total
consumption.
The consumption per meter per hole-sections is quite similar for all case wells however, it
varies as drilling operations are not identical. Wells are always exposed to drilling problems
which requires extra fluid volume. After all, it’s quite difficult to measure the influence of the
centrifuge on drilling fluid consumption per meter. Consumption per meter is a function of a
number of factors such as formation type and well-bore stability. See Appendix 3
Figure 7-3 Comparison of drilling fluid consumption

52
This encouraged us to carry out an event tree analysis and ask specialists about the role of the
centrifuge in reducing drilling fluid consumption in high solid build up rates. In addition, a
quantitative model was built to precisely estimate the influence of upgrading the solid control
system on total drilling fluid consumption and associated logistic cost.
Event tree analysis
To understand how the centrifuge contributes in reducing dilution rate, it was necessary to
conduct a decision/Event tree analysis. Event tree analysis is conducted to understand the role
of centrifuges in processing drilling fluids. In Figure 7-4, initial event is the high solid build
up. The figure represents the sequence of decisions to be taken and events to occur in order to
process high solid build up rates. A three stages event tree is suggested to overcome high
solids build up rates after interviewing drilling engineers and drilling fluids specialized
engineers.
In the first stage, the decision is to monitor the shakers closely and screen up with finer
screens when possible. The success of this approach depends on several factors, such as the
actual performance of the shakers, the dexterity of the shaker hands, and more importantly
drilling rate of penetration ROP and the temperature of the mud. Cold mud will plug fine
screens and just overflow, likewise with high ROP. Screening up is thus the preferred
approach but may result in losing more mud.
Figure 7-4 The event tree analysis for high solid build up
53
In the second stage, the decision is to run the centrifuge to process more solids. The success of
this approach depends on the processing capacity of the centrifuge. Usually, centrifuges have
a limited processing capacity of less than 25% of total active drilling fluid system.
In the third stage, the decision is to circulate the mud system whenever possible when not
drilling. This allows to clean the hole as circulating the drilling fluid system runs the mud
over the fine shaker screens and removes more solids. So, again it depends on the actual
performance of the shakers.
In the fourth stage, the decision is to dilute fresh fluid, which is often used in addition to the
other two methods. One of the main problems with dilution, especially for lengthy sections is
pit space. Space is a luxury offshore and must be managed carefully. In addition, building
excess mud that must be disposed of causes logistic cost in addition to material costs.
As a conclusion, the analysis explains the role of the centrifuge in processing high solid build
up rates. The analysis shows that the use of centrifuge is going to mitigate the sequences of
the solid build up. If the centrifuge is not used, the next two events are going to occur;
circulating the drilling fluid system and diluting extra drilling fluid volume. These two steps
are time consuming and costly, the time consumed in circulating the mud system is
unproductive time, as no drilling penetration occurs at this time. In addition, diluting extra
drilling fluid is an extra cost and will result in additional logistics cost of drill cutting waste.
The next chapter includes more precise analysis on determining the size of the benefit of
using the centrifuge.
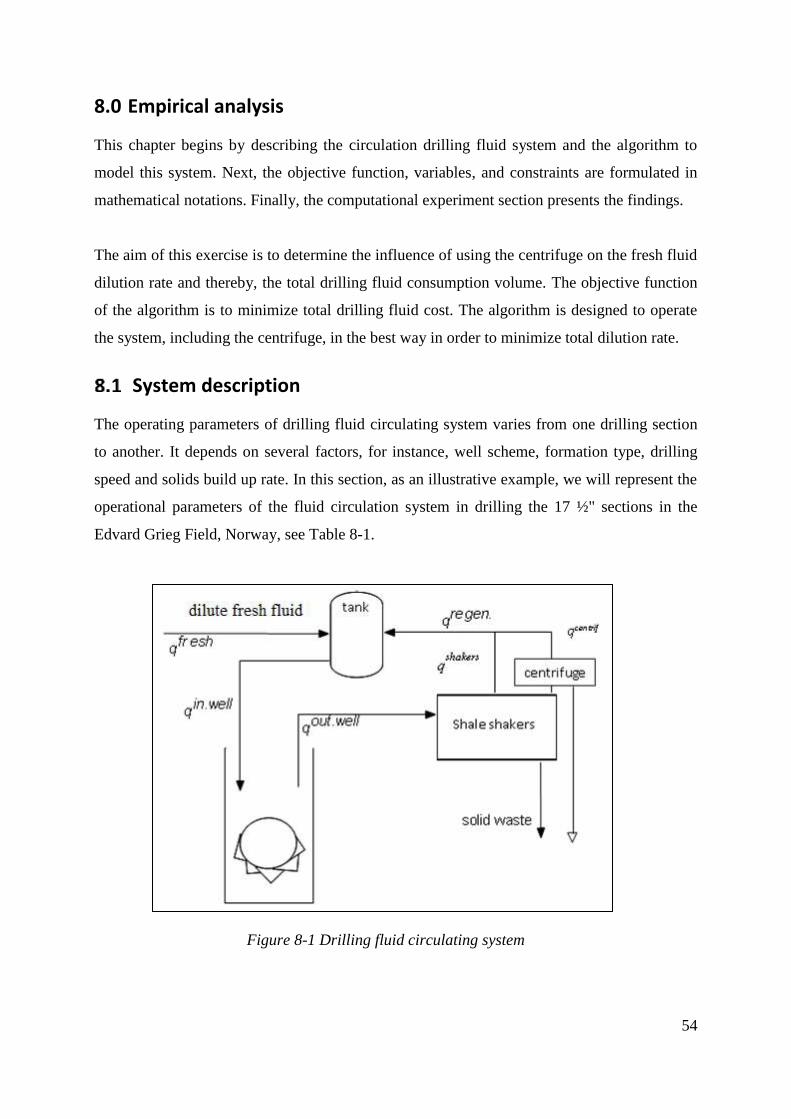
54
8.0 Empirical analysis
This chapter begins by describing the circulation drilling fluid system and the algorithm to
model this system. Next, the objective function, variables, and constraints are formulated in
mathematical notations. Finally, the computational experiment section presents the findings.
The aim of this exercise is to determine the influence of using the centrifuge on the fresh fluid
dilution rate and thereby, the total drilling fluid consumption volume. The objective function
of the algorithm is to minimize total drilling fluid cost. The algorithm is designed to operate
the system, including the centrifuge, in the best way in order to minimize total dilution rate.
System description
The operating parameters of drilling fluid circulating system varies from one drilling section
to another. It depends on several factors, for instance, well scheme, formation type, drilling
speed and solids build up rate. In this section, as an illustrative example, we will represent the
operational parameters of the fluid circulation system in drilling the 17 ½" sections in the
Edvard Grieg Field, Norway, see Table 8-1.
Figure 8-1 Drilling fluid circulating system

55
The drilling fluid is pumped into the well (q in.well) while the well is drilled using a mud
pump. The solid content of the mud raises as it reaches the hole (Sc out.well). The increase in
the solid content depends on several factors, such as the Rate of Penetration (ROP), well
schematic and formation type. Drilling mud flows through the mud return line upon its return
from the hole to the surface (q out.well). In order to control the solid content, drilling mud
flows to the shale shakers, then some of the outflow of shale shakers (q shakers) flows to the
centrifuge, this depends on the maximum processing capacity of the centrifuge. “Centrifuges
can typically handle only about 15% of the active system”. The summation of the outflow
from shakers and centrifuge (q regenerated) returns back to the tank.
In order to recover the volume lost in the well and solid control equipment (solid waste), an
extra volume of drilling mud must build and pumped to the tank. (q regenerated + q fresh).
The process of adding a fresh mud to the system is known as a dilution in the drilling
industry. Dilution is also used when the efficiency of the solid control system is not sufficient
to keep the solid content as required. In this case, some of the existing fluid is dumped and
replaced with a fresh mud with a lower solid content. The notations used in this circulation
system are given in the table below with the description.
Notation Description value
qin.well The flow rate of the drilling fluid delivered to the well. ≥4500, ≤ 5000
Scin.well Solids content in the fluid delivered to the well. ≤6%
qout.well The flow rate of the used drilling fluid delivered from the well to the Solid control system.
≥4500, ≤ 5000
Scout.well Average solids content in the fluid coming from the well. 155 Liters/minute
Scout.well Solids content in the fluid coming from the well in case of caving problem.
1055 liters/minute
qshakers The flow rate of the drilling fluid out of the shakers. Variable
Cshakers Maximum fluid processing capacity of shakers ≤ 5000 liters/minute
Scshakers Solids content in the drilling fluid out of the shakers. 75%
qcentrifuge The flow rate of the drilling fluid out of the centrifuge. 25%
Ccentrifuge Maximum fluid processing capacity of centrifuge ≤ 400 liters/minute
Sccentrifuge Solids content in the drilling fluid out of the centrifuge. Variable
qfresh Dilution rate of “fresh” drilling fluid to the tank. Variable
qregenerated Mud outflow from the solid control equipment. Variable
Table 8-1 Operating parameters of section 17 ½" in the Edvard Grieg field

56
Algorithm description
The considered problem is a simple continuous flow problem. The idea of our algorithm is
based on the assumption that the system consists of four main components, the components
are; well, shale-shakers, centrifuge, and the fresh drilling fluid tank.
For modeling purposes, two variables were made to model drilling fluid flow. This flow is a
mixture of two components drilling fluid and solid content, both components are changing in
each cycle over the system. The model assumes that these are two separate flows and the
summation of these two variables represent the actual fluid flow. Also, in order to model the
initial solid content, a constraint is made with an index of (t -1) when t = 2... T, this allows us
to define the solid content value in the first cycle. Another constraint was made to define the
total initial fluid flow.
In Edvard Grieg Field, the maximum allowed drilling rate of penetration (ROP) is 35 meters
per minute (hour?), this rate generates a fixed rate of 155 liters of solids per minute. It means
that each minute, the solid content of drilling fluid outflow increases by 155 liters. This model
considers a constant parameter to represent solids generation, however, in the real life, ROP is
a variable rate, and the generated solids vary widely on this variable.
Four balance flow constraints are built for the four system components to assure that inflow
equals to outflow at each point. However, this is not the case for shale-shaker and centrifuge,
as they were modeled with a specific separation efficiency and operating capacity. In each
cycle, both the shale-shaker and centrifuge processes a specific amount of solid flow and a
small fraction of fluid flow, the separation of fluid flow is undesirable in real life situations
but it exists and known as slippage volume.
The model suggests two conditions to dilute fresh drilling fluid, either to recover the fluid loss
in solid control equipment (shale-shaker and centrifuge) or to keep total solid content rate
below 6 percent. A specific cost was used for each liter of dilution volume, this cost includes
purchasing drilling fluid cost and the cost of associated logistic activities.
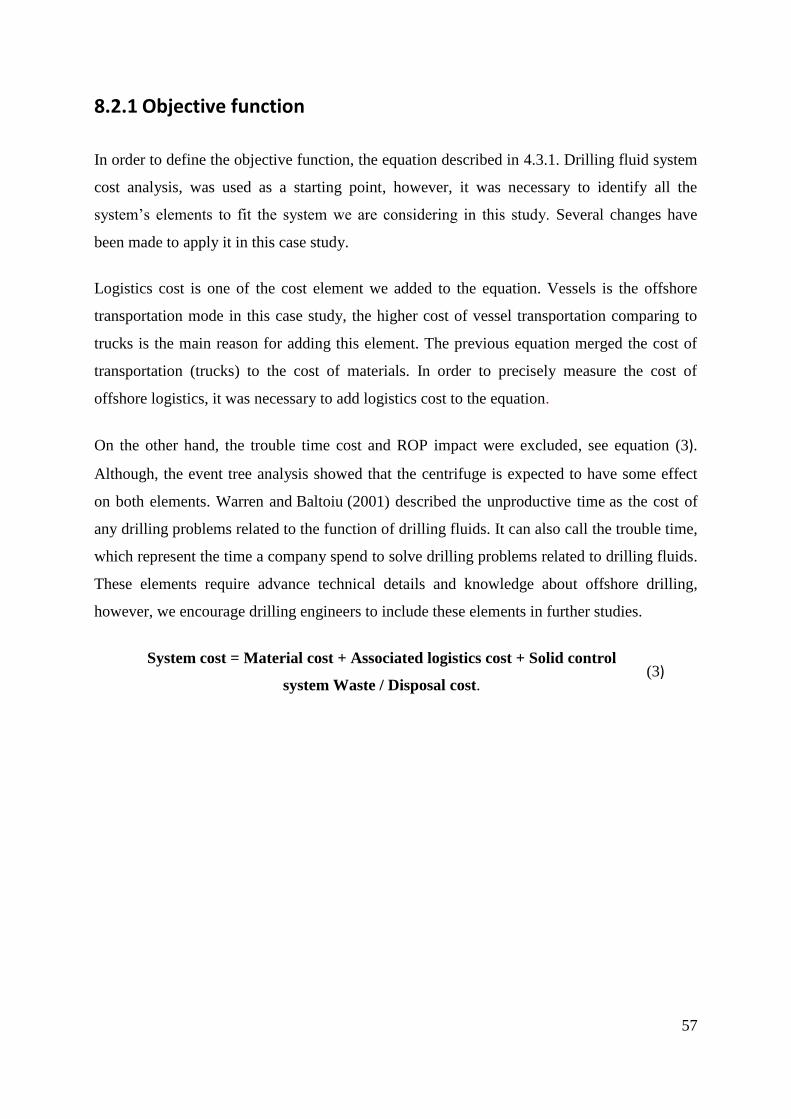
57
8.2.1 Objective function
In order to define the objective function, the equation described in 4.3.1. Drilling fluid system
cost analysis, was used as a starting point, however, it was necessary to identify all the
system’s elements to fit the system we are considering in this study. Several changes have
been made to apply it in this case study.
Logistics cost is one of the cost element we added to the equation. Vessels is the offshore
transportation mode in this case study, the higher cost of vessel transportation comparing to
trucks is the main reason for adding this element. The previous equation merged the cost of
transportation (trucks) to the cost of materials. In order to precisely measure the cost of
offshore logistics, it was necessary to add logistics cost to the equation.
On the other hand, the trouble time cost and ROP impact were excluded, see equation (3).
Although, the event tree analysis showed that the centrifuge is expected to have some effect
on both elements. Warren and Baltoiu (2001) described the unproductive time as the cost of
any drilling problems related to the function of drilling fluids. It can also call the trouble time,
which represent the time a company spend to solve drilling problems related to drilling fluids.
These elements require advance technical details and knowledge about offshore drilling,
however, we encourage drilling engineers to include these elements in further studies.
System cost = Material cost + Associated logistics cost + Solid control
system Waste / Disposal cost.
(3)

58
Mathematical formulation
Nomenclature
Notations Description
Indices
𝑡 Time periods
Parameters
𝑆𝑝𝑒𝑟 Percentage of fluid waste flow from shakers
𝑆𝑟𝑒𝑚 Efficiency of shakers to remove solids
𝐶𝑝𝑒𝑟 Percentage of fluid waste flow from centrifuge
𝐶𝑟𝑒𝑚 Efficiency of centrifuge to remove solids
𝑆𝑝𝑟𝑜 Production of solids
𝐶𝑓𝑟𝑒𝑠ℎ Cost of fresh fluid (dilution)
𝐶𝑐𝑒𝑛𝑡 Cost of centrifuge operations per liter of fluids
𝐶𝑓𝑤 Cost of fluids waste handling per liter of the fluid
𝐶𝑠𝑤 Cost of solids waste handling per liter of the solids
∆𝜏 Duration of every time period
𝑇 Number of tie periods
Variables (fluid flow)
𝐼𝑡 Amount of fluid injected into the well, 𝑡 = 1, . . , 𝑇
𝑂𝑡 Amount of fluid come out from the well, 𝑡 = 1, . . , 𝑇
𝛼𝑡 Fluid inflow to shakers from well, 𝑡 = 1, . . , 𝑇
𝛽𝑡 Outflow from shaker to tank, 𝑡 = 1, . . , 𝑇
𝛾𝑡 Outflow from shakers to centrifuge, 𝑡 = 1, . . , 𝑇
𝜇𝑡 Waste generated by shakers, 𝑡 = 1, . . , 𝑇
𝑁𝑡 Inflow to centrifuge from shakers, 𝑡 = 1, . . , 𝑇
𝑈𝑡 Outflow from centrifuge to tank, 𝑡 = 1, . . , 𝑇
𝜔𝑡 Waste generated by centrifuge, 𝑡 = 1, . . , 𝑇
𝑘𝑡 Inflow to tank from centrifuge and shakers, 𝑡 = 1, . . , 𝑇
𝑓𝑡 Amount of fresh fluid added, 𝑡 = 1, . . , 𝑇
𝑥𝑡 Outflow from tank to well (injection again), 𝑡 = 1, . . , 𝑇

59
Variables (solids flow)
𝑦𝑡 Solids in fluid injected to well, 𝑡 = 1, . . , 𝑇
𝑧𝑡 Solids come out from the well, 𝑡 = 1, . . , 𝑇
𝑙𝑡 Solids comes to shakers, 𝑡 = 1, . . , 𝑇
𝑚𝑡 Solids outflow from shakers to tank, 𝑡 = 1, . . , 𝑇
𝑛𝑡 Solids outflow from shakers to centrifuge, 𝑡 = 1, . . , 𝑇
𝑝𝑡 Solids waste from shakers, 𝑡 = 1, . . , 𝑇
𝑞𝑡 Solids inflow to centrifuge, 𝑡 = 1, . . , 𝑇
𝑟𝑡 Solids outflow from centrifuge to tank, 𝑡 = 1, . . , 𝑇
𝜛𝑡 Solids waste generated by centrifuge, 𝑡 = 1, . . , 𝑇
𝑠𝑡 Solids into the tank from shakers and centrifuge, 𝑡 = 1, . . , 𝑇
𝑣𝑡 Solids injected into the well, 𝑡 = 1, . . , 𝑇
Objective function: minimization of total cost by reducing the amount of diluting fresh
drilling fluid. The first term corresponds to the cost of fresh fluid and amount of fresh fluid
added to the system. The second term corresponds to the cost of handling the fluid waste from
centrifuge and shakers. Similarly, the third term corresponds to the handling cost solids waste
generated from centrifuge and shakers.
𝑚𝑖𝑛𝑖𝑚𝑖𝑧𝑒 ∑ 𝐶𝑓𝑟𝑒𝑠ℎ
𝑇
𝑡=1
. 𝑓𝑡 . ∆𝜏 + 𝐶𝑓𝑤 (𝜔𝑡 . 𝜇𝑡 ) ∆𝜏 + 𝐶𝑠𝑤( 𝑝𝑡. 𝜛𝑡) ∆𝜏 (4)
Constraints:
1. Constraints for fluid flow:
Subject to
The amount fluid injected into the well must be equal to the amount of fluid comes out
from the well.
𝐼𝑡 + 𝑦𝑡 = 𝑂𝑡 + 𝑧𝑡 , 𝑡 = 1, . . , 𝑇 (5)
The amount of fluid comes out from the well must be equal to the inflow to shakers.
𝑂𝑡 = 𝛼𝑡 , 𝑡 = 1, . . , 𝑇 (6)
The amount fluid comes to shakers must be equal to the outflow from shakers (e.g.
tank, centrifuge and removal efficiency).
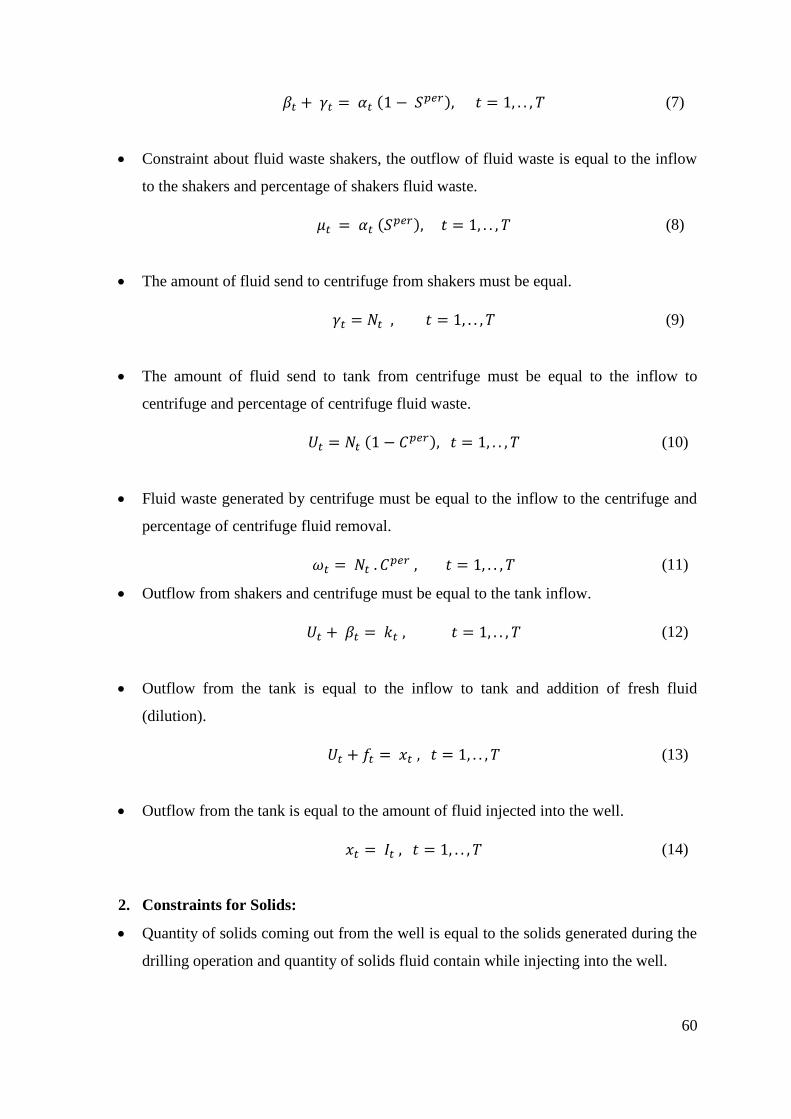
60
𝛽𝑡 + 𝛾𝑡 = 𝛼𝑡 (1 − 𝑆𝑝𝑒𝑟), 𝑡 = 1, . . , 𝑇 (7)
Constraint about fluid waste shakers, the outflow of fluid waste is equal to the inflow
to the shakers and percentage of shakers fluid waste.
𝜇𝑡 = 𝛼𝑡 (𝑆𝑝𝑒𝑟), 𝑡 = 1, . . , 𝑇 (8)
The amount of fluid send to centrifuge from shakers must be equal.
𝛾𝑡 = 𝑁𝑡 , 𝑡 = 1, . . , 𝑇 (9)
The amount of fluid send to tank from centrifuge must be equal to the inflow to
centrifuge and percentage of centrifuge fluid waste.
𝑈𝑡 = 𝑁𝑡 (1 − 𝐶𝑝𝑒𝑟), 𝑡 = 1, . . , 𝑇 (10)
Fluid waste generated by centrifuge must be equal to the inflow to the centrifuge and
percentage of centrifuge fluid removal.
𝜔𝑡 = 𝑁𝑡 . 𝐶𝑝𝑒𝑟 , 𝑡 = 1, . . , 𝑇 (11)
Outflow from shakers and centrifuge must be equal to the tank inflow.
𝑈𝑡 + 𝛽𝑡 = 𝑘𝑡 , 𝑡 = 1, . . , 𝑇 (12)
Outflow from the tank is equal to the inflow to tank and addition of fresh fluid
(dilution).
𝑈𝑡 + 𝑓𝑡 = 𝑥𝑡 , 𝑡 = 1, . . , 𝑇 (13)
Outflow from the tank is equal to the amount of fluid injected into the well.
𝑥𝑡 = 𝐼𝑡 , 𝑡 = 1, . . , 𝑇 (14)
2. Constraints for Solids:
Quantity of solids coming out from the well is equal to the solids generated during the
drilling operation and quantity of solids fluid contain while injecting into the well.
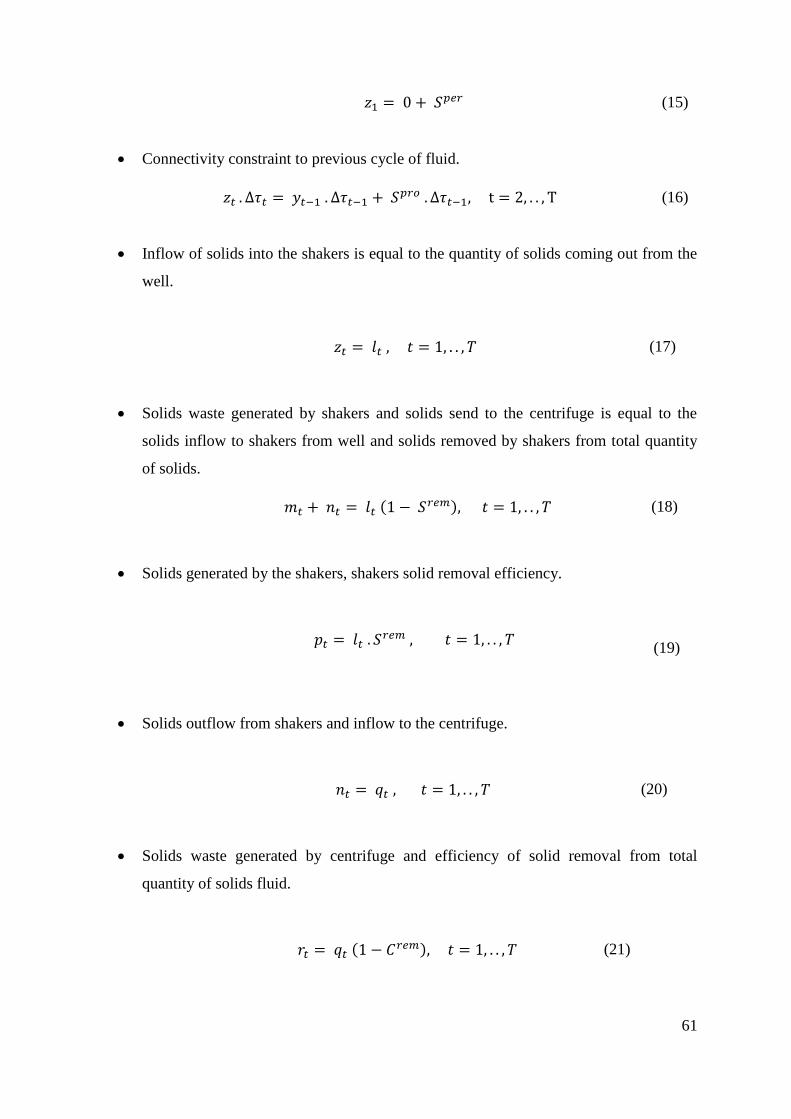
61
𝑧1 = 0 + 𝑆𝑝𝑒𝑟 (15)
Connectivity constraint to previous cycle of fluid.
𝑧𝑡 . ∆𝜏𝑡 = 𝑦𝑡−1 . ∆𝜏𝑡−1 + 𝑆𝑝𝑟𝑜 . ∆𝜏𝑡−1, t = 2, . . , T (16)
Inflow of solids into the shakers is equal to the quantity of solids coming out from the
well.
𝑧𝑡 = 𝑙𝑡 , 𝑡 = 1, . . , 𝑇 (17)
Solids waste generated by shakers and solids send to the centrifuge is equal to the
solids inflow to shakers from well and solids removed by shakers from total quantity
of solids.
𝑚𝑡 + 𝑛𝑡 = 𝑙𝑡 (1 − 𝑆𝑟𝑒𝑚), 𝑡 = 1, . . , 𝑇 (18)
Solids generated by the shakers, shakers solid removal efficiency.
𝑝𝑡 = 𝑙𝑡 . 𝑆𝑟𝑒𝑚 , 𝑡 = 1, . . , 𝑇
(19)
Solids outflow from shakers and inflow to the centrifuge.
𝑛𝑡 = 𝑞𝑡 , 𝑡 = 1, . . , 𝑇 (20)
Solids waste generated by centrifuge and efficiency of solid removal from total
quantity of solids fluid.
𝑟𝑡 = 𝑞𝑡 (1 − 𝐶𝑟𝑒𝑚), 𝑡 = 1, . . , 𝑇 (21)
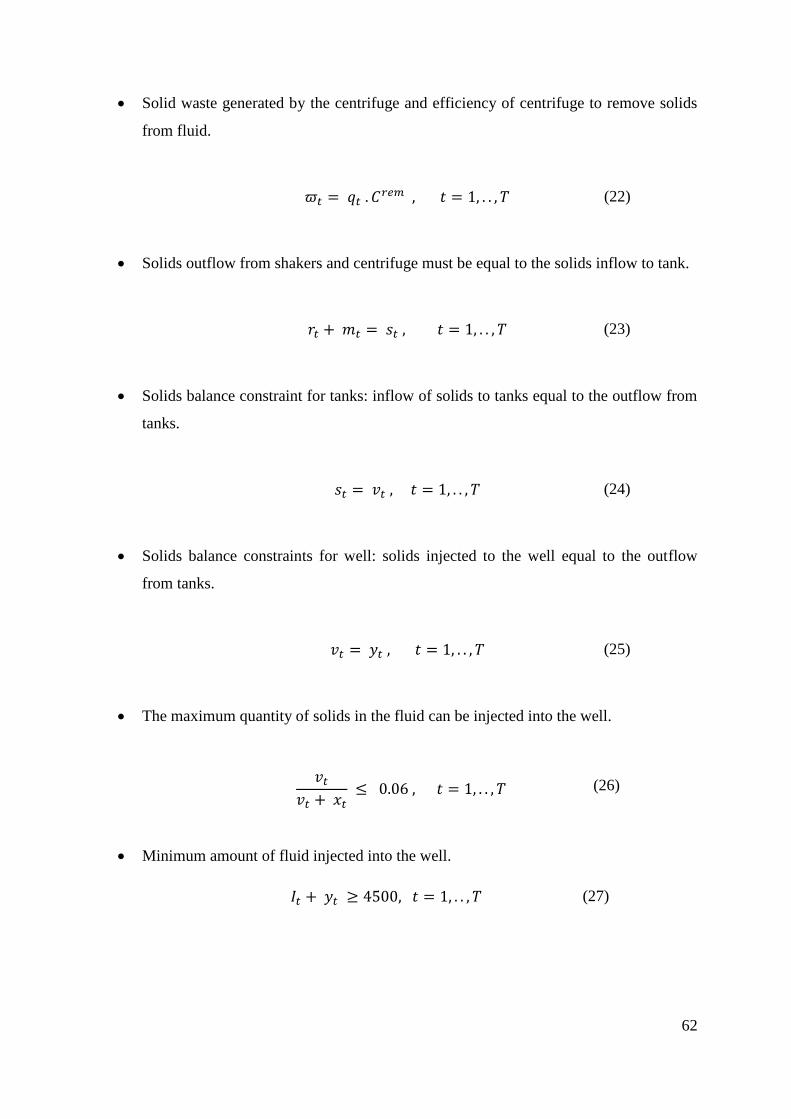
62
Solid waste generated by the centrifuge and efficiency of centrifuge to remove solids
from fluid.
𝜛𝑡 = 𝑞𝑡 . 𝐶𝑟𝑒𝑚 , 𝑡 = 1, . . , 𝑇 (22)
Solids outflow from shakers and centrifuge must be equal to the solids inflow to tank.
𝑟𝑡 + 𝑚𝑡 = 𝑠𝑡 , 𝑡 = 1, . . , 𝑇 (23)
Solids balance constraint for tanks: inflow of solids to tanks equal to the outflow from
tanks.
𝑠𝑡 = 𝑣𝑡 , 𝑡 = 1, . . , 𝑇 (24)
Solids balance constraints for well: solids injected to the well equal to the outflow
from tanks.
𝑣𝑡 = 𝑦𝑡 , 𝑡 = 1, . . , 𝑇 (25)
The maximum quantity of solids in the fluid can be injected into the well.
𝑣𝑡
𝑣𝑡 + 𝑥𝑡 ≤ 0.06 , 𝑡 = 1, . . , 𝑇 (26)
Minimum amount of fluid injected into the well.
𝐼𝑡 + 𝑦𝑡 ≥ 4500, 𝑡 = 1, . . , 𝑇 (27)
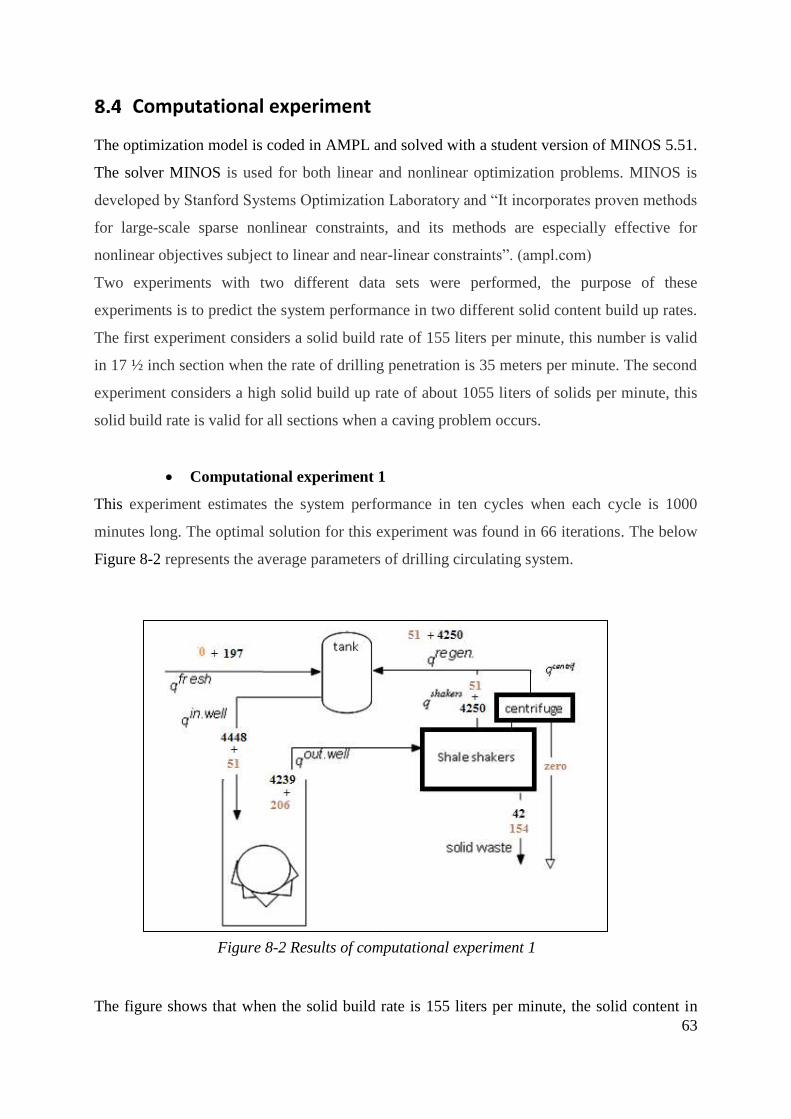
63
Computational experiment
The optimization model is coded in AMPL and solved with a student version of MINOS 5.51.
The solver MINOS is used for both linear and nonlinear optimization problems. MINOS is
developed by Stanford Systems Optimization Laboratory and “It incorporates proven methods
for large-scale sparse nonlinear constraints, and its methods are especially effective for
nonlinear objectives subject to linear and near-linear constraints”. (ampl.com)
Two experiments with two different data sets were performed, the purpose of these
experiments is to predict the system performance in two different solid content build up rates.
The first experiment considers a solid build rate of 155 liters per minute, this number is valid
in 17 ½ inch section when the rate of drilling penetration is 35 meters per minute. The second
experiment considers a high solid build up rate of about 1055 liters of solids per minute, this
solid build rate is valid for all sections when a caving problem occurs.
Computational experiment 1
This experiment estimates the system performance in ten cycles when each cycle is 1000
minutes long. The optimal solution for this experiment was found in 66 iterations. The below
Figure 8-2 represents the average parameters of drilling circulating system.
The figure shows that when the solid build rate is 155 liters per minute, the solid content in
Figure 8-2 Results of computational experiment 1

64
the well outflow is going to be 4.9%. Shale shakers will then reduce this percent to 1.1 %,
producing 196 liters per minutes. As shale-shakers handles solids to below the maximum
allowable content 6%, the system suggests to not flow through the centrifuge.
Findings show that total volume of solids generated in 10 cycles is 1998 liters. Processing this
amount of solids the solid control system generates total waste of 1929 liters. To recover this
volume, the system dilution cost is 5884 NOK including logistics cost.
Computational experiment 2
This experiment estimates the system performance in ten cycles when each cycle lasts for
1000 minutes. The optimal solution for this experiment was found in 40 iterations. The below
Figure 8-3 represents the average parameters of drilling circulation system.
The figure shows that if the solid build rate increased to 1055 liters per minutes, the solid
content in well outflow is going to raise to 29.4%. Shale shakers will then reduce the solid
content to 10.5%, producing 1024 liters of waste per cycle. As this percent is above the
allowable percent of 6%, the system suggests to use the centrifuge, the centrifuge is going to
separate 61 liters of waste per cycle, reducing total solid content to 5.9%.
Figure 8-3 Results of computational experiment 2

65
Findings show that total solids generated in 10 cycles are 12974 liters. Processing this amount
of solids in the solid control system will result in generating total waste of 10575 liters. To
recover this volume, the system dilution cost is NOK 35956 including logistics cost, which is
NOK 7785.
Sensitivity Analysis
In order to estimate the influence of using a centrifuge on the other variables of the drilling
fluid circulation system, dilution rate, and disposal volume, we ran the model without a
centrifuge and added one more variable ‘tank fluids waste (Ω𝒕)’. This variable was added to
the constraints (24) and (25) to allow the model to dump a specific volume of the drilling
fluids and dilute the same volume of fresh drilling fluid in order to keep the solid content less
than 6%. The results show that, when centrifuge was not working, the disposal volume
increased from 10860 to 11730 liters and dilution rate increased by 1,000 liters in ten cycles.
In order to define the objective function, several changes were made on the
equation proposed by Warren and Baltoiu (2001). To precisely measure the
cost of offshore logistics, it was necessary to add logistics cost to the equation.
In addition, two elements, trouble time cost, and ROP were excluded,
although, the centrifuge is expected to have some effect on both elements.
These elements require advance technical details, knowledge about offshore
drilling and more time to be estimated.
The results show that in the current operating parameters of the section 17 ½",
the shale shakers can handle the 155 liters of solids generated per minute when
drilling fluid flow rate is between 4500 and 5000 liters per minute. For these
system parameters, the use of the centrifuge is not required and will result in
increasing total operating cost. However, for the many cases when the solid
build up rate increases dramatically, using the centrifuge is going to reduce
total disposal by 15.3% and 8% of dilution rate.
The processing capacity of the centrifuge is going to increase total separation
efficiency of the solid control equipment. The upgraded solid control system is
going to produce 10860 liters of solids. The dilution rate is going to be 10860

66
in total. This means that the system dilutes only to recover the lost volume of
fluids in the solid control system, no extra dilution is required to balance the
total solid content in the tank. In this experiment, for 10 cycles, running the
centrifuge, saved 1,000 liters of fluid. In addition, it reduced the disposal
volume from 11730 to 10860 liters.
There are two purposes of dilution, either to recover separated amount in the solid control
system or to keep total solid content less than 6 percent. When the centrifuge is working, the
separation efficiency is sufficient to handle the generated volume of solids, therefore dilution
rate equals total separated solid volume, however, if the solid control efficiency is not enough,
the centrifuge is not working, and a specific volume of fluid must be dumped and replaced
with fresh dilution to keep total solids content less than 6%.
Figure 8-4 Dilution rate
Dilution
Centrifuge/ off
To recover fluid loss
To keep solid content less than
6%
Centrifuge/ onTo recover fluid
loss
67
9.0 Summary and conclusion
The oil and gas price fall in 2014 has led operating companies to cut further investment in
exploration and production. According to Norwegian Petroleum Directorate 2017, only 36
wells were drilled in 2016 which 47% less than the maximum number of drilled wells in
previous years. This also motivates us among other researchers and research institutes to
study and develop methods to reduce drilling cost structures.
The design of solid control equipment depends on several technical parameters including well
scheme, geological structure, drilling fluid design and solid content rate. Caving problem is
the main cause of high solid build up rate in the Edvard Grieg field, especially during drilling
Hordaland formation. Caving is a partial collapse of borehole walls, it generates a high
amount of cuttings, increasing solid content rate from 155 liters per minute to more than 1000
liters per minutes in average. In the Edvard Grieg, a set of five shale shakers processes high
rate of solids with solid processing efficiency of about 75%. In addition, a centrifuge installed
to process fine solids, practical parameters in the Edvard Grieg proves that the actual
processing capacity of centrifuges is about 400 liters per minute.
Logistics is a key element when it comes to effective and efficient operations and revenue
optimization. Logistics accounts 14% of total offshore drilling cost structure (Osmundsen, et
al., 2010). Core activities of offshore upstream logistics are storage, transportation and
loading and unloading process. Transportation is the most expensive element and it consists
of three major cost elements: daily vessel rent, planning and routing cost and operating cost.
In addition, there are other marginal costs such as harbor fees. In the Edvard Grieg field, the
high daily rent of two vessels is about NOK 269,000. This makes offshore transportation
more expensive than other logistics activities, reducing this cost is a difficult task especially if
the vessel has only one installation to serve. However, if the vessel is serving several
installations, routing, planning and vessel utilization management can contribute to reducing
this cost significantly. Operating cost can widely vary depending on sailing conditions. In the
Edvard Grieg field, fuel consumption is a major cost element in operating cost, it cost about
NOK 18,000 in good weather conditions, however, and this cost jumps to more than double
per trip in case of bad weather condition.

68
The purpose of formulating this research study is to answer the main research question: how
upgrading the solid control system influences total system cost and logistical activities. An
optimization model is built to describe and predict the behavior of drilling circulating system
by using a mathematical programing language. This model allows to understand the current
performance and predict the effects of each component in the system on total system
production and cost. A continuous flow model was built to simulate drilling fluid circulation
system and predict different operating parameters of solid content, disposal amount and
dilution volume in Edvard Grieg field. The model calculates values for the three mentioned
variables within strict constraints of the maximum allowed solid content into the well, a
specific fluid flow rate and operating capacity.
In order to define the objective function, several changes were made on the equation proposed
by Warren and Baltoiu (2001). To precisely measure the cost of offshore logistics, it was
necessary to add logistics cost to the equation. In addition, two elements, trouble time cost,
and ROP were excluded, although, the centrifuge is expected to have some effect on both
elements. These elements require advance technical details, knowledge about offshore drilling
and more time to be estimated.
The event tree analysis conducted in this study shows that the use of centrifuge contributes in
reducing total drilling fluid consumption in case of high solid content rate. The first step when
solid content raise is to check the performance of shale shakers and run the centrifuge. Then,
if the first step didn't work, the second step is to circulate drilling fluid allowing to carry out
more cuttings. The last option is to dilute fresh fluid. To conclude, running the centrifuge
reduces the need for diluting fresh drilling fluid when solid content increases and thereby,
total drilling fluid consumption.
The findings show that the centrifuge is not used in case of average solid built up rate. In
order to make a decision of installing the centrifuge, the preliminary study before drilling a
well can play a vital role. Having a complete information about the behavior and strength of
the formations to be drilled is a key factor in decision making.
Our findings show that there is no need to run the centrifuge when the solid build rate is 155
liters per minute. However, if the solid content exceeds 1000 liters per minute, the total

69
volume of solids sent of solids to the centrifuge is 2450 liters, this results in a reduction in
dilution rate.
The model demonstrates that in 17 ½" section when active circulating fluid is 5000 liters per
minutes, drilling operation generates 155 liters of solids per minute, the duration of fluid
circulation is 1000 minutes, will generate 155 of solids per minute. The current efficiency of
shakers separates 9700 of drill cutting, additionally, 420 liters of associated fluid is wasted as
slippage. Finally, the total dilution rate to recover drilling fluid and cutting waste is 1970
liters.
This study concludes the relationship between drilling circulating components, logistics
activities and waste volumes. In general, the design of solid control equipment influences total
dilution rate and thus total drilling fluid consumption. In Edvard Grieg, the upgrade of the
solid control system by adding centrifuge has a small influence on total drilling fluid
consumption in regular drilling conditions, however, when solids raise the use of the
centrifuge may significantly affect dilution rates. On the other hand, the study concludes that
the influence on logistic activities is marginal in Edvard Grieg however, the influence may be
greater when several installations are being served.
70
Limitations and further research
One of the limitations related to this study is the lack of replications. A study including
multiple cases can be more valid and reliable. In this research, a single case study is used out
thousand offshore wells is used, this study as a basic tool for further studies.
The analysis is based on data collected from different resources and also uses estimated
numbers. Although, authors tried to use numbers as accurate as possible but still there will be
a chance of uncertainties. However, this does not have severe effects on the main conclusion
of the thesis.
Limitations related to the quantitative part of the study is mainly connected to the lack of
availability of secondary data. To the best of the author’s knowledge there is no previous
studies cover solid control system optimization modeling. Most of the Information used to
conduct this research work was mainly based on primary data provided by the Lundin AS in
the form of daily drilling reports, daily mud reports, and interviews.
In this case study, 17 ½ inch section was selected to be modeled, however a more integrated
model which includes all the five drilling sections is expected to produce more practical and
accurate results than smaller per section models.
A fixed rate of 155 liters of solids per meter is applied, this amount of solids is valid in the
maximum drilling penetration rate of 35 meters per minutes in the Edvard Grieg field,
however, and if the rate changed the volume of solids generated would also change. A further
study considering a variable ROP rate of penetration can be more realistic. In addition, an
approximate figure was used for waste and discharge cost. The importance of this figure
increases when considering an integrated model that includes all drilling sections, as the cost
varies from drilling fluid type to another and one hole section to another.
Drilling fluid consumption is a function of several factors. Although this model considers
real-life situations and uses real data, several additional practical measures can improve this
study e.g. drilling problems. Drilling problems have a significant impact on dilution rates and
total drilling fluid consumption.

71
This study investigates and identifies transportation cost elements in the offshore upstream
industry, however, further studies in different geographical locations and company structures
can be interesting.

72
References
Aas, B., Buvik, A. & Cakic, D., 2008a. Outsourcing of logistical activities in a complex
supply chain: a case study from the Norwegian oil and gas industry. International Journal of
Procurement MAnagement, Vol. 1(3).
Aas, B., Gribkovskaia, I., Halskau, Ø. & Shlopak, A., 2007. Routing of supply vessels to
petroleum installations. International Journal of Physics Distribution & Logistics
Management, 37(2), pp. 164-179.
Aas, B., Halskau, Ø. & Wallace, S. W., 2009. Role of supply vessels in offshore logistics.
Maritime Economics and Logistics, 11(3), pp. 302-325.
Aas, B. & Wallace, S. W., 2008b. Management of logistics planning. Production Planning
and Control.
Aneichyk, T., 2009. Simulation model for stratigical fleet sizing and operational planning in
offshore supply vessels operations. Master Thesis, Molde University College (HIM).
ASME, A. S. o. M. E., 2005. Drilling fluids processing handbook.
Bloys, B. et al., 1994. Designing and Managing Drilling fluids, s.l.: s.n.
Bourgoyne Jr, A., Millheim, K., Chenevert, M. & Young Jr., F., 1986. Applied drilling
engineering. s.l.:Society of Petroleum Engineers (SPE).
Bouse, E., 2005. Centrifuge. In: Drilling fluid processing handbook. s.l.:s.n., pp. 303-325.
Brun, A., Aerts, G. & Jerkø, M., 2015. How to achieve 50% reduction in offshore drilling
costs, Designed by Visual Media Europe, Oslo: Oil and gas Practices, Mckinsey & Company..
Caenn, R. & Chillingar, G. V., 1995. Drilling fluids: State of art. Journal of Petroleum
Science and Engineering, Volume 14, pp. 221-230.
Caenn, R., Darkey, H. & Gray, G. R., 2011. Composition and Properties of Drilling and
Completion Fluids. Seventh Ed. ed. s.l.:s.n.
Choi, T. M., Chiu, C. H. & Chan, H. K., 2016. Risk Management of logistics system.
Transportation Research Part E, Volume 90, pp. 1-6.
CSCMP, 2017. Council of Supply Chain Management Professionals. [Online]
Available at:

73
http://cscmp.org/CSCMP/Educate/SCM_Definitions_and_Glossary_of_Terms/CSCMP/Educ
ate/SCM_Definitions_and_Glossary_of_Terms.aspx?hkey=60879588-f65f-4ab5-8c4b-
6878815ef921
[Accessed 05 05 2017].
Diaz-de-Baldasano, M. C., Mateos, F. J., Nunez-Rivas, L. R. & Leo, T. J., 2014. Conceptual
design of offshore platfrom supply vessels based on hybrid diesel generated fuel cell power
plant. Applied Energy, Volume 116, pp. 91-100.
Drift, M. v. d. & Weeke, A., 2015. Offshore Cargo Handling, Rotterdam: s.n.
Ellram, L. M., 1996. The use of the case study method in logigistics research. Journal of
Business Logsitics, 17(2), pp. 93-138.
Engh, H. D., 2015. Optimization of an upstream supply chain. Master Thesis, Norwegian
University of Science and Technology (NTNU).
EnvironmentalNorwegianAgency, 2017. Environmental Norwegian Agency. [Online]
Available at: http://www.environment.no/topics/marine-and-coastal-waters/oil-and-gas-
activities/waste-from-offshore-activities/
[Accessed 20 03 2017].
Facts, 2017. Ministry of Norwegian Petroleum Directorat. [Online]
Available at: http://www.norskpetroleum.no/en
[Accessed 25 3 2017].
Fourer, R., Gay, D. M. & Kernighan, B. W., 2003. AMPL: A Modelling Language for
Mathematical Programming. Second Ed. ed. s.l.:s.n.
Growcock, F. & Harvey, T., 2005. Drilling fluids. In: Drilling fluids processing handbook.
s.l.:American Society of Mechanical Engineers (ASME), pp. 15-66.
Guba, E. G., 1981. ERIC/ECTJ Annual review paper: Criteria for assessing the
Trusttworthiness of naturalistic inquiries. Education, Communication and Technology:
Journal of Theory, Research and Development, 29(2), pp. 75-91.
Huang, D., Chen, T. & Wang, M. J. J., 2001. A fuzzy set approach for Event Tree Analysis.
Fuzzy Sets and System, Volume 118, pp. 153-165.
74
Hussain, R., Assavapokee, T. & Khumawala, B., 2006. Supply chain management in the
petroleum industry: Challenges and Opportunities. International Journal of Global Logistics
& Supply Chain Management, 1(2), pp. 90-97.
Jain, V., Wadhwa, S. & Deshmukh, S. G., 2009. Select supplier - related issues in modelling a
dynamic supply chain: potential challenges and direction for future research. International
Journal of Production Research, Volume 47, pp. 3013-3039.
Kothari, C. R., 2004. Research Methodology: Methods and Technology. Second ed ed.
s.l.:New Age International.
Lawson, D. & Marion, G., 2008. An Introduction to Mathematical Modelling, s.l.: s.n.
Leonard, S. A. & Stegemann, J. A., 2010. Stabilization/solidification of petroleum drill
cuttings. Journal of Hazardous Materials, 174(1-3), pp. 463-472.
Lundin, 2017. s.l.: s.n.
Maisiuk, Y. & Gribkovskaia, I., 2014. Fleet sizing for offshore supply vessels with stochastic
sailing and service times. Procedia Computer Science, Volume 3, pp. 939-948.
Norlund, E. K., Gribkovskaia, I. & Laporte, G., 2015. Supply vessel planning under cost,
environment and robustness considerations.. Omega, Part B, Volume 57, pp. 271-281.
Norskolje museum, n.d. s.l.: s.n.
Osmundsen, P., Roll, K. H. & Tveterås, R., 2010. Exploration drilling productivity at the
Norwegian Shelf. Journal of Petroleum Science and Engineering.
Ramzali, N., Lavasani, M. R. M. & Ghodousi, J., 2015. Safety barriers analysis of offshore
drilling system by emplying fuzzy Event Tree Analysis. Journal of Safety Science, Volume
78, pp. 49-59.
Rausand, M., 2013. Risk assessment: theory, method and applications.
Rowe, S. J., Gilmore, A. H. & Martin, E., 1995. Improving the safety of offshore supply
vessels cargoes. Transaction on the Built Environment, Volume 11.
Saad, S., Zulklifli, M. U. & Norlena, H., 2014. Dynamic supply chain capabilities: a case
study in oil and gas industry. International Journal of Supply Chain Management, 3(2).
75
Shah, N. K., Li, Z. & Ierapetritou, M. G., 2011. Petroleum refining operations: key issues,
advances and opportunities. Industrial and Engineering Chemistry Research, Volume 50, pp.
1161-1170.
Shah, S. N., Shanker, P. E. N. H. & Ogugbue, C. C., 2010. Futuer challenges of drilling fluids
and their rheological measurements. American Association of Drilling Engineering, AADE-
10-DF-HO-41..
Shenton, A. K., 2004. Strategies for ensuring trustworthiness in qualitative research projects.
Education for Information, Volume 22, pp. 63-75.
Silverman, D., 2001. Interpreting Qualitative Data: Methods for Analysing Talk, Text and
Interaction. Second Ed. ed. London: Sage.
Silverman, D., 2006. Qualitative Research: Theory, Method and Practice. Second Ed. ed.
London: Sage.
Sopot, E. & Gribkovskaia, I., 2014. Routing of supply vessels to with deliveries and pickups
of multiple commodities.. Procedia Computer Science, Volume 3, pp. 939-948.
Warren, B. & Baltoiu, L., 2001. Using a System Cost Analysis to quantify drilling fluids and
solid control costs. AADE, National Drilling Technincal Conference.
Wiig, A., 2001. Supply chain management in the oil industry: The Angolan case. Chr.
Michelsen Institute Development Studies and Human Rights.
Williamson, D., 2013. Oil field review, s.l.: s.n.
You, X. & Tonon, F., 2012. Event Tree Analysis with imprecise probabilities. Risk Analysis,
32(2).
Yunita, P., Irawan, S. & Kania, D., 2016. Optimization of Water based drilling fluid using
Non-ionic and Anionic surfactants additives. 4th International Conference on Process
Engineering and Advanced Materials, Volume 148, pp. 1184-1190.
Zhou, D. et al., 2016. Applied propeties of oil based drilling fluids with montmorillonites
modified by cationic and anionic surfactants. Applied Clay Science, Volume 121-122, pp. 1-8.

76
Ministry of Petroleum and Norwegian Petroleum Directorate, Facts 2017 – The Norwegian
Petroleum Sector. Available at http://www.norskpetroleum.no/en Accessed 25/03/2017
Norskolje Museum Norway, Available at:
http://www.norskolje.museum.no/en/category/kadmemap-features-en/bases-kadme-map-
features-en Accessed at (29/03/2017).

77
Appendix
Appendix 1
This interview guide was used in the group interview related to the research study ‘Influence
of upgraded solid control system on the dilution rate and associated logistical activities’.
The interviews were conducted as semi structured and questions were asked related to the
specific field of study to answer the main tasks in the research study. The summary of the
questions, asked during the interviews, is given below.
Introduction: Presented ourselves and research topic.
Employees: following employees were usually interviewed during the meetings.
Bård Fjellså (Production Drilling Manager, Lundin AS)
Trym Elseth (Lead Drilling Engineer, Lundin AS)
Bengt Sola (Operation Manager Drilling and Completion Fluids, Baker Hughes)
Olav Overskott (Head of Logistics, Lundin AS)
The description of each meeting is given below.
I. Analyzing the drilling reports. (1st meeting – 16/02/2017)
Mainly discuss the daily drilling reports, daily mud reports, drilling fluid types and drilling
problems related to drilling fluids. In addition, the consumption of drilling fluids for each
section. The questions were;
i. What is the average rate of penetration (ROP) and what are the parameters to
change the ROP in different sections of the well?
ii. What is the average length of each section and consumed volume of drilling
fluids in each section?
iii. How many types of drilling fluids used in different sections?
iv. What is the solid built up rate with normal ROP and in case caving problem?
v. What are the environmental regulations related to the offshore drilling
operations and disposal?
78
Presentation

79

80
II. Solid control system, common drilling problems and logistics system. (2nd meeting
– 23/02/2017)
Mainly discuss about the recent upgradation in solid control system and role of drilling fluids
and solid control system to overcome the common drilling problems. The question were;
Logistics
Cost of the following:
Drilling Fluids loading and unloading cost?
Why do you have two vessels with the same capacity but different cost?
What’s your average deck utilization percent?
Is there any other associated cost related to the transportation of mud from supply base
to offshore platform? (Purchasing raw material, transportation, loading and unloading
and storage cost, any other cost?
Operating cost (fuel and operating crew)
Administrative cost planning and routing
Fees of harbor
Handling equipment’s in the base.
What about maintenance cost?
The logistics planning, if we need a specific amount of Mud, do you send an extra
volume as a back-up? If yes, how much more do you send (%)?
Back-up volume will be mixed and stored at Bakers base facility
Some of the drilling fluids are sometimes stored on the laid up vessel beside the
platform. To calculate this, we need to know the following?
How often do you send drilling fluids? Ex. each section.
If you send a specific volume for each section how much is loaded to the platform (%)
every day?
This depends on the situation, a boat load will normally be loaded to the rig at arrival.
Weather can be a challenge so mud can be stored on the boat for some days
Logistics costs
Lundin has 2 vessels one for shipping and the other works as storage facility.
Lundin`s logistics coordinator said that up to 800 m3 of drilling fluids can be shipped each
trip. According to this we did the calculations below, and we decided to take an average as
there are two prices.

81
We are requesting info about planning, how often they ship mud in order to calculate the
storage cost and we will assume that the storage rate for 1 m3 is the same as transportation,
unless a better way is found.
What are your technical parameters for running the centrifuge?
Do you have a specific parameter?
Other questions in the meeting were:
i. What are the common drilling problems, mainly related to the drilling fluids?
ii. What are the steps to overcome these problems?
iii. The role of the drilling fluids and efficiency of solid control system to
overcome the problems?
iv. How much a capacity of the solid control system increased by adding a
centrifuge? Capacity of the centrifuge?
v. What is the annual cost of using centrifuge?
vi. How much the upgraded solid control system influence the ROP?
vii. How much using a centrifuge minimize the dilution volume?
viii. How many vessels are involved in logistics operations to serve the Edvard
Grieg field?
ix. What are main challenges for the logistical activities?
x. The daily rent of vessels?
xi. Average fuel consumption in one trip and other related costs?
xii. Is there any HSE measures for using and not using the centrifuge? We would
like to consider this in our calculations.
Drilling Problems
The below event tree analysis will enable us to quantitatively describe and discuss the effect
of the centrifuge in mitigating the sequences of drilling problems. Please have a look on the

82
two scenarios (before/after installing the centrifuge) below and answer the following
questions?
Is it possible to describe the sequences of the solid build up in this way?
What is the first technical action you do on the platform when the solid content raise?
Does it always solve the logistics problem? Can you explain why it sometimes doesn’t
work?
What are the next actions? Explain.

83
III. Transportation of drilling fluids and storage. (3rd meeting – 09/03/2017)
Mainly discuss the transportation activities of drilling fluids and inventory management at
supply base and offshore platforms. The questions were;
i. How much volume of drilling fluids transported in one trip?
ii. What is the storage plan of drilling fluids at supply base and offshore
installation?
iii. How would an upgraded solid control system influence the transportation and
storing the drilling fluids?
iv. What are the activities in case of urgent demand of drilling fluids?
v. How they conduct the process of loading and unloading of drilling fluids at the
supply base and installation?
Cost of disposal (the average cost of disposing 1 m3 of each type of drilling fluids)
Can you explain the disposal process, its types?
WBM / Slop : 1850,- NOK/MT
OBM will not be disposed, some slop will be generated ant the above cost will be
Used.
2400 NOK/MT for cuttings
In the DMRs, what is the difference between mud losses per length and mud additives
per length?
Mud losses is the hole volume lost during drilling Additives will be reported to NEMS
(usage of each product- environmental product reporting software)
Note:
The drilling fluid in section 12 ½ " is oil based that’s why there is no discharge.
The drilling of A10 was extremely complicated and I wasn’t able to find the total discharge.
After approving these results from Lundin AS, we will calculate how much does 1 m3 of
drilling fluid cost them. By adding the transportation, loading unloading storage and disposal
cost of 1 m3 of drilling fluid to the purchasing cost of raw materials.
Drilling fluids have different costs for 1 m3
24" section = NOK 2500

84
17 ½" = NOK 2800
12 ¼" = NOK 6100
8 ½ " = N/A as we were focusing on the upper sections.
IV. Presentation of results and discussion. (4th meeting – 20/04/02/2017)
We presented the results of the case study and main purpose of this meeting to show the
progress so far and get recommendations to improve the results. The main points are;
i. Presented the results of the study and detailed discussion of the results.
ii. Make a comparison of our results with the real life situation.
iii. Get the feedback of the professionals to make these results more realistic.

85
Presentation for 4th meeting
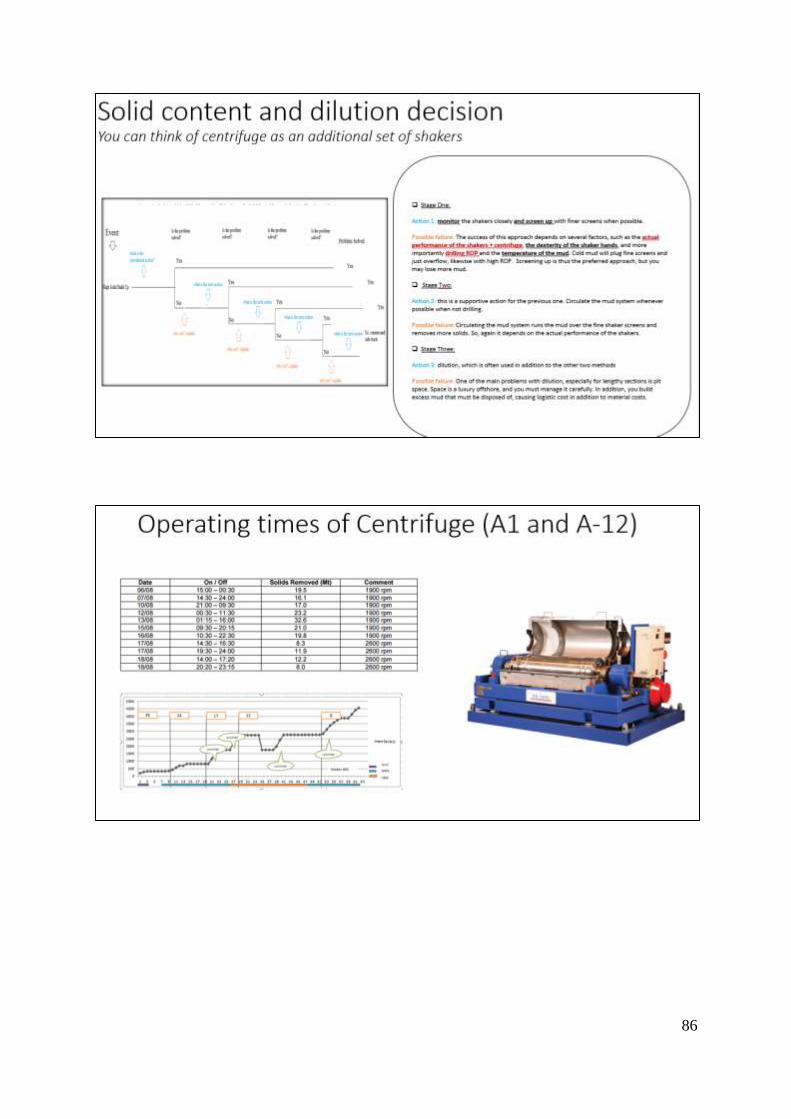
86
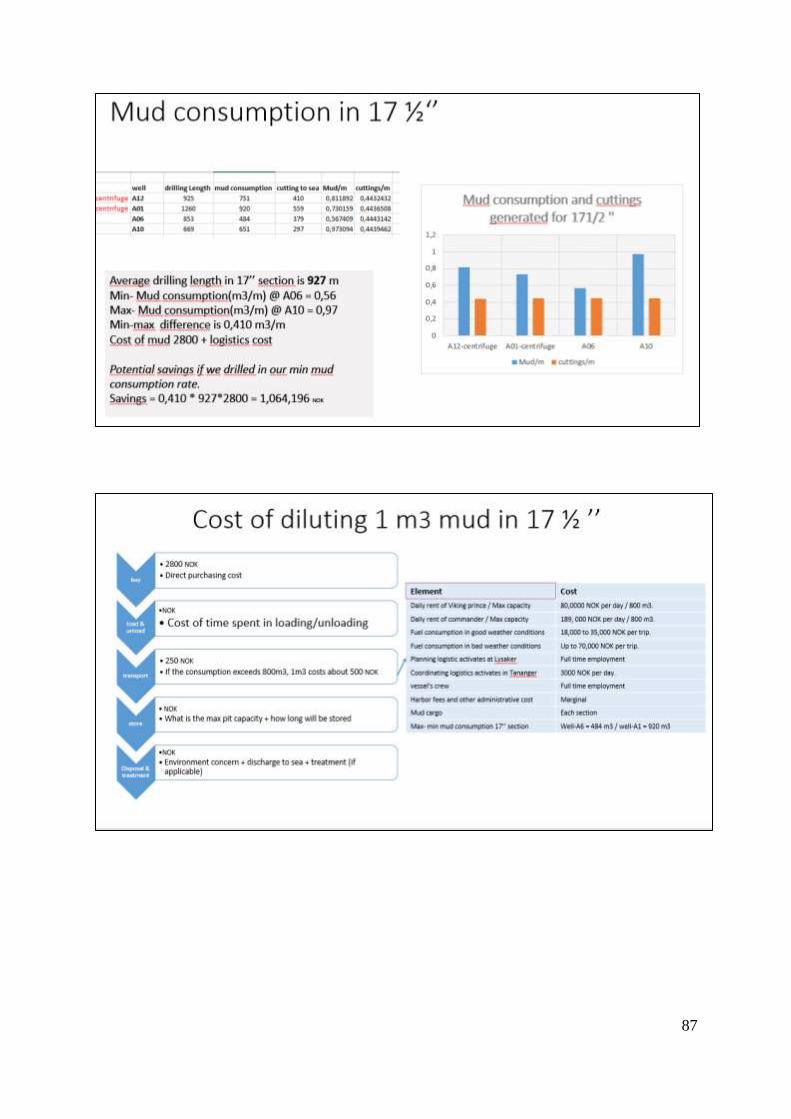
87

88

89
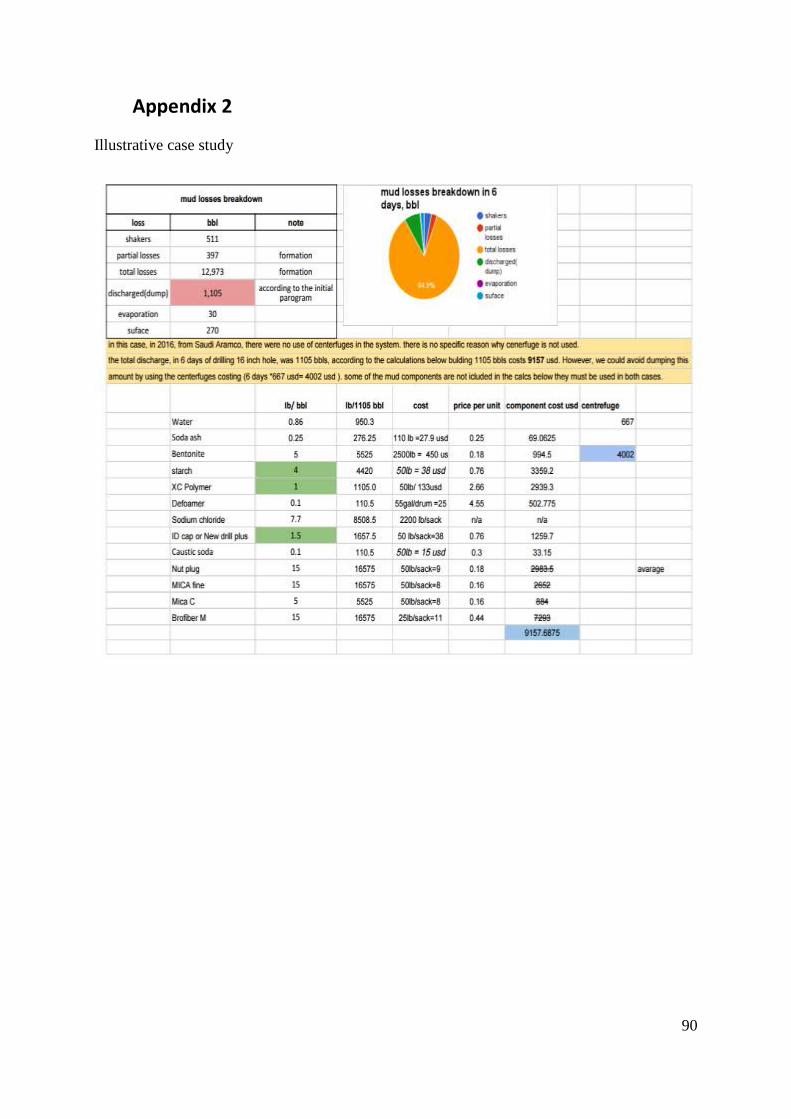
90
Appendix 2
Illustrative case study
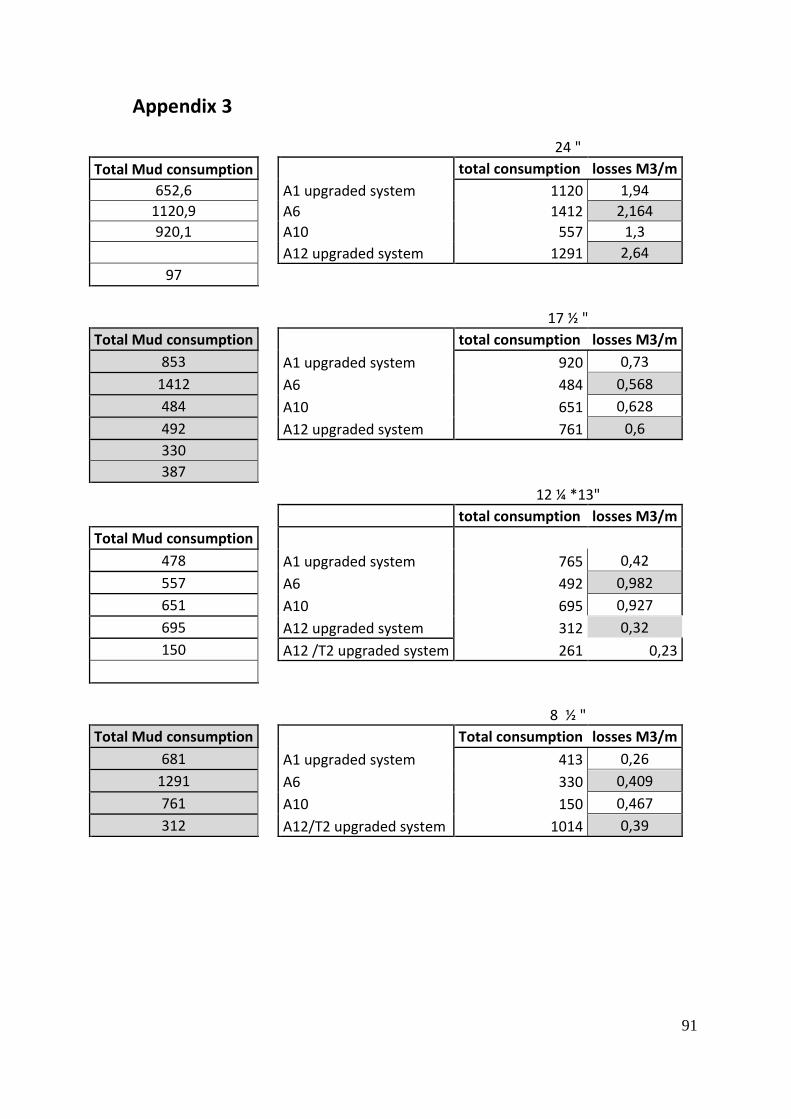
91
Appendix 3
24 " Total Mud consumption
total consumption losses M3/m
652,6
A1 upgraded system 1120 1,94 1120,9
A6 1412 2,164
920,1
A10 557 1,3
A12 upgraded system 1291 2,64
97
17 ½ " Total Mud consumption
total consumption losses M3/m
853
A1 upgraded system 920 0,73
1412
A6 484 0,568
484
A10 651 0,628
492
A12 upgraded system 761 0,6
330 387
12 ¼ *13"
total consumption losses M3/m
Total Mud consumption
478
A1 upgraded system 765 0,42
557
A6 492 0,982
651
A10 695 0,927
695
A12 upgraded system 312 0,32
150
A12 /T2 upgraded system 261 0,23
8 ½ " Total Mud consumption
Total consumption losses M3/m
681
A1 upgraded system 413 0,26
1291
A6 330 0,409
761
A10 150 0,467
312
A12/T2 upgraded system 1014 0,39
92
Graphs below show the total consumption and losses per meter in each section for the
four drilled wells, the upgraded system is the well with centrifuge. The mud losses per
meter is what we will consider as wells have different drilled length.
When we discussed the possibility of saving money by reducing discharge and thus
dilution, we were advised to study 24" and 17 ½" sections as the savings could be
higher there however, the centrifuge were not runing in any of these section , as they
were allways starting it in 12 ½ " and 8 ½"sections, We then decided to study the two
lower sections, 12 ½" and 8 ½".
In 24" and 17 ½ ", the upgrade of the system has no effect as numbers are random.
However, in 12 ¼ " and 8 ½ " sections, its clear that the consumption per meter is
lower where the upgraded system operates. The figures in red shows that the
consumption is always less (30 to 40%) in the case of the centrifuge.

93
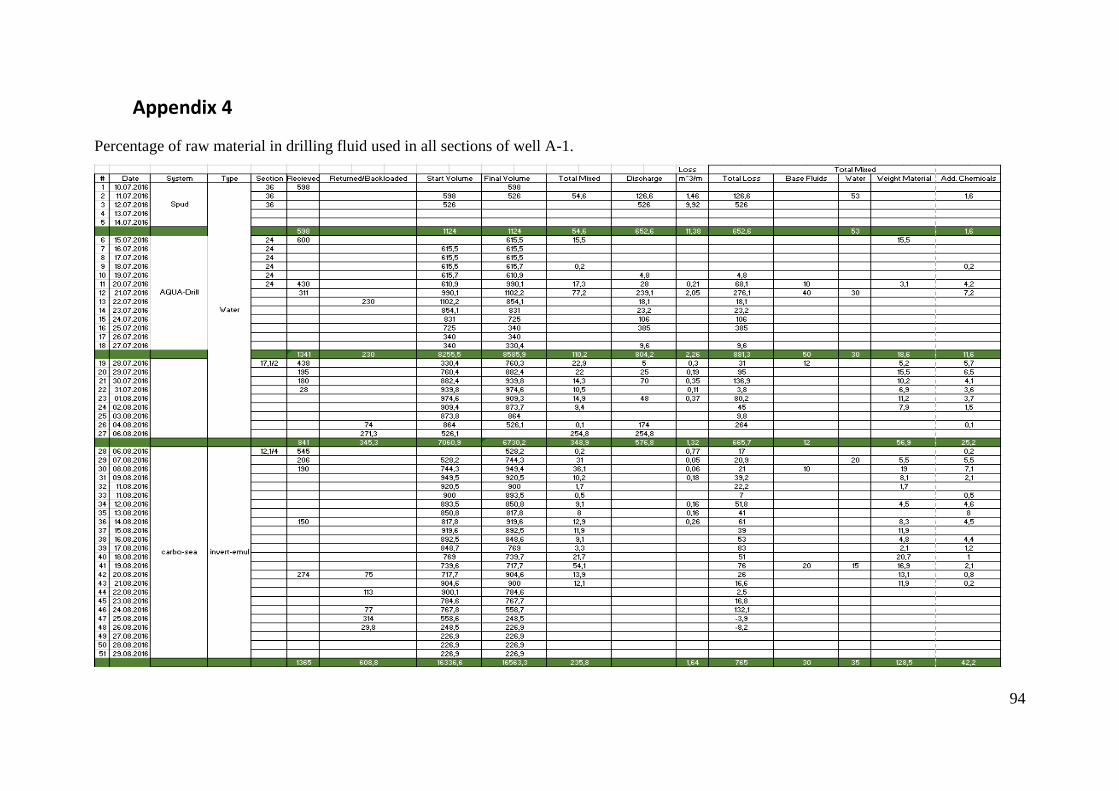
94
Appendix 4
Percentage of raw material in drilling fluid used in all sections of well A-1.
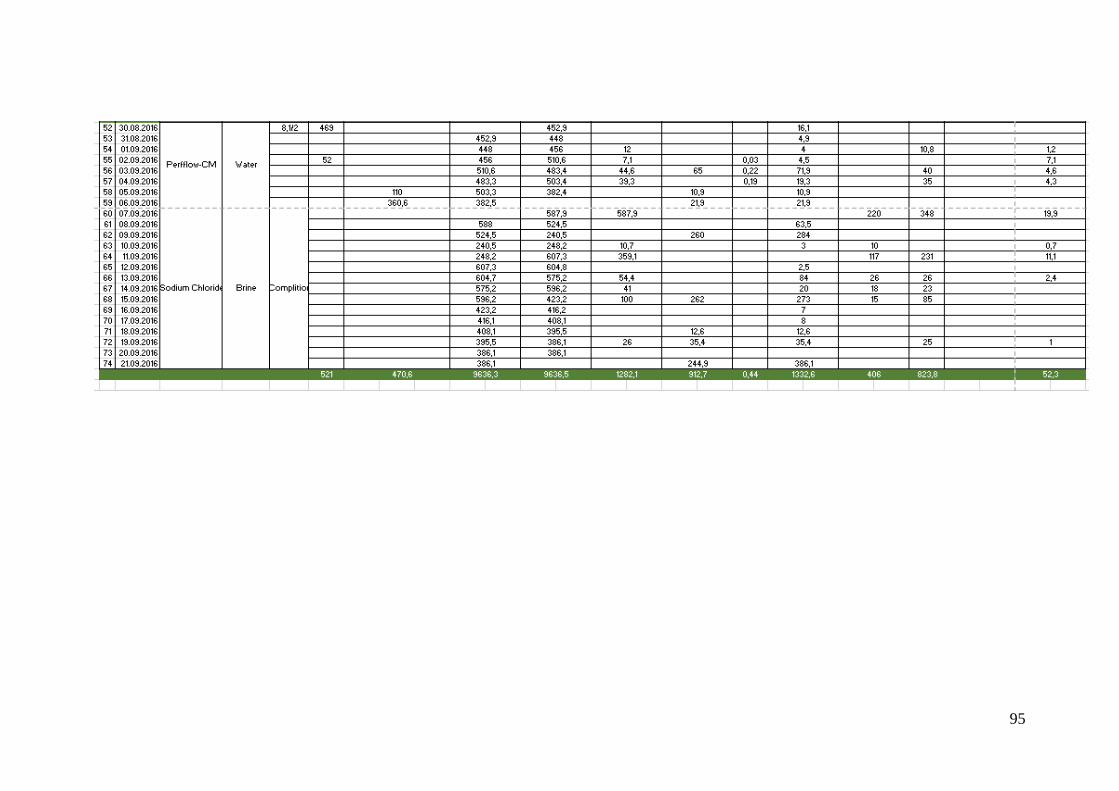
95

96
Percentage of raw material in drilling fluid used in all sections of well A-6.

97
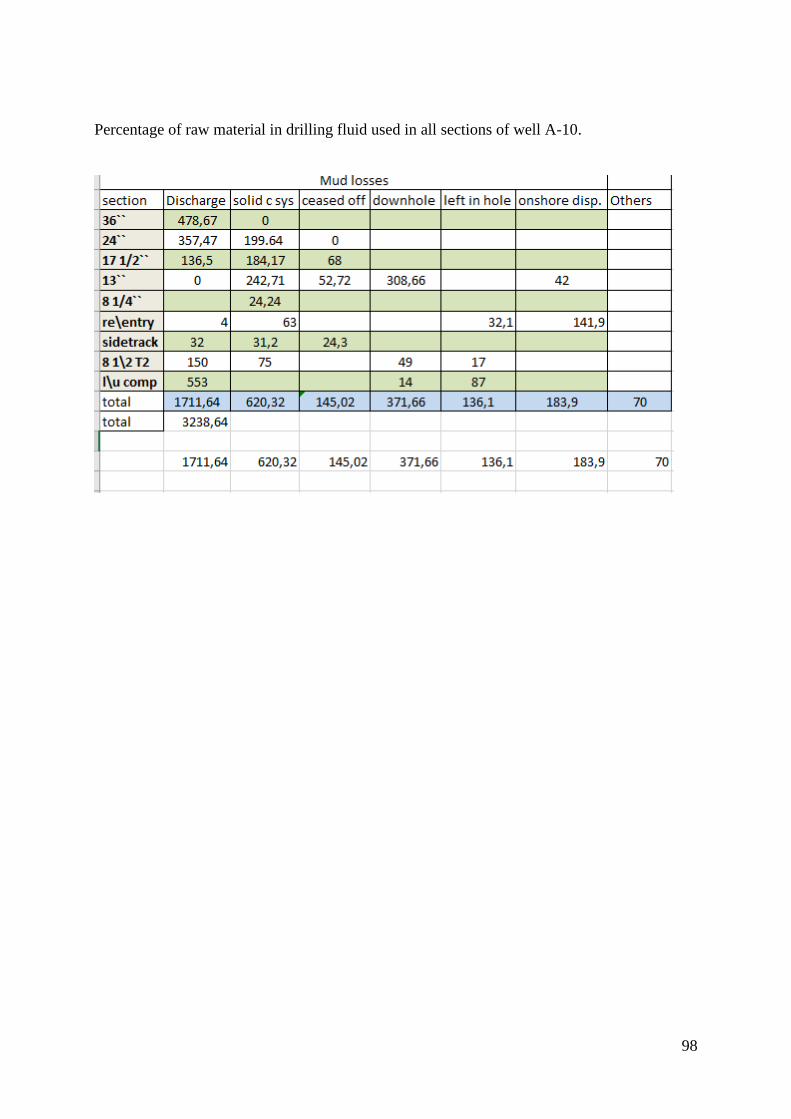
98
Percentage of raw material in drilling fluid used in all sections of well A-10.

99
Percentage of raw material in drilling fluid used in all sections of well A-12.
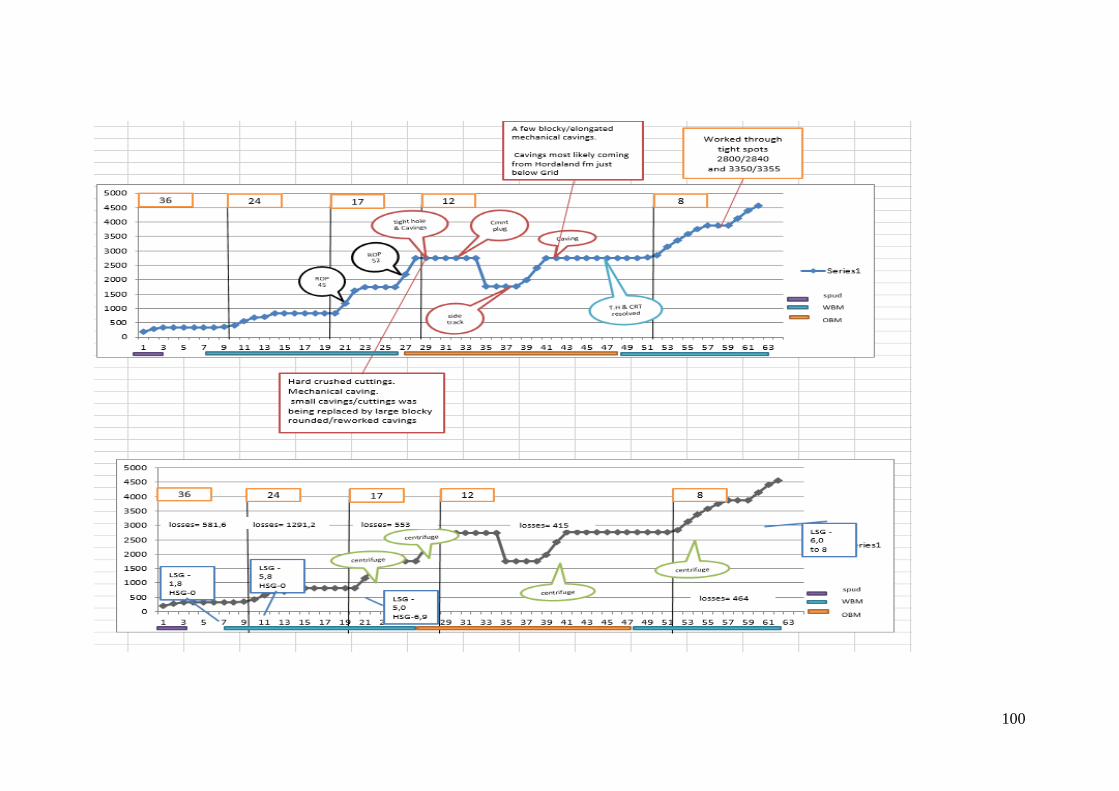
100