![Q1_FY_2012_final_290711.ppt [Read-Only] [Compatibility ... - Infinity](https://static.fdokumen.com/doc/165x107/63207975e9691360fe01ce09/q1fy2012final290711ppt-read-only-compatibility-infinity.jpg)
Q1_FY_2012_final_290711.ppt [Read-Only] [Compatibility ... - Infinity
Upload
khangminh22Category
view
1download
0
HAL Id: tel-01018026https://tel.archives-ouvertes.fr/tel-01018026
Submitted on 3 Jul 2014
HAL is a multi-disciplinary open accessarchive for the deposit and dissemination of sci-entific research documents, whether they are pub-lished or not. The documents may come fromteaching and research institutions in France orabroad, or from public or private research centers.
L’archive ouverte pluridisciplinaire HAL, estdestinée au dépôt et à la diffusion de documentsscientifiques de niveau recherche, publiés ou non,émanant des établissements d’enseignement et derecherche français ou étrangers, des laboratoirespublics ou privés.
Improvement of compatibility of poly(lactic acid)blended with natural rubber by modified natural rubber
Wannapa Chumeka
To cite this version:Wannapa Chumeka. Improvement of compatibility of poly(lactic acid) blended with natural rubberby modified natural rubber. Other. Université du Maine, 2013. English. �NNT : 2013LEMA1029�.�tel-01018026�

Wannapa CHUMEKA
Mémoire présenté en vue de l’obtention du grade de Docteur de l’Université du Maine sous le label de L’Université Nantes Angers Le Mans
École doctorale : 3MPL Discipline : Chimie des Matériaux, CNU 33 Spécialité : Chimie et Physicochimie des polymères Unité de recherche : IMMM, UMR CNRS 6283 Soutenue le 11/12/2013
Improvement of compatibility of poly(lactic acid) blended
with natural rubber by modified natural rubber
JURY
Rapporteurs : Fabrice BUREL, Professeur, INSA Rouen
Anuwat SAETUNG, Maitre de conférences, Prince of Songkla University, Pattani Campus
Examinateur : Chuanpit KHAOKONG , Maitre de conférences, Prince of Songkla University
Directeur de Thèse : Varaporn TANRATTANAKUL, Professeur, Prince of Songkla University
Co-directeur de Thèse : Jean-François PILARD, Professeur, Université du Maine
Co-encadrant : Pamela PASETTO, Maitre de conférences, Université du Maine
L4u L’Université Nantes Angers Le Mans

v
Thesis Title Improvement of Compatibility of Poly(Lactic Acid) Blended
with Natural Rubber by Modified Natural Rubber
Author Wannapa Chumeka
Major Program Polymer Science and Technology (Prince of Songkla
University) and Chemistry and Physical Chemistry of Polymer
(University of Maine)
Academic Year 2013
ABSTRACT
The aim of this research was to improve the compatibility of polymer blends
made from poly(lactic acid) and natural rubber (PLA/NR blends) by using modified
natural rubber as a compatibilizer. Natural rubber was chemically modified into two
categories: natural rubber grafted poly(vinyl acetate) copolymer (NR-g-PVAc) and
block copolymers (PLA-NR diblock copolymer and PLA-NR-PLA triblock
copolymer). PLA/NR blends were prepared by melting blending in a twin screw
extruder and compression molded to obtain a 2-mm thick sheet. The blends contained
10-20 wt% of NR and modified NR, and the impact strength and tensile properties
were investigated. The compatibilization effect was determined by DMTA, DSC and
SEM.
NR-g-PVAc was synthesized by emulsion polymerization to obtain different
PVAc graft contents (1%, 5% and 12%), calculated from 1H-NMR spectra, and
referred to as G1, G5 and G12, respectively. The formation of graft copolymers was
also verified by FTIR. Characterization by DMTA showed an enhancement in
miscibility of the PLA/NR-g-PVAc blends, e.g., the transition temperature of PLA
decreased from 71C to 63C, 64C and 67C after blending with 10% of G1, G5 and
G12, respectively. The increase in miscibility brought about a reduction in the rubber
particle diameter. These changes were responsible of the enhancement of toughness
and ductility of PLA. NR-g-PVAc could be used as a toughening agent of PLA and as
a compatibilizer of the PLA/NR blend. Effect of molecular weight of NR on
mechanical properties of the blend was investigated as well. Molecular weight of NR

vi
strongly affected the toughness of the blends. Relatively low molecular weight of NR,
obtained from mastication by a two-roll mill, was preferred because it provided
smaller particle size that enhanced toughness and ductility of the blends and this
effect depended on the blend composition and the number of mastications.
The block copolymers were synthesized following two routes: (1) hydroxyl
telechelic natural rubber (HTNR) and lactide and (2) HTNR and PLA prepolymer. In
the former route, lactide was in situ polymerized via a ring opening polymerization to
be a PLA block segment during block copolymerization. In the latter route PLA
prepolymer was synthesized by a condensation polymerization of L-lactic acid prior to
block copolymerization. Stannous octanoate (Sn(Oct)2) was used as a catalyst and the
reaction conditions were 110C and 170C, for 24 h, for diblock copolymers and
triblock copolymers, respectively. The mole ratio between HTNR and PLA in the
diblock and triblock copolymers was 1/1 and 2/1, respectively. The chemical structure
of prepared polymers was identified by 1H-NMR and FTIR. The block copolymers
were characterized by GPC, TGA and DSC. The formation of diblock and triblock
copolymers was evident from a new chemical shift at 4.1 ppm for PLA-NR diblock
copolymer and PLA-NR-PLA block copolymer had two new chemical shifts at 4.1
and 4.8 ppm. The experimental results from GPC, TGA and DSC also indicated the
characteristics of the block copolymers. Both block copolymers acted as good
compatibilizers for the PLA/NR blend by increasing the impact strength and
decreasing the NR particle size. A small amount of block was preferred, i.e. 2.5 pph; a
higher content showed larger particle diameter due to more coalescence. Triblock
copolymers provided higher impact strength than diblock copolymers, and triblock
copolymers were a less effective compatibilizer than NR-g-PVAc. In contrast to NR
and NR-g-PVAc, the block copolymer was not a good toughening agent for PLA.
Keywords: Biobased polymers, poly(lactic acid), natural rubber, polymer blends,
graft copolymers, block copolymers, compatibilizer

vii
Titre de la Thèse Amélioration de la Compatibilité de l’acide Polylactique
mélangé au Caoutchouc Naturel par des Dérivés du
Caoutchouc Naturel
Auteur Wannapa Chumeka
Ecoles Doctorales Sciences et technologie des polymères (Prince of Songkla
University) Chimie et Physicochimie des Polymères
(Université du Maine)
Année Académique 2013
RESUME
L’objectif de ce travail de thèse était l’amélioration de la compatibilité de
mélanges d’acide polylactique et de caoutchouc naturel (mélanges PLA/NR) par
l’ajout de dérivés du caoutchouc naturel comme agents compatibilisants. Le
caoutchouc naturel a été modifié selon deux approches : synthèse d’un copolymère
greffé caoutchouc- poly(vinyl acétate) (NR-g-PVAc) et synthèse de polymères à
blocks PLA-NR et PLA-NR-PLA. Les mélanges PLA/NR ont été préparés par
extrusion dans une extrudeuse à double vis et moulées par compression pour obtenir
des feuilles de 2 mm d’épaisseur. Les mélanges contenaient 10-20% en poids de NR
et NR modifiée. La résistance au choc et les propriétés en traction ont été étudiées.
L’effet de compatibilisation a été déterminé par DMTA, DSC et MEB.
NR-g-PVAc a été synthétisé par polymérisation en émulsion pour obtenir de
copolymères avec différents contenus en PVAc greffé (1%, 5% and 12%) ; les
pourcentages ont été calculés à partir des spectres 1H-RMN et désignés G1, G5 et
G12. La formation des copolymères greffés a aussi été vérifiée par FTIR. La
caractérisation des matériaux par DMTA a montré une augmentation de la miscibilité
des mélanges PLA/NR-g-PVAc ; la température de transition du PLA a diminué de
71C à 63C, 64C et 67C après mélange avec 10% de G1, G5 et G12.
L’augmentation de la miscibilité a été liée à la réduction du diamètre des particules de
caoutchouc. Ces changements sont responsables de l’augmentation de la dureté et la
ductilité du PLA.

viii
NR-g-PVAc a montré d’être un agent durcissant pour le PLA et un agent
compatibilisant pour les mélanges PLA/NR. L’effet de la masse molaire du NR sur
les propriétés mécaniques a aussi été étudié. La masse molaire du NR affecte
profondément la dureté des mélanges.
Les NR de faibles masses molaires obtenus par mastication dans un mélangeur à deux
cylindres se sont révélés être la solution optimale, car ils ont permis la formation de
petites particules de NR, qui ont augmenté la dureté et la ductilité des mélanges. Cet
effet dépend de la composition du mélange et du nombre de mastications.
Les polymères à bloc ont été synthétisés selon deux routes : (1) NR hydroxy
téléquelique (HTNR) et lactide et (2) NR hydroxy téléquelique et pré-polymère PLA.
Dans la première approche, le lactide a été polymérisé in situ à travers la
polymérisation par ouverture de cycle pour donner un bloc a utiliser dans la
copolymerization à blocs. Dans la deuxième approche, le pré-polymère PLA a été
synthétisé par polymérisation directe de l’acide L-lactique avant copolymérisation à
blocs. L’octanoate d’étain (Sn(Oct)2) a été utilisé comme catalyseur et les conditions
de réactions étaient 110C pour les copolymères diblocs et 170C pour les triblocs,
pendant 24 h. Le rapport molaire entre HTNR et PLA dans les copolymères dibloc
était 1/1 et dans les triblocs 2/1. La structure chimique des polymères a été vérifiée
par 1H-RMN et FTIR. Les copolymères à blocs ont été caractérisés par GPC, ATG et
DSC. La formation de copolymères dibloc and tribloc a été confirmée par un nouveau
pic à 4.1 ppm pour le PLA-NR dibloc, et le PLA-NR-PLA tribloc a donné deux
nouveaux pics à 4.1 et 4.8 ppm. Les deux types de copolymères se sont révélé de
bons agents compatibilisants pour les mélanges PLA/NR, car ils ont augmenté la
résistance au choc et ils ont diminué la taille des particules de caoutchouc. Un contenu
de bloc de l’ordre de 2.5 pph a été préféré car une quantité supérieure donnait des
diamètres plus grands à cause de la coalescence. Les copolymères tribloc ont donné
une résistance au choc plus élevée que les diblocs mais ils étaient moins efficaces
comme agents compatibilisants que NR-g-PVAc. Au contraire de NR et NR-g-PVAc,
les copolymères à bloc n’étaient pas de bons agents durcissant pour le PLA.
Mots-clés: Polymères Biobasés, acide polylactique, caoutchouc naturel, mélanges de
polymères, copolymères greffés, copolymères à blocs, agent compatibilisant

ix
ช่ือวิทยานิพนธ์ การปรบัปรงุความเขา้กนัไดข้องพอลแิลคตคิแอซดิผสมยางธรรมชาตดิว้ยยางธรรมชาตดิดัแปร
ผูเ้ขียน นางสาววรรณภา ชเูมฆา
สาขา วทิยาศาสตรแ์ละเทคโนโลยพีอลเิมอร ์(มหาวทิยาลยัสงขลานครนิทร)์ และChimie et physicochimie des Polymères (Université du
Maine)
ปีการศึกษา 2556
บทคดัย่อ
วตัถุประสงคข์องงานวจิยันี้ เพื่อปรบัปรงุความเขา้กนัไดข้องพอลเิมอรผ์สมระหว่างพอ-
ลแิลคตคิแอซดิและยางธรรมชาต ิ (PLA/NR) โดยการเตมิยางธรรมชาตดิดัแปร เพื่อท าหน้าทีเ่ป็นสารเพิม่ความเขา้กนัได ้การดดัแปรยางธรรมชาตเิตรยีมในรปูของกราฟทโ์คพอลเิมอรก์บัพอลไิวนิลอะซเีตต (NR-g-
PAVc) และสงัเคราะหเ์ป็นบลอ็คโคพอลเิมอรร์ว่มกบัพอลแิลคตคิ-
แอซดิในรปูของไดบลอ็คโคพอลเิมอร ์ (PLA-NR) และไตรบลอ็คโคพอลเิมอร ์ (PLA-NR-PLA)
พอลเิมอรผ์สมเตรยีมดว้ยการผสมแบบหลอมโดยเครือ่งอดัรดีสกรคูู่ และขึน้รปูเป็นแผ่นหนา 2
mm ปรมิาณยางในพอลเิมอรผ์สมมตีัง้แต่ 10-20% โดยน ้าหนัก ประกอบดว้ยยางธรรมชาตแิละยางธรรมชาตดิดัแปร พอลเิมอรผ์สมทีเ่ตรยีมไดน้ าไปทดสอบสมบตัเิชงิกล (ความตา้นทานต่อแรงกระแทก และสมบตัคิวามทนต่อแรงดงึ) สมบตัทิางความรอ้น (DMTA และ DSC) และตรวจสอบสณัฐานวทิยา (SEM)
กราฟทโ์คพอลเิมอรร์ะหว่างยางธรรมชาต ิ และพอลไิวนิลอะซเีตตสงัเคราะหด์ว้ยกระ-บวนการอมิลัชนัพอลเิมอรไ์รเซชนั เปอรเ์ซน็ตก์ารกราฟทท์ีไ่ดค้อื 1%, 5% และ 12%
ค านวณปรมิาณการกราฟทด์ว้ยเทคนิค 1H-NMR
และเรยีกชื่อกราฟทโ์คพอลเิมอรต์ามเปอรเ์ซน็ตก์ารกราฟทท์ีไ่ด ้ คอื G1, G5 และ G12
ตามล าดบั ท าการยนืยนัการเกดิกราฟทโ์คพอลเิมอรเ์พิม่เตมิดว้ย FTIR
จากการหาลกัษณะเฉพาะดว้ยเทคนิค DMTA
แสดงใหเ้หน็ถงึความเขา้กนัไดท้ีเ่พิม่ขึน้ของพอลเิมอรผ์สม PLA/NR-g-PVAc
พบว่าอุณหภูมเิปลีย่นสถานะแอลฟา ( transition temperature) ของ PLA ลดลงจาก 71C
เป็น 63C, 64C และ 67C ในพอล-ิเมอรผ์สมระหว่าง PLA และ 10 wt% ของ G1, G5 และ

x
G12 ความเขา้กนัไดท้ีม่ากขึน้ของพอล-ิเมอรผ์สมเป็นผลใหอ้นุภาคของยางทีม่ขีนาดเลก็ลง และส่งผลใหค้่าความตา้นทานต่อแรงกระแทก และค่าระยะยดื ณ จดุขาด เพิม่ขึน้ ดงันัน้ NR-g-
PVAc สามารถใชเ้ป็นสารเพิม่ความยดืหยุน่ใหก้บั PLA
และยงัสามารถใชเ้ป็นสารเพิม่ความเขา้กนัไดใ้หก้บัพอลเิมอรผ์สมของ PLA/NR นอกจากนี้ยงัมกีารศกึษาอทิธพิลของน ้าหนกัโมเลกุลของยางธรรมชาตต่ิอสมบตัเิชงิกลของพอลเิมอรผ์สม บดยางธรรมชาตดิว้ยเครือ่งบดสองลกูกลิง้ทีจ่ านวนรอบต่างๆ พบว่าเมือ่ยางธรรมชาตมินี ้าหนกัโมเลกุลลดลง และส่งผลใหอ้นุภาคของยางมขีนาดลดลง ท าใหค้วามต้านทานต่อแรงกระแทก และระยะยดื ณ จดุขาด ของพอลเิมอรผ์สมเพิม่ขึน้ แต่ทัง้นี้ขึน้อยูก่บัสดัส่วนและจ านวนรอบในการบดยางธรรมชาตดิว้ย
บลอ็คโคพอลเิมอรเ์ตรยีมจากยางธรรมชาตดิดัแปรน ้าหนกัโมเลกุลต ่า ทีม่หีมูป่ลายสองขา้งเป็นหมู่ไฮดรอกซลิและพอลแิลคตคิแอซดิพรพีอลเิมอร ์ไดบลอ็คและไตรบลอ็คโคพอลเิมอรจ์าก HTNR สามารถเตรยีมไดส้องวธิคีอื (1) สงัเคราะหจ์าก HTNR และแลคไทด ์ ดว้ยวธิกีาร in situ พอลเิมอรไ์รเซชนัแบบเปิดวงแหวนของแลคไทด ์ และ (2) สงัเคราะหจ์าก HTNR และพอล-ิแลคตคิแอซดิพรพีอลเิมอร ์โดยสงัเคราะหพ์รพีอลเิมอรด์ว้ยกระบวนการควบแน่นของกรดแลค-ตคิ สภาวะทีใ่ชใ้นการสงัเคราะหค์อื 110C และ 170C เป็นเวลา 24 h ส าหรบั ไดบลอ็คและไตรบลอ็คโคพอลเิมอร ์ ตามล าดบั และใชส้แตนเนียสออกโตเอท (Sn(Oct)2
เป็นตวัเรง่ปฏกิริยิา สดัส่วนโดยมวลของ HTNR และ PLA
ในการสงัเคราะหไ์ดบลอ็คและไตรบลอ็คโคพอลเิมอรค์อื 1/1 และ 2/1 ตามล าดบั
ตรวจสอบโครงสรา้งทางเคมขีองบลอ็คโคพอลเิมอรท์ีไ่ดด้ว้ยเทคนิค 1H-NMR และ FTIR
ตรวจวเิคราะหล์กัษณะเฉพาะของบล๊อคโคพอลเิมอรท์ีไ่ดด้ว้ยเทคนิค GPC, TGA และ DSC
จาก 1H-NMR ในไดบล๊อคโคพอลเิมอร ์ พบสญัญาณใหมเ่กดิขึน้ทีต่ าแหน่ง 4.1 ppm
และไตรบล๊อคโคพอลเิมอรพ์บสญัญาณใหม่ปรากฏทีต่ าแหน่ง 4.1 ppm และ 4.8 ppm
และสามารถยนืยนัความเป็นบล๊อคโคพอลเิมอรด์ว้ยเทคนิค GPC, TGA และ DSC
บลอ็คโคพอล-ิเมอรท์ัง้สองชนิดสามารถท าหน้าทีเ่ป็นสารเพิม่ความเขา้กนัไดท้ีด่ขีอง PLA/NR
โดยท าใหค้่าความตา้นทานต่อแรงกระแทกเพิม่ขึน้ และส่งผลใหข้นาดอนุภาคของยางเลก็ลงโดยเฉพาะทีป่รมิาณบลอ็คโคพอลเิมอรเ์ท่ากบั 2.5 pph
เมือ่ปรมิาณบล๊อคโคพอลเิมอรเ์พิม่ขึน้ท าใหอ้นุภาคของยางมขีนาดเพิม่ขึน้ เนื่องจากการเกาะกนัของอนุภาคยางทีเ่พิม่ขึน้ และพบว่าไตรบลอ็คโค-
พอลเิมอรแ์สดงค่าความต้านทานต่อแรงกระแทกสงูกว่าไดบล๊อคโคพอลเิมอร ์อยา่งไรกต็ามไตร-บลอ็คโคพอลเิมอรม์ปีระสทิธภิาพในการเป็นสารเพิม่เขา้กนัไดน้้อยกว่า NR-g-PVAc และบลอ็ค-
โคพอลเิมอรย์งัไมใ่ช่สารเพิม่ความยดืหยุ่นทีด่ใีหก้บั PLA

xi
ค าส าคญั: พอลเิมอรช์วีภาพ, พอลแิลคตคิแอซดิ, ยางธรรมชาต,ิ พอลเิมอรผ์สม, กราฟทโ์ค-
พอลเิมอร,์ บล๊อคโคพอลเิมอร,์ สารเพิม่ความเขา้กนัได ้

xi
ACKNOWLEDGEMENTS
I would like to express my appreciation and gratitude to Associated Professor
Dr. Varaporn TANRATTANAKUL who has been a wonderful advisor for giving me
an opportunity to study Ph.D. Program and also her support and professional guidance
during my Ph.D. period. I really thank to her enthusiasm for my research inspirations.
Associate Professor Dr. Varaporn TANRATTANAKUL has been a delightful
advisor, providing me with support, encouragement, patience and an endless source of
ideas. I thank her for the countless hours that she has spending, discussing, reading
and correcting with me, my manuscripts and my thesis.
I would also like to thank Professor Dr. Jean-François PILARD, my advisor,
on condition that giving me an opportunity to do the research at Université du Main,
France. His enthusiasm for research and his vision for the future have been an
inspiration. He has given me support and his advices have greatly enhanced my
research.
I am extremely grateful to Dr. Pamela PASETTO, my co-advisor, for spending
her time to discuss the results of my experiments and finding the time to read and to
correct my manuscripts and my thesis. Most importantly, I would like to thank her for
her encouragement, patience and also much assistance in my personal life at Le Mans.
I am sincerely grateful to the Royal Golden Jubilee Ph.D. Program of Thailand
Research Fund (Grant No. PHD/0253/2551), and the French-Thai Cooperation
Program in Higher Education and Research (PHC Program) and Graduate School,
Prince of Songkla University for financial support. This work has been carried out
under the collaboration between Prince of Songkla University and Université du
Maine.
I would like to express gratitude to my member thesis committee, Professor
Dr. Fabrice BUREL from INSA de Rouen, France, Dr. Anuwat SAETUNG from
Prince of Songkla University, Pattani Campus, Thailand and Dr. Chuanpit
KHAOHONG from Prince of Songkla University, Hat Yai Campus, Thailand who
have been kindness with their time and assisted with the successful completion of this
work. Next I would like to express thank Dr. Fabien BOEDA (Université du Maine)

xii
and Dr. Frederic PERUCH (Université de Borbeaux) who are my external scientific
members of the Comité de Suivi de Thèse.
I would like to express my sincere gratitude to Dr. Irène CAMPISTRON, Dr.
Arnaud NOURRY, Anita LOISEAU, Aline LAMBERT and Jean-Luc MONEGER
for their guidance and helpful in providing advice. Thank you all friends in IMMM
laboratory and also thank you all Thai students for their friendship, helpful and good
atmosphere during my stay in France. I would like to give special thanks to Krishna
VENI BARATHA and her family for their helpful and good atmosphere during my
stay in Le Mans. I also thank to Wilaiporn KHONDEE and her family for their
helpful guidance and support with good atmosphere during my stay in Le Mans.
I am grateful to all the lecturers, technicians, office workers and all my friends
at the Department of Material Science and Technology, Faculty of Science, Prince of
Songkla University, also special for all members in VT group, and especially, Dr.
Wannarat PANWIRIYARAT and Dr. Pimchanok SAITHAI for their friendship,
unlimited help and encouragement during my study period.
Finally, I would like to extend special thanks to my family for their financial
support, encouragement and unconditional love. I am very lucky to have such
wonderful family members. I dedicate this thesis to my family and all the teachers
who have taught me since my childhood. I will never forget this time in my life and,
most importantly, the people I met and who helped me to create, develop and
complete this thesis.
To this end, I fully take all responsibility for any mistakes that may have occurred
in this work.
Wannapa CHUMEKA

xiii
CONTENTS
Page
ABSTRACTS v
ACKNOWLEDGEMENTS xi
CONTENTS xiii
LIST OF TABLES xviii
LIST OF FIGURES xxii
LIST OF ABBREVIATIONS xxix
CHAPTER 1 GENERAL INTRODUCTION 1
1.1 Background 1
1.2 Objectives 3
1.3 References 4
CHAPTER 2 LITERATURE REVIEW 14
2.1 Polymer blends 14
2.1.1 General information 14
2.1.2 Definition of polymer blend 14
2.1.3 Rubber toughened plastic 16
2.1.4 Methods of polymer blend 17
2.1.5 Compatibilization 18
2.2 Copolymerization 20
2.2.1 Graft copolymers 20
2.2.2 Block copolymers 22
2.3 Poly(lactic acid) 29
2.3.1 General information 29
2.3.2 Biodegradable polymers 30
2.3.3 Synthesis of poly(lactic acid) 32
2.3.4 Degradation of poly(lactic acid) 35
2.3.5 Properties of poly(lactic acid) 35
2.3.6 Poly(lactic acid) blended with elastomer/rubber 38
2.3.7 Poly(lactic acid) based block copolymers 41

xiv
CONTENTS (continued)
Page
2.4 Natural rubber 46
2.4.1 General information 46
2.4.2 Telechelic natural rubber 47
2.4.3 Natural rubber based graft copolymers 51
2.5 Poly(vinyl acetate) 54
2.5.1 General information 54
2.5.2 Synthesis of poly(vinyl acetate) 54
2.5.3 Miscibility of poly(lactic acid)/poly(vinyl acetate) blend 57
2.6 Characterizations 58
2.6.1 Mechanical properties 58
2.6.1.1 Tensile properties 58
2.6.1.2 Impact resistance 59
2.6.2 Thermal properties 60
2.6.2.1 Differential scanning calorimetry (DSC) 60
2.6.2.2 Thermal gravimetric analysis (TGA) 62
2.6.2.3 Dynamic mechanical thermal analysis (DMTA) 63
2.6.3 Nuclear magnetic resonance spectroscopy 64
2.6.4 Fourier transform infrared spectroscopy 65
2.6.5 Scanning electron microscope 66
2.6.6 Gel permeation chromatography 67
2.7 References 69
CHAPTER 3 MATERIALS AND METHODOLOGY 84
3.1 Materials 84
3.2 Instruments 85
3.3 Methodology 86
3.3.1 Synthesis of natural rubber grafted poly(vinyl acetate) 88
3.3.2 Synthesis of telechelic natural rubber 88
3.3.2.1 Carbonyl telechelic natural rubber 88
3.3.2.2 Hydroxyl telechelic natural rubber 89

xv
CONTENTS (continued)
Page
3.3.3 Synthesis of PLA prepolymer 90
3.3.4 Synthesis of PLA-NR block copolymers 91
3.3.4.1 PLA-NR diblock copolymers 91
3.3.4.2 PLA-NR-PLA triblock copolymers 92
3.3.5 Preparation of polymer blends 94
3.3.6 Testing of mechanical properties 94
3.3.6.1 Tensile properties 94
3.3.6.2 Impact resistance 94
3.3.7 Characterizations 95
3.3.7.1 Nuclear magnetic resonance spectroscopy 95
3.3.7.2 Fourier transform infrared spectroscopy 95
3.3.7.3 Gel permeation chromatography 95
3.3.7.4 Dynamic scanning calorimetry 95
3.3.7.5 Dynamic mechanical thermal analysis 96
3.3.7.6 Thermal gravimetric analysis 96
3.3.7.7 Scanning electron microscopy 96
3.4 References 96
CHAPTER 4 RESULTS AND DICUSSION 98
4.1 Effect of poly(vinyl acetate) on the mechanical properties and
characteristics of poly(lactic acid)/natural rubber blends 98
4.1.1 NR-g-PVAc copolymerization 98
4.1.2 Polymer blends containing 10 wt% rubber 103
4.1.2.1 Mechanical properties 103
4.1.2.2 Morphology 109
4.1.2.3 Dynamic mechanical analysis 112
4.1.2.4 Differential scanning calorimetry analysis 114
4.1.3 Polymer blends containing >10 wt% rubber 117
4.1.3.1 Effect of NR content 117
4.1.3.2 Compatibilization effect 120

xvi
CONTENTS (continued)
Page
4.1.4 Effect of rubber mastication 124
4.1.4.1 Mechanical properties 124
4.1.4.2 Morphology 130
4.2 Synthesis and characterization of diblock and triblock copolymers from
HTNR and lactide 132
4.2.1 Synthesis of telechelic natural rubber 132
4.2.2 Synthesis of PLA-NR diblock copolymers 138
4.2.3 Synthesis of PLA-NR-PLA triblock copolymers 145
4.3 Synthesis and characterization of diblock and triblock copolymers from
HTNR and PLA prepolymer (lactic acid) 150
4.3.1 Synthesis of PLA prepolymer 150
4.3.2 Synthesis of PLA-NR diblock copolymers 153
4.3.3 Synthesis of PLA-NR-PLA triblock copolymers 161
4.4 Mechanical properties and characterization of PLA/NR/block
copolymers 168
4.4.1 Polymer blends containing 10 wt% rubber 168
4.4.1.1 Effect of PLA-NR diblock copolymer 169
4.4.1.2 Effect of PLA-NR-PLA triblock copolymer 178
4.4.2 Polymer blends containing >10 wt% rubber 188
4.4.2.1 Effect of PLA-NR diblock copolymers 188
4.4.2.2 Effect of PLA-NR-PLA triblock copolymers 193
4.5 References 200
CHAPTER 5 CONCLUSIONS 205
5.1 Effect of poly(vinyl acetate) on the mechanical properties and
characteristics of poly(lactic acid)/natural rubber blends 205
5.2 Synthesis and characterization of diblock and triblock copolymers
from HTNR and lactide 206
5.3 Synthesis and characterization of diblock and triblock copolymers
from HTNR and lactic acid 206

xvii
CONTENTS (continued)
Page
5.4 Mechanical properties and characterization of PLA/NR/block
copolymers blends 207
PERSPECTIVES 209
CURRICULUM VITAE 210

xviii
LIST OF TABLES
Page
Table 2.1 Selected physical and chemical properties of PLA 36
Table 2.2 Comparison of physical properties between PLA and commodity
polymers 37
Table 2.3 A typical composition of fresh natural rubber latex 46
Table 2.4 Composition of solid natural rubber 47
Table 3.1 Weight of NR, VAc and PPS for synthesis of NR-g-PVAc 86
Table 4.1 Conversion percentage of vinyl acetate monomer to
poly(vinyl acetate) 99
Table 4.2 1H-NMR assignment of NR and PVAc 100
Table 4.3 FTIR assignment of NR and PVAc 102
Table 4.4 Characteristics of graft copolymerization 102
Table 4.5 Impact strength of PLA/NR/NR-g-PVAc blends (10 wt% rubber) 104
Table 4.6 Tensile properties of PLA/NR/NR-g-PVAc blends (10 wt% rubber) 108
Table 4.7 Average diameter of rubber particles in the blends (10 wt% rubber) 112
Table 4.8 The transition temperature of PVAc, PLA and polymer blends 113
Table 4.9 Thermal properties of the blends from the 1st and the 2nd heating
scan 114
Table 4.10 Thermal properties of the blends from the 3rd heating scan 115
Table 4.11 Impact strength of PLA/NR/NR-g-PVAc blends (>10 wt% rubber) 118
Table 4.12 Tensile properties of PLA/NR/NR-g-PVAc blends (>10 wt% rubber) 120
Table 4.13 Average diameter of rubber particles in the blends (>10 wt% rubber) 123
Table 4.14 Effect of rubber mastication on the impact resistance of
the blends containing G5 and G12 125
Table 4.15 Effect of rubber mastication on the tensile properties of the
blends containing G5 and G12 128
Table 4.16 Average diameter of rubber particles in the blends (10 wt% rubber) 130
Table 4.17 Chemical shift assignment of carbonyl telechelic natural rubber
(CTNR) 133
Table 4.18 Chemical shift of hydroxyl telechelic natural rubber (HTNR) 134

xix
LIST OF TABLES (continued)
Page
Table 4.19 Wavenumber and functional group of NR, CTNR and HTNR 135
Table 4.20 The molecular weight of carbonyl telechelic oligomers 137
Table 4.21 The molecular weight of hydroxyl telechelic oligomers 137
Table 4.22 1H-NMR assignments of “PLA1-NR” diblock copolymer 139
Table 4.23 PLA assignments 139
Table 4.24 Condition for synthesis of “PLA1-NR” diblock copolymers 141
Table 4.25 The molecular weight of “PLA1-NR” diblock copolymers after
purification 141
Table 4.26 Thermal properties of “PLA1-NR” diblock copolymers 144
Table 4.27 1H-NMR assignments of “PLA1-NR-PLA1” triblock copolymer 146
Table 4.28 The molecular weight of “PLA1-NR-PLA1” triblock copolymers
after purification 148
Table 4.29 Thermal properties of “PLA1-NR-PLA1” triblock copolymers 149
Table 4.30 The assignments and chemical shifts of PLA prepolymer 151
Table 4.31 The molecular weght of synthesized PLA from GPC analysis 152
Table 4.32 The condition for synthesis of “PLA2-NR” diblock copolymers 155
Table 4.33 The molecular weight of “PLA2-NR” diblock copolymers after
purification 155
Table 4.34 Thermal properties and thermal stability of “PLA2-NR” diblock
copolymers 157
Table 4.35 The molecular weight of “PLA2-NR-PLA2” triblock copolymers
after purification 163
Table 4.36 Thermal properties of “PLA2-NR-PLA2” triblock copolymers at
the 1st heating and cooling scan 164
Table 4.37 Thermal properties of “PLA2-NR-PLA2” triblock copolymers at
the 2nd heating scan 165
Table 4.38 The molecular weight of “PLA2-NR” and “PLA2-NR-PLA2” block
copolymers 169
Table 4.39 Impact strength of the PLA/NR/PLA-NR blends (10 wt% rubber) 170

xx
LIST OF TABLES (continued)
Page
Table 4.40 Tensile properties of the PLA/NR/PLA-NR blends (10 wt% rubber) 170
Table 4.41 Average diameter of rubber particles in the blends (10 wt% rubber) 176
Table 4.42 Impact strength of PLA/NR/PLA-NR-PLA blends (10 wt% rubber) 179
Table 4.43 Tensile properties of PLA/NR/PLA-NR-PLA blends
(10 wt% rubber) 183
Table 4.44 Average diameter of rubber particles in the blends (10 wt% rubber) 187
Table 4.45 Impact strength of the PLA/NR/PLA-NR blend (>10 wt% rubber) 189
Table 4.46 Tensile properties of the PLA/NR/PLA-NR blend
(>10 wt% rubber) 192
Table 4.47 Average diameter of rubber particle in the PLA/NR/PLA-NR blends
(>10 wt% rubber) 193
Table 4.48 Impact strength of PLA/NR/PLA-NR-PLA blends
(>10 wt% rubber) 194
Table 4.49 Tensile properties of PLA/NR/PLA-NR-PLA blends
(>10 wt% rubber) 196
Table 4.50 Average diameter of rubber particles in the blends
(>10 wt% rubber) 198

xxi
LISTS OF FIGURES
Page
Figure 2.1 Possible types of phase diagrams in the solution of polymer blend 16
Figure 2.2 Schematic diagram of connecting chains at an interface in the
polymer blend: (a) diblock copolymers, (b) end-grafted chains,
(c) triblock copolymers, (d) multiple grafted chain and
(e) random copolymers 19
Figure 2.3 Schematic diagram of (a) “grafting to” and (b) “grafting from”
approach 21
Figure 2.4 Block copolymer architectures 23
Figure 2.5 Syntheses of block copolymers by cationic polymerization 24
Figure 2.6 The general mechanism for atom transfer radical polymerization 25
Figure 2.7 The general mechanism for reversible addition-fragmentation chain
transfer radical polymerization 26
Figure 2.8 Schematic diagram of ring cleavage of olefin lead to difunctional
formation 27
Figure 2.9 Schematic diagram of polycondensation of α, ω-dienes utilizing
an elimination reaction 27
Figure 2.10 Classification of the biodegradable polymers 31
Figure 2.11 General mechanism of plastic biodegradation under
aerobic conditions 31
Figure 2.12 Synthesis methods for obtaining PLA 32
Figure 2.13 The stereoisomers of lactic acid 33
Figure 2.14 Chemical structures of L-, meso- and D-lactides 33
Figure 2.15 Zero-shear viscosities versus molecular weights for PLAs of
varying optical composition and resulting scaling law 38
Figure 2.16 Reaction scheme for the synthesis of PLLA-PEOz-PLLA
triblock copolymers 42
Figure 2.17 Block copolymerization of -caprolactone and DL-lactide initiated
by dihydroxyl PEG 43

xxii
LIST OF FIGURES (continued)
Page
Figure 2.18 Preparation route of PLLA/P(CL-b-LLA) blends by ring
opening polymerization of LLA 44
Figure 2.19 Reaction of PLA, PBS, and compatibilizers 44
Figure 2.20 Formation of TPS and compatibilizer and the reaction between them 45
Figure 2.21 Synthesis of (a) AB and (b) ABA block copolymers 45
Figure 2.22 Structure of cis-1,4-polyisoprene 46
Figure 2.23 The structure of modified natural rubber of (a) isoprene unit,
(b) HTNR and (c) CTNR 47
Figure 2.24 Reactive terminal groups of the TNR; (a) vinyl-, (b) trans- and
(c) cis-unit 48
Figure 2.25 A cleavage of polyisoprene to liquid carbonyl telechelic
polyisoprenes 49
Figure 2.26 Possible reactions among MA, polyamide 6 and NR that can take place
during processing 53
Figure 2.27 Structure of poly(vinyl acetate) 54
Figure 2.28 Structure of poly(vinyl acetate) both head-to-head and head-to-tail 55
Figure 2.29 Hydrogen abstraction of poly(vinyl acetate) 55
Figure 2.30 Typical tensile specimen, showing a reduced gage section and
enlarged shoulders 58
Figure 2.31 Stress-strain curves of (a) ductile, (b) semi-ductile and
(c) brittle materials 59
Figure 2.32 Impact testing: (a) V-notched specimen, (b) Izod testing, (c) Charpy
testing and (d) Testing apparatus 60
Figure 2.33 Schematic diagram of a DSC apparatus 61
Figure 2.34 The typical DSC thermogram of polymers 61
Figure 2.35 Components of a thermobalance 62
Figure 2.36 Typical TGA and DTG curves 62
Figure 2.37 Schematic representation of the response of perfectly elastic and
perfectly viscous materials to an applied stress 63

xxiii
LIST OF FIGURES (continued)
Page
Figure 2.38 Schematic representation of (a) the response of a viscoelastic
material to an applied sinusoidal stress and (b) the in- and
out- of phase stress components 63
Figure 2.39 DMTA thermogram of modulus values change with temperature
and transitions in materials 64
Figure 2.40 The basic arrangement of NMR spectrometer 64
Figure 2.41 A spinning nucleus can be regarded as a microscopic magnet 65
Figure 2.42 Schematic diagram of the optical layout of IR spectrometer 65
Figure 2.43 Stretching and bending vibrational modes for a CH2 group 66
Figure 2.44 Diagram of electron beam and specimens 67
Figure 2.45 Illustration of the separation of polymer molecules of different sizes 68
Figure 2.46 The general form of a calibration curve and chromatogram of
different sizes of polymer 68
Figure 4.1 1H-NMR spectrum of natural rubber 99
Figure 4.2 1H-NMR spectrum of poly(vinyl acetate) 100
Figure 4.3 1H-NMR spectra of NR, PVAc and NR-g-PVAc 101
Figure 4.4 FTIR spectra of NR, PVAc and NR-g-PVAc after Soxhlet extraction 101
Figure 4.5 Notched impact strength of PLA/NR/NR-g-PVAc blends
(10 wt% rubber): Izod and (b) Charpy test 105
Figure 4.6 Stress-strain curves of PLA/NR/NR-g-PVAc blends
(10 wt% rubber): (a) G1, (b) G5 and (c) G12 107
Figure 4.7 Tensile properties of PLA/NR/NR-g-PVAc blends (10 wt% rubber):
(a) modulus, (b) yield stress, (c) stress at break and (d) elongation
at break 109
Figure 4.8 Tensile fractured surfaces of (a) PLA, and PLA/NR/NR-g-PVAc:
(b) 90/10/0, (c) 90/0/10G5, (d) 90/0/10G12 and (e) 90/5/5G12 110
Figure 4.9 SEM micrographs of freeze-fractured surface of PLA/NR-g-PVAC
blends: (a) 10%NR, (b) 10%G1, (c) 10% G5 and (d) 10%G12 111
Figure 4.10 The transition temperature of PLA and the blends 113

xxiv
LIST OF FIGURES (continued)
Page
Figure 4.11 DSC thermograms of (a) PLA pellet, (b) PLA sheet,
(c) extruded PLA and (d) 90/10/0 116
Figure 4.12 DSC thermograms of the blends containing G12: (a) 90/0/10,
(b) 90/5/5 and (c) 90/7.5/2.5 117
Figure 4.13 Stress-strain curves of PLA/NR blends containing different
NR content 119
Figure 4.14 Stress-strain curves of the blend containing G5 and G12 as
a compatibilizer 119
Figure 4.15 Effect of G5 and G12 as a compatibilizer on the notched impact
strength of the PLA/NR (90/10) blends: (a) Izod and (b) Charpy test 121
Figure 4.16 Effect of G5 and G12 as a compatibilizer on tensile properties of
the PLA/NR (90/10) blends 122
Figure 4.17 SEM micrographs of PLA/NR/G blends (>10 wt% rubber):
(a) 90/15/0, (b) 90/20/0, (c) 90/10/5G5 and (d) 90/10/5G12 124
Figure 4.18 Effect of rubber mastication on the impact strength of the blends
containing G5: (a) Izod and (b) Charpy test 126
Figure 4.19 Effect of rubber mastication on the impact strength of the blends
containing G12: (a) Izod and (b) Charpy test 126
Figure 4.20 Stress-strain curves of polymer blends with different number of
mastication of NR; (a) 100, (b) 140 and (c) 180 passes 127
Figure 4.21 Effect of NR mastication on the tensile properties of the blends
containing G5 129
Figure 4.22 Effect of NR mastication on the tensile properties of the blends
containing G12 130
Figure 4.23 SEM micrographs of the 90/5/5-G5 blends containing G5 with
different number of masticated NR: (a) 0, (b) 100, (c) 140 and
(d) 180 passes 131
Figure 4.24 1H-NMR spectrum of natural rubber 132
Figure 4.25 1H-NMR spectrum of carbonyl telechelic natural rubber (CTNR) 133

xxv
LIST OF FIGURES (continued)
Page
Figure 4.26 1H-NMR spectrum of hydroxyl telechelic natural rubber (HTNR) 134
Figure 4.27 FTIR spectra of NR, CTNR and HTNR 135
Figure 4.28 1H-NMR spectra of “PLA1-NR” diblock copolymers 138
Figure 4.29 FTIR spectra of PLA, HTNR and “PLA1-NR” diblock copolymers 140
Figure 4.30 GPC chromatograms of HTNR32 and the P35N32
(A = after purification, B = before purification) 142
Figure 4.31 DSC thermograms of “PLA1-NR” diblock copolymers: (a) P35N32,
(b) and (c) the second heating scan of P27N32, P31N32 and P35N32
(c) triblock copolymers 143
Figure 4.32 TGA thermograms of (a) HTNR32 and (b) P35N32, and (c) the
weight loss of P27N32, P31N32 and P35N32 triblock copolymers 144
Figure 4.33 1H-NMR spectrum of “PLA1-NR-PLA1” triblock copolymers 145
Figure 4.34 FTIR spectra of PLA, HTNR and triblock copolymers 147
Figure 4.35 GPC chromatograms of HTNR70 and P22N70P22 148
Figure 4.36 TGA thermograms of: (a) HTNR70, (b) P31N70P31 and (c) the weight
loss of “PLA1-NR-PLA1” triblock copolymers 149
Figure 4.37 Polymerization routes to poly(lactic acid) 150
Figure 4.38 Schematic diagram of: (a) polycondensation of poly(lactic acid)
and (b) depolymerization of poly(lactic acid) 150
Figure 4.39 1H-NMR spectrum of PLA prepolymer: (a) before and (b) after
purification 151
Figure 4.40 1H-NMR spectrum of “PLA2-NR” diblock copolymers 153
Figure 4.41 FTIR spectra of HTNR, PLA, “PLA2-NR” triblock copolymers 154
Figure 4.42 GPC chromatograms of PLA58, HTNR32 and P58N32 copolymer 156
Figure 4.43 DSC thermograms: (a) PLA58, (b) PLA53 and (c) the 2nd heating
scan of HTNR32, HTNR65 and HTNR150 158
Figure 4.44 DSC thermograms: (a) P58N150, (b) P58N32, (c) PLA53 and
(d) PLA58 as precursors of diblock copolymers 159

xxvi
LIST OF FIGURES (continued)
Page
Figure 4.45 TGA thermograms: (a) PLA58, (b) HTNR150, (c) P58N32 and
(d) P58N150 160
Figure 4.46 1H-NMR spectrum of “PLA2-NR-PLA2” triblock copolymers 161
Figure 4.47 FTIR spectra of PLA, HTNR and triblock copolymers 162
Figure 4.48 GPC chromatograms of PLA53, HTNR150 and P60N150P60 163
Figure 4.49 DSC thermograms: (a) PLA35, (b) PLA75 (c) P36N150P36 and
(d) P83N150P83 166
Figure 4.50 DSC thermograms of “PLA2-NR-PLA2” triblock copolymers with
HTNR150 as a precursor (65C is the contaminant in the instrument) 166
Figure 4.51 TGA thermograms of (a) PLA35, (b) PLA75, (c) P36N150P36 and
(d) P83N150P83 167
Figure 4.52 TGA thermogram of the “PLA2-NR-PLA2” triblock copolymers
with HTNR150 as a precursor 168
Figure 4.53 Impact strength of PLA/NR/PLA-NR blends with different
molecular weight of HTNR oligomer (10 wt% rubber): (a) Izod
and (b) Charpy test 171
Figure 4.54 Impact strength of PLA/NR/PLA-NR blends with different
molecular weight of PLA (10 wt% rubber): (a) Izod and
(b) Charpy test 172
Figure 4.55 Stress-strain curves of PLA, PLA/NR and PLA/NR/PLA-NR 173
Figure 4.56 Tensile properties of PLA/NR/PLA-NR blends (10 wt% rubber):
(a) modulus, (b) stress at yield, (c) stress at break and
(d) elongation at break 175
Figure 4.57 SEM micrographs of freeze fractured surface of the PLA/NR/
PLA-NR blends: (a) 10 wt% P60N120, (b) 10 wt% P58N150,
(c) 2.5 wt% P60N120 and (d) 2.5 wt% P58N150 177
Figure 4.58 Impact strength of PLA/NR/PLA-NR-PLA blends with different
molecular weight of HTNR (10 wt% rubber): (a) Izod and
(b) Charpy test 180

xxvii
LIST OF FIGURES (continued)
Page
Figure 4.59 Impact strength of PLA/NR/PLA-NR-PLA blends with different
molecular weight of PLA (10 wt% rubber): (a) Izod and
(b) Charpy test 181
Figure 4.60 Stress-strain curves of PLA/NR/PLA-NR-PLA blends
(10 wt% rubber): P60N120P60, (b) P58N150P58, (c) P35N150P35
and (d) P60N200P60 182
Figure 4.61 Effect of different HTNR oligomers on tensile properties of
PLA/NR blends (10 wt% rubber) 184
Figure 4.62 Effect of different PLA prepolymers on tensile properties of
PLA/NR blends (10 wt% rubber) 185
Figure 4.63 Mechanical properties of the blends (10 wt% rubber) with P58N150
diblock and P58N150P58 triblock copolymers 186
Figure 4.64 SEM micrographs of freeze-fractured surface of
PLA/NR/PLA-NR-PLA blends at 2.5 wt% of: (a) P60N120P60,
(b) P58N150P58, (c) P35N150P35 and (d) P60N200P60 187
Figure 4.65 Impact strength of the PLA/NR/PLA-NR blends
(>10 wt% rubber): (a) Izod and (b) Charpy test 190
Figure 4.66 SEM micrographs of PLA/NR/PLA-NR blends (>10 wt% rubber):
(a) 2.5 pph-P58N150, (b) 2.5 pph-P60N200, (c) 10 pph-P58N150 and
(d) 10 pph-P60N200 191
Figure 4.67 Tensile properties of PLA/NR/PLA-NR blends (>10 wt% rubber):
(a) modulus, (b) stress at yield, (c) stress at break and
(d) elongation at break 192
Figure 4.68 Impact strength of the PLA/NR/PLA-NR-PLA blends
(>10 wt% rubber): (a) Izod and (b) Charpy 195
Figure 4.69 Tensile properties of PLA/NR/PLA-NR-PLA blends
(>10 wt% rubber): (a) modulus, (b) stress at yield,
(c) stress at break and (d) elongation at break 197

xxviii
LIST OF FIGURES (continued)
Page
Figure 4.70 SEM micrographs of the PLA/NR/PLA-NR-PLA blends
(>10 wt% rubber): (a) 2.5 pph-P58N150P58, (b) 10 pph-P60N200P60,
(c) 10 pph-P58N150P58 and (d) 10 pph-P60N200P60 199

xxix
LIST OF ABBREVIATIONS
CTNR Carbonyl telechelic natural rubber
DMTA Dynamic mechanical thermal analysis
DRC Dry rubber content
DSC Differential scanning calorimetry
FTIR Fourier transform infrared spectroscopy
G Grafting percentage
GE Grafting efficiency
GPC Gel permeation chromatography
H5IO6 Periodic acid
HTNR Hydroxyl telechelic natural rubber
Mn Number average molecular weight
Mw Mass average molecular weight
NaHB4 Sodium borohydride
NR Natural rubber
NRL Natural rubber latex
NR-g-PMMA Natural rubber grafted with poly(methyl methacylate)
NR-g-PVAc Natural rubber grafted with poly(vinyl acetate)
PDI Polydispersity index
PEG Poly(ethylene glycol)
PEO Poly(ethylene oxide)
PLA Poly(lactic acid)
PVAc Poly(vinyl acetate)
ROP Ring opening polymerization
SEM Scanning electron microscopy
Td Thermal degradation stability
Tg Glass transition temperature
Tcc Cold crystallization temperature
Tm Melting temperature
TGA Thermal gravimetric analysis
THF Tetrahydrofuran
TNR Telechelic natural rubber
X Conversion percentage
Xm Crystallinity

1
CHAPTER 1
GENERAL INTRODUCTION
1.1 Background
The synthesis of polymers from renewable resources has gained
considerable interest in the two last decades due to two major reasons: the
environmental concerns and the realization that the petroleum resources are finite.
These polymers can be classified into three categories based on their original source
including: (1) natural polymers, such as starch, protein, wood flour and celluloses; (2)
synthetic polymers from natural monomers, such as poly(lactic acid) (PLA); (3)
synthetic polymers from microbial fermentation, such as polyhydroxybutyrate (PHB).
Most plastics are derived from non-renewable crude oil and natural gas resources and
they exhibit many properties ideal for the use in a variety of applications, such as light
weight, variable barrier properties to match endues applications, good shaping and
molding capability, and ease of conversion into different formats. However,
petroleum-based polymers have caused serious pollution, which cannot be resolved in
a straightforward way, when dispersed in the environment. Therefore, the
development of synthetic polymers using monomers from natural resources provides a
new direction to develop biodegradable polymers from renewable resources.
One of the most promising polymers in this regard is poly(lactic acid)
(PLA). It is a synthetic aliphatic polyester; it is obtained from agricultural products
and is readily biodegradable. The advantages of PLA have been mentioned such as
renewability, biocompatibility, processability and energy saving [1-4]. PLA can be
considered an eco-friendly biomaterial with excellent properties. Nevertheless, it also
has disadvantages such as low toughness, slow degradation rate, hydrophobicity and
lack of reactive side-chain groups. One of the significant limitations of PLA is poor
toughness with less than 10% elongation at break; therefore, it is not suitable for
certain applications [5]. Common processes for improving the flexibility and impact
strength of PLA are blending with a toughening agent [6-14] and copolymerization
[15-18]. However, most PLA-based polymer blends are immiscible blends,

2
consequently in order to achieve good properties it is essential to compatibilize the
components of the blends. Compatibilization is a process of modification of the
interfacial properties in immiscible polymer blends. There are three goals for the
compatibilization process: (1) to adjust the interfacial tension, (2) to make certain that
the morphology generated during the blending stage will yield optimum structure
during the forming stage, and (3) to enhance adhesion between the phases in the solid
state [19-20]. There are four common compatibilization methods to produce desirable
properties: (1) achievement of thermodynamic miscibility (a balance of enthalpic and
entropic contributions to the free energy of mixing), (2) addition of block or graft
copolymers, (3) addition of functional groups (reactive polymers) and (4) in situ
grafting [21]. The first two methods are referred to as a non-reactive compatibilization
whereas the other two are a reactive compatibilization. The added block or graft
copolymers, which contain segments miscible with their respective polymer
components, show a tendency to be localized at the interface between the continuous
and dispersed phases. These copolymers act as emulsifiers which reduce the
interfacial tension between the two phases and stabilize the dispersed phase against
coalescence of the dispersed particles. The reaction compatibilization is the process
that allows generating in situ graft or block copolymers during melt blending and it is
generally referred as a reactive blending (the obtained blends are called reactive
blends). There are many research works in which reactive blending has been used to
improve the mechanical properties of PLA-based blends [22-33].
In recent years, many researchers have been reporting that natural
rubber (NR) is a good toughening agent for PLA because of its excellent properties,
such as high strength, high resilience and high elongation at break. It has been
demonstrated that the optimal content of NR in the blends was 10 wt% [11-14, 34-
36]. The mechanical properties of PLA/NR blends were improved by adding a third
component such as dicumyl peroxide (DCP) as a crosslinker [34], calcium carbonate
(CaCO3) and talc [36] as nucleating agents. Natural rubber was grafted with many
polymers such as poly(methyl methacrylate) (NR-g-PMMA) [13, 37], poly(butyl
acrylate) (NR-g-PBA) [14], and glycidyl methacrylate (NR-g-GMA) [11, 38] and it
was used as a compatibilizer. PLA/NR-g-PBA is a compatible blend in which the
elongation at break and the impact strength increased with increasing NR-g-PBA

3
content [14]. The addition of NR-g-GMA in PLA/NR blend showed higher impact
strength and elongation at break than the PLA/NR blend without NR-g-GMA [11,
38]. Viscosity and molecular weight of NR decreased with increasing number of
mastications and this led to an increase in the impact strength of the PLA/NR blends,
because of the more appropriate particle size of rubber [13]. PLA blended with
polyisoprene (PIP) grafted with polyvinyl acetate (PIP-g-PVAc) showed better
mechanical properties than PLA blended with PIP [39]. The PLA/PVAc blend
showed only one glass transition temperature and exhibited synergism in the range of
5-30 wt% PVAc in mechanical properties probably due to some reaction taking place
in that region [40-42].
Block copolymerization is another method that can improve the
mechanical properties of polymers and block copolymers can be used as a
compatibilizer of polymers blends. Some polymers have been copolymerized with
PLA such as poly(ethylene glycol) (PEG) [43-60], poly(ethylene oxide) (PEO) [61-
69], poly(-caprolactone) (PCL) [70-77], new amphiphilic poly(2-ethyl-2-oxazoline)
[78-79] and PEG-PLA-PCL [80-82]. It has been published that PLA-based block
copolymer was used to improve the compatibility in PLA-based blends such as
PLA/PCL-PLLA blend [72], and PLLA/MPEG-PLLA and PLLA/PLLA-PEG-PLLA
blends [59]. There is no report on a block copolymer of PLA and NR.
1.2 Objectives
The objective of this research work was to improve the toughness of
PLA/NR blends by adding three different types of compatibilizers: NR grafted with
PVAc (NR-g-PVAc), PLA-NR diblock copolymer and PLA-NR-PLA triblock
copolymer. This research work has been divided into three parts; the first and the
second part consisted in the synthesis of a graft copolymer and block copolymers,
respectively. The third part was the preparation of polymer blends from PLA and NR
with and without a compatibilizer, and the determination of their mechanical
properties. In the first part, the NR-g-PVAc copolymer was synthesized and
characterized by using emulsion polymerization technique at 60C for 4 h. The
chemical structure was analyzed by 1H-NMR and FTIR. The mole ratio of NR and
VAc was varied from 90/10, 60/40 and 50/50. In the second part, diblock (PLA-NR)

4
and triblock (PLA-NR-PLA) copolymers were synthesized and characterized. NR was
modified by chain scission with periodic acid to obtain carbonylic telechelic natural
rubber (CTNR) and then transformed to be hydroxyl telechelic natural rubber
(HTNR). Prepolymer of PLA was synthesized by two methods: ring opening
polymerization of lactide and condensation polymerization of L-lactic acid. Block
copolymerization was carried out for 24 h at 110C to obtain diblock copolymers and
at 170C for the triblock copolymers. They were characterized by 1H-NMR, FTIR and
GPC. In the third part, PLA/NR blends were prepared by melt blending in a twin
screw extruder. The polymer blends contained 10-20 wt% of rubber (NR, NR-g-
PVAc, PLA-NR and PLA-NR-PLA). A 2-mm thick sheet was prepared by
compression molding and, morphology, mechanical and thermal properties were
investigated.
1.3 References
1. Henton, D.E., Gruber, P., Lunt, J., Randall, J. 2005. Natural fibers, biopolymers,
and biocomposites. Mohanty, A.K., Drzal, L.T., Misra, M., Ed. Taylor &
Francis group LLC. USA.
2. Gupta, B., N., Revagade, Hilbornb, J. 2007. Poly(lactic acid) fiber: An
overview. Progress in Polymer Science, 32, 455-482.
3. Rasal, R.M., Janorkar, A.V., Hirt, D.E. 2010. Poly(lactic acid) modification.
Progress in Polymer Science, 35, 338-356.
4. Xiao, L., Wang, B., Yang, G., Gauthier, M. 2012. Poly(lactic acid)-based
biomaterials: synthesis, modification and applications, biomedical science,
engineering and technology. Ghista, D.N., Ed. InTech publisher, New York,
USA.
5. Rasal, R.M., Hirt, D.E. 2009. Toughness decrease of PLA-PHBHHx blend films
upon surface-confined photopolymerization. Journal of Biomedical
Materials Research Part A, 88, 1079-1086.
6. Grijpma, D.W., Van Hofslot, R.D.A., Super, H., Nijenhuis, A.J., Pennings, A.J.
1994, Rubber toughening of poly(lactide) by blending and block
copolymerization. Polymer Engineering Science, 34, 1674-1684.

5
7. Nijenhuis, A., Colstee. J.E., Grijpma, D.W., Pennings, A.J. 1996. High
molecular weight poly(L-lactide) and poly(ethylene oxide) blends: Thermal
characterization and physical properties. Polymer, 37, 5849-5857.
8. Zhang, L., Xiong, C., Deng, X.C. 1996. Miscibility, crystallization and
morphology of poly (3-hydroxybutyrate)/poly (DL-lactide) blends. Polymer,
37, 235-241.
9. Zhang, L., Goh, S.H., Lee, S.Y. 1998. Miscibility and crystallization behavior of
poly(L-lactide)/poly(p-vinylphenol) blends, Polymer, 39, 4841-4847.
10. Ishida, S., Nagasaki, R., Chino, K., Dong, T., Inoue, Y.J. 2009. Toughening of
poly(L-lactide) by melt blending with rubbers. Journal of Applied Polymer
Science, 113, 558-566.
11. Juntuek, P., Ruksakulpiwat, C., Chumsamrong, P., Raksakulpiwat, Y. 2010. The
study of using glycidylmethylacrylate grafted natural rubber as an impact
modifier of poly(lactic acid). Clean Technology, ISBN 978-1-4398-3419-0.
12. Bitinis, N., Verdejo, R., Cassagnau, P., Lopez-Manchado, M.A. 2011. Structure
and properties of polylactide/natural rubber blends. Materials Chemistry and
Physics, 129, 823-831.
13. Jaratrotkamhorn, R., Khaokong, C., Tanrattanakul, V. 2012. Toughness
enhancement of poly(lactic acid) by melt blending with natural rubber.
Journal of Applied Polymer Science, 124, 5027-5036.
14. Zhang, C., Man, C., Pan,Y., Wang, W., Jiang, L., Dan, Y. 2011. Toughening of
polylactide with natural rubber grafted with poly(butyl acrylate). Polymer
International, 60, 1548-1555.
15. Cutright, D.E., Perez, B., Beasley, J.D., Larson, W.J., Posey, W.R. 1974.
Degradation rates of polymers and copolymers of polylactic and
polyglycolic acids. Oral Surgery, Oral Medicine, Oral Pathology, 37, 142-
152.
16. Athanasiou, K.A., Niederauer, G.G., Agrawal, C.M. 1996. Sterilization, toxicity,
biocompatibility and clinical applications of polylactic acid/polyglycolic
acid copolymers. Biomaterials, 17, 93-102.

6
17. Zhang, J.F., Sun, X. 2004. Mechanical and thermal properties of poly(lactic
acid)/starch blends with dioctyl maleate. Journal Applied Polymer Science,
94, 1697-1704.
18. Ferretti, C. 2008. A prospective trial of poly-L-lactic/polyglycolic acid co-
polymer plates and screws for internal fixation of mandibular fractures.
International Journal of Oral Maxillofacial Surgery, 37, 242-248.
19. Harrats, C., Groenincke, G. 2004. Reactive processing of polymer blend using
reactive compatibilization and dynamic creosslinking: Phase morphology
control and microstructure - Property Relations. Modification and Blending
of Synthetic and Natural, Macromolecules NATO Science Series, 175, 155-
199.
20. Ciardelli, F., Penczek, S., Ed. Modification and blending of synthesis and
natural macromolecules, Kluwer Acadamic Publishers, Netherlands, 155-
199.
21. Horák, Z., Fortelný, I., Kolařík, J., Hlavatá, D., Sikora, A. 2005. Polymer
Blends, Encyclopedia in Polymer Science and Technology. John Wiley &
Sons, Inc., 1-59.
22. Folkes, M.J., Hope, P.S. 1993. Polymer blends and alloys. Blackie Academic
and Professional, Glasgow Lanarkshire G64 2NZ, UK.
23. Wang, L., Ma, W., Gross, R.A., McCarthy, S.P. 1998. Reactive
compatibilization of biodegradable blends of poly(lactic acid) and poly(ε-
caprolactone). Polymer Degradation and Stability, 59, 161-168.
24. Jin, H.J., Chin, I.J., Kim, M.N., Kim, S.H., Yoon, J.-S. 2000. Blending of
poly(L-lactic acid) with poly(cis-1,4-isoprene). European Polymer Journal,
36, 165-169.
25. Wu, C.S., Liao, H.T. 2005. A new biodegradable blends prepared from
polylactide and hyaluronic acid. Polymer, 46, 10017-10026.
26. Mohamed, A.A., Gordon, S.H., Carriere, C.J., Kim, S. 2006. Thermal
characterization of polylactic acid/wheat gluten blends. Journal of Food
Quality, 29, 266-281.
27. Harada, M., Ohya, T., Iida, K., Hayashi, H., Hirano K., Fukuda, H. 2007.
Increased impact strength of biodegradable poly(lactic acid)/poly(butylene

7
succinate) blend composites by using isocyanate as a reactive processing
agent. Journal of Applied Polymer Science, 106, 1813-1820.
28. Orozco, V.H., Brostow, W., Chonkaew,W., Lo´pez, B.L. 2009. Preparation and
characterization of poly(lactic acid)-g-maleic anhydride+starch blends.
Macromolecule Symposia, 277, 69-80.
29. Oyama, H.T. 2009. Super-tough poly(lactic acid) materials: Reactive blending
with ethylene copolymer. Polymer, 50, 747-751.
30. Ren, J., Fu, H., Ren, T., Yuan, W. 2009. Preparation, characterization and
properties of binary and ternary blends with hermoplastic starch, poly(lactic
acid) and poly(butylene adipate-co-terephthalate). Carbohydrate Polymers,
77, 576-582.
31. Carrasco, F., Pagès, P., Gámez-Pérez, J., Santana, O.O., Maspoch, M.L. 2010.
Processing of poly(lactic acid): Characterization of chemical structure,
thermal stability and mechanical properties. Polymer Degradation and
Stability, 95, 116-125.
32. Kumar, M., Mohanty, S., Nayak, S.K., Rahail, P.M. 2010. Effect of glycidyl
methacrylate (GMA) on the thermal, mechanical and morphological
properties of biodegradable PLA/PBAT blend and its nanocomposites.
Bioresource Technology, 101, 8406-8415.
33. Phetwarotai, W., Potiyaraj, P., Aht-Ong, D. 2010. Properties of compatibilized
polylactide blend films with gelatinized corn and tapioca starches. Journal of
Applied Polymer Science, 116, 2305-2311.
34. Huang, Y., Zhang, C., Pan, Y., Wang, W., Jiang, L., Dan, Y. 2013. Study on the
Effect of dicumyl peroxide on structure and properties of poly(lactic
acid)/natural rubber blend. Journal of Polymer and the Environment, 21,
375-387.
35. Bitinis, N., Sanz, A., Nogales, A., Verdejo, R., Lopez-Manchado M.A.,
Ezquerra, T.A. 2012. Deformation mechanisms in polylactic acid/natural
rubber/organoclaybionanocomposites as revealed by synchrotron X-ray
scattering. Soft Matter, 8, 8990-8997.

8
36. Siksut, B., Deeprasertkul, C. 2011. Effect of nucleating agents on physical
properties of poly(lactic acid) and its blend with natural rubber. Journal of
Polymer and the Environment, 19, 288-296.
37. Jaratrotkamjorn, R., Tanrattanakul, V. Mechanical properties of poly(lactic acid)
blended with natural rubber, The 1st Polymer Conference of Thailand (PCT-
1), October 7-8, 2010, Bangkok, Thailand, p.27.
38. Juntuek, P., Ruksakulpiwat, C., Chumsamrong, P., Raksakulpiwat, Y. 2012.
Effect of glycidyl methacrylate-grafted natural rubber on physical properties
of polylactic acid and natural rubber blends. Journal of Applied Polymer
Science, 125, 745-754.
39. Jin, H.J., Chin, I.J., Kim, M.N., Kim, S.H., Yoon, J.-S. 2000. Blending of
poly(L-lactic acid) with poly(cis-1,4-isoprene). European Polymer Journal,
36, 165-169.
40. Gajria, A.M., Dave, V., Gross, R.A., McCarthy, S.P. 1996. Miscibility and
biodegradability of blends of poly(lactic acid) and poly(vinyl acetate).
Polymer, 37, 437-444.
41. Liu, C., Mather, P.T. 2003. Thermomechanical characterization of blends of
poly(vinyl acetate) with semi-crystalline polymers for shape memory
application. Proceeding of Annual Technical Conference of the Society of
Plastics Engineers (ANTEC) 61st, 2, 1962-1966.
42. Park, J.W., Im, S.S. 2003. Miscibility and morphology in blends of poly(L-lactic
acid) and poly(vinyl acetate-co-vinyl alcohol). Polymer, 44, 4341-4354.
43. Stevels, W.M., Ankone, M.J.K., Dijkstra, P.J., Feijen, J. 1995. Stereocomplex
formation in ABA triblock copolymer of poly(lactic acid) (A) and
poly(ethylene glycol) (B). Macromolecular Chemistry and Physics, 196,
3687-3694.
44. Riley, T., Stolnik, S., Heald, C.R., Xiong, C.D., Garnett, M.C., Illum, L., Davis,
S.S. 2001. Physicochemical evaluation of nanoparticles assembled from
poly(lactic acid) poly(ethylene glycol) (PLA-PEG) block copolymers as
drug delivery vehicles. Langmuir, 17, 3168-3174.
45. Salem, A.K., Cannizzaro, S.M., Davies, M.C., Tendler, S.J.B., Roberts, C.J.,
Williams, P.M., Shakesheff, K.M. 2001. Synthesis and characterization of a

9
degradable poly(lactic acid)-poly(ethylene glycol) copolymer with
biotinylated end groups. Biomacromolecules, 2, 575-580.
46. Aamer, K.A., Sardinha, H., Bhatia, S.R., Tew, G.N. 2004. Rheological studies
of PLLA-PEO-PLLA triblock copolymer hydrogels. Biomaterials 25, 1087-
1093.
47. Kim, H.D., Bae, E.H., Kwon, I.C., Pal, R.R., Nam, J.D., Lee, D.S. 2004. Effect
of PEG-PLLA diblock copolymer on macroporous PLLA scaffolds by
thermally induced phase separation. Biomaterials, 25, 2319-2329.
48. Quesnel, R., Hildgen, P. 2005. Synthesis of PLA-b-PEG multiblock copolymers
for stealth drug carrier preparation. Molecules, 10, 98-104.
49. Lee, J.H., Go, A.K., Oh, S.H., Lee, K.E., Yuk, S.H. 2005. Tissue anti-adhesion
potential of ibuprofen-loaded PLLA-PEG diblock copolymer films.
Biomaterials, 26, 671-678.
50. Drumond, W.S., Mothé, C.G., Wang, S.H. 2006. Quantitative analysis of
biodegradable amphiphilic poly(latic acid)-blocked-poly(ethyleneglycol)-
block-poly(lactic acid) by using TG, FTIR and NMR. Journal of Thermal
Analysis and Calorimetry, 85, 173-177.
51. Na, K., Lee, K.H., Lee, D.H., Bae, Y.H. 2006. Biodegradable thermo-sensitive
nanoparticles from poly(L-lactic acid)/poly(ethylene glycol) alternating
multi-block copolymer for potential anti-cancer drug carrier. European
Journal of Pharmaceutical Sciences, 27, 115-122.
52. Chen, L., Xie, Z., Hu, J., Chen, X., Jing, X. 2007. Enantiomeric PLA-PEG block
copolymers and their stereocomplex micelles used as rifampin delivery.
Journal of Nanoparticle Research, 9, 777-785.
53. Wang, M., Chen, W., Zhang, H., Li, X., Zhang, Y., Yao, K., Yao, F. 2007.
Synthesis and characterization of PLLA-PLCA-PEG multiblock copolymers
and their applications in modifying PLLA porous scaffolds. European
Polymer Journal, 43, 4683-4694.
54. Jun, Y.J., Park, K.M., Joung, Y.K., Park, K.D. 2008. In situ gel forming
stereocomplex composed of four-Arm PEG-PDLA and PEG-PLLA block
copolymers. Macromolecular Research, 16, 704-710.

10
55. Gong, F., Cheng, X., Wang, S., Wang, Y., Gao, Y., Cheng, S. 2009.
Biodegradable comb-dendritic tri-block copolymers consisting of
poly(ethylene glycol) and poly(L-lactide): Synthesis, characterizations, and
regulation of surface morphology and cell responses. Polymer, 50, 2775-
2785.
56. Lin, Y., Zhang, A. 2010. Synthesis and characterization of star-shaped poly
(D,L-lactide)-block-poly(ethylene glycol) copolymers. Polymers Bulletin, 65,
883-892.
57. Ren, W., Chang, J., Yan, C., Qian, X. 2010. Development of transferrin
functionalized poly(ethylene glycol)/poly(lactic acid) amphiphilic block
copolymeric micelles as a potential delivery system targeting brain glioma.
Journal of Materials Science: Materials in Medicine, 21, 2673-2681.
58. Hu, X., Xu, J.-Z., Zhong, G.-J., Luo, X.-L., Li, Z.-M. 2011. Shear induced
crystallization of poly(L-lactide) and poly(ethylene glycol) (PLLA-PEG-
PLLA) copolymers with different block length. Journal of Polymer
Research, 18, 675-680.
59. Jung, I.-I., Haam, S., Lim, G., Ryu, J.-H. 2011. Formation of MPEG-PLLA
block copolymer microparticles using compressed carbon dioxide. Korean
Journal of Chemistry and Engineering, 28, 1945-1951.
60. Kim, J.H., Noh, H., Kang, J.H., Lee, B.S., Choi, J., Park, K., Han, D.K. 2011.
Characteristics of PLLA films blended with PEG block copolymers as
additives for biodegradable polymer stents. Biomedical Engineering Letter,
1, 42-48.
61. Zhao, H., Liu, Z., Park, S., Kim, S.H., Kim, J.H., Piao, L. 2012. Preparation and
characterization of PEG/PLA multiblock and triblock copolymer. Bulletins
Korean Chemistry Society, 33, 1638-1642.
62. Saffer, E.M., Tew, G.N., Bhatia, S.R. 2011. Poly(lactic acid)-poly(ethylene
oxide) block copolymer: New directions in self-assembly and biomedical
applications. Current Medicinal Chemistry, 18, 5676-5686.
63. Rashkov, I., Manolova, N., Li, S.M., Espartero, J.L., Vert, M. 1996. Synthesis,
characterization, and hydrolytic degradation of PLA/PEO/PLA triblock

11
copolymers with short poly(L-lactic acid) chains. Macromolecules, 29, 50-
56.
64. Park, S.Y., Han, D.K., Kim, S.C. 2001. Synthesis and characterization of star-
shaped PLLA-PEO block copolymers with temperature-sensitive sol-gel
transition behavior. Communications to the Editor: Macromolecules, 34,
8821-8824.
65. Lee, C.W., Kang, Y.G. 2001. Synthesis and properties of triblock and
multiblock copolymers consisting of poly(L-lactide) and poly(oxyethylene-
co-oxypropylene), Korea Polymer Journal, 9, 84-91.
66. Lee, S.-H., Kim, S.H., Kim, Y.H. 2002. Synthesis and degradation behaviors of
PEO/PL/PEO tri-block copolymers. Macromolecular Research, 10, 85-90.
67. Maglio, G., Migliozzi, A., Palumbo, R. 2003. Thermal properties of di- and
triblock copolymers of poly(L-lactide) with poly(oxyethylene) or poly(-caprolactone). Polymer, 44, 369-375.
68. Garric, X., Garreau, H., Vert, M., Moles, J.-P. 2008. Behaviors of keratinocytes
and fibroblasts on films of PLA50-PEO-PLA50triblock copolymers with
various PLA segment lengths. Journal of Materials Science: Materials in
Medicine, 19, 1645-1651.
69. Lee, J.-W., Jeong, E.D., Cho, E.J., Gardella, J.A., Hicks, W., Hard, R., Bright,
F.V. 2008. Surface-phase separation of PEO-containing biodegradable
PLLA blends and block copolymers. Applied Surface Science, 255, 2360-
2364.
70. Qian, H., Bei, J., Wang, S. 2000. Synthesis, characterization and degradation of
ABA block copolymer of L-lactide and -caprolactone. Polymer Degradation
and Stability, 68, 423-429.
71. Kim, J.K., Park D.J., Lee, M.S., Ihn, K.J. 2001. Synthesis and crystallization
behavior of poly(L-lactic acid)-block-poly(-carprolactone) copolymer.
Polymer, 42, 7429-7441.
72. He, A., Han, C.C., Yang, G. 2004. Preparation and characterization of
PLLA/P(CL-b-LLA) blends by an in situ ring-opening polymerization.
Polymer, 45, 8231-8237.

12
73. Baimark,Y., Molloy, R., Molloy, N., Siripitayananon, J., Punyodom, W., Sriyai,
M. 2005. Synthesis, characterization and melt spinning of a block copolymer
of L-lactide and ε-caprolactone for potential use as an absorbable
monofilament surgical suture. Journal of materials Science: Materials in
Madecine, 16, 699-707.
74. Zhao, Z., Yang, L., Hu, Y., He, Y., We, J., Li, S. 2007. Enzymatic degradation
of block copolymers obtained by sequential ring opening polymerization of
L-lactide and -caprolactone. Polymer Degradation and Stability, 92, 1769-
1777.
75. Wu, L., Chen, S., Li, Z., Xu, K., Chen, G.-Q. 2008. Synthesis, characterization
and biocompatibility of novel biodegradable poly[((R)-3-hydroxybutyrate)-
block (D,L-lactide)-block-(ε-caprolactone)] triblock copolymers. Polymer
International, 57, 939-949.
76. Zhang, G., Fiore, G.L., Clair, T.L., Fraser, C.L. 2009. Difluoroborondibenzoyl-
methane PCL-PLA block copolymers: matrix effects on room temperature
phosphorescence. Macromolecules, 42, 3162-3169.
77. Kikkawa, Y., Kurokawa, K., Kimura, R., Takahashi, M., Kanesato, M., Abe, H.
2010. Solvent-induced morphological diversification in poly(L-lactide-b--caprolactone) block copolymer thin films. Polymer Degradation and
Stability, 95, 1414-1420.
78. Wang, C.-H., Hsiue, G.-H. 2003. New amphiphilic poly(2-ethyl-2-oxazoline)/
poly(L-lactide) triblock copolymers. Biomacromolecules, 4, 1487-1490.
79. Wang, C.-H., Fan, K.-R., Hsiue, G.-H. 2005. Enzymatic degradation of PLLA-
PEOZ-PLLA triblock copolymers. Biomaterials, 26, 2803-2811.
80. Huang, M.-H., Li, S., Coudane, J., Vert, M. 2003. Synthesis and characterization
of block copolymers of -caprolactone and DL-lactide initiated by ethylene
glycol or poly(ethylene glycol). Macromolecular Chemistry and Physics,
204, 1994-2001.
81. Zhang, Y., Wang, C., Yang, W., Shi, B., Fu, S. 2005. Tri-component diblock
copolymers of poly(ethylene glycol)-poly(-caprolactone-co-lactide):
synthesis, characterization and loading camptothecin. Colloid Polymer
Science, 283, 1246-1252.

13
82. Kang, Y.M., Lee, S.H., Lee, J.Y., Son, J.S., Kim, B.S., Lee, B., Chun, H.J., Min,
B.H., Kim, J.H., Kim, M.S. 2010. A biodegradable, injectable, gel system
based on MPEG-b-(PCL-ran-PLLA) diblock copolymers with an adjustable
therapeutic window. Biomaterials, 31, 2453-2460.

14
CHAPTER 2
LITERATURE REVIEW
2.1 Polymer blend
2.1.1 General information
A polymer blend is a mixture of two or more different polymers that
makes it possible to achieve various combinations of the properties of final materials,
usually in a more effective cost way than in the case of the synthesis of new polymers.
Therefore, great attention has been paid to the investigation of the blend systems, as
well as to the development of specific materials. Mixing of two polymers can produce
either a homogeneous mixture at the molecular level or a heterogeneous separated
phase blend [1]. Demixing of polymer chains produces two totally separated phases,
and hence leads to macrophase separation in polymer blends. The most important
relationship governing mixtures of dissimilar components 1 and 2 is equation (2.1)
mmm STHG 0 (2.1)
Where Gm is the free energy of mixing (Gibbs energy), Hm is the enthalpy of
mixing (heat of mixing), Sm is the entropy of mixing and T is the temperature (K).
Gm must be negative to have a spontaneous process [1].
2.1.2 Definition of polymer blend
Polymer blends can be divided into different types considering the
miscibility, immiscibility, partial miscibility and compatibility of the component [2].
(a) Miscibility: It is considered to be the level (scale) of mixing of polymeric
constituents of a blend yielding a material which exhibits the properties expected from
a single phase material. This method does not imply or require ideal mixing, but will
be expected to be mixed approaching the segment scale of dimensions. Structure of
the blend can still be expected in the 1-2 nm range. Miscible polymer blends can be

15
defined as a blend of two or more polymers homogeneous down to the molecular
level and fulfilling the thermodynamic conditions for a miscible multicomponent
system.
(b) Immiscibility: A blend is considered immiscible if it is separated into
phases composed by the individual constituents. Phase separation is also established
from thermodynamic relationships. An immiscible polymer blend can be defined as
the blend that does not comply with the thermodynamic conditions of phase stability.
(c) Partial miscibility: A blend is considered partially miscible if there exists
phase separation but each polymer rich phase contains a sufficient amount of the other
polymer to alter the properties of that phase e.g., the glass transition temperature.
(d) Compatibility: it is a general term used to imply useful properties of
polymer blends. Generally, the mechanical properties are employed as a reference of
the degree of compatibility. Compatibilization of incompatible polymer blends is a
major area of research and development. The degree of compatibility is generally
related to the level of adhesion between the phases and the ability to transmit stress
across the interface. A compatible polymer blend corresponds to a commercially
attractive polymer mixture that is visibly homogeneous, and that has improved
physical properties compared with the constituent polymers. For two-component blends, it is possible to construct a phase diagram,
which may exhibit lower or upper critical solution temperature (LCST or UCST). In
practice, LCST behavior is more commonly seen, phase separating occurring as
temperature increases, because the intermolecular attractive forces responsible for the
miscible behavior are disrupted [3]. Figure 2.1 shows schematic binodal and spinodal
curves corresponding to the different types of interaction parameters. The binodal
(curves 1-4), define the two-phase regions. The spinodal curve defines the region of
absolute instability of the polymer blend. The common point to the binodal and
spinodal curves is the critical point. The position of the critical point of a blend of
monodisperse polymers coincides with the UCST or LCST of a binodal curve. If only
dispersive interactions among polymer molecules are effective in a blend, partial
miscibility can be expected at low temperatures. Above the UCST, the polymer blend
is homogeneous (curve 1) [1].

16
Figure 2.1 Possible types of phase diagrams in the solution of polymer blend; (—
binodal curves, ---- spinodal curves) [1].
2.1.3 Rubber toughened plastic
Rubber toughening is an extremely successful method for improving
the balance of properties in rigid polymers and it has been applied to brittle materials.
Improving mechanical properties such as toughness is usually the main reason for the
development of novel polymer blends. Other reasons for blending two or more
polymers together include: (1) to improve the polymer’s processability, especially for
the high temperature of polyaromatic plastics, (2) to enhance the physical and
mechanical properties of the blend, making them more desirable than those of the
individual polymers in the blend, and (3) to meet the market demand [3].
Compatibilization of the rubber and plastic phases is very important to achieve stress
transfer from the hard to the ductile phase. For toughened plastics, rubber modified
thermoset resins, and rubber toughened plastics, details of toughening mechanisms,
used materials, and level of toughening achieved were found to be a function of
rubber type and content [4].
When a polymeric material is subjected to impact, the plastic matrix
absorbs most of the energy, until the stress reaches a critical value; then fracture
growth takes place. It is postulated that in a rubber toughened plastic the rubber
particles undergo stretching and form a large number of microcracks instead of a large
crack and there-by they absorb the energy at the crack tip. Localized deformation on

17
these sites creates micro-voids (crazing) and/or shear bands since crazing creates new
surfaces. At higher stress, the fibrillar structure breaks down and a true crack forms.
Even at this stage, rubber particles dissipate some of the stress through shear banding,
there by delaying the failure. Hence, toughening is best carried out by adding
adequate amount of a low modulus (compared to the matrix) material having good
adhesion to the matrix [4].
2.1.4 Methods of polymer blend
The majority of polymer pairs are immiscible. The phase structure of
polymer blends is not in equilibrium and depends on the process of their preparation.
Four different methods are used for the preparation of the polymer blends: melt
blending, solution blending, latex mixing and interpenetrating polymer networks [1].
(a) Melt blending is the most widespread method of polymer blend
preparation. The blend components are mixed in the molten state in an extruder or in
batch mixers. Advantages of the method are well-defined components and
universality of mixing devices, the same extruder or batch mixers can be used for a
wide range of polymer blends. Disadvantages of this method are high energy
consumption and possible unfavorable chemical changes of blend components.
(b) Solution blending is frequently used for preparation of polymer blends on
a laboratory scale. The blend components are dissolved in a common solvent and
intensively stirred. The blend is separated by precipitation or evaporation of the
solvent. The phase structure formed in the process is a function of blend composition,
interaction parameters of the blend components, type of solvent and history of its
separation. Advantages of the process are rapid mixing of the system without large
energy consumption and the potential to avoid unfavorable chemical reactions. On the
other hand, the method is limited by the necessity to find a common solvent for the
blend components, and in particular, to remove huge amounts of organic (frequently
toxic) solvent. Therefore, in industry, this method is used only for preparation of thin
membranes, surface layers, and paints.
(c) Latex mixing is the polymer blending in the order of 10 m without using
organic solvents or large energy consumption. Significant energy is needed only for
removing water and eventually achievement of finer dispersion by melt mixing. The

18
whole energetic balance of the process is usually better than that for melt mixing. The
necessity to have all components in latex form limits the use of the process. Because
this is not the case for most synthetic polymers, the application of the process in
industrial practice is limited.
(d) Interpenetrating polymer networks is another procedure for synthesis of
polymer blend. A network of one polymer is swollen with the other monomer or
prepolymer; after that, the monomer or prepolymer is crosslinked.
2.1.5 Compatibilization
Compatibilization is a process of modification of the interfacial
properties in an immiscible polymer blend that results in formation of the interphases
and stabilization of the morphology, leading to the creation of a polymer blend [5]. As
it follows from thermodynamics, the blends of immiscible polymers obtained by
simple mixing show a strong separation tendency, leading to a coarse structure and
low interfacial adhesion. The final material then shows poor mechanical properties.
On the other hand, the immiscibility or limited miscibility of polymers enables
formation of wide range structures, some of which, if stabilized, can impart excellent
end-use properties to the final material [1]. There are three goals for the
compatibilization process: (1) to adjust the interfacial tension, thus engender the
desired degree of dispersion; (2) to make certain that the morphology generated
during the alloying stage will yield optimum structure during the forming stage; and
(3) to enhance adhesion between the phases in the solid state, facilitating the stress
transfer hence improving performance [6-7]. This procedure is known as
compatibilization, and the active component that creates the bonding is called
compatibilizer. Two general methods used for compatibilization of immiscible
polymers are reactive and non-reactive compatibilization.
(a) Non-reactive compatibilization is accomplished by reducing the size of the
dispersed phase. Block or graft copolymers with segments that are miscible with their
respective polymer components show a tendency to be localized at the interface
between immiscible blend phases. The copolymers anchor their segments in the
corresponding polymer, reducing interfacial tension and stabilizing dispersion against
coalescence. Random copolymers, sometimes also used as compatibilizers, reduce

19
interfacial tension, but their ability to stabilize the phase structure is limited. Finer
morphology and higher adhesion of the blend lead to improved mechanical properties.
The morphology of the resulting two-phase (multiphase) material, and consequently
its properties, depend on a number of factors, such as copolymer architecture (type,
number, and molecular parameters of segments), blend composition and blending
conditions. Figure 2.2 shows the conformation of different block, graft, or random
copolymers at the interface [1, 4].
(b) Reactive compatibilization is the process that allows generating in situ graft
or block copolymers acting as compatibilizers during melt blending. These
copolymers are formed by reactions at the interfaces between suitably functionalized
polymers, and they link the immiscible phases by covalent or ionic bonds. In this
process, the copolymers are formed directly at the interfaces, where they act like
preformed copolymers. They reduce the size of the dispersed phase and improve
adhesion. For this reason, the problem of the transport of the compatibilizer to
interface is not relevant and structure control is easier than in the case of adding
preformed copolymers. In order to achieve efficient compatibilization of polymer
(a)
(b)
(d)
(c)
(e)
Figure 2.2 Schematic diagram of connecting chains at an interface in the polymer
blend: (a) diblock copolymers, (b) end-grafted chains, (c) triblock
copolymers, (d) multiple grafted chains and (e) random copolymer [1].

20
blends, the reactions between the functional groups should be selective and fast, and
the mixing conditions should minimize the limitation of mass transfer in the course of
the reaction [1, 4].
2.2 Copolymerization
Copolymers generally possess a different composition than that of the
initial monomer mixture. The chain composition depends on the ratio between the
reactivities of the two monomers and the concentrations of growing ends. In
copolymerization, the more reactive monomer will polymerize preferentially: its
consumption, however, means that the remaining monomer mixture will become
deficient in this monomer, so that the copolymer that is formed at the end of the
reaction exhibits a different composition than that produced at the beginning. The
composition of the copolymer is equal to the initial mixture composition only at a
specific combination of reactivity and concentration [8].
2.2.1 Graft copolymers
Graft copolymers are composed by a main polymer chain, the
backbone, having one or more side polymer chains attached to it through covalent
bonds, to form branches. The chemical nature and composition of the backbone and
the branches differs in most cases. Branches are usually distributed randomly along
the backbone although, recently, advances in synthetic methods allowed the
preparation of more well-defined structures [10]. Two major types of grafting may be
considered: (i) grafting with a single monomer and (ii) grafting with a mixture of two
or more monomers. The first type usually occurs in a single step and the second may
occur with either the simultaneous or sequential use of the two monomers [9].
Grafting can be accomplished by either “grafting to” or “grafting from” approach. In
“grafting to”, functionalized monomers react with the backbone polymer to form the
grafted one. On the other hand, “grafting from” is achieved by immobilizing initiators
on the backbone and performing the polymerization. High grafting density polymers
also can be obtained using this technique [11]. The schematic presentation of all the
processes is depicted in Figure 2.3.

21
Figure 2.3 Schematic diagram of (a) “grafting to” and (b) “grafting from” approach
[10].
There are several techniques for graft copolymerization of different
monomers on polymeric backbones. These include chemical, radiation,
photochemical, plasma-induced techniques and enzymatic grafting [9].
(a) Grafting initiated by chemical means
1) Free radical grafting can be divided into two general types according
to the manner in which the first radical species are formed; (1) homolytic
decomposition of covalent bonds by energy absorption; or (2) electron transfer from
ions or atoms containing unpaired electrons followed by bond dissociation in the
acceptor molecule.
2) Living polymerization has provided a potential for grafting reactions.
Controlled free radical polymerizations combine features of conventional free radical
and ionic polymerizations. In a living polymerization case, it provides living polymers
with controlled molecular weights and low polydispersities.
3) Ionic grafting proceeds through an ionic mode. Alkali metal
suspensions in a liquid Lewis base, organometallic compounds and sodium
naphthalenide are useful initiators for this purpose. Cationic catalyst BF3 can also be
used. Grafting can also proceed through an anionic mechanism.
(b) Grafting initiated by radiation technique
1) Free radical grafting: Grafting proceeds in three different steps; (1)
the pre-irradiation technique, the polymer backbone is first irradiated in vacuum or in
the presence of an inert gas to form free radicals in liquid or vapor state or as a

22
solution in a suitable solvent, (2) the peroxidation grafting method, the trunk polymer
is subjected to high-energy radiation in the presence of air or oxygen to form
hydroperoxides or diperoxides, depending on the nature of the polymeric backbone
and the irradiation conditions and (3) the mutual irradiation technique, the polymer
and monomers are irradiated simultaneously to form free radicals and subsequent
addition. Since the monomers are not exposed to radiation in the pre-irradiation
technique, the obvious advantage is that the method is relatively free from
homopolymer formation, which occurs with the simultaneous technique.
2) Ionic grafting may be of two different types: cationic or anionic. The
potential advantage of the ionic grafting is high reaction rate. Thus, small radiation
doses are sufficient to bring about the required grafting.
(c) Photochemical grafting: when a chromophore on a macromolecule
absorbs light, it goes to an excited state, which may dissociate into reactive free
radicals; hence the grafting process is initiated. If the absorption of light does not lead
to the formation of free radical sites through bond rupture, this process can be
promoted by the addition of photosensitizers.
(d) Plasma radiation induced grafting: the plasma polymerization technique
has received increasing interest. Plasma conditions attained through slow discharge
offer about the same possibilities as with ionizing radiation. The main processes in
plasmas are electron-induced excitation, ionization and dissociation. Thus, the
accelerated electrons from the plasma have sufficient energy to induce cleavage of the
chemical bonds in the polymeric structure, to form macroradicals, which subsequently
initiate graft copolymerization.
(e) Enzymatic grafting: the enzymatic grafting method is quite new. The
principle involved is that an enzyme initiates the chemical/electrochemical grafting
reaction.
2.2.2 Block copolymers [12]
Block copolymers are composed of two chemically dissimilar bonded
polymer segments. In most cases the different blocks are immiscible, giving rise to a
rich variety of well-defined, self-assembled structures, both in bulk than in solvent.
Two or more different blocks provide unique properties in the solid and solution state,

23
which opens various interesting applications. The sequential arrangement of the block
copolymer results in linear architectures such as AB diblock, ABA or ABC triblock
copolymers, and AmBn multiblock copolymers and non-linear architectures such as
star-block copolymers, graft copolymers and miktoarm star copolymers (Figure 2.4).
Depending on the number of different blocks, their composition, and the way they are
linked together, they can form a variety of ordered structures with characteristic
lengths in the mesoscale dimension. In the solid state, the morphological micro-phase
separation in these materials may lead to phase structures with different architecture
(spherical, cylindrical and lamellar) [10, 12].
In principle, the block copolymers might be prepared by chain
polymerization, polyaddition and polycondensation methods. Nevertheless, there are
only a few methods which allow the preparation of block copolymers having control
over structure and architecture from the beginning [12].
AB diblock
AnBm
ABA triblock
ABC triblock
Miktoarm star
Hetero arm star
Figure 2.4 Block copolymer architectures [10].
(a) Synthesis of block copolymers by anionic polymerization: The main
feature of anionic polymerization is associated with the absence of any spontaneous
termination or chain transfer reaction, leading to the preparation of well-defined
structures. Several initiators, mono-, di-, or multi-functional, along with different
series of suitable linking agents having various functionalities are available for the
synthesis of complex macromolecular architectures. An important limitation of
anionic polymerization is the demanding experimental conditions required to achieve
a living polymerization system and its applicability to a rather narrow spectrum of
monomers (styrenes, dienes, methacrylates, acrylates, ethylene oxide, vinyl pyridine).

24
(b) Synthesis of block copolymers by cationic polymerization: This
polymerization technique was considered for many years to be the less appropriate
polymerization method for the synthesis of polymers with controlled molecular
weights and narrow polydispersity (PDI). This behavior is attributed to the inherent
instability of the carbocations, which are susceptible to chain transfer, isomerization,
and termination reactions. Three methods were developed for this purpose (Figure
2.5). (1) Bronsted acid initiator and a mild Lewis acid: the Bronsted acid initiator, e.g.
HCl, forms an adduct with a C-Cl bond, which is electrophilically activated by the
weak Lewis acid. (2) Initiator, strong Lewis acid and Lewis base as the additive: the
use of a protonic initiator and a strong Lewis acid, e.g. SnCl4, leads to poor control of
the polymerization, due to the generation of binary counter anions, which are too
weakly nucleophilic to efficiently stabilize the carbocations. (3) Initiator, strong
Lewis acid and onium salt as additive: the previous method cannot be easily applied
in polar media. In this case the living cationic polymerization is promoted by the
addition of salts with nucleophilic anions, such as ammonium and phosphonium
derivatives.
Figure 2.5 Synthesis of block copolymers by cationic polymerization [12].
(c) Synthesis of block copolymers by controlled radical polymerization: free
radical polymerization remains the most versatile method for polymer synthesis due
to its compatibility with a wide range of monomers with functional groups, its
resistance to protic or aqueous media, which allows emulsion and suspension
polymerization processes, and to the experimentally less demanding conditions. There

25
are three methods to synthesize block copolymers by controlled radical
polymerization.
(1) Nitroxide-mediated radical polymerization (NMP): NMP is initiated by a
bimolecular system, consisting of a classical radical initiator, (e.g. benzoyl peroxide)
and an alkoxyamine as the stable free radical (e.g. 2,2,6,6-tetramethyl-1-
piperidinyloxy (TEMPO) radical). By conducting the polymerization in bulk at
elevated temperatures, a benzyloxy radical is formed and subsequently undergoes
reaction with monomer molecules to give a growing polymer chain. Reversible
termination of this growing macromolecular chain with TEMPO leads to controlled
growth and lower polydispersities than those obtained in free radical polymerization.
However, this technique is not efficient during initiation and a variety of unwanted
side reactions occurs leading to poor control over the molecular characteristics.
(2) Atom transfer radical polymerization (ATRP): Novel catalytic systems,
used initially for atom transfer radical additions in organic chemistry, have been
employed in polymer science and referred to as ATRP. Two different systems
developed have been widely used. The first involves the use of ruthenium catalysts
(e.g. RuCl2(PPh3)2) in the presence of CCl4 as the initiator and aluminum alkoxides as
the activators. The second employs the catalytic system CuX/bpy (X=halogen) in the
presence of alkyl halides as the initiators, where bpy is a 4,4'-dialkyl-substituted
bipyridine, which acts as the catalyst’s ligand. The general mechanism is given in
Figure 2.6.
Figure 2.6 The general mechanism for atom transfer radical polymerization [12].
(3) Reversible addition-fragmentation chain transfer radical polymerization
(RAFT): RAFT is another technique of controlled radical polymerization, based on
the principle of degenerative chain transfer. The process involves the radical
polymerization of a monomer in the presence of a chain transfer agent (CTA). The
CTA usually contains a thiocarbonylthio group (S=C(-S-R)(-Z)) with proper

26
substituents -R and -Z that influence the reaction kinetics and the macromolecular
structural control as shown in Figure 2.7.
(d) Synthesis of block copolymers by group transfer polymerization (GTP):
The GTP technique involves a catalyzed silicon-mediated sequential Michael addition
of α,β-unsaturated esters using silyl ketene acetals as initiators. Nucleophilic (anionic)
or Lewis acid catalysts are necessary for the polymerization. Nucleophilic catalysts
activate the initiator and are usually employed for the polymerization of
methacrylates, whereas Lewis acids activate the monomer and are more suitable for
the polymerization of acrylates. The method has been applied mainly for
methacrylates and acrylates but other monomers e.g. methacrylonitrile, acrylonitrile,
dienoates etc. have been used as well. The polymerization is compatible with
functional groups, i.e. dimethylamine-, glycidyl-, vinyl benzyl-, allyl- etc. However,
groups bearing active hydrogens atoms, such as hydroxyl, carboxylic acid, phenol,
primary or secondary amines etc. interfere with the polymerization.
Figure 2.7 The general mechanism for reversible addition-fragmentation chain
transfer radical polymerization [12].
(e) Synthesis of block copolymers by olefin metathesis polymerization: The
continuous developments in the field of metal-mediated olefin metathesis added novel
tools to the arsenal of synthetic polymer chemistry. The research has focused on the
ring opening metathesis polymerization (ROMP) of cyclic strained olefins. When

27
these olefins are employed, ring cleavage leads to the formation of a difunctional
moiety which effectively forms the building block of a polymer chain, as illustrated in
Figure 2.8. Several complexes of molybdenum, tungsten, titanium etc., have been
employed as metathesis catalysts. These living or better controlled polymerization
systems have been successfully applied for the polymerization of norbornene and
their derivatives. An alternative and more recent approach employing olefin
metathesis is the acyclic diene metathesis, ADMET, an analogous polycondensation
reaction of α, ω-dienes utilizing an elimination reaction (Figure 2.9).
Figure 2.8 Schematic diagram of ring cleavage of olefin [12].
Figure 2.9 Schematic diagram of polycondensation of α, ω-dienes utilizing an
elimination reaction [12].
(f) Synthesis of block copolymers by transition metal-catalyzed
polymerization: This method has stimulated tremendous efforts in academic research
resulting in numerous industrial applications. Ziegler-Natta and metallocene catalysts
have been used for the synthesis of tailor made polymers regarding the
microstructure, co-monomer incorporation and composition, end-group functionality
and molecular weight. Coordination polymerization has been expanded to a wide
variety of monomers, such as olefins, styrenes, dienes, (meth)acrylates, lactones,
carbonates etc. Newer advances in the synthesis of novel catalytic systems and the
study of the polymerization mechanism have allowed for the realization of controlled
or even living polymerization leading to the synthesis of more complex structures,
such as block and graft copolymers.
(g) Synthesis of block copolymers by combinations of different
polymerization techniques: Every polymerization method is limited to a certain type

28
and numbers of monomers, thus preventing the possibility to synthesize block
copolymers with a wide combination of monomers. The transformation of the chain
end active center from one type to another is usually achieved through the successful
and efficient end-functionalization reaction of the polymer chain. This end-
functionalized polymer can be considered as a macroinitiator capable of initiating the
polymerization of another monomer by a different synthetic method. Using a
semitelechelic macroinitiator, an AB diblock copolymer is obtained, while with a
telechelic macroinitiator an ABA triblock copolymer is provided. The key step of this
methodology relies on the success of the transformation reaction.
(h) Synthesis of linear multiblock copolymers: Multiblock copolymers are
linear copolymeric structures consisting of repeating units of a certain block
copolymer of the type AmBn. The synthetic strategy used for the preparation of
multiblock copolymers involves the synthesis of the individual A and B chains with
functional groups such as hydroxyls and carboxyls at both ends. The functionalized
chains are subsequently subjected to step growth polymerization for the preparation of
the multiblock copolymer. For the synthesis of the difunctional A and B chains, living
polymerization methods are usually employed, leading to controlled molecular
weights, low polydispersities, and very high degrees of functionalization. However,
the coupling of the AB copolymeric chains suffers the drawbacks of step growth
polymerization, where control over the degree of polymerization is difficult to achieve
and the molecular weight distributions are high. Nevertheless, these materials possess
interesting properties both in solution and in bulk.
(i) Nonlinear block copolymers
1) Star block copolymers are actually star-shaped macromolecules where
each arm is a block copolymer. The number of branches can vary from a few to
several tens. The topological difference of this kind of macromolecules, with respect
to linear block copolymers, is focused on the existence of a central branching point,
which, by itself, brings certain symmetry in the macromolecule and sometimes
defines a certain amount of intramolecular ordering.
2) Graft copolymers are comprised of a main polymer chain, the
backbone, having one or more side polymer chains attached to it through covalent
bonds, the branches.

29
3) Miktoarm star copolymers are a special class of nonlinear block
copolymers where arms of different chemical nature and/or composition are linked to
the same branch point. These block copolymers have been synthesized mainly by
anionic polymerization methods, although some examples of synthesis by other
methodologies have appeared in the literature. The number of different kind of arms
can be varied as well as the total number of arms, giving rise to a variety of miktoarm
stars like generally AnB, AmBn, ABC, or even ABCD. Several approaches have been
reported for the preparation of miktoarm stars, with each one of them having specific
advantages and disadvantages.
2.3 Poly(lactic acid)
2.3.1 General information
Poly(lactic acid) (PLA) is a linear aliphatic thermoplastic polyester,
produced from renewable resources and readily biodegradable. Its low toxicity, along
with its environmentally benign characteristics, has made PLA an ideal material for
food packaging and for other consumer products [13-16]. Some advantages of using
PLA: (1) PLA is derived from renewable and biodegradable resources such as corn
and cassava starch, (2) PLA and its degradation products, namely H2O and CO2, are
neither toxic nor carcinogenic to the human body, hence making it an excellent
material for biomedical applications, (3) PLA can be processed by film casting,
extrusion, blow molding, and fiber spinning due to its greater thermal processability
in comparison to other biomaterials such as poly(ethylene glycol) (PEG),
poly(hydroxyalkanoates) (PHAs), and poly(-caprolactone) (PCL) [17] and (4) PLA
production consumes 25-55% less fossil energy than petroleum-based polymers [14,
18-20]. While PLA can be considered an eco-friendly biomaterial with excellent
properties, it also has obvious drawbacks when confronted with requirements for
certain applications; (1) degradation through hydrolysis of the backbone ester groups
is too slow. Sometimes it takes several years, which can impede its biomedical and
food packaging applications, (2) PLA is very brittle with less than 10% elongation at
break, thus it is not suitable for demanding mechanical performance applications
unless it is suitably modified, (3) PLA is strongly hydrophobic and can elicit an

30
inflammatory response from the tissues of living, and (4) the limited gas barrier
properties prevent its complete access to industrial sectors such as packaging [21].
2.3.2 Biodegradable polymers
The American Society for Testing of Materials (ASTM) and the
International Standards Organization (ISO) defined degradable plastics those which
undergo a significant change in chemical structure under specific environmental
conditions. These changes result in a loss of physical and mechanical properties, as
measured by standard methods. Biodegradable plastics undergo degradation from the
action of naturally occurring microorganisms such as bacteria, fungi, and algae.
Plastics may also be designated as photodegradable, oxidatively degradable,
hydrolytically degradable, or those which may be composted [22-25]. Figure 2.10
shows an attempt to classify the biodegradable polymers into two groups and four
different families. The main group are agro-polymers (polysaccharides and proteins)
and the biopolyesters poly(lactic acid) and poly(hydroxyalkanoate) [18].
During degradation the polymer is first converted to its monomers, and
then these monomers are mineralized. Most polymers are too large to pass through
cellular membranes, so they must first be depolymerized to smaller monomers before
they can be absorbed and biodegraded within microbial cells. The initial breakdown
of a polymer results from a variety of physical and biological forces. Physical forces,
such as heating/cooling, freezing/thawing, or wetting/drying, can cause mechanical
damage such as the cracking of polymeric materials. At least two categories of
enzymes are actively involved in biological degradation of polymers: extracellular
and intracellular depolymerases. Exoenzymes from microorganisms break down
complex polymers smaller enough to pass the semi-permeable outer bacterial
membranes and to be utilized as carbon and energy sources. The process is called
depolymerization. When the end products are CO2, H2O, or CH4, the degradation is
called mineralization (Figure 2.11). It is important to note that bio-deterioration and
degradation of polymer substrate can rarely reach 100% and the reason is that a small
portion of the polymer will be incorporated into microbial biomass, humus and other
natural products. The primary products will be microbial biomass, CO2, CH4 and H2O
under methanogenic (anaerobic) conditions e.g. landfills/compost [26].

31
Figure 2.10 Classification of the biodegradable polymers [18].
Figure 2.11 General mechanism of plastic biodegradation under aerobic conditions [26].
Biodegradable polymers
Biomass products
(from agro-recources)
Agro-polymers
Polysaccharides
Starch, Wheat, Potatoes, Maize,….
Ligno-cellulosic products
Wood, Staws,…
Others: Pectins, Chitosan/Chitin, Gums,…
Proteins, Lipid
Animals:
Casein, whey,
Colagen/Gelatin
Plant:
Zein, Soya, Gluten
From micro-organism
(obtained by extraction)
Poly(hydroxyl-Alkanoates) (PHA)
Poly(hydroxybutyrate (PHB
Poly(hydroxybutyrate-co-
hydroxyvalerate) PHBV ,…
From biotechnology
(conventional synthesis
from bio-derivedmonomers)
polylactides
Poly(lactic acid)
(PLA)
From petrochemical
Products (conventional
synthesis from synthesis from
synthetic monomers)
Polycarprolactones (PCL)
polyesteramides
Aliphatic co-polyesters
Aromatic-copolyesters
Agro-polymers Biopolyesters

32
2.3.3 Synthesis of poly(lactic acid) [18]
Three main routes can be followed to synthesize PLA (Figures 2.12).
(1) Condensation polymerization of lactic acid yields a low molecular weight
macromolecule, unless external coupling agents are employed to increase its chains
length. (2) The azeotropic dehydrative condensation of lactic acid yields high
molecular weight PLA without the use of chain extenders or special adjuvants. (3)
The main process is ring opening polymerization (ROP) of lactide to obtain high
molecular weight PLA [18].
Figure 2.12 Synthesis methods for obtaining PLA [14].
(a) Precursors
(1) Lactic acid: Lactic acid is the simplest hydroxyl acid with an
asymmetric carbon atom and two optically active configurations of the L and D
isomers (Figure 2.13), which can be produced in bacterial systems, whereas
mammalian organisms only produce the L-isomer, which is easily assimilated during
metabolism.

33
L-Lactic acid D-Lactic acid
Figure 2.13 The stereoisomers of lactic acid [20].
(2) Lactide: Figure 2.14 shows the different stereoforms of lactide. The
cyclic dimer of lactic acid combines two of its molecules and gives rise to L-lactide
(LL-lactide), D-lactide (DD-lactide) and meso-lactide (LD-lactide) (a molecule of L-
lactic acid associated with another one of D-lactic acid). A mixture of L- and D-
lactides is a recemiclactide (rac-lactide). Lactide is usually obtained by the
depolymerization of low molecular weight PLA under reduced pressure to give a
mixture of L-, D- and meso-lactides. The different percentages of lactide isomers
formed depend on the lactic acid isomer feedstock, temperature and the catalyst’s
nature and content [27-28].
L-Lactide meso-Lactide D-Lactide
Figure 2.14 Chemical structures of L-, meso- and D-lactides[18].
(b) PLA polymerization
(1) Lactic acid condensation and coupling: The condensation
polymerization is the less expensive route but is difficult to obtain high molecular
weight. The use of coupling of esterification-promoting agents is required to increase
the chain length but at the expense of an increase in both the cost and complexity
(multistep process). The advantages of esterification-promoting agents are highly
purified and free from residual catalysts and/or oligomers final products. However,

34
coupling agents are of higher costs due to the number of steps and the additional
purification of the residual by-products.
(2) Azeotropic dehydration and condensation: The azeotropic
condensation polymerization is used to obtain high chain lengths without the use of
chain extenders or adjuvant and their associated drawbacks. This polymerization
gives considerable catalyst residues because of the high concentration needed to reach
an adequate reaction rate. This can cause many drawbacks during processing, such as
degradation and hydrolysis.
(3) Ring opening polymerization (ROP): ROP is an important and
effective method to manufacture high molecular weight PLA (Mw 100,000). PLA is
obtained by using a catalyst with the monomer under vacuum or in an inert
atmosphere. Control of time and temperatures with the type and concentration of
catalyst are possible to control the ratio and sequence of D- and L-lactic acid units in
the final polymers [13]. The polymerization mechanism involved can be ionic,
coordination-insertion, or free radical, depending on type of catalyst employed.
(c) Copolymers based on lactic acid units
(1) Ring opening copolymerization (ROP): Several heterocyclic monomers
can be used as co-monomers with lactide in ROP, the most commonly used being
glycolide for biomedical applications, caprolactone, valerolactone and poly(ethylene
glycol). The co-monomer units can be inserted randomly or in block sequences.
(2) Modification by high energy radiations and peroxides: Radical
reactions applied to PLA to modify its structure have been generated by peroxides or
high energy radiation. Branching has been suggested to be the dominant structural
change in poly(L-lactide) (PLLA) with 0.1-0.25 wt% peroxide. The peroxide melt-
reaction with PLA has been found to cause strong modifications of the original PLA
properties.
(3) Graft or block copolymerization: Graft or block copolymers are often
used as compatibilizers to improve the interfacial properties of blends or multiphase
systems. Copolymerization can be induced chemically, by plasma discharge, or by
radiation (UV, X-rays or accelerated electrons), the latter approach giving purer
products at high conversions.

35
2.3.4 Degradation of poly(lactic acid) [18]
(a) Abiotic degradation
The main abiotic phenomena involve thermal and hydrolysis
degradation during the life cycle of the material. The PLA decomposition temperature
is located between 230C and 260C. The carbon-oxygen (CO) linkage in the
carbonyl group is the most likely to split under isothermal heating. Hydrolysis of PLA
leads to chain fragmentation and can be associated with thermal or biotic degradation,
depending on structure, molecular weight and distribution, crystallinity, the shape of
samples, and thermal and mechanical history (including processing).
(b) Biotic degradation
The in vivo and in vitro degradations have been evaluated for PLA-
based surgical implants. In vitro studies have shown that the pH of the solution plays
a key role in the degradation and this analysis can be a useful predicting tool for in
vivo PLA degradation. Primarily, after exposure to moisture, PLA degrades by
hydrolysis by abiotic mechanisms. First, random non-enzymatic chain-scissions of the
ester groups lead to a reduction in molecular weight with the consequent
embrittlement of the polymer. This step can be accelerated by acids or bases and is
affected by both temperature and moisture levels. Then, the ensuing PLA oligomers
can diffuse out of the bulk polymer and be attacked by microorganisms. The biotic
degradation of these residues produces carbon dioxide, water and humus.
2.3.5 Properties of poly(lactic acid) [17]
(a) Physical and chemical properties: High molecular weight PLA is a
colorless, glossy, rigid thermoplastic material with properties similar to polystyrene.
Homo-PLA is a linear macromolecule with a molecular architecture that is
determined by its stereochemical composition and can be totally amorphous or up to
40% crystalline. The two isomers of LA can produce four distinct materials. (1)
Poly(D-lactic acid) (PDLA), which is a crystalline material with a regular chain
structure, (2) poly(L-lactic acid) (PLLA), which is semi-crystalline, and likewise with
a regular chain structure, (3) poly(D,L-lactic acid) (PDLLA) which is amorphous, and

36
(4) meso-PLA, obtained by the polymerization of meso-lactide. Some of the physical
and chemical properties of PLA are summarized in Table 2.1. The tensile properties
of PLA can vary widely depending on whether it is annealed or oriented, or on its
degree of crystallinity [29]. The comparison of physical properties between PLA and
commodity polymers is shown in Table 2.2.
(b) Surface energy: Surface energy is critically important for many processes
such as, printing, multilayering, etc. and it influences the interfacial tension.
(c) Solubility: A good solvent for PLA and most of the corresponding
copolymers is chloroform. Other solvents are chlorinated or fluorinated organic
compounds, dioxane, dioxolane and furan. Poly(rac-lactide) and poly(meso-lactide)
are soluble in many other organic solvents like acetone, pyridine, ethyl lactate,
tetrahydrofuran, xylene, ethyl acetate, dimethylformamide, methyl ethyl ketone.
Among non-solvents, are water, alcohols and alkanes.
(d) Barrier properties: The CO2 permeability coefficients for PLA polymers
are lower than for crystalline polystyrene at 25C and 0% relative humidity and higher
than for PET. Since diffusion takes place through the amorphous regions of a
polymer, an increase in the extent of crystallization will inevitably result in a decrease
in permeability.
Table 2.1 Selected physical and chemical properties of PLA [20]
Properties PDLA PLLA PDLLA
Crystalline structure Crystalline Semi-crystalline Amorphous
Melting temperature (C) ~180 ~180 -
Glass transition temperature (C) 50-60 55-60 Variable
Decomposition temperature (C) ~200 ~200 185-200
Elongation at break (%) 20-30 20-30 Variable
Breaking strength (g/d) 4.0-5.0 5.0-6.0 Variable
Half-life in 37C normal saline 4-6 months 4-6 months 2-3 months

37
Table 2.2 Comparison of physical properties between PLA and commodity polymers
[16]
Properties PLA PS i-PP PET
Relative density 1.24 1.04-1.06 0.91 1.37
Clarity Transparent Transparent Translucent Transparent
MECHANICAL PROPERTIES
Tensile yield strength (MPa) 48-110 34-46 21-37 47
Tensile modulus (GPa) 3.5-3.8 2.9-3.5 1.1-1.5 3.1
Tensile elongation (%) 2.5-100 3-4 20-800 50-300
Notched Izod impact, 23C (J/m) 13 - 72 79
THERMAL PROPERTIES
Glass transition temperature (C) 60 95 0 75
Melting temperature (C) 153 - 163 250
Vicat temperature (C) 55-60 84-106 80-140 74-200
Processing temperature (C) 210 230 225 255
(e) Mechanical properties
(1) Solid state: The mechanical properties of PLA can vary to a large
extent, ranging from soft and elastic materials to stiff and high strength materials,
depending on crystallinity, polymer structure and molecular weight, material
formulation (plasticizers, blend, and composites) and processing (orientation) (Table
2.1 and Table 2.2). These mechanical properties can be readily tuned to satisfy
different applications.
(2) Molten behavior: PLA melt rheology is of particular interest for
processing and corresponding applications. The pseudo-plastic index is in the range
0.2-0.3, depending on the PLA structure. Figure 2.15 shows the evolution of the zero-
shear viscosity versus molecular weight for a wide range of L/D ratios (%), the latter
parameter having virtually no effect. Static and dynamic characterizations had shown
that the molecular weight between entanglements was around 104. Chain branching
and molecular weight distribution have a significant effect on the melt viscosity of
PLA.

38
Figure 2.15 Zero-shear viscosities versus molecular weights for PLAs of varying
optical composition and resulting scaling law [30].
2.3.6 Poly(lactic acid) blended with elastomer/rubber
Toughness is a measure of resistance to fracture. It is an important
requirement in most loads bearing application of materials. There are many
techniques to enhance toughness of brittle polymers. Blending of the brittle matrix
and elastomer/rubber is the most commonly used, expecting a combination of the
stiffness and processability of the brittle polymer matrix with the fracture resistance of
elastomer/rubber. The approach in which polymers are toughened depends on both
intrinsic and extrinsic factors. However, the elastomer/rubber phase intended for
rubber toughening must be dispersed as small particles in the plastic matrix. An
optimal particle size and size distribution of the dispersed particles is required; too
small or too large rubber particles cannot promote toughening [4]. PLA was blended
with various polymers to enhance the flexibility. PLA blends were found to be either
miscible or immiscible. Miscibility of polymer blend influences properties of the
blends such as thermal properties, mechanical and physical properties. Most of the
polymer blends are incompatible due to a variety of reasons such as the absence of
any specific interaction between the blend constituents; dissimilarity in their

39
structures; broad differences in their viscosities; surface energy or activation energy
of flow, and polarity.
In recent years, NR has been considered an interesting candidate to use
as a toughening agent or an impact modifier for PLA because it has excellent
properties, such as high strength, high resilience and high elongation at break. NR has
been used therefore to improve the mechanical properties of PLA. PLA/NR blends are
different in polarity and molecular weight and showed poor compatibility, which led
to poor impact strength of the blends. The compatibility of PLA/NR can be improved
by adding a third component. The third component or compatibilizer can be a
homopolymer, block or graft copolymers, which may interact or be compatible with
both phases. PLA/NR blends with and without compatibilizers have been studied [31-
42].
Bitinis et al. [41] prepared PLA/NR blends by melt blending with an
internal mixer and twin screw extruder. The processing window, temperature, time,
and rotor rate, and the rubber content have been optimized in order to obtain a blend
with useful properties. The rubber phase was uniformly dispersed in the continuous
PLA matrix with a droplet size range from 1.1-2.0 m. The ductility of PLA has been
significantly improved by blending with NR. The elongation at break improved from
5% for neat PLA to 200% by adding 10 wt% NR. In addition, the incorporation of NR
not only increased the crystallization rate but also enhanced the crystallization ability
of PLA. These materials are, therefore, very promising for industrial applications.
Suksut and Deeprasertkul [34] added nucleating agents (cyclodextrin
(CD), calcium carbonate (CaCO3) and talc in the neat PLA and PLA/NR blend in
order to improve the crystallization of the blend. It was found that the addition of talc
and CD decreased cold crystallization temperature (Tcc) of the PLA, the same as the
PLA/NR blend containing talc. All nucleating agents increased the degree of
crystallinity (DC) of PLA. Only talc and CaCO3 increased the DC of PLA in PLA/NR
blends. The enhanced toughness of PLA by the addition of nucleating agent was
attributed to its increased crystallinity, as well as decreased spherulite size. The
increase in toughness of PLA/NR blends was mainly given by the presence of the
rubber.

40
Zhang et al. [37] prepared copolymers between NR and poly(butyl
acrylate) (NR-g-PBA) by emulsion polymerization in an attempt to toughen PLA.
NR-g-PBA/PLA and NR/PLA blends were prepared with an internal mixer. The
morphology and mechanical properties of the blends were investigated as a function
of rubber content. SEM showed that the spherical-particle-dispersed phase appearing
in the NR/PLA blend was not found in the NR-g-PBA/PLA blend, which showed that
NR-g-PBA was compatible with PLA. The elongation at break and the impact
strength were significantly improved with an increase in NR-g-PBA content. The
thermal stability of PLA decreased when blended with NR but was retained with NR-
g-PBA.
Huang et al. [39] enhanced the compatibility of PLA/NR blends by
adding dicumyl peroxide (DCP) as a cross-linker for improving the mechanical
properties of the blends, which were melt-blended in an internal mixer. The effects of
DCP on morphology, thermal, mechanical, and rheological properties of PLA and
PLA/NR blends were studied. The results indicated that DCP could increase the
compatibility of PLA and NR. With small amount of DCP, the effect on NR
toughening PLA was enhanced and the tensile toughness of PLA/NR blends was
improved. When the DCP content was up to 0.2 wt%, elongation at break of PLA/NR
blends was reached 2.5 times compared to neat PLA. Adding 2 wt% DCP into the
blend, the maximum Charpy impact strength that could be achieved was 1.8 times that
of neat PLA. Moreover, the viscosity of PLA/NR blend decreased significantly and
the lowest viscosity of the blends could be achieved when 0.5 wt% of DCP was
added.
Jaratrotkamjorn et al. [40] prepared PLA/NR blends by adding 10 wt%
of rubber and melt blended in a twin screw extruder. Three types of rubbers were
used: NR, epoxidized natural rubber (ENR25 and ENR50), and natural rubber grafted
with poly(methyl methacrylate (NR-g-PMMA). Effect of viscosity and molecular
weight of NR, and rubber mastication with a two-roll mill was investigated. It was
found that all blends showed higher impact strength than PLA and NR was the best
toughening agent. Viscosity and molecular weight of NR decreased with increasing
number of mastication. The impact strength of PLA/NR blends increased after
applying NR mastication because an appropriate particle size was obtained.

41
Juntuek et al. [32] melt blended NR and PLA at various ratios using an
internal mixer. The impact strength and elongation at break of PLA/NR blend
dramatically increased with increasing NR content up to 10 wt%. NR grafted with
glycidyl methacrylate (NR-g-GMA) was used as a compatibilizer for PLA/NR blend.
The addition of NR-g-GMA in PLA/NR blend significantly improved impact strength
and elongation at break of the blend when compared with that of the neat PLA and
PLA/NR blend without NR-g-GMA. The impact strength and elongation at break of
PLA/NR blend increased with increasing NR-g-GMA content up to 1 wt%. Moreover,
with increasing the grafting percentage of NR-g-GMA in the blend from 0.76 up to
4.35, the impact strength and elongation at break of the blend increased too.
Morphological and thermal property of PLA, PLA/NR, and PLA/NR/NR-g-GMA
were elucidated as well.
2.3.7 Poly(lactic acid) based block copolymers
The inherent brittleness characteristics of PLA and its low Tg around
60C have been the major limitations for its use in a variety of applications. Several
modifications, such as copolymerization, plasticization and blending with various
biodegradable and non-biodegradable polymers have been suggested to improve the
mechanical properties of the virgin PLA. PLA has been copolymerized with
poly(ethylene glycol) (PEG) to give diblock copolymer [43-49], triblock copolymer
[48-54], multiblock copolymer [55-59] and star block copolymer [60-61].
Poly(ethylene oxide (PEO) was copolymerized with PLA as a diblock copolymer [62-
64], triblock copolymer [64-67] and multiblock copolymer [68]. Copolymers from
PLA and with poly(-caprolactone) (PCL) has been published, i.e., a diblock
copolymer [69-74] and triblock copolymer [70, 75-76]. A block copolymer
synthesized from PLA and poly(2-ethyl-2-oxazoline) has been studied [77-78]. The
multiblock copolymer of PEG-PLA-PCL has been extensively studied as well [56, 72,
79-81].
Rashkov et al. [65] synthesized PLA/PEO/PLA triblock copolymers
bearing short PLLA blocks by ring opening polymerization (ROP) of L-lactide. GPC
and 1H- and 13C-NMR showed the resulting triblock copolymers did not contain any
detectable PLA homopolymer as side product. FTIR and X-ray diffraction (XRD)

42
suggested that PEO and PLA blocks were phase separated even for copolymers with
very short PLA blocks. Optical microscope and DSC showed that an increase in the
length of PLA blocks led to a decrease in the crystallinity of PEO blocks up to
disappearance. Data suggested that intrachain and PEO/PLA connecting ester bonds
were cleaved at comparable rates in the selected homogeneous medium.
Wang and Hsiue [77] synthesized poly(L-lactide)-poly(2-ethyl-2-
oxazoline)-poly(L-lactide) (PLLA-PEOz-PLLA) triblock copolymers (Figure 2.16) by
ROP. The PLLA-PEOz-PLLA aqueous solution was transparent at room temperature.
Heating the solution resulted in precipitation, which was caused by the combination
of dehydration of water around PEOz and the aggregation of PLLA segments.
Acid/base titration profiles indicated that PLLA-PEOz-PLLA were protonated at
neutral and acidic conditions. The specific PLLA-PEOz-PLLA triblock copolymers
with thermal- and pH-sensitive properties can be tailored by varying the compositions
and can be applied as controlled release carrier for biomedical applications.
Figure 2.16 Reaction scheme for the synthesis of PLLA-PEOz-PLLA triblock
copolymers [77].
Huang et al. [79] prepared PEG/PCL/PLA triblock copolymers by
ROP of sequentially added -caprolactone and DL-lactide in the presence of PEG
(Figure 2.17), using zinc metal as catalyst. Polymerization was performed in bulk and
yielded block copolymers with predetermined PEG/PCL/PLA segments. Block
polymers were characterized by 1H-NMR, GPC, FTIR, DSC, TGA, and XRD. Data
showed that the copolymers preserved the excellent thermal behavior inherent to PCL.
The crystallinity of PLA-containing copolymers was reduced with respect to PCL-
homopolymer. The presence of both hydrophilic PEG and fast degrading PLA blocks
should improve the biocompatibility and biodegradability of the materials, which are
of interest in drug delivery or as scaffolding in tissue engineering.

43
Figure 2.17 Block copolymerization of -caprolactone and DL-lactide initiated by
dihydroxyl PEG [79].
It is known that an incompatible polymer blend leads to poor
mechanical properties. The strategy to increase the mechanical properties of this blend
is the addition of the compatibilizer. It has been reported that the PLA blended with
other polymers in the presence of a compatibilizer resulted in enhanced mechanical
properties of the blended PLA, PCL with triphenyl phosphate [82], PE with
polyethylene graft maleic anhydride (PE-g-MA) [83], poly(butylenes succinate)
(PBS) with lysine isocyanate (LTI and LDI) [84], poly(butylenes succinate-co-lactate
(PBSL) with LTI [85], starch and poly(butylenes-co-terephthalate) (PBAT) with
maleic anhydride (MA) [86], poly(ethylene-glycidylmethyacrylate) (EGMA) [87],
PBAT with 2,5-dimethyl-2,5-di(tert-butylperoxy) hexane [88].
He et al. [70] improved the compatibility by a new reactive blending
approach of PLLA and PCL blends. The PCL-b-PLLA block copolymers (Figure
2.18) were in situ formed during polymerization by ROP in the presence of PCL-OH
(OH groups on one end) and PLLA/PCL-b-PLLA blends were obtained. PLLA/PCL-
b-PLLA samples were submitted to GPC and 1H-NMR. 13C-NMR spectroscopy
showed that no transesterification reaction occurred to a significant extent during L-
LA polymerization process. The in situ formed PCL-b-PLLA compatibilizes the
phase separated structure of PCL domains in PLLA matrix. The size of PCL domains
in PLLA matrix became much smaller than that in a solution blended sample. The
average sizes of PCL domains are controllable in the level of submicron scale.

44
Figure 2.18 Preparation route of PLLA/P(CL-b-LLA) blends by ring opening
polymerization of LLA [70].
Harada et al. [84] prepared the blends between PLA and PBS in the
presence of lysine diisocyanate (LDI) and lysine triisocyanate (LTI) by using a twin
screw extruder and injection molding machine. It was found that LDI was not
effective for the blends. The impact strength of PLA/PBS (90/10 wt%) blend was
about 18 kJ/m2 in the absence of LTI, and it increased to 50-70 kJ/m2 in the presence
of LTI at 0.5 wt%. The melt-mass flow rate (MFR) value of PLA/PBS (90/10 wt%)
decreased from 25 g/10 min at 200C in the absence of LTI to approximately 3 g/10
min in the presence of LTI. These results indicate that the LTI is a useful reactive
processing agent to increase the compatibility of PLA/PBS blend by increasing the
impact strength of PLA (Figure 2.19).
Figure 2.19 Reaction of PLA, PBS, and compatibilizers [84].
Ren et al. [86] prepared binary and ternary blends from thermoplastic
starch (TPS), PLA and PBAT using a one-step extrusion process. The concentration
of TPS in the blends was fixed at 50 wt%, with the rest being PLA and PBAT. A
compatibilizer containing anhydride functional groups (Figure 2.20) was used to
increase the interfacial affinity between TPS and the synthetic polyesters. The

45
addition of a small amount of compatibilizer greatly increased the mechanical
properties of the blends. The elongation at break of the blends exhibited a dramatic
improvement in with increasing PBAT content. SEM analysis of the blends showed
that most of the TPS particles were well dispersed in the polyester matrix for the
compatibilized blends.
Figure 2.20 Formation of TPS and compatibilizer and the reaction between them
[86].
Kim et al. [49] synthesized PLLA-PEG di- and triblock copolymers of
lactide by ROP and using methoxy PEG (MPEG) and PEG as an initiator (Figure
2.21). The block copolymers were then blended with PLLA at various mass ratios. It
was found that sol-gel phase transition of block copolymers depended on type and
concentrations of the copolymers. PLLA/MPEG-PLLA and PLLA/PLLA-PEG-PLLA
films showed higher degree of swelling than hydrophobic control PLLA. Mechanical
properties of the blended PLLA films were slightly reduced in comparison to those of
the control PLLA. PLLA films blended with hydrophilic PEG-based block copolymer
as additives demonstrated improved swelling property as well as mechanical
properties.
Figure 2.21 Synthesis of (a) AB and (b) ABA block copolymers [49].

46
2.4 NATURAL RUBBER
2.4.1 General information
Natural rubber (NR), which is obtained from the latex of the Hevea
Brasiliensis tree, is an entirely cis-1,4-polyisoprene. Figure 2.22 shows the structure
of cis-1,4-polyisprene, consisting in C5H8 repeating isoprene units. It adopts an
irregular conformation in the solid state, is unable to crystallize under normal
conditions, and therefore exists as an amorphous, rubbery material. Owing to its plant
origin, natural rubber latex (NRL) contains not only cis-l,4-polyisoprene but also non
rubber components which vary from source to source.
Figure 2.22 Structure of cis-1,4-polyisoprene.
Typical composition of NRL and solid NR are shown in Table 2.3 and
Table 2.4, respectively. Because of the plant origin, even though the structure of NR
is similar concerning the cis-1,4-polyisoprene chains, the presence of various non-
rubber components in NR such as amino acids, proteins, carbohydrates, neutral and
polar lipids, and organic substances may modify its chemical reactivity and physical
and mechanical properties [89].
Table 2.3 A typical composition of fresh natural rubber latex [89]
Compositions Contents (%)
Total solid content (TSC) 36
Dry rubber content (DSC) 33
Protein 1-1.5
Resins 1-1.5
Ashes <1
Sugars 1
Water 60

47
Table 2.4 Composition of solid natural rubber [89]
Compositions Contents (%)
Cis-1,4-polyisoprene 90
Acetone soluble 2.5-4.5
Nitrogen 0.3-0.5
Ash 0.2-0.6
2.4.2 Telechelic natural rubber [89]
Telechelic natural rubber (TNR) can be defined as a low
molecular weight NR having Mn of 102-104 g/mol, approximately, and it contains
reactive terminal groups that can be used in further chain extension and crosslinking.
Structure of TNR still possesses the basic structure of NR consisting of isoprene units
shown in Figure 2.23. The value of the repeating units may vary from 1-300.
Examples of TNR are hydroxyl terminated natural rubber (HTNR) and carbonyl
terminated natural rubber (CTNR) (Figure 2.23).
Other reactive groups are bromine, chloride and vinyl (Figure 2.24).
The nature of reactive terminal groups on TNR depends on the preparative
procedures. The number average functionality (fn) of TNR is reported to be in the
range 1.4-1.97. Intrinsic viscosity of TNRs in toluene prepared by the redox couple
method (Mn in the ranges of 9,000-35,000 g/mol) was from 22-57 ml/g. The
viscosities of TNRs having Mn between 250 and 3,000 g/mol, obtained by the
oxidation method, were reported to range from 250-400 poise. High molecular weight
TNR shows pseudo-plastic behavior at low temperatures (20-80°C) whereas low
molecular weight TNR exhibits perfect Newtonian behavior [89].
X and Y = terminal groups R= Ph, Me, h
(a) isoprene unit (b) HTNR (c) CTNR
Figure 2.23 The structure of modified natural rubber of (a) isoprene unit, (b) HTNR
and (c) CTNR [89].

48
(a) vinyl-unit (b) trans-unit (c) cis-unit
Figure 2.24 Reactive terminal groups of the TNR; (a) vinyl-, (b) trans- and (c) cis-
unit [89].
Basically, the methods that involve controlled degradation or
depolymerization of the NR backbone via chain cleavages of NR and synthetic rubber
are photochemical [90-97], oxidative chemical [98-109], methathesis, [110], anionic
[111] and ring opening methathesis polymerization (ROMP) [112]. The obtained
TNRs were used as precursors of other polymers. Many researches have been carried
out in telechelic natural rubber and synthetic rubber for using them as starting
materials:
Paul et al. [92] synthesized HTNR by photochemical degradation to
use the obtained segment to prepare polyurethane (PU) based on Bisphenol A and
toluene diisocyanate, by one-shot and two-shot processes in solution. The soft
segment Tg and hard segment were well-defined around 264°C and 75-105°C,
respectively. Two relaxation temperatures were observed with dynamic mechanical
analysis (DMA). SEM and OM showed well-defined domains dispersed in a matrix,
indicating the two-phase morphology. The samples behaved like soft elastomers at
lower hard segment content, toughened plastics at high hard segment content, and
rigid elastomers at intermediate compositions.
Gillier-Ritoit et al. [100] prepared telechelic cis-1,4-oligoisoprenes by
the selective cleavage of weak epoxidized units (E) in epoxidized cis-1,4-
polyisoprenes (EPIs) and by the random cleavage of isoprenic units (I) in cis-1,4-
polyisoprene (PI). In both cases, cleavage by periodic acid (H5IO6) in tetrahydrofuran
(THF) led to aldehydic and ketonic chain ends. Through variations in the E/(I+E)
molar percentage (E%) in the cleavage of EPI and through variations in the H5IO6/I
molar percentage (PA%) in the cleavage of PI, a polydispersity index near 2 and a
number-average molecular weight of 2-20 103 were obtained.

49
Kébir et al. [101] synthesized telechelic cis-1,4-polyisoprene
oligomers bearing an hydroxyl group by modifying ENR and then transforming into
carbonyl telechelic polyisoprene (CTPI) by using H5IO6 (Figure 2.25). The hydroxyl-
oligoisoprenes possessed controlled molecular weights and were used as soft
segments in the elaboration of PU elastomers. The influence of the structural changes
of these precursors on the PUs properties has been studied.
Figure 2.25 A cleavage of polyisoprene to liquid carbonyl telechelic polyisoprenes
[101].
Radhakrishnan Nair and Gopinathan Nair [97] prepared HTNR by
photochemical degradation. Soluble block copolymers from toluene diisocyanate
(TDI), with chain extender diols, propylene glycol (PG), 1,4-butane diol (1,4-BDO)
and 1,3-butane diol (1,3-BDO), were synthesized by solution polymerization. The
dilute solution properties of these block copolymers dissolved in THF were studied by
viscometry and GPC. IR and NMR analyses confirmed the chemical structure of
block copolymerization. DSC analysis showed a Tg soft segment around -58C and
that Tg of the segment between 70 and 75C for these samples. Two-stage thermal
decomposition and SEM indicated the amorphous heterophase morphology of the
samples.
Saetung et al. [103] prepared telechelic oligoisoprenes by the selective
controlled degradation of NR via epoxidation and cleavage reactions. The molar mass
of the oligoisoprene product obtained depended on the degree of epoxidation of the
starting materials. The preliminary study of preparation of HTNR-based polyurethane
foams was performed. The thermal properties were investigated and the results
indicated that the HTNR-based PU foams have good low temperature flexibility.
Thomas and Grubbs [112] synthesized telechelic polyisoprene via the
ring opening metathesis polymerization (ROMP) of 1,5-dimethyl-1,5-cyclooctadiene
(DMCOD) in the presence of cis-1,4-diacetoxy-2-butene as a chain transfer agent
(CTA). This method generated a telechelic polymer in excellent yield, and the acetoxy

50
groups were successfully removed to yield R,ω-hydroxy end-functionalized
polyisoprene with potential for subsequent reactions. Efficient, quantitative
incorporation of CTA was achieved, and NMR spectroscopy was utilized to confirm
the chemical identity of the polymer end groups.
Panwiriyarat et al. [106] synthesized a new type of biodegradable PU
by using HTNR and PCL as a soft segment and toluene-2,4 diisocyanate (TDI) as a
hard segment with solution polymerization. HTNR has been synthesized by
epoxidation reaction and chain cleavage of NR with the Mn in the range of 1700-8000
g/mol. The Mn of the derived PUs was 3000-5500 g/mol determined by using GPC. 1H-NMR and FTIR were used to determine the chain end functional groups in
oligomers and PU. Panwiriyarat et al. [107] synthesized PU by using HTNR and PCL
as a soft segment. The hard segment included isophorone diisocyanate and 1,4-butane
diol (BDO) that was added as a chain extender. The addition of BDO in the PCL diol-
based PU increased Young’s modulus and tear strength but decreased the elongation
at break resulting in a decrease in the tensile strength. By addition of a small amount
of HTNR, the tensile properties and tear strength of PU increased significantly. The
tensile behavior of PU was changed from a tough to a soft polymer with increasing
HTNR content. Panwiriyarat et al. [108] prepared HTNR by an oxidative chain
cleavage reaction of NR for synthesizing bio-based PU with poly(-caprolactone) diol
(PCL). Three kinds of diisocyanate and molecular weight of diols were investigated
on mechanical properties. An aliphatic diisocyanate (hexamethylene diisocyanate,
HDI), an aromatic diisocyanate (toluene-2,4-diisocyanate, TDI) and a cycloalkane
diisocyanate (isophorone diisocyanate, IPDI) were employed. PU containing TDI and
IPDI showed a rubber-like behavior: low Young’s modulus and high elongation at
break. The crystalline domains in PU containing HDI acted as physical crosslinks,
enhancing the Young’s modulus and reducing the elongation at break, and they were
responsible of the plastic yielding. Panwiriyarat et al. [109] used HTNR and PCL as
the soft segment to synthesize the novel PU by a one-shot polymerization. The
derived polyurethanes demonstrated excellent mechanical properties, which depended
on their chemical composition. Their tensile behavior seemed to have typical
elastomeric characteristics. PUs became amorphous and showed a phase separation
between the PCL diol and HTNR segments. The phase separation between the soft

51
and the hard segments was observed by the DMTA technique whereas DSC results
showed only Tg of the soft segment.
2.4.3 Natural rubber based graft copolymers
The graft copolymerization would effectively combine the desirable
properties of NR with vinyl monomer in order to produce tough, hard, and impact
resistant materials with easy processability. Graft copolymerization with polar
monomers such as acrylonitrile has been considered as a possible route to the
production of oil resistant NR. Another important motivation has been the production
of self-reinforced and thermoplastic NR. The desired modifications are achieved by
phase-separation of the block of glassy polymer, which has become covalently
bonded to the rubber molecules by graft copolymerization. The polyisoprene chain of
NR is an example of a polymer which contains allylic (-methylenic) hydrogen atoms
susceptible to abstraction by interaction with free radicals, thereby generating reactive
sites from which copolymer grafts can propagate to obtain NR based grafted
copolymers [113]. Some thermoplastics were grafted on NR backbone including
poly(vinyl acetate) (PIP-g-PVAc) [114], polystyrene (NR-g-PS) [115-116],
poly(methyl methacylate) (NR-g-PMMA) [40, 117-120] and NR grafted with maleic
anhydride (NR-g-MA) [121-123]. NR was block copolymerized with PS to obtain
NR-b-PS [124].
Jin et al. [114] blended PLA with poly(cis-1,4-isoprene) (PIP). The
PLLA/PIP blend was incompatible as indicated by two Tgs. PIP was grafted with
vinyl acetate monomer to form PIP-g-PVAc, which was then blended with PLLA.
The PLLA/PIP-g-PVAc blends had two Tgs. The lower Tg, which was due to PIP
phase, did not vary with the blend composition, while the higher Tg, which was due to
PLLA rich phase, decreased with an increase in the graft copolymer content. The
tensile properties of the PLLA/PIP-g-PVAc blend were much superior to those of the
PLLA/PIP blend.
Asaletha et al. [115] improved the compatibility of natural rubber and
polystyrene (NR/PS) blend by adding graft copolymer of NR and PS (NR-g-PS) as a
compatibilizer. The effects of homopolymer molecular weight, copolymer molecular
weight, copolymer concentration, processing conditions and mode of addition on the

52
morphology of the dispersed phase have been investigated by means of OM. The
addition of a small percentage of the NR-g-PS decreased the domain size of the
dispersed phase. The experimental results were compared with the theoretical
predictions of Noolandi and Hong. The addition of the graft copolymer improved the
mechanical properties of the blend and attempts were made to correlate the
mechanical properties with the morphology of the system.
Chuayjuljit et al. [116] prepared NR/PS films by using NR-g-PS as the
compatibilizer. NR-g-PS was synthesized via emulsion copolymerization using tert-
butyl hydroperoxide and tetraethylenepentamine as an initiator. The copolymers were
subsequently added into the blends at 0-30 phr. The mixtures were cast into films by
the solution-casting method with toluene. The film prepared from 80/20 NR/NR-g-PS
showed higher tensile and tear strength, as well as finer domain size of the dispersed
phase, than those prepared from 90/10 and 70/30 NR-g-PS. However, the mechanical
properties of the films were decreased at high loading of the copolymers. In addition,
TGA revealed that weight loss was decreased upon introduction of the compatibilizer.
Oommen et al. [117] prepared poly(methyl methacrylate)/natural
rubber (PMMA/NR) blend by adding NR grafted with PMMA (NR-g-PMMA). A
sharp decrease in the dispersed domain size was observed by adding a few percent of
NR-g-PMMA followed by leveling off at higher concentrations. The NR-g-PMMA
increased the interfacial adhesion by the formation of micro-bridges with the matrix.
The effects of homopolymer molecular weights, processing conditions, and mode of
addition on the morphology of the dispersed phase had been investigated. The
changes in mechanical properties of the blends as a result of the addition of the
compatibilizer were related to the morphology of the blends.
Carone et al. [121] blended polyamide 6 (PA6) and NR. The objective
was to investigate in situ the formation of a graft copolymer between NR and PA6
during melt blending. Addition of maleic anhydride (MA) to the rubber (NR-g-MA)
was done prior to blending with PA6. During processing MA can react with both NR
and PA6 leading to the graft copolymer formation (Figure 2.26). Molau test was used
to confirm this graft copolymer formation. Rheology and thermal properties as well as
DMTA also confirmed the polymer structure. Blend morphology analysis showed a
significant reduction in particle size as the MA was added to the rubber.

53
Figure 2.26 Possible reactions among MA, polyamide 6 and NR that can take place
during processing [121].
Chattopadhyay and Sivaram [124] improved the compatibility of
PS/NR blend with diblock copolymer of PS and poly(cis-isoprene) (PS-b-PI). The
compatibilizing effect has been investigated as a function of block copolymer
molecular weight, composition and concentration. The effect of homopolymer
molecular weight, processing conditions and mode of addition on the morphology of
the dispersed phase had also been investigated by means of OM and SEM. A sharp
decreased in phase dimensions was observed with the addition of a few percent of
block copolymers. The effect leveled off at higher concentrations. The leveling off
could be an indication of interfacial saturation. The addition of the block copolymer
improved the mechanical properties of the blend. An attempt was made to correlate
the mechanical properties with the morphology of the blends.
Jaratrotkamjorn [119] enhanced the impact strength of PLA by adding
NR, ENR25, ENR50 and NR-g-PMMA. NR-g-PMMA was synthesized by using
emulsion polymerization technique and was investigated the grafting percentage by 1H-NMR technique.The molar ratio of NR/PMMA was 95/5 and 60/40 called as G5
and G35, respectively. NR provided higher impact strength than ENR and NR-g-
PVAc and the suitable content of NR in PLA blend was 10 wt%. Young’s modulus,
stress at yield and stress at break were decreased when increasing NR content whereas
the elongation at break was significantly increased. It was found that G35 improved
the compatibility to PLA/NR blends more than G5.
BoonKeaw [120] used NR-g-PMMA and NR-g-PVAc as a
compatibilizer of thermoplastic elastomer of PLA and NR. The higher amount of
PMMA in NR-g-PMMA led to the higher modulus and tear resistance while the stress
at break, tension set and percent of change in tensile properties after thermal and

54
ozone aging decreased. Moreover, the amount of NR-g-PMMA showed the same
trend with the effect of an increment of PMMA in NR-g-PMMA. The added NR-g-
PMMA had no significant effect on the thermal properties of TPE and no reaction
between PMMA and PLA was observed. The addition of NR-g-PVAc led to a
decrease in the modulus, stress at break, tear resistance, hardness and tension set.
2.5 Poly(vinyl acetate)
2.5.1 General information [124-126]
Poly(vinyl acetate) (PVAc) is a rubbery synthetic polymer with the
formula (C4H6O2)n (Figure 2.27). PVAc is thermoplastic and it softens at low
temperature. PVAc is also colorless, glassy, highly transparent and resistant to the
degradative effects of heat and light. It is widely used as an adhesive; it sticks to
almost anything, from glass to paper. PVAc is an essential chemical material for a
range of industrial and consumer products such as paints, concrete additives, textiles,
and plastics. Furthermore, partial or total hydrolysis of PVAc is used to prepare
poly(vinyl alcohol) (PVOH).
Figure 2.27 Structure of poly(vinyl acetate).
2.5.2 Synthesis of poly(vinyl acetate)
The structure of PVAc produced by free radical methods is complex.
First, both head-to-head and head-to-tail addition can take place (Figure 2.28),
resulting in the incorporation of the two types of repeating units shown in the
backbone of the polymer. The proportion of head-to-tail and head-to-head repeating
groups in the polymers is dependent on the temperature at which the polymerization is
carried out. Higher head-to-head enchainment is obtained as the temperature is
increased [128]. Hydrogen abstraction at the tertiary positions along the chain as well

55
as at the pendant acetoxy groups appears to take place and lead to extensive branching
at these sites, as shown in Figure 2.29.
Figure 2.28 Structure of poly(vinyl acetate) both head-to-head and head-to-tail [128].
Figure 2.29 Hydrogen abstraction in poly(vinyl acetate) [128].
There are several methods for the synthesis of PVAc [126]:
(a) Emulsion polymerization: The chief large scale commercial method for the
polymerization of VAc. In VAc emulsion polymerization, the polymers are not
isolated but rather the polymerization reaction mixtures are used directly in the
various applications. Besides VAc monomer, three other components are necessary to
carry out an emulsion polymerization: water, an emulsifier, and a water soluble
initiator. Additional additives are also often included for various purposes.
(b) Suspension polymerization: An initiator for this polymerization is soluble
in VAc monomer and insoluble in water. A suspending agent, such as poly(vinyl
alcohol) (PVOH), gelatin, and various water-soluble cellulose derivatives, have been
used as well as water-insoluble inorganic materials (e.g. CaCO3, BaCO3 and BaSO4).
Depending on such factors as monomer concentration, agitation rate, reactor vessel
configuration, polymerization temperature, and type and amount of suspending agent,
the particle size can vary widely. Suspension polymerization is used as the
commercial production, intended for conversion to PVOH.
(c) Bulk polymerization: It can be carried out simply by dissolving any one of
a variety of common organic free radical initiators in the monomer and heating to
dissociate the initiator. Reasonable care should be taken to eliminate oxygen and other
impurities that retard or inhibit the polymerization. Nevertheless, bulk polymerization
of VAc is not practiced on a commercial scale.

56
(d) Solution polymerization: A wide variety of solvents in which both the
monomer and polymer are soluble were employed. Azo, peroxide, and hydroperoxide
initiators as well as many other organic-soluble initiators can be used. Solvents with
low chain-transfer constants, such as benzene, toluene, acetic acid, acetic anhydride,
acetone, and cyclohexanone, are required to obtain reasonably high molecular
weights. Solution techniques are especially convenient for the laboratory preparation
of poly(vinyl esters) and are used in certain commercial applications in which the
polymers are sold directly as solutions.
(e) Photopolymerization: Direct UV irradiation of VAc at 255 nm, or more
advantageously, irradiation in the presence of photo initiators, induces facile free
radical polymerization. Benzoin, benzoin alkyl ethers, biacetyl, and alkoxy
acetophenones are particularly efficient photo initiators. The polymerizations are
generally run under nitrogen using a medium-pressure mercury arc lamp or a mercury
doped xenon arc lamp as the UV irradiation source. Photochemical polymerizations
have been carried out on a laboratory scale but have not been found useful for the
commercial preparation of PVAc.
(f) High energy radiation polymerization: Cobalt-60 -ray irradiation induces
the facile polymerization of VAc and produces high molecular-weight polymers.
Polymerization can be carried out in solution, bulk, and emulsion. The emulsion -ray
irradiation polymerization of VAc has been of particular interest, and considerable
labor has been expended on studies designed to explore the effects of dose, irradiation
intensity, type of emulsifier, monomer concentration, and so on, on the course of the
polymerization.
(g) Miscellaneous method: VAc has been polymerized by a wide variety of
nonconventional initiator systems. Free radical mechanisms are clearly involved in
most instances; however, examples of cationic and anionic types of polymerization
are also known.
(h) Controlled radical polymerization methods: Using RAFT polymerization
with xanthanes and dithiocarbamates a narrow PDI was obtained and good control of
molecular weight for polymers of Mn < 30000. The homopolymerization of VAc with
the ATRP has not yet been successful.

57
2.5.3 Miscibility of poly(lactic acid)/poly(vinyl acetate) blend
PVAc and PVAc derivative were blended with PLA and the blends
were miscible PVAc [129-130], ethylene-co-vinyl acetate (EVA) [131], PVOH [133]
poly(ethylene-co-vinyl alcohol) (EVOH) [131] and poly(vinyl acetate-co-vinyl
alcohol) copolymers P(VAc-co-VA) [134]. Gajria et al. [129] blended PLA and
PVAc using a single-screw extruder. DSC results showed that all the as-extruded
films were amorphous, and the blends were miscible as only one Tg was observed.
Physical properties testing indicated that the blends exhibited synergism in the range
of 5-30% PVAc. Yoon et al. [131] blended PLLA with EVA. The PLLA/EVA70
blends were immiscible because the Tg and the spherulitic growth rate of the blend
were nearly constant regardless of the change in the blend composition. On the other
hand, the PLLA/EVA85 blends were miscible. The tensile strength and modulus of
the PLLA/EVA85 blend dropped rapidly, followed by a more gradual decrease with
the increase in the EVA85 content. The strain at break was increased rather slowly up
to 70 wt% of EVA85 and then increased quite rapidly around 90 wt% of EVA85. Park
and Im [134] prepared PLA/P(VAc-co-VA) blends by solvent casting method using
chloroform as a co-solvent. The PLA/PVAc blends exhibited a single Tg over the
entire composition range, indicating that the blends were miscible systems. With
increasing neat PVAc contents, the heat of fusion decreased and the melting peaks
shifted to lower temperature. SEM micrographs revealed that the significant phase
separation occurred with increasing the degree of hydrolysis. The PLA/PVAc blends
of 70/30 with 30 mol% vinyl alcohol, the P(VAc-co-VA) copolymer formed the
domains with a size of about 10 m.
2.6 CHARACTERIZATIONS
2.6.1 Mechanical properties
2.6.1.1 Tensile testing [135]
Tensile tests are performed for several reasons. The results of tensile
tests are used in selecting materials for engineering applications. Tensile properties
frequently are included in material specifications to ensure quality, often measured

58
during development of new materials and processes, so that different materials and
processes can be compared, and often used to predict the behavior of a material under
forms of loading other than uniaxial tension. A tensile specimen is shown in Figure
2.30.
Figure 2.30 Typical tensile specimen, showing a reduced gage section and enlarged
shoulders [135].
A tensile test involves mounting the specimen in a machine and
subjecting it to tension. The tensile stress () and the strain () are defined in equation
(2.2) and (2.3), respectively.
0A
F (2.2)
0L
L (2.3)
Where F is the tensile force and A0 is the initial cross-sectional area of the gage
section. L0 is the initial gage length and L is the change in gage length (L-L0).
When a solid material is subjected to small stresses, the bonds between the atoms are
stretched. When the stress is removed, the bonds relax and the material returns to its
original shape. This reversible deformation is called elastic deformation. At higher
stresses, planes of atoms slide over one another. This deformation, which is not
recovered when the stress is removed, is termed plastic deformation. For most
materials, the initial portion of the curve is linear. The slope of this linear region is
called the elastic modulus or Young’s modulus (E) as shown in equation (2.4).
E (2.4)
The stress-strain curves of tensile tests are shown in Figure 2.31. The
tensile strength (ultimate strength) is defined as the highest value of engineering

59
stress. Up to the maximum load, the deformation should be uniform along the gage
section. With ductile materials, the tensile strength corresponds to the point at which
the deformation starts to localize, forming a neck (Figure 2.31a). Less ductile
materials fracture before they neck (Figure 2.31b). In this case, the fracture strength is
the tensile strength. Indeed, very brittle materials do not yield before fracture (Figure
2.31c). Such materials have tensile strengths but not yield strengths.
(a) (b) (c)
Figure 2.31 Stress-strain curves of (a) ductile, (b) semi-ductile and (c) brittle
materials [135].
2.6.1.2 Impact testing
Toughness is a measure of the amount of energy a material can absorb
before fracturing. Impact test conditions are chosen to represent those most severe
relative to the potential for fracture of (1) deformation at a relatively low temperature,
(2) a high strain rate, and (3) a triaxial stress state which may be introduced by the
presence of a notch. Two standardized tests, the Charpy and Izod, are commonly used
to measure impact energy. For both Charpy and Izod, a V-notch is machined into a
specimen with a rectangular cross section. A standard V-notch specimen is illustrated
in Figure 2.32a. The load is applied as an impact shock from a weighted pendulum
hammer that is released from a cocked position at a fixed height "h" (Figure 2.32d).
The specimen is positioned at the base as shown in Figure 2.32b-c. Upon release, a
knife edge mounted on the pendulum strikes and fractures the specimen at the notch,
which acts as a point of stress concentration for the high velocity impact blow. The
pendulum continues its swing, rising to a maximum height "һ'", which is lower than

60
"h". Based on the difference between h and һ׳, the energy absorption and area of the
specimen are computed [136-137].
(a) Notched specimen (b) Izod testing (c) Charpy testing
(d)
Figure 2.32 Impact testing; (a) V-notched specimen, (b) Izod testing, (c) Charpy
testing and (d) Testing Apparatus [136].
2.6.2 Thermal properties
2.6.2.1 Differential scanning calorimetry (DSC)
DSC analysis monitors heat effects associated with phase transitions
and chemical reactions as a function of temperature. DSC is also an alternative

61
technique for determining the temperatures of the phase transitions like melting point,
solidification onset, re-crystallization onset, evaporation temperature, etc [138]. The
calorimeter consists of a sample holder and a reference holder shown in Figure 2.33.
DSC measures the change of the difference in the heat flow rate to the sample and a
reference while they are subjected to a controlled temperature program [139]. The
reference is an inert material such as alumina, or an empty aluminum pan. The
temperature of both the sample and reference is increased at a constant rate. Since the
DSC is at constant pressure, heat flow is equivalent to enthalpy changes. The
difference in the power to the two holders, necessary to maintain the holders at the
same temperature, is used for the calculations. DSC thermogram is shown in Figure
2.34. Notice that this graph labels four critical points: the glass transition temperature
(Tg), the crystallization temperature (Tc), the melting temperature (Tm), and the curing
temperature.
Figure 2.33 Schematic diagram of a DSC apparatus [139].
Figure 2.34 The typical DSC thermogram of polymers [140].

62
2.6.2.2 Thermogravimetric analysis (TGA)
TGA is an analytical technique used to determine a material’s thermal
and/or oxidative stabilities and its fraction of volatile components by monitoring the
weight change that occurs as a specimen is heated. Figure 2.35 shows an example of
thermobalance. The measurement is normally carried out in air or in an inert
atmosphere, such as Helium (He) or Argon (Ar), and the weight is recorded as a
function of increasing temperature. The measurement is performed in a lean oxygen
atmosphere (1-5% O2 in N2 or He) to slow down oxidation. The TGA and derivative
thermogravimetric analysis (DTG) curves generally are plotted between mass and
temperature, as illustrated in Figure 2.36. The TGA curve shows the plateau of
constant weight (region A), the mass loss portion (region B), and another plateau of
constant mass (region C) [141].
Figure 2.35 Components of a thermobalance [142].
Figure 2.36 Typical TGA and DTG curves [142].

63
2.6.2.3 Dynamic mechanical thermal analysis (DMTA) [143]
DMTA is a technique that is widely used to characterize a material’s
properties as a function of temperature, time, frequency, stress, atmosphere or a
combination of these parameters. DMTA works by applying a sinusoidal deformation
to a sample of known geometry. The sample can be subjected to a controlled stress or
a controlled strain. When a sinusoidal stress is applied to a perfectly elastic solid the
deformation (and hence the strain) occurs exactly in phase with the applied stress,
hence the modulus is not time dependent. A completely viscous material will respond
with the deformation lagging behind the applied stress (Figure 2.37).
Figure 2.37 Schematic representation of the response of perfectly elastic and
perfectly viscous materials to an applied stress [143].
When a sinusoidal stress is applied to a viscoelastic material it will behave neither as
a perfectly elastic nor as a perfectly viscous body and the resultant strain will lag
behind the stress by some angle(s) where = 90 (Figure 2.38). The magnitude of the
loss angle is dependent upon the amount of internal motion occurring in the same
frequency range as the imposed stress. Other transitions occur in the glassy or rubbery
plateau, as shown in Figure 2.39. The Tg is seen as a large drop (a decade or more) in
the storage modulus when viewed on a logarithmic scale.
Figure 2.38 Schematic representation of (a) the response of a viscoelastic material to
an applied sinusoidal stress and (b) the in-and out- of phase stress
components [143].

64
Figure 2.39 DMTA thermogram of modulus values change with temperature and
transitions in materials [140].
2.6.3 Nuclear magnetic resonance spectroscopy (NMR)
NMR is a technique that exploits the magnetic properties of certain
atomic nuclei. The basic arrangement of an NMR spectrometer is shown in Figure
2.40. When placed in the magnetic field of NMR, active nuclei (e.g. 1H, 13C) absorb
electromagnetic radiations at a frequency characteristic of the isotope. The resonant
frequency, the energy of the absorption, and the intensity of the signal are
proportional to the strength of the magnetic field. Any motion of a charged particle
has an associated magnetic field, meaning a magnetic dipole is created, just like an
electrical current in a loop creates a magnetic dipole, which in a magnetic field
corresponds to a magnetic moment µ (Figure 2.41) [144]. The operation gives a
locator number called the Chemical Shift, having units of parts per million (ppm), and
designated by δ symbol.
Figure 2.40 The basic arrangement of NMR spectrometer [144].

65
1H-NMR provides information related to the molecular structure. This is particularly
important for copolymers where such information may, for example, help to
determine reactivity ratios and, for vinyl polymers, can give an immediate indication
of the presence of unreacted monomer.
Figure 2.41 A spinning nucleus can be regarded as a microscopic magnet [144].
2.6.4 Fourier transform infrared spectroscopy (FTIR)
IR spectroscopy is the most important of vibrational spectroscopies. It
is used for the determination and identification of molecular structure. IR and Raman
spectroscopy are complementary techniques. Generally, IR spectroscopy is used for a
measurement of the asymmetric vibrations of polar groups while Raman spectroscopy
is suitable for the symmetric vibrations of non-polar groups [145]. The schematic
diagram of the optical layout of IR spectrometer is shown in Figure 2.42.
Figure 2.42 Schematic diagram of the optical layout of IR spectrometer [145].
In the IR active mode an oscillating electric dipole moment in polymeric molecules
must take place. Figure 2.43 expresses the modes of vibration of the bonds and IR

66
activities. The plus and minus signs indicate the partial charges on atoms and the
arrows means the direction of motion [146-148].
Stretching vibrations Bending vibrations
Figure 2.43 Stretching and bending vibrational modes for a CH2 group [149].
2.6.5 Scanning electron microscopy (SEM)
The scanning electron microscope uses a focused beam of high-energy
electrons to generate a variety of signals at the surface of solid specimens. The signals
that derive from electron sample interactions reveal information about the sample
including surface morphology, chemical composition, crystalline structure and
orientation of materials making up the sample. In most applications, data are collected
over a selected area of the surface of the sample, and a 2-dimensional image is
generated that displays spatial variations in these properties. When the primary
electron enters a specimen it travels some distance into the specimen before hitting a
particle. After hitting an electron or a nucleus, etc., the primary electron will continue
on in a new trajectory. This is known as scattering. It is the scattering events that are
most interesting, because it is the components of the scattering events (not all events
involve electrons) that can be detected. The result of the primary beam hitting the
specimen is the formation of a teardrop shaped reaction vessel as shown in Figure
2.44 [150].

67
Figure 2.44 Diagram of electron beam and specimens [150].
2.6.6 Gel permeation chromatography (GPC) [148]
Gel permeation chromatography, a type of size exclusion
chromatography (SEC), is a technique that employs porous non-ionic gel beads to
separate polymers in solution. Beads containing pores of various sizes and
distributions are packed into a column in GPC. Such beads are commonly made of
glass or cross-linked polystyrene. A solvent is pumped through the column and then a
polymer solution in the same solvent is injected into the column. Fractionation of the
polymer sample results as different-sized molecules that are eluted at different times.
Fractionation of molecules in GPC is governed by hydrodynamic volume rather than
by molecular weight. The largest polymers in the solution cannot penetrate the pores
within the cross-linked gel beads, so they will elute first as they are excluded and their
retention volume is smaller. The smallest polymer molecules in the solution are
retained in the interstices (or the voids) within the beads, and so require more time to
elute and their retention volume is bigger (Figure 2.45).
A chromatogram is a plot of the detector response as a function of the
retention volume or retention time. In order to obtain a molecular weight distribution,
the column must be calibrated by using fractions of known molecular weight so to
relate molecular weight to the eluted volume. Commercially available PS samples
with narrow molecular weight distributions are often used as calibration standards. A
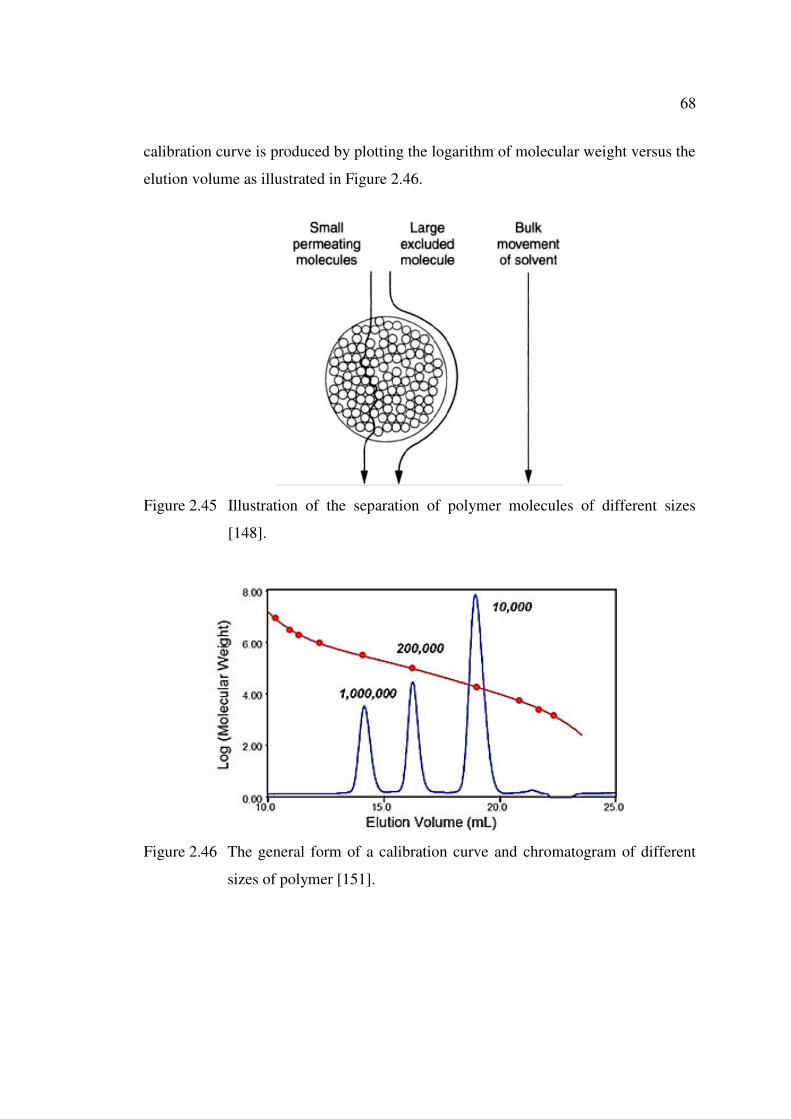
68
calibration curve is produced by plotting the logarithm of molecular weight versus the
elution volume as illustrated in Figure 2.46.
Figure 2.45 Illustration of the separation of polymer molecules of different sizes
[148].
Figure 2.46 The general form of a calibration curve and chromatogram of different
sizes of polymer [151].

69
2.7 References
1. Horák, Z., Fortelný, I., Kolařík, J., Hlavatá, D., Sikora, A. 2005. Polymer Blends. In: Encyclopedia in Polymer Science and Technology. John Wiley & Sons, Inc., New York, USA, 1-59. 2. Robeson, M.L. 2007. Polymer blends: A comprehensive review: Carl Hanser Verlag, Munich, Germany. 3. Folkes, M.J., Hope, P.S. 1993. Polymer blends and alloys. Blackie Academic and Professional, Glasgow Lanarkshire, United Kingdom. 4. Mangaraj, D., Parsons, A.B. 2008. Current topics in elastomer research. Bhowmick, A.K., Ed. Taylor & Francis Group, LLC, Boca Raton, USA. 5. Work, W.J., Horie, K. Hess, M. Stepto, R.F.T. 2004. Definitions of terms related to polymer blends, composites, and multiphase polymer materials. Pure Applied Chemistry, 76, 1985-2007. (IUPAC Recommendations 2004). 6. Utracki, L.A. 2002. Compatibilization of Polymer Blends. The Canadian Journal of Chemical Engineering, 80, 1008-1016. 7. Utracki L.A. 2003. Polymer Blends Handbook: Introduction to polymer blends. Utracki, L.A., Ed. Kluwer Academic Publishers, Netherlands. 8. Elias, H.-G. 1997. Copolymerization. Macromolecules, 1, 761-798. 9. Bhattacharya, A., Misra, B.N. 2004. Grafting: A versatile means to modify polymers Techniques factors and applications. Progress in Polymer Science. 29, 767-814. 10. Hadjichristidis, N., Pispas, S., Floudas, G.A. 2003. Block copolymers: Synthetic strategies, physical properties, and applications. John Wiley & Sons, Inc., New York, USA. 11. Bhattacharya, A., Ray, P. 2009. Polymer grafting and crosslinking: Basic features and techniques. Bhattacharya, A., Rawlins, J.W., Ray, P. Ed. John Wiley & Sons, Inc., Hoboken, New Jersey, USA. 12. Hadjichristidis, N., Pitsikalis, M., Iatrou, H. 2005. Synthesis of block copolymers. Springer-Verlag Berlin Heidelberg. Advanced Polymer Science, 189, 1-124. 13. Lunt, J. 1998. Large-scale production, properties and commercial applications of polylactic acid polymers. Polymer Degradation and Stability, 59, 145-152. 70 14. Gupta, B., Revagade, N., Hilbornb, J. 2007. Poly(lactic acid) fiber: An overview. Progress in Polymer Science, 32, 455-482. 15. Yu, L., Deana, K., Li, L. 2006. Polymer blends and composites from renewable r esources. Progress in Polymer Science, 31, 576-602. 16. Carrasco, F. Pagès, P., Gámez-Pérez, J., Santana, O.O., Maspoch, M.L. 2010. Processing of poly(lactic acid): Characterization of chemical structure, thermal stability and mechanical properties. Polymer Degradation and Stability, 95, 116-125. 17. Rhim, J.W., Mohanty, A.K., Singh, S.P., Ng, P.K.W. 2006. Effect of the processing methods on the performance of polylactide films: Thermocompression versus solvent casting. Journal of Applied Polymer Science, 101, 3736-3742. 18. Avérous, L. 2011. Monomers, polymers and composites from renewable

70
resources. Belgacem, M.N. Gandini, A., Ed. Elsevier, Amsterdam, Netherlands. 19. Rasal, R.M., Janorkar, A.V., Hirt, D.E. 2010. Poly(lactic acid) modification. Progress in Polymer Science, 35, 338-356. 20. Xiao, L., Wang, B., Yang, G., Gauthier, M. 2012. Poly(lactic acid)-based biomaterials: synthesis, modification and applications, Biomedical Science, Engineering and Technology. Ghista, D.N., Ed. InTech publisher, New York, USA. 21. Singh, R.P., Pandey, J.K., Rutot, D., Degee, P., Dubois, P. 2003. Biodegradation
of poly( -caprolactone)/starch blends and composites in composting and culture environments: The effect of compatibilization on the inherent biodegradability of the host polymer. Carbohydrate Research, 338, 1759-1769. 22. Chandra, R., Rusgi, R. 1997. Biodegradable of maleated linear low-density polyethylene and starch blends. Polymer Degradation and Stability. 56, 185-202. 23. Kolybaba, M., Tabil, L.G., Panigrahi, S., Crerar, W.J., Powell, T., and Wang, B. 2003. Biodegradable Polymers: Past, present, and future. The 2003 CSAE/ASAE annual intersectional meeting sponsored by the red river 71 section of ASAE
quality Inn & Suites 301 3rd Avenue North Fargo, North Dakota, USA. October 3-4, 2003, 1-15.
24. Bastioli, C. 2005. Handbook of Biodegradable Polymers: Smithers Rapra Publishing, United Kingdom. 25. Müller, R.J. 2005. Biodegradability of polymers: Regulations and methods for testing. Biopolymers Online, DOI: 10.1002/3527600035.bpola012. 26. Shah, A.A., Hasan, F., Hameed, A. Ahmed, S. 2008. Biological degradation of plastics: A comprehensive review. Biotechnology Advances. 26, 246-265. 27. Hartmann, H., 1998. High molecular weight polylactic acid polymers, in Biopolymers from Renewable Resources. 1st Ed. Kaplan, D.L., Ed. Springer- Verlag, Berlin, 367-411. 28. Auras, R., Harte, B., Selke, S., 2004. An overview of polylactides as packaging materials, Macromolecular Bioscience, 4, 835-864. 29. Garlotta, D. 2001. A literature review of poly(lactic acid). Journal of Polymers and the Environment, 9, 63-84. 30. Dorgan, J.R., Williams, J.S, Lewis, D.N. 1999. Melt rheology of poly(lactic acid): Entanglement and chain architecture effects. Journal of Rheology, 43, 1141-1155. 31. Juntuek, P., Ruksakulpiwat, C., Chumsamrong, P., Raksakulpiwat, Y. 2010. The study of using glycidylmethylacrylate grafted natural rubber as an impact modifier of poly(lactic acid). Clean Technology, ISBN 978-1-4398-3419-0. 32. Juntuek, P., Ruksakulpiwat, C., Chumsamrong, P., Raksakulpiwat, Y. 2012. Effect of glycidyl methacrylate-grafted natural rubber on physical properties of polylactic acid and natural rubber blends. Journal of Applied Polymer Science, 125, 745-754. 33. Juentuek, P., Ruksakulpiwat, C., Chumsamrong, P., Ruksakulpiwat, Y. 2011. Comparison between mechanical and thermal properties of poly(lactic acid) and natural rubber blend using calcium carbonate and vetiver grass fiber as fillers. Advanced Materials Research, 410, 59-62. 34. Suksut, B., Deeprasertkul, C. 2011. Effect of nucleating agents on physical properties of poly(lactic acid) and its blend with natural rubber. Journal of Polymer and the Environment, 19, 288-296 72

71
35. Liu, H., Zhang, J. 2011. Research in toughening modification of poly(lactic acid). Journal of Polymer Science Part B: Polymer Physics, 49, 1051-1083. 36. Desa, M.S.Z.M., Hassan, A., Arsad, A. 2013. The effect of natural rubber toughening on mechanical properties of poly(lactic acid)/multiwalled carbon nanotube nanocomposite. Advanced Materials Research, 747, 639-642. 37. Zhang, C., Man, C., Pan, Y., Wang, W., Jiang, L., Dan, Y. 2011. Toughening of polylactide with natural rubber grafted with poly(butyl acrylate). Polymer International, 60, 1548-1555. 38. Zhang, C., Huang, Y., Luo, C., Jiang, L., Dan, Y. 2013. Enhanced ductility of polylactide materials: Reactive blending with pre-hot sheared natural rubber. Journal of Polymer Research, 20, 121-129. 39. Huang, Y., Zhang, C., Pan, Y., Wang, W., Jiang, L., Dan, Y. 2013. Study on the effect of dicumyl peroxide on structure and properties of poly(lactic acid)/natural rubber blend. Journal of Polymers and the Environment, 21, 375-387. 40. Jaratrotkamhorn, R., Khaokong, C., Tanrattanakul, V. 2012. Toughness enhancement of poly(lactic acid) by melt blending with natural rubber. Journal of Applied Polymer Science, 124, 5027-5036. 41. Bitinis, N., Verdejo, R., Lopez-Manchado, M.A. 2012. Structure and properties of polylactide/natural rubber blends. Materials Chemistry and Physics, 129, 823-831. 42. Bitinis, N., Sanz, A., Nogales, A., Verdejo, R., Lopez-Manchado M.A., Ezquerra, T.A. 2012. Deformation mechanisms in polylactic acid/natural rubber/organo-clay bionanocomposites as revealed by synchrotron X-ray scattering. Soft
Matter, 8, 8990-8997. 43. Riley, T., Stolnik, S., Heald, C.R., Xiong, C.D., Garnett, M.C., Illum, L., Davis, S.S. 2001. Physicochemical evaluation of nanoparticles assembled from poly(lactic acid) poly(ethylene glycol) (PLA-PEG) block copolymers as drug delivery vehicles. Langmuir, 17, 3168-3174. 44. Salem, A.K., Cannizzaro, S.M., Davies, M.C., Tendler, S.J.B., Roberts, C.J., Williams, P.M., Shakesheff, K.M., 2001. Synthesis and characterization of a degradable poly(lactic acid)-poly(ethylene glycol) copolymer with biotinylated end groups. Biomacromolecules, 2, 575-580. 45. Lee, J.H., Go, A.K., Oh, S.H., Lee, K.E., Yuk, S.H. 2005. Tissue anti-ahesion potential of ibuprofen-loaded PLLA-PEG diblock copolymer films. Biomaterials, 26, 671-678. 46. Chen, L., Xie, Z., Hu, J., Chen, X., Jing, X. 2007. Enantiomeric PLA-PEG block copolymers and their stereocomplex micelles used as rifampin delivery. Journal of Nanoparticle Research, 9, 777-785. 47. Jung, I.-I., Haam, S., Lim, G., Ryu, J.-H. 2011. Formation of MPEG-PLLA block copolymer microparticles using compressed carbon dioxide. Korean Journal of Chemistry and Engineering, 28, 1945-1951. 48. Kim, H.D., Bae, E.H., Kwon, I.C., Pal, R.R., Nam, J.D., Lee, D.S. 2004. Effect of PEG-PLLA diblock copolymer on macroporous PLLA scaffolds by thermally induced phase separation. Biomaterials, 25, 2319-2329. 49. Kim, J.H., Noh, H., Kang, J.H., Lee, B.S., Choi, J., Park, K., Han, D.K. 2011. Characteristics of PLLA films blended with PEG block copolymers as additives for biodegradable polymer stents. Biomedical Engineering Letter, 1, 42-48. 50. Stevels, W.M., Ankone, M.J.K., Dijkstra, P.J., Feijen, J. 1995. Stereocomplex

72
formation in ABA triblock copolymer of poly(lactic acid) (A) and poly(ethylene glycol) (B). Macromolecular Chemistry and Physics, 196, 3687-3694. 51. Drumond, W.S., Mothé, C.G., Wang, S.H. 2006. Qualitative analysis of biodegradable amphiphilicpoly(latic acid)-blocked-poly(ethylene glycerol)- block-poly(lactic acid) by using TG FTIR and NMR. Journal of Thermal Analysis and Calorimetry, 85, 173-177. 52. Gong, F., Cheng, X., Wang, S., Wang, Y., Gao, Y., Cheng, S. 2009. Biodegradable comb-dendritic tri-block copolymers consisting of poly(ethylene glycol) and poly(L-lactide): Synthesis, characterizations, and regulation of surface morphology and cell responses. Polymer, 50, 2775-2785. 53. Ren, W., Chang, J., Yan, C., Qian, X. 2010. Development of transferrin functionalized poly(ethylene glycol)/poly(lactic acid) amphiphilic block copolymeric micelles as a potential delivery system targeting brain glioma. Journal of Materials Science: Materials in Medicine, 21, 2673-2681. 54. Hu, X., Xu, J.-Z., Zhong, G.-J., Luo, X.-L., Li, Z.-M. 2011. Shear induced crystallization of poly(L-lactide) and poly(ethylene glycol) (PLLA-PEGPLLA) copolymers with different block length. Journal of Polymer Research, 18, 675-680. 55. Quesnel, R., Hildgen, P. 2005. Synthesis of PLA-b-PEG Multiblock copolymers for stealth drug carrier preparation. Molecules, 10, 98-104. 56. Na, K., Lee, K.H., Lee, D.H., Bae, Y.H. 2006. Biodegradable thermo-sensitive nanoparticles from poly(L-lactic acid)/poly(ethylene glycol) alternating multi-block copolymer for potential anti-cancer drug carrier. European Journal of pharmaceutical Sciences, 27, 115-122. 57. Wang, M., Chen, W., Zhang, H., Li, X., Zhang, Y., Yao, K., Yao, F. 2007. Synthesis and characterization of PLLA-PLCA-PEG multiblock copolymers and their applications in modifying PLLA porous scaffolds. European Polymer Journal, 43, 4683-4694. 58. Saffer, E.M., Tew, G.N., Bhatia, S.R. 2011. Poly(lactic acid)-poly(ethylene oxide) block copolymer: New directions in self-assembly and biomedical applications. Current Medicinal Chemistry, 18, 5676-5686. 59. Zhao, H., Liu, Z., Park, S., Kim, S.H., Kim, J.H., Piao, L. 2012. Preparation and characterization of PEG/PLA multiblock and triblock copolymer. Bulletins Korean Chemistry Society, 33, 1638-1642. 60. Jun, Y.J., Park, K.M., Joung, Y.K., Park, K.D. 2008. In situ gel forming stereocomplex composed of four-arm PEG-PDLA and PEG-PLLA block copolymers. Macromolecular Research, 16, 704-710. 61. Lin, Y., Zhang, A. 2010. Synthesis and characterization of star-shaped poly (D,L-lactide)-block-poly(ethylene glycol) copolymers. Polymers Bulletin, 65, 883-892. 62. Maglio, G., Migliozzi, A., Palumbo, R. 2003. Thermal properties of di- and
triblock copolymers of poly(L-lactide) with poly(oxyethylene) or poly( - caprolactone). Polymer, 44, 369-375. 63. Park, J.W., Im, S.S. 2003. Miscibility and morphology in blends of poly(L-lactic acid) and poly(vinyl acetate-co-vinyl alcohol). Polymer, 44, 4341-4354. 64. Lee, J.-W., Jeong, E.D., Cho, E.J., Gardella, J.A., Hicks, W., Hard, R., Bright,

73
F.V. 2008. Surface-phase separation of PEO-containing biodegradable PLLA blends and block copolymers. Applied Surface Science, 255, 2360- 2364.
65. Rashkov, I., Manolova, N., Li, S.M., Espartero, J.L., Vert, M. 1996. Synthesis, characterization, and hydrolytic degradation of PLA/PEO/PLA triblock copolymers with short poly(L-lactic acid) chains : Macromolecules, 29, 50-56. 66. Lee, S.-H., Kim, S.H., Kim, Y.H. 2002. Synthesis and degradation behaviors of PEO/PL/PEO tri-block copolymers. Macromolecular Research, 10, 85-90. 67. Garric, X., Garreau, H., Vert, M., Moles, J.-P. 2008. Behaviors of keratinocytes and fibroblasts on films of PLA50-PEO-PLA50 triblock copolymers with various PLA segment lengths. Journal of Materials Science: Materials in Medicine, 19, 1645-1651. 68. Park, S.Y., Han, D.K., Kim, S.C. 2001. Synthesis and characterization of star- Shaped PLLA-PEO block copolymers with temperature-sensitive sol-gel transition behavior. Communications to the Editor. Macromolecules, 34, 8821-8824. 69. Kim, J.K., Park, D.J., Lee, M.S., Ihn, K.J. 2001. Synthesis and crystallization
behavior of poly(L-lactic acid)-block-poly( -carprolactone) copolymer. Polymer, 42, 7429-7441. 70. He, A., Han, C.C., Yang, G. 2004. Preparation and characterization of PLLA/P(CL-b-LLA) blends by an in situ ring-opening polymerization. Polymer, 45, 8231-8237. 71. Baimark, Y., Molloy, R., Molloy, N., Siripitayananon, J., Punyodom, W., Sriyai, M. 2005. Synthesis, characterization and melt spinning of a block copolymer of L-lactide and ε-caprolactone for potential use as an absorbable monofilament surgical suture. Journal of materials Science: Materials in Medecine, 16, 699-
707. 72. Zhang, Y., Wang, C., Yang, W., Shi, B., Fu, S. 2005. Tri-component diblock
copolymers of poly(ethylene glycol)-poly( -caprolactoneco-lactide): Synthesis, characterization and loading camptothecin. Colloid Polymer Science, 283, 1246-1252. 73. Zhang, G., Fiore, G.L., Clair, T.L., Fraser, C.L. 2009. Difluoroborondibenzoylmethane PCL-PLA block copolymers: matrix effects on room temperature phosphorescence. Macromolecules, 42, 3162-3169. 74. Kikkawa, Y., Kurokawa, K., Kimura, R., Takahashi, M., Kanesato, M., Abe, H.
2010. Solvent-induced morphological diversification in poly(L-lactide-b- - caprolactone) block copolymer thin films. Polymer Degradation and Stability, 95. 1414-1420. 75. Qian, H., Bei, J., Wang, S. 2000. Synthesis, characterization and degradation of
ABA block copolymer of L-lactide and -caprolactone. Polymer Degradation and Stability, 68, 423-429. 76. Zhao, Z., Yang, L., Hu, Y., He, Y., We, J., Li, S. 2007. Enzymatic degradation of block copolymers obtained by sequential ring opening polymerization of
L-lactide and -caprolactone. Polymer Degradation and Stability, 92, 1769-1777. 77. Wang, C.-H., Hsiue, G.-H. 2003. New amphiphilicpoly(2-ethyl-2-oxazoline)/ poly(L-lactide) triblock copolymers. Biomacromolecules, 4, 1487-1490.

74
78. Wang, C.-H., Fan, K.-R., Hsiue, G.-H. 2005. Enzymatic degradation of PLLAPEOZ- PLLA triblock copolymers. Biomaterials, 26, 2803-2811. 79. Huang, M.-H., Li, S., Coudane, J., Vert, M. 2003. Synthesis and characterization
of block copolymers of -caprolactone and DL-lactide initiated by ethylene glycol or poly(ethylene glycol). Macromolecular Chemistry Physics, 204,1994-2001. 80. Wu, C.S., Liao, H.T. 2005. A new biodegradable blends prepared from polylactide and hyaluronic acid. Polymer, 46, 10017-10026. 81. Kang, Y.M., Lee, S.H., Lee, J.Y., Son, J.S., Kim, B.S., Lee, B., Chun, H.J., Min, B.H., Kim, J.H., Kim, M.S. 2010. A biodegradable, injectable, gel system based on MPEG-b-(PCL-ran-PLLA) diblock copolymers with an adjustable therapeutic window. Biomaterials, 31, 2453-2460. 82. Wang, L., Ma, W., Gross, R. A., McCarthy, S. P. 1998. Reactive compatibilization of biodegradable blends of poly(lactic acid) and poly(ε- caprolactone). Polymer Degradation and Stability, 59, 161-168. 83. Kim, Y.F., Choi, C.N., Kim, Y.D., Lee, K.Y., Lee, M.S. 2004. Compatibilization of Immiscible Poly(L-lactide) and low density polyethylene blends. Fibers and Polymers, 5, 270-274. 84. Harada, M., Ohya, T., Iida, K., Hayashi, H., Hirano K., Fukuda, H. 2007. Increased impact strength of biodegradable poly(lactic acid)/poly(butylene succinate) blend composites by using isocyanate as a reactive processing agent. Journal of Applied Polymer Science, 106, 1813-1820. 85. Vannaladsaysy, V., Todo, M., Takayama, T., M., Jaafar, Ahmad, Z., Pasomsouk, K. 2009. Effects of lysine triisocyanate on the mode I fracture behavior of polymer blend of poly (L-lactic acid) and poly (butylenes succinate-co- L-lactate). Journal of Materials Science, 44, 3006-3009. 86. Ren, J., Fu, H., Ren, T., Yuan, W. 2009. Preparation, characterization and properties of binary and ternary blends with hermoplastic starch, poly(lactic acid) and poly(butylene adipate-co-terephthalate). Carbohydrate Polymers, 77, 576-582. 87. Oyama, H.T. 2009. Super-tough poly(lactic acid) materials: Reactive blending with ethylene copolymer. Polymer, 50, 747-751. 88. Coltelli, M.B., Bronco, S., Chinea, C. 2010. The effect of free radical reactions on structure and properties of poly(lactic acid) (PLA) based blends. Polymer Degradation and Stability, 95, 332-341. 89. Nor, H.M., Ebdon, J.R. 1998. Telechelic liquid natural rubber: A review. Progress in Polymer Science, 23, 143-1998. 90. Decker, C., Le Xuan, H., Nguyen, Thi Viet, T. 1996. Photocrosslinking of functionalized rubber. III. Polymerization of multifunctional monomers in epoxidized liquid natural rubber. Journal of Polymer Science: Part A: Polymer Chemistry. 34, 1771-1781. 91. Ravindran, T., Nayar, G.M.R., Francis, D.J. 1988. Production of hydroxylterminated liquid natural rubber-mechanism of photochemical depolymerization and hydroxylation. Journal of Applied Polymer Science, 35, 1227-1239. 92. Paul, C.J., Gopinathan Nair, M.R., Koshy, P., Idage, B.B. 1999. Segmented block copolymers of natural rubber and bisphenol A-toluene diisocyanate oligomers. Journal of Applied Polymer Science, 74, 706-721. 93. Gopakumar, S., Nair, M.R.G. 2005. Swelling characteristics of NR/PU block

75
copolymers and the effect of NCO/OH ratio on swelling behaviour. Polymer, 46, 104-119. 94. Gopakumar, S.C., Paul, J. Gopinathan Nair, M.R. 2005. Segmented block copolymers of natural rubber and 1,4-butanediol-toluene diisocyanate oligomers. Materials Science-Poland, 23, 227-245. 95. Gopakumar, S., Gopinathan Nair, M.R. 2006. Natural rubber-polyurethane block copolymers: Nonlinear structural variations with NCO/OH ratio. Society of Plastics Engineers, 46, 1812-1821. 96. Chandrasekharan Nair, Gopakumar, R.S., Gopinathan Nair, M. R. 2007. Synthesis and characterization of block copolymers based on natural rubber and polypropylene oxide. Journal of Applied Polymer Science, 103, 955-962. 97. Radhakrishnan Nair, M.N., Gopinathan Nair, M.R. 2008. Synthesis and characterisation of soluble block copolymers from NR and TDI based polyurethanes. Journal of Material and Science, 43, 738-747. 98. Monton, M. 1987. Rubber technology. 3rd Ed. Van Nostrand Reinhold Company lnc., New York, USA. 99. Reyx, D., Compistron, I. 1997. Controlled degradation in tailor-made macromolecular elaboration: controlled chain-cleavages of polydienes by oxidation and by metathesis. Die Angwandte Makromolekulare Chemie. 247, 197-211. 100. Gillier-Ritoit, S., Reyx, D., Campistron, I., Laguerre, A., Singh, R.P. 2003. Telechelic cis-1,4-oligoisoprenes through the selective oxidolysis of epoxidized monomer units and polyisoprenic monomer units in cis-1,4- polyisoprenes. Journal of Applied Polymer Science, 87, 42-46. 101. Kébir, N., Morandi, G., Campistron, I., Laguerre, A., Pilard, J.F. 2005. Synthesis of well defined amino telechelic cis-1,4-oligoisoprenes from carbonyl telechelic oligomers; first studies of their potentialities as polyurethane or polyurea materials precursors. Polymer, 46, 6844-6854. 102. Kébir, N., Campistron, I., Laguerre, A., Pilard, J.F., Bunel, C., Jouenne, T. 2007. Use of telechelic cis-1,4-polyisoprene cationomers in the synthesis of antibacterial ionic polyurethanes and copolyurethanes bearing ammonium groups. Biomaterials, 28, 4200-4208. 103. Saetung, A., Rungvichaniwat, A., Campistron, I., Klinpituksa, P., Laguerre, A., Phinyocheep, P., Pilard, J.F. 2010. Controlled degradation of natural rubber and modification of the obtained telechelic oligoisoprenes: Preliminary study of their potentiality as polyurethane foam precursors. Journal of Applied Polymer Science, 117, 1279-1289. 104. Saetung, A., Rungvichaniwat, A., Campistron, I., Klinpituksa, P., Laguerre, A., Phinyocheep, P., Pilard, J.F. 2010. Preparation and physico-mechanical, thermal and acoustic properties of flexible polyurethane foams based on hydroxytelechelic natural rubber. Journal of Applied Polymer Science, 117, 1279-1289. 105. Saetung, A., Kaenhin, L., Klinpituksa, P., Rungvichaniwat, A., Tulyapitak, T., Munleh, S., Campistron, I., Pilard, J.F. 2012. Synthesis, characteristic, and properties of waterborne polyurethane based on natural rubber. Journal of Applied Polymer Science, 124, 2742-2752. 106. Panwiriyarat, W., Tanrattanakul, V., Pilard, J.F., Khaokong, C. 2011. Synthesis and characterization of block copolymer from natural rubber, toluene-2,4-
diisocyanate and poly( -caprolactone) diol-based polyurethane. Materials

76
Science Forum, 695, 316-319. 107. Panwiriyarat, W., Tanrattanakul, V., Pilard, J.F., Pasetto, P., Khaokong, C.
2012. Effect of natural rubber and poly( -caprolactone) content on mechanical and thermal properties of novel biodegradable Polyurethane.
Advance in Science Letter, 19, 1016-1020. 108. Panwiriyarat, W., Tanrattanakul, V., Pilard, J.F., Pasetto, P., Khaokong, C. 2013. Effect of the diisocyanate structure and the molecular weight of diols on bio-based polyurethanes. Journal of Applied Polymer Science, 130, 453-462. 109. Panwiriyarat, W., Tanrattanakul, V., Pilard, J.F., Pasetto, P., Khaokong, C. 2013. Preparation and properties of bio-based polyurethane containing polycaprolactone and natural rubber. Journal of Polymer and the Environment, 21, 807-815. 110. Solanky, S.S., Campistron, I., Laguerre, A., Pilard, J.F. 2005. Metathelic selective degradation of polyisoprene: Low-molecular-weight telechelic oligomer obtained from both synthetic and natural rubber. Macromolecular Chemistry and Physics, 206, 1057-1063. 111. Quirk, R.P., Kuang, J. 1999. Anionic synthesis and characterization of carbaldehyde-functionalized polybutadienes and polyisoprenes. Journal of Polymer Science: Part A: Polymer Chemistry. 37, 1143-1156. 112. Thomas, R.M., Grubbs, R.H. 2010. Synthesis of telechelic polyisoprene via ring-opening metathesis polymerization in the presence of chain transfer agent. Macromolecules, 43, 3705-3709. 113. Blackley, D.C. 1997. Polymer lattices, science and technology, 2nd Ed. Vol. 2: Type of latices, Chapman and Hall, London, United Kingdom. 114. Jin, H.J., Chin, I.J., Kim, M.N., Kim, S.H., Yoon, J.-S. 2000. Blending of poly(L-lactic acid) with poly(cis-1,4-isoprene). European Polymer Journal, 36, 165-169. 115. Asaletha1, R., Groeninckx, G., Kumaran, M.G., Thomas, S. 1998. Melt rheology and morphology of physically compatibilized natural rubberpolystyrene blends by the addition of natural rubber-g-polystyrene. Journal of Applied Polymer Science, 69, 2673-2690. 116. Chuayjuljit, S., Moolsin, S., Potiyaraj, P. 2005. Use of natural rubber-gpolystyrene as a compatibilizer in casting natural rubber/polystyrene blend films. Journal of Applied Polymer Science, 95, 826-831. 117. Oommen, Z., Gopinathan Nair, M.R., Thomas, S. 1996. Compatibilizing effect of natural rubber-g-poly(methyl methacrylate) in heterogeneous natural rubber/poly(methyl methacrylate) blends. Polymer Engineering and Science, 36, 151-160. 118. Oommen, Z., Thomas Z. 1997. Compatibility studies of natural rubber/poly(methyl methacrylate) blends by viscometry and phase separation techniques. Journal of Materials Science, 32, 6085-6094. 119. Jaratrotkamjorn, R. 2011. Enhance of impact resistance of poly(lactic acid) by natural rubber. Master of Polymer Science and Technology Thesis, Prince of Songkla University. 120. Boonkeaw, P. 2013. Preparation and properties of thermoplastic elastomer made from natural rubber blended with poly(lactic acid). Master of Science and Technology Thesis, Prince of Songkla University.

77
121. Carone Jr., E., Kopcaka, U., Gonçalves, M.C., Nunes, S.P. 2000. In situ
compatibilization of polyamide 6/natural rubber blends with maleic anhydride. Polymer, 41, 5929-5935. 122. Nakason, C., Kaesaman, A., Samoh, Z., Homsin, S., Kiatkamjornwong, S. 2002. Rheological properties of maleated natural rubber and natural rubber blend. Material Behavior, Polymer Testing, 21, 449-455. 123. Nakason, C. Kaesaman, A., Supasanthitikul, P. 2004. The grafting of maleic anhydride onto natural rubber. Polymer Testing, 23, 35-41. 124. Chattopadhyay, S., Sivaram, S. 2001. Compatibilizing effect of poly(styrene)- block-poly(isoprene) copolymers in heterogeneous poly(styrene)/natural rubber blends. Polymer International, 50, 67-75. 125. Cook, J.G. 1965. Your guide to plastics. The English language book society and Merrow publishing Co. Ltd., United Kingdom. 126. Uhrich, K.E., Cannizzaro, S.M., Langer, R.S., Shakesheff, K.M. 1999. Polymeric systems for controlled drug release chemical reviews, 99, 3181-3198. 127. Lee, K.Y., Mooney, D.J. 2001. Hydrogels for tissue engineering. Chemical Reviews, 101, 1869-1879. 128. Nuyken, O., Crivello, J., Lautner, C. 2005. Handbook of polymer synthesis. 2nd
Ed. Kricheldorf, H.R., Nuyken, O., Swift, G., Ed. Marcel Dekker, USA. 129. Gajria, A.M., Dave, V., Gross, R.A., McCarthy, S.P. 1996. Miscibility and biodegradability of blends of poly(lactic acid) and poly(vinyl acetate). Polymer, 37, 437-
444. 130. Liu, C., Mather, P.T. 2003. Thermomechanical characterization of blends of poly(vinyl acetate) with semi-crystalline polymers for shape memory application. Proceeding of Annual Technical Conference of the Society of Plastics Engineers (ANTEC) 61st, 2, 1962-1966. 131. Yoon, J.S., Oh, S.H., Kim, M.N., Chin, I.J, Kim, Y.H. 1999. Thermal and mechanical properties of poly(L-lactic acid)-poly(ethylene-co-vinyl acetate) blends, Polymer, 40, 2303-2312. 132. Shuai, X., He, Y., Asakawa, N., Inoue, Y. 2001. Miscibility and phase structure of binary blends of poly(L-lactide) and poly(vinyl alcohol). Journal of Applied Polymer Science, 81, 762-772. 133. Lee, C.M., Kim, E.S., Yoon, J.S. 2005. Reactive blending of poly(L-lactic acid) with poly(ethylene-co-vinyl alcohol). Journal of Applied Polymer Science, 98, 886-890. 134. Park, J.W., Im, S.S. 2003. Miscibility and morphology in blends of poly(L-lactic acid) and poly(vinyl acetate-co-vinyl alcohol). Polymer, 44, 4341-4354. 135. Davis, J.R. 2004. Tensile testing, 2nd Ed. Materials Park, OH, USA. 136. Callister, Jr., William, D. 1991. Materials science and Engineering: An introduction. 7th Ed. John Wiley & Sons, Inc., New York, USA. 137. Duell, J.M. 2004. Impact testing of advanced composites in advanced topic in characterization of composites. Kessler, M.R., Ed. Trafford Publishing, Bloomington, IN, USA. 138. Klančnik, G., Medved, J., Mrvar, P. 2010. Differential thermal analysis (DTA) and differential scanning calorimetry (DSC) as a method of material investigation. RMZ-Materials and Geo Environment, 57, 127-142. 139. Höhne, G.,Hemminger,W.F. Flammersheim, H.-J. 2003. Differential Scanning

78
Calorimetry. Springer Berlin Heidelberg, 1-298. 140. TA instrument, 2012. TA100 Differential Scanning, Waters Corporation, MA,USA. 141. Sepe, M.P. 1997. Thermal analysis of polymers. iSmithersRapra Publishing, Shrewsbury, SY4 4NR , United Kingdom. 142. PerkinElmer, 2012. Thermogravimetric analysis (TGA). A Beginner’s Guide. 143. Waters, M., Jagger, R., Williams, K., Jerolimov, V. 1996. Dynamic mechanical thermal analysis of denture soft lining materials. Biomaterials, 17, 1627-1630. 144. Gerothanassis, P.I., Troganis, A., Exarchou, V., Barbarossou, K. 2002. Nuclear magnetic resonance (NMR) spectroscopy: Basic principles and phenomena and their applications to chemistry, biology and medicine. Chemistry Education Research and Practice in Europe, 3, 229-252. 145. Larkin, P.J. 2011. IR and Raman spectroscopy: Principles and spectral interpretation. Elsevier, San Diego, USA. 146. Hosier, I.L., Vaughan, A.S., Mitchell, G.R., Siripitayananon, J., Davis, F.J. 2004. Polymer chemistry: A practical approach series to chemistry. Davis, F.J., Ed. OUP Oxford, United Kingdom. 147. Bower, D.I. 2002. An introduction to polymer physic. Cambridge University Press Cambridge, United Kingdom, 162-185. 148. Stuart, B.H. 2002. Polymer analysis. John Wiley & Sons, Hoboken, NJ, USA. 149. Åmand, L.-E., Tullin, C.J., 1999. The theory behind FTIR analysis application examples from measurement at the 12 MW Circulating Fluidized Bed Boiler at Chalmers Department of Energy Conversion Chalmers University of Technology, Göteborg, Sweden. 150. Dunlap, M., Adaskaveg, J.E. 1997. Introduction to the scanning electron microscope: Theory, practice, and procedures. Facility for advanced instrumentation. Rutgers School of Dental Medicine, NJ, USA. 151. Malvern Instruments. 2013. GPC/SEC Conventional calibration. http://www.malvern.com/labeng/technology/gel_permeation_chromatograph y_theory/conventional_calibration_gpc_theory.htm. (accessed 12/07/2013).

84
CHAPTER 3
MATERIALS AND METHODOLOGY
3.1 Materials
1. Two types of natural rubber (NR) were used: CV60 NR block and high
ammonium or ammonia-concentrated natural rubber latex. The NR blocks
were obtained from Jana Concentrated Latex, Co., Ltd., Thailand and
Hutchinson Co., France. The NR latex was obtained from Jana Concentrated
Latex Co., Ltd., Thailand.
2. Vinyl acetate monomer (VAc) was from Merck Co., USA.
3. Poly(lactic acid), the grade was NatureWorks® PLA (2002D), was produced
from NatureWorks LLC, USA.
4. L(+)-Latic acid (L-LA) containing 90% solution in water was from Acros
Organics Co., USA.
5. 3,6-dimethyl-1,4-dioxane-2,5 dione (lactide) was from Sigma-Aldrich Co.,
LLC, USA.
6. Periodic acid (H5IO6) was from Sigma-Aldrich Co., LLC, USA.
7. Sodium borohydride (NaBH4) was from Acros Organics Co.,USA.
8. Stannous octoate (Sn(Oct)2) was from Sigma-Aldrich Co., LLC, USA.
9. Potassium persulfate (KPS) was from AjexFinchem Pty, Ltd., Australia.
10. Sodium laurylsulfate (SLS) was from AjexFinchem Pty, Ltd., Australia.
11. Sodium bicarbonate (NaHCO3) was from Sigma-Aldrich Co., LLC, USA.
12. Sodium sulfate anhydrous (NaSO4) was from Carlo Erba Reagent, France.
13. Magnesium sulfate anhydrous (MgSO4) was from Fisher Scientific Ltd., UK.
14. Sodium thiosulfate (Na2S2O3) was from Fisher Scientific Ltd., UK.
15. Sodium chloride (NaCl) was from Fisher Scientific Ltd., UK.
16. Calcium chloride (CaCl2) was BDH Prolabo fromVWR International, India.
17. Tetrahydrofuran (THF) was from Fisher Scientific Ltd., UK.
18. Toluene was from Sigma-Aldrich Co., LLC, USA.
19. Dichloromethane (CH2Cl2) was from Fisher Scientific Ltd., UK.

85
20. Petroleum ether was from RCI Labscan Ltd., Thailand.
21. Ethanol (CH3CH2OH) was a commercial grade and distilled before using.
22. Methanol (CH3OH) was a commercial grade and distilled before using.
23. WingstayL was purchased from KijpaiboonKemee Ltd., Part, Thailand.
3.2 Instruments
1. Nuclear Magnetic Resonance Spectroscope (1H-NMR): (1) BrukerAvance
400 spectrometer (Bruker, Corp., USA)and (2) UNITY INOVA 500 (Varian
Inc., Germany).
2. Fourier Transform Infrared Spectroscope (FTIR): (1) Nicolet Avatar 370
DTGS FTIR spectrometer (Thermo Electronic Corp., USA) and (2)
EQUINOX55 (Bruker Corp., Germany).
3. Gel Permeation Chromatograph (GPC): ThermoFiningan SEC instrument
(equipped with a SpectraSYSTEM AS100 autosampler, a SpectraSYSTEM
UV2000 and a SpectraSYSTEM RI150 detectors (Thermo Electronic Corp.,
USA).
4. Thermal Gravimetric Analytical Instrument (TGA): TGA Q500 (TA
instrument, USA).
5. Differential Scanning Calorimeter (DSC): (1) Perkin ElmerDSC7 (Perkin
Elmer Inc., USA) and (2) DSCQ100 (TA instrument, USA).
6. Dynamic Mechanical Thermal Analyzer (DMTA): Rheometric Sciencific
DMTA V (RheometricSciencific, USA).
7. Scanning Electron Microscope (SEM): (1) JEOLJSM5800LV and (2)
Quanta400 FEI (JEOL Co., Japan).
8. Evaporator: BUCHI Rotavapor (BUCHI Laborttechnik AG, Switzerland).
9. Twin screw extruder (TWSE): PrismTSE-16-TC (Aaron Equipment Co., Inc,
USA).
10. Compression molding machine: KT-7014 (Kao Tieh Co., Taiwan).
11. Tensile testing machine: Universal Instron 5569 (Instron, USA).
12. Impact resistance tester: Zwick® 5102 (Zwick/Roell, Germany).
13. Thermal oven: UFB 400 (MEMMERT Co., Ltd., Germany).
14. Vacuum oven: Model 29 (Precision, Co., Ltd., USA).

86
3.3 Methodology
3.3.1 Synthesis of natural rubber grafted with poly(vinyl acetate) (NR-g-
PVAc)
Vinyl acetate monomer was purified to remove hydroquinone
monomethyl ether inhibitor by filtering in Al2O3 [1] and washing with 10% NaHCO3
solution [2]. The Al2O3 was packed in a column containing two layers of sand and
cotton wool. After washing with 10% NaHCO3 solution, VAc monomer was
neutralized with distilled water and dried over Na2SO4. Purified VAc monomer was
kept in a container and covered with aluminum foil and refrigerated at 4C.
NR-g-PVAc was synthesized by using emulsion polymerization
technique. The synthesis method was adapted from the works of Ratposan [1] and
Chakrabory et al. [3]. NR Latex was charged in a reactor and stirred at 420 rpm under
nitrogen atmosphere. SLS and NaHCO3 solutions were added and stirred for 10 min.
Then KPS (0.8 mol% of VAc) was slowly dropped and stirred for 20 min. Purified
VAc monomer was dropwise poured into the latex mixture. The reaction was
performed at 60C for 3 h. Then the mixture was precipitated with CaCl2. The
precipitate was washed with distilled water and dried at 60C in a vacuum oven until
constant weight was reached. The mole ratio of NR/VAc and the composition used for
synthesis are summarized in Table 3.1. Free NR (un-grafted NR) and free PVAc
(homo-PVAc) and were extracted by Soxhlet using petroleum ether at 60C for 36 h
and methanol at 40C for 24 h, respectively. The polymer conversion (X), grafting
efficiency (GE), free PVAc and free NR were calculated according to the equations
(3.1-3.4), respectively [4-5].
Table 3.1 Weight of NR, VAc and KPS for synthesis of NR-g-PVAc
NR/VAc
(mol%)
NR Latex (g)
(30 g of dried rubber)
VAc monomer
(WVAc) (g)
KPS (g)
(0.8 mol% of VAc)
90/10 50 4.213 0.107
60/40 50 25.270 0.640
50/50 50 37.914 0.960

87
100
VAcW
NRW
productdriedW
(%)X (3.1)
100
1M
M(%)GE 3 (3.2)
100
1M
2M
1M
(%)NRFree (3.3)
100M
MM(%)PVAcFree
2
32 (3.4)
Where:
Wdried product was total weight of final dried product (g)
WNR was weight of dried rubber (30 g)
WVAc was weight of VAc monomer (g)
M1 was weight of NR-g-PVAc before Soxhlet extraction (g)
M2 was weight of NR-g-PVAc after Soxhlet extraction with petroleum
ether (g)
M3 was weight of NR-g-PVAc after Soxhlet extraction with petroleum
ether and methanol (g)
The grafted PVAc content (G, %) in the NR-g-PVAc after Soxhlet
extraction was evaluated from the 1H-NMR spectrum according to the following
equations (3.5-3.7) [4, 5] ;
1C100
IIPVAcgraftedof%mol
5.14.8
4.8I (3.5)
100)
2M
2(C)
1M
1(C
1M
1C
PVAcgraftedof%weight(%)G (3.6)

88
100CC 21 (3.7)
Where:
I4.8 was the integrated area of the peak at 4.8 ppm (CH of PVAc)
I5.1 was the integrated area of the peak at 5.1 ppm (C=CH of NR)
C1 was the percentage mole of PVAc in the graft copolymer
C2 was the percentage mole of NR in the graft copolymer
M1 was the repeating unit weight of PVAc (86 g/mol)
M2 was the repeating unit weight of NR (68 g/mol)
PVAc homopolymer was synthesized with the following method.
Purified VAc monomer was charged in a 3-necks round bottom flask and stirred at
60-70C, at 420 rpm, under nitrogen atmosphere. SLS, NaHCO3 and PPS (0.8 mol%
of VAc monomer) solution were added in the reactor. The reaction time was 3-5 h and
then the mixture was coagulated with CaCl2, washed with distilled water and dried at
40C in a vacuum oven until constant weight. Conversion percentage of monomer to
polymer was calculated from the dried weight of monomer and that of derived
polymer according to equation (3.8).
100(g)monomer of weight
(g)polymer of weight(%)Conversion PVAcVAc (3.8)
3.3.2 Synthesis of telechelic natural rubber (TNR)
3.3.2.1 Carbonyl telechelic natural rubber (CTNR)
NR was modified to obtain carbonyl telechelic natural rubber (CTNR)
and then transformed into hydroxyl telechelic natural rubber (HTNR), as shown in
Scheme 3.1. The various molecular weights of CTNR and HTNR were obtained by
varying the amount of periodic acid (H5IO6). The method to modify NR to CTNR was
adapted from Kébir et al. [6-7] and Panwiriyarat et al. [8-10]. NR was dissolved in
THF (0.588 M) at 30C for 6 h. H5IO6 was dissolved in THF (0.4 M) and slowly

89
dropped into the NR solution, and the reaction was maintained at 30C for 6 h. The
obtained CTNR was filtered by using filter paper and THF was eliminated by using an
evaporator at 40C. CTNR was dissolved again in THF, filtered and THF was
eliminated. Then CTNR was dissolved in distilled CH2Cl2 and washed with a mixture
of 70 vol% of saturated NaHCO3 solution and 30 vol% of saturated NaCl solution in a
separating funnel. CTNR solution was completely separated from the saturated
aqueous solution and released from the separating funnel. CTNR was washed again
with 50 vol% of 20 wt% Na2S2O3 solution and 50 vol% of saturated NaCl solution by
using the separating funnel. After phase separation and releasing from the separating
funnel, MgSO4 was added into the CTNR solution and kept overnight in order to
remove water from CTNR. Finally, the CTNR was filtered with the filter paper and
CH2Cl2 was removed by using the evaporator at 40C. The obtained CTNR was
characterized by a 1H-NMR spectroscopy and Gel Permeation Chromatography
(GPC).
Scheme 3.1 Synthesis of hydroxyl telechelic natural rubber (HTNR).
3.3.2.2 Hydroxyl telechelic natural rubber (HTNR)
The obtained CTNR was transformed to HTNR by using NaBH4.
NaBH4 was put in THF (0.5 M) and charged into the reactor. CTNR was dissolved in
THF (0.4 M) and slowly dropped into NaBH4 solution in the reactor. The mole ratio
of NaBH4: CTNR was 10:1. The reaction condition was at 60C for 6 h. After 6 h,
300 mL of cold water was added in the reactor to hydrolyze the functional group to be
hydroxyl group. The obtained HTNR was washed with a saturated NaCl solution and
dried over MgSO4 overnight before filtering with the filter paper and eliminating THF
in the evaporator at 40C. The chemical structure and molecular weight of the final
products were investigated by using 1H-NMR and GPC technique, respectively.
3.3.3 Synthesis of PLA prepolymer

90
PLA prepolymer (pre-PLA) was produced in two steps from the direct
condensation polymerization process. In the first step the lactic acid monomer reacted
to give an oligomer and then the oligomer was polymerized in the second step.
Schematic diagram of PLA polymerization is shown in Scheme 3.2. PLA prepolymer
was obtained according to the methodology of Moon et al. [11], Lan and Lv [12] and
Lasprilla et al. [13]. 90% aqueous solution of lactic acid (L-LA) was charged in a 500-
mL round bottom flask equipped with a mechanical stirrer, temperature and pressure
sensors, and connected with a vacuum line. L-LA monomer was dehydrated at 150C
at atmosphere pressure for 2 h, at 100 mbar for 2 h, and finally at 5 mbar for 4 h.
Sn(Oct)2 catalyst, corresponding to 0.5 wt% of monomer, was added into the reactor.
The mixture was heated to the desired reaction temperature (180-220C) under
continuous stirring and the pressure was stepwise reduced to 5 mbar for 8-24 h. In
order to remove the lactide derived from depolymerization in the process, the
obtained products were purified by dissolving in CH2Cl2 and subsequently
precipitated in an excess ethanol. The purified PLA prepolymer was vacuum dried at
40C for 24 h. Chemical structure of PLA prepolymer before and after purification
was verified by 1H-NMR technique and molecular weight by GPC.
Scheme 3.2 Synthesis diagram of PLA prepolymer [11].
3.3.4 Synthesis of PLA-NR block copolymers
3.3.4.1 PLA-NR diblock copolymers
Two methods were used for synthesis of PLA-NR diblock copolymers.
The first method used lactide and in situ polymerization of lactide was carried out
during block copolymerization. The second method used the PLA prepolymer as a co-

91
monomer. The derived diblock copolymers were referred to as “PLA1-NR” and
“PLA2-NR”diblock copolymers, respectively.
(a) “PLA1-NR” diblock copolymer
“PLA1-NR” diblock copolymers were synthesized by ring opening
polymerization (ROP) of lactide in the presence of HTNR oligomers and Sn(Oct)2 as a
catalyst. HTNR was dissolved in toluene and placed in a reactor equipped with a
condenser, mechanical stirrer, and temperature sensor. 0.5 wt% of Sn(Oct)2 (based on
HTNR and lactide content) and lactide were added into the HTNR solution. The
different mole ratios of lactide/HTNR were studied (2/1 and 4/1). The reaction was
maintained at 110C and the different reaction time was performed to find the optimal
reaction time for 8, 16 or 24 h, under nitrogen atmosphere. Synthesis diagram is
shown in Scheme 3.3.
Scheme 3.3 Synthesis diagram of “PLA1-NR” diblock copolymers.
(b) “PLA2-NR” diblock copolymer
In this method, “PLA2-NR” diblock copolymers were prepared by
using PLA prepolymer as shown in Scheme 3.4. HTNR was dissolved in toluene and
charged into the reactor at 110C; then 0.5 wt% of Sn(Oct)2 (based on HTNR and
PLA prepolymer content) and PLA prepolymer were added subsequently. The
different mole ratios of pre-PLA/HTNR were studied (2/1, 1/1 and 1/2). The reaction
was carried out under nitrogen atmosphere for 24 and 48 h at 110C.

92
Scheme 3.4 Synthesis diagram of “PLA2-NR” diblock copolymers.
Toluene was removed by the evaporator at 40C and the obtained
products were dissolved in CH2Cl2, precipitated in an excess distilled ethanol and
dried in the vacuum oven at 40C for 24 h. The chemical structure of final products
was confirmed by 1H-NMR and FTIR and their molecular weight was determined by
GPC technique.
3.3.4.2 PLA-NR-PLA triblock copolymers
There were two methods for the synthesis of PLA-NR-PLA triblock
copolymers. In the first method, lactide was polymerized by ring opening
polymerization into block copolymer to obtain “PLA1-NR-PLA1” triblock copolymer.
The second method, PLA prepolymer was used as a co-monomer and the obtained
triblock copolymers were indicated as “PLA2-NR-PLA2” triblock copolymer.
(a) “PLA1-NR-PLA1” triblock copolymer
“PLA1-NR-PLA1” triblock copolymer displayed in Scheme 3.5 was
generated by ring opening polymerization of lactide. The procedure for the synthesis
of “PLA1-NR-PLA1” triblock copolymer was the same as the process of “PLA1-NR”
diblock copolymer. HTNR was dissolved in toluene and charged in the reactor then
0.5 wt% of Sn(Oct)2 and lactide were added in the reactor. The reaction was carried

93
out at 170C, for 24 h, under nitrogen atmosphere. The mole ratio of lactide/HTNR
was varied from 2/1 to 10/1.
Scheme 3.5 Synthesis diagram of “PLA1-NR- PLA1” triblock copolymers.
(b) “PLA2-NR-PLA2” triblock copolymer
In this method, PLA prepolymer was used as a precursor to prepare
PLA-NR-PLA triblock copolymer designed to “PLA2-NR-PLA2” like the method to
synthesize PLA2-NR diblock copolymer. The mole ratio of PLA/HTNR was 2/1.
HTNR was dissolved in toluene and charged into the reactor, then 0.5 wt% Sn(Oct)2
and PLA prepolymer were respectively added to the HTNR solution, which was
heated at 170C for 24 h. The synthesis diagram is shown in Scheme 3.6.
Scheme 3.6 Synthesis diagram of “PLA2-NR-PLA2” triblock copolymers.
The obtained “PLA1-NR-PLA1” and “PLA2-NR-PLA2” triblock
copolymers were purified by dissolving in CH2Cl2, precipitating in ethanol, and

94
drying under vacuum at 40C. Chemical structure and molecular weight were
determined by 1H-NMR and GPC, respectively.
3.3.5 Preparation of polymer blends
PLA pellets were dried at 105C for 8 h in an oven for removing
moisture and kept in a desiccator. NR, graft copolymer and block copolymers were
cut into small pieces before blending. 1 phr of Wingstay L as an antioxidant was
mixed with PLA and rubber before melt blending. Polymer blending was performed
in a twin screw extruder at a temperature of 120, 160 and 160C for a feed, middle
and die zone, respectively. The screw speed was 150 and 190 rpm for the 1st and 2nd
extrusion, respectively. A 2 mm-thick sheet of polymer blend was molded by a
compression molding machine at 160C under the pressure of 200 kg/cm2 for 17 min.
The specimen was cooled under this pressure for 10 min.
3.3.6 Testing of mechanical properties
3.3.6.1 Tensile properties
The tensile properties were carried out according to ASTM D638 type
V. The specimens were tested at room temperature (25C) with a 50 kN load cell and
a crosshead speed of 5 mm/min. 35 mm of gauge length was used. Eight specimens
were used for every sample. An average value and a standard deviation were reported.
3.3.6.2 Impact resistance
The impact resistance was investigated according to ASTM D256 and
ASTM D6110 for the Izod and Charpy testing, respectively. Notched and Un-Notched
specimens were carried out with the Izod and Charpy tests with a 4 J pendulum.
Impact resistance value of each sample was reported at least for 6 specimens. Eight
specimens were used for every sample. An average value and a standard deviation
were reported.
3.3.7 Characterization
3.3.7.1 Nuclear magnetic resonance spectroscopy (1H-NMR)

95
1H-NMR spectrumof all samples was performed by using deuterated
chloroform (CDCl3-d) as a solvent and tetramethylsilane as the internal standard. 30
mg of sample were dissolved in CDCl3-d and charged in a NMR tube.
3.3.7.2 Fourier transform infrared spectrometry (FTIR)
The FTIR spectra of the NR-g-PVAc graft copolymer and PLA-NR
and PLA-NR-PLA block copolymer were recorded in the range of 4000-400 cm-1. All
samples were investigated by using Neat cell (NaCl cell). Dichloromethane and
chloroform were used as a solvent for graft copolymer and block copolymer,
respectively.
3.3.7.3 Gel permeation chromatography (GPC)
Gel permeation chromatography was performed using a guard column
(Poly Laboratoires, PL gel 5 μm guard column, 50 × 7.5 mm) followed by two
columns (Polymer Laboratoires, 2 PL gel 5 μm MIXED-D column, 2 mm × 300 mm
× 7.5 mm). Narrow molecular weight linear polystyrene standards (ranging from 580
- 4.83 × 10⁵ g/mol) were used to prepare the calibration curve. The mobile phase was
tetrahydrofuran (THF) at a flow rate of 1 mL/min and the temperature of the column
was 40C.
3.3.7.4 Differential scanning calorimetry (DSC)
DSC thermograms of block copolymers were measured at the heating
rate of 10C/min for all scans. The first heating scan was performed from -80C to
200C, and then the sample was slowly cooled at the rate of -10C/min from 200C to
-80C. The second heating scan was performed from -80C to 200C.
DSC analysis of the polymer blends was performed in three steps. The
first heating scan was from 20C to 200C, at 10C/min, and then the quenching scan
with the rate of -100C/min from 200C to 20C was performed. The second heating
scan was from 20C to 200C with the rate of 10C/min, and then the sample was
slowly cooled with the rate of -10C/min. The third heating scan was from 20C to
200C at 10C/min.

96
3.3.7.5 Dynamic mechanical thermal analysis (DMTA)
Dynamic mechanical thermal analysis was carried out in a dual
cantilever bending mode at a frequency of 1 Hz, 0.01% strain and a heating rate of
3C/min from 30C to 200C. The size of a rectangular sample was 3 mm 1 mm.
3.3.7.6 Thermogravimetric analysis (TGA)
Thermal gravimetric analysis was performed with a rate of 10C/min
from 25C to 600C under nitrogen atmosphere. 20 mg of sample were used.
3.3.7.7 Scanning electron microscope (SEM)
All specimens were immersed in liquid nitrogen for 6 h and
immediately fractured before coating with gold. NR particle diameters were
determined.
3.4 References
1. Ratposan, P. 2008. Synthesis of hydrophilic membrane from modified natural
rubber. Master of Science Thesis, Khon Khean University.
2. Bahattab, M.A. 2005. Preparation of Poly(vinyl acetate) latex with ultrasonic
and redox initiation. Journal of Applied Polymer Science, 98, 812-817.
3. Chakraborty, M., Mukherjee, D.C., Mandal, B.M. 1999. Interpenetrating
polymer network composites of polypyrrole and poly(vinyl acetate).
Synthetic Metals, 98, 193-200.
4. Kalkornsuraparnee, E., Sahakaro, K., Kaesaman, A. Nakason, C. 2009. From a
laboratory to a pilot scale production of natural rubber grafted with PMMA.
Journal of Applied Polymer Science, 114, 587-597.
5. Jaratrotkamhorn, R., Khaokong, C., Tanrattanakul, V. 2012. Toughness
enhancement of poly(lactic acid) by melt blending with natural rubber.
Journal of Applied Polymer Science, 124, 5027-5036.
6. Kébir, N., Campistron, I., Laguerre, A., Pilard, J.-F., Bunel, C., Couvercelle, J.-
P., Gondard, C. 2005. Use of hydroxytelechelic cis-1,4-polyisoprene (HTPI)
in the synthesis of polyurethanes (PUs). Part 1. Influence of molecular

97
weight and chemical modification of HTPI on the mechanical and thermal
properties of PUs. Polymer, 46, 6869-6877.
7. Kébir, N., Morandi, G., Campistron, I., Laguerre, A., Pilard, J.-F. 2005.
Synthesis of well-defined amino telechelic cis-1,4-oligoisoprenes from
carbonyl telechelic oligomers; first studies of their potentialities as
polyurethane or polyurea materials precursors. Polymer, 46, 6844-6854.
8. Panwiriyarat, W., Tanrattanakul, V., Pilard, J.F., Khaokong C. 2011. Synthesis
and characterization of block copolymer from natural rubber, toluene-2,4-
diisocyanate and poly(-caprolactone) diol-based polyurethane. Materials
Science Forum, 695, 316-319.
9. Panwiriyarat, W., Tanrattanakul, V., Pilard, J. F., Pasetto, P., Khaokong, C.
2012. Effect of natural rubber and poly(-caprolactone) content on
mechanical and thermal properties of novel biodegradable polyurethane.
Advance in Science Letter, 19, 1016-1020.
10. Panwiriyarat, W., Tanrattanakul, V., Pilard, J. F., Pasetto, P., Khaokong, C.
2013. Preparation and properties of bio-based polyurethane containing
polycaprolactone and natural rubber. Journal of Polymer and the
Environment, 21, 807-815.
11. Moon, S.I., Lee, C.W., Miyamoto, M., Kimura,Y. 2000. Melt polycondensation
of L-lactic acid with Sn(II) catalysts activated by various proton acids: A
direct manufacturing route to high molecular weight poly(L-lactic acid).
Journal of Polymer Science: Part A: Polymer Chemistry, 38, 1673-1679.
12. Lan, P., Lv, J. 2008. Study on synthesis and mechanism of melt polymerization
of L-lactic acid. Journal of Fiber Bioengineering and Informatics, 1, 41-46.
13. Lasprilla, A.J.R., Martinez, G.A.R., Lunelli, B.H., Figueroa, J.E.J., Jardini, A.L.,
Filho, R.M. 2011. Synthesis and characterization of poly(lactic acid) for use
in biomedical field. Chemical Engineering Transitions, 24, 985-990.

98
CHAPTER 4
RESULTS AND DISCUSSIONS
4.1 Effect of poly(vinyl acetate) on the mechanical properties and characteristic
of poly(lactic acid)/natural rubber blends
4.1.1 NR-g-PVAc copolymerization
The conversion percentage of synthesized PVAc using two different
methods for removing the inhibitor is presented in Table 4.1. It was observed that in
the same conditions, using NaHCO3 solution provided higher conversion percentage
than packed column of Al2O3. The washing by NaHCO3 solution was a simple method
and the final purified VAc monomer obtained was of a higher purity than the one
coming from the packed column of Al2O3. The PVAc synthesis was carried out at
60C for 3 h for three times (PVAc1-PVAc3), the conversion from monomer to
polymer was 59, 69 and 68% and 70, 81 and 86% for Al2O3 and NaHCO3 procedure,
respectively. When the reaction time increased to 4 h, the conversion percentage did
not significant increase. Therefore, for the synthesis of the graft copolymer the
conditions 60C for 3 h by using NaHCO3 procedure were chosen. The obtained
PVAc was translucent and rather brittle.
The 1H-NMR spectrum of NR and PVAc are presented in Figure 4.1
and Figure 4.2, respectively. All samples were dissolved in CDCl3. The chemical
shifts () of NR and PVAc samples were listed in Table 4.2. It was found that the
assignments at 5.1 and 4.8 ppm belonged to C=CH of NR (position 3 in Figure 4.1)
and CHO of PVAc (position 2 in Figure 4.2), respectively. The chemical shift at
2.0 ppm responded to –CH2 (position 4 and 5 in Figure 4.2) of NR and –OCH3
(position 3 in Figure 4.2) of PVAc respectively. The chemical shift at 1.6 ppm
(position 1 in Figure 4.1) was –CH3 of NR and CH2 of PVAc appeared at 1.7 ppm
(position 1 in Figure 4.2).

99
Table 4.1 Conversion percentage of vinyl acetate monomer to poly(vinyl acetate)
Code Reaction temp.
(C)
Reaction time
(h)
Conversion (%)
Al2O3 NaHCO3
PVAc1 60 3 58.89 70.10
PVAc2 60 3 68.62 80.91
PVAc3 60 3 68.34 85.78
PVAc4 60 4 81.84 86.88
PVAc5 60 4 80.87 85.44
PVAc6 60 5 68.35 83.19
PVAc7 70 3 51.58 52.10
Figure 4.1 1H-NMR spectrum of natural rubber.
The obtained graft copolymers (NR-g-PVAc) were put in a Soxhlet
apparatus to eliminate un-reacted NR and homo-PVAc. They were extracted with
petroleum ether for 48 h and methanol for 36 h before determining the percentage of
graft PVAc (G). The 1H-NMR spectra of NR, PVAc and NR-g-PVAc before and after
Soxhlet extraction are shown in Figure 4.3. The main characteristic chemical shift of
NR and PVAc were at 5.1 ppm (C=CH proton) and 4.8 ppm (CH proton),
respectively. The FTIR spectra of NR, PVAc and graft copolymer after Soxhlet

100
extraction are illustrated in Figure 4.4. The signal of C=CH stretching and bending of
NR was at 1660 and 836 m-1, respectively. The functional assignments of NR and
PVAc are presented in Table 4.3. After extracting free NR and free homo-PVAc, the
graft copolymer showed characteristic peaks of PVAc at 1738 and 1241 cm-1, which
were assigned to the C=O and CO stretching of the vinyl acetate group, respectively.
Figure 4.2 1H-NMR spectrum of poly(vinyl acetate).
Table 4.2 1H-NMR assignment of NR and PVAc
Samples Chemical shift (ppm) Assignment
Natural rubber
5.1 C=CH
2.0 CH2
1.6 CH3
Poly(vinyl acetate)
4.8 CH
2.0 OCH3
1.7 CH2

101
Figure 4.3 1H-NMR spectra of NR, PVAc and NR-g-PVAc.
Figure 4.4 FTIR spectra of NR, PVAc and NR-g-PVAc after Soxhlet extraction.
NR
PVAc
NR-g-PVAc (G5)
1
6
6
6
1
2,
3
4
23
4
1
5
7
57
1 4
40080012001600200024002800320036004000
Tra
nsm
itta
nce
(%
)
Wavenumber (cm-1)
1668C=CH
NR
PVAc
NR-g-PVAc
836C=CH
1735C=O
1738C=O1666C=CH
836C=CH
1240C-O
1241C-O

102
Table 4.3 FTIR assignment of NR and PVAc
Sample Wavenumber (cm-1) Assignment
Natural rubber [1-3]
3429 OH stretching
2925, 2926, 2854 CH stretching
1720, 1666 C=CH stretching
1448 CH3 deformation
1374 CH2 deformation
Poly(vinyl acetate)
836 C=CH (bending)
1738 C=O stretching
1370 CH3 bending
1241-1264 CO stretching
1175-1375 CH3C=O stretching
1140-1210 COC stretching
The mole ratios of NR/VAc were 90/10, 60/40 and 50/50 and the
characteristics of the obtained graft copolymer are shown in Table 4.4. It was found
that the percentage of conversion (X) increased with an increasing VAc content but
the conversion was relatively low ( 50%). The grafted PVAc content (G) was
increased with increasing VAc content, consequently higher free PVAc
(homopolymer) and free NR (un-reacted NR) were left over when using higher VAc
monomer and NR content, respectively [4-6]. The graft copolymer was coded based
on the value of grafted PVAc content (%G), which was determined from 1H-NMR
spectrum.
Table 4.4 Characteristics of graft copolymerization
Sample
Code
VAc
(mol%)
X
(%)
Free NR
(%)
Free PVAc
(%)
GE
(%)
G
(%)
G1 10 19.2 52.0 13.0 41.0 0.9
G5 40 19.6 40.3 23.8 45.5 5.2
G12 50 50.6 51.1 6.96 14.9 11.9
X = conversion percentage; GE = grafting efficiency; G = grafting percentage

103
4.1.2 Polymer blends containing 10 wt% rubber
4.1.2.1 Mechanical properties
In this section polymer blends consisted of 90 wt% PLA and 10 wt%
rubber including NR and NR-g-PVAc. It is shown that 10% of rubber is an optimal
content in the rubber toughened PLA [4, 7-14]. A compression molded sheet of
extruded PLA was prepared and compared to the virgin PLA as referred to “sheet”
sample. It was found that the neat PLA (sheet) had higher impact strength than the
extruded PLA (Table 4.5). This may be due to thermal degradation during extrusion,
which causes a decrease in molecular weight because of chain scissions and
consequently there is a drop in the impact strength.
PLA was blended with PVAc to investigate the compatibility of PLA
and PVAc. It was shown that the impact resistance of the PLA/PVAc blend did not
significantly change. The un-notched Izod impact strength of PLA (sheet sample) was
19.55±2.67 kJ/m2 whereas all the blends did not break during testing. The Charpy
results presented lower value than those of Izod because the primary difference
between the Charpy and Izod techniques lies in the manner in which the specimen is
supported. Fracture in the un-notched specimen can occur randomly in the test
samples. It is common to obtain higher impact strength in the un-notched specimen
because the notched generates high stress concentration. These results are similar to
those described in the works of Jaratrotkamjorn [14] and Chuaytan [15]. The notched
Izod and Charpy impact strength of PLA and the blends are displayed in Figure 4.5.
Considering the binary blends (90/10/0 and 90/0/10), all rubbers (NR and NR-g-
PVAc) enhanced the Izod impact strength of PLA, particularly G5 had a fourfold
increase of the impact strength of the PLA (Figure 4.5a). The Izod impact strength of
the blends was ranked based on the toughening agents as following: G5 > G12 > NR >
G1. The notched Charpy impact strength in the binary blends in the, except 10% G1
(Figure 4.5b) showed higher value than PLA. The Charpy impact strength of the
binary blends was ordered as following: G12 > G5 > NR > G1. These results indicated
that NR-g-PVAc is a good toughening agent for PLA and it was better than NR and
NR-g-PMMA [4]. The impact strength of PLA and the PLA/NR blend were similar to

104
those reported by Suksut and Deeprasertkul [13] and slightly higher than those
reported by Zhang et al. [9].
Table 4.5 Impact strength of PLA/NR/NR-g-PVAc blends (10 wt% rubber)
PLA/NR/
NR-g-PVAc
Impact strength (kJ/m2)
Charpy Izod Notched Un-Notched Notched Un-Notched
PLA (sheet) 2.54 0.55 19.24 5.22 2.85 0.44 19.55 2.67
PLA (extruded) 2.14 0.31 16.54 3.10 2.17 0.40 9.77 1.92
PLA/PVAc (90/10) 2.36 0.46 15.39 2.11 2.56 0.17 9.49 1.70
90/10/0 4.29 0.54 30.16 5.90 6.36 0.36 -*
90/0/10G1 2.84 0.66 16.42 3.52 5.42 0.31 -*
90/5/5G1 2.37 0.32 16.00 1.83 4.25 0.43 -*
90/7.5/2.5G1 3.43 0.84 23.33 0.67 7.08 0.27 -*
90/0/10G5 4.30 0.59 26.36 2.78 12.01 0.69 -*
90/5/5G5 5.12 0.59 29.83 1.97 12.23 0.70 -*
90/7.5/2.5G5 4.34 0.33 34.54 1.66 12.49 0.72 -*
90/0/10G12 4.47 0.55 30.37 1.67 8.48 0.91 -*
90/5/5G12 5.59 0.82 30.09 3.69 11.57 0.80 -*
90/7.5/2.5G12 2.63 0.72 18.83 1.67 4.02 0.78 -*
*specimens didn’t break
In order to determine the effect of the NR-g-PVAc in the PLA/NR
blend, the ternary blends, a mixture of PLA/NR/NR-g-PVAc, was employed, i.e.,
90/5/5 and 90/7.5/2.5, and compared with the 90/10/0 binary blend. The ternary
blends displayed different results depending on the grafted PVAc content as shown in
Figure 4.5a. G5 improved the toughness of the PLA/NR blend for both blend
compositions. The impact strength of the PLA/NR blend increased from 6.36 kJ/m2 to
12.23-12.49 kJ/m2 after adding G5. G12 exhibited a positive effect only in the 90/5/5
blend that had a toughness of 11.57 kJ/m2 while G1 provided little increase in the
90/7.5/2.5 blend, i.e., 7.08 kJ/m2. The notched Charpy impact strength of the ternary
blends was increased, especially at 90/5/5G5 and 90/5/5G12 it has doubled when

105
comparing to PLA alone, as shown in Figure 4.5b. G5 is the best toughening agent for
the binary and ternary blends, which provided the highest value for the notched
impact strength, while G1 and G12 improved it only in some cases. The maximum
Izod impact strength obtained in the present study was higher than that reported
previously [4, 9, 13, 16-17]. The results indicated that the NR-g-PVAc could be used
directly or mixed with NR to enhance the toughness of PLA.
Figure 4.5 Notched impact strength of PLA/NR/NR-g-PVAc blends (10 wt%
rubber): (a) Izod and (b) Charpy test.
5.42
4.25
7.08
2.85
6.36
12.0112.23 12.49
8.48
11.57
4.02
0
2
4
6
8
10
12
14
16
PLA (sheet)
Izod
im
pact
str
ength
(k
J/m
2)
PLA/NR/NR-g-PVAc
G1 G5 G12(a)
2.842.37
3.43
2.54
4.29 4.30
5.12
4.344.47
5.59
2.63
0
1
2
3
4
5
6
7
8
PLA (sheet)
Ch
arp
y i
mp
act
str
ength
(k
J/m
2)
PLA/NR/NR-g-PVAc
G1 G5 G12(b)

106
Other mechanical properties of the blends were investigated. Figure 4.6
shows the stress-strain curves of PLA and the polymer blends containing 90 wt%
PLA and 10 wt% rubbers both NR and G1, G5, G12. PLA and all blends showed a
yield point before failure. The deformation at breakdown of the blends containing
G12 (90/5/5) is shown in Figure 4.6c and it obviously changed from a brittle failure to
a ductile failure. The 90/5/5G12 sample provided the highest elongation at break up to
16%; it was threefold from the one of the PLA/NR blend (4.25%). The ductility of
PLA/NR blends with G5 and G12 was clearly much higher than of PLA blend and
PLA/NR blends without G5 and G12. However, Young’s modulus, stress at yield and
stress at break of the blends decreased (Table 4.6). It is well known that the addition
of toughening agent into brittle materials decreased the modulus and tensile strength
due to the action of the rubbery phase in the blends.
A similar comparison has been made for the tensile properties as
shown in Figure 4.7. All the blends exhibited lower tensile properties than PLA,
except that the elongation at break of some blends was higher than for PLA. It is
common to obtain lower tensile properties of PLA after blending with NR [5, 8, 10,
13]. The Young’s modulus of all blends was in the range of 1300-1400 MPa. It
seemed that the grafted PVAc had an insignificant effect on the modulus of the
blends. In the binary blends only G12 showed a higher yield stress than NR. In the
ternary blends only G5 and G12 in the 90/5/5 blends revealed a higher yield stress
than NR. PVAc decreased the stress at break of the PLA/NR blends but the elongation
at break of the blends containing G5 and G12 was relatively high for both binary and
ternary blends, especially for G12 in the 90/5/5 blend that showed a higher value than
the PLA and PLA/NR blend by approximately threefold and fourfold, respectively.
The results indicated that PVAc raised the yield stress and the elongation at break of
the PLA/NR blend.
Typically PVAc is a soft and weak amorphous polymer; therefore,
PVAc itself as PLA/PVAc blend (90/10) is not a good toughening agent. The tensile
properties of its blend were not significantly different with the neat PLA (PLA sheet).

107
Figure 4.6 Stress-strain curves of PLA/NR/NR-g-PVAc blend (10 wt% rubber): (a)
G1, (b) G5 and (c) G12.
0
10
20
30
40
50
60
70
0 2 4 6 8 10 12 14 16 18
Str
ess
(MP
a)
Strain (%)
PLA/PVAc
90/10/0
ext.PLA
PLA (sheet)
90/5/5
90/0/10
90/7.5/2.5
G1(a)
0
10
20
30
40
50
60
70
0 2 4 6 8 10 12 14 16 18
Str
ess
(MP
a)
Strain (%)
PLA/PVAc
90/10/0
PLA (sheet)
90/0/10
90/7.5/2.590/5/5
G5(b)
ext.PLA
0
10
20
30
40
50
60
70
0 2 4 6 8 10 12 14 16 18
Str
ess
(MP
a)
Strain (%)
PLA/PVAc
90/10/0
ext. PLA
PLA (sheet)
G12
90/5/5
90/7.5/2.5
90/0/10
(c)

108
Table 4.6 Tensile properties of PLA/NR/NR-g-PVAc blends (10 wt% rubber)
PLA/NR/
NR-g-PVAc
E
(MPa)
y
(MPa)
y
(%)
b
(MPa)
b
(%)
PLA (sheet) 1,63839 62.080.48 5.310.20 61.880.48 5.440.19
PLA (extruded) 1,66383 60.404.27 3.900.39 59.924.05 3.970.45
PLA/PVAc (90/10) 1,62540 59.020.98 4.850.13 57.841.33 5.040.32
90/10/0 1,34595 38.691.83 4.090.17 38.491.83 4.250.17
90/0/10G1 1,28433 33.802.42 3.690.23 33.632.47 3.730.24
90/5/5G1 1,30525 33.791.52 3.800.17 33.341.47 3.950.25
90/7.5/2.5G1 1,33043 35.131.42 3.780.19 33.461.16 4.070.38
90/0/10G5 1,35065 35.341.70 3.750.21 34.941.40 3.830.28
90/5/5G5 1,36037 43.513.91 4.610.31 29.941.29 8.401.42
90/7.5/2.5G5 1,25864 39.671.94 4.430.15 27.951.24 6.051.30
90/0/10G12 1,42280 44.201.26 4.240.27 33.381.84 7.151.67
90/5/5G12 1,33024 40.931.49 4.260.09 25.261.64 16.101.41
90/7.5/2.5G12 1,29528 37.260.64 4.310.17 33.310.94 7.120.88
The objective of the addition of PVAc to the PLA/NR blends in the
present study was to use PVAc as a compatibilizer in the form of NR-g-PVAc, which
was used directly or mixed with NR. The results showed that the impact strength and
tensile properties of PLA and the PLA/NR blends increased with the addition of NR-
g-PVAc. The addition of G5 in the PLA and PLA/NR blends provided the highest
Izod impact strength for 90/0/10, 90/5/5 and 90.7.5/2.5 blends. Therefore, G5 was the
best impact modifier of the blend and was the best compatibilizer for impact strength,
whereas G12 seemed to be the best compatibilizer for enhancing the elongation at
break of the blend. Based on both mechanical properties, the 90/5/5G12 blend should
be the best blend. NR-g-PVAc was better than NR-g-PMMA [4] because NR-g-
PMMA did not increase the mechanical properties of PLA and the PLA/NR blend.
The tensile properties of the present PLA/NR blend were not comparable with those
reported by Bitinis et al. [7] perhaps because of the different sample thickness (2 mm
vs. 0.4 mm) and different testing speed (5 mm/min vs. 10 mm/min).

109
Figure 4.7 Tensile properties of PLA/NR/NR-g-PVAc blend (10 wt% rubber):
(a) modulus, (b) yield stress, (c) stress at break and (d) elongation at
break.
4.1.2.2 Morphology
The morphology of neat PLA and the blends were investigated by
SEM technique. Both of the fractured surfaces from tensile testing specimens and
freeze fracture surface specimens were evaluated. The fractured surface of the tensile
tested specimens (Figure 4.8) agreed with the values of the elongation at break. A
brittle fracture was observed in PLA (Figure 4.8a) and the 10%G5 blend (Figure
4.8c). A ductile fracture was indicated by a yielding of the PLA matrix found in the
blend containing 10%NR (Figure 4.8b) and 10%G12 (Figure 4.8d). Crazing might be
a major deformation mechanism in PLA and the 10%G5 blend, while shear yielding
in PLA matrix occurred in the other blends. Figure 4.8e showed more yielding than
Figure 4.8b and 4.8d, and this corresponded to the highest elongation at break. The
results suggest that NR performs as a toughening agent and absorbs energy from the
PLA matrix, and the rupture happened at the particle-matrix interface because of the
poor interfacial adhesion. This system leaded to the formation of yield point at which
1284 1305 1330
1638
1345 1350 1360
1258
1422
1330 1295
0
400
800
1,200
1,600
2,000
PLA
Mo
du
lus
(MP
a)
PLA/NR/NR-g-PVAc
G1 G5 G12(a)
33.80 33.7935.13
62.08
38.6935.34
43.51
39.67
44.2040.93
37.26
0
10
20
30
40
50
60
70
80
PLA
Yie
ld s
tres
s (M
Pa
)
PLA/NR/NR-g-PVAc
G1 G5 G12(b)
33.63 33.34 33.46
61.88
38.4934.94
29.94 30.9533.38
28.46
33.31
0
10
20
30
40
50
60
70
80
PLA
Str
ess
at
bre
ak
(M
Pa
)
PLA/NR/NR-g-PVAc
G1 G5 G12(c)
3.73 3.95 4.07
5.44
4.25 3.83
8.40
6.05
7.15
16.10
7.12
0
2
4
6
8
10
12
14
16
18
20
PLA
Elo
ng
ati
on
at
bre
ak
(%
)
PLA/NR/NR-g-PVAc
G1 G5 G12(d)

110
stable plastic deformation occurred. The SEM micrographs of fracture surface from
tensile test specimens supported the explanation about the increasing in elongation at
break.
Figure 4.8 Tensile fractured surfaces of (a) PLA, and PLA/NR/NR-g-PVAc:
(b) 90/10/0, (c) 90/0/10G5, (d) 90/0/10G12 and (e) 90/5/5G12.

111
Figure 4.9 SEM micrographs of freeze-fractured surface of PLA/NR-g-PVAC
blends: (a) 10%NR, (b) 10%G1, (c) 10% G5 and (d) 10%G12.
All blends showed the formation of spherical rubber particles (Figure
4.9) and their size was measured from SEM micrographs. The average particle
diameter of all blends was listed in Table 4.7. It was found that PVAc decreased the
particle size of NR but some blends had a higher diameter, i.e., 2.47 and 2.60 m, due
to coalescence of the rubber particles. The size of the dispersed phase implies
miscibility between the continuous and the dispersed phase. High immiscibility
induces coalescence of the dispersed phase because phase separation is preferred in
the blend. Miscibility between PLA and NR was poor; therefore, the NR dispersed
particles tried to combine in their phase causing the coalescence. In contrast, the
miscibility between PLA and NR-g-PVAc was higher due to the miscibility between
PLA and PVAc; consequently, PVAc part acted as an emulsifier leading to higher
stability in the PLA matrix. Theoretically, smaller particle indicates higher
miscibility. Preparation with a rubber diameter larger than 2.1 m exhibited low

112
impact strength [9]. This reflects that it is not only the compatibilization effect but
also the optimal rubber particle diameter that control the impact resistance of the
present blends. The submicron size of the rubber particle diameter in the 90/5/5G12
blend might be a key factor in the improvement in the elongation at break besides the
increment of compatibility.
Table 4.7 Average diameter of rubber particles in the blends (10 wt% rubber)
PLA/NR/NR-g-PVAc Rubber particle diameter (m)
G1 G5 G12
90/10/0 2.50 1.16 2.50 1.16 2.50 1.16
90/0/10 2.24 0.72 1.67 0.77 1.93 0.81
90/5/5 2.47 0.98 1.99 0.97 0.88 0.29
90/7.5/2.5 2.09 0.77 1.90 0.75 2.60 1.11
As stated earlier, it is believed that the PLA/PVAc blend is a miscible
one [16-18]. Therefore, the aim was to increase miscibility of the PLA/NR blend by
using NR-g-PVAc. It was expected that PVAc in this graft copolymer would act as a
compatibilizer and promote interfacial adhesion between the PLA matrix and the
rubber particles. The increase in impact strength, yield stress and elongation at break
as well as the reduction in the rubber particle diameters due to the presence of PVAc
in the blends indicated the enhancement of miscibility of the blends.
4.1.2.3 Dynamic mechanical thermal property
The dynamic mechanical thermal property of PLA and all the blends
were characterized to confirm the miscibility of the blends. It was found that the
temperature of maximum tan of the blends decreased with increasing grafted PVAc
content as shown in Figure 4.10 and Table 4.8. This temperature is the transition
temperature and is equivalent to the glass transition temperature (Tg) determined from
the differential scanning calorimetry (DSC). Basically, it is higher than Tg from DSC
because of the different nature of testing. Dynamic load is applied during testing in
DMTA while as only heating is used in DSC. The transition temperature of PLA

113
sheet and extruded PLA was 69.3 and 71.2C; respectively whereas that of PVAc was
48.9C. PLA blended with 10% PVAc showed lower temperature (65.9C) than PLA.
The transition temperatures of PLA phase in the blends is listed in Table 4.8. The
transition temperatures of the 10%NR blend was not significantly different from that
of PLA whereas the temperature of the 10%G12 blend shifted at 63.0C. This means
PVAc increased the miscibility between PLA and NR.
Figure 4.10 The transition temperature of PLA and the blends.
Table 4.8 The transition temperature of PVAc, PLA and polymer blends
Samples The transition temperature (C)
PVAc 48.9
PLA (sheet) 69.3
PLA (extruded) 71.2
PLA/PVAc (90/10) 65.9
PLA/NR/NR-g-PVAc G1 G5 G12
90/10/0 69.8 69.8 69.8
90/0/10 66.8 64.3 63.0
90/5/5 66.3 69.5 67.5
0
0.5
1
1.5
2
2.5
30 40 50 60 70 80 90
Ta
n d
elta
Temperature (C)
PVAc (48.90C)
PLA (71.20C)
PLA/NR (69.80C)
PLA/G1 (66.82C)
PLA/G5 (64.32C)
PLA/G12 (63.03C)

114
4.1.2.3 Differential scanning calorimetry
The thermal properties of PLA pellets, PLA sheet, extruded PLA and
the blends were investigated. The DSC curves show the three steps of heating scans
and one step of slowly cooling scan (Figure 4.11 and Figure 4.12). Table 4.9 and
Table 4.10 summarized the thermal properties from the first, the second and the third
heating scan of PLA and all the blends. It is known that the first heating scan was
served to remove previous thermal history from the sample. The second heating scan
was performed after rapidly quenching and should evaluate the inherent properties of
the material, and sometimes can be used to differentiate various batches of a material.
The third heating scan was done to check on the reliability of the prior scans. From
the results, it was observed that the addition of NR and NR-g-PVAc enhanced the
crystallizability of PLA by inducing cold crystallization (Tcc) in the heating scan. The
crystallization behavior of compression molded PLA was similar to that of the PLA,
Table 4.9 Thermal properties of the blends from the 1st and the 2nd heating scan
PLA/NR/ NR-g-PVAc
Tg1 (C) Tcc1
(C) Tm1
(C) Xm1 (%)
Tg2
(C) Tcc2
(C) Tm2
(C) Xm2 (%)
PVAc 35.8 - - - 35.0 - - -
PLA (pellet) 60.6 - 151.3 35.4 58.5 128.5 - -
PLA (sheet) 60.7 - 147.0 10.8 58.5 - 148.2 -
PLA (extruded) 58.7 - 150.0 29.6 58.1 - 150.0 6.4
PLA/PVAc (90/10) 54.5 118.5 149.3 28.6 56.0 126.2 150.4 19.6
90/10/0 66.7 106.3 144.3, 152.1 31.9 56.3 125.9 148.9 18.9
90/0/10G1 60.0 106.3 144.3, 151.5 30.7 55.3 126.4 148.9 21.7
90/0/10G5 59.0 104.8 144.3, 151.5 30.2 55.2 123.0 147.4 13.2
90/0/10G12 58.5 107.5 145.5, 151.5 31.2 56.1 129.7 149.5 7.6
90/5/5G1 58.3 104.8 145.2, 153.0 30.3 57.3 123.0 148.7 27.3
90/5/5G5 58.7 106.7 146.0, 152.8 30.9 57.3 127.9 150.0 13.4
90/5/5G12 58.8 105.7 145.7, 152.0 25.9 57.2 129.9 150.5 8.24
90/7.5/2.5G1 57.9 106.2 145.3, 152.5 29.0 57.3 124.5 149.0 22.2
90/7.5/2.5G5 58.9 108.3 146.2, 153.0 29.4 57.4 126.5 149.5 15.7
90/7.5/2.5G12 59.5 108.3 147.3, 152.8 24.3 57.8 124.9 150.3 15.6

115
except the degree of crystallinity of the first heating scan of the PLA sheet was
10.89% while that of PLA pellet was 35.40% and 29.6% for extruded PLA. The lower
crystallinity in the PLA sheet might be one factor causing lower impact strength when
compared with the blends that showed higher crystallinity. Cold crystallization did not
appear in the PLA pellet (Figure 4.11a), PLA sheet (Figure 4.11b) and PLA extruded
(Figure 4.11c) whereas it was shown in PLA/NR blends (Figure 4.11d). Therefore,
this can point out that NR and NR-g-PVAc acted as a nucleating agent of PLA. The
Tg, Tm and degree of crystallization (Xm) in the first heating scan of the blends
differed slightly from those of PLA.
Table 4.10 Thermal properties of the blend from the 3rd heating scan
PLA/NR/NR-g-PVAc Tg3 (C) Tcc3 (C) Tm3 (C) Xm3 (%)
PVAc 41.6 - - -
PLA (pellet) 58.5 - - -
PLA (sheet) 58.5 - 147.4 -
PLA (extruded) 58.0 - 148.5 6.9
PLA/PVAc (90/10) 56.0 127.2 150.5 19.6
90/10/0 57.3 124.5 148.5 21.3
90/0/10G1 56.1 126.5 148.7 13.8
90/0/10G5 55.2 122.9 146.7 23.7
90/0/10G12 56.3 129.9 149.5 8.83
90/5/5G1 57.1 121.9 148.5 28.6
90/5/5G5 57.1 126.9 149.5 14.4
90/5/5G12 56.9 129.7 149.5 10.3
90/7.5/2.5G1 57.5 123.2 148.9 23.4
90/7.5/2.5G5 56.6 124.7 146.4 18.8
90/7.5/2.5G12 58.5 126.4 150.0 16.59
All the blends showed similar thermal properties in the first heating
scan and Tg tended to decrease with an increasing PVAc content as shown in Figure
4.12. It was noted that a double melting peak appeared in all the blends at first heating
scan. The melting peak at higher temperature belonged to more perfect crystalline

116
Figure 4.11 DSC thermograms of (a) PLA pellet, (b) PLA sheet, (c) extruded PLA,
(d) 90/10/0.
structure than at lower temperature [13]. The double melting peak in the first heating
scan disappeared in the second and the third heating scan. In the second and the third
heating scan, PLA and the blends displayed a lower Tg than the first heating scan.
This may be due to thermal degradation of PLA during the first and second heating
scan. In addition, it was observed that PLA pellet was amorphous after the first
heating scan but the extruded PLA and the PLA blends remained crystallized in the
second and the third heating scan due to processed PLA molecule can be crystallized
with better chain mobility [7]. The Tm of the blends also decreased in the second
heating scan and there was no significant difference in the Tcc and Tm among the
blends as same as the third heating scan. The effect of rubber on the thermal
properties of PLA could be identified from the degree of crystallinity (Xm1, Xm2 and
Xm3). The addition of rubber including NR and NR-g-PVAc to PLA caused PLA to
behave as a crystalline polymer, as shown by the increasing degree of crystallinity of
PLA in the blends when compared to PLA extruded. The higher the PVAc content the
20 40 60 80 100 120 140 160 180 200
Hea
t F
low
En
do U
p (
W/g
)
Temperature ( C)
1st heating
2nd heating
3rd heating
Cooling
151.33 C
58.86 C
58.48 C128.47 C
58.57 C
(a)
20 40 60 80 100 120 140 160 180 200
Hea
t F
low
En
do U
p (
W/g
)
Temperature ( C)
147.37 C
60.71 C
58.48 C
149.23 C
58.48 C 148.2 C
1st heating
2nd heating
3rd heating
Cooling
(b)
20 40 60 80 100 120 140 160 180 200
Hea
t F
low
En
do U
p (
W/g
)
Temperature (C)
1st Heating
2nd Heating
Cooling
3rd Heating
150.0C58.7C
58.1C 150.0C
148.5C58.0C
(c)
20 40 60 80 100 120 140 160 180 200
Hea
t F
low
En
do
Up
(W
/g)
Temperature (C)
66.72C106.33C
152.17C144.33C
56.34C 125.87C148.87C
57.29C148.53C
124.53C
1st Heating
2nd Heating
Cooling
3rd Heating
52.52C
(d)

117
lower was the degree of crystallinity, probably because PVAc disrupted the
crystallization process of PLA.
Figure 4.12 DSC thermograms of the blends containing G12: (a) 90/0/10, (b) 90/5/5
and (c) 90/7.5/2.5.
4.1.3 Polymer blends containing >10 wt% rubber
This section describes the blends containing more than 10 wt% rubber
including NR and NR-g-PVAc. Effect of NR content (10, 15 and 20 wt%) and effect
of NR-g-PVAc (G5 and G12) as a compatibilizer were determined. NR-g-PVAc was
added in the blend containing 10 wt% of NR. Its concentration was based on 100 parts
of the blend, i.e., 2.5, 5 and 10 pph.
4.1.3.1 Effect of NR content
Table 4.11 shows the impact strength of this series of blends.
Obviously, the impact strength decreased when NR content increased, except for the
un-notched Izod impact test where the blends were unbroken. The decrease in the
impact strength was attributed to the large NR particle size, as shown in Figure 4.17
30 50 70 90 110 130 150 170 190
Hea
t F
low
En
do
Up
(W
/g)
Temperature (C)
1st Heating
2nd Heating
3rd Heating
Cooling
58.45C151.50C
56.12C
56.30C
145.50C
107.50C
129.70C
149.53C
129.87C
149.53C
(a)
20 40 60 80 100 120 140 160 180 200
Hea
t F
low
En
do
Up
(W
/g)
Temperature ( C)
1st Heating
2nd Heating
3rd Heating
Cooling
58.80C152.00C
57.25C
56.90C
145.67C
105.67C
129.87C150.33C
129.70C149.53C
(b)
20 40 60 80 100 120 140 160 180 200
Hea
t F
low
En
do
Up
(W
/g)
Temperature ( C)
1st Heating
2nd Heating
3rd Heating
Cooling
59.45C 152.83C
57.83C
58.53C
147.33C
108.33C
124.87C
150.53C
126.37C
150.33C
(c)

118
and Table 4.13. Basically, the impact strength of the rubber toughened plastic not only
depends on the rubber content but also depends on the optimal rubber particle
diameter. Too large particle diameter causes premature failure due to lesser interfacial
adhesion between the matrix and the dispersed phase, particularly in the immiscible
blend including the PLA/NR blend. The Charpy impact strength of the blend
containing 20 wt% of NR showed the lowest value and it was lower than that of PLA
sheet. The notched-Izod impact strength also showed the same trend. However, it
seemed that the Charpy test can differentiate the effect of NR content. As stated
previously, the 10 wt% of NR was optimum for toughening the PLA. This experiment
substantiated this assumption.
Table 4.11 Impact strength of PLA/NR/NR-g-PVAc blends (>10 wt% rubber)
PLA/NR/
NR-g-PVAc
Impact strength (kJ/m2)
Charpy Izod
Notched Un-Notched Notched Un-Notched
100/0/0 (sheet) 2.54 0.55 19.24 5.22 2.85 0.44 19.55 2.67
90/10/0 4.29 0.54 30.16 5.90 6.36 0.36 -*
90/15/0 2.84 ± 0.57 19.74 ± 2.18 4.19 ± 0.45 -*
90/20/0 2.61 ± 0.45 15.36 ± 2.06 3.43 ± 0.37 -*
90/10/2.5G5 3.14 ± 0.72 35.91 ± 4.33 6.03 ± 0.73 -*
90/10/5G5 4.43 ± 0.35 35.87 ± 3.90 8.06 ± 0.85 -*
90/10/10G5 4.05 ± 0.56 43.71 ± 8.21 8.42 ± 0.92 -*
90/10/2.5G12 3.11 ± 0.76 36.84 ± 4.59 5.91 ± 0.80 -*
90/10/5G12 3.74 ± 0.59 35.38 ± 2.65 6.99 ± 0.97 -*
90/10/10G12 2.81 ± 0.33 35.83 ± 1.46 6.79 ± 0.70 -*
*specimens didn’t break
The stress-strain curves of the blends and their tensile properties are
exhibited in Figure 4.13-4.14 and Table 4.12, respectively. The tensile stress-strain
curves of the PLA/NR blends containing >10% NR (90/15/0 and 90/20/0) showed
lower elongation at break than the PLA/NR blends containing G5 and G12, as shown
in Figure 4.13. The tensile stress-strain curves displayed the brittleness of both PLA

119
and PLA/NR blend (90/10/0). It can be seen that there is a change of fracture mode in
PLA and PLA/NR blend to a ductile fracture after adding G5 and G12 (Figure 4.14).
A yield point phenomenon of necking and cold-drawing appeared in the blends
containing 10% rubber. The cold drawing is caused by interactions between this
strain force and molecular orientation [7].
Figure 4.13 Stress-strain curves of PLA/NR blend containing different NR content.
Figure 4.14 Stress-strain curves of the blend containing G5 and G12 as a
compatibilizer.
0
5
10
15
20
25
30
35
40
45
0 5 10 15 20 25
Str
ess
(MP
a)
Strain (%)
90/10/0
ext. PLA
90/20/0
90/15/0
0
5
10
15
20
25
30
35
40
45
0 5 10 15 20 25
Str
ess
(MP
a)
Strain (%)
90/10/5G5
90/1010G5
90/10/2.5G5
90/10/5G12
90/10/2.5G1290/10/10G12

120
The tensile properties of the blends decreased with an increasing NR
content, except the elongation at break. The highest elongation at break (18%)
derived from the blend containing 15 wt% of NR and it was more than three folds
higher than that of PLA sheet (5%). By increasing NR to 20 wt%, this property
dropped to 8%. In terms of the tensile toughness determined from the area under the
stress-strain curve, 15 wt% of NR was the optimal content. Although it increased
ductility and tensile toughness of the blend, it greatly decreased the tensile strength
(b) of the blend from 62 MPa of PLA to 21 MPa.
Table 4.12 Tensile properties of PLA/NR/NR-g-PVAc blends (> 10 wt% rubber)
PLA/NR/
NR-g-PVAc
E
(MPa)
y
(MPa)
y
(%)
b
(MPa)
b
(%)
100/0/0 (sheet) 1,63839 62.080.48 5.310.20 61.880.48 5.440.19
100/0/0 (ext) 1,66383 60.404.27 3.900.39 59.924.05 3.970.45
90/10/0 1,34595 38.691.83 4.090.17 38.491.83 4.250.17
90/15/0 1,24040 29.740.52 3.930.11 23.970.52 17.681.34
90/20/0 1,06320 24.050.46 4.060.13 21.260.57 7.601.08
90/10/2.5-G5 1,215±68 33.43±1.29 4.29±0.29 22.84±1.89 25.38±4.13
90/10/5-G5 1,205±36 32.38±0.80 4.00±0.13 21.69±1.05 26.48±7.74
90/10/10-G5 1,151±76 28.38±0.69 3.76±0.11 19.59±0.88 23.37±2.24
90/10/2.5-G12 1,251±35 32.71±1.29 3.97±0.37 23.49±1.77 18.24±3.97
90/10/5-G12 1,213±31 32.47±1.32 4.00±0.11 24.07±0.74 20.34±2.60
90/10/10-G12 1,102±37 28.05±0.82 3.98±0.18 20.87±0.58 17.56±3.37
4.1.3.2 Compatibilization effect
In this section the blends with a constant 90% PLA, 10% NR ratio and
different NR-g-PVAc (G5 or G12) contents are considered. The effect of G5 and G12
on the impact strength of the PLA/NR blend is shown in Table 4.11 and Figure 4.15.
No data were collected for the un-notched Izod test because of the unbroken
specimens. The notched Izod impact strength was increased when adding 5% and
10% of G5 but it was still lower than the other blends displayed in Figure 4.5a. The

121
addition of G5 increased the un-notched Charpy impact strength of the blends but the
notched-Charpy impact strength was lower. Higher PVAc content in the NR-g-PVAc
did not promote the impact resistance. The notched Charpy impact strength of the
blends decreased after adding G12 while the notched Izod impact strength slightly
changed. The un-notched Charpy impact strength of the blends increased
approximately 20 % by adding G12.
Figure 4.15 Effect of G5 and G12 as a compatibilizer on the notched impact strength
of the PLA/NR (90/10) blends: (a) Izod and (b) Charpy test.
6.366.03
8.068.42
5.91
6.99 6.79
0
2
4
6
8
10
12
Izod
Im
pact
str
ength
(k
J/m
2)
NR-g-PVAc content (pph)
G5 G12(a)
4.29
3.14
4.43
4.05
3.11
3.74
2.81
0
1
2
3
4
5
6
Ch
arp
y I
mp
act
str
ength
(k
J/m
2)
NR-g-PVAc content (pph)
G5 G12(b)

122
Figure 4.16 represents the tensile properties of the blends from 0 to 10
pph of G5 and G12, and the summary of tensile properties of the blends with 10%
rubber is exhibited in Table 4.12. It was discovered that the addition of G5 and G12
lowered the Young’s modulus, the yield stress and the stress at break. It was expected
that the modulus and the stress of the blends should decrease with increasing rubber
content because of the higher content of the soft and weak component. The elongation
at break of the blends significantly increased and these blends had a higher ductility
than the 90/5/5G12 blend. However, the standard deviation of the elongation at break
was relatively high compared with other properties. The addition of NR as a
toughening agent and using NR-g-PVAc graft copolymers as a compatibilizer were
allowed straightforward production of ductile PLA.
Figure 4.16 Effect of G5 and G12 as a compatibilizer on tensile properties of the
PLA/NR (90/10) blends.
The average rubber particle diameter of the blends containing >10 wt%
rubber is listed in Table 4.12. The SEM micrographs from freeze fractured section of
PLA/NR at 90/10 wt% with adding NR-g-PVAc as a compatibilizer are exhibited in
1,345
1,215 1,2051,151
1,251 1,213
1,102
0
200
400
600
800
1,000
1,200
1,400
1,600
Mod
ulu
s (M
Pa)
NR-g-PVAc content (pph)
G5 G12(a)38.69
33.4332.38
28.38
32.71 32.47
28.05
0
5
10
15
20
25
30
35
40
45
Yie
ld s
tres
s (M
Pa)
NR-g-PVAc content (pph)
G5 G12(b)
38.49
22.8421.69
19.59
23.49 24.0720.87
0
5
10
15
20
25
30
35
40
45
Str
ess
at
bre
ak
(M
Pa)
NR-g-PVAc content (pph)
G5 G12(c)
4.25
25.3826.48
23.37
18.2420.34
17.56
0
5
10
15
20
25
30
35
40
Elo
ng
ati
on
at
bre
ak
(%
)
NR-g-PVAc content (pph)
G5 G12(d)

123
Figure 4.17. All the blends showed phase separation morphology, where the non-polar
rubber particles formed spherical dispersed phase with low interfacial adhesion with
the polar PLA matrix. An increase of particle diameter with increasing rubber content
appeared. The average diameter of rubber particles in PLA/NR blend with 10%NR
(Figure 4.10a) was 2.50±1.16 m; increasing the rubber content i.e., 90/15/0 and
90/20/0 blends (Figure 4.17a and 4.17b) increased slightly the diameter to 2.66±1.62
and 3.01±2.75 m, respectively, because of coalescence occurring. The average
diameters of all the blends with G5 (Figure 4.17c) were smaller than the blends with
G12 (Figure 4.17d), which corresponded to the results of the elongation at break of
G5 and G12. It can be demonstrated that the coalescence of the dispersed phase in
immiscible blends was not prevented by high viscosity of polymers [7]. For this
reason, the coalescence of NR particle in 20% rubber blends increased the diameter
size and toughening of PLA by NR became ineffective, while it was effective with the
graft copolymers. G5 and G12 were good compatibilizers the enhancement in the
elongation at break of PLA.
Table 4.13 Average diameter of rubber particles in the blends (>10wt% rubber)
PLA/NR Diameter (m)
90/10/0 2.50 1.16
90/15/0 2.66 1.62
90/20/0 3.01 2.75
PLA/NR/NR-g-PVAc G5 G12
90/10/2.5 2.76 1.09 3.18 1.46
90/10/5 2.74 1.12 2.97 1.28
90/10/10 2.92 1.32 3.20 1.93

124
Figure 4.17 SEM micrographs of PLA/NR/G blends containing >10 wt% rubber:
(a) 90/15/0, (b) 90/20/0, (c) 90/10/5G5 and (d) 90/10/5G12.
4.1.4 Effect of rubber mastication
4.1.4.1 Mechanical properties
Jaratrotkamjorn et al. [4] have studied the effect of the number of NR
mastications from 20 to 200 passes on the toughness of the PLA/NR blend. They
reported that the suitable number of mastications for impact resistance was 80-180
passes. The present study also focused on the effect of NR mastication in the
PLA/NR/NR-g-PVAc blends. The NR alone was masticated by a two-roll mill for
100, 140 and 180 passes before melt blending with PLA and NR-g-PVAc. The effect
of mastication of NR on the impact resistance of the polymer blends contained NR-g-
PVAc is displayed in Table 4.14.

125
Table 4.14 Effect of rubber mastications on the impact resistance of the blends
containing G5 and G12
No. of
mastication
(passes)
PLA/NR/
NR-g-PVAc
Impact strength (kJ/m2)
Charpy Izod
Notched Un-Notched Notched
- 100/0/0 2.540.55 19.245.22 2.850.66
0 90/10/0 4.290.54 30.165.90 6.360.36
100 90/10/0 5.711.39 44.105.39 14.703.33
140 90/10/0 5.891.19 44.504.76 9.580.97
180 90/10/0 2.350.44 30.276.52 2.560.49
0 90/5/5G5 5.120.59 29.831.97 12.230.70
100 90/5/5G5 8.51±0.86 38.24±4.73 11.86±0.78
140 90/5/5G5 4.95±0.35 33.20±3.04 8.26±0.68
180 90/5/5G5 6.57±0.89 31.39±3.45 8.91±0.79
0 90/7.5/2.5G5 4.340.33 34.541.66 13.661.72
100 90/7.5/2.5G5 7.20±0.87 34.51±5.13 16.16±2.50
140 90/7.5/2.5G5 4.91±0.33 43.21±3.43 7.89±0.86
180 90/7.5/2.5G5 7.69±0.89 31.92±3.52 10.47±0.96
0 90/5/5G12 5.590.82 30.093.69 11.570.80
100 90/5/5G12 6.14±0.79 38.65±3.89 8.85±0.65
140 90/5/5G12 5.52±0.80 27.59±1.52 8.61±0.92
180 90/5/5G12 7.74±0.78 44.18±5.62 10.63±0.40
0 90/7.5/2.5G12 2.630.72 18.831.67 4.020.78
100 90/7.5/2.5G12 5.14±0.73 34.20±3.35 8.08±0.86
140 90/7.5/2.5G12 5.48±0.89 35.77±3.81 8.32±0.85
180 90/7.5/2.5G12 9.22±1.58 44.07±5.90 13.32±1.37
The notched Izod impact strength of the blends decreased with the
number of NR mastications, excluding the 90/7.5/2.5G5 blend masticated at 100
passes (Figure 4.18a). The notched Charpy impact of the 90/5/5G5 and 90/7.5/2.5G5

126
blends (Figure 4.18b) slightly increased with using masticated NR at 100 passes as
same as 90/7.5/2.5G5 at 180 passes. The blends containing G12 had increased notched
Izod impact strength with increasing number of mastication for 90/7.5/2.5 blend. On
the other hand, NR masticated in the 90/5/5 blend caused a decrease in the impact
strength (Figure 4.19a). The 90/7.5/2.5G12 blend (Figure 4.19b) showed an increase
in the impact strength when the masticated rubber was employed.
Figure 4.18 Effect of rubber mastication on the impact strength of the blends
containing G5: (a) Izod and (b) Charpy test.
Figure 4.19 Effect of rubber mastication on the notched impact strength of the blends
containing G12: (a) Izod and (b) Charpy test.
The tensile stress-strain curves of PLA/NR/NR-g-PVAc blends with
varying number of NR mastication are presented in Table 4.15 and Figure 4.20. The
curves showed that the use of masticated NR instead of non-masticated NR slightly
reduced the brittleness of PLA and PLA/NR blends. The blends became more ductile.
6.36
12.23
13.6614.70
11.86
16.16
9.58
8.26 7.89
2.56
8.91
10.47
0
2
4
6
8
10
12
14
16
18
20
Izo
d I
mp
act
str
ng
th (
kJ
/m2)
PLA/NR/NR-g-PVAc
(a)
4.29
5.12
4.34
5.71
8.51
7.20
5.89
4.95 4.91
2.35
6.57
7.69
0
2
4
6
8
10
12
Ch
arp
y I
mp
act
str
ng
th (
kJ
/m2)
PLA/NR/NR-g-PVAc
(b)
6.36
11.57
4.02
14.70
8.858.08
9.588.61 8.32
2.56
10.63
13.37
0
4
8
12
16
20
Izo
d I
mp
act
str
ng
th (
kJ
/m2)
PLA/NR/NR-g-PVAc
(a)
4.29
5.59
2.63
5.716.14
5.14
5.895.52 5.48
2.35
7.74
9.22
0
2
4
6
8
10
12
Ch
arp
y I
mp
act
str
ng
th (
kJ
/m2)
PLA/NR/NR-g-PVAc
(b)

127
Figure 4.20 Stress-strain curves of polymer blends with different number of
mastication of NR; (a) 100, (b) 140 and (c) 180 passes.
0
5
10
15
20
25
30
35
40
45
0 5 10 15 20 25 30 35
Str
ess
(MP
a)
Strain (%)
ext.PLA
(a)
90/5/5-G590/10/0
90/7.5/2.5-G5
90/5/5-G12
100
90/7.5/2.5-G12
90/10/0-0
0
5
10
15
20
25
30
35
40
45
0 5 10 15 20 25 30 35
Str
ess
(MP
a)
Strain (%)
ext.PLA
140
90/5/5-G5
90/10/0 90/7.5/2.5-G5
90/5/5-G1290/7.5/2.5
(b)90/10/0-0
0
5
10
15
20
25
30
35
40
45
0 5 10 15 20 25 30 35
Str
ess
(MP
a)
Strain (%)
ext.PLA
180
90/5/5-G5
90/10/0
90/7.5/2.5-G5
90/5/5-G12
90/7.5/2.5-G12
(c) 90/10/0-

128
Table 4.15 Effect of rubber mastication on the tensile properties of the blends
containing G5 and G12
No. of
Mastication
(passes)
PLA/NR/
NR-g-PVAc
E
(MPa)
y
(MPa)
y
(%)
b
(MPa)
b
(%)
- PLA (sheet) 1,63839 62.080.48 5.310.20 61.880.48 5.440.19
0 90/10/0 1,34595 38.691.83 4.090.17 38.491.83 4.250.17
100 90/10/0 1,348±31 40.37±1.73 4.20±0.26 24.44±2.95 21.38±4.59
140 90/10/0 1,280±46 40.23±1.08 4.12±0.11 24.59±0.46 13.69±1.47
180 90/10/0 1,313±24 37.90±3.04 4.28±0.25 24.65±1.64 11.17±3.78
0 90/5/5G5 1,36037 43.513.91 4.610.31 29.941.29 8.401.42
100 90/5/5G5 1,340±61 38.61±1.26 4.12±0.07 26.71±1.61 29.02±3.20
140 90/5/5G5 1,383±31 39.39±1.28 4.11±0.07 28.16±1.27 10.94±2.84
180 90/5/5G5 1,374±30 36.44±2.56 3.85±0.24 25.07±2.84 6.98±1.26
0 90/7.5/2.5G5 1,25864 39.671.94 4.430.15 27.951.24 6.051.30
100 90/7.5/2.5G5 1,345±35 37.82±1.48 4.10±0.12 28.17±0.99 12.30±2.66
140 90/7.5/2.5G5 1,341±39 37.79±1.68 4.04±0.08 25.84±1.44 24.02±2.11
180 90/7.5/2.5G5 1,341±21 38.00±1.34 4.02±0.08 27.56±1.45 8.60±2.56
0 90/5/5G12 1,33024 40.931.49 4.260.09 25.261.64 16.101.41
100 90/5/5G12 1,357±33 39.93±1.13 4.23±0.14 28.75±1.22 16.91±1.70
140 90/5/5G12 1,362±21 40.01±1.15 4.18±0.07 28.96±0.57 23.89±2.51
180 90/5/5G12 1,336±30 40.59±1.26 4.44±0.69 28.24±1.25 23.54±4.26
0 90/7.5/2.5G12 1,29528 37.260.64 4.310.17 33.310.94 7.120.88
100 90/7.5/2.5G12 1,354±19 38.74±0.77 4.09±0.07 28.18±0.74 15.87±3.57
140 90/7.5/2.5G12 1,317±54 36.64±1.74 3.93±0.19 27.24±1.13 10.33±2.04
180 90/7.5/2.5G12 1,350±24 40.01±0.86 4.18±0.04 26.77±0.79 26.50±3.62
The Young’s modulus, the yield stress and the stress at break of the
blends containing G5 were slightly changed by the mastication of NR (Figure 4.21a-
c). In contrast, rubber mastication increased the elongation at break (Figure 4.21d).
The blends containing G12 were similar to the blends containing G5 as presented in
Figure 4.22a-d. The number of mastications had different effects on the elongation at

129
Figure 4.21 Effect of NR mastication on the tensile properties of the PLA/NR/NR-g-
PVAc blends containing G5.
Figure 4.22 Effect of NR mastication on the tensile properties of the PLA/NR/NR-g-
PVAc blends containing G12.
1,345 1,360
1,258
1,348 1,340 1,345 1,280
1,383 1,341 1,313
1,374 1,341
0
200
400
600
800
1,000
1,200
1,400
1,600
Mod
ulu
s (M
Pa)
PLA/NR/NR-g-PVAc
(a)
38.69
43.51
39.6740.37
38.61 37.82
40.23 39.3937.7937.90
36.44
38.00
0
5
10
15
20
25
30
35
40
45
50
Yie
ld s
tres
s (M
Pa)
PLA/NR/NR-g-PVAc
(b)
38.49
29.94
27.95
24.44
26.7128.17
24.59
28.16
25.8424.6525.07
27.56
0
5
10
15
20
25
30
35
40
45
Str
ess
at
bre
ak
(M
Pa)
PLA/NR/NR-g-PVAc
(c)
4.25
8.40
6.05
21.38
29.02
12.3013.69
10.94
24.02
11.17
6.988.60
0
5
10
15
20
25
30
35
Elo
ngati
on
at
bre
ak
(%
)
PLA/NR/NR-g-PVAc
(d)
1,345 1,330 1,295
1,348 1,357 1,354 1,280
1,362 1,317 1,313 1,336 1,350
-
200
400
600
800
1,000
1,200
1,400
1,600
Mod
ulu
s (M
Pa)
PLA/NR/NR-g-PVAc
(a)
38.6940.93
37.26
40.37 39.9338.74
40.23 40.01
36.6437.90
40.5940.01
0
5
10
15
20
25
30
35
40
45
50
Yie
ld s
tres
s (M
Pa
)
PLA/NR/NR-g-PVAc
(b)
38.49
25.26
33.31
24.44
28.75 28.18
24.59
28.96
27.2424.65
28.2426.77
0
5
10
15
20
25
30
35
40
45
Str
ess
at
bre
ak
(M
Pa)
PLA/NR/NR-g-PVAc
(c)
4.25
16.10
7.12
21.38
16.91
15.87
13.69
23.89
10.3311.17
23.54
26.5
0
5
10
15
20
25
30
35
Elo
ng
ati
on
at
bre
ak
(%
)
PLA/NR/NR-g-PVAc
(d)

130
break in each blend. The elongation at break significantly increased after NR
mastication at 100 and 140 passes for the 90/5/5 and 90/7.5/2.5 blend, respectively.
All blends showed higher elongation at break when NR masticated was used. It is
known that mastication of NR causes molecular chain scissions, as reported by
Jaratrotkamjorn et al. [4] and Tanrattanakul et al. [19], where it was found that
mastication of NR caused a decrease in the molecular weight and Mooney viscosity.
The viscosity of the matrix and the dispersed phase is one of the important factors that
can control the morphology of the polymer blends and affect their mechanical
properties. These experimental results confirmed that rubber mastication could be
used as a compatibilization technique for the PLA/NR/NR-g-PVAc blend. This
indicated that molecular weight and viscosity of rubber played as a major role in the
mechanical properties of the blends [4].
4.1.4.2 Morphology
Table 4.16 Average diameter of rubber particles in the blends
No. of NR mastication
(passes)
PLA/NR/
NR-g-PVAc
Rubber diameter (m)
G5 G12
0
90/10/0 2.50 1.16
90/5/5 1.99 0.97 0.88 0.29
90/7.5/2.5 1.90 0.75 2.60 1.11
90/10/0 1.77 0.49
100 90/5/5 1.24 0.44 1.28 0.43
90/7.5/2.5 1.39 0.50 1.64 0.62
90/10/0 1.91 0.64
140 90/5/5 1.43 0.50 1.18 0.40
7.5/2.5 1.44 0.56 1.53 0.53
90/10/0 1.54 0.52
180 90/5/5 1.17 0.39 1.08 0.32
90/7.5/2.5 1.38 0.43 1.10 0.34

131
Figure 4.23 and Table 4.16 display the SEM micrographs of freeze-
fractured surfaces of all PLA/NR/NR-g-PVAc blends containing masticated NR. It
can be observed that the particle size of NR dramatically decreased when increasing
the number of NR mastications. It was perceptible that the NR particle size was
reduced from 2.50 to 1.08 m between 0 and 180 passes. It was assumed that the
explanation was the same than Jaratrotkamjorn et al. [4] and Tanrattanakul et al. [19];
who showed that chain scission of NR molecules occurs during mastication because of
the applied stress. The lower viscosity was due to a decrease in molecular weight that
may also increase the compatibility of the blend.
Figure 4.23 SEM micrographs of the 90/5/5 blend containing G5 with different
number of masticated NR: (a) 0, (b) 100, (c) 140 and (d) 180 passes.

132
4.2 Synthesis and characterization of diblock and triblock copolymers from
HTNR and lactide
4.2.1 Synthesis of telechelic natural rubber (TNR)
NR was chemically modified to carboxyl telechelic natural rubber
(CTNR) and then CTNR was transformed in hydroxyl telechelic natural rubber
(HTNR). The 1H-NMR spectrum of NR is presented in Figure 4.24, in which the
chemical shift at 5.1 ppm belongs to methine proton (C=CH) of NR. The methylene
(CH2) and methyl proton (CH3) were assigned at 2.0 ppm and 1.6 ppm,
respectively. Figure 4.25 illustrates the 1H-NMR spectrum of CTNR and all the
chemical shifts of CTNR are listed in Table 4.17 [20-28]. After reaction with the
oxidative agent, a new chemical shift was seen at 9.7 ppm, corresponding to the
aldehyde group (CH=O) at the end of the CTNR chain. The chemical shifts of
methyl and methylene protons close to the carbonyl terminal groups appeared in the
range of 2.1 to 2.5 ppm.
Figure 4.24 1H-NMR spectrum of natural rubber (NR).
A reducing agent called sodium borohydride (NaBH4) was used to
transform the carbonyl groups of CTNR to hydroxyl groups in HTNR. The reducing
agent reacted with the carbonyl groups of CTNR and it had no effect on C=C and CC
bonds of NR. The 1H-NMR spectrum of the HTNR is displayed in Figure 4.26 and the
CHCl3
3
4
51

133
chemical shifts of HTNR are listed in Table 4.18. From the spectrum of HTNR, it was
seen that the chemical shift at 9.7 ppm (CH=O) disappeared, and the -proton in
hydroxyl terminated groups (CH2OH, multiplet, and –CHOH, triplet) were at 3.65
ppm and 3.80 ppm, respectively. The signals at 2.0 and 1.6 ppm belonged to the –
CH2 and –CH3 of NR, respectively. Furthermore, it was observed a new signal at 1.2
ppm (doublet) that was assigned to the methyl group (–CH3CHOH) close to the chain
end.
Figure 4.25 1H-NMR spectrum of carbonyl telechelic natural rubber (CTNR).
Table 4.17 Chemical shift assignment of carbonyl telechelic natural rubber
(CTNR) [20-28]
Functional group Chemical shift (ppm)
CH=O 9.77 (H6)
C=CH 5.10 (H3)
CH2CH=O 2.49 (H7)
CH3C=OCH2 2.43 (H10)
CH2CH2CH=O 2.34 (H8)
CH3C=OCH2CH2 2.25 (H9)
CH3C=OCH2 2.13 (H11)
CH2 2.00 (H4 and H5)
CH3 1.67 (H1)
6
910 8
7
11
CHCl3
45 1
3
THF
THF10

134
Figure 4.26 1H-NMR spectrum of hydroxyl telechelic natural rubber (HTNR).
Table 4.18 Chemical shift assignment of hydroxyl telechelic natural rubber
(HTNR) [20-28]
Functional group Chemical shift (ppm)
C=CH 5.10 (H3)
–CHOH 3.80 (H9)
CH2OH 3.65 (H6)
CH2 2.00 (H4 and H5)
CH3 1.67 (H1)
CH3CHOH 1.20 (H10)
The functional groups and the molecular structure of CTNR and
HTNR were also investigated by using FTIR technique. Figure 4.27 illustrates the
FTIR spectra of NR, CTNR and HTNR and Table 4.19 summarizes the assignment of
their functional groups. Characteristics peaks in NR (Figure 4.27a) were found that
the band at 3036 and 1662 cm-1 representing asymmetric and symmetric –C=CH
stretching, respectively. Also the band at 837 was attributed to –C=CH bending in NR
molecule. The peaks belonging to CH2 and CH3 stretching appeared at 2961 and 2727
cm-1, respectively. The bands at 1449 and 1376 cm-1 were assigned to C-H stretching
of CH2 and CH3 in cis-1,4-isoprene unit, respectively. In CTNR (Figure 4.27b), all
CHCl3
3 14
5
69
6
9
10

135
Figure 4.27 FTIR spectra of NR, CTNR and HTNR.
Table 4.19 Wavenumber and functional groups of NR, CTNR and HTNR
Wavenumber (cm-1) Functional group
NR CTNR HTNR
- - 3352 OH stretching
3036 3035 3036 =CH asymmetric stretching
2961, 2727 2961, 2728 2961, 2727 CH2, CH3 stretching
- 1720 - C=O stretching
1662 1663 1662 C=CH symmetric stretching
1449, 1376 1448, 1374 1449, 1376 CH2, CH3 deformation
837 837 837 C=CH bending
the main peaks were similar to the NR spectrum, except the band of the carbonyl
group at 1720 cm-1. The FTIR spectrum of HTNR (Figure 4.27c) showed well-defined
absorptions at 1662 and 837 cm-1, C=C stretching and bending, respectively. The
bands at 1449 and 1376 cm-1 corresponded to the CH2 and CH3 bending, respectively.
Also the absorption peaks at 2961 and 2727 cm-1 were CH2 and CH3 stretching,
respectively. The band at 3352 cm-1 for O-H stretching from hydroxyl group was
revealed in the HTNR spectrum while the band of carbonyl group at 1720 cm-1
40080012001600200024002800320036004000
Tra
nsm
itta
nce
(%
)
Wavenumber (cm-1)
(a) NR
(b) CTNR
(c) HTNR
2961-2727
CH2, CH3 stretchig
3036
=C-H stretchig
1662
C=C stretchig
1720
C=O stretchig
1448, 1376
CH2, CH3 stretchig
837
C=CH bending
3352
O-H stretchig

136
disappeared. This result confirmed that the carbonyl groups in CTNR were
completely changed to hydroxyl groups in HTNR. HTNR with different molecular
weight was used as a starting material for the preparation of block copolymers from
poly(lactic acid) and natural rubber.
Table 4.20 and Table 4.21 present the %yield, the molecular weight
and polydispersion index (PDI) of CTNR and HTNR, respectively. The obtained
CTNR and HTNR were yellowish viscous liquids. The CTNR and HTNR behavior
depended on their molecular weight, for example HTNR-1 with 2840 g/mol was less
viscous than HTNR-10 having 19360 g/mol. As expected, the molecular weight of
CTNR and HTNR could be controlled by the amount of periodic acid. The optimum
reaction time for periodic acid to cut NR chain was 6 h based on the preliminary
studies. In some cases, purification of NR was performed by dissolving in
dichloromethane at 30C for 8 h, then precipitating in an excess ethanol and drying
until constant weight in a vacuum oven. The obtained molecular weights of CTNR
and HTNR from purified and non-purified NR did not have any significant difference.
Therefore, the successive preparations of TNRs were performed using non-purified
NR. The purification of NR was carried out because in some experiments, the
molecular weight of the obtained CTNR did not correspond to the targeted molecular
weight (Mn-targeted), which allows the calculation of the amount of periodic acid to use.
Thus, only in the synthesis of HTNR-4, the amount of periodic acid was calculated by
multiplying by the required number of moles by the factor 1.6, to obtain a molecular
weight of CTNR and HTNR close to the targeted one. The targeted molecular weight
of CTNR-7 and CTNR-8 samples was 10000 g/mol, but the obtained CTNRs were
16110 and 11730 g/mol, respectively. This was explained when it was realized that
the periodic acid used for these reactions was from a different brand and that it had
not the same quality and reactivity. The obtained HTNR was used as a precursor to
produce block copolymers from poly(lactic acid) and natural rubber as a PLA-NR
diblock and PLA-NR-PLA blocks. A high molecular weight of HTNR was required to
use it as a precursor for the synthesis of block copolymers.

137
Table 4.20 The molecular weight of carbonyl telechelic oligomers
Sample Yield (%) Mn-targeted
(g/mol)
Mn
(g/mol)
Mw
(g/mol) PDI
CTNR-1 69.80 1700 2910 5750 1.97
CTNR-2 72.80 3000 4070 8360 2.05
CTNR-3 84.30 3000 3120 5470 1.80
CTNR-4 83.80 1700 1790 3490 1.89
CTNR-5 81.90 1700 1880 3650 1.94
CTNR-6 63.20 5000 8450 16820 1.99
CTNR-7 85.30 10000 16110 43170 2.68
CTNR-8 85.20 10000 11730 23300 1.98
CTNR-9 85.10 5000 7210 13910 1.95
CTNR-10 80.20 15000 19390 268510 2.98
Table 4.21 The molecular weight of hydroxyl telechelic oligomers
Sample Yield (%) Mn targeted
(g/mol)
Mn
(g/mol)
Mw
(g/mol) PDI
HTNR-1 78.70 1700 2890 5630 1.98
HTNR-2 89.50 3000 4850 11290 2.32
HTNR-3 83.30 3000 3240 5380 1.66
HTNR-4 86.60 1700 1900 4040 2.12
HTNR-5 78.00 1700 3560 4450 1.25
HTNR-6 62.20 5000 6500 14150 2.18
HTNR-7 82.20 10000 15750 45480 2.88
HTNR-8 77.90 10000 10540 25060 2.38
HTNR-9 74.30 5000 7140 14520 2.03
HTNR-10 77.40 15000 19360 38320 2.91
4.2.2 Synthesis and characterization of “PLA1-NR” diblock copolymers
All of the obtained “PLA1-NR” diblock copolymers were sticky and
yellow liquids. The 1H-NMR spectrum of “PLA1-NR” diblock copolymers after
purification and the assignments are illustrated in Figure 4.28 and Table 4.22,

138
respectively. The chemical shift at 5.2 ppm was assigned to the C=CH proton of
NR and the CH proton (H12) in the repeating unit of PLA chain. The main
characteristics of PLA at 4.4 ppm (H13) and 1.5 ppm (H11) belonged to CH and
CH3 at the chain end, respectively. The condensation reaction between OH group of
HTNR and COOH group of lactide or lactic acid led to the formation of a new ester
linkage. As a result, a new chemical shift of the methylene proton (C=OOCH2) at
4.1 ppm (H6) was evident in the resulting diblock copolymer. This methylene proton
(PLACOOCH2) has been observed in the PLA-PEO diblock copolymers as
reported by Rashkov et al., [29], Park et al. [30], Na et al. [31] and Jun et al. [32]. The
methine proton (CH) in -position of hydroxyl end group (CHOH) at 3.8 ppm
(H9) was observed, indicating that only one chain end of HTNR has reacted to form
the diblock copolymer.
Figure 4.28 1H-NMR spectrum of “PLA1-NR” diblock copolymer.
CHCl3
3,
12
4,
5
9
136
1
11 14

139
Table 4.22 1H-NMR assignments of “PLA1-NR” diblock copolymer
Assignments Chemical shift (, ppm)
–CH and –C=CH (PLA and HTNR) 5.2 (H12 and H3)
CH, CH3 (chain end of PLA) 4.4 (H13), 1.2 (H14)
–C=O–OCH2 (PLA-HTNR) 4.1 (H6)
–CHOH (HTNR) 3.8 (H9)
–CH2, –CH3 (HTNR) 2.0 (H4, 5), 1.6 (H1)
–CH3 (main chain of PLA) 1.5 (H11)
–CH3CHOH (HTNR) 1.2 (H10)
FTIR spectra of the PLA, HTNR and “PLA1-NR” diblock copolymer
are showed in Figure 4.29, and in Table 4.23 the FTIR assignments of PLA
prepolymer are reported. The OH stretching was observed at 3526 cm-1. The PLA
spectrum showed symmetric and asymmetric vibrations of methine proton (CH) from
CH3 at 2999 and 2952 cm-1, respectively. The band at 1764 cm-1 was assigned to the
C=O stretching of an ester carbonyl group. The bands corresponding to bending
vibrations of CH3 and COC (asymmetric and symmetric) were found at 1621, 1453
cm-1 and 1348, 1275, 1198 cm-1, respectively. The HTNR spectrum is explained in
Figure 4.27c. FTIR spectra of the diblock copolymers did not show any new peak.
The main peaks were similar to those of HTNR and PLA, such as the band at 1662
and 836 cm-1, which was attributed to the C=CH stretching and bending of NR and the
band at 1760 cm-1 due to C=O stretching of ester group in the PLA segment.
Table 4.23 PLA assignments [33]
Wavenumber (cm-1) Functional group
3526 OH stretching
2999, 2952 C-H stretching in CH3 (asym. and sym.)
1764 C=O stretching
1621, 1453 CH3 bending (asym. and sym.)
1348, 1275, 1198 C-O-C stretching, asym. and sym.

140
Figure 4.29 FTIR spectra of PLA, HTNR and “PLA1-NR” diblock copolymer.
Lactide and lactic acid were used for the synthesis of the “PLA1-NR”
diblock copolymers in order to investigate the effect of the monomer structure.
Studied parameters were molecular weight of HTNR and reaction time as listed in
Table 4.24. Sample designation was based on the molecular weight of each segment in
the resulting diblock copolymer, as shown in Table 4.25.
The molecular weight of HTNR was 2900, 3200 and 6500 g/mol and
the block copolymers were prepared with different PLA block lengths. A higher
reaction time increased the molecular weight of the obtained diblock copolymer and
molecular weight distribution was approximately 1.4 (1.39-1.45). The increment in Mn
of the diblock copolymer seemed to agree with the increment in Mn of the HTNR. By
changing Mn of HTNR from 3200 g/mol to 6500 g/mol and the mole ratio (PLA/NR)
to 4/1, in order to investigate the effect of lactide content, it was found that the L69N65
sample had Mn higher than L35N32 about two folds and the PDI was 2.93. The 1H-
NMR result still showed the peak at 3.80 ppm, which confirmed that this copolymer
was a diblock copolymer. Lactic acid can be used as a starting monomer for
copolymerization as shown in P56N32 and P36N29. However, the P56N32 block
copolymer (from lactic acid) showed lower molecular weight than the P69N65 block
copolymer at the same ratio (4/1). This might be due to the incomplete polymerization
of PLA.
40080012001600200024002800320036004000
Tra
nsm
itta
nce
(%
)
Wavenumber (cm-1)
(a) HTNR
(b) pre PLA
(c) "PLA1-NR"
1662
C=C stretchig
1764
C=O stretchig1662
C=C stretchig
2961-2727CH2, CH3 stretchig
2999-2952C-H stretchig3526
O-H stretchig
3352O-H stretchig
837
C=CH bending
836
C=CH bending
1764
C=O stretchig

141
Table 4.24 Conditions for synthesis of “PLA1-NR” diblock copolymers
Samples Type of
monomer
Lactide/HTNR
(mole ratio)
Reaction time
(h)
Mn HTNR
(g/mol)
P27N32 Lactide 2/1 8 3200
P31N32 Lactide 2/1 16 3200
P35N32 Lactide 2/1 24 3200
P69N65 Lactide 4/1 24 6500
P36N29 Lactic acid 2/1 24 2900
P56N32 Lactic acid 4/1 24 3200
Table 4.25 The molecular weight of “PLA1-NR” diblock copolymers after
purification
Sample Mn HTNR (g/mol) Mn PLA1-NR (g/mol) Mw PLA1-NR (g/mol) PDI
P27N32 3200 5900 8600 1.45
P31N32 3200 6300 8800 1.39
P35N32 3200 6700 9300 1.39
P69N65 6500 13400 39200 2.93
P36N29 2900 6500 9000 1.39
P56N32 3200 8800 14000 1.63
The GPC chromatograms of HTNR and P35N32 diblock copolymer
before and after purification are shown in Figure 4.30. A bi-modal curve was obtained
for the sample without purification (P35N32-B), then, after purification (P35N32-A), a
symmetric peak remained at higher molar weights and the PDI was 1.39. These
chromatograms indicated that the purification of “PLA1-NR” diblock copolymer
removed un-reacted and low molecular weight homopolymer precursor (yield = 50%
after purification).

142
Figure 4.30 GPC chromatograms of HTNR32 and the synthesized block copolymer
P35N32 (A = after purification, B = before purification).
The thermal characterization of synthesized diblock copolymers was
performed by DSC and TGA techniques. From DSC results, it was observed that the
block copolymers had two glass transition temperatures (Tg), which corresponded to
NR and PLA segments. The lower transition temperature (around -60C) was
attributed to Tg of the NR segment and the higher transition temperature was given to
the PLA segment. The PLA and NR blocks can be considered to be immiscible
because the Tgs of the copolymers were nearly identical to those of the
homopolymers. This conclusion was in agreement with the data on PLA/NR blends
[4, 7-13]. It is known that the blends of two immiscible polymers exhibit the two Tgs
of each separated component. In contrast, only one Tg is observed in the case of
blends of two miscible polymers.
DSC technique did not detect the peak of crystallization temperature
(Tc) and melting temperature (Tm) of diblock polymers due to the presence of short
NR sequences attached to PLA in the block copolymers, which were amorphous
polymers. Lactide or lactic acid was in situ polymerized with the HTNR to form
“PLA1-NR” diblock copolymer. Figure 4.31a-b presents the DSC thermograms from
the first heating, cooling and the second heating scans of P35N32 and P56N32 diblock
copolymers, which was made from lactide and lactic acid, respectively. Figure 4.31c
0
5
10
15
20
25
30
35
40
8 10 12 14 16 18 20
Res
po
nse
(m
V)
Retention Time (Min)
P35N32-A
HTNR32
P35N32-B

143
displays DSC thermograms of “PLA1-NR” diblock copolymer synthesized from
HTNR32 as a precursor; it was found that the Tg of NR segments were around -60C.
The Tg of PLA segments slightly increased with an increasing of molecular weight of
block copolymers at 5900, 6300 and 6700 g/mol, for which Tg were 30.5, 31.4 and
34.3C, respectively. Table 4.26 summarizes the thermal properties of diblock
copolymers of “PLA1-NR” method.
Figure 4.31 DSC thermograms of “PLA1-NR” diblock copolymers: (a) P35N32, (b)
P56N32 and (c) the second heating scan of P27N32, P31N32 and P35N32
diblock copolymers.
The weight loss curves and thermal degradation temperature (Td) of
HTNR oligomer, PLA prepolymer and PLA-NR diblock copolymers are displayed in
Figure 4.32 and Table 4.26. The TGA thermograms of the “PLA1-NR” diblock
copolymers showed two steps of degradation. The first degradation step (Td1) was
-80 -60 -40 -20 0 20 40 60 80 100 120 140 160 180 200
Hea
t F
low
Exo U
p (
W/g
)
Temperature (C)
-60.09C
-61.80C
-58.63C
1st Heating
2nd Heating
Cooling
67.29C
34.32C
28.98C
(a)
-80 -60 -40 -20 0 20 40 60 80 100 120 140 160 180 200
Hea
t F
low
Exo U
p (
W/g
)
Temperature (C)
-59.96C
-60.69C
-60.53C
1st Heating
2nd Heating
Cooling
43.10C
57.06C
30.98C
(b)
-80 -60 -40 -20 0 20 40 60 80 100 120 140 160 180 200
Hea
t F
low
Ex
o U
p (
W/g
)
Temperature (C)
HTNR32
-60.59C
-60.22C
-61.50C30.45C
31.37C-61.80C
34.32C
P27-N32
P35-N32
P31-N32
(c)

144
Table 4.26 Thermal properties of “PLA1-NR” diblock copolymers
Samples
Transition temperature (C) Thermal degradation
temperature (C) 1st heating Cooling 2nd heating
Tg1 Tg2 Tg1 Tg2 Tg1 Tg2 Td1 Td2
HTNR29 -59.5 - -58.8 - -59.3 - 407 -
HTNR32 -61.6 - -60.1 - -60.6 - 426 -
HTNR65 -61.4 - -60.5 - -60.7 - 424 -
P27N32 -59.5 50.36 -63.9 38.8 -61.5 30.5 229 371
P31N32 -59.0 50.48 -58.4 11.5 -60.2 31.4 235 373
P35N32 -60.1 67.29 -58.6 29.0 -61.8 34.3 242 375
P69N65 -60.5 10.91 -60.9 6.8 -60.5 31.2 247 375
P36N29 -61.2 43.22 -59.5 27.6 -61.5 42.5 244 376
P56N32 -60.0 43.10 -60.5 31.0 -60.7 57.1 251 374
Figure 4.32 The DTG thermograms of (a) HTNR32, (b) P35N32 and (c) TGA
thermograms of diblock copolymers.
-0.1
0
0.1
0.2
0.3
0.4
0.5
0.6
0.7
0.8
0
10
20
30
40
50
60
70
80
90
100
0 100 200 300 400 500 600
Der
iv. W
eigh
t (%
/C)
Wei
gh
t (%
)
Temperature (C)
426.30C(a)
-0.2
0
0.2
0.4
0.6
0.8
1
1.2
0
10
20
30
40
50
60
70
80
90
100
0 100 200 300 400 500 600D
eriv
. W
eigth
(%
/C)
Wei
gh
t (%
)
Temperature (C)
374.59C
241.86C
(b)
0
10
20
30
40
50
60
70
80
90
100
0 100 200 300 400 500 600
Wei
gh
t (%
)
Temperature (C)
P31N32
HTNR32
P27N32
P35N32(c)

145
assigned to PLA block and the second step (Td2) was attributed to HTNR blocks.
P56N32 and P69N65 showed higher Td1 than other diblock copolymers due to their
higher molecular weight. The thermal stability of diblock copolymers (Td1) depended
on the molecular weight of PLA segments. The thermal stability (Td2) of diblock
copolymers shifted to lower temperature as compared to HTNR oligomer because of
the incorporation of the PLA segment.
4.2.3 Synthesis and characterization of “PLA1-NR-PLA1” triblock
copolymers
After the synthesis of diblocks, the idea was to synthesize triblocks of
the type PLA1-NR-PLA1”, using HTNR and ring opening polymerization of lactide.
They were obtained as yellowish viscous fluids. Figure 4.33 presents the 1H-NMR
spectrum of “PLA1-NR-PLA1” triblock copolymers. The new ester linkages between
PLA and HTNR were observed at 4.8 ppm (H9) and at 4.1 ppm (H6), which belonged
to –COOCH2 and –CHOCO at the two chain ends of HTNR, respectively. The
achieved triblock copolymerization can be proved by the shift of the peaks at 3.80 and
3.65 ppm, whose chemical shift was due to the two hydroxyl groups in the HTNR
molecules.
Figure 4.33 1H-NMR spectrum of “PLA1-NR-PLA1” triblock copolymers.
The obtained copolymers were composed of HTNR as a central block
and two blocks of PLA at the two chain ends. The main characteristic peaks of the

146
PLA in the repeating unit at 5.2 ppm (H12) and 1.5 ppm (H11) were assigned to
methine proton (CH), and methyl proton (CH3), respectively. The signals at 5.2
ppm (H3) and 1.6 ppm (H1) responded to C=CH and CH3 in cis-1,4-polyisoprene
of NR molecule, respectively.
Table 4.27 presents the 1H-NMR chemical shifts of PLA-NR-PLA
triblock copolymers. The difference between diblock and triblock copolymerization
was that diblock copolymer showed only a new peak at 4.1 ppm, assigned to ester
linkage between PLA and HTNR, and one hydroxyl end group still remained at 3.80
ppm. Two new ester linkages in triblock copolymer were present at 4.1 and 4.8 ppm,
indicating that the two hydroxyl end groups of HTNR reacted with carboxylic acid
groups of PLA [21, 25-26].
Table 4.27 1H-NMR assignments of “PLA1-NR-PLA1” triblock copolymer
Assignment Chemical shift (, ppm)
CH and –C=CH (PLA and NR) 5.1 (H3 and H12)
CHOC(=O) (PLA-HTNR) 4.8 (H9)
C(=O)OCH2 (PLA-HTNR) 4.1 (H6)
CH, CH3 (chain end PLA) 4.4 (H13), 1.2 (H14)
CH2, CH3 (HTNR) 2.0 (H4 and H5), 1.6 (H1)
CH3 (main chain PLA) 1.5 (H11)
CH3CHOH (HTNR) 1.2 (H10)
FTIR spectra of HTNR, PLA, “PLA1-NR-PLA1” triblock copolymers
are showed in Figure 4.34. The band at 3526 cm-1 in PLA belonged to OH stretching
of COOH end group and the bands at 2999 and 2952 cm-1 were assigned to the CH
stretching of CH3 and CH groups in PLA molecules. The stretching of ester carbonyl
group in the PLA block was at 1764 cm-1and the characteristics COC stretching
was found at 1348, 1275 and 1198 cm-1. For HTNR, the significant bands at 3036,
1662 and 837 cm-1 corresponded to =CH stretching, C=C stretching and C=CH
bending, respectively. And also the vibration bands at 2961 and 2727 cm-1 were due
to CH stretching of CH2 and CH3, respectively. In the spectra of triblock copolymers,

147
all of these typical bands of PLA prepolymer and HTNR were detected, suggesting
the presence of two component blocks in the triblock copolymer. It can be observed
that there was no difference in the FTIR results between “PLA1-NR” diblock and
“PLA1-NR-PLA1” triblock copolymer, both spectra showed similar characteristics.
Figure 4.34 FTIR spectra of PLA, HTNR and triblock copolymer.
GPC analyses were carried out. Table 4.28 summarizes the molecular
weight and molecular weight distribution of “PLA1-NR-PLA1” triblock copolymers
with different mole ratios. The lactide was in situ polymerized during block
copolymerization and the molecular weight of PLA prepolymer can be determined
from the molecular weight of the triblock copolymer subtracted with that of HTNR.
By using a constant molecular weight of HTNR (7000 g/mol), molecular weight of
PLA prepolymer seemed to increase with an increasing mole ratio of lactide/HTNR
(or lactide content), as observed from the higher molecular weight of triblock
copolymer. As the mole ratio of lactide/HTNR changed from 2/1 to 10/1, Mn and PDI
of “PLA1-NR-PLA1” triblock copolymer changed from 10900 g/mol to 13200 g/mol
and from 2.11 to 2.65, respectively. Figure 4.35 shows the GPC traces of PLA
prepolymer, HTNR and “P20N70P20” triblock copolymer before and after purification.
The molecular weight distribution of “PLA1-NR-PLA1” shifted to higher molecular
40080012001600200024002800320036004000
Tra
nsm
itta
nce
(%
)
Wavenumber (cm-1)
(a) HTNR
(b) PLA
(c) "PLA1-NR-PLA1"
1760
C=O stretchig
1662C=C stretchig
1764
C=O stretchig
1664
C=C stretchig
2961-2727CH2, CH3 stretchig
2999-2952C-H stretchig
3352O-H stretchig
3526O-H stretchig
836
C=CH bending
837
C=CH bending
1348, 1275, 1198
C-O-C stretchig
1348, 1275, 1198
C-O-C stretchig

148
weight, indicating the absence of un-reacted and low molecular weight homopolymers
precursors.
Table 4.28 The molecular weight of “PLA1-NR-PLA1” triblock copolymers after
purification.
Samples Lactide/NR
(mole ratio)
Mn HTNR
(g/mol)
Mn PLA1-NR-PLA1
(g/mol)
Mw PLA1-NR-PLA1
(g/mol) PDI
P20N70 P 20 2/1 7000 10900 23000 2.11
P 22N70 P 22 4/1 7000 11400 27700 2.44
P29N70P29 6/1 7000 12900 30700 2.58
P 30N70 P 30 8/1 7000 13000 34500 2.65
P 31N70 P 31 10/1 7000 13200 33900 2.57
Figure 4.35 GPC chromatograms of HTNR70 and P22N70P22.
Concerning the thermal properties, Table 4.29 and Figure 4.36 present
the thermal degradation temperature (Td) and TGA thermograms of “PLA1-NR-
PLA1” triblock copolymers with the different mole ratios of lactide and HTNR
oligomer, respectively. It was found that the thermal stability of triblock copolymers
increased with an increasing of the molecular weight of block copolymer. This can
prove that the molecular weight has an effect on the thermal behavior of the
copolymers. Figure 4.36a-c present TGA thermograms of HTNR65, P20N70P20 and
0
5
10
15
20
25
30
8 10 12 14 16 18 20
Res
pon
se (
mV
)
Retention time (min)
HTNR70
P22N70P22-B
P22N70P22-A

149
P31N70P31, respectively. The HTNR65 oligomer showed two stages of degradation at
368 and 415C. All “PLA1-NR-PLA1” triblock copolymers showed two steps of
thermal degradation; the first step was in the range of 235C to 256C attributed to the
PLA segment (Td1) and the second observed degradation was referred to HTNR
segment (Td2 and Td3), which was in two ranges of 339-400C and 404-408C.
Table 4.29 Thermal properties of “PLA1-NR-PLA1” triblock copolymers
Sample Thermal degradation temperature (C)
Td1 Td2 Td3 P20N70P20 227 339 403
P22N70P22 237 340 404
P29N70P29 249 340 408
P30N70P30 251 338 405
P31N70P31 256 337 407
Figure 4.36 TGA thermograms of: (a) HTNR70, (b) P31N70P31, (c) “PLA1-NR-PLA1”
triblock copolymers.
-0.2
0
0.2
0.4
0.6
0.8
1
1.2
1.4
0
10
20
30
40
50
60
70
80
90
100
0 100 200 300 400 500 600
Der
iv. W
eig
ht (%
/C)
Wei
gh
t (%
)
Temperature (C)
415.21C
368.02C (a)
0
0.5
1
1.5
2
2.5
0
20
40
60
80
100
0 100 200 300 400 500 600
Der
iv. W
eigh
t (%
/C)
Wei
gh
t (%
)
Temperature (C)
336.84C
256.30C
406.90C
(b)
0
20
40
60
80
100
0 100 200 300 400 500 600
Wei
gh
t (%
)
Temperature (C)
P30N70P30
P31N70P31
P29N70P29
P22N70P22
P20N70P20

150
4.3 Synthesis and characterization of di- and tri-block copolymers from
HTNR and lactic acid
4.3.1 Synthesis of PLA prepolymer
It is known that PLA can be prepared by both direct condensation of
lactic acid and by the ring opening polymerization of the cyclic lactide dimer. Figure
4.37 shows the polymerization routes to obtain PLA. In the present study, PLA
prepolymer was polymerized directly from L-lactic acid monomer. Since L-lactic acid
has both OH and COOH groups, necessary for polymerization, the reaction can take
place directly by self-condensation. It has been well established that there are two
reactions occurring during condensation polymerization of L-lactic acid: esterification
and depolymerization, as shown in Figure 4.38a and Figure 4.38b, respectively.
Typically, the polycondensation of lactic acid is carried out at high temperature and
high vacuum, but the evaporation of lactide could induce more depolymerization [34-
36].
Figure 4.37 Polymerization routes to poly(lactic acid) [37].
(a)
(b)
Figure 4.38 Schematic diagram of: (a) polycondensation of poly(lactic acid) and (b)
depolymerization of poly(lactic acid) [33].

151
1H-NMR spectra of PLA prepolymer before and after purification are
shown in Figure 4.39 and the chemical shifts are listed in Table 4.30. The obtained
PLA prepolymer contained also lactide in the final product, indicating the occurring
of the depolymerization. The 1H-NMR spectrum of PLA prepolymer before
purification (Figure 4.39a) showed methine proton (CH) in the ring and methyl
proton (CH3) of lactide unit at 4.9 ppm (Ha) and 1.6 ppm (H6), respectively [36].
After purification both peaks disappeared. The peaks at 5.2 ppm (H3) were due to the
methine proton (CH) in the main chain of the PLA prepolymer, and the signals due
to methine proton (CH) adjacent to OH end group appeared at 4.4 ppm (H2). The
methyl proton (CH3) was observed at 1.5 ppm (H4).
Table 4.30 The assignments and chemical shifts of PLA prepolymer [34-36]
Assignments The chemical shift (ppm)
CH (repeating unit) 5.2 (H3)
CH (end group) 4.4 (H2)
CH3 (repeating unit) 1.5 (H4)
CH3 (end group) 1.2 (H1)
Figure 4.39 1H-NMR spectra of PLA prepolymer: (a) before and (b) after
purification.

152
The molecular weight analysis from GPC of the PLA prepolymer
synthesized at different polymerization time and temperature and, type of monomer
(lactic acid and lactide) are given in Table 4.31. It was found that the number average
molecular weight (Mn) of the PLA increased significantly with increasing the
polymerization time; at 180C, the Mn changed from 3490 to 7500 g/mol reacting for
24 h instead of 8 h. This was a general behavior in all condensation polymerization.
The Mn of prepolymer for 8 to 24 h at 110-220C of polymerization temperature was
from 5320 to 19830 g/mol. Lactide and lactic acid were polymerized at 110C for 24
h and the molecular weight of PLA prepolymer was 3820 and 5320 g/mol,
respectively. The color of obtained PLA ranged from colorless to dark brown color,
depending on experimental conditions. In the direct condensation polymerization of
PLA, for a temperature higher than 200C, the obtained PLA prepolymers become
dark brown solids because a severe oxidation occurred. Kaitian et al. [36] reported
that this direct polycondensation procedure was not possible to utilize temperature
higher than 200C. The obtained PLA prepolymers at 110-180C were colorless
solids and at 200C were yellowish solids. This yellowish was due to the oxidation
was taken place.
Table 4.31 The molecular weight of synthesized PLA from GPC analysis
Sample Monomer Reaction Yield
(%) MW (g/mol)
PDI Temp. (C) Time (h) Mn Mw
PLA-1 Lactide 110 8 88 680 1010 1.48 PLA-2 Lactide 110 24 80 3820 12800 3.35 PLA-3 Lactic acid 110 24 73 5320 6930 1.30
PLA-4 Lactic acid 180 8 65 3490 6050 1.73
PLA-5 Lactic acid 180 16 70 6030 9210 1.52
PLA-6 Lactic acid 180 24 65 7500 11350 1.52
PLA-7 Lactic acid 200 8 72 1490 2450 1.64
PLA-8 Lactic acid 200 16 65 5770 10800 1.87
PLA-9 Lactic acid 200 24 70 9020 13230 1.46
PLA-10 Lactic acid 220 24 82 12540 20300 1.61
PLA-11 Lactic acid 220 24 70 19830 31590 1.59

153
4.3.2 Synthesis and characterization of “PLA2-NR” diblock copolymers
The second strategy adopted to obtain the so-called “PLA2-NR”
copolymers was to react PLA prepolymer with HTNR oligomer. 1H-NMR spectrum
of “PLA2-NR” diblock copolymers after purification are illustrated in Figure 4.40.
The main characteristic chemical shifts of HTNR were at 5.2 and 1.6 ppm which were
assigned to C=CH (H3) and CH3 (H12), respectively. The characteristic peaks of
PLA were at 4.4 ppm (H13) and 1.5 ppm (H11), and those of HTNR at 1.6 ppm (H1)
and 3.8 ppm (H9). The new ester linkage between the OH group of HTNR and COOH
group of PLA formed during the condensation reaction. The methylene proton
(C=OOCH2) of the new peak was at 4.1 ppm (H6) similar to the “PLA1-NR”
diblock copolymers. The formation of diblocks was verified by the appearance of
methine proton (CHOH) at 3.8 ppm (H9), which indicated that only one chain end of
HTNR had reacted with the COOH group in PLA.
Figure 4.40 1H-NMR spectrum of “PLA2-NR” diblock copolymers.
Figure 4.41 reports FTIR spectra of HTNR, PLA and “PLA2-NR”
diblock copolymers. FTIR spectrum of the “PLA2-NR” diblock copolymers shows all
the same peaks of the “PLA1-NR” diblock copolymers. No new peak appeared and
the main characteristics were similar to those of HTNR and PLA, for example, the

154
bands at 1663 and 836 cm-1 were attributed to the C=CH stretching and bending of
NR and the band at 1760 cm-1 belonged to C=O stretching of ester group in the PLA
segment.
Figure 4.41 FTIR spectra of HTNR, PLA, “PLA2-NR” triblock copolymers.
The conditions for the synthesis of diblock copolymers by using
“PLA2-NR” procedure are reported in Table 4.32. The PLA/HTNR ratios were 2/1,
1/1 and 1/2. The Mn of PLA prepolymer with 5300 and 5800 g/mol and that of HTNR
with 3200, 6500 and 15000 g/mol were used. Table 4.33 summarizes the molecular
weight and PDI of “PLA2-NR” diblock copolymers. It was found that Mn of “PLA2-
NR” block copolymers determined from GPC matched well with the value calculated
from Mn of HTNR and PLA prepolymer precursors (Mn-cal). The reaction time had no
effect on the molecular weight of diblock copolymer. The PDI of all copolymers was
around 1.27-2.93. When the higher molecular weight of HTNR was used the PDI of
copolymer was higher than the lower molecular weight. P80N150 and P98N150 showed
higher Mn than calculated Mn. It is possible that a multiblock copolymer was
obtained. It was comfirmed that PLA and NR were diblock copolymers considering
that their molecular weight corresponded to the sum of the Mn of the starting
materials.
40080012001600200024002800320036004000
Tra
nsm
itta
nce
(%
)
Wavenumber (cm-1)
(a) HTNR
(b) PLA
(c) "PLA2-NR"
1760
C=O stretchig
1662
C=C stretchig
1764
C=O stretchig
1663
C=C stretchig
2961-2727CH2, CH3 stretchig
2999-2952C-H stretchig
3526O-H stretchig
3352O-H stretchig
837
C=CH bending
836
C=CH bending
1348, 1275, 1198
C-O-C stretchig

155
Table 4.32 The conditions for synthesis of “PLA2-NR” diblock copolymers
Sample PLA/HTNR
(mole ratio)
Reaction time
(h)
Mn (g/mol)
PLA prepolymer HTNR
P56N32 2/1 24 5300 3200
P57N32 2/1 48 5300 3200
P50N32 1/1 24 5300 3200
P52N32 1/2 24 5300 3200
P55N32 1/2 48 5300 3200
P58N32 2/1 24 5800 3200
P57N65 2/1 24 5800 6500
P80N150 2/1 24 5800 15000
P98N150 2/1 48 5800 15000
P58N150 1/1 24 5800 15000
Table 4.33 The molecular weight of “PLA2-NR” diblock copolymers after
purification
Sample Mn (g/mol) Mw (g/mol) PDI Mn-cal* (g/mol)
P56N32 8800 11300 1.30 8500
P57N32 8900 11300 1.27 8500
P50N32 8200 12100 1.47 8500
P52N32 8400 8300 1.46 8500
P55N32 8700 9247 1.48 8500
P58N32 9000 14900 1.51 9000
P57N65 11300 30613 2.53 12300
P80N150 23000 62790 2.73 20800
P98N150 24800 72450 2.92 20800
P58N150 20800 45300 2.03 20800
* Sum of Mn of both precursors (PLA prepolymer and HTNR)
The GPC chromatograms of the PLA58, HTNR32 and P58N32 diblock
copolymer of before and after purification are shown in Figure 4.42. Mn of P58N32-B
(before purification) and that of P58N32-A (after purification) was 7500 and 9000

156
g/mol, respectively. Purification was carried out in order to eliminate free lactide.
Uni-modal curve is seen in the P58N32-A sample, which indicated that high purify of
the block copolymer was obtained. Noticeably, the P58N32-B curve showed a similar
shape to the HTNR and PLA curve. A fairly narrow PDI was clearly observed (1.51)
after removal of free lactide and very short chains, decreasing from the value 1.72 of
the non-purified sample. Thus, it was proved that un-reacted and low molecular
weight of homopolymer precursor was completely removed.
Figure 4.42 GPC chromatograms of PLA58, HTNR32 and P58N32 copolymer.
DSC results of “PLA2-NR” diblock copolymer samples exhibited two
values of Tgs; the first Tg was at lower temperature in the range of -59C to -62C and
the second one at higher temperature, ranged from 30C to 50C according to the
HTNR and PLA segments, respectively (Figure 4.43 and Table 4.34). The Tg of the
second heating scan was significantly decreased from the first heating scan. This can
be explained by thermal degradation of PLA segment during the first heating scan that
induces PLA to become amorphous and by the imperfect crystallization during the
cooling and the second heating. It was noticed that this behavior was the same in
every sample.
Concerning the difference between PLA53 and PLA58 (Figure 4.43a-b),
PLA53 behaved as an amorphous polymer showing only one Tg at 38C (the second
heating scan), while PLA58 revealed the cold crystalline temperature (Tcc) at 103.82C
0
5
10
15
20
10 12 14 16 18 20
Res
po
nse
(m
V)
Retention Time (min)
P58N32-A
HTNR32
P58N32-BPLA58

157
Table 4.34 Thermal properties and thermal stability of “PLA2-NR” diblock
copolymers
Sample
Transition temperature (C) Thermal degradation
temperature (C) 1st heating Cooling 2nd heating
Tg1 Tg2 Tm Tg1 Tg2 Tg1 Tg2 Td1 Td2
HTNR150 -62.4 - - 60.8 - -62.4 -
PLA53 33.6 - - 27.0 - 38.0 - 264 -
*PLA58 36.4 - * 37.3 - 37.0 * 344 -
P56N32 -59.8 48.9 137.5 -59.6 13.7 -60.0 40.3 241 370
P57N32 -58.7 48.2 150.6 -58.6 23.3 -59.4 31.4 244 371
P50N32 -59.5 45.4 173.4 -58.8 36.9 -59.3 43.5 242 369
P52N32 -60.0 62.7 172.6 -60.5 23.1 -60.0 32.1 232 371
P55N32 -59.0 56.1 172.0 -58.7 29.0 -59.0 32.4 231 370
**P58N32 -61.2 44.3 ** -61.1 46.6 -61.0 48.7 287 374
P58N65 -61.7 43.3 136.01 -61.2 32.4 -61.3 40.30 261 376
P80N150 -62.3 45.2 179.9 -63.9 24.5 -62.4 40.0 258 373
P98N150 -61.3 50.2 177.9 -62.8 30.3 -61.6 38.9 261 372
P58N150 -62.5 55.3 136.4 -62.0 43.5 -62.3 48.2 260 376
*: PLA58 (the first heating scan): Tcc1, Tm1 and Xm1 were 92.9C, 119.3 and 136.5C,
and 16.3%, respectively. (the second heating scan): Tcc2, Tm2 and Xm2 were
103.9C, 122.8 and 134.1C, and 13.7%, respectively
**: P58N32 (the first heating scan): Tm1 and Xm1 were 131.0 and 141.9C and 23.2%,
respectively. (the second heating scan): Tcc2, Tm2 and Xm2 were 112.8C, 135.5 and
143.2C, and 13.6%, respectively
and double melting temperature (Tm) at 122.8 and 134.1C, which indicated that
PLA58 was a semi-crystalline polymer. The DSC curves of HTNR from the second
heating scan (Figure 4.43c) showed Tg at -60.6, -60.7 and -62.4C for HTNR32,
HTNR65 and HTNR150, respectively. Figure 4.44a illustrates the DSC curves of the
P58N150: it showed Tm at 136.4C in the first heating scan and the disappearance of Tm
in the second heating scan was observed because the crystallization of PLA was

158
obstructed by the long chains of HTNR blocks as happened in the P58N65, P80N150 and
P98N150 samples. In contrast, The P58N32 copolymer shown in Figure 4.44b displayed
Tm in both the first and second heating scan because the lower molecular weight of
HTNR segment had no effect on crystallization of PLA. Figure 4.44c and Figure
4.44d show only the second heating scan of “PLA2-NR” diblock copolymers
synthesized from PLA58 and PLA53 prepolymer as a precursor with different
molecular weights of HTNR segment, respectively. Table 4.34 summarizes the
thermal properties from DSC examination from the first heating, cooling and the
second heating scan of “PLA2-NR” diblock copolymers. It can be concluded that the
thermal behavior of block copolymers depended on the relative segment size of each
component such as short segment of PLA in block copolymer led to amorphous
materials and increased segment sizes led to the formation of semi-crystalline
materials.
Figure 4.43 DSC thermograms: (a) PLA58, (b) PLA53 and (c) the second heating scan
of HTNR32, HTNR65 and HTNR150.
-80 -60 -40 -20 0 20 40 60 80 100 120 140 160 180 200
Hea
t F
low
Exo U
p (
W/g
)
Temperature (C)
36.40C
37.01C
37.26C
1st Heating
2nd Heating
Cooling
92.87C
119.32C136.45C
122.83C134.08C
103.82C
(a)
-80 -60 -40 -20 0 20 40 60 80 100 120 140 160 180 200
Hea
t F
low
Exo U
p (
W/g
)
Temperature (C)
33.36C
27.00C
1st Heating
2nd Heating
Cooling
38.03C
(b)
-80 -60 -40 -20 0 20 40 60 80 100 120 140 160 180 200
Hea
t F
low
Exo U
p (
W/g
)
Temperature (C)
HTNR32
-60.59C
HTNR65
HTNR150
-60.69C
-62.38C
(c)

159
Figure 4.44 DSC thermograms: (a) P58N150, (b) P58N32, (c) PLA53 and (d) PLA58 as
precursors of diblock copolymers.
The thermal stability of the “PLA2-NR” diblock copolymers was
evaluated using TGA. Thermogravimetry measurement was used to investigate the
influence of structure on the thermal behavior of materials from block copolymer with
different lengths of segments. Table 4.34 shows the thermal degradation temperature
(Td1 and Td2) of homopolymers and “PLA2-NR” diblock copolymers. Interestingly,
the degradation behavior of homopolymers, PLA and HTNR exhibited one step in the
courseof measurement. The thermal degradation temperature of PLA58 homopolymer
(Figure 4.45a) was observed at 344C and that of PLA53 was 264C. The thermal
stability of the PLA precursors depended on their molecular weight. The thermal
degradation temperature of HTNR32, HTNR65 exhibited one step at 426C and 424C,
respectively; and HTNR150 provided two steps of degradation at 370C and 426C
(Figure 4.45b). This could be due to the PDI of HTNR150 that was relatively high
(2.88), indicating various size chains of HTNR molecules. Figure 4.45c and Figure
4.45d shows weight loss and derivative thermalgravimetry (DTG) of P58N32 and
P58N150 diblock copolymer samples, respectively. The thermal degradation behavior
-80 -60 -40 -20 0 20 40 60 80 100 120 140 160 180 200
Hea
t F
low
Exo U
p (
W/g
)
Temperature (C)
-62.47C
-63.34C
-62.00C
1st Heating
2nd Heating
Cooling
43.52C
48.17C
55.26C136.43C
(a)
-80 -60 -40 -20 0 20 40 60 80 100 120 140 160 180 200
Hea
t F
low
Exo U
p (
W/g
)
Temperature (C)
-61.17C
-61.04C
-61.06C
1st Heating
2nd Heating
Cooling
44.31C
141.95C48.70C
46.63C
131.00C
143.20C
112.78C
135.54C
(b)
-80 -60 -40 -20 0 20 40 60 80 100 120 140 160 180 200
Hea
t F
low
Exo U
p (
W/g
)
Temperature (C)
-60.59C
32.09C-59.34C
HTNR32
38.00C PLA53
-60.03C
-60.00C43.46C
40.27C
P52N32
P56N32
P50N32
(c)
-80 -60 -40 -20 0 20 40 60 80 100 120 140 160 180 200
Hea
t F
low
Exo U
p (
W/g
)
Temperature (C)
-60.00C
40.33C
48.70-61.33C
143.20C
135.54C
112.78C40.27C
-61.04C
-62.35C40.04C
P80N150
P57N65
P58N32
P55N32
(d)

160
of all “PLA2-NR” block copolymers showed two phases consisting of degradation
(Td1 and Td2), similarly to that of “PLA1- NR” diblock copolymer. It was explained
that the first degradation step was due to PLA blocks (Td1) and the second step was
HTNR blocks (Td2) degradation. The thermal degradation temperature at the first step
(Td1) of P58N32 and P58N150 was presented at 260C and 287C, respectively. This was
suggested that the thermal stability (Td1) of block copolymer depended on the
molecular weight of NR segment. The thermal degradation temperature in the second
step of block copolymers (Td2) was shifted to lower temperature as compared to
HTNR precursor, which could mean that the thermal stability decreased because of
the incorporation of PLA segment to HTNR segments in block copolymer. It was
observed that the thermal degradation temperature of HTNR was higher that of PLA
prepolymer, which prove that the HTNR segment was is more thermally resistant than
PLA segment due to the intrinsic properties in both PLA and NR.
Figure 4.45 TGA thermograms: (a) PLA58, (b) HTNR150, (c) P58N32 and (d) P58N150.
-0.2
0
0.2
0.4
0.6
0.8
1
1.2
1.4
1.6
1.8
2
0
10
20
30
40
50
60
70
80
90
100
Der
iv. W
eig
ht
(%/C
)
Wei
gh
t (%
)
Temperature (C)
344.35C (a)
-0.2
0
0.2
0.4
0.6
0.8
1
1.2
1.4
0
10
20
30
40
50
60
70
80
90
100
D
eriv
. W
eig
ht
(%/C
)
Wei
gh
t (%
)
Temperature (C)
369.87C
425.79C
(b)
-0.2
0
0.2
0.4
0.6
0.8
1
1.2
1.4
0
10
20
30
40
50
60
70
80
90
100
Der
iv. W
eigh
t (%
/C)
Wei
gh
t (%
)
Temperature (C)
259.75C
376.37C (c)
-0.2
0
0.2
0.4
0.6
0.8
1
1.2
0
10
20
30
40
50
60
70
80
90
100
Der
iv. W
eigh
t (%
/C)
Wei
gh
t (%
)
Temperature (C)
374.39C286.60C
(d)

161
4.3.3 Synthesis and characterization of “PLA2-NR-PLA2” triblock
copolymers
This is another method for the synthesis of PLA-NR-PLA triblock
copolymers. In this procedure PLA was polymerized to obtain prepolymer, then PLA
prepolymer was reacted with HTNR oligomer to generate “PLA2-NR-PLA2” triblock
copolymers.
The 1H-NMR spectrum of “PLA2-NR-PLA2” triblock copolymers is
shown in Figure 4.46. The chemical assignments from the 1H-NMR analysis of this
triblock copolymer corresponded to the spectrum of the “PLA1-NR-PLA1” triblock
copolymer (see Table 4.33). The new two ester linkages were obtained at 4.8 and 4.1
ppm corresponding to COOCH2 (H6) and –CHOCO (H9) from COOH group of
PLA and OH group in HTNR. The main characteristic peaks of PLA and HTNR were
at 5.1 ppm, which were assigned to CH (H12) and C=CH (H3), respectively.
FTIR spectra of HTNR, PLA and “PLA2-NR-PLA2” triblock
copolymer were done (Figure 4.47). Block copolymers showed the same spectrum of
the “PLA1-NR-PLA1” triblock copolymer. No new peak was observed and the main
peaks of HTNR and PLA spectrum were present.
Figure 4.46 1H-NMR spectrum of “PLA2-NR-PLA2” triblock copolymer.

162
Figure 4.47 FTIR spectra of PLA, HTNR and triblock copolymers.
In this study, PLA prepolymers with 1900, 3500, 5800, 6000 and 7500
g/mol; HTNR oligomers with 6500, 12000 and 15000 g/mol, and PLA/HTNR mole
ratio of 2/1 (reaction time 24 and 48 h) were selected in order to synthesize triblock
copolymers. The GPC study confirmed the 1H-NMR analysis, with HTNR as mid-
block and PLA as an end blocks. Table 4.35 summarizes the molecular weight
characteristics of various “PLA2-NR-PLA2” triblock copolymers. GPC analysis
revealed the broad distribution from 2.49 to 3.62. Some of the triblock copolymers
such as P30N65P30, P69N150P69 and P83N150P83 provided a higher Mn than the calculated
Mn. This was possibly due to the formation of multiblocks of HTNR and PLA.
In this case also the purification step was necessary; the retention time
of triblock copolymers after purification was clearly shifted to higher molecular
weight (Figure 4.48 GPC curves of HTNR150, PLA58 and P60N150P60 triblock
copolymer). The Mn before purification was 23700 g/mol and increased to 26900
g/mol after purification. The PDI before and after purification of was 3.28 and 2.98,
respectively.
40080012001600200024002800320036004000
Tra
nsm
itta
nce
(%
)
Wavenumber (cm-1)
(a) HTNR
(b) PLA
(c) "PLA2-NR-PLA2"
1760
C=O stretchig
1662
C=C stretchig
1764
C=O stretchig
1664
C=C stretchig
2961-2727CH2, CH3 stretchig
2999-2952C-H stretchig
3352O-H stretchig
3526O-H stretchig
836
C=CH bending
837
C=CH bending
1348, 1275, 1198
C-O-C stretchig

163
Table 4.35 The molecular weight of “PLA2-NR-PLA2” triblock copolymers after purification
Sample* Reaction
time (h)
Mn of precursor (g/mol) Triblock copolymer
Pre PLA HTNR Mn
(g/mol) Mw
(g/mol) PDI
Mn-cal** (g/mol)
P30N65P30 24 1900 6500 12400 33980 2.74 10300
P35N65P35 24 3500 6500 13400 34120 2.74 13500
P37N65P37 24 3500 6500 13800 34700 2.71 13500
P33N65P33 48 3500 6500 13000 34710 2.87 13500
P36N150P36 24 3500 15000 22100 53890 2.56 22000
P35N150P35 48 3500 15000 21900 58470 2.67 22000
P60N150P60 24 5800 15000 26900 80160 2.98 26600
P69N150P69 24 5800 15000 28800 111400 3.87 26600
P64N150P64 48 5800 15000 27900 101010 3.62 26600
P83N150P83 24 7500 15000 31700 81950 2.58 30000
P75N150P75 48 7500 15000 30100 75040 2.49 30000
P75N120P75 24 7500 12000 27000 77760 2.88 27000
P76N120P62 48 7500 12000 27200 72870 2.66 27000
*: mole ratio of PLA/HTNR = 2:1 **: (2 Mn-prePLA) + Mn-HTNR
Figure 4.48 GPC chromatograms of PLA53, HTNR150 and P60N150P60.
0
2
4
6
8
10
12
14
16
18
20
8 10 12 14 16 18 20
Res
po
nse
(m
V)
Retention time (min)
HTNR150
PLA58
P60N150P60 -A
P60N150P60-B

164
Thermal properties of the diblock copolymers were summarized in
Table 4.36-4.37. DSC thermograms of PLA35, PLA75, and P60N150P60 and P83N150P83
triblock copolymers are shown in Figure 4.49a-d, respectively. It was noticed that the
observed transition peak at 65C in Figure 4.49c-d was from the contaminant in a
DSC instrument, it did not relate to the block copolymer sample. Tcc of PLA35 (Figure
4.49a) showed in the first heating scan at 87.4C and disappeared in the second
heating scan. The disappearance of Tcc in PLA was due to thermal degradation during
the first heating scan, which was attributed to PLA35 is amorphous polymer. PLA75
(Figure 4.49b) was a semi-crystalline polymer, which showed Tcc and Tm in both
heating scans. The double melting peak was observed in both heating scans as well.
P60N150P60 triblock copolymer (Figure 4.49c) showed Tcc and Tm at the first heating
scan but all of these peaks disappeared in the second heating scan.
Table 4.36 Thermal properties of “PLA2-NR-PLA2” triblock copolymers at the 1st
heating and cooling scan
Sample
Transition temperature (C)
1st heating Cooling
Tg1 Tg2 Tcc Tm Xm (%) Tg1 Tg2
P30N65P30 -62.1 44.2 - - - -64.1 10.3
P35N65P35 -61.6 30.8 - - - -51.3 8.60
P37N65P37 -58.7 52.0 - - - -57.4 6.97
P33N65P33 -58.9 39.2 - - - -56.5 2.03
P36N150P36 -61.3 41.6 89.9 125.6, 135.1 1.6 -61.9 34.1
P35N150P35 -60.1 36.4 - - -61.0 13.0
P60N150P60 -61.5 51.0 - 111.8 4.3 -63.1 17.7
P69N150P69 -61.8 42.9 - 142.9 1.1 -52.3 36.9
P64N150P64 -62.4 35.8 - - - -52.1 42.9
P83N150P83 -61.8 37.5 - 141.0 7.4 -59.4 32.7
P75N150P75 -61.2 43.3 - 140.1 3.8 -62.1 44.3
P75N120P75 -61.5 55.5 - 84.4, 142.7 6.6 -63.0 44.7
P75N120P75 -61.3 25.7 - 85.8, 142.8 3.8 -63.0 43.7

165
This behavior was observed in the triblock copolymer prepared from 3500 g/mol of
PLA prepolymer. P83N150P83 block copolymer (Figure 4.49d) had Tm only in the first
heating scan and it did not show in the second heating scan. This was possibly due to
the thermal degradation of PLA during the first heating scan and the long HTNR
chain attached to the PLA chain could obstruct crystallization of PLA. For Triblock
copolymers two values of Tg (Tg1 and Tg2) appeared (Figure 4.50, and Table 4.36 and
Table 4.37). Tg1 were in the range of -59C to -62C: the lower Tg can be attributed to
all NR segments and the higher Tg (Tg2) resulted from PLA segment (7 to 52C). The
two values of Tg observed of the copolymers further confirmed the block structures.
Table 4.37 Thermal properties of “PLA2-NR-PLA2” triblock copolymers at the 2nd
heating scan
Sample Transition temperature (C) Thermal degradation
temperature (C) 2nd heating
Tg1 Tg2 Td1 Td2
P30N65P30 -61.9 27.9 282 376
P35N65P35 -60.0 12.3 276 376
P37N65P37 -58.6 5.30 267 375
P33N65P33 -59.0 7.30 278 375
P36N150P36 -61.9 38.4 266 376
P35N150P35 -61.2 37.9 272 375
P60N150P60 -61.6 24.2 258 376
P69N150P69 -61.6 38.8 259 375
P64N150P64 -62.1 34.8 266 375
P83N150P83 -61.58 38.90 270 377
P75N150P75 -61.49 40.40 266 377
P75N120P75 -61.34 49.95 261 378
P75N120P75 -61.81 49.48 262 379

166
Figure 4.49 DSC thermograms: (a) PLA35, (b) PLA75 (c) P36N150P36 and (d)
P83N150P83.
Figure 4.50 DSC thermograms of “PLA2-NR-PLA2” triblock copolymers with
HTNR150 as a precursor (65C is the contaminant in the instrument).
-80 -60 -40 -20 0 20 40 60 80 100 120 140 160 180 200
Hea
t F
low
Exo U
p (
W/g
)
Temperature (C)
23.76C
36.55C
35.65C
1st Heating
2nd Heating
Cooling
87.42C
125.06C
(a)
-80 -60 -40 -20 0 20 40 60 80 100 120 140 160 180 200
Hea
t F
low
Exo U
p (
W/g
)
Temperature (C)
35.56C
37.75C
1st Heating
2nd Heating
Cooling
40.24C
104.01C
141.40C
95.78C
142.92C
125.85C
(b)
-80 -60 -40 -20 0 20 40 60 80 100 120 140 160 180 200
Hea
t F
low
Exo U
p (
W/g
)
Temperature (C)
-61.30C
-61.92C
-61.87C
1st Heating
2nd Heating
Cooling
125.55C
41.57C
34.05C
38.43C
86.92C
135.10C
(c)
-80 -60 -40 -20 0 20 40 60 80 100 120 140 160 180 200
Hea
t F
low
Exo U
p (
W/g
)
Temperature (C)
-61.82C
-61.58C38.90C
32.71C-59.42C
1st Heating
2nd Heating
Cooling
140.97C37.47C
(d)
-80 -60 -40 -20 0 20 40 60 80 100 120 140 160 180 200
Hea
t F
low
Ex
o U
p (
W/g
)
Temperature (C)
-61.92C
-61.56C
-62.24C
P36N150P36
24.17C
37.91C
38.43CP35N150P35
P69N150P69
P60N150P60
38.77C-61.65C P64N150P64
34.83C-62.07C P83N150P83
40.40C-61.49C
-61.58C38.90C
P75N150P75

167
The onset of thermal degradation for each sample occurred above
200C and continued until 380C. Thermal stability of PLA with 1900, 3500, 5800,
6000 and 7500 g/mol showed one stage of thermal degradation, at 264, 288, 344, 323
and 329C, respectively. Thermal degradation temperature of HTNR oligomers with
6500, 12000 and15000 g/mol was 424, 422, and 370 and 426C, respectively. Figure
4.51a and Figure4.51b show the TGA curves of PLA35 and PLA75, respectively,
which were representative of the thermal stability of PLA prepolymer sample. The
thermal stability of PLA depended on the molecular weight and intrinsic properties
such as degree of crystallinity. P36N150P36 and P83N150P83 were substitute for all
triblock copolymers which were displayed in Figure 4.51c and Figure 4.51d,
respectively. Figure 4.52 displays the TGA curves of the “PLA2-NR-PLA2” triblock
copolymers having HTNR150 as a precursor. Table 4.37 summarizes the thermal
degradation temperature of “PLA2-NR-PLA2” triblock copolymers. All the triblock
copolymers degraded in two steps.
Figure 4.51 TGA thermograms of (a) PLA35, (b) PLA75, (c) P36N150P36 and (d)
P83N150P83.
-0.5
0
0.5
1
1.5
2
2.5
0
10
20
30
40
50
60
70
80
90
100
0 100 200 300 400 500 600
Der
iv. W
eigh
t (%
/C)
Wei
gh
t (%
)
Temperature (C)
287.47C (a)
-0.2
0
0.2
0.4
0.6
0.8
1
1.2
1.4
1.6
0
10
20
30
40
50
60
70
80
90
100
0 100 200 300 400 500 600
Der
iv. W
eigh
t (%
/C)
Wei
gh
t (%
)
Temperature (C)
328.37C(b)
-0.2
0
0.2
0.4
0.6
0.8
1
1.2
1.4
0
10
20
30
40
50
60
70
80
90
100
0 100 200 300 400 500 600
Der
iv. W
eigh
t (%
/C)
Wei
gh
t (%
)
Temperature (C)
266.46C
375.59C (c)
-0.2
0
0.2
0.4
0.6
0.8
1
1.2
1.4
0
10
20
30
40
50
60
70
80
90
100
0 100 200 300 400 500 600
Der
iv. W
eigh
t (%
/C
Wei
gh
t (%
)
Temperature (C)
269.68C
376.88C (d)

168
Figure 4.52 TGA thermograms of the “PLA2-NR-PLA2” triblock copolymers with
HTNR150 as a precursor.
4.4 Mechanical properties and characteristics of PLA/NR/block copolymers
blends
4.4.1 Polymer blends containing 10 wt% rubber
The block copolymers used in this section were “PLA2-NR” diblock
and “PLA2-NR-PLA2” triblock copolymers, and polymer blends contained 90 wt% of
PLA and 10 wt% of rubber including NR, “PLA2-NR” diblock and “PLA2-NR-PLA2”
triblock copolymers. Rubber ratios of NR:block copolymer varied, i.e., 1:0, 0.5:0.5,
0.25:0.75 and 0:1. The effect of different molecular weights of precursors including
HTNR oligomer and PLA prepolymer of diblock and triblock copolymer on the
mechanical properties of the blends was investigated. Table 4.38 displays molecular
weight of the diblock and tribock copolymers used in this section.

169
Table 4.38 The molecular weight of “PLA2-NR” and “PLA2-NR-PLA2” block
copolymers.
Block
copolymer*
Mn of precursor (g/mol) Block copolymer
Pre PLA HTNR Mn
(g/mol)
Mn
(g/mol) PDI
Mn-cal
(g/mol)
P60N120 6000 12000 19350 50700 2.62 18000
P35N150 3500 15000 17560 41270 2.35 18500
P58N150 5800 15000 21030 44790 2.13 20800
P60N200 6000 20000 24083 63819 2.65 26000
P60N120 P60 6000 12000 22190 56590 2.55 24000
P35N150 P35 3500 15000 21320 47589 2.23 22000
P58N150 P58 5800 15000 27500 97350 3.54 26600
P60N200 P60 6000 20000 31664 92459 2.92 32000
*: mole ratio of PLA:HTNR = 2:1 and reaction time = 24 h
4.4.1.1 Effect of PLA-NR diblock copolymer
This section describes the polymer blends consisting of 10 wt% rubber
including NR and PLA-NR diblock copolymer. Two types of blends were prepared: a
binary blend (PLA/NR and PLA/PLA-NR) and a ternary blend (PLA/NR/PLA-NR).
The diblock copolymers had different total molecular weight and different molecular
weight of each block. Effect of Mn of HTNR block was investigated by using P60N120,
P58N150 and P60N200 and that of PLA block was observed from P35N150 and P58N150.
Three molecular weights of HTNR oligomer as 12000, 15000 and 20000 g/mol were
used with a constant molecular weight of PLA prepolymer 6000 g/mol. Two
molecular weights of PLA as 3500 and 5800 g/mol were used with a constant
molecular weight of HTNR oligomer as 15000 g/mol.
(a) Impact resistance
The notched and un-notched specimens were examined for Izod and
Charpy test. Table 4.39, Figure 4.53 and Figure 4.54 show the impact strength of the
blends. It is known that the impact strength of the notched and un-notched specimens
is not related and the un-notched impact strength is normally higher than the notched

170
one. A notched specimen brings a stress concentrator to fracture in the tip of the
notched position [1]. On the other hand, a crack in the un-notched specimen will start
at any point in the specimen that acts as a stress concentrator. The rubber particles in a
rubber toughened polymer acted as a craze starter or crack initiator. The un-notched
specimens have randomly fractured in the test, thus showing higher impact strength
than the notched specimens. In the present study, the Izod un-notched impact strength
of some blends was not determined because the specimens did not un-break
Table 4.39 Impact strength of the PLA/NR/PLA-NR blends (10 wt% rubber)
Block
copolymer
PLA/NR/
PLA-NR
Impact strength (kJ/m2)
Izod Charpy
Notched Un-notched Notched Un-notched
PLA (ext) 2.140.31 16.543.10 2.170.40 9.771.92
90/10/0 6.440.85 - 2.310.36 27.073.80
90/0/10 3.600.61 - 2.610.70 34.392.13
90/5/5 6.590.96 - 2.760.78 17.521.08
P60N120 90/7.5/2.5 6.210.81 - 2.280.85 25.642.35
90/0/10 3.340.78 - 2.130.43 16.361.89
P35N150 90/5/5 5.890.61 - 2.420.21 20.871.01
90/7.5/2.5 6.190.56 - 2.770.56 23.031.25
90/0/10 5.630.82 9.600.99 2.350.58 15.730.81
P58N150 90/5/5 6.440.51 23.751.37 2.500.32 19.891.66
90/7.5/2.5 7.560.44 - 2.320.31 21.312.78
90/0/10 5.041.23 13.230.34 2.130.62 18.832.76
P60N200 90/5/5 7.980.78 27.451.21 3.190.67 23.202.17
90/7.5/2.5 8.431.01 - 2.990.67 29.231.78
Figure 4.53 and Figure 4.54 show the impact strength of the blends
containing different molecular weight of HTNR oligomer and PLA prepolymer in
diblock copolymers, respectively. It was found that the notched Izod impact strength
of the PLA/PLA-NR blends was lower than that of the PLA/NR blend; however, it

171
was higher than that of the neat PLA (Figure 4.53a). The notched Izod impact
strengths of the ternary blends (PLA/NR/PLA-NR) were in the range of 6.44-7.98 and
6.21-8.83 kJ/m2 for the 90/5/5 and 90/7.5/2.5 blends, respectively. The higher
molecular weight of HTNR oligomer in diblock copolymer showed a little higher
notched Izod impact strength than the lower molecular weight of HTNR oligomer, i.e.,
at the 90/7.5/2.5 blends were ranked as P60N200 > P58N150 > P60N120. The notched
Charpy impact strength (Figure 4.53b) had no significant changes; the different
molecular weight of the precursors of diblock copolymer had no effect.
Figure 4.53 Impact strength of PLA/NR/PLA-NR blends with different molecular
weight of HTNR (10 wt% rubber): (a) Izod and (b) Charpy test.
3.60
6.59
6.21
2.14
6.44 5.636.44
7.56
5.04
7.98
8.43
0
2
4
6
8
10
PLA (ext)
Izod
Iim
pact
str
ength
(k
J/m
2)
PLA/NR/PLA-NR
P60N120 P58N150 P60N200(a)
2.61 2.76
2.282.17
2.31
2.35 2.502.32
2.13
3.19
2.99
0
1
2
3
4
5
PLA (ext)
Ch
arp
y I
imp
act
str
ength
(k
J/m
2)
PLA/NR/PLA-NR
P60N120 P58N150 P60N200(b)

172
Figure 4.54 Impact strength of PLA/NR/PLA-NR blends with different molecular
weight of PLA (10 wt% rubber): (a) Izod and (b) Charpy test.
The impact strengths of the blends containing 10 wt% rubber with
different molecular weight of PLA prepolymer (3500 and 5800 g/mol) and 15000
g/mol of HTNR oligomer are illustrated in Figure 4.54. The notched Izod and Charpy
impact strength of the binary and ternary blends containing P35N150 diblock
copolymer was lower than those containing P58N150 diblock copolymer. The
PLA/PLA-NR blends lowered the notched Izod impact strength compared to the
PLA/NR blend (Figure 4.54a). The notched Charpy impact strength (Figure 4.54b)
had no change when the diblock copolymers were added in the neat PLA and the
2.14
6.44
3.34
5.896.195.63
6.44
7.56
0
2
4
6
8
10
PLA (ext)
Izod
Iim
pact
str
ength
(k
J/m
2)
PLA/NR/PLA-NR
P35N150 P58N150(a)
2.17
2.31
2.13
2.42
2.772.35 2.502.32
0
1
2
3
4
PLA (ext)
Ch
arp
y I
imp
act
str
ength
(k
J/m
2)
PLA/NR/PLA-NR
P35N150 P58N150(b)

173
PLA/NR blends. Diblock copolymer should be used as a compatibilizer rather than as
a second polymer in the blends, as it can be seen in the 90/5/5 and 90/7.5/2.5 blends.
It can be concluded that PLA-NR diblock copolymer is not a good impact modifier
for PLA compared with NR. The PLA-NR diblock copolymers increased the notched
Izod impact strength of the neat PLA but less than NR. This might be due to the
softness and low molecular weight of PLA and HTNR in the PLA-NR diblock
copolymer.
(b) Tensile Properties
The tensile stress-strain curves of the blends containing diblock
copolymer and their tensile properties are displayed in Figure 4.55 and Table 4.40,
respectively. All the blends exhibited the brittle characteristic with a yield point.
Except the 90/0/10 blend which showed brittle fracture without yielding before
failure.
Figure 4.55 Stress-strain curves of PLA, PLA/NR and PLA/NR/PLA-NR (P58N150).
The brittleness of PLA slightly decreased when blended with NR and
NR/PLA-NR, i.e., the elongation at break of the 90/7.5/2.5 blend containing P58N150
and P60N200 diblock copolymer were 5.24 and 5.65%, respectively, while that of the
PLA/NR blends was 4.25%. The addition of diblock copolymers lowered the Young’s
0
5
10
15
20
25
30
35
40
45
0 1 2 3 4 5 6
Str
ess
(MP
a)
Strain (%)
90/10/0
ext.PLA
90/0/10
90/7.5/2.5
58-150
90/5/5

174
modulus, stress at yield and stress at break because of the addition of a soft and weak
component.
The Young modulus, stress at yield, stress at break and elongation at
break of the neat PLA and the blends containing different size chains of diblock
copolymer are presented in Figure 4.56a-d, respectively. The addition of the PLA-NR
diblock copolymers in the neat PLA did not significantly improve the properties of the
PLA blends, except the elongation at break of the 90/7.5/2.5 blend, which slightly
increased. The 90/5/5 blend of P60N200 had a higher elongation at break than the
90/10/0 one. NR alone behaved as a toughening agent of PLA. It was expected that
the Young’s modulus and tensile strength of PLA would decrease because of the
addition of the softer polymers (NR and PLA-NR diblock copolymer).
Table 4.40 Tensile properties of the PLA/NR/PLA-NR blends (10 wt% rubber)
Block
copolymer
PLA/NR/
PLA-NR
E
(MPa)
y
(MPa)
y
(%)
b
(MPa)
b
(%)
PLA (ext) 166383 60.404.27 3.900.39 59.924.05 3.970.45
90/10/0 134595 38.691.83 4.090.17 38.491.83 4.250.17
90/0/10 132682 - - 23.481.35 1.700.41
P60N120 90/5/5 132526 29.230.56 3.010.11 29.230.56 3.05 0.65
90/7.5/2.5 131246 37.181.77 3.110.28 35.911.81 4.66 0.77
90/0/10 138965 - - 15.131.23 2.120.12
P35N150 90/5/5 131198 29.972.01 3.090.41 30.211.11 3.110.43
90/7.5/2.5 123876 29.811.19 4.860.56 29.232.39 4.980.81
90/0/10 1367130 - - 13.791.65 1.850.09
P58N150 90/5/5 1327 36 30.842.80 2.840.37 30.692.81 2.960.32
90/7.5/2.5 130632 29.473.64 3.790.56 29.243.51 5.240.59
90/0/10 128989 - - 23.451.22 3.210.32
P60N200 90/5/5 124976 29.212.09 4.030.78 28.891.04 5.290.77
90/7.5/2.5 123782 31.021.21 4.010.69 27.912.21 5.650.55

175
The effect of HTNR molecular weight can be clearly observed when
the molecular weight of HTNR oligomer in PLA-NR block copolymer increased from
12000 to 20000 g/mol: the elongation at break of the 90/7.5/2.5 blends slightly
increased (4.66-6.65%). The diblock copolymer with higher molecular weight
provided higher the tensile properties than that of the lower one. In the results from
3500 and 5800 g/mol of PLA prepolymer, the P58N150 diblock copolymer provided a
little higher tensile properties than P35N150 diblock copolymer. It can be concluded
that the diblock copolymer is not a good toughening agent for PLA but it can be used
as a compatibilizer for PLA/NR blends for improving the elongation at break.
Figure 4.56 Tensile properties of the PLA/NR/PLA-NR blends (10 wt% rubber): (a)
modulus, (b) stress at yield, (c) stress at break and (d) elongation at
break.
(c) Morphology
The properties of polymer blends are not dependent on only physical
properties of each component but also on the dispersed microstructure and the
interfacial chemistry. The components are melt-blended and broken up to form a
1326
1325 1312
1663
1345 1307 132713061289
1249 1237
0
500
1000
1500
2000
PLA (ext)
Mod
ulu
d (
MP
a)
PLA/NR/PLA-NR
P60N120 P58N150 P60N200 (a)
23.48
29.23
37.18
60.40
38.69
13.79
30.84
29.47
23.45
29.6131.02
0
10
20
30
40
50
60
70
PLA (ext)
Str
ess
at
yie
ld (
MP
a)
PLA/NR/PLA-NR
P60N120 P58N150 P60N200 (b)
23.48
29.23
35.91
59.92
38.49
13.79
30.69 29.24
23.45
28.2 28.89
0
10
20
30
40
50
60
70
PLA (ext)
Str
ess
at
bre
ak
(M
Pa)
PLA/NR/PLA-NR
P60N120 P58N150 P60N200 (c)
1.70
3.05
4.66
3.974.25
1.85
2.96
5.24
3.21
5.295.65
0
1
2
3
4
5
6
7
PLA (ext)
Elo
ngati
on
at
bre
ak
(%
)
PLA/NR/PLA-NR
P60N120 P58N150 P60N200 (d)

176
dispersed phase during processing. Thus, the study of the morphology of polymer
blend is important to confirm the mechanical properties. The SEM micrographs of the
freeze fracture surface of the blend containing 10 wt% rubber including NR and PLA-
NR are shown in Figure 4.57 and the average particle diameter of rubber is listed in
Table 4.41 There were two phases which can be seen clearly. Each blend showed a
dispersed particle morphology caused by phase separation. The average rubber
particle diameter of the blend containing 10 wt% of P60N120, P35N150, P58N150 and
P60N200 were 1.25±0.32, 1.79±0.98, 1.41±0.27 and 1.75±0.32 m, respectively, while
that of the PLA/NR blend was 2.50±1.16 m. The rubber particles and the rubber
cavities in the PLA matrix remained when the rubber fell off during fracturing and
many rubber particles were pulled out from PLA matrix leaving large voids. It was
suggested that the fracture crack ran along the interface between the PLA matrix and
the rubber particles. In general, the rubber particles acted as a stress concentrator
which initiated and terminated crazes in the brittle polymer matrix; thus, they were
responsible for the enhanced fracture energy absorption. All the blends containing 10
wt% PLA-NR diblock copolymers showed lower impact strength (Figure 4.53 and
Figure 4.54) than that of 10 wt% NR. The PLA/NR blend gave a higher stress at break
and ductility (Figure 4.41) than the PLA/PLA-NR and PLA/NR/PLA-NR blends.
However, the rubber particle size of the PLA/PLA-NR blends was smaller than that of
the PLA/NR/PLA-NR blend (Figure 4.57a and Table 4.41). The rubber diameter was
not related to the impact strength of the blends. Maybe the lower molecular weight of
PLA-NR diblock copolymer led to lower viscosity which affected the rubber particle
Table 4.41 Average diameter of rubber particles in the blends (10 wt% rubber)
Type of diblock
copolymer
Rubber particle diameter (m)
90/0/10 90/5/5 90/7.5/2.5
P60N120 1.25±0.32 2.70±0.81 2.32±0.76
P35N150 1.79±0.87 2.61±1.16 2.52±1.00
P58N150 1.41±0.27 2.44±0.83 2.211.11
P60N200 1.75±1.13 2.13±0.95 2.23±1.13
Note: Average particle diameter of the PLA/NR was 2.501.16 m

177
size. It was expected that higher molecular weight of NR would infer higher
mechanical properties to the blends [4, 14, 19].
Figure 4.57 SEM micrographs of freeze fractured surface of the PLA/NR/PLA-NR
blends: (a) 10 wt% P60N120, (b) 10 wt% P58N150, (c) 2.5 wt% P60N120 and
(d) 2.5 wt% P58N150.
Basically, PLA-NR should be more compatible to PLA than NR
because PLA-NR had two blocks (PLA block and NR block) which should be
miscible to PLA matrix and NR dispersed phase, providing theoretically smaller
rubber particle sizes than the PLA/NR blend. The smaller size of the PLA-NR diblock
copolymers indicated higher miscibility than virgin NR. However, the lower
molecular weight of these block copolymers might affect the particle size as well
because of lower viscosity. However, all 90/7.5/2.5 blends showed a similar rubber
particle size to the 10 wt% NR blend, approximately 2.1-2.5 m. The average particle
diameter of rubber in the ternary blends were smaller than the PLA/NR blends but

178
larger than the PLA/PLA-NR blends; may be the viscosity of the ternary blends
increased due to the viscosity from blended NR segment leading to improve in the
mechanical properties and show a similar rubber diameter to the PLA/NR blend.
4.4.1.2 Effect of PLA-NR-PLA triblock copolymer
(a) Impact resistance
In this section, the blends consisted of 10 wt% of rubber in both the
binary blends (PLA/NR and PLA/PLA-NR-PLA blends) and ternary blends
(PLA/NR/PLA-NR-PLA blends). The effect of the molecular weight of the precursors
in the triblock copolymers on the mechanical properties of the blends was
investigated. Three molecular weights of HTNR oligomer were used (12000, 15000
and 20000 g/mol) with a constant molecular weight of PLA prepolymer (6000
g/mol) and two molecular weights of PLA prepolymer (3500 and 5800 g/mol) were
employed together with a constant molecular weight of HTNR oligomer (15000
g/mol).
The impact strength of the blends is illustrated in Figure 4.58-4.59 and
summarized in Table 4.42. The notched Izod impact strengths of the binary blends
(PLA/PLA-NR-PLA) were in the same range, e.g., 6.09-6.88 kJ/m2, indicating that the
Mn of HTNR had no effect (Figure 4.58a). For the ternary blends, it was found that the
impact strength of 90/5/5 and 90/7.5/2.5 blends containing P58N150P58 increased
twofold (12.67±0.64 and 11.20±0.96 kJ/m2) when compared to the PLA/NR blends
(6.44±0.85 kJ/m2). The addition of P60N200P60 triblock copolymer provided increased
notched Izod impact strength to 10.53±0.75 and 11.71±1.01 kJ/m2 for the 90/5/5 and
90/7.5/2.5 blends, respectively. The notched Izod impact strength of the 90/7.5/2.5
blends slightly increased with increasing the Mn of HTNR block. The notched Izod
impact strength of the 90/7.5/2.5 blends containing P60N120P60 increased when
compared to the 90/10/0 blend but it was lower than that of P58N150P58 and P60N200P60
triblock copolymers. The effect of Mn of HTNR oligomer on the notched Charpy
impact strength is shown in Figure 4.58b. The binary blends showed the same notched
Charpy impact strength to the neat PLA and PLA/NR blend. The notched Charpy
impact strength of the 90/5/5 blends for all block copolymer slightly increased when

179
compared to the neat PLA and PLA/NR and had a little increased in the 90/7.5/2.5
blends. The increase and decrease in the impact strength was related to the molecular
weight of the block copolymer.
Table 4.42 Impact strength of the PLA/NR/PLA-NR-PLA blends (10 wt% rubber)
Block
copolymer
PLA/NR/
PLA-NR-PLA
Impact strength (kJ/m2)
Izod Charpy
Notched Un-Notched Notched Un-Notched
PLA (ext.) 2.140.31 16.543.10 2.170.40 9.771.92
90/10/0 6.440.85 - 2.310.36 27.073.80
90/0/10 6.090.83 - 2.680.39 15.031.73
P60N120P60 90/5/5 6.770.79 - 2.770.55 16.652.24
90/7.5/2.5 8.840.95 - 2.990.40 21.562.02
90/0/10 4.110.52 - 2.180.49 21.182.11
P35N150P35 90/5/5 5.680.78 - 2.980.97 31.171.17
90/7.5/2.5 6.961.01 - 2.410.16 29.211.59
90/0/10 6.290.81 - 2.380.55 25.002.56
P58N150P58 90/5/5 12.671.64 - 3.670.33 30.901.70
90/7.5/2.5 11.201.16 - 2.890.42 31.215.34
90/0/10 6.880.50 - 2.810.30 22.251.64
P60N200P60 90/5/5 10.530.75 - 3.520.54 23.681.72
90/7.5/2.5 11.711.01 - 3.140.33 29.231.78
Figure 4.59 illustrates the notched impact strength of the blends made
with P35N150P35 and P58N150P58 triblock copolymers. It was found that the P35N150P35
triblock copolymer lowered both of the Izod and Charpy impact strength of the blends.
The decreasing in the impact strength of the blends containing P35N150P35 might come
from the lower molecular weight of the triblock copolymer. Thus, the addition of
higher molecular weight of block copolymer provided higher impact strength than
lower molecular weight of triblock copolymer. As a result, the effect of molecular
weight of block copolymer showed the same results between diblock and triblock

180
copolymers. It was possibly due to the higher molecular weight of triblock copolymer
that can improve the compatibility of the immiscible polymers, resulting in
enhancement of the notched Izod impact strength [4, 19]. P58N150P58 block copolymer
was the best toughening agent in comparison with NR and other block copolymers.
Figure 4.58 Impact strength of the PLA/NR/PLA-NR-PLA blends with different
molecular weight of HTNR oligomer (10 wt% rubber): (a) Izod and (b)
Charpy test.
6.09
6.77
8.84
2.14
6.44 6.29
12.67
11.20
6.88
10.53
11.71
0
2
4
6
8
10
12
14
16
PLA (ext)
Izod
Iim
pact
str
ength
(k
J/m
2)
PLA/NR/PLA-NR-PLA
P60N120P60 P58N150P58 P60N200P60(a)
2.68 2.77
2.99
2.172.31
2.38
3.67
2.892.81
3.52
3.14
0
1
2
3
4
5
PLA (ext)
Ch
arp
y I
imp
act
str
ength
(k
J/m
2)
PLA/NR/PLA-NR-PLA
P60N120P60 P58N150P58 P60N200P60(b)

181
Figure 4.59 Impact strength of PLA/NR/PLA-NR-PLA blends with different
molecular weight of PLA (10 wt% rubber): (a) Izod and (b) Charpy test.
(b) Tensile properties
Tensile stress-strain curves of polymer blends containing various PLA-
NR-PLA triblock copolymers are shown in Figure 4.60 and Table 4.43, respectively.
The stress-strain curve of PLA showed brittle nature with a yield point at so called
brittle-to-ductile transition behavior. The fracture characteristics of the blends
depended on blend composition and the type of block copolymer. The 90/0/10 and
90/5/5 blends of P60N120P60 were brittle and had no yielding (Figure 4.60a). Figure
4.60b-c shows the stress-strain curves of the blends containing P58N150P58, P35N150P35
2.14
6.44
4.11
5.68
6.966.29
12.6711.20
0
2
4
6
8
10
12
14
PLA (ext)
Izod
Iim
pact
str
ength
(k
J/m
2)
PLA/NR/PLA-NR-PLA
P35N150P35 P58N150P58(a)
2.17
2.31
2.18
2.98
2.412.38
3.67
2.89
0
1
2
3
4
5
PLA (ext)
Ch
arp
y I
imp
act
str
ength
(k
J/m
2)
PLA/NR/PLA-NR-PLA
P35N150P35 P58N150P58(b)

182
Figure 4.60 Stress-strain curves of the PLA/NR/PLA-NR-PLA blend (10 wt%
rubber): P60N120P60, (b) P58N150P58, (c) P35N150P35 and (d) P60N200P60.
0
5
10
15
20
25
30
35
40
45
0 1 2 3 4 5 6
Str
ess
(MP
a)
Strain (%)
90/10/0
ext.PLA
90/5/5
60-120-60(a)
90/7.5/2.5
90/0/10
0
5
10
15
20
25
30
35
40
45
0 1 2 3 4 5 6 7 8
Str
ess
(MP
a)
Strain (%)
90/10/0
ext.PA
90/5/5
58-150-58(b)
90/7.5/2.590/0/10
0
5
10
15
20
25
30
35
40
45
0 1 2 3 4 5 6 7
Str
ess
(MP
a)
Strain (%)
90/10/0
ext.PLA 90/5/5
35-150-35(c)
90/7.5/2.590/0/10
0
5
10
15
20
25
30
35
40
45
0 2 4 6 8 10 12
Str
ess
(MP
a)
Strain (%)
90/10/0
ext.PLA
90/5/5
60-200-60(d)
90/7.5/2.590/0/10

183
and P60N200P60, respectively. For these blends the yield point before fracture could be
clearly observed and they exhibited higher elongation at break when compared with
that of the PLA/NR blends. The decrease in the Young’s modulus and stress at break
of the blends caused due to the addition of the soft polymer, e.g. NR and PLA-NR-
PLA, into PLA matrix.
Table 4.43 Tensile properties of PLA/NR/PLA-NR-PLA blends (10 wt% rubber)
Block
copolymer
PLA/NR/
PLA-NR-PLA
E
(MPa)
y
(MPa)
y
(%)
b
(MPa)
b
(%)
PLA (ext) 166383 60.404.27 3.900.39 59.924.05 3.970.45
90/10/0 1,34595 38.691.83 4.090.17 38.491.83 4.250.17
P60N120P60
90/0/10 1,47628 - - 26.783.65 1.860.29
90/5/5 1,39017 - - 31.152.80 2.300.06
90/7.5/2.5 1,27341 39.081.45 3.080.20 35.031.79 4.311.63
P58N150P58
90/0/10 1,35036 34.813.19 3.970.18 34.634.12 4.700.41
90/5/5 1,21745 37.451.38 4.000.56 35.551.51 7.890.75
90/7.5/2.5 1,22818 35.470.83 4.381.38 33.821.87 7.200.63
P35N150P35
90/0/10 1,252±59 22.93±0.98 2.97±0.18 22.77±0.61 2.99±0.79
90/5/5 1,299±32 33.63±2.64 4.00±0.56 30.73±3.51 5.74±0.59
90/7.5/2.5 1,276±45 38.56±1.26 4.38±1.38 34.61±0.75 5.97±1.51
P60N200P60
90/0/10 1,351±37 28.99±1.29 3.97±0.37 26.70±1.77 4.95±1.25
90/5/5 1,234±45 32.47±1.32 4.00±0.11 27.07±0.74 10.81±2.06
90/7.5/2.5 1,232±38 36.80±0.82 4.09±0.18 28.39±0.58 10.25±2.01
Tensile properties of the blends containing 10 wt% rubber including
NR and PLA-NR-PLA with different size chains of triblock copolymer are shown in
Figure 4.61 and Figure 4.62 for different HTNR oligomers and PLA prepolymers,
respectively. It was found that all the blends exhibited lower Young’s modulus, stress
at yield and stress at break than PLA. However, the elongation at break of some
blends was higher than the neat PLA and PLA/NR blend. The lower tensile properties
are a common behavior when PLA was blended with NR which is a soft polymer. The

184
Young’s modulus of the blends was in the range of 1200-1400 MPa. It seemed that all
triblock copolymers had no significant effect on the Young’s modulus of the blends
(Figure 4.61a and Figure 4.62a). In the binary blends, the PLA/NR blend showed
higher yield stress and stress at break than all PLA/PLA-NR-PLA blends (Figure
4.61b and Figure 4.62b). The molecular weight of HTNR oligomer and PLA
prepolymer had a little effect on the stress at yield and stress break of the blends,
except P60N200P60, which provided the lowest stress at break in both of the binary and
ternary blends (Figure 4.61c). The elongation at break of the binary blend was similar
to that of the PLA/NR blend. The elongation at break of the 90/5/5 and 90/7.5/2.5
blends containing P60N200P60 increased to 10.81±2.06 and 10.25±2.01%, respectively
(Figure 4.61d). Obviously, the P60N200P60 had the highest Mn and also had the longest
PLA and HTNR block. The PLA/P35N150P35 blend provided a lower elongation at
break than PLA/P58N150P58 one (Figure 4.62d). The molecular weight of PLA-NR-
PLA triblock copolymers had a significant effect on the elongation at break of the
blend because they are soft and weak. However, triblock copolymers are not a good
Figure 4.61 Effect of different molecular weight of HTNR oligomers on tensile
properties of PLA/NR blends (10 wt% rubber).
1,4761,390
1,273
1663
1345 1,350
1,217 1,228
13511234 1232
0
500
1000
1500
2000
PLA (ext)
Mo
du
lus
(MP
a)
PLA/NR/PLA-NR-PLA
P60N120P60 P58N150P58 P60N200P60(a)
26.78
31.15
39.08
60.40
38.69
34.8137.45
35.4732.71 32.47
28.05
0
10
20
30
40
50
60
70
PLA (ext)
Str
ess
at
bre
ak
(M
Pa
)
PLA/NR/PLA-NR-PLA
P60N200P60 P58N150P58 P60N200P60(b)
26.7831.15
35.03
59.92
38.49
34.6335.55
33.82
26.7 27.07 28.38
0
10
20
30
40
50
60
70
PLA (ext)
Str
ess
at
bre
ak
(M
Pa
)
PLA/NR/PLA-NR-PLA
P60N120P60 P58N150P58 P60N200P60(c)
1.862.30
4.313.97 4.25
4.70
7.897.20
4.95
10.8110.25
0
2
4
6
8
10
12
14
PLA (ext)
Elo
ngati
on
at
bre
ak
(%
)
PLA/NR/PLA-NR-PLA
P60N120P60 P58N150P58 P60N200P60(d)

185
toughening agent for the direct blending with PLA. In this present study, the
P60N200P20 triblock copolymer showed to be the best toughening agent for PLA and
acted as a good compatibilizer when blending together with NR. Molecular weight
and structure of block copolymer have important influences on their effectiveness as
compatibilizer [38]. It was expected that higher molecular weight of NR could lead to
higher mechanical properties.
Figure 4.62 Effect of different molecular weight of PLA prepolymers on tensile
properties of PLA/NR blends (10 wt% rubber).
The comparison in the mechanical properties of the blends between
adding P58N150 diblock and P58N150P58 triblock copolymers are presented in Figure
4.63. It was found that the Young’s modulus of the blends containing diblock and
triblock copolymers was in the same range, while stress at yield, stress at break and
elongation at break (Figure 4.63b-d) of the blends with triblock copolymer were
higher than those of diblock copolymers. The notched Izod impact strength of the
blends carrying triblock copolymers (Figure 4.63e) was higher than that of the blends
consisting of diblock copolymer. This was similarly observed in the notched Charpy
1663
13451252
1299 12761350
1217 1228
0
500
1000
1500
2000
PLA (ext)
Mo
du
lus
(MP
a)
PLA/NR/PLA-NR-PLA
P35N150P35 P58N150P58(a)60.40
38.69
22.93
33.63
38.56
34.8137.45
35.47
0
10
20
30
40
50
60
70
PLA (ext)
Str
ess
at
bre
ak
(M
Pa)
PLA/NR/PLA-NR-PLA
P35N150P35 P58N150P58(b)
59.92
38.49
22.77
30.73
34.6134.63 35.55
33.82
0
10
20
30
40
50
60
70
PLA (ext)
Str
ess
at
bre
ak
(M
Pa)
PLA/NR/PLA-NR-PLA
P35N150P35 P58N150P58(c)
3.97 4.25
2.99
5.745.97
4.70
7.89
7.20
0
1
2
3
4
5
6
7
8
9
PLA (ext)
Elo
nga
tio
n a
t b
rea
k (
%)
PLA/NR/PLA-NR-PLA
P35N150P35 - - (d)

186
impact strength (Figure 4.63f). This lower impact strength was the effect from lower
molecular weight of block copolymer in the blend.
Figure 4.63 Mechanical properties of the blends (10 wt% rubber) containing P58N150
and P58N150P58.
(c) Morphology
There are many factors concerning with the effectiveness of rubber
toughened polymer, such as interfacial adhesion between rubber particles and
polymer matrix, type and concentration of rubber, blending method, processing
conditions and rubber particle size and shape. It is generally accepted that rubber
1663
1345
1467
1327 13061350
1217 1228
0
500
1000
1500
2000
PLA (ext)
Mo
du
lus
(MP
a)
PLA/NR/B
P58N150 P58N150P58(a)59.92
38.49
13.79
30.69 29.24
34.63 35.5533.82
0
10
20
30
40
50
60
70
PLA (ext)
Str
ess
at
yie
ld (
MP
a)
PLA/NR/B
P58N150 N58N150P58(b)
59.92
38.49
13.79
30.69 29.24
34.63 35.5533.82
0
10
20
30
40
50
60
70
PLA (ext)
Str
ess
at
bre
ak
(M
Pa)
PLA/NR/B
P58N150 P58N150P58(c)
3.974.25
1.85
2.96
5.244.70
7.897.20
0
2
4
6
8
10
12
PLA (ext)
Elo
ngati
on
at
bre
ak
(%
)
PLA/NR/B
P58N150 P58N150P58(d)
2.14
6.44 5.636.44
8.56
6.29
12.67
11.20
0
2
4
6
8
10
12
14
16
PLA (ext)
Izod
Iim
pact
str
ength
(k
J/m
2)
PLA/NR/B
P58N150 P58N150P58(e)
2.172.31
2.352.50
2.322.38
3.67
2.89
0
1
2
3
4
5
PLA (ext)
Ch
arp
y I
imp
act
str
ength
(k
J/m
2)
PLA/NR/B
P58N150 P58N150P58(f)

187
Table 4.44 Average diameter of rubber particles in the blends (10 wt% rubber)
PLA-NR-
PLA
Rubber particle diameter (m)
90/0/10 90/5/5 90/7.5/2.5
P60N120P60 1.96±0.59 2.06±0.60 2.23±0.61
P35N150P35 1.87±0.56 2.43±0.55 2.27±0.49
P58N150P58 0.88±0.87 1.76±0.59 2.370.96
P60N200P60 1.43±0.93 2.13±0.95 2.07±1.30
Note: Average particle diameter of the PLA/NR was 2.501.16 m
Figure 4.64 SEM micrographs of freeze-fractured surface of the PLA/NR/PLA-NR-
PLA blends at 2.5 wt% of: (a) P60N120P60, (b) P58N150P58, (c) P35N150P35
and (d) P60N200P60.
particle size and interfacial adhesion between blend components give an important
factor in determining the mechanical properties of polymer blend. For example, the

188
blends showing large particle size and weak adhesion would result in poor mechanical
properties. SEM micrographs of freeze fractured surface of the blends containing
different size chains of PLA-NR-PLA triblock copolymer are shown in Figure 4.64,
and Table 4.44 presents the average diameter of rubber particles in the blends. The
formation of rubber particles was observed in all the blends because of the phase
separation between the immiscible polymers. The rubber particles diameter of the
PLA/PLA-NR-PLA blends were smaller than those of the PLA/NR blend (2.501.6
m). The binary blends containing triblock copolymers showed lower impact strength
and elongation at break than the ternary blends but the rubber particles of the ternary
blends were bigger than those of the binary blends. Probably, the smaller rubber
particle diameter was due to the lower molecular weight of triblock copolymer in the
PLA/PLA-NR-PLA blends and its lower viscosity. It seemed that the lower molecular
weight of rubber reduced the rubber particle diameter of the blends. Indeed, an
optimal particle size and distribution of dispersed particle of rubber is required; too
small or too large rubber particles rubber cannot promote toughening.
4.4.2 Polymer blends containing >10 wt% rubber
In this section, the blends containing more than 10 wt% rubber were
investigated considering the effect of diblock and triblock copolymers as
compatibilizer on the mechanical properties. The P58N150 and P60N200 diblock
copolymers and P35N150P35, P58N150P58 and P60N200P60 were selected for this study due
to their improvement of the notched Izod impact strength and elongation at break in
the polymer blends containing 10 wt% rubber. The concentration was based on 100
parts of the blend, i.e., 2.5, 5, 10 and 15 pph. In the present work, the
compatibilization effect of “PLA2-NR” and “PLA2-NR-PLA2” was studied, similarly
to the section 4.1.3 for Polymer blends containing 10 wt% rubber. For example, the
sample code of 90/10/2.5 blend mean 90%PLA and 10 %NR and 2.5 pph of block
copolymer.
4.4.2.1 Effect of PLA-NR diblock copolymers
The impact strength of the blends is shown in Figure 4.65 and Table
4.45. The notched Izod impact strength of the blends containing P58N150 decreased

189
when the diblock copolymers content increased (Figure 4.65a). The notched Izod
impact strength of the 90/10/2.5 and 90/10/5 blends containing P60N200 diblock
copolymer slightly increased to 7.65±0.75 and 7.12±0.23 kJ/m2, respectively; while
that of the blend without block copolymer (90/10/0 blend) was 6.440.85 kJ/m2. The
un-notched Izod specimens of some blends were unbroken, i.e. 90/10/2.5 blend
contained P58N150 and P60N200 diblock copolymers. The blends containing P60N200
diblock copolymer showed higher notched Izod impact strength than those of P58N150
for all compositions. The notched Charpy impact strength of the blends containing 2.5
and 5 pph of P58N150 was slightly higher than that of the one without this block
copolymer, and the impact strength value became lower when P58N150 10 pph
(Figure 4.65b). The addition of P60N200 slightly increased the impact strength when
P60N200 10 pph. However, there was no significant difference between the blends
containing P58N150 and P60N200. The un-notched Charpy impact strength of these
blends showed the same trend than the notched specimen. The addition of 2.5 pph of
the block copolymer provided the highest impact strength of the PLA/NR blend;
consequently this content was the optimal one for using as a compatibilizer.
Table 4.45 Impact strength of the PLA/NR/PLA-NR blends (>10 wt% rubber)
Block
copolymer
PLA/NR/
PLA-NR-PLA
Impact strength(kJ/m2)
Izod Charpy
Notched Un-Notched Notched Un-Notched
PLA (ext.) 2.140.31 19.552.67 2.170.40 9.771.92
90/10/0 6.440.85 - 2.310.36 27.073.80
P58N150
90/10/2.5 6.09±0.46 - 3.21±0.68 16.02±1.13
90/10/5 3.90±0.89 21.253.12 2.79±0.49 17.94±1.40
90/10/10 2.71±0.86 18.332.10 2.17±0.25 24.90±2.20
90/10/15 2.13±0.45 16.092.47 1.97±0.41 11.32±2.13
P60N200
90/10/2.5 7.65±0.75 - 2.82±0.56 32.14±2.13
90/10/5 7.12±0.23 - 2.57±0.65 29.12±1.98
90/10/10 3.01±0.48 19.861.97 2.55±0.41 19.00±2.04
90/10/15 4.23±0.99 20.991.71 1.98±0.23 21.09±3.02

190
Figure 4.65 Impact strength of the PLA/NR/PLA-NR blends (>10 wt% rubber):
(a) Izod and (b) Charpy test.
The increase and a decrease in the impact strength of these blends were
related to the rubber diameter shown in Figure 4.66. The average rubber diameter of
the PLA/NR blend slightly decreased with the addition of 2.5 pph of the diblock
copolymer and the rubber diameter was larger when increased diblock copolymer
content and larger than that in the blend without diblock copolymer, probably due to
coalescence of rubber. A larger particle diameter generated a lesser interfacial
adhesion between PLA matrix and NR dispersed phase.
6.44 6.09
3.90
2.71
2.13
7.657.12
3.01
4.23
0
2
4
6
8
10
Izod
Iim
pact
str
ength
(k
J/m
2)
PLA-NR (pph)
P58N150 P60N200 (a)
2.31
3.21
2.79
2.171.97
2.822.57 2.55
1.98
0
1
2
3
4
5
Ch
arp
y i
mp
act
str
ength
(k
J/m
2)
PLA-NR (pph)
P58N150 P60N200 (b)

191
Figure 4.66 SEM micrographs of the PLA/NR/PLA-NR blends (>10 wt% rubber):
(a) 2.5 pph-P58N150, (b) 2.5 pph-P60N200, (c) 10 pph-P58N150 and (d) 10
pph-P60N200.
Table 4.46 and Figure 4.67 display the tensile properties of the
PLA/NR/PLA-NR blends containing > 10 wt% rubber. The Young’s modulus, yield
stress and stress at break decreased with an increasing of diblock copolymers content.
There was no significant difference in the modulus and stress between the blends
containing P50N150 and P60N200 diblock copolymers (Figure 4.67a-c). The elongation
at break of the blends (Figure 4.67d) tended to decrease when a higher amount of
diblock copolymer was added. The 90/10/2.5 and 90/10/5 blends containing P60N200
showed higher elongation at break (6.210.33 and 5.890.45%) than the 90/10/10 and
90/10/15 blends (4.650.55 and 4.110.39%). The 90/10/10 and 90/10/15 blends
from both diblock copolymers had no yield point, indicating a brittle character. The
elongation at break of the 90/10/2.5 blends containing P58N150 diblock copolymer
showed a little increase 5.74%. The higher content of rubber caused a higher

192
Table 4.46 Tensile properties of the PLA/NR/PLA-NR blends (>10 wt% rubber)
Block
copolymer
PLA/NR/
PLA-NR-
PLA
E
(MPa)
y
(MPa)
y
(%)
b
(MPa)
b
(%)
PLA (ext) 166383 60.404.27 3.900.39 59.924.05 3.970.45
90/10/0 134595 38.691.83 4.090.17 38.491.83 4.250.17
P58N150
90/10/2.5 119484 30.651.27 5.740.21 30.751.37 5.740.86
90/10/5 123643 27.521.21 3.710.82 27.621.25 3.710.74
90/10/10 113432 - - 24.341.13 2.310.34
90/10/15 102367 - - 21.231.42 3.120.76
P60N200
90/10/2.5 125155 29.172.01 4.110.23 29.272.11 6.210.33
90/10/5 113469 24.211.03 4.780.65 24.301.21 5.890.45
90/10/10 103291 - - 23.311.56 4.650.55
90/10/15 110183 - - 22.561.23 4.110.39
Figure 4.67 Tensile properties of the PLA/NR/PLA-NR blends (>10 wt% rubber):
(a) modulus, (b) stress at yield, (c) stress at break and (d) elongation at
break.
1,345
1194 1236
1134
1023
1251
11341032 1101
0
200
400
600
800
1000
1200
1400
1600
Mod
ulu
s (M
Pa)
PLA-NR (pph)
P58N150 P60N200 (a)38.69
30.65
27.52
24.34
21.23
29.27
24.3023.31 22.56
0
5
10
15
20
25
30
35
40
45
Str
ess
at
yie
ld (
MP
a)
PLA-NR (pph)
P58N150 P60N200 (b)
38.49
30.75
27.62
24.34
21.23
29.27
24.3023.31 22.56
0
5
10
15
20
25
30
35
40
45
Str
ess
at
bre
ak
(M
Pa)
PLA-NR (pph)
P58N150 P60N200 (c)
4.25
5.74
3.71
2.31
3.12
6.215.89
4.65
4.11
0
1
2
3
4
5
6
7
8
Elo
ngati
on
at
bre
ak
(%
)
PLA-NR (pph)
P58N150 P60N200 (d)

193
viscosity of the blends leading to poorer compatibility between PLA and NR. It was
observed that the P60N200 diblock copolymers provided the higher elongation at break
than the P58N150 for all compositions. Generally, a higher molecular weight polymer
conferred a higher ductility.
SEM micrographs of the PLA/NR/PLA-NR blend containing >10 wt%
rubber and their average rubber particle diameters are shown in Figure 4.66 and Table
4.47, respectively. The NR particle diameter in the 90/10/0 blend was 2.50±1.60 m
(Figure 4.9a) which was larger than that of the 90/10/2.5 blends, which were
2.23±1.17 and 2.22±1.35 m of P58N150 and P60N200, respectively (Figure 4.66a and
Figure 4.66b). This corresponded to the enhancement in impact strength and
elongation at break. It was found that the blends containing higher rubber content
showed larger particle diameter than that of lower rubber content, i.e., the 90/10/5,
90/10/10 and 90/10/15 blends of P58N150 diblock copolymer were 2.78±1.78,
3.53±1.97 and 3.78±2.01 m, respectively. This indicated that the higher rubber
content induced to the coalescence of rubber particle in the blends and that too large
rubber particle diameter affected the mechanical properties.
Table 4.47 Average diameter of rubber particle in the PLA/NR/PLA-NR blends
(>10 wt% rubber)
PLA/NR/PLA-NR Rubber particle diameter (m)
P58N150 P60N200
90/10/2.5 2.23±1.17 2.22±1.35
90/10/5 2.78±1.78 2.52±1.39
90/10/10 3.53±1.97 3.36±2.09
90/10/15 3.78±2.31 3.45±2.05
Note: Average particle diameter of the PLA/NR was 2.501.16 m
4.4.2.2 Effect of PLA-NR-PLA triblock copolymers
In this section, the blends consisted of 90 wt% PLA, 10 wt% NR and
different contents of different size chain triblock copolymers (P35N150P35 or P58N150P58

194
or P60N200P60). The effect of the different molecular weight and content of triblock
copolymers on the mechanical properties of the blends was determined.
Table 4.48 Impact strength of PLA/NR/PLA-NR-PLA blends (>10 wt% rubber)
Block
copolymer
PLA/NR/
PLA-NR-PLA
Impact strength (kJ/m2)
Izod Charpy
Notched Notched Un-Notched
PLA (ext.) 2.140.31 2.170.40 9.771.92
90/10/0 2.310.36 6.440.85 -
P35N150P35
90/10/2.5 8.67±0.49 1.89±0.15 21.19±2.72
90/10/5 5.84±0.49 1.88±0.45 24.21±1.27
90/10/10 4.09±0.55 1.42±0.23 18.90±2.03
90/10/15 5.46±0.67 1.78±0.63 24.54±0.96
P58N150P58
90/10/2.5 12.44±1.75 3.77±0.63 25.83 ± 2.85
90/10/5 8.15±1.06 3.75±0.51 29.48 ± 2.56
90/10/10 4.25±1.17 2.79±0.66 31.09 ± 2.99
90/10/15 5.31±0.89 2.59±0.97 27.12 ± 1.89
P60N200P60
90/10/2.5 11.25±1.45 3.45±0.71 31.21±3.43
90/10/5 8.12±0.81 2.79±0.66 32.11±2.19
90/10/10 4.11±0.71 2.21±0.91 32.38±3.03
90/10/15 5.79±0.55 2.81±0.59 32.11±2.96
The effect of triblock copolymer contents on the impact strength of the
PLA/NR blend is presented in Figure 4.68 and Table 4.48. The specimens from the
un-notched Izod were unbroken during testing. The blends containing 2.5 pph of
triblock copolymers showed the highest notched Izod impact strength in the order
P58N150P58 > P60N200P60 > P35N150P35 (Figure 4.68a). The notched Izod impact strength
of the blends tended to decrease when the triblock copolymer content increased. The
higher content of triblock copolymer may induce higher coalescence of rubber and
explain the rubber particle diameter. The notched Charpy impact strength (Figure
4.68b) of the blends slightly increased after adding 2.5 and 5 pph of P58N150P58 and

195
P60N200P60. In contrast, P35N150P35 decreased the notched Charpy impact strength of
the blends for all components. The un-notched Charpy impact strength showed the
same tendency as those of the notched test.
Figure 4.68 Impact strength of the PLA/NR/PLA-NR-PLA blends (>10 wt% rubber):
(a) Izod and (b) Charpy test.
Tensile properties of the blends having 90% PLA, 10% NR and
different size chain and contents of PLA-NR-PLA (P35N150P35 or P58N150P58 or
P60N200P60) are shown in Table 4.49 and Figure 4.69. It was found that the Young’s
modulus (Figure 4.69a) of the blends decreased with increasing content of triblock
8.67
5.84
4.09
5.466.44
12.44
8.15
4.25 5.31
11.25
8.12
4.11
5.79
0
2
4
6
8
10
12
14
16
Izod
Iim
pact
str
ength
(k
J/m
2)
PLA-NR-PLA (pph)
P35N150P35 P58N150P58 P60N200P60(a)
1.891.88
1.421.78
2.31
3.77 3.75
2.79
2.59
3.45
2.79
2.21
2.81
0
1
2
3
4
5
Ch
arp
y I
imp
act
str
ength
(k
J/m
2)
PLA-NR-PLA (pph)
P35N15P35 P58N150P58 P60N200P60(b)

196
copolymers when compared to the 90/10/0 blend, they were in the range of 1100-1200
MPa. The yield stress (Figure 4.69b) slightly decreased when increasing of PLA-NR-
PLA contents, similarly to the stress at break (Figure 4.69c). All the 90/10/15 blends
had no yielding before fracture. The addition of PLA-NR-PLA triblock copolymer to
the PLA/NR blend decreased the modulus and strength of the blends with increasing
block copolymer content due to the higher content of soft and weak segment. It was
found that the elongation at break decreased when the triblock copolymers content
increased (Figure 4.69d). The highest elongation at break was obtained from the
lowest content of the triblock copolymers (2.5 pph). The 90/10/5 blends of P58N150P58
and the 90/10/10 blend of P60N200P60 provided a little increase (7.03±0.77 and
6.55±0.69%, respectively) when compared to the 90/10/0 blend. The elongation at
break of other blends was similar to the 90/10/0 blends. The concentration of block
Table 4.49 Tensile properties of PLA/NR/PLA-NR-PLA blends (>10 wt% rubber)
Block
copolymer
PLA/NR/
PLA-
NR-PLA
E
(MPa)
y
(MPa)
y
(%)
b
(MPa)
b
(%)
PLA (ext) 166383 60.404.27 3.900.39 59.924.05 3.970.45
90/10/0 134595 38.691.83 4.090.17 38.491.83 4.250.17
P35N150P35
90/10/2.5 122067 33.852.11 5.991.98 33.853.66 6.190.71
90/10/5 121377 30.121.81 4.740.67 30.221.62 4.840.30
90/10/10 110973 - - 25.622.71 5.020.72
90/10/15 110885 - - 25.212.66 4.750.75
P58N150P58
90/10/2.5 1234121 30.620.98 6.240.18 28.770.61 7.760.79
90/10/5 120976 30.222.03 5.480.41 29.101.61 7.030.77
90/10/10 115737 25.574.37 4.570.70 25.191.05 4.641.06
90/10/15 111249 - - 24.611.89 3.710.66
P60N200P60
90/10/2.5 1228121 30.123.15 4.601.02 29.993.21 7.671.01
90/10/5 121686 27.742.69 4.760.20 26.662.68 5.790.22
90/10/10 119664 26.901.95 4.190.63 26.822.05 6.550.69
90/10/15 114761 - - 24.152.86 4.860.75

197
copolymer at 2.5 pph seemed to be the optimal amount because a further increase of
the triblock copolymer content in the blend decreased the impact strength and
elongation at break. The increase of triblock copolymer content decreased the impact
strength and tensile properties of the blends because of the lower compatibility of
PLA and NR. It can be concluded that the addition of a small amount of triblock
copolymers can effectively improve the compatibility of the two phases, enhance the
interfacial adhesion thanks to the small amount of compatibilizer which acted like a
solid emulsifier and stabilizer.
Figure 4.69 Tensile properties of the PLA/NR/PLA-NR-PLA blends (>10 wt%
rubber): (a) modulus, (b) stress at yield, (c) stress at break and (d)
elongation at break.
The objective of this section has been to systematically investigate the
effect of added block copolymer as a compatibilizer of the PLA/NR blends in order to
gain understanding of the mechanism of compatibilization. The PLA/NR was an
immiscible blend that undergoes phase separation with poor adhesion between the
PLA matrix and NR dispersed phase. To understand the results of the mechanical
12201213
1109 1108
13451234
1209 11571112
12281216 1196
1147
0
500
1000
1500
2000
Mo
du
lus
(MP
a)
PLA-NR-PLA (pph)
P35N150P35 P58N150P58 P60N200P60 (a)
33.85
30.1225.62 25.21
38.69
30.62 30.22
25.57 24.70
30.1227.74 26.90
24.15
0
5
10
15
20
25
30
35
40
45
Str
ess
at
yie
ld (
MP
a)
PLA-NR-PLA (pph)
P35N150P35 P58N150P58 P60N200P60 (b)
33.8530.22
25.62 25.21
38.49
28.77 29.10
25.19 24.70
29.99
26.6626.82
24.15
0
5
10
15
20
25
30
35
40
45
Str
ess
at
bre
ak
(M
Pa
)
PLA-NR-PLA (pph)
P35N150P35 P58 N150P58 P60N200P60 (c)
6.19
4.84 5.024.75
4.25
7.76
7.03
4.64
3.71
7.67
5.79
6.55
4.86
0
2
4
6
8
10
Elo
nga
tio
n a
t b
rea
k (
%)
PLA-NR-PLA (pph)
P35N150P35 P58N150P58 P60N200P60 (d)

198
properties of polymer blend, the morphology of the blends was evaluated by using
SEM. The SEM micrographs and the average rubber diameter were displayed in
Figure 4.70 and Table 4.50, respectively. The rubber particle size of the blends
increased when the triblock copolymer content increased. The average rubber particle
diameter of the 90/10/2.5 blends were lower than the 90/10/0 blend. The larger
particle diameter was observed in the blends containing more rubber content. The
decreased and increased mechanical properties of the blends were also related to the
rubber particle size. The large particle size and weak interfacial adhesion would result
in low mechanical properties of the blends. The increasing of the average diameter
and higher of distribution of rubber at higher concentrations was due to the
enlargement of the dispersed rubber caused by the coagulation of dispersed rubber
phase. Thus, the decrease in elongation at breaks and impact strength of PLA/NR
blends was observed at high content of block copolymer. It also was expected that
higher content of rubber in the blends might induce higher viscosity would become
poor compatibility between PLA and NR.
Table 4.50 Average diameter of rubber particles in the blends (>10 wt% rubber)
PLA/NR/
PLA-NR-PLA
Rubber particle diameter (m)
P35N150P35 P58N150P58 P60N200P60
90/10/2.5 2.371.35 2.201.05 2.07±1.06
90/10/5 2.891.78 2.931.03 2.57±1.31
90/10/10 4.012.63 3.911.56 3.572.31
90/10/15 4.492.47 4.142.47 4.45±2.35
Note: Average particle diameter of the PLA/NR was 2.501.16 m
This present work found that the addition of block copolymer with
small content to be a compatibilizer for PLA/NR blend reduced the particle size of
rubber dispersed phase which verified non-reactive compatibilization. There are many
factors of copolymer that affect compatibility of the blend, such as type, number and
molecular weight of copolymer, blend composition and blending conditions.
Theoretically, diblock copolymer should be more effective than triblock copolymer,

199
dissimilarly to this present work due to molecular weight is concerned in this work.
Pual [39] suggested that the solubilization of a separately dispersed polymer into its
corresponding domain of a block copolymer compatibilizer occurs only if the polymer
molecular weight is equal to or less than that of the corresponding block. However,
stabilization of matrix polymer into its corresponding domain of a block copolymer
compatibilizer will occur even if the molecular weights are mismatched. The
requirement that the copolymer should locate preferentially at the blend interfaces
also has implications for the molecular weight of the compatibilizer [38].
Figure 4.70 SEM micrographs of the PLA/NR/PLA-NR-PLA blends (>10 wt%
rubber): (a) 2.5 pph-P58N150P58, (b) 10 pph-P60N200P60, (a) 10 pph-
P58N150P58 and (d) 10 pph-P60N200P60.

200
4.5 References
1. Santos, K.A.M., Suarez, P.A.Z., Rubim, J.C. 2005. Photo-degradation of
synthetic and natural polyisoprenes at specific UV radiations. Polymer
Degradation and Stability, 90, 34-43.
2. Debuigne, A., Caille, J.-R., Willet, N., Jérôme, R. 2005. Synthesis of poly(vinyl
acetate) and poly(vinyl alcohol) containing block copolymers by
combination of cobalt-mediated radical polymerization and ATRP.
Macromolecules, 38, 9488-9496.
3. Toxqui-Lopez, S., Olivares-Perez, A., Fuentes-Tapia, I. 2006. Polyvinyl acetate
with cellulose dinitrate holograms. Optical Materials, 28,342-349.
4. Jaratrotkamjorn, R., Khaokong, C., Tanrattanakul, V. 2012. Toughness
enhancement of poly(lactic acid) by melt blending with natural rubber.
Journal of Applied Polymer Science, 124, 5027-5036.
5. Thiraphattaraphun, L., Kiatkamjornwong, S., Prasassarakich, P., Damronglerd,
S. 2001. Natural rubber-g-methyl methacrylate/poly(methyl methacrylate)
blends. Journal of Applied Polymer Science, 81, 428-439.
6. Kalkornsuraparnee, E., Sahakaro, K., Kaesaman, A., Nakason, C. 2009. From a
laboratory to a pilot scale production of natural rubber grafted with PMMA.
Journal of Applied Polymer Science, 114, 587-597.
7. Bitinis, N., Verdejo, R., Cassagnau, P., Lopez-Manchado, M.A. 2011. Structure
and properties of polylactide/natural rubber blends. Materials Chemistry and
Physics, 129, 823-831.
8. Bitinis, N., Sanz, A., Nogales, A., Verdejo, R., Lopez-Manchado, M.A.,
Ezquerra, T.A. 2012. Deformation mechanisms in polylactic acid/natural
rubber/organoclay bionanocomposites as revealed by synchrotron X-ray
scattering. Cite this: Soft Matter, 8, 8990-8997.
9. Zhang, C., Man, C., Pan, Y., Wang, W., Jiang, L., Dan, Y. 2011. Toughening of
polylactide with natural rubber grafted with poly(butyl acrylate). Polymer
International, 60, 1548-1555.
10. Zhang, C., Huang, Y., Luo, C., Jiang, L., Dan, Y. 2013. Enhanced ductility of
polylactide materials: Reactive blending with pre-hot sheared natural rubber.
Journal of Polymer Research, 20, 121-129.

201
11. Juntuek, P., Ruksakulpiwat, C., Chumsamrong, P., Raksakulpiwat, Y. 2010. The
study of using glycidyl methylacrylate grafted natural rubber as an impact
modifier of poly(lactic acid). Clean Technology, ISBN 978-1-4398-3419-0.
12. Juntuek, P., Ruksakulpiwat, C., Chumsamrong, P., Raksakulpiwat, Y. 2012.
Effect of glycidyl methacrylate-grafted natural rubber on physical properties
of polylactic acid and natural rubber blends. Journal of Applied Polymer
Science, 125, 745-754.
13. Suksut, B., Deeprasertkul, C. 2011. Effect of nucleating agents on physical
properties of poly(lactic acid) and its blend with natural rubber. Journal
Polymer and the Environment, 19, 288-296.
14. Jaratrotkamjorn, R. 2011. Enhance of impact resistance of poly(lactic acid) by
natural rubber. Master of Polymer Science and Technology Thesis, Prince of
Songkla University.
15. Chouaytan, J. 2013. Toughness enhancement of poly(lactic acid) blends with
cassava starch and natural rubber. Master of Polymer Science and
Technology Thesis, Prince of Songkla University.
16. Jin, H.J., Chin, I.J., Kim, M.N., Kim, S.H., Yoon, J.-S. 2000. Blending of
poly(L-lactic acid) with poly(cis-1,4-isoprene). European Polymer Journal,
36, 165-169.
17. Gajria, A.M., Dave, V., Gross, R.A., McCarthy, S.P. 1996. Miscibility and
biodegradability of blends of poly(lactic acid) and poly(vinyl acetate).
Polymer, 37, 437-444.
18. Liu, C., Mather, P.T. 2003. Thermomechanical characterization of blends of
poly(vinyl acetate) with semi-crystalline polymers for shape memory
application. Proceeding of Annual Technical Conference of the Society of
Plastics Engineers (ANTEC) 61st, 2, 1962-1966.
19. Tanrattanakul, V., Boonkeaw, P., Boonlong, N. 2012. Influence of rubber
mastication on mechanical properties of poly(lactic acid)-based
thermoplastic natural rubber. Journal of biobased materials and bioenergy, 6,
1-7.
20. Kébir, N., Morandi, G., Campistron, I., Laguerre, A., Pilard, J.F. 2005.
Synthesis of well defined amino telechelic cis-1,4-oligoisoprenes from

202
carbonyl telechelic oligomers; first studies of their potentialities as
polyurethane or polyurea materials precursors. Polymer, 46, 6844-6854.
21. Kébir, N., Campistron, I., Laguerre, A., Pilard, J.F., Bunel, C., Jouenne, T. 2007.
Use of telechelic cis-1,4-polyisoprene cationomers in the synthesis of
antibacterial ionic polyurethanes and copolyurethanes bearing ammonium
groups. Biomaterials, 28, 4200-4208.
22. Saetung, A., Rungvichaniwat, A., Campistron, I., Klinpituksa, P., Laguerre, A.,
Phinyocheep, P., Pilard, J.F. 2010. Controlled degradation of natural rubber
and modification of the obtained telechelic oligoisoprenes: preliminary study
of their potentiality as polyurethane foam precursors. Journal of Applied
Polymer Science, 117, 1279-1289.
23. Saetung, A., Rungvichaniwat, A., Campistron, I., Klinpituksa, P., Laguerre, A.,
Phinyocheep, P., Pilard, J.F. 2010. Preparation and physico-mechanical,
thermal and acoustic properties of flexible polyurethane foams based on
hydroxytelechelic natural rubber. Journal of Applied Polymer Science, 117,
828-837.
24. Saetung, A., Kaenhin, L., Klinpituksa, P., Rungvichaniwat, A., Tulyapitak, T.,
Munleh, S., Campistron, I., Pilard, J.F. 2012. Synthesis, characteristic, and
properties of waterborne polyurethane based on natural rubber. Journal of
Applied Polymer Science, 124, 2742-2752.
25. Panwiriyarat, W., Tanrattanakul, V., Pilard, J.F., Khaokong, C. 2011. Synthesis
and characterization of block copolymer from natural rubber, toluene-2,4-
diisocyanate and poly(-caprolactone) diol-based polyurethane. Materials
Science Forum, 695, 316-319.
26. Panwiriyarat, W., Tanrattanakul, V., Pilard, J.F., Pamela, P., Khaokong, C.
2012. Effect of natural rubber and poly(-caprolactone) content on
mechanical and thermal properties of novel biodegradable Polyurethane.
Advance in Science Letter, 19, 1016-1020.
27. Panwiriyarat, W., Tanrattanakul, V., Pilard, J.F., Pastto, P., Khaokong, C. 2013.
Effect of the diisocyanate structure and the molecular weight of diols on bio-
based polyurethanes. 130, 453-462.

203
28. Panwiriyarat, W., Tanrattanakul, V., Pilard, J.F., Pasetto, P., Khaokong, C.
2013. Preparation and properties of bio-based polyurethane containing
polycaprolactone and natural rubber. Journal of Polymer and Environment,
21, 807-815.
29. Rashkov, I., Manolova, N., Li, S.M., Espartero, J.L., Vert, M. 1996. Synthesis,
characterization, and hydrolytic degradation of PLA/PEO/PLA triblock
copolymers with short poly(L-lactic acid) chains. Macromolecules, 29, 50-
56.
30. Park, S.Y., Han, D.K., Kim, S.C. 2001. Synthesis and characterization of star-
shaped PLLA-PEO block copolymers with temperature-sensitive sol-gel
transition behavior. Communications to the Editor: Macromolecules, 34,
8821-8824.
31. Na, K., Lee, K.H., Lee, D.H., Bae, Y.H. 2006. Biodegradable thermo-sensitive
nanoparticles from poly(L-lactic acid)/poly(ethylene glycol) alternating
multi-block copolymer for potential anti-cancer drug carrier. European
Journal of pharmaceutical Sciences, 27, 115-122.
32. Jun, Y.J., Park, K.M., Joung, Y.K., Park, K.D. 2008. In situ gel forming
stereocomplex composed of four-arm PEG-PDLA and PEG-PLLA block
copolymers. Macromolecular Research, 16, 704-710.
33. Lasprilla, A.J.R., Martinez, G.A.R. Lunelli, B.H., Figueroa, J.E.J., Jardini, A.L.,
Filho, R.M. 2011. Synthesis and characterization of poly(lactic acid) for use
in biomedical field. Chemical Engineering Transitions, 24, 985-990.
34. Moon, S.I., Lee, C.W., Miyamoto, M., Kimura, Y. 2000. Melt polycondensation
of L-lactic acid with Sn(II) catalysts activated by various proton acids: A
direct manufacturing route to high molecular weight poly(L-lactic acid).
Journal of Polymer Science: Part A: Polymer Chemistry, 38, 1673-1679.
35. Lan, P., Lv, J. 2008. Study on synthesis and mechanism of melt polymerization
of L-lactic acid. Journal of Fiber Bioengineering and Informatics, 41-46.
36. Kaitian, X., Kozluca, A., Denkbas, E.B., Piskin, E. 1996. Poly(D,L-lactic acid)
homopolymers: synthesis and chracterization. Turkish Journal of Chemistry,
20, 43-53.

204
37. Choochottiros, C., Park, E., Chin, I.-J. 2012. Synthesis and characterization of
polylactide-poly(methyl methacrylate) copolymer by combining of ROP and
AGET ATRP. Journal of Industrial and Engineering Chemistry, 18, 993-
1000.
38. Folkes, M.J., Hope, P.S. 1993. Polymer blends and alloys. Blackie Academic
and Professional, Glasgow Lanarkshire.
39. Pual, D.R. 1978. Polymer blends. Vol. 2, Pual, D.R. Newman, S., Ed. Acadamic
Press, London, United Kingdom.

205
CHAPTER 5
CONCLUSIONS
5.1 Effect of poly(vinyl acetate) on the mechanical properties and
characteristics of poly(lactic acid)/natural rubber blends
The NR-g-PVAc was successfully prepared by using emulsion
polymerization technique. The chemical structure of graft copolymer was investigated
and confirmed by1H-NMR and FTIR. The graft copolymers were prepared with
different PVAc contents. The grafting percentages were 1%, 5% and 12% and used
for sample nomenclature: G1, G5 and G12, respectively. The percentages of grafting
increased with an increasing of vinyl acetate content. G5 and G12 improved the
impact resistance of the neat PLA and PLA/NR blends, but decreased the Young’s
modulus, stress at yield and stress at break of the blends. The NR-g-PVAc increased
the miscibility of the PLA/NR blends by decreasing the temperature of the maximum
tan ( transition temperature) of the PLA in the blends. The higher the grafted
PVAc content, the lower the temperature of the maximum tan . NR and NR-g-PVAc
acted as a nucleating agent for PLA by inducing the cold crystallization and increased
the degree of crystallinity in the second and third heating scan. Although the NR-g-
PVAc reduced the particle size of rubber, it seemed that coalescence of the rubber
particles occurred, producing relatively larger sized rubber particles in some blends.
The higher miscibility and smaller rubber particle diameter in the PLA/NR-g-PVAc
blends was attributed to the higher impact strength and elongation at break than the
PLA/NR blends. NR-g-PVAc could be used directly as a toughening agent of PLA or
a compatibilizer of the PLA/NR blend. NR mastication could be applied to the blends
containing NR-g-PVAc for improvement of the impact strength and elongation at
break. The effect of NR content (10-20 wt% NR) showed that the higher NR content
showed the lower impact strength. This was due to the coalescence of NR phase
causing too large particle diameter for toughening.

206
5.2 Synthesis and characterization of diblock and triblock copolymers
synthesized from HTNR and lactide
Natural rubber was chemically modified to be telechelic natural rubber
by controlled selective degradation reaction. The degradation reaction of natural
rubber provided the carbonyl telechelic natural rubber (CTNR) with different
molecular weights that were controlled by using different periodic acid
concentrations. The carbonyl end groups were transformed into hydroxyl end groups
to obtain hydroxyl telechelic natural rubber (HTNR) by selective reduction. The so
called “PLA1-NR diblock” and “PLA1-NR-PLA1 triblock” copolymers were
synthesized by an in situ ring opening polymerization of lactide in the presence of
HTNR oligomer. The reaction conditions of diblock and triblock copolymer were
110C and 170C for 24 h, respectively, and stannous octoate was used as catalyst.
The block copolymers have been prepared using various molecular weights of starting
materials and different mole ratios. The block copolymers were characterized by 1H-
NMR and FTIR. The “PLA1-NR” diblock copolymers showed a new chemical shift of
the methylene proton (COOCH2) at 4.1 ppm. The “PLA1-NR-PLA1” triblock
copolymers presented the two new ester linkages at 4.1 ppm (COOCH2) and 4.8
ppm (–CHOCO), and the disappearance of OH end-groups in HTNR oligomer was
observed. These data indicated that HTNR became a mid-block and PLA was an end-
block. DSC analysis showed two Tgs in both block copolymers. The thermal analysis
of block copolymers showed two steps of degradation attributed to PLA segments and
HTNR segments in block copolymer.
5.3 Synthesis and characterization of diblock and triblock copolymers from
HTNR and lactic acid
The “PLA2-NR” diblock and “PLA2-NR-PLA2” triblock copolymers
were accomplished by reaction between PLA prepolymer and HTNR oligomer in the
presence of stannous octanoate as catalyst. PLA prepolymers were polymerized by a
direct condensation polymerization of L-lactic acid monomer. The reaction was
carried out at 110C and 170C for 24 h of diblock and triblock copolymer,
respectively. The various molecular weights of PLA prepolymer and HTNR oligomer

207
had been prepared to obtain a wide range of molecular weight of the block
copolymers. The various mole ratios between PLA prepolymer and HTNR oligomer
for diblock copolymer had been studied while the mole ratio for the synthesis of
triblock copolymers was constant at 2/1. From 1H-NMR results, it was confirmed that
the hydroxyl groups in HTNR oligomer reacted with the carboxyl group of PLA as
found in the “PLA1-NR biblock” and “PLA1-NR-PLA1 triblock” copolymers. DSC
analysis of block copolymers showed two Tgs that belonged to PLA and HTNR
segments, confirming the block structures of the resulting products. The thermal
analysis of the diblock and triblock copolymers showed two-step degradations
correlated to the degradation of PLA and HTNR segments and their thermal
degradation temperature depended on the chemical structure and molecular weight of
the precursors.
5.4 Mechanical properties and characteristics of PLA/NR/block copolymer
blends
The diblock and triblock copolymers synthesized from lactic acid were
employed for studying the mechanical properties of PLA/NR/block copolymer blends.
The block copolymers were investigated in terms of toughening agent (PLA/block
copolymer blends) and a compatibilizer (PLA/NR/block copolymer blends). The
block copolymers were successfully used as a toughening agent for PLA. Polymer
blends consisting of 90 wt% PLA and 10 wt% of block copolymers showed a higher
impact strength and elongation at break than the virgin PLA, but the Young’s
modulus, stress at yield and stress at break of the blends were lower. The blends
containing triblock copolymers showed higher mechanical properties than those
containing diblock copolymers. P58N150P58 and P60N200P60 became the best toughening
agent of the blends. The miscibility between PLA and block copolymers was higher
than that between PLA and NR, indicating a reduction in the particle diameter of
rubber dispersed phase but also too small dispersed particles that may not promote
toughening mechanisms. The role of the block copolymer as a compatibilizer was
determined in the PLA/NR blend. It was found that both diblock and triblock
copolymers acted as a good compatibilizer by increasing the notched Izod impact
strength of the blends and the triblock copolymers seemed to be more effective than

208
the diblock copolymers. The mechanical properties of the blends decreased with an
increasing block copolymer contents. The PLA/NR blends containing 2.5 pph of
P58N150P58 and P60N200P60 triblock copolymers showed the highest notched Izod
impact strength, approximately six folds higher than that of the blend without these
block copolymers, and both blends also showed the highest elongation at break. The
addition of 2.5 pph of block copolymers to the PLA/NR blends was the optimal
content which may be due to the formation of an appropriate particle size diameter.
The higher content of the block copolymer generated more coalescence of the
dispersed particles in the PLA/NR blends.
In conclusion, both block copolymers performed as toughening agent
for PLA and acted a good compatibilizer for PLA/NR blend due to higher
enhancement in toughness and ductility of PLA and decreasing in the NR particle
size. NR-g-PVAc showed to be a little higher efficient compatibilizer than block
copolymers (maybe because of the brittleness of PLA segment).

209
PERSPECTIVES
In the present work the effect of the block copolymers of PLA and NR
as a toughening agent for PLA and as a compatibilizer for PLA/NR blend have been
studied. The addition of the block copolymers reduces the interfacial tension, permits
a finer dispersion and results in improved interfacial adhesion of the PLA/NR blend.
However, the PLA/block copolymers blends showed lower effectiveness than the
PLA/NR blend, which may be due to the brittleness of the PLA segment in the block
copolymer.
From this study, it was found that the molecular weight of a
compatibilizer plays an important role in the mechanical properties of the blends.
Therefore, further studies of the synthesis of the PLA-NR-PLA block copolymers
with a higher molecular weight of the HTNR oligomer should be pursued and the
synthesis of PLA-NR-PLA block copolymers with addition of other functional
polymers should be studied. It is suggested to modify the block copolymers by
grafting maleic anhydride (MA), to obtain PLA-NR-PLA-g-MA, to have a reactive
compatibilization for improving the mechanical properties of PLA/NR blends. It is
known that MA gives reactive blending with both PLA and NR molecules and the
modification of PLA-NR-PLA block copolymer can be expected to improve the
compatibility between PLA and NR. Thermoplastic elastomer behavior and
biodegradation of block copolymers should be studied.

210
CURRICULUM VITAE
Name Miss Wannapa Chumeka
Student ID 5210230039
Educational Attainment
Degree Name of Institution Year of Gradualtion
B.Sc. (Polymer Science) Prince of Songkla University 2006
M.Sc. (Polymer Science
and Technology)
Prince of Songkla University 2009
Scholarship Award during Enrolment
Grant of the Royal Golden Jubilee Ph.D. Program
Grant of French-Thai Cooperation Program in Higher Education and Research
List of Publications and Communications
Publications:
Wannapa Chumeka, Varaporn Tanrattanakul, Jean-François Pilard, Pamela Pasetto
(2013). Effect of poly(vinyl acetate) on mechanical properties and
characteristics of poly(lactic acid)/natural rubber blends, Journal of Polymers
and the Environment, 21, 450-460.
Communications:
Wannapa Chumeka and Varaporn Tanrattanakul. 2011. Effect of NR-g-MA on
mechnical properties of poly(lactic acid)/natural rubber blend. RGJ Seminar
XXXI, Faculty of Science, Prince of Songkla University, Hat Yai, Songkhla,
Thailand, August 31, 2011. (Poster)
Wannapa Chumeka and Varaporn Tanrattanakul. 2011. Effect of NR-g-PVAc on
mechanical properties of poly(lactic acid)/natural rubber blend. The 2nd MJU-

211
Prae National research conference, 2011, Maejoe University, Phrae campus,
Phrae, Thailand, September 1-2, 2011. (Oral)
Wannapa Chumeka, Varaporn Tanrattanakul, Jean-François Pilard, Pamela Pasetto
2012. Synthesis and characterization of block copolymer of poly(lactic acid)
and natural rubber, Journée de l’École Doctorale 3MPL-JED2012, École des
Mines de Nantes (EMN), University of Nantes, Nantes, France, June 20-21,
2012. (Poster)
Wannapa Chumeka, Varaporn Tanrattanakul, Jean-François Pilard, Pamela Pasetto
2013. Synthesis and characterization of new block copolymer made from
poly(lactic acid) and natural rubber (PLA-b-NR). RGJ-PhD Congress XIV,
Jomtien Palm Beach Resort, Pattaya, Chonburi, Thailand, April 5-7, 2013.
(Oral)
Wannapa Chumeka, Varaporn Tanrattanakul, Jean-François Pilard, Pamela Pasetto
2013. Synthesis of a novel bio-based PLA-NR-PLA triblock copolymer. Third
International Symposium, Frontiers in Polymer Science, Sitges, Spain, May
21-23, 2013. (Poster)

Improvement of Compatibility of Poly(Lactic Acid) Blended with Natural Rubber by Modified Natural Rubber
Résumé L’objectif de ce travail de thèse était l’amélioration de la compatibilité de mélanges d’acide polylactique et de caoutchouc naturel (mélanges PLA/NR) par l’ajout de dérivés du caoutchouc naturel comme agents compatibilisants. Le caoutchouc naturel a été modifié selon deux approches : synthèse d’un copolymère greffé caoutchouc- poly(vinyl acétate) (NR-g-PVAc) et synthèse de polymères à blocks PLA-NR et PLA-NR-PLA. Les mélanges PLA/NR ont été préparés par extrusion dans une extrudeuse à double vis et moulées par compression pour obtenir des feuilles de 2 mm d’épaisseur. Les mélanges contenaient 10-20% en poids de NR et NR modifiée. La résistance au choc et les propriétés en traction ont été étudiées. L’effet de compatibilisation a été déterminé par DMTA, DSC et MEB. NR-g-PVAc a été synthétisé par polymérisation en émulsion pour obtenir de copolymères avec différents contenus en PVAc greffé (1%, 5% and 12%). La caractérisation des matériaux par DMTA a montré une augmentation de la miscibilité des mélanges PLA/NR-g-PVAc.NR-g-PVAc a résulté être un agent durcissant pour le PLA et un agent compatibilisant pour les mélanges PLA/NR. Les polymères à bloc ont été synthétisés selon deux routes : (1) NR hydroxy téléquelique (HTNR) et lactide et (2) NR hydroxy téléquelique et pré-polymère PLA. Dans la première approche, le lactide a été polymérisé in situ à travers la polymérisation par ouverture de cycle pour donner un bloc. Dans la deuxième approche, le pré-polymère PLA a été synthétisé par polymérisation directe de l’acide L-lactique avant copolymérisation à blocs. Les deux types de copolymères se sont révélés de bons agents compatibilisants pour les mélanges PLA/NR, car ils ont augmenté la résistance au choc et ils ont diminué la taille des particules de caoutchouc.
Mots-clés: Polymères Biobasés, acide polylactique, caoutchouc naturel , copolymères à block/greffés
Abstract The aim of this research work was to improve the compatibility of polymer blends made from poly(lactic acid) and natural rubber (PLA/NR blends) by using modified natural rubber as a compatibilizer. Natural rubber was chemically modified into two categories: natural rubber grafted poly(vinyl acetate) copolymer (NR-g-PVAc) and block copolymers (PLA-NR diblock copolymer and PLA-NR-PLA triblock copolymer). PLA/NR blends were prepared by melting blending in a twin screw extruder and compression molded to obtain a 2-mm thick sheet. The blends contained 10-20 wt% of NR and modified NR, and the impact strength and tensile properties were investigated. The compatibilization effect was determined by DMTA, DSC and SEM. NR-g-PVAc was synthesized by emulsion polymerization to obtain different PVAc graft contents (1%, 5% and 12%). Characterization by DMTA showed an enhancement in miscibility of the PLA/NR-g-PVAc blends. NR-g-PVAc could be used as a toughening agent of PLA and as a compatibilizer of the PLA/NR blend. The block copolymers were synthesized following two routes: (1) hydroxyl telechelic natural rubber (HTNR) and lactide and (2) HTNR and PLA prepolymer. In the former route, lactide was in situ polymerized via a ring opening polymerization to be a PLA block segment during block copolymerization. In the latter route PLA prepolymer was synthesized by a condensation polymerization of L-lactic acid prior to block copolymerization. Both block copolymers acted as good compatibilizers for the PLA/NR blend by increasing the impact strength and decreasing the NR particle size. Triblock copolymers provided higher impact strength than diblock copolymers, and they were a less effective compatibilizer than NR-g-PVAc. In contrast to NR and NR-g-PVAc, the block copolymer was not a good toughening agent for PLA. Key Words Biobased polymers, poly(lactic acid), natural rubber, graft / block copolymers
Wannapa CHUMEKA
L4u L’Université Nantes Angers Le Mans
Copyright © 2022 FDOKUMEN


![Bai07_Thiet ke CPU.ppt [Compatibility Mode]](https://static.fdokumen.com/doc/165x107/6337655dd63e7c790105c48c/bai07thiet-ke-cpuppt-compatibility-mode.jpg)


![Stephen Briggs [Compatibility Mode]](https://static.fdokumen.com/doc/165x107/6324c3005c2c3bbfa802dd10/stephen-briggs-compatibility-mode.jpg)