Impact of river ow modi cation on wetland hydrological and ...
45
Impact of river ァow modiヲcation on wetland hydrological and morphological characters Tamal Kanti Saha University of Gour Banga Swades Pal University of Gour Banga RAJESH SARDA ( [email protected] ) University of Gour Banga Research Article Keywords: Flow alteration, Wetland hydrology, Wetland fragmentation, Active ァood plain, Hydrological strength modeling, Machine learning models, and Wetland security state Posted Date: February 24th, 2022 DOI: https://doi.org/10.21203/rs.3.rs-1251492/v1 License: This work is licensed under a Creative Commons Attribution 4.0 International License. Read Full License
-
Upload
khangminh22 -
Category
Documents
-
view
2 -
download
0
Transcript of Impact of river ow modi cation on wetland hydrological and ...

Impact of river �ow modi�cation on wetlandhydrological and morphological charactersTamal Kanti Saha
University of Gour BangaSwades Pal
University of Gour BangaRAJESH SARDA ( [email protected] )
University of Gour Banga
Research Article
Keywords: Flow alteration, Wetland hydrology, Wetland fragmentation, Active �ood plain, Hydrologicalstrength modeling, Machine learning models, and Wetland security state
Posted Date: February 24th, 2022
DOI: https://doi.org/10.21203/rs.3.rs-1251492/v1
License: This work is licensed under a Creative Commons Attribution 4.0 International License. Read Full License

Impact of river flow modification on wetland hydrological and morphological characters 1
Dr. Tamal kanti Saha2, Dr. Swades Pal1, and Rajesh Sarda3* 2
3
1Professor, Department of Geography, University of Gour Banga, Malda-732103, West Bengal, India, 4
Email: [email protected] 5
2Researcher, Department of Geography, University of Gour Banga, Malda-732103, West Bengal, India, 6
Email: [email protected] 7
3Research Scholar, Department of Geography, University of Gour Banga, Malda-732103, West Bengal, 8
India, Email: [email protected] 9
*Corresponding author 10
11
12
13
14
15
16
17
18
19
20
21
22
23
24
25
26
27
28

Abstract 29
A good number of researchers investigated the impact of flow modification on hydrological, 30
ecological, geomorphological conditions in a river. A few works also focused on hydrological 31
modification on wetland with some parameters but as far the knowledge is concerned, linking 32
river flow modification to wetland hydrological and morphological transformation following an 33
integrated modeling approach is almost absent. The current study aimed to explore the degree of 34
hydrological alteration in the river and its effect on downstream riparian wetlands adopting 35
advanced modeling approaches. After damming maximally 67 to 95% hydrological alteration 36
was recorded in respect to maximum, minimum, and average discharges. Wavelet transformation 37
analysis figured out a strong power spectrum after 2012 (damming year). Due to attenuation of 38
flow, the active inundation area was reduced by 66.29%. After damming, 524.03 km2 (48.97% to 39
total pre-dam wetland) was completely obliterated. Hydrological strength (HS) modeling also 40
reported areas under high HS was declined by 14% after post-dam condition. WSS and HS 41
matrix, a new approach, used to feature wetland coupling inundation connectivity and current 42
hydrological state. HS under critical and stress wetland hydrological security zones deteriorated 43
in the post-dam period. The morphological transformation was also well recognized showing an 44
increase of area under the patch, edge, and decrease of the area under large core area. All these 45
findings established a good linkage between river flow modification and wetland transformation 46
and it provided a good clue for managing wetland. 47
Keywords 48
Flow alteration, Wetland hydrology, Wetland fragmentation, Active flood plain, Hydrological 49
strength modeling, Machine learning models, and Wetland security state. 50
1. Introduction 51
People have been continuously changing river systems to meet their water demands through 52
various activities, and one of these activities is the construction of dams across river, which 53
dramatically modify the natural river flow regime in its downstream (Wang et al., 2019; Zheng et 54
al., 2019; Arévalo-Mejía et al., 2020). This direct regulation-related effect will undoubtedly 55
continue to have an impact on rivers in the future decades, with potentially significant and 56
unexpected consequences for their morphodynamics and ecosystems, as well as the concerned 57
flood plain areas (van Oorschot et al., 2018; Zheng et al., 2019; Pal and Sarda, 2020). River flow 58
alterations seem like the most significant modification of the fluvial landscape on the earth's 59

surface (Wang et al., 2020; Chen et al., 2021; Pal and Sarda, 2021a). A good number of 60
researchers believe that flow modification is one of the emerging challenges since it changes the 61
downstream flow regime in terms of total flow, size, timing, length, rate of change, and water 62
quality (Pal et al., 2019; Huang et al., 2019; Amenuvor et al., 2020; Du et al., 2020; Pal and 63
Sarda, 2020; Pal et al., 2020). As a result, it can reduce the connection of the main channel with 64
the flood plain and it not only arrests the water supply to the flood plain but also limits the 65
natural dispersion of fish and macroinvertebrate species towards the flood plain for sustaining 66
the flood plain biodiversity (Rolls et al., 2012). Li et al. (2017) documented since 1991 to 2009, 67
the average flow of Southeast Asia's Mekong river was decreased by 82 percent. Pal (2016b) 68
showed that the Rubber dam on the Atreyee river in Bangladesh has attenuated 84 percent 69
maximum flow and 56 percent average flow. As per Xue et al. (2017), damming on Tarim river 70
basin of China, downstream flow was reduced by 68.7%, which made the hydrological shortage 71
and ecological stress. According to Pal and Talukdar (2020) in the case of the Punarbhaba river 72
in India-Bangladesh, the average flow was decreased by 36% due to dam installation. Ali et al. 73
(2019) reported 17-27% attenuation of the flow of the Yangtze River after damming and warned 74
for water shortages without implementation of suitable management techniques. Wang et al. 75
(2018), Pal et al. (2019) observed the significant hydrological modification in Yangtze, Tangon 76
rivers throughout the world. 77
The construction of the dam not only changed the hydrological system of a river (Pal, 2016a) but 78
also modified the hydro-ecological regime and morphological character of the riparian wetlands 79
by reducing flood frequency, magnitude, squeezing active flood plain area, fragmenting the 80
wetland landscape, and so on. (Gain and Giupponi, 2015; Pal and Saha, 2018; Zheng et al., 2019; 81
Saha and Pal, 2019b; Wang et al., 2019; Duc et al., 2020; Smith et al., 2020; Pal and Sarda, 82
2020; Pal and Sarda, 2021b). Wetlands are the world's most unique, transitional, and productive 83
ecosystems, holding around 6-8 percent of the earth's terrestrial area and indicating 84
approximately 45 percent of the overall economic value among all global ecosystems (Finlayson, 85
2013; Mitsch and Gosselink, 2015). Changes in land use/cover, increase of population and their 86
demands, changing lifestyles and requirements are all putting pressure on these wetlands. In 87
comparison to other economic activities, these lands have always been treated as less valuable 88
(Duc et al., 2020; Pal and Sarda, 2020; Smith et al., 2020). 89

Several studies have discovered that damming has an unfriendly influence on the riparian zone, 90
although, the fact that the dam is not the sole responsible factor for all such changes undoubtedly 91
it is a dominant factor for altering riparian wetland hydrological and morphological character 92
(Zheng et al., 2019; Pal et al., 2020; Talukdar and Pal, 2020). In recent times, the research 93
community and the victims both have paid their attention to study this issue and trying to find 94
some reasonable solution, because it is strongly related to ecological survival and livelihood 95
sustainability (Pal and Saha, 2018; Wang et al., 2019; Zheng et al., 2019; Pal and Sarda, 2020). 96
According to Zheng et al. (2019), hydrological changes were recognized in the lower portion of 97
the Nenjiang River in Northeast China after dam building, and these changes contributed 98
significantly to the 44 percent decline in riparian wetlands. Saha and Pal (2019a) reported that 99
45% of the active flood plain was lost after damming in the Atreyee river basin. According to 100
Talukdar and Pal (2020), damming across the Punarbhaba river in India and Bangladesh reduced 101
the active floodplain by 39.72% enhancing the stress of wetland beyond the active flood plain 102
limit. When a wetland is hydrologically affected adversely, its ecological function abilities, 103
natural resource strength, and morphological characteristics also change accordingly (Bregoli et 104
al., 2019; Aghsaei et al., 2020; Orimoloye et al., 2020). According to Kundu et al. (2021), flow 105
change has an indicative impact on the state of wetland fragmentation as well as ecosystem 106
services. Furthermore, shallowing water depth promotes agriculture extension inside wetland, 107
which leads to wetland fragmentation (Pal and Saha, 2019a). 108
Integrated development of hydrological strength is very difficult since the hydrological data are 109
not readily available (Jeziorska, 2019). Pal and Sarda (2020), Khatun et al. (2021), Pal et al. 110
(2022) applied a water presence frequency approach for wetland consistency analysis. A 111
consistent wetland is good for hydrological strength. Water indices based on time series wetland 112
maps were used for this. Water depth is also a prevalent hydrological component and such data is 113
scarce. Khatun et al. (2021), Kundu et al. (2021), Pal and Sarda (2021a), Pal and Sarda (2021b) 114
tried to develop it from satellite images. Onyango and Opiyo (2021), Pal and Sarda (2021b), 115
Saha et al. (2021), Sahour et al. (2022) used Normalized difference water index (NDWI) for 116
preparing water depth layers through a field-driven databased calibration process. Hydro-period 117
means the period of water stagnation in the wetland in a year. Özelkan (2020), Kundu et al. 118
(2021), Pal and Sarda (2021b), Teng et al. (2021) attempted to develop it through monthly water 119
indices-based images. For compositing, the hydrological components and interpreting the overall 120

change in the hydrological environment in wetland, modeling approaches like statistical, 121
knowledge-driven, and machine learning (ML) algorithms are recommended. Among these, ML 122
modeling provides a good scope for solving non-linear relationships of the applied parameters in 123
a very robust way. A good many ML methods like Random forest (RF) (Shaikhina et al., 2019; 124
Han et al., 2020; Rahmati et al., 2020), Artificial neural networks (ANN) (Tian et al., 2019; Nhu 125
et al., 2020), Reduced Error Pruning Tree (REPtree) (Chen et al., 2019; Ghasemain et al., 2020; 126
Arabameri et al., 2021), Support vector machines (SVM) (Xiong et al., 2019; Singha et al., 2020; 127
Bouramtane et al., 2021) and many more were applied by the scholars for predicting risk, the 128
vulnerability of different kinds and reported credible result. Considering this, the present study 129
also applied ML models for developing hydrological strength models using image-driven 130
hydrological components. Since flood water is a reliable source of wetland, assessing flood 131
extent over time and analyzing wetland within or beyond flood extent is also very useful (Greet 132
et al., 2020; Karim et al., 2020). Flood simulation amongst is a reliable approach for this which is 133
applied in this present case. Based on this, the wetland was classified into para and ortho-fluvial 134
wetland by Ward and Stanford (1989). Para-fluvial wetlands are those that are directly linked 135
with the river (Deforet et al, 2009; Mondal and Pal, 2018). Following their thinking, the wetland 136
hydrological security state (WSS) was recognized in this present work. 137
From the literature survey, it is very clear that a good many studies dealt with river flow 138
modification and its hydro-ecological, geomorphological consequences in downstream rivers 139
(Yan et al., 2010; Li et al., 2017; Tonkin et al., 2018; Wang et al., 2018). A few works also 140
devoted to exploring hydrological dynamics in the riparian wetland in consequence of 141
hydrological modification in a river (Chakraborty et al., 2018; Zheng et al., 2019; Pal and Sarda, 142
2020; Pal and Sarda, 2021a; Pal and Sarda, 2021b; Pal et al., 2022). However, as far the 143
knowledge is concerned there is a dearth of work linking river and riparian wetland hydrological 144
modification selecting relevant hydrological parameters like pixel scale water depth, water 145
presence consistency, hydro-period, river flood water connectivity, etc. But integrated spatial 146
scale (pixel) analysis of hydrological conditions in the wetland concerning the degree of 147
hydrological modification in a river triggered by damming is very vital for understanding the 148
effect of it and devising sustainable planning for wetland management. Few case studies used 149
field-driven data for doing this, but there is a lack of work covering a large geographical area. 150
However, it is essential from the planning point of view. Therefore the current study aimed to 151

examine the degree of hydrological modification in the river and riparian wetland concerning 152
damming and linking them. The work was also in a question that can hydrological modification 153
bring noticeable changes in wetland morphology promoting other factors of wetland 154
transformation? 155
2. Study area 156
Atreyee river (390 km long), an India Bangladesh transboundary river with assorted aquatic 157
ecosystems (Adel, 2013). In the lower portion of this basin, a lot of rain-fed and flood water-fed 158
wetlands are available and they are generally located close to the main river (Figure 1). The 159
majority of the wetlands are seasonal and highly inconsistent in water appearance. Water furnish 160
to the wetlands depends on occasional rainwater and the frequency, duration, magnitude of 161
inundation of the Atreyee river (Pal and Saha, 2018; Pal and Sarda, 2020; Pal et al., 2021, Pal 162
and Sarda, 2021a). Water harvesting from the mainstream for different economic and domestic 163
purposes has gradually been expanded. For upgrading irrigation supply, the Mohanpur rubber 164
dam was built over the Atreyee river in 2012 and this episode has enhanced the water shortage in 165
the downstream main river and its alongside wetlands. The time after the development of the 166
dam (2012 onward) is considered as a post-dam stage. After the damming impact, the river and 167
riparian scene have experienced a huge alteration in the hydrological regime (Pal and Sarda, 168
2020). River damming is brought about by 30.97% and 64.01% discharge curtailed during pre-169
monsoon and post-monsoon seasons and it is additionally caused for dwindling water 170
accessibility in the wetland (Pal, 2016b; Pal and Saha, 2018; Pal and Sarda, 2020). This is also a 171
very evident reason for wetland hydrological alteration. Considering this the lower Atreyee river 172
basin has been considered as a special case. 173
174
175

176
Figure 1: Location of the study area 177
3. Materials 178
To fulfill the objectives, consider three-hour interval discharge and water level data (from 1993 179
to 2018) that were obtained from the Joda bridge river gauge station in Balurghat for monitoring 180
hydrological modification, 2D flood modeling in the post-dam period. Specifically, for 2D 181
floodplain modeling, the SRTM DEM was employed. Landsat-TM satellite images characterize 182

crucial and ongoing recordings of the earth's surface. We have separated the complete temporal 183
spectrum dataset into two phases-pre and post-dam for pre and post-monsoon season to 184
recognize the dam's influence. Over the last 33 years (1987-2020), cloud-free Landsat TM and 185
OLI were used to detect and monitor the inundation state of wetlands. Detail descriptions of the 186
images are provided in the supplementary section. 187
4. Methods 188
4.1 Measuring flow alteration (heat mapping) 189
There are many methods of measuring flow alteration like the Range of variability approach 190
(Richter et al., 1998; Yang et al., 2008; Cheng et al., 2018; Ali et al., 2019; Tian et al., 2019), 191
Revised range of variability approach (Ge et al., 2018), Histogram comparison approach (Huang 192
et al., 2017), Histogram matching approach (Shiau and Wu, 2008; Huang et al., 2016). Among 193
this range of variability approach adopted to measure the flow alteration of the Atreyee river. 194
Besides, heat mapping is a good data visualization technique showing the changes of the 195
magnitude of the phenomenon in a gradient of color in two dimensions (Barter and Yu, 2018). In 196
this present context, a heat map was prepared using the time-series change of discharge data and 197
change of discharge data in pre and post-dam years (1997 to 2018) about each month. 198
Hydrological alteration of the post-dam period was computed about the average of the pre-dam 199
period. The Data matrix for the pre-dam period doesn’t show any alteration rather an anomaly of 200
yearly discharge about the average of each respective month. 201
202
4.2 Flow periodicity analysis 203
For analyzing long-term time series variability, trend, periodicity Wavelet transformation 204
technique is very useful (Talukdar and Pal, 2020). Wavelet transformation is a well-built 205
mathematical signal processing technique that can offer both frequency and time domain 206
information from both non-stationary and stationary data sets, which together is difficult to 207
obtain from other standard methods (Santos et al., 2018). Fourier transformation can only 208
provide time or frequency domain (Smith et al., 1998), however, the wavelet transformation 209
method was built by modifying the Fourier transformation to receive both time and frequency 210
domain information (Liu et al., 2016; Wang et al., 2018). Additionally, this method can construct 211
a multi-resolution analysis. For an instance, at a low scale of wavelet transformation, it yields a 212
good quality time resolution and at a high scale, it is just the opposite. This information is very 213

imperative for any time series analysis like time series discharge change. In the case of non-214
stationary time series data (mean, variance, covariance, and autocorrelation change over time but 215
cannot return to its original position again), this method is well accepted and will be applied for 216
hydro-meteorological data series. 217
Goupillaud et al. (1984) deemed first wavelets as a group of functions constructed from the 218
translations and dilations of a single function, which is known as the ‘‘mother wavelet”. The 219
wavelet transform is defined by equation (1) 220
,
1( ) ( ); , ; 0a b
t bt a b R a
aa
(Eq. 1)
221
Where, the scale parameter is symbolized by ‘ a ’ that appraises the degree of compression, 222
whereas, translation parameter that calculates the time location of the wavelet is presented by ‘ b223
’. The ‘ a ’ parameter in the mother wavelet will be conditioned by the higher frequencies 224
(smaller support in the time domain) when a will be less than 1. When aa
will is more than 1, 225
then , ( )a b t has a larger time width than ( )t that will correspond to lower frequencies. 226
Therefore, wavelets have time widths that are adapted to their frequencies that are the actual 227
reason behind the achievement and exclusive usefulness of the Morlet wavelets in signal 228
processing and time-frequency signal analysis. 229
230
4.3 Method for measuring hydrological modification of wetland 231
4.3.1 Modification about hydrological components 232
Measuring hydrological modification at a spatial level over a larger geographical area is a very 233
difficult task due to the lack of spatial scale data availability. In this work, three major 234
hydrological components were developed from multi-date image data at a pixel level. The 235
components are (1) water presence frequency (WPF), (2) hydro-period (HP), and (3) water depth 236
(WD). 237
For developing hydrological components of the wetland, month scale Normalized differences 238
water index (NDWI) was first developed following Mcfeeters (1996) (Eq. 2). Saha and Pal 239
(2018), Pal and Sarda (2020) endorsed that NDWI is a suitable water index for wetland 240
delineation for this region. NDWI value 0-1 signifies wetland. 241

Green NIR
NDWIGreen NIR
(Eq. 2) 242
WPF shows consistency of water appearance in a pixel over a considered time. The equation for 243
computing WPF is Equation 3. WPF value ranges from 0-100%. A value near 1 means irregular 244
water appearance in a pixel and 100% signifies that in all the considered years, water appeared in 245
a pixel (Sarda and Das, 2018). For the convenience of analysis, the WPF spectrum was classified 246
into three classes (a) high WPF (>67%), (b) moderate WPF (33-67%), and (c) low WPF (<33%). 247
For developing the WPF map from the satellite image, the first water index (Normalized 248
difference water index (NDWI)) (Eq. 2) of each year was computed for the post-monsoon 249
season. Each NDWI map was converted into a binary map assigning 0 to non-wetland and 1 to 250
wetland pixel. All the binary maps of pre and post-dam periods were added separately and 251
divided by the total number of considered years and expressed in percentage (Eq. 3). 252
1(%)
N
i
s
BFpijWPF
N
(Eq. 3) 253
254
Hydro-period map was developed from monthly NDWI maps. Binary NDWI maps of twelve 255
months in a year were summed up following Pal and Sarda (2021a). The value may range from 256
0-12. 0 signifies no wet period in a year and 12 means perennial wetland. Both seasonal and 257
perennial wetlands are ecologically important but perennial wetland has a better opportunity for 258
species phenology over a long period and economic turnover (Milani et al., 2019). This approach 259
is very efficient since it provides pixel scale hydro-period information over wider geographical 260
areas. The finer temporal resolution may provide more authentic data for doing this than the 261
Landsat product (temporal resolution: 16 days). 262
Water depth data is very crucial for analyzing the hydrological state of a wetland, but pixel scale 263
data, even point scale data is almost lagging. Khatun et al. (2021), Kundu et al. (2021), Pal and 264
Sarda (2021b) successfully attempted image-based derivation of water depth data at different 265
points in time. Following them, the present work also applied this approach of water depth 266
calibration of water indices (NDWI) using 130 field-driven sample depth data of nine wetland 267
sites. The accuracy of this map largely depends on the number of field-driven data for calibration 268
and suitable water indices. Abnormal natural and anthropogenic intervention on wetland water 269
strongly withstand against establishing a relationship between spectral value and ground truth 270

(Talukdar and Pal, 2020). Gao (1996) stated that NDWI value is related to water thickness. Good 271
water depth is related to the hydrological strength of the wetland since it provides sample 272
ecological niches of varying characteristics. 273
4.4 Developing hydrological strength model 274
Using WPF, HP, and WD, three machine learning (ML) algorithm-based hydrological strength 275
models were developed to see the change of hydrological strength in pre and post-dam periods. 276
Artificial neural network (ANN), Random forest (RF), and Reduced error pruning tree 277
(REPTree) hydrological strength models were built. 278
4.4.1 Artificial neural network (ANN) 279
ANN can work as a human mind and can powerfully anticipate the outcome from the countless 280
factors model (Zhao et al., 2019; Nguyen et al., 2020; Saha et al., 2021). This is the justification 281
for why, number of specialists have widely applied this model in several fields of examination 282
(Choi et al., 2019, Zhao et al., 2019; Nguyen et al., 2020; Pal and Sarda, 2021). Here the 283
researchers have widely used the multi-layer perceptron (MLP) algorithm. MLP is one of the 284
most by and huge executed neural frameworks which are constantly set up with the back-285
propagation calculation (Choi et al., 2019, Zhao et al., 2019). The backpropagation algorithm 286
was applied in MLP for the development of the network till the least error is reached inside the 287
result and expected upsides of the ANN. In this calculation, the connection between the 288
information is noticed and a transition rule is utilized to remove data from the fundamental layer 289
(Paola & Schowengerdt, 1995). The connections might be weighted in the given environment 290
and are associated through unidirectional progressions of data produced from the input layer to 291
concealed layer lastly to the output layer. This sort of multi-layer ANN model is skilled to get 292
significance from the components WPF, depth consistency, and hydro-period duration of the 293
wetland considered as a dependable information building WR models. 294
4.4.2 Random forest (RF) 295
Random forest (RF), presented by Breiman (2001) is a notable ensemble-learning calculation 296
that is a blend of decision trees for gathering or backsliding to predict with a higher precision 297
level. Besides, the RF method is broadly utilized for land use land cover classification, 298
regression, and unsupervised learning (Behnia and Blais-Stevens, 2018; Camargo et al., 2019; 299
Chen et al., 2020). RF comprises an ensemble of classifiers to establish a connection among 300

factors and weight generation for each variable. The RF algorithm produces many trees during 301
the training stage, and the last weight is created by averaging all the tree values. RF classification 302
utilized the resampling procedure by randomly changing the predictive variables to build the 303
variety in each tree (Arabameri et al., 2020). In this study, the datasets are of high dimensional 304
nature so it is essential to join the effect of each component then the model can predict the water 305
wealth of the wetland with a higher precision level. 306
4.4.3 Reduced error pruning tree (REPtree) 307
The Reduced error pruning tree is a fast machine learning algorithm, which consists of Reduced 308
Error Pruning (REP) and the Decision Tree (DT) (Quinlan, 1987). The prime goal of this 309
algorithm is to reduce the difficulty of the modeling procedure when utilizing enormous 310
information (Mohamed et al., 2012). In this calculation, the DT is applied to rearrange the 311
modeling strategy using a preparation dataset when the output of a decision tree is huge, and the 312
REP was used to lessen the complicity of the structure of the tree (Mohamed et al., 2012). This 313
strategy reduces the complexity of the decision tree model during the pruning process and limits 314
the model error. The straightforward setup and pruning strategy gives better exactness and 315
lessens the over-fitting issue (Pham et al. 2019). In pruning measure, a decision tree can be 316
pruned into two different ways, for example, pre-pruning and post-pruning. Pre-pruning is 317
quicker with less exactness whereas post-pruning gives better precision (Chen et al. 2019). In 318
this examination, the post pruning strategy was used to generate a series of pruned trees and to 319
recognize an exact sub-tree from the test dataset. 320
Table 1: Optimization statistics of the applied machine learning models 321
Machine
learning
algorithms
Description of optimized parameters
ANN Hidden layer-6, learning rate-0.3, momentum-0.2, seed-7, training time-
500, validation threshold-20, Normal to binary filter-TRUE
RF Batch size-100, seed-1, number of iteration-100, max depth-1, calc out of
bag-TRUE, Compute attribute importance-TRUE
REPtree Batch size-100, seed-3, max depth- -1, minimum number-2.0, minimum
variance proportion-0.001, spread initial count-TRUE
322
4.5 Validation of hydrological strength models 323

Nampak et al. (2014) rightly stated that there is no merit in modeling with no scientific 324
significance; therefore, the validity and uncertainty of models need to be assessed. To 325
authenticate the performance of the wetland hydrological strength models, several statistical 326
measures including Sensitivity (SE), Specificity (SP), Kappa statistic (K), Area under the curve 327
(AUC) in receiver operating characteristic (ROC) curve, and Matthews’s correlation coefficient 328
(MCC) were applied in this study. SE, SP, AUC, K values usually range from 0-1. A value near 329
1 signifies a higher level of predictive agreement (Yang and Zhou 2015; Warrens and Pratiwi, 330
2016). MCC was used to check the quality of binary classification of machine learning models 331
(Chicco and Jurman, 2020). This coefficient ranges from -1 (complete disagreement in 332
prediction) to +1 (perfect agreement in prediction). The equations of the statistical measures are 333
put from Eq. 4-7. 334
TPSE
TP FN
(Eq. 4) 335
TNSP
TN FP
(Eq. 5) 336
1
o e
e
Kappa statistW
iW
Wc
(Eq. 6) 337
( )( )( )( )
TP TN FP FN
TP FP TP FN TN FP TN FNMCC
(Eq. 7) 338
Where, TP= True Positive; TN=True Negative; FP=False Positive; FN=False Negative; Wo and 339
We= Observed and Expected agreement 340
341
4.6 Modification about lateral hydrological connectivity 342
4.6.1 2D inundation modeling 343
The US Army Corps of Engineers developed HEC-RAS software to simulate floods using one-344
dimensional (1D), two-dimensional (2D), and three-dimensional (3D) models. In the scenario of 345
a uniform cross-section channel, the 1D model can be utilized whereas, in the case of a channel 346
with different cross-sections, the 2D model is implemented. The 2D simulation model was 347

employed for both the pre-dam and post-dam phases of the Atreyee river, taking into account 348
variable cross-sections. 349
The median flood discharge is estimated for both the pre-dam and post-dam eras before flood 350
models are simulated. The years 1993 and 2014 were chosen as the representative median flood 351
years for both phases. Discharge data from flood periods (7 days) were placed in the dam's 352
downstream sections, and flood simulation maps were created using the SRTM DEM. For the 353
model's validation, a total of 188 flooded locations were chosen from around the basin. A GPS 354
survey of flood areas was conducted to acquire ground reference sites. People's perspectives on 355
the selected places were obtained to see if they were genuinely prone to flooding. Using field and 356
model data, the Kappa coefficient was calculated. The estimated kappa coefficients for pre and 357
post-dam periods respectively are 0.85 and 0.89, denoting high agreement between model and 358
field reality. (Eq. 8-10). 359
0h s t
x m n
(Eq. 8) 360
2 2 2 2
2( ) ( ) ( ) ( )mm mn
s s st n sg s t hvwd sf wd wd
x m wd n wd wd m m n
(Eq. 9) 361
2 2 2 2
2( ) ( ) ( ) ( )nn mn
t t st n tg s t hvd yf wd wd
x n wd m wd wd n n m
(Eq. 10) 362
Where, wd is the depth of water (m), 363
s and t are the definite flow in the m and n directions (m2s−1), 364
h is the surface height (m), 365
v is the increase of rate due to gravity (m s−2), 366
r is the Manning resistance, 367
is the water density (kg m−3), 368
, and are the components of the effective shear stress and f is the Coriolis (s−1). 369
After producing inundation maps for both the pre-dam and post-dam phases, current-day 370
wetlands were superimposed on these maps, and it was determined which section of a specific 371
wetland is beyond or within the pre-dam and post-dam active flood plains. Wetlands are 372
classified into three types based on their probability of receiving frequent floodwater. Wetlands 373
that exceed the pre-dam flood limits are classified as having a critical status. Wetlands that are 374
inside the pre-dam active flood limit but beyond the post-dam active flood limit are classified as 375

stressed wetlands. Wetlands within the current flood limit are considered safe wetlands since 376
they may receive frequent flood water. 377
4.6.2 Classifying wetland security state (based on flood zones) 378
Wetlands of the basin were classified based on lateral inundation zones before and after 379
hydrological alteration due to damming. After overlapping inundation zones of pre and post-dam 380
conditions, three zones were identified like (1) area inundated both during pre and post-dam 381
periods (2) area beyond post-dam but within pre-dam inundation limits, and (3) area beyond both 382
pre and post-dam flood limits. Wetlands were under three inundation zones were respectively 383
treated as (1) safe, (2) stress, and (3) critical about hydrological security particularly in terms of 384
lateral hydrological connectivity. Since in the rain-induced fluvial-flood plain region where 385
floodwater is one of the dominant sources of wetland, classification on this basis is very crucial. 386
Moreover, flood not only supplies water to the para-fluvial wetland but also supplies nutrients, 387
fish seeds, different species seeds, remove pollutants, etc. So, analyzing flood water connectivity 388
and classifying wetland is very essential. Here, it is to be remembered that a critical wetland 389
doesn’t mean the wetland is devoid of water, it may be supported by rainwater, seepage water 390
but deprived of flood services. 391
4.7 Morphological change of wetland (Fragmentation/shape sizes) 392
Landscape morphology is itself a good indicator of wetland hydrological dynamics. The 393
perennial and consistent wetland is less susceptible to morphological transformation than 394
seasonal, ephemeral wetlands that are hydrological irregular, erratic, and provide a scope of 395
activating invasive factors of wetland morphological change (Epting et al., 2018; Talukdar and 396
Pal, 2019; Lee et al., 2020). Using Fragstat software wetland landscape of both pre and post-dam 397
periods was classified into a patch, edge, perforated, small, medium, and large core, and the area 398
under each category were accounted to show the morphological changes of the wetlands. 399
Dynamics of patch frequency, area, edge area, a core area in between pre and post-dam periods 400
help to explain the nature of influencing factors. 401
4.8 Identifying associated modification 402
There are different causes to be condemned for wetland loss, a hydro-ecological transformation 403
like agricultural, built-up land extension, infrastructure development replacing wetland, 404
attenuation of water availability, etc. However, the hydrological modification could be one 405
fundamental transformation of wetland that can also invite some other related causes (Das and 406

Pal, 2018; Pal and Sarda, 2020; Pal et al., 2022). Considering this the present section focused on 407
some case studies exploring the nature of hydrological transformation and associated other 408
causes directly from the field following the approach of the Millennium Ecosystem Assessment 409
(MEA, 2005) report. Different drivers, driver’s impact, current trend, etc were surveyed for each 410
wetland. 411
5. Results 412
5.1 Flow alteration (heat mapping) 413
414
Figure 2: Heat map showing flow alteration about absolute maximum, minimum and average 415
discharge (A, B, C) and maximum, minimum and average discharge change rate (D, E, F). Here 416
2012 is the damming year. 417
From the heat map of maximum, minimum and average discharge, and discharge change rate, it 418
is very evident that in the pre-dam period discharge anomaly (positive and negative) is 419
accountable for but its dynamics were highly observable in case of minimum discharge 420
specifically in the monsoon months. After damming, the sharp decline of discharge without any 421
incident of the anomaly was noticed (Fig. 2A, B, C). Similarly, the rate of discharge attenuation 422
was found in post-dam conditions. For instance, it was up to 92%, 66.5%, and 75% in case of 423

maximum, minimum and average discharges respectively (Fig. 2D, E, F). Such change was 424
recognized more during monsoon months. Discharge increment rate was also recorded in these 425
heat maps, however; all such incidents were identified in the pre-dam period. It does mean there 426
were many years when maximum, minimum, and average discharge was greater than that of 427
respective average. 428
5.2 Periodicity Analysis 429
The continuous wavelet power spectrum of average discharge in pre-monsoon, monsoon, post-430
monsoon, and winter seasons was presented in figure 3. After damming (2012), significant 431
periodicity in the wavelet power spectrum was identified in 3-5 years’ band particularly in 432
different seasons. From the wavelet power spectrum, the highest power (represents the variance 433
of flow) was found near the bands of 3-4 years from 2012 to 2015. It does signify that the nature 434
of river flow was changed more or less in the same direction with quite varying magnitude. In 435
the pre-monsoon season, a strong power is recognized in 2-3 years’ time band from 2012 to 2015 436
(Fig. 3). In the monsoon season, a few strong wavelet power spectrums were displayed in 2-8 437
years’ band from 2000 to 2009; in 16-30 years’ band from 2012 to 2017 (Fig. 3b). In the post-438
monsoon season, three significant spectrums were noticed. Among them, a comparatively 439
stronger significant spectrum was found in the 2-2.8 years’ band from 1995 to 2000, 4 to 7 years’ 440
band from 2012 to 2015 (Fig. 3c). During the winter season, a few strong spectrums were 441
portrayed after 2012. 442
443
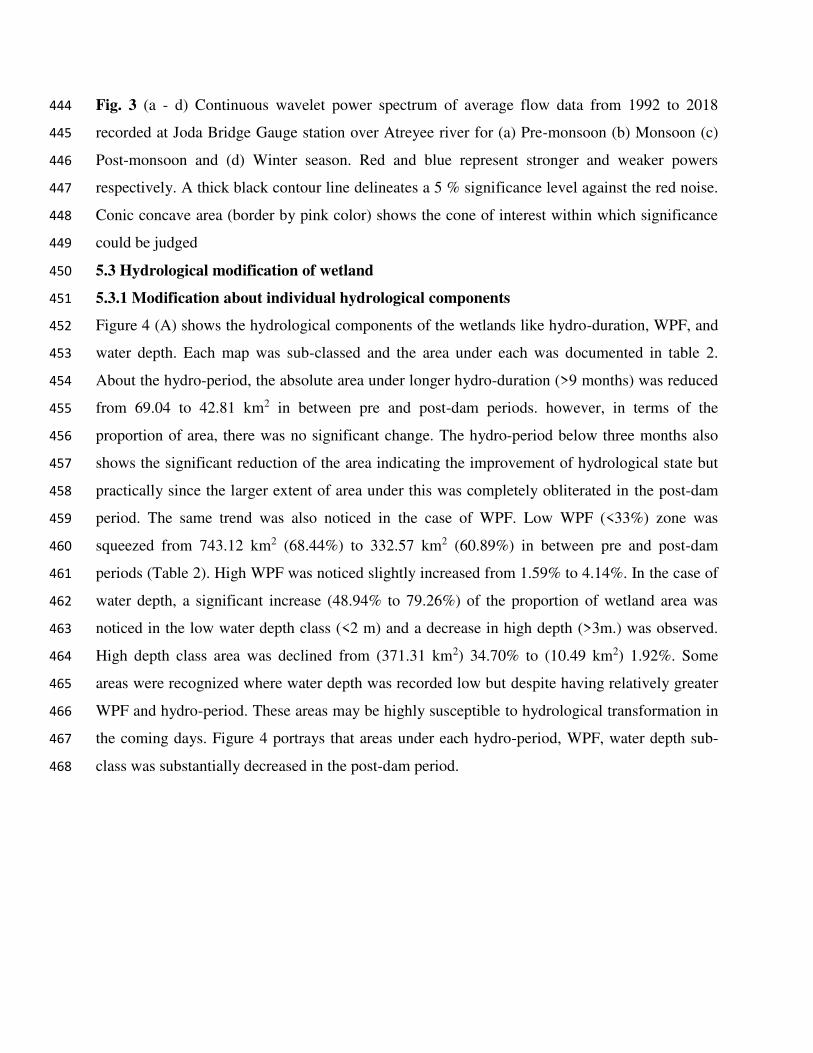
Fig. 3 (a - d) Continuous wavelet power spectrum of average flow data from 1992 to 2018 444
recorded at Joda Bridge Gauge station over Atreyee river for (a) Pre-monsoon (b) Monsoon (c) 445
Post-monsoon and (d) Winter season. Red and blue represent stronger and weaker powers 446
respectively. A thick black contour line delineates a 5 % significance level against the red noise. 447
Conic concave area (border by pink color) shows the cone of interest within which significance 448
could be judged 449
5.3 Hydrological modification of wetland 450
5.3.1 Modification about individual hydrological components 451
Figure 4 (A) shows the hydrological components of the wetlands like hydro-duration, WPF, and 452
water depth. Each map was sub-classed and the area under each was documented in table 2. 453
About the hydro-period, the absolute area under longer hydro-duration (>9 months) was reduced 454
from 69.04 to 42.81 km2 in between pre and post-dam periods. however, in terms of the 455
proportion of area, there was no significant change. The hydro-period below three months also 456
shows the significant reduction of the area indicating the improvement of hydrological state but 457
practically since the larger extent of area under this was completely obliterated in the post-dam 458
period. The same trend was also noticed in the case of WPF. Low WPF (<33%) zone was 459
squeezed from 743.12 km2 (68.44%) to 332.57 km2 (60.89%) in between pre and post-dam 460
periods (Table 2). High WPF was noticed slightly increased from 1.59% to 4.14%. In the case of 461
water depth, a significant increase (48.94% to 79.26%) of the proportion of wetland area was 462
noticed in the low water depth class (<2 m) and a decrease in high depth (>3m.) was observed. 463
High depth class area was declined from (371.31 km2) 34.70% to (10.49 km2) 1.92%. Some 464
areas were recognized where water depth was recorded low but despite having relatively greater 465
WPF and hydro-period. These areas may be highly susceptible to hydrological transformation in 466
the coming days. Figure 4 portrays that areas under each hydro-period, WPF, water depth sub-467
class was substantially decreased in the post-dam period. 468

469
Figure 4: (A) Hydrological components of wetland like hydro-period, WPF, and water depth (B) 470
hydrological strength state models using different ML models for both pre and post-dam periods 471
472

473
Table 2: Area under different parameters used for identification hydrological strength of the 474
wetland 475
Parameters Period Parameter
sub-class Area in km2 % of area
Hydro-period (month)
Pre-dam
Below 3 299.83 28.02
3 to 6 477.11 44.58
6 to 9 224.22 20.95
Above 9 69.04 6.45
Post-dam
Below 3 114.86 21.03
3 to 6 235.58 43.13
6 to 9 152.92 28.00
Above 9 42.81 7.84
WPF (%)
Pre-dam
Low 743.12 69.44
Moderate 310.03 28.97
High 17.05 1.59
Post-dam
Low 332.57 60.89
Moderate 191.01 34.97
High 22.59 4.14
Wetland water depth (m)
Pre-dam
Low (<2) 523.72 48.94
Moderate (2-3)
175.17 16.37
High (>3) 371.31 34.70
Post-dam
Low (<2) 432.89 79.26 Moderate
(2-3) 102.79 18.82
High (>3) 10.49 1.92
476
5.3.2 Modification in reference to Hydrological strength (HS) models 477
Figure 4B shows the hydrological strength (HS) using ANN, RF, and REPTree ML models both 478
for pre and post-dam periods. High HS was widely found across the river basin covering both 479
upper and lower catchments during the pre-dam period but a huge area under this category was 480
squeezed in the post-dam period. A large part of the wetland with high HS in the lower part of 481
the basin was lost showing maximum degree of conversion. A large tract of wetland with high 482
HS astride of river was also witnessed wetland transformation from high HS to moderate and 483

low. Table 3 depicts the area under different HS zones computed for each applied model. 484
Noticeably, it was found that the area under the high HS zone was about 47% as per all the 485
models but it was reduced to about 32% with very little inter-model areal fluctuation. The area 486
under moderate HS zone was declined about the absolute area (210 km2 to 187 km2) however in 487
terms of relative area, it was increased by 14%. The area under high HS was shifted to a 488
moderate HS zone. Applied ML HS models showed that there was no significant variation in 489
areal extents and geographical positions of high, moderate, and low HS zones and thus, all those 490
models could be valid. However, conventionally, it requires validation for finding out the most 491
suited one. 492
Table 3: Area under different Hydrological strength state categories using ML methods 493
Machine learning
algorithms
applied
Pre-dam Post-dam
Low Moderate High Low Moderate High
ANN 361.74 (33.80)
209.67 (19.59)
498.79 (46.61)
184.38 (33.75)
186.84 (34.20)
174.96 (32.03)
RF 361.96 (33.82)
210.11 (19.63)
498.13 (46.55)
192.24 (35.19)
182.41 (33.40)
171.52 (31.40)
REPTREE 361.89 (33.82)
209.52 (19.58)
498.79 (46.61)
185.8 (34.02)
186.9 (34.22)
173.47 (31.76)
494
5.3.3 Validation of HS models 495
From the applied statistical measures of validation, it is clear that all the applied models have an 496
excellent agreement between map and ground conditions and therefore, could be accepted. AUC 497
values range from 0.89 to 0.92, sensitivity from 0.89 to 0.9, specificity from 0.88 to 0.92, kappa 498
coefficient from 0.89 to 0.94 indicating the acceptability of all the models. However, to select the 499
best representative model, a comparative analysis of those values was done and the REPTree 500
model was recognized as the best suited since all the measures show the highest agreement 501
(Table 4). MCC value was also found 0.82 in the case of REPTree both during pre and post-dam 502
periods and this value is greater than MCC produced by the other models. 503
Table 4: Accuracy result of the wetland hydrological strength models using ML algorithm 504
Phases Models AUC
(ROC) Sensitivity Specificity MCC
Kappa
coefficient (K)

Pre-dam REPTree 0.91 0.9 0.92 0.82 0.91
RF 0.90 0.89 0.92 0.81 0.90
ANN 0.91 0.89 0.88 0.78 0.89
Post-dam REPTree 0.92 0.9 0.92 0.82 0.94
RF 0.9 0.89 0.92 0.81 0.92
ANN 0.89 0.89 0.88 0.78 0.92 505
5.4 Modification in reference to lateral hydrological connectivity 506
Flood water, flow of river water tie channel, groundwater flow connects the wetland with the 507
river (Tootchi et al., 2019; Yabusaki et al., 2020). Disconnection of some wetlands from lateral 508
flood spread limit deteriorates the water supply to the wetland. Figure 5 A and B respectively 509
represent the active inundation zones with possible floodwater depth in pre and post-dam periods 510
in the wetland domain. From the illustration, it is quite clear that the active inundation area in the 511
pre-dam period was considerably greater than the post-dam period. In the pre-dam period, the 512
inundation area was 4827.82 km2 which was reduced to 1627.30 km2 in the post-dam period. 513
Depth of floodwater ranged from 0 to 17 m. in pre-dam and 0 to 8 m. in post dam period. This 514
incident is directly linked with the dwindling of discharge and water level in the Atreyee river. 515
Spilling of the riverbank and rainfall are two major reasons behind rainfall in the flood plain 516
region. Pal et al. (2022) also identified the same declining trend of active inundation and area and 517
water depth in the post-dam period. River astride wetlands was also witnessed considerable 518
attenuation of water level and this led to reduction of inundated area. 519

520
Figure 5: Active inundation floodplain models of (A) pre-dam (B) post-dam periods (C) wetland 521
hydrological security state (WSS) about the active inundation limits (D) wetland matrix of WSS 522
and HS showing HS under different WSS zones 523
5.5 Wetland hydrological security state (WSS) concerning inundation 524
Based on the active inundation zones of the pre and post-dam period, the wetland was 525
categorized into safe, stress and critical, and definitions of each were mentioned in the concerned 526
method section. About the lateral flood water connectivity, 85.74 km2 (18.79%), 100.72 km2 527
(22.07%), and 359.72 km2 (78.85%) of wetland areas of the present time were classified into 528

critical, stress and safe wetland security. Wetland away from the main river was recognized as 529
critical due to the linkage of floodwater (Fig. 5C). 530
5.6 Hydrological strength in wetland hydrological security zone (WSS and HS matrix) 531
For further discrimination of wetland characters, the hydrological strength of existing wetland 532
under different WSS zones was featured to know that how are the wetland without having lateral 533
inundation water connectivity. Table 5 explains the HS character in different WSS zones. 534
Usually, it was hypothesized that critical and stress WSS zone will have poor HS and safe WSS 535
zone will have a high HS state with a greater proportion. Out of a total 85.74 km2 wetland under 536
the critical WSS zone, 78.14 km2 was characterized by low and moderate HS. In the stress, the 537
WSS zone total area was 100.72 km2, out of which 79.7 km2 fall under the low and moderate HS 538
zone (Table 5). On the other hand, out of a total 359.72 km2 wetland in the safe WSS zone, 539
40.26% wetland was characterized by a high HS state. The findings of the present WSS and HS 540
matrix satisfied the adopted hypothesis. 541
Table 5: Hydrological strength of wetland in different hydrological security states. The 542
computed area under each zone is given in the table 543
Wetland hydrological
security state (WSS)
Hydrological strength
(HS)
Area in post-dam period
Area in km2 Area in %
Safe
High 144.84 26.52
Moderate 96.36 17.64
Low 118.52 21.70
Stress
High 21.02 3.85
Moderate 43.37 7.94
Low 36.33 6.65
Critical
High 7.60 1.39
Moderate 47.26 8.65
Low 30.88 5.65
Note: Wetland hydrological security state was determined based on lateral inundation 544
connectivity and hydrological strength was determined based on hydrological components like 545
WPF, HP and water depth 546
547

5.7 Morphological change of wetland 548
Figure 6 depicts the wetland fragmentation status in pre and post-dam periods. From the figure, it 549
is very clear that there was well defined long wetland tract alongside the main river during the 550
pre-dam period. In the post-dam period, most of the continuous large wetland tract was found 551
fragmented. For instance, In the pre-dam period, 10.84% and 22.03% areas were under patch and 552
edge area respectively but these were inflated during the post-dam period (patch and edge areas 553
are 22.21% and 27.43%) signifying enhancement of adverse situation of wetland morphology. 554
Contrarily, the large core area was reduced from 52.11% to 33.71% in between pre-and post-dam 555
periods (Table 6). Growing fragmentation means increasing edge-area ratio which leads to the 556
enhancement of anthropogenic intervention (Shen et al., 2019; Kundu et al., 2021). Such change 557
is not only the alteration of landscape morphology, but it can adversely affect the serviceability 558
of such precious natural capital (Lu et al., 2019). 559
560
Figure 6. Wetland fragmentation showing patch, edge, perforated, small, medium, and large 561
cores of (a) pre-dam and (b) post-dam periods 562
563
Table 6: Proportion of area of landscape fragmentation for the post-monsoon season in pre and 564
post-dam periods 565
Landscape
Fragmentation
Wetland condition in post-monsoon seasons
Pre-dam Post-dam
Area (km2) Area (km2)
Patch 116.01(10.84%) 121.30 (22.21%)
Edge 235.77(22.03%) 149.81 (27.43%)

Perforated 15.30 (1.43%) 10.87 (1.99%)
Low core 122.32(11.43%) 64.23 (11.76%)
Medium core 22.80 (2.13%) 15.68 (2.87%)
Large core 557.68 (52.11%) 184.11 (33.71%)
566
5.8 Identifying associated modification in some specific cases 567
Ten wetlands from different parts of the study unit as mentioned in figure 1 were taken for 568
showing hydrological modification and associated other changes and their current trend (Figure 569
7). Driver-specific analysis endorsed the following findings like flow modification impact was 570
high to moderate in maximum wetlands and driver’s current trend at 60% cases were found 571
increasing and 40% cases the impact was continued as observed earlier. Inundation frequency 572
was found to decrease in most of the cases, inundation magnitude was found to decrease or 573
remain as usual. In association with those hydrological transformations, agricultural 574
encroachment, construction activities, water pollution, eutrophication, habitat change, 575
biodiversity loss, etc. were found degraded in most of the selected wetlands. Hydrological 576
strength is fundamental to an aquatic ecosystem (Meng et al., 2020; Li et al., 2021). Since the 577
wetlands witnessed the adverse impact of hydrological transformation, often promoted some 578
other associated causes like habitat quality change, water pollution, biodiversity loss, etc. Some 579
people residing near wetland areas also reported that after shallowing wetlands, inconsistence 580
water appearance in wetland, people received an opportunity to convert the wetland into 581
perennial agriculture land. 582

583
Figure: 7 Current trends and degree of driver’s impact on the wetland of Atreyee river basin 584
6. Discussion 585
From the result, it is very clear that damming brought a landmark hydrological change in the 586
river and riparian wetlands. The squeeze of active inundation plain impacted adversely to the 587
wetland hydrological security. Poor hydrological strength was detected in critical and stress 588
wetland insecurity zones. About 48.97% wetland area was wiped out after damming. A large 589
tract of the wetland along the confluence segment of the main river at its proximity also 590
hydrologically weakened. Now the questions how the hydrological modification, wetland loss is 591
related to river flow modification? 592
Discharge attenuation after damming was well reported in this paper and this finding is 593
supported by similar works conducted by Zheng et al. (2019), Amenuvor et al. (2020), Chen et 594
al. (2021), Gao et al. (2021) across the world. The rate of attenuation depends on the degree of 595
anthropogenic control as reported by Fleischmann et al. (2019). Pal (2016b) investigated 596
hydrological modification in the Atreyee river and reported that average flow was reduced by 597
53%, reduced overall flood frequency, and flood magnitude above extreme danger level was 598
attenuated by 46%. Talukdar and Pal (2020) also documented the same trend of extreme 599
hydrological change in the Punarbhaba river of Barind plain. 600
Since the flood plain wetlands are fed by rain and floodwater, the dynamics of the flood of a 601
river are strongly linked with riparian flood plain (Fritz et al., 2018; Vidon et al., 2019; Alafifi 602

and Rosenberg, 2020; Cui et al., 2021). Lowering of floodwater level in Atreyee river during 603
monsoon season was identified as a prime reason behind the reduction of the active flood plain. 604
Rainfall reduction (28.76%) was also identified inflow availability in river and wetland reduction 605
(Pal et al., 2022) and it is also a reason behind active flood plain squeeze. Embanking rivers and 606
restricting discharge up to an artificially elevated level also is a major cause behind less spread 607
flood water laterally (Galib et al., 2018; Sarkar et al., 2020). But if the embankment is breached 608
anyway, it may cause the sudden spread of water laterally obliterating the natural and manmade 609
infrastructures (Urzică et al., 2021). It can adversely affect the wetland hydrological stability and 610
associated ecology. Since the water level was attenuated and the increased volume of water 611
during extreme depression during monsoon was capacitated by the raised embankment, flood 612
severity except during breach time was found weak. It is a well-explored cause for active flood 613
plain squeeze. Mondal and Pal (2018) also reported an active flood plain squeeze incident in the 614
Mayurakshi river basin of Eastern India. 615
As a result of this squeeze of the active floodplain during the post-dam period, a good proportion 616
of wetland was left beyond the present flood spread limit and these wetlands were started to 617
suffer from water scarcity, paucity of nutrients, fish seeds, and so on. Flood water supply at a 618
regular interval not only makes the wetland hydrologically secure but also ecologically efficient. 619
For instance, free nutrient and fish seed supply reduces the cost of fishing and thereby supports 620
the livelihood of the fishermen. The concentration of chemical fertilizers, pesticides residues 621
within wetlands leads to a great ecological threat (Quintela et al., 2020) like strengthening exotic 622
species growth and arresting the growth of valuable endemic species (Maurya et al., 2019). 623
Regular flooding can remove such noxious residues and refresh the wetland habitat (Liu et al., 624
2018). Considering mainly water service of flooding, the wetlands were categorized into safe, 625
stress, and critical. Critical wetlands are not used to receive floodwater since from pre-dam 626
period and they are solely dependent on rainwater and seepage water. Lowering groundwater 627
tables and lessening rainfall (Pal et al., 2022) are therefore threats to the critical WSS. In the 628
stress WSS zone, floodwater is usually not received but rarely received. So, the wetland within 629
this zone is not hydrologically rich and ecologically prudent. Wetland within a safe zone receives 630
regular flood water and nutrients and therefore, is hydro-ecologically efficient. This sort of 631
wetland classification was also done by Talukdar and Pal (2020). 632

Analysis of HS models identified that a large part of the wetland within critical and stress WSS 633
zones suffer from hydrological weakness. For instance, inconsistent water appearance, narrow 634
hydro-period, shallow water depth were identified in these zones. Hydrological strength is 635
considerably better in the safe WSS zone. However, all parts of the wetlands are not 636
hydrologically stronger, some wetlands in very proximity to the main river within this zone were 637
identified hydrologically sick and it is in fact due to the erection of an embankment astride the 638
main river restricting natural flooding. In some cases, tie channels that connect river and wetland 639
water were also reclaimed mainly for agriculture purposes (Mukherjee et al., 2018; Pal and 640
Talukdar, 2019). Case studies from the present study area also proved the loss of tie channels and 641
hydrological degradation. Pal and Talukdar (2019), Saha and Pal (2019) also reported hydro-642
ecological deterioration of wetland due to tie channel loss. Some tie channels were identified 643
those were not reclaimed but their aggraded bed level at the off-take points is quite above the 644
normal water level, so they rarely get support from river discharge. These situations led to 645
hydrological degradation of river proximate wetland despite tie channel linking. 646
Lowering water availability in wetland, irregular water appearance for a short time often invites 647
agrarian people to invade the wetland. Initially, they used such area for seasonal cultivation but 648
gradually, they make it suitable for perennial agriculture land effacing its wetland characters 649
(Wondie, 2018). Often agriculture invasion is condemned as the most dominant cause behind 650
wetland loss in the flood plain region (Saha and Pal, 2019). Das and Pal (2018), Saha and Pal 651
(2019), Sarda and Pal (2021a) rightly pointed out hydrological deterioration can also promote 652
this vector. It may also promote the expansion of the built-up area since the study region is 653
densely populated. The increasing population demands more habitats for living. Often people 654
reclaim this land without considering its priceless serviceability. If such land is public, the rate of 655
reclamation is quite greater. All these are caused for the morphological transformation of 656
wetlands (Pal et al., 2022) as also found in this present study. Patch and edge dominated areas 657
were increased and the large core area was decreased in this present case. Increasing the edge 658
area ratio after growing fragmentation exerts extra pressure on wetland habitat and ecology 659
(Mukherjee and Pal, 2021). This trend of morphological wetland scape transformation is 660
commonly found across the world (Shen et al., 2019; Cui et al., 2021; Das et al., 2021; Kundu et 661
al., 2021). 662

For exploring hydrological change in wetland, image-driven hydrological components were used 663
for overcoming the issues of spatial scale data scarcity. Image-driven pixel scale hydro-period, 664
depth, and WPF data derivation is very useful for hydrological modeling over wider 665
geographical area time and cost-effectively. The approaches taken here for data derivation would 666
be much more refined and the resolution of the used images would be finer. In this regard, more 667
research is required. One or two hydrological monitoring stations at wetland is not just enough to 668
build a spatial hydrological strength model. So, it is now the chief alternative to fill the field-669
based data deficiency. Machine learning algorithms were applied for building the HS models to 670
resolve the complex spatial relationship among the parameters and use the robustness of the 671
models. Al-Abadi and Al-Najar (2020), Costache and Bui (2020), Pal and Paul (2020), Pal and 672
Sarda (2021) recommended ML models over other statistical models. A multi-model approach 673
was taken for justifying the best-suited model. Multiple statistical tests were applied for verifying 674
the suitability of the model. If all the applied statistical test results figure out the suitability of a 675
model, its acceptability will be very strong. In this study, REPTree was found as the best suited 676
confirmed by all the test results. WSS and HS matrix is a new way for featuring wetland 677
coupling inundation connectivity and current wetland hydrological conditions. This matrix 678
yielded nine wetland types with the specific nature of WSS and HS. 679
7. Conclusion 680
From the result, it is very evident that damming was a major determinant of river flow and in 681
consequence of the attenuation of river flow, the active flood plain region was squeezed by 682
66.29% curtailing the water supply to the wetlands away from the current active flood plain 683
limit. Flow alteration also leads to loss of extensive wetland area and existing wetland was also 684
witnessed remarkable hydrological alteration. Hydrological strength models exhibited that area 685
under high HS state was substantially reduced inflating area under relatively weaker HS state 686
zones. Integrated analysis of wetland hydrological security state (WSS) based on lateral flood 687
water connectivity and hydrological strength (HS) categories revealed that critical and stress 688
WSS zones recorded relatively poor HS. Weakening hydrological strength was also identified as 689
a major reason behind promoting wetland fragmentation as was noticed after damming in the 690
present study. 691
The result itself is a vital instrument for wetland management and restoration. Reduction of flow 692
is the primary reason behind attenuation of flood spread and squeezing flood water spread is 693

caused for enhancing wetland hydrological insecurity state. So, to formulate sustainable wetland 694
management and restoration strategies, it is very essential to release the ecologically viable 695
amount of water to the dam downstream segment. It can only revive the river and riparian 696
wetland ecology. It can also help to restore the wetlands left beyond lateral hydrological 697
connectivity. 698
Since the work clearly mapped the active flood plain zones after damming incidents and 699
recognized wetland within and beyond, it would be a good instrument for adopting priority basis 700
planning. Moreover, since the study further explored poor hydrological strength (HS) states 701
within critical and stress WSS zones, flood restoration is an effective option to improve 702
hydrological efficacy and wetland security. Maintaining water levels would be a panacea to 703
resolving the ongoing and upcoming crisis. Detail study is further required for setting a viable 704
amount of water flow that is to be released downstream. The study successfully linked the 705
alteration in river flow and hydrological conditions of the wetland applying an integrated 706
advanced hydrological modeling approach. This work would also be a good guide regarding the 707
exploration of image-based pixel scale hydrological data resolving spatial scale wetland 708
hydrological data scarcity. These are the novel contribution of this paper. However, adopting the 709
same approach or more updated approach, high spatial and temporal resolution data could 710
provide better output. Moreover, for analyzing the hydrological security of wetland, only 711
inundation connectivity was focused but tie channel connectivity, groundwater support in terms 712
of vertical hydrological connectivity were not taken into consideration. Because of spatial scale 713
data non-availability, these were not taken but the inclusion of all these could yield more 714
authentic results on wetland hydrological alteration. 715
Acknowledgments 716
The corresponding author of this article (Rajesh Sarda) would like to acknowledge University 717
Grants Commission (UGC Ref. No.: 3430/(NET-DEC 2018)), New Delhi, India for providing 718
financial support as a Junior Research fellowship to conduct the research work presented in this 719
paper. We would like to extend my gratitude to USGS for providing Landsat imageries. 720
721
722
723

References 724
Adel, M.M., 2013. Upstream water piracy, the strongest weapon of cornering a downstream 725
nation. Environment and Ecology Research, 1(3), pp.85-128. 726
Aghsaei, H., Dinan, N.M., Moridi, A., Asadolahi, Z., Delavar, M., Fohrer, N. and Wagner, P.D., 727
2020. Effects of dynamic land use/land cover change on water resources and sediment yield in 728
the Anzali wetland catchment, Gilan, Iran. Science of the Total Environment, 712, p.136449. 729
Al-Abadi, A.M. and Al-Najar, N.A., 2020. Comparative assessment of bivariate, multivariate 730
and machine learning models for mapping flood proneness. Natural Hazards, 100(2), pp.461-731
491. 732
Alafifi, A.H. and Rosenberg, D.E., 2020. Systems modeling to improve river, riparian, and 733
wetland habitat quality and area. Environmental Modelling & Software, 126, p.104643. 734
Ali, R., Kuriqi, A., Abubaker, S. and Kisi, O., 2019. Hydrologic alteration at the upper and 735
middle part of the Yangtze river, China: towards sustainable water resource management under 736
increasing water exploitation. Sustainability, 11(19), p.5176. 737
Amenuvor, M., Gao, W., Li, D. and Shao, D., 2020. Effects of Dam Regulation on the 738
Hydrological Alteration and Morphological Evolution of the Volta River Delta. Water, 12(3), 739
p.646. 740
Arabameri, A., Santosh, M., Saha, S., Ghorbanzadeh, O., Roy, J., Tiefenbacher, J.P., Moayedi, 741
H. and Costache, R., 2021. Spatial prediction of shallow landslide: application of novel rotational 742
forest-based reduced error pruning tree. Geomatics, Natural Hazards and Risk, 12(1), pp.1343-743
1370. 744
Arévalo-Mejía, R., Leblois, E., Salinas-Tapia, H., Mastachi-Loza, C.A., Bâ, K.M. and Díaz-745
Delgado, C., 2020. A baseline assessment of hydrologic alteration degree for the Mexican 746
catchments at gauged rivers (2016). Science of The Total Environment, 729, p.139041. 747
Barter, R.L. and Yu, B., 2018. Superheat: An R package for creating beautiful and extendable 748
heatmaps for visualizing complex data. Journal of Computational and Graphical 749
Statistics, 27(4), pp.910-922. 750

Bouramtane, T., Kacimi, I., Bouramtane, K., Aziz, M., Abraham, S., Omari, K., Valles, V., 751
Leblanc, M., Kassou, N., El Beqqali, O. and Bahaj, T., 2021. Multivariate Analysis and Machine 752
Learning Approach for Mapping the Variability and Vulnerability of Urban Flooding: The Case 753
of Tangier City, Morocco. Hydrology, 8(4), p.182. 754
Bregoli, F., Crosato, A., Paron, P. and McClain, M.E., 2019. Humans reshape wetlands: 755
Unveiling the last 100 years of morphological changes of the Mara Wetland, Tanzania. Science 756
of the Total Environment, 691, pp.896-907. 757
Chakraborty, R., Talukdar, S., Basu, T. and Pal, S., 2018. Habitat identity crisis caused by the 758
riparian wetland squeeze in Tangon River Basin, Barind Region, India. Spatial Information 759
Research, 26(5), pp.507-516. 760
Chen, W., Hong, H., Li, S., Shahabi, H., Wang, Y., Wang, X. and Ahmad, B.B., 2019. Flood 761
susceptibility modelling using novel hybrid approach of reduced-error pruning trees with 762
bagging and random subspace ensembles. Journal of Hydrology, 575, pp.864-873. 763
Chen, L., Wu, Y., Xu, Y.J. and Zhang, G., 2021. Alteration of flood pulses by damming the 764
Nenjiang River, China–Implication for the need to identify a hydrograph-based inundation 765
threshold for protecting floodplain wetlands. Ecological Indicators, 124, p.107406. 766
Cheng, J., Xu, L., Wang, X., Jiang, J. and You, H., 2018. Assessment of hydrologic alteration 767
induced by the Three Gorges Dam in Dongting Lake, China. River Research and 768
Applications, 34(7), pp.686-696. 769
Costache, R. and Bui, D.T., 2020. Identification of areas prone to flash-flood phenomena using 770
multiple-criteria decision-making, bivariate statistics, machine learning and their 771
ensembles. Science of The Total Environment, 712, p.136492. 772
Cui, G., Liu, Y. and Tong, S., 2021. Analysis of the causes of wetland landscape patterns and 773
hydrological connectivity changes in Momoge National Nature Reserve based on the Google 774
Earth Engine Platform. Arabian Journal of Geosciences, 14(3), pp.1-16. 775
Das, R.T. and Pal, S., 2018. Investigation of the principal vectors of wetland loss in Barind tract 776
of West Bengal. GeoJournal, 83(5), pp.1115-1131. 777

Das, S., Adhikary, P.P., Shit, P.K. and Bera, B., 2021. Urban wetland fragmentation and 778
ecosystem service assessment using integrated machine learning algorithm and spatial landscape 779
analysis. Geocarto International, pp.1-19. 780
Deforet T, Marmonier P, Rieffel D, Crini N, Giraudoux P, Gilbert D. 2009. Do parafluvial zones 781
have an impact in regulating river pollution? Spatial and temporal dynamics of nutrients, carbon, 782
and bacteria in a large gravel bar of the Doubs River (France). Hydrobiologia. 623(1):235–250. 783
Du, J., Wu, X., Wang, Z., Li, J. and Chen, X., 2020. Reservoir-Induced Hydrological Alterations 784
Using Ecologically Related Hydrologic Metrics: Case Study in the Beijiang River, 785
China. Water, 12(7), p.2008. 786
Duc, N.A., Nguyen, L.T., Thai, T.H., Khan, A., Rautenstrauch, K. and Schmidt, C., 2020. 787
Assessing cumulative impacts of the proposed Lower Mekong Basin hydropower cascade on the 788
Mekong River floodplains and Delta–Overview of integrated modeling methods and 789
results. Journal of Hydrology, 581, p.122511. 790
Epting, S.M., Hosen, J.D., Alexander, L.C., Lang, M.W., Armstrong, A.W. and Palmer, M.A., 791
2018. Landscape metrics as predictors of hydrologic connectivity between Coastal Plain forested 792
wetlands and streams. Hydrological processes, 32(4), pp.516-532. 793
Finlayson, C. M. (2013). Climate change and wise use of wetlands: informations from Australian 794
wet lands. Hydrobiologia, 708(1), 145–152. 795
Fleischmann, A., Collischonn, W., Paiva, R. and Tucci, C.E., 2019. Modeling the role of 796
reservoirs versus floodplains on large-scale river hydrodynamics. Natural Hazards, 99(2), 797
pp.1075-1104. 798
Fritz, K.M., Schofield, K.A., Alexander, L.C., McManus, M.G., Golden, H.E., Lane, C.R., 799
Kepner, W.G., LeDuc, S.D., DeMeester, J.E. and Pollard, A.I., 2018. Physical and chemical 800
connectivity of streams and riparian wetlands to downstream waters: a synthesis. JAWRA 801
Journal of the American Water Resources Association, 54(2), pp.323-345. 802
Gain, A.K. and Giupponi, C., 2015. A dynamic assessment of water scarcity risk in the Lower 803
Brahmaputra River Basin: An integrated approach. Ecological indicators, 48, pp.120-131. 804

Galib, S.M., Lucas, M.C., Chaki, N., Fahad, F.H. and Mohsin, A.B.M., 2018. Is current 805
floodplain management a cause for concern for fish and bird conservation in Bangladesh's largest 806
wetland?. Aquatic Conservation: Marine and Freshwater Ecosystems, 28(1), pp.98-114. 807
Gao, B.C., 1996. NDWI—A normalized difference water index for remote sensing of vegetation 808
liquid water from space. Remote sensing of environment, 58(3), pp.257-266. 809
Gao, Y., Chen, L., Zhang, W., Li, X. and Xu, Q., 2021. Spatiotemporal variations in 810
characteristic discharge in the Yangtze River downstream of the Three Gorges Dam. Science of 811
The Total Environment, 785, p.147343. 812
Ge, J., Peng, W., Huang, W., Qu, X. and Singh, S.K., 2018. Quantitative assessment of flow 813
regime alteration using a revised range of variability methods. Water, 10(5), p.597. 814
Ghasemain, B., Asl, D.T., Pham, B.T., Avand, M., Nguyen, H.D. and Janizadeh, S.J.V.J.O.E.S., 815
2020. Shallow landslide susceptibility mapping: A comparison between classification and 816
regression tree and reduced error pruning tree algorithms. Vietnam Journal of Earth 817
Sciences, 42(3), pp.208-227. 818
Greet, J., Fischer, S. and Russell, K., 2020. Longer duration flooding reduces the growth and 819
sexual reproductive efforts of a keystone wetland tree species. Wetlands Ecology and 820
Management, 28(4), pp.655-666. 821
Han, J., Kim, J., Park, S., Son, S. and Ryu, M., 2020. Seismic vulnerability assessment and 822
mapping of Gyeongju, South Korea using frequency ratio, decision tree, and random 823
forest. Sustainability, 12(18), p.7787. 824
Huang, F., Zhang, N., Guo, L.D. and Xia, Z.Q., 2016, August. Assessing the hydrologic 825
alteration of the Yangtze River using the histogram matching approach. In IOP Conference 826
Series: Earth and Environmental Science (Vol. 39, No. 1, p. 012002). IOP Publishing. 827
Huang, F., Li, F., Zhang, N., Chen, Q., Qian, B., Guo, L. and Xia, Z., 2017. A histogram 828
comparison approach for assessing hydrologic regime alteration. River Research and 829
Applications, 33(5), pp.809-822. 830

Huang, X., Suwal, N., Fan, J., Pandey, K.P. and Jia, Y., 2019. Hydrological Alteration 831
Assessment by Histogram Comparison Approach: A Case Study of Erdu River Basin, 832
China. Journal of Coastal Research, 93(SI), pp.139-145. 833
Jeziorska, J., 2019. UAS for wetland mapping and hydrological modeling. Remote 834
Sensing, 11(17), p.1997. 835
Karim, F., Marvanek, S., Merrin, L.E., Nielsen, D., Hughes, J., Stratford, D. and Pollino, C., 836
2020. Modelling Flood-Induced Wetland Connectivity and Impacts of Climate Change and 837
Dam. Water, 12(5), p.1278. 838
Khatun, R., Talukdar, S., Pal, S. and Kundu, S., 2021. Measuring dam induced alteration in 839
water richness and eco-hydrological deficit in flood plain wetland. Journal of Environmental 840
Management, 285, p.112157. 841
Kundu, S., Pal, S., Talukdar, S. and Mandal, I., 2021. Impact of wetland fragmentation due to 842
damming on the linkages between water richness and ecosystem services. Environmental Science 843
and Pollution Research, pp.1-20. 844
Lee, S., McCarty, G.W., Moglen, G.E., Lang, M.W., Jones, C.N., Palmer, M., Yeo, I.Y., 845
Anderson, M., Sadeghi, A.M. and Rabenhorst, M.C., 2020. Seasonal drivers of geographically 846
isolated wetland hydrology in a low-gradient, Coastal Plain landscape. Journal of 847
Hydrology, 583, p.124608. 848
Li, D., Long, D., Zhao, J., Lu, H. and Hong, Y., 2017. Observed changes in flow regimes in the 849
Mekong River basin. Journal of Hydrology, 551, pp.217-232. 850
Li, B., Yang, Z., Cai, Y. and Li, B., 2021. The frontier evolution and emerging trends of 851
hydrological connectivity in river systems: a scientometric review. Frontiers of Earth 852
Science, 15(1), pp.81-93. 853
Liu, Z., Zhao, L., Xu, T., Bu, F., Liu, X. and Zhou, D., 2018. Quantification of potential flood 854
inundation areas in the marsh wetland of Honghe National Natural Reserve, Northeast 855
China. Ecohydrology & Hydrobiology, 18(4), pp.355-364 856

Lu, C., Ren, C., Wang, Z., Zhang, B., Man, W., Yu, H., Gao, Y. and Liu, M., 2019. Monitoring 857
and assessment of wetland loss and fragmentation in the Cross-boundary Protected Area: a case 858
study of Wusuli River Basin. Remote Sensing, 11(21), p.2581. 859
Maurya, P.K., Malik, D.S., Yadav, K.K., Kumar, A., Kumar, S. and Kamyab, H., 2019. 860
Bioaccumulation and potential sources of heavy metal contamination in fish species in River 861
Ganga basin: Possible human health risks evaluation. Toxicology reports, 6, pp.472-481. 862
McFeeters, S.K., 1996. The use of the Normalized Difference Water Index (NDWI) in the 863
delineation of open water features. International journal of remote sensing, 17(7), pp.1425-1432. 864
Meng, B., Liu, J.L., Bao, K. and Sun, B., 2020. Methodologies and management framework for 865
restoration of wetland hydrologic connectivity: A synthesis. Integrated environmental 866
assessment and management, 16(4), pp.438-451. 867
Milani, M., Marzo, A., Toscano, A., Consoli, S., Cirelli, G.L., Ventura, D. and Barbagallo, S., 868
2019. Evapotranspiration from horizontal subsurface flow constructed wetlands planted with 869
different perennial plant species. Water, 11(10), p.2159. 870
Mitsch, W.J. and Gosselink, J.G., 2015. Wetlands. John Wiley & Sons. 871
Mondal, D. and Pal, S., 2018. Monitoring dual-season hydrological dynamics of seasonally 872
flooded wetlands in the lower reach of Mayurakshi River, Eastern India. Geocarto 873
International, 33(3), pp.225-239. 874
Mosavi, A., Ozturk, P. and Chau, K.W., 2018. Flood prediction using machine learning models: 875
Literature review. Water, 10(11), p.1536. 876
Mukherjee, K., Pal, S. and Mukhopadhyay, M., 2018. Impact of flood and seasonality on 877
wetland changing trends in the Diara region of West Bengal, India. Spatial Information 878
Research, 26(4), pp.357-367. 879
Mukherjee, K. and Pal, S., 2021. Hydrological and landscape dynamics of floodplain wetlands of 880
the Diara region, Eastern India. Ecological Indicators, 121, p.106961. 881

Nampak, H., Pradhan, B. and Abd Manap, M., 2014. Application of GIS based data driven 882
evidential belief function model to predict groundwater potential zonation. Journal of 883
Hydrology, 513, pp.283-300. 884
Nhu, V.H., Shirzadi, A., Shahabi, H., Singh, S.K., Al-Ansari, N., Clague, J.J., Jaafari, A., Chen, 885
W., Miraki, S., Dou, J. and Luu, C., 2020. Shallow landslide susceptibility mapping: A 886
comparison between logistic model tree, logistic regression, naïve bayes tree, artificial neural 887
network, and support vector machine algorithms. International journal of environmental 888
research and public health, 17(8), p.2749. 889
Onyango, D.O. and Opiyo, S.B., 2021. Detection of historical landscape changes in Lake 890
Victoria Basin, Kenya, using remote sensing multi-spectral indices. Watershed Ecology and the 891
Environment. 892
Orimoloye, I.R., Kalumba, A.M., Mazinyo, S.P. and Nel, W., 2020. Geospatial analysis of 893
wetland dynamics: wetland depletion and biodiversity conservation of Isimangaliso Wetland, 894
South Africa. Journal of King Saud University-Science, 32(1), pp.90-96. 895
Özelkan, E., 2020. Water body detection analysis using NDWI indices derived from landsat-8 896
OLI. Polish Journal of Environmental Studies, 29(2), pp.1759-1769. 897
Pal, S., 2016a. Impact of Massanjore dam on hydro-geomorphological modification of 898
Mayurakshi river, Eastern India. Environment, development and sustainability, 18(3), pp.921-899
944. 900
Pal, S., 2016b. Impact of water diversion on hydrological regime of the Atreyee river of Indo-901
Bangladesh. International Journal of River Basin Management, 14(4), pp.459-475. 902
Pal, S. and Saha, T.K., 2018. Identifying dam-induced wetland changes using an inundation 903
frequency approach: The case of the Atreyee River basin of Indo-Bangladesh. Ecohydrology & 904
Hydrobiology, 18(1), pp.66-81. 905
Pal, S. and Talukdar, S., 2019. Impact of missing flow on active inundation areas and 906
transformation of parafluvial wetlands in Punarbhaba–Tangon river basin of Indo-907
Bangladesh. Geocarto International, 34(10), pp.1055-1074. 908

Saha, T.K. and Pal, S., 2019. Exploring physical wetland vulnerability of Atreyee river basin in 909
India and Bangladesh using logistic regression and fuzzy logic approaches. Ecological 910
indicators, 98, pp.251-265. 911
Pal, S., Saha, A. and Das, T., 2019. Analysis of flow modifications and stress in the Tangon river 912
basin of the Barind tract. International Journal of River Basin Management, 17(3), pp.301-321. 913
Pal, S. and Paul, S., 2020. Assessing wetland habitat vulnerability in moribund Ganges delta 914
using bivariate models and machine learning algorithms. Ecological Indicators, 119, p.106866. 915
Pal, S. and Sarda, R., 2020. Damming effects on the degree of hydrological alteration and 916
stability of wetland in lower Atreyee River basin. Ecological Indicators, 116, p.106542. 917
Pal, S. and Talukdar, S., 2020. Modelling seasonal flow regime and environmental flow in 918
Punarbhaba river of India and Bangladesh. Journal of Cleaner Production, 252, p.119724. 919
Pal, S., Talukdar, S. and Ghosh, R., 2020. Damming effect on habitat quality of riparian 920
corridor. Ecological Indicators, 114, p.106300. 921
Pal, S. and Sarda, R., 2021a. Measuring the degree of hydrological variability of riparian wetland 922
using hydrological attributes integration (HAI) histogram comparison approach (HCA) and range 923
of variability approach (RVA). Ecological Indicators, 120, p.106966. 924
Pal, S. and Sarda, R., 2021b. Modelling water richness in riparian flood plain wetland using 925
bivariate statistics and machine learning algorithms and figuring out the role of 926
damming. Geocarto International, pp.1-24. 927
Pal, S., Sarkar, R. and Saha, T.K., 2022. Exploring the forms of wetland modifications and 928
investigating the causes in lower Atreyee river floodplain area. Ecological Informatics, 67, 929
p.101494. 930
Quintela, F.M., Lima, G.P., Silveira, M.L., Costa, P.G., Bianchini, A., Loebmann, D. and 931
Martins, S.E., 2019. High arsenic and low lead concentrations in fish and reptiles from Taim 932
wetlands, a Ramsar site in southern Brazil. Science of the Total Environment, 660, pp.1004-933
1014. 934

Rahmati, O., Falah, F., Dayal, K.S., Deo, R.C., Mohammadi, F., Biggs, T., Moghaddam, D.D., 935
Naghibi, S.A. and Bui, D.T., 2020. Machine learning approaches for spatial modeling of 936
agricultural droughts in the south-east region of Queensland Australia. Science of the Total 937
Environment, 699, p.134230. 938
Richter, B.D., Baumgartner, J.V., Braun, D.P. and Powell, J., 1998. A spatial assessment of 939
hydrologic alteration within a river network. Regulated Rivers: Research & Management: An 940
International Journal Devoted to River Research and Management, 14(4), pp.329-340 941
Rolls, R.J., Leigh, C. and Sheldon, F., 2012. Mechanistic effects of low-flow hydrology on 942
riverine ecosystems: ecological principles and consequences of alteration. Freshwater 943
Science, 31(4), pp.1163-1186. 944
Saha, T.K. and Pal, S., 2019a. Emerging conflict between agriculture extension and physical 945
existence of wetland in post-dam period in Atreyee River basin of Indo-946
Bangladesh. Environment, Development and Sustainability, 21(3), pp.1485-1505. 947
Saha, T.K. and Pal, S., 2019b. Exploring physical wetland vulnerability of Atreyee river basin in 948
India and Bangladesh using logistic regression and fuzzy logic approaches. Ecological 949
indicators, 98, pp.251-265. 950
Saha, T.K., Pal, S. and Sarkar, R., 2021. Prediction of wetland area and depth using linear 951
regression model and artificial neural network based cellular automata. Ecological 952
Informatics, 62, p.101272. 953
Sahour, H., Kemink, K.M. and O’Connell, J., 2022. Integrating SAR and Optical Remote 954
Sensing for Conservation-Targeted Wetlands Mapping. Remote Sensing, 14(1), p.159. 955
Santos, C.A.G., Kisi, O., da Silva, R.M. and Zounemat-Kermani, M., 2018. Wavelet-based 956
variability on streamflow at 40-year timescale in the Black Sea region of Turkey. Arabian 957
Journal of Geosciences, 11(8), pp.1-11. 958
Sarkar, U.K., Mishal, P., Borah, S., Karnatak, G., Chandra, G., Kumari, S., Meena, D.K., 959
Debnath, D., Yengkokpam, S., Das, P. and DebRoy, P., 2020. Status, potential, prospects, and 960

issues of floodplain wetland fisheries in India: synthesis and review for sustainable 961
management. Reviews in Fisheries Science & Aquaculture, 29(1), pp.1-32. 962
Sarda, R. and Das, P., 2018. Monitoring changing trends of water presence state in the major 963
manmade reservoirs of Mayurakshi river basin, eastern India. Spatial Information 964
Research, 26(4), pp.437-447. 965
Shaikhina, T., Lowe, D., Daga, S., Briggs, D., Higgins, R. and Khovanova, N., 2019. Decision 966
tree and random forest models for outcome prediction in antibody incompatible kidney 967
transplantation. Biomedical Signal Processing and Control, 52, pp.456-462. 968
Shen, G., Yang, X., Jin, Y., Xu, B. and Zhou, Q., 2019. Remote sensing and evaluation of the 969
wetland ecological degradation process of the Zoige Plateau Wetland in China. Ecological 970
Indicators, 104, pp.48-58 971
Shiau, J.T. and Wu, F.C., 2008. A histogram matching approach for assessment of flow regime 972
alteration: application to environmental flow optimization. River Research and 973
Applications, 24(7), pp.914-928. 974
Singha, P., Das, P., Talukdar, S. and Pal, S., 2020. Modeling livelihood vulnerability in erosion 975
and flooding induced river island in Ganges riparian corridor, India. Ecological Indicators, 119, 976
p.106825. 977
Smith, L.C., Turcotte, D.L. and Isacks, B.L., 1998. Stream flow characterization and feature 978
detection using a discrete wavelet transform. Hydrological processes, 12(2), pp.233-249. 979
Smith, A., Tetzlaff, D., Gelbrecht, J., Kleine, L. and Soulsby, C., 2020. Riparian wetland 980
rehabilitation and beaver re-colonization impacts on hydrological processes and water quality in 981
a lowland agricultural catchment. Science of the Total Environment, 699, p.134302. 982
Talukdar, S. and Pal, S., 2019. Effects of damming on the hydrological regime of Punarbhaba 983
river basin wetlands. Ecological Engineering, 135, pp.61-74. 984
Talukdar, S. and Pal, S., 2020. Modeling flood plain wetland transformation in consequences of 985
flow alteration in Punarbhaba river in India and Bangladesh. Journal of Cleaner 986
Production, 261, p.120767. 987

Teng, J., Xia, S., Liu, Y., Yu, X., Duan, H., Xiao, H. and Zhao, C., 2021. Assessing habitat 988
suitability for wintering geese by using Normalized Difference Water Index (NDWI) in a large 989
floodplain wetland, China. Ecological Indicators, 122, p.107260. 990
Tian, X., Zhao, G., Mu, X., Zhang, P., Tian, P., Gao, P. and Sun, W., 2019. Hydrologic alteration 991
and possible underlying causes in the Wuding River, China. Science of the Total 992
Environment, 693, p.133556. 993
Tian, Y., Xu, C., Hong, H., Zhou, Q. and Wang, D., 2019. Mapping earthquake-triggered 994
landslide susceptibility by use of artificial neural network (ANN) models: an example of the 995
2013 Minxian (China) Mw 5.9 event. Geomatics, Natural Hazards and Risk, 10(1), pp.1-25. 996
Tonkin, J.D., Merritt, D.M., Olden, J.D., Reynolds, L.V. and Lytle, D.A., 2018. Flow regime 997
alteration degrades ecological networks in riparian ecosystems. Nature ecology & 998
evolution, 2(1), pp.86-93. 999
Tootchi, A., Jost, A. and Ducharne, A., 2019. Multi-source global wetland maps combining 1000
surface water imagery and groundwater constraints. Earth System Science Data, 11(1), pp.189-1001
220. 1002
Urzică, A., Mihu-Pintilie, A., Stoleriu, C.C., Cîmpianu, C.I., Huţanu, E., Pricop, C.I. and 1003
Grozavu, A., 2021. Using 2D HEC-RAS Modeling and Embankment Dam Break Scenario for 1004
Assessing the Flood Control Capacity of a Multi-Reservoir System (NE Romania). Water, 13(1), 1005
p.57. 1006
van Oorschot, M., Kleinhans, M., Buijse, T., Geerling, G. and Middelkoop, H., 2018. Combined 1007
effects of climate change and dam construction on riverine ecosystems. Ecological 1008
engineering, 120, pp.329-344. 1009
Vidon, P.G., Welsh, M.K. and Hassanzadeh, Y.T., 2019. Twenty years of riparian zone research 1010
(1997–2017): Where to next?. Journal of environmental quality, 48(2), pp.248-260. 1011
Wang, Y., Zhang, N., Wang, D., Wu, J. and Zhang, X., 2018. Investigating the impacts of 1012
cascade hydropower development on the natural flow regime in the Yangtze River, 1013
China. Science of the total environment, 624, pp.1187-1194. 1014

Wang, D., Zhang, S., Wang, G., Han, Q., Huang, G., Wang, H., Liu, Y. and Zhang, Y., 2019. 1015
Quantitative assessment of the influences of Three Gorges Dam on the water level of Poyang 1016
Lake, China. Water, 11(7), p.1519. 1017
Wang, Y., Zhang, N., Wang, D. and Wu, J., 2020. Impacts of cascade reservoirs on Yangtze 1018
River water temperature: Assessment and ecological implications. Journal of Hydrology, 590, 1019
p.125240. 1020
Ward JV, Stanford JA (1989) The four-dimensional nature of lotic ecosystems. J N Am Benthol 1021
Soc 8:2–8 1022
Wondie, A., 2018. Ecological conditions and ecosystem services of wetlands in the Lake Tana 1023
Area, Ethiopia. Ecohydrology & Hydrobiology, 18(2), pp.231-244. 1024
Xiong, J., Li, J., Cheng, W., Wang, N. and Guo, L., 2019. A GIS-based support vector machine 1025
model for flash flood vulnerability assessment and mapping in China. ISPRS International 1026
Journal of Geo-Information, 8(7), p.297. 1027
Xue, L., Zhang, H., Yang, C., Zhang, L. and Sun, C., 2017. Quantitative assessment of 1028
hydrological alteration caused by irrigation projects in the Tarim River basin, China. Scientific 1029
Reports, 7(1), pp.1-13. 1030
Yabusaki, S.B., Myers‐Pigg, A.N., Ward, N.D., Waichler, S.R., Sengupta, A., Hou, Z., Chen, X., 1031
Fang, Y., Duan, Z., Serkowski, J.A. and Indivero, J., 2020. Floodplain inundation and 1032
salinization from a recently restored first‐order tidal stream. Water Resources Research, 56(7), 1033
p.e2019WR026850. 1034
Yan, Y., Yang, Z., Liu, Q. and Sun, T., 2010. Assessing effects of dam operation on flow 1035
regimes in the lower Yellow River. Procedia Environmental Sciences, 2, pp.507-516. 1036
Yang, T., Zhang, Q., Chen, Y.D., Tao, X., Xu, C.Y. and Chen, X., 2008. A spatial assessment of 1037
hydrologic alteration caused by dam construction in the middle and lower Yellow River, 1038
China. Hydrological Processes: An International Journal, 22(18), pp.3829-3843. 1039
Zheng, Y., Zhang, G., Wu, Y., Xu, Y.J. and Dai, C., 2019. Dam effects on downstream riparian 1040
wetlands: the Nenjiang River, Northeast China. Water, 11(10), p.2038. 1041

Declarations 1042
Ethical Approval 1043
Not applicable 1044
Consent to Participate 1045
Not applicable 1046
Consent to Publish 1047
Not applicable 1048
Authors Contributions 1049
All authors contributed to the study's conception and design. Conceptualization; Methodology 1050
designing; Writing – review & editing were performed by Dr. Swades Pal. Data curation; 1051
Investigation; Software; Validation; and Writing - original draft were performed by Rajesh Sarda 1052
and Dr. Tamal Kanti Saha. All the authors read and approved the final manuscript. 1053
Funding 1054
The corresponding author of the article (Rajesh Sarda) would receive a Junior Research 1055
fellowship to conduct the research work. 1056
Competing Interests 1057
The authors declare that they have no competing interests 1058
Availability of data and materials 1059
The datasets used and/or analyzed during the research work are available from the corresponding 1060
author on reasonable request. 1061