Methanotrophy potential versus methane supply by pore water diffusion in peatlands
14
Biogeosciences, 6, 1491–1504, 2009 www.biogeosciences.net/6/1491/2009/ © Author(s) 2009. This work is distributed under the Creative Commons Attribution 3.0 License. Biogeosciences Methanotrophy potential versus methane supply by pore water diffusion in peatlands E. R. C. Hornibrook, H. L. Bowes, A. Culbert, and A. V. Gallego-Sala Bristol Biogeochemistry Research Centre, Department of Earth Sciences, University of Bristol, Wills Memorial Building, Queens Road, Bristol BS8 1RJ, UK Received: 4 March 2008 – Published in Biogeosciences Discuss.: 18 June 2008 Revised: 13 July 2009 – Accepted: 22 July 2009 – Published: 7 August 2009 Abstract. Low affinity methanotrophic bacteria consume a significant quantity of methane in wetland soils in the vicin- ity of plant roots and at the oxic-anoxic interface. Estimates of the efficiency of methanotrophy in peat soils vary widely in part because of differences in approaches employed to quantify methane cycling. High resolution profiles of dis- solved methane abundance measured during the summer of 2003 were used to quantity rates of upward methane flux in four peatlands situated in Wales, UK. Aerobic incubations of peat from a minerotrophic and an ombrotrophic mire were used to determine depth distributions of kinetic parameters associated with methane oxidation. The capacity for methan- otrophy in a 3 cm thick zone immediately beneath the depth of nil methane abundance in pore water was significantly greater than the rate of upward diffusion of methane in all four peatlands. Rates of methane diffusion in pore water at the minerotrophic peatlands were small (<10%) compared to surface emissions during June to August. The proportions were notably greater in the ombrotrophic bogs because of their typically low methane emission rates. Methanotrophy appears to consume entirely methane transported by pore wa- ter diffusion in the four peatlands with the exception of 4 of the 33 gas profiles sampled. Flux rates to the atmosphere re- gardless are high because of gas transport through vascular plants, in particular, at the minerotrophic sites. Cumulative rainfall amount 3-days prior to sampling correlated well with the distance between the water table level and the depth of 0 μmol l -1 methane, indicating that precipitation events can impact methane distributions in pore water. Further work is needed to characterise the kinetics of methane oxidation spatially and temporally in different wetland types in order Correspondence to: E. R. C. Hornibrook ([email protected]) to determine generalized relationships for methanotrophy in peatlands that can be incorporated into process-based models of methane cycling in peat soils. 1 Introduction Alpha and gamma Proteobacteria belonging, respectively, to the Methylocystaceae and Methylococcaceae families are ubiquitous at oxic-anoxic interfaces in the Earth system where oxygen (O 2 ) is present and methane (CH 4 ) is trans- ported in large quantities under the influence of concentration gradients or ebullition. These microorganisms, also known as Type I (gamma) and Type II (alpha) methanotrophs, serve as an efficient filter, removing CH 4 that otherwise would en- ter the troposphere. Collectively low affinity methanotrophs in such environments annually consume a quantity of CH 4 well in excess of the ∼600 Tg that does enter the Earth’s at- mosphere from biological and geological sources (Fletcher et al., 2004). The anoxic soils of natural wetlands are one of the main perennial sources of CH 4 flux that help to maintain a low but significant quantity of this chemically and radiatively ac- tive organic gas in the Earth’s highly oxidizing atmosphere. More than three decades of study of methanotrophs in wet- lands and peatlands has yielded significant insights into their phylogeny, distribution, kinetics, and preferred growth con- ditions (e.g., Segers, 1998; Gutknecht, 2006; Chen et al., 2008). Methanotroph populations in the rhizosphere and with depth in peat soils have been mapped using molecular biology techniques, including PCR amplification of DNA ex- tracts and hybridisation with specific phylogenetic 16S rRNA and functional gene primers (e.g., Krumholz et al., 1995; Mc- Donald et al., 1996, 1999; Ritchie et al., 1997; Calhoun and Published by Copernicus Publications on behalf of the European Geosciences Union.
Transcript of Methanotrophy potential versus methane supply by pore water diffusion in peatlands
Biogeosciences, 6, 1491–1504, 2009www.biogeosciences.net/6/1491/2009/© Author(s) 2009. This work is distributed underthe Creative Commons Attribution 3.0 License.
Biogeosciences
Methanotrophy potential versus methane supply by pore waterdiffusion in peatlands
E. R. C. Hornibrook, H. L. Bowes, A. Culbert, and A. V. Gallego-Sala
Bristol Biogeochemistry Research Centre, Department of Earth Sciences, University of Bristol, Wills Memorial Building,Queens Road, Bristol BS8 1RJ, UK
Received: 4 March 2008 – Published in Biogeosciences Discuss.: 18 June 2008Revised: 13 July 2009 – Accepted: 22 July 2009 – Published: 7 August 2009
Abstract. Low affinity methanotrophic bacteria consume asignificant quantity of methane in wetland soils in the vicin-ity of plant roots and at the oxic-anoxic interface. Estimatesof the efficiency of methanotrophy in peat soils vary widelyin part because of differences in approaches employed toquantify methane cycling. High resolution profiles of dis-solved methane abundance measured during the summer of2003 were used to quantity rates of upward methane flux infour peatlands situated in Wales, UK. Aerobic incubations ofpeat from a minerotrophic and an ombrotrophic mire wereused to determine depth distributions of kinetic parametersassociated with methane oxidation. The capacity for methan-otrophy in a 3 cm thick zone immediately beneath the depthof nil methane abundance in pore water was significantlygreater than the rate of upward diffusion of methane in allfour peatlands. Rates of methane diffusion in pore water atthe minerotrophic peatlands were small (<10%) comparedto surface emissions during June to August. The proportionswere notably greater in the ombrotrophic bogs because oftheir typically low methane emission rates. Methanotrophyappears to consume entirely methane transported by pore wa-ter diffusion in the four peatlands with the exception of 4 ofthe 33 gas profiles sampled. Flux rates to the atmosphere re-gardless are high because of gas transport through vascularplants, in particular, at the minerotrophic sites. Cumulativerainfall amount 3-days prior to sampling correlated well withthe distance between the water table level and the depth of0µmol l−1 methane, indicating that precipitation events canimpact methane distributions in pore water. Further workis needed to characterise the kinetics of methane oxidationspatially and temporally in different wetland types in order
Correspondence to:E. R. C. Hornibrook([email protected])
to determine generalized relationships for methanotrophy inpeatlands that can be incorporated into process-based modelsof methane cycling in peat soils.
1 Introduction
Alpha and gamma Proteobacteria belonging, respectively,to the Methylocystaceae and Methylococcaceae families areubiquitous at oxic-anoxic interfaces in the Earth systemwhere oxygen (O2) is present and methane (CH4) is trans-ported in large quantities under the influence of concentrationgradients or ebullition. These microorganisms, also knownas Type I (gamma) and Type II (alpha) methanotrophs, serveas an efficient filter, removing CH4 that otherwise would en-ter the troposphere. Collectively low affinity methanotrophsin such environments annually consume a quantity of CH4well in excess of the∼600 Tg that does enter the Earth’s at-mosphere from biological and geological sources (Fletcheret al., 2004).
The anoxic soils of natural wetlands are one of the mainperennial sources of CH4 flux that help to maintain a lowbut significant quantity of this chemically and radiatively ac-tive organic gas in the Earth’s highly oxidizing atmosphere.More than three decades of study of methanotrophs in wet-lands and peatlands has yielded significant insights into theirphylogeny, distribution, kinetics, and preferred growth con-ditions (e.g., Segers, 1998; Gutknecht, 2006; Chen et al.,2008). Methanotroph populations in the rhizosphere andwith depth in peat soils have been mapped using molecularbiology techniques, including PCR amplification of DNA ex-tracts and hybridisation with specific phylogenetic 16S rRNAand functional gene primers (e.g., Krumholz et al., 1995; Mc-Donald et al., 1996, 1999; Ritchie et al., 1997; Calhoun and
Published by Copernicus Publications on behalf of the European Geosciences Union.

1492 E. R. C. Hornibrook et al.: Methanotrophy potential versus methane supply in peatlands
King, 1998; Edwards et al., 1998; Dedysh, 2002; Dedyshet al., 2001, 2003; Wartiainen et al., 2003; Miller et al.,2004), quantification of membrane phospholipids fatty acids(PLFA) (Krumholz et al., 1995; Sundh et al., 1995, 1997),and more recently stable isotope probing techniques involv-ing 13C-labelling of PLFAs and nucleic acids (Morris et al.2002; McDonald et al., 2005; Kreuzer-Martin, 2007; Chenet al., 2008). Both Type I and II methanotrophs occur inwetland soils, occupying oxic zones immediately adjacent toplant roots (King, 1994; 1996; Schipper and Reddy, 1996;Calhoun and King, 1998; van der Nat and Middelburg, 1998;Popp et al., 2000) and shallow zones within peat soils towhich atmospheric O2 is able to diffuse under edaphic condi-tions and vegetation groundcover specific to particular typesof wetlands (Krumholz et al., 1995; McDonald et al., 1996;Watson et al., 1997; Edwards et al., 1998; Beckman andLloyd, 2001; Megonigal and Schlesinger, 2002).
The tolerance of methanotrophs to anoxia appears to vary(Roslev and King, 1996). Greatly diminished levels ofmethanotrophic activity have been reported in post-anoxiaincubations of rhizome material (King, 1994) while sedimentand peat from other wetlands upon return to O2-rich con-ditions have shown CH4 oxidation capacities ranging frommoderately attenuated (e.g., King, 1990) to rapid and vig-orous (Whalen and Reeburgh, 2000). Methane supply ismost commonly cited as the factor limiting methanotrophy inpeat soils (Boon and Lee, 1997; Megonigal and Schlesinger,2002; Berestovskaya et al., 2005; Basiliko et al., 2007) al-though O2 availability also may restrict rates of CH4 uptake(King, 1990, 1994, 1996; Mikkela et al., 1995; Beckman andLloyd, 2001). Differences in the limiting factors betweenpeatlands likely results from a combination of soil propertiesaffecting gas exchange and heat transfer, the abundance andtypes of plants present, and water table depth, all of whichimpact the potential for CH4 oxidation and production (Ket-tunen et al., 1996; Kettunen, 2003). Water table level is aparticularly critical parameter because it controls the thick-ness of the unsaturated zone, which when enlarged enhancesthe capacity for methanotrophy, but conversely diminishesCH4 production at shallow depths in vicinity of the rhizo-sphere where methanogens benefit from higher temperaturesand an abundant supply of labile substrates from root exuda-tion (Roulet et al., 1993; Sundh et al., 1994; Kettunen et al.,1999; Strom et al., 2005). Despite the presence of methan-otrophy in this zone, CH4 flux from wetlands is significantlyenhanced by gas exchange with the atmosphere through theaerenchyma of vascular plants (Shannon et al., 1996; Joab-sson et al., 1999; Joabsson and Christensen, 2001; Oquistand Svensson, 2002; Strom and Christensen, 2007). In theabsence of high temporal resolution measurements of CH4flux capable of detecting sporadic ebullition events (Baird etal., 2004; Tokida et al., 2007a, b), estimates of CH4 emissionfrom wetlands will be dominated by passive or active trans-port of CH4 through vascular aquatic plants when suitableplants are present.
Attempts to quantify the efficiency of methanotrophy inpeat soils have yielded a wide range of estimates of CH4 con-sumption, in part, because of different methods employedand the limitations associated with specific approaches asdiscussed by Pearce and Clymo (2001). Le Mer and Roger(2001) concluded from a survey of literature that∼60 to 90%of CH4 produced in wetland soils is oxidized by methan-otrophs in the rhizosphere or shallow subsurface horizons;however, other estimates suggest a range of proportions, in-cluding 20–40% in general for natural wetlands (Whalen,2005), 15 to 76% of potential diffusive CH4 flux season-ally and∼43% annually of CH4 entering the oxic zone ofa freshwater marsh (Roslev and King, 1996),∼22% forconversion of CH4 to CO2 during transport through 10 cmof acrotelmSphagnum-rich peat (Pearce and Clymo, 2001),complete consumption within 20 cm of the water table in anundrained peatland (Roulet et al., 1993), 65±24% of CH4entering the rhizosphere ofSagittaria lancifolia estimatedby CH3F inhibition and 79±20% by mass balance (Schip-per and Reddy, 1996), 34.7±20.3% and 16.1±7.9% in therhizosphere, respectively, of bulrush and reed wetlands (vander Nat and Middelburg, 1998), 55% of upward diffusingCH4 in an Alaskan boreal peatland (Whalen and Reeburgh,2000), 52±10% and 81±9% in two tidal freshwater wetlandforests (Megonigal and Schlesinger, 2002), 0 to 34% rhizo-sphere oxidation of CH4 in aCarexfen determined using13Cmass balance (Popp et al., 1999), and 58 to 92% or<20% inthe same peatland depending upon whether CH4 consump-tion was quantified by subtracting in situ methane emissionrates from CH4 production rates measured in the laboratoryor in situ use of the CH3F inhibitor technique (Popp et al.,2000). Much of the variability in estimates of CH4 oxidationefficiency appears to stem from differences in methodology.As noted by Popp et al. (2000), CH4 production rates deter-mined in vitro likely lead to an overestimation of CH4 supplyin peat soils, contributing to the calculation of anomalouslyhigh proportions of CH4 removal by methanotroph activity.
We investigated the balance between CH4 supply by porewater diffusion and the quantity of CH4 emitted to the at-mosphere in four peatlands situated in Wales, UK duringthe summer of 2003 to determine the potential contributionof CH4 diffusion through pore water to total emissions andthe degree to which methanotrophs may consume CH4 trans-ported via pore water diffusion. Detailed (cm scale resolu-tion) in situ profiles of dissolved CH4 concentration weremeasured to estimate the supply of CH4 into the methan-otrophic zone at the sites. Complete attenuation of CH4transport via pore water diffusion was evident when the abun-dance of dissolved CH4 was ∼0µmol l−1 within the satu-rated zone. We compared estimated rates of CH4 transportby pore water diffusion to total quantites of CH4 emitted tothe atmosphere. We also used aerobic incubations of peatamended with CH4 to assess differences in CH4 uptake kinet-ics with depth and between two of the peatlands (a raised bogand an intermediate fen). In situ CH4 concentration data and
Biogeosciences, 6, 1491–1504, 2009 www.biogeosciences.net/6/1491/2009/

E. R. C. Hornibrook et al.: Methanotrophy potential versus methane supply in peatlands 1493
Table 1. Sites descriptions (after Hornibrook and Bowes, 2007).
Site Wetland Type Altitude pHb Dominant Vegetation
(m a.s.l.)a
Crymlyn Bog intermediate fen 9 5.5±0.5 (n = 20) Juncus squarrosum, Carex elata,Eriophorum gracile,Cladium mariscus, Sphagnumspp.
Gors Lwyd upland valley mire 385 4.9±0.6 (n = 20) Erica tetralix, Eriophorum angustifolium,Sphagnumspp.
Blaen Fign blanket bog 504 4.2±0.3 (n = 20) J. squarrosus, Calluna vulgaris,Trichophorum cespitosum, Molinia caerulea,Sphagnumspp.
Cors Caron raised bog 160 4.2±0.1 (n = 20) Rhyncospora alba, T. cespitosum, C. vulgaris,Narcethium ossifragum, M. caerulea, Sphag-numspp.
a m a.s.l. = meters above sea levelb Mean pore water pH±standard deviation (1σ ; n = # of measurements) from 5 to 45 cm depth for May to August 2003.
the determinedµm (maximum rates of CH4 oxidation) andKs (half saturation concentrations) values were employed toestimate the capacity for CH4 consumption in relation to thesupply of CH4 by pore water diffusion. Finally, we also in-vestigated relationships between cumulative rainfall in theperiod preceding pore water sampling and the distributionof CH4 with depth in the peatland soils to determine whetherthe timing of sampling impacted our results.
2 Site characterisation
2.1 Peatland descriptions
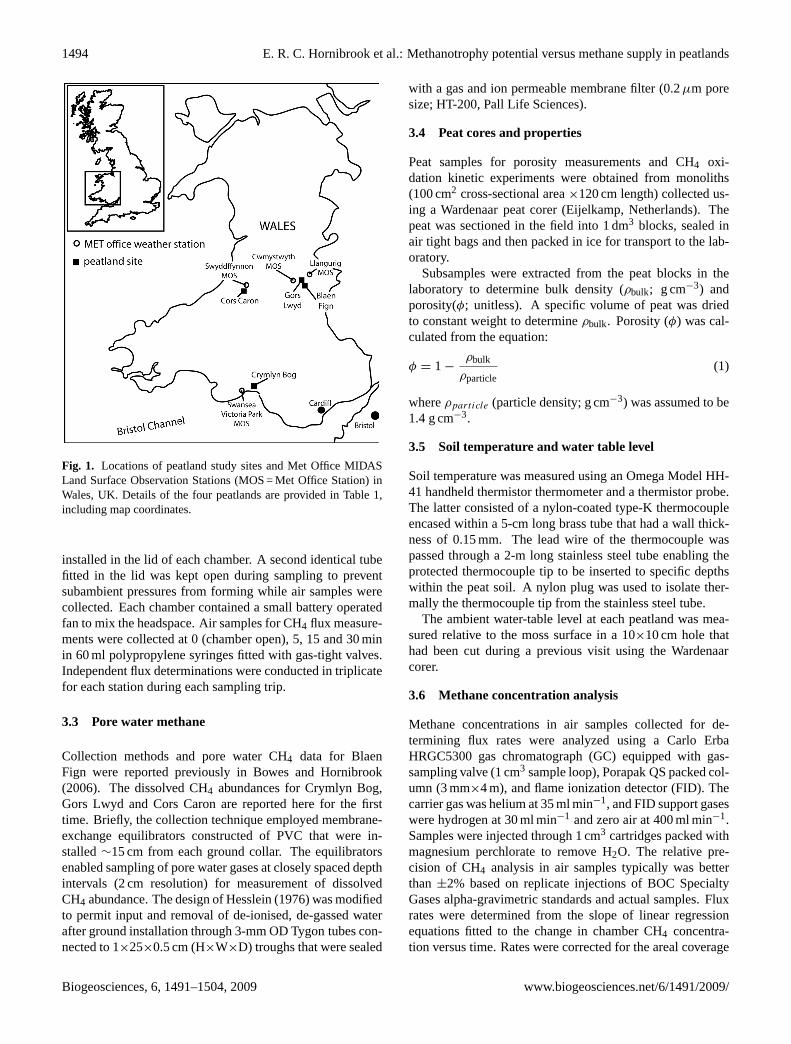
The locations of the four peatlands investigated in Wales,UK are shown in Fig. 1 and details about peatland eleva-tion, pore water pH, and dominant vegetation are providedin Table 1. Crymlyn Bog (51◦38’11′′ N, 03◦53’18”W) andGors Lwyd (52◦15’44′′ N, 03◦34′44′′ W) both receive waterinput from surrounding uplands via overland and subsurfaceflow and thus have slightly more alkaline pore water thanBlaen Fign (52◦15’44′′ N, 03◦34′ 44′′ W) and Cors Caron(52◦15′ 24′′ N, 03◦55′ 00′′ W), which are ombrotrophic bogs.Sphagnumspp. were common at all sites; however, pre-dictably the abundance of vascular plants was highest at thetwo minerotrophic peatlands Crymlyn Bog and Gors Lwyd.At each peatland, two adjacent stations (∼1 m apart) werechosen for installation of pore water equilibrators and groundcollars to support flux chambers. At Crymlyn Bog and BlaenFign the ground collars enclosed significantly different pro-portions of bryophytes and vascular plants withSphagnummoss dominating at station 1 and sedge, grass and rushspecies at station 2.
2.2 Weather data
Daily precipitation data for the period January to Decem-ber 2003 collected at UK Meteorological Office Stations atSwyddffynnon, Cwmystwyth, Llangurig and Swansea Victo-ria Park (Fig. 1) were obtained from the British AtmosphericData Centre (BADC) archive.
3 Analytical Methods
3.1 Sample collection
Pore water equilibrators and ground collars for flux chamberswere installed at the sites several months prior to the onsetof sampling which began in the spring of 2003. Measure-ments of in situ concentrations of pore water CH4 and CH4flux rates to the atmosphere were performed between Apriland September 2003 at the four peatlands. One peatland wassampled each week yielding on average one monthly data setfor each site during the growing season. Peat cores were col-lected in September 2005 for follow-up experiments investi-gating differences in methane oxidation kinetics with depthat Cors Caron and Crymlyn Bog.
3.2 Methane flux
Collection methods and CH4 flux data for all sites werereported previously in Bowes and Hornibrook (2006) andHornibrook and Bowes (2007). Briefly, flux chambers andground collars were constructed of polyvinyl chloride (PVC)and had a combined volume of either 11 or 15 l. The cham-bers were sealed onto the collars using large neoprene rub-ber o-rings coated with silicon grease and then covered withopaque lids also fitted with greased o-rings. Air sampleswere collected via a 4-m length of 3-mm OD Tygon tube
www.biogeosciences.net/6/1491/2009/ Biogeosciences, 6, 1491–1504, 2009
1494 E. R. C. Hornibrook et al.: Methanotrophy potential versus methane supply in peatlands
30
743
744
Figure 1. 745
746
Fig. 1. Locations of peatland study sites and Met Office MIDASLand Surface Observation Stations (MOS = Met Office Station) inWales, UK. Details of the four peatlands are provided in Table 1,including map coordinates.
installed in the lid of each chamber. A second identical tubefitted in the lid was kept open during sampling to preventsubambient pressures from forming while air samples werecollected. Each chamber contained a small battery operatedfan to mix the headspace. Air samples for CH4 flux measure-ments were collected at 0 (chamber open), 5, 15 and 30 minin 60 ml polypropylene syringes fitted with gas-tight valves.Independent flux determinations were conducted in triplicatefor each station during each sampling trip.
3.3 Pore water methane
Collection methods and pore water CH4 data for BlaenFign were reported previously in Bowes and Hornibrook(2006). The dissolved CH4 abundances for Crymlyn Bog,Gors Lwyd and Cors Caron are reported here for the firsttime. Briefly, the collection technique employed membrane-exchange equilibrators constructed of PVC that were in-stalled∼15 cm from each ground collar. The equilibratorsenabled sampling of pore water gases at closely spaced depthintervals (2 cm resolution) for measurement of dissolvedCH4 abundance. The design of Hesslein (1976) was modifiedto permit input and removal of de-ionised, de-gassed waterafter ground installation through 3-mm OD Tygon tubes con-nected to 1×25×0.5 cm (H×W×D) troughs that were sealed
with a gas and ion permeable membrane filter (0.2µm poresize; HT-200, Pall Life Sciences).
3.4 Peat cores and properties
Peat samples for porosity measurements and CH4 oxi-dation kinetic experiments were obtained from monoliths(100 cm2 cross-sectional area×120 cm length) collected us-ing a Wardenaar peat corer (Eijelkamp, Netherlands). Thepeat was sectioned in the field into 1 dm3 blocks, sealed inair tight bags and then packed in ice for transport to the lab-oratory.
Subsamples were extracted from the peat blocks in thelaboratory to determine bulk density (ρbulk; g cm−3) andporosity(φ; unitless). A specific volume of peat was driedto constant weight to determineρbulk. Porosity (φ) was cal-culated from the equation:
φ = 1 −ρbulk
ρparticle(1)
whereρparticle (particle density; g cm−3) was assumed to be1.4 g cm−3.
3.5 Soil temperature and water table level
Soil temperature was measured using an Omega Model HH-41 handheld thermistor thermometer and a thermistor probe.The latter consisted of a nylon-coated type-K thermocoupleencased within a 5-cm long brass tube that had a wall thick-ness of 0.15 mm. The lead wire of the thermocouple waspassed through a 2-m long stainless steel tube enabling theprotected thermocouple tip to be inserted to specific depthswithin the peat soil. A nylon plug was used to isolate ther-mally the thermocouple tip from the stainless steel tube.
The ambient water-table level at each peatland was mea-sured relative to the moss surface in a 10×10 cm hole thathad been cut during a previous visit using the Wardenaarcorer.
3.6 Methane concentration analysis
Methane concentrations in air samples collected for de-termining flux rates were analyzed using a Carlo ErbaHRGC5300 gas chromatograph (GC) equipped with gas-sampling valve (1 cm3 sample loop), Porapak QS packed col-umn (3 mm×4 m), and flame ionization detector (FID). Thecarrier gas was helium at 35 ml min−1, and FID support gaseswere hydrogen at 30 ml min−1 and zero air at 400 ml min−1.Samples were injected through 1 cm3 cartridges packed withmagnesium perchlorate to remove H2O. The relative pre-cision of CH4 analysis in air samples typically was betterthan ±2% based on replicate injections of BOC SpecialtyGases alpha-gravimetric standards and actual samples. Fluxrates were determined from the slope of linear regressionequations fitted to the change in chamber CH4 concentra-tion versus time. Rates were corrected for the areal coverage
Biogeosciences, 6, 1491–1504, 2009 www.biogeosciences.net/6/1491/2009/

E. R. C. Hornibrook et al.: Methanotrophy potential versus methane supply in peatlands 1495
and volume of the chambers, and are expressed in units ofmg CH4 m−2 d−1.
Methane was stripped from pore water into a headspace ofhelium using the method of McAullife (1971). The resultinggas samples were analyzed on the Carlo Erba HRGC5300gas chromatograph (GC) under the same conditions used foranalysis of CH4 in flux samples. Pore water concentrationsof CH4 were corrected for differences in peat porosity andare expressed in units ofµmol CH4 l−1.
3.7 Methane oxidation kinetics
Peat monoliths obtained from Cors Caron and Crymlyn Bogwere subsampled in 5 cm slices (∼0.5 dm3) centred on fivedepths (5, 12.5, 20, 27.5 and 35 cm). The material was slur-ried in a 1:1 ratio with autoclaved de-ionised water. Slurryfrom each depth was incubated in triplicate at 15◦C in crimp-top 35 ml Wheaton serum vials containing a headspace ofCH4 in zero air corresponding to initial dissolved CH4 con-centrations (S0) of ∼10, 25, 50, 100, 250 and 500µM. Anadditional slurry sample for each depth was incubated in sin-gular as a blank containing a headspace of air only to con-firm the absence of net CH4 production. Within two hours ofloading the vial headspace, the actual value ofS0 in each vialwas determined by GC-FID analysis of CH4 in the headspaceand Henry’s Law. The rate of CH4 oxidation was determinedsubsequently from the decrease in headspace concentrationof CH4 from time 0 (initial) to 24, 48 and 72 h. Gas sampleswere extracted using a 50µl Hamilton glass syringe fittedwith a side-hole needle and gas-tight valve. Methane con-centration was analyzed in triplicate using a Perkin ElmerClarus 500 gas chromatogram fitted with an Elite PLOT Qmega-bore column (30 m×0.53 mm diameter) and FID. Thecarrier gas was helium at 45 ml min−1 and FID support gaseswere hydrogen at 35 ml min−1 and zero air at 450 ml min−1.The CH4 oxidation rates determined independently in tripli-cate for each of the sixS0 values (i.e., 18 rate measurementsper depth) were used to determine the maximum specific rateof CH4 uptake (µm) and half saturation concentrations (Ks)for each depth interval in the two peatlands. Oxygen pre-sumably was not a limiting factor in our experiments giventhat the incubations were conducted in zero air and hence thesingle Monod expression was used to describe methanotrophconsumption of CH4 in the vials:
µ=
µm [CH4]
Ks + [CH4](2)
whereµ is the rate of methanotrophy (µmol l−1 h−1), µm
is the maximum specific rate of CH4 uptake (µmol l−1 h−1),[CH4] is the concentration of CH4 (µmol l−1) (i.e., S0 val-ues) andKs is the concentration of CH4 (µmol l−1) requiredto attain half the maximum rate of CH4 uptake. Equation (2)was fitted to the CH4 oxidation rate andS0 data using non-linear regression software (Prism v4.0, GraphPad Software,San Diego, CA, USA).
3.8 Diffusion rates for CH4 in pore water
The rate of upward CH4 diffusion in pore water at each peat-land was determined using Ficks 1st Law:
J = DS
(d [CH4]
dz
)(3)
whereJ is the flux rate (µmol cm2 s−1), Ds is the temper-ature and porosity corrected diffusion coefficient for CH4 inwater (cm2 s−1) andd[CH4]/dzis the CH4 concentration gra-dient (µmol cm−3 cm−1) with depth (cm) in peat soils. Ficks1st law was used because the amount of time required tosample an equilibrator profile (∼1 h) is small and hence themeasured gradients can be treated as being effectively steadystate. Final values ofJ are expressed in mg CH4 m−2 d−1
to facilitate comparison with CH4 fluxes to the atmospheremeasured using static chambers. The temperature depen-dency ofDS was based upon polynomial regression of dif-fusion coefficients for CH4 in water in the range 0 to 35◦C(83rd Edition of the Handbook of Physics and Chemistry)which yielded the relationship:
D = 8.889× 10⁻¹¹T 3− 1.714× 10⁻⁹T 2 (4)
+3.721× 10⁻⁷T + 8.771× 10⁻⁶
A value of D was calculated for each CH4 profile basedupon the mean soil temperature measured in situ across thedepth interval for which pore water CH4 concentration datawere linearly regressed to determined[CH4]/dz. Values ofDwere porosity corrected using Eq. (5) from Lerman (1979):
DS = Dφ2 (5)
whereφ is porosity (unitless). For each pore water data set,an average value ofφ was calculated from in situ porositymeasurements collected across thed[CH4]/dzdepth interval.
4 Results
4.1 Daily precipitation and timing of sampling
The timing of sample collection at Crymlyn Bog, CorsCaron, Blaen Fign and Gors Lwyd is shown in Fig. 2 in re-lation to total daily precipitation measured at UK Meteoro-logical Office Stations (MOSs) situated near the peatlands.Swansea Victoria Park (Fig. 2a) and Swyddffynnon (Fig. 2b)MOSs are located immediately adjacent to Crymlyn Bog andCors Caron, respectively, providing accurate daily precipita-tion records for each site. There are no active MOSs in closeproximity to either Blaen Fign or Gors Lwyd because oftheir remote locations in the Elan Valley. Consequently dailyprecipitation records from the Cwmystwyth and LlangurigMOSs, which geographically bracket the peatland sites, havebeen used (Fig. 2c and d)
www.biogeosciences.net/6/1491/2009/ Biogeosciences, 6, 1491–1504, 2009

1496 E. R. C. Hornibrook et al.: Methanotrophy potential versus methane supply in peatlands
31
746
Figure 2 747
748 Fig. 2. Sample collection dates at Crymlyn Bog (CB1 27.5.03; CB22.7.03; CB3 28.7.03; CB4 19.8.03), Cors Caron (CC1 7.5.03; CC217.6.03; CC3 14.7.03; CC4 25.8.03), Blaen Fign (BF1 30.4.03;BF2 4.6.03; BF3 8.7.03; BF4 5.8.03; BF5 2.9.03), and GorsLwyd (GL1 19.5.03; GL2 24.6.03; GL3 23.7.03; GL4 11.8.03)and daily precipitation amounts for 2003 from Met Office MIDASLand Surface Observation Stations at Swansea Victoria Park (src id1257; 51◦36′43′′N, 03◦57′43′′W; 8 m a.s.l.), Swyddffynnon (src id1204; 52◦16′19′′N, 03◦54′54′′W; 168 m a.s.l.), Cwmystwyth (src id1211; 52◦21′29′′N, 03◦48′07′′W; 301 m a.s.l.), and Llangurig (srcid 10432; 52◦24′14′′N, 03◦36′22′′W; 273 m a.s.l.).
4.2 Pore water CH4
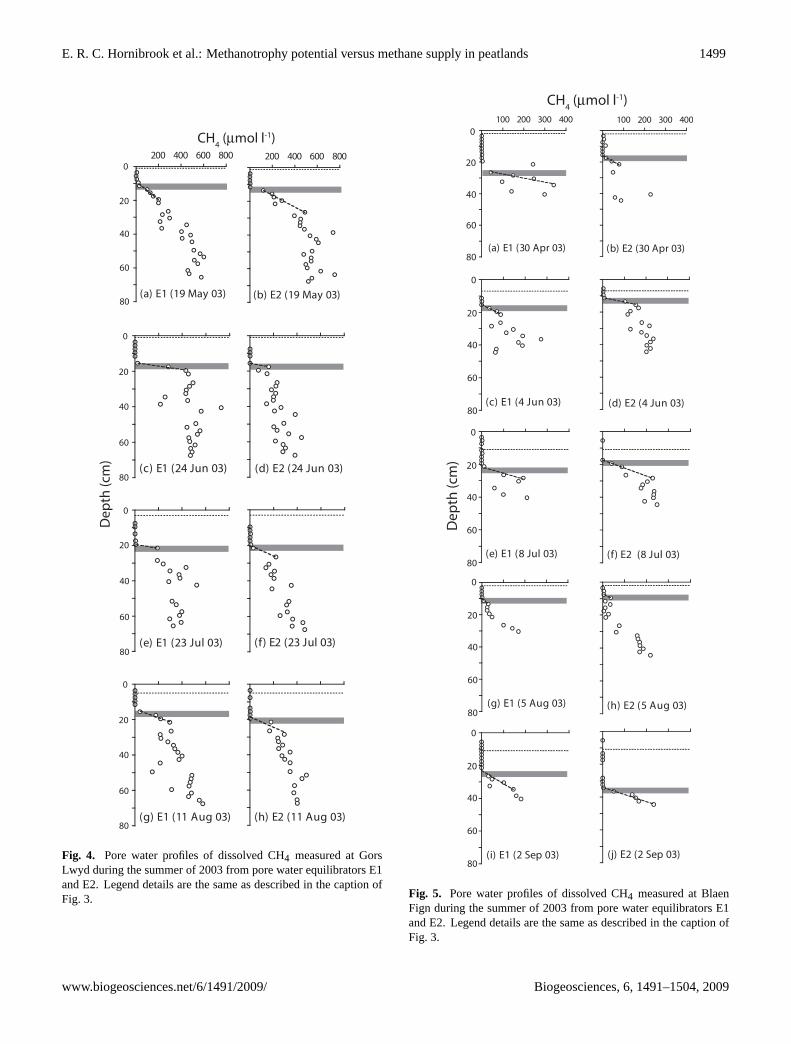
Pore water profiles of dissolved CH4, ambient water ta-ble levels, linear regression curves from which values ofd[CH4]/dz were obtained, and the 3 cm thick zone imme-diately beneath depth [CH4]0 in soils at the four peatlandsduring the summer of 2003 are shown in Figs. 3 to 6. Porewater CH4 concentration profiles at all sites exhibited a sim-ilar shape although the size of the zone beneath the watertable in which dissolved CH4 abundance was below the de-tection limit of our analysis method varied widely betweenpeatlands and sampling months at individual sites. The po-tential impact of the magnitude and timing of rainfall eventson the size of the zone where [CH4] <0µmol l−1 will be ex-plored further in Sect. 5.1.
4.3 CH4 oxidation kinetics
Maximum potential rates of CH4 oxidation (µm) and halfsaturation concentrations (Ks) determined from incubations
Dep
th (c
m)
CH4 (µmol l-1)
0
20
40
60
80
0
20
40
60
80
0
20
40
60
80
0
20
40
60
80
200 400 600 800
(a) E1 (7 May 03)
(b) E1 (2 Jul 03)
200 400 600 800
(c) E2 (2 Jul 03)
(d) E1 (28 Jul 03) (e) E2 (28 Jul 03)
(f) E1 (19 Aug 03) (g) E2 (19 Aug 03)
Fig. 3. Pore water profiles of dissolved CH4 measured at CrymlynBog during the summer of 2003 from pore water equilibrators E1and E2. Water-table level in each panel is indicated by a dotted hori-zontal line and inverted filled triangle. The dashed line through shal-low CH4 values trending to zero concentration is a regression linefitted to the data to determine the gradient d[CH4]/dz, which wasused to calculate rates of CH4 flux into the methanotrophic zoneand the depth at which [CH4] = 0µmol l−1 (i.e., the y-intercept de-noted as [CH4]0). The gray horizontal bar delineates a 3 cm thickzone immediately beneath depth [CH4]0 in which potential ratesof CH4 oxidation were calculated based upon experimentally deter-mined kinetic parameters (see Sect. 4.3) and in situ dissolved CH4concentrations. If gaps existed in pore water [CH4] data, missingvalues were interpolated between adjacent CH4 concentrations, in-cluding when necessary the point [CH4]0 = 0µmol l−1.
Biogeosciences, 6, 1491–1504, 2009 www.biogeosciences.net/6/1491/2009/

E. R. C. Hornibrook et al.: Methanotrophy potential versus methane supply in peatlands 1497
Table 2. Maximum CH4 oxidation rates (µm) and half saturation constants (Ks )
Depth S0= 10 to 500µmol l−1 S0= 10 to 100µmol l−1
Site Interval µm±SEa Ks±SEa µm±SEa Ks±SEa
cm µmol l−1 h−1 µmol l−1 µmol l−1 h−1 µmol l−1
Crymlyn Bog 2.5 to 7.5 26±8 231±116 4.1±0.9 8.3±8.010 to 15 70±78 903±1329 dncb dncb
17.5 to 22.5 40±19 198±187 3.3±1.9 10.2±20.125 to 30 8±2 137±93 1.8±1.8 11.5±40.032.5 to 37.5 dncb dncb dncb dncb
Cors Caron 2.5 to 7.5 24±3 83±30 21.1±6.4 68.1±38.010 to 15 103±97 881±1091 15.6±3.9 45.8±25.117.5 to 22.5 106±88 956±1026 14.5±4.0 51.2±28.625 to 30 43±17 353±208 10.5±1.9 42.6±17.132.5 to 37.5 25±8 54±49 dncb dncb
a SE = standard errorb dnc = did not converge
of slurried peat are presented in Table 2. The methanotro-phy rate andS0 data were fitted twice with Eq. (2): onceusing all data (S0 = 10 to 500µmol l−1) and a second timeexcluding theS0 = 250 and 500µmol l−1 measurements (i.e.,usingS0 = 10 to 100µmol l−1). Theµm andKs values de-termined using all data are anomalous, in particular, theKs
values which exceed all half saturation constants reported todate for low affinity methanotropy by 1 to 2 orders of mag-nitude. Theµm values are similarly high with values fromthe two samples in the depth interval 10 to 22.5 cm at CorsCaron being∼10 times greater than any maximum potentialrates for CH4 oxidation in freshwater environments reportedto date. These anomalous values appear to result from thedisproportionate effects of high CH4 oxidation rates deter-mined from the small number of incubations havingS0 = 250and 500µmol l−1. Such concentrations of CH4 are uncom-mon in situ at the oxic-anoxic interface in peatlands and con-sequently, Eq. (2) was fit to the data a second time exclud-ing CH4 oxidation rates from the two highest values ofS0(250 and 500µmol l−1). The resultingµm andKs values areconsistent with kinetic parameters typically associated withlow affinity methanotrophy in aerobic environments. Thehalf saturation concentrations are still amongst the highestreported to date; however, they are similar to published val-ues ofKs for peat soils, which tend to be large relative toother methanotrophic environments (Segers, 1998).
Notably theS0 = 10 to 100µmol l−1 set of depth profilesof µm andKs samples do not show maxima at depths near thelower limit of water table fluctuations (which are present intheµm andKs values from analysis of the complete data set).Insteadµm values decrease steadily with increasing depth.The large standard errors associated with theKs parameterpreclude any broad generalisation about trends with depth ofthe half saturation constant in soils at either site.
4.4 Rates of CH4 flux and consumption
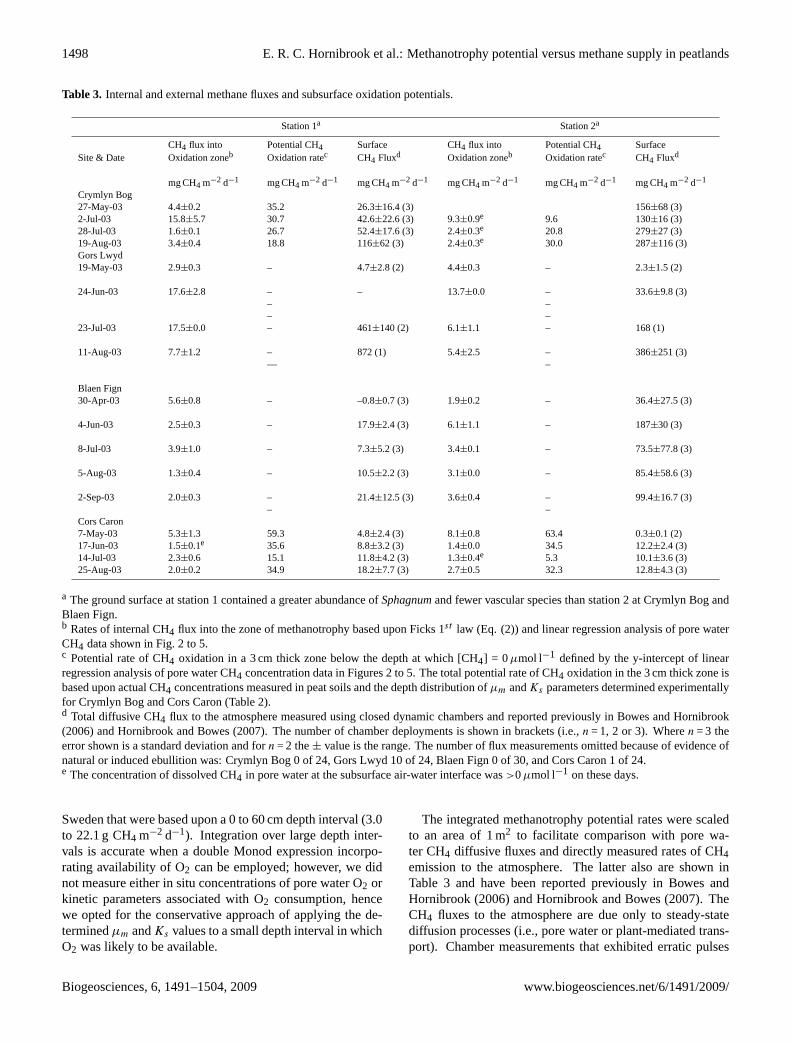
A summary of rates of internal and external CH4 fluxes(all sites) and subsurface methanotrophy potentials (Crym-lyn Bog and Cors Caron only) are presented in Table 3. Ratesof upward CH4 flux into the methanotrophic zone were de-termined according to the method described in Sect. 3.8 andthen scaled to a cross-sectional area of 1 m2. The majorityof CH4 fluxes by pore water diffusion had a magnitude<10mg m−2 d−1. The concentration of dissolved CH4 at the wa-ter table surface was>0µmol l−1 in only 5 of the 33 porewater CH4 profiles (Figs. 3c, e, g, 6c and f), suggesting thatdiffusion of CH4 across the air-water interface contributes lit-tle to atmospheric emissions of CH4 at these sites. Methaneescaping from the water surface within the peat profile muststill transit pore spaces and methanotroph populations in theunsaturated zone before reaching the atmosphere.
In all cases the rate of upward CH4 flux was less than thecapacity for CH4 oxidation determined in a 3 cm thick zoneimmediately below the depth at which [CH4] = 0µmol l−1
(Table 3). The potential for methanotrophy in the 3 cm thickzone was estimated by integrating rates of CH4 oxidation cal-culated by substituting values ofµm andKs , and in situ dis-solved CH4 concentrations into Eq. (2). A peat interval of3 cm downward from the point [CH4]0 was chosen because(i) depths above the point [CH4]0 yield methanotrophy rates(µ) equal to zero using Eq. (2), (ii) 3 cm was the minimumdepth reported by Beckmann and Lloyd (2001) for penetra-tion of O2 by diffusion into a Scottish peat soil, and (iii) ouraim was to provide a conservative estimate of CH4 oxidationpotentials based upon the kinetic parameters determined inlaboratory incubations. For example, the values of potentialcapacity for CH4 uptake noted in Table 3 (mg CH4 m−2 d−1)are∼3 orders of magnitude smaller than integrated oxidationrates reported by Sundh et al. (1994) for boreal peatlands in
www.biogeosciences.net/6/1491/2009/ Biogeosciences, 6, 1491–1504, 2009
1498 E. R. C. Hornibrook et al.: Methanotrophy potential versus methane supply in peatlands
Table 3. Internal and external methane fluxes and subsurface oxidation potentials.
Station 1a Station 2a
CH4 flux into Potential CH4 Surface CH4 flux into Potential CH4 SurfaceSite & Date Oxidation zoneb Oxidation ratec CH4 Fluxd Oxidation zoneb Oxidation ratec CH4 Fluxd
mg CH4 m−2 d−1 mg CH4 m−2 d−1 mg CH4 m−2 d−1 mg CH4 m−2 d−1 mg CH4 m−2 d−1 mg CH4 m−2 d−1
Crymlyn Bog27-May-03 4.4±0.2 35.2 26.3±16.4 (3) 156±68 (3)2-Jul-03 15.8±5.7 30.7 42.6±22.6 (3) 9.3±0.9e 9.6 130±16 (3)28-Jul-03 1.6±0.1 26.7 52.4±17.6 (3) 2.4±0.3e 20.8 279±27 (3)19-Aug-03 3.4±0.4 18.8 116±62 (3) 2.4±0.3e 30.0 287±116 (3)Gors Lwyd19-May-03 2.9±0.3 – 4.7±2.8 (2) 4.4±0.3 – 2.3±1.5 (2)
24-Jun-03 17.6±2.8 –––
– 13.7±0.0 –––
33.6±9.8 (3)
23-Jul-03 17.5±0.0 – 461±140 (2) 6.1±1.1 – 168 (1)
11-Aug-03 7.7±1.2 –—
872 (1) 5.4±2.5 ––
386±251 (3)
Blaen Fign30-Apr-03 5.6±0.8 – –0.8±0.7 (3) 1.9±0.2 – 36.4±27.5 (3)
4-Jun-03 2.5±0.3 – 17.9±2.4 (3) 6.1±1.1 – 187±30 (3)
8-Jul-03 3.9±1.0 – 7.3±5.2 (3) 3.4±0.1 – 73.5±77.8 (3)
5-Aug-03 1.3±0.4 – 10.5±2.2 (3) 3.1±0.0 – 85.4±58.6 (3)
2-Sep-03 2.0±0.3 ––
21.4±12.5 (3) 3.6±0.4 ––
99.4±16.7 (3)
Cors Caron7-May-03 5.3±1.3 59.3 4.8±2.4 (3) 8.1±0.8 63.4 0.3±0.1 (2)17-Jun-03 1.5±0.1e 35.6 8.8±3.2 (3) 1.4±0.0 34.5 12.2±2.4 (3)14-Jul-03 2.3±0.6 15.1 11.8±4.2 (3) 1.3±0.4e 5.3 10.1±3.6 (3)25-Aug-03 2.0±0.2 34.9 18.2±7.7 (3) 2.7±0.5 32.3 12.8±4.3 (3)
a The ground surface at station 1 contained a greater abundance ofSphagnumand fewer vascular species than station 2 at Crymlyn Bog andBlaen Fign.b Rates of internal CH4 flux into the zone of methanotrophy based upon Ficks 1st law (Eq. (2)) and linear regression analysis of pore waterCH4 data shown in Fig. 2 to 5.c Potential rate of CH4 oxidation in a 3 cm thick zone below the depth at which [CH4] = 0µmol l−1 defined by the y-intercept of linearregression analysis of pore water CH4 concentration data in Figures 2 to 5. The total potential rate of CH4 oxidation in the 3 cm thick zone isbased upon actual CH4 concentrations measured in peat soils and the depth distribution ofµm andKs parameters determined experimentallyfor Crymlyn Bog and Cors Caron (Table 2).d Total diffusive CH4 flux to the atmosphere measured using closed dynamic chambers and reported previously in Bowes and Hornibrook(2006) and Hornibrook and Bowes (2007). The number of chamber deployments is shown in brackets (i.e.,n = 1, 2 or 3). Wheren = 3 theerror shown is a standard deviation and forn = 2 the± value is the range. The number of flux measurements omitted because of evidence ofnatural or induced ebullition was: Crymlyn Bog 0 of 24, Gors Lwyd 10 of 24, Blaen Fign 0 of 30, and Cors Caron 1 of 24.e The concentration of dissolved CH4 in pore water at the subsurface air-water interface was>0µmol l−1 on these days.
Sweden that were based upon a 0 to 60 cm depth interval (3.0to 22.1 g CH4 m−2 d−1). Integration over large depth inter-vals is accurate when a double Monod expression incorpo-rating availability of O2 can be employed; however, we didnot measure either in situ concentrations of pore water O2 orkinetic parameters associated with O2 consumption, hencewe opted for the conservative approach of applying the de-terminedµm andKs values to a small depth interval in whichO2 was likely to be available.
The integrated methanotrophy potential rates were scaledto an area of 1 m2 to facilitate comparison with pore wa-ter CH4 diffusive fluxes and directly measured rates of CH4emission to the atmosphere. The latter also are shown inTable 3 and have been reported previously in Bowes andHornibrook (2006) and Hornibrook and Bowes (2007). TheCH4 fluxes to the atmosphere are due only to steady-statediffusion processes (i.e., pore water or plant-mediated trans-port). Chamber measurements that exhibited erratic pulses
Biogeosciences, 6, 1491–1504, 2009 www.biogeosciences.net/6/1491/2009/
E. R. C. Hornibrook et al.: Methanotrophy potential versus methane supply in peatlands 1499
Dep
th (c
m)
CH4 (µmol l-1)
0
20
40
60
80
0
20
40
60
80
0
20
40
60
80
0
20
40
60
80
200 400 600 800
(a) E1 (19 May 03)
200 400 600 800
(b) E2 (19 May 03)
(c) E1 (24 Jun 03) (d) E2 (24 Jun 03)
(e) E1 (23 Jul 03) (f) E2 (23 Jul 03)
(g) E1 (11 Aug 03) (h) E2 (11 Aug 03)
Fig. 4. Pore water profiles of dissolved CH4 measured at GorsLwyd during the summer of 2003 from pore water equilibrators E1and E2. Legend details are the same as described in the caption ofFig. 3.
Dep
th (c
m)
CH4 (µmol l-1)
100 200 300 400
(a) E1 (30 Apr 03)
100 200 300 400
(b) E2 (30 Apr 03)
(c) E1 (4 Jun 03) (d) E2 (4 Jun 03)
(e) E1 (8 Jul 03) (f) E2 (8 Jul 03)
(g) E1 (5 Aug 03) (h) E2 (5 Aug 03)
(i) E1 (2 Sep 03) (j) E2 (2 Sep 03)
0
20
40
60
80
0
20
40
60
80
0
20
40
60
80
0
20
40
60
80
0
20
40
60
80
Fig. 5. Pore water profiles of dissolved CH4 measured at BlaenFign during the summer of 2003 from pore water equilibrators E1and E2. Legend details are the same as described in the caption ofFig. 3.
www.biogeosciences.net/6/1491/2009/ Biogeosciences, 6, 1491–1504, 2009

1500 E. R. C. Hornibrook et al.: Methanotrophy potential versus methane supply in peatlands
Dep
th (c
m)
CH4 (µmol l-1)
0
20
40
60
80
100 200 300 400
(a) E1 (7 May 03)
100 200 300 400
(b) E2 (7 May 03)
(c) E1 (17 Jun 03) (d) E2 (17 Jun 03)
(e) E1 (14 Jul 03) (f) E2 (14 Jul 03)
(g) E1 (25 Aug 03) (h) E2 (25 Aug 03)
0
20
40
60
80
0
20
40
60
80
0
20
40
60
80
Fig. 6. Pore water profiles of dissolved CH4 measured at CorsCaron during the summer of 2003 from pore water equilibratorsE1 and E2. Legend details are the same as described in the captionof Fig. 3.
(i.e., ebullition) were excluded from the flux analysis becauseit could not be determined conclusively whether the eventswere natural or induced artifically during sample collection(see Table 3, footnote d).
In the minerotrophic peatlands (Crymlyn Bog and GorsLwyd), CH4 emission rates to the atmosphere typically ex-ceeded maximum rates of CH4 transport by pore water diffu-sion by one to two orders of magnitude, in particular, duringsummer months (Table 3). Fluxes of CH4 to the atmospherewere much smaller from the ombrotrophic peatlands (BlaenFign and Cors Caron) with the exception of the sedge-richplot (station 2) at Blaen Fign, consistent with the well knownability of many aquatic vascular plants to mediate gas trans-port via aerenchymatous tissue.
5 Discussion
5.1 The influence of precipitation events on pore waterCH4 profiles
Rates of both aerobic and anaerobic microbial processes inpeat soils can be affected by rainfall events through the in-troduction of electron acceptors such as O2, SO2−
4 and NO−
3(Dise and Verry, 2001; Gauci et al., 2002; Gauci et al., 2004).Concentrations of microbial substrates in shallow peat layers,including dissolved gases (e.g., CH4), also may be influencedthrough dilution which may affect rates of processes such asmethanogenesis and methanotrophy (Kettunen et al., 1996).Thus the timing of CH4 flux measurements or sampling ofpore water CH4 concentrations should be considered whenpossible in relation to short-term precipitation events.
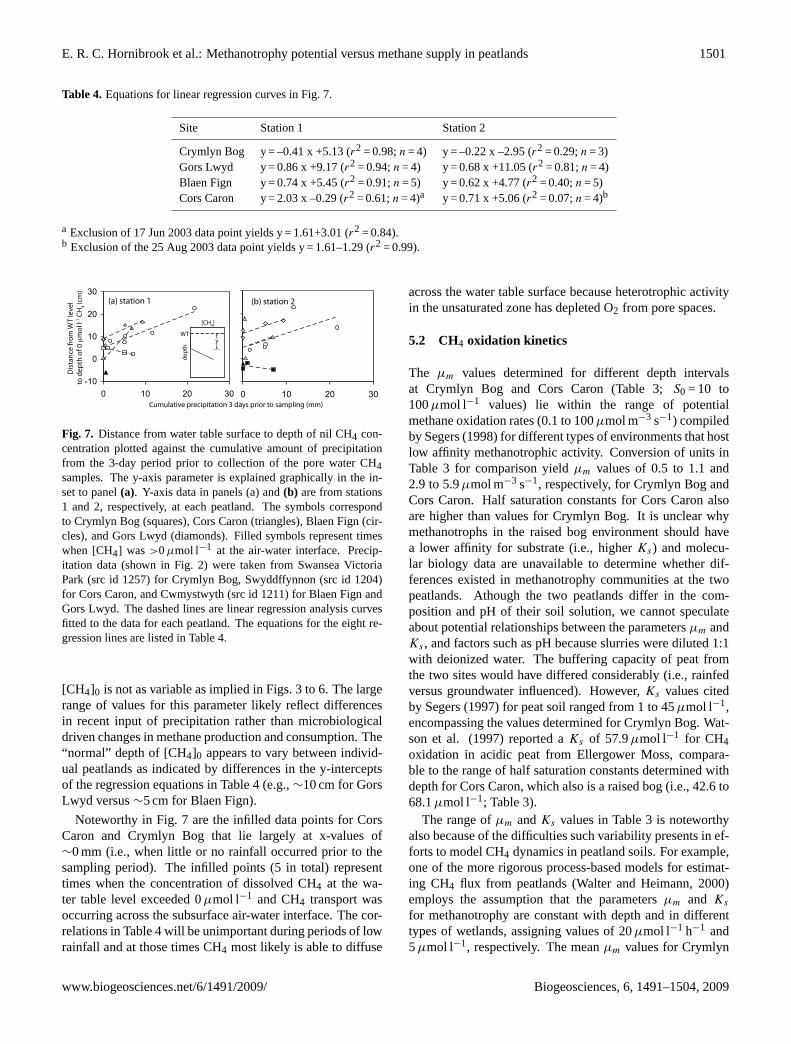
The distance between the water table level and depthwhere [CH4] = 0µmol l−1 (i.e., [CH4]0) differed greatly be-tween the four peatland sites and sampling periods at indi-vidual sites (Figs. 3 to 6). The potential influence of precipi-tation input on this parameter was explored by comparing thedepth to [CH4]0 in the saturated zone with rainfall amountson (i) the day of sampling, and (ii) the periods 1, 3, 5 and 7days before sampling of pore water. Significant correlationsexisted with cumulative rainfall during the period 3 daysprior to pore water sampling (Fig. 7 and Table 4) but not theamount of rainfall over shorter or longer periods before sam-ple collection (data not shown;r2 values typically<0.40). Afew of the weaker correlations in Fig. 7 (e.g., Cors Caron, sta-tions 1 and 2) result from single data points heavily skewingthe linear regression analysis because of the small size of thedata sets (i.e., typicallyn = 4). Regression lines have a nega-tive slope only for Crymlyn Bog, the most minerotrophic ofthe peatlands which receives significant moisture input fromgroundwater as well as precipitation. For the other threepeatlands, including Gors Lwyd which is positioned at thehead of a small catchment, the slopes of the regression equa-tions are positive. The analysis in Table 4 and Fig. 7 suggeststhat in the absence of significant rainfall events, the depth of
Biogeosciences, 6, 1491–1504, 2009 www.biogeosciences.net/6/1491/2009/
E. R. C. Hornibrook et al.: Methanotrophy potential versus methane supply in peatlands 1501
Table 4. Equations for linear regression curves in Fig. 7.
Site Station 1 Station 2
Crymlyn Bog y = –0.41 x +5.13 (r2 = 0.98;n = 4) y = –0.22 x –2.95 (r2 = 0.29;n = 3)Gors Lwyd y = 0.86 x +9.17 (r2 = 0.94;n = 4) y = 0.68 x +11.05 (r2 = 0.81;n = 4)Blaen Fign y = 0.74 x +5.45 (r2 = 0.91;n = 5) y = 0.62 x +4.77 (r2 = 0.40;n = 5)Cors Caron y = 2.03 x –0.29 (r2 = 0.61;n = 4)a y = 0.71 x +5.06 (r2 = 0.07;n = 4)b
a Exclusion of 17 Jun 2003 data point yields y = 1.61+3.01 (r2 = 0.84).b Exclusion of the 25 Aug 2003 data point yields y = 1.61–1.29 (r2 = 0.99).
-10
0
10
20
30
0 10 20 30 0 10 20 30Cumulative precipitation 3 days prior to sampling (mm)
Dis
tan
ce fr
om
WT
leve
l to
dep
th o
f 0 μ
mo
l l-1
CH
4 (c
m)
y
dep
th
[CH4]
WT
(a) station 1 (b) station 2
Fig. 7. Distance from water table surface to depth of nil CH4 con-centration plotted against the cumulative amount of precipitationfrom the 3-day period prior to collection of the pore water CH4samples. The y-axis parameter is explained graphically in the in-set to panel(a). Y-axis data in panels (a) and(b) are from stations1 and 2, respectively, at each peatland. The symbols correspondto Crymlyn Bog (squares), Cors Caron (triangles), Blaen Fign (cir-cles), and Gors Lwyd (diamonds). Filled symbols represent timeswhen [CH4] was >0µmol l−1 at the air-water interface. Precip-itation data (shown in Fig. 2) were taken from Swansea VictoriaPark (src id 1257) for Crymlyn Bog, Swyddffynnon (src id 1204)for Cors Caron, and Cwmystwyth (src id 1211) for Blaen Fign andGors Lwyd. The dashed lines are linear regression analysis curvesfitted to the data for each peatland. The equations for the eight re-gression lines are listed in Table 4.
[CH4]0 is not as variable as implied in Figs. 3 to 6. The largerange of values for this parameter likely reflect differencesin recent input of precipitation rather than microbiologicaldriven changes in methane production and consumption. The“normal” depth of [CH4]0 appears to vary between individ-ual peatlands as indicated by differences in the y-interceptsof the regression equations in Table 4 (e.g.,∼10 cm for GorsLwyd versus∼5 cm for Blaen Fign).
Noteworthy in Fig. 7 are the infilled data points for CorsCaron and Crymlyn Bog that lie largely at x-values of∼0 mm (i.e., when little or no rainfall occurred prior to thesampling period). The infilled points (5 in total) representtimes when the concentration of dissolved CH4 at the wa-ter table level exceeded 0µmol l−1 and CH4 transport wasoccurring across the subsurface air-water interface. The cor-relations in Table 4 will be unimportant during periods of lowrainfall and at those times CH4 most likely is able to diffuse
across the water table surface because heterotrophic activityin the unsaturated zone has depleted O2 from pore spaces.
5.2 CH4 oxidation kinetics
The µm values determined for different depth intervalsat Crymlyn Bog and Cors Caron (Table 3;S0 = 10 to100µmol l−1 values) lie within the range of potentialmethane oxidation rates (0.1 to 100µmol m−3 s−1) compiledby Segers (1998) for different types of environments that hostlow affinity methanotrophic activity. Conversion of units inTable 3 for comparison yieldµm values of 0.5 to 1.1 and2.9 to 5.9µmol m−3 s−1, respectively, for Crymlyn Bog andCors Caron. Half saturation constants for Cors Caron alsoare higher than values for Crymlyn Bog. It is unclear whymethanotrophs in the raised bog environment should havea lower affinity for substrate (i.e., higherKs) and molecu-lar biology data are unavailable to determine whether dif-ferences existed in methanotrophy communities at the twopeatlands. Athough the two peatlands differ in the com-position and pH of their soil solution, we cannot speculateabout potential relationships between the parametersµm andKs , and factors such as pH because slurries were diluted 1:1with deionized water. The buffering capacity of peat fromthe two sites would have differed considerably (i.e., rainfedversus groundwater influenced). However,Ks values citedby Segers (1997) for peat soil ranged from 1 to 45µmol l−1,encompassing the values determined for Crymlyn Bog. Wat-son et al. (1997) reported aKs of 57.9µmol l−1 for CH4oxidation in acidic peat from Ellergower Moss, compara-ble to the range of half saturation constants determined withdepth for Cors Caron, which also is a raised bog (i.e., 42.6 to68.1µmol l−1; Table 3).
The range ofµm andKs values in Table 3 is noteworthyalso because of the difficulties such variability presents in ef-forts to model CH4 dynamics in peatland soils. For example,one of the more rigorous process-based models for estimat-ing CH4 flux from peatlands (Walter and Heimann, 2000)employs the assumption that the parametersµm and Ks
for methanotrophy are constant with depth and in differenttypes of wetlands, assigning values of 20µmol l−1 h−1 and5µmol l−1, respectively. The meanµm values for Crymlyn
www.biogeosciences.net/6/1491/2009/ Biogeosciences, 6, 1491–1504, 2009
1502 E. R. C. Hornibrook et al.: Methanotrophy potential versus methane supply in peatlands
Bog and Cor Caron suggest that maximum rates of CH4 ox-idation may differ between minerotrophic and ombrogenousmires and in both cases appear to decrease gradually withdepth. As noted previously, half saturation concentrationsalso may be higher in acidic rainfed peatlands (e.g., Table 3and Watson et al., 1997). Availability of kinetic parame-ters describing CH4 oxidation in peatlands is too limited atpresent to attempt to develop generalised relationships de-scribingµm andKs in different types of peatlands and spa-tially and temporally within individual sites.
5.3 Methane supply, demand and net flux
The amount of upward CH4 transport in all four peatlands viapore water diffusion typically was<10 mg m−2 d−1 and ex-ceeded this value in only 4 of the 33 pore water CH4 profilescollected during the summer of 2003. Rates of CH4 emis-sion to the atmosphere from Blaen Fign and Cors Caron werethe same order of magnitude as pore water CH4 diffusionrates; however, it is unlikely that CH4 transport by this modecontributed to atmospheric flux. The stable carbon isotopecompositions (δ13C values) of CH4 in pore water and surfaceflux have been used previously to demonstrate that diffusiveemission of CH4 to the atmosphere at all four peatlands oc-curs predominately via plant-mediated transport (Bowes andHornibrook, 2006; Hornibrook and Bowes, 2007). For ex-ample, CH4 emitted at a higher rate from sedge-rich station2 at Blaen Fign hasδ13C values that are statistically indistin-guishable from CH4 emissions fromSphagnum-rich station1 (Bowes and Hornibrook, 2006). Theδ13C composition ofCH4 emissions from both plots are13C-depleted by∼15 to20‰ relative to pore water CH4, which eliminates the pos-sibility that the small quantities of CH4 emitted from station1 are residual CH4 that has survived transit across the unsat-urated zone (Happell et al., 1994; Popp et al., 1999). Sim-ilarly, CH4 emissions from Cors Caron, Crymlyn Bog andGors Lwyd also are13C-depleted relative to the pore wa-ter CH4 pool (Hornibrook and Bowes, 2007). These con-clusions about transport processes based upon stable isotopedata are consistent with the observation reported here thatlow affinity methanotrophs in the 3 cm thick zone where CH4first appears in the pore water pool (i.e., immediately belowthe depth [CH4]0) have a capacity for CH4 consumption thatsignificantly exceeds the upward CH4 supply via pore waterdiffusion (Table 3). While low affinity methanotrophs appearto consume the bulk of CH4 transported along concentrationgradients in pore water, they do not provide a robust bar-rier to CH4 flux from peatlands because of the prevalence ofCH4 movement through vascular plants which bypasses themethanotrophy filter. During June to August, microbial CH4oxidation rates ranged from 0.8 to 40.7% of total CH4 flux tothe atmosphere in Crymlyn Bog and Gors Lwyd; however,the majority of values were<10%. In the same months,the percentages were higher at sedge-poor plots at the om-brotrophic mires (Blaen Fign,∼9.3 to 53.4%; Cors Caron,
11.0 to 21.1%), but the difference in proportions is unim-portant because as indicated byδ13C data little or none ofthe diffusion transported CH4 contributed to surficial emis-sions (Hornibrook and Bowes, 2007). Consequently, in theabsence of bacterial CH4 oxidation the CH4 flux rate fromminerotrophic peatlands would not be significantly greaterin absolute terms but the increase would be proportionallymuch larger from the ombrotrophic bogs. The steady stateflux rates of>100 mg CH4 m−2 d−1 commonly observedfrom wetland soils (e.g., Whalen, 2005) would be difficult toachieve if pore water diffusion alone was the dominant trans-port mechanism. The bulk of CH4 emitted from peatlandstypically occurs via vascular plants and possibly ebullition,although data for the latter transport process remain sparse(Baird et al., 2004).
6 Conclusions
The depth below ambient water table levels at which dis-solved methane is depleted to∼0µmol l−1 by methan-otrophic activity varies widely between peatlands and tem-porally within individual peatlands. Short-term precipitationevents appear to increase the depth to [CH4]0 without nec-essarily disturbing dissolved CH4 profiles. In the absence ofrecent rainfall input, the depth of [CH4]0 below the water ta-ble level ranged from∼5 to 10 cm, although the size of theinterval diminished to 0 (i.e., CH4 present at the water ta-ble surface) during prolonged periods without precipitationinput.
The capacity for methanotrophy in peatland soils fromboth minerotrophic and ombrotrophic peatlands typicallywas greater than the available supply of upward diffusingCH4. Kinetic parameters (µm and Ks) describing the re-sponse of methanotroph populations to substrate (i.e., CH4)concentrations are not constant with depth as assumed insome process models and both parameters were larger in theombrotrophic versus minerotrophic peatlands. Low affinitymethanotrophic activity effectively consumes the majority ofupward diffusing CH4 in peatland soil (in most cases 100%).Maximum rates of CH4 flux by pore water diffusion wereat most 10 to 20 mg m−2 d−1, which in minerotrophic miresrepresents typically<10% of actual emissions. The gen-erally lower CH4 emission rates from ombrotrophic mireswould be impacted more by cessation or attentuation ofmethanotrophy activity but diffusive CH4 flux rates wouldstill amount to only a few 10 s of mg m−2 d−1.
Acknowledgements.We thank Mike Dury for manufactur-ing flux chambers and pore water equilibrators. HLB wassupported by an NERC postgraduate scholarship and AVGSby a NERC Industrial CASE scholarship. This study wasfunded by NERC (NER/B/S/2000/00076) and Royal Society(574006.G503/21832/SM) grants to ERCH. The UK Joint HigherEducation Funding Council for England and Office of Science andTechnology Science Research Investment Fund (SRIF), and the
Biogeosciences, 6, 1491–1504, 2009 www.biogeosciences.net/6/1491/2009/

E. R. C. Hornibrook et al.: Methanotrophy potential versus methane supply in peatlands 1503
University of Bristol are thanked for infrastructure funding. Wethank the British Atmospheric Data Centre (BADC) for technicaladvice and permission to use daily precipitation data from MetOffice weather stations in Wales.
Edited by: C. Slomp
References
Baird, A. J., Beckwith, C. W., Waldron, S., and Waddington,J. M.: Ebullition of methane-containing gas bubbles fromnear-surface sphagnum peat, Geophys. Res. Lett., 31, L21505,doi:10.1029/2004GL021157, 2004.
Basiliko, N., Blodau, C., Roehm, C., Bengtson, P., and Moore, T.R.: Regulation of decomposition and methane dynamics acrossnatural, commercially mined, and restored northern peatlands,Ecosystems, 10, 1148–1165, 2007.
Beckmann, M. and Lloyd, D.: Mass spectrometric monitoring ofgases (CO2, CH4, O2) in a mesotrophic peat core from KopparasMire, Sweden, Global Change Biol., 7, 171–180, 2001.
Berestovskaya, Y. Y., Rusanov, II, Vasil’eva, L. V., and Pimenov,N. V.: The processes of methane production and oxidation in thesoils of the Russian arctic tundra, Microbiology, 74, 221–229,2005.
Boon, P. I. and Lee, K.: Methane oxidation in sediments of a flood-plain wetland in south-eastern australia, Lett. Appl. Microbiol.,25, 138–142, 1997.
Bowes, H. L. and Hornibrook, E. R. C.: Emision of highly13C-depleted methane from an upland blanket mire, Geophys. Res.Lett., 33, L04401, doi:10.1029/2005GL025209, 2006.
Calhoun, A. and King, G. M.: Characterization of root-associatedmethanotrophs from three freshwater macrophytes:Pontederiacordata, Sparganium eurycarpum, andSagittaria latifolia, Appl.Environ. Microbiol., 64, 1099–1105, 1998.
Chen, Y., Dumont, M. G., McNamara, N. P., Chamberlain, P. M.,Bodrossy, L., Stralis-Pavese, N., and Murrell, J. C.: Diversityof the active methanotrophic community in acidic peatlands asassessed by mRNA and SIP-PLFA analyses, Environ. Microbiol.,10, 446–459, 2008.
Dedysh, S. N.: Methanotrophic bacteria of acidic sphagnum peatbogs, Microbiology, 71, 638–650, 2002.
Dedysh, S. N., Derakshani, M., and Liesack, W.: Detection andenumeration of methanotrophs in acidic sphagnum peat by 16srRNA fluorescence in situ hybridization, including the use ofnewly developed oligonucleotide probes forMethylocella palus-tris, Appl. Environ. Microbiol., 67, 4850–4857, 2001.
Dedysh, S. N., Dunfield, P. F., Derakshani, M., Stubner, S., Heyer,J., and Liesack, W.: Differential detection of type II methan-otrophic bacteria in acidic peatlands using newly developed 16srRNA-targeted fluorescent oligonucleotide probes, FEMS Mi-crobiology Ecology, 43, 299–308, 2003.
Dise, N. B. and Verry, E. S.: Suppression of peatland methane emis-sion by cumulative sulfate deposition in simulated acid rain, Bio-geochemistry, 53, 143—160, 2001.
Edwards, C., Hales, B. A., Hall, G. H., McDonald, I. R., Murrell, J.C., Pickup, R., Ritchie, D. A., Saunders, J. R., Simon, B. M., andUpton, M.: Microbiological processes in the terrestrial carboncycle: Methane cycling in peat, Atmos. Environ., 32, 3247–3255,1998.
Gauci, V., Dise, N., and Fowler, D.: Controls on suppres-sion of methane flux from a peat bog subjected to simu-lated acid rain sulfate deposition, Global Biogeochem. Cy., 16,doi:10.1029/2000GB001370, 1004, 2002.
Gauci, V., Matthews, E., Dise, N., Walter, B., Koch, D., Granberg,G., and Vile, M.: Sulfur pollution suppression of the wetlandmethane source in the 20th and 21st centuries, Proceedings of theNational Academy of Sciences of the United States of America,101, 12583–12587, 2004.
Gutknecht, J. L. M.: Linking soil process and microbial ecology infreshwater wetland ecosystems, Plant Soil, 289, 17–34, 2006.
Happell, J. D., Chanton, J. P., and Showers, W. S.: The influence ofmethane oxidation on the stable isotopic composition of methaneemitted from florida swamp forests, Geochimica et Cosmochim-ica Acta, 58, 4377-4388, 1994.
Hesslein, R. H.: An in situ sampler for close interval pore waterstudies, Limnol. Oceanogr., 912–914, 1976.
Hornibrook, E. R. C. and Bowes, H. L.: Trophic status impactsboth the magnitude and stable carbon isotope composition ofmethane flux from peatlands, Geophys. Res. Lett., 34, L21401,doi:10.1029/2007GL031231, 2007.
Joabsson, A. and Christensen, T. R.: Methane emissions from wet-lands and their relationship with vascular plants: An arctic ex-ample, Global Change Biol., 7, 919–932, 2001.
Joabsson, A., Christensen, T. R., and Wallen, B.: Vascular plantcontrols on methane emissions from northern peatforming wet-lands, Trends Ecol. Evol., 14, 385–388, 1999.
Kettunen, A.: Connecting methane fluxes to vegetationcover and water table fluctuations at microsite level:A modeling study, Global Biogeochem. Cy., 17, 1051,doi:10.1029/2002GB001958, 2003.
Kettunen, A., Kaitala, V., Alm, J., Silvola, J., Nykanen, H., andMartikainen, P. J.: Cross-correlation analysis of the dynamics ofmethane emissions from a boreal peatland, Global Biogeochem.Cy., 10, 457–471, 1996.
Kettunen, A., Kaitala, V., Lehtinen, A., Lohila, A., Alm, J., Silvola,J., and Martikainen, P. J.: Methane production and oxidation po-tentials in relation to water table fluctuations in two boreal mires,Soil Biol. Biochem., 31, 1741–1749, 1999.
King, G. M.: Dynamics and controls of methane oxidation in a dan-ish wetland sediment, FEMS Microbiology Ecology, 74, 309–323, 1990.
King, G. M.: Associations of methanotrophs with the roots andrhizomes of aquatic vegetation, Appl. Environ. Microbiol., 60,3220–3227, 1994.
King, G. M.: In situ analyses of methane oxidation associated withthe roots and rhizomes of a bur reed, sparganium eurycarpum,in a maine wetland, Appl. Environ. Microbiol., 62, 4548–4555,1996.
Kreuzer-Martin, H. W.: Stable isotope probing: Linking functionalactivity to specific members of microbial communities, Soil Sci.Soc. Am. J., 71, 611–619, 2007.
Krumholz, L. R., Hollenback, J. L., Roskes, S. J., and Ringelberg,D. B.: Methanogenesis and methanotrophy within asphagnumpeatland, FEMS Microbiology Ecology, 18, 215–224, 1995.
Le Mer, J. and Roger, P.: Production, oxidation, emission and con-sumption of methane by soils: A review, European Journal ofSoil Biology, 37, 25–50, 2001.
Lerman, A.: Geochemical processes: Water and sediment environ-
www.biogeosciences.net/6/1491/2009/ Biogeosciences, 6, 1491–1504, 2009

1504 E. R. C. Hornibrook et al.: Methanotrophy potential versus methane supply in peatlands
ments, John Wiley & Sons, New York, USA, 481 pp., 1979.McAullife, C.: GC determination of solutes by multiple phase equi-
libration, Chem. Technol., 1, 46–51, 1971.McDonald, I. R., Hall, G. H., Pickup, R. W., and Murrell, J. C.:
Methane oxidation potential and preliminary analysis of methan-otrophs in blanket bog peat using molecular ecology techniques,FEMS Microbiology Ecology, 21, 197–211, 1996.
McDonald, I. R., Upton, M., Hall, G., Pickup, R. W., Edwards, C.,Saunders, J. R., Ritchie, D. A., and Murrell, J. C.: Molecularecological analysis of methanogens and methanotrophs in blan-ket bog peat, Microbiol. Ecol., 38, 225–233, 1999.
McDonald, I. R., Radajewski, S., and Murrell, J. C.: Stable isotopeprobing of nucleic acids in methanotrophs and methylotrophs: Areview, Organic Geochem., 36, 779–787, 2005.
Megonigal, J. P. and Schlesinger, W. H.: Methane-limited methan-otrophy in tidal freshwater swamps, Global Biogeochem. Cy.,16, 1088, doi:10.1029/2001GB001594, 2002.
Mikaloff Fletcher, S. E., Tans, P. P., Bruhwiler, L. M., Miller, J.B., and Heimann, M.: CH4 sources estimated from atmosphericobservations of CH4 and its13C/12C isotopic ratios: 2. Inversemodeling of CH4 fluxes from geographical regions, Global Bio-geochem. Cy., 18, GB4005, doi:10.1029/2004GB002224, 2004.
Mikkela, C., Sundh, I., Svensson, B. H., and Nilsson, M.: Diurnalvariation in methane emission in relation to the water-table, soiltemperature, climate and vegetation cover in a swedish acid mire,Biogeochemistry, 28, 93–114, 1995.
Miller, D. N., Yavitt, J. B., Madsen, E. L., and Ghiorse, W. C.:Methanotrophic activity, abundance, and diversity in forestedswamp pools: Spatiotemporal dynamics and influences onmethane fluxes, Geomicrobiol. J., 21, 257–271, 2004.
Morris, S. A., Radajewski, S., Willison, T. W., and Murrell, J. C.:Identification of the functionally active methanotroph populationin a peat soil microcosm by stable-isotope probing, Appl. Envi-ron. Microbiol., 68, 1446–1453, 2002.
Oquist, M. G. and Svensson, B. H.: Vascular plants as regulators ofmethane emissions from a subarctic mire ecosystem, J. Geophys.Res.-Atmos., 107, 4580, doi:10.1029/2001JD001030, 2002.
Pearce, D. M. E. and Clymo, R. S.: Methane oxidation in a peatlandcore, Global Biogeochem. Cy., 15, 709–720, 2001.
Popp, T. J., Chanton, J. P., Whiting, G. J., and Grant, N.: Methanestable isotope distribution at a carex dominated fen in north cen-tral alberta, Global Biogeochem. Cy., 13, 1063–1077, 1999.
Popp, T. J., Chanton, J. P., Whiting, G. J., and Grant, N.: Evaluationof methane oxidation in the rhizosphere of a carex dominated fenin north central alberta, canada, Biogeochemistry, 51, 259–281,2000.
Ritchie, D. A., Edwards, C., McDonald, I. R., and Murrell, J. C.:Detection of methanogens and methanotrophs in natural environ-ments, Global Change Biol., 3, 339–350, 1997.
Roslev, P. and King, G. M.: Regulation of methane oxidation ina freshwater wetland by water table changes and anoxia, FEMSMicrobiology Ecology, 19, 105–115, 1996.
Roulet, N. T., Ash, R., Quinton, W., and Moore, T.: Methane fluxfrom drained northern peatlands: Effect of a persistent water ta-ble lowering on flux, Global Biogeochem. Cy., 7, 749–769, 1993.
Schipper, L. A. and Reddy, K. R.: Determination of methane ox-idation in the rhizosphere ofSagittaria lancifoliausing methylfluoride, Soil Sci. Soc. Am. J., 60, 611–616, 1996.
Segers, R.: Methane production and methane consumption: A re-view of processes underlying wetland methane fluxes, Biogeo-chemistry, 41, 23–51, 1998.
Shannon, R. D., White, J. R., Lawson, J. E., and Gilmour, B. S.:Methane efflux from emergent vegetation in peatlands, Journalof Ecology, 84, 239-246, 1996.
Strom, L. and Christensen, T. R.: Below ground carbon turnoverand greenhouse gas exchanges in a sub-arctic wetland, Soil Biol.Biochem., 39, 1689–1698, 2007.
Strom, L., Mastepanov, M., and Christensen, T. R.: Species-specificeffects of vascular plants on carbon turnover and methane emis-sions from wetlands, Biogeochemistry, 75, 65–82, 2005.
Sundh, I., Nilsson, M., Granberg, G., and Svensson, B. H.: Depthdistribution of microbial production and oxidation of methane innorthern boreal peatlands, Microbial Ecol., 27, 253–265, 1994.
Sundh, I., Borga, P., Nilsson, M., and Svensson, B. H.: Estimationof cell numbers of methanotrophic bacteria in boreal peatlandsbased on analysis of specific phospholipid fatty acids, FEMS Mi-crobiology Ecology, 18, 103–112, 1995.
Sundh, I., Nilsson, M., and Borga, P.: Variation in microbial com-munity structure in two boreal peatlands as determined by analy-sis of phospholipid fatty acid profiles, Appl. Environ. Microbiol.,63, 1476–1482, 1997.
Tokida, T., Miyazaki, T., Mizoguchi, M., Nagata, O., Takakai,F., Kagemoto, A., and Hatano, R.: Falling atmospheric pres-sure as a trigger for methane ebullition from peatland, GlobalBiogeochem. Cy., 21, GB2003, doi:10.1029/2006GB002790,2007a.
Tokida, T., Mizoguchi, M., Miyazaki, T., Kagemoto, A., Nagata,O., and Hatano, R.: Episodic release of methane bubbles frompeatland during spring thaw, Chemosphere, 70, 165–171, 2007b.
van der Nat, F. J. W. A. and Middelburg, J. J.: Seasonal variationin methane oxidation by the rhizosphere of phragmites australisand scirpus lacustris, Aquat. Botany, 61, 95–110, 1998.
Walter, B. P., Heimann, M., and Matthews, E.: Modeling modernmethane emissions from natural wetlands 1. Model descriptionand results, J. Geophys. Res.-Atmos., 106, 34189–34206, 2001.
Wartiainen, I., Hestnes, A. G., and Svenning, M. M.: Methan-otrophic diversity in high arctic wetlands on the islands of Sval-bard (Norway) – denaturing gradient gel electrophoresis analysisof soil DNA and enrichment cultures, Canad. J. Microbiol., 49,602–612, 2003.
Watson, A., Stephen, K. D., Nedwell, D. B., and Arah, J. R. M.:Oxidation of methane in peat: Kinetics of CH4 and O2 removaland the role of plant roots, Soil Biol. Biochem., 29, 1257–1267,1997.
Whalen, S. C.: Biogeochemistry of methane exchange between nat-ural wetlands and the atmosphere, Environ. Eng. Sci., 22, 73–94,2005.
Whalen, S. C. and Reeburgh, W. S.: Methane oxidation, production,and emission at contrasting sites in a boreal bog, Geomicrobiol.J., 17, 237–251, 2000.
Biogeosciences, 6, 1491–1504, 2009 www.biogeosciences.net/6/1491/2009/