Possible detrital, diagenetic and hydrothermal sources for Holocene sediments of the Andaman backarc...
16
Possible detrital, diagenetic and hydrothermal sources for Holocene sediments of the Andaman backarc basin Siby Kurian a , B. Nagender Nath a, ⁎ , V. Ramaswamy a , D. Naman a , T. Gnaneshwar Rao b , K.A. Kamesh Raju a , K. Selvaraj c , C.T.A. Chen c a National Institute of Oceanography, Dona Paula, Goa-403 004, India b National Geophysical Research Institute, Uppal Road, Hyderabad-500 007, India c Institute of Marine Geology & Chemistry, National Sun Yat-Sen University, Kaohsiung 804, Taiwan Received 17 May 2007; received in revised form 21 August 2007; accepted 23 September 2007 Abstract Three sediment cores near the spreading axis in the Andaman backarc basin (ABB) were studied for bulk and clay mineralogy, major, trace and rare earth element (REE) geochemistry in bulk and three selective leaches, to identify sediment sources to this region and to decipher probable hydrothermal contribution. REE and other geochemical data suggest a strong influence of the Irrawaddy River as a major continental source to the ABB sediments. Low carbonate content in the sediments is due to dilution by higher detrital input as well as reduced foraminiferal carbonate contribution because of low sea surface salinity. The contribution from local volcanic sources was identified from the presence of volcanic glass in the sand-sized sediment fraction; higher smectite content in the clay fraction and the trace element data. Mn concentrations in the upper 12 cm are well above those found in pelagic carbonate-free sediments. Mn distribution pattern and oxide nature suggest a hydrothermal source. Other discriminants such as Eu anomaly and Y/Ho ratio also suggest the role of hydrothermal activity. In addition, the association of Mo with Pb, Zn and Cu in the HCl-insoluble residue suggests the presence of sulfidic material probably of hydrothermal origin. © 2007 Elsevier B.V. All rights reserved. Keywords: Andaman backarc basin; Irrawaddy River; rare earth elements; geochemical tracers; volcanic sources; hydrothermal mineralization 1. Introduction The tectonics and geological history of the Andaman Sea is fairly well known (Rodolfo, 1969a; Curray et al., 1979; Rao et al., 1996; Kamesh Raju et al., 2004), but limited studies have been carried out on the sediments (Cronan and Wijayananda, 1991; Roonwal et al., 1997; Venkatesan et al., 2003). According to Rodolfo (1969a), the main sources of sediments to the Andaman basin are the Irrawaddy, Salween and Sittang Rivers from Myanmar. Recent studies (Ramaswamy et al., 2004; Rao et al., 2005) have shown that the sediment influx from these rivers is transported along the shelf by monsoon currents and carried to the deep sea-floor through submarine canyons. Apart from fluvial sources (Roonwal et al., 1997), the ABB should also receive material from pelagic, eolian, weathering of sea-floor rocks, and possible hydrother- mal sources (Rao et al., 1996; Chernova et al., 2001; Marine Geology 247 (2008) 178 – 193 www.elsevier.com/locate/margeo * Corresponding author. Tel.: +91 832 2450402; fax: +91 832 2450609. E-mail address: [email protected] (B.N. Nath). 0025-3227/$ - see front matter © 2007 Elsevier B.V. All rights reserved. doi:10.1016/j.margeo.2007.09.006
Transcript of Possible detrital, diagenetic and hydrothermal sources for Holocene sediments of the Andaman backarc...
(2008) 178–193www.elsevier.com/locate/margeo
Marine Geology 247
Possible detrital, diagenetic and hydrothermal sources for Holocenesediments of the Andaman backarc basin
Siby Kurian a, B. Nagender Nath a,⁎, V. Ramaswamy a, D. Naman a, T. Gnaneshwar Rao b,K.A. Kamesh Raju a, K. Selvaraj c, C.T.A. Chen c
a National Institute of Oceanography, Dona Paula, Goa-403 004, Indiab National Geophysical Research Institute, Uppal Road, Hyderabad-500 007, India
c Institute of Marine Geology & Chemistry, National Sun Yat-Sen University, Kaohsiung 804, Taiwan
Received 17 May 2007; received in revised form 21 August 2007; accepted 23 September 2007
Abstract
Three sediment cores near the spreading axis in the Andaman backarc basin (ABB) were studied for bulk and clay mineralogy,major, trace and rare earth element (REE) geochemistry in bulk and three selective leaches, to identify sediment sources to thisregion and to decipher probable hydrothermal contribution. REE and other geochemical data suggest a strong influence of theIrrawaddy River as a major continental source to the ABB sediments. Low carbonate content in the sediments is due to dilution byhigher detrital input as well as reduced foraminiferal carbonate contribution because of low sea surface salinity. The contributionfrom local volcanic sources was identified from the presence of volcanic glass in the sand-sized sediment fraction; higher smectitecontent in the clay fraction and the trace element data. Mn concentrations in the upper 12 cm are well above those found in pelagiccarbonate-free sediments. Mn distribution pattern and oxide nature suggest a hydrothermal source. Other discriminants such as Euanomaly and Y/Ho ratio also suggest the role of hydrothermal activity. In addition, the association of Mo with Pb, Zn and Cu in theHCl-insoluble residue suggests the presence of sulfidic material probably of hydrothermal origin.© 2007 Elsevier B.V. All rights reserved.
Keywords: Andaman backarc basin; Irrawaddy River; rare earth elements; geochemical tracers; volcanic sources; hydrothermal mineralization
1. Introduction
The tectonics and geological history of the AndamanSea is fairly well known (Rodolfo, 1969a; Curray et al.,1979; Rao et al., 1996; Kamesh Raju et al., 2004), butlimited studies have been carried out on the sediments(Cronan and Wijayananda, 1991; Roonwal et al., 1997;Venkatesan et al., 2003). According to Rodolfo (1969a),
* Corresponding author. Tel.: +91 832 2450402; fax: +91 832 2450609.E-mail address: [email protected] (B.N. Nath).
0025-3227/$ - see front matter © 2007 Elsevier B.V. All rights reserved.doi:10.1016/j.margeo.2007.09.006
the main sources of sediments to the Andaman basin arethe Irrawaddy, Salween and Sittang Rivers fromMyanmar. Recent studies (Ramaswamy et al., 2004;Rao et al., 2005) have shown that the sediment influxfrom these rivers is transported along the shelf bymonsoon currents and carried to the deep sea-floorthrough submarine canyons.
Apart from fluvial sources (Roonwal et al., 1997), theABB should also receive material from pelagic, eolian,weathering of sea-floor rocks, and possible hydrother-mal sources (Rao et al., 1996; Chernova et al., 2001;

179S. Kurian et al. / Marine Geology 247 (2008) 178–193
Venkatesan et al., 2003; Siby, 2004). Assessing thesources to the ABB assumes importance in view of thefollowing:
1) Rodolfo (1969a) reported high smectite content forthe deep Andaman sea sediments, though the mainfluvial source of sediments to the region has lowsmectite content (Konta, 1985).
2) Paleoclimatic reconstructions on the sediments ofABB were conducted (e.g. Colin et al., 1999) on theassumption that the main source of sediments to theAndaman Sea is the Irrawaddy River. However, othersources are likely to play a role in the basinalsedimentation in view of its tectonic setting.
3) Backarc basins are known for hydrothermal miner-alization (e.g. Sumisu Rift, Izu Bonin Island Arc,Okinawa Trough, Mariana Trough, Mariana Basin,Manus Basin, North Fiji Basin, Lau Basin etc. (Ronaand Scott, 1993 and references therein)). The ABBhas a well defined spreading axis (Kamesh Rajuet al., 2004) and the possibility of hydrothermalsignatures in the basin is reported by Rao et al.(1996). So, it is interesting to see if any hydrothermalsignatures are seen in the ABB sediments.
With the above objectives, we have studied 3 shortsediment cores collected on either side of the rift valleyin the ABB for 1) mineralogy of clay-sized fraction andbulk sediments; 2) comprehensive geochemical studieson a) whole-sediments and b) on three chemicallyseparable phases (both leach and residue), extractedusing selective leaching techniques.
2. Materials and methods
2.1. Study area
TheABB is a semi-enclosed basin in the eastern IndianOcean. The basin is marked by prominent morphologicalfeatures such as the Nicobar deep, Barren-Narcondamvolcanic islands, Invisible bank and Alcock and Sewellseamount complexes (Rodolfo, 1969b). The southwesternpart of the basin is dominated by N–S-trending faultsystems. The backarc basin is bisected by a prominenttrough (with a vertical drop of about 500m), whichmakesthe Andaman backarc spreading center (Kamesh Rajuet al., 2004). The western part is dominated by volcanicfeatures which are related to arc volcanism and backarcspreading activity, whereas the eastern part has a smoothtopography resulting from sediment infill from theIrrawaddy and Salween River system located to thenorth of the study area (Fig. 1).
TheAndaman Sea experiences the seasonally reversingAsian monsoon (Wyrtki, 1973). Circulation in the Anda-man Sea is cyclonic during the southwest monsoon(May–September) and anti-cyclonic during the northeastmonsoon (December–February). Surface salinities arevariable owing to intermittent dilution by monsoonalprecipitation and runoff from the Irrawaddy andPeninsularMyanmar. This results in low surface salinity (b30 PSU)in the northern area, which increases southwards to morenormal marine values (Rodolfo, 1969a). The surfaceseawater temperatures are quite uniform throughout theyear, ranging between 27° and 30 °C.
2.2. Sample collection
In the present study, three short spade cores SPC-1(11.17°N, 94.73°E), SPC-2 (10.58°N, 94.72°E) and SPC-5 (10.31°N, 94.39°E) [∼20–30 cm long] were collectedduring the 168th expedition of O.R.V. Sagar Kanya in2001. They were sub-sampled at 2 cm intervals anddivided into two aliquots. One aliquot was frozen forgeochemical studies, while the second half was dried at65 °C for sedimentological analyses. Based on asedimentation rate of ∼10 cm kyr−1 in the basin (Colinet al., 1999; Ahmad et al., 2000 and the unpublished datawith the authors), the sediments sampled are not olderthan∼3 kyr. While the core SPC-1 was sampled from thenorthern side of the rift valley, SPC-2 and SPC-5 werecollected from the southern side of the rift valley (Fig. 1).Three surface sediment samples and suspended sedimentfrom the inner continental shelf were also analyzed torepresent the fluvial contribution from Irrawaddy andSalween Rivers (Fig. 1).
2.3. Mineralogy
Observations under binocular microscope show thatthe coarse fraction (N63 μm) is a mixture of biogenicparticles such as radiolarians and foraminifera, withferromanganese micronodules noticed in a few samples.Small quantities of palagonitic material, muscovite,biotite and glass fragments (brown and white colored)were also observed at deeper sediment intervals.
2.3.1. Bulk mineralogySediment samples were washed until salt free, treated
with H2O2 to remove organic carbon and freeze dried forbulk mineralogical analysis. Homogenised sedimentsamples were pressed into sample holders taking care tominimize orientation of the particles. Samples werescanned from 3° to 32° 2θ at 0.5° 2θ min−1 on an X-rayDiffractometer using Cu Kα radiation. The percentages

Fig. 1. Core locations shown in relation to the topographic features of Andaman Backarc basin (base map from Kamesh Raju et al., 2004). Irrawaddyand Salween Rivers and the locations of the surficial sediments from the shelf are shown in the inset.
180 S. Kurian et al. / Marine Geology 247 (2008) 178–193
of various minerals were determined following themethod of Biscaye (1965).
2.3.2. Clay mineralogySediment fractions b2 μm were separated for clay
mineral analysis based on the settling velocity (Folk, 1968).Salt and organic carbon-free clay fractions were preparedas a thick slurry, pipetted onto glass slides, glycolatedovernight at 60 °C and kept in the desiccator. The slideswere scanned from 3° to 32° at 2° 2θ min−1 with slowspeed (24° to 26° at 0.01° 2θ s−1) on X-ray Diffractometer
using Cu Kα radiation. The relative abundance of the clayminerals was determined according to the methoddescribed in Biscaye (1965) using weighted peak areas(4×illite, 2×(kaolinite and chlorite) and 3.33×quartz). ForIdentification of smectite types, sediment samples b2 μmfraction were freeze dried, homogenized and pressed intoholders (less oriented) andwere scanned from48° to 64° 2θon the X-ray diffractometer using Cu Kα radiation. Thisscanning range includes smectite (060) at 1.501–1.503°A,quartz peak (112) at 1.817°A and quartz peak (211) at1.524°A±0.001°A.
Table 1Concentration of bulk and clay minerals in the sediment cores fromthe ABB
Depth Bulk minerals Clay minerals
(cm) (%) (%)
Quartz Plagioclase Smectite Illite Chlorite Kaolinite K/Ch
SPC-10–2 31.41 10.24 51.9 21.2 10 12.3 1.234–6 31.34 10.8 25.5 35.5 12.2 15.6 1.288–10 35.69 8.98 48.4 26.4 8.4 11.8 1.4012–14 35.25 8.51 47.9 24.8 8.6 12.4 1.4422–24 37.88 7 55.1 20.3 9 12.6 1.40
SPC-20–2 33.45 11.12 53.4 19.3 8.5 11.2 1.324–6 30.18 7.08 56.8 19.7 9.4 11.5 1.228–10 28.46 7.44 59.9 19.4 7.4 10.2 1.3816–18 28.34 5.82 55.5 22.1 7.5 10.7 1.43
SPC-50–2 28.8 9.65 55.2 19.5 10.2 11.3 1.112–4 34.53 9.07 48.8 26 7.2 13.3 1.8510–12 35.17 8.49 59.9 18.9 8.9 9.7 1.0914–16 39.83 7.81 34.1 33.2 11.6 16.4 1.4122–24 33.42 5.58 58.6 20.2 8.4 9.4 1.1224–26 34.92 8.21 56.7 29 6.4 7.3 1.14
181S. Kurian et al. / Marine Geology 247 (2008) 178–193
2.4. Bulk geochemistry
In the laboratory, the dried samples were grinded tofine powder using an agate mortar and pestle. Thecalcium carbonate content was measured using a CO2
Coulometer following acidification of the sample with1 N HCl. The organic carbon (Corg) content wasdetermined by the wet oxidation method (El Wakeeland Riley, 1957). The precision and accuracy of theanalysis were better than 0.01% and 7–10% respectively(Nath et al., 1997). Analysis for REEs and other traceelements were carried out at NGRI, Hyderabad, using anICP-MS. Sediments and geochemical standard (MAG-1from the USGS) were dissolved following aciddissolution procedure described in Balaram and Rao(2003). Potential polyatomic and doubly charged ioninterferences were minimized by choosing the leastinterfering isotopes of each element as well as bydiluting the solutions considerably (5000 times). Theresults showed better than 1% agreement for the REEswith respect to MAG-1. Co, Ni, Cu, La, Nd, Er analyseshad a precision of 1%, while all other elements hasdisplayed precisions better than 5%. The error calculat-ed in the Eu anomaly is b0.02 anomaly unit, hence theEu anomaly has been considered in the discussion onlyif the variation between samples exceeds this value.
Ba and K were analyzed in two cores (SPC-1 andSPC-5) using an X-ray fluorescence spectrometer(RIGAKU RIX 2000) equipped with a Rh cathode.About 2 g of finely powdered (b200 mesh) sedimentwith silica gel 60 (Merck) added as binder andcompacted into pellets (30 mm in diameter and10 mm thick) under 20×103 kg cm−2 pressures. Thepellets were analyzed at an acceleration voltage of50 kV and a current of 50 mA. The accuracy of theanalytical method, determined by analyzing the standardreference materials (GBW 07315 and GBW 07316[marine sediments]), was better than 3%.
2.5. Leach studies
Selective leach studies were carried out followingthe method described by Cronan (1976). Three splits of1 g sediment were leached separately using 1) 10%acetic acid, 2) mixed acid-reducing agent (acetic acidand hydroxylamine–HCl) and 3) with hot 50% HCl.The leach solutions and residues were analyzed forREEs and other elements by means of ICP-MS. Usingthe three selective leaches (L1, L2 and L3), thefollowing element associations were established. (1)Acetic acid (L1) dissolves carbonate mineral constitu-ents, loosely sorbed ions, and interstitial water
evaporates and possibly some colloidal iron. (2) Theacid-reducing agent (L2) removes all the above phasestogether with ferromanganese oxide and some amor-phous Fe-oxides. (3) Hot HCl (L3) removes phase 1,phase 2, along with bulk of remaining amorphous Fe-oxide, crystalline Fe-oxide and partially dissolves claysand other weathered detrital phases. 4) Any material notdissolved by the HCl consists of resistant silicates andaluminosilicates (Cronan, 1976; Hodkinson et al.,1994). The elements (wt.%) soluble in each phasesuch as acetic acid soluble (L1), hydroxylamine–HClsoluble (L2–L1), HCl soluble (L3–L2) and detritalfraction (HCl-insoluble fraction) were calculated fromthese results.
3. Results
3.1. Mineralogy
The down core variations of bulk minerals (quartzand plagioclase) and clay minerals (smectite, illite,chlorite and kaolinite) from the ABB are listed inTable 1. The quartz concentration increased down corefor SPC-1 sediments, while those from SPC-2 de-creased. Plagioclase ranged between 6 to 11% for all the
182 S. Kurian et al. / Marine Geology 247 (2008) 178–193
samples with low values in the deeper sample intervals.The major clay minerals present are smectite (34–60%),Illite (19–35%), kaolinite (7–16%) and chlorite (6–12%)(Table 1). The illite concentration ranged between20–35% for SPC-1 and SPC-5 with high valuescorresponding to a low smectite abundance. Kaoliniteabundance was higher than that of chlorite with anaverage K/Ch ratio of 1.3 (Table 1). The Smectite typewas identified as dioctahedral montmorillonite andbeidellite based on d (060) spacing (1.501–1.503°A).The beidellite could be either Al-beidellite or Al–Febeidellite (Parra et al., 1991).
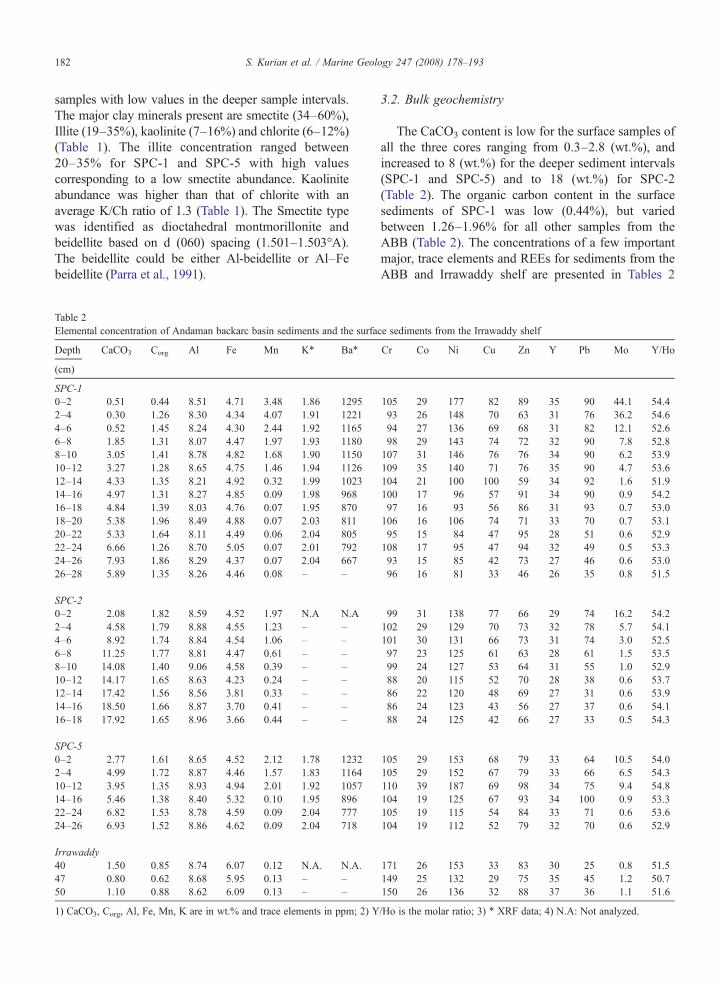
Table 2Elemental concentration of Andaman backarc basin sediments and the surfa
Depth CaCO3 Corg Al Fe Mn K⁎ Ba⁎
(cm)
SPC-10–2 0.51 0.44 8.51 4.71 3.48 1.86 12952–4 0.30 1.26 8.30 4.34 4.07 1.91 12214–6 0.52 1.45 8.24 4.30 2.44 1.92 11656–8 1.85 1.31 8.07 4.47 1.97 1.93 11808–10 3.05 1.41 8.78 4.82 1.68 1.90 115010–12 3.27 1.28 8.65 4.75 1.46 1.94 112612–14 4.33 1.35 8.21 4.92 0.32 1.99 102314–16 4.97 1.31 8.27 4.85 0.09 1.98 96816–18 4.84 1.39 8.03 4.76 0.07 1.95 87018–20 5.38 1.96 8.49 4.88 0.07 2.03 81120–22 5.33 1.64 8.11 4.49 0.06 2.04 80522–24 6.66 1.26 8.70 5.05 0.07 2.01 79224–26 7.93 1.86 8.29 4.37 0.07 2.04 66726–28 5.89 1.35 8.26 4.46 0.08 – –
SPC-20–2 2.08 1.82 8.59 4.52 1.97 N.A N.A2–4 4.58 1.79 8.88 4.55 1.23 – –4–6 8.92 1.74 8.84 4.54 1.06 – –6–8 11.25 1.77 8.81 4.47 0.61 – –8–10 14.08 1.40 9.06 4.58 0.39 – –10–12 14.17 1.65 8.63 4.23 0.24 – –12–14 17.42 1.56 8.56 3.81 0.33 – –14–16 18.50 1.66 8.87 3.70 0.41 – –16–18 17.92 1.65 8.96 3.66 0.44 – –
SPC-50–2 2.77 1.61 8.65 4.52 2.12 1.78 12322–4 4.99 1.72 8.87 4.46 1.57 1.83 116410–12 3.95 1.35 8.93 4.94 2.01 1.92 105714–16 5.46 1.38 8.40 5.32 0.10 1.95 89622–24 6.82 1.53 8.78 4.59 0.09 2.04 77724–26 6.93 1.52 8.86 4.62 0.09 2.04 718
Irrawaddy40 1.50 0.85 8.74 6.07 0.12 N.A. N.A.47 0.80 0.62 8.68 5.95 0.13 – –50 1.10 0.88 8.62 6.09 0.13 – –
1) CaCO3, Corg, Al, Fe, Mn, K are in wt.% and trace elements in ppm; 2) Y
3.2. Bulk geochemistry
The CaCO3 content is low for the surface samples ofall the three cores ranging from 0.3–2.8 (wt.%), andincreased to 8 (wt.%) for the deeper sediment intervals(SPC-1 and SPC-5) and to 18 (wt.%) for SPC-2(Table 2). The organic carbon content in the surfacesediments of SPC-1 was low (0.44%), but variedbetween 1.26–1.96% for all other samples from theABB (Table 2). The concentrations of a few importantmajor, trace elements and REEs for sediments from theABB and Irrawaddy shelf are presented in Tables 2
ce sediments from the Irrawaddy shelf
Cr Co Ni Cu Zn Y Pb Mo Y/Ho
105 29 177 82 89 35 90 44.1 54.493 26 148 70 63 31 76 36.2 54.694 27 136 69 68 31 82 12.1 52.698 29 143 74 72 32 90 7.8 52.8107 31 146 76 76 34 90 6.2 53.9109 35 140 71 76 35 90 4.7 53.6104 21 100 100 59 34 92 1.6 51.9100 17 96 57 91 34 90 0.9 54.297 16 93 56 86 31 93 0.7 53.0106 16 106 74 71 33 70 0.7 53.195 15 84 47 95 28 51 0.6 52.9108 17 95 47 94 32 49 0.5 53.393 15 85 42 73 27 46 0.6 53.096 16 81 33 46 26 35 0.8 51.5
99 31 138 77 66 29 74 16.2 54.2102 29 129 70 73 32 78 5.7 54.1101 30 131 66 73 31 74 3.0 52.597 23 125 61 63 28 61 1.5 53.599 24 127 53 64 31 55 1.0 52.988 20 115 52 70 28 38 0.6 53.786 22 120 48 69 27 31 0.6 53.986 24 123 43 56 27 37 0.6 54.188 24 125 42 66 27 33 0.5 54.3
105 29 153 68 79 33 64 10.5 54.0105 29 152 67 79 33 66 6.5 54.3110 39 187 69 98 34 75 9.4 54.8104 19 125 67 93 34 100 0.9 53.3105 19 115 54 84 33 71 0.6 53.6104 19 112 52 79 32 70 0.6 52.9
171 26 153 33 83 30 25 0.8 51.5149 25 132 29 75 35 45 1.2 50.7150 26 136 32 88 37 36 1.1 51.6
/Ho is the molar ratio; 3) ⁎ XRF data; 4) N.A: Not analyzed.
183S. Kurian et al. / Marine Geology 247 (2008) 178–193
and 3. The Al concentrations did not show muchvariation (8–9%) for the samples from the ABB andIrrawaddy shelf. Fe concentration ranged between 4.3 to5% for SPC-1 and SPC-5 sediments, but a relatively lowconcentration (3.6–4.6%) was recorded in SPC-2 and ahigh concentration in sediments from Irrawaddy shelf(6–6–1%). K concentration ranged between 1.8–2.04%for SPC-1 and SPC-5 sediments with low concentrationfor the surficial samples. Elements such as Mn, Ba, Co,Ni, Cu displayed low concentration in the deepersediment intervals (Table 2). Mn showed high concen-tration (1 to 4%) in the top 6 cm after which they rapidly
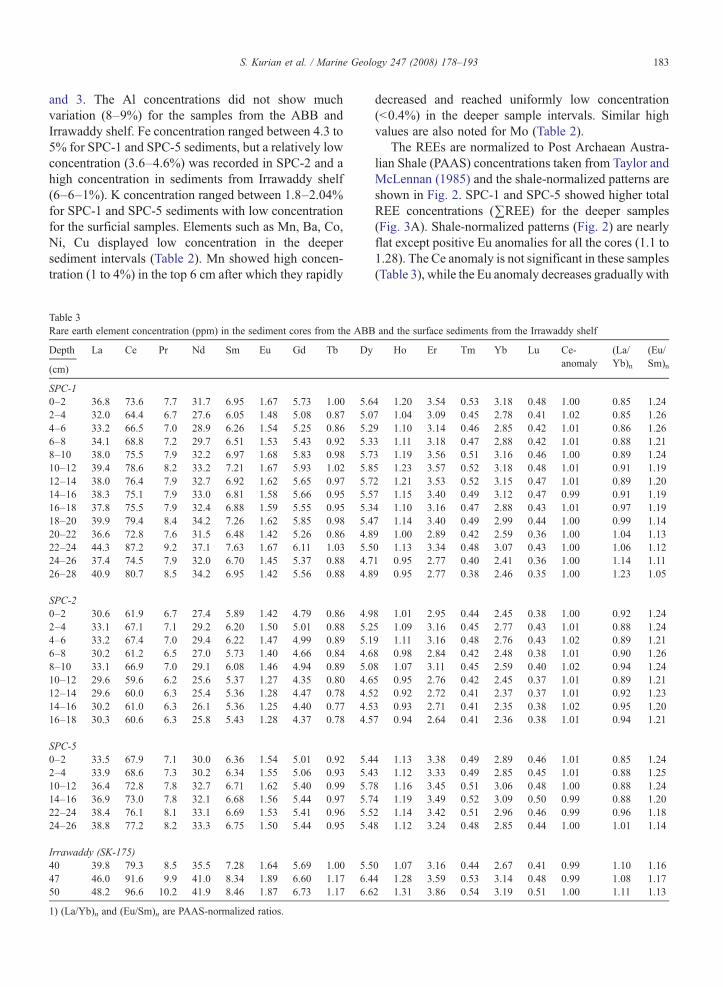
Table 3Rare earth element concentration (ppm) in the sediment cores from the ABB
Depth La Ce Pr Nd Sm Eu Gd Tb Dy
(cm)
SPC-10–2 36.8 73.6 7.7 31.7 6.95 1.67 5.73 1.00 5.62–4 32.0 64.4 6.7 27.6 6.05 1.48 5.08 0.87 5.04–6 33.2 66.5 7.0 28.9 6.26 1.54 5.25 0.86 5.26–8 34.1 68.8 7.2 29.7 6.51 1.53 5.43 0.92 5.38–10 38.0 75.5 7.9 32.2 6.97 1.68 5.83 0.98 5.710–12 39.4 78.6 8.2 33.2 7.21 1.67 5.93 1.02 5.812–14 38.0 76.4 7.9 32.7 6.92 1.62 5.65 0.97 5.714–16 38.3 75.1 7.9 33.0 6.81 1.58 5.66 0.95 5.516–18 37.8 75.5 7.9 32.4 6.88 1.59 5.55 0.95 5.318–20 39.9 79.4 8.4 34.2 7.26 1.62 5.85 0.98 5.420–22 36.6 72.8 7.6 31.5 6.48 1.42 5.26 0.86 4.822–24 44.3 87.2 9.2 37.1 7.63 1.67 6.11 1.03 5.524–26 37.4 74.5 7.9 32.0 6.70 1.45 5.37 0.88 4.726–28 40.9 80.7 8.5 34.2 6.95 1.42 5.56 0.88 4.8
SPC-20–2 30.6 61.9 6.7 27.4 5.89 1.42 4.79 0.86 4.92–4 33.1 67.1 7.1 29.2 6.20 1.50 5.01 0.88 5.24–6 33.2 67.4 7.0 29.4 6.22 1.47 4.99 0.89 5.16–8 30.2 61.2 6.5 27.0 5.73 1.40 4.66 0.84 4.68–10 33.1 66.9 7.0 29.1 6.08 1.46 4.94 0.89 5.010–12 29.6 59.6 6.2 25.6 5.37 1.27 4.35 0.80 4.612–14 29.6 60.0 6.3 25.4 5.36 1.28 4.47 0.78 4.514–16 30.2 61.0 6.3 26.1 5.36 1.25 4.40 0.77 4.516–18 30.3 60.6 6.3 25.8 5.43 1.28 4.37 0.78 4.5
SPC-50–2 33.5 67.9 7.1 30.0 6.36 1.54 5.01 0.92 5.42–4 33.9 68.6 7.3 30.2 6.34 1.55 5.06 0.93 5.410–12 36.4 72.8 7.8 32.7 6.71 1.62 5.40 0.99 5.714–16 36.9 73.0 7.8 32.1 6.68 1.56 5.44 0.97 5.722–24 38.4 76.1 8.1 33.1 6.69 1.53 5.41 0.96 5.524–26 38.8 77.2 8.2 33.3 6.75 1.50 5.44 0.95 5.4
Irrawaddy (SK-175)40 39.8 79.3 8.5 35.5 7.28 1.64 5.69 1.00 5.547 46.0 91.6 9.9 41.0 8.34 1.89 6.60 1.17 6.450 48.2 96.6 10.2 41.9 8.46 1.87 6.73 1.17 6.6
1) (La/Yb)n and (Eu/Sm)n are PAAS-normalized ratios.
decreased and reached uniformly low concentration(b0.4%) in the deeper sample intervals. Similar highvalues are also noted for Mo (Table 2).
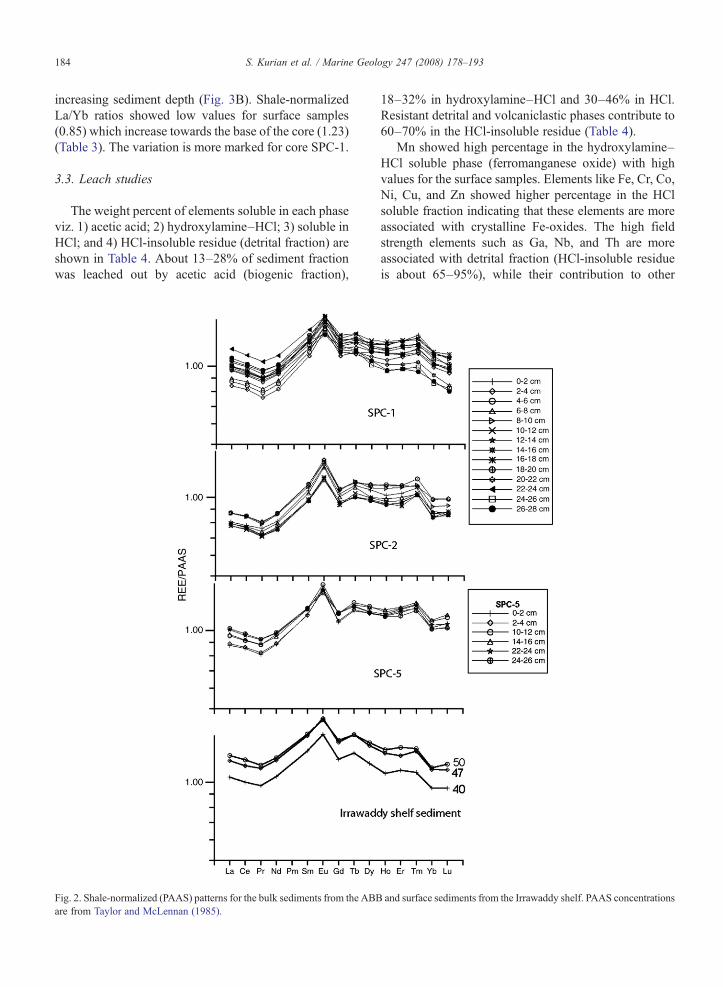
The REEs are normalized to Post Archaean Austra-lian Shale (PAAS) concentrations taken from Taylor andMcLennan (1985) and the shale-normalized patterns areshown in Fig. 2. SPC-1 and SPC-5 showed higher totalREE concentrations (∑REE) for the deeper samples(Fig. 3A). Shale-normalized patterns (Fig. 2) are nearlyflat except positive Eu anomalies for all the cores (1.1 to1.28). The Ce anomaly is not significant in these samples(Table 3), while the Eu anomaly decreases gradually with
and the surface sediments from the Irrawaddy shelf
Ho Er Tm Yb Lu Ce-anomaly
(La/Yb)n
(Eu/Sm)n
4 1.20 3.54 0.53 3.18 0.48 1.00 0.85 1.247 1.04 3.09 0.45 2.78 0.41 1.02 0.85 1.269 1.10 3.14 0.46 2.85 0.42 1.01 0.86 1.263 1.11 3.18 0.47 2.88 0.42 1.01 0.88 1.213 1.19 3.56 0.51 3.16 0.46 1.00 0.89 1.245 1.23 3.57 0.52 3.18 0.48 1.01 0.91 1.192 1.21 3.53 0.52 3.15 0.47 1.01 0.89 1.207 1.15 3.40 0.49 3.12 0.47 0.99 0.91 1.194 1.10 3.16 0.47 2.88 0.43 1.01 0.97 1.197 1.14 3.40 0.49 2.99 0.44 1.00 0.99 1.149 1.00 2.89 0.42 2.59 0.36 1.00 1.04 1.130 1.13 3.34 0.48 3.07 0.43 1.00 1.06 1.121 0.95 2.77 0.40 2.41 0.36 1.00 1.14 1.119 0.95 2.77 0.38 2.46 0.35 1.00 1.23 1.05
8 1.01 2.95 0.44 2.45 0.38 1.00 0.92 1.245 1.09 3.16 0.45 2.77 0.43 1.01 0.88 1.249 1.11 3.16 0.48 2.76 0.43 1.02 0.89 1.218 0.98 2.84 0.42 2.48 0.38 1.01 0.90 1.268 1.07 3.11 0.45 2.59 0.40 1.02 0.94 1.245 0.95 2.76 0.42 2.45 0.37 1.01 0.89 1.212 0.92 2.72 0.41 2.37 0.37 1.01 0.92 1.233 0.93 2.71 0.41 2.35 0.38 1.02 0.95 1.207 0.94 2.64 0.41 2.36 0.38 1.01 0.94 1.21
4 1.13 3.38 0.49 2.89 0.46 1.01 0.85 1.243 1.12 3.33 0.49 2.85 0.45 1.01 0.88 1.258 1.16 3.45 0.51 3.06 0.48 1.00 0.88 1.244 1.19 3.49 0.52 3.09 0.50 0.99 0.88 1.202 1.14 3.42 0.51 2.96 0.46 0.99 0.96 1.188 1.12 3.24 0.48 2.85 0.44 1.00 1.01 1.14
0 1.07 3.16 0.44 2.67 0.41 0.99 1.10 1.164 1.28 3.59 0.53 3.14 0.48 0.99 1.08 1.172 1.31 3.86 0.54 3.19 0.51 1.00 1.11 1.13
184 S. Kurian et al. / Marine Geology 247 (2008) 178–193
increasing sediment depth (Fig. 3B). Shale-normalizedLa/Yb ratios showed low values for surface samples(0.85) which increase towards the base of the core (1.23)(Table 3). The variation is more marked for core SPC-1.
3.3. Leach studies
The weight percent of elements soluble in each phaseviz. 1) acetic acid; 2) hydroxylamine–HCl; 3) soluble inHCl; and 4) HCl-insoluble residue (detrital fraction) areshown in Table 4. About 13–28% of sediment fractionwas leached out by acetic acid (biogenic fraction),
Fig. 2. Shale-normalized (PAAS) patterns for the bulk sediments from the ABBare from Taylor and McLennan (1985).
18–32% in hydroxylamine–HCl and 30–46% in HCl.Resistant detrital and volcaniclastic phases contribute to60–70% in the HCl-insoluble residue (Table 4).
Mn showed high percentage in the hydroxylamine–HCl soluble phase (ferromanganese oxide) with highvalues for the surface samples. Elements like Fe, Cr, Co,Ni, Cu, and Zn showed higher percentage in the HClsoluble fraction indicating that these elements are moreassociated with crystalline Fe-oxides. The high fieldstrength elements such as Ga, Nb, and Th are moreassociated with detrital fraction (HCl-insoluble residueis about 65–95%), while their contribution to other
and surface sediments from the Irrawaddy shelf. PAAS concentrations

Fig. 3. Down core variation of (A) the ∑REE content of the sedimentcores; (B) Eu anomaly in the sediment cores.
185S. Kurian et al. / Marine Geology 247 (2008) 178–193
phases is negligible (Table 4). The total REE content(∑REE) showed a low percentage in acetic acid fractionfor all the three cores with relatively high values for thedeeper sample intervals. The contribution of ∑REE tothe HCl soluble fraction is 30–40%. Shale-normalizedpatterns of acetic acid soluble phase (biogenic carbo-nates) in the surface sediments showed HREE enrich-ment and negative Ce anomaly (Fig. 4) mimicking theseawater REE pattern (Palmer, 1985; Chavagnac et al.,2005). The deeper samples showed flat or insignificantpositive Ce anomaly.
4. Discussion
4.1. Source of Andaman backarc basin sediments
Deciphering the provenance of hemipelagic sedi-ments is complicated owing to their fine-grained natureof the sediment and the multiple processes of transport
and resuspension controlling their distribution (e.g.Hathon and Underwood, 1991; Stow, 1985). In addition,the Andaman basin also receives sediment inputsdirectly from the Myanmar shelf through the Martabancanyon (Ramaswamy et al., 2004; Rao et al., 2005).Seismic studies show that the Irrawaddy River as themajor source of detrital sediment in the abyssal plain inthe eastern part of the ABB (Kamesh Raju et al., 2004).
4.1.1. Terrigenous sourceThe similarity in shale-normalized REE patterns with
positive Eu anomaly for sediments from both the ABBand the Irrawaddy shelf (Fig. 2) suggests that theMyanmar Rivers are the major continental source to theABB sediments (Roonwal et al., 1997). Flat shale-normalized patterns for the ABB and Irrawaddy shelfsediments indicate a mixed felsic and basic source(Piper, 1974; Sholkovitz, 1990; McLennan, 1989; Nathet al., 2000). However, there are dissimilarities in thepatterns between the ABB and Irrawaddy shelfsediments (Fig. 2) which are discussed in the subsequentsections. The fractionation index (La/Yb)n (Table 3)shows high values for the deeper samples (typical ofcontinentally-derived detrital material) which suggest alarger detrital component in the older sediments (Piper,1974; Sholkovitz, 1990; Nath et al., 1997).
4.1.2. Biogenic sourceAlthough the organic carbon content in the core tops
(0.44 to 1.82%; Table 2) is within the range expected ofhemipelagic sediments, the CaCO3 content is very low(0.5 to 2.8 wt.%). It is surprising to find such a lowcarbonate content in a modern hemipelagic sedimenta-tion area at a depth of 3000 m. In a similar setting andwater depth in the Arabian Sea, carbonate percentagesare around 30–40% (e.g., Sirocko et al., 2000). Theextremely low carbonate content in the surface of thecore tops from the ABB are both due to the dilutionfrom large detrital sedimentation and the lowerforaminiferal carbonate productivity induced by sharpchanges in surface salinity (b30 PSU) during thesouthwest monsoon in the northern Bay of Bengal andAndaman Sea (Ramaswamy and Gaye, 2006; Stollet al., 2007). Contributions from the Irrawaddy shelf ismainly fluvial sediment having low carbonate content(~1%, Table 2).
4.1.3. Volcanic sourceTephra present in the sand-sized sediment fractions
from the ABB sediments indicates contribution from arcvolcanism and numerous seamounts in the westernbackarac basin (Rao et al., 1996; Kamesh Raju et al.,
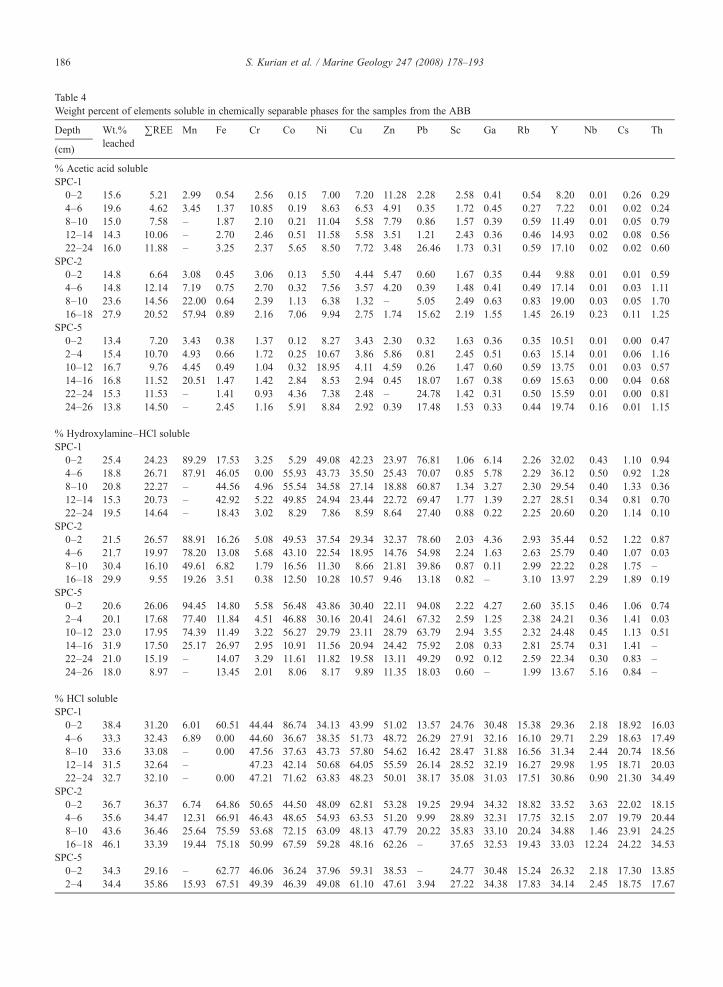
Table 4Weight percent of elements soluble in chemically separable phases for the samples from the ABB
Depth Wt.%leached
∑REE Mn Fe Cr Co Ni Cu Zn Pb Sc Ga Rb Y Nb Cs Th
(cm)
% Acetic acid solubleSPC-10–2 15.6 5.21 2.99 0.54 2.56 0.15 7.00 7.20 11.28 2.28 2.58 0.41 0.54 8.20 0.01 0.26 0.294–6 19.6 4.62 3.45 1.37 10.85 0.19 8.63 6.53 4.91 0.35 1.72 0.45 0.27 7.22 0.01 0.02 0.248–10 15.0 7.58 – 1.87 2.10 0.21 11.04 5.58 7.79 0.86 1.57 0.39 0.59 11.49 0.01 0.05 0.7912–14 14.3 10.06 – 2.70 2.46 0.51 11.58 5.58 3.51 1.21 2.43 0.36 0.46 14.93 0.02 0.08 0.5622–24 16.0 11.88 – 3.25 2.37 5.65 8.50 7.72 3.48 26.46 1.73 0.31 0.59 17.10 0.02 0.02 0.60
SPC-20–2 14.8 6.64 3.08 0.45 3.06 0.13 5.50 4.44 5.47 0.60 1.67 0.35 0.44 9.88 0.01 0.01 0.594–6 14.8 12.14 7.19 0.75 2.70 0.32 7.56 3.57 4.20 0.39 1.48 0.41 0.49 17.14 0.01 0.03 1.118–10 23.6 14.56 22.00 0.64 2.39 1.13 6.38 1.32 – 5.05 2.49 0.63 0.83 19.00 0.03 0.05 1.7016–18 27.9 20.52 57.94 0.89 2.16 7.06 9.94 2.75 1.74 15.62 2.19 1.55 1.45 26.19 0.23 0.11 1.25
SPC-50–2 13.4 7.20 3.43 0.38 1.37 0.12 8.27 3.43 2.30 0.32 1.63 0.36 0.35 10.51 0.01 0.00 0.472–4 15.4 10.70 4.93 0.66 1.72 0.25 10.67 3.86 5.86 0.81 2.45 0.51 0.63 15.14 0.01 0.06 1.1610–12 16.7 9.76 4.45 0.49 1.04 0.32 18.95 4.11 4.59 0.26 1.47 0.60 0.59 13.75 0.01 0.03 0.5714–16 16.8 11.52 20.51 1.47 1.42 2.84 8.53 2.94 0.45 18.07 1.67 0.38 0.69 15.63 0.00 0.04 0.6822–24 15.3 11.53 – 1.41 0.93 4.36 7.38 2.48 – 24.78 1.42 0.31 0.50 15.59 0.01 0.00 0.8124–26 13.8 14.50 – 2.45 1.16 5.91 8.84 2.92 0.39 17.48 1.53 0.33 0.44 19.74 0.16 0.01 1.15
% Hydroxylamine–HCl solubleSPC-10–2 25.4 24.23 89.29 17.53 3.25 5.29 49.08 42.23 23.97 76.81 1.06 6.14 2.26 32.02 0.43 1.10 0.944–6 18.8 26.71 87.91 46.05 0.00 55.93 43.73 35.50 25.43 70.07 0.85 5.78 2.29 36.12 0.50 0.92 1.288–10 20.8 22.27 – 44.56 4.96 55.54 34.58 27.14 18.88 60.87 1.34 3.27 2.30 29.54 0.40 1.33 0.3612–14 15.3 20.73 – 42.92 5.22 49.85 24.94 23.44 22.72 69.47 1.77 1.39 2.27 28.51 0.34 0.81 0.7022–24 19.5 14.64 – 18.43 3.02 8.29 7.86 8.59 8.64 27.40 0.88 0.22 2.25 20.60 0.20 1.14 0.10
SPC-20–2 21.5 26.57 88.91 16.26 5.08 49.53 37.54 29.34 32.37 78.60 2.03 4.36 2.93 35.44 0.52 1.22 0.874–6 21.7 19.97 78.20 13.08 5.68 43.10 22.54 18.95 14.76 54.98 2.24 1.63 2.63 25.79 0.40 1.07 0.038–10 30.4 16.10 49.61 6.82 1.79 16.56 11.30 8.66 21.81 39.86 0.87 0.11 2.99 22.22 0.28 1.75 –16–18 29.9 9.55 19.26 3.51 0.38 12.50 10.28 10.57 9.46 13.18 0.82 – 3.10 13.97 2.29 1.89 0.19
SPC-50–2 20.6 26.06 94.45 14.80 5.58 56.48 43.86 30.40 22.11 94.08 2.22 4.27 2.60 35.15 0.46 1.06 0.742–4 20.1 17.68 77.40 11.84 4.51 46.88 30.16 20.41 24.61 67.32 2.59 1.25 2.38 24.21 0.36 1.41 0.0310–12 23.0 17.95 74.39 11.49 3.22 56.27 29.79 23.11 28.79 63.79 2.94 3.55 2.32 24.48 0.45 1.13 0.5114–16 31.9 17.50 25.17 26.97 2.95 10.91 11.56 20.94 24.42 75.92 2.08 0.33 2.81 25.74 0.31 1.41 –22–24 21.0 15.19 – 14.07 3.29 11.61 11.82 19.58 13.11 49.29 0.92 0.12 2.59 22.34 0.30 0.83 –24–26 18.0 8.97 – 13.45 2.01 8.06 8.17 9.89 11.35 18.03 0.60 – 1.99 13.67 5.16 0.84 –
% HCl solubleSPC-10–2 38.4 31.20 6.01 60.51 44.44 86.74 34.13 43.99 51.02 13.57 24.76 30.48 15.38 29.36 2.18 18.92 16.034–6 33.3 32.43 6.89 0.00 44.60 36.67 38.35 51.73 48.72 26.29 27.91 32.16 16.10 29.71 2.29 18.63 17.498–10 33.6 33.08 – 0.00 47.56 37.63 43.73 57.80 54.62 16.42 28.47 31.88 16.56 31.34 2.44 20.74 18.5612–14 31.5 32.64 – 47.23 42.14 50.68 64.05 55.59 26.14 28.52 32.19 16.27 29.98 1.95 18.71 20.0322–24 32.7 32.10 – 0.00 47.21 71.62 63.83 48.23 50.01 38.17 35.08 31.03 17.51 30.86 0.90 21.30 34.49
SPC-20–2 36.7 36.37 6.74 64.86 50.65 44.50 48.09 62.81 53.28 19.25 29.94 34.32 18.82 33.52 3.63 22.02 18.154–6 35.6 34.47 12.31 66.91 46.43 48.65 54.93 63.53 51.20 9.99 28.89 32.31 17.75 32.15 2.07 19.79 20.448–10 43.6 36.46 25.64 75.59 53.68 72.15 63.09 48.13 47.79 20.22 35.83 33.10 20.24 34.88 1.46 23.91 24.2516–18 46.1 33.39 19.44 75.18 50.99 67.59 59.28 48.16 62.26 – 37.65 32.53 19.43 33.03 12.24 24.22 34.53
SPC-50–2 34.3 29.16 – 62.77 46.06 36.24 37.96 59.31 38.53 – 24.77 30.48 15.24 26.32 2.18 17.30 13.852–4 34.4 35.86 15.93 67.51 49.39 46.39 49.08 61.10 47.61 3.94 27.22 34.38 17.83 34.14 2.45 18.75 17.67
186 S. Kurian et al. / Marine Geology 247 (2008) 178–193

Table 4 (continued)
Depth Wt.%leached
∑REE Mn Fe Cr Co Ni Cu Zn Pb Sc Ga Rb Y Nb Cs Th
(cm)
% HCl solubleSPC-5
10–12 37.1 38.00 19.60 68.43 50.25 38.42 43.51 67.89 54.09 33.62 26.81 32.84 17.13 37.06 2.81 20.38 15.4614–16 35.3 33.76 46.75 – 50.67 74.97 66.29 50.14 66.08 2.15 28.09 32.00 16.71 32.13 0.92 19.20 19.5622–24 34.5 35.94 – – 50.09 71.51 65.18 49.91 62.32 19.47 32.52 32.03 17.92 35.20 0.91 20.29 24.1724–26 30.1 39.45 – 0.00 49.99 71.27 63.77 45.99 60.15 12.32 33.45 30.36 18.45 39.12 24.22 20.92 27.00
% Detrital (HCl-insoluble residue)SPC-1
0–2 61.6 39.35 1.71 21.42 49.76 7.82 9.79 6.57 13.72 7.34 71.60 62.97 81.82 30.42 97.38 79.72 82.744–6 66.7 36.24 1.75 52.57 44.55 7.21 9.29 6.24 20.94 3.28 69.52 61.62 81.34 26.95 97.20 80.43 80.988–10 66.4 37.07 – 53.57 45.38 6.62 10.64 9.48 18.71 21.86 68.62 64.46 80.55 27.63 97.16 77.89 80.2812–14 68.5 36.57 – 54.39 45.09 7.50 12.81 6.93 18.18 3.18 67.28 66.05 81.00 26.58 97.69 80.40 78.7122–24 67.3 41.39 – 78.32 47.40 14.44 19.81 35.46 37.87 7.97 62.31 68.44 79.65 31.44 98.87 77.55 64.82
SPC-20–2 63.4 30.43 1.26 18.43 41.21 5.84 8.87 3.41 8.88 1.55 66.35 60.97 77.81 21.16 95.84 76.74 80.394–6 64.4 33.43 2.30 19.26 45.20 7.93 14.97 13.95 29.83 34.65 67.39 65.65 79.13 24.92 97.52 79.11 78.428–10 56.4 32.88 2.74 16.96 42.14 10.16 19.23 41.90 30.40 34.87 60.81 66.17 75.95 23.90 98.23 74.29 74.0516–18 53.9 36.53 3.37 20.42 46.47 12.86 20.49 38.52 26.55 71.20 59.33 65.92 76.01 26.80 85.25 73.78 64.03
SPC-50–2 65.7 37.58 2.13 22.05 47.00 7.16 9.92 6.86 37.06 5.60 71.38 64.89 81.81 28.02 97.35 81.63 84.942–4 65.6 35.76 1.73 19.99 44.37 6.47 10.09 14.63 21.91 27.93 67.74 63.86 79.16 26.52 97.17 79.78 81.1510–12 63.0 34.29 1.57 19.59 45.50 5.00 7.75 4.89 12.53 2.33 68.79 63.00 79.97 24.70 96.73 78.46 83.4614–16 64.8 37.22 7.57 71.56 44.96 11.28 13.62 25.99 9.05 3.86 68.16 67.29 79.80 26.50 98.77 79.36 79.7622–24 65.5 37.34 – 84.53 45.70 12.51 15.62 28.03 24.56 6.45 65.14 67.54 78.99 26.88 98.77 78.88 75.0224–26 69.9 37.09 – 84.10 46.84 14.76 19.23 41.20 28.11 52.17 64.43 69.31 79.12 27.47 70.46 78.23 71.85
187S. Kurian et al. / Marine Geology 247 (2008) 178–193
2004). Although the shale-normalized patterns of thesediments from the ABB and Irrawaddy shelf arebroadly similar, the relative LREE depletion in the ABBsediment (Fig. 2) suggests a possible contribution fromlocal basaltic sources. The higher smectite content(∼50%) in the clay fraction of ABB sediment comparedto that of Irrawaddy shelf sediment (15%) also supportsthe contribution from volcanic rocks (Fig. 5).
The smectite in ABB sediments is identified asdioctahedral montmorillonite and beidellite. The occur-rence of Al-smectite in the sediments could indicate thepresence of terrigenous smectite (Aoki and Kohyama,1991; Chamley, 1989) or smectite derived from thehydrothermal alteration of volcanic formation and soils(Parra et al., 1991). The higher smectite content in theclay fraction of ABB sediments compared to Irrawaddysource could therefore indicate mixed sources ofcontinental, volcanic and hydrothermal smectite. Alter-natively, smectite usually the clay mineral having thesmallest particles could be transported furthest awayfrom the Irrawaddy River, increasing its relativeconcentration in the deep ABB sediments.
Basaltic rocks were recovered from the ABBspreading centre and flanks of the rift valley by Rodolfo
(1969a), Rao et al. (1996) and Curray (2005). Thecompositional data also supports a basaltic contributionto the sediments for e.g. Sc concentrations in residue 3are closer to the basaltic field (Table 4).
4.2. Hydrothermal signaturesWhile the mineralogical and geochemical signatures
clearly suggest the contribution from Irrawaddy andother Myanmar Rivers and local basaltic sources, someof the geochemical data requires additional diageneticand hydrothermal inputs to explain the variations. Thefollowing discussions are to differentiate between thediagenetic and hydrothermal signatures, for which wehave used Mn, Ba, Mo enrichment, Eu anomaly, Y/Hovariation and Irrawaddy normalized HCl-insolubleresidue.
4.2.1. Enrichment of Mn, Ba and MoThe possible sources of Mn enrichment at the surface
(Fig. 6) could be either diagenetic or hydrothermal. Mnprofiles for SPC-1 show significant enrichment (1–4%)in the top 12 cm (Fig. 6), well above those in normalpelagic carbonate-free sediments (e.g., Rutten andDe Lange, 2003). The deeper samples of the cores
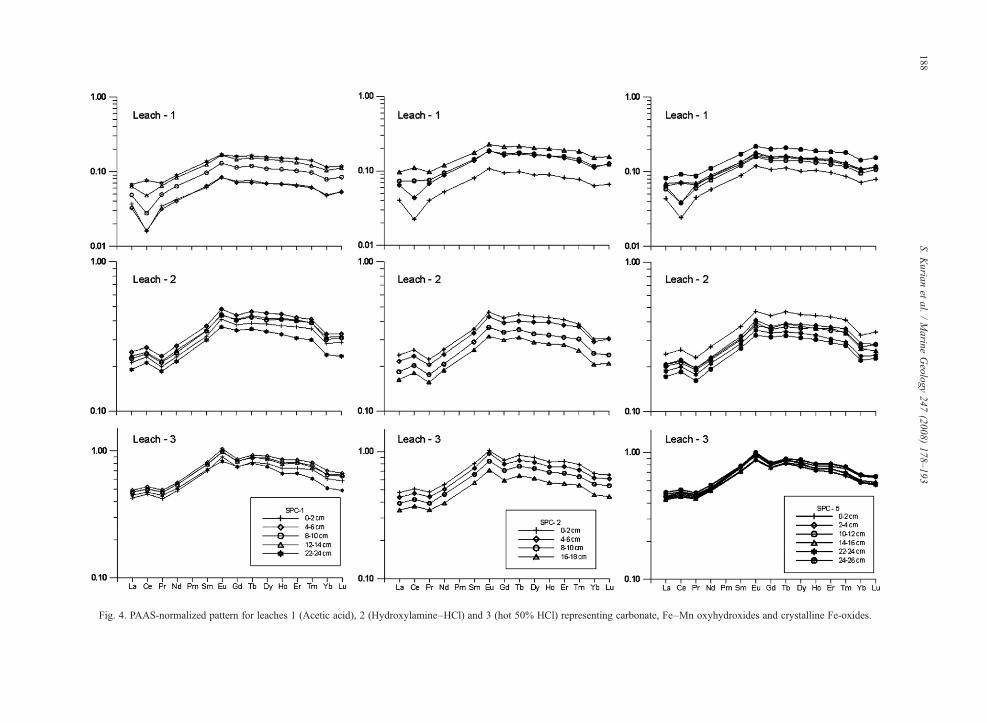
Fig. 4. PAAS-normalized pattern for leaches 1 (Acetic acid), 2 (Hydroxylamine–HCl) and 3 (hot 50% HCl) representing carbonate, Fe–Mn oxyhydroxides and crystalline Fe-oxides.
188S.
Kurian
etal.
/Marine
Geology
247(2008)
178–193

Fig. 5. XRD patterns for core tops from the ABB studied compared with suspended sediment and surficial sediments from the Irrawaddy shelf.
189S. Kurian et al. / Marine Geology 247 (2008) 178–193
have very low Mn content and thus can be clay mineral-Mn or carbonate-Mn (Table 4). Leach studies (Table 4)and PAAS-normalized REE patterns (Fig. 4) confirmthat Mn in the surficial sediments is predominantly inthe oxide/oxyhydroxide form. Positive Ce anomalies(1.2 to 1.3) and MREE enrichment (Fig. 4), typical ofdeep-sea Fe–Mn oxyhydroxides (Elderfield andGreaves, 1981; Glasby et al., 1987; Nath et al., 1992,1994) are seen here.
Lack of sharp peaks of MnO2, which is typical ofmigration of oxidation fronts in a diagenetic system
(e.g., Froelich et al., 1979; Thomson et al., 1995; Reitzet al., 2006), suggests that Mn enrichment in the uppersediment zone are not due to diagenetic processes andhydrothermal input play a major role (Reitz et al., 2006).
Barium in the surficial sediments is also high(N1000 ppm) up to a depth of 12 cm, which correspondswell with the Mn enriched layers (Table 2, Fig. 6). Theenrichment of Ba, Mo and Mn is possible in sedimentswith hydrothermal/metalliferous components. Hydrother-mal sediments, particularly those in proximity to hydro-thermal vents may be rich in Ba (Plank and Langmuir,

Fig. 7. A plot of Y/Ho (molar ratio) versus Y/Fe−105 (molar ratio) forthe bulk and Leach-3 samples of cores SPC-1, 2 and 5 related withplume particles from TAG mound (Bau and Dulski, 1999).
Fig. 6. Down core variation of Mn, Ba, Mo in bulk sediments of thecore SPC-1.
190 S. Kurian et al. / Marine Geology 247 (2008) 178–193
1998). Although, the barium enrichment can also resultfrom the biological productivity in the overlying waters, alack of correlation between Ba and other biologicalproxies (CaCO3, Corg) suggests a limited role ofproductivity on the Ba enrichment in the surficial layers.
Mo enrichment, as high as 200 ppm, is seen in TAGmetalliferous sediments (Mills et al., 1993). Similarconcomitant increases of Mn and Mo were seen bySchaller et al. (2000) in a sediment core recovered fromnear an active hydrothermal location on the southernEast Pacific Rise and were attributed to the scavengingof dissolved Mo onto Fe and Mn oxides in hydrothermalplumes and diagenetic cycling of Mn in the sediments.The sharp increase in Mo concentrations (from 0.8 to44 ppm in SPC-1) at the surface in the ABB sediments(Table 2) indicates probable hydrothermal enrichment.
4.2.2. Eu anomalyLarger positive Eu anomalies in the ABB sediments
(Table 3) compared to the Irrawaddy shelf sediments,could be possibly due to a hydrothermal input. Thehydrothermal solutions and the sediments resulting fromhigh-Temperature basalt alteration along the mid-oceanridges and backarc spreading centers (Michard et al.,1983; German et al., 1993) display positive Euanomalies. While the surface sediments from the ABBshowed (Eu/Sm)n ratios (1.24) closer to hydrothermal
plume particle ratio of 1.23 (e.g. Barrett et al., 1990),lower ratios in deeper sediment intervals are more closerto the Irrawaddy shelf sediments (1.1) (Table 3). Thissuggests a reduced influence of detrital contributionwith time. The larger detrital contribution for the deepersamples is also supported by an increase in down core Kcontent (Table 2). The Eu anomaly, however, can also bea result of eolian input (Elderfield, 1988) or merely dueto the variation in plagioclase content. Eolian input tothe ABB is not expected as the main-land around theAndaman Sea (Myanmar, Thailand, Andaman islands)is well vegetated and has a humid climate. Hydrother-mally-derived metalliferous sediments typically showshale-normalized pattern with HREE enrichment, pos-itive Eu anomaly and negative Ce anomaly similar toseawater (e.g. Dymond et al., 1973; Mills et al., 1993).However, ABB sediments show a down core decrease inpositive Eu anomaly and with no Ce fractionationsuggesting that detrital sedimentation in ABB dominatesover a hydrothermal contribution.
4.2.3. Y–Ho variationYttrium and the redox-insensitive REEs are very
similar, being trivalent with similar ionic radii. Thesesimilarities often lead to extremely coherent behaviorresulting in negligible Y–Ho fractionation in igneousrocks and clastic sediments (Bau and Dulski, 1999). Aplot of Y/Ho (molar ratio) versus Y/Fe×105 (molar ratio)for ABB samples (Fig. 7) shows that the values are closeto plume particles from other hydrothermal area indicat-ing affinity to plume characteristics. When we considerthe estimates of Y/Homolar ratio for particles precipitatedfrom varying mixtures of hydrothermal fluids and
191S. Kurian et al. / Marine Geology 247 (2008) 178–193
seawater, the average molar Y/Ho ratios of 57.5, 58.1 and57.7 obtained for leach-3 of sediments from the ABB(SPC-1, 2 and 5 respectively) match well with thepublished values of particles of other areas having∼10%hydrothermal component (Bau and Dulski, 1999).
4.2.4. Concentrations of HCl-insoluble fractionnormalized to Irrawaddy shelf sediment data
Normalized to the Irrawaddy sediment, elementssuch as Mo, Cu, Pb showed enrichment (0.9–2.4) whichis probably due to the hydrothermal input (residuedevoid of adsorbed and diagenetic phases). Associationof Mo and Cu can be possibly due to sulfide likematerial, probably of a hydrothermal nature.
Leaching studies reveal a major contribution fromresistant detrital and volcaniclastic phases to the ABBsediments (∼65%), and thus a mixture of biogenic,authigenic and hydrothermal inputs will account forabout 30–40% (Table 4) in these sediments. The Pb, Znand Cu content in the present study is 8–10 times lowerthan in near-vent sediment cores closer to the hydro-thermal vents from the EPR area (German et al., 1999).The influence of hydrothermal contribution in thesediments considered here must therefore be limited,compared to other active hydrothermal areas (Germanet al., 1999) suggesting that these sediments do notrepresent a near field component derived from erosionand mass wasting of sea-floor hydrothermal sulfidedeposits but probably represent a weak plume relatedcomponent (German et al., 1993; Mills et al., 1993).
5. Summary and conclusions
Mineralogical and geochemical studies of the sedi-ments from the ABB show that the principle sedimentsources to the basin are (a) the continental source ofIrrawaddy and other Myanmar rivers; (b) biogenicsources; (c) altered products of basinal volcanic rockswhich are further subjected to diagenetic and hydro-thermal alterations.
High terrigenous and low biogenic carbonate contentin the ABB sediment is due to direct input of fluvialsediments through the Irrawaddy submarine canyon andlow carbonate productivity in the overlying surfacewaters of the northern Andaman Sea.
Our study indicates a significant enrichment of tracemetals (Mn, Ba, Mo, Cu, Pb) in upper 10 cm of thesediment coremainly due to hydrothermal activity. Otherhydrothermal signatures such as Eu anomaly, Y/Hovariation, Irrawaddy normalized HCl-insoluble residuealso support hydrothermal activity during the lateHolocene.
Future studies targeting fresh hydrothermal precipitateson basaltic rocks in the rift valley may provide insightsinto the hydrothermal processes operating in the area.
Acknowledgements
We thank the Directors of NIO, Goa and NGRI,Hyderabad, for permission to use the facilities, theMinistry of Earth Sciences, New Delhi, for providingship time to collect the samples, CSIR and DST forfunding the project, P. Pawaskar, R. Uchil and M. B. L.Mascarenhas-Pereira for their help in generating someof the figures and Girish Prabhu for his help in the XRDanalyses. The first author wishes to acknowledge Dr. N.Chandramohana Kumar and Dr. K.K.C. Nair for theirguidance. Thorough reviews by Geoff Glasby, Editor-in-chief Gert deLange and an anonymous reviewer werevery useful. K.S. also thanks National Science Councilof Taiwan (NSC-94-2621-Z-110-001 and 94-2611-M110-001) for his postdoctoral fellowship. This isNIO contribution no. 4299.
References
Ahmad, S.M., Patil, D.J., Rao, P.S., Nath, B.N., Rao, B.R.,Rajagopalan, G., 2000. Glacial-interglacial changes in the surfacewater characteristics of the Andaman Sea: evidence from stableisotopic ratios of planktonic foraminifera. Proc. Indian Acad. Sci.,Earth Planet. Sci. 109, 153–156.
Aoki, S., Kohyama, N., 1991. The vertical change in clay mineralcomposition and chemical characteristics of smectite in sedimentcores from the southern part of the Central Pacific Basin. Mar.Geol. 98, 41–49.
Balaram, V., Rao, T.G., 2003. Rapid determination of REEs and othertrace elements in geological samples by microwave acid digestionand ICP-MS. At. Spectr. 24, 206–212.
Barrett, T.J., Jarvis, I., Jarvis, K.E., 1990. Rare earth elementgeochemistry of massive sulfides-sulfates and gossans on theSouthern Explorer Ridge. Geology 18, 583–586.
Bau, M., Dulski, P., 1999. Comparing yttrium and rare earths inhydrothermal fluids from the Mid-Atlantic Ridge: implications forY and REE behavior during near-vent mixing and for the Y/Horatio of Proterozoic seawater. Chem. Geol. 155, 77–90.
Biscaye, P.E., 1965. Mineralogy and sedimentation of recent deep-seaclays in the Atlantic Ocean and adjacent seas and oceans. Bull.Geol. Soc. Am. 76, 803–832.
Chamley, H., 1989. Clay Sedimentology. Springer-Verlag, Berlin, p. 623.Chavagnac, V., German, C.R., Milton, J.A., Palmer, M.R., 2005.
Sources of REE in sediment cores from the rainbow vent site(36°14′N, MAR). Chem. Geol. 216, 329–352.
Chernova, T.G., Rao, P.S., Pikovskii, Yu.I., Alekseeva, T.A., Nath, B.N.,Rao, B.R., Rao, Ch.M., 2001. The composition and source ofhydrocarbons in sediments taken from the tectonically activeAndaman Backarc Basin, Indian Ocean. Mar. Chem. 75, 1–15.
Colin, C., Turpin, L., Bertaux, J., Desprairies, A., Kissel, C., 1999.Erosional history of the Himalayan and Burman ranges during thelast two glacial-interglacial cycles. Earth Planet. Sci. Lett. 171,647–660.
192 S. Kurian et al. / Marine Geology 247 (2008) 178–193
Cronan, D.S., 1976. Basal metalliferous sediments from the easternPacific. Geol. Soc. Amer. Bull. 87, 928–934.
Cronan, D.S., Wijayananda, N.P., 1991. Sediments and marine mineralresources in the eastern Indian Ocean. Mar. Min. 10, 103–116.
Curray, J.R., 2005. Tectonics and history of the Andaman Sea region.J. Asian Earth Sci. 25, 187–232.
Curray, J.R., Moore, D.G., Lawver, L.A., Emmel, F.J., Raitt, R.W., Henry,M., Kieckhefer, R., 1979. Tectonics of the Andaman Sea and Burma.In: Watkins, J., Montadert, L., Dickerson, P.W. (Eds.), Geological andGeophysical Investigations of Continental Margins American Asso-ciation Petroleum Geologists Memoir vol. 29, 189–198.
Dymond, J., Corliss, J.B., Heath, G.R., Filed, C.W., Dasch, E.J.,Veeh, H.H., 1973. Origin of metalliferous sediments from thePacific Ocean. Geol. Soc. Amer. Bull. 8, 3355–3371.
Elderfield, H., 1988. The oceanic chemistry of the rare earth elements.Philos. Trans. R. Soc. Lond., A 325, 105–126.
Elderfield, H., Greaves, M.J., 1981. Negative cerium anomalies in therare earth element patterns of oceanic ferromanganese nodules.Earth Planet. Sci. Lett. 55, 163–170.
El Wakeel, S.K., Riley, J.P., 1957. Determination of organic matter inmarine muds. J. Con. Perm. Int. Explor. Mar. 22, 180–183.
Folk, R.L., 1968. Petrology of Sedimentary Rocks, Hemphills, Austin,Texas, p. 170.
Froelich, P.N., Klinkhammer, G.P., Bender, M.L., Luedtke, N.A.,Heath, G.R., Cullen, D., Dauphin, P., 1979. Early oxidation oforganic matter in pelagic sediments of the eastern equatorialAtlantic: suboxic diagenesis. Geochim. Cosmochim. Acta 43,1075–1090.
German, C.R., Mills, R., Blusztajn, J., Fleer, A.P., Bacon, M.P., Higgs,N.C., Elderfield, H., Thomson, J., 1993. A geochemical study ofmetalliferous sediment from the TAG hydrothermal mound, 26°08′N, Mid Atlantic Ridge. J. Geophys. Res. 98, 9683–9692.
German, C.R., Hergt, J., Palmer, M.R., Edmond, J.M., 1999.Geochemistry of a hydrothermal sediments core from the OBSvent-field, 21°N East Pacific Rise. Chem. Geol. 155, 65–75.
Glasby, G.P., Gwozdz, R., Kunzendorf, H., Friedrich, G., Thijssen, T.,1987. The distribution of rare earth and minor elements inmanganese nodules and sediments from the equatorial and S.W.Pacific. Lithos 20, 97–113.
Hathon, E.G., Underwood, M.B., 1991. Clay mineralogy andchemistry as indicators of hemipelagic sediment dispersal southof the Aleutian arc. Mar. Geol. 97, 145–166.
Hodkinson, R.A., Varnavas, S., Perissoratis, C., 1994. Regionalgeochemistry of sediments from the Hellenic Volcanic Arc inregard to submarine hydrothermal activity. Mar. Georesour.Geotechnol. 12, 83–129.
Kamesh Raju, K.A., Ramprasad, T., Rao, P.S., Rao, B.R., Varghese, J.,2004. New insights into the tectonic evolution of the Andaman basin,northeast Indian Ocean. Earth Planet. Sci. Lett. 221, 145–162.
Konta, J., 1985. Mineralogy and chemical maturity of suspended matter inmajor river samples under the SCOPE/UNEP project. In: Degens, E.T.,Kempe, S. (Eds.), Transport of Carbon and Minerals in Major WorldRivers, Part 3. Mittilungen aus dem Geologisch-Palaeontologischen,Institut der Universitat Hamburg, vol. 58, pp. 559–568.
McLennan, S.M., 1989. Rare earth elements in sedimentary rocks:influence of provenance and sedimentary processes. In: Lipin, B.P.,Mckay, G.A. (Eds.), Geochemistry and Mineralogy of Rare EarthElements. Rev. in Mineralogy, vol. 21, pp. 116–200.
Michard, A., Albarède, F., Michard, G., Minster, J.F., Charlou, J.L.,1983. Rare earth elements and uranium in high temperaturesolutions from East Pacific Rise hydrothermal vent field (13°N).Nature 303, 795–797.
Mills, R., Elderfield, H., Thomson, J., 1993. A dual origin for theHydrothermal component in a metalliferous sediment core fromthe Mid-Atlantic Ridge. J. Geophys. Res. 98 (B6), 9671–9681.
Nath, B.N., Balaram, V., Sudhakar, M., Pluger, W.L., 1992. Rare earthelement geochemistry of ferromanganese deposits of the IndianOcean. Mar. Chem. 38, 185–208.
Nath, B.N., Roelandts, I., Sudhakar, M., Plüger, W.L., Balaram, V.,1994. Cerium anomaly variations in ferromanganese nodules andcrusts from the Indian Ocean. Mar. Geol. 120, 385–400.
Nath, B.N., Bau, M., Rao, B.R., Rao, Ch.M., 1997. Trace and rareearth elemental variation in Arabian Sea sediments through atransect across the oxygen minimum zone. Geochim. Cosmochim.Acta 61, 2375–2388.
Nath, B.N., Kunzendorf, H., Pluger, W.L., 2000. Influence ofprovenance, weathering and sedimentary processes on theelemental ratios of the fine-grained fraction of the bedloadsediments from the Vembanad Lake and the adjoining continen-tal shelf, southwest coast of India. J. Sediment. Res. 70,1081–1094.
Palmer, M.R., 1985. Rare earth elements in foraminifera. Earth Planet.Sci. Lett. 186, 383–399.
Parra, M., Chapuy, B., Pons, J., Latouche, C., 1991. The nature andorigin of smectites in the Kerguelen-Heard Archipelagoes of thesouthern Indian Ocean. Cont. Shelf Res. 11, 347–364.
Piper, D.Z., 1974. Rare earth elements in the sedimentary cycle: asummary. Chem. Geol. 14, 285–304.
Plank, T., Langmuir, C.H., 1998. The chemical composition ofsubducting sediment and its consequences for the crust and mantle.Chem. Geol. 145, 325–394.
Ramaswamy, V., Gaye, B., 2006. Regional variations in the fluxes offoraminifera carbonate, coccolithophorid carbonate and biogenicopal in the northern Indian Ocean. Deep-Sea Res. 53, 271–293.
Ramaswamy, V., Rao, P.S., Rao, K.H., Thwin, S., Rao, N.S., Raiker, V.,2004. Tidal influence on suspended sediment distribution anddispersal in the northern Andaman Sea and Gulf of Martaban. Mar.Geol. 208, 33–42.
Rao, P.S., Kamesh Raju, K.A., Ramprasad, T., Nath, B.N., Rao, B.R.,Rao, Ch.M., Nair, R.R., 1996. Evidence for hydrothermal activityin the Andaman Backarc Basin. Curr. Sci. 70, 379–385.
Rao, P.S., Ramaswamy, V., Thwin, S., 2005. Sediment texture,distribution and transport on the Ayeyarwady continental shelf,Andaman Sea. Mar. Geol. 216, 239–247.
Reitz, A., Thomson, J., De Lange, G.J., Hensen, C., 2006. Source anddevelopment of large manganese enrichments above easternMediterranean sapropel S1. Paleoceanography 21, PA3007.doi:10.1029/2005PA001169.
Rodolfo, K.S., 1969a. Sediments of the Andaman basin, North EasternIndian Ocean. Mar. Geol. 7, 371–402.
Rodolfo, K.S., 1969b. Bathymetry and marine geology of theAndaman basin, and tectonic implications for South East Asia.Geol. Soc. Amer. Bull. 80, 1203–1230.
Rona, P.A., Scott, D., 1993. A special issue on sea-floor hydrothermalmineralization New perspectives—Preface. Econ. Geol. 88,1935–1975.
Roonwal, G.S., Glasby, G.P., Roelandts, I., 1997. Mineralogy andgeochemistry of surface sediments from the Andaman Sea andupper Nicobar Fan, northeast Indian Ocean. J. Indian Assoc.Sedimentol. 16, 89–101.
Rutten, A., De Lange, G.J., 2003. Sequential extraction of iron,manganese and related elements in S1 sapropel sediment, easternMediterranean. Palaeogeogr. Palaeoclimatol. Palaeoecol. 190,79–101.
193S. Kurian et al. / Marine Geology 247 (2008) 178–193
Schaller, T., Morford, J., Emerson, S.R., Feely, R.A., 2000. Oxyanionsin metalliferous sediments: tracers for paleoseawater metalconcentrations? Geochim. Cosmochim. Acta. 63, 2243–2254.
Sholkovitz, E.R., 1990. Rare earth elements in marine sediments andgeochemical standards. Chem. Geol. 88, 333–347.
Siby, V., 2004. Geochemistry of rare earth elements and trace metalsalong the western continental shelf of India. Ph.D thesis, CochinUniversity of Science and Technology, Kerala (unpublished),pp.238.
Sirocko, F., Garbe-Schönberg, D., Devey, C., 2000. Processescontrolling trace element geochemistry of Arabian Sea sedimentsduring the last 25,000 years. Glob. Planet. Change 26, 217–303.
Stoll, H.M., Arevalos, A., Burke, A., Ziveri, P., Mortyn, G., Shimizu, N.,Unger, D., 2007. Seasonal cycles in biogenic production and exportin northern Bay of Bengal sediment traps. Deep-Sea Res. II. 54,558–580.
Stow, D.A.V., 1985. Fine grained sediments in deep water: anoverview of processes and facies models. Geo. Mar. Letts. 5,17–23.
Taylor, S.R., McLennan, S.M., 1985. The Continental Crust: ItsComposition and Evolution. Blackwell Scientific Publications,Oxford, p. 312.
Thomson, J., Higgs, N.C., Wilson, R.R.S., Croudace, I.W., de Lange, G.J.,van Santvoort, P.J.M., 1995. Redistribution and geochemical behaviourof redox-sensitive elements around S1, the most recent easternMediterranean sapropel. Geochim. Cosmochim. Acta 59, 3487–3501.
Venkatesan, M.I., Ruth, E., Rao, P.S., Nath, B.N., Rao, B.R., 2003.Hydrothermal petroleum in the sediments of the Andaman BackarcBasin, Indian Ocean. Appl. Geochem. 18, 845–861.
Wyrtki, K., 1973. Physical oceanography of the Indian Ocean. In:Zeitschel, B., Gerlach, S.A. (Eds.), The Biology of the IndianOcean. Springer Verlag, Berlin, pp. 18–36.


![SIPUNCULANS IN HUMP CORAL PORITES LUTEA, THE ANDAMAN SEA, THAILAND. [1994]](https://static.fdokumen.com/doc/165x107/6322f3f063847156ac06da7d/sipunculans-in-hump-coral-porites-lutea-the-andaman-sea-thailand-1994.jpg)