
Multistoried agroforestry garden system in West Sumatra, Indonesia
Upload
independentCategory
view
0download
0
Available online at www.sciencedirect.com
etters 263 (2007) 88–103www.elsevier.com/locate/epsl
Earth and Planetary Science L
26th December 2004 great Sumatra–Andaman earthquake:Co-seismic and post-seismic motions in northern Sumatra
Jean-Claude Sibuet a,⁎, Claude Rangin b, Xavier Le Pichon b, Satish Singh c,Antonio Cattaneo a, David Graindorge d, Frauke Klingelhoefer a, Jing-Yi Lin a,
Jacques Malod d, Tanguy Maury a, Jean-Luc Schneider e, Nabil Sultan a,Marie Umber a, Haruka Yamaguchi f
and the “Sumatra aftershocks” team1
a Ifremer Centre de Brest, B.P. 70, 29280 Plouzané cedex, Franceb Collège de France, Chaire de Géodynamique and CNRS CEREGE, Europôle de l'Arbois, BP 80, 13545 Aix en Provence, France
c Institut de Physique du Globe de Paris, 4 Place Jussieu, Tour 14–15, 5th Floor, 75252 Paris cedex 05, Franced Institut Universitaire Européen de la Mer, Place Nicolas Copernic, 29280 Plouzané, France
e Université Bordeaux 1, Observatoire Aquitain des Sciences de l'Univers, Département de Géologie et Océanographie,Avenue des Facultés, 33405 Talence cedex, France
f Institute for Research on Earth's Evolution, Japan Agency for Marine-Earth Science and Technology,Natsushima-cho 2-15, Yokosuka, 237-0061, Japan
Received 4 September 2006; received in revised form 20 June 2007; accepted 3 September 2007
Available online
Editor: C.P. Jaupart
15 September 2007
Abstract
Trench-parallel thrust faults verging both landward and seaward were mapped in the portion of wedge located betweennorthern Sumatra and the Indian–Indonesian boundary. The spatial aftershocks distribution of the 26th December 2004earthquake shows that the post-seismic motion is partitioned along two thrust faults, the Lower and Median Thrust Faults, thelatter being right-laterally offset by a N–S lower plate fracture zone located along the 93.6° N meridian. Between February 2005and August 2005, the upper plate aftershock activity shifted from southeast of this fracture zone to northwest of it, suggesting thatthe lower plate left-lateral motion along the fracture zone may have induced a shift of the upper plate post-seismic activity alongthe Median Thrust Fault. Based on swath bathymetric and 3.5 kHz data, co-seismic deformations were weak close to the trench.Joint seismic–geodetic determination of slip distribution and time arrivals and heights of tsunami waves suggest that the co-seismic slip was maximum along a portion of the Upper Thrust Fault located north of the Tuba Ridge, suggesting that the UpperThrust Fault might be a splay fault originated at the interplate fault plane. As the Upper Thrust Fault is steeper than the slab, the
⁎ Corresponding author. Tel.: +33 2 98 48 45 20, +33 6 62 12 45 20 (mobile).E-mail address: [email protected] (J.-C. Sibuet).
1 “Sumatra aftershocks” team: J.-C. Sibuet, S. Singh, R. Apprioual, N.C. Aryanto, J. Begot, A. Cattaneo, A. Chauhan, R. Creach, J. Crozon, A.Domzig, N. Falleau, D. Graindorge, F. Harmegnies, Y. Haryadi, F. Klingelhoefer, S.K. Kolloru, J.-Y. Landuré, C. Le Lann, J. Malod, A. Normand, G.Oggian, C. Rangin, D. Restuning Galih, J.-L. Schneider, N. Sultan, M. Taufik, M. Umber and H. Yamaguchi.
0012-821X/$ - see front matter © 2007 Elsevier B.V. All rights reserved.doi:10.1016/j.epsl.2007.09.005

89J.-C. Sibuet et al. / Earth and Planetary Science Letters 263 (2007) 88–103
vertical motion of the adjacent Outer Arc and overlying water is much larger compared to the one resulting from slip on themegathrust alone, increasing tsunamogenic effects.© 2007 Elsevier B.V. All rights reserved.
Keywords: 2004 Sumatra–Andaman earthquake; aftershocks; co-seismic rupture; active thrust faults
1. Introduction
The 26th December 2004 Mw=9.2 great Sumatra–Andaman earthquake ruptured the Sumatra and Sundasubduction zones over a length of 1300 km andgenerated the most deadly tsunami in the historicrecord. Teleseismically well-recorded earthquakesoccurring in this region during the 1918–2005 periodwere relocated by Engdahl et al. (2007). Prior to the2004 earthquake, seismicity occurred down-dip alongthe interplate zone at depths greater than 35 km, with aquasi-absence of seismicity trenchward (Engdahl et al.,2007; Lay et al., 2005) (Fig. 1a). The co-seismic slipdistribution of the Sumatra–Andaman earthquake hasbeen estimated from seismic waves (Lay et al., 2005;Ammon et al., 2005), static offsets (Banerjee et al.,2005; Subarya et al., 2006; Vigny et al., 2005), and jointseismic–geodetic data (Chlieh et al., 2007). Most of theco-seismic slip occurred trenchward of prior seismicityand was close to its maximum value of ∼20 m offshoreNW Sumatra (Ammon et al., 2005; Subarya et al., 2006)where the tsunami devastated the coast along ∼300 kmcausing 170,000 of the 230,000 tsunami deaths. Most ofthe aftershock activity is shallower than 35 km andlocated trenchward in areas where previous seismicitywas absent (Engdahl et al., 2007) (Fig. 1b). However,many aftershocks are also observed between 35 and75 km, in particular in the northern Sumatra area(Fig. 1b). Therefore, the rupture of the northern Sumatraarea seems to present specific characteristics during thenorthward propagation of the 2004 earthquake.
To understand the reason why the co-seismic slip andtsunami amplitudes were so high in this region, weperformed the “Sumatra Aftershocks” cruise (R/VMarion Dufresne, Jakarta, July 15 – Colombo, August9, 2005) in order to establish the geodynamical contextof the 2004 earthquake and to record the aftershockactivity. We selected an area encompassing the wholesubduction system from the Wharton Basin to northeastof the Sumatra Fault and located between northernSumatra and the Indonesia/India water limit. Twentyocean bottom seismometers (OBSs) were deployed andrecorded the local seismicity during 12 days. During therecording period, a 370×75 km stripe was fully surveyedwith a Seafalcon 11 MBES swath-bathymetric system
(the bathymetric grid is available at http://www.ifremer.fr/drogm_uk/Realisation/carto/Indien/Sumatra/index.html) and a 3.5 kHz mud-penetrator (Fig. 2).
2. Geodynamic context
Offshore northern Sumatra, the motion is close to theAustralia/Sunda motion (Delescluse and Chamot-Rooke, 2007), that is about 47 mm/yr to N004° (Socquetet al., 2006). The focal mechanism of the 26th December2004 great Sumatra–Andaman earthquake shows thatpartitioning due to the obliquity of the subduction iscomplete, because the co-seismic motion is perpendic-ular to the trench, along N039° (Lay et al., 2005). Thisgives 38.5 mm/yr for the convergent motion perpendic-ular to the trench and 29.5 mm/yr for the right-lateralmotion parallel to the trench. The motion along the right-lateral Sumatra Fault is estimated to be about 25 mm/yrin northernmost Sumatra (Sieh and Natawidjaja, 2000).This suggests that at most 5 mm/yr are absorbed bydextral deformation within the wedge (Le Pichon, 2006).
Northwest of Sumatra Island, the Sumatra Faultsystem extends in a ∼50-km wide dextral shear band,which continues at sea in the northern part of thebathymetric survey (Fig. 2). Aligned volcanoes suggestthat the northern branch of the system, which is named theSumatra Fault by Sieh and Natawidjaja (2000) is the mostrecent active segment as summarized byCurray (2005). Inthe Aceh forearc basin, fossil linear faults parallel to theSumatra Fault (Fig. 2), sometimes showing a compressivecomponent, were identified in its southern portion (Izartet al., 1994) (Figs. 2 and 3). Along the northeastern slopeof the Outer Arc, southwest of the Aceh Basin, a festoonof discontinuous strike–slip faults was observed andcorresponds to the possible southern extension of theWestAndaman Fault (Fig. 3). To the northwest, this dextrallywrenched system merges with the Sumatra Fault systemthat then proceeds toward the Andaman Sea. To thesoutheast, the connection of the Sumatra Fault with theMentawai Fault located north of Simeulue Island (e.g.Izart et al., 1994) or with a former plate boundary locatedsouth of Simeulue Island (Curray, 2005) is still unclear.Even if two strike–slip aftershocks occurred close to theWest Andaman Fault in the days following the 26December event (Singh, 2005), and if the two Sumatra
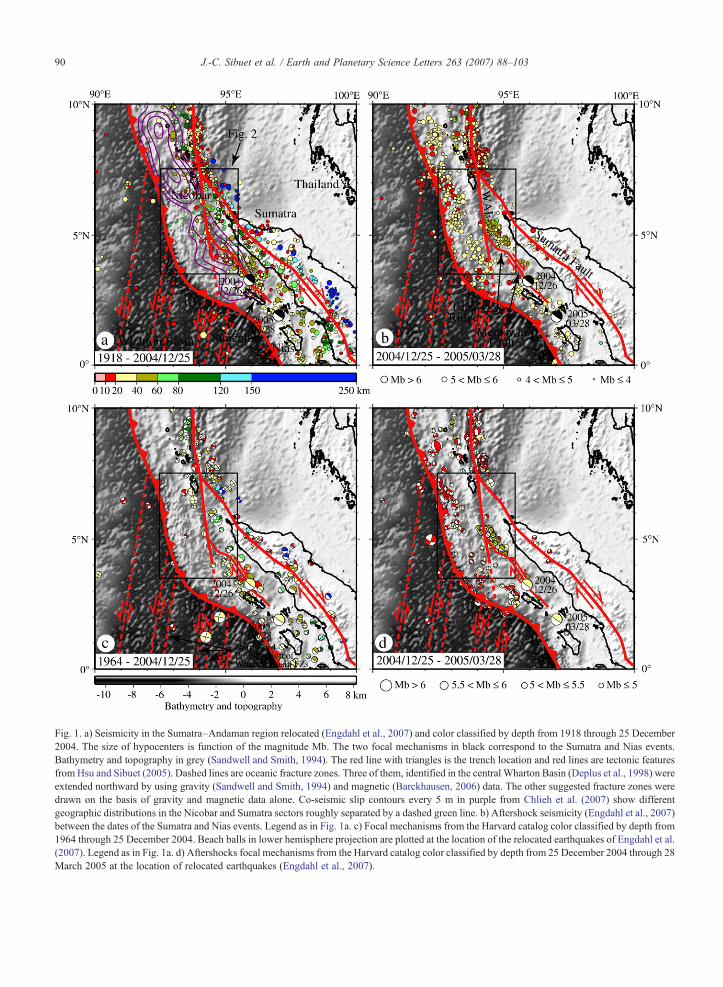
Fig. 1. a) Seismicity in the Sumatra–Andaman region relocated (Engdahl et al., 2007) and color classified by depth from 1918 through 25 December2004. The size of hypocenters is function of the magnitude Mb. The two focal mechanisms in black correspond to the Sumatra and Nias events.Bathymetry and topography in grey (Sandwell and Smith, 1994). The red line with triangles is the trench location and red lines are tectonic featuresfrom Hsu and Sibuet (2005). Dashed lines are oceanic fracture zones. Three of them, identified in the central Wharton Basin (Deplus et al., 1998) wereextended northward by using gravity (Sandwell and Smith, 1994) and magnetic (Barckhausen, 2006) data. The other suggested fracture zones weredrawn on the basis of gravity and magnetic data alone. Co-seismic slip contours every 5 m in purple from Chlieh et al. (2007) show differentgeographic distributions in the Nicobar and Sumatra sectors roughly separated by a dashed green line. b) Aftershock seismicity (Engdahl et al., 2007)between the dates of the Sumatra and Nias events. Legend as in Fig. 1a. c) Focal mechanisms from the Harvard catalog color classified by depth from1964 through 25 December 2004. Beach balls in lower hemisphere projection are plotted at the location of the relocated earthquakes of Engdahl et al.(2007). Legend as in Fig. 1a. d) Aftershocks focal mechanisms from the Harvard catalog color classified by depth from 25 December 2004 through 28March 2005 at the location of relocated earthquakes (Engdahl et al., 2007).
90 J.-C. Sibuet et al. / Earth and Planetary Science Letters 263 (2007) 88–103

Fig. 2. Swath-bathymetric data collected along a 370×75 km stripe located southeast of the India–Indonesia water limit over the regional bathymetry(Sandwell and Smith, 1994). Light from the southwest. The thin gray lines are tracklines along which swath bathymetric and 3.5 kHz data werecontinuously collected. Main structural elements in red. Lines with triangles are thrust faults. Thick continuous red lines with triangles are main thrustfaults determined from swath-bathymetric and 3.5 kHz data. The solid N–S trending blue lines are the locations of N–S fracture zones of the WhartonBasin and their associated N–S trending valleys in the wedge.
91J.-C. Sibuet et al. / Earth and Planetary Science Letters 263 (2007) 88–103
and West Andaman fault systems are considered asgeologically active systems, they were not active duringthe 2004 earthquake. Consequently, the stress is stillaccumulating along the two Sumatra and West Andamanfault systems and one of the two systems at least mightbreak in the future.
The wedge, located between the tectonic front andthe broad 40–50 km wide Outer Arc adjacent to theAceh forearc basin, is 130-km wide (Fig. 2) (Fisheret al., 2007). Most of the wedge is at a mean depth of1.5 km and consists of a series of sigmoidal ridges andtroughs that formed several piggy-back basins (Fig. 3).Most of the piggy-back basins are bordered by reverse
faults and thrusts with double vergency as shown inFigs. 4 and 5. About 30 of such thrust faults orientedN340° (parallel to the trench) with both seaward andlandward vergences are imaged in the swath-bathymet-ric (Figs. 2 and 3) and 3.5 kHz data. The sigmoidalshape of ridges and troughs is the signature of someamount of distributed dextral wrenching within thewedge. Post-seismic focal mechanisms related to the2004 Sumatra earthquake (Fig. 1d) as well as inter-seismic focal mechanisms (Fig. 1c) show several upperplate earthquakes with a right-lateral strike–slip motiontrending N–S to N010° within the wedge suggesting thatthe structurally observed distributed dextral wrenching
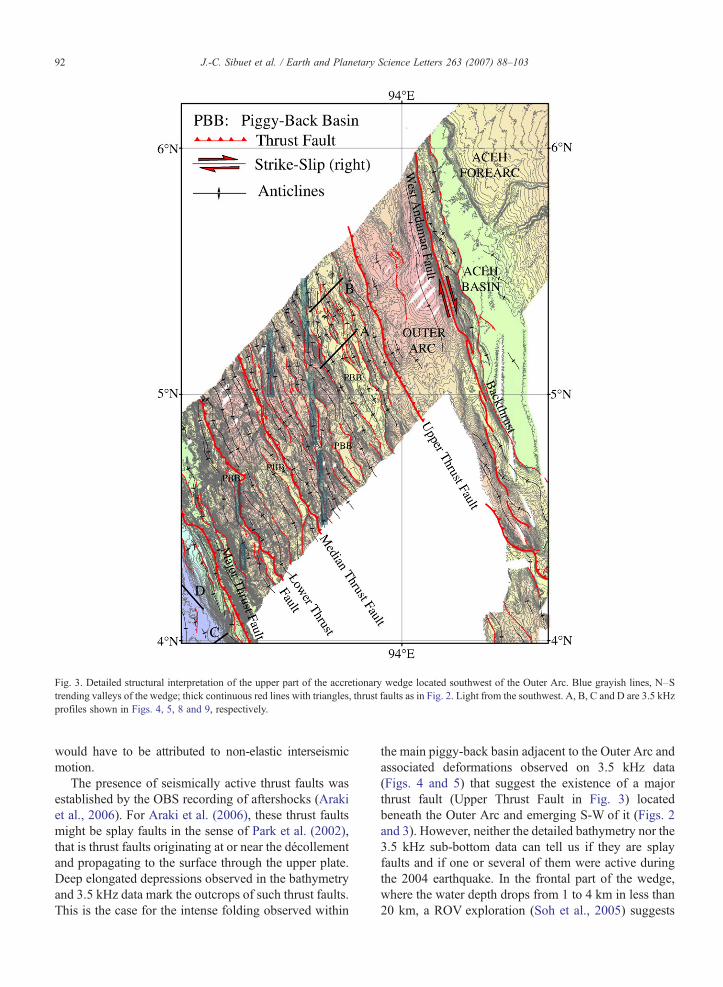
Fig. 3. Detailed structural interpretation of the upper part of the accretionary wedge located southwest of the Outer Arc. Blue grayish lines, N–Strending valleys of the wedge; thick continuous red lines with triangles, thrust faults as in Fig. 2. Light from the southwest. A, B, C and D are 3.5 kHzprofiles shown in Figs. 4, 5, 8 and 9, respectively.
92 J.-C. Sibuet et al. / Earth and Planetary Science Letters 263 (2007) 88–103
would have to be attributed to non-elastic interseismicmotion.
The presence of seismically active thrust faults wasestablished by the OBS recording of aftershocks (Arakiet al., 2006). For Araki et al. (2006), these thrust faultsmight be splay faults in the sense of Park et al. (2002),that is thrust faults originating at or near the décollementand propagating to the surface through the upper plate.Deep elongated depressions observed in the bathymetryand 3.5 kHz data mark the outcrops of such thrust faults.This is the case for the intense folding observed within
the main piggy-back basin adjacent to the Outer Arc andassociated deformations observed on 3.5 kHz data(Figs. 4 and 5) that suggest the existence of a majorthrust fault (Upper Thrust Fault in Fig. 3) locatedbeneath the Outer Arc and emerging S-W of it (Figs. 2and 3). However, neither the detailed bathymetry nor the3.5 kHz sub-bottom data can tell us if they are splayfaults and if one or several of them were active duringthe 2004 earthquake. In the frontal part of the wedge,where the water depth drops from 1 to 4 km in less than20 km, a ROV exploration (Soh et al., 2005) suggests

Fig. 4. 3.5 kHz Profile A located in Fig. 3 across a possible pop up feature and small elongated tilted basins observed within a piggy-back basin.
93J.-C. Sibuet et al. / Earth and Planetary Science Letters 263 (2007) 88–103
that the most seaward thrust fault identified within theJapanese OBS survey may indeed emerge at the base ofa giant anticline-like feature, characterized by a verysteep southwest-facing wall with large erosional scarps.This wall is bounded at its base by a thrust fault (MajorThrust Fault in Figs. 2, 6 and 7a). Thus, the post-seismicdeformation in the wedge may have been distributedalong several thrust faults throughout the wedge al-though we have no direct proofs that they were activeduring the main shock. The four major thrust faultsidentified from swath bathymetric and 3.5 kHz data areunderlined in Figs. 2, 3 and 6.
The explored segment of subduction zone is locatedabove the diffuse India/Australia plate boundary identi-fied between the Investigator Fracture Zone (98° E) and
Fig. 5. 3.5 kHz Profile B located in Fig. 3 across the same piggy-back basinsigns of recent tectonic activity.
the Ninety East Ridge (Delescluse and Chamot-Rooke,2007). The south to north velocity vector of the Australiaplate with respect to the India plate determined in thiszone progressively decreases westward across this dif-fuse boundary from about 1 cm/yr to zero (Delescluseand Chamot-Rooke, 2007). This vector is parallel to thedirection of the mapped oceanic fracture zones in thecentral Wharton Basin (Deplus et al., 1998), which canbe traced in direction of the Sunda Trench by using thefree-air gravity map (Sandwell and Smith, 1994) and thetrends of the detailed magnetic anomaly map (Barc-khausen, 2006) (Fig. 1a). Thus, earthquakes occurringwithin this stripe display N–S left-lateral strike–slipmechanisms (Harvard CMT focal mechanisms), whichreactivate old fracture zones (e.g. Fig. 1c and d).
than in Fig. 4, with numerous seaward vergence thrust faults showing
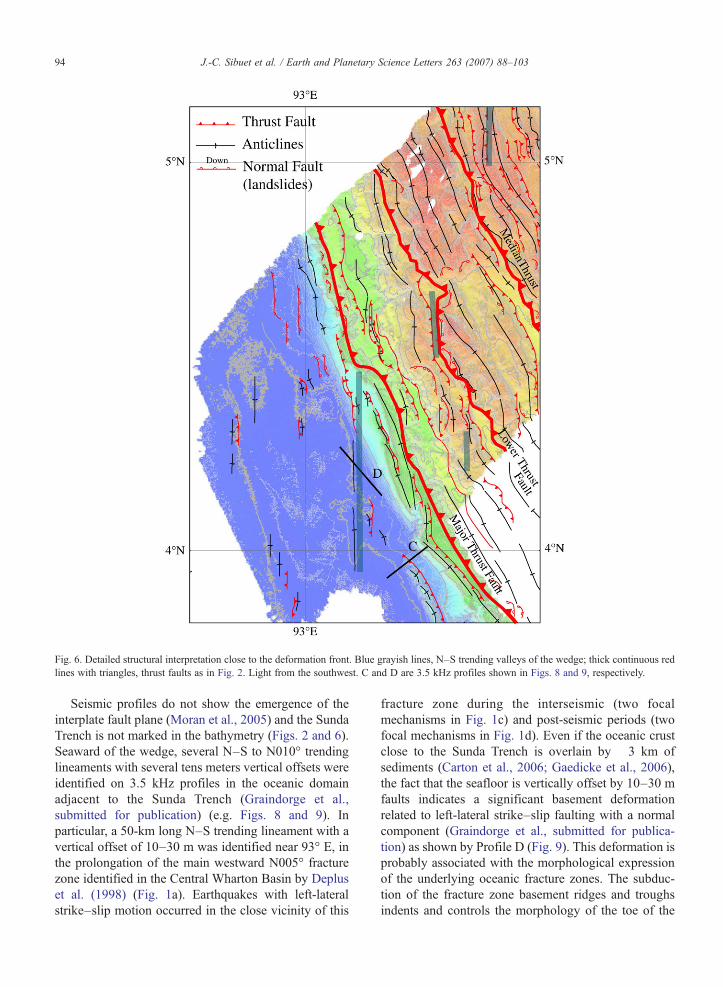
Fig. 6. Detailed structural interpretation close to the deformation front. Blue grayish lines, N–S trending valleys of the wedge; thick continuous redlines with triangles, thrust faults as in Fig. 2. Light from the southwest. C and D are 3.5 kHz profiles shown in Figs. 8 and 9, respectively.
94 J.-C. Sibuet et al. / Earth and Planetary Science Letters 263 (2007) 88–103
Seismic profiles do not show the emergence of theinterplate fault plane (Moran et al., 2005) and the SundaTrench is not marked in the bathymetry (Figs. 2 and 6).Seaward of the wedge, several N–S to N010° trendinglineaments with several tens meters vertical offsets wereidentified on 3.5 kHz profiles in the oceanic domainadjacent to the Sunda Trench (Graindorge et al.,submitted for publication) (e.g. Figs. 8 and 9). Inparticular, a 50-km long N–S trending lineament with avertical offset of 10–30 m was identified near 93° E, inthe prolongation of the main westward N005° fracturezone identified in the Central Wharton Basin by Depluset al. (1998) (Fig. 1a). Earthquakes with left-lateralstrike–slip motion occurred in the close vicinity of this
fracture zone during the interseismic (two focalmechanisms in Fig. 1c) and post-seismic periods (twofocal mechanisms in Fig. 1d). Even if the oceanic crustclose to the Sunda Trench is overlain by ∼3 km ofsediments (Carton et al., 2006; Gaedicke et al., 2006),the fact that the seafloor is vertically offset by 10–30 mfaults indicates a significant basement deformationrelated to left-lateral strike–slip faulting with a normalcomponent (Graindorge et al., submitted for publica-tion) as shown by Profile D (Fig. 9). This deformation isprobably associated with the morphological expressionof the underlying oceanic fracture zones. The subduc-tion of the fracture zone basement ridges and troughsindents and controls the morphology of the toe of the

Fig. 7. Block diagrams of a) the toe of the accretionary wedge, with a minor landslide located close to the trench and the Major Thrust Fault located atthe base of the eroded wall (festoon); b) the main part of the wedge with the well-imaged N–S valleys linked to N–S fracture zone features of thelower plate.
95J.-C. Sibuet et al. / Earth and Planetary Science Letters 263 (2007) 88–103
prism (Fig. 6). 3.5 kHz data also evidences N–Strending landward thrusting and folding of the frontalpart of the wedge. Thus, we attribute the deformation ofthe frontal part of the wedge with re-entrants compatiblewith a dextrally wrenched tectonic front to the obliquityof the subducting N–S oriented lower plate basementfeatures with the N340° sedimentary features and thrustfaults of the wedge.
In the study area, the signs of tectonic activity linkedto the 2004 earthquake and located at the toe of the prismare weak and restricted to small-scale fault-relatedfeatures and minor landslides (Henstock et al., 2006)(Fig. 6). For example, dives in a small 20-m deepdepression (the ditch) that runs parallel with the base of a12-km long scarp along the toe of the prism show it was
an active feature (Moran et al., 2005). A detailed study ofthe minor landslide imaged in Fig. 7a shows that it was infact the result of three consecutive phases of failure, thelast one being relatively minor. Coring on the slopelocated close to the landslide indicates the existence ofremolded sediment. The in-situ pore pressure monitoringusing a piezometer at the same site shows that an excesspore pressure was generated by a recent event. Sultanet al. (submitted for publication) demonstrated that theexcess pore pressure was in a transient regime and that itsorigin was linked to a local deformation of the uppersediment layers generated at the same time than the 2004earthquake. Consequently, as there is evidence of onlysmall displacements or failures at the frontal part of thewedge at the time of the 2004 earthquake, the co-seismic
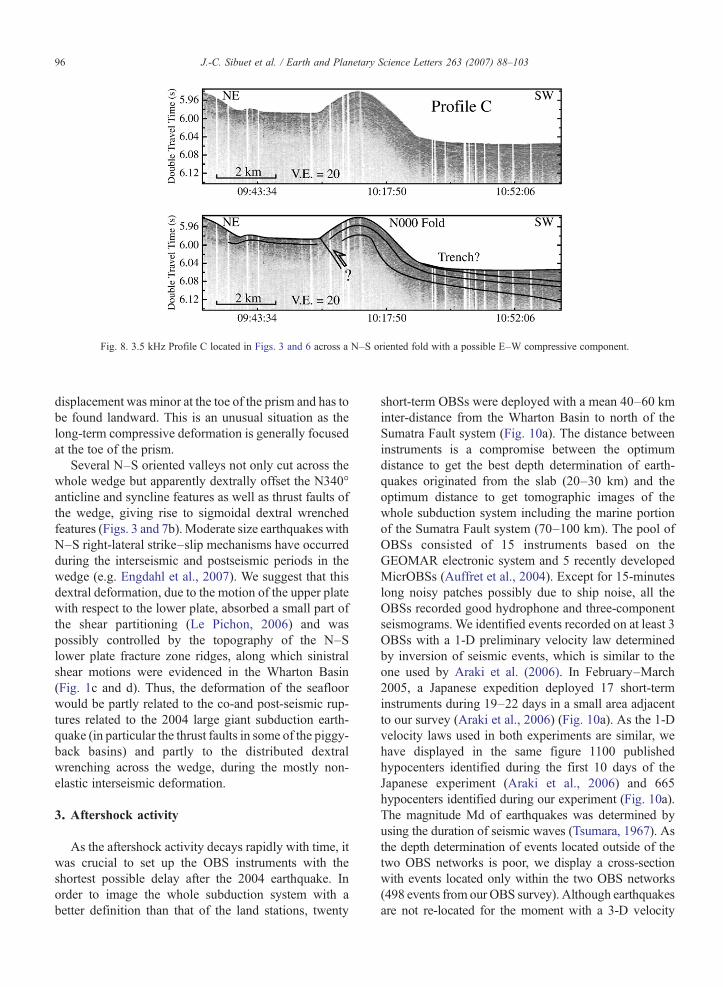
Fig. 8. 3.5 kHz Profile C located in Figs. 3 and 6 across a N–S oriented fold with a possible E–W compressive component.
96 J.-C. Sibuet et al. / Earth and Planetary Science Letters 263 (2007) 88–103
displacement was minor at the toe of the prism and has tobe found landward. This is an unusual situation as thelong-term compressive deformation is generally focusedat the toe of the prism.
Several N–S oriented valleys not only cut across thewhole wedge but apparently dextrally offset the N340°anticline and syncline features as well as thrust faults ofthe wedge, giving rise to sigmoidal dextral wrenchedfeatures (Figs. 3 and 7b).Moderate size earthquakes withN–S right-lateral strike–slip mechanisms have occurredduring the interseismic and postseismic periods in thewedge (e.g. Engdahl et al., 2007). We suggest that thisdextral deformation, due to the motion of the upper platewith respect to the lower plate, absorbed a small part ofthe shear partitioning (Le Pichon, 2006) and waspossibly controlled by the topography of the N–Slower plate fracture zone ridges, along which sinistralshear motions were evidenced in the Wharton Basin(Fig. 1c and d). Thus, the deformation of the seafloorwould be partly related to the co-and post-seismic rup-tures related to the 2004 large giant subduction earth-quake (in particular the thrust faults in some of the piggy-back basins) and partly to the distributed dextralwrenching across the wedge, during the mostly non-elastic interseismic deformation.
3. Aftershock activity
As the aftershock activity decays rapidly with time, itwas crucial to set up the OBS instruments with theshortest possible delay after the 2004 earthquake. Inorder to image the whole subduction system with abetter definition than that of the land stations, twenty
short-term OBSs were deployed with a mean 40–60 kminter-distance from the Wharton Basin to north of theSumatra Fault system (Fig. 10a). The distance betweeninstruments is a compromise between the optimumdistance to get the best depth determination of earth-quakes originated from the slab (20–30 km) and theoptimum distance to get tomographic images of thewhole subduction system including the marine portionof the Sumatra Fault system (70–100 km). The pool ofOBSs consisted of 15 instruments based on theGEOMAR electronic system and 5 recently developedMicrOBSs (Auffret et al., 2004). Except for 15-minuteslong noisy patches possibly due to ship noise, all theOBSs recorded good hydrophone and three-componentseismograms. We identified events recorded on at least 3OBSs with a 1-D preliminary velocity law determinedby inversion of seismic events, which is similar to theone used by Araki et al. (2006). In February–March2005, a Japanese expedition deployed 17 short-terminstruments during 19–22 days in a small area adjacentto our survey (Araki et al., 2006) (Fig. 10a). As the 1-Dvelocity laws used in both experiments are similar, wehave displayed in the same figure 1100 publishedhypocenters identified during the first 10 days of theJapanese experiment (Araki et al., 2006) and 665hypocenters identified during our experiment (Fig. 10a).The magnitude Md of earthquakes was determined byusing the duration of seismic waves (Tsumara, 1967). Asthe depth determination of events located outside of thetwo OBS networks is poor, we display a cross-sectionwith events located only within the two OBS networks(498 events from our OBS survey). Although earthquakesare not re-located for the moment with a 3-D velocity
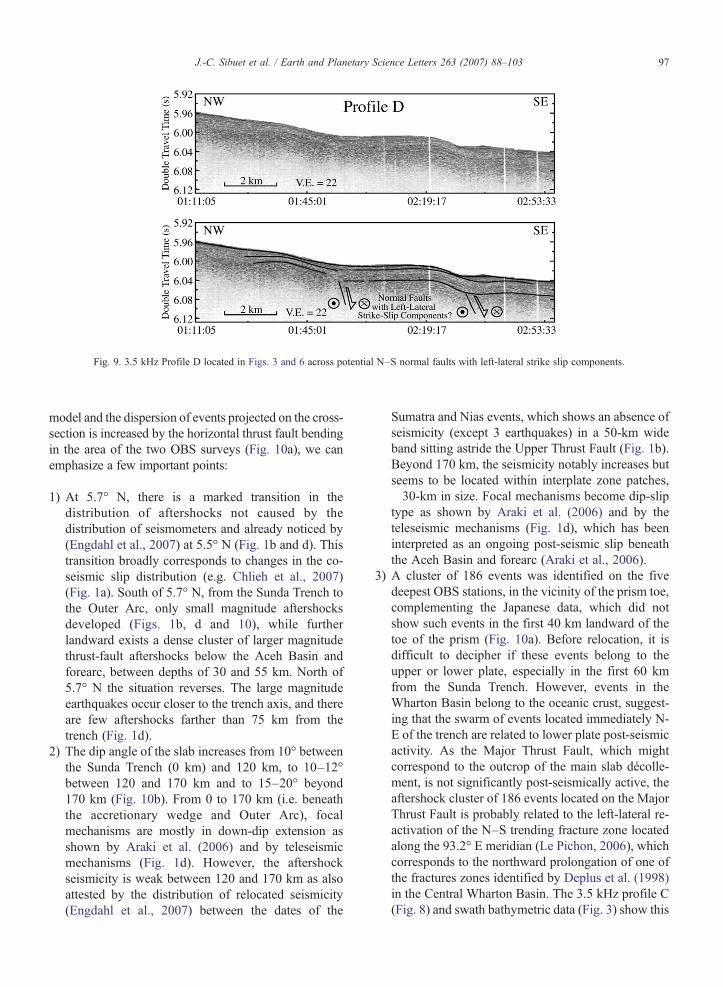
Fig. 9. 3.5 kHz Profile D located in Figs. 3 and 6 across potential N–S normal faults with left-lateral strike slip components.
97J.-C. Sibuet et al. / Earth and Planetary Science Letters 263 (2007) 88–103
model and the dispersion of events projected on the cross-section is increased by the horizontal thrust fault bendingin the area of the two OBS surveys (Fig. 10a), we canemphasize a few important points:
1) At 5.7° N, there is a marked transition in thedistribution of aftershocks not caused by thedistribution of seismometers and already noticed by(Engdahl et al., 2007) at 5.5° N (Fig. 1b and d). Thistransition broadly corresponds to changes in the co-seismic slip distribution (e.g. Chlieh et al., 2007)(Fig. 1a). South of 5.7° N, from the Sunda Trench tothe Outer Arc, only small magnitude aftershocksdeveloped (Figs. 1b, d and 10), while furtherlandward exists a dense cluster of larger magnitudethrust-fault aftershocks below the Aceh Basin andforearc, between depths of 30 and 55 km. North of5.7° N the situation reverses. The large magnitudeearthquakes occur closer to the trench axis, and thereare few aftershocks farther than 75 km from thetrench (Fig. 1d).
2) The dip angle of the slab increases from 10° betweenthe Sunda Trench (0 km) and 120 km, to 10–12°between 120 and 170 km and to 15–20° beyond170 km (Fig. 10b). From 0 to 170 km (i.e. beneaththe accretionary wedge and Outer Arc), focalmechanisms are mostly in down-dip extension asshown by Araki et al. (2006) and by teleseismicmechanisms (Fig. 1d). However, the aftershockseismicity is weak between 120 and 170 km as alsoattested by the distribution of relocated seismicity(Engdahl et al., 2007) between the dates of the
Sumatra and Nias events, which shows an absence ofseismicity (except 3 earthquakes) in a 50-km wideband sitting astride the Upper Thrust Fault (Fig. 1b).Beyond 170 km, the seismicity notably increases butseems to be located within interplate zone patches,∼30-km in size. Focal mechanisms become dip-sliptype as shown by Araki et al. (2006) and by theteleseismic mechanisms (Fig. 1d), which has beeninterpreted as an ongoing post-seismic slip beneaththe Aceh Basin and forearc (Araki et al., 2006).
3) A cluster of 186 events was identified on the fivedeepest OBS stations, in the vicinity of the prism toe,complementing the Japanese data, which did notshow such events in the first 40 km landward of thetoe of the prism (Fig. 10a). Before relocation, it isdifficult to decipher if these events belong to theupper or lower plate, especially in the first 60 kmfrom the Sunda Trench. However, events in theWharton Basin belong to the oceanic crust, suggest-ing that the swarm of events located immediately N-E of the trench are related to lower plate post-seismicactivity. As the Major Thrust Fault, which mightcorrespond to the outcrop of the main slab décolle-ment, is not significantly post-seismically active, theaftershock cluster of 186 events located on the MajorThrust Fault is probably related to the left-lateral re-activation of the N–S trending fracture zone locatedalong the 93.2° E meridian (Le Pichon, 2006), whichcorresponds to the northward prolongation of one ofthe fractures zones identified by Deplus et al. (1998)in the Central Wharton Basin. The 3.5 kHz profile C(Fig. 8) and swath bathymetric data (Fig. 3) show this

Fig. 10. a) Aftershock determinations from the two Japanese and French networks of seismometers. In blue, aftershocks determined during 10 days ofthe recording period (20 February – 13March 2005) by Araki et al. (2006) using 17 seismometers (triangles). In red, 665 aftershocks determined fromour survey using 20 seismometers (stars) from 22 July 2005 to 3 August 2005. Magnitudes of earthquakes scaled in the upper left part of the figure.Large solid and dashed lines with triangles are post-seismic active thrust faults (Lower and Median Thrust Faults) and non-active post-seismicfeatures, respectively. Thick blue lines are the lower plate N–S fracture zones and their prolongations below the lower part of the wedge. Note thepresence of a swarm of 186 events located at the northern extremity of the 93.2° E fracture zone and of a large number of events along the northernextremity of the 93.6° E fracture zone, highlighting the shift of seismicity along the Median Thrust Fault from S–E of it in February 2005 to N–Wof itin August 2005. The projected synthetic profile 2 shows in purple the slab and active thrust faults determined from the hypocenters distribution.b) Seismicity along Profile 2 in function of the distance to the trench. Only hypocenters located inside the Japanese (Araki et al., 2006) and French(498 events) networks are shown in blue and red, respectively. In purple, slab and thrust faults deduced from the distribution of hypocenters. Note thepresence of lower plate events in the 40–60 km and 90–130 km stripes, suggesting the re-activation of lower plate fracture zones.
98 J.-C. Sibuet et al. / Earth and Planetary Science Letters 263 (2007) 88–103
feature interpreted as a N–S oriented fold with apossible E–W compressive component. Another3.5 kHz profile (Profile D in Fig. 9) perpendicular
to Profile C shows potential N–S left-lateral strikeslips in the area of the cluster of 186 events.However, as the 3.5 kHz penetration is only a few

99J.-C. Sibuet et al. / Earth and Planetary Science Letters 263 (2007) 88–103
tens of meters, seismic profiles are needed to fullyresolve this question.
4. Thrust faults and splay faults
Within the upper plate, the distribution of aftershocksis concentrated in four areas:
1) In discrete patches localized in the oceanic crust ofthe Wharton Basin and beneath the frontal part of theaccretionary wedge, along the 93.2° E fracture zone.Outside these patches, almost no aftershocks arerecorded along the Major Thrust Fault, which isimaged in Fig. 10a and more generally S–W of theLower Thrust Fault emergence, between 0 and 60 km.
2) At 70 km, within the shallow part of the wedge at amean depth of 1.5 km, the cloud of aftershocks mayindicate a distributed deformation. However, as Arakiet al. (2006), we suggest the presence of an activethrust fault. Here, the precision in the depth determi-nation of hypocenters is sufficient to discriminatebetween earthquakes belonging to the upper and lowerplates. In plane view, aftershocks are located N–E ofthe trace of the Lower Thrust Fault. The active portionof the Lower Thrust Fault starts in the southeast at itsintersection with the 93.6° E N–S valley (Figs. 7band 10). To the northwest, seismic events continuesnorthwest of our survey until 5.7° N, following anortherly direction already underlined by a bathymet-ric trend in the Sandwell and Smith (1994) map.
3) At 110 km, the 200-km long elongated cluster ofseismic events begins south of the location of theJapanese network (94.4° E) and disappears at 5.7° N.As Araki et al. (2006), we suggest the presence of asecond active N340° oriented thrust fault (MedianThrust Fault) well imaged in cross-section and planeview (Fig. 10). We observed a shift in the post-seismicactivity from S–E of the 93.6° E N–S valley (Figs. 3and 7b) at the time of the Japanese survey (February2005) to N–Wof this feature at the time of our survey(August 2005). This is not an artifact as both OBSpools recorded earthquakes well outside their net-works. Even if the depth determination of seismicevents is poor, some of them, located between 80 and130 km, definitely belong to the underlying oceaniccrust (Fig. 10b). The dense but diffuse seismic activityobserved in the lower plate and spatially along theN–S93.6° E feature, between 4.3° N and 5.1° N, suggeststhat it is a re-activated portion of fracture zone whichmay act as an asperity for the northwestward jump ofthe aftershock activity along the Median Thrust Faultbetween February and August 2005.
4) A hypothetical splay fault (Upper Thrust Fault) thatmay rise from the slab break at 170 km andoutcropping southwest of the Outer Arc has beensuggested by Araki et al. (2006), though only a smallnumber of upper plate events were recorded. Thishypothetical splay fault crops out where we haveidentified a major thrust fault on the basis of detailedbathymetric and 3.5 kHz data. Very recent activecompressive features are shown on profiles A and B(Figs. 4 and 5) located in Fig. 3. A pop up feature andsmall-elongated tilted basins are observed within thepiggy-back basin (Fig. 4). Further northwest in thesame piggy-back basin, numerous seaward vergencethrust faults show signs of a recent tectonic activity(Fig. 5). Small thrust faults between 19H06 and19H11 are testimonies of such a recent tectonicactivity within a gently folded sub-basin. On thebasis of a careful examination of all 3.5 kHz profiles,we suggest that the Upper Thrust Fault, which is notpost-seismically active, was active in the recent past.
5. Discussion and conclusion
From the careful examination of the aftershockactivity, two post-seismic active thrust faults wereidentified (Lower and Median Thrust Faults in solid redlines) and two other thrust faults are not post-seismicallyactive (Major andUpper Thrust Faults in dashed red lines,Fig. 10). Fig. 11c summarizes the distribution of post-seismic active features: dip-slip along the interplate zonebeneath the Aceh basin and the deeper part of the forearc,and down-dip extension beneath the accretionary wedgewith the presence of two thrust faults branching on theinterplate zone. The two swarms of events located in thefrontal part of the wedge and along the 93.6° E meridiansuggest that this aftershock activity is linked to left-lateralstrike slip motions along two fracture zones located at93.2° E and 93.6° E longitude. Thus, the reactivation oftwo lower plate fracture zones triggered by the 2004earthquake, or due to the westward decrease of thevelocity vector in the diffuse area of the Australia/Indiaplate boundary, influences the distribution of theaftershock activity within the accretionary wedge. Byanalogy, we suggest that the other N–S valleys identifiedin the swath bathymetric data (Figs. 2, 3, 6 and 7) may beassociated with underlying lower plate fracture zones.
Before the 2004 earthquake, the seismicity wasrestricted to northeast of the Upper Thrust Fault and noteleseismic earthquakes were recorded below theaccretionary wedge (Fig. 1a). Except if there is someaseismic creep within the accretionary wedge, thelocked zone is located beneath the accretionary wedge,
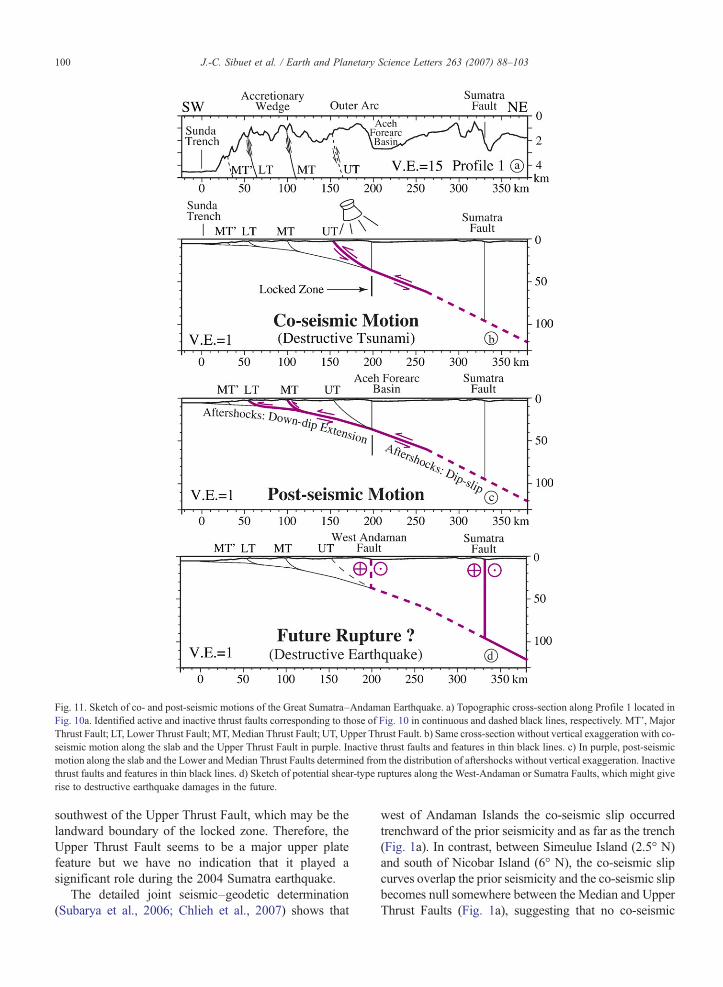
Fig. 11. Sketch of co- and post-seismic motions of the Great Sumatra–Andaman Earthquake. a) Topographic cross-section along Profile 1 located inFig. 10a. Identified active and inactive thrust faults corresponding to those of Fig. 10 in continuous and dashed black lines, respectively. MT', MajorThrust Fault; LT, Lower Thrust Fault; MT, Median Thrust Fault; UT, Upper Thrust Fault. b) Same cross-section without vertical exaggeration with co-seismic motion along the slab and the Upper Thrust Fault in purple. Inactive thrust faults and features in thin black lines. c) In purple, post-seismicmotion along the slab and the Lower and Median Thrust Faults determined from the distribution of aftershocks without vertical exaggeration. Inactivethrust faults and features in thin black lines. d) Sketch of potential shear-type ruptures along the West-Andaman or Sumatra Faults, which might giverise to destructive earthquake damages in the future.
100 J.-C. Sibuet et al. / Earth and Planetary Science Letters 263 (2007) 88–103
southwest of the Upper Thrust Fault, which may be thelandward boundary of the locked zone. Therefore, theUpper Thrust Fault seems to be a major upper platefeature but we have no indication that it played asignificant role during the 2004 Sumatra earthquake.
The detailed joint seismic–geodetic determination(Subarya et al., 2006; Chlieh et al., 2007) shows that
west of Andaman Islands the co-seismic slip occurredtrenchward of the prior seismicity and as far as the trench(Fig. 1a). In contrast, between Simeulue Island (2.5° N)and south of Nicobar Island (6° N), the co-seismic slipcurves overlap the prior seismicity and the co-seismic slipbecomes null somewhere between the Median and UpperThrust Faults (Fig. 1a), suggesting that no co-seismic
101J.-C. Sibuet et al. / Earth and Planetary Science Letters 263 (2007) 88–103
motion occurred along the Median, Lower and MajorThrust Faults. Except if there was some aseismic creepwithin the accretionary prism, this observation explainswhy the deformation at the front of the wedge was soweak. If this is correct and knowing the uncertainty on theco-seismic slip values, the Upper Thrust Fault branchingupward from the interplate zone might be a candidate fortransferring the co-seismic slip from the interplate zone tothe sea-bottom.
Plafker et al. (2006) interviewed 110 eyewitnesses,who were situated along the west coast of Sumatra, andobtained information on wave arrival times, waveheights and wave periods. Tsunami flow depths of 5to 12 m along the north coast and 7 to 20 m along thewest coast cannot be explained by the 2.8 m verticaldisplacement estimate due to slip on the plate interfacealone, assuming 20 m maximum horizontal slip, 8° faultdip, and dip-slip displacement (Plafker et al., 2006).Back tracing the recorded arrival times suggested thatthe source was located in the area of the Outer Arc,where Plafker et al. (2007) reoccupied old bathymetriclines after the 2004 earthquake and found a recent upliftof more than 14 m. They show that a source modelconsisting primarily of co-seismic uplift along a splayfault about 80 km long, 60° dip, and 20 m slip that issuperimposed on minor uplift (b3 m) due to up-dip slipon the megathrust explain the tsunami observations.Banerjee et al. (2007) also considered a hypotheticalsplay fault approximately coincident with the location ofthe West Andaman Fault. When dip slip of 20 m isassigned to this splay fault and slip parameters areinverted, the remaining slip along the shallower portionof megathrust is only 2.9 m±2.1 m, which means thatthere is a kinematic discontinuity between the deeperand shallower slip on the megathrust in this area.Banerjee et al. (2007) suggest that the disproportionateamount of aftershock activity deeper than 30 km wouldreflect the much greater co-seismic slip having occurredalong the deeper section of the megathrust. All thesearguments suggest that the portion of the Upper ThrustFault located north of the Tuba Ridge may have rupturedduring the 2004 Sumatra earthquake (Fig. 11b) as asplay fault branching on the interplate fault plane.
For large size earthquakes in compressional domains,the role of splay faults has been already evidenced. Forexample, during the 1964 Alaskan earthquake, a thrustdisplacement of 8 m along a splay fault was observed onthe Patton Bay Fault in Montague Island (Plafker, 1972),suggesting that a substantial amount of deeper slip wastransferred to the splay fault, resulting in relatively littleslip on the shallower megathrust. More recently, the co-seismic slip was modeled along an inferred splay fault for
the 1946 Nankai earthquake (Cummins and Kaneda,2000). In the Nankai subduction zone, the geometry ofsplay faults was imaged on deep seismic reflectionprofiles. One of the splay faults is branching upward fromthe interplate zone, beneath the forearc basin, and emergesseaward of the outer arc (Park et al., 2002), in a geologicalcontext similar to the one of our studied area. Similarly,for the 1958 earthquake on the Ecuador margin, co-seismic slip occurred along a megathrust splay faultlocated beneath the outer arc (Collot et al., 2004). Theassociated co-seismic uplift was interpreted as the causeof the triggered tsunami. All these cases suggest that splayfaults must be taken into account to understand thebehavior of megathrust earthquakes. Surface dips of splayfaults are considerably larger (30° in the Nankai Trough)than the 10° dip angle of the slab at the prism toe,increasing the resulting vertical motion of the watercolumn and giving rise to large tsunamis (Fig. 11b). Wethus conclude that during the 2004 earthquake, the co-seismic motion was transferred along a splay fault fromthe slab to the Upper Thrust Fault and that it was the mainfactor controlling the large amplitude of the tsunami.
The N004° Australia/Sunda motion being partitionedbetween motions perpendicular to the trench alongN039° (example of the 26th December 2004 earth-quake) and right-lateral motions along the N309°direction, both the Sumatra Fault and theWest AndamanFault may rupture in the future as shown in Fig. 11d,giving rise to a destructive earthquake without tsunamias no significant relative vertical motion is expected.
Acknowledgments
We thank the Presidents of Ifremer and Institute Paul-Emile Victor (IPEV) for their constant supports andencouragements to achieve on a short notice the “SumatraAftershocks” cruise onboard the R/V Marion Dufresne.We thank Yvon Balut (IPEV), Pierre Cochonat (Ifremer),John Ludden (Institut National des Sciences de l'Univers)and Jean-Paul Montagner (Direction Générale de laRecherche et de l'Innovation) for their support. TheIndonesian Agency for the Assessment and Applicationof Technology (BPPT) is greatly acknowledged for itshelp and support during the planning stage of the cruise.The French Hydrographic Service (SHOM) helps tovalidate swath-bathymetric data. Bernard Ollivier (IPEV)and his technical team are particularly acknowledged fortheir dedicated work at sea. We thank Bob Engdahl forproviding his relocated teleseismic events in the Sumatraregion. We thank Jo Curray, Jamie Austin and ananonymous reviewer for their careful and constructivereviews. Financial supports were provided by the Agence
102 J.-C. Sibuet et al. / Earth and Planetary Science Letters 263 (2007) 88–103
Nationale de la Recherche (ANR), the Délégation Inter-ministérielle pour le Tsunami (DIPT), Ifremer and IPEV.
References
Ammon, C.J., Ji, C., Thio, H.K., Robinson, D., Ni, S., Hjorleifsdottir,V., Kanamori, H., Lay, T., Das, S., Helmberger, D., Ichinose, G.,Polet, J., Wald, D., 2005. Rupture Process of the 2004 Sumatra–Andaman earthquake. Science 308, 1133–1139.
Araki, E., Shinohara, M., Obana, K., Yamada, T., Kaneda, Y.,Kanazawa, T., Suyehiro, K., 2006. Aftershock distribution of the26 December 2004 Sumatra–Andaman earthquake from oceanbottom seismographic observation. Earth Planets Space 58,113–119.
Auffret, Y., Pelleau, P., Klingelhoefer, F., Géli, L., Crozon, J., Lin, J.-Y.,Sibuet, J.-C., 2004. MicrOBS: A new generation of ocean bottomseismometer. First Break 22, 41–47.
Banerjee, P., Pollitz, F.F., Bürgmann, R., 2005. The size and durationof the Sumatra–Andaman Earthquake from far-field static offsets.Science 308, 1769–1772.
Banerjee, P., Pollitz, F.F., Nagarajan, B., Bürgmann, R., 2007. Coseismicslip distributions of the 26 December 2004 Sumatra–Andaman and28 March 2005 Nias earthquakes from GPS static offsets. Bull.Seismol. Soc. Am. 97, 86–102. doi:10.1785/0120050609.
Barckhausen, U., 2006. The segmentation of the subduction zoneoffshore Sumatra: relations between upper and lower plate. EosTrans. AGU 87 (52) Fall Meet. Suppl., Abstract U53A-0029.
Carton, H., Singh, S.C., Hananto, N., Hartoyo, D., Chauhan, A.,Tapponnier, P., White, N., Bunting, T., Christie, P., Lubis, H.,Martin, J., 2006. Schlumberger seismic vessel Geco Searcherprovides unprecedented images of the Great Sumatra–Andamanearthquake megathrust rupture plane. Eos Trans. AGU 87 (52) FallMeet. Suppl., Abstract U53A-0026.
Chlieh, M., Avouac, J.-P., Hjorleifsdottir, V., Song, T.-R.A., Ji, C.,Sieh, K., Sladen, A., Hebert, H., Prawirodirdjo, L., Bock, Y.,Galetzka, J., 2007. Coseismic slip and afterslip of the GreatMw 9.15 Sumatra–Andaman Earthquake of 2004. Bull. Seismol.Soc. Am. 97, 152–173. doi:10.1785/0120050631.
Collot, J.-Y., Marcaillou, B., Sage, F., Michaud, F., Agudelo, W.,Charvis, P., Graindorge, D., Gutscher, M.-A., Spence, G., 2004.Are rupture zone limits of great subduction earthquakes controlledby upper plate structures? Evidence from multichannel seismicreflection data acquired across the northern Ecuador–southwestColombia margin. J. Geophys. Res. 109 (B11103). doi:10.1029/2004JB003060.
Cummins, P.R., Kaneda, Y., 2000. Possible splay fault slip during the1946 Nankai earthquake. Geophys. Res. Lett. 27, 2725–2728.
Curray, J.R., 2005. Tectonics and history of the Andaman Sea region.J. Asian Earth Sci. 25, 187–232.
Delescluse, M., Chamot-Rooke, N., 2007. Instantaneous deformationand kinematics of the India–Australia plate. Geophys. J. Int. 168,818–842.
Deplus, C., Diament, M., Hébert, H., Bertrand, B., Dominguez, S.,Dubois, J., Malod, J., Patriat, P., Pontoise, B., Sibilla, J.-J., 1998.Direct evidence for active deformation in the eastern Indian Oceanplate. Geology 26, 131–134.
Engdahl, E.R., Villaseñor, A., DeShon, H.R., Thurber, C.H., 2007.Teleseismic relocation and assessment of seismicity (1918–2005)in the region of the 2004 Mw 9.0 Sumatra–Andaman and 2005Mw 8.6 Nias Island great earthquakes. Bull. Seismol. Soc. Am. 97,43–61. doi:10.1785/0120050614.
Fisher, D., Mosher, D., Austin, J.A., Gulick, S.P.S., Masterlark, T.,Moran, K., 2007. Active deformation across the Sumatran forearcover the December 2004 Mw9.2 rupture. Geology 35, 99–102.doi:10.1130/G22993A.22991.
Gaedicke, C., Franke, D., Ladage, S., Tappin, D., Baranov, B.,Barckhausen, U., Berglar, K., Delisle, G., Djajadihardja, Y.,Heyde, I., Lutz, R., Khafid, K., Mueller, C., Nur Adi, K., Park, J.,Seeber, L., Neben, S., Triarso, E., 2006. Imaging the rupture areasof the Giant Northern Sumatra Earthquakes: A multidisciplinarygeophysical experiment. Eos Trans. AGU 87 (52) Fall Meet.Suppl., Abstract U52A-01.
Graindorge, D., Klingelhoefer, F., Sibuet, J.-C., McNeill, L., Henstock,T., Dean, S., Gutscher, M.-A., Dessa, J.-X., Permana, H., Singh, S.,Leau, H., White, N., Carton, H., Malod, J.-A., Aryawan, K.G.,Chaubey, A.K., Chauhan, A., Galih, D.R., Greenroyd, C.J.,Laesanpura, A., Prihantono, J., Royle, G., Shankar, U., submittedfor publication. Interaction/links between lower and upper platedeformation at the NW Sumatran convergent margin from seafloormorphology, Earth Planet. Sci. Lett.
Henstock, T.J., McNeill, L., Tappin, D.R., 2006. Seafloor morphologyof the Sumatran subduction zone: Surface rupture duringmegathrust earthquakes? Geology 34, 485–488.
Hsu, S.-K., Sibuet, J.-C., 2005. Earthquake off Japan could generatestrong tsunami. Eos 86, 169–170.
Izart, A., Mustafa Kemal, B., Malod, J.A., 1994. Seismic stratigraphyand subsidence evolution of the northwest Sumatra fore-arc basin.Mar. Geol. 12, 109–124.
Lay, T., Kanamori, H., Ammon, C.J., Nettles, M., Ward, S.N., Aster,R.C., Beck, S.L., Bilek, S.L., Brudzinski, M.R., Butler, R.,DeShon, H.R., Ekström, G., Satake, K., Sipkin, S., 2005. Thegreat Sumatra–Andaman earthquake of 26 December 2004.Science 308, 1127–1133.
Le Pichon, X., 2006. Le séisme de Sumatra du 26 décembre 2004 et lasubduction Indo–Australienne, Cours du Collège de France,Chaire de Géodynamique, Cours et Séminaires, année 2005–2006, http://www.cdf.u-3mrs.fr/~lepichon/.
Moran, K., Austin, J.A., Tappin, D.R., 2005. Survey presents broadapproach to tsunami studies. Eos Trans. AGU 86, 430–432.
Park, J.-O., Tetsuro, T., Kodaira, S., Cummins, P.R., Kaneda, Y., 2002.Splay fault branching along the Nankai subduction zone. Science297, 1157–1160.
Plafker, G., 1972. Alaskan earthquake of 1964 and Chilean earthquakeof 1960: implications for arc tectonics. J. Geophys. Res. 77,901–923.
Plafker, G., Cluff, L.S., Lloyd, X., Nishenko, S.P., Stuart, Y., Syahrial,D., 2006. The cataclysmic 2004 tsunami on NW Sumatra —Preliminary evidence for a near-field secondary source along theWestern Aceh Basin. Seism. Soc. Am., Annual meeting, SanFrancisco, CA, April, 2006. Abstract.
Plafker, G., Ward, S.N., Nishenko, S.P., Cluff, L.S., Coonrad, J.,Syahrial, D., 2007. Evidence for a secondary tectonic sourcefor the cataclysmic tsunami of 12/26/2004 on NW Sumatra.Seism. Soc. Am., Annual meeting, Kona, Hawaii, April 11–13.Abstract.
Sandwell, D.T., Smith, W.H.F., 1994. New global marine gravity map/grid based on stacked ERS1, Geosat and Topex altimetry. EosTrans. AGU 75 (16), 321 Spring Meet. Suppl.
Sieh, K., Natawidjaja, D.H., 2000. Neotectonics of the Sumatran Fault,Indonesia. J. Geophys. Res. 105, 28295–28326.
Singh, S.C., Sumatra Aftershocks team, 2005. Sumatra earthquakeresearch indicates why rupture popagated northward. Eos Trans.AGU 86, 497–502.

103J.-C. Sibuet et al. / Earth and Planetary Science Letters 263 (2007) 88–103
Socquet, A., Vigny, C., Chamot-Rooke, N., Simons, W., Rangin, C.,Ambrosius, B., 2006. India and Sunda plates motion anddeformation along their boundary in Myanmar determined byGPS. J. Geophys. Res. 111, B05406. doi:10.1029/2005JB003877.
Soh, W., Djajadihardja, Y.S., Anantasena, Y., Arai, K., Araki, E.,Burhanuddin, S., Fujiwara, T., Hananto, N.D., Hirata, K., Kurnio,H., Machiyama, H., Badrul, K.M., Mueller, C., Seeber, L.,Suyehiro, K., Wanatebe, K., 2005. Sea bottom shattered by theSumatra–Andaman earthquake of 26 December 2004. Eos Trans.AGU Supplement 86, F8–F9.
Subarya, C., Chlieh, M., Prawirodirdjo, L., Avouac, J.-P., Bock, Y., Sieh,K., Meltzner, A.J., Natawidjaja, D.H., McCaffrey, R., 2006. Plate-boundary deformation associated with the great Sumatra–Andamanearthquake. Nature 440, 46–51. doi:10.1038/nature04522.
Sultan, S., Cattaneo, A., Sibuet, J.-C., Schneider, J.-L., submitted forpublication. Sumatra Aftershocks team, Evidence from piezometermonitoring of in situ excess pore pressure and sedimentdeformation generated during the December 26, 2004 GreatSumatra–Andaman Earthquake. In: Canals, M. (Ed), Slopeinstabilities, International Journal of Earth Sciences, Special Issue.
Tsumara, K., 1967. Determination of earthquake magnitude fromduration of oscillation. Jishin 2, 30–40 (in Japanese).
Vigny, C., Simons, W.J.F., Abu, S., Bamphenyu, R., Satirapod, C.,Choosakul, N., Subarya, C., Socquet, A., Omar, K., Abidin, H.Z.,Ambrosius, B.A.C., 2005. Insight into the 2004 Sumatra–Anda-man earthquake from GPSmeasurements in southeast Asia. Nature436, 201–206.
Copyright © 2022 FDOKUMEN