STATISTICAL OUTLINE ANDAMAN AND NICOBAR ISLANDS
223
STATISTICAL BUREAU ANDAMAN AND NICOBAR ADMINISTRATION STATISTICAL OUTLINE OF ANDAMAN AND NICOBAR ISLANDS 1970-71 UBLISHED BY THE ANDAMAN AND NICOBAR ADMINISTRATION AND PRINTED BY THE MANAGER, GOVERNMENT PRESS. PORT BLAIR, 1972
-
Upload
khangminh22 -
Category
Documents
-
view
3 -
download
0
Transcript of STATISTICAL OUTLINE ANDAMAN AND NICOBAR ISLANDS

STATISTICAL BUREAU ANDAMAN AND NICOBAR ADMINISTRATION
STATISTICAL OUTLINEOF
ANDAMAN AND NICOBAR ISLANDS
1 9 7 0 - 7 1
UBLISHED BY THE ANDAMAN AND NICOBAR ADMINISTRATION AND PRINTED BY THE MANAGER, GOVERNMENT PRESS.
PORT BLAIR, 1972


PREFACE
The Statistical Outline o f Andaman and Nicobar Islands for /0-71 is the eleventh issue in the series. It seeks to present in landy and compact form the essential statistical data pertaining various aspects o f the economy o f the Islands. In order to lance the utility o f the publication constant attempt is made improve the coverage and presentation o f statistical informa- ■1. Besides presenting data on 1971 Population Census, a few ?er tables containing information on matters o f curren portance have also been incorporated in the.current edition.
We hope this publication will serve as a useful reference book r the Government departments and other interested persons.
The Bureau acknowledges with gratitude the co-operation o f rious Government Departments and private Organisations 10 have supplied data presented here.
Suggestions for further improvement o f the publication are ost welcome.
M. M . S IN G H
Dated at Port Blair, Statistical Ofjicer,
(he 26th Jaunary, 1072 ) Andaman and Niculxtr hlauds*


ADMINISTRATIVE AND JUDICIAL SET-UP OF ANDAMAN AND NICOBAE ISLANDS
CHIEF c o m m is s io n e r (also I. G. Police, I. G. Prisons and Registrar of Calcutta High Court at Port Blair)
... H. S. BUTALIA
SECRETARIES/ASSISrANT SECRETARIES TO THE ANDAMAN AND NICOBAR
ADMINISTRATION
Chief Secretary Secretary (Forests) Secretary (Judicial) Secretary (Finance) Development Conimissioner- cum-Development Secretary Assistant Secretary (Public) Assistant Secretary Assistant Secretary Assistant Secretary Assistant Secretary Assistant Secretary Assistant Secretary
(General) (Finance) (Development) (Establishment) (Medical)(Confidential Cell)
Statistical Officer (also Assistant Secretary) (Pty.) Accounts Officer (also Assistant Secretary)
(Budget) THE JUDICIARY
District and Sessions Judge District Magistrate Addl. District Magistrate Magistrates, 1st Class
S. C. Vajpeyi Bachan Singh N. N ChadhaB. B. L. Bhardwa)
P. M. NairA. A. KhanK.K. WarriarU. M. HegdeL. Mewa LallA. B. SenBrij Behari LallP. G. Balaraman NairM. M. SinghM. N. Bansal
S. P- Dass Ghosh R. K. Ahuja N. Chandrasekharan R. C. Ilango Lachman Singh D. C. Sankhala S. Rah aR. Kishen Swarup K. Sethuraman
DISTRICT ADMINISTRATION
Deputy CommissionerAdditional Deputy Commissioner, A & N Islands (also B. D. O. Car Nicobar)Assistant Commissioner (North and Middle Andaman)Assistant Commissioner (Settlement)Assistant Commissioner (also B. D. O. Nancowrie)Block Development Officer (Rangat)Block Development Officer (Diglipur)Treasury Officer Supply Ofl&cer
R. K . Ahuja
R. C. Ilango
D. C. Sankhala Lachman Singh
R, Kishen SwarupC. RajamanikamC. Mohammed R. Shyamji Krishna M. S. Malhotra

PUBLIC WORKS DEPARTMENT
[ i v ]
Principal Engineer Surveyor of WorksExecutive Engineer (Port Blair South Division) Executive Engineer (Port Blair North Division) Executive Engineer (South Andaman Division) Executive Engineer (S & W Division)Executive Engineer (R. C. D , Wimberlygunj) Executive Engineer (Const. Division, Rangat) Executive Engineer (N. A. C. D., Mayabunder) Executive Engineer (Marine Works, Car Nicobar) Engineering Assistant to Principal Engineer Assistant Surveyor of Works Assistant Surveyor of Works Assistant Surveyor of Works Assistant Engineer (Independcn Stores Sub-Division, Calcutta)Assistant Engineer (Port Blair South Division)
Assistant Engineer (S & W Division)
Assistant Engineer (South Andaman Division)
Assistant Engineer (Port Blair North Division)
Assistant Engineer (Road Constn. Division)
Assistant Engineer (Construction Division, Rangat) ^
Assistant Engineer (N. A. C. D.,) Mayabunder
Assistant Engineer (Marine Works), Car Nicobar
Assistant Town Planner
Accounts Officer
A. K. Singhal R. Ramachandran M. M. L. Misra Vacant Gurdial Singh S. B. L. Gupta R. RajagopalA. H. Phadnis P. S. PassiM. S. Bhati V. N. R. Das S, P. Sood S, Krishnan M. A, Shukur
B. B. Dutt Chowdury K. N. Rao AjayakumarS. C Singhal Hayat Singh H. M. Bijani D. L. Jain D .K . Choudhury V. Rama Krishna R. SardanandO. N. Gupta Y. Narayana RaoG. P. Bhatnagar R. B. DeyH. K. Sachdeva S. B. WagleD. S. Krishnaswamy H. C. Verma V. V. George J. M. Basheer R. S. Singh M. R. Agarwal G. RamalingamA. K. BhattacharyaB. C. Sharma R. K. Singh M. S; Rathore S. D. JoshiT. R. Sambamurthy K. S. Agarwal M. S. ChohanB. S. Nanra Sohan Singh Syan
V. S. Swaminathan

FOREST DEPARTMENT
Chief Conservator of Forests Conservator of Forests (H.Q.)Conservator of Forests (Calcutta)Deputy Conservator of Forests (Mill Division) Chatham Deputy Conservator of Forests (Depot-Division, Howrah)Deputy Conservator of Forests (Working Plan) Deputy Conservator of Forests (Middle Andaman Division)Deputy Conservator of Forests (Silviculture and Utilization)Deputy Conservator of Forests (South Andaman) .. Assistant Conservator of Forests (North Andaman) . Assistant Conservator of Forests (Middle Andaman)Assistant Conservator of Forests y South Andaman)Assistant Conservator of Forests (South Andkman)Assistant Conservator of Forests (South Andaman)Assistant Conservator of Forests (H. Q.)Assistant Conservator of Forests (Andaman Government Timber Depot, Madras)Assistant Conservator of Forests (Andaman Goverment Timber Depot, Howrah)Assistant Conservator of Forests (Little Andaman) . Assistant Conservator of Forests (Statistical Cell, Port Blair)Assistant Conservator of Forests (Mill Division) Chatham Assistant Conservator of Forests (Middle Andaman)Senior Assistant Engineer (Mill Division Chatham) , Assistant Mill Manager (Mill Division Chatham) Veterinary Officer
Accounts Officer
[ V]
Bach an SinghE. S. ThangamD. P. Boiah
P. M. Ganapathy
R. K. Mondal Panday B. P. Sinha
A. C. D’Crus
S. K . Sharma P. M. Thimaiya J. K. Mehta
G. A. Bolliappa
P. N, Ray
S. R. Mehta
Alvis MinjB. A. Mathews
A. S. Achappa
P. K. RayB. M. Maniappa
A. B. Chakravorthy
M. M, Appachu
P. M. Achayya N. Stevenson J. N. Bhattacharjee Dr. Balaram
Seetharam Singh S. C. Agarwal
MEDICAL AND HEALTH DEPARTMENT
Director of Medical and Health Services SurgeonSurgical SpecialistMedical SpecialistG. D. O. GRADE IAssistant Director of Medical ServicesAssistant Director of Health Services
Dr. A. K. Banerjee Dr. S. Chatterjee Vacant Vacant
VacantDr. S. R. Haider

[ V i ]
Lady Medical Officer
Lady Medical Officer (V.D.) Medical Officer (H. 0.) Medical Officer (HI Q.) Medical Officer Junior Medical Officer
do. do. do.
Assistant Surgeon do.
Junior Pediatrician Junior Ophthalmic Surgeon Medical Officer, Nutrition Junior Radiologist T. B. Officer Junior ENT Surgeon Malaria Officer (MNEP) Anaesthetist Junior PathologistG. D. O. GRADE II junior Medical Officer (H. Q.
do. do. do. do. do.
Junior Medical Officer do. do. do. do.
Car Nicobar
(Rangat)(Nancowrie)(Car Nicobar
(Little Andaman) (Campbell Bay) (Dentist)(NEMP)
do.
do.Lady Medical Officer
do.
(Mayabunder)(Car Nicobar) (Diglipur) (Billiground) (Isolation Hospital) Port Blair)(H. Q.)
(Bambooflat)(N/M Andaman)
(Family Planning)
Public Analyst Matron(4 posts of J. M. O. for primary Health Centres— Diglipur, Wimberlygunj, Rangat and Nancowrie are vacant)
AGRICULTURE DEPARTMENT
Dr. (Mrs.) Radha Rani Roy
VacantDr. Moti Ram Dr. S. Chakraborty Dr T. R. Mediratta Dr. S. B. Das Dr. G. S. Chakrabarty
Dr. (Mrs.) Dotty Jacob Dr. Shiv Dev Singh Dr. A. K. Mukherjee VacantDr. B. R. Routh Dr. K, K, Chaturvedy Dr. D. D, Kundu VacantDr. R. N. Sanyal Dr. Gurcharan Singh Vacant VacantDr. N. G. Kumar
Dr. Rajalingam Dr. Govind Ram Dr. S. N, Banerjee Dr. R. K Lall Dr. A. A. Choudhary Dr. (Mrs.) Dayal Dr. A. K. Sengupta Dr. (Mrs.) S. i homas Dr. K. Riaz Meshack Dr. R. Mukherjee
Dr. (Mrs.) G. Saxena Dr. (Mrs.) Elizabeth
Mathews Dr. B. Shanmugam
. Dr. (Mrs,) Meena Mukherjee
, Dr. (Mrs.) N. K .Chaturvedi
. VacantMrs. S. Cherian
Director of Agriculture Agriculture Officer
S. K. Biswas J. C. Barpujari

[ v i i ]
Agriculture Officer Soil Conservation Officer Agriculture Officer Coffee Development Officer Soil ChemistPlant protection Officer (also B. D. O., S/A)
EDUCATION DEPARTMENT
Director of Education Deputy Inspector of Schools (HQ)Deputy Inspector of Schools (Mayabunder)Principal, Goveiumeut College, Port Principal, Boys H, S. School, Port Blair Principal, Higher Secondary School, Car Nicobar Principal, Girls H. S. School, Port Blair Principal, Higher Secondary School, Rangat Principal, H. S. School. Diglipur Principal, H. S. School, Mayabunder Principal, H. S. School, Wimberlygunj Principal, Ravindra Vidhyalaya, Port Blair Principal, Teacher’s Training School, Port Blair Junior Lecturers, Govt. College, Port Blair
do. do. do. do. do. do. do.
do.do.do.do.do.
Jagan SinghC. J. ThampiC. S. Das M. R. N. Rao S. S. YadavB. C. Datta Roy
Gyan Chandra Brojendra Lall Beant SinghH . L . LvithTa K. S. Naidu P. C. Srivastava Smt. Shanti PandeB. M. Budharaja R. B. Shishodiya M. R. Gupta S. N. P. Sinha VacantG. P. Dubey P. A. MathewsB. S. Sharma Smt. I. B. Dutta A. K. Singh R. A. Sharma P. C. BhattacharyaO. J. Thomas Samarendra Choudhary Kumari K. Deshmukh Suraj BhanA. R. P. Singh M. M. Mahajan S. N. Kashalkar
SHIPPING AND MARINE DEPARTMENTHarbour Master (Shipping, Transport and also Customs Collector)Assistant Harbour Master Marire EngineerAccounts Officer (Marine and Shipping)
POLICE DEPARTMENTSuperintendent of Police Police Radio Officer Asstt. Deputy Superintendent of Police (South Andaman)
do. (Armed Police)do. (Car Nicobar)
Commander K. P. Nair
B. J. Abraham VacantA. C. Chandra- sekharan
V. N. Singh Capt. Dhanman Rai
V. Vaidyanathan Bakhtawar Singh T. R. Kakkar

[ viii ]
ot Police (M/N Andaman) Kalicharan Singhdo. (C .L D .) Rajender Singh
do. (Special Armed VacantPolice Coy. II)
do. (S. A. P. Coy. I) Vacantdo. (Home Guard) R. P. Shungloo
LABOUR DEPARTMENT
Labour CommissionerLabour Welfare Officer (P. \V. D.)
do. (HQ)do. (Rangat)
C. N. Bopaiah V. R. Huddar R. C. Das R. Shanti Charan
ELECTRICITY DEPARTMENT
Executive Engineer
Assistant Executive Engineer Assistant Engineer
do.do.
M. M. Kewal Ramani'
P. C. Saba Bhagat Singh Inder Singh S. R. Talukdar
OTHER DEPARTMENTS
Director of Animal Husbandry Live-Stock Officer Controller, Andaman Labour Force Cottage Industries, Officer Fisheries Development Officer Registrar, Co-operative Societies Superintendent, District Jail Manager, Government Press
K. Vanchinathan R.. Hussain K. Balu Vacant K. SubbiahA. K. Guha Dr. A. K. Banerjee K. L. Gupta
CENTRAL g o v e r n m e n t DEPARTMENTS
Rehabilitation Department
Chief Development-cum-Rehabilitation CommissionerOfficer on Special Duty (Rehabilitation) Assistant Secretary (Rehabilitation) Accounts OfficerAssistant Commissioner (Campbell Bay) Agriculture Officer Research OfficerAssistant Soil Conservation Officer R. R. O.
B. K. Halve S. K. Biswas P. J. Samuel M. K. Jain VacantD. P. Chakarborty^ J, C. ChoudhuryC. N. GeorgeD. N. Mukherje

OTHERS
Station Director, All India Radio. Port Blair Director, Light Houses and Light Ships Navel Officer-in- Charge Chief Engineer, Wharf Project Director of Census Operations Principal Engineer (Marine) Andaman Harbour WorksDeputy Superintendent of Police-cum- Detatchment Commander Officer-in-Charge, Anthropological Deptt, Officer-on-Special Duty (Chief Executive) Rubber Research-cum-Dev. Station, Ferrarganj Station Commandant 1 . C. C. (H.Q.)Executive Engineer (Investigation Division) Deputy Accountant General Supdt. of Post Offices Assistant Director (Offshore Fishing)Principal, Central School, Port Blair Officer-in-Charge, Meterological Centre,Port BlairField Publicity Officer Aerodrome OfficerOfficer-in-Charge, Aeronautical Communication StationExtra Assistant Director (Maintenance) ISPW (Assistant Engineer, Civil Wireless Officer-in-Charge, Central Marine Fisheries Research Centre
[ i x ]
P. Venkateshwarlu J. N. Mankad Capt. P. C. Rajkhowa Col. A. N. Sethi M C. Joshi
G. S. Rao
Dayal Singh T. N. Pandit
K. M. Joseph Lt. Col. Ratnam S. S. Iyer N. Sunder Rajan R. Shankaranara^anan i\ . SudershanB. N. Kaul
J. K. Nandi P. K. MazumdarS. S. Pillai
M. V. UpadhyaD. D. MallikH. F. Banerjee
V. N. Pande


PORT BLAIR MUNICIPAL BOARD
Ch a ir m a n
SHRI R. K. AHUJA
V i c e -Ch a ir m a n
SHRI SHIV RAM
J u n io r V ic e -C h a ir m a n
SHRI A. R. MARUDHAVANAN
E l e c t e d Me m b e r s
SHRI MOHAMMED SALEH
„ M. A. LEHMAN
SOHAN RANGAIAH
„ KANHAYA LALL
T. K. GOPAL
SITAMBARAM
„ VEERA RAGHLU
S e c r e t a r y
SHRI SAROOP LALL


CONTENTS.
SECTION— I.
G e n e r a l
Table ' Pagel .i Andam in and Nlcoljar Islands at a glance ... ^
SECTION — 2.
CLIMATE
J
78 8
910
1112
2.1 Normal and actual rainfall2.2 Monthly rainfall data recorded at various stations in
Bay Islands-1970.2..' Month-wise number of rainy days.2.4 Temperature and humidity.2.5 Monthly data on temperature, humidity and rainfall
recorded at Port Blair— 1970.2.6 Monthly average temperature and rainfall data2.7 Monthly wind directions and mean wind speed recorded
at Port Blair- 1970.2.8 Mean daily wind spee 1 recorded at Port Blair.
S E C T IO N - 3.
.3.1 Area, Population, number of Tehsils arid Town ... 15?>.Z Distribution and movement of population during seven
Decades .. 15Decennial growth of population ...
3.4 Mean decennial growth rates of population ... 163.5 Rural and Urban Population 173 6 Tehsil-wise Density of population . . . 173.7 Tehsil-wise Sex-Ratio ... 183.8 Trend of Tribal Population . 183 9 Distribution of Tribal Population— 1961 Census - 193.10 Male, Female, llural and Urban population .. 193.11 Population accordinii to marital status— 1961 Census ... 203.12 Population according to mother tongue—-1961 Census . . . 203.13 Population according to religion— 1961 Census ... 213.14 Growth of religious communities— 1961 Census . . . 213.15 Population by workers and non-workers ... ... 223.16 Distribution of woikinp population ... ... 223 17 Area and population of Port Blair Tow n— 1^71 Census ..." 233 i8 Reirion-wise No. of Inhabited villages— 19(U Census ... 2'.3,19 Distribution of No. of Inhabited villages and average
population- 1961 Census ... ... . . . 2.43 20 Villages Classified by population— 1961 C'ensus ... 24;j21 iehsil-u jse (Population of Andaman and Nicobar Islands
— 1971 Census ... ... ... ... 25
Table
4.14.24.3 4 44.54.64.7
4.8
f).l5.25.35.45.55.6
5.7
5.8
5.0
5.10
6.1 6-2 6.3 6 4 6.5 6 6
7.17.2 7 37.4
7.5
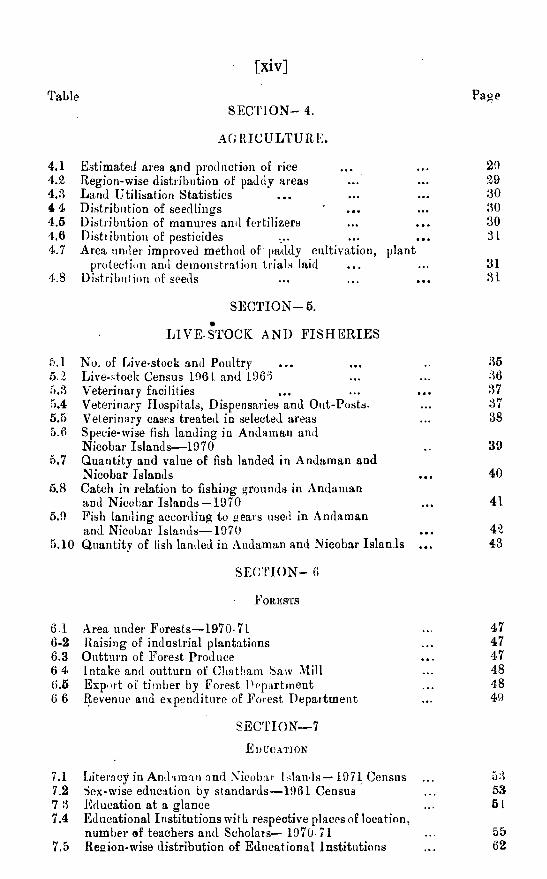
SECTION ^ 4.
AGRICULTU Rl^.
Estimated area and production of rice Region-wise distribution of paddy areas Land Utilisation Statistics Distribution of seedlings ’Distribution of manures and fertilizers Distribution of pesticidesArea under improved method of [>addy cultivation, plant
protection and demonstrat ion trials laid Distribution of seeds
S E C T IO N -5.
L IV E S T O C K AND FISH E R IE S
No. of Live-stock and Poultry Live-stock Census 1061 and 106^Veterinary facilitiesVeterinary Hospitals, Dispensaries and Out-Posts. Veterinary cases treated in selected areas Specie-wise fish landing in Andaman and Nicobar Islands— 1070Quantity and value of fish landed in Andaman and Nicobar IslandsCatch in relation to fishing grounds in xVndaman and Nicobar Islands —1970Pish landing according to oears used in Andaman and Nicobar Islands— 1070Q-uantity of fish landed in Andaman and Nicobar Islands
S E ( r r i O N - 6
F o r e s t s
Area under Forests— 1970-71Raising of industrial plantationsOutturn of Forest ProduceIntake and outturn of Chatham Saw MillExport of timber by Forest PppartmentRevenue and expenditure of Forest Department
SECTION— 7
E d u c a t io n
Literacy in And iman and Nicobar Islands*—1971 Census Sex-wise education by standards— 1061 Census Education at a glanceEducational Institutions with respective places of location,number of teachers and Scholars— 1070-71Reoion-wise distribution of Educational Institutions
[xiv]
Page
203930303031
3131
3536373738
39
40
41
4-243
47474748 48 40
535361
5562

[ X V ]
7.G Iuatitatioii*\vIse regional distribution of Scholars7.7 Institution-wise rej^ional distribution of Teachers7.8 Teachers in Educational Jnstitutions7.0 Distribution of Institutions, Scholars and Teachers
7.10 Distribution of stipendiary scholars undergoing posi: matriculation education in mainland according to pursuit of study
7.1 Distribution of stipendiary scholars ntidergoing post matriculation education iji mainland according to amount i)f stipend received
7.1:2 Tnstitutioti-wise annual di.stribution of Scholars7.1 Examination results7.14 Teachers trained in Junior Basic Teacher^d Training
School, Port BlairSECTION— 8
M e d ic a l a x d P u b l ic H e a lth
8.1 Regional distribution of hospitals and dispensaries8.2 Bed strength of various hospitaLs—19708.8 Government medical and public health perse nnel8.1 Medical facilities8.5 Patients treated in hospitals and dispensaries8.6 Births and deaths in various hospitals8.7 Deaths according to causes8.8 Vaccination Statistics 19708.9 Progress of B. C. G. work
8.10 Pathological Lal)oratorj Statistics8.11 Operations performed8.LE Maternity cases attended8.1:5 Antenatal clinics conducted at the maternity and child
welfare centres—19708.14 Average No. of daily in-patients and out-patients8.15 Medical facilities-region-wise8.If) Expenditure on Medical facilities •8.17 Surveillance activity <>1 the N. M. E. P. Organisation in
A. & N. Islands8.18 No. of Sterilisation and TU ^I) Operations performed in
A. & N. Islands accordin»: to Reliffion and Sex
Tal)le ■63646566
Page
686070
70
7;7575767677777878 7079 70
SO80 81 81
8:2
S E C T I O N -O
S h i p p i n g a n d M a k i x k
9.1 Passenger tiatiic at Port Slair9.2 Cargo imports snd exports9.3 Export of Copra, Betelnut and Coconut from Xicobar
Group of Islands0.4 Numl)er and tonnage of vessels visiting Port iilair9.5 Sanctioned strength of Government Marine Dock-Yard.
Port Blair '9.6 Workers employed, mandays worked and accidents
oficmrel in Government ]\lurine Dock*Yard
S5
8586
86
87

T a b le P ag®9.7 Water-crafts consitrueted in Government Marine
Dock-Yrud ... 879.8 Xiimber of water-crafts surveyed and major relit
undertaken . . . ' 8 7
S E C T I O N -10
TRANsroiiT A nu Commuxicatioxs
10.1 Koad length . . . 0110.2 Government road transport ... 9110.3 Motor vehicles in Andaman and Nieobar Islands ... 9210.4 New registration of motor vehicles ... 9210.5 No. of vehicles registered outside A. & N, Islands
but plying in A. & N. Islands ... 9310.0 No. of Accidents due to conveyances in A. & N. Islands ... 9.‘)10.7 Postal and telegraph communication facilities ... 9410 8 Number of telephones and Exchanges ... 9510.9 TraHic handled in Fort Blair Telegraph OtKce ... 9610.10 Programme coniposition-All India Radio, Port Blair ... 9()10.11 Indian Airlines Operations between Calcutta and
Fort Blair ... 97SECTION — 11
POWEK
11.1 Installed capacity and power generation in Andamanand Nieobar Islands ... 101
11.2 Electric con>umption by various sectors in Andamanend Nieobar Islands . . . KJl
11.3 Region-wise electric consumption by various sectors inAndaman and Nieobar Islands—1970 . - 102
11.4 In.stalled capacity and power generation at Port Blair ... 10:511.5 Electiic consumption by various sectors at
Port Blair— 1970 l o t11 G Sale of electricity to different consumers at Port Blair ... 105
SECTION— 12
Public F inance
12 1 Budget at a glance ... 109.12.2 Details of revenue receipts ... 11012.8 Details of expenditure . . . I l l
SECTION — 1;
Law A xd O rueii
13.1 Stjength of Police Force ... 315D12 Volume of crimes; ... 116
[xvi]

[ xvii ]
13.;:$ 18.4 18 5 18.G 18 7
Tnhln
Average daily population of Jail Age and state of educatiou of convicts Condition of prisoners released from Jail Pidperty stolen and recovered Incidence of fire
11(3117118 110 119
Page
SECTION — 1-1
C o -O peu atio n -
I LL Co-opi'ration statistics financial and physical11.2 Development of co-operative societies
S E C T I O N -15
123124
15 1
10.1 15 8
15.1
15.515.6
15.7 15.S
15.9 15 10
15.1115.1215.13
Small-scale Industries and handicrafts under Cottage Industries Department Output of Jail IndustriesAverage daily uumb^r oF workers employed in registered factoriesAverage daily employment of adult wovkers in < registered factories with specified normal rt'eekly hours I'actory LabourNumber of accidents an I atnouut of eoinpensation paid under the \Vorkmeu’s Compen-ation Act, l''>23 Industrial dispute*-' and mandays lost Number of shops and Oommercial E.stablisbments under the weekly holidays Act, 191i Leave with wiges uq ler the Factories Act, HUS Nam ler ol’ establish neu^s having certified standing orders un.ler Inlustrial Employment (Slatiiing Orders) Act, 194G and Strength o f Employees Accidents Industry-vvise Amount of (*o npMl-;:;tio i [)a:d-Industry-wise VVoik Committees
12612C)
U S130
130 181
131182
138l3^18513C.
SKf T IO X — ir.
E m f l o y -m kxt
16.1 Distribution of Andaman and Nicobar Administration's Employees
16.2 Distribution of Andaman and Nieobar Administration's Employees according to basic pay ranges
16.3 Distribution of An laman & Nicobar Administration's Employees accordino to total emoluments
16.4 Distribuiion of Andaman & Nicobar A'lrainistration'’s Employees (Regular by sex and class of nppointment)
16.5 Distiibutiou of An laman & Nicobar administration’s Employees (Regul-ir) according to Marital Status
16.6 Sanctioned strength and filled-in-j)osts in respect of Andama'i an ! Nicobai A Iministralion s Em 1)Vh(;;‘s
188
1 10
112
114
14ti
148

S E C T IO N - 17
P l a n n in g A n d D e v e l o p m e n t
Table Paf^e17.1 Fonrtb Five Year Plan and Annual Plan 1070-71 ... ITiS17.2 Second Five Year Plaa*alIotinent and expendif:ure 15.1',17.3 Third Five Y’ear Plan-allotrnent and expenditure ... 15.U)17.4 Outlay, Sanctioned Bud get and Expenditure incurred
during 1970-71 on implementation of Plan Schemes ... 156517.5 Blocks at a glance ... 157
SECTION— 18
Fooi3ftiiA\ :s And Puui.s
18.1 Wholesale prices of food^rains at Port Blair, 1970-71 ...13.2 Retail prices of food stuffs prevailing at different
market centres ... 16:’IS.J Trend of retail prices of essential commodities at Port Blair ... 16318.4 Average annual wholesale prices of milk and tuilk
products at Port Blair 16 418.5 Average annual wholesale prices of meat of
different animals at Port Blair ... 16518.6 Average annual wholesale prices of poultry by tj’ pe of
birds at Port Blair . . . 16518.7 Average antuial prices of animals of various types at
Port Blair “ ... 166SE C TIO N -^] 0
L o c a l B o d ie s
19.1 Population and ConstitutioQ of Municipalities . . . 16919.2 Income of Municipalities ... 16!919. 5. Expenditure of Municipalities . . . . 17019.4 Panehayats ... 1*^
S E C T IO X --20
E i .k otoral S t a tistic s
20.1 Mid-tem Election to Lok Sabha— 1971 ... • 17;V20.2 ^lid-term Election—1971— Electorate ... 17>‘i2 0 . Mid-term Election— 1971 —Polling ... 17420.4 Mid-term Election— 1971—Y 'oting Preference by Parties 174
SECTION— 21
M iscet-l a n e o u s
[xviii]
•> r*:i l . l Sitting Capacity of Cinema Houses at Port Blair . . . 1721.2 Language-wise films exhibited in cinemas ... 17721,; Cinema Statistics ... 171
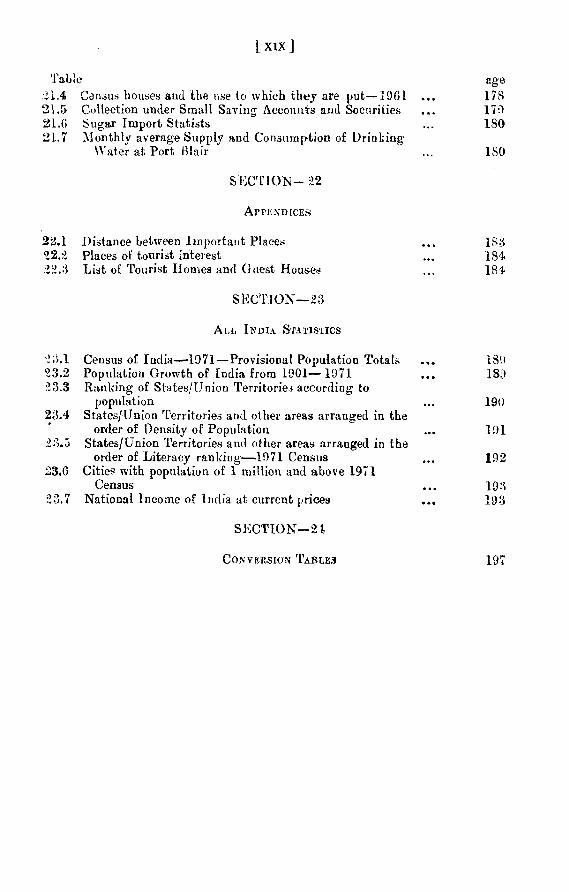
[ X I X ]
:il.4 Census bouses and the v.se to which they are put— 1961 2L 5 Collection under Small Saving Accounts and Socnrities21.0 Sugar Import Statists21.7 Monthly average Supply and Consumption of Drinking
Water at Port Blair
Table age178170180
180
22.1
22.
;i;i.l23.2:Z3.3
2;5.4
23.6
23.7
S E C T IO N - 22
ArrENDicEs
Distance between Important PlacesPlaces of tourist interestList of Tourist Homes and Guest Houses
SECTION — 23
A ll I ndia Statistics
Census of India— -1971— Provisional Population Totals Population Growth of India from 1901— 1971 Ranking of States/Union Territories according to
populationStates/Union Territories and other areas arranged in the
order of Density of Population States/Union Territories and other areas arranged in the
order of Literacy ranking— 1071 Census Cities with population of 1 million and above 1971
CensusNational Income of India at current prices
S E C T IO N ~ 24
C oxvE R S io.v T a b l e s
1S3184184
180189
190
191
192
19H193
197


S E c T I O N - 1
GENERAL


ANDAMAN AND NICOBAR ISLANDS AT A GLANCE.
T a b l e (1 . 1)
No. Item Unit Particular?1
I . Area Sq. Kms. 8,2932 . Distance between Port Blair and
(i) Calcutta Kms. 1.255(ii) Madras 1,191
3. Average rainfall Cms. 3184. Actual rainfall, 1970 3665- Mean maximum temperature, 197O 30,76. Mean minimum temperature, 197O c ° . 23.27. Highest Peak (Saddle Peak) Metres 7328, Revenue Tehsils No. 69- Towns 1
10. Population 1971 Census (Provisional) 1 ,15,090
11.12.13.14.15.
t6.17 .
(i) Males(ii) Females(iii) Urban (ivi Rural
Females per 1,000 males, 197I Density of population, 197I Total Workers, i971 Total Non-Workers, 1971 Literates, I 971
(i) Males(ii) Females
(iii) Literacy, 1961(iv) Literacy, 1971
Educational Institutions, 1970-7 r Scholars
Per Sq. Km. No.
Percentage
No.
(i) Boys(ii) Girls • I
18. Teachers No.(i) Males
(ii) Females19 . Expenditure on Education, 1970*71 Rs. Lakhs.20. Estimated area under rice, 197O-7I Hectares2 1 . Production of rice, 1970*71 Tonnes.22 . Average yield of rice per hectare Tonnes23- Total Livestock I966 Census No.H - Total Poultry, I966 Census . 25. Veterinary Hospitals, 197O26. Veterinary Dispensaries I97O27 . Veterinary Surgeons, I97O i *28. Fish landed during 197O Tonnes29. Income realised, I97O Rs. ‘ 000 ^30. Outturn of Forest Produce, i970-7i Rs. lakhs.3 1 . Medical Facilities 197O
(i) Hospitals No.(ii) Dispensaries
(iii) Beds available
70.005 45,085 26 2 i 2 88,878
64414
45.33369,75750,03636,07913 ,9 5 733.6343.48
16 1i 7,q6610,5i9
7,447886598288
5 8 .3 18247
10.006 1.21
49,68598;659
156
500924120
n
49493

32.
4
Working (Registered) factories, i970 (i) Average workers employed
No. 17
daily >> 3,008(ii) Mandays worked 8 ,98,210
33. Roads (Black topped) I97O-71 Kms. 44134. Buses 1970-71 No. 4135- Motor vehicles I97O-7I ft 1,07236. Electricity Generated, 107O ' 000 ' KW 4 .3O537. Electricity Consumed, 197O ' 000' KWH 3>56738. C. D. Blocks, 197O-7I No. 539- Post Offices and Sub-Post Offices
as on 31-3-1971 i 240. Police Stations, I97O 941. Police out-posts I97O •» 1242. Telegraph/Police Raido Stations,
1970-71 No. 2043- Co-operative Societies, 1970-71 No. i9g
(i) Membership i 5>807(ii) Share Capital Rs. ' 000 ' 1636
(iii) Working Capital 2745

S E C T 1 O N—2
CLIMATE


N ORM AL AND ACTUAL RALN FALL
T able (2 .1 )
Period Normal Rainfall Actual Rainfall Departure of Actual Percentage.R a i t i f a l l
'------------- ----------- r---------------------------- -------------------------------^In Cvns. In Inches In Crns. In Jaches In Cms. Tn Inches.
1 5.2 3 6
1967 318.05 125.:>:3;US/0:) 125.22
iOrt!) 3l8.(,)5 125/2:21970 ;U8.05 ’ >5.32
29-2 77 115.26 — 25.28 — 9.95 — 7.953t)0.46 141.91 •4-42.41 + 16.()9262.00 108.15 — ')6.05 — 22.07 — 17.632()S.!j.3 105.89 — 49.10 - 19.:’): ; — 15.44;^66.:i2 141 22 + 48.27 + 19.00 + 15.18
S o u rce ; Regional Meteorological Centre, Calcutta.
T a b l e (2 .2 )
M ONTHLY R A IN F A L L DATA RE O RDED AT VA RIO U S STATIONSIN HAY i s l a n d s - 1970.
(in inilliuietres)
Month Port Blair LongIsland
s t a t i o n s
Mayabun- Car tier Nicobar
Nanco-wrie
Kondul Hut Bay
1 3 4 o 6 / 8
January ;31.o 47,0 5.4 45.6 249.4 281.6 171.9February 3.6 1.0 0.0 44.4 :>5.0 368.2 6.8March 0.0 0.0 0.0 2.0 20.2 40.4 22.6April 36.6 12.6 31.6 44.6 85.2 136.8 89.8May 452.6 353.8 405.0 364.3 265.1 558.7 .415.0•T une 464.5 3^2.0 611.9 261.0 272.7 219.8 274-6July 707.4 563.6 77.3.0 320.1 252.6 1S9.3 445.9Augu>;t 326.6 297.4 498.2 319.9 209.6 244.8 322.9September 628 7 346.6 383.4 218.9 376.6 365..3 425.6October 3.19.6 34 L4 380.0 463.7 397.8 364.7 446.6November 457.1 432.3 48 6. S 261.0 345.3 263.8 603.3December 154.8 143.0 3J3.4 265.3 207.6 236.9 224.1
jOuiicE : —Regional Meteorological Centre, Calcutta.

M ONTil-VvISE N U M B E R OF R A IN Y DAYS
8
T able (2 .3 )
Month 1966 1967 1968 1969 L970
JanuaryFebruaryMarchAprilMayJuneJulyAugustSeptemberOctoberNovemberDecember
T ota r.
7 1 5 20 2 0 1 10 0 0 1 02 5 4 .3 6
15 20 8 19 1812 15 19 21 2119 24 22 15 2218 21 19 19 2417 16 19 12 199 23 14 9 16
14 10^ 9 10 1711 6 6 3 11
120 149 121 118 157
S o u rce Kegional Meteorological Centre, Calcutta.
T a b l e 2 .4 )
TEM PERATU RE AND H U M ID IT Y
Year Mean Maximum Mean Minimum Average Mean Relative Temperature Temperature Temperature Humidity ^ a t
CDegrees
F CDegrees
F 0 F 0830 hrs. 1730 brs.Degrees I.S.T. I.S .T
1966 30.6 87.1 23.3 73.9 26.9 80.4 77 82
1967 30.4 86.7 23.2 73.7 26.8 8D.3 78 82
1968 30.7 87.3 23.5 74.3 27.1 80.8 76 81
1969 30.8 87.5 23.3 74.0 27.6 81.7 77 81
1970 30.7 87.3 23.2 73.7 26.9 80.4 78 82
S o u r c e Regional Meteorological Centre,] Calcutta.

T able (2 .6 )
MONTHLY DATA ON TKMPERA.TURE, HU UDITY AND(RE- ’ORDKD A r PORT BLAIR, 197D).
R A IN F A L L
Moath Temperaturfi iu Ceu dg rad er - ----------
MeanMaximum
MeanMinimum
AverageTemporature
Relative Humidity Total--------------------------------- ^Rainfall0830 hrs. 1730 hrs. in Milli-
I.S.T. LS.T. metres
January ;Mi.9 22.4 26.7 69 76 31.5I-'ebruary ;^2.o 22.7 27.4 68 74 3.6M arch 33.0 22.9 2S.0 66 70 0.0April 33.8 24. r. 29 2 66 73 36.6May 3L0 24.1) 27.5 81 8C> 152.6June 3'0.1 24.1 27.1 87 87 464.5J lily 2!).3 23.2 26 1 86 87 707.4August •20.3 23.3 26.3 8(i 88 326.6September 23.0 26.3 80 87 628.7October 29.5 22.7 26.1 81 86 399.6November 39,8 22.8 26 3 81 86 457 1December 29.9 22.3 ' 26.1 77 83 154.8
30.7 23.2 26.9 78 82 3663.0
S o u rce :— Regional Meteorological Centre, Calcutta.

T able (2 .6 )
MONTHLY AVERAGE TEMPERATURE AND RAIN FALL DATA RECORDED AT PORT BLAIR
1966 1967-------- A ^ . .
1968_____ A . . .
1969 1970_____A____
(----------------------------Mean Tem- Total Mean Tern- Total Rain. Mean Tempe- Total Mean Terape- Total Mean Tempe- Total
Month. perature(°C) Rain- perature (°C) fall in Mil- rature (°C) Rainfall rature (°Cj Rainfall ratnre (*0) Rain-f----- .-A---------- fall jn I--------- ---------limetres. (------------------------—> in Milli-,^----------- ------------ in Milli-,/--------- ---------- >,fall inMax. Min. Milli- Max. Min Max. Min. metres. Max. Min. metres. Max. Min Milli
metres metres.
1 2 3 4 5 6 7 8 9 10 l i 12 13 . 14 15 IG
January 30.7 22.9 70.0 30.0 22.8 146.5 30.4 . 21.9 8.6 30.3 22.0 75.0 30.9 22.4 31,5February 3L7 23.7 0.0 31.2 22.0 13.9 31.1 21,5 1.4 30.8 20.7 18.8 32.0 22.7 3.6M ai ch 32.3 21.9 1.6 32.0 22.2 3.9 32.8 23.6 0.2 32.6 22.6 42.8 33.0 22.9 0.0April 33.3 24.2 42.0 33.2 23.5 31.8 33.2 24.1 69.1 33.7 25.0 38.6 33.8 24.5 38,6May 30.8 24.3 462.6 30.8 23.9 619.9 31.2 24.0 233.4 31.8 24.5 374.2 31.0 24.0 452.6June 30.2 24.5 124.7 30.0 24.3 872.3 29.9 23.8 477.8 29.8 25.4 494.5 30.1 24.1 464.5July 29.1 23.6 527.0 28.9 23.6 634.7 29.0 23.8 551.0 29.5 24.1 404.0 •29.3 23.2 707.4August 29.7 23.7 31L6 28.6 23.7 722.5 29.6 24.4 263.7 29.5 383.0 29 3 23.3 326.6September 29.3 23.1 556.3 29.3 23.4 326.0 29.1 23.4 493.9 29.4 23.3 492.6 29.5 23.0 628.7October 30.3 22,9 174.1 29.6 22.9 534.6 30.5 23.5 223.7 30.9 23.?. 106.5 20.5 22.7 399.6November 30.2 23.0 378.3 30.8 23.3 123.9 31,5 23.9 181.5 30.3 23.0 222.0 29.8 22.8 457.1December 29.9 23.0 279.5 30.2 23.3 74.6 30.9 23.5 110.7 31.1 23.7 38.5 29.9 22.3 154.-8
S o u r c e : Regional ^ietaorologieal Centre, Calcutta.

T able (-^.7)
MONTHLY WIND DIRECTIONS AXD iMEAN W IN D SPEKD RECORDED AT PORT BLAIR — 1970
Month.0830
A . ..
W IN D D IR E C TIO N" ................................ ^
Frequency of OccurrencesA . Mean Wind Speed in
Km. p . hA
SE
173—
S
N
0f
N NE E SE s SW" w NW' Calm> r~
N NE E sw W N W Calm 0830 1ST 1730 1ST
1 2 3 4 5 6 7 8 9 10 11 U 13 14 15 16 17 IS lu 20 21
January 5 22 3 0 0 0 0 I 0 3 23 0 ■■() 0 0 0 1 2 9.3 8.0February 6 16 4 0 0 0 0 0 2 3 17 4 0 0 0 0 0 4 8.0 8.5March 5 15 4 1 0 1 1' 1 3 0 13 5 0 0 I 1 I 10 5,8 2.9April 6 13 4 1 0 0 0 1 5 3 6 12 1 0 1 1 (» 6 5.0 3.7May 0 0 1 8 11 10 :3 1 2 1 2 0 1 7 11 4 3 0 1:2.4 10.7June 0 0 1 1 9 17 1 0 1 0 0 (1 1 6 17 5 0 1 15.9 i4.9J uly 0 0 0 0 4 24 3 0 0 0 0 0 0 7 18 4 0 2 ^20.6 18.5August 0 0 0 0 8 16 5 1 1 0 0 0 0 6 21 3 0 1 16 9 14.1September 0 0 0 1 4 11 11 0 3 0 0 0 0 2 11 11 1 5 1L2 9.0October 0 4 2 3 3 7 7 0 5 0 1 1 2 6 2 1 11 9.0 5.8November I 8 11 3 1 0 1 1 4 0 12 () 3 3 0 1 0 5 11.1 10.2December 4 15 5 1 0 0 1 1 3 4 16 •3 0 1 1 0 0 6 8.8 7.3
S o u rce : Keg:ioual Meteorological Centre, Calcutta.

T a b l e (2.8)
MEAN DAILY WIND SPEED RECORDED AT PORT BLAIR
( In Km. P .
12
Month
JanuaryFebruaryMarchAprilMayJuneJulyAugustSeptemberOctoberNovemberDecember
1966
8.36.56.35.2
16.218.120.814 .114.6
5.07.58 .5
1 O.9
1967
9.5 6.04.65.9
15 .216.216.422.315.810 .56.8 8.g
SPEED
1968
7.4 6.86.55-99.9
17.621.6 2 4 .2 17.57.47.08.7
1 1 .7 1 O.8
1969
7.45.85.15.9
11.7 20.2 2 I .4 15 .314 .8 5-7 7-4 8.7
197O
7.87 14 .7 5.3
1 2 . 11 7 . 22 2 .317.813.8 8.1 9-27.7
i l . l
S o u r c e :— Regional Meteorological Centre, Calcutta.

S E C T I 0 N ~ 3
AREA AND POPULATION


AREA, POPULATION, NUMBER OF TEH SILS AND TOWNS
15
T a b l e (3 .I )
81. No. . Item Unit Particulars
I . Area Sq. Kms. 8.2932. *Population-l971 No. 1, 15 0903. Density-1971 Per Sq. Km. 144. Revenue Tehsils No. 65* Towns 16. *Population of Port Blair town-1971 26,212
(i) Male 16842(ii) Female 9,370
^ProvisionalS o u r c e Statistieal Bureau,
Andaman and Nicobar Islands.
T a b le (3.2)
DISTRIBUTION AND MOVEMENT OF POPULATION DURINGSEVEN DECADES
ANDAMANS NICOBARS
YeartMale Female Total
(—Male Female Total
I 2 3 4 5 6 7
1901 15 J 58 2,980 18,138 3.537 2,974 6 ,5 1119 1 1 1 4^737 2,904 17,641 4,844 3>985 8,8181921 15 .551 2,263 17 814 5-242 4,030 9,2721931 14,258 4.965 19,223 5444 4y796 10,2401941 i 4>873 6,444 21,316 6586 5,866 12,4521951 12,734 6,228 18.962 6‘32i 5,688 12,0091961 31,524 17,461 48,985 7,780 6.783 14,563
*1971 57,857 35,564 93,421 12,148 9.521 21,666
*Pro visionalSource Census Reports

T a b le (3 .3)
DECENNIAL GROWTH OF POPULATION
16
SI. No. Year Population Variation in Percentage Density P’er Population Variation Sq. Km.
4
1 19O1 24 649 — — 3
2 i9 i l 26,459 4-1,810 + 7*3 3
3 1921 27,086 + 627 + 2.4 3
4 1931 29.463 + 2,377 + 8.8 4
5 194I 33,768 + 4>305 + 14.6 4
6 1951 30,971 — 2,797 — 8.3 4
7 i96i 63,548 + 32,577 + 105.2 8
8 *1971 1 . 15,090 51,542 + 81.1 14
* ProvisionalS o u r c e :— Census Reports.
T a b l e ( ii .4 )
MEAN DECI<]NNIAL GRO W TH RATES OF POPULATION
Items 1961-70 1051-60 1941-50 1931-40 1921-30 1911-20
Mean Population of decade 89,319 47,260 32,369 31,616 28,275 26,7 72Mean population of daeade for area under registrationof births and deaths 89,319 47,360 32,369 31,616 28,275 26,7 72Growth of populationduring the decade -,-51,542 +32,577 -2 ,7 9 7 +4,305 +2,377 + 6:27Mean decennial growthRate + 57.7 + 68.9 - 8 . 6 +13.6 + 8.4 + 2 .3
S o u r c e : — S ta tis t ic a l Bureau,Andaman and Nicobar Islands.

T 6 b le (3.5)
R U R A L A N D URBAN PO PU LATIO N 1971 c e n s u s (PR O V ISIO N A L F IG U R E S )
17
Tehsil Rural Urban Total Percentage of Urban to total population
1. Diglipur 9,471 — 9,471 _
2. Mayabunder 8,443 — 8,443 —
3. Rangat 15,164 — 15,164 —
4, South Andaman 34,131 26,212 60,343 43.445. Car Nicobar 13,504 - 13,504 —
6 Nancowrie 8,164 — 8,165 —
A. & N, Islands 88,878 26,212 1,15,090 22.78
SoUTiCE :— Paper 1— 1971, issued b j Director of Census Operations,Andaman and Nicobar Islands.
T a b l e (3.6)
TEHSILVYISE D E N SITY OP PO PU LA TIO N
Tebsil Density per Sq. Kilometre
1961 1971 (Provisional)
1. Diglipur 5 112. Mayabunder 4 63. Rangat 7 144. South Andaman 10 205. Car Nicobar 77 1066. Nancowrie 3 4
A. & N. Islands 8 14
S o u r c e :— Paper 1 — 1071, issued b y Director of Census Operntions,
Andaman and Nicobar Islands.

T abi.e (3 .7)
T I 'I IS T L -W IS E SRX RATIO
18
'lehsil Sex Rafio (Feinnles per 1,000 Malf's)
11761 1971(Prov.)
1. niglipiir2. Mayabun>ler
Rano;rit4, South Antinm '1115. Car Xii'obar 0. Nancowrie
714541420570026767
703 . 707
0;U 574 002 017
A. &. N. Islands (il7 644
SOITRCE : —Paper I — 1071, issued by Direetoi ot Censns Operations,Andaman nnd iNJieobar Islands
Tabt.K (3.8)
T R i:N1) o f 'I’R lB iL POPULATION
Tribes Consii.s Years
1001 I Dll 10:21 I0:n 10 11 1051 lOtll
1 •> 4 5 6 7 8
IN Andatnan*Isl:iuils
Antlamai'f'so 025 Onges (072) JarawasSentinalese (117)
Nieob;ir('se rilUlrJ Shoinj)ens (•>•'')
455 . 200 (6;U) (3tG) (114) (114) (117) (117)
IN MCOBAU 70!) I 8248 (37:>) (375)
0 0 — (260) — (70) —(5 0 ) —
ISLANDS'.jr)80 12252
(2 0 0 )
23(150)(50)
1 '902 ( >0 )
191211
(500)(50)
1390;i71
Note'.— Figures in brackets are esliriuiteii tiguics.
SoURCK ( ’ensns Heport- A. & N. lslan<
~I9U1,1h.

19
D ISTRIBU TIO N
T a b l e (;V9)
OF TR IB A L 1;^0PULATI0N--lOOl CENSUS
'Fribal Communitv Populati(U) Hermirks
1 2 3
A. Andaman I slands : —(i) Andamanese I!)
(ii) Jam was (Hostilo) 50U
(iii) \ l ^(iv) * Sentinalese (Hostile) 50
B. Nioobar Islands :—(i) NicobareiJe L^,003
(ii) Shorn pens 71
Liv ing in Grea^ Andam ans alongvvitli civilised population.
Livliifr on tlie \vi stern coast o f Mid.lie & South Andamans.
L iving in Ijittle Andaman. Liv ing in North Sentinal Lsland
L iv ino in all (he inhabited N icobarLivinir in Great Nieobar.
Estimated.Source : - Cen us Report— 1961.
Table (3.10)
MALE, FEMALE, RURAL AND URBAN POPULATION OF ANDAMAN AND NICOBAR ISLANDS
Item No.
—
Percentage to total Population
— — — — — . - A ---------------------------
1961 1971 (Prov.) 1961 1971
Fetal Population 63,548 1,15,090 lOO.O 100.0
Total Males 93,304 70,005 61.8 60.8
Total Females 24,244 45,085 36.2 39.2
fetal Rural Population 49,473 88,878 77.8 77.2
Total Urban Population 14,075 26,212 21.2 22.8
2. Paper 1-107J. Andamixu and Nioobai Population Census.
S o u rce Census Report, 1961
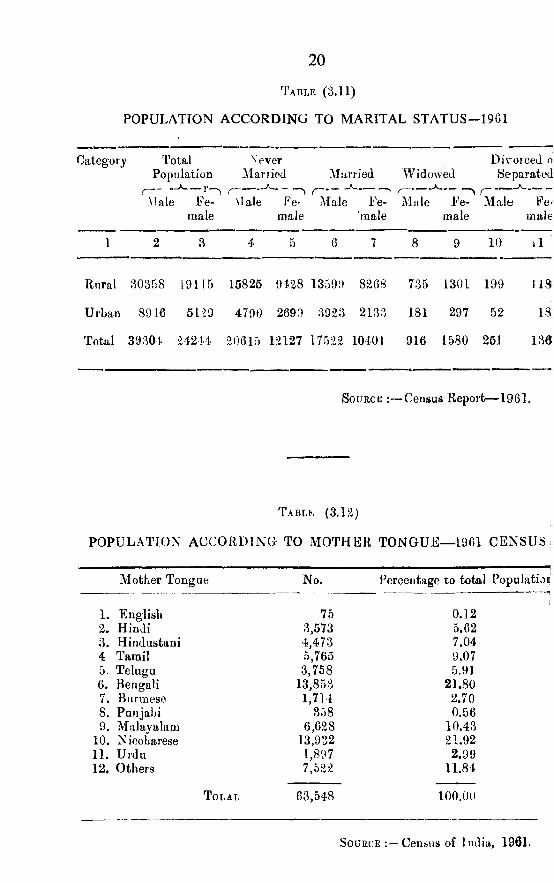
POPULATION A C CO RD IN G TO M ARITAL S T A T U S -1961
20
T able (3 .11 )
Category TotalPopulation
\'everMarried
A.
Married WidowedA _ _
Div^oreed o Separated
A _
Male Female
(
\Iale Female
^ _^Male Fe-
’raaleMale
-----------------------N
Female
Male Female
1 2 3 4 5 6 7 8 9 10 i l
Rural 30358 19115 15825 9428 13591) 8268 735 1301 199 113
Urban 89 16 51 >9 4790 2693 3923 2133 181 297 52 18
Total 39304 :H2t4 20615 12127 17522 10401 916 1580 251 136
S ource -Census Report— 1961.
T ablk (3.12)
POPULATION A C C O R D IN G TO M OTHER TONGU E— 1961 CENSUS
Mother Tongue No. Percentage to total Populatioi
1. English 75 0.122. Hindi 3,573 5.623. Hindustani 4,473 7.044 Tamil 5,765 9.075. Telugu 3,758 5.916. Bengali 13,853 21.807. Burmese 1,714 2.708. Punjabi 358 0.569. Malayalam 6,628 10.43
10. Nioobarese 13,932 21.9211. Urdu 1,897 2.9912. Others 7,522 11.84
T o la l 63,548 lOO.OO
SoUECE Census of India., 1961.

POPULATION ACCO RD IN G TO R E L IG IO N — 1951 & 1061
21
T a b l e (3.13)
Religion Alalb Female Total I’erceutage of total population
Hindus 1961 21,021 11,760 32,781 51.61951 6,138 3,165 0,294 30.0
Gbristiaos 1961 11,225 6,748 17.973 28.31 1051 6,090 3,404 0,494 30.7Muslims 1961 4,155 3,243 7,398 11.6
1051 2,874 1,900 4,783 15.4BudhistK 1961 976 731 1,707 2.7
1951 982 622 1,604 5.2Sikhs 1961 145 06 241 0.4
1951 80 37 126 0.4Jaius 1961 3 __ 3 N
1961 I -- 1 NOthers 1961 1,7 79 1,666 3,4 i5 5.4
1951 2,881 2,785 5,669 18.3
T o t a l 1961 39,304 24,244 63,548 lOO.O1951 10,055 11,061 30,971 100.0
N =N egligibleS o u r c e : Ceusus Repoit, 19G1.
T a b l e ( 3 .1 4 )
G R O W TH OF R E L IG IO U S C O M M U N ITIE S
•1961 1951 Percentaj^e increase
1961-1051
Total population 63,548 30,071 105.19Hindus 32,781 0,204 252.71Cbriatians 17,073 9,494 89.31Muslims 7,308 4,783 54.67Budbists 1,707 1,604 6.42Sikhs 241 126 01.27 .Jains 3 1 200.00Others 3,445 6,660 ( — )30.23
S o u r c e : Census of India, 1961.
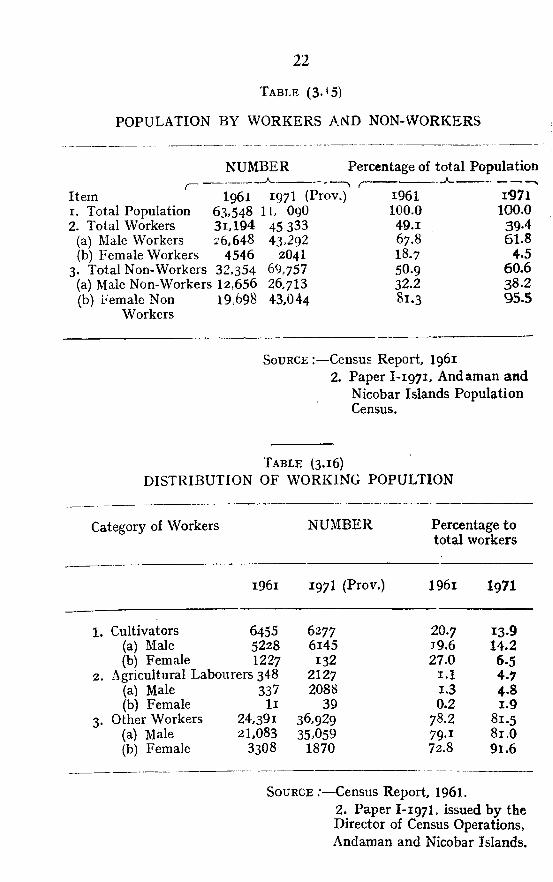
POPULATION BY WORKERS NON-WORKERS
22
T a b l e ( 3 . '5 )
NUMBER______A----
Item1. Total Population2. Total Workers
(a) Male Workers(b) Female Workers
3. Total Non-Workers(a) Male Non-Workers(b) b'emale Non
Workers
Percentage of total Population
1961 197I (Prov.) 1961 r97l63.548 IL O9O 100.0 100.031,194 45333 49.1 39-426,648 43.292 67.8 61.8
4546 2O4I 18.7 4.532.354 69,757 50.9 60.612,656 26,713 32.2 38.219,698 43,044 81.3 95.5
S o u r c e :—Census Report, I9612. Paper I-1971, Andaman and
Nicobar Islands Population Census.
T a b l e (3 .16 )
DISTRIBUTION OF WORKING POPULTION
Category of Workers NUMBER
i 96i 197I (Prov.)
Percentage to total workers
196i 1971
1 . Cultivators 6455 6277 20.7 13-9(a) Male 5228 6i45 J9.6 14.2(b) Female 1227 132 27.0 6.5
2 . Agricultural Labourers 348 2127 i . l 4-7(a) Male 337 2088 1.3 4.8(b) Female l i 39 0.2 1.9
3- Other Workers 24,391 36.929 78.2 81.5(a) Male 21,083 35.059 79.1 81.0(b) Female 33O8 1870 72.8 91.6
S o u r c e ;—Census Report, 1961.2. Paper I-197I. issued by the Director of Census Operations, Andaman and Nicobar Islands.

T a b le (3.17)
:AREA a n d p o p u la t i o n o f p o r t BLAIR TOWN-1971 CENSUS
23
Item Unit 1971
Area Sq. Mile 3-04Sq. Km. 7.87
♦Population No. 2 6 ,2 12(i) Male No. 16,842(ii) Female No. 9370
Females per 1000 Males No. 556Density No. per 8,622
Sq. Mile
♦ProvisionalS o u r c e :— Paper I -I971 Census
issued by the Director of Census Operations, Andaman and Nicobar Islands.
T a b l e (3 .I8)
REGION— WISE NO. OF INHABITED VILLAGES— 1961 CENSUS
Islands Villages (No.)
Andaman and Nicobar IslandsA. Andaman Islands
(i) North Andaman Islands (ii) Middle Andaman Islands
(iii) South Andaman Islands(iv) Little Andaman Island
B. Nicobar Islands
39924236
103102
I
15 7
Source :~Census Report, i961.
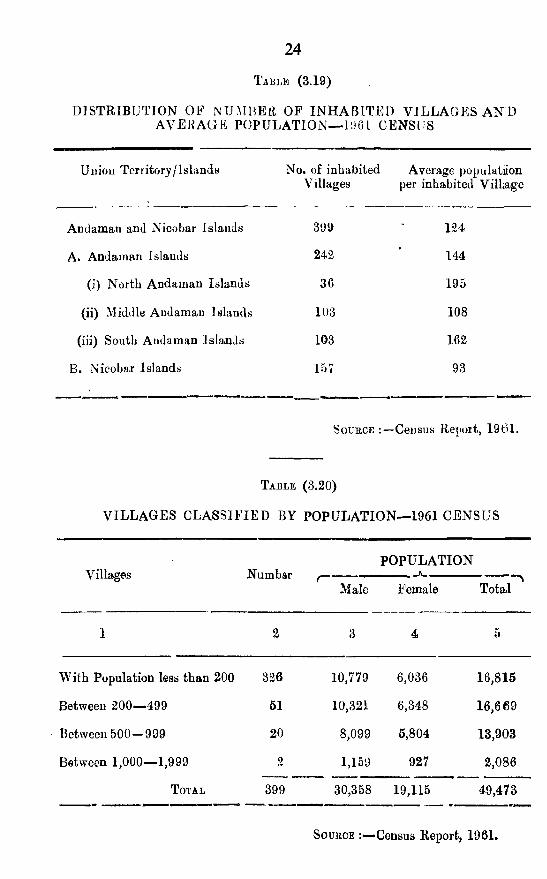
D ISTRIBU TIO N OP xNUMBEtl OF IN H A B IT E D V IL L A G E S A N D A V E R A G E PO PU LATIO N — Ii)6L CENSUS
24
T able (3.19)
Union Territory/Islands No. of inhabited Average populatiion Villages per inhabited Villsage
Andaman and Nicohar Islands 399' 134
A. Andaman Islands 243•
144
(i) North Andaman Islands 36 195
(ii) Middle Andaman Islands 103 108
(iii) South Andaman Islands 103 162
B. Nicobar Islands 157 93
S o u r c e Census Report, 1961.
T a b l e (3.20)
V ILL A G E S C LASSIFIED BY PO PU LATIO N — 1961 CENSUS
PO PU LATIO N
Male Female T o ta l
1 2 3 4 5
W ith Population less than 200 326 10,779 6,036 16,815
Between 2 00— 499 51 10,321 6,348 16,669
Between 500— 999 20 8,099 5,804 13,903
Between 1,000— 1,999 2 1,159 927 2,086
T otal 399 30,358 19,115 49,473
S ource ;— Census Report, 1961,

TEHSIL-WISE POPULATION OF ANDAMAN AND NICOBAR ISLANDS— ia71 CENSUS (PROVISIONAL FIGURES)
25
T able (3.21)
Tehsil POPULATION_______ A---------
Male Female Total
1, Diglipur 5381 4190 9471
2, Mayabunder 4946 3497 8443
3. Rangat 9296 5868 15164
4. South Andaman 38334 22009 60343
5. Car Nicobar 7099 6405 13504
6. Nancowrie 5049 3116 8165
T otal 70005 45085 116090
S ource Paper I— 1971, issued by Director ofCensus Operations,Andaman and Nicobar Islands.


S E C T I o N—4
A G R I C U L T U R E

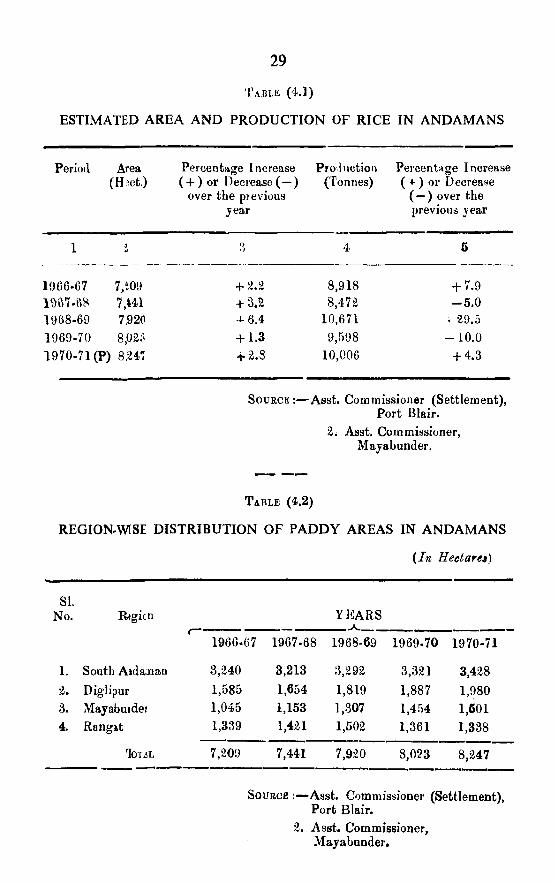
ESTIMATED A R E A A N D PROD UCTION OF RICE IN A N D AM A N S
29
T a b l e (4J)
Period Area Percentage Increase (H^ot.) ( + ) or Decrease ( —)
over the previous ^ear
Production Percentage Increase (Tonnes) ( 4- ) or Decrease
( “ ) over the previous j ear
1966-67 7,i0910G7-6^ 7,4413968-69 7.9201969-70 8,02?1970-71 (P) 8,247
+ 2.2 + 3.2 -1-6.4 + 1.3 i* 2.8
8,9188,472
10,6719,598
10,006
+ 7.9 - 5 . 0
; 29.5 - 10.0
+ 4.3
S o u rc e :— Asst. Commissioner (Settlement), Port Blair.
2. Asst. Commissioner, Mayabunder.
T able (4.2)
REGION-WISE DISTRIBUTION OF PA D D Y AREAS IN A N D AM A N S
{In Hectares)
SI.No. R<gicn YEARS
A_1966-67 1967-68 1968-69 1969-70 1970-71
1. South Aidaatian 3,240 3,213 3,292 3,321 3,4282. Diglipur 1,585 1,654 1,819 1,887 1,9803. Mayabuidei 1,045 1,153 1,307 1,454 1,5014. Rangat 1,339 1,421 1,502 1,361 1,338
lOTiL 7,209 7,441 7,920 8,023 8,247
Source Asst. Commissioner (Settlement), Port Blair.
2. Asst. Commissioner,Majabunder.

T able (4.3)
LAND UTILIZATION IN ANDAMANS
30
(In Heetnresi)
SI. N o Classification of reportino aiea 1967-68 1968-69 (P) 1969-70 (P )1 0 “ 3 7 5
1. Total Geographical area2. Total rt’j)orting area
Area not available for cultivfilion4. Other ar)enltiva(ed land excluding
fallow land5. Fallow land6. Total eropj)ed aiea7. Net area sown8. Area sown more than once
8,29,203 8,>9,263 8 , ’ 9,26342,239 42,596 42,8323,304 3,070 3,065
27,040 27,207 26,6461,410 1,549 2,i:i2
10,633 11,069 11,24210,486 10,770 l(i,9(i0
147 239 273(P) =Provisional
>ouRCE :— A sst. Commissioner iSettlem ent), Pi»ri Blair.
i . Asst. Commis-sioner, Mayabunder.
I abi.k (4.4)
DISTRIBUTION OP SEEDLINGS
Item
Coconut Si-Mdlini's Arecanut >eeillinos Vegetables SfvdHnus Fruit Plants mclnding Ornamental Seedlings Cashewi ut Seedlinys
(In Nos.)1966-67 1967-68 1968-69 1969-70 1970-71
2 3 4 0 6
18,294 10,623 34,865 9,204 21,37873,73!) 33,530 ;’,fc,;)75 52,600 l,3(),:i0094,929 140,647 1,43,317 1,5 i,6 13 l,L s ,il9
Suckers 11,431 2,255 6,211 10,830 52,918- I7,0>8 1.83,800 5,875 1,990
16,500 — 18,842 — 448
S o u r c e Director o f Agiiculture,Andaman and Nicobar I.-.lands.
T able (4.5)
DISTRIBUTION OF .MANIM^ES AND FERTILISERS
Variety 1966-67 1967-68 1968-69 1969-70 1970-71
1 .) 3 4 5 6
Nitrogenous 24 I 53 49 4 7Phosphatic 25 1 25 16 36Potassic — — — 4 1Compost 210 345 608 1,426 1,423
S o u r c e Pirector of Ajiricultiiif,Andaman and Nicobar Islands

T a r i.e (4 .())
D ISTR IB U TIO N OF PP]STICIOKS
31
Item Unit, 19(56.07 1967-68 19«S.6i) 1960-70 1070-71
Pesticides Tonnes 1: 11 16 20 :i6Pesticides Li(juid Litres iU)6 4;10 005 500 1002
SouiicF,: - Director of Agriculture,Andaman and Nicnhar Islands’.
T sble (4 7)
AREA UNDER IM PROVED M ETH O D OF PA D D Y CULTIVATIO N, PLANT PROTECTION A N D DEM O N STRATIO N TRIALS LA ID
I tom Unit 10o6-67 1067.08 1968.60 1969-70 1970-7:
Area under improved merho(i o f |)addy cultivation i 1 ect. 241 1,656 810 1,366 1,500Area, under Plant Protection Hect. 878 920 1,392 1 140 2,762Demfmstration Trials Laid No. 380 00 37 41 188
SouiiCE :— Director of Agiiculture,Andaman and Nicobar Islands,
T a b l e (4.8)
DISTRIBUTION OF SEEDS
Varif'fv Unit lOiU) 67 19;;7.G8 1968-60 1069-70 1970-71
Paddy Seeds Tonne 24 8:\ l]2 37 03Vegetable s Seeds Kg. 334 427 oO.') 211 951
S o u r c e Director of Agriculture,Andaman and Nicobar Islands


S E C T I O N - 5
LIVE-STOCK AND FISHERIES


NO. OF LIVE-STOCK A N D POULTRY
35
T able (5.1)
Live- No. of Live-StockStock f------------------------------------------------------- --------------- -----------------------------------------^
betsus Cattle Buffaloes Sheep Goats Horses Pigs etc. Total Live- Poultryand Stock
poju'es
L956 4,850 0,105 3; 3,6(33 17 14,449 28,617 57,040
1901 7,?,88 8,357 36 8,615 5 14,216 3S,617 • 76,655
1966 ' 10,131 8,078 26 10,131 5 21,314 49,685 98,659
S o u r c e Deputy Commissioner,Andaman and Nicobar Islands.

T able (5.2)
LIVE-STOCK CENSUS 1961 A N D 1966
36
SI. No. Item 1961 1966
1. Cattle :—(a) Male over 3 years :—
(i) Used for breeding only (ii) Used for breeding and work both
(iii) Used for work only (vi) Others
TO TAL(b) Female over 3 years :—
(i) Breeding :—(a) In Milk(b) Dry and. not calved even once
(ii) W orking(iii) Others
TOTAL(c) Young Stock
TO TA L CATTLE2. Bnffaloes : —
(a) Male over 3 years: —(i) Used for breeding only
(ii) Used for breeding and work both(iii) U sed for work only(iv) Others
TO TAL(b) Female over 3 years :—
(i) Breeding :—(a) In milk(b) Dry and not calved even once
(ii) W orking(iii) Others
(c) Young Stock
3. Sheep4. Goats5. Horses and Ponies6. Other Live-Stocki. Total Live-Stock S. Poultry9. Ploughs
10. Carts11. Sugar cane crushers12. Oil Engines13. Electric Pumps14. Ghanies
TO TAL
TO TAL BUFFALOES
36 '29243 178
1,650 2,720284 63
2,212 2,990
1,984 1,754796 1,424
38 12144 9
2,862 3,1992,314 3,9427,388 10,131
7 14378 454
3,341 3,59353 —
4,779 4,061
679 1,0011,320 1,034
51 5634 6
2,084 2,0961,494 1,9218,357 8,078
36 268,615 10,131
5 514,216 21,31438,617 49,68576,655 98,669
3,010 3,57452 12012 101
3 201 —
5 5
SouECB Deputy Commissioner,Andaman and Nicobar Islands,

T a b l e (5.3)
V E T E R IN A R Y F A C IL IT IE S
37
Veteriu&ry Hospitals Veterinary Dispensaries Veterinary Surgeons Animals treated Castrations done Inoculations done
1966
541,215
459
YEARS
1967
145
43,5851,100
1968 1969
147
49,616999
157
58,8501,001
1970
156
6£,7142,236
SouR(3R :— Live'Stock Ofiicer,Andaman anil ^.icobar Lslands.
T a b le (5 .4)
VETERINARY HOSPITALS, DISPENSARIES AND OUT POSTS AS ON 31ST MARCH, 1971
Naturi of facilities Place Year of inception
A. HosfitalB. Dispensaries
Souti Andaman Middle Andaman Norti Andaman Nicobar Group
C. Outpsts Souti Andaman
Middle Andaman
Norti Andaman
Nicobar Group
Junglighat
(i) Wimberlygunj (ii) Rangat 0 Diglipur
(ii) Car Nicobar (ii) Nancowrie (Kamorta)
(i) Port Mout(ii) Tusnabad
(iii) Garactiarama(iv) Manglutan(v) Baratang
(vi) Havelock (vii) Neil
(i) Betapur(ii) Kadamtala
(iii) Bakultala(i) Mayabunder (Webi)
(ii) Kalara (Kalighat)(iii) Milangram(i) Teressa
(ii) Katchal(iii) Campbell-Bay
1968
19481955 1958 19651968
19471948 1«681958 1964 1952 1970195919591962195619601963 1967 19671969
ISoLiiCE : Live-btook Oflieer,A?ulamTn and Nicobar Islantb.

Tabi.e (5.5)
VETERINARY CASES TREATED IN SELECTED AREAS
(No. )
Period Rangat Mayabunder Diglipur Kadamtala Kaiara
38
1966-67 7,274 1,461 5,843 1,714 1,95»
1967-68 3,992 1,656 5,400 1,975 1,980
1968-69 7,349 1 952 7,215 1,866 3,054
1969-70 9,170 2,032 8,946 1,984 2,004
1970-71 8,056 1,962 4,737 L874 1,826
Source .-L ive-Stock Officer.Andaman and Nicobar Islands,

Name of fish
SPECIE-WISE FISH LANDING IN ANDAMAN AND NICOBAR ISLANDS-J970
T a b l e ( - ) . t i )
{in Kgs.)Jan. Feb. March April May June July Aug Sept. Oct. Nov. Dec. Total
1
SardinesAnchoviesBarracudaBeaked fishCarnexSeer fishMulletsOther PerchesSea PerchesShark and RayMackerelSilver BelliesTunnyCat fishPrawnsDorabGar fishDorosomaPomfretsHilsaMiscellaneous
TOTAL
9 10 11 12 1384753270710580
5540875
436542304830192512352100
535330
1270430
340350
42102130375520
62052170359039454265101514651370560410670230
470260
38803130430430
5355327063454265463516452465” 170230630875460
215650
344633951487116434816304272310733V731629271517591140938541785331
1331315
403432641623125235494920261311953678124117202105117010411135903215245318
3015401013001098423252292783273042102175234331006001021875
1450160162372
413532601025335
537032007345235052102135735
4210340630715
3115
795560
311042701230410
630021056370133042101I5:>13301360415230350705
420340
325039701275215
43652360536012704»70107012.303205
320315325950
430245
3155 3551 1326 927
3679 701:) 361(- 440
396S 2133 2579 2146 1170 1431 853 593
1497526
2150 1645 1945 2812 3085 4210 3415 2160 3370 2225
2820323411211298380068603461
41232085265824431220139311651165370
1655390403
2276
3096323711401387378469153776
37942307240523791270130111581664395
1410423268
2679
14
4162640721130429616
5566051218523412282851591205102288028347
897096709932
12450147189704749
67032272
VO
38540 35505 43025 41142 39306 45100 48880 37795 38395 43119 43939 44784 499534
SOURCE :— Fisheries Development Officer, Andaman and Nicobar Islands.

40
T a b l e (5.7)
QUANTITY AND VALUE OF FISH LANDED INNICOBAR ISLANDS
ANDAMAN AND
Period Quantity (Tonnes) Value (Rs,)
1968 341 6,13,8001969 412 7,94,3361970 500 9,23,936January 1970 39 71,19»9February „ 36 65,675March „ 43 79,587April 41 76,109May 39 72,705June „ 45 83,435July 49 90,428August „ 38 69,911September ,, 38 71,021October „ 43 79,753November „ 44 81,270December „ 45 82,843
Sou«c£ : Fisheries Development Officer, Andaman and Nicobar Islands.

CATCH IN RELATION TO FISHING GROUNDS IN ANDAMAN AND NICOBAR ISLANDS— 1970(in Kgs.)
T able (5.8)
Fishing Ground1
Jan. Feb. Mar. April May June .... 76 8
Dundas Point 1410Aberdeen Jetty 1605North Bay 825Ross Island 1410Carbynscove 740Madhuban 1450Rangachang 655Neil Island 1130Haddo 905Phoenix Bay 1015Kalapahar 1025Saithan Khari 610Balughat 1105Port Mout 865Junglighat 1T45Wright Myo 440Panighat 865Shoal Bay 630Rangat (Area) 6905Mayabunder (Area) 3005Diglipur (Area) 8090Car Nicobar (Area) 1615Nancowrie 495Campbell Bay ____ -
Total 3854
11301030850
1315850
1030650
104110101045845635740800
1080555705540
7450294071001805359
12051625940
1790906
1920965
184012651210905755905857
1430385605870
7837381089051690405
164010001681406810001876810
18001200760760800
1063800960300200970
6860278975891720496
13301505845
1860790
19101240965
14451420980940965840
16001121625845
6330286465451860481
14101620965
1610835
18551448895960
12101405975
1250885
22501080515705
7273389398451705511
16501785905
1650945
198015051615121015051485122513301075246512451195960
7821397489801945430
August Sept. Oct. Nov. Dec. Total
9 10 11 12 13 14
1205 1385 1343 1235 1310 162531360 1210 1696 1640 1605 176S1890 860 984 972 940 11657985 1210 1472 1597 1015 19982860 710 943 875 905 10359
1050 1540 1668 1532 1590 19401955 1060 1269 1295 1305 13157
1060 1205 1120 1270 1295 142361165 1005 980 1005 1290 134401095 1210 1054 1110 1230 138641040 1085 1.SP9 1295 1260 13484755 695 892 795 1510 10587
1040 770 793 807 905 11673675 555 869 970 880 10071
2080 2310 2185 2408 2515 23028581 536 988 870 865 8966620 840 1995 1640 1590 11095
460 692 537 645 78546988 7080 7835 6345 8210 869343851 2815 2964 3073 3192 391708120 8090 8790 10095 8270 1004191030 1130 1240 1680 1820 20240390 415 — 488 , 398 4868
219 248 405 243 1115
35505 43025 41142 39306 45100 48880 37795 38395 43U9 43939 44788 499534
SouRCK : Fisheries Development Officer, A iirla n ifln nnH Nicobar Islands.

FISH LANDING ACCORDING TO GEARS USED IN ANDAMAN AND NICOBAR ISLANDS- 1970
(In Kgs.)
T a b l e (5.9)
Name Jan. Feb. March Apfil May June July Aug. Sept. Oct. Nov. Dec. Total
1 2 3 4 5 6 7 8 9 10 11 12 13 14
Hook and Line 14210 12085 15265 15465 14402 16720 17695 14515 15340 15556 15390 17032 183675Shoreseine Net 8030 8005 7410 5857 7934 9193 7550 7540 6915 8601 9780 8605 9M20Trawl Net 3625 2860 5350 3189 3721 -''149 5040 3395 3605 5520 4130 — 44584Cast Net 3710 3685 3583 2781 3806 4046 5115 3805 3010 3738 4158 5206 46643Drag Net ’1145 1265 1420 3146 1337 2602 2905 1190 1030 1040 1130 4705 22915Gill Net 7205 6960 9636 8764 7111 7390 8805 6575 7860 8664 8986 8984 96940Stake Net 410 380 — — 648 514 860 460 635 — — — 3907Harpoon, Traps, Dhava 205 265 361 1940 347 486 910 315 — — 365 256 5450
and Light Fishing
TOTAL 38540 35505 43025 41142 39306 45100 48880 37795 38395 43119 43939 4 4788 499534
4N)
Souu( K : Fiislieries Development Officer, Aiiilamati and X ieoba r Islands.
43
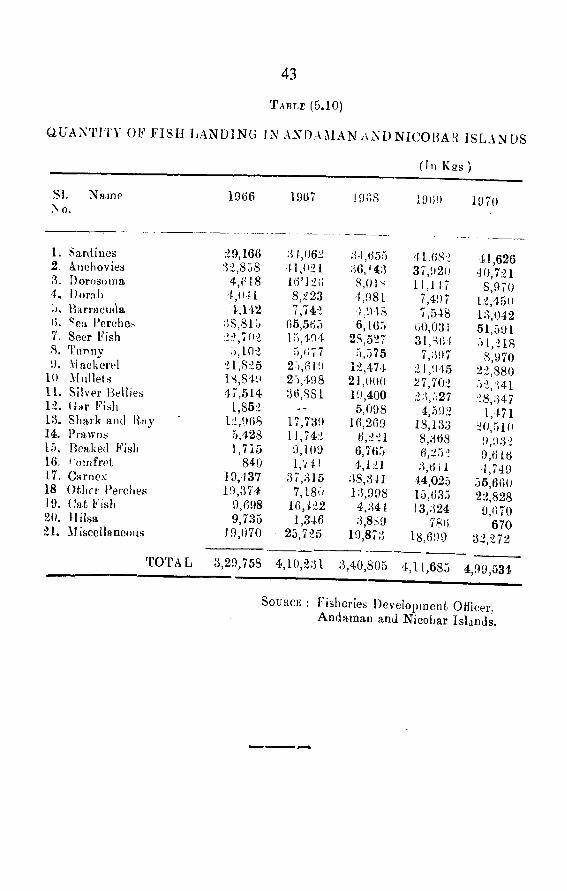
T a b l e (5.10)
a U A X T IT Y OF FISH IjANDINCi IN A -X D A llA N ,i.\D N IC O IiA B ISLAN DS
SI. Name No.
1. Sardines2. Anchovies3. Dorosonia4. Dorat)o. Barraciula
Sea Perches 7. Seer Fish5. Tiinny9. Viackerel
10 Mullets11. Silver Bellies1 2 . ( i a r Fish
13, Shark and liny14, Prawnsl>'). Beaked Fish16. t'omfret17. Carnex18. Other Perches19. Cat Fish20. Milsa21. Miscellaneous
1966
29,166 S:>,S58
4,(‘ 18 4,(11 L 4,142
;iS,8U. ;2:?,70:>
5,102 21,825 lS,84i> 47,514
1,852 12,968
5,428 1,715
840 19,137 19,374
9,698 9,735
19,070
1967
41,021l(Vi2(;8,223'7,742
()5,56515,4945,(177
2:>,61925,498:J6,8S1
17,739 11,742 9,109 I,V41
37,: 15 7,180
16,422 1,346
25,725
(III 1<2S \)
1968 19 69 1970
34,655 41.682 41,62636,143 37,'.I20 40,7218,0 IS 11,147 8,9704,981 7,497 12,450
7,548 13,042i6 ,165 (H),031 51,59128,527 31,'^6 4 51,218
5,575 7,397 8,97012,474 2 1,1)45 22,88021,000 27,702 52,34119,400 23,527 28,3475,098 4,592 1,471
16,269 18,133 20,5106,221 8,368 9,9326,765 6,25 ’ 9,6164,121 3,6 i 1 4,749
38,341 44,025 56,66013,998 15,635 22,8284,344 13,324 9,6703,8^9 781) 670
19,873 18,699 32,372
TO TAL 3,29,758 4,10,231 3,40,805 4,11,685 4,99,534
S ource Fisheries Development Officer. Andarnau and Nicobar Islands.

S E C T I O N - 6
FORESTS


A R E A U N D ER FO R E ST S-1970 .71
47
T able (,6.1)
{In Ktns.)
SI. No. Item Particulars
1 2 3
1- Total Area of Andaman and Nicobar Islands 2. Forest area under Forest Administration •
8,293 ' 7,468
SouKCE : Chief Conservator of Forests, Andaman and Nicobar Islands.
T a b l e ( 6 .2 )
R A ISIN G OF IN D U ST R IA L [PLANTATIONS
(I n Hect.)Year Match Wood Teak Wood
A A
fadauk ^ ..... ..........— — .r • - — r- — — ^
Target Achievement Target Achievement 'rarget Achievement1966-671967-681968-691969-701970-71
10 — 507 607 6 — 357 452
20 20 405 405 2U 20 425 439 16 18 435 4.23
406140
405144
SOURCE ;—-Chief Conservator of Forests, Andaman and Nicobar Islands.
T a b l e (6.3)O U TTU RN OF FOREST PROD UCE
Na.ture of Produce 1966-67 67-68 68-69 69-70 70-71
M AJOil PRODUCE (ii Timber in Cu. Metre 86,885 85,608 81,299 fii) Firewood in Cu. Metre 65,306 41,163 33,836
(iii) Charcoal in Tonnes 45 50 55
87,14432,950
60
82,2905,47,088
24
Total value (in Lakhs of Rs.) 66.51 73.20 109.31 117.08 106.74
MINOR PRODUCE (V A L U E IN LA K H S OF RS.)(i) Bamboo and Canes 0.60 1.41 13.50(ii) Others 0.81 4.68 —
13.55 1.74 1 .07
Total Value 1.41 6.09 13.50 13.55 12.81
SOURCE :— Chief Conservator of Forests,Andaman and Nicobar Islandss.

IN TA K E AND OU TTURN OF CH A TH A M SAW M IL L _________ ( In Cum)
48
T a b l e (6.4)
Year/Month
is e a - io\ 9 io .n
’ AaJ-
Sevt.Oct.
^ o v .Dec.3aO-■Feb.
^larcb.
707070707070707071 71 71
Intake Outturn W astageSquares Scantlings Total Percentag©
and others
33793 582* 14960 15532 5432538 36 13332 13368 5933261 24 15660 15684 5831217 23 15423 15446 5130152 143 14632 14775 49
2226 IS 1013 1031 542074 5 992 997 5 12396 — 1182 1182 512675 16 1837 1353 502654 13 1409 1422 672596 ---- 1377 1377 472488 I 1255 1256 502429 19 1119 1188 542673 18 1180 1198 562581 12 1191 1203 542306 17 1091 1108 523054 24 1486 1510 51
*Inchiding others. SOURCK : — Chief Conservator of Forests, Andaman and Nieobar Islands..
Table (3.5)
EXPORT OF TIM BER BY FO RLST DEPARTM ENT(In Tons)
SI. No. Year Logs Sawn Timber Total
1. 1966.67 8,695 6,587 15,2822. 1967-68 10,600 6,982 17,582i ! 196S-69 18,977 7,258 26,2354. 1969-70 18,423 3,586 22,0095. 1970.71 13,609 3,015 16,624
S ource :— Chief Conservator of Forest.s,Andaman and Nieobar Islands.

R E V E N U E AND E X I’ E N D ITU RE OF b’ ORKST D E PARTM EN T
(In Rs.)
49
T able (6.6)
Year Revenue E XPE N D ITU Rb] Deficit ( r - )
Ordinary Capilal Total Surplns(4-)
^066-67 1,03,93,938 1,33,67,396 90,646 1,34,48,042 ( - ) 30,64,104
^967-63 1,21,91,694 1,31,68,072 1,15,355 1,32,83,427 ( - ) 10,91,733
i')68.60 l,il,61,877 1,48,11,360 80,630 1,48,91,986 ( - ) 7,30,109
1969-70 1,31,55,083 1,49,24,528 4,13,460 1,53,37,988 ( - ) 21,82,906
1970-71 1,67,49,400 1,63,73,800 63,700 1,64,37,500 (-+) 3,11,900
S o u r c e Chief Conservator of Forests, Andaman and Nieobar Islands


S E C T 1 O N— 7
EDUCATION


L i rERACY IN A N D A M A N AND NIGORAR IS L A N D !
(1071 (Jensus— Provisional figures)
53
T a b le (7 1)
Item Particulars
Total Population Literates:—
(i) Male(ii) Female
Literacy Percentage
(i) Male(ii) Female
Total
Total
lAo,090
36,07913,957
50,036 i»] .54 S0.96
13.48
S o u r c e 'Paper 1. of 1971, Census of India, 1971.
T a b le (7 .2)
S E X -W IS E E D U C A TIO N B Y S T A N D A R D S— 1961 CENSUS
Male Female Total
Population 39,304 24,344 63,518
Illiterates 22,629 19,547 42,176
Literates —
Without Educational Level 8,^95 2,413 11,108
Piimary or Junior Basie 6,381 2,035 8,416
Matriculation and Above 1,599 249 1,848
S ource :— Census, 1961.
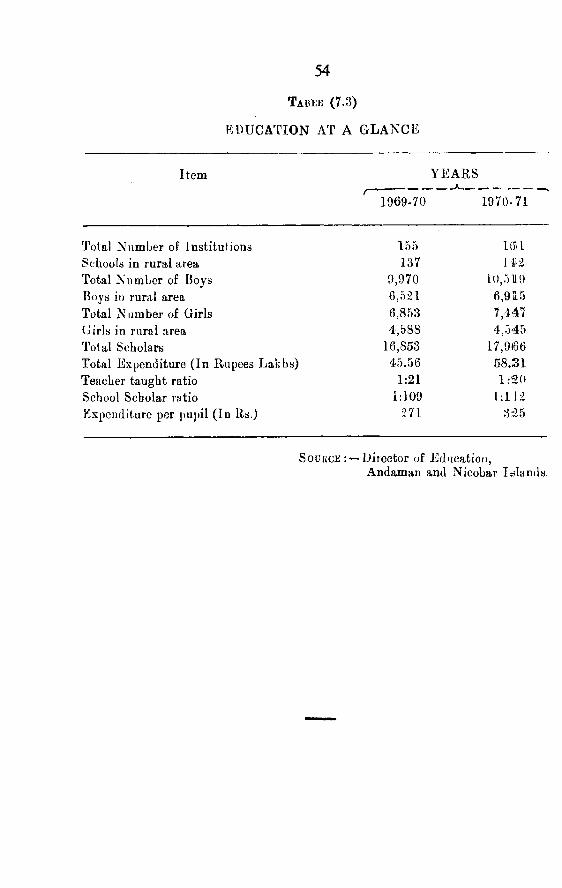
T a b e e (7.3)
EDUCATION AT A GLAN CE
54
Item YEAHS
^ 1 9 6 9 -7 0 1970-71
Total Number of Institutions 155 161LSchools in rural area 187 142Total Number of Boys 9,970 10,5119Boys in rural area 6,521 6,915Total Number of Girls 6,853 7,447(iirls in rural area 4,588 4,545Total Scholars 16,853 17,9(66Total Expenditure (In Rupees Lakhs) 45.56 58.31Teacher taught ratio 1:21 1:20School Scholar ratio 1:109 1:112Kxpenditure per pupil (In Rs.) 271 3r25
SoUKCE Director of Education,Andaman and Nicobar Islands.

ED U CATIO N AL IN STITU TIO N S W IT H R E S P E C T IV E PLACES OF LOCATION, NO. OF T E A C H E R S A N D N O. OF
SCHOLARS AS ON 3 1 -3 - I 97I
55
T a b le (7 .4 )
Location/Type of Institution
Enrolment
1. Govt. College2. T. T Sehi.ol
Name of Institution
Govt. College T. 'r School
3. Higher Secondary School
i. lliger Secondary School
5. Higher Secondary School
6. KendriyaVif'yalaya
Boys School
Girls School
It. B. Vidyalaya Kendriya Vidyalaya Port Hlair
fBovs Girls Total Teachers
N D AM AN )55 29 84 868 32 100 9
S37 — 837 39
— 795 795 42
168 119 287 17
152 124 276 22
TOTAL H. S. SCHOOLS 1,157 1,038 2,195 1207. S. B. School SBS Aberdeen 483 272 755 358. do. SBS Haddo 427 284 711 329. do. (Private) SBS Carmel 216 197 413 16
10. do. (Private) SBS Nirmala 136 158 294 10
Total S. B. Schools 1,262 911 2,173 93
11. J, B. School JBS Delaneypur 257 212 469 1712. do. JBS Jiinfili-hut 217 160 377 1213. do. JBS South Point 142 120 262 1114. do. J BS Dtiggonabad 113 135 248 1015. do. JBS Haddo (Telui^u) 145 103 248 816. do. JBS Middle Point 89 86 175 7
Total J. B. Schools , 963 816 1,779 6517. Pre-Primary
School PPS Aberdeen 45 35 80 218. do. (Private) PPS Tunnu Muuu School 54 41 95 3
Total Pre-Primary Schools 99 76 175 5
19. Govt. College Govt. College 55 29 84 820. T . T. School T. T. School 68 32 100 93L Fligher Secondary
Schools22. S. B. Schools23. J. B. Schools24. Pre-Primary
Schools
Higher Sec. Schools S. B. Schools J. B. Schools
Pre-Primar} Schools
Total
1,1571,262
963
99
3,604
1,03891181.6
76
2,902
2,1952,1731,779
175
6,6<)6
1209365
5
300

56
1 2 3. 4 5 6
SOUTH ANDAM AN (R U R A L )
19. Hi’o-her Secondary HSSSchool Wimberlyj^unj 274 127 401 18
Total HSS 274 127 401 18
20. Senior Basic School SBS School Line 266 203 469 2021. do. SBS Chouldari 167 102 269 1522. do. SBS Garacharama 120 124 244 1325. do. SBS Havelock-'^ 105 81 186 1224. do. SBS Neil Island 138 47 185 1025. do. SBS Ograbraj 118 46 164 1026. do. SBS Oralkatcha 63 29 92 7
Total S B Schools 977 632 1609 87
27. Jiwior Basic School JBS Kanyapurara 188. J35 323 1428. do. JBS Barnbooflat
Head(]uarters 141 116 257 929. da'. JBS Mannarghat 85 56 141 830.- do. JBS Protherapore 67 88 155 731. do. JBS H.Flat
( Maljalam) 76 56 132 r-i;i2. do. JBS Namunaghar 56 56 112 638. do. JBS Ferrargunj 65 40 105 6U . do. JBS Mangluton 54 34 88 535. do. JBS Caddlegunj 53 54 107 436. do. JBS Hut Bay 64 44 lOS 437. do. JBS Jarva Creek 43 34 77 438. do. JBS Wandoor 43 32 75 439. do. JBS Calicut 39 25 64 440. do. JBS Mathura 25 36 61 441. do. JBS Tusnabad 33 43 76 342. do. JBS South Creak 41 30 71 343. do. JBS Man pur 32 32 64 344. do. JBS Sippighat 43 21 64 345. do. JBS Herbertabad 21) 33 62 346. do. JBS Guptapara 32 26 58 347. do. JBS Dollygunj 25 29 54 348. do. JBS Rangachang 39 28 57 349. do. JBS Mithakhari 26 21 47 350. do. JBS Bidnabad 22 24 46 351. do. JBS Birchguni 27 18 45 352. do. JBS Flat Bay 19 15 34 3
Sub-Total JB Schools 1357 1126 2483 122

57
53. 64. 5 5.56.57. 5S. 5'9. G'O. 61. 62. 6 3.
Juninr Basic School do. do. do. do. do. do. do. do. do. do.
JBS Havelock-6 JBS Hobdeypur .TBS IIavelook-7 JBS SlioaIhay-12 JBS Mile Tilak JBS Khatakliari JBS New Waudoor J BS Hope Town JBS Shoalbay-14 JBS Chidijatapu JBS Shoalbay-19
Sub-Total JB Schools
Grand Total
26 56 226 24 50 216 19 35 217 7 24 2
8 16 24 215 14 29 112 15 27 111 l?> 24 16 10 16 16 10 16 16 5 11 1
141) 146 312 16
1506 12b9 2795 138
t o t a l s o u t h A N D AM A N (R U R A L )1. Higher Secoudarv Schools 274 127 401 182. Senior Basic Schools 977 632 1609 87
Junior Basic Schools 1506 1289 2795 138
Sub-Total South Aiidaman .Rural) 2757 2048 4805 243
TOTAL SOUTH AN D AM AN (H Q + R U R A L )1. Pre-Primary Schools 99 76 176 52. Jurior Basic Schools 2469 2105 4574 2033* Senior Basic Schools 2239 1543 3782 1804. Higher Secondary Schools 1431 1165 2596 137
Sub-Total HQ-}-Rural 6238 4889 H U 7 525
Government College 55 29 84 8Teachei’s L’rainiug School 68 32 100 9
Cirand Total South Andaman 6361 4950 11,311 542
M ID D L E AND AM AN S
SI. Type of School Name of Enruhuent , No. of------— ______ A-------—
No. Institution Boys Oirls Total Teachers
1. Higher Secondary School HSS Rangat 220 117 337 18
2. Senior Basic Scbool SBS Billiground i l7 47 164 133*. do. SBS CFON allah 96 91 187 104. do. SBS Uttara 89 76 165 85- do. SBS Kadamtala 78 70 148 8
Total SB Schools 380 284 664 39

7. do.' 8. do.
9. do.10. do.11. do.12. do.13. do.14. do.15. do.16. do.17. do.18. do.19. do.20. do.21. do.22. do.23. do.34. do.25. do.26. do.27. do.
3
JBS Mangat JBS Long Island JBS Kalady JBS Nimbutala JBS Bakultala
JBS Padamnavvapui JBS Kausalayanagar JBS Paranshala J|-;S Jaiiiikpur JBS Dasrathpur JBS Kataidera JBS Nimbudera JBS Sabri J BS Sluiutipiir JBS Swadese Nagar JBS Bbaratpur JBS F3adamnallah J BS Laxmanpur JBS Laxiiiallah JBS Sbyamkund JBS Kalsi JBS Manspuri
58
Total Higher Secondary School Total Senior i^asic Schools Total Junior Basic Schools
Grand Total Middle Andamans
4 5 6 7
143 95 238 1 166 43 109 437 40 77 441 36 77 444 30 74 4
n 50 48 98 ;3' 53 36 89 3
31 ' 3 54 ;3:>4 50 :348 i'l 70 334 •12 6633 0 42 212 W 26 2-l\ 18 39 210 IS 37 214 18 32 110 r*
4 :Z6 115 5 20 11 1 8 19 I
C) 8 14 110 ' 2 12 18 11 19 1
739 538 1277 59
220 117 337 18380 1-84 . 664739 538 1277 59
1339 939 2278 116
N ORTH A N D AM AN S
SI. Type of School Name of School Enrolment Teachersr~-------- ----------------^
No. Bovs Girls Total
1. Hr. Sec. School HSS Diglipur 235 87 322 252. do.. HSS Mayabunder 109 36 145 2
Total HS Schools 344 123 467 34
3. Senior Basic School SBS Kalighat 44 29 73 4
• Total SB School 44 29 73 4
4. Junior Basic School JBS Subhasgram (B) 78 62 140 75. do. JBS Subhasgram (H ) 46 27 73 36. do. JBS Mayabunder 119 78 197 77. do. JBS Ramnagai’ 75 37 112 68. do. JBS Ramkrihsnagrara 73 45 115 5

59
9. do. JBS Keralapurarn10. do. .IBS llamptir11. do. JBS Pahalgaon12. do. JBS Khudirampiir13. do. JBS Madhupur I14. do. JBS Madhupur U15. do. JBS Milangram16. do. JBS Swaiajgram17. do. JBS Sitiinagar18. do. J BS Nabhagram19. do JBS De.shbaudhugram20. do. JBS Krishnapuri21. do. J BS Kishorinagar:I2. do' JBS Durgapur23. do. JBS Shyamnagar21.. do. JBS Webi25. do. JBS Cainpuri26. do. JBS Laxmipur27. do. JBS Mohanpur28. do. JBS Sliibpur29. do. JBS Tugapur No. 83U. do. JBS Karrnatang31. do. JBS Kalipur32. do JBS Radhnagar33. do. JBS Padamadurai34. do. JBS Tugapur No. 635. do J BS Tugapur No. 7 •36. do. JBS Jugnathdera37. do. JBS Paranagara38. do. JBS Tugapur No. 239. do. JBS Nishchiutapur40. do. JBS Smith Islaod41. do. (Private) Sumoti Vidya
Mandir Sitanagar42. do. (Private) Mulla School
65 51 116 532 31 61) 4U 20 (U 438 27 65 338 26 64 337 20 57 334 23 57 343 14 :>7 231 18 52 226 13 49 227 20 47 229 20 40 232 13 45 121 17 38 224 12 36 226 18 43 216 15 31 220 10 . 30 227 26 53 121 .5 30 118 10 28 113 14 37 111 14 25 118 6 24 115 3 18 1
8 9 17 113 7 20 110 6 16 19 4 13 18 6 14 15 6 11 15 r.«./ 10 1
28 28 56 125 22 47 4
1217 801 2018 94
TOTAL NORTH ANDAM ANS
Total Higher Secondary Schools 344 123 467 34
Total Senior Basic Schools 44 29 73 4
Total Junior Basic Schools 1217 801 2018 94
Grand Total North Andamans 1605 963 2058 132

60
N ICO BAR & N AN C O W H IE ISLAN D S
SI. Type of Institution Name of Institution
No.
Enrolment No. of
Boys Girls Total Teachers
1 H i g h e r Secondary'^chool HSS Car Nieobar 146 29 175
Total HSS School 146 29 175
14
14
2. Senior Basic School3. do.4. do.5. do.
NICOBAK
6. Junior Basic School7.8, 9.
10.11.12.IP,.
do.do.do.do.do.do.do.
N AN CO W IU E
14. Junior Basic School15. do.16. do.17. do.18. do.19. do.20. do.21. do.22. do.23. do.
24. do.25. do.•26. do.27. do.28. do.
Pre-Primaiy School
SBS Campbell bay 92 61 153 10SBS Mus 145 82 227 SSBS Malacca 118 68 186 8SBS Champion 57 12 69 6
Total SB Schools 412 223 635 32
JBS Tamaloo 9 i 55 .149 6JBS Biglapati 82 54 136 5JBS Kenyuka 93 35 128 5JBS Sawai 67 38 106 5JBS Arong 4.S 22 67 3JBS Teetop 29 21 50 3JBS Kiraos 27 14 41 2JBS Kakana 31 4 35 0(V
JBS Chowra 39 16 55 2JBS Kapanga 15 17 32 1JBS Pulobhabi 19 9 28 1JBS West Bay Katchal 15 11 26 1JBS Kondul 17 3 20 1JBS East Bay Katchal 12 7 19 1JBS Pilpillow 9 . 7 16 LJBS Jancin 12 2 14 1JBS Kamorta 6 8 14 1JBS Kakna(Nancovvrie) 16 2 12 1JBS Daring 6 5 11 IjB S Minyuek 4 3 7 1JBS Bengali 4 2 6 1JBS Pulomillow 4 1 5 1JBS Pulopauja 4 — 4 1
Total JB Schools 644 366 980 47
PPS NanhaA'l nnna School 12 17 29 2

Name of Enrolment No. of
61
t Institution Boys ' Girls Total Teachers
TOTAL N ICOBAR & N A N C O W R IE ISLAN DS
Total Pre-Piimary School 17 29 3Total Junior Basic Schools 644 036 980 47Total Senior Basie Schools 41: 223 635 32Total Higher Secondary School 146 29 175 14
O llA N D TOTAL OP A. & N. ISLAN DS
Total No. of Edn. Institutions 161Total No. of Boys 10519Total No. of Girls 7447
Total No of Students 17966TEACHERS
Male 59S Female:— 288
Total 886
Total Nicobar Aieas 1214 605 1819 9S

T a b le (7.5)
R E G IO N -W IS E D IS T R IB U T IO N OF E D U C A T IO N A L IN S T IT U T IO N S
1969-70 19 7 0 -7 1
Type of Institutions South Middle North Andaman Andaman Andaman
Nico-bars
Totalr~South Middle
Andman AndamanNorth
AndamanNico-bars
Total
I. Govt. College I — — —• 1 I — — — 12. Higher Secondary/
Multipurpose Schools 5 I 2 1 9 5 1 2 I 93. Senior Basic Schools 10 4 — 3 17 11 4 I 4 204. Junior Basic Schools 43 21 37 23 124 43 2 2 39 23 1275. Pre-Primary Schools 2 — — 1 3 2 — — I 36 . Junior Basic Teacher's
Training School 1 — — — 1 1 — — — I
TOrAL 62 26 39 28 155 63 27 42 29 16 1
S o u rc e :— Dixector of Education,Andaman and Nicobar Islands.
asto

T a b le (7 .6)
IN S T IT U T IO N -W IS E R E G IO N A L D IST R IB U T IO N OF SCHOLARS
SCHOLARSSouth Andaman Middle Andaman North Andaman Nicobars Grand
--------------- ----------------- ,--------------"--------------, ,----------------- ------------------ » ---------------------------, TotalType of Institution Boys Girls Total Boys Girls Total Boys Girls Total Boys Girls Total_____
Govt, College 7O 24 g4 _ _ _ _ _ — _ _ _Higher Secondary/Multipur
pose Schools 1398 1125 2523 163 75 238 431 158 589 103 34 I 87 3537Senior Basic Schools I899 1223 3i22 4CO 265 665 — — — 254 140 3g4 4181Junior Basic Schools 2526 2O76 46O2 67i 515 1186 I 1 15 723 J838 742 378 1120 8746Pre-Primary Schools 76 71 147 — — — — — — 15 16 31 178Teacher s Training School 57 30 87 — — — — — — — — — 87
TOTAL 6O26 4549 1 O575 1234 855 208g 1546 881 2427 1164 568 1732 16823
1970-71Govt, College 35 2g 84 — — — — — — — — — 84Higher Secondary/Multipur
pose Schools I431 116 5 2596 22O 1 17 ^37 344 123 467 i46 2q I 75 3575Senior Basic Schools 2239 1543 3782 38O 284 664 44 29 73 4^2 223 635 5154Junior Basic Schools 2469 2105 4574 739 538 I277 I2l7 801 2OI8 644 336 98O 8849Pre-Primary Schools 99 76 175 — — — — — — 12 17 29 2O4Teacher's Training School 68 32 100 — — — — — — — — — 100
TOTAL 6361 4950 1 1 3 II I 339 939 2278 1605 953 2558 l 2i 4 6O5 18 19 17g66
Source :— Director of Education,Andam an and Nicobar Islands.
u>
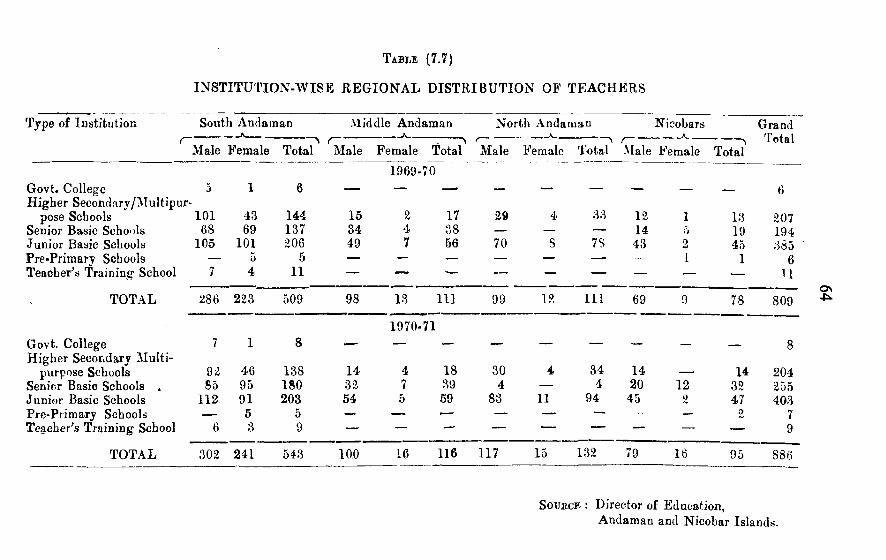
T able (7 .7 )
IN S T IT U T IO N -W IS E K E G IO N A L D IST R IB U TIO N OF TEAC H ER S
Type of Institution South Andaman Middle Andaman North Andaman Nieobars Grand.
Govt. College Higher Secondary/Multipur
pose Schools Senior Basic Schools Junior Basic Schools Pre-Primary Schools Teacher^s Training School
TOTAL
Govt. College Higher Secondary Multi
purpose Schools Senior Basic Schools , Junior Basic Schools Pre-Primary Schools Teacher^s Training School
TOTAL
-A---- ' \ f " ..... -A_ t---------- -K- f .. TotalMale Female Total Male Female Total Male Female Total Male Female Total
1969- 703 1 6 6
101 43 144 15 2 17 29 4 33 12 1 13 20768 69 137 34 4 38 — — — 14 0 19 194
105 101 206 49 7 56 70 8 7S 43 2 45 385— 5 5 — — — — — — ■— 1 1 67 4 11 — —* ---- — — — — — — 11
286 223 509 98 13 111 99 12 I l l 69 9 78 809
1970-717 1 8 •— — — — — — — — — 8
9^ 46 138 14 4 18 30 4 34 14 14 204S5 95 180 32 7 39 4 — 4 20 12 32 255
112 91 203 54 5 59 83 11 94 45 2 47 403__ 5 5 — — .— — — —• — 2 7
6 3 9 — 9
302 241 543 100 16 116 117 15 132 79 16 95 886
S oxjecE : Director of Education,Andaman and Nicobar Islands.
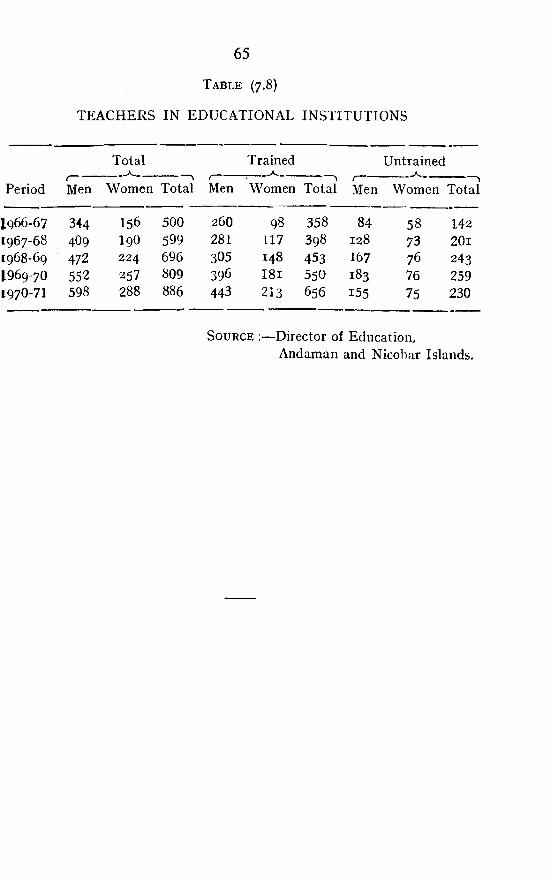
TEACHERS IN EDUCATIONAL INSTITUTIONS
65
T a b le (7 .8)
Total Trained___ A----
Untrained____ A------
Period Men Women Total Men Women Total Men Women Tota
Iq66-67 344 156 500 260 98 358 84 58 142t967-68 4O9 I9O 599 281 117 398 128 73 2O11968-69 472 224 696 305 148 453 167 76 2431969-70 552 257 809 396 I81 550 183 76 2591970-71 598 288 886 443 2 13 656 155 75 230
S o u rc e :— Director of Education,Andaman and Nicobar Islands.

T a b le (7.9)
D IS T R IB U T IO N OF IN S T IT U T IO N S, SCH O LARS A N D T E A C H E R S
Paiticulars
lg68-69 1969-70X
1970-71A
Male Female Totalf
Male Female Totalf
Male Female Total
1 . INSTITUTIONS;—
Government College 1 I I ____ 1 I — 1Higher Secondary Schools 6 I 7 8 I 9 8 1 9Senior Basic Schools 12 — i 2 17 — 17 20 — 20Junior Basic Schools 1 I 4 — 1 14 124 — 124 12 7 — 127Primary Schools 4 — 4 — — — — —Pre-Primary Schools 2 — 2 3 — 3 3 — 3Teacher's Training School 1 — I 1 —- I I — I
T otal 140 1 14 1 154 1 155 160 I 16 1
2. NO. OF SCHOLARS:—
Government College 1 1 1 2O 131 70 24 94 55 29 84Higher Secondary Schools 16 13 IO24 2 8 3 7 2145 1392 3537 2141 1434 3575Senior Basic Schools 1926 1248 3174 2553 1628 4181 3075 2O79 5154Junior Basic Schools 4847 3538 8385 5054 3692 8746 5069 378O 8849Primary Schools 2 1 5 143 358 — — — — — —Pre-Primary Schools 60 43 103 91 87 178 I l l 93 204Teacher's Training School 3 1 20 51 57 30 87 68 32 100
T otal 8803 6036 1483Q 9970 6853 16823 10519 7447 17966
On0 \
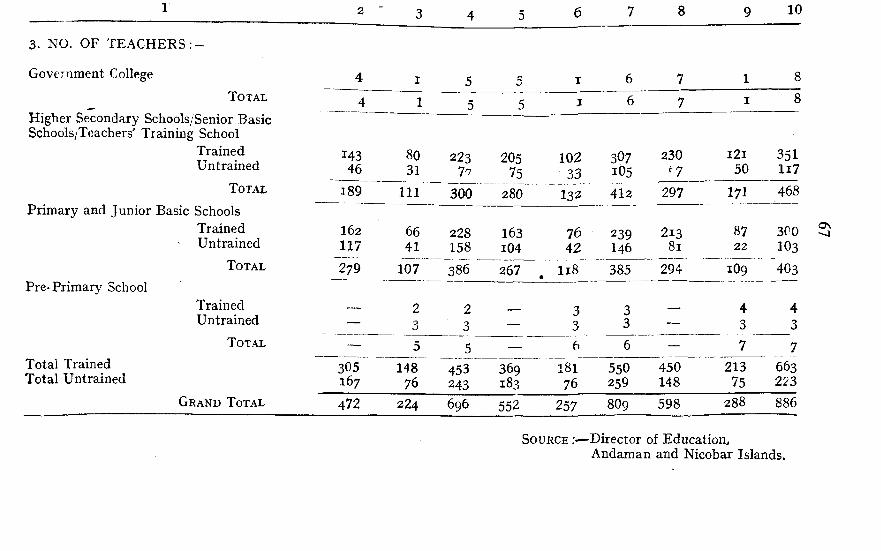
1 2 ■ 3 4 5 6 7 8 9 1 0
3. NO. OF TEACHERS
Government College4 I 5 5 I 6 7 1 8
Total 4 1 5 5 j 6 7 I 8Higher Secondary Schools/Senior Basic Schools/Teachers' Training School
Trained 143 80 223 205 102 3O7 230 i 2 i 35 1Untrained 46 31 In
_ 7 5 3 3 1 O5 i r ? 50 l i 7Total 189 111 300 280 132 412 297 173 468
Primary and Junior Basic SchoolsTrained 162 66 228 163 76 2 3 9 2 13 87 3 0 0
Untrained 117 41 158 i04 42 146 81 22 IO3Total 279” 107 386 267
. 1 1 8385 294 1 O9 4 0 3
Pre-Primary SchoolTrained __ 2 2 3 _ 4 4Untrained —
3 3—
3 3 — 3 3
Total — 5 5— 6 6 — 7 7
Total Trained 3O5 148 453 369 1 8 1 550 450 213 663Total Untrained 167 76 243 183 76 259 148 7 5 223
Grand Total 4 7 2 224 696 5 5 2 2 5 7 8O9 598 288 886
a^
Source .-— Director of Education,Andaman and Nicobar Islands.

68
Distribiitioii of Stipendiary Scholars from Andaman find Nicobar Islauds unut-i^u iiig post Matriculation Education in Educational Institutions in Mainland accordin;^
to pursuit of Study ^
T a b l e ( 7 . 1 0 )
2
^ - 6
Cj
CQ
§o
‘'Bo> *—«
*35
'A
bO
O)
' S daW
S "S2 ^
^ . 2 ^ g
E:c9
>>
C
5
>
Oik.3
DI3<
-4->o
H
1 0 3 4 5 6 7 8 9 1 0
1966-67 18 8 29 __ _ 8 031967-68 13 — 12 28 ---- —' — 12 65196S-69 19 — 13 • 14 ---- — 2 b 53196.9-70 9 I 34 :>6 1 — — 4 ii51970-71 15 1 24 27 3 “ 5 76
Source :— Director of lilducation,Andaman and Nicobar Islands.
T able (7.11)
Distribution of stipendiary scholars from Andaman and Nicobar Islands undergoing post matriculation education in educational institutions in mainland according
to amount of stipend received.
Stipend (Amount in Rs.) 1966-67 1967-68 1968-69 1969-70 1970-71
20— 30 _ _ _ -31— 40 —_ __ __ — _41— 50 i— — — — ■ —51— 60 — — 1 — — —61— 70 1 — — — —■71— 80 13 — — 17 __8 1 - 9 0 42 — 24 11 391-100 — 28 7 — 1
101-120 7 25 22 37 . 72
TOTAL 63 65 53 65 76
■ SoUBCEDirector of Edtication,Andaman and Nicobar Islands.

\l.VZf
INSTITUTION-WISE (EXCLUDING TEACHERS' TRAINING SCHOOL) ANNUAL DISTRIBUTION OF SCHOLARS
Period BOYS--- K----
GIRLS----- A----
TOTAL-----------A----------
Primary Middle Standard Stan- including dard
Pre- Primary
High/ Gra- Higher duate Secon Stan- dary dard
standard
PrimaryStandardincluding
Pre-Primary
MiddleStandard
High/HigherSecondary
Standard
GraduateStandard
Primary MiddleStandard
includingPre-
Primary
Standard
High/Highersecon
daryStandard
Gra- Grand duate Total Standard
1 2 3 4 5 6 7 8 9 10 11 12 13 14
1966-67 4.467 935 1.158 3.145 503 734 _ 7,6»2 1,438 1,892 - 10,9421967-68 4.702 I..307 L651 ICO 3 466 917 L 021 8 8,168 2,224 2,672 1 O8 13 ,1721968-69 5.122 1.926 1,6 13 I I I 3.724 1,248 1.024 20 8,846 3,174 2,637 131 14.788I 969-7O 5.145 2 .5 S 3 2,145 70 3.779 1,628 1.392 24 8,924 4.181 3,537 94 16,736197O-71 5.180 3,075 2,141 55 3.873 2X79 1,434 29 9.053 5,154 8.575 84 17,866
S ou rce .‘— Director of Eduction,Andaman and Nicobar Islands.

T a b le (7 .I3)
EXAMINATION RESULTS
70
Higher Secondary and Equivalent Examinations
YEAR No. Appeared No. Passed _____ ^_____
Boys Girls Total Boys Girls Total Percentage ofCol. 7 over Col.4
1 2 3 4 5 6 7 8
1 9 6 6 -6 7 46 27 73 16 1 1 27 35.61967- 6S 59 37 96 1 3 22 35 3 6 ,51968-69 96 38 13 4 41 2 3 . 64 47.8I 969-7O 145 64 2Gq 4 2 2 i 63 3 0 .11970-71 199 1 4 2 3 4 1 59 86 145 42.5
S o u rc e :— Director of Education,Andaman and Nicobar Islands.,
T a b l e (7 .14)
TEACHERS TRAINED IN JUNIOR BASIC TEACHERS^ TRAINING SCHOOL— PORT BLAIR
N o. of Trajineesf .. . -A
Year Male Female Total
1958-59 15 5 201959-60 8 11 191960-61 20 4 241961-62 13 10 231961-63 IS 9 241963-64 18 5 231 9 6 1-65 21 3 241965-66 21 3 241966-67 12 10 221967-68 22 14 36196S-69 31 20 511969-70 57 30 . 871970-71 68 32 100
S O U R C E -'Director of Education,Andaman and Nicobar Islands.

S E G T I O N - 8
MEDICAL AND PUBLIC HEALTH


REGION AL D IS T R IB U T IO N OF H O SPITA LS AND D ISPE N SA R IE S AS ON 3 is t M ARCH , 19 7 I
73
T a b l e ( 8 . 1 )
Kegion
1
Smith Andaman -
Hospitals . Gobind Ballabh Pant
Bambooflat Hosj)ital T. B. Hospital Primary Ilealih Centre
Dispensaries ,Jail DispensaryPolice ,,Marine ChathamTusnabad ,,Manglutan „Mithakhari „Mile Tilak Shoal Bay „Oral Katcha ,,Havelock ,,Little Andamau Neil Island Flat Bay
Middle Andaman;—Hospitals Long Island Hospital
Rangat ,,Billigroiind ,,
Dispensaries Bakultala Dispensary Kadamtala ,, Betapur No, 7 ,, Betapur No. 3 ,, Charlungta ,,
North Andaman:—Hospitals Dr. R. P. Hospital
Place of Locatipn Hate of inception
% 3
Fort Blair
Banibooflat Port Blair Wimborlvgnnj Port Blair
do. do. do.
Tusnabad Village Manglutan ,, Mithakhari ,, Mile Tilak Shoal Bay ,, Oral Katcha ,, Havelock ,, Little Andaman Neil Island Flat Bay
Long Island Rangat Billiground Bakultala Kadatntala Betapur No. 7 Betapur No. 3 Charlungta
Mayabunder
Pre-war Civil Hos- pitijl, Port Blair, was re-named as G. B. Pant Hospital and shifted to !)ewl7 constructM building in March, 1964.Pre-vvmr iiospital October, 196! Jatiuary, 1968 February,Feltruary, 1949 July, 1957 October, 1949
July, 1952 May, 1949 July, 1948 December, 1960 April, 1952 November, 1967 August, 1965 April, 1966 April, 1967 March, 1969
May, 1948 Janury, 1959 January, 1968 April, 1954 August, 1954 February, 1955 October, 1959 July, 1961
Mayabunder Hospital was re-named as Dr. R. P. Hospital and shifted to new building i n January, 1965.

74
Diglipar Hos])ital Di.^pensaries Kalara Dispeusary
Tu»apur ,,Caiisirina Bay „Laxini[)ur ,,Shibpur ,,Blair Bay „Tarlet Bay ,,Si tan agar ,,Bajato ,,Kaligliat ,,Noroomluni K,adhanagar ,,Mohanpur ,,Badamiialla ,,East Island ,,Smith Island ,,
Nicobar Group of Islands :—
Hospitals
Dispensaries
IIospital(/ar Nicobar N ancowrie Campbell Bay ,,Bigiapati DispejisnryAr.tno'(Jreit NicoKfir „West Bay Katclial ,, Teressa „Pilomilo „Kakana ,,Kapaitga /Chovvra ,,Pilpilow „Pilobhabi „Champion „
Diglipui Kalara Tugapur Causirina Bay Laxiiiipur Shibpar Blair Bay Tarlet Bay S itan M gar Bajato Kalighat
Moiconduui liadhanagar Mohanpur Bad a m n alia East Island Smith Island
Car >Jicobar Naucowrie Compbell Bay Biglaj)ati ArungGreat NicobarWest Bay KateTeressaPilomiloKakanaKapangaChowraPilpilowPilobhabiChampion
April, I9fi0.May, 1955 May, 1955 September, 1958 September, 1658 September, 195S July, 1959 Jiiue, 19o8i May, 19 5» August, • 1960 August 1960 April, 1068 January 1962 March, 1969 November, 196'.) February, 1970 February, 1970
July,April, March, October, October, September,
hal June, April, Octobar, November, April, April,June,April,
Novemher
19461957199919491949l;l5illd5S1956195919641965 19651960 1969 1969
S o u r c e : —Director of Medical and Health Services, Andaman and Nicobar Islands.
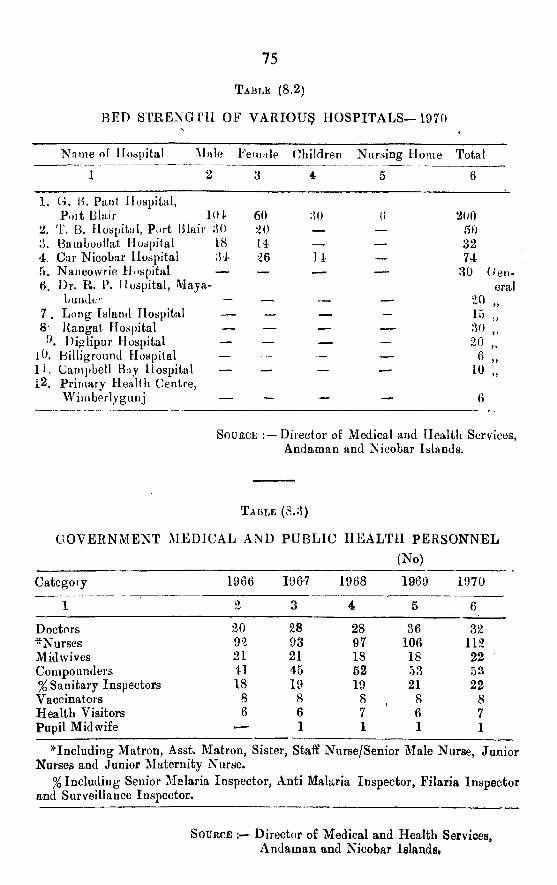
BED STRENGril OF VARIOUS HOSPITALS— 1970
75
T able (8 .2 )
Name of Hospital Male Eeuiiile (Children Nursing Ho me Total1 2 3 4 5 6
1. (7. Pant Hospital,Poit Blair 104 60 80 () 200
2. T. B. Hospitiil, Port Blaii• ;U) ->0 — — 50o. Bamboollat Ilodpital 18 14 — — 324. Car Nicobar Hospital U — 745. NaDcowrie H<>spital — — — . — 30 (GenB. Dr. R. P. Hospital, Maya- eral
buudev — — — — :10 „7 . Long- Island Hospital — . _ — — 158‘ Kangat Hos|)ital — — — — ‘>0
Diolipur Hospital — — — — 20 „
lO. Billiground Hospital _ — 6 „l i . Cami)bell Buy Hospital — — — — 10 „l2. Primary Health C'entre,
Wimberly gun j — — — — 6
S o u r c e : — Director of Medical and Health Services,Andaman and Nicobar I slands.
T a b l e (8.;^)
G O V E R N M E N T M E D ICA L AND PU BLIC H EALTH PERSON NEL(No)
Category 1966 IDS'? 1968 1969 1970
1 0 3 4 5 6
Doctors 20 28 28 86 32*Nurses 92 93 97 106 112Mid wives 21 21 18 18 22Compounders 41 45 52 53 53% Sanitary Inspectors 18 19 19 21 22Vaccinators S 8 8 8 8Health Visitors 6 6 7 6 7Pupil Midwife •—■ 1 1 1 1
*^Including Matron, Asst. Matron, Sister, Staff Nurse/Senior Male Nurse, JuniorNurses and Junior Maternity Nurse.
% Including Senior Malaria Inspector, Anti Malaria Inspector, Filaria Inspectorand Surveillance Inspector.
S ource Director of Medical and Health Services,Andaman and Nicobar Islands*

T a b l e (8.4)
M EDICAL l^ACILITIKS
76
Period Hospitals Dispensaries Number of Beds available
1966 9 40 4341967 9 42 4551968 10 41 4771069 1 1 45 4871970 1 1 49 493
S o u r c e : Director of Metlieal and Health Service;!,Audaman and Nicob'.ir Islands.
T a b le (8.5)
PATIENTS TREATED IN HOSPITALS AND DISPENSARIES
Diseases 1966 1967 1968 1969 1970
Malaria:—No. Treated 223 539 813 1 ,1 14 1870Deaths I 9 4 7 24
Dispepsia and DiarrhoeaNo. Treated 45»345 5LI97 55,683 55.583 67.391Deaths 46 8 19 12 20
Dysentry :—No. Treated 6,731 8,212 10,354 8,728 11,947Deaths 2 7 2 4 2
Tubercule of the LungNo. Treated 1,083 i,i46 952 1,688 3.719Deaths 9 17 i 6 26 25
Other Tubercule DiseasesNo. Treated 573 548 634 924 656Deaths 9 3 3 I 3
Rheumatic Fever:—No. Treated 46 68 , 27 i 8i 76Deaths — — — — 1
Filaria:—No. Treated 1 O6 139 119 88 I 24Deaths --
S ou rce :— Director of Medical & Health Services,Andaman and Nicobar Islands.

BIRTHS AND DEATHS IN VARIOUS HOSPITALS
77
T able (8.6)
Item 1966 1967 1968 1969 1970
BIRTHS(i) Male 920 859 885 863 917
(ii) Female 884 863 » 819 869 863
TOTAL 1.8C4 1,722 1,704 1,742 1,780
Male Bivtks to everythousand Female Births L041 995 1,081 993 r,063
DEATHS(i) Male 166 166 i7 l 159 214(ii) Female IGi 1 17 105 iiO I 12
TOTAL 267 283 276 269 326
Male deaths to everythousand Female Deaths 1,644 1.4 19 1,445 1,629 1 ,9 1 1
S o u rce :— Director of Medical & Health Services, Andaman and Nicobar Islands.
T a b le (8.7)
DEATHS ACCORDING TO CAUSES
S). No. Diseases 1966 1967 1968 1969 1970
1 . Fever 2 5 1 32 . Dysentry and Diarrhoea n 15 2 4 23. Respiratory diseases 49 80 19 12 54. Other causes 205 188 244 26 r 273
Source .-— Director of Medical & Health Services,Andaman and Nicobar Islands.

78
T a b l e ( 8 .8 )
VACCIN ATIO N STA TISTICS- 1970
Month Primary P. Vaccination
V. successfiill Revaccination
January 520 237 1556February 507 193 i 522M aich 819 283 1718A p i il 41^ 259 1877May 207 206 1016June 2(59 283 " 8 8July 253 182 128aAufiust 409 827 1456September 512 222 1508October 281 155 987November 718 588 2828December 261 58 1523
TOTAL 4008 2998 17732
N otk, : — In cul. 3, P. V .=P rim aiy Yaceinafion
S o u r c e : — Diieotor o f Medical an-1 Health Services, Andaman and JNicobai l,slands.
T a b l e (S .9 )
PROGRESS OF B.C.G. W O R K
Work doneYears
1966 1967 li)68 1969 L970
Tuberculine Testing 4088 8902 1356 9705 -Positives 1183 1082 481 2975 —Negatives 1765 1878 548 4729 -No. Regi.- t-'red — — — 2526 8085No. Examined — — — — 8035No. with previous Bt)(i Sear — • — — 680 1609No. Direct Vaccinated with P.C i — — — 1491 5491
N otk during 1^70 no 'I’ubeieiilinc testintr was done on circular instructions from D.G.H.S New Delhi
S ource Director of Metlic.il and Health Services,Andaman and Nicohar Islands.

79
iMonth
Jnniiarjl''phniaryM archAprilMayJuneJulyAugustSeptemberOctob(‘rNovemherDecember
Period
19661967 i q 6 819691970
PATHOLOGICAL LA B O RATO RY STATISTICS Nuu)ber of Cases examined
T a b l e ^ S . I O )
Period
i9661967196819691970
19()6 K)674,;5384,:l^74,2:»3
;5,75() 4,8(i4 4,‘ 74 4 ,472 4,CO;; 5,140 5,332 0,1 I {)
5,52'j6,2055,OJ575,363
r>,9i40,4767,0(t(]7,0f}()C.,7616,5390,040
11368 1969 1970^,790 5,414 40365,40r. 5,-115 3 8 3 15,555 5,408 37395,806 5,325 45075,073 5,120 45705,021 5,495 40950,200 5,711 30430,01:2 5,685 43225,983 6,553 . 43220,031 5,572 37090,382 5,283 38385,713 0,286 5011
Source : —Director of Meuic.il nnd Fl 'ulth Sei viees, Andaman and Niccibar I>iands.
T able (8.1 1 )
O P E R A T IO N S p e r f o r m e d
Major Minor Total276449544438439
2561 .3O41,5 5 21,4 562,257
1 ,1 3 81 ,7 5 32,096 I 8942,696
S o u rc e : —Director of Medical and Health Services, Andaman and Nicobar Islands.
T able (8.I2)
M A T E R N IT Y CASES A T T E N D E D
Total Cases Admitted(No.)
2.0752.0222.0832.4892,345
Labour Cases Conducted
L534 1,329 1.533 1,860 I 844
S o u rc e :— Director of Medical and Health Services,Andaman and Nicobar Islands.
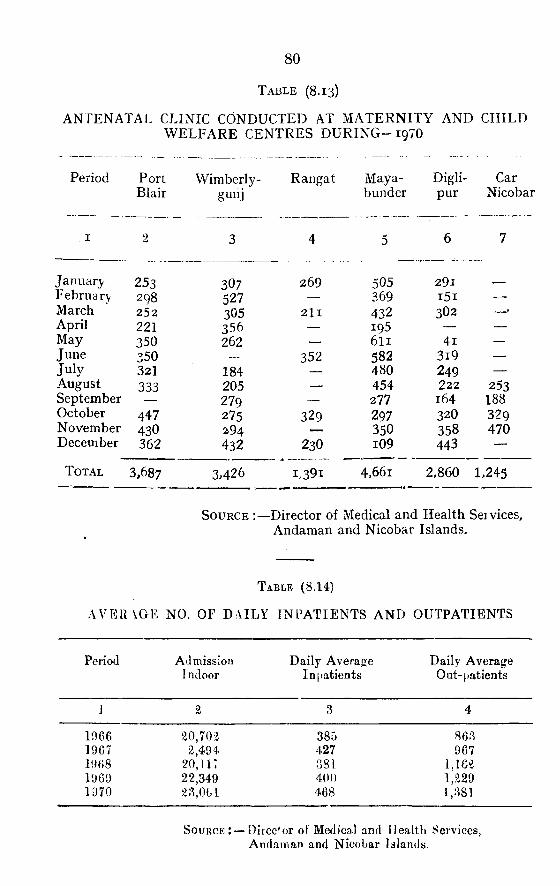
ANTENATAl. CLINIC CONDUCTED AT MATERNITY AND CHILD WELFARE CENTRES D U R IN G -197O
80
T a b le (8 .1 3 )
Period Port W im berl}^- Rangat Maya- Digli- Car Blair gunj bunder pur Nicobar
I 2 3 4 5 6 7
January 253 3 O7 269 505 29 1February 298 527 — 369 i 5 i —March 252 305 2 l l 432 3O2 — 'April 2 2 1 356 — 19 5 — —May 350 262 — 6 l i 4 i —June 350 — 352 582 3 i9 —July 321 184 — 480 249 —August 333 205 — 454 222 253September 279 — 277 164 188October 447 275 329 297 32O 329November 43O 294 350 358 470December 362 432 230 109 443 —
T o tal 3,687 3.426 I; 3 9 1 4,661 2.860 L245
Source :—Director of Medical and Health Sei vices.
• Andaman and Nicobar Islands.
T a b l e (8.14)
AVERAGE NO. OF DAILY INPATIENTS AND OUTPATIENTS
Period Admission Daily Average Daily AverageIndoor Inpatients Out-[)atients
1 2 3 4
1066 20,702 385 8631967 2,494. 427 9671968 20, 1 1 : r.si 1,1621969 22,349 400 1,2291970 2.‘ ,061 468 1,381
S ource ;-—]')irccfor of Medical and Health Services,Andaman and Nicobar Islands.
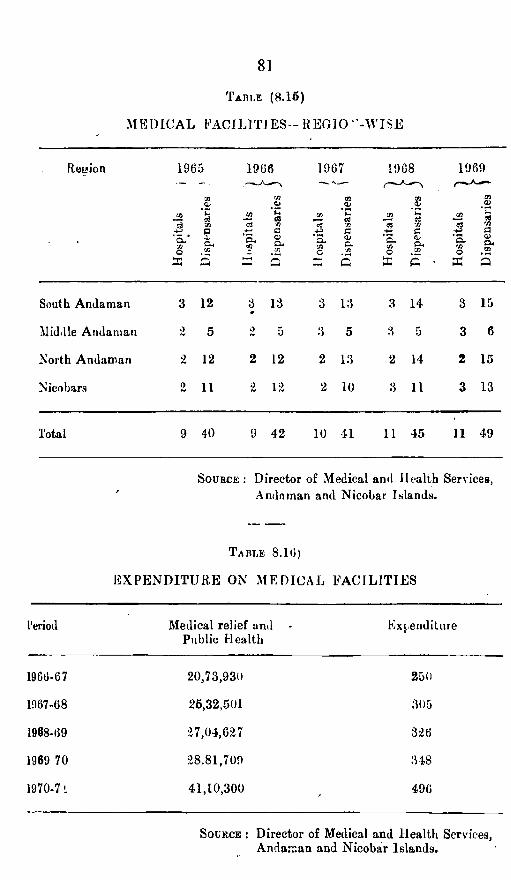
M E D IC A L K A C ILTTJE S- REGIO ’ -W IS E
81
T a b l e (8. 16)
Re£*ion 1965 1906 1967 1908 1969
CO ei _Cfl uos X
JXa
c3 •na .'S
Q-’yjo
04 'E .tn
<uCUOT uT
cX C X Q X
cOIc.C8
'S,COO
s
. ici•na<u
^(V
J2 i^ fl■S. s . S .2
X Q
South Andaman 3 12 3 13 3 13 3 14 3 15
Middle Andaman 0 5 '1 5 5 3 5 3 6
North Andaman 2 12 2 12 2 13 2 14 2 15
Nicobars 0 11 -Z 12 2 10 3 11 3 13
Total 9 40 9 42 10 41 11 45 11 49
S o u rce : Director of Medical and ilealth Services, Andaman and Nicobar Islands.
T a b l e 8.10)
E X P E N D ITU R E ON M E D IC A L F A C IL IT IE S
I’eriod Medical relief and Public Health
K/X(,.enditure
1960-67 20,73,930 250
1067-68 25,32,501 305
1968-09 27,04,627 326
1969 70 28.81,700 348
1970-7 1 41,10,300 496
S o u r c e ; Director of Medical and Health Services,Andan:an and Nicobar Islanda.

82
T a b l e (8.17)
SU H V E ILL \N C E ACTIVITY OF IN AND AM AN AN D
TH E N. M. N ICOBAR
E. P. O R G A N ISA TIO N ISLAN D S.
Nu niber of Blood SlidesA
Name of the Unit. Year.r(^llected Examined Found Positive.
1 2 4 5
0.:25 11 vpofMiiiemic Unit. 19()7-68ioas-691969-701070-71
21,515^^o,5oa46,04556,118
21,515 50 20,50;^ 81 46,045 1874 56,118 2800
S ou rce : Director of Medieal and Mealth Services, Andaman and Nieobar Islands.
T a b l e (8 .1 8 )
NO. OF STE R ILISA TIO N AND lU C D OFKRATION S PERFO RM ED IN AND AM AN AN D NICOBAR ISLAN D S ACCO RD IN G TO
R E L IG IO N A N D SEX.
1 9 6 8 -6 9
Sterilisation
1 9 6 9 -7 0 --------- -------
SterilisationSI.No. Religion Male
... _Female Total I U C D Male
-------.... ...Female Total lUCDi
1 2 3 4 5 6 7 8 9 10
1. Hindu 78 40 118 75 72 39 111 362. Muslim 6 10 16 13 6 5 11 83. Christian 17 7 24 10 6 7 13 164. Sikh ■ — — — — — — — —5. Other — — — ~ — - — —
Total lOi 57 158 98 84 51 135 60
Source: Director of Meiii'al and liealth Services,Andaman nnd Niooltar Island,s.

S E C T I o N—9
SHIPPING & MARINE


85
T a b l e ( 9 . 1 )
PASSENGER TR AFFIC AT PORT B L A IR .
Period Embarked Disembarked I’otal
1965-66 9,718 10,957 20,6751966-67 10,602 15,204 25,8061967-68 13,110 14,365 2 7,4751968-69 12,999 18,028 31,0271969-70 14,642 21,219 35,8611970-71 15,491 18,688 34,079
S o u r c e H a r b o u r Master,Andaman and Nicobar Islands.
T a b l e (9.2)
C A R G O IMPORTS A N D EXPORTS
{In BW Ton.)
Year Imports Exports*
1066-67 23858 207;il1967-68 29351 211511968-69 35941 321251969-70 41833 321991970-71 49981 33475
*Excluding quantity of Timber exported direct by Forest Department by private Vessels.
S o u r c e :— Harbour Master,Andaman and Nicobar Islands.
T a b l e (9,3)
feXPORT OF COPRA, BETELNUT AND C O C O N U T FRO M NfCOBARGROUP OF ISLANDS
Year Copra(Tonnes)
Betelnut(Tonnes)
Coconut(Nos.)
19«6-67 1,602 188 2,0001967-68 1,709 277 4,500
’ 1968-69 1,746 191 —
1969-70 1,061 256 —
1970-71 1,639 225 —
S o u r c e :— Additional Deputy Commissioner, Andaman and Nicobar Islands.

NUMBER AND TONNAGE
8 6
T able (9.4)
OF VESSELS VISITING PORT BLAIR
Year No. Tonnage
1966-67 123 1,23,0851967-68 110 1,59,1811968-69 95 1,60,5271969-70 114 1,71,2061970-71 138 1,65,312
Source -Customs Collecior,
1
Andaman and Nicobar IslanJe!.
T able (9 .5 )
SAN CTIO N ED STREN G TH OF G O V E R N M E N T M A R IN E jD O C K Y A R EPO R T B L A IR 1970-71 ,
SI. Sectious Super Skilled Semi- U n- TotaNo. visory skilled skilled
1. Fitting Shop 3 28 14 28 732. Machine Shop 1 17 — 7 253. Carpenter Shop ‘ A ’ 3 26 14 13 554. Carpenter Shop ‘ B ^
(Mooring-file) 1 5 11 4 215. Dry-Dock 3 3 1 10 176. Welding Shop — 5 2 — 77. Foundry Shop — ' 4 — 5 98. Smithy Shop (including Cop
per sxnith and Tinsmith) — 4 4 99. Power Sub-station and Elec
trical Shop — 5 _ 2 710. Painting Shop — 3 3 — 611. Plater Shop 1 16 20 40 7712. Sailmaker Shop — 2 1 — 313. Stores, Jetties, Gate & sanitary — — — 29 2914, Canteen 1 ----- 6 — 7
TOTAL 12 118 76 138 344
Source Marine Engineef,Andaman and Nicobar Islands#

W O R K E R S E M P L O Y E D , M A N D A Y S W O R K E D A N D A C C I D E N T S O C C U R R E D I N G O V E R N M E N T M A R I N E D O C K Y A R D , P O R T B L A I R .
87
T a b l e (9 .6)
K No. Item YEA R S
19 66 1967 1968 1969 1 9 70
1. Average daily number ofworkers employed 287 ^UO 810 324 306
3. Total N o . of man<lay.> worked 84 95 2 91 45 0 9 2 3 8 0 95580 9 0 5 7 63 . Accidents occurred :
(i) Fatal — — — 1 —(ii) N o n -F a ta l 4 6 6 6 8
S o u r c e M arine Euj^iaeer,Andam an and Nicobar Islands.
T ab le (9 .7 )
W A T E R -C R A F T S C O N S T R U C T E D I N G O V E R N M E N T M A R IN E D O C K Y A R D , P O R T B L A IR
Ao.
Y ear Power boats D um b Barges Pontoons Totalconstructed constructed constructed
1 9 6 6 -6 7 — — _ _1 9 6 7 -6 8 1 N o . (30 feet) — 1 319 68 -6 9 — _1 9 6 9 -7 0 1 N o. (30 feet) _ — i^ 9 7 0 -7 1 — i (50 tons.1 — 1
S o u r c e ; — M arine Engineer,Andam an and N icobar Islands.
T a b l e (9 .8 )
N U M B E R O F W A T E R -C R A F T S S U R V E Y E D A N D M A J O R R E F IT U N D E R T A K E N
I terns
SFumber of Vessels M A J O R R E F I T
(i) in D ry -P ock(ii) On Slipway(iii) Beached
166-67 1 9 6 7 -6 8 . 1 9 6 8 -6 9 1 9 6 9 -7 0 I970-7L
10 26 29 30 32
1 7 11 17 179 13 14 13 10
— 7 4 1 5
S ou rce :— M arine Engineer,Andam an and N icobar Islands.

TRANSPORT AND COMMUNICATIONS
SE C TIO N - 10


Type of Koads
Black I'opped Other type of Roads Roads in progress
R O A f) L E N G T H
91
TABr.E (10.1)
(In Kilometres)
1 9 6 8 -6 9 1960-70 1 9 7 0 -7 1
;^89IS
143
410;34
145
441
37
146
S o u rce ;— P u b lic Works Department,Andam an and N icobar Islands.
T a b le (1 0 .2 )
g o v l :r n m e n t r o a d t r a n s p o r t
Item
1 . Length o f routes in Kilom etres
2. Number of routes
3 . D aily Kilom etres covered
4. Num ber of Buses on Road
5 . Average number of passengers transported per day
<5. Total capital iavested b j G ovt. (R s.)
7 . Incom e realised (R s.)
YEARS
.96 6 -67 1 )6 7 -6 8 1 9 6 8 -6 9 1 9 6 9 -7 0 1 9 7 0 -7 1
37-2 417 41 7 469 62 6•28 31 31 33 42
1886 22 26 2305 2377 2 4 60
17 24 30 30 34
6985 7327 9 6 7 4 1 0 ,1 8 2 1 0 ,4 2 5
N .A . 1330 432 1 7 0 7 0 7 1 17 07 071 19 88 2136 0 78 77 6 3 76 48 862169 95 01 20 10 7 3 7 3 6
S o u r c e Harbour Master (Transport),
Andaman and Nicobar Islande.

T a b l e (10.3)
M O T O R V E U I C L E S IN A N D A M A N A N D N IC O B A R I S L A N D S
92
Period M otorCycles
Lorries Taxis Ruses Cars and Jeeps
Others Total
1966-671967-681968-691969-701970-71
120165248314363
192188220277311
2126364041
1924283341
113137^1621932 03
83102
99113
54864278 6956
1072
SoUECE : S u p erin ten d en t o f P o lice ,Andam an and Nicobar Islands.
T a b l e (10.4)
N KW RKGISTRATION OF MOTOR Vl^MICLES a n d M C O B A R ISLAN DS
I N A N D A M A N
P eriod N um ber of registered M otor Vehicles
c3o
Cua> o ooo02
O)o a
-2 ^ TS o o ^
wO)'K . 2-a ^ o
1966.671967-681968.691969-701970-71
13 818 1413 1018 I I 27 6
725191718
3043625459
1213
99
523146727
2961
30
73144147167176
S ource : Superintendent of Police,Andaman and Nicobar Islands.

N U M B E R OF V E H IC LE S R E G ISTE R E D OUTSIDE AN D AM A N AND NICOBAR IS L A N D S BUT PL Y IN G IN ANDAM AN AND
N IC O B A R ISLAN DS
93
T able (1 0 .5 )
Period Number of Motor Vehicles Registered outside Andaman and Nicobar Islands but plying in this territory
C iirs J eeps Motor C\’cles Scooters Goodsvehicles
Othervehiclgs
Total
1 2 3 4 5 6 7 8
1966.67 5 _) 2 .10 1 _ 201967-68 7 2 3 13 2 — 271968.60 4 2 6 24 3 — 391969-70 7 4 4 16 8 2 441970-71 8 1 12 23 10 7 61
S o u r c e : Superintendent of Police,Andaman and Nicobar Islands,
T able (10.6)
N U M BER OF ACCIDENTS DUE TO CON VEYAN CRS IN A N D AM A N / AND NICOBAR ISLAN D S
Period Number of Accidents by
O
£-‘• - r oe3
cn:a Eh
_CJ0
0
000C/D i i
a.0)<i>
S0
"o0Qc f£3
0 >
CO
0) ^5 ©w ^I ’s
1 3 4 5 6 7 8 9 10 11 12
1966-67 15 __ 11 ■ - — _ 1 - 3 1 111967*68 21 2 10 ___ 1 ___ 1 3 4 2 281968-69 38 — 18 3 5 ___ 1 1 10 5 371969-70 38 2 9 — 1 ___- ' 9 3 14 13 651970-71 24 0 9 3 - 2 8 9 24
S ource : Superintendent of Police,Andaman and Nicobar Islands.

94
POSTAL AND TELEGRAPH COMMUNICATION FACILITIES AS ON3 1ST m a r c h , 1971
L 0 d .T I 0 N Y E a ¥ O F T N ^ P T I o i r
A POSTAL ~Head Post Office Port Blair Pre-warSub-Post Office Urban i. Aberdeen Bazar 1959
2. Chatham 19553 . New Secretariat Building I966
T a b le (10.7)
RURAL(a) South Andaman(b) Middle Andaman
(c) North Andaman
(d) Nicobars
BRANCH—POST OFFICES(a) South Andaman
(b) Middle Andaman
(c) North Andaman
(d) Nicobar Group
B. TELEGRAPH/POLICE (a) South Andaman
4 . Junglighat (B.O.)
1. Wimberlygunj1. Rangat2. Long Island3 . Betapur1 . Diglipur2 . Mayabunder1. Car Nicobar2 . Nancowrie
1966
19591959195519501959195519591960
1. Bambooflat I9662 . Garacharama i 9583 . Tusnabad i9684 . Hompherygunj I9555 . Chouldari 19626. Beach Dera 19647 . Havelock i96i8. Oralkatcha I961Q. Kalatang I964
10. Miletilak 19641 1 . Ferrargurj 197O1 2 . Neil Island 197O
1 . Kadamtala 19592 . Bakultala i9633 . Nimbutala I9634 . Pitchernala i9661. Parangara 19592 . Tugapur 19593 . Swarajgram 19624 . Aerialbay 19661 . Lapathi 19662 . Teressa 19683 . Kapanga 19684. Hut Bay 19695 . Campbell Bay 1969
RADIO S T A T I O N S I 97O-7I1 . Port Blair 19462 . Havelock 19633 . Baratang 19514. Neil Island 1967

95
I 2 3
(b) Middle Andaman 1. Rungat 19492. Long Island 19463. Kadamtala 1949
(c) North Andaman I . Mayabunder 19492. Diglipur 1955
! 3. East Island 19644. Interview Island 19705. Norcondum Island 1968
(b) Nicobar Group I. Car Nicobar 19462. Nancownc 19463, Kondul 19514 CawpbeW Bay 19655. Teres sa 19666. Little Andaman 19657. Kapanga 19668. Pilomilo 1967
Source :— l. Post Master, Port Blair.2. Police Radio Officer,
Andaman and Nicobar Islands.
T a b l e ( i 0 . 8 )
NUMBER OF TELEPHONES AND EXCHANGES
Year Telephone Connections Telephone Exchanges
1 9 6 6 2 1 8 with 5 6 Extensions 3
1 9 6 7 2 8 0 with 7 5 4
1 9 6 8 3 5 2 with 8 3 4
1 9 6 9 3 8 9 with 9 8 4
1 9 7 0 4 0 2 with 1 1 0 4
S o u r c e :— Asst. Engineer, Wireless, Port Blair.
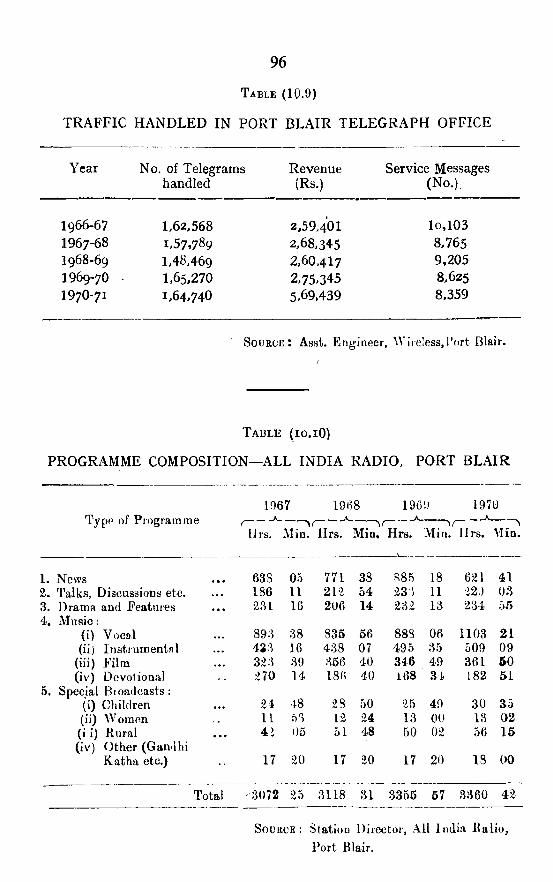
96
T a b l e (10.9)
T R AF FIC H A N D L E D IN PORT B L A IR T E L E G R A P H OFFICE
Year No, of Telegrams Revenue handled (Rs.)
Service Messages (No.)
1966-67 1,62,568 2,59,401 lo,1031967-68 1 ,57,789 2,68,345 8,7651968-69 1,48,469 2,60,417 9,2051969-70 1 ,65,270 2>75.345 8,625197O-71 1 ,64,740 5,69.439 8,359
S o u r c e : Asst. Engineer, Wireless,I’ort Blair.
T able ( io . i O)
PROGRAMME COMPOSITION— ALL INDIA RADIO, PORT BLAIR
1067 1968 1961) 1970
Typ( of Programme /--------^Hrs. Mi”2
___Hrs. Min.
____\___ _Hrs. Min. Hrs. Min.
1. News 638 05 771 38 S85 18 621 412. Talks, Discussions etc. 186 11 212 54 23 11 22.) 033. Drama and Features 231 16 206 14 232 13 234 554. M usic:
(i) Vocal 893 38 835 56 888 06 1103 21(ii) Instrumental 433 16 438 07 495 35 509 09
(iii) Film 323 39 356 40 346 49 361 50(iv) Devotional 270 14 186 40 168 3 i 182 51
5. Special Bioadcasts: (i) Children 24 48 28 50 25 49 30 35(ii) Women 11 53 12 24 13 00 13 02(i i) Kural 42 05 51 48 50 02 56 15(iv) (^ther (Gandhi
Katha etc.) 17 20 17 20 17 20 18 00
Total '3072 25 3118 31 3355 57 3360 42
S o u r c e : Station Director, A l l India Eaiio, Port Blair,

'^able ( lu .r n
IN D IA N A IR LIN E S O PERATIO N S BETW I:EN ( ’ALCU TTA AND POKT b L A IR
Ye«r Hours Km. Capacity Flown flown (Ton Km.)
Passengers Carried
No. Passenger Ton(Km.) (Km )
Freight Carried- A --------------------------^
WeightKgs.)
Ton(Kms.)
Mail Can ied Total Revenue Load----------- ---------------- (Ton Kms.)W eight Ton
(K gs.) (Kms.)
10 11 12
1966-67 319.; 5 86,0U0 221,882 1,185 15,72,683 136,288 9,634 12,479 8,398 11,196 159,963
1967-68 426.00 120,978 450,049 2,060 26,51,220 228,964 23,040 2!),653 16,882 21,727 280,344
1968-69 651.55 226,550 10,01,732 3,508 53,46,215 454,597 61,967 81,338 20,017 30,720 566,655
1969-70 807.35 3,46,524 11,46,043 4,360 75,16,640 635,770 92,655 1,59,735 22,693 39,120 834,226
1970-71 617.35 301,602 8,60,594 3,485 62,62,698 524,541 90,247 1,60,577 21,939 39,394 724,458
S o u r c e :— Financial Adviser and Chief Accounts Officer, Indian Airlines, Calcutta.
VO-O


SE C TIO N - 11
POWER


INSTALLKO CAPACITY' AND PO W K R G E N E R A TIO N IN A N D A M A NAND N IC O B A R IS L A N D g
(K.W.)
101
T able ( 1 1 . 1 )
Year Installed Capacity CJeneration
1966 1365 27,09,3771967 1736 30,47,755
; 1968 1736 35,48,4761969 2295 39,15,0501970 2994 43,01,694
S o u r c e :— Executive Engineer,Eleotrieity Department, A , & N. Islands.
T able (11.2)
ELECTRIC CONSUMPTION BY VARIOUS SECTORS IN ANDAMAN AND NICOBAR ISLANDS
(K.W.H.)
kear Domestic Commercial Industrial Street Lighting Others Total
19661967196819691 9 7 0
10,21,35511,31,78012,39,55314,74,74024,61,163
1,59,0471,58,518
1,63,0252,23,2262,25,804
5,19,4684,96,1405,51,5014,92,9955,29,139
82,6161,01,497
93,33597,78786,082
2,07,1392,33,8892,54,8342,61276
2,64,634
19,89,62521,21,82423,02,24825,50,02435,66,822
S o u r c e r-* Executive Engineer,Electricity Department, Andaman and Nicobar Islands.
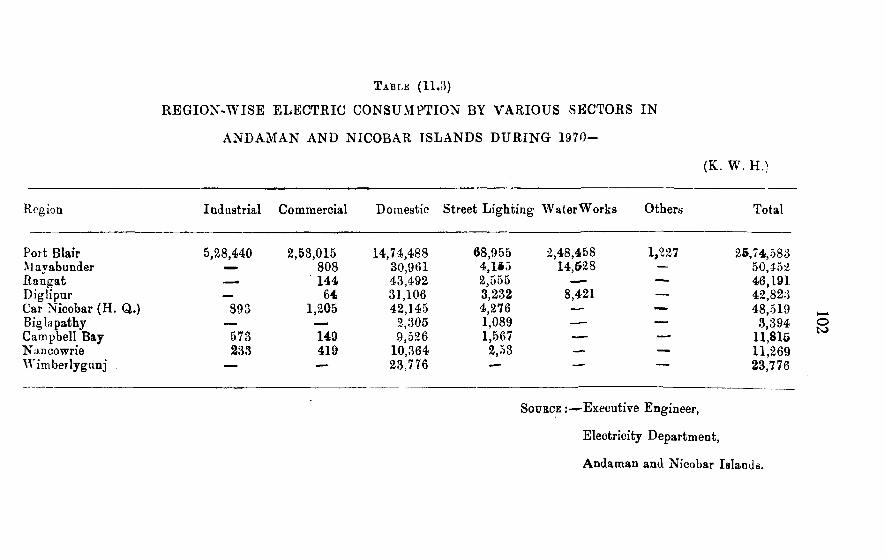
T able (11.3)
REGION-WISE ELECTRIC CONSUMPTION BY VARIOUS SECTORS IN
ANDAMAN AND NICOBAR ISLANDS DURING 1 9 7 0 -
(K. W . HO
Region Industrial Commercial Domestic Street Lighting Water Works Others Total
Port Blair 5,S8,440 2,53,015 14,74,488 68,955 2,48,458 1,227 25,74,583\] ay abunder — 808 30,961 4,1S5 14,528 — 50,452Rangat —. ■ 144 43,492 2,555 — ‘ — 46,191Diglipur _ 64 31,106 3,232 8,421 — 42,823Car Nicobar (H. Q..) 893 1,205 42,145 4,276 — 48,519Biglapathy — — 2,305 1,089 — — 3,394Campbell Bay 573 140 9,526 1,567 — — 11,815Nan cowrie 233 419 10,364 2,53 — 11,269Wimberlygiinj MM 23,776 —— 23,776
o
Source :—^Executive Engineer,
Electricity Department,
Andaman and Nicobar Islands.

T a b l e (11.4)
(INSTALLED CAPACITY AND POWliR GENERATION AT PORT BLAIR
(In K . W .)
103
Year Installed Capacity Generation
1966 1,230 26,27,646
l':>67 1,430 29,18,074
1968 1,430 33,76,877
1969 1,870 36,94,250
1970 2,500 40,28,461
S o u r c e Executive Engineer,
Electricity Department,
Andaman and Nicobar Islands.

T a b l e (11.5)
E LE C TR IC CONSUM PTION BY V A RIO U S SECTORS D U R IN G 1970 AT PORT B L A IR .
(In K . W . H .)
Period Industrial Commercial Domestic Street Lighting Water Works Others Total
J anuary 43100 17363 119703 5961 22037 27!) 208443February 44801 111438 5547 18163 18163 26 ]98138March 40299 18370 109320 5715 17563 6 191273April 42193 18207 15490i 5660 17958 1*24 239144May 46397 19i72 130566 5874 18854 — 230862June 40158 21856 113501 5823 16636 — 197!i74July 40707 21428 118384 6009 158!t0 — 202418August 48846 24374 112683 5518 21224 64 212709September 46200 25195 127345 5660 22562 127 2,->6089October 48884 22940 124279 5663 26937 262 228965November 42395 21841 126087 5817 26066 59 222265December 45460 21890 126281 5708 24568 180 224087
o■|i»
S o u r c e :■— Executive Engineer,
Electricity Department,
Andaman and Nicobar Islands.

{ In K. r . H .)
105
T a b l e (11.6)
SALE OF ELECTRICITY TO DIFFERENT CONSUMERS AT PORT BLAIR
Year Domestic Coinmeroial Consumption Lighting and
Small Power
Iniustrial Public Otheis Power Lighting
Total
1961 451680 62071 684291 47414 699G6 13153621963 493626 77634 628705 49750 84133 1333848196;^ 65486a 100945 561790 57437 113367 14914021964 136154 riOlOS l;^U76 15'2956H1965 888797 156482 469808 68323 140077 17234871966 972488 1581399 519468 75150 207139 19326441967 1040561 155336 496140 86110 233775 20119221968 1196829 162198 551501 85406 254834 22507681969 1303189 215635 492995 77235 261275 23603291970 1474488 253015 528440 68955 249685 3574583
S o u r c e —Executive Engineer,Electricity De[)artment, Andaman & Nicobar Islands.


PUBLIC FINANCE
S E C T IO N -12


BU D G ET AT A G L A X C E
(in /iS. W O’)
109
T a b l e ( 1 2 . i )
Year Revenue Receipts Revenue Expenditure(Actuals) Area Grant (Actuals)
1066.67 17,335 66,650
1967-68 19,687 74,387
1968-69 25,286 80,459
I9G9-70 22,915 1,01,570
1970-71 (Revised Rstimates) 26,542 1,17,825
1971-72 (BudgetEstimates) 27,265 1,10,861
S o u r c e C h ie f C o tn m is b io n o r 's Seett.,Andaman and Nicobar Islands.

110
D ETAILS OF RblVEN UE RECEIPTS
{in Rs, WO’)
T a b l e (12.2)
Receipts Actuals
1969-70
Revised Estimates for
1970-71
Budget Estimates for
1971-72
Land Revenue 72 1,16 1,16Taxes on vehicles 14 25 25Other taxes and duties 36 70 70Stamps 75 80 80Registration fees 1 2 2Administration of Justice 20 25 25Stationery & Printing 19 27 20J ailsRoad & VS ater Transport
2 4 3
Schemes 9,56 11,00 12,00Police 15 20 20Ports & Pilotasje 50,10 66,97 66,97Forests 1,43,57 1,62,95 1,66,56Education ____ 20 17Medical 31 15 15Agriculture 1,26 2,23 2,73Animal Husbandry 15 1 1Co-operation — 10 10Industries 1,12 Community Dev. Projects, NES
2,00 2,10
and Local Dev. Works 3 5 5Electricity Schemes 17,93 11,64 12,60iVliscellHneous 2,68 4,43 5,60
Total Revenue : 2,29,15 2,66,42 2,72,65
S o u r c e Chief Commissioner’s Secretariat, Andaman and Nicobar Islands.

I l l
DETAILS OP EXPENDITUKE
T a b l e (12.3)
{in Rs, ‘000’ )
Head Actuals1969-70
RevisedEstimates(1970-71)
Budget Estimates (1971-72)
1 3 4
1. AREA G RAN TLand Revenue 3,07 3,69 3,77Stamps 5 3 3General Administration 21,59 24,72 51,57Admn. of Justice 73 88 88Jails 1,44 1,50 1,69Police 87,05 92,21 93,55Misc. Departments 2,34 2,36 2,53Education 48,32 55,95 63,38Medical 24,17 26,02 29,36Public Health 5,93 10,14 12,49(A) Family Planning — 72Agriculture 17,16 17,33 25,10Animal Husbandry 3,49 3,75 4,37Co-operation 1,94 2,38 2,69Industries 2,98 3,12 3,25C. D. Projects-Local Dev.
Works and NESjr
6,29 7.63 6,75Labour and Employment 11,00 12,47 12,68*Misc. Social and Dev. Oren. ;i5 1,20 1,90Kleotrieity Schemes 17,32 23,12 25,09Public Works 1,95,64 4,23,77 3,43,16Capital Outlay on Public
W orks 32,83 31,53 26,88Ports and Pilotage 2,27,15 1,89,56 1,43,09Hoad and W^ater Transport
Schemes 18,50 30,25 31,34Famine 1 1Stationery and Printing 1,78 2,17 2,87Forests 1,66,47 1,91,00 1,92,00Miscellaneous 17,71 21,46 27,46
Total Area Grant 10,15,70 11,78,25 11,08,61

112
II . CAPITAL G R A N T :Capital out lay on improvement of
Public Health Capital outlay on Industrial and
Economic Development Capital outlay on Klee, Schemes Capital outlj iy on Public Works Capital outlay on Ports Capital outlay on Shipping,
Tankers etc.Capital outlay on Forests Capital outlay on Schemes of
Government Trading
2 3 ' 4
15,27 76,63 64,66
7219,23
1,58,0285,28
2510,89
1.47.591.28.60
3811,00
1,39,101,68,00
10,184,34
11,88 19,465,00
1,14,45 1,90,77
Total Capital (^rant 4,07,49 5 ,6 2 ,it] 5,98,:^7
S o u r c e : Chief Commissioner’s Secretariat, Andaman and Nicobar Islands,

SECTION— 13
LAW AND ORDER


T able (13.1)
STRENGTH OF POLICE FORCE
115
Item PE R IO D * '
19(56 1967 1968 1969 1970
Inspector General of Police**’* — — — — —
Superintendent of Police 1 I T 1 1
Dy/Asist. Supdt. of Police 5 4 7 8 8
Police Radio Officer 1 1 1 1 1
Asst. Chemical Examiner — — 1 1 1
Inspectors 15 15 17 18 18
Sub-Inspectors 36 35 42 47 4?
Asat. Sub-Inspectors •’ 3 26 27 25 25
Head Constables 137 131 168 195 195
Lance Head Constables 50 51 6: 46 46
Constables 700 732 778 875 875
[iknd Personnel % 24 24 24 24 24
Bush Poliee/Jamadar 3^6 334 34d 349 346
3ther Ranks (Radio Staff] 116 188 224 227 228
*A s ou 31st December each year.
* '‘'Chief Commissioner is the Ex-0(ficio Inspector-lTeneral of Police.
% Already inehided in their respective ranks.
S o u r c e : — Superintendent of Poh*ce,
Andaman and Nicobar Islands.

T a b le (13.2)
VOLUM E OF CRIMES
116
Nature of Crime 106G 19G7 1 0 6 8 19G9 1970
Murder 8 4 ri 3 8
Burglary 4 6 5 1 44 3 4 3 0Thefts 6 9 8 9 6 1 16 7 4Local and Special Law 2 4 6 3 4 6 3 4 5 6 4 4 7 4 4Mi.scellaneons IPC Cases 1 7 0 1 9 3 1 7 7 2 2 2 i S 7Other (Robbery etc.) 3 I 3 0
T o t a l 5 4 7 6 8 6 6 5 5 98 :1 1 0 4 5
COGNIZABLE CRIMES
Cases 1966 1907 1908 1969 1970
Number of Cases ReportedConvictionsAcquittals
547131
31
685 655 982 392 324 238 107 75 16
104535315
S o u r c e : — Superintendent of Police,Andaman and Nicobar Islands.
T a b l e (13.3)
AVERAGE D A ILY POPULATION OF JAILS
Category of Prisoners PE R IO D
1966 1967 1968 1969 1970
Convicts in Cells & Barracks U nder-trials Non-Criminal Lunatics
45266
49 42 39 28 19 15
7 8 9
2547
6
T o ta l 76 84 69 63 78
S o u r c e Superintendent of Dist. Jail,Andaman & Nicobnr Tslandii.

Year
a g e a n d s t a t e o f e d u c a t l o n o f c o n v i c t s
T a b l e (1 ^ 5 .4 )
A 'iE ___ __
Under 22------A-----
22 to 40A __
41 to 60 61 and aboveA
^ r N { ^ ^Male Female Male Female Male Female Male Female
E D U C A TIO N_____ A______
Literate___A___
Illiterate
Male Female Male Female
4 6 10 11 12 13
1966 19
1967 27
106S 21
1069 18
11)70 10
88
I 83
— 63
— 66
~ 40
— 21
— 21
1 13
— 21
— 10
14
1
1
2
1
109
107
76
92
45
— 33
15
16
S o u r c e :— Superintendent of Dist. Jail,Andaman and Nicobar Islands.
1
1

T a b l e ( 1 3 . 5 )
' C O N D IT IO N OF PRISONEKS R E LE A SE D FROM JAIL
Year Number released Number, who badNo. who had gained weight / No. who had lost weight
during the year neither lost nor gained weight in Jail Upto 5 Kg. Over 5 Kg. Total L pto 5 K g. Over 5 Kg. Total.
1 2 3 4 5 6 7 8 9
1066 116 30 70 12 82 4 — 4
1967 147 73 63 • a 65 4 — 4
1068 125 55 59 _ J ' 7 66 4 — 4
M 113 42 62 ^ 6 68 3 — 3
1970 55 23 •25 ' 4 29 3 -- 3
Source :— Superintendent of Dist. Jail, Andaman and Nicobar Islands.
QC
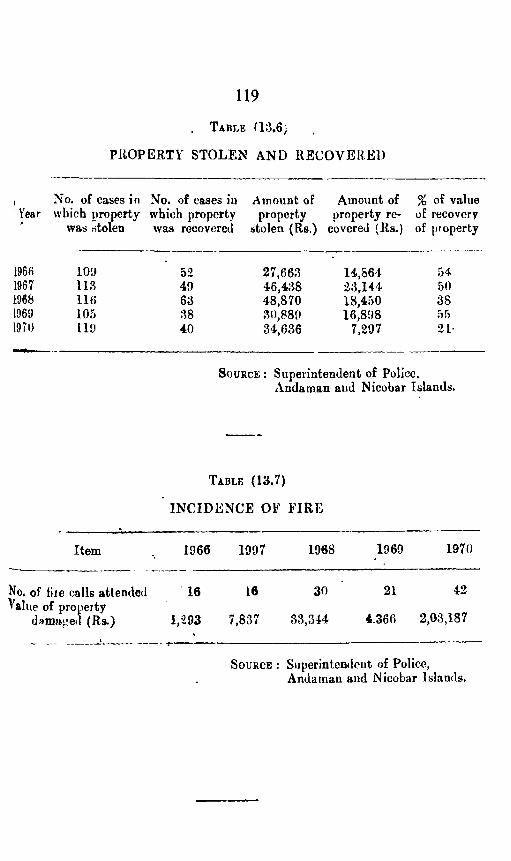
. T able Q 3 .6 j
PllOPERTV STOLEN AND R E CO VE R E D
119
No. of cases in No. of eases in Amount of Amount of % of valueYear which property which property property property re- of recovery
was stolen was recovered stolen (Rs.) covered (Rs.) of property
1966 lOU 52 27,663 14,564 541967 m 49 46.438 33,144 501968 116 63 48,870 18,450 381969 105 30,889 16,898 551970 119 40 34,636 7,297 21*
Source : Superintendent of Police.Andaman and Nicobar Islands.
Item
T able (13 .7)
IN C ID E N C E OF FIR E
No. of tile calls attended Value of property
dam»j;etl (Rs.)
1 9 6 6 1 9 9 7 1 9 6 8 1 9 6 9 1 9 7 0
1 6 1 6 3 0 21 4 2
1 , 2 9 3 7 , 8 3 7 3 3 , 3 4 4 4 , 3 6 0 2 , 0 3 , 1 8 7
S o u r c e : Superintendent of Police,Andaman and Nicobar Islands.


SECTION— 14
CO-OPERATION

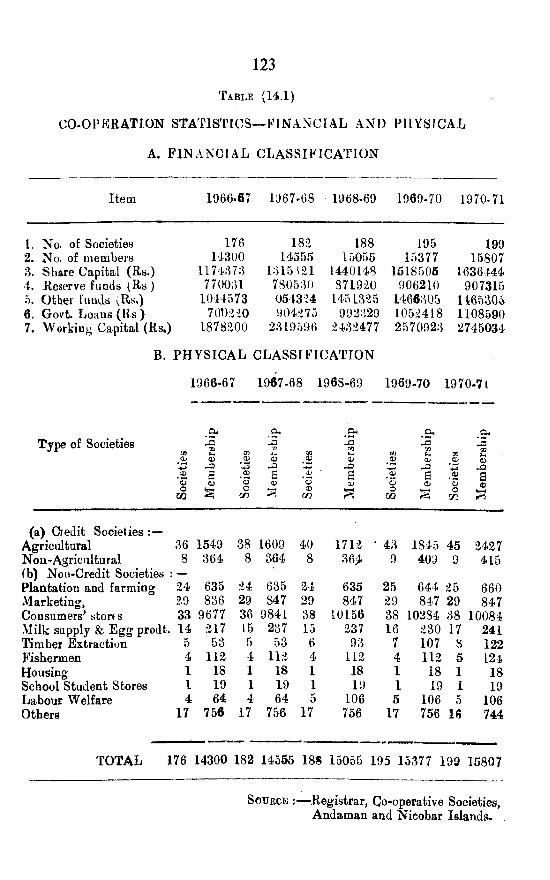
CO-OPERATION STATISTICS— FIN A N C IA L AND PHYSICAL
A. FIN A N C IA L C LA SSIFIC ATIO N
123
T a b l e (14.1)
Item 1966-67 1067-08 1968-69
1. No. of Societies 176 182 1882. No. of members 14300 14555 150553. Share Capital (Rs.) 117437;^ 1;U5^21 14401484. Reserve funds (R s ) 7700;U 7805:^0 8719205. Other Eimds 1044573 054324 14513256. Govt. L oa u s(R s) 70t)220 904275 992:i297. Workino Capital (Rs.) 1878200 2319596 2432477
1969-70 1970-71
195 19915377 15807
1518505 1636444906210 907315
1466305 14653051052418 11085902570923 2745034
B. PH Y SIC A L C LA SSIFIC ATIO N
1966-67 1967-68 1968-69 1969-70 1970-71
Type of Societies 00 m CO.213
.OhJ3!» eft
13r/i *•S*15CO
C3 •2- <5 O) .2 Oj 0)’-+J -t-i 42 r£2s .2 a .ii ' a • 22 a .2 a”o o '3 © o ‘ 3 o» '3 toOOD
ooo s ocr> om 1 0CZ}
Agricultural 36 1549 38 1609 40 1712 • 43 1845 45 2427Nou-Agricultural 8 364 8 364 8 36^ 9 409 9 415(b) Nou-Credit Societies : —Plantation and farming 24 635 24 635 24 635 25 644 25 660Marketing, 29 836 29 847 29 847 29 847 29 847Consumers^ storfs 33 9677 36 9841 38 10156 38 10284 38 10084Milk supply & Egg prodt. 14 217 15 237 15 237 16 230 17 241Timber Extraction 5 53 5 53 6 93 7 107 8 122Fishermen 4 112 4 112 4 112 4 112 5 124Housing 1 18 1 18 1 IS 1 18 1 18School Student Stores 1 19 1 19 1 19 1 19 1 19Labour Welfare 4 64 4 64 5 106 5 106 5 106Others 17 756 17 756 17 756 17 756 16 744
TOTAL ]176 14300 182 14555 188 15055 195 15377 199 15807
S o u r c e :— Registrar, Co-operative Societies,Andaman and Nieobar Islands.

124
T a b l e ( 1 4 . 2 )
DKVKLOPM ENT OF CO-OPERATIVli] S O C IE TIE S --31-3-1971
Type of Societies No. Membership Share Capital(Rs.)
1, Credit Societies :'
(a) State Co-operative Bank 1 107 329894(b) Other Credit Societies 49 2332 157580( c ) Multipurpose 4 403 30000
%, Plantation and Farming Societies 25 660 895003. Marketing Societies 29 847 1609854. Wholesale Stores 2 . \ m mm5. Primary Stores 36 8596 3355106. Milk Supply and Eg-gs Production
Societies 17 241 38207. Timber Extraction Societies 8 122 53408. Fishery Societies 5 124 25009. Housing Societies 1 18 5000
10, Ice Manufacturing Societies 1 14 18301 1 . Co-operative Canteens 4 262 3181512. Co-operative Rice Mills 1 10 25013. School Supply Stores 1 19 1651 4 , Labour Welfare Societies 5 106 564015. Women Industrial Co-operatives 4 5o 61016. Other Industrial Societies 3 42 280017. Others 3 3 6 1 51205
TOTAL 199 15807 1636444
SouBCE :— Registrar, Co-operative Societies, ADdaman and Nicobar Islands.
INDUSTRIES AND LABOUR
S E C T IO N -15

126
T a b l e (15.1)
SM ALL SC’ALK IN D U STR IE S A N D HANDICRAKTS U N D E R CO ITAG K i n d u s t r i e s D K PARTM im T
Crafts Location of No. of Employees as on Centre Units. Slst ^lareh, 1971
( 7 'Employees Trainees
L Wood Working and shellCraft Port Blnir
2. Smithy, Sheet Metallingand Electroplating ‘do.
3. Women^s Training I entrein Tailoriiij^ and Garment making. do.
4. Blacksmithy and Carpentry CarNicobar5. Tailoring an i Garment
making. do.6. Tailoring and Garment
making. Wimberlygunj
33
■13
o9
2
2
10
16
10
18
S o u r c e :— Cottage Industries Officer,Andaman and Nieobar Islands.
T a b le (1 5 .2)
OUTPUT OF JA IL IN D U STR IE S
Output
Year. ClothA ,
(?anj ProductsA
Misc. TotalValue(Rs.)Sq. Metre Value (Rs.) Pieces Value (Rs.)
^ ^__________ A _
Value (Rs.)
1966 236 351 185 2,199 2,5501967 200 309 175 2,184 503 3,0861968 188 330 271 2,770 91 3,1911969 141 303 472 3,669 114 4,0891970 223 477 242 3,023
S o u r c e :— Superintendent of Dist. Jail, Port Blair.

A V E R A G E D A IL Y N U M BRR OF W ORKERS EM PLOYED IN .................. RE(;ISTEREI> FACTORIES.
127
T a b l e (1 5 .3 )
Category of Factories. 1966 1967 1968 1969 1970
1215 1177 1165 1111 110622 23 27 18 20
36Q 372 370 388 356134 247 261 325 37593 120 19<) 63 6346 49 48 44 4612 12 12 10 12
40 20 11 12 26126 124 125 n o 120
847 948 950 882 8752 — ---- 10
2906 3092 3168 2972 3008
1. (lovernment nnd Local Fund Factories (Under Section 2nd (i) of the A ct);—Saw Mills.Wooden.Marine Engine Buildin^ and
Repairing.Motor Transport Workshop Electric Light and power. Printing and Book Binding. Metal,
2. Others (Under Section 3m (i) ofthe Act) :—
Saw Mills.Match Splints.Maniifaetnre of plywood.Motor Transport.
T o t a l
S o u r c e :— Chief Inspector of Factories, Andaman and ^Nicobar Islands.

AVERAGE d a i l y EMPLOYMENT OF ADULT WORKERS IN REGIS-
128
T a ble
Industry 1967fBeiow 42 Hra
42-45 . Hrs.
45-48 Above Hrs. 48 Hra.
I 2 3 4 5
Cjovernment and Local Fund Factories (Under
Section 2m (i) of the Act).
1 Saw Mills — — 1177 —
2. Wooden — — 23 —
8. Marine Engine Bnildinfr and Repairing — — 372 —
4. Motor Transport Workshop — — 247
5. {Electric Light and Power — — 120 —
6. Printing and Book Binding — 49 — —
7. Metal12
Others (Under Section 2m (i) of the Act.)
8. Saw Mills — — 20 —
9. Match Splints — — 124 —
10. Manufacture of Plywood. — — 948 —
11. Wooden — — -* —

129
(iS-4)
rK R E D FACTORIES W ITH S P E C IP Ilill N O IiM AL W U K K LY HOURS
1968 1969 m o--------------- ---------- _________ A_________ _ ,----------------K. .....-------- -Below 42-1 5 45-48 Above Below 42*4r) 45-48 Above Below ‘l2-4o 45-48 Above
i4 i firs. Mrs. Hr.s. 48 Mrs. 42 Hts. Mrs. firs 48 Hrs. 42 Mrs. His. Hrs 48 Hrs
10 11 12 13 14 15 16 17
— ll(>r> - ~ n i l — — 1106 — —
— ;>7 — _ 18 — - ;>0 — —
_ ;370 __ _ _ _ 388 — - 6 — —
— «61 ~ — - 3>o - - 356 - ~
48 199 — — 44 63 - — 375 — —
48 — _ 44 — 46 ~ ~
1 2 - _ _ 1 0 — — 7 _ —
— 1 1 _ _ _ _ _ _ 13 _ 120 — 25
__ 125 — — _ 119 — — 375 - -
— 950 — — — 882 — — 10 - —
SouRct: -.— Chief Inspector of Factories,Andaman and Nieobar Islands.

A. FACTORY LABO U R
130
T able (ir».5)
Period Number of working factories (Under
Factories Act, 1948)
Average number of wojkers employed
daily
Vumber of Mandays worked
1
19661967 1068 1960 1970
1615151517
2,906; ,0923,1682,972;\008
8,44,2070.19,2229,1^7,2718,86,9918,08,210
B. FACTORY A CCID EN TS
Period ending June Fatal Non-Fatal Total Number of Mandays lost
1966 _ 302 302 1,3231067 11 294 295 1,3311968 2 288 290 1,6751969 1 320 321 5271970 1 288 289 1,882
S o u r c e Chief Inspector o f Factoriea,Andaman and Nieobar Islands.
T a b l e ^15.6)
N U M BE R OP ACCIDENTS A N D AM OU N T COM PENSATION PA ID U NDER WORKMEN^S COM PENSATION ACT, 1923
Item, 1966 1067 1968 I960 1970
1. Avorage number of Workersemployed per day. 8498 7738 9r,60 1IU99 8298
2. Number of total accidentsoccurred. 302
3. ACCIDENTS No, of cases of injuries in respect of which final compensation paid.
333 260 343 304
(i) Death. 1 7 1 5(ii) Permanent disablement. 3 4 4 1 4
(iii) Temporary disablement. 270 3 2 ’ 255 334 2954. AM OU N T OF COM PEN SA
TION PAI1> (Rs.)(i) De;ith, 6000 47000 6ii00 56000 350OC
(ii) PtM riiuuent dis iblenient. l76o' 212:! 1 1270 176L 5061(ii) Temporary disablement 5353 5041 8867 15742 002(1
Total 13116 54163 27037 73503 40281
SoURCK Labour ('ouimissioner,Audamau and Nieobar Islands.

131
T a b l e(15 .7 )
IN D U S T R IA L DISPUTES AN D M A N DAYS LOST
SI.No.
Quarterending,
No. of No. of work- No. of Man-Dispiites. ers involved, days lost
1. March. 1967 1 37 178z. June. 1967 1 24 24X September. 1967 1 156 32054. December. 1967 3 742 8845, March. 19G8 1 580 284206. June. 19G8 , 5 3052 30521 . September. 19C8 1 131 2628. December. 1968 3 246 2579. March. 1969 ____ — —
LO. June. 1969 —- — —
11. September. 1969 1 398 5012. December 1969 2 493 34913. March. 1970 2 311 —
11. J une. 1970 — —• —la September. 1970 2 3465 108116. December. 1970 2 224 ' 2583
5'0IJ''CE : —Labour Commissioner,Andaman and Nicobar Islands.
T a b l e (15.8)
N U M BE R OF SHOPS AND COMM KRCIAL ESTABLISHM ENTS UNDER W E E K LY H O LID A Y ACT, 1942
Item. 1967
No. No of persons
einploved
1968
No No. of persons
employe 1
1969 1970
No. No of No. No, of persons persons
employed employed
1. Shop^/CoiiuneicialEstablish ments 393 471- 3(»3 517 33S 471 399 486
2. 'rhcMtiPs findH'.^stauiant-. (5 :>20 3 1 153 1 :> 7 36 225
T<.tal 437 694 334 670 472 688 435 711
Source :— Laboni Commissioner,Andaman and Nicobar Islands.

T a b l e (,15.9)
LEAVE WITH WAGES UNDER FACTORIES ACT, 1 0 8
ItemsX)o>.o
aw
1. Govt, and Local Fund Factories (under Section >m (0 of the Act)(i) Saw Mills
(ii) W ooden(iii) Marine Engine Building
and Repairing(iv) M otor Transport W ork
shop(v) Electric Light and Power(vi) P r i n t i n g and Book
Binding(vii) Metal
2. Other Factories (under Section 2m(i) of the Act) ■-(i) Saw Mills
(ii) Match Splints(iii) Manufacture o f Plywood
1967--------A------
1968__A--
1969
TJS O•ts >+-> KS C V W
T3asj
o
1970 — ^ —
o•o4) _ (O9 >^ cs p oiC 4>
WhJ O J
T3«C2 „ 00 of t
^ •—1
”0<uoaaw
•o61•ti > ■s
O
u«2W)«o
I ’aS
m
■o i i « .ts >■w r3C OW J
aonJftO o o w
1177 1040 969 71 1176 1150 1062 88 1 1 1 1 981 918 59 1106 1081 928 15333 14 5 9 35 28 12 16 18 18 12 6 24 21 18 3
372 372 349 23 370 370 358 12 388 388 345 43 356 356 387 69
265 265 98 167 278 278 134 144 325 266 183 83 422 416 254 162120 120 57 63 199 199 98 101 63 63 41 22 63 63 48 15
49 49 28 21 48 48 31 17 44 44 42 2 49 49 38 1112 12 8 4 12 12 9 3 10 10 8 2 12 12 9 3
20 20 ■ 20 _ _ _ 12 _ _ 25 10 5 5143 133 117 16 145 141 114 27 119 119 115 4 153 137 109 28972 502 238 264 1017 694 353 341 881 673 370 303 968 718 302 416
S o u r c e Labour Commissiouer,Andaman niid Nieobar Islands.
COLC

NUMBER OF ESTABLISHMliNTS HAVING CERTIFIED STz^NDING ORDERS UNDER INDUSTRIAL EMPLOYxMENT fSTANDKNG ORDERS) ACT, 1946 AND STRENGTH OF EMPLOYEES
T I ble (1 5 .1 0 )
1967 1968 1069 1070
Classificationa
c(UE
H 1)
(A30a ^
1 ^ C3
1
1. No. of establishment coming within the purview of the Act 6
2. No, of employees 22763. No. of establishment having
certified standing orders at the beginning of the year 5
4. No. of employees 19765. Estt. having stand-^ No. ofEstt. 5
ing orders in res- [ No. of em- pect of all emplo- ^ployees. 886 yees at the end of 1the year j
6. Estt. having stand-*) No.ofEstt. -ing orders in res- 1 No. of em- pect of only a gro- y ployees. — up of employees at | •the end of the year j
4880
1210915
1 6 97 2261
4880
1210750
1 6148 2153
4793
1611611
1 6* 4154 2228 1006
1511735
1155
3549
3
67289
6
134
51886
5
3540
3
67289
6
134
1
51960
5
3553
3
66804
6
1 534 2244 — 5
3602
3
66175
6
163
540 7289 — 1960 552 6804 — 2044 604 6175 — 1976 937 6746 —
1 1 1 — 1
63
COo;
S o u r c e : — Labour Commissioner,Andaman and Nicobar Islands.

T a b le ( I5.I I )
ACCIDENTS INDDSTRY-WISE
No. of Cases of injuries in respect of which final compensation paid1967 1968 iq69 I97O
Industry
CtJ(UQ
_
u o03 COh ne5 .52 H -ry
<uQ
C a;S sS5 ^5 ,52
C2 S o <u
s i4>H ^
^ § c e
g '.52Di 73
2 g o ^S5 .52
H hs
a<v
Q
c S c B
S 'St-4 CT»OJ C/}
C3oJ § O 4>
p H T3
8 10 11 12 13
I. FACTORIESI* Saw Mills — — 221 — — 212 ■— — 259 — — 2292. Marine Engine Building and repairing — — 3 — — — 1 — — — 1 —3 . Electric Light and Power — — — — — — — — — — — —4. Match Splints manufacturing — — — — — — — — — — — —5 . Motor Transport, Air Transport & Ports — — — — — — — — —• — — 16. Manufacture of Plywood 1 3 64 — — 34 1 — 51 — — 43
II. MISCELLANEOUS7. Timber Extraction (Government) 3 — 33 — — 9 4 1 24 3 — 228. Timber Extraction (Private) — — — — — — — — — — — —9. Construction Industries 3 l — 1 3 — 2 — 1 2 3 —
10 . Rubber Plantation — — 1 — — — — — — — — —1 1 . Stevedoring Industry — — — — 1 — — — — — — —
Source -Labour Commissioner,Andaman and Nicobar islands.

T a b le (15.12)
AM O U N T OF CO M PE N SATIO N P A ID — IN D U S T R Y -W IS E
Industry
a<vQ
1967
^ § a BI -SM OJd> .52 0>4 ^
aM 4)S3 6O 1>a s S rt S .2 H ^
Oj4»Q
1968
s iSU clD c/J
2 6o «S'rt 53,22 H ^
ct!Up
1969
c gS sS'S S3 Ji i T3
>> C« so 5e-SV.22 H T3
ciOia
1970
G gfi eS'STO
f i t T5
2 i
6 c*4) <«H '3
10 11 12 13
I. FACTORIES1 . Saw Mills — — 2771 — — 5751 — — I27O3 — — 76622. Marine Engine Building and repairing — 347 — — — 8000 — — — 294 —3. Electric Light and Power — — — — — — — — — — ' — —4. Match Splints manufacturing — — — — — — — — — — — —5 . Motor Transport, Air Service and Ports — — — — — — — — — — — 2896. Manufacture of Plywood 6000 49 322 — — 2ii3 6000 — 750 — — 948
II. MISCELLANEOUS7 . Timber extraction (Government) 2i000 — I4O4 — — i003 28OOO 1761 2290 21000 — 3218 . Timber extraction (Private) — — — — — — — — — — — —9. Construction Industry 20000 2O73 — 69OO 7840 — 14OOO — — 14OOO 477O —
10 . Rubber Plantation — — 197 — — — — — — — — —1 1 . Stevedoring Industry — — — — 343O — — — — — — —
Sou rce Labour Commissioner,Andaman and Nicobar Islands.

136
T a b l e (15.13)
W ORK S COxMMITTEES
1966 1967 1968 1969 1970
1. No. of Works Committees to be formed. 23 •23 26 23 28
3. No. of workers to be covered by works committees in (1) above. 14S22 14322 14959 15120 15372
3. No. of comrnittees actually formed and functioning. 14 14 15 15 16
4. No. of workers covered by works committees in (3) above 9893 9893 10899 10796 11818
S o u r c e :— Labour Comraistjiojier,Andaman and Niuobar Islands.

EMPLOYMENT
SECTION-1 6

DISTRIBUTION OF ANDAMAN AND NICOBAR ADMINISTRATION'S EMPLOYEES AS ON 31ST MARCH I971 .
T a b l e (16.1)
R E G U L A R STAFF
SI.No.
Department/Office Non-Gazetted Class III Class IV
Gazetted Class 1 Class II
Total Noil-Regular Grand (Cols. Staff Total Percentage 3— 6) (Cols. to
7- 8) total
10
1. Chief Commiti.'ioner’ s Secretariat . . . L5f) 84 5 9 253 — 253 1 300 Poorest Department • • # 463 754 10 12 1239 3100 4339 22.26;’). Office of the Deputy Commissioner 80 42 1 3 126 — 126 0 654.5.
Police DepartmentOffice of the Harbour Master
. . . 12.3S 415 2 , mtt 1662 ■■ 1662 8.53
(Shipping) * • • 49 8 2 — 59 — 59 0.306. An laman Public Works Department 527 189 10 41 767 7604 8461 43.41<. Transport Department 0 0 9 171 91 — — 26-2
7326- - 1 34
S. Medical Department • •• 229 488 13 20 750 823 4.22Amicultnre Department • •• 84 270 1 7 362 — 362 1.8«
ic . K’ducation Departmetit » . . 956 207 9 2 1174 — 1174 6.0211. Electricity Department 108 133 2 4 247 50 297 1.5212. Office ot the Labour Commissioner • • < 1; 9 4 — 26 — 2(-) 0.1413. Office of the ADC Car Nicobar • • • 5 3 1 — 9 2 11 0.06]4. Marine Office • •• 211 383 1 — 595 21 6lfi 3.1615. Office of the Distt. and Session Judge 6 8 1 — 15 — 15 0.0816. Labour Force Department 15 330 — 1 346 — 346 1.78
03CO
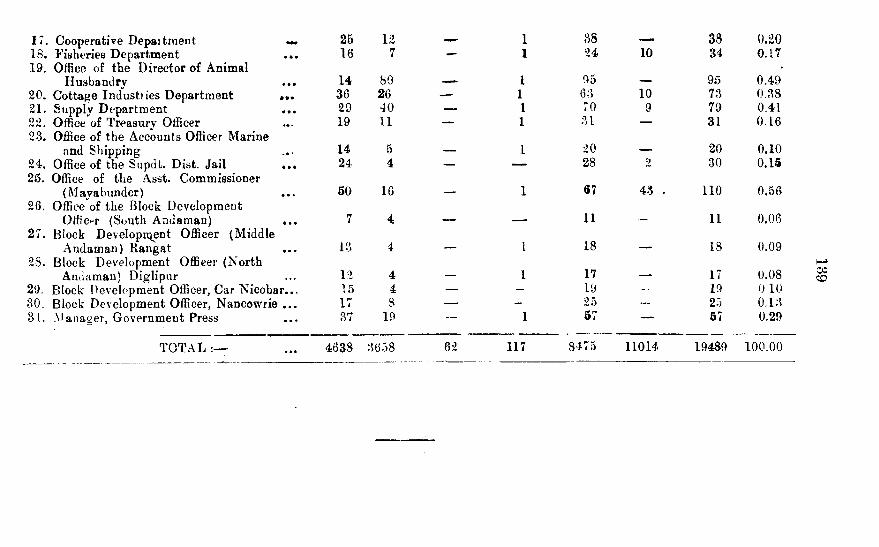
17. Cooperative Depaitraent 26 12 — 1 38 — 38 0.20IS. Fisheries Department19, Office of the Director of Animal
16 7 1 24 10 34 0,17
Husbandry 14 80 — 1 95 — 95 0.4920. Cottage Industries Department 36 26 — 1 63
7010 73 0.38
31. Supply Department 29 40 — I 9 79 0.4122. Office of Treasury Officer 19 11 — 1 31 — 31 0.1623. Office of the Accounts Officer Marine
and Shipping 14 5 — 1 20 — 20 0.1024. Office of the Supdt. Dist, Jail . . . 24 4 — — 28 2 30 0.1525. Office of the Asst. Commissioner
(Maya bunder) 50 16 — 1 67 43 . 110 0.5626, Office of the Block Development
Officer (South Andaman) . . . 7 4 — — 11 — 11 0.0627. Block Developn^ent Officer (Middle
And.amau) Rangat 13 4 — I 18 — 18 0.0928. Block Development Officer (North
Andaman) Diglipur 12 4 — I 17 — 17 0.0829. Block Development Officer, Car Nicobar... 15 4 — — 19 19 0 1030. Block Development Officer, Nancowrie . . . 17 8 — - 25 — 25 0.1331. Manager, Government Press 37 19 — 1 57 — 67 0.29
TOTAL 463S 3658 62 117 8475 11014 19489 100.00
03CO

D IS T R IB U T IO N OF A. & N. A D M IN IS TR A T IO N 'S EM PLOYEES (IN C L U D IN G N O N -R E G U L A R STAFF) A C C O R D IN G TO BASIC PAY RANGES AS ON iUst M A R C H , I9 7 l ‘
T a b l e (16.2)
Departmeut/Office ua1 o
o5 g r—<
9oo
s
o
5C*
oo S<
s
o
1 . 3 5oo
:= O 3 'M«or—•o o o o^ in r>i N
oo o O M o
1 2 3 4 5 6 r»i s 0 10 11 12 13 14 15 16
1. C. C^s. Secretariat IS 66 71 45 28 3 11 6 4 1 2532. Forest Department 1623 1224 1086 288 74 17 9 6 6 4 2 — 4339'?>. Office of fheD y. Commissioner 11 32 56 14 7 0 — 2 1 1 — — — 126■i. Police Department5. Office of the Harbour Master
84 1200 199 55 89 21 10 3 1 — — — — 1662
(Shipping) 4 1 39 8 2 3 — — — 2 — — — 596. Andaman Public Works Deptt. 5777 1308 926 123 252 21 19 17 8 5 ,— - _ 8^617. Transport Department 26 60 77 66 31 I 1 — - — — — __ 2628. Medical Department 1S5 390 82 89 31 23 10 12 I — — — 8239. Agriculture Department 269 1 63 - 21 — — f"i 1 — _ — __ 362
10, Education Department 60 147 632 I l l 173 29 • 4 9 — - — — __ 117411. Electricity Department 50 133 82 13 13 — — 4 — ou — — — 29712. Office of the Labour Commissioner j 7 10 —• 3 1 2 L — --- — — — 2613. Office of the ADC, Car Nicobar 3 3 1 1 1 1 — — \ __ — _ _ 1114. Marine Office15. Office of the District and Session
62 251 197 89 6 3 — — 1 — — — 616
Judge 6 2 •) 1 2 1 — __ — 1 __ _ _ 1516. Labour Force Departmett — 325 17 1 0 — — 1 __ ____ - -- _ _ _ 34617. Co-operative Department — 12 9 1 15 — — 1 38
s

18. Fisheries DepMrtment19. Oilice of the Director of Animal
Husbandry20. ( ’ ottage Industries Department21. Supply Department•22. Office of the Treasury Officer ... 2?) Office of the Accounts Office-,
Marine and Shipping 2<. Office of fhe Superiutendent,
Dirftrict Jail25. Office of the Asst. Commissioner
(iVIayabnnder)26. Office of the Block Development
Officer (South Andaman)27. Office of the Block Development
Officer (.Middle Audamau)Kan gat
28. Block Development Officer, (North Andaman) Diglipur
29. Block Development Officer, Car Nicobar
30. Block Dpvelopmeut Officer,- Nan cowrie
31. Manager, Govt, Press
Total
12 5 10 I •2 3 1 — — - — — — 34
20 58 9 0 ~ » T) 1 9513 19 26 8 2 2 3 — — — — — — 7326 19 7 2 1 — 1 —■ — — — — 795 6 4 14 1 — — 1 — — — — — 31
-- 5 8 3 3 — 1 — — — — — — 20
1 17 10 1 — — 1 — — — — — — 3 0
46 3 0 23 7 > 1 — 1 — - — — — 110
4 — 3 3 I — — — — - - ' — 11
3 3 6 3 2 1 18
3 a 6 2 0 1 1 — — — — — — 17
3 1 1-2 1 2 - — — — — — — 19
5 6 10 1 3 — — .— — —■ — — — 252 17 ' 31 4 2 — — I — — ' — — 57
33> 5354 3726 967 771) 140 70 73 19 20 •) — 1 19-]80

D lS T R llU ir iO X OF A. & N. ADMINISrilxVTION^S EM PLO YEES (IN CLU D IN ^j N ON -RE JULAR STAFF) ACCORDING/ TO TO TAL EM OLUM ENTS AS ON 31ST M ARCH , 197L
T a b l e (16.3)
SI. Depaitmenf/Office No.
lOt—o
ooto
ot—1 1oo—1
o(NOo
ooCO1oo<M
o. o1ooCO
o
oo o
o0
1 r-
oo»<:)oo
o
oovS
©
oo
oo'iC'oic
1 2 3 4 5 6 7 8 9 10 11 12 13 14 15 16
1. C. C'/s Secretariat -- 67 72 63 16 19 11 _ 4 1 2532. F'^rest Depirtment3. Odice of the Deputy
!. 3 175 2496 1053 442 82 42 29 8 7 I 2 4339
C )mmis-sif ner .. — — 2 32 65 13 7 3 2 1 1 — — 1264, L’olice Dep*rtment5. Office of the Harbour Master
— — — 778 618 138 87 33 4 —— — — 1662
(Shipping) .. — — — 5 40 8 — 4 — 2 — — 596. A ndaman Public Works Deptt. .. — 28 5333 1814 855 207 112 80 20 10 . 2 — — 84617. Transport Department .. - — 11 80 70 74 24 2 1 — — — — 2628. Medical Department .. 30 — 73 443 127 60 28 29 18 14 1 — — 8239. A 'riculture Depaitrnent — — — 270 84 — — — 3 5 — — — 362
10. K hication Department — — 207 595 246 92 23 2 * 9 — — — 117411. Fl-.“cfricity Dt^partment12. Office of tlie Labour
— 50 133 82 13 13 4 2 297
Commissioner — __ __ 9 10 1 2 2 2 --- — — 2613. Officpof the a DC Car Nicobar .. — ■ — 2 3 1 1 3 — — 1 — — 1114. Marine Office — 21 349 34 120 82 9 — 1 — — 616
to

15. Office of the Distt, and Session Judge
16. Labour Foice Department17. Co-opeiative Department18. Fisheries Department19. Office oF the Director of
Animal Husbandry20. Cottage Industries Departmeni21. Supply Department22. Office of Treasury Officer23. Office ( f the Accounts Officer
Marine and Shipping24. Office of the Supdt.
Dist. Jail2B. Office of the Asst.
Commissioner Mayabunder26. Office of the Block
Development Officer,(South Andaman)
27. Block Development Officer (.Middle Andaman) Rangat
iS. Block Development Officer, (North Andaman) Diglipur
29. Block Hevelopment Officer, Car Nicobar
50. Block Development Officer, Nancowrie
31. Manager, Government Press
Total
— — — 7 a 1 1 2 — — 1 — — 15— — — :i;iO 12 1 2 — I — — — 346
» 1 — 9 \) 1 3 14 1 — — — — 38• ' — — 10 11 8 — 4 1 — — — — S4
____ 65 22 2 4 0iV ____- — _ — 95.— — 10 n 26 9 2 5 - 73— — 9 84 10 1 1 1 — — — — 79— — — 7 9 10 4 1 — 31
. — — — 5 7 4 2 1 1 — — — 20
. — — 2 9 18 — — I — — — — — 30
— 36 7 11 17 26 9 3 1 — - — _ 110
— — — 4 3 3 1
— — 4 1 9 1 2 1
— — — 3 3 5 3 2 1 — - - - 1 7
— — 4 8 5 2 — — — - — ~ 10
— — — 6 6 9 1 3 — — — - -- 25
— — — 14 33 7 1 1 1 — - - - 57
33 261 7998 5783 3314 1128 543 279 78 55 14 2 1 19489
CO

D IS T R IB U T IO N OF A N D A M A N A N D N IC O B A R A D M IN ISTR A TIO N 'S E M P LO Y E E S (R E G U L A R O N LY) B Y S E X A N D CLASS OF A P P O IN T M E N T AS ON 31st M ARCH . 19 7 1
T a b l e (I6 .4 )
{ l300
1
• Department
(lazetted Non-Gazetted I All (yla>ses
M F Total
Class III Class IV1 .
M 'rotalM F Total M F Total
1 2 ‘ 3 4 & 6 7 8 9 10 11 12 13 14
1 . c C^s. Secretariat 14 14 134 21 lo5 84 84 232 21 253'Z. Forest Department — 22 44-2 21 463 753 1 754 1217 22 12393 . Office of Deputy Commissioner ... 4 — 4 69 11 80 42 — 42 115 11 1264. J^olice Department 9 — 9 1238 — 1238 415 — 415 1662 — 16626. OlHce of the Harbour Master (Shipping) 2 — • 2 44 5 49 8 — 8 54 5 59t). Andaman Public Works Department . 51 — 51 479 48 a27 189 — 189 710 48 7677. Transport Department — — — 167 4 171 ‘•1 — 91 268 4 2628. Medical Department U 9 83 146 83 229 389 09 488 559 191 7509. Agriculture Department 8 — 8 78 6 84 270 - 270 356 362
lU I'Jdtication Department 11 — 11 682 274 966 191 16 207 884 290 1174U . j .lectricitv Department . . . 6 - 6 103 5 108 133 — 133 242 5 24712. Office of the Laboui' Commissioner ... 4 — ■ 4 11 .> 13 0 — 9 24 2613. Office of the ADC, Car Nicobar 1 — 1 4 1 5 — 3 8 I 914. Marine Office 1 I 201 7 211 383 — 383 588 7 59515. Office of the District and Session Judge 1 — 1 6 — 6 8 — 8 lb — U

16. Labour Force Department ^ 1 14 1 15 330 — 330 345 1 34617. Co'oparative Department — I 23 2 25 1 2 12 36 2 3818. Fisheries Department19. Office of the Director of Animal
1 1 16 — *16 7 7 24 w 24
Husbandry 1 — 1 13 1 14 80 — 80 94 1 9520. Cottage Industries Department 1 1 31 5 36 26 — 26 58 5 6321. Supply Department I — 1 26 3 29 34 6 40 61 9 7022, Office of Treasury Officer23, Office of the Accounts Officcr, Marine
1 1 19 -- 10 1 1 n 31 31
and Shipping 1 — 1 1 1 3 14 5 — 5 17 3 2024. Office of the Supdt. District Jail 23. Office of the Assistant Commissioner
--- — 22 2 24 4 4 26 2 28
(Mayabunder^26. Office of the Block Development Officer
1 1 46 4 60 16 —- 16 63 4 67
(South Andaman)27. Block Development Officer iMiddle
4 3 7 4 4 8 3 1 1
Andaman) (Rangat)28. Block Development Officer (North
I 1 1 1 2 13 4 w—— 4 16 2 18
Andaman) 1 — 1 10 2 12 4 — 4 15 2 1729. Block Development Officer, Car Nicobar — — — 12 3 15 4 — 4 16 3 1930. Block Developmr^nt Officer, Nancovprie — — 15 2 17 8 — 8 23 2 2531. Manager, Govt. Press 1 — 1 37 — 37 19 — 19 57 — 57
Total 170 9 179 4117 521 4638 3536 122 3658 7823 652 8475

DISTRIBUTION OF ANDAMAN AND NICOBAR ADMINISTRATION’S EMPLOYEES (REGULAR ONLY)ACCORDING TO MARITAL STATUS AS ON 31ST MARCH 197I
'F a b le (16.6^
NON-O.AZETTEDGA ZETT hlD
s Clas
1tm
??
s I I I
saD
A All Classes
SI. Department No.
r
C3
1ntm(625
D
Total TotalT3_o>'Sa
1Urn
odsa
D
Total
1Uc3a
Total
1 2 3 4 5 6 7 8 9 10 11 12 13 14
1 . Chief Commissioner Secretariat 1 : 1 14 121 34 165 68 16 84 202 51 2532. Forest Department
Office of Deputy w'ommissioner... 21 1 22 390 73 463 575 179 754 986 253 1239
4 — 4 33 47 SO 23 19 42 60 66 1264.•').
Police Dt'partmentOflfice of the Harbour Master
...* 8 1 9 ^ 9 2 6 . 312 1238 324 91 415 1258 404 1662
Shipping 2 2 25 24 49 6 2 8 33 26 596. Andaman and Public Works Deptt. ... 48 3 51 290 237 527 151 37 189 490 277 767« . Transport Department — — — 144 27 171 66 25 91 210 52 262S. Medical Department . . . 31 2 33 193 36 229 427 61 488 651 99 750
Agriculture Department 7 1 8 70 14 84 200 70 270 277 85 36210. h-dueation Department 11 — 1 1 436 520 956 149 08 207 60 d 578 11741 1 . Electiicity Department 5 1 6 77 31 108 66 68 133 147 100 24712. OlKce of the Labour Comjoissionei 3 1 t 8 5 13 7 0 9 18 8 26l.’i. Office of the ADC Car Nicobar 1 — 1 5 — . 5 3 — 3 9 _ 914. Marine Office 1 — 1 114 07 2 1 1 170 213 383 •285 310 69615 Offiee of the Histt. & Session Judge; 1 — I 4 2 6 6 .‘i 8 10 5 15
ON
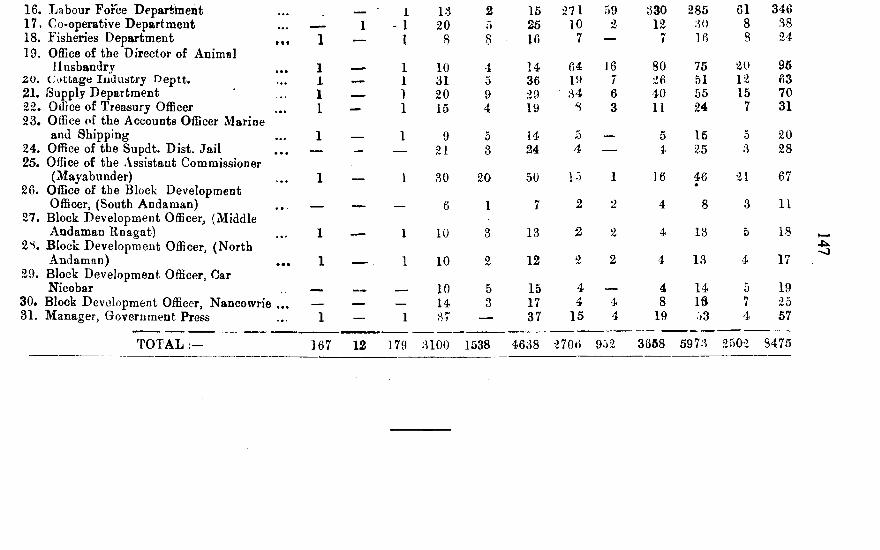
16. Labour Force Departhient17. Co-operative Department18. Fisheries Department , , ,19. Office of the Director of Animal
Husbandry20 . Cottage Industry Deptt.21. Supply Department2^. Odice of Treasury Officer23. Office of the Accounts Officer Marine
and Shipping24. Office of the Supdt. Dist. Jail25. Office of the Assistant Commissioner
(Mayabnnder)26. Office of the Block Development
Officer, (South Andaman)27. Block Development Officer, (Middle
Andaman Rnagat)•2 S. Block Development Officer, (North
Andaman) , , ,29. Block Development Officer, Oar
Nicobar30» Block Development Officer, Nancowrie ... 31, Manager, Government Press
TO TAL
i 13 2 15 271 59 330 285 61 346_ 1 - 1 20 o 25 10 2 12 30 8 38
1 — 1 8 8 16 7 — 7 16 8 24
1 1 10 4 14 64 16 80 75 20 951 1 31 0 36 19 7 26 51 12 631 .-- 1 20 9 29 34 6 40 55 15 701 — 1 15 4 19 8 3 1 1 24 7 31
1 1 9 5 14 5 _ 5 15 5 20—- - — 21 3 24 4 ---- 1. 25 3 28
1 — I 30 20 50 lo 1 16 46• 21 67
— — — 6 1 7 2 2 4 8 3 1 1
1 ---- 1 10 3 13 2 2 4 13 5 18
1 ---- . 1 10 0 12 0/V 2 4 13 4 17
__ 10 5 15 4 -- 4 14 5 19_ _ -- 14 3 17 4 4 8 IS 7 25
1 — 1 — 37 15 4 19 >3 4 57
367 12 179 3100 1538 4638 270d 952 3668 5973 2502 8475
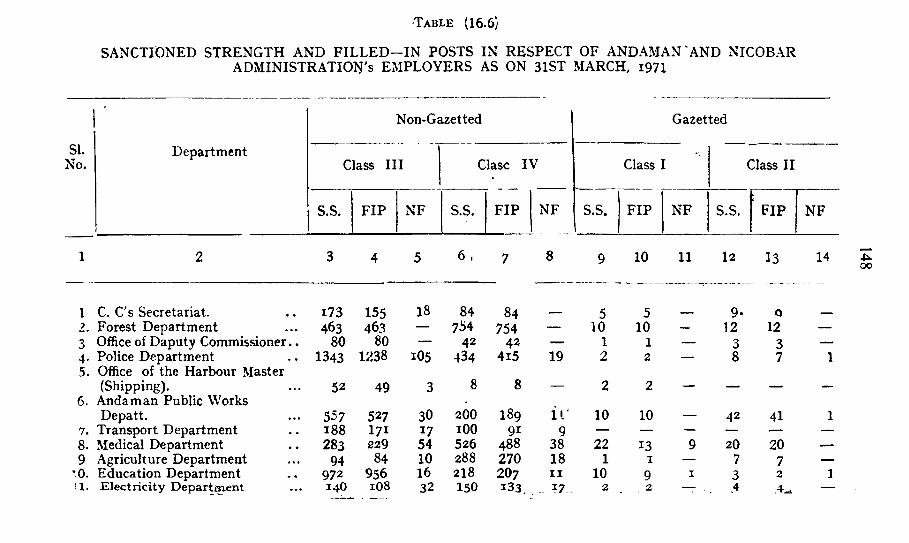
SAN CTIO N ED STR E N G TH A N D F I L L E D -I N PO STS IN R E SPE C T OF A N D A M A N 'A N D N IC O B A R A D M IN ISTR A TIO N 'S E M P L O Y E R S AS ON 31ST M ARCH, i971
■Ta b l e (16 .6}
Non-Gazetted Gazetted
SI. DepartmentNo. Class III Clasc IV Class I Class II
S.S. FIP NF S.S. FIP NF S.S. FIP NF S.S. FIP NF
1 2 3 4 5 6 . 7 8 9 10 11 12 13 14
1 C. C's Secretariat. 173 155 18 84 84 5 5 9 . 02. Forest Department 463 463 — 754 754 — 10 10 — 12 12 —3 Office of Daputy Commissioner. . 80 80 — 42 42 — I 1 — 3 3 —4- Police Department 1343 1238 105 434 4i5 19 2 2 — 8 7 15. Office of the Harbour Master
(Shipping). 52 49 3 8 8 — 2 2 — — — —6 . Andaman Public Works
Depatt. 557 527 30 200 189 1 1 ' 10 10 — 42 41 17 . Transport Department 188 17 1 17 lOO 91 9 — — — — — —
8. Medical Department 283 229 54 526 488 38 22 13 9 2O 20 —
9 Agriculture Department 94 84 10 288 270 18 1 I — 7 7 —
’ 0. Education Department 972 956 16 218 207 I I 10 9 I 3 2 11. Electricity Department 14O 1 O8 32 150 133 ^7 2 2 — . 4 .4^ —
4^oo

X Z'. v /m c e o i m e j - ,a D 0 u r i ,0 m r a r 5 r
sioner . . i 3 1 3 — lO 9 i 6 4 2 — — —13 . Office of the ADC. Car N icobar . . 6 5 i 3 3 - — i i — — — —14 . Marine Office ... 2 I I 211 — 383 383 — 1 1 — i — i1 5 . Office o f the Distt. and Secssion
Judge .. . 6 6 — 8 8 — I I — — — —16 Labour Forec Departm ent . . 1 7 1 5 2 330 3 3 O — —- — — i 1 —1 7. Co-operative Departm ent ... 28 25 3 I 2 i2 — — — — i i —18. Fisheries Departm ent . . I 8 1 6 2 7 7 — — — — I 119. Office of the D irector o f Animal
H usbandry . . 2O i4 6 85 80 5 — — — 1 i —20. Cottage Industry D eptt. ... 36 36 — 26 26 — — — — i i —2 1 . Supply Departm ent ... 3 1 29 2 42 4O 2 — — — 1 1 —2 2 . Office o f Treasury officer ... i9 19 — 11 1 1 — — — — 1 i —23. Office o f the Accounts Officer
Marine and Shipping ... 1 4 i 4 — 5 5 - ^ — — — 1 i —24. Office o f the Supdt. Dist. Jail . . 24 24 — 5 4 1 — — — — — SI25. Office of the Asst. Commissioner ^
(Mayabunder) •• 55 50 5 i7 16 1 _ — — l i —26 Office of the B lock Developm ent
Officer, (South Andaman) ... 8 7 I 4 4 — — — — — — —27- B lock D evelopm ent Officer
(Middle Andam an) (Rangat) ... 1 7 13 4 4 4 — — — — i i —28 B lock Developm ent Officer,
(North Andaman) . . 12 I 2 4 4 — — — — i i —29. B lock D evelopm ent Officer,
Car N icobar . .. 19 1 5 4 4 4 — — — — — — —30. B lock Developm ent Officer,
Nancowrie ... 18 1 7 i 8 8 — — — — — — —31. Manager Govt. Press • • 40 37 3 19 I 9 — — — — i 1 —
T otal 4957 4638 3^9 3 7 9 i 3658 133 74 62 1 2 1 2 I 1 I 7


S E C T IO N -1 7
PLANNING AND DEVELOPMENT


1 5 3
T a b l e (17.1)
FOURTH F IV E Y E A R PLAN AN D A N N U A L PLAN 1970-71A LLO TM EN T
(Rs. in Lakbs.)
SI.X o .
Sector. Annualplan
1970-71
percentage to total
Fourth Five year plan 1969-
70 to 1973-74
Percentage to
total
1 . 2 3 4 5 6
1 . Agricultural programme 24.422 7.89 126.440 8.962 . Co-operation and Com
munity Development 6.580 2.13 32.900 2.35Irrigation and Power 12.000 3.88 55.000 3.03
4. Industry and Mining 0.590 0.19 5.110 0.365. Transport and Communica
tion 145.530 47.03 774.203 55.306 . Social Services 114.828 37.11 389.247 27.807. Miscellaneous 6.470 1.77 18.100 1.30
Total :^09.420 100.00 1400.000 100.00
S ou iU 'E :— Chief Commissioner's Seoretaiiat, Andaman and Nicobar Administration.
T a b l e (17 2 )
SECOND F IV E Y E A R PI.AN— ALLOTM ENT AND E X P E N D IT U R E(Rs. in Lakhs.)
SI. Head N o.
Plan provision (19£6-61)
Expenditure(1956-61)
Percentage of Col. 4 over
Col. 3
1 2 3 4 5
L AG H IC U LTU R A L PROGRAMxMES :(i) Agricultural Production 20.00 11.16 55.S0
(ii) Minor Irrigation 6.50 0.01 0.15(iii) Soil Conservation *5.60 0.42 7.50(iv) Animal Husbandry 3.80 2.00 52.63(v ) Dairy and Milk Supply 5.00 0.17 3.40(vi) Fisheries 1.75 2.36 134.86
(viii) Forests 80.00 12.37 15.46(viii) Land Resettlement and Coloni
satioD 130.00 9L17 70.13
T o t a l 252.65 119.6G 47.36* lacluding land Development

1 5 4
I 3 8 4 5
2 CO-OPERATION AND C. DK V E L O l ’ME N T :(i) Co-operation 0.75 0.77 102.67
(ii) Communitj' Development 10 .2 1 ll.fiO 113.61(iii) Panchayats — — • —
T o t a l 10-96 12,37 1 1 2 S6
8. IR R IG A T IO N A N D POW ER ,
(i) Irrigation — — —(ii) Flood Control — ■ — —
(iii) Power 2.50 0.92 36.80
T o t a l 2.50 0.92. 36.80
4. IN D U STR Y AiND M IN IN G :(i) Large and 'viedium Industries —; — —
(ii) Mineral Development 7.00 3.19 45.57(iii) Village and Small Industries — — ■ —
T o t a l 7.00 3.19 45.67
5. TRAiNSPORT AND COAJMUNICATAION : fi) Roads 85.00 80.90 '.)6.18
(ii) Road Transport 1.00 1.26 126.00(iii) P(uts and Harbours — —
(iv) Other Transport (Shipping) 154.00 99.01 64 29(v) T onri.sni — . ■ — —
! : T o t a l 240.00 181.17 , 75.49
6. SO CIAL SERVICES :(i) General Education 27.40 1 1 .02 '40.22(ii) Technical Education and
Scientific Research — — —(iii) Cultural Programmes — — — •(iv) Health 25.30 11.32 44.74(v) Housing and Urban Dev. '32.92 23.86 72.48 .(vi) Welfare of Backward Classesi 1.00 0.46 46.00(vii) Social Welfare — _ —
(viii) Labour and Labour W^elfare — — —
T o t a l 86.62 46.66 53.87
7. M ISCELLANEOU S :(i) Statistics i— —
(ii) Information and Publicity 0.60 0.44 73.33(iii) Local Bodies 2.00 .— —
(iv) Others 0.81 0.46 56.79
T o t a l 3.41 0.90 26.39
Grand Total 603.14 364.87 60.50

155
T a b l e (17.3)
T H IR D F IV E YEA R P L A N — A L L O T M E n T AND E X P E N D I T U R E
(Rs. iu Lakhs)
SI. Head/Sub-headNo.
l lau Expenditure Percentage Provision (1961-66) of Col. 4 (1961-66) over Col. o
L Agricultural Progra.rames : ?.53.788 130.485 50.62
1. Agricultural Production 53.947 ;^3.5752. Minor Irrigation — — —
3. Soil Conservation 9.983 2.526 25 304. Animal Husbandry 4.420 6.927 156.725 . Dairj-ing and Milk-Supply 3..') 00 0.054 1.546. Forests 56.818 43.985 77.417. Fisheries 14.770 5.474 37.068. Ware Housing and Marketing — — —
9. Land Resettlement and Coloribation 110.350 37.944 34.39II. Co-operation and Community
Development 3L980 30.155 94.29
1. Co-operation 3.960 187 50£. Community Development 26.020 20.453 8L753. Pancbayats 3.000 2.277 75.90
IIL Irrigation and Power : 14.350 1L521 80.29
1. Power 14.350 1L521 80.29IV . Industry and Mining : 14.760 10.362 70.20
1. Village and Small Industries 13.320 9.413 70.672. Industry (Metric system) 1.440 0.949 65.90
V. Transport and Communications : 514.00 323.036 62.85
1, Road 238.000 251.048 105.482. Road Transport 10.000 9.099 90.093. Ports and Harbours — — —
4. Other Transport (Shipping) 263.000 59.643 22.675, Tourism 3.000 3.246 108.20
VI» Social Services : . 132.890 121.850 91.69
1. General Education 56.760 57.892 101.992. Health 50.750 57.305 112.913. Housing 16.000 0.694 4.344. Welfare of Back-ward Classes 6.500 4.296 66.096 . Social Welfare 0.100 —
6, Labour and Labour Welfare 2.780 1.663 59.82V II . Miscellaneous ; 17.552 8.793 50.10

156
1 2 3 4 5
1. Statistics2. Information and Publicity3. Local Bodies4. Others
0.4103.000
10,3583.784
0.2200.4507.1171.006
53.6615.0068.7126.59
Grand T ota l: 979.320 636.202 64.96
1. Development of Minor Ports 3. Rural Water Supply3. Miscellaneous Housing Schemes4. Centrally Sponsored Schemes*
42.5805.000
16.1374.968
11.321
37.8999.36
* (Includes development of Consumer ment of Soil condition).
C’o-operative Stoies and immproVC'
T a b l e ( 17.4)
O U TLAY, SANCTIONED BUDGET A N D EXPENDITURE IN CURRED D U R IN G 1970-71 ON IM PLEM ENTATION OF PLAN SCHEMES
(R s . in la k h s)
SI. Name of Sector No.
Approvedoutlay
Sanctionedbudget Expenditure
1. Agricultural Production 4.934 ) r 4.3292. Soil Conservation 1.200 V 3.836 \ 0.3663. Minor Irrigation - ) ( 0.0544. Animal Husbandry 2.514 0.937 1.3165. Dairying and Milk Supply 0.713 0.713 0.0676. Forests 14.150 10.000 13.3767, Fisheriess 0.911 1.014 0.3678. Co-operation 2.180 1.310 1.4469. C, D. Blocks 4.000 j.950 3.199
10. Panchayats 0.400 0.400 0.400LI. Power 2 000 5.480 8.630L2 . Ijidustries 0*590 0.440 0.40013. Roads 83.000 95.670 62 250L4. Ptoad Transpoit 7.630 8.760 3.11215. Ports aj;d Harbours 36.500 25.000 34.31316. Shipping 17.000 24.700 0.38117. Touri.m 1.40<‘ * 0.01218. Eciucation 20.068 13.757 25.98219. Medical 7.000 1.974 7.69620. Water Supply 82.340 66.2.: 0 76.0452 1 . Housinji 2.500 1.900 1.09422. Bock ward Classes 1.340 1.000 0.84323. Social Welfare 0.2 B0 0.200 0.35724. Labour & Labour Welfare 0.400 0.06(1 0.025

157
1 3 8 5 5
25. Statistics 0.070 0.070 0.02026. Publicity and Inforrnatioii 1.640 0.930 0.98727. Local Bodies 2 .:V>0 2.160 1.16028, Govt. Press L440 0.680 0.105
Bulidings * @ 28.030 @
Grand Total 800.420 300.071 248.832
SouRc:— Chief Commissioner s Sectt.,Andaman and Nicobar Islands.
' Included in the bmlding giant.@ Included in the Sectorwise outlay
and expenditure.
T a b le ( I 7 . 5 )
BLOCKS AT A GLANCK—1970-71
ItemSouth
AndamatiBlock
Car North Middle Nicobar Andaman Andaman Block Block Block
NancowrieBlock
1 3 4 5 6
1. Block Headquarters Wimber- Big-la- Diulipur Ran gat Kamorta
2,. Villages coveredlygunj
84pati
15 30 45 1453. Population served 1061
Census 16729 0869 6199 7190 46734. Seed Multiplication Farms 1 — — 1 —5. Fruit Trees Planted 2024 464 719 400 10376 . Veterinary Dispensaries
Functioning 7 3 5 5 6(a) Full Fledged 1 1 I 4 4(b) Peripatetic or stock men
centres/outposts 6 2 4 I •)7. SCHOOLS 45 12 30 39 178 . Scholars (a) Boys 1506 889 1246 1698 325
(b) Girls 1289 489 7P6 1126 166Total 2795 1328 2012 2824 491
9. Teachers (a) Male 96 49 96 1 2 1 30(b) Female 42 14 9 22 2
Total 188 68 105 143 3210. Liteiacy (^enl res functioning 5 10 4 1 1 4

158
1 •1 3 4 5 6
11. Reading Rooms and Libraries Piinetioning 1 10 8 23 5
12. Youth Clubs 10 15 10 — 1 113. Membership in youth Clubs 140 150 275 — 13414. Cultural Centres — .— 10 —
15. Mahiia Sarnities/.VIandals ' Functionin;i 2 15 5 10
16. Membership in (16) 30 375 85 200 —17. Credit co-operative
Societies Functioning 19 17 1218. Farming' Co-operatives
PunctiouiD” 7 I ■19. Other (including Multipur
pose co-operatives) 1 1 20 4 22 1320 . Membership in (17) 567 — 1869 826 —
2 1 . ^Membership in ( 18) 349 — — 1 1 0 —2 . Membership in (19) 629 786 10 7244 347
S ou rce :— Block Development Officer, South Andnman.B. D. O. Nancowrie.B. D. 0 . Car Nicobar.B. D. O. North Andaman. B. D. O. Middle Andaoian.

SE C TIO N - 18
FOODGRAINS AND PRICES


W H O L E S OF F O O D G R A IN S A T PO R T B L A IR D U R I N G -i9 7 0 -7 1
(In Rs. per 100 Kg.)
Month
Government stock of Foodgrains Flour per bag of 75 Kg,f
Local rice Coarse rice Med. rice Fine rice S.F. rice Wheat Atta
April, 197O 139.28 118 .43 129.93 _ _ 95.31 99.24 98.25May, 1970 139.28 120.34 131.84 I4I.26 — 97.23 10 1.28 98.25June; I97O 139.28 120.34 131.84 141.26 — 97.23 101.28 98.25July, 1970 139-28 — 13 1.8 4 141.26 — 97.23 101.28 98.25Aug. 197O 139.28 — 13 1.8 4 141.26 — 97.23 jOr.28 98.25Sept. i 9 7 0 139.28 — 131-84 141.26 — 97.23 1 O1.28 99.00Oct. I97O 139.28 120.34 131.84 141.26 149-82 97.23 IO2.71 99.00Nov. 1970 139.28 120.55 132.15 141.46 149.82 97-44 102.93 99.00Dec. I 97O 139.28 — 132.15 141.46 — 97-44 102.93 99.00Jan. 197I — — 117.19 126.59 — 82.47 87.82 99.00Feb. 1971 139.28 — 117.19 — — 82.47 87.82 99.00March 1971 139.28 117 .19 --- — 82.47 87.82 99.00
ON
Source Supply Officer,Andaman and Nicobar Islands.

162
RETAIL PRICES OF FOOD STUFFS PREVAILING AT DIFFERENT CENTRES DURING I 97O IN ANDAMAN AND NICOBAR ISLANDS
(MONTHLY AVERAGE)
T a b l e ( 1 8 .2 )
Item Prices in Rupees per Kilogram
r rPort Blair Mayabunder Rangat Diglipur Car Nicobai
A. CEREALS1 . Rice (Medium) 1.522 . Rice (Coarse) 1.333. Atta 1 .O34 . Maida I .255 . Wheat 0.98
B. PULSES1. Moong dal i.832. Masoor dal 1.603 . Urad dal 1.804 . Arhar dal I .835 . Chana dal 1.71
C. EDIBLE OILS1 . Mustard oil 6.i92 . Coconut oil 9.193 . Groundnut oil 5.934 . Vegetable Ghee 5-99
D. OTHERS1 . Chillies 10.202 . Onions I .123 . Potatoes 1 .3O4 . Salt O.3O5 . Sugar 1.9 16. Gur 1 .5O7 . Tea (Loose) 8.708. Fish (Big) 2.5O
Fish (Small) 2 .OO9 . Meat (Goat) 9.OO
10. Milk (per litre) i.401 1 . Eggs (in Rs. per 6.60
dozen)
— N o t A v a i la b le
1.44 1.63 1.27 1.621.38 1-39 1.25 1.371.10 i.iO 1.24 1.111.49 1.61 1.67 1.63
2.19 1.96 2.14 2 .152.02 1.89 1.96 1 .9O2.23 2.02 2 .1 1 2.092.18 2 .O4 2.02 22.22
T.96 2 .0.8 2.06
6.66 6.59 6.73 7.709.92 lO.OO 10.05 —6,47 6.53 6.68 5.706.51 6.42 6.90
9.39 9-47 9*35O.7P1.23 1.25 1.29
1.56 1.55 1.720.45 0.40 0.542.00 1.97 2.12 •f
— 1.54 2.58 I . .
9.16 9.64 9.53 —•,2.00 2.13 2.00 —
— 2.00 1.50 —
8.00 9.00 8.00 —
1.08 1.50 I .5O —4.00 4.80 4.00 —
Source -Supply Officer, A. & N. Islands, Tehsildar Mayabunder, Ranga Diglipur. Addl. Deputy Comm A. & N. Islands.

163
TREND OP RF.TATTi PRICES OF ESSENTIAL COMMODiriESAT PORT B LA l R
T a b l e (18.3)
(Base 1063-100)
“SI. No. Coiuinodity. 1967 1968 1969 1970
FOOD-GRAINSI. Rioe IG^.l 166.2 168.5 • 170.8
WheatPULSES
137.7 166.0 179.2 184.9
Arhar Dal 19-2.1 11)0.1 142.6 181.24. Urad Dal 217.0 183.0 145.3 169.85. Masoor Dal 223.7 IG9.9 194.6
{ i rani 266.2 248.1 177.9 172.07. Moong Dal
EDI BLR O ILS.240.2 212.0 188.U 194.8
8. ,\i ustaril Oil 181.8 159 7 104.2 194.7!). ( Jingely Oil 170.2 140.2 179.5 188.0
10 Orouud-nut Oil 205.2 160.1 205.2 239.1Coconut Oil 175.2 181.5 174.8 229.8
k VanaspathiOTHER FOOD A R riC LE S
172.1 148-9 184.2 172.1
IS. Gliee 138.9 159.0 177.9 181.614. Milk 113.5 126.1 126.1 126.115. Eggs 151.0 178-0 181.9 195.816. Fish 129.7 142.9 142.9 142.9
M eat 149.0 159.0 167.6 167.818. Potatoes 163.9 169.7 166.7 180.6ID. Onions 141.3 131.7 150.8 177.8
Banana 158.0 150.0 150.0 150.0Sagar 12L3 136.0 14 L 2 140.4
22 . Gur 140.5 194.2 144,6 124.0Salt 103.4 103.4 106.9 103.4
24. Dry Chillies 182.1 108.2 142.9 260.215, Dry Corriander 227.8 2 1 1 . 1 225.0 188.3U>. Tamarind 166.3 252.0 215.4 164.0 t . rurnieric 158.7 158.7 208.3 257.9
B. B. Tea 103.1 107.8 107.8 109.459. Cotff^ Powder
FUEL129.0 148.4 113.1 147.1
\ 0 . Kerosene Oil 108.0 120.7 127.6 139.1U. Charcoal 109.7 142.9 142.9 142.912. Fi.re-W oud 107.6 133.3 133.3 133.3
Matches (W imcoj CLOTHING
125.0 125.0 125.0 125.0
4. Dhoti 4 j'ards 130.4 i30.4 131.4 135.15. Sajee 138.5 138..'S 148.2 193.8H. Sbirtino- 197.2 197.2 197.2 197.7
{7. Co>ating 103.8 133 8 172.9 206.3

164.
38. Drills 118 3 118.3 117.0 111.439. Print for blouses 120.0 120.0 119.2 120.030. Long Cloth 181.8 151.5 175.8 264.841. Towels 156.8 156.8 156. ^ 157.142. Bed Sheets 144.4 144 4 163.9 260.243. Ghappals
S T A T IO N E R Y .107.1 107.1 112 .6 107.1
44. Pencil (Ajanta) 166.7 166.7 166.7 166.745. Ink (Rain how) 1 1 2 0 112 .0 112 .0 112 .846. Paper
CH E M IC AL A N D DRUGS.100.0 100.0 100.0 100.0
47. Washing Soda 126.7 126.7 128.0 128.048. Anaoin lOO.O \00.0 100.0 100.049 Elkosin
TO ILE T GOODSlOO.W 100.0 100.0 101.3
50. Washing Soa{) 133.8 133.8 171.0 177.451. Toilet Soap (Lux) 127.3 160.0 145.5 145.5
(Life Buoy) 127.3 160.0 145.5 146.552. Hair Oil 142.9 142.9 142.9 161.753. Razor Blades (Panama) 101.7 105.1 118.6 126.0
(6 morning) 120.0 120.0 120.0 183.554. Tooth Paste 176.5 176.5 183.5 183.5
S o u r c e Statistical Bureau,Andam an and Nicobar Islands.
T a b l e (18 .4 )
A V E R A G E A N N U A L W H O L E S A L E P R IC E S O F M I L K A N D M I L K P R O D U C T S A T P O R T B L A I R .
(In Rs. Per lOO Kg.)
M I L KA
G H E Er
Period
oU
<o
'rt
WnSO
O
ro S
^ 3 ? (f) <
• CtJ
^ G 1—1H
1966-67 1 5 0 150 N S 150 N S 1100 I 4OO 12001967-68 200 200 N S 200 N S 1650 18 OO i5 C 01968-69 1 7 5 17 5 N S 175 N S 1 6 5 0 1750 15501969-70 2 0 0 2 0 0 N S 2 0 0 N S 17 OO 18OO 16OO1970-71 2 0 0 2 0 0 N S 2 0 0 N S 17 OO iSOO 16OO
N.S. = Not soldSource :— Live Stock Officer,
Andaman and Nicobar Islands.

1 6 5
T a b le (i8.5)
AVERAGE ANNUAL WHOLESALE PRICES OF MEAT OF DIFFERENT ANIMALS AT PORT BLAIR.
(In Rs. per ] 00 kg.
Period. Venison. Buffaloe. Goat. Pig.
1966-67 300 300 800 3001967-68 400 400 900 400-1968-69 375 375 850 3751969-70 400 400 900 4001970-71 500 400 9OO 4OO
S ource :— Live-Stock Officer.
'
Andaman and Nicobar Islands.
T able (18.6)
AVERAGE WHOLESALE PRICES OF POULTRY BY TYPEOF BIRDS AT PORT BLAIR
(In Rs.)
j pe of bird Specification Average price per Unitf
------------- ■1 9 6 7 1 9 6 8 1 9 6 9 1970
Fowls Adult (each) 12.00 12 .CO 12.00 16.00Chicken „ 6.00 6.00 6.00 7.00
Ducks Adult „ lO.OO lO.OO lO.OO , 12.00Chicken „ 5.00 5.00 5.00 6.00
Geese Adult (pair) 4 8 . 0 0 48.00 48.00 48.00Chicken „ 24.00 24 00 24.00 24.00
Source :—Live Stock Officer,Andaman and Nicobar Islands.

166
T a b l e (18.7)
AVERAGE ANNUAL PRICE OF ANIMALS OF VARIOUS TYPES
(In Rs.)
Animals. Unit. 1967 1968 1969 1 9 7 0 .
CATTLEMale over 3 years(i) Breeding Bull each 9OO 900 900 9OO(ii) Bullock per pair 600 600 800 1000(iii) Not in use for breeding
work each 150 150 i50 200Female over 3 years(i) Breeding Cow 800 lOOO lOOO lOOO
(ii) Cow used in work ’ *9 250 150 150 200YOUNG STOCK
(i) Male 300 300 300 4C0(ii) Female 9$ 350 400 400 500
2, GOATS(i) Male over one year 99 90 90 9 O 10 0 ,
(a) Milk yielding 9f 90 90 9 O I 20(b) Non-milk yielding 09 75 75 75 90
3. PIG 9» q o 90 9 O 100
Source i— Live Stock Officer,Andaman and Nicobar Islands!
LOCAL BODIES
SECTION 19

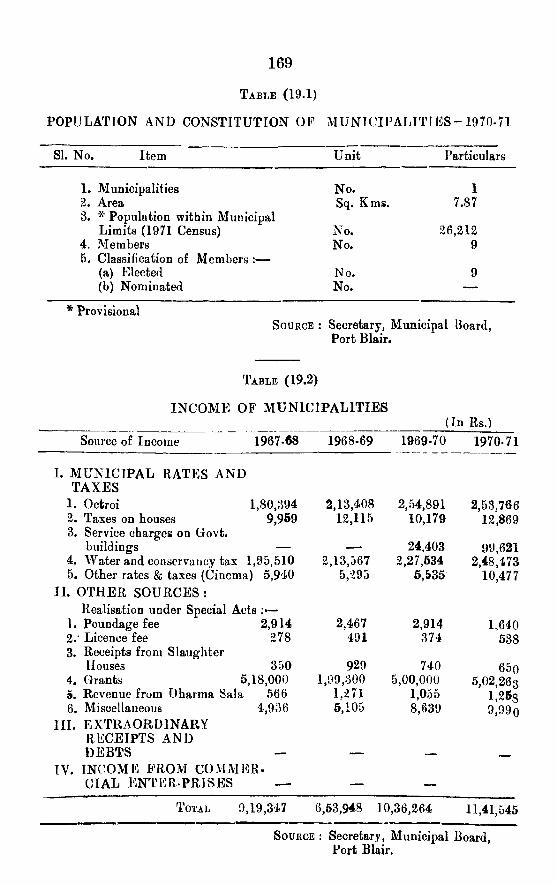
169
T a b l e (19.1)
POPULATION /VND CONSTITUTION OP M U N IC IP A L IT IK S - 1970-71
SI. No. Item Unifc Particulars
1. Municipalities No. 13. Area Sq. Kms. 7.873. * Population within Municipal
Limits (1971 Census) No. 26,2124. Members No. 95. Classification of Members
(a) Elected No, 9(b) Nominated No. —
* ProvisionalS o u r c e : Secretary, Municipal Board,
Port Blair.
T a b l e (19.2)
IN C O M E OF M U N IC IP A L IT IE S[In Rs.)
Source of Income 1967-68 1968-69 1969-70 1970-71
I. M U N IC IPA L RATES AN D TA X E S
1. Octroi 1,80,394 2,13,408 2,54,891 2,53,7662. Taxes on houses 9,959 12,115 10,179 12,8693. Service charges on Govt.
buildings — — • 24,403 99,6214. Water and conservancy tax 1,95,510 2,13,567 2,27,534 2,48,1735. Other rates & taxes (Cinema) 5,940 5,295 5,535 10,477
IL OTHER S O U R C E S :Realisation under Special Acts
]. Poundage fee 2,914 2,467 2,914 1,6402 . ' Licence fee 278 491 374 5383 . Receipts from Slaughter
Houses 350 929 740 65o4. Grants 5,18,000 1,09,300 5,00,000 5,02,2635. Revenue from Dharma Sala 566 1,271 1,055 1,25s6. Miscellaneous 4,936 5,105 8,639 9,99o
III . E XTR A O R D IN A R Y RECEIPTS AND DEBTS
IV. INCOME EROM CO M M ER-C lA L E N TE R .PR ISE S _
T o t a l 9,19,347 6,53,948 10,36,264 11,41,545
SoUKCE : Secretary, Municipal Board, Port Blair.

170
T a b l e (19.3)
E X P E N D ITU R E OP M U N IC IP A L IT IE S
(In Rs.)
Head of Expenditure 1967-68 1968-69 1969-70 1970-71
I . Current Expenditure :—1. Public Lighting and
water Supply2 . Drainage, conservancy
and sanitation3. Vaccination4. Public instruction
II . Capital Expenditure :—1 . Roads, foot paths and
culverts2. Others
II I . Extraordinary Expenditure (debts).
IV . Expenditure on commercial enterprises.
4,92,463 2,16,744 4,29,662 4,89,312
.‘^,00,6634,805
4,56321,716
3,72,673 4,18.5776,206 5,005
13,16213,700
85612,737
4,04,4176625
1,75,966
415611696
TOTAL 9,31,528 7,24,645 9,88,203 10,92,172
S o u r c e : Secretary, Municipal Board, Port Blair.
T a i l e (19.4)
P A N C H A Y A T S -A S ON 31-3.1971
(N o.)
Region
South Andaman Middle Andaman North Andaman
TOTAL
Gram Panchayats
151110
J6
Nyaya Panchayats.
151110
36
S o u r c e :— Distfc. Panchayat Officer,Andaman and Nicobar Islands.

ELECTORAL STATISTICS
SECTION— 20

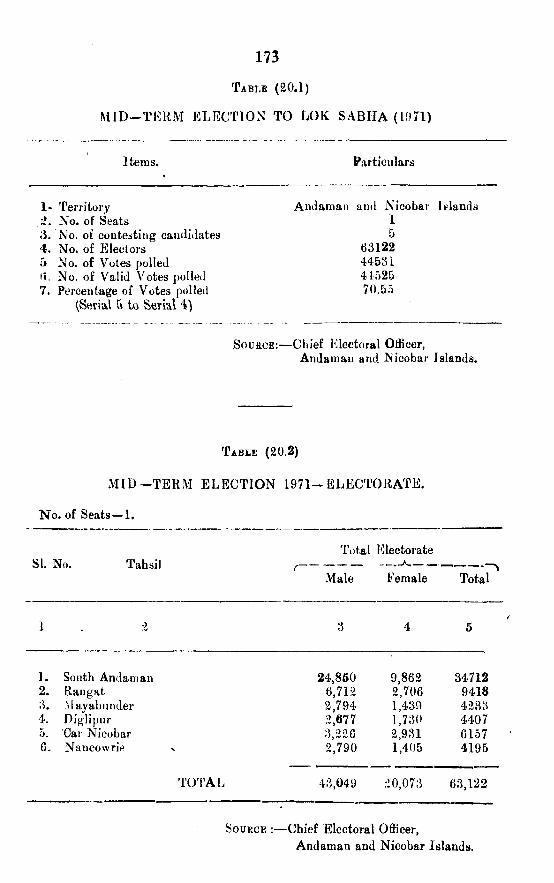
M ID --T E R M ELECTION TO LOK SA B H A (1971)
173
T a b l e ( 2 0 . 1 )
Items. Particulars
1- Territory No. of Seats
3. No. of contesting candidates4. No. of Electors5 No. of Votes polled li. No. of Valid Votes polled 7. Percentage of Votes polled
(Serial 5 to Serial 4)
Andaman and
D6 3 1 2 24 4 5 3 14152570.55
Nicobar1
I elands
S o u r c e :— Chief Electoral Officer,Andaman and Nicobar Islands.
T a b l e (20.2)
M ID — TERM E LECTIO N 1 9 7 1 - ELECTORATE.
N o. of S e a ts -1.
Total ElectorateSI. No. Tahsil ------------- --------- A-------- -----------
Male Female T o t a l
1 - 2 3 4 5
1. South Andaman 24,860 9,862 347122 , Raiigat 6,712 2,706 94183. M ayabunder 2,794 1,439 42334. Diglipur 2,677 1,730 44075. Car Nicobar 3,226 2,931 61576. Nan cowrie 2,790 1,405 4195
TO'l'AL 43,049 20,073 63,122
S o u r c e :— Chief Electoral Officer,Andaman and Nicobar Islands.
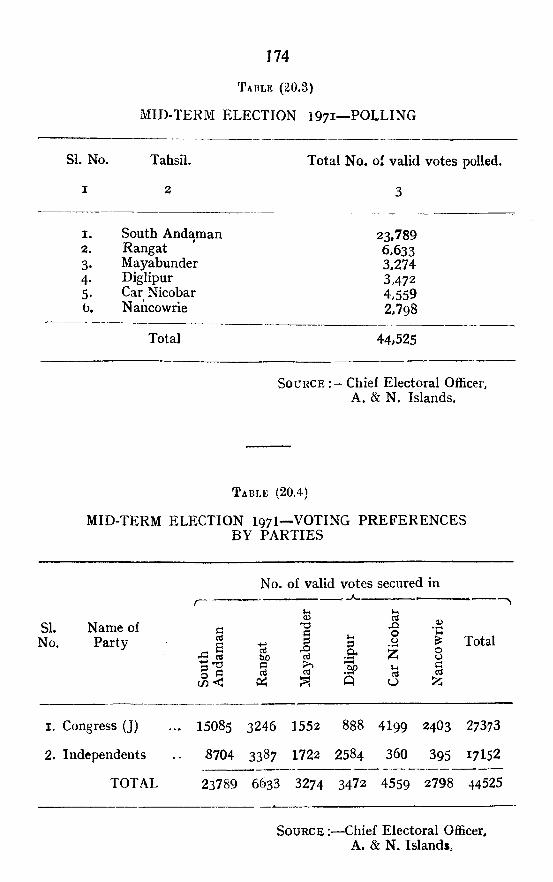
174
T a b l e (20.3)
M ID -TER M ELEC TIO N 1971— PO LLIN G
SI. No. TahsiL Total No. of valid votes polled.
I 2 3
I . South Andaman 23,7892 . Rangat 6,6333- Mayabunder 3,2744- Diglipur 3,4725 . Car Nicobar 4.559b. Nahcowrie 2,798
Total 44,525
So u r c e Chief Electoral Officer, A. & N. Islands.
T a b l e (20,4)
MID-TERM ELECTION I97I— VOTING PREFERENCESBY PARTIES
SI.No.
Name of Party
1. Congress (J)
2. Independents
TOTAL
No. of valid votes secured in ______________^ ----------------------
art
c/) <I
o3bjonrt0^
i-4<Da
rQiH
.Qh'qjoQ
03ou
nJ0
Oo«cd:z;
Total
15085 3246 1552 888 4199 24O3 27373
3704 3387 1722 2584 360 395 I7l52
23789 6633 3274 3472 4559 2798 44525
S o u r c e :— Chief Electoral Officer, A. & N. Islands,

MISCELLANEOUS
S E C T IO N -21


1 7 7
T a b l e ( 2 1 . I )
S IT T IN G CAPACITY OF CIN EM A H O USES AT PORT B L A IR
Name of Cinema House
Whetherpermanent
ortemporary
1. L ig h t H ou se P erm an ent
2. Mountbatten Talkies do.
Sitting capacity in i ------------ --------------- --
T30 >>
GinCflpj
(fl(fi 00 0<v +->Q cq tnH
•T3CO
a2
pH
1 1 6 1 1 6 1 7 4 2 6 1 8 3 S 3 7
5 1 7 3 1 4 5 2 5 0 8 0 3 9 9
T a b l e ( 2 1 . 2 )
LANGUAGE-WISE FILMS EXHIBITED IN CINEMAS ATPORT BLAIR
No. of Cinema Houses—2
No. of Films shown duringSI. No. Language
1966 1967^ -
1968 1969 1970
1 . Hindi/Hindustani/Urdu 57 63 53 4 1 9O2 . English 7
0 1 2 353 . Bengali 3 2 — —
4
4 . Tamil 5 6 3 6 155 . Telugu 3 4 3 — 56. Punjabi . — — — —7 . Malayalam 2 2 — I I
8. Bhojpuri --- — — — —
TOTAL 77 7 q 60 50 150
N o t e The information for the years 1966 to lg69 relates to one Cinema House only, ie, Mountbatten Talkies, Port Blair.
S o u r c e :— 1. Manager, Mountbatten Talkies, Pert Blair.2. Manager, Light House, Port Blair.

. 1 7 8
CINEMA STATISTICS
No. of Cinema Houses at Port Blair— 2.
T a b l k ( 2 1 ,3 ;
Year Entertainment tax collected
(Rs/)2
Total sale proceeds excluding entertaiment tax
(Rs.)3
1966196719681969
J .97O
N ote
26,027 28,701 28 955 28,15091,976
2,03,6072 .13 ,5432 , 17 .0732,09,9796,08,062
-The information for the years i966 to 1969 relates to one Cinema House only, ie Mountbatten Talkies. Port Blair.
Source :— 1. Deputy Commissioner,A. & N. Islands,2. Manager, Mountbatten Talkies,
Port Blair.3. Manager, Light House Cinema,
Port Blair.
T a b l e (21.4)
CENSUS HOUSES AND THE USES TO WHICH THEY AREPUT—1961 CENSUS
Item Rural Urban Total
TOTAL No. OF CENSUS HOUSES 10.456 3.397 13-8531. Vacant houses 624 284 90S2. Dwellings 8,705 2,580 11,2853 . Shop-Cum-dwellings 207 237 4444. Workshop-cum-dwellings 5 3 85 . Hotels, Sarais, dharamshalas, tourist
homes and inspection houses 3i 21 436. Shops excluding eating houses 119 31 1507 . Business houses and offices 73 32 105k Factories, workshops and worksheds 33 25 589. Schools and other educational institutions 78 2i 99
lO. Restaurants, Sweetmeat shops & eating places 6 — 6I I . Places of entertainment & community gathering 78 i3 9i12 . Public Health and Medical institutions 64 6 7013. Other 433 153 586
S o u r c e Census Report I 961,Andaman and NiGobar Islands.

T a b t j ? ( 2 1 . 5 )
COLLKCTION U N DER SM ALL S A V IN G ACCOUNTS AND SKCURTTIES
[In Rupeex]
Item1966-67
___1967.68
/ __ 1968-69---- K___
1969-70 1970-71
Net C'1088 Net Gross Net Gross Net Gross Net
1. Post Office Saving Bank Accounts
2. Cumulative Time- Deposit Accounts
3. All Postal Certificates4. Recurring Deposit
Accounts5. rim e Depo&its
1. Post Office Saving Bank Accounts
2. Cumulative Time Deposit Accounts
3. Recurring Deposit Accounts
15,27,664 l,9o,OS7 18,47,773 4,19,150 22,64,766 -2.72,83;^ 24,35,485 3,41,633 26,78,->33 6,08,?70
1,16,127 91,994 1,66,412 1,21,350 2,27,593 1,84,17019,730(-)36 ,222 26,555( - )15,561 27,630(_)20,188
1,252 Accounts
427 Accounts
NO. OF NEW ACCOUNTS
1:595 Accouu^ 1,596 Accounts
562 Accounts *44 Accounts
2,83,046 2,26,839 55,486(— )4i»,240
1,516 Accounts
393 Accounts
3,28,752 1,71,13714,625 6,4U5
19,920 19,420 17,150 17,150
1,499 Ac«H»unts
266 Accounts
278 Accounts
■-0
SouKCE Organiser, Small Savings, Port Blair.

SU GAR IM PORT STATISTICS
180
T / b l f (21 6 )
■ Period Sugar '• Molasses Total
19(36- 67 1,234 357 1,5911967— (i8 1,448 — 1,4481 9 6 8 -6 9 1 , 100 1,4231969— 70 1,510 288 1,7981 9 7 0 -7 1 2,020 242 2,262
* Molasses iiieluAe guT, rab anti jaggery.
S ou rce : — Supply Officer,Andaman and Nieobar Islands
T a b l e (21.7)
M O N TH LY A V E R A G E SUPPLY AND CONSUMPTION OP DRINtCINGi W ATER a t PORT B L A I R - 1970-71
{In Million gallons)
x\f0Dth Quantity available for distribution Quantity consumed]
April 1970 12.65 7.50May 1970 5.59 7.78Jane 1970 15.16 9.18July 1970 45.33 10.35August 1970 105,44 11.90September 1970 106.28 12.00October 1970 117.36 13.50November 1970 114.81 13.50December 1970 11L82 13.95J anuary 1071 101.04 13,95February 1971 81.07 12.60March 1971 64.45 13.95
S o u r c e ;~Principal Enaineer,A .P .W .D ., Aniianian and Nioobar Islaiidi

APPENDICES
S E C T IO N -22


183
T able (22. i )
Di s t a n c e b e t w e e n i m p o r t a n t p l a c e s
Distance inFrom To
Miles Kms.
Port Blair Diglipur i05 169Port Blair Mayabu«der 85 137Port Blair Rangat Bay 5 2 84Port Blair Long Island 45 72Poit Blair Havelock 28 45Port Blair Oral Katcha 34 55Port Blair Wraftar Creek 25 40Port Blair Long Island via Oral Katcha 58 93Port Blair Mayabunder via Oral Katcha 96 154Port Blair Mayabunder via Long Island 88 142Port Blair Mayabunder via Havelock 88 142Port Blair Little Andamaji 62 lOOPort Blair Car Nicobar 150 24IPort Blair Nancowrie 235 378Port Blair Nancowrie via Car Nicobar 242 389Car Nicobar Nancowrie 92 148Nancowrie Kondul 60 97Car Nicobar Teressa 70 1 1 3Car Nicobar Chowra 58 93Teressa Nancowrie 28 45Ifancowric W. B. Katchal 20 32PTancowrie N. B. Katchal - 10 16Nancowrie Polomilo 42 68Port Blair Barren Island 74 1 I9Barren Island Norcondom 75 i 2 iBarren island Mayabunder 70 1 1 3Barren Island Long Island 55 89Port Blair Neil Isalnd 22 35
Source :— Chief Commissioner’s Sectt.,Andaman and Nicobar Islands.

184
T a b le (22 .2)
PLACES OF TOURIST INTEREST
1. Carbyn's Cove Sea Beach.2 . Cellular Jail.3 . Ross Island (Wild Life Sanctuary).4. Mount Harriet5 . Madhuban (Elephent Nursery of Andaman Forest Department).6 . Horticultural Garden.7 . Jawahar Sarover.8. Anthropological Museum.9. Fisheries Museum.
10. Cottage Industries Emporium.1 1 . Chatham Saw Mill12. Vasudhaia WaterialL1 3 . Govt. Orchards at Sipighat, Viper Island, Chiria Tapu etc.14. Saddle Peak.15 . Barren and Norcondam Islands (Volcanoes).16 . Interview Island.
T a b l e ( 2 2 . 3 )
LIST Of TOURIST HOMES, CIRCUIT HOUSES, GUEST HOUSES AND INSPECTION BUNGALOWS MAINTAINED BY PUBLIC WORKS AND FOREST DEPARTMENTS OF ANDAMAN AND
NICOBAR ADMINISTRATION
ANDAMAN PUBLIC WORKS DEPARTMENT 1—
I, Tourist Home Haddo, Port Blair South Andaman.2. Tourist do. Carbyns Cove,
Port Blair do.3 . Circuit House Haddo, Port Blair do.4. Circuit House Car Nicobar Nicobar.5. Circuit House Mayabunder North Andaman.6. Rest House Haddo, Port Blair South Andaman7 . Rest House Neil Island do.8. Rest House Rangat Middle Andaman.9 . Rest House Betapur do.
lO. Rest House Kadamtala do.II. Rest House Mayabunder North Andaman.'i2. Rest House Diglipur do.13. Rest House Aerial Bay do.14 . Rest House Tugapur do.15 . Rest House Kalighat do.t6. Rest House Parangara do.

17* Guest House18. Guest House Ig. Guest House 20- Guest House21. Dak Bungalow22. Inspection Bungalow23. Inspection Bungalow24. Inspection Bungalow25. Inspection Bungalow
FOREST DEPARTMENT1. Nilambur2 . Chiriatapu3 . Wrafter^s Creek4 . Port Meadows5 . Jirkatang6. Long Island7 . Elphinstone Harbour8. Prolob jig g. Bakultala
185
Car Nicobar Nicobar.Hamfregunj South Andaman.Havelock do.Kamorta Nicobar.Haddo, Port Blair South AndamanFerrargunj do.Miletilak do.Wrightmyo do.Teetop Nicobar.
South Andaman, do. do, do. do.
Middle Andaman, do. do. do.
Source (i) Principal Engineer, A.P.W.D. (ii) C. C. F., A. & N. Islands.


SECTION— 23
ALL INDIA STATISTICS


189
T able (23 .1)
CENSUS OF IN D IA 1971-PRO V IS IO N A L PO PU LATIO N TOTALS — FIG U R E S a T a g l a n c e —
A. Population of India
K. Decennial population growth rate 1961-71
C. Density of populationD. Sex ratioE. Literacy rate
TotalMalesFemales
546,965,945383.065,987263,899,958
24.57 percent 183 per Sq. Km.932 females per 1,000 males. Total 29.35 percentMales 39.49 percentFemales 1S.47 percent
* Excludes N EFA and J&K for which data are not available.
SoDECE :— Census of India, 1971, Paper 1, 1971.
T a b le (23.2)
POPULATION GROW TH OF IN D IA FROxM 1901 - 1 9 7 L
Year Population Decadal growth rate
Progressive growth rate over 1901
1 2 3 4
1901 238,337,3131911 252,006,470 + 5.73 + 5.731921 251,239,402 — 0.30 + 5.411931 278,867,430 + 11 .00 + 17.011941 318,539,060 14.23 + 33.66195J 360,950,365 + 13.31 + 51.451961 439,072,582 21.64 + 84.221971* 546,955,945 + 24.57 + 129.49
* Provisional Figures
S o u r c e -Population Census, 1971, Paper 1, 1971.

R A N K I N G O F S T A T E S , U N I O N r E I I R I T O R l R S A C C O R D I N G T OPOPUI.A'l'ION^
190
T a e l F: (23.3)
State/Union Territory Population, 1971
Percentage Rank in to total Population population of India
IN 1 1 A 546,955,945 100.00Uttar Pradesh 88,299,453 16.14 1Bihar 56.387,29(i 10.31Maharashtra 50,295,081 9.20 3West Bengal 44,440,095 8.12 4Ai'dhra Pradesh 43,394,951 7.93 5Aladhva Pradesh 4 i ,449,729 7.55 6Tamil Nadu 41,103,125 7.51 7Mysore 29,224,046 5.34 8Gujarat 26,660,929 4.87 9Kajasthati 25,724,14:i 4.70 10Orissa 21,934,827 4.01 IIKerala 21,280,397 3.89 12Assam 14,857,314 >.72 13Punjab 13,472,972 2.46 14Haryana 9,971,165 1.82 15Jammu & Kashmir 4,615,176 0.84 16Delhi 4,044,338 0.74 17Himaclial Ptadesh 3.424,332 0 63 ISTripura 1,556,822 0.29 19Manipur 1,069,555 0.20 20Meghalaya 983,33'; 0.18 21Goa, Daman and Diu 857,180 0.16 22Nagaland 515,561 0.10 23Pondicherry 471,347 0.09 24N EFA 444,744 0.08 26Chandigarh 256,979 0.05 26A . & N. Islands 115,090 0.02 27Dadra & Nagar Haveli 74,165 O.Ol 281j. M. & a . Islands 31,798 0.01 29
Provisional Figures
S o u h c e :— Census of India, ii)71 Paper I, 1971.

191
STATES, UNION TERRITORIES AND OTHER AREAS ARRANGED IN THE ORDER OF DENSITY OF POPULATION
T able (23-4)
(Density of Population of India— 182 per Sq. Km).
Ranking in19 7 1
State/Union Territory and
other area
Density of population per Km 2 in i97i
Density of population per Km 2 in 1961
1. Delhi 2,723 1.7922. Chandigarh 2,254 1,0523 . Laccadive, Minicoy and Amindivi Islands 994 8314. Pondicherry 982 7875 . Kerala 548 4356. West Bengal 507 3947 . Bihar 324 2688. Tamil Nadu 316 2599. Uttar Pradesh 300 250
lO. Punjab 268 221U r Haryana 225 172i2. Goa, Daman and Diu 225 1291 3 . Maharashtra 163 I2914 . Andhra Pradesh 157 131i5 . Mysore 152 12316 . Dadra and Nagar Haveli 15 1 1 1717 . Assam 149 1 1218 . Tripura 149 IO3i9. Orissa 141 11326. Gujrat 136 1 122i. Madhya Pradesh 93 7422. Rajasthan 75 5923 . Himachal Pradesh 62 5r24. Mainpur 48 3525 . Meghalaya 44 3326 . Nagaland 31 2227 . Andaman and Nicobar Islands 14 8
Source : Census of India, 1971, Paper I, 197i.

STATES. UNION TERRITORIES AND OTHER AREAS ARRANGED IN THE ORDER OF LITERACY RANKING IN iQyi CENSUS
192
T able (23.5)
State'Union Territory/Other Area Literacy rate in 1971
Ranking in1 9 7 1
IN D IA 29.35Chatidigarh ()1.24 1Kerala 60.1G 2Delhi 56.65 3Goa, Daman and Din 44.53 4Andaman and Nicobar Islands 43.48 5Laccadive, Minicoy and Amindivi Islands 43.44 6Pondicherry 43.36 7Tamil Nadu 39.39 8AI aharashtra 39.06 9Gujarat 35.70 10Punjab 33.39 1 1\\'est Bengal 38.05 12Manipur 32.80 13Mysore 3L47 14Himachal Pradesh 31.32 15Tripura 30.87 16Assam 28.74 17Meghalaya 28.41 18Nagaland 27.33 19Haryana 26.69 20Orissa 26.12 2 1Andhra Pradesh 24.56 22Madhya Pradesh 22.03 23Uttar Pradesh •21.64 24Bihar 19.97 25Rajasthan 18.79 26Jammu and Kashmir 18.30 27Dadra and Nagar Havel i 14.86 28North-East Frontier Agency 9.34 29
S ou rce ; (census of Indifl, Paoer I, 1971
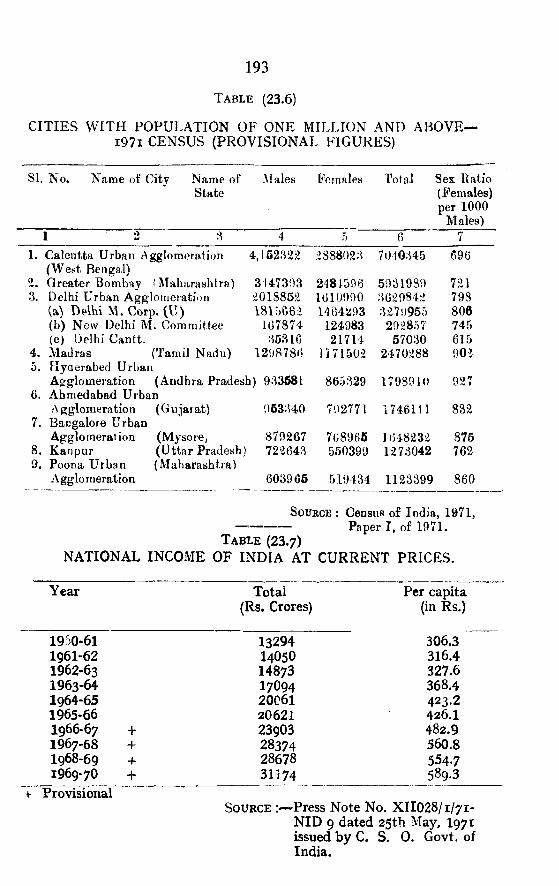
193
T able (23.6)
CITIES WITH POPULATION OF ONE MILLION AND ABOVE- i 97i CENSUS (PROVISIONAL FIGURES)
SI. No. Name of City Name of State
Males Females Total Sex Ratio (Females) per 1000
Males)
1. Calcutta Urban ii^gglomeration 4, L52322 2888023 7010345 696(W est Beng’al)
Q. Greater Bombay f Maharashtra) 3147303 2481596 5931989 721Delhi Urban Agglomeration 018852 1610990 3629842 798{%) Delhi M. Corp. (U ) 1464203 3279955 806(b) New Delhi M. Committee 167874 124983 292857 745(c) Delhi Cantt. ;^6316 21714 57030 6L5
4. Madras (Tamil Nadu) 12987S<? 1171502 2470288 9025. flyaerabed Urban
Agglomeration (Andhra Pradesh) 9;^368I 865329 1798910 9276. Ahmedabad Urban
Agglomeration (Guiarat) 053;H0 79277V 1746111 8327. Bacgalore Urban
Agglomeration (Mysore^ 879267 708966 1648232 8758. Kanpur (Uttar Pradesh) 722643 560399 1273042 7629. Poona Urban (Maharashtra)
Agglomeration 603965 519434 1123399 860
Source : Census of India, 1971, Paper I, of 1971.
T able (23.7)NATIONAL INCOME OF INDIA AT CURRENT PRICES.
Year
f Provisional
Total (Rs. Crores)
Per capita (in Rs.)
19 0-61 13294 306.31961-62 I4O5O 316.41962-63 14873 327.61963-64 17094 368.41964-65 20C61 423.21965-66 20621 426.11966-67 + 23903 482.91967-68 + 28374 560.81968-69 + 28678 554.71969-70 + 31174 589.3
Source :— Press Note No. XIIO28/1/71- NID 9 dated 25th May, I971 issued by C. S. 0 . Govt, of India.


CONVERSION TABLES
S E C T IO N -2 4


197
CON VERSION T A B L E S
(For changing Br it ish Units of W eightL ength an d capacity into Metric u nits .)
I. STANDARDS O F WEIGHTS.
I Oz. = ;>8.3495 (irams.1 Gram = 0.035274 Ounces.
=0.09 Tolas-I ^ ound = 0.45359 Kilogram,1 Kilogram = 2.-20462 Pounds.1 Toune (Metric ton) ... =0.98420 Tons.
= 1000 Kilograms.= 10 Quintals.
1 Ton = 1.01605 Metric Tons.= •240 Lbs.
1 Maund = 0.037324 Metric tons.= 82 2857 Lbs.= 0.3732 Quintal.
1 Cwt = 0.501 Quintal.I Seer = 0.9331 Kilogram.
II STANDARDS O F AREA.
1 Hectare = 2.47105 Acres.I Acre . = 0.404686 Hectare.
I Sq. mile
1 Sq. Kilometre
I Sq. yard I Sq. metre
= 4 S 4 0
r=640 = 2.69 =0.3861 = 100 = 0.8361 = 1.1960
sq. yards. (43,560 sq. ft.) Acres.Sq. Kilometres. Sq. mile. Hectares.Sq. metre.Sq. yards.
Ill STANDARDS OF LENGTH AND CAPACITY.
1 Kilometre = 0.6214 Mile.1 Metre • • • ==1.0936 Yards.I Yard • • • =0.9144 Metre.
=i91.44 Centimetres.1 Inch « • t =25.4 Millimetres.
= 2 .54 Cms.1 Millimetre « • • = 0 .04 Inch.1 Centimetre . . . • •• «0 .393701 Inch.1 Gallon = 4 .546 Litres.1 Litre ... =0.2199 Gallon.
IV NUMBERS.
1 Lakh =100,000 or 0.1 Million1 Million . . . • • • = 1 0 Lakhs1 Crore • • • =10,000,000 or 10 Millions1 Million • •• = 0 .1 Crore

2. M ETRIC U N IT OF LEN<rTH, A R E A , W E IG H T
(Capacity and Temperature Basic Units)
L e n g t h
198
10 Millimetres 10 Centimetrdfe 10 Decimetres 10 Metres 10 Dekameties 10 Hectometres
100 Square millimetres 100 Square centimetres 100 Square decimetres 100 Square metres 100 Acres 100 Hectares
= 1 Centimetre = 1 Decimetre = L Metre = I Dekametre = I Hectometre = I Kilometre
A r e a
1 Square centimetre 1 Square decimetre I Square metre 1 Acre or 1 Square dekametre 1 Hectare or 1 Sq. hectometre 1 Square kilometre
\V EIGHT
10 Milligrams 10 Centigrams 10 Decigram 10 Grams LO Decai^rams 10 Hectograms 10 Kilograms 10 Myriograms 10 Quintals
10 Millilitres 10 Centilitres 10 Decilitres 10 Litres 10 Decalitres 10 Hectolitres
= 1 Centigram = 1 Deciyram = 1 ( jra m = 1,000 mgs.= I Decagiam = 1 Hectogram= 1 Kilogram (1 kg = l,000 gms. = 1 Myriogram = 1 Quintal = 1 Metric ton or tonne
(1 tonne=l,000 kgs.)
C a p a c i t y
= 1 Centilitre = 1 Decilitre = 1 Litre = 1 Decalitre = 1 Hectolitre = 1 Kilolitre
SiG P P 1 Statistical/72 — 3 -8 -1 2— 10(' ».
CONVERSION TABLES
SECTION-24


ERRATA
Table Page Column No. For ReadNo.
1 2 4 5Pre 8th iioe Curren Currerface
3,1 15 Under Nicobars total against 1971 21666 2166<3.5 17 Under rural against Nancowrie 8164 816(3.10 19 Under 1961 against total males 93304 3930^
Under 1961 Percentage to tolal Population— against total females
36.2 38. ‘
3.13 21 Hindus 1951—-Female 3165 315(, , Under female —against total for 1951 11961 119K
4.3 :i() Column No 3, 4 and 5 against Serial I 829263 82927i5.6 39 Column 7 against Sea perches 4231 423^
>> ,, Column 11 against Miscellaneous 2225 252!Column 12 against Hilsa 403 4o:
j, Column 13 against total 44784 4478^5.8 41 Column 2 against total 3854 3o54(
>> Coiumv^ 11 againsl tolal 43119 m v .5.10 43 Under 1966 against Mackeerel 21825 1708^
99 >> Under 1967 against Silver Bellies 36821 3688!5? M Under 1967 agaifist total 410231 41022:
7.4 56 . Under Col. 3 against J.B S. Rangachang 39. 57 Under Col. 6 against Grand total South
Andaman542 54:
**) 58 Under Col. 6 against J.B.S. Kaliadera 66 5(59 Under Col. 4 against J.B.S. Nabhagram 26 3(
,, (iO Under Boys against J B.S. Kakna 16 1(7.6 63 Under Boys South Andaman against Govt.
College35 5t
7.7 64 Under Females Nicobars—against pre- primary school
--
7.S (■5 Under trained total against 69-70 550 57'7.9 06 Under total acainst Higher Secondary School
in 1968-6928o7 263'
7.9 07 Under Col. 6 against untrained Higher Secondaiy School Teachers
39 3(
7.11 08 Under Col. 3 against (81-90) — 23
7"l3Under Col. 3 against (91-100) 28 i;
70 Under Col. 8 against 1966-67 35.6 37.(8..6 77 Under Col. 5 against Total Births 1742 173:J5.ll 79 Under Col. 3 against 1966 . 256 85(
Under Col. 4 against IV‘66 1138 113'8.13 80 Under Col. 2 against April 221 298.15 81 Under Col. 9 against Nicobars 11 i:9.5 86 Under Col. 7 against Smithyshop 915.2 126 Under Col. 5 against 1970 25t76 254(
5? Under Col. 7 against 1969 4089 408!15.3 127 Under 1969 against Match splints ilO 11!15.8 131 Under 1967 against Shops/commercial esU. 393 39;
> > Under 1969 against Theaties 27 2r17.4 156 Under Col. 3 against Power 2 000 12.00119.2 169 Under 1967-68 against total 919347 91884'19.3 170 Below item 4 o f 1 add item 5 as miscellaneous
99328, 102160, 121366, 17596619.3 170 Under 1970-71 against public instruction 175966 ~
21.4 . 178 Under urban against serial 5 21 121.7 180 Under quantity available for distribution
against May, 19705.59 15.5'