Constraints on fault and lithosphere rheology from the coseismic slip and postseismic afterslip of...
16
Constraints on fault and lithosphere rheology from the coseismic slip and postseismic afterslip of the 2006 M w 7.0 Mozambique earthquake Alex Copley, 1 James Hollingsworth, 2 and Eric Bergman 3 Received 8 June 2011; revised 13 January 2012; accepted 17 January 2012; published 10 March 2012. [1] The 2006 M w 7.0 Mozambique (Machaze) normal-faulting earthquake ruptured an unusually steeply dipping fault plane (75°). The amount of slip in the earthquake decreased from depths of 10 km toward the surface, and this shallow slip deficit was at least partly recovered by postseismic afterslip on the shallow part of the fault plane. An adjacent normal fault segment slipped postseismically (and possibly also co-seismically) at shallow depths with a large strike-slip component, in response to the stresses generated by slip on the main earthquake fault plane. Our observations suggest that the fault zone behaves in a stick-slip manner in the crystalline basement, and that where it cuts the sedimentary layer the coseismic rupture was partially arrested and there was significant postseismic creep. We discuss the effects of such behavior on the large-scale tectonics of continental regions, and on the assessment of seismic hazard on similar fault systems. The steep dip of the fault suggests the re-activation of a preexisting structure with a coefficient of friction at least 25–45% lower than that on optimally oriented planes, and analysis of the deformation following an aftershock indicates that the value of the parameter ‘a’ that describes the rate-dependence of fault friction lies in the range 1 10 3 –2 10 2 . The lack of long-wavelength postseismic relaxation suggests viscosities in the ductile lithosphere of greater than 2 10 19 Pa s, and an examination of the tectonic geomorphology in the region identifies ways in which similar fault systems can be identified before they rupture in future earthquakes. Citation: Copley, A., J. Hollingsworth, and E. Bergman (2012), Constraints on fault and lithosphere rheology from the coseismic slip and postseismic afterslip of the 2006 M w 7.0 Mozambique earthquake, J. Geophys. Res., 117, B03404, doi:10.1029/ 2011JB008580. 1. Introduction [2] The M w 7.0 Mozambique (Machaze) earthquake occurred on 22nd February 2006. Focal mechanisms show the event to be normal faulting at the southern end of the East African Rift system (Figure 1). The Nubia-Somalia Euler pole, which describes the extension occurring on the East African Rift system, lies close to the southern tip of Africa [e.g., Nocquet et al., 2006]. The Mozambique earth- quake occurred at latitudes where the rate of extension across the entire plate boundary is 2.5 mm/yr [Nocquet et al., 2006], and the deformation becomes more laterally distributed than in the rift systems further north. One reason for choosing to study this earthquake is that it provides a rare opportunity to study a large earthquake in a region of slow deformation, and as such provides an interesting comparison with the more common earthquakes from rapidly deforming areas. Additionally, the large volumes of space- based geodetic data available for the region present an opportunity to use the earthquake to probe the rheology of the brittle and ductile portions of the lithosphere. This particular aim is especially timely because of the vigorous current debate regarding the rheology of the continental lithosphere [e.g., Chen and Molnar, 1983; Townend and Zoback, 2000; Watts and Burov, 2003; Hetenyi et al., 2006; Jackson et al., 2008]. Much of the discussion revolves around the magni- tude of the stresses that are transmitted through the seismo- genic layer compared with the ductile lithosphere. It is therefore worthwhile to attempt to use earthquakes and their postseismic deformation to constrain the rheology of active faults and the ductile lithosphere. [3] The 2006 Mozambique earthquake occurred on the coastal plain of southern Mozambique (Figure 1), where the surface geology is characterized by quaternary to Neogene sediments [Salman and Abdula, 1995]. The sedimentary sequence is 5–10 km thick, and is composed of terrestrial and shallow marine sediments deposited almost continu- ously since the Jurassic [Salman and Abdula, 1995; Watts, 1 COMET+, Bullard Labs, Department of Earth Sciences, University of Cambridge, Cambridge, UK. 2 Tectonics Observatory, Division of Geological and Planetary Sciences, California Institute of Technology, Pasadena, California, USA. 3 Global Seismological Services, Golden, Colorado, USA. Copyright 2012 by the American Geophysical Union. 0148-0227/12/2011JB008580 JOURNAL OF GEOPHYSICAL RESEARCH, VOL. 117, B03404, doi:10.1029/2011JB008580, 2012 B03404 1 of 16
-
Upload
independent -
Category
Documents
-
view
1 -
download
0
Transcript of Constraints on fault and lithosphere rheology from the coseismic slip and postseismic afterslip of...

Constraints on fault and lithosphere rheologyfrom the coseismic slip and postseismic afterslipof the 2006 Mw7.0 Mozambique earthquake
Alex Copley,1 James Hollingsworth,2 and Eric Bergman3
Received 8 June 2011; revised 13 January 2012; accepted 17 January 2012; published 10 March 2012.
[1] The 2006 Mw7.0 Mozambique (Machaze) normal-faulting earthquake ruptured anunusually steeply dipping fault plane (�75°). The amount of slip in the earthquakedecreased from depths of �10 km toward the surface, and this shallow slip deficit was atleast partly recovered by postseismic afterslip on the shallow part of the fault plane. Anadjacent normal fault segment slipped postseismically (and possibly also co-seismically) atshallow depths with a large strike-slip component, in response to the stresses generated byslip on the main earthquake fault plane. Our observations suggest that the fault zonebehaves in a stick-slip manner in the crystalline basement, and that where it cuts thesedimentary layer the coseismic rupture was partially arrested and there was significantpostseismic creep. We discuss the effects of such behavior on the large-scale tectonics ofcontinental regions, and on the assessment of seismic hazard on similar fault systems.The steep dip of the fault suggests the re-activation of a preexisting structure with acoefficient of friction at least �25–45% lower than that on optimally oriented planes,and analysis of the deformation following an aftershock indicates that the value of theparameter ‘a’ that describes the rate-dependence of fault friction lies in the range1 � 10�3–2 � 10�2. The lack of long-wavelength postseismic relaxation suggestsviscosities in the ductile lithosphere of greater than �2 � 1019 Pa s, and an examinationof the tectonic geomorphology in the region identifies ways in which similar fault systemscan be identified before they rupture in future earthquakes.
Citation: Copley, A., J. Hollingsworth, and E. Bergman (2012), Constraints on fault and lithosphere rheology from thecoseismic slip and postseismic afterslip of the 2006 Mw7.0 Mozambique earthquake, J. Geophys. Res., 117, B03404, doi:10.1029/2011JB008580.
1. Introduction
[2] The Mw7.0 Mozambique (Machaze) earthquakeoccurred on 22nd February 2006. Focal mechanisms showthe event to be normal faulting at the southern end of theEast African Rift system (Figure 1). The Nubia-SomaliaEuler pole, which describes the extension occurring on theEast African Rift system, lies close to the southern tip ofAfrica [e.g., Nocquet et al., 2006]. The Mozambique earth-quake occurred at latitudes where the rate of extensionacross the entire plate boundary is �2.5 mm/yr [Nocquetet al., 2006], and the deformation becomes more laterallydistributed than in the rift systems further north. One reasonfor choosing to study this earthquake is that it provides arare opportunity to study a large earthquake in a region of
slow deformation, and as such provides an interestingcomparison with the more common earthquakes from rapidlydeforming areas. Additionally, the large volumes of space-based geodetic data available for the region present anopportunity to use the earthquake to probe the rheology of thebrittle and ductile portions of the lithosphere. This particularaim is especially timely because of the vigorous currentdebate regarding the rheology of the continental lithosphere[e.g., Chen and Molnar, 1983; Townend and Zoback, 2000;Watts and Burov, 2003; Hetenyi et al., 2006; Jackson et al.,2008]. Much of the discussion revolves around the magni-tude of the stresses that are transmitted through the seismo-genic layer compared with the ductile lithosphere. It istherefore worthwhile to attempt to use earthquakes and theirpostseismic deformation to constrain the rheology of activefaults and the ductile lithosphere.[3] The 2006 Mozambique earthquake occurred on the
coastal plain of southern Mozambique (Figure 1), where thesurface geology is characterized by quaternary to Neogenesediments [Salman and Abdula, 1995]. The sedimentarysequence is 5–10 km thick, and is composed of terrestrialand shallow marine sediments deposited almost continu-ously since the Jurassic [Salman and Abdula, 1995; Watts,
1COMET+, Bullard Labs, Department of Earth Sciences, University ofCambridge, Cambridge, UK.
2Tectonics Observatory, Division of Geological and Planetary Sciences,California Institute of Technology, Pasadena, California, USA.
3Global Seismological Services, Golden, Colorado, USA.
Copyright 2012 by the American Geophysical Union.0148-0227/12/2011JB008580
JOURNAL OF GEOPHYSICAL RESEARCH, VOL. 117, B03404, doi:10.1029/2011JB008580, 2012
B03404 1 of 16
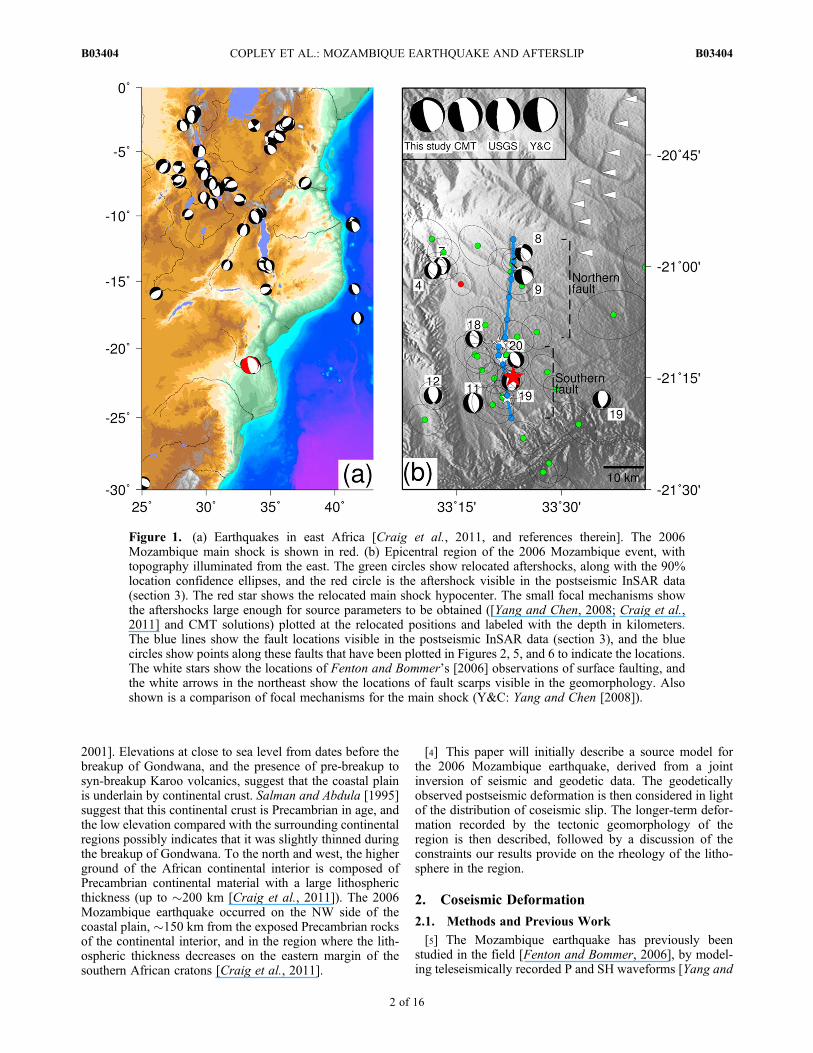
2001]. Elevations at close to sea level from dates before thebreakup of Gondwana, and the presence of pre-breakup tosyn-breakup Karoo volcanics, suggest that the coastal plainis underlain by continental crust. Salman and Abdula [1995]suggest that this continental crust is Precambrian in age, andthe low elevation compared with the surrounding continentalregions possibly indicates that it was slightly thinned duringthe breakup of Gondwana. To the north and west, the higherground of the African continental interior is composed ofPrecambrian continental material with a large lithosphericthickness (up to �200 km [Craig et al., 2011]). The 2006Mozambique earthquake occurred on the NW side of thecoastal plain, �150 km from the exposed Precambrian rocksof the continental interior, and in the region where the lith-ospheric thickness decreases on the eastern margin of thesouthern African cratons [Craig et al., 2011].
[4] This paper will initially describe a source model forthe 2006 Mozambique earthquake, derived from a jointinversion of seismic and geodetic data. The geodeticallyobserved postseismic deformation is then considered in lightof the distribution of coseismic slip. The longer-term defor-mation recorded by the tectonic geomorphology of theregion is then described, followed by a discussion of theconstraints our results provide on the rheology of the litho-sphere in the region.
2. Coseismic Deformation
2.1. Methods and Previous Work
[5] The Mozambique earthquake has previously beenstudied in the field [Fenton and Bommer, 2006], by model-ing teleseismically recorded P and SH waveforms [Yang and
Figure 1. (a) Earthquakes in east Africa [Craig et al., 2011, and references therein]. The 2006Mozambique main shock is shown in red. (b) Epicentral region of the 2006 Mozambique event, withtopography illuminated from the east. The green circles show relocated aftershocks, along with the 90%location confidence ellipses, and the red circle is the aftershock visible in the postseismic InSAR data(section 3). The red star shows the relocated main shock hypocenter. The small focal mechanisms showthe aftershocks large enough for source parameters to be obtained ([Yang and Chen, 2008; Craig et al.,2011] and CMT solutions) plotted at the relocated positions and labeled with the depth in kilometers.The blue lines show the fault locations visible in the postseismic InSAR data (section 3), and the bluecircles show points along these faults that have been plotted in Figures 2, 5, and 6 to indicate the locations.The white stars show the locations of Fenton and Bommer’s [2006] observations of surface faulting, andthe white arrows in the northeast show the locations of fault scarps visible in the geomorphology. Alsoshown is a comparison of focal mechanisms for the main shock (Y&C: Yang and Chen [2008]).
COPLEY ET AL.: MOZAMBIQUE EARTHQUAKE AND AFTERSLIP B03404B03404
2 of 16
Chen, 2008], and by using InSAR [Fialko, 2009; Raucouleset al., 2010]. This paper builds upon these previous studiesby using all three data sources simultaneously, to perform ajoint inversion for the source characteristics of the earth-quake. By doing this we can minimize the trade-offs and, insome cases, poorly resolved source parameters that canresult from using one data set alone. We can therefore pro-duce a well-constrained model for the distribution of slip onthe fault plane, which is one of the pieces of information thatwill allow us to investigate the rheology of the lithosphere inthe region.[6] We were able to create SAR interferograms for the
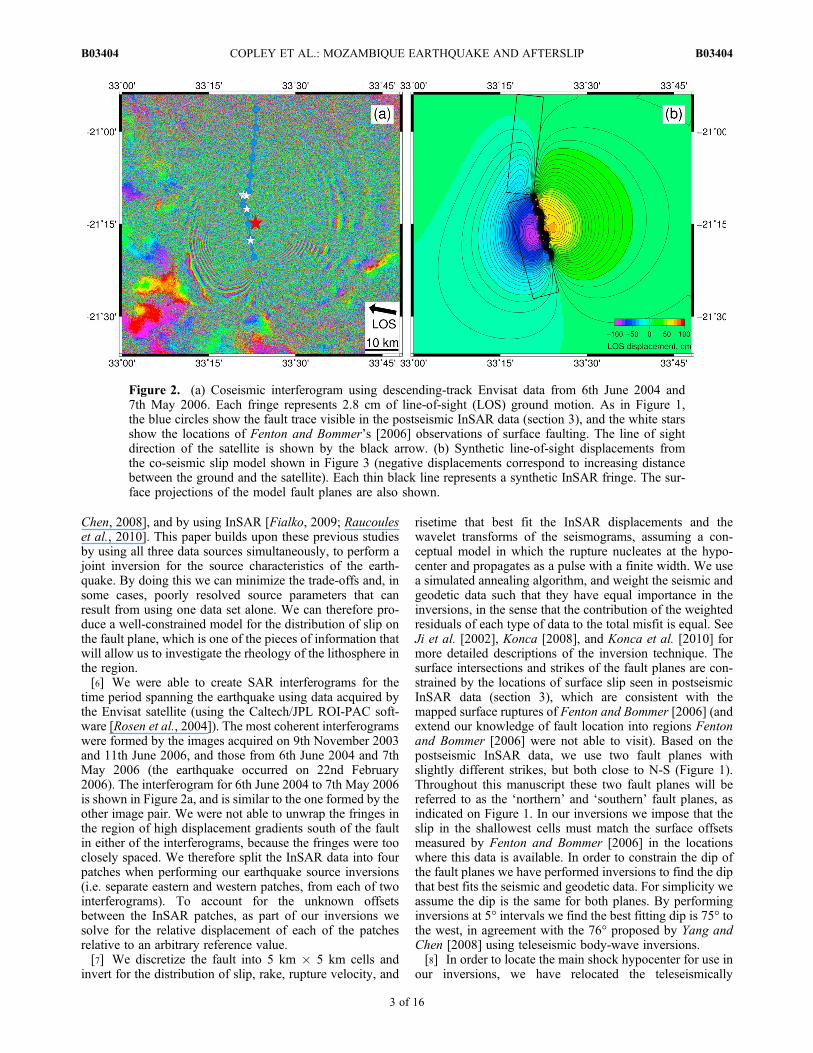
time period spanning the earthquake using data acquired bythe Envisat satellite (using the Caltech/JPL ROI-PAC soft-ware [Rosen et al., 2004]). The most coherent interferogramswere formed by the images acquired on 9th November 2003and 11th June 2006, and those from 6th June 2004 and 7thMay 2006 (the earthquake occurred on 22nd February2006). The interferogram for 6th June 2004 to 7th May 2006is shown in Figure 2a, and is similar to the one formed by theother image pair. We were not able to unwrap the fringes inthe region of high displacement gradients south of the faultin either of the interferograms, because the fringes were tooclosely spaced. We therefore split the InSAR data into fourpatches when performing our earthquake source inversions(i.e. separate eastern and western patches, from each of twointerferograms). To account for the unknown offsetsbetween the InSAR patches, as part of our inversions wesolve for the relative displacement of each of the patchesrelative to an arbitrary reference value.[7] We discretize the fault into 5 km � 5 km cells and
invert for the distribution of slip, rake, rupture velocity, and
risetime that best fit the InSAR displacements and thewavelet transforms of the seismograms, assuming a con-ceptual model in which the rupture nucleates at the hypo-center and propagates as a pulse with a finite width. We usea simulated annealing algorithm, and weight the seismic andgeodetic data such that they have equal importance in theinversions, in the sense that the contribution of the weightedresiduals of each type of data to the total misfit is equal. SeeJi et al. [2002], Konca [2008], and Konca et al. [2010] formore detailed descriptions of the inversion technique. Thesurface intersections and strikes of the fault planes are con-strained by the locations of surface slip seen in postseismicInSAR data (section 3), which are consistent with themapped surface ruptures of Fenton and Bommer [2006] (andextend our knowledge of fault location into regions Fentonand Bommer [2006] were not able to visit). Based on thepostseismic InSAR data, we use two fault planes withslightly different strikes, but both close to N-S (Figure 1).Throughout this manuscript these two fault planes will bereferred to as the ‘northern’ and ‘southern’ fault planes, asindicated on Figure 1. In our inversions we impose that theslip in the shallowest cells must match the surface offsetsmeasured by Fenton and Bommer [2006] in the locationswhere this data is available. In order to constrain the dip ofthe fault planes we have performed inversions to find the dipthat best fits the seismic and geodetic data. For simplicity weassume the dip is the same for both planes. By performinginversions at 5° intervals we find the best fitting dip is 75° tothe west, in agreement with the 76° proposed by Yang andChen [2008] using teleseismic body-wave inversions.[8] In order to locate the main shock hypocenter for use in
our inversions, we have relocated the teleseismically
Figure 2. (a) Coseismic interferogram using descending-track Envisat data from 6th June 2004 and7th May 2006. Each fringe represents 2.8 cm of line-of-sight (LOS) ground motion. As in Figure 1,the blue circles show the fault trace visible in the postseismic InSAR data (section 3), and the white starsshow the locations of Fenton and Bommer’s [2006] observations of surface faulting. The line of sightdirection of the satellite is shown by the black arrow. (b) Synthetic line-of-sight displacements fromthe co-seismic slip model shown in Figure 3 (negative displacements correspond to increasing distancebetween the ground and the satellite). Each thin black line represents a synthetic InSAR fringe. The sur-face projections of the model fault planes are also shown.
COPLEY ET AL.: MOZAMBIQUE EARTHQUAKE AND AFTERSLIP B03404B03404
3 of 16
recorded aftershocks, and the main shock hypocenter, rela-tive to each other using a multiple event relocation methodthat has been specialized for studies of calibrated (i.e. bias-free) locations. The earthquakes were first relocated in singleevent fashion using the EHB methodology [Engdahl et al.,1998] with special attention to the analysis of depth phasesto set focal depths for relocation (E. R. Engdahl, personalcommunication, 2010). We then used a method based on theHypocentroidal Decomposition (HDC) method [Jordan andSverdrup, 1981] to relatively relocate the events (see Biggset al. [2006]; Bondar et al. [2008]; Nissen et al. [2010] forrecent applications of this technique). The HDC analysisprovides strong constraints on the relative locations of allevents in the cluster (uncertainties are 1.1 to 7.2 km at the90% confidence level, 34 of 41 events are less than 4.0 km).The resulting event distribution was then shifted so that theMw5.2 aftershock that occurred on 29th November 2007lines up with the signal it produced in postseismic InSARdata (section 3). We assigned a circular region of uncertaintyto this calibration location, with radius 3 km. By combiningthe uncertainties of the calibration location and the HDC-derived relative location of the events, we estimate that ofthe 41 events, 32 have final absolute location uncertaintiesof 5.0 km or less (longest semi-axis of the 90% confidenceellipse).[9] The relocations show that the main shock hypocenter
was in the southernmost fault plane (red star on Figure 1).We have varied the along-strike and down-dip location ofthe hypocenter within this region of the fault in order to findthe best fit to the data. We find the best fitting depth was inan inversion cell extending from 15–20 km depth. This is inagreement with the reported ISC depth of 16.4 km, althoughdeeper than the 11 km reported in the EHB catalogue.However, inversions in which the hypocenter is placed in thecell extending from 10–15 km depth show no significantdifferences from those shown below.[10] The lack of geodetic data close to the fault means we
are not able to accurately constrain the moment of the event.We therefore chose to use the value from the CMT solutionof 4.5� 1019 Nm. This is consistent with the USGS estimateof 4.6 � 1019 Nm, although larger than Yang and Chen’s[2008] estimate of 3.5 � 1019 Nm. However, we view themoment estimates of the CMT and USGS to be more reliablebecause they used longer-period data than did Yang andChen [2008], whose solution was based only upon bodywaves (which are less accurate for estimating the magnitudesof large events).[11] There is a well-known trade-off between the smooth-
ness imposed upon an inversion solution and the quality offit to the data. As our preferred solution we select thesmoothest model which involves only a minimal increase inthe misfit to the data, choosing a similar point on the trade-off curve to numerous previous studies [e.g., Freymuelleret al., 1994; Johanson and Burgmann, 2010]. We willdescribe below the effects of imposing other values of themodel smoothness.
2.2. Inversion Results
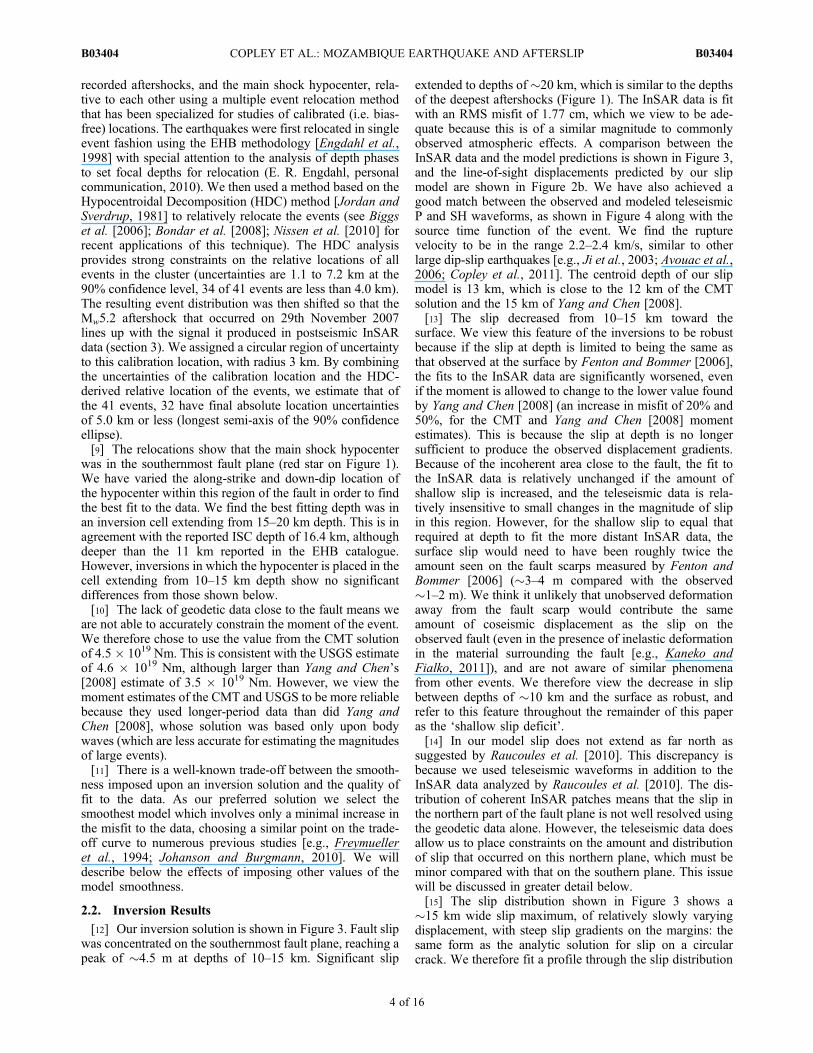
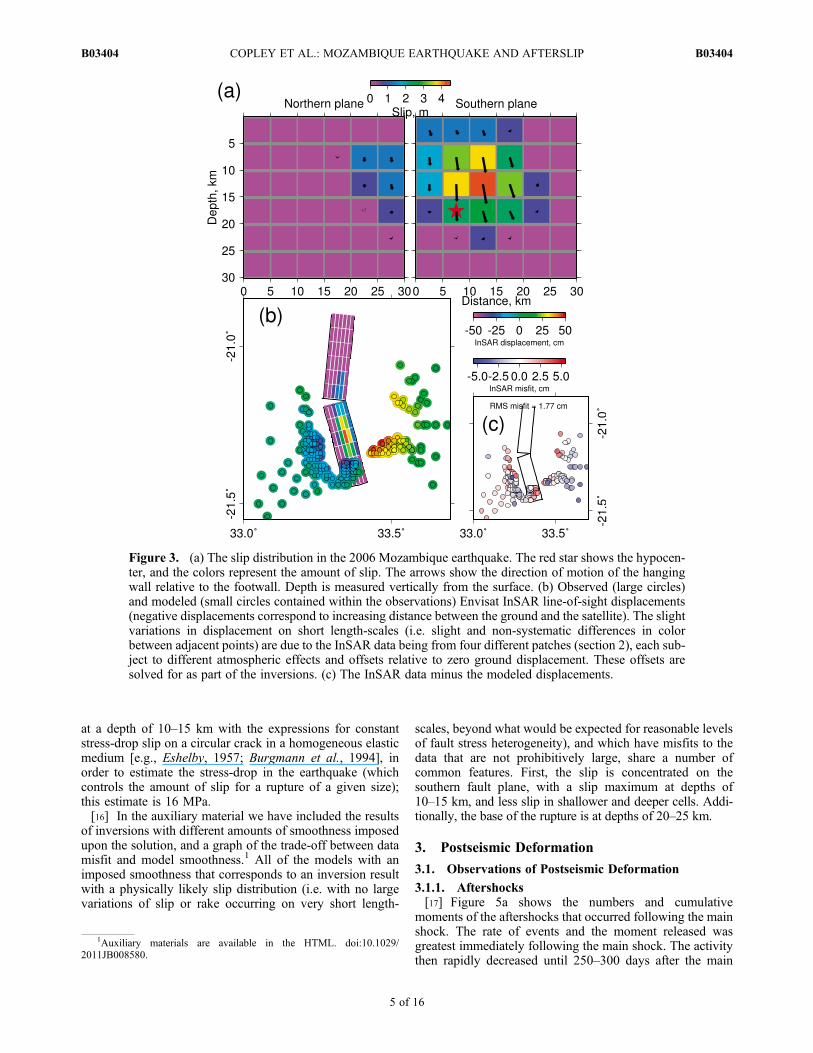
[12] Our inversion solution is shown in Figure 3. Fault slipwas concentrated on the southernmost fault plane, reaching apeak of �4.5 m at depths of 10–15 km. Significant slip
extended to depths of �20 km, which is similar to the depthsof the deepest aftershocks (Figure 1). The InSAR data is fitwith an RMS misfit of 1.77 cm, which we view to be ade-quate because this is of a similar magnitude to commonlyobserved atmospheric effects. A comparison between theInSAR data and the model predictions is shown in Figure 3,and the line-of-sight displacements predicted by our slipmodel are shown in Figure 2b. We have also achieved agood match between the observed and modeled teleseismicP and SH waveforms, as shown in Figure 4 along with thesource time function of the event. We find the rupturevelocity to be in the range 2.2–2.4 km/s, similar to otherlarge dip-slip earthquakes [e.g., Ji et al., 2003; Avouac et al.,2006; Copley et al., 2011]. The centroid depth of our slipmodel is 13 km, which is close to the 12 km of the CMTsolution and the 15 km of Yang and Chen [2008].[13] The slip decreased from 10–15 km toward the
surface. We view this feature of the inversions to be robustbecause if the slip at depth is limited to being the same asthat observed at the surface by Fenton and Bommer [2006],the fits to the InSAR data are significantly worsened, evenif the moment is allowed to change to the lower value foundby Yang and Chen [2008] (an increase in misfit of 20% and50%, for the CMT and Yang and Chen [2008] momentestimates). This is because the slip at depth is no longersufficient to produce the observed displacement gradients.Because of the incoherent area close to the fault, the fit tothe InSAR data is relatively unchanged if the amount ofshallow slip is increased, and the teleseismic data is rela-tively insensitive to small changes in the magnitude of slipin this region. However, for the shallow slip to equal thatrequired at depth to fit the more distant InSAR data, thesurface slip would need to have been roughly twice theamount seen on the fault scarps measured by Fenton andBommer [2006] (�3–4 m compared with the observed�1–2 m). We think it unlikely that unobserved deformationaway from the fault scarp would contribute the sameamount of coseismic displacement as the slip on theobserved fault (even in the presence of inelastic deformationin the material surrounding the fault [e.g., Kaneko andFialko, 2011]), and are not aware of similar phenomenafrom other events. We therefore view the decrease in slipbetween depths of �10 km and the surface as robust, andrefer to this feature throughout the remainder of this paperas the ‘shallow slip deficit’.[14] In our model slip does not extend as far north as
suggested by Raucoules et al. [2010]. This discrepancy isbecause we used teleseismic waveforms in addition to theInSAR data analyzed by Raucoules et al. [2010]. The dis-tribution of coherent InSAR patches means that the slip inthe northern part of the fault plane is not well resolved usingthe geodetic data alone. However, the teleseismic data doesallow us to place constraints on the amount and distributionof slip that occurred on this northern plane, which must beminor compared with that on the southern plane. This issuewill be discussed in greater detail below.[15] The slip distribution shown in Figure 3 shows a
�15 km wide slip maximum, of relatively slowly varyingdisplacement, with steep slip gradients on the margins: thesame form as the analytic solution for slip on a circularcrack. We therefore fit a profile through the slip distribution
COPLEY ET AL.: MOZAMBIQUE EARTHQUAKE AND AFTERSLIP B03404B03404
4 of 16
at a depth of 10–15 km with the expressions for constantstress-drop slip on a circular crack in a homogeneous elasticmedium [e.g., Eshelby, 1957; Burgmann et al., 1994], inorder to estimate the stress-drop in the earthquake (whichcontrols the amount of slip for a rupture of a given size);this estimate is 16 MPa.[16] In the auxiliary material we have included the results
of inversions with different amounts of smoothness imposedupon the solution, and a graph of the trade-off between datamisfit and model smoothness.1 All of the models with animposed smoothness that corresponds to an inversion resultwith a physically likely slip distribution (i.e. with no largevariations of slip or rake occurring on very short length-
scales, beyond what would be expected for reasonable levelsof fault stress heterogeneity), and which have misfits to thedata that are not prohibitively large, share a number ofcommon features. First, the slip is concentrated on thesouthern fault plane, with a slip maximum at depths of10–15 km, and less slip in shallower and deeper cells. Addi-tionally, the base of the rupture is at depths of 20–25 km.
3. Postseismic Deformation
3.1. Observations of Postseismic Deformation
3.1.1. Aftershocks[17] Figure 5a shows the numbers and cumulative
moments of the aftershocks that occurred following the mainshock. The rate of events and the moment released wasgreatest immediately following the main shock. The activitythen rapidly decreased until 250–300 days after the main
Figure 3. (a) The slip distribution in the 2006 Mozambique earthquake. The red star shows the hypocen-ter, and the colors represent the amount of slip. The arrows show the direction of motion of the hangingwall relative to the footwall. Depth is measured vertically from the surface. (b) Observed (large circles)and modeled (small circles contained within the observations) Envisat InSAR line-of-sight displacements(negative displacements correspond to increasing distance between the ground and the satellite). The slightvariations in displacement on short length-scales (i.e. slight and non-systematic differences in colorbetween adjacent points) are due to the InSAR data being from four different patches (section 2), each sub-ject to different atmospheric effects and offsets relative to zero ground displacement. These offsets aresolved for as part of the inversions. (c) The InSAR data minus the modeled displacements.
1Auxiliary materials are available in the HTML. doi:10.1029/2011JB008580.
COPLEY ET AL.: MOZAMBIQUE EARTHQUAKE AND AFTERSLIP B03404B03404
5 of 16

shock, followed by a more gradual lessening of momentrelease until the present-day. The total moment release byaftershocks to date is 3.7 � 1018 Nm, equivalent to a singleMw6.3 event and 8% of the main shock moment. Figure 1bshows that the main concentration of aftershocks wastoward the northern end of the southern fault plane, in thesame region as the high slip patch in our coseismic sourceinversions.
3.1.2. Envisat Data[18] We used Envisat and ALOS SAR data to construct
interferograms for dates up until October 2010. Unfortu-nately, due to the large amounts of vegetation in the region,the Envisat data was not coherent enough to allow a contin-uous time series to be constructed. The only Envisat post-seismic interferogram with coherence over the fault covers a35-day time window from 7th May to 11th June 2006 (74 to109 days after the earthquake). This interferogram is shown
Figure 4. Observed (black) and modeled (red) teleseismic waveforms. Each trace is labeled with thestation name, the type of wave (i.e. P or SH), and the maximum amplitude of the signal. The station dis-tribution is shown in the upper right with the blue circles indicating epicentral distances of 30° and 80°.Also shown is the source time function of the event.
COPLEY ET AL.: MOZAMBIQUE EARTHQUAKE AND AFTERSLIP B03404B03404
6 of 16
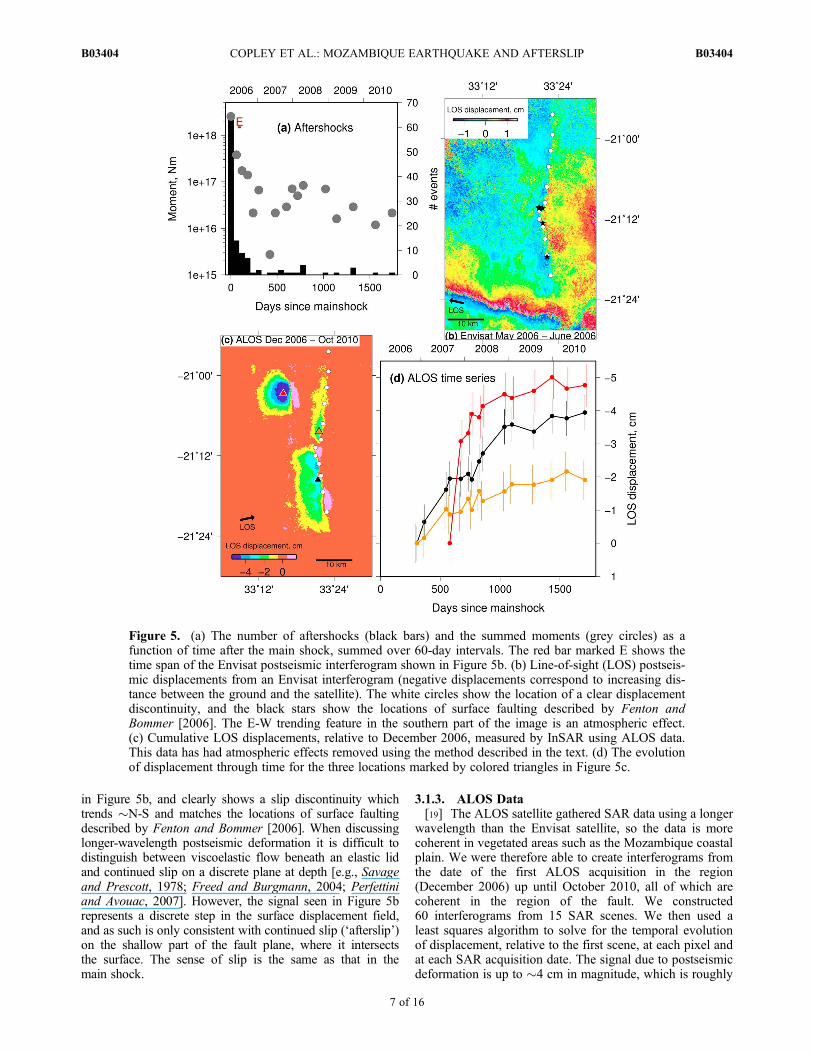
in Figure 5b, and clearly shows a slip discontinuity whichtrends �N-S and matches the locations of surface faultingdescribed by Fenton and Bommer [2006]. When discussinglonger-wavelength postseismic deformation it is difficult todistinguish between viscoelastic flow beneath an elastic lidand continued slip on a discrete plane at depth [e.g., Savageand Prescott, 1978; Freed and Burgmann, 2004; Perfettiniand Avouac, 2007]. However, the signal seen in Figure 5brepresents a discrete step in the surface displacement field,and as such is only consistent with continued slip (‘afterslip’)on the shallow part of the fault plane, where it intersectsthe surface. The sense of slip is the same as that in themain shock.
3.1.3. ALOS Data[19] The ALOS satellite gathered SAR data using a longer
wavelength than the Envisat satellite, so the data is morecoherent in vegetated areas such as the Mozambique coastalplain. We were therefore able to create interferograms fromthe date of the first ALOS acquisition in the region(December 2006) up until October 2010, all of which arecoherent in the region of the fault. We constructed60 interferograms from 15 SAR scenes. We then used aleast squares algorithm to solve for the temporal evolutionof displacement, relative to the first scene, at each pixel andat each SAR acquisition date. The signal due to postseismicdeformation is up to �4 cm in magnitude, which is roughly
Figure 5. (a) The number of aftershocks (black bars) and the summed moments (grey circles) as afunction of time after the main shock, summed over 60-day intervals. The red bar marked E shows thetime span of the Envisat postseismic interferogram shown in Figure 5b. (b) Line-of-sight (LOS) postseis-mic displacements from an Envisat interferogram (negative displacements correspond to increasing dis-tance between the ground and the satellite). The white circles show the location of a clear displacementdiscontinuity, and the black stars show the locations of surface faulting described by Fenton andBommer [2006]. The E-W trending feature in the southern part of the image is an atmospheric effect.(c) Cumulative LOS displacements, relative to December 2006, measured by InSAR using ALOS data.This data has had atmospheric effects removed using the method described in the text. (d) The evolutionof displacement through time for the three locations marked by colored triangles in Figure 5c.
COPLEY ET AL.: MOZAMBIQUE EARTHQUAKE AND AFTERSLIP B03404B03404
7 of 16

double the observed atmospheric effects. From visualinspection of the interferograms, and from stacking the data,it appears that no temporally consistent signals are presentexcept for in the regions of the fault planes and one shallowaftershock, suggesting no resolvable tectonic deformationoccurs away from these areas. We have attempted toremove the apparent displacements due to atmosphericsignals. To do this we fitted a smoothly varying displace-ment field to the signal at each SAR acquisition date, notincluding the regions of tectonic deformation. We thenextrapolated this ‘atmospheric’ displacement field across thepreviously excluded regions of tectonic deformation usingsplines in tension [Smith and Wessel, 1990], and thenremoved the extrapolated atmospheric signal from thewhole image to leave just the tectonic signal remaining. Thetotal deformation observed over the date range December2006 – October 2010 is shown in Figure 5c, and the evo-lution through time of the deformation at three points isshown in Figure 5d. These time series of data show thatsome atmospheric effects still remain (the short-term fluc-tuations), but the overall signals are of the temporallysmooth form expected for tectonic deformation. The methodwe have used to remove the atmospheric signals is rela-tively crude. However, the similar magnitudes of theatmospheric and tectonic signals, and the lack of ‘ground-truthing’ GPS data, meant that we were not successful inisolating the tectonic signal using more sophisticatedmethods [Kositsky and Avouac, 2010]. Additionally, we didnot want to follow the commonly used approach ofassuming a functional form of the tectonic displacement inorder to extract this signal, because we did not want toimpose constraints upon the estimated time-evolution of thedeformation. The apparent displacements before theremoval of atmospheric effects, along with an equivalent toFigure 5d produced from the uncorrected measurements, areshown in the auxiliary material.[20] Figures 5c and 5d show that there are three locations
of significant postseismic deformation. The first is adjacentto the southernmost fault plane, where the coseismic slip wasconcentrated (Figure 3). The evolution of deformationshown in black on Figure 5d demonstrates that the rate ofdisplacement accumulation in this location was approxi-mately constant at �17.5 mm/yr throughout 2007 and 2008(in agreement with the findings of Raucoules et al. [2010]).This rate is considerably faster than the long-term extensionrate of �2.5 mm/yr across the entire plate boundary[Nocquet et al., 2006], of which this fault forms only a part.Shortly after 1000 days post main shock (late 2008) thedeformation became unresolvably slow or stopped. Theregion of resolvable postseismic surface deformation doesnot extend far enough from the fault to coincide with theareas where the coseismic Envisat interferograms werecoherent. We are therefore confident that any postseismicdeformation present in the coseismic interferograms will beminor compared with the large coseismic displacements, andthat the slip inversions are not likely to be significantlycontaminated with postseismic signals.[21] The second region of displacement accumulation was
near the northern fault plane. The evolution of postseismicdisplacement shown in orange on Figure 5d displays asimilar behavior to that seen adjacent to the southern part ofthe fault plane, with a relatively rapid rate of displacement
accumulation followed by slow motion or the cessation ofdeformation. This deformation will be discussed in greaterdetail below (section 3.2) in light of the deformation mea-sured in the region using optical satellite images.[22] The third observed postseismic deformation signal is
that caused by a shallow Mw5.2 aftershock that occurred on29th November 2007. The evolution of displacement in thisregion is shown in red on Figure 5d. The sudden displace-ment in the aftershock was followed by �275–450 days ofmotion at progressively decreasing rates. This timescale issimilar to that over which aftershock activity died away afterthe main shock, suggesting a common postseismic defor-mation mechanism. It was the InSAR signal of this after-shock that was used to geographically locate the relativelyrelocated aftershocks and main shock hypocenter (section 2).3.1.4. SPOT Optical Data[23] We have also measured surface deformation in the
region of the earthquake by cross-correlating SPOT 5 opticalimages using the Cosi-Corr programme of Leprince et al.[2007, 2008]. The two images we used were acquired on3rd August 2001 and 26th August 2008, so the measureddeformation spans the coseismic and postseismic timeperiods (ending close to the date that the ALOS InSAR datashows the surface deformation rate decreased or stopped).The method we have used usually measures the deformationin two perpendicular directions, East-West and North-South. However, in this case the incidence angle of thesatellite images we used was not vertical, which means thatvertical ground motions show up as an apparent displace-ment in the E-W component. Specifically, because the sat-ellite was looking to the west, uplift will appear as anegative eastward signal with a magnitude given by thevertical displacement multiplied by the tangent of the inci-dence angle (see Copley et al. [2011] for a more completediscussion of the interpretation of optical image correlationdata with non-vertical incidence angles). For the images weused the incidence angle is �20°, resulting in the verticalmotions being multiplied by �0.36. In the measurementsproduced using the Cosi-Corr method, the absolute valuesof the displacement are not well constrained, but the mag-nitudes of displacement discontinuities are robust features.[24] In the region of the southern fault plane, where the
coseismic slip was concentrated, there is little evidence forN-S displacements, which is as would be expected given theminimal N-S displacements in our coseismic slip models andobserved in the field. There is also no clear discontinuity inthe E-W displacements, which is also as expected becausefor steeply dipping dip-slip faults the fault-perpendiculardisplacement discontinuity at the surface is small. Addi-tionally, for the image geometry we used the E-W dis-placements result in a signal of opposite sign to the verticalmotions, so the two signals destructively interfere. Thecoseismic slip model shown in Figure 3 would result in asignal in the E-W component of �25 cm, which is belowthe detection threshold of �50 cm for 5 m resolutionSPOT5 images.[25] Figures 6a and 6b show that �1 m of left-lateral
strike-slip motion accumulated on the northern fault planeduring the time span of the images, and that there is noresolvable E-W displacement discontinuity. We haveinvestigated if this slip could be coseismic by imposing theobserved deformation on the northern fault plane during
COPLEY ET AL.: MOZAMBIQUE EARTHQUAKE AND AFTERSLIP B03404B03404
8 of 16

some coseismic source inversions. We have constrained thestrike-slip component of motion to be 1 m, and varied thedip-slip component (which the optical image results aremuch less sensitive to) so that the rake varies between pureleft-lateral strike-slip and �60°. If slip is imposed on thenorthern plane from the surface down to a depth of 15 km,then the misfits between the observed and modeled tele-seismic waveforms become significantly higher than in ourpreferred model (by 11–35%, as the rake varies from left-lateral strike-slip to �60°). These misfits take the form ofsystematic differences in shape and magnitude between theobserved and synthetic waveforms, and are due to signifi-cant moment being released at times later than is consistentwith the source time function of the event. For slip extendingto a depth of 10 km, the corresponding values are 7–18%.Lower amounts of coseismic slip on the northern plane resultin lower misfits between the model and the teleseismic andInSAR data (until the best fitting model is reached, whereonly minor slip, and normal in sense, occurs on the northernplane; Figure 3). The degree to which any coseismic slipcould have occurred on the northern plane depends upon theresolution of the teleseismic waveforms to small amounts ofslip in this region. Our inversions suggest that we canexclude significant moment release (e.g. the surface defor-mation observed in the SPOT data, extending down to10 km or more), but not the possibility that some minor slipmay have occurred in a small number of the inversion cells(e.g. 1–2 m in up to �5 cells). We therefore cannot con-clusively say to what extent the slip observed in the SPOT
data accumulated coseismically (the increases in misfit tothe teleseismic data for slip in only the top 5 km of thenorthern fault plane are insignificant, i.e. 0.7–2.3%).However, we think it unlikely that the rupture propagatedhorizontally for the �20 km observed in the SPOT data,within only the top 5 km of the fault plane, given that thisis the depth range that partially arrested the rupture on thesouthern fault plane. We do know that at least some of thedeformation is definitely postseismic afterslip, as demon-strated by the signal seen in the postseismic Envisat andALOS data in this region. However, it is possible thatsome of the slip adjacent to the southern fault plane couldbe coseismic.
3.2. Interpretation of Postseismic Deformation
3.2.1. Southern Fault Plane[26] By inverting the displacement field adjacent to the
southernmost fault shown in Figure 5c, it is possible toestimate the slip on this fault plane over the time periodcovered by the postseismic ALOS InSAR data. In theseinversions we use cells with lengths and widths of half thatused in the main shock inversions (i.e. 2.5 km), in order toallow us to use the near-source InSAR data to constrain thedetails of the shallow slip. The results of this slip inversionshow �10 cm of normal-faulting motion on the upper�10 km of the fault plane (Figure 7), equivalent to amoment magnitude of 5.7. The depth extent of the afterslipcorresponds to where the coseismic slip decreased fromdepths of �10 km toward the surface (Figure 3), suggesting
Figure 6. (a, b) N-S and E-W surface displacements measured from the cross-correlation of SPOTsatellite images. Northward and eastward motions are positive. The robust outputs of this methodare displacement discontinuities, not the absolute displacement values or long-wavelength features. Assuch, the robust feature is the roughly N-S trending discontinuity seen in the N-S offsets, equivalent toleft-lateral strike-slip. The blue circles show the location of the displacement discontinuity observed inthe postseismic Envisat interferogram (Figure 5). (c) Principal axes of the horizontal strain tensor atthe surface, calculated from the coseismic slip model (Figure 3). Also shown (black lines) is the surfaceprojection of the (west-dipping) northernmost fault plane.
COPLEY ET AL.: MOZAMBIQUE EARTHQUAKE AND AFTERSLIP B03404B03404
9 of 16

that the afterslip is ‘filling in’ the coseismic shallow slipdeficit. However, the slip we have inferred from the ALOSdata (�10 cm) is much smaller than the shallow slip deficit(�1–2 m). In order to estimate what proportion of the slipdeficit has been recovered we need to estimate the amountof shallow afterslip that occurred between the main shock inFebruary 2006 and the start of ALOS data acquisition inDecember 2006. One method of making this estimate is tomake assumptions regarding the functional form of thesurface deformation [e.g., Fialko, 2004; Chandrasekharet al., 2009]. The Envisat data shows that the averagerate of deformation between 74 and 109 days after the mainshock (0.6 mm/day) was considerably faster than theroughly linear rate of 0.05 mm/day seen in the ALOS data.This rapid rate seen in the Envisat data coincides with thetime of frequent aftershocks shortly following the mainshock (Figure 5a). Geodetic data following large earth-quakes shows that ground displacements often follow alogarithmic function [e.g., Langbein et al., 1983; Hsu et al.,2006, 2009]. We have therefore assumed that the surfacedisplacements were logarithmic in form until 250 days afterthe main shock, when the aftershock activity had decayed tolow rates (Figure 5a). We then found a logarithmic functionthat replicates the 2.2 cm displacement observed in theEnvisat interferogram from May–June 2006. To the dis-placement calculated in this manner, we added a displace-ment calculated from the linear rate of deformation seen inthe ALOS data, which we assumed to occur from 250 daysafter the main shock until the rate of displacement decreasedin late 2008. Using this method we estimate that the totalafterslip is roughly an order of magnitude greater than isobserved in the time period covered by the ALOS data(i.e. on the order of meters). There are obviously large
uncertainties inherent in this estimate. Therefore, the onlyconclusion we would like to draw from this extrapolation isthat the InSAR data is potentially consistent with thedecrease in deformation rate in late 2008 corresponding tothe time when the shallow afterslip had removed the shal-low slip deficit observed in the coseismic slip model.However, this is by no means necessarily the case, andafterslip is often observed to not completely recover theshallow slip deficit [e.g., Fialko, 2004; Fielding et al.,2009].3.2.2. Northern Fault Plane[27] The strike of the northernmost fault plane, which is
perpendicular to the regional extension direction, and sub-parallel to the southern fault plane, suggests that the motionon the fault is usually dominantly dip-slip rather than strike-slip. The tectonic geomorphology in the region also indi-cates dip-slip faulting on this plane (section 4). However, apotential explanation for the significant left-lateral strike-slipcomponent of motion observed in the SPOT image correla-tions (Figure 6a) lies with the stresses induced by slip on thesouthern fault plane. Figure 6c shows the principal axes ofthe horizontal strain tensor at the surface, calculated from theelastic displacements predicted by the coseismic slip model.The coseismic strains in the region of the northern faultplane are equivalent to left-lateral strike-slip on N-S planes.The agreement between this calculated sense of strain andthe slip observed by the SPOT image correlation suggeststhat the northernmost fault plane accumulated displacementin response to the stresses generated by the slip on thesouthernmost fault plane (although we cannot conclude if allof this signal was postseismic, or if some of the deformationresulted from the propagation of coseismic slip into theregion). This view is supported by the observation that thecoseismic strains and the deformation measured usingthe SPOT images both decay over a similar distance of15–20 km along the northernmost fault. For the displace-ments produced by the slip on the southern fault plane toproduce offsets of �1 m across the northern fault plane, therecovery of the shallow slip deficit would be required to bealmost complete, which is at odds with observations fromother events [e.g., Fialko, 2004; Fielding et al., 2009]. Thismay suggest that some coseismic slip did propagate into thenorthern fault plane (as discussed above), which would thenprovide additional driving stresses for the afterslip in theregion.[28] We can draw further conclusions based on comparing
the InSAR and SPOT data for the region of the northernmostfault plane. The ALOS InSAR data indicates an increase inrange between the satellite and the ground on the westernside of the fault, which is the opposite expected for pure left-lateral strike-slip on a N-S plane. This discrepancy suggeststhat some normal-sense slip occurred, as is also suggested bythe mechanisms of the two aftershocks that occurred close tothe northern fault plane (Figure 1). The viewing geometry ofthe ALOS satellite constrains this normal component to bemore than 17% of the strike-slip motion during the ALOSobservation period. Given that normal motion on a steeplydipping fault will produce a small E-W signal, which islargely canceled out by the signal resulting from the verticalmotions (as described above), this small percentage is wellbeneath the detection threshold on the E-W component ofthe SPOT image correlation. Unlike the optical image
Figure 7. Distribution of postseismic afterslip on thesouthern fault plane during the time period covered bythe ALOS SAR data (�300–1700 days post main shock).The location and size of the fault plane is the same as thatshown in Figure 3, but the individual cells are half the widthand height. The 4 m and 2 m contours from the coseismicslip model are also shown.
COPLEY ET AL.: MOZAMBIQUE EARTHQUAKE AND AFTERSLIP B03404B03404
10 of 16
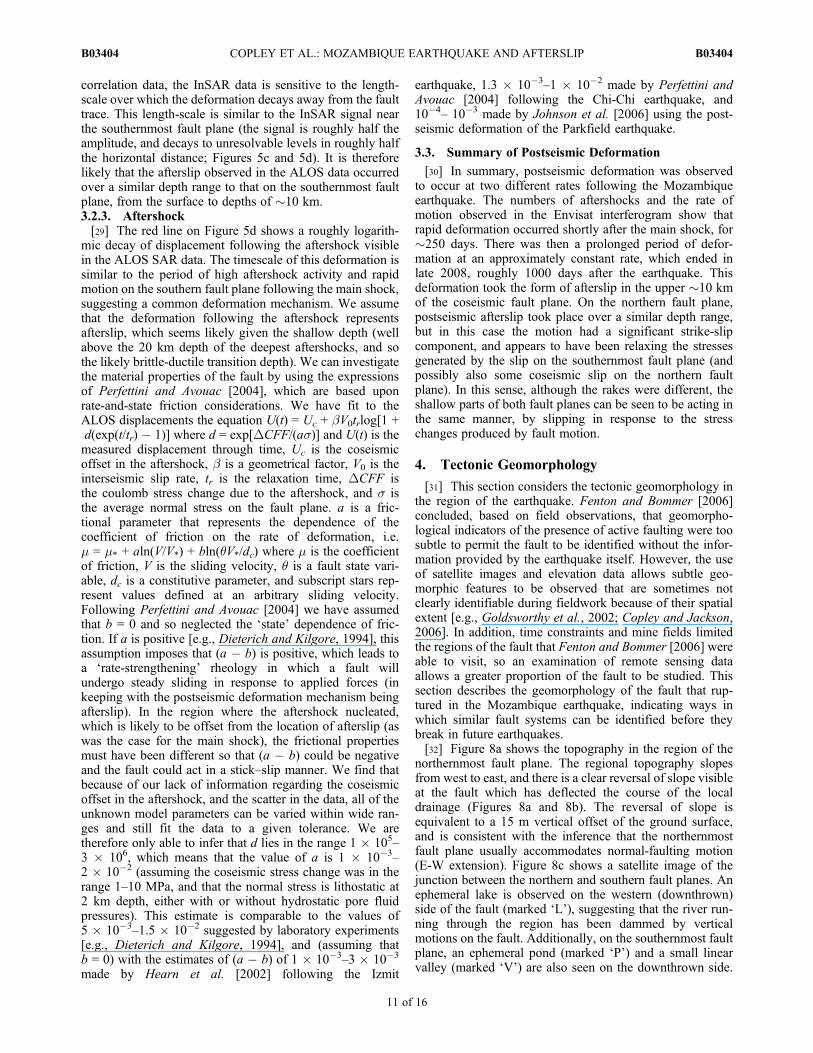
correlation data, the InSAR data is sensitive to the length-scale over which the deformation decays away from the faulttrace. This length-scale is similar to the InSAR signal nearthe southernmost fault plane (the signal is roughly half theamplitude, and decays to unresolvable levels in roughly halfthe horizontal distance; Figures 5c and 5d). It is thereforelikely that the afterslip observed in the ALOS data occurredover a similar depth range to that on the southernmost faultplane, from the surface to depths of �10 km.3.2.3. Aftershock[29] The red line on Figure 5d shows a roughly logarith-
mic decay of displacement following the aftershock visiblein the ALOS SAR data. The timescale of this deformation issimilar to the period of high aftershock activity and rapidmotion on the southern fault plane following the main shock,suggesting a common deformation mechanism. We assumethat the deformation following the aftershock representsafterslip, which seems likely given the shallow depth (wellabove the 20 km depth of the deepest aftershocks, and sothe likely brittle-ductile transition depth). We can investigatethe material properties of the fault by using the expressionsof Perfettini and Avouac [2004], which are based uponrate-and-state friction considerations. We have fit to theALOS displacements the equation U(t) = Uc + bV0trlog[1 +d(exp(t/tr) � 1)] where d = exp[DCFF/(as)] and U(t) is themeasured displacement through time, Uc is the coseismicoffset in the aftershock, b is a geometrical factor, V0 is theinterseismic slip rate, tr is the relaxation time, DCFF isthe coulomb stress change due to the aftershock, and s isthe average normal stress on the fault plane. a is a fric-tional parameter that represents the dependence of thecoefficient of friction on the rate of deformation, i.e.m = m∗ + aln(V/V∗) + bln(qV∗/dc) where m is the coefficientof friction, V is the sliding velocity, q is a fault state vari-able, dc is a constitutive parameter, and subscript stars rep-resent values defined at an arbitrary sliding velocity.Following Perfettini and Avouac [2004] we have assumedthat b = 0 and so neglected the ‘state’ dependence of fric-tion. If a is positive [e.g., Dieterich and Kilgore, 1994], thisassumption imposes that (a � b) is positive, which leads toa ‘rate-strengthening’ rheology in which a fault willundergo steady sliding in response to applied forces (inkeeping with the postseismic deformation mechanism beingafterslip). In the region where the aftershock nucleated,which is likely to be offset from the location of afterslip (aswas the case for the main shock), the frictional propertiesmust have been different so that (a � b) could be negativeand the fault could act in a stick–slip manner. We find thatbecause of our lack of information regarding the coseismicoffset in the aftershock, and the scatter in the data, all of theunknown model parameters can be varied within wide ran-ges and still fit the data to a given tolerance. We aretherefore only able to infer that d lies in the range 1 � 105–3 � 106, which means that the value of a is 1 � 10�3–2 � 10�2 (assuming the coseismic stress change was in therange 1–10 MPa, and that the normal stress is lithostatic at2 km depth, either with or without hydrostatic pore fluidpressures). This estimate is comparable to the values of5 � 10�3–1.5 � 10�2 suggested by laboratory experiments[e.g., Dieterich and Kilgore, 1994], and (assuming thatb = 0) with the estimates of (a � b) of 1 � 10�3–3 � 10�3
made by Hearn et al. [2002] following the Izmit
earthquake, 1.3 � 10�3–1 � 10�2 made by Perfettini andAvouac [2004] following the Chi-Chi earthquake, and10�4– 10�3 made by Johnson et al. [2006] using the post-seismic deformation of the Parkfield earthquake.
3.3. Summary of Postseismic Deformation
[30] In summary, postseismic deformation was observedto occur at two different rates following the Mozambiqueearthquake. The numbers of aftershocks and the rate ofmotion observed in the Envisat interferogram show thatrapid deformation occurred shortly after the main shock, for�250 days. There was then a prolonged period of defor-mation at an approximately constant rate, which ended inlate 2008, roughly 1000 days after the earthquake. Thisdeformation took the form of afterslip in the upper �10 kmof the coseismic fault plane. On the northern fault plane,postseismic afterslip took place over a similar depth range,but in this case the motion had a significant strike-slipcomponent, and appears to have been relaxing the stressesgenerated by the slip on the southernmost fault plane (andpossibly also some coseismic slip on the northern faultplane). In this sense, although the rakes were different, theshallow parts of both fault planes can be seen to be acting inthe same manner, by slipping in response to the stresschanges produced by fault motion.
4. Tectonic Geomorphology
[31] This section considers the tectonic geomorphology inthe region of the earthquake. Fenton and Bommer [2006]concluded, based on field observations, that geomorpho-logical indicators of the presence of active faulting were toosubtle to permit the fault to be identified without the infor-mation provided by the earthquake itself. However, the useof satellite images and elevation data allows subtle geo-morphic features to be observed that are sometimes notclearly identifiable during fieldwork because of their spatialextent [e.g., Goldsworthy et al., 2002; Copley and Jackson,2006]. In addition, time constraints and mine fields limitedthe regions of the fault that Fenton and Bommer [2006] wereable to visit, so an examination of remote sensing dataallows a greater proportion of the fault to be studied. Thissection describes the geomorphology of the fault that rup-tured in the Mozambique earthquake, indicating ways inwhich similar fault systems can be identified before theybreak in future earthquakes.[32] Figure 8a shows the topography in the region of the
northernmost fault plane. The regional topography slopesfrom west to east, and there is a clear reversal of slope visibleat the fault which has deflected the course of the localdrainage (Figures 8a and 8b). The reversal of slope isequivalent to a 15 m vertical offset of the ground surface,and is consistent with the inference that the northernmostfault plane usually accommodates normal-faulting motion(E-W extension). Figure 8c shows a satellite image of thejunction between the northern and southern fault planes. Anephemeral lake is observed on the western (downthrown)side of the fault (marked ‘L’), suggesting that the river run-ning through the region has been dammed by verticalmotions on the fault. Additionally, on the southernmost faultplane, an ephemeral pond (marked ‘P’) and a small linearvalley (marked ‘V’) are also seen on the downthrown side.
COPLEY ET AL.: MOZAMBIQUE EARTHQUAKE AND AFTERSLIP B03404B03404
11 of 16

The combination of the reversal of slope and the damming oflocal drainage are indicative of the presence of previousfaulting, and so provide a method of identifying other activefaults within the region. Using these indicators, active faultsto the NE of that which ruptured in the earthquake have beenidentified and marked with white arrows on Figure 1b.
5. Discussion
5.1. Upper-Crustal Rheology
[33] The coseismic and postseismic results indicate that onthe southern fault plane the top �10 km of the crust accu-mulated less slip during the earthquake than deeper depths,and then slipped postseismically. This shallow coseismicslip deficit implies the shallow part of the fault inhibited thepropagation of seismic rupture, although some coseismicslip did occur. The depth range over which the coseismicslip deficit and the ensuing shallow afterslip occurredroughly corresponds to the 5–10 km thickness of sedimentsin the Mozambique coastal plain [Salman and Abdula, 1995;Watts, 2001]. It therefore appears that the fault plane hasdifferent mechanical properties where it cuts through thethick sequence of sediments, compared to deeper depthswhere it cuts through crystalline basement.
[34] The behavior we have observed is similar to thatexpected for a fault zone in which a ‘velocity-weakening’region (which will display stick-slip behavior) is separatedfrom the surface by a ‘velocity-strengthening’ region (whichwill usually slide at slow velocities in response to appliedstresses, and not accumulate elastic strain) [e.g., Maroneet al., 1991; Rice, 1993; Kaneko et al., 2008]. Numericalmodels [e.g., Kaneko et al., 2008] show that in this situationcoseismic rupture can dynamically propagate into thevelocity-strengthening region, although the total slip willbe lower than in the velocity-weakening region beneath. Insuch a situation the velocity-strengthening surface layerwould then be expected to slide in the time following theearthquake, in response to the coseismic stress changes, asis observed for the case of the Mozambique earthquake. Thesignificant strike-slip motion observed on the northernmostfault plane suggests that the stresses generated on that partof the fault during the earthquake were similar to, or largerthan, the �E-W extensional stresses related to the motionsof the bounding plates, probably indicating that the shallowpart of the fault was relatively unstressed prior to theearthquake.[35] If the link between our observations, the thickness of
the sedimentary layer, and the dynamic models of afterslipare correct, then we can infer that the rock-type a given fault
Figure 8. (a) Topography in the region of the Mozambique earthquake, illuminated from the east.The white arrows show the location of a �N-S trending scarp that reverses the regional downwardslope to the east. This scarp corresponds to the location of the northern fault plane shown inFigure 1b. (b) Topographic profile along the white line in Figure 8a. The scarp is clearly visible, and repre-sents a �15 m vertical offset in the regional slope. (c) Landsat satellite image of the region marked by thered box in Figure 8a (Band combination: red = 3, green = 2, blue = 1, intensity from band 8). Whitecircles show the locations of surface ruptures identified by Fenton and Bommer [2006]. Grey bands showthe approximate locations of the surface displacement discontinuities in the Envisat postseismic interfer-ogram shown in Figure 5b. Also labeled are an ephemeral lake and pond (L and P), and a shallow linearvalley (V).
COPLEY ET AL.: MOZAMBIQUE EARTHQUAKE AND AFTERSLIP B03404B03404
12 of 16
is cutting plays a first-order role in determining whether itwill display stick-slip (velocity-weakening) or predomi-nantly creeping (velocity-strengthening) behavior. Shallowslip deficits have been observed in other earthquakes [e.g.,Fialko et al., 2005, and references therein], and it may bethat similar effects occur in the sedimentary layer in mostearthquakes (as also suggested by Marone et al. [1991]), butthat the large thickness of sediments in the region of theMozambique earthquake allowed the behavior to be seenwith greater ease. With the information we have availablewe are not able to infer exactly what property of the fault orsurrounding rocks and fluids in the sedimentary layer pro-motes creeping rather than stick-slip behavior. One possi-bility is suggested by the experiments of Marone et al.[1990], which demonstrated that unconsolidated gouge canbehave in a velocity strengthening manner. However, itshould also be noted that some experimental results showthat fault gouge can become velocity weakening undercertain conditions of displacement and induration [e.g.,Biegel et al., 1989], which may explain why earthquakes dosometimes nucleate in (and are contained within) the sedi-mentary layer [e.g. Nissen et al., 2011].
5.2. Mid-crustal Rheology
[36] The coefficient of friction (the ratio of shear andnormal stresses at failure) for rocks is generally thought to bein the range between 0.6 (‘Byerlee’s Law’) and ≤0.1 [e.g.,Lamb, 2006; Herman et al., 2010; Copley et al., 2011].These coefficients of friction are expected to result in activenormal faults forming at dips between 60° and 45°, whichmay then rotate to shallower dips during the accumulationof displacement. The dip of the fault that ruptured in theMozambique earthquake (�75°) is therefore steeper thanexpected. This steep dip is likely to represent the rupture ofa preexisting weak plane where slip can occur at lowerstresses than on more optimally oriented, but stronger,planes. The extensive faulting in the region that occurredduring the break-up of Gondwana may be the origin of thispreexisting weakness.[37] We can quantify the weakness of the fault plane
relative to the surrounding material by comparing thecoefficient of friction required for slip on a 75° plane withthat on an optimally oriented plane in the same location(which may or may not be a preexisting fault). If thecoefficient of friction of the optimally oriented planes were0.6 (as in ‘Byerlee’s Law’), then these planes would dip at60°, and the fault that broke in the earthquake would berequired to have a coefficient of friction at least �25%lower. If the coefficient of friction for the optimal planeswere the lower value of 0.1 (as suggested by some geo-physical observations [e.g. Lamb, 2006; Herman et al.,2010; Copley et al., 2011]), then the optimal planes woulddip at 48°, and the fault that ruptured would be required tohave a coefficient of friction at least �45% lower. In thesecalculations we have assumed that the fault plane has ahomogeneous coefficient of friction throughout. It has beensuggested that faults may be ‘statically strong but dynami-cally weak’ [e.g., Lapusta and Rice, 2003; Di Toro et al.,2004], i.e. containing weak patches in which slip cannucleate and spread by dynamic weakening into regions notat the static failure criterion. If this is the case, then our
constraints upon the coefficient of friction apply to the weakregions of the faults, where the slip first nucleates.[38] The Mozambique earthquake ruptured from the sur-
face to a similar depth as the 2001 Mw7.6 Bhuj (India)earthquake [Copley et al., 2011] (�25–30 km at Bhuj and�20 km at Mozambique), and the along-strike extent of thehigh-displacement patch was relatively similar in size(�25 km at Bhuj and �20 km at Mozambique). Both aredip-slip events in relatively slowly deforming regions,although the Bhuj event was a thrust. The considerablylower displacements in Mozambique compared with Bhujmean that the stress-drop we have estimated is roughly afactor of two lower than that seen at Bhuj (�35 MPa atBhuj compared with �16 MPa at Mozambique), which islikely to be a robust feature because both estimates wereobtained using the same techniques so no methodologicalbiases should be present. One possible explanation for thedifference is that the estimated stress-drop represents anaverage over the ruptured patch, and if the shallow part ofthe fault plane in Mozambique obeys a different rheolog-ical law (i.e. velocity-strengthening rather than velocity-weakening), then the calculations of Kaneko et al. [2008]suggest a reduced stress-drop on the shallow part of thefault. (Although there was a shallow slip deficit apparent inco-seismic models of the Bhuj event, it occupied a smallerproportion of the vertical rupture extent.) Another possibilityis that the two fault planes simply have different materialproperties, because of differences in mineralogy or porefluid pressures. Copley et al. [2011] suggested that the Bhujfault plane was strong enough to support the forces exertedupon India by the Tibetan Plateau (equivalent to the sug-gestions of Townend and Zoback [2000] and Jackson et al.[2008] that the majority of lithospheric stresses are trans-mitted through the seismogenic layer). This logic impliesthat if there are variations by up to a factor of two in theshear stresses supportable by faults in the seismogeniclayer, then the processes responsible for these differencescould play a role in halving or doubling the sizes of stressesthat can be transmitted through the continents, and so thetopography that can be supported. Therefore, if themechanical properties of the sedimentary layer are playing afundamental role in governing fault rheology at shallowdepths, then the location and thickness of sedimentarydeposition could have a dramatic effect upon large-scalecontinental tectonics (in a manner additional to the tem-perature effects that Copley et al. [2009] discussed in theAdriatic region).
5.3. Rheology of the Ductile Lithosphere
[39] As described above, there was no resolvable long-wavelength postseismic deformation signal of the type oftenobserved after large earthquakes [e.g., Freed and Burgmann,2004], as was also concluded by Fialko [2009] andRaucoules et al. [2010]. This lack of signal can be used toplace constraints upon the viscosity of the ductile lithospherein the region. We have used the VISCO-1D code [Pollitz,1992] to calculate the postseismic response of a Maxwellviscoelastic layer underlying an elastic lid, in response to thestresses generated by our coseismic slip model. Based on thedepth extent of the main shock, and the depth distribution ofaftershocks, we use an elastic layer extending to a depth of21 km (1 km deeper than the estimated base of the coseismic
COPLEY ET AL.: MOZAMBIQUE EARTHQUAKE AND AFTERSLIP B03404B03404
13 of 16

slip and the deepest aftershock, in order to avoid numericalproblems resulting from the fault reaching the base of theelastic layer). We have used two conceptual models of lith-osphere rheology in order to constrain the viscosity of theductile layers. In the first we have assumed that the entireductile lithosphere has the same viscosity, and have foundthe minimum viscosity that would result in no visible post-seismic deformation at the surface during our period ofALOS observations (December 2006 to October 2010).Based on the ALOS data presented above, we assume adetection limit of 1 cm. This limit corresponds to a minimumbound on the viscosity of �2 � 1019 Pa s. The surfacedeformation calculated to result from this scenario is shownin Figure 9a. If the elastic layer is taken to be thicker, thebound on the viscosity reduces, as shown in Figure 9b.[40] In a second conceptual model of lithospheric
rheology, we have assumed that the upper mantle behaveselastically (over a depth range of 25 km beneath a 35 kmthick crust). Because most of the deformation occurs in theductile lower crust in the previous model, imposing anelastic upper mantle layer does little to change the resultingviscosity bound. Observations over a longer timescalewould be required to investigate where in the range of�2 � 1019 Pa s or higher the actual viscosity lies.[41] It is possible that long-wavelength signals could be
masked by long-wavelength artifacts in the InSAR data,resulting from inaccuracies in orbital parameters. To test ifthese artifacts are present in our data, we have fitted E-Wdipping linear planes to the ALOS displacements in each ofour 60 interferograms (the variations in line-of-sight dis-placement expected from the viscoelastic models are largestalong E-W profiles through the fault). The best-fitting planesshow no consistency in dip direction (i.e. east or west), andmostly have gradients of less than 0.01 cm/km (in 51 of the60 interferograms), which is significantly smaller than the
gradients present in the calculations that show displacementsabove our detection threshold of 1 cm (e.g. the�0.05 cm/kmshown in Figure 9a). Of the remaining interferograms, wherethe gradients are larger (up to 0.017 cm/km), these gradientscan be seen to be dominated by features which appear to beatmospheric in origin (i.e. they are irregular in shape, ratherthan forming the smooth variation expected from orbitalartifacts). We therefore believe that were a signal of visco-elastic relaxation present at above the level of our detectionthreshold (1 cm), it would not be overwhelmed by orbitalartifacts, and that our estimate of�2� 1019 Pa s represents atrue lower bound on the viscosity.
5.4. Implications for Seismic Hazard Assessment
[42] Our information regarding the faulting during theMozambique earthquake has implications for the assessmentof seismic hazard on similar fault systems. First, althoughthe coseismic slip at the surface on the southernmost faultplane was concentrated onto a discrete fault scarp, we do notknow if the postseismic afterslip also occurred on this scarp,or if it was laterally distributed over tens to hundreds ofmeters. If the afterslip was laterally distributed at the surface,then studies based only upon the surface fault scarp wouldinfer an amount of total slip that was less than half of whathad actually occurred in the entire seismic cycle. Addition-ally, studies based only upon observations of the recentmotion at the surface on the northernmost fault plane wouldfail to capture two aspects of the deformation. First, thesense of long-term motion would be incorrectly interpreted(which from recent observations would be taken to have asignificant strike-slip component, at odds with the regionalstrain). Secondly, the fault would be interpreted to haveslipped recently. While this is true for the near-surfacelayers, the teleseismic data precludes significant slip atdepths corresponding to the crystalline basement, where the
Figure 9. (a) Predicted ALOS line-of-sight displacement along a profile through the center of the faultover the time period December 2006 to October 2010, calculated assuming relaxation in a Maxwellviscoelastic half-space with a viscosity of 2 � 1019Pa s underlying a 21 km thick elastic layer (negativedisplacements correspond to increasing distance between the ground and the satellite). (b) Maximumline-of-sight displacement as a function of the thickness of the elastic layer and the viscosity of the under-lying half-space. Our detection limit of 1 cm is shown.
COPLEY ET AL.: MOZAMBIQUE EARTHQUAKE AND AFTERSLIP B03404B03404
14 of 16
fault is presumably still capable of generating large earth-quakes in the near future. Possibly the best way to minimizethe effects of these potentially misleading observationswould be to collect fault offset data spanning the largestpossible numbers of timescales and distances from the faulttrace.
6. Conclusions
[43] The geodetic data available for the region of the 2006Mozambique earthquake, along with teleseismic data, haveallowed us to produce a well-constrained source model andstudy the postseismic deformation. Where the fault cutsthrough the crystalline basement it behaves in a stick-slip(‘velocity-weakening’) manner, and has a coefficient offriction at least �25–45% lower than that on optimallyoriented planes. Within the sedimentary layer the faultbehaved postseismically in a creeping manner (‘velocity-strengthening’), although the earthquake rupture dynami-cally propagated into this shallow region. The presence ofthick sedimentary sequences containing creeping fault zonesmay have a significant impact on the magnitude of theforces that can be transmitted through the seismogeniccrust. The stresses generated by slip on the main fault planeof the earthquake led to significant strike-slip postseismic(and possibly coseismic) slip on the shallow part of anadjacent normal fault. Analysis of the deformation follow-ing an aftershock indicates that the value of the parameter‘a’ that describes the rate-dependence of fault friction lies inthe range 1 � 10�3–2 � 10�2. The lack of significant long-wavelength postseismic deformation implies viscosities inthe ductile lithosphere greater than �2 � 1019 Pa s. Thefault that ruptured in the earthquake had previously pro-duced subtle features visible in the geomorphology of theregion, although earthquakes similar to this one may leavemisleading features in the landscape from the perspective ofassessing seismic hazard.
[44] Acknowledgments. We thank James Jackson for help inacquiring SPOT images via ISIS/CNES. Includes material copyrightCNES 2010, distribution Spot Image S.A. We thank three anonymousreviewers for helpful comments on the manuscript. We thank PembrokeCollege in the University of Cambridge and the Gordon and Betty MooreFoundation for financial support.
ReferencesAvouac, J.-P., F. Ayoub, S. Leprince, O. Konca, and D. V. Helmberger(2006), The 2005, Mw 7.6 Kashmir earthquake: Sub-pixel correlationof ASTER images and seismic waveforms analysis, Earth Planet. Sci.Lett., 249, 514–528.
Biegel, R. L., C. G. Sammis, and J. H. Dieterich (1989), The frictionalproperties of simulated fault gouge having a fractal particle distribution,J. Struct. Geol., 11, 827–846.
Biggs, J., E. A. Bergman, B. Emmerson, G. J. Funning, J. A. Jackson,B. E. Parsons, and T. J. Wright (2006), Fault identification for buriedstrike-slip earthquakes using InSAR: The 1994 and 2004 Al Hoceima,Morocco earthquakes, Geophys. J. Int., 166, 1347–1362.
Bondar, I., E. A. Bergman, E. R. Engdahl, B. Kohl, Y. Kung, andK. McLaughlin (2008), A hybrid multiple event location technique toobtain ground truth event locations, Geophys. J. Int., 175, 185–201.
Burgmann, R., D. D. Pollard, and S. J. Martel (1994), Slip distributions onfaults: Effects of stress gradients, inelastic deformation, heterogeneoushost-rock stiffness, and fault interaction, J. Struct. Geol., 16, 1675–1690.
Chandrasekhar, D. V., R. Burgmann, C. D. Reddy, P. S. Sunil, and D. A.Schmidt (2009), Weak mantle in NW India probed by geodetic measure-ments following the 2001 Bhuj earthquake, Earth Planet. Sci. Lett., 280,229–235.
Chen, W., and P. Molnar (1983), Focal depths of intracontinental and intra-plate earthquakes and their implications for the thermal and mechanicalproperties of the lithosphere, J. Geophys. Res., 88, 4183–4214.
Copley, A., and J. Jackson (2006), Active tectonics of the Turkish-Iranianplateau, Tectonics, 25, TC6006, doi:10.1029/2005TC001906.
Copley, A., F. Boait, J. Hollingsworth, J. Jackson, and D. McKenzie(2009), Subparallel thrust and normal faulting in Albania and the roleof gravitational potential energy and rheology contrasts in mountain belts,J. Geophys. Res., 114, B05407, doi:10.1029/2008JB005931.
Copley, A., J.-P. Avouac, J. Hollingsworth, and S. Leprince (2011), The2001 Mw 7.6 Bhuj earthquake, low fault priction, and the crustal supportof plate driving forces in India, J. Geophys. Res., 116, B08405,doi:10.1029/2010JB008137.
Craig, T. J., J. A. Jackson, K. Priestley, and D. McKenzie (2011), Earth-quake distribution patterns in Africa: Their relationship to variations inlithospheric and geological structure, and their rheological implications,Geophys. J. Int., 185, 403–434.
Dieterich, J. H., and B. D. Kilgore (1994), Direct observation of fric-tional contacts: New insights for state-dependent properties, Pure Appl.Geophys., 143, 283–302.
Di Toro, G., D. L. Goldsby, and T. E. Tullis (2004), Friction falls towardszero in quartz rock as slip velocity approaches seismic rates, Nature, 427,436–439.
Engdahl, E. R., R. van der Hilst, and R. Buland (1998), Global teleseismicearthquake relocation with improved travel times and procedures fordepth determination, Bull. Seismol. Soc. Am., 88, 722–743.
Eshelby, J. D. (1957), The determination of the elastic field of an ellipsoidalinclusion, and related problems, Proc. R. Soc. A, 241, 376–396.
Fenton, C. H., and J. J. Bommer (2006), The Mw7 Machaze, Mozambique,earthquake of 23 February 2006, Seismol. Res. Lett., 77, 426–439.
Fialko, Y. (2004), Evidence of fluid-filled upper crust from observations ofpostseismic deformation due to the 1992 Mw7.3 Landers earthquake,J. Geophys. Res., 109, B08401, doi:10.1029/2004JB002985.
Fialko, Y. (2009), Study of postseismic deformation due to the 2006Mw 7.0Mozambique (East Africa) earthquake using alos-palsar data, paper pre-sented at 3rd ALOS PI Symposium, Kona, Hawaii, 9–13 Nov.
Fialko, Y., D. Sandwell, M. Simons, and P. Rosen (2005), Three-dimensional deformation caused by the Bam, Iran, earthquake andthe origin of shallow slip deficit, Nature, 435, 295–299.
Fielding, E. J., P. R. Lundgren, R. Burgmann, and G. J. Funning (2009),Shallow fault-zone dilatency recovery after the 2003 Bam earthquake inIran, Nature, 458, 64–68.
Freed, A. M., and R. Burgmann (2004), Evidence of power-law flow in theMojave desert mantle, Nature, 430, 548–551.
Freymueller, J., N. E. King, and P. Segall (1994), The co-seismic slip distri-bution of the Landers earthquake, J. Geophys. Res., 84, 646–659.
Goldsworthy, M., J. Jackson, and J. Haines (2002), The continuity of activefault systems in Greece, Geophys. J. Int., 148, 596–618.
Hearn, E. H., R. Burgmann, and R. E. Reilinger (2002), Dynamics of Izmitearthquake postseismic deformation and loading of the Duzce earthquakehypocentre, Bull. Seismol. Soc. Am., 92, 172–193.
Herman, F., et al. (2010), Exhumation, crustal deformation, and thermalstructure of the Nepal Himalaya derived from the inversion of thermo-chronological and thermobarametric data and modeling of the topogra-phy, J. Geophys. Res., 115, B06407, doi:10.1029/2008JB006126.
Hetenyi, G., R. Cattin, J. Vergne, and J. L. Nabelek (2006), The effectiveelastic thickness if the India Plate from receiver function imaging, gravityanomalies and thermomechanical modelling, Geophys. J. Int., 167,1106–1118.
Hsu, Y.-J., M. Simons, J.-P. Avouac, J. Galetzka, K. Sieh, M. Chlieh,D. Natawidjaja, L. Prawirodirdjo, and Y. Bock (2006), Frictional after-slip following the 2005 Nias-Simeulue earthquake, Sumatra, Science,312, 1921–1926.
Hsu, Y.-J., S.-B. Yu, and H.-Y. Chen (2009), Coseismic and postseismicdeofrmation associated with the 2003 Chengkung, Taiwan, earthquake,Geophys. J. Int., 176, 420–430.
Jackson, J., D. McKenzie, K. Priestley, and B. Emmerson (2008), Newviews on the structure and rheology of the lithosphere, J. Geol. Soc.,165, 453–465.
Ji, C., D. J. Wald, and D. V. Helmberger (2002), Source description of the1999 Hector Mine, California, earthquake, part 1: Wavelet domaininversion theory and resolution analysis, Bull. Seismol. Soc. Am., 92,1192–1207.
Ji, C., D. V. Helmberger, D. J. Wald, and K.-F. Ma (2003), Slip his-tory and dynamic implications of the 1999 Chi-Chi, Taiwan, earthquake,J. Geophys. Res., 108(B9), 2412, doi:10.1029/2002JB001764.
Johanson, I. A., and R. Burgmann (2010), Coseismic and postseismic slipfrom the 2003 San Simeon earthquake and their effects on backthrust slip
COPLEY ET AL.: MOZAMBIQUE EARTHQUAKE AND AFTERSLIP B03404B03404
15 of 16

and the 2004 Parkfield earthquake, J. Geophys. Res., 115, B07411,doi:10.1029/2009JB006599.
Johnson, K., R. Burgmann, and K. Larson (2006), Frictional properties onthe San Andreas Fault near Parkfield, California, inferred from modelsof afterslip following the 2004 earthquake, Bull. Seismol. Soc. Am., 96,S321–S338, doi:10.1785/0120050808.
Jordan, T. H., and K. A. Sverdrup (1981), Teleseismic location techniquesand their application to earthquake clusters in the south-central Pacific,Bull. Seismol. Soc. Am., 71, 1105–1130.
Kaneko, Y., and Y. Fialko (2011), Shallow slip deficit due to large strike-slip earthquakes in dynamic rupture simulations with elasto-plastic off-fault response, Geophys. J. Int., 186, 1389–1403.
Kaneko, Y., N. Lapusta, and J.-P. Ampuero (2008), Spectral-elementmodeling of spontaneous earthquake rupture on rate and state faults:Effect of velocity-strenghtening friction at shallow depths, J. Geophys.Res., 113, B09317, doi:10.1029/2007JB005553.
Konca, O. (2008), Partial rupture of a locked patch of the Sumatra mega-thrust during the 2007 earthquake sequence, Nature, 456, 631–635.
Konca, O., S. Leprince, J.-P. Avouac, and D. V. Helmberger (2010), Rup-ture process of the 1999 Mw 7.1 Duzce earthquake from joint analysis ofSPOT, GPS, InSAR, strong-motion, and teleseismic data: A supershearrupture with variable rupture velocity, Bull. Seismol. Soc. Am., 100,267–288.
Kositsky, A. P., and J.-P. Avouac (2010), Inverting geodetic time serieswith a principal component analysis-based inversion method, J. Geophys.Res., 115, B03401, doi:10.1029/2009JB006535.
Lamb, S. (2006), Shear stresses on megathrusts: Implications for mountainbuilding behind subduction zones, J. Geophys. Res., 111, B07401,doi:10.1029/2005JB003916.
Langbein, J., A. McGarr, J. S. Johnston, and P. W. Harsh (1983), Geodeticmeasurements of postseismic crustal deformation following the 1979Imperial Valley earthquake, California, Bull. Seismol. Soc. Am., 73,1203–1224.
Lapusta, N., and J. R. Rice (2003), Low-heat and low-stress fault operationin earthquake models of statically strong but dynamically weak faults, InEos Trans. AGU 84(46), Fall Meet. Suppl., Abstract S51B-02.
Leprince, S., S. Barbot, F. Ayoub, and J.-P. Avouac (2007), Automatic andprecise ortho-rectification, coregistration, and subpixel correlation of sat-ellite images, application to ground deformation measurements, IEEETrans. Geosci. Remote Sens., 45, 1529–1558.
Leprince, S., P. Muse, and J.-P. Avouac (2008), In-flight CCD distortioncalibration for pushbroom satellites based on subpixel correlation, IEEETrans. Geosci. Remote Sens., 46, 2675–2683.
Marone, C. J., C. B. Raleigh, and C. H. Scholz (1990), Frictional behaviorand constitutive modeling of simulated fault gouge, J. Geophys. Res., 95,7007–7025.
Marone, C. J., C. H. Scholtz, and R. Bilham (1991), On the mechanics ofearthquake afterslip, J. Geophys. Res., 96, 8441–8452.
Nissen, E., F. Yamini-Fard, M. Tatar, A. Gholamzadeh, E. Bergman,J. R. Elliott, J. A. Jackson, and B. Parsons (2010), The vertical separationof mainshock rupture and microseismicity at Qeshm island in the Zagrosfold-and-thrust belt, Iran, Earth Planet. Sci. Lett., 296, 181–194.
Nissen, E., M. Tatar, J. A. Jackson, and M. B. Allen (2011), New views onearthquake faulting in the Zagros fold-and-thrust belt of Iran, Geophys. J.Int., 186, 928–944.
Nocquet, J.-M., P. Willis, and S. Garcia (2006), Plate kinematics ofNubia-Somalia using combined DORIS and GPS solution, J. Geod.,80, 591–607.
Perfettini, H., and J.-P. Avouac (2004), Postseismic relaxation driven bybrittle creep: A possible mechanism to reconcile geodetic measurementsand the decay rate of aftershocks, application to the Chi-Chi earthquake,Taiwan, J. Geophys. Res., 109, B02304, doi:10.1029/2003JB002488.
Perfettini, H., and J.-P. Avouac (2007), Modeling afterslip and aftershocksfollowing the 1992 Landers earthquake, J. Geophys. Res., 112, B07409,doi:10.1029/2006JB004399.
Pollitz, F. F. (1992), Postseismic relaxation theory on the spherical Earth,Bull. Seismol. Soc. Am., 82, 422–453.
Raucoules, D., B. Ristori, M. de Michele, and P. Briole (2010), Surfacedisplacement of the Mw 7 Machaze earthquake (Mozambique): Comple-mentary use of multiband InSAR and radar amplitude image correlationwith elastic modelling, Remote Sens. Environ., 114, 2211–2218.
Rice, J. R. (1993), Spatio-temporal complexity of slip on a fault, J. Geophys.Res., 98, 9885–9907.
Rosen, P. A., S. Hensley, and G. Peltzer (2004), Updates repeat orbit inter-ferometry package released, Eos Trans. AGU, 85(5), 47, doi:10.1029/2004EO050004.
Salman, G., and I. Abdula (1995), Development of the Mozambique andRuvuma sedimentary basins, offshore Mozambique, Sediment. Geol.,96, 7–41.
Savage, J. C., and W. H. Prescott (1978), Asthenosphere readjustment andthe earthquake cycle, J. Geophys. Res., 83, 3369–3376.
Smith, W. H. F., and P. Wessel (1990), Gridding with continuous curvaturesplines in tension, Geophysics, 55, 293–305.
Townend, J., and M. D. Zoback (2000), How faulting keeps the cruststrong, Geology, 28, 399–402.
Watts, A. B. (2001), Gravity anomalies, flexure, and crustal structure at theMozambique rifted margin, Mar. Pet. Geol., 18, 445–455.
Watts, A. B., and E. B. Burov (2003), Lithospheric strength and its relation-ship to the elastic and seismogenic layer thickness, Earth Planet. Sci.Lett., 213, 113–131.
Yang, Z., and W.-P. Chen (2008), Mozambique earthquake sequence of2006: High-angle normal faulting in southern Africa, J. Geophys. Res.,113, B12303, doi:10.1029/2007JB005419.
E. Bergman, Global Seismological Services, 1900 19th St., Golden, CO80401, USA.A. Copley, COMET+, Bullard Labs, Department of Earth Sciences,
University of Cambridge, Cambridge CB3 0EZ, UK. ([email protected])J. Hollingsworth, Tectonics Observatory, Division of Geological and
Planetary Sciences, California Institute of Technology, Pasadena, CA91125, USA.
COPLEY ET AL.: MOZAMBIQUE EARTHQUAKE AND AFTERSLIP B03404B03404
16 of 16