A 35,000 year record of changes in the eastern Indian Ocean offshore Sumatra
19
A 35,000 year record of changes in the eastern Indian Ocean offshore Sumatra Davide S. Murgese a,b , Patrick De Deckker a,c, ⁎, Michelle I. Spooner a,d , Martin Young a,e a Department of Earth and Marine Sciences, The Australian National University, Canberra ACT 0200, Australia b SEA Consulting S.r.l, Via Cernaia 27 - 10121 Torino, Italy c Research School of Earth Sciences, The Australian National University, Canberra ACT 0200, Australia d Geoscience Australia, GPO Box 378, Canberra ACT 2601, Australia e CSIRO Petroleum,11 Julius Avenue, Riverside Corporate Park, North Ryde NSW 2113, Australia ABSTRACT ARTICLE INFO Article history: Received 14 March 2008 Received in revised form 31 May 2008 Accepted 2 June 2008 Keywords: Last glacial maximum Deep chlorophyll maximum Barrier layer Java Upwelling System Monsoon Organic carbon Foraminifera Dinoflagellates We have examined the upper 276 cm of deep-sea core BAR9403 taken at a water depth of 2034 m offshore the southern portion of Sumatra in the eastern Indian Ocean using several micropalaeontological proxies. Faunal counts and stable isotopes of oxygen and carbon of planktic and benthic foraminifers, as well as floral counts of dinoflagellates were obtained to reconstruct conditions in the oceans over the last 35,000 years. At times, we found that when benthic foraminifers indicate high organic content values at the bottom of the ocean this is not paralleled by high productivity signals at the sea surface, but instead must relate to changes in bottom-water circulation as a result of slower water circulation. The marine isotopic stages [MIS] 3-1 are clearly differentiated by benthic and foraminiferal assemblages as well as dinoflagellates and their cysts. MIS 3 is characterised by a much sharper [than today] thermocline that was closer to the sea surface and by the absence of a low-salinity ‘barrier layer’ which today results from high monsoonal rains. The absence of the latter persisted during the last glacial period [MIS 2] when bottom circulation must have been reduced and high percentages of organic matter occurred on the sea floor combined with low dissolved-oxygen levels. The deglaciation is marked by a change in salinity at the sea surface as seen by the dinoflagellates and planktic foraminifers and progressive alteration of the thermocline was detected by foraminifers suggesting a less productive deep chlorophyll maximum in contrast with MIS 3 and 2. Monsoonal activity commenced around 15,000 cal years ago and was well established 2000 years later. The Holocene is marked by a significant increase in river discharge to the ocean, pulsed by the delivery of organic matter to the sea floor, despite overall oligotrophic conditions at and near the sea surface induced by a permanent low-salinity cap. We did not identify obvious and persistent upwelling conditions offshore Sumatra for the last 35,000 years. © 2008 Elsevier B.V. All rights reserved. 1. Introduction 1.1. Regional oceanography and climate The eastern Indian Ocean adjacent to the 2 large Indonesian Islands, Sumatra and Java, displays contrasting seasonal character- istics at the sea surface. In the austral summer [December to February], salinity is rather low (≤ 32 S) due to the monsoonal activity. Overall, the monthly rainfall on Sumatra and offshore in the Indian Ocean is well over 30 cm per month [see http://www.jisao. washington.edu/data/smi/rss/precipssmirssclimr/jpg] with ensuing huge discharges of river water to the ocean. During that time, the predominant winds are such that the southeast trades, that are prevalent between December and April, will force the Southeast Java Current to flow in the direction of Western Australia, before turning southward to eventually join the Southeast Equatorial Current (Fig. 1). In contrast, during the austral winter, the northwest trade winds that are predominant between June and October cause the Current to run in the opposite direction to the one mentioned above, thus flowing towards the Andaman Sea. This coincides with the “drier” season, but still the Island of Sumatra continues to receive much rainfall. Consequently, salinity at the sea surface increases to 34.2. During the wet season there is a ‘barrier layer’ (sensu Springtall and Tomczak, 1992) that will have been enhanced near the surface of the ocean and which consists of a ‘low salinity cap’ that is approximately 50 to 100 m thick. The latter prevents any direct exchange between the atmosphere and the deeper ocean below. Of importance also is the Deep Chlorophyll Maximum [=DCM] which sits below the barrier layer, and which can only be exploited by those members of the plankton that can live in deeper waters. The barrier layer’s characteristics are typical of the Indo Pacific Warm Pool [abbreviated herewith to ‘Warm Pool’], a body of water that today encompasses the entire Indonesian Archipelago and that extends as far east as the Pacific side of Papua New Guinea, in the south just north of Australia and west to the eastern Andaman Sea. The Warm Pool consistently has surface waters ≥ 28 °C (Yan et al., 1992) and a low salinity cap due to Palaeogeography, Palaeoclimatology, Palaeoecology 265 (2008) 195–213 ⁎ Corresponding author. Research School of Earth Sciences, The Australian National University, Canberra ACT 0200, Australia. Fax: +61 2 6125 5544. E-mail address: [email protected] (P. De Deckker). 0031-0182/$ – see front matter © 2008 Elsevier B.V. All rights reserved. doi:10.1016/j.palaeo.2008.06.001 Contents lists available at ScienceDirect Palaeogeography, Palaeoclimatology, Palaeoecology journal homepage: www.elsevier.com/locate/palaeo
-
Upload
independent -
Category
Documents
-
view
1 -
download
0
Transcript of A 35,000 year record of changes in the eastern Indian Ocean offshore Sumatra

Palaeogeography, Palaeoclimatology, Palaeoecology 265 (2008) 195–213
Contents lists available at ScienceDirect
Palaeogeography, Palaeoclimatology, Palaeoecology
j ourna l homepage: www.e lsev ie r.com/ locate /pa laeo
A 35,000 year record of changes in the eastern Indian Ocean offshore Sumatra
Davide S. Murgese a,b, Patrick De Deckker a,c,⁎, Michelle I. Spooner a,d, Martin Young a,e
a Department of Earth and Marine Sciences, The Australian National University, Canberra ACT 0200, Australiab SEA Consulting S.r.l, Via Cernaia 27 - 10121 Torino, Italyc Research School of Earth Sciences, The Australian National University, Canberra ACT 0200, Australiad Geoscience Australia, GPO Box 378, Canberra ACT 2601, Australiae CSIRO Petroleum, 11 Julius Avenue, Riverside Corporate Park, North Ryde NSW 2113, Australia
⁎ Corresponding author. Research School of Earth SciUniversity, Canberra ACT 0200, Australia. Fax: +61 2 612
E-mail address: [email protected] (P. De
0031-0182/$ – see front matter © 2008 Elsevier B.V. Aldoi:10.1016/j.palaeo.2008.06.001
A B S T R A C T
A R T I C L E I N F OArticle history:
We have examined the upp Received 14 March 2008Received in revised form 31 May 2008Accepted 2 June 2008Keywords:Last glacial maximumDeep chlorophyll maximumBarrier layerJava Upwelling SystemMonsoonOrganic carbonForaminiferaDinoflagellates
er 276 cm of deep-sea core BAR9403 taken at a water depth of 2034 m offshorethe southern portion of Sumatra in the eastern Indian Ocean using several micropalaeontological proxies.Faunal counts and stable isotopes of oxygen and carbon of planktic and benthic foraminifers, as well as floralcounts of dinoflagellates were obtained to reconstruct conditions in the oceans over the last 35,000 years.At times, we found that when benthic foraminifers indicate high organic content values at the bottom of theocean this is not paralleled by high productivity signals at the sea surface, but instead must relate to changesin bottom-water circulation as a result of slower water circulation. The marine isotopic stages [MIS] 3-1 areclearly differentiated by benthic and foraminiferal assemblages as well as dinoflagellates and their cysts. MIS3 is characterised by a much sharper [than today] thermocline that was closer to the sea surface and by theabsence of a low-salinity ‘barrier layer’ which today results from high monsoonal rains. The absence of thelatter persisted during the last glacial period [MIS 2] when bottom circulation must have been reduced andhigh percentages of organic matter occurred on the sea floor combined with low dissolved-oxygen levels. Thedeglaciation is marked by a change in salinity at the sea surface as seen by the dinoflagellates and plankticforaminifers and progressive alteration of the thermocline was detected by foraminifers suggesting a lessproductive deep chlorophyll maximum in contrast with MIS 3 and 2. Monsoonal activity commenced around15,000 cal years ago and was well established 2000 years later. The Holocene is marked by a significantincrease in river discharge to the ocean, pulsed by the delivery of organic matter to the sea floor, despiteoverall oligotrophic conditions at and near the sea surface induced by a permanent low-salinity cap. We didnot identify obvious and persistent upwelling conditions offshore Sumatra for the last 35,000 years.
© 2008 Elsevier B.V. All rights reserved.
1. Introduction
1.1. Regional oceanography and climate
The eastern Indian Ocean adjacent to the 2 large IndonesianIslands, Sumatra and Java, displays contrasting seasonal character-istics at the sea surface. In the austral summer [December toFebruary], salinity is rather low (≤32 S) due to the monsoonal activity.Overall, the monthly rainfall on Sumatra and offshore in the IndianOcean is well over 30 cm per month [see http://www.jisao.washington.edu/data/smi/rss/precipssmirssclimr/jpg] with ensuinghuge discharges of river water to the ocean. During that time, thepredominant winds are such that the southeast trades, that areprevalent between December and April, will force the Southeast JavaCurrent to flow in the direction of Western Australia, before turningsouthward to eventually join the Southeast Equatorial Current (Fig. 1).
ences, The Australian National5 5544.Deckker).
l rights reserved.
In contrast, during the austral winter, the northwest trade winds thatare predominant between June and October cause the Current to runin the opposite direction to the one mentioned above, thus flowingtowards the Andaman Sea. This coincides with the “drier” season, butstill the Island of Sumatra continues to receive much rainfall.Consequently, salinity at the sea surface increases to 34.2.
During thewet season there is a ‘barrier layer’ (sensu Springtall andTomczak, 1992) that will have been enhanced near the surface of theocean and which consists of a ‘low salinity cap’ that is approximately50 to 100 m thick. The latter prevents any direct exchange betweenthe atmosphere and the deeper ocean below. Of importance also is theDeep Chlorophyll Maximum [=DCM] which sits below the barrierlayer, and which can only be exploited by those members of theplankton that can live in deeper waters. The barrier layer’scharacteristics are typical of the Indo Pacific Warm Pool [abbreviatedherewith to ‘Warm Pool’], a body of water that today encompasses theentire Indonesian Archipelago and that extends as far east as thePacific side of Papua New Guinea, in the south just north of Australiaandwest to the eastern Andaman Sea. TheWarm Pool consistently hassurface waters ≥28 °C (Yan et al., 1992) and a low salinity cap due to
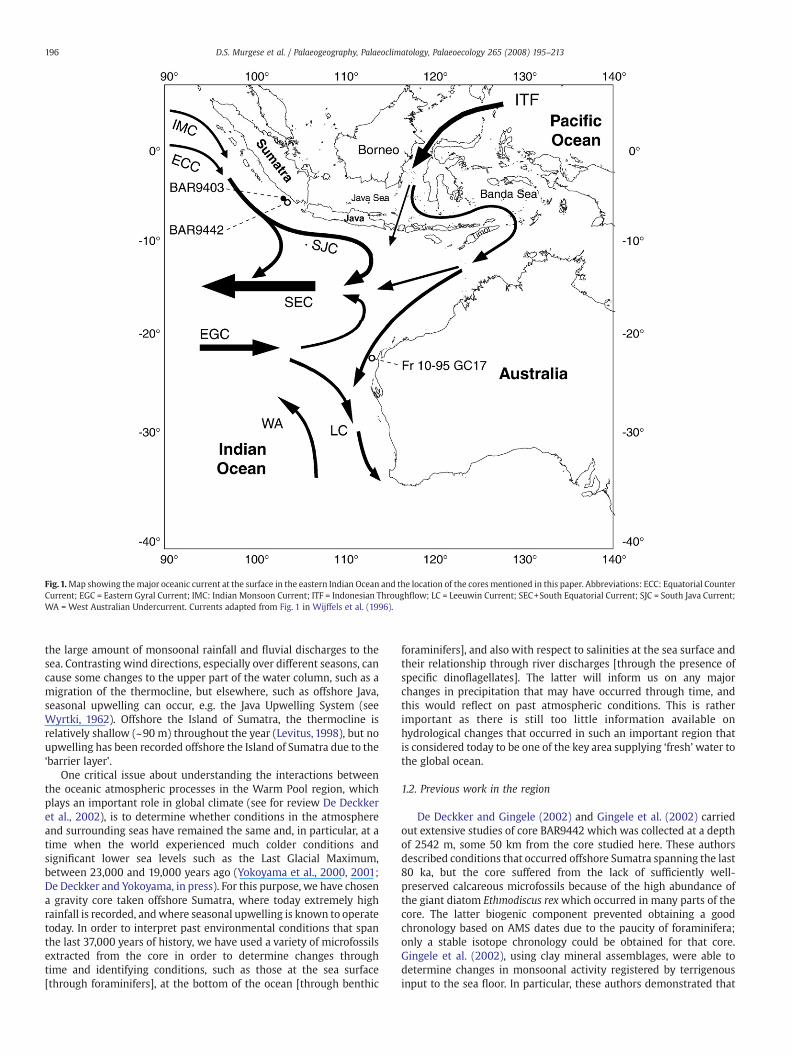
Fig.1.Map showing themajor oceanic current at the surface in the eastern Indian Ocean and the location of the coresmentioned in this paper. Abbreviations: ECC: Equatorial CounterCurrent; EGC = Eastern Gyral Current; IMC: Indian Monsoon Current; ITF = Indonesian Throughflow; LC = Leeuwin Current; SEC+South Equatorial Current; SJC = South Java Current;WA = West Australian Undercurrent. Currents adapted from Fig. 1 in Wijffels et al. (1996).
196 D.S. Murgese et al. / Palaeogeography, Palaeoclimatology, Palaeoecology 265 (2008) 195–213
the large amount of monsoonal rainfall and fluvial discharges to thesea. Contrasting wind directions, especially over different seasons, cancause some changes to the upper part of the water column, such as amigration of the thermocline, but elsewhere, such as offshore Java,seasonal upwelling can occur, e.g. the Java Upwelling System (seeWyrtki, 1962). Offshore the Island of Sumatra, the thermocline isrelatively shallow (~90 m) throughout the year (Levitus, 1998), but noupwelling has been recorded offshore the Island of Sumatra due to the‘barrier layer’.
One critical issue about understanding the interactions betweenthe oceanic atmospheric processes in the Warm Pool region, whichplays an important role in global climate (see for review De Deckkeret al., 2002), is to determine whether conditions in the atmosphereand surrounding seas have remained the same and, in particular, at atime when the world experienced much colder conditions andsignificant lower sea levels such as the Last Glacial Maximum,between 23,000 and 19,000 years ago (Yokoyama et al., 2000, 2001;De Deckker and Yokoyama, in press). For this purpose, we have chosena gravity core taken offshore Sumatra, where today extremely highrainfall is recorded, andwhere seasonal upwelling is known to operatetoday. In order to interpret past environmental conditions that spanthe last 37,000 years of history, we have used a variety of microfossilsextracted from the core in order to determine changes throughtime and identifying conditions, such as those at the sea surface[through foraminifers], at the bottom of the ocean [through benthic
foraminifers], and also with respect to salinities at the sea surface andtheir relationship through river discharges [through the presence ofspecific dinoflagellates]. The latter will inform us on any majorchanges in precipitation that may have occurred through time, andthis would reflect on past atmospheric conditions. This is ratherimportant as there is still too little information available onhydrological changes that occurred in such an important region thatis considered today to be one of the key area supplying ‘fresh’water tothe global ocean.
1.2. Previous work in the region
De Deckker and Gingele (2002) and Gingele et al. (2002) carriedout extensive studies of core BAR9442 which was collected at a depthof 2542 m, some 50 km from the core studied here. These authorsdescribed conditions that occurred offshore Sumatra spanning the last80 ka, but the core suffered from the lack of sufficiently well-preserved calcareous microfossils because of the high abundance ofthe giant diatom Ethmodiscus rex which occurred in many parts of thecore. The latter biogenic component prevented obtaining a goodchronology based on AMS dates due to the paucity of foraminifera;only a stable isotope chronology could be obtained for that core.Gingele et al. (2002), using clay mineral assemblages, were able todetermine changes in monsoonal activity registered by terrigenousinput to the sea floor. In particular, these authors demonstrated that

197D.S. Murgese et al. / Palaeogeography, Palaeoclimatology, Palaeoecology 265 (2008) 195–213
during the glacial period, spanning 70 to 20 ka, strong northeasterlywinds associated with the East Asian Winter Monsoon intensified theIndianMonsoon Current and the eastward flowing South Java Current.
1.3. Core bar 9403
The core we have chosen to study is crucially located on thewestern margin of the Indo-Pacific Warm Pool which, today, isconsidered to play an important role in the thermohaline circulationof the global ocean, as the waters offshore Sumatra often display lowsalinities due to heavy monsoonal rains and constantly high (N28 °C)sea-surface temperatures.
2. Materials and methods
2.1. Deep-sea core BAR9403
Piston core BAR9403 was recovered offshore of Sumatra [5° 49.20′S, 103° 61.90′E] (Fig. 1), west of its southern extremity at a depth of2034m. The first 276 cm of this corewere sampled every 5 cm. The top105 cm of the core consist of light yellow clay. Below 105 cm, thesediment consists of greyish olive clay, with some levels (155 cm and245–255 cm) where the sediment is sandier.
This core is located in an area under the influence of the South JavaUpwelling System and, therefore, faunal changes of planktic andbenthic foraminifera and dinoflagellates, if related to any variation ofthe productivity at the sea surface, ought to provide information aboutmodifications of past upwelling intensity/activity.
For the extraction of planktic and benthic foraminifers, approxi-mately 3 cm3 of each sample was dried in an oven to obtain dryweight. After that, the samples were immersed in a dilute (3%)hydrogen peroxide solution until the clays had fully disaggregated,and the various fractions dried in an oven at 60 °C after being washedwith a gentle water jet through a 63 µm.
Sampling for organic-walled dinoflagellate cysts (herein termed‘dinocysts' for the sake of brevity) was carried out at 4 cm intervalsthroughout the core to a depth of 240–241 cm. The standardizedprocessing procedure for dinocysts is described in detail by de Vernalet al. (1993), and involves dissolution of a known volume of oven-driedsediment with 10% HCl followed by 40% HF. Where necessary, sampleswere disaggregated by placing them in an ultrasonic bath (b1 min toprevent damaging the cysts), and the remaining residue was thenfiltered through 120 and 10 µm sieves. Preparation techniques usingacetolysis, strongoxidants, alkalis and hot acidswere avoided to preventbias from selective dissolution of the more susceptible cysts.
2.2. Stable isotopes and isotope chronology
The δ18O record of planktic foraminifera was measured in order toproduce an age model for the studied cores, while the δ13C isotopic
Table 1AMS radiocarbon analyses of samples from core BAR9403 showing also calibrated ages
ANSTO codeOZI Depth in core(cm) Species analysed δ13C per mill
771 0–2 G. ruber −0.3772 25–26 G. ruber 1.2773 55–56 G. ruber 1.2774 65–66 G. ruber 0.9775 100–101 G. ruber 0.8776 125–126 G. ruber 0.8777 155–156 G. ruber 2.8778 185–186 G. ruber 2.7779 205–206 G. ruber -0.4780 265–266 G. ruber 0.1
⁎ Calibrated age calculated using Bard (1998)'s polynomial.
signal from the benthic foraminifera was measured in order to acquireinformation about the deep-water circulation and/or the presence oforganic matter at the sea floor.
The species used for isotope analyses were: Cibidoides wuellerstorfifor benthic foraminifera, and Globigerinoides ruber (white variety) forplanktic foraminifera.
C. wuellerstorfi occupies an epifaunal microhabitat (Lutze and Thiel,1988) and the isotopic composition of its test appears in equilibriumwith the TCO2 of the ambient deep water mass (Duplessy et al., 1984;Altenbach and Sarnthein, 1989). For this reason, the isotopic trend ofthis species reflects the one characterising the water at the sea floor(Duplessy et al., 1984).
The methodology followed for the preparation of the samples forisotopic analyses is the same for the two types of foraminifera. Anumber of specimens sufficient to reach the minimum weight ofmaterial (180 μg) detectable by the mass spectrometer, werehandpicked from each sample from the N250 µm fraction. Specimenswere thenwashed in alcohol and placed in an ultrasonic cleaner for 5 s(up to 10 s when processing benthic foraminifera), in order toeliminate any contaminating residual adhering to the foraminifer test.Oxygen- and carbon-isotopic data obtained are reported in the usual δnotation, which is referred to the PeeDee belemnite (V-PDB) standard.Samples were calibrated against the National Bureau of Standardscalcite (NBS-19), assuming values of δ18OV-PDB=−2.20‰ and δ13CV-PDB=−1.95 ‰.
Analyses were conducted utilising a Finnigan-MAT 251 massspectrometer at the Research School of Earth Sciences (RSES) at theAustralian National University (ANU). The external errors were 0.05‰,for δ 8O, and 0.08‰, for δ 3C.
2.3. AMS dating of planktic foraminifera
Up to 400 specimens of the planktic foraminifer G. ruber, followingthe common practice followed nowadays by micropalaeontologists toreach good confidence levels with counts, were picked for each levelin the core [see Table 1] for AMS chronology conducted at theAustralian Nuclear Science and Technology Organisation [=ANSTO].The foraminifer samples were then placed in a scintillation vial in pureethanol and allowed to be in an ultrasonic bath for 1 min to clear alldisaggregating particles. The clean foraminifers were then washed inmilliQ water and then dried. Graphite targets were then made atANSTO at the ANTARES AMS Facility (see Fink et al., 2004).
The δ13C values quoted in Table 1 relate solely to the graphitederived from the fraction that was used for the radiocarbonmeasurement. The data supplied by ANSTO have been roundedaccording to Stuiver and Polach (1977).
Radiocarbon dates were calibrated using the using the CALIB 5.1program (Stuiver et al., 2006), and the Marine04 radiocarbon agecalibration curve (Hughen et al., 2004). For the oceanic reservoircorrection the estimate of the regional ΔR mean for NWAustralia and
Percent ModernCarbo
Conventional14 C a
Calibratedage BP
pMC 1σ error yr BP 1σ error yr BP 1σ error
84.11 0.42 1390 45 889 785–97046.78 0.22 6105 40 6489 6395–658732.92 0.22 8920 60 9553 9448–965330.41 0.17 9560 45 10,373 10276–1047226.62 0.16 10,630 50 11,838 11675–1205519.38 0.12 13,180 60 15,025 14882–1519713.17 0.11 16,280 70 19,031 18924–191158.35 0.11 19,940 110 23,207 22914–234956.28 0.18 22,230 230 26,174⁎2.2 0.13 30,640 510 35,680⁎

198 D.S. Murgese et al. / Palaeogeography, Palaeoclimatology, Palaeoecology 265 (2008) 195–213
Java of 67±24 (Bowman, 1985; Southon et al., 2002) was obtainedfrom the CALIB Marine Reservoir Correction Database. All datesreported within this paper are in calibrated radiocarbon years.
For the 2 samples dated in the lower portion of the core (at 205–206 cm and 265–266 cm), the polynomial developed by Bard (1998)was used to calibrate the ages.
2.4. Planktic foraminifers and statistical treatment of the data
Counts of planktic foraminifera were made on splits of theN150 µm fraction to provide a base level for the ecological counts,removing small juvenile and possibly unidentifiable foraminifera.Each sample was split by an Otto-micro splitter until approximately400 specimens were present in the final split. Planktic foraminiferawere identified, at a species level, to reconstruct faunal assemblagesthrough time. The species nomenclature used in this study follows thetaxonomy of Saito et al. (1981).
Principal component analysis was conducted on the plankticforaminiferal counts to find ecological groups within the data. The C2program, version 1.4 (Juggins, 2003) was used to perform thestatistical analysis. In accordance with other studies (Martinez et al.,1998), species abundance below 1% was excluded from analysis andraw counts were entered into the program to reduce error.
2.5. Dinoflagellates
Total cyst concentrations (per gram of dry sediment) werecalculated as follows:
Total cysts=g ¼ EaddedXTcysts� �
=Ecounted� �
=Sdry weight:
where Eadded is the number of exotic spore grains (Lycopodium sp.) addedto the sample, Tcysts is the total number of dinocysts counted in thatsample, Ecounted represents the total number of exotic pollen grainscounted in the sample, and Sdry weight is the dry weight of sediment used(in grams). Calculated dinocyst concentrations using the marker-grainmethodprovides anestimatewithin a standarddeviationof 10% fora0.95confidence interval (de Vernal et al., 1987; Marret and de Vernal, 1997).
The ratio of heterotrophic (H) to autotrophic (A) species iscalculated as follows:
H=A ratio ¼ H−cysts= H−cystsþ A−cystsð Þ:
If selective preservation has not greatly influenced the dinocystassemblages, the H/A ratio can indicate productivity in the surfacewaters (e.g., Dale and Fjellså, 1994; van Waveren, 1993; Versteegh,1994; Cho and Matsuoka, 2001; Roncaglia, 2004), as heterotrophicspecies (H-cysts) are found in high numbers in upwelling regions dueto the abundance of suitable nutrients and prey (e.g., diatoms, whichare usually the dominant organism in upwelling-related phytoplank-ton). However, some caution needs to be exercised in using this ratiofor productivity purposes, as post-depositional transportation of cystsand selective preservation of species that are sensitive to aerobicdecay (e.g. Zonneveld et al., 1997, 2001) can skew the true signature ofthe H/A ratio. It is imperative to consider these factors before drawingany conclusions regarding productivity.
2.6. Benthic foraminifera and statistical treatment of the data
Specimens from the N150 µm fraction of each sample wereisolated, counted and mounted on micropalaeontological slides. Inorder to compare the results of the study of benthic foraminifera fromthe core with the result of the analysis of the core-tops, the absolutenumber of individuals for each species was converted as thepercentage of total foraminifera present in each sample.
Species present with a percentage N2% in at least 1 sample wereused for statistical analyses. Similar to the situation observed for the
core tops, the specimens belonging to the genera Fissurina, Lagena,Lenticulina, Oolina and Parafissurina were present in many sampleswith high species diversity. For this reason, all the species belonging tothese genera and used for statistical analysis were grouped together asFissurina spp., Lagena spp., Lenticulina spp., Oolina spp. and Parafis-surina spp.
The program STATISTICA 6.0 [StatSoft Inc., STATISTICA (dataanalysis software system), version 6, www.statsoft.com] was used toperform Q – mode Factor Analysis (Principal Components) on thespecies dataset of each core sample.
2.7. Benthic foraminifera accumulation rate (BFAR): applications andproblems
A linear relationship between the accumulation rate of benthicforaminifera (BFAR) and the amount of organic matter reaching thesea floor was outlined by Herguera and Berger (1991) and by Hergueraand Berger (1994). BFAR has been used worldwide as a proxy toestimate variations of the past carbon-flux rate to the sea floor (Struck,1995; Thomas et al., 1995; Loubere, 1996; Herguera, 2000; Diester-Haass and Zahn, 2001; Diester-Haass et al., 2002; Rasmussen et al.,2002;). For the eastern Indian Ocean, the selective dissolution ofcalcareous foraminiferal tests is excluded, as the lysocline is presentlyindicated at a depth of 2400m, north of 15°S, and at a depth of 3600msouth of 15°S (Martinez et al., 1998), deeper than the sites studiedhere. Finally, since the BFAR is a function of the linear sedimentationrate (LSR), this parameter needs to be carefully determined. For theexamined cores, LSR was calculated considering AMS measurements(see Section 2.3).
The total number of foraminifera isolated in each sample was usedto calculate the benthic foraminifera accumulation rate (BFAR),following the formula proposed by Herguera and Berger (1991):
BFAR ¼ Fð Þd LSRð Þd DBSð Þ n=cm2Kyr� �
;
where F is the abundance of foraminifera (n/g), LSR is the linearsedimentation rate (cm/kyr) and DBS is the dry bulk sediment (g/cm3)[g = grams of dry sediment].
3. Results
3.1. Chronology for core BAR9403 based on AMS dates and oxygenisotopes
All the AMS results are presented in Table 1. The oxygen isotopechronology for piston core BAR9403 is based on the δ18O of G. ruber incombination with that of C. wuellerstorfi (Fig. 2) with tie points linkedto the SPECMAP chronology set by Martinson et al. (1993)and also verified by the AMS dates. The program performing time-series analysis of Paillard et al. (1996) was used to calculate ages for alllevels studied in the core. Note that we did not join all the points forthe stable isotope analyses done on the benthic foraminifers assome levels had insufficient material for analysis. Nevertheless, thetrends are clearly visible and are parallel to those of the plankticforaminifers.
3.2. Planktic foraminifera
A total of 24,374 planktic foraminifer individuals were identifiedfrom core BAR9403. The relative abundance of planktic foraminiferashows clear intervals of abundance change paralleling each of themarine isotope stages recorded in core BAR9403 (Fig. 3).
MIS 3 is characterised by Neogloboquadrina pachyderma (dextral)recording average abundances of 6%. The relative abundanceof N. pachyderma (dextral) reduces to b2% near the Last GlacialMaximum [LGM] and does not recover during the Holocene. The

Fig. 2. Chronology of core BAR9403 determined by a combination of the δ18O composition of planktic and benthic foraminifers and AMS dates done on selected horizons in the core[for more information refer to Table 1 and text]. MIS1-3 refers to the Marine Isotopic Stages 1 to 3. The boundaries between the 3 stages were chosen following the procedures set inMartinson et al., 1993.
199D.S. Murgese et al. / Palaeogeography, Palaeoclimatology, Palaeoecology 265 (2008) 195–213
occurrence of species Neogloboquadrina dutertrei remains fairly stablethroughout the entire core but a 5% increase in abundance isseen during MIS 3 and at the Holocene/ MIS 2 transition. Pulleniatinaobliquiloculata increases in abundance during MIS 3 and the Holocenewith abundances N10%, compared to b10% during the LGM. Someminorspecies, within core BAR9403, only appear during MIS 3 and givefurther insight into differing conditions in the water column.For example, Turborotalia quinqueloba appears in the record with apeak of 2% in relative abundance during MIS 3. Other minor speciesof deep-water dwellers such as Globorotalia truncatulinoidesand Globorotalia crassaformis also only appear in the record duringMIS 3.
The most obvious change in the relative abundance of plankticforaminifera in core BAR9403 is shown by Globigerina bulloides. Highabundances of Ga. bulloides (26%) occur at approximately 12 ka andanother peak of abundance (22.7%) occurs during the Holocene. This iscompared to the periods from MIS 3 to the LGM where the relativeabundance of Ga. bulloides is generally b10%. Species Gr. menardii alsoincreases its relative abundance from b8% during MIS 3 to peakabundance during MIS 2 of 16% at approximately 14 ka.
Comparatively, periods of increased abundance of Ga. bulloides andGloborotalia menardii coincide with periods of low abundance forspecies such as Gs. ruber and Gs. sacculifer. This is most noticeable afterthe LGM during the peak relative percentages of Ga. bulloides (seeFig. 3). Species Gs. ruber records its highest relative abundance of22.8% during the Holocene but also records a high relative abundanceof 20.5% around the 15 ka yr BP. Similarly, species Gs. sacculifer recordsits highest relative abundance of 17% during the Holocene but alsorecords a relatively high percentage (15%) at ~16.5 ka.
3.3. Principal component analysis of planktonic foraminifera
The Eigenvalues of the first five axes from principal componentanalysis are provided in Table 2. The variance within the speciescounts of core BAR9403 is explained by each axis, which decreases foreach successive axis.
In 56 observations, 28 variables were identified and analysed. Themain variance is explained by Component 1 (Eigenvalue 1). However,relatively high variance is explained in the first four components(Fig. 4). Component 1, which explains 32.3% of variance, is dominatedwith positive scores of Ga. bulloides, Gr. menardii and N. dutertrei.Component 1 is also associated with negative scores from the speciesPulleniatina obliquiloculata, Gs. sacculifer and Gs. ruber. Component 2,which accounts for 24.4% of the variance in core BAR9403, isdominated by N. pachyderma (dextral), N. dutertrei, P. obliquiloculataand Globigerinita glutinata. This component is also associated withstrong negative responses by Ga. bulloides, Gs. ruber and Gs. sacculifer.Component 3 accounts for 14.7% of the variance and is dominated bythe positive score of Gt. rubescens and the strongly negative responsesby Gs. sacculifer, N. dutertrei and P. obliquiloculata. Component 4accounts for 7% variance and is dominated by the high positive speciesscore of Gs. sacculifer and also associated with high negative speciesscores of Gr. menardii, Gs. ruber, P. obliquiloculata and Gn. glutinata.
Component plots (bi-plots) were also used to define ecologicalgroups between the first two meaningful components. In thecomponent plots (Fig. 5), the distance between the species relates tothe similarity of the species and, therefore, the greater the anglebetween the vectors the greater the difference between the species. Inaddition, the vector or line length indicates the importance of the

Fig. 3. Composite diagram showing the percentage distribution against time in cal. years BP of the main planktic foraminifer species counted in core BAR9403. The shaded area implies the LGM.
200D.S.M
urgeseet
al./Palaeogeography,Palaeoclim
atology,Palaeoecology265
(2008)195
–213
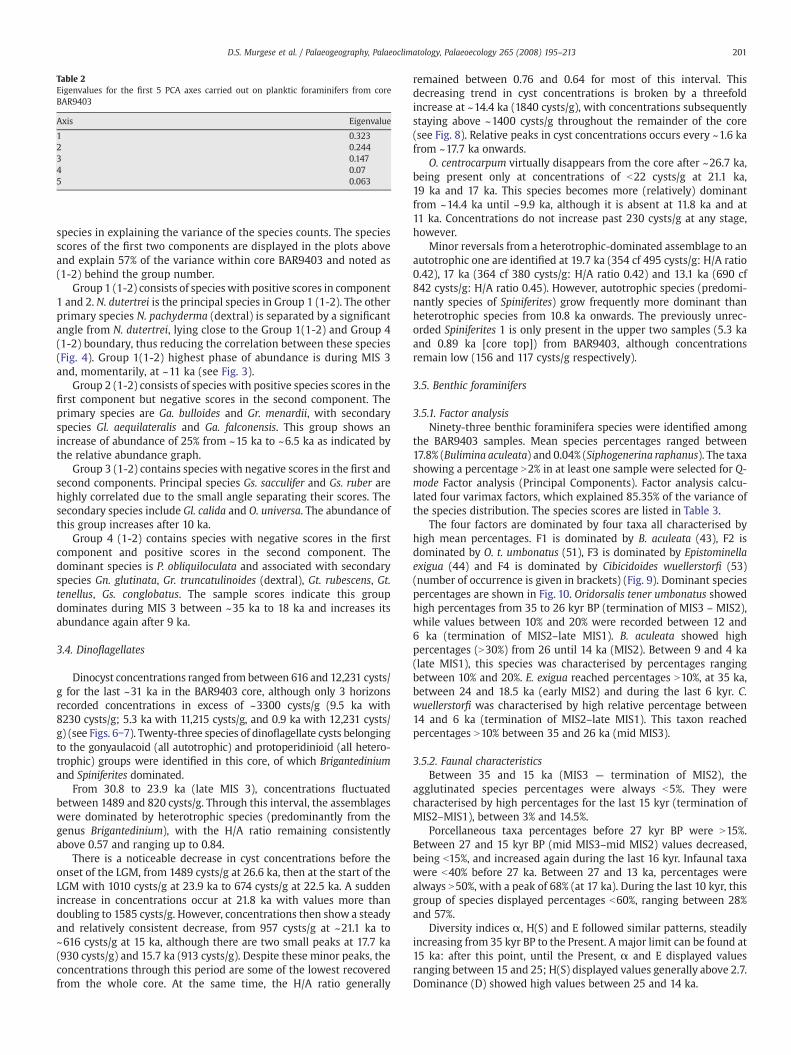
Table 2Eigenvalues for the first 5 PCA axes carried out on planktic foraminifers from coreBAR9403
Axis Eigenvalue
1 0.3232 0.2443 0.1474 0.075 0.063
201D.S. Murgese et al. / Palaeogeography, Palaeoclimatology, Palaeoecology 265 (2008) 195–213
species in explaining the variance of the species counts. The speciesscores of the first two components are displayed in the plots aboveand explain 57% of the variance within core BAR9403 and noted as(1-2) behind the group number.
Group 1 (1-2) consists of species with positive scores in component1 and 2. N. dutertrei is the principal species in Group 1 (1-2). The otherprimary species N. pachyderma (dextral) is separated by a significantangle from N. dutertrei, lying close to the Group 1(1-2) and Group 4(1-2) boundary, thus reducing the correlation between these species(Fig. 4). Group 1(1-2) highest phase of abundance is during MIS 3and, momentarily, at ~11 ka (see Fig. 3).
Group 2 (1-2) consists of species with positive species scores in thefirst component but negative scores in the second component. Theprimary species are Ga. bulloides and Gr. menardii, with secondaryspecies Gl. aequilateralis and Ga. falconensis. This group shows anincrease of abundance of 25% from ~15 ka to ~6.5 ka as indicated bythe relative abundance graph.
Group 3 (1-2) contains species with negative scores in the first andsecond components. Principal species Gs. sacculifer and Gs. ruber arehighly correlated due to the small angle separating their scores. Thesecondary species include Gl. calida and O. universa. The abundance ofthis group increases after 10 ka.
Group 4 (1-2) contains species with negative scores in the firstcomponent and positive scores in the second component. Thedominant species is P. obliquiloculata and associated with secondaryspecies Gn. glutinata, Gr. truncatulinoides (dextral), Gt. rubescens, Gt.tenellus, Gs. conglobatus. The sample scores indicate this groupdominates during MIS 3 between ~35 ka to 18 ka and increases itsabundance again after 9 ka.
3.4. Dinoflagellates
Dinocyst concentrations ranged from between 616 and 12,231 cysts/g for the last ~31 ka in the BAR9403 core, although only 3 horizonsrecorded concentrations in excess of ~3300 cysts/g (9.5 ka with8230 cysts/g; 5.3 ka with 11,215 cysts/g, and 0.9 ka with 12,231 cysts/g) (see Figs. 6−7). Twenty-three species of dinoflagellate cysts belongingto the gonyaulacoid (all autotrophic) and protoperidinioid (all hetero-trophic) groups were identified in this core, of which Brigantediniumand Spiniferites dominated.
From 30.8 to 23.9 ka (late MIS 3), concentrations fluctuatedbetween 1489 and 820 cysts/g. Through this interval, the assemblageswere dominated by heterotrophic species (predominantly from thegenus Brigantedinium), with the H/A ratio remaining consistentlyabove 0.57 and ranging up to 0.84.
There is a noticeable decrease in cyst concentrations before theonset of the LGM, from 1489 cysts/g at 26.6 ka, then at the start of theLGM with 1010 cysts/g at 23.9 ka to 674 cysts/g at 22.5 ka. A suddenincrease in concentrations occur at 21.8 ka with values more thandoubling to 1585 cysts/g. However, concentrations then show a steadyand relatively consistent decrease, from 957 cysts/g at ~21.1 ka to~616 cysts/g at 15 ka, although there are two small peaks at 17.7 ka(930 cysts/g) and 15.7 ka (913 cysts/g). Despite these minor peaks, theconcentrations through this period are some of the lowest recoveredfrom the whole core. At the same time, the H/A ratio generally
remained between 0.76 and 0.64 for most of this interval. Thisdecreasing trend in cyst concentrations is broken by a threefoldincrease at ~14.4 ka (1840 cysts/g), with concentrations subsequentlystaying above ~1400 cysts/g throughout the remainder of the core(see Fig. 8). Relative peaks in cyst concentrations occurs every ~1.6 kafrom ~17.7 ka onwards.
O. centrocarpum virtually disappears from the core after ~26.7 ka,being present only at concentrations of b22 cysts/g at 21.1 ka,19 ka and 17 ka. This species becomes more (relatively) dominantfrom ~14.4 ka until ~9.9 ka, although it is absent at 11.8 ka and at11 ka. Concentrations do not increase past 230 cysts/g at any stage,however.
Minor reversals from a heterotrophic-dominated assemblage to anautotrophic one are identified at 19.7 ka (354 cf 495 cysts/g: H/A ratio0.42), 17 ka (364 cf 380 cysts/g: H/A ratio 0.42) and 13.1 ka (690 cf842 cysts/g: H/A ratio 0.45). However, autotrophic species (predomi-nantly species of Spiniferites) grow frequently more dominant thanheterotrophic species from 10.8 ka onwards. The previously unrec-orded Spiniferites 1 is only present in the upper two samples (5.3 kaand 0.89 ka [core top]) from BAR9403, although concentrationsremain low (156 and 117 cysts/g respectively).
3.5. Benthic foraminifers
3.5.1. Factor analysisNinety-three benthic foraminifera species were identified among
the BAR9403 samples. Mean species percentages ranged between17.8% (Bulimina aculeata) and 0.04% (Siphogenerina raphanus). The taxashowing a percentage N2% in at least one sample were selected for Q-mode Factor analysis (Principal Components). Factor analysis calcu-lated four varimax factors, which explained 85.35% of the variance ofthe species distribution. The species scores are listed in Table 3.
The four factors are dominated by four taxa all characterised byhigh mean percentages. F1 is dominated by B. aculeata (43), F2 isdominated by O. t. umbonatus (51), F3 is dominated by Epistominellaexigua (44) and F4 is dominated by Cibicidoides wuellerstorfi (53)(number of occurrence is given in brackets) (Fig. 9). Dominant speciespercentages are shown in Fig. 10. Oridorsalis tener umbonatus showedhigh percentages from 35 to 26 kyr BP (termination of MIS3 – MIS2),while values between 10% and 20% were recorded between 12 and6 ka (termination of MIS2–late MIS1). B. aculeata showed highpercentages (N30%) from 26 until 14 ka (MIS2). Between 9 and 4 ka(late MIS1), this species was characterised by percentages rangingbetween 10% and 20%. E. exigua reached percentages N10%, at 35 ka,between 24 and 18.5 ka (early MIS2) and during the last 6 kyr. C.wuellerstorfi was characterised by high relative percentage between14 and 6 ka (termination of MIS2–late MIS1). This taxon reachedpercentages N10% between 35 and 26 ka (mid MIS3).
3.5.2. Faunal characteristicsBetween 35 and 15 ka (MIS3 — termination of MIS2), the
agglutinated species percentages were always b5%. They werecharacterised by high percentages for the last 15 kyr (termination ofMIS2–MIS1), between 3% and 14.5%.
Porcellaneous taxa percentages before 27 kyr BP were N15%.Between 27 and 15 kyr BP (mid MIS3–mid MIS2) values decreased,being b15%, and increased again during the last 16 kyr. Infaunal taxawere b40% before 27 ka. Between 27 and 13 ka, percentages werealways N50%, with a peak of 68% (at 17 ka). During the last 10 kyr, thisgroup of species displayed percentages b60%, ranging between 28%and 57%.
Diversity indices α, H(S) and E followed similar patterns, steadilyincreasing from 35 kyr BP to the Present. A major limit can be found at15 ka: after this point, until the Present, α and E displayed valuesranging between 15 and 25; H(S) displayed values generally above 2.7.Dominance (D) showed high values between 25 and 14 ka.

Fig. 4. Plot of the relative abundance of the four groups as found by the principal component analysis of planktic foraminifer from core BAR9403 plotted against the chronology in cal. years BP as well as the stable isotope record for oxygen andcarbon obtained on the planktic species G. ruber. Note the 3 MIS indicated in the right hand column. The shaded area implies the LGM.
202D.S.M
urgeseet
al./Palaeogeography,Palaeoclim
atology,Palaeoecology265
(2008)195
–213

Fig. 5. Bi-plot of Components 1 and 2 for planktic foraminifer counts that explain 58% of the variance in core BAR9403 and which also reveal four ecological groups [see text for moreinformation].
203D.S. Murgese et al. / Palaeogeography, Palaeoclimatology, Palaeoecology 265 (2008) 195–213
3.5.3. Benthic Foraminifera Accumulation Rate (BFAR) and accu-mulation rates calculated for B. aculeata, E. exigua and Uvigerinaproboscidea
The selective destruction of soft-cemented agglutinated foramini-fera is instead a phenomenon recorded for the analysed samples, but itonly affects a minimal percentage of the total assemblage and shouldnot preclude the use of BFAR.
The BFAR curve (see Fig. 10) showed values ranging between 71and 240 n/cm2 kyr−1, for the period between 35 and 29 ka. Between 29and 14 ka, BFARwas generally higher, reaching values N250 n/cm2 kyr.After 15 ka, BFAR was characterised by lower values. Between 14 and10 ka, BFAR decreased passing from 180 to 90 n/cm2 kyr and between10 and 6 kyr BP, it ranged between 160 and 53 n/cm2 kyr. During thelast 6 kyr, BFAR decreased, reaching a value of 20 n/cm2 kyr−1 for thePresent.
The accumulation rate of B. aculeata reached values N30 n/cm2 kyr−1,between 29 and 14 ka, with a peak of 170 n/cm2 kyr−1 at 22 ka. After14 ka, this species was nearly absent. A small increase in B. aculeata ARwas recorded for the last 6 kyr. E. exigua was characterised by high AR,between 29 and 14 ka, ranging between 10 and 60 n/cm2 kyr−1. After14 ka, the AR of this taxa was nearly 0. It increased again during the last6 kyr, reaching values N10 n/cm2 kyr−1.U. proboscidea followed a patternsimilar to the former two species, although itwas characterised by lowerAR values compared to the other two taxa. Between 29 and 14 ka, U.proboscidea AR ranged between 5 and 20 n/cm2 kyr−1. After 14 ka, thisspecies displayed AR values b5 n/cm2 kyr−1, with an isolated peak at9 ka, when it reached an AR of 15 n/cm2 kyr−1.
4. Discussion
4.1. Evidence from planktic foraminifers
The distribution of planktic foraminifera in core BAR9403 impliesphases of variation within the mixed layer since MIS 3. Overall, MIS 3appears to be a period of reduced vertical mixing resulting in thestratification of the mixed layer. PCA analysis (see Fig. 5) and the
sample scores indicate that Group 1 (1-2), containing species Neo-globoquadrina dutertrei andNeogloboquadrina pachyderma, dominatedover the other ecological groups during MIS 3 and momentarily at11 ka (75 cm). Species N. dutertrei and N. pachyderma are bothconsidered thermocline dwellers whose increased abundance hasbeen linked to the development of a Deep Chlorophyll Maximum layer(=DCM). A DCM is initiated when the upper water column is stratifiedand an increase in chlorophyll production occurs at the thermocline(Fairbanks and Weibe, 1980; Thunell and Sautter, 1992), therefore,resulting in optimal conditions for these heterotrophic species.
Cluster analysis by Ding et al. (2006) of core-tops within theIndonesian Archipelago classified the surface waters of the SumatraRegion as being relatively oligotrophic, low in salinity, small inseasonal temperature differences, shallow thermocline and of highdissolution. Ding et al. (2006) revealed that N. dutertrei obtained thesecond highest abundances in the ‘Indian Monsoon Sumatra Region’where core BAR9403 is located, due to a shallow thermocline and lowsalinity waters. In the relative abundance counts in core BAR9403, N.dutertrei is the most abundant species throughout the entirety of thecore with an increase in abundance of 5% during MIS 3 and 11 ka.However, N. pachyderma (d) is not present in Ding et al (2006) core-top counts. The appearance of N. pachyderma (d) species during MIS 3in core BAR9403 indicates a reduction in temperatures at the base ofthe thermocline compared to the present. High frequencies of N.pachyderma are linked to waters with low temperature (10°–14 °C),low salinity (34 and 35.5), and high nutrient (phosphate) levels 1.7 µgat/l (Bé and Hutson, 1977).
It is also shown through the abundances of Globigerina bulloidesand Globorotalia menardii, the principal species of PCA Group 2 (1-2)that upwelling conditions did not occur during MIS 3 (Fig. 3) but,instead, the conditions favoured the development of a DCM layer.Species, Ga. bulloides and Gr. menardii, are both considered to be‘upwelling’ indicators in tropical regions (Bé, 1977; Thunell andReynolds, 1984; Auras-Schudnagies et al., 1989; Kroon and Neder-bragt, 1990; Martinez et al., 1998; Ganssen and Kroon, 2000). Ourconclusion relies on the fact that Group 2 (1-2) does not show a

Fig. 6. Plot of the major dinoflagellate species and cysts recovered in core BAR9403 against time in cal. years BP. Note that the distribution of taxa does not extend as far back in time as for the foraminifers in the same core as no dinoflagellateswere recovered below 31 ka. The shaded area implies the LGM.
204D.S.M
urgeseet
al./Palaeogeography,Palaeoclim
atology,Palaeoecology265
(2008)195
–213
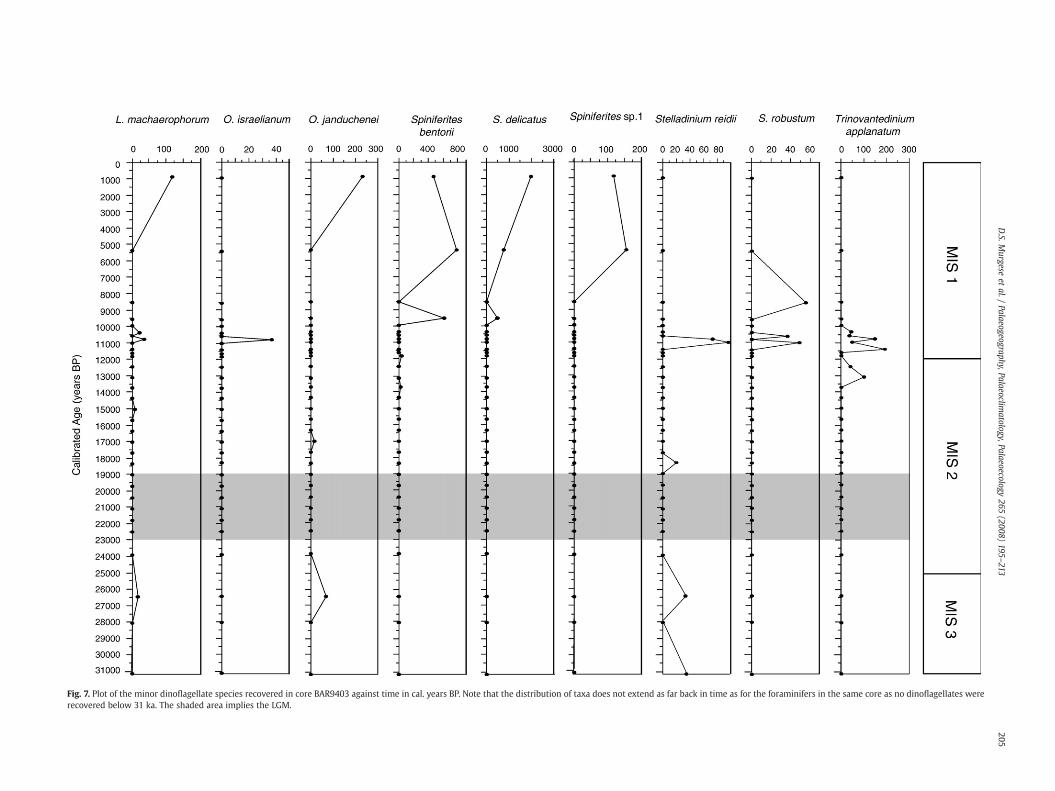
Fig. 7. Plot of the minor dinoflagellate species recovered in core BAR9403 against time in cal. years BP. Note that the distribution of taxa does not extend as far back in time as for the foraminifers in the same core as no dinoflagellates wererecovered below 31 ka. The shaded area implies the LGM.
205D.S.M
urgeseet
al./Palaeogeography,Palaeoclim
atology,Palaeoecology265
(2008)195
–213

Fig. 8. Plot of autotrophic (A) and heterotrophic (H) dinoflagellate species and the H/A ratio that is used to indicate productivity at the sea surface. The shaded area identifies the LGM.
206 D.S. Murgese et al. / Palaeogeography, Palaeoclimatology, Palaeoecology 265 (2008) 195–213
response to the existence of colder water and possible nutrients at thesea surface during MIS 3 (Fig. 3). This again suggests that the mixedlayer was stratified and nutrients did not reach the sea-surface and,therefore, ‘upwelling’ conditions were not established during MIS 3.
De Deckker and Gingele’s (2002) analyses of core BAR9442, located~50 km from BAR9403, indicated ‘blooms’ of the “giant” diatom Eth-modiscus rex between 28 ka and 19 ka. These authors claim thatblooms occur when the water-column is permanently stratified, witha substantial increase in salinity and high levels of silica and nitratenear the sea-surface. This period coincides with the indicated phase ofstratification within core BAR9403. In addition, a regional pattern of
DCM development was already observed within the various seas ofthe Throughflow region by Linsley et al. (1985), Barmawidjaja et al.(1993), Ding et al. (2002) and Spooner et al. (2005) for MIS 3 andMIS 2.
The primary species of Group 4 (1-2) is Pulleniatina obliquiloculata.The sample scores indicate this group dominates during MIS 3between ~28 ka to 23 ka and increases its abundance again at ~19 ka.Pulleniatina obliquiloculata is predominantly a tropical species and hasbeen associated with warm-water masses such as the SouthEquatorial Current (Bé and Hutson, 1977) and the Kuroshio Current(Wang et al., 1999; Li et al., 1997).

Table 3Factor scores of the Q-mode varimax factors in piston core BAR9403
Species Factor 1 Factor 2 Factor 3 Factor 4
Allomorphina pacifica −0.3089 −0.1891 −0.1440 −0.4228Anomalina globulosa −0.1029 −0.3378 −0.5053 −0.1177Astrononion echolsi −0.0757 −0.2354 −0.5619 0.2702Bolivina robusta −0.1284 −0.2581 −0.4080 −0.3951Bolivinita quadrilatera −0.0449 −0.2518 −0.2155 −0.4513Brizalina semilineata −0.2288 −0.2768 −0.3201 −0.3363Bulimina aculeata 7.2886 0.5376 −1.0540 −0.6130Bulimina costata −0.0036 0.8853 0.8493 −0.5370Bulimina exilis −0.1731 0.3728 −0.3462 −0.7523Cassidulina laevigata 0.1427 0.7604 −0.1672 0.1645Ceratobulimina pacifica −0.1552 −0.2852 −0.3917 −0.4301Chilostomella oolina −0.1833 −0.0229 0.5445 1.1802Cibicidoides bradyi −0.1231 −0.2956 −0.1109 0.8635Cibicidoides pseudoungerianus −0.1755 −0.4268 −0.3179 0.2755Cibicidoides robertsonianus −0.2503 −0.3103 −0.0965 −0.4739Cibicidoides wuellerstorfi 0.4494 0.0754 −0.0115 5.6760Eggerella bradyi −0.1987 −0.3063 −0.0625 −0.3695Epistominella exigua 0.9489 −1.0216 6.7501 −0.9394Fissurina sp. −0.0773 −0.2433 −0.0691 −0.1458Fursenkoina bradyi −0.1916 −0.2707 −0.2176 −0.5379Fursenkoina fusiformis −0.0744 0.3702 −0.2660 0.2612Fursenkoina sp. −0.2311 −0.3101 −0.2070 −0.4578Gavelinopsis lobatulus −0.0627 −0.3006 −0.4778 −0.1508Globobulimina affinis −0.2283 −0.1015 0.4461 −0.3164Globobulimina pacifica −0.2208 −0.3368 0.3832 0.0175Globocassidulina subglobosa 0.1451 −0.4291 −0.0162 0.7227Gyroidinoides orbicularis −0.2249 −0.3363 −0.4198 0.6359Gyroidinoides polius −0.2782 −0.3311 0.1473 0.1638Gyroidinoides soldanii −0.2196 −0.1538 −0.4720 −0.3148Hoeglundina elegans 0.2484 0.2048 −0.3849 0.7204Hyalinea balthica −0.2711 −0.2094 −0.0404 −0.4843Karreriella bradyi −0.2885 −0.2768 −0.0969 −0.3526Lagena sp. −0.2595 −0.3551 0.0259 −0.2310Lenticulina sp. −0.2639 −0.1505 −0.2030 −0.4846Loxostomum karrerianum −0.2686 −0.2785 −0.0740 −0.4608Melonis barleeanum −0.4038 0.0621 −0.0222 1.6341Melonis pompilioides −0.2687 −0.2924 −0.1615 −0.4811Miliolinella subrotunda −0.2506 −0.1645 −0.2867 −0.5811Nonionella bradyi −0.2498 −0.1729 −0.3645 −0.4611Nummoloculina irregularis −0.2253 −0.1223 −0.3162 −0.5907Oridorsalis tener umbonatus −0.6304 7.0328 0.6723 −0.0899Osangularia cultur −0.1744 −0.1194 −0.4819 −0.3035Parafissurina sp. −0.1627 −0.2137 −0.3682 −0.4435Pullenia bulloides −0.2492 −0.3133 0.2096 −0.0141Pullenia quinqueloba −0.2011 −0.3257 0.0019 −0.1965Pyrgo depressa −0.1689 −0.0409 −0.4007 −0.4149Pyrgo lucernula −0.2457 0.0284 −0.4646 −0.6110Pyrgo murrhina −0.0549 0.9087 1.6953 0.4588Pyrgo serrata −0.1001 −0.1312 −0.3007 −0.5876Quinqueloculina seminulum −0.2555 −0.1375 −0.2256 −0.3546Quinqueloculina venusta −0.1772 0.7055 −0.3634 −0.8163Robertinoides brady −0.1222 −0.2627 −0.3583 −0.5413Sigmoilopsis schlumbergeri −0.1801 −0.0502 −0.7339 0.8957Siphogenerina raphanus −0.2631 −0.1826 −0.2915 −0.5857Siphotextularia catenata −0.2008 −0.0380 −0.3727 −0.5857Uvigerina peregrina 0.0874 −0.5457 0.8255 1.5660Uvigerina proboscidea 0.3117 −0.3550 0.5466 2.3568Valvulinaria araucana 0.2753 −0.1747 0.0729 −0.4287
The species listed in bold are the 4 taxa whose distributions are presented in Fig. 10.
207D.S. Murgese et al. / Palaeogeography, Palaeoclimatology, Palaeoecology 265 (2008) 195–213
The sample scores reveal that Group 4 (1-2) and Group 1 (1-2)alternate in dominance during MIS 3. Previous studies have linked theabundance of P. obliquiloculata to its sensitivity to winter tempera-tures and, therefore, high concentrations of P. obliquiloculata occurduring warm winter temperatures at the subsurface (Li et al., 1997;Pflaumann and Jian, 1999). The high relative abundance of P.obliquiloculata within Group 4 (1-2) and N. pachyderma in Group 1(1-2) during MIS 3 initially appears to be contradictory but may alsosupport the hypothesis that the water column was stratified duringthis period. The study by Bé (1977) in the region of core BAR9403found P. obliquiloculata predominantly between 50 and 100 m whileN. pachyderma was predominantly below 100 m. Either stratification
provided temperature niches for both these species or the tempera-ture at the base of the thermocline went through seasonality phases.Alternatively the deepening of the mixed layer into cooler, deeperwaters could explain the increased abundance of N. pachyderma(d) during MIS 3. Thickening of the mixed layer due to stratificationhas been observed within the Santa Barbara Basin by Pak and Kennett(2002).
Pulleniatina obliquiloculata is one of the most dissolution-resistantspecies in the low latitudes and canmake up to 70% of the total fauna intheWestern Pacific sediments (Thompson,1981 and Thiede et al.,1997).It is believed that dissolution is not the controlling factor on theabundances of planktic foraminifera in core BAR 9403 due to the lack ofetchingon the foraminifer tests. In addition, the low relative percentagesof other dissolution-resistant species such as Gr. menardii during MIS 3and the Holocene coincide with high abundances of P. obliquiloculata.
During MIS 2, the relative abundance of N. dutertrei reduced slightly,N. pachyderma relative abundance reduced tob1%and the lowabundanceof upwelling species such as Ga. bulloideswas maintained from MIS 3 toMIS 2 (see Fig. 3). The PCA analysis grouped Gs. ruber and Gs. sacculifertogether and the sample scores indicated that Group 3 (1-2) dominatedover the other PCA groups during the LGM and the Holocene. From theseresults the LGMappears to be characterised by the abundance of tropical-subtropical species with a preference for oligotrophic conditions. Inaddition, the higher abundance of these tropical-subtropical speciessuggests thewater columnwas still stratified and nutrientsmay not havebeen entrained into the upper surface layer through wind-forced mixingwhich occurs presently (Sprintall et al., 2002).
The major change registered in core BAR9403 is around theupwelling signal of PCA Group 2 (1-2) containing Ga. bulloides and Gr.menardii. The sample scores indicate that this group dominated from14 ka to 9 ka (Fig. 3). Consequently, we interpret this phenomenon toindicate that nutrients were upwelled to the sea-surface for that timeperiod. The abundance of Group 3 (1-2) and Group 4 (1-2) was alsoreduced from 15 ka to 9 ka and this implies the removal of the stratifiedstructure of the water column. At the LGM-Holocene transition, DeDeckker and Gingele (2002) recorded a high Baexcess, and low E rexabundance in core BAR9442 and suggested the removal of stratifiedconditions and this further supports our interpretation for the region.
Presently, upwelling along the coast of Java operates during the SEMonsoon as a result of southward Ekman transport (Wyrtki, 1962) butnutrients do not reach the surface due to an increase in the transportof the Throughflow (Bray et al., 1997). Martinez et al. (1998) showedthat the change in abundance of species, such as N. pachyderma,N. dutertrei and Ga. bulloides, varies around the region and depend onmixed layer thickness and the intensity of the Java Upwelling System.Amore dynamic and productive Java Upwelling System encouraged bythe SE Monsoon during the LGM is indicated in studies by Martinezet al. (1999), Takahashi and Okada (2000), Gingele et al. (2001) andGingele et al. (2002). In addition, palaeoproductivity proxy investiga-tions by Müller and Opdyke (2000) in the Timor passage indicateincreased nutrients in the mixed layer during MIS 2. However, resultsfrom cores BAR9403 and BAR9442 off the coast of Sumatra suggestthat upwelling did not occur until after the LGM. It is possible theupwelling signal in core BAR9403 is evidence of a more intense JavaUpwelling System and hence monsoonal system from 14 ka.
4.2. Evidence from dinoflagellates
4.2.1. Possible influences upon cyst assemblagesBefore any worthwhile interpretation of the dinocyst fossil record
from BAR9403 can be made, it is imperative that post-depositionalprocesses such as transportation, selective decay and dissolution areconsidered, as these factors can create a biased view of the actualthanatocoenosis. We believe that the effect of sea level changesthrough time did not affect the abundance of dinoflagellate cysts perse as there was little change of the coast line with respect to the core
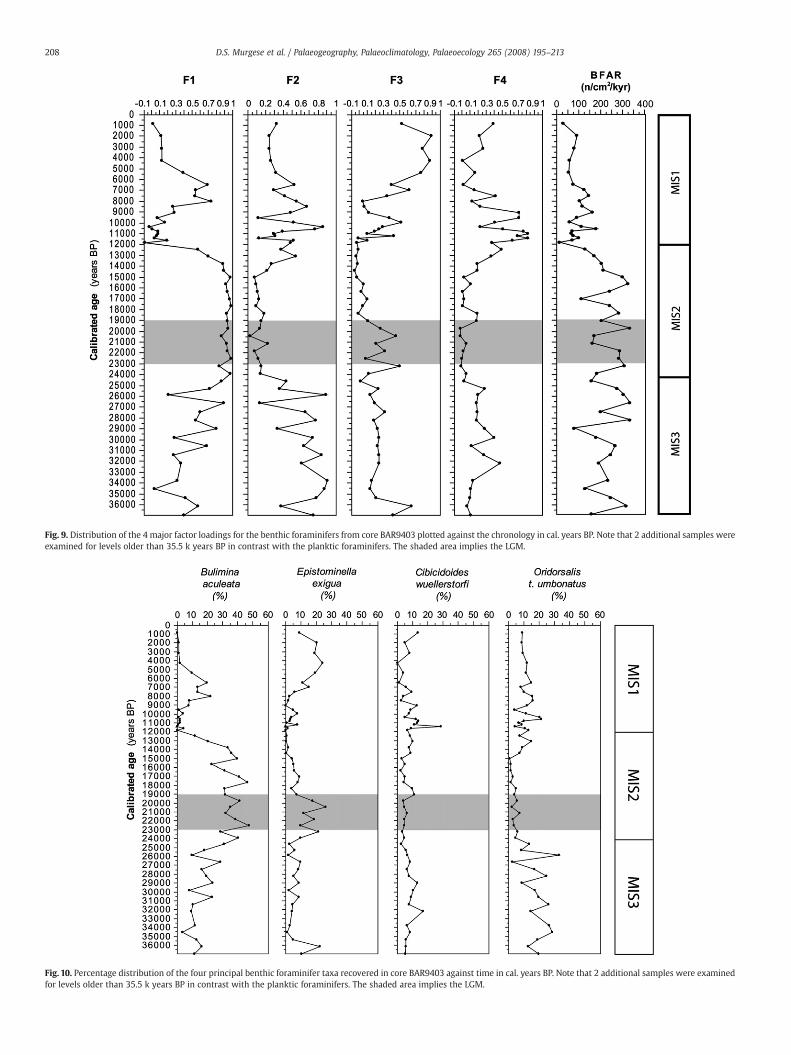
Fig. 9. Distribution of the 4 major factor loadings for the benthic foraminifers from core BAR9403 plotted against the chronology in cal. years BP. Note that 2 additional samples wereexamined for levels older than 35.5 k years BP in contrast with the planktic foraminifers. The shaded area implies the LGM.
Fig. 10. Percentage distribution of the four principal benthic foraminifer taxa recovered in core BAR9403 against time in cal. years BP. Note that 2 additional samples were examinedfor levels older than 35.5 k years BP in contrast with the planktic foraminifers. The shaded area implies the LGM.
208 D.S. Murgese et al. / Palaeogeography, Palaeoclimatology, Palaeoecology 265 (2008) 195–213
209D.S. Murgese et al. / Palaeogeography, Palaeoclimatology, Palaeoecology 265 (2008) 195–213
site and proximity to the landwas notmuch different between periodsof low sea level [eg at the LGM] and today.
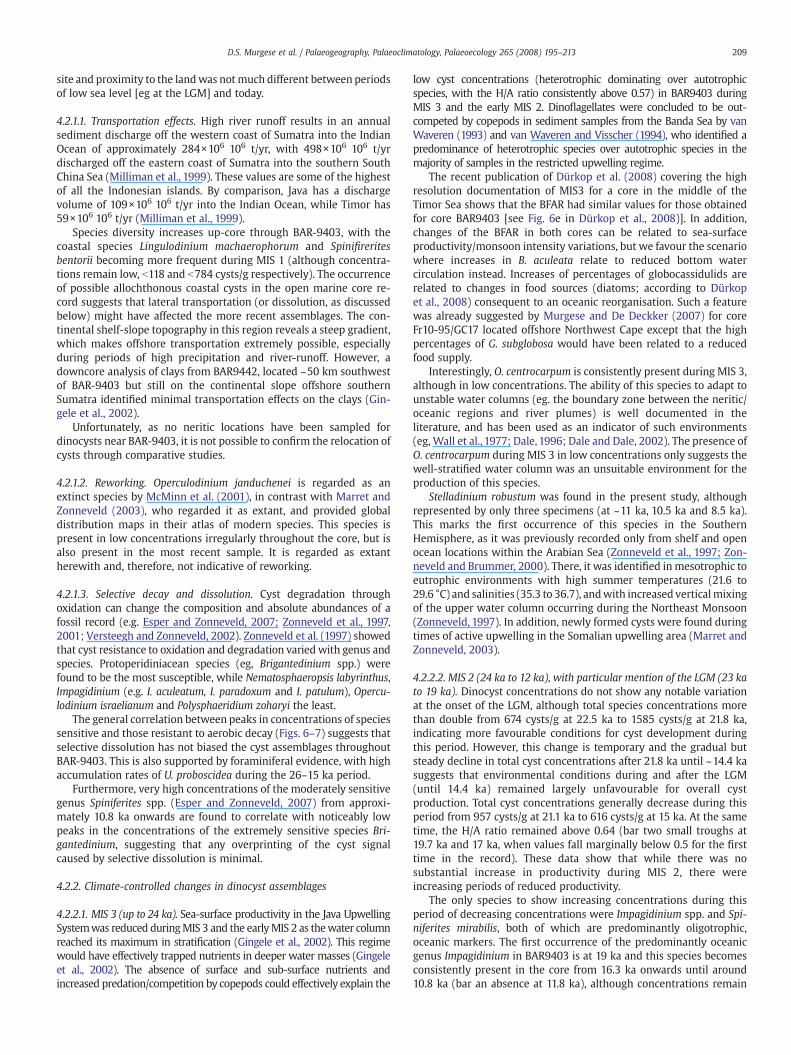
4.2.1.1. Transportation effects. High river runoff results in an annualsediment discharge off the western coast of Sumatra into the IndianOcean of approximately 284×106 106 t/yr, with 498×106 106 t/yrdischarged off the eastern coast of Sumatra into the southern SouthChina Sea (Milliman et al., 1999). These values are some of the highestof all the Indonesian islands. By comparison, Java has a dischargevolume of 109×106 106 t/yr into the Indian Ocean, while Timor has59×106 106 t/yr (Milliman et al., 1999).
Species diversity increases up-core through BAR-9403, with thecoastal species Lingulodinium machaerophorum and Spinifireritesbentorii becoming more frequent during MIS 1 (although concentra-tions remain low, b118 and b784 cysts/g respectively). The occurrenceof possible allochthonous coastal cysts in the open marine core re-cord suggests that lateral transportation (or dissolution, as discussedbelow) might have affected the more recent assemblages. The con-tinental shelf-slope topography in this region reveals a steep gradient,which makes offshore transportation extremely possible, especiallyduring periods of high precipitation and river-runoff. However, adowncore analysis of clays from BAR9442, located ~50 km southwestof BAR-9403 but still on the continental slope offshore southernSumatra identified minimal transportation effects on the clays (Gin-gele et al., 2002).
Unfortunately, as no neritic locations have been sampled fordinocysts near BAR-9403, it is not possible to confirm the relocation ofcysts through comparative studies.
4.2.1.2. Reworking. Operculodinium janduchenei is regarded as anextinct species by McMinn et al. (2001), in contrast with Marret andZonneveld (2003), who regarded it as extant, and provided globaldistribution maps in their atlas of modern species. This species ispresent in low concentrations irregularly throughout the core, but isalso present in the most recent sample. It is regarded as extantherewith and, therefore, not indicative of reworking.
4.2.1.3. Selective decay and dissolution. Cyst degradation throughoxidation can change the composition and absolute abundances of afossil record (e.g. Esper and Zonneveld, 2007; Zonneveld et al., 1997,2001; Versteegh and Zonneveld, 2002). Zonneveld et al. (1997) showedthat cyst resistance to oxidation and degradation varied with genus andspecies. Protoperidiniacean species (eg, Brigantedinium spp.) werefound to be the most susceptible, while Nematosphaeropsis labyrinthus,Impagidinium (e.g. I. aculeatum, I. paradoxum and I. patulum), Opercu-lodinium israelianum and Polysphaeridium zoharyi the least.
The general correlation between peaks in concentrations of speciessensitive and those resistant to aerobic decay (Figs. 6–7) suggests thatselective dissolution has not biased the cyst assemblages throughoutBAR-9403. This is also supported by foraminiferal evidence, with highaccumulation rates of U. proboscidea during the 26–15 ka period.
Furthermore, very high concentrations of the moderately sensitivegenus Spiniferites spp. (Esper and Zonneveld, 2007) from approxi-mately 10.8 ka onwards are found to correlate with noticeably lowpeaks in the concentrations of the extremely sensitive species Bri-gantedinium, suggesting that any overprinting of the cyst signalcaused by selective dissolution is minimal.
4.2.2. Climate-controlled changes in dinocyst assemblages
4.2.2.1. MIS 3 (up to 24 ka). Sea-surface productivity in the Java UpwellingSystemwas reduced duringMIS 3 and the earlyMIS 2 as thewater columnreached its maximum in stratification (Gingele et al., 2002). This regimewould have effectively trapped nutrients in deeper water masses (Gingeleet al., 2002). The absence of surface and sub-surface nutrients andincreased predation/competition by copepods could effectively explain the
low cyst concentrations (heterotrophic dominating over autotrophicspecies, with the H/A ratio consistently above 0.57) in BAR9403 duringMIS 3 and the early MIS 2. Dinoflagellates were concluded to be out-competed by copepods in sediment samples from the Banda Sea by vanWaveren (1993) and van Waveren and Visscher (1994), who identified apredominance of heterotrophic species over autotrophic species in themajority of samples in the restricted upwelling regime.
The recent publication of Dürkop et al. (2008) covering the highresolution documentation of MIS3 for a core in the middle of theTimor Sea shows that the BFAR had similar values for those obtainedfor core BAR9403 [see Fig. 6e in Dürkop et al., 2008)]. In addition,changes of the BFAR in both cores can be related to sea-surfaceproductivity/monsoon intensity variations, but we favour the scenariowhere increases in B. aculeata relate to reduced bottom watercirculation instead. Increases of percentages of globocassidulids arerelated to changes in food sources (diatoms; according to Dürkopet al., 2008) consequent to an oceanic reorganisation. Such a featurewas already suggested by Murgese and De Deckker (2007) for coreFr10-95/GC17 located offshore Northwest Cape except that the highpercentages of G. subglobosa would have been related to a reducedfood supply.
Interestingly, O. centrocarpum is consistently present during MIS 3,although in low concentrations. The ability of this species to adapt tounstable water columns (eg. the boundary zone between the neritic/oceanic regions and river plumes) is well documented in theliterature, and has been used as an indicator of such environments(eg, Wall et al., 1977; Dale, 1996; Dale and Dale, 2002). The presence ofO. centrocarpum during MIS 3 in low concentrations only suggests thewell-stratified water column was an unsuitable environment for theproduction of this species.
Stelladinium robustum was found in the present study, althoughrepresented by only three specimens (at ~11 ka, 10.5 ka and 8.5 ka).This marks the first occurrence of this species in the SouthernHemisphere, as it was previously recorded only from shelf and openocean locations within the Arabian Sea (Zonneveld et al., 1997; Zon-neveld and Brummer, 2000). There, it was identified in mesotrophic toeutrophic environments with high summer temperatures (21.6 to29.6 °C) and salinities (35.3 to 36.7), andwith increased verticalmixingof the upper water column occurring during the Northeast Monsoon(Zonneveld, 1997). In addition, newly formed cysts were found duringtimes of active upwelling in the Somalian upwelling area (Marret andZonneveld, 2003).
4.2.2.2. MIS 2 (24 ka to 12 ka), with particular mention of the LGM (23 kato 19 ka). Dinocyst concentrations do not show any notable variationat the onset of the LGM, although total species concentrations morethan double from 674 cysts/g at 22.5 ka to 1585 cysts/g at 21.8 ka,indicating more favourable conditions for cyst development duringthis period. However, this change is temporary and the gradual butsteady decline in total cyst concentrations after 21.8 ka until ~14.4 kasuggests that environmental conditions during and after the LGM(until 14.4 ka) remained largely unfavourable for overall cystproduction. Total cyst concentrations generally decrease during thisperiod from 957 cysts/g at 21.1 ka to 616 cysts/g at 15 ka. At the sametime, the H/A ratio remained above 0.64 (bar two small troughs at19.7 ka and 17 ka, when values fall marginally below 0.5 for the firsttime in the record). These data show that while there was nosubstantial increase in productivity during MIS 2, there wereincreasing periods of reduced productivity.
The only species to show increasing concentrations during thisperiod of decreasing concentrations were Impagidinium spp. and Spi-niferites mirabilis, both of which are predominantly oligotrophic,oceanic markers. The first occurrence of the predominantly oceanicgenus Impagidinium in BAR9403 is at 19 ka and this species becomesconsistently present in the core from 16.3 ka onwards until around10.8 ka (bar an absence at 11.8 ka), although concentrations remain

210 D.S. Murgese et al. / Palaeogeography, Palaeoclimatology, Palaeoecology 265 (2008) 195–213
low. S. mirabilis is more prominent in fully marine regions and whilethis species is present (in low concentrations) in the lower part ofBAR9403, it becomes more dominant around 19.7 ka until ~10.8 ka.These species likely represent an allochthonous component of the cystrecord.
Total cyst concentrations show a dramatic increase at ~14.4 ka,with both heterotrophic and autotrophic species concentrationsnearly tripling previous values. This is likely associated with increasedwind activity and precipitation, river runoff and nutrient supply withthe onset of the monsoons favouring cyst production.
The consistent presence of O. centrocarpum after ~14.4 ka atslightly higher concentrations than previously seen could reflectdecreasing stratification of the water column (e.g. increasing pre-cipitation and/or monsoonal winds).
4.2.2.3. MIS 1 (12 ka to the present). As sea-surface temperatures (SST)and stratification of the upper water column increased during MIS 1,conditions became unfavourable for the continued relatively highconcentrations of O. centrocarpum with the last occurrence thisspecies in BAR9403 occurring at ~9.9 ka.
The sudden and extreme bloom of Spiniferites species during theHolocene is noteworthy, although reasons for such an occurrence arenot known. Spiniferites ramosus, which makes up a large proportion ofthe autotrophic signature in BAR9403 during MIS 1, is a cosmopolitanspecies found in a wide variety of environments, although withhighest abundances in mesotrophic to eutrophic regions character-ized by upwelling or a well-mixed upper water column (Marret andZonneveld, 2003). The peaks in concentration of S. ramosus do notcorrelate with any increases in heterotrophic species; in fact, thespecies indicative of increased productivity and/or upwelling (eg,Brigantedinium) displays low concentrations during this period. It ispossible that the peak in Spiniferites species results from increasedoffshore transportation from the shelf due to increased precipitation,river runoff and sediment discharge at sea.
The coastal species S. bentorii becomes more common after 9.5 ka(although single specimens were recorded at 13.7 ka and 11.8 ka).However, concentrations remain N784 cysts/g at all other levels. Othercoastal species (Lingulodinium machaerophorum and Operculodiniumisraelianum) are also more frequent from ~10.8 ka, althoughconcentrations remain extremely low. The increasing presence –
albeit minimal – of coastal species in core BAR9403 during MIS 1represent increased relocation from shelf sediments down slopeoffshore Sumatra due to increased precipitation, river runoff andsediment discharge at sea.
Spiniferites delicatus is observed in minor amounts after 9.5 ka,although a single specimenwas identified at 13.7 ka. Dale et al. (2002)identified a dominance of S. delicatus in samples from the outer plumeof the Congo River, West-Central Africa, and suggested a relationshipwith an as yet unidentified type of nutrient enrichment, one distinctfrom the heterotrophic signal and one possibly derived from the land.This relationshipwas previously observed byMarret (1994) in the Gulfof Guinea, East Equatorial Atlantic Ocean, and byMarret et al. (1999) inthe Congo Fan, West-Central Africa. Although concentrations of thisspecies are low, the slight increase in S. delicatus in BAR9403 coincideswith decreasing concentrations of heterotrophic species, with H/Aratios b0.22. While the low concentrations prevent interpretation ofthis species occurrence with confidence, it is likely that S. delicatus isalso responding to increased river runoff and sediment discharge atsea.
The new species “Spiniferites 1,” previously identified in three coretop samples located near the Sunda Strait, where it reaches a peakrelative abundance of 20% (Young, 2006), is only recorded at twohorizons in the core (5.3 ka and the surface sample), and only threespecimens in total are recorded. Further work in the region of Sumatraand the Sunda Strait is required to determine the exact nature of S.delicatus and “Spiniferites 1” in relation to possibly indicating nutrient
enrichment that is different to that depicted by other heterotrophicspecies.
4.3. Evidence from benthic foraminifera
The benthic foraminifera species O. t. umbonatus, E. exigua, B.aculeata and C. wuellerstorfi, characterised the benthic foraminiferalfauna at different times during the last 35.7 kyr (see Fig. 10).
Oridorsalis tener umbonatus was the most abundant species until26 ka BP (Fig. 10). At present, this species is related to a deep and coldenvironment, characterised by a low carbon-flux rate (Murgese and DeDeckker, 2005). The percentage for this taxon, close to 30%, during thisperiod, would indicate conditions of low productivity at the sea surfaceas also suggested by BFAR. Circulation offshore Java and Sumatra wasdifferent at that time: sea-surface currents, under the influence ofstrengthened Northwestern Monsoon (Gingele et al., 2002), andintermediate waters were characterised by a prevalent eastward flow.Under these conditions, the upwelling, which at Present is associatedwith the Southeastern Monsoon and the westward flow of the SJC,would have been suppressed or greatly reduced.
The isotopic signal (low δ13C of C. wuellerstorfi) can then beattributed to enhanced stratification of the water column, whichallowed the bloom of the giant diatom Ethmodiscus rex (De Deckkerand Gingele, 2002; Gingele et al., 2002). The situation changed at26 ka, when O. t. umbonatus was replaced by B. aculeata, whichdominated the benthic foraminiferal assemblage between 26 and14 ka, reaching percentages close to 50% (Fig. 10).
Analyses on Recent and living (stained) benthic foraminifera showa relationship between the abundance of B. aculeata, the sedimentorganic carbon content (Mackensen et al., 1993; Miao and Thunell,1993; Rathburn and Corliss, 1994) and shallow oxygen penetrationwithin the sediment (Miao and Thunell, 1996). The distribution of B.aculeata also correlates with high organic-carbon flux (N2 gC/m2 yr) inthe Atlantic and Southern Oceans (Altenbach et al., 1999). Similarly toB. aculeata, another species, E. exigua, showed increased percentage atthis time. In the Eastern Indian Ocean, the distribution of this speciesoutlines the preference for a deep environment, with pulsed fluxes oforganic matter (Murgese and De Deckker, 2005). The high BFAR valueswould suggest an increased input of organic matter to the sea floor forthis period. High carbon-flux rate is also suggested by the increasedAR of U. proboscidea. This species would also indicate reduced oxygenlevels (Murgese and De Deckker, 2005) and together with the low δ13Cof C. wuellerstorfi, would suggest a reduced deep-water circulation.
The E. exigua percentage peak suggests increased inputs of organicmatter from the sea surface. The high U. proboscidea AR corroboratesthis hypothesis and indicates an enhanced flux of organic matter tothe sea floor. As seen for the other cores, the B. aculeata bloomcoincided with increased food supply and low-oxygen levels at the seafloor. The reduced percentage of E. exigua after 20 ka (Fig. 10) may beseen as the consequence of competition between these two species,which, in the presence of constant and significant amount of organicmatter, would favour B. aculeata. This latter aspect can be related tothe fact that in the presence of a high organic-matter oxidation-rate,oxygen depletion at the sea floor would occur.
Together with a reduction of deep-waters circulation, oxygendepletion could have played a major role in limiting E. exigua, therebyfavouring B. aculeata. Low oxygen conditions are also suggested by thehigh value of dominance (D), which, during this period, reached thehighest values recorded for the entire core. At the same time, the highpercentage of infaunal taxa, which at Present are correlated with highcarbon-flux rate and low-oxygen levels (Murgese and De Deckker,2005), would support this hypothesis. Around 14 ka, O. t. umbonatusand C. wuellerstorfi became the most important species (Fig. 10). Theenvironmental interpretation of these taxa has already been dis-cussed, as together they would indicate a more oligotrophic environ-ment characterised by intense bottom currents. Different factors
211D.S. Murgese et al. / Palaeogeography, Palaeoclimatology, Palaeoecology 265 (2008) 195–213
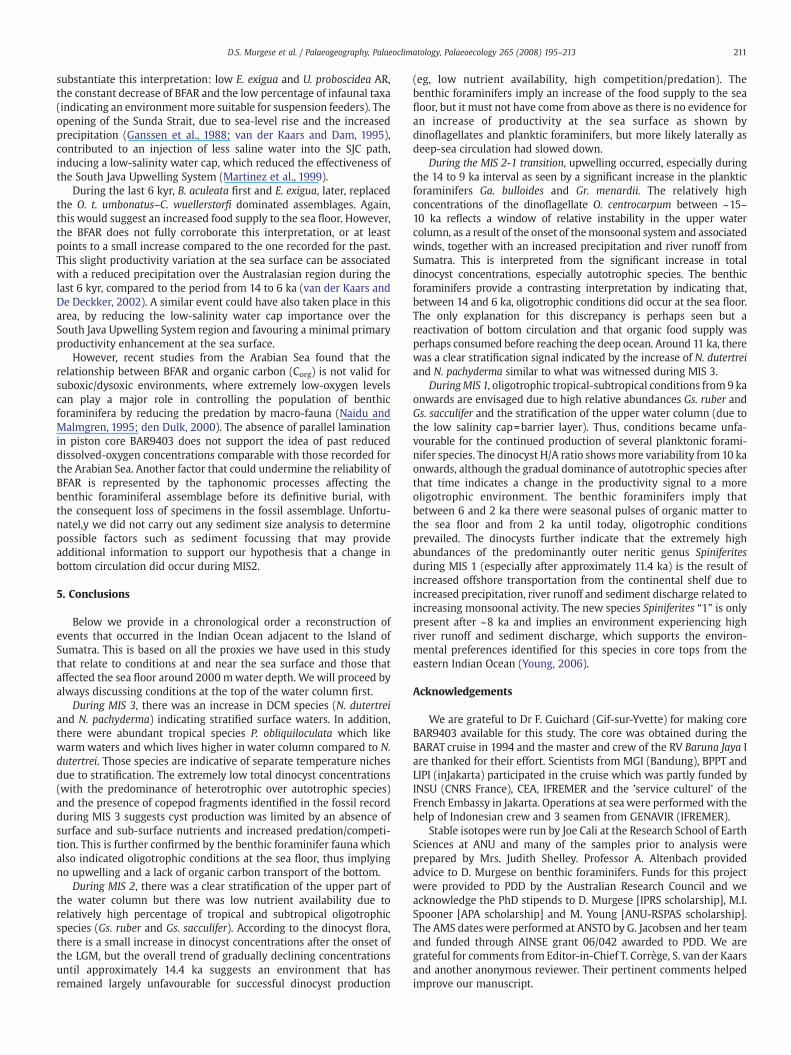
substantiate this interpretation: low E. exigua and U. proboscidea AR,the constant decrease of BFAR and the low percentage of infaunal taxa(indicating an environmentmore suitable for suspension feeders). Theopening of the Sunda Strait, due to sea-level rise and the increasedprecipitation (Ganssen et al., 1988; van der Kaars and Dam, 1995),contributed to an injection of less saline water into the SJC path,inducing a low-salinity water cap, which reduced the effectiveness ofthe South Java Upwelling System (Martinez et al., 1999).
During the last 6 kyr, B. aculeata first and E. exigua, later, replacedthe O. t. umbonatus–C. wuellerstorfi dominated assemblages. Again,this would suggest an increased food supply to the sea floor. However,the BFAR does not fully corroborate this interpretation, or at leastpoints to a small increase compared to the one recorded for the past.This slight productivity variation at the sea surface can be associatedwith a reduced precipitation over the Australasian region during thelast 6 kyr, compared to the period from 14 to 6 ka (van der Kaars andDe Deckker, 2002). A similar event could have also taken place in thisarea, by reducing the low-salinity water cap importance over theSouth Java Upwelling System region and favouring a minimal primaryproductivity enhancement at the sea surface.
However, recent studies from the Arabian Sea found that therelationship between BFAR and organic carbon (Corg) is not valid forsuboxic/dysoxic environments, where extremely low-oxygen levelscan play a major role in controlling the population of benthicforaminifera by reducing the predation by macro-fauna (Naidu andMalmgren, 1995; den Dulk, 2000). The absence of parallel laminationin piston core BAR9403 does not support the idea of past reduceddissolved-oxygen concentrations comparable with those recorded forthe Arabian Sea. Another factor that could undermine the reliability ofBFAR is represented by the taphonomic processes affecting thebenthic foraminiferal assemblage before its definitive burial, withthe consequent loss of specimens in the fossil assemblage. Unfortu-natel,y we did not carry out any sediment size analysis to determinepossible factors such as sediment focussing that may provideadditional information to support our hypothesis that a change inbottom circulation did occur during MIS2.
5. Conclusions
Below we provide in a chronological order a reconstruction ofevents that occurred in the Indian Ocean adjacent to the Island ofSumatra. This is based on all the proxies we have used in this studythat relate to conditions at and near the sea surface and those thataffected the sea floor around 2000 mwater depth. We will proceed byalways discussing conditions at the top of the water column first.
During MIS 3, there was an increase in DCM species (N. dutertreiand N. pachyderma) indicating stratified surface waters. In addition,there were abundant tropical species P. obliquiloculata which likewarm waters and which lives higher in water column compared to N.dutertrei. Those species are indicative of separate temperature nichesdue to stratification. The extremely low total dinocyst concentrations(with the predominance of heterotrophic over autotrophic species)and the presence of copepod fragments identified in the fossil recordduring MIS 3 suggests cyst production was limited by an absence ofsurface and sub-surface nutrients and increased predation/competi-tion. This is further confirmed by the benthic foraminifer fauna whichalso indicated oligotrophic conditions at the sea floor, thus implyingno upwelling and a lack of organic carbon transport of the bottom.
During MIS 2, there was a clear stratification of the upper part ofthe water column but there was low nutrient availability due torelatively high percentage of tropical and subtropical oligotrophicspecies (Gs. ruber and Gs. sacculifer). According to the dinocyst flora,there is a small increase in dinocyst concentrations after the onset ofthe LGM, but the overall trend of gradually declining concentrationsuntil approximately 14.4 ka suggests an environment that hasremained largely unfavourable for successful dinocyst production
(eg, low nutrient availability, high competition/predation). Thebenthic foraminifers imply an increase of the food supply to the seafloor, but it must not have come from above as there is no evidence foran increase of productivity at the sea surface as shown bydinoflagellates and planktic foraminifers, but more likely laterally asdeep-sea circulation had slowed down.
During the MIS 2-1 transition, upwelling occurred, especially duringthe 14 to 9 ka interval as seen by a significant increase in the plankticforaminifers Ga. bulloides and Gr. menardii. The relatively highconcentrations of the dinoflagellate O. centrocarpum between ~15–10 ka reflects a window of relative instability in the upper watercolumn, as a result of the onset of themonsoonal system and associatedwinds, together with an increased precipitation and river runoff fromSumatra. This is interpreted from the significant increase in totaldinocyst concentrations, especially autotrophic species. The benthicforaminifers provide a contrasting interpretation by indicating that,between 14 and 6 ka, oligotrophic conditions did occur at the sea floor.The only explanation for this discrepancy is perhaps seen but areactivation of bottom circulation and that organic food supply wasperhaps consumed before reaching the deep ocean. Around 11 ka, therewas a clear stratification signal indicated by the increase of N. dutertreiand N. pachyderma similar to what was witnessed during MIS 3.
DuringMIS 1, oligotrophic tropical-subtropical conditions from 9 kaonwards are envisaged due to high relative abundances Gs. ruber andGs. sacculifer and the stratification of the upper water column (due tothe low salinity cap=barrier layer). Thus, conditions became unfa-vourable for the continued production of several planktonic forami-nifer species. The dinocyst H/A ratio showsmore variability from 10 kaonwards, although the gradual dominance of autotrophic species afterthat time indicates a change in the productivity signal to a moreoligotrophic environment. The benthic foraminifers imply thatbetween 6 and 2 ka there were seasonal pulses of organic matter tothe sea floor and from 2 ka until today, oligotrophic conditionsprevailed. The dinocysts further indicate that the extremely highabundances of the predominantly outer neritic genus Spiniferitesduring MIS 1 (especially after approximately 11.4 ka) is the result ofincreased offshore transportation from the continental shelf due toincreased precipitation, river runoff and sediment discharge related toincreasing monsoonal activity. The new species Spiniferites “1” is onlypresent after ~8 ka and implies an environment experiencing highriver runoff and sediment discharge, which supports the environ-mental preferences identified for this species in core tops from theeastern Indian Ocean (Young, 2006).
Acknowledgements
We are grateful to Dr F. Guichard (Gif-sur-Yvette) for making coreBAR9403 available for this study. The core was obtained during theBARAT cruise in 1994 and the master and crew of the RV Baruna Jaya Iare thanked for their effort. Scientists from MGI (Bandung), BPPT andLIPI (inJakarta) participated in the cruise which was partly funded byINSU (CNRS France), CEA, IFREMER and the ’service culturel’ of theFrench Embassy in Jakarta. Operations at seawere performed with thehelp of Indonesian crew and 3 seamen from GENAVIR (IFREMER).
Stable isotopes were run by Joe Cali at the Research School of EarthSciences at ANU and many of the samples prior to analysis wereprepared by Mrs. Judith Shelley. Professor A. Altenbach providedadvice to D. Murgese on benthic foraminifers. Funds for this projectwere provided to PDD by the Australian Research Council and weacknowledge the PhD stipends to D. Murgese [IPRS scholarship], M.I.Spooner [APA scholarship] and M. Young [ANU-RSPAS scholarship].The AMS dates were performed at ANSTO by G. Jacobsen and her teamand funded through AINSE grant 06/042 awarded to PDD. We aregrateful for comments from Editor-in-Chief T. Corrège, S. van der Kaarsand another anonymous reviewer. Their pertinent comments helpedimprove our manuscript.

212 D.S. Murgese et al. / Palaeogeography, Palaeoclimatology, Palaeoecology 265 (2008) 195–213
References
Altenbach, A.V., Sarnthein, M., 1989. Productivity record in benthic foraminifera. In:Berger, W.H., Smetacek, V.S., Wefer, G. (Eds.), Productivity of the Ocean: Present andPast. John Wiley & Sons Limited, pp. 255–269. S. Bernhard, Dahlem Konferenzen.
Altenbach, A.V., Pflaumann, U., Ralph, S., Thies, A., Timm, S., Trauth, M.,1999. Scaling anddistributional patterns of benthic foraminifera with flux rates of organic carbon.J. Foraminiferal Res. 29, 173–185.
Auras-Schudnagies, A., Kroon, D., Ganssen, G., Hemleben, C., Van Hinte, J.E., 1989.Distribution pattern of planktic foraminifers and pteropods in surface waters andtop core sediments of the Red Sea, and adjacent areas controlled by the monsoonalregime and other ecological factors. Deep-Sea Res. 36 (10), 1515–1533.
Bard, E., 1998. Geochemical and geophysical implications of the radiocarbon calibration.Geochim. Cosmochim. Acta 62, 2025–2038.
Barmawidjaja, B.M., Rohling, E.J., van der Kaars, S., Vergnaud Grazzini, C., Zachariasse,W.J., 1993. Glacial condition in the Northern Molucca Sea region (Indonesia).Palaeogeogr. Palaeoclimat. Palaeoecol. 101, 147–167.
Bé, A.W.H., 1977. An ecological, zoogeographical and taxonomic review of Recentplanktic foraminifera. In: Ramsay, A.T.S. (Ed.), Oceanic Micropaleontology, 1.Academic Press, London, pp. 1–100.
Bé, A.W.H., Hutson, W.H., 1977. Ecology of planktic foraminifera and biogeographicpatterns of life and fossil assemblages in the IndianOcean.Micropaleontology 23 (4),369–414.
Bowman, G.M., 1985. Oceanic reservoir correction for marine radiocarbon dates fromnorthwestern Australia. Aust. Archaeol. 20, 58–67.
Bray, N.A., Wijffels, S.E., Chong, J.C., Fieux, M., Hautala, S., Meyers, G., Morawitz, W.M.L.,1997. Characteristics of the Indo-Pacific Throughflow in the eastern Indian Ocean.Geophys. Res. Lett. 24, 2569–2572.
Cho, H.-J., Matsuoka, K., 2001. Distribution of dinoflagellate cysts in surface sedimentsfrom the Yellow Sea and East China Sea. Mar. Micropaleontol. 42 (3-4), 103–123.
Dale, B., 1996. Chapter 31. Dinoflagellate cyst ecology, modeling and geologicalapplications. In: Jansonius, J.M., McGregor, D.C. (Eds.), Palynology: principles andapplications. Am. Ass. Strat. Palynol. Found, vol. 3, pp. 1249–1275.
Dale, B., Fjellså, A., 1994. Dinoflagellate cysts as palaeoproductivity indicators: state ofthe art, potential and limits. In: Zahn, R., et al. (Ed.), Carbon cycling in the glacialocean: constraints on the ocean's role in global change. Springer-Verlag, Berlin,pp. 521–537.
Dale, A.L., Dale, B., 2002. Appendix: application of ecologically based statisticaltreatment to micropalaeontology. In: Haslett, S.K. (Ed.), Quaternary EnvironmentalMicropalaeontology. Arnold, London, pp. 259–286.
Dale, B., Dale, A.L., Jansen, F.J.H., 2002. Dinoflagellate cysts as environmental indicatorsin surface sediments from the Congo deep-sea fan and adjacent regions.Palaeogeogr. Palaeoclimat. Palaeoecol. 185, 309–338.
De Deckker, P., Gingele, F.X., 2002. On the occurrence of the giant diatom Ethmodiscusrex in a 80-ka record from a deep-sea core, southeast of Sumatra, Indonesia:implications for tropical palaeoceanography. Mar. Geol. 183, 31–43.
De Deckker, P., Tapper, N.J., van der Kaars, S., 2002. The status of the Indo-Pacific WarmPool and adjacent land at the Last Glacial Maximum. Glob. Planet. Change 35, 25–35.
De Deckker, P., Yokoyama, Y. in press. Micropalaeontological evidence for Late Quaternarysea-level change in Bonaparte Gulf, Australia. Glob. Planet. Change.
den Dulk, M., 2000. Benthic foraminiferal response to Late Quaternary variations insurface water productivity and oxygenation in the northern Arabian Sea.Universiteit Utrecht, Utrecht. 205 pp.
de Vernal, A., Larouche, A., Richard, P., 1987. Evaluation of palynomorph concentration:do the aliquot and marker-grain methods yield comparable results? Pollen Spores29 (2-3), 291–304.
Diester-Haass, L., Meyers, P.A., Vidal, L., 2002. The late Miocene onset of highproductivity in the Benguela Current upwelling system as part of a global pattern.Mar. Geol. 180 (1-4), 87–103.
de Vernal, A., Guiot, J., Turon, J.L., 1993. Late and postglacial palaeoenvironments of theGulf of St. Lawrence: marine and terrestrial palynological evidence. Géogr. Phys.Quat. 47 (2), 167–180.
Diester-Haass, L., Zahn, R., 2001. Paleoproductivity increase at the Eocene–Oligoceneclimatic transition: ODP/DSDP sites 763 and 592. Palaeogeogr. Palaeoclimat.Palaeoecol. 172 (1-2), 153–170.
Ding, X., Guichard, F., Bassinot, F., Labeyrie, L., Fang, N.Q., 2002. Evolution of heattransport pathways in the Indonesian Archipelago during last deglaciation. Chin.Sci. Bull. 47 (22), 1912–1917.
Ding, X., Bassinot, F., Guichard, F., Li, Q.Y., Fang, N.Q., Labeyrie, L., Xin, R.C., Adisaputra, M.K.,Hardjawidjaksana, K., 2006. Distribution and ecology of planktic foraminifera fromthe seas around the Indonesian Archipelago. Mar. Micropaleontol. 58, 114–134.
Duplessy, J.-C., et al., 1984. d13C Record of benthic foraminifera in the last interglacialocean: implications for the carbon cycle and the global deep water circulation.Quat. Res. 21 (2), 225–243.
Dürkop, A., Holbourn, A., Kuhnt, W., Zuraida, R., Andersen, N., Grootes, P., 2008.Centennial-scale climate variability in the Timor Sea during Marine Isotope 3. Mar.Micropaleontol. 66, 208–221.
Esper, O., Zonneveld, K.A.F., 2007. The potential of organic-walled dinoflagellate cystsfor the reconstruction of past sea-surface conditions in the Southern Ocean. Mar.Micropaleontol. 65, 185–212.
Fairbanks, G.R., Wiebe, P.H., 1980. Foraminifera and chlorophyll maximum: verticaldistribution, seasonal succession, and paleoceanographic significance. Science 209,1524–1525.
Fink, D., Hotchkins, M., Hua, Q., Smith, A.M., Zoppi, U., Child, D., Mifsud, C., van der Gaast,H., 2004. The ANTARES AMS facility at ANSTO. Nucl. Instr. Meth. B 223–224,109–115.
Ganssen, G.M., Kroon, D., 2000. The isotopic signature of planktic foraminifera from theNE Atlantic surface sediments: implications for the reconstruction of past oceanicconditions. J. Geol. Soc. 157, 693–699.
Ganssen, G., Troelstra, S.R., Faber, B., van Der Kaars, W.A., Situmorang, M., 1988. LateQuaternary paleoceanography of the Banda Sea, eastern Indonesian piston cores(Snellius-II expedition, cruise G5). Neth. J. Sea Res. 22, 491–494.
Gingele, F.X., De Deckker, P., Hillenbrand, C.-D., 2001. Late Quaternary fluctuations of theLeeuwin Current and palaeoclimates on the adjacent land masses — clay mineralevidence. Aust. J. Earth Sci. 48, 867–874.
Gingele, F.X., De Deckker, P., Girault, A., Guichard, F., 2002. High-resolution history of theSouth Java Current during the past 80 Ka. Palaeogeogr. Palaeoclimat. Palaeoecol.183, 247–260.
Herguera, J.C., 2000. Last glacial paleoproductivity patterns in the eastern equatorialPacific: benthic foraminifera records. Mar. Micropaleontol. 40, 259–275.
Herguera, J.C., Berger,W.H.,1991. Paleoproductivity from benthic foraminifera abundance:glacial to postglacial change in the West-Equatorial Pacific. Geology 19, 1173–1176.
Herguera, J.C., Berger,W.H.,1994. Glacial to postglacial drop in productivity in the westernequatorial Pacific: mixing rate vs. nutrient concentrations. Geology 22, 629–632.
Hughen, K.A. and 26 other authors, 2004. Marine04 Marine Radiocarbon AgeRadiocarbon. 46, 1059-1086.
Juggins, S., 2003. C2 User Guide 1.3. Software for ecological and palaeoecological dataanalysis and visualization. University of Newcastle, Newcastle-upon-Tyne, UK. 69 pp.
Kroon, D., Nederbragt, A.J., 1990. Ecology and palaeoecology of triserial foraminifera.Mar. Micropaleontol. 16, 25–38.
Levitus, S., 1998. World Ocean Atlas 1998. available at http://www.cdc.noaa.gov/.Li, B.H., Jian, Z.M., Wang, P.X., 1997. Pulleniatina obliquiloculata as a paleoceanographic
indicator in the southern Okinawa trough during the last 20,000 years. Mar.Micropaleontol. 32 (1-2), 59–69.
Linsley, B.K., Thunell, R.C., Morgan, C., Williams, D.F., 1985. Oxygen minimum expansionin the Sulu Sea, western equatorial Pacific, during the last glacial low stand of sealevel. Mar. Micropaleontol. 9, 395–418.
Loubere, P., 1996. The surface ocean productivity and bottom water oxygen signals indeep water benthic foraminiferal assemblages. Mar. Micropaleontol. 28, 247–261.
Lutze, G.F., Thiel, H., 1988. Epibenthic foraminifera from elevated microhabitats: Cibi-cidoides wuellerstorfi and Planulina ariminensis. J. Foraminiferal Res. 19, 153–158.
Mackensen, A., Futterer, D.K., Grobe, H., Schmiedl, G., 1993. Benthic foraminiferalassemblages from the eastern South Atlantic Polar Front region between 35° and57° S. Mar. Micropaleontol. 22, 33–69.
McMinn, A., Howard, W.R., Roberts, D., 2001. Late Pliocene dinoflagellate cyst anddiatom analysis from a high resolution sequence in DSDP Site 594, Chatham Rise,south west Pacific. Mar. Micropaleontol. 43, 207–221.
Marret, F., 1994. Distributions of dinoflagellate cysts in Recent marine sediments fromthe East Equatorial Atlantic (Gulf of Guinea). Rev. Palaeobot. Palynol. 84, 1–22.
Marret, F., de Vernal, A.,1997. Dinoflagellate cyst distribution in surface sediments of thesouthern Indian Ocean. Mar. Micropaleontol. 29, 367–392.
Marret, F.Z., Zonneveld, K.A.F., 2003. Atlas of modern organic-walled dinoflagellate cystdistribution. Rev. Palaeobot. Palynol. 125, 1–200.
Marret, F., Scourse, J., Jansen, J.H.F., Schneider, R., 1999. Changements climatiques etpaléocéanographiques en Afrique centrale atlantique au cours de la dernièredéglaciation: contribution palynologique. Comptes rendus acad. sc.. Série II Fasc. A-Sc. terre et planètes, vol. 329, pp. 721–726.
Martinez, J.I., De Deckker, P., Barrows, T.T., 1999. Palaeoceanography of the last glacialmaximum in the eastern Indian Ocean: planktic foraminiferal evidence. Palaeo-geogr. Palaeoclimat. Palaeoecol. 147, 73–99.
Martinez, I.J., Taylor, L., De Deckker, P., Barrows, T.T., 1998. Planktic foraminifera from theeastern Indian Ocean: distribution and ecology in relation of the Western Pacificwarm Pool (WPWP). Mar. Micropaleontol. 34, 121–151.
Martinson, D.G., Pisias, N.G., Hays, J.D., Imbrie, J., Moore, T.C., Shackleton, N.J., 1993. Agedating and the orbital theory of the ice ages: development of a high-resolution 0 to300,000-year chronostratigraphy. Quat. Res. 27, 1–29.
Miao, Q.M., Thunell, R.C., 1993. Recent deep-sea benthic foraminiferal distributions inthe South China and Sulu Seas. Mar. Micropaleontol. 22, 1–32.
Miao, Q.M., Thunell, R.C., 1996. Late Pleistocene–Holocene distribution of deep-seabenthic foraminifera in the South China sea and Sulu sea — palaeoceanographicimplications. J. Foraminiferal Res. 26, 9–23.
Milliman, J.D., Farnsworth, K.L., Albertin, C.S., 1999. Flux and fate of fluvial sedimentsleaving large islands in the East Indies. J. Sea Res. 41, 97–110.
Müller, A., Opdyke, B.N., 2000. Glacial–interglacial changes in nutrient utilization andpaleoproductivity in the Indonesian Throughflow sensitive Timor Trough, eastern-most Indian Ocean. Paleoceanography 15, 85–94.
Murgese, D.S., De Deckker, P., 2005. The distribution of deep-sea benthic foraminifera incore tops from the eastern Indian Ocean. Mar. Micropaleontol. 56, 25–49.
Murgese, S.D., De Deckker, P., 2007. The Late Quaternary evolution of water masses inthe eastern Indian Ocean between Australia and Indonesia, based on benthicforaminifera faunal and carbon isotopes analyses. Palaeogeogr. Palaeoclimat.Palaeoecol. 247, 382–401.
Naidu, P.D., Malmgren, B., 1995. Do benthic foraminifer records represent a productivityindex in oxygen minimum zone areas? An evaluation from the Oman Marin,Arabian Sea. Mar. Micropaleontol. 26, 49–55.
Paillard, D., Labeyrie, L., Yiou, P., 1996. Machintosh program performs time-seriesanalysis. Eos. Trans. AGU 77, 379.
Pak, D.K., Kennett, J.P., 2002. A foraminiferal isotopic proxy for upper water massstratification. J. Foraminiferal Res. 32 (3), 319–327.
Pflaumann, U., Jian, Z., 1999. Modern distribution patterns of planktic foraminifera inthe South China Sea and western Pacific: a new transfer technique to estimateregional sea-surface temperatures. Mar. Geol. 156 (1), 41–83.
213D.S. Murgese et al. / Palaeogeography, Palaeoclimatology, Palaeoecology 265 (2008) 195–213
Rathburn, A.E., Corliss, B.H., 1994. The ecology of living (stained) deep-sea benthicforaminifera from the Sulu Sea. Paleoceanography 9, 87–150.
Rasmussen, T.L., Thomsen, E., Troelstra, S.R., Kuijpers, A., Prins, M.A., 2002. Millennial-scale glacial variability versus Holocene stability: changes in and benthicforaminifera faunas and ocean circulation in the North Atlantic during the last60000 years [Review]. Mar. Micropaleontol. 47 (1-2), 143–176.
Roncaglia, L., 2004. Palynofacies analysis and organic-walled dinoflagellate cysts asindicators of palaeo-hydrographic changes; an example from Holocene sedimentsin Skalafjord, Faroe Islands. Mar. Micropaleontol. 50 (1-2), 21–42.
Saito, T., Thompson, P.R., Berger, D., 1981. Systematic index of recent and PleistocenePlanktic foraminifera. University Press, Tokyo.
Southon, J., Kashgarian,M., Fontugne,M.,Metivier, B., Yim,W.W.-S., 2002.Marine reservoircorrections for the Indian Ocean and Southeast Asia. Radiocarbon 44, 167–180.
Spooner, M.I., Barrows, T.T., De Deckker, P., Paterne, M., 2005. Palaeoceanography of theBanda Sea, and Late Pleistocene initiation of the Northwest Monsoon. Glob. Planet.Change 49 (1-2), 28–46.
Springtall, J., Tomczak, M., 1992. Evidence of the barrier layer in the surface layer of thetropics. J. Geophys. Res. 97, 7305–7316.
Sprintall, J., Wijffels, S., Chereskin, T., Bray, N., 2002. The JADE and WOCE I10/IR6Throughflow sections in the southeast Indian Ocean. Part 2: velocity and transports.Deep-Sea Res. II 49, 1363–1389.
Struck, U., 1995. Stepwise postglacial migration of benthic foraminifera into the abyssalnortheastern Norwegian sea. Mar. Micropaleontol. 26 (1-4), 207–213.
Stuiver, M., Polach, H., 1977. Reporting of 14C data. Radiocarbon 19, 355–363.Stuiver, M., Reimer, P.J., and Reimer, R.W., 2006. CALIB 5.1. available at http://calib.qub.
ac.uk/calib/.Takahashi, K., Okada, H., 2000. The paleoceanography for the last 30,000 years in the
southeastern Indian Ocean by means of calcareous nannofossils. Mar. Micropa-leontol. 40, 83–103.
Thiede, J., Nees, S., Hartmut, S., De Deckker, P., 1997. Oceanic surface conditions recordedon the sea floor of the Southwest Pacific Ocean through the distribution offoraminifers and biogenic silica. Palaeogeog. Palaeoclimat. Palaeoecol. 131, 207–239.
Thomas, E., Booth, L., Maslin, M., Shackleton, N.J., 1995. Northeastern Atlantic benthicforaminifera during the last 45,000 tears — changes in productivity seen from thebottom up. Paleoceanography 10, 545–562.
Thompson, P.R., 1981. Planktic foraminifera in the Western Pacific during the past150,000 years — comparison of modern and fossil assemblages. Palaeogeogr.Palaeoclimat. Palaeoecol. 35, 241–279.
Thunell, R.C., Reynolds, L.A., 1984. Sedimentation of planktic foraminifera: seasonalchanges in species flux in the Panama basin. Micropalenotology 30, 243–262.
Thunell, R., Sautter, L.R., 1992. Planktonic foraminiferal faunal and stable isotopic indicesof upwelling: a sediment trap study in the San Pedro Basin, Southern CaliforniaBight. In: Summerhayes, C.P., Prell, W.L., Emeis, K.C. (Eds.), Upwelling Systems:Evolution since the Early Miocene. Geological Society Special Publication, pp.17–91.
van der Kaars, S., De Deckker, P., 2002. A Late Quaternary polen record from deep-seacore Fr10/95 GC17 offshore Cape Range Peninsula, northwestern Australia. Rev.Palaeobot. Palynol. 120, 17–39.
van der Kaars, W.A., Dam, M.A.C., 1995. A 135,000-year record of vegetational andclimatic change from the Bandung area, West-Java, Indonesia. Palaeogeog.Palaeoclimatol. Palaeoecol. 117, 55–72.
vanWaveren, I.M., 1993. Planktic organic matter in surficial sediments of the Banda Sea(Indonesia) — a palynological approach. Geologica Ultraiectina: Medel. Facult.Aardwetensch. Univ. Utrecht, vol. 104, pp. 1–237.
van Waveren, I.M., Visscher, H., 1994. Analysis of the composition and selectivepreservation of organic matter in surficial deep-sea sediments from a high-productivity area (Banda Sea, Indonesia). Palaeogeog. Palaeoclimatol. Palaeoecol.112 (1-2), 85–111.
Versteegh, M., 1994. Recognition of cyclic and non-cyclic environmental changes in theMediterranean Pliocene; a palynological approach. Mar. Micropaleontol. 23 (2),147–183.
Versteegh, G.J.M., Zonneveld, K.A.F., 2002. Use of selective degradation to separatepreservation from productivity. Geology 30 (7), 615–618.
Wall, D., Dale, B., Lochmann, G.P., Smith, W.K., 1977. The environmental and climaticdistribution of dinoflagellate cysts in modern marine sediments from regions in thenorth and south Atlantic Oceans and adjacent seas. Mar. Micropaleontol. 2, 121–200.
Wang, L., Sarnthein,M., Erlenkeuser,H., Grimalt, J., Grootes, P., Heilig, S., Ivanova, E., Kienast,M., Pelejero, C., Pflaumann, U., 1999. East Asian monsoon during the Late Pleistocene:high-resolution sediment records from the South China Sea. Mar. Geol. 156, 245–284.
Wijffels, S.E., Bray, N., Hautala, S., Meyers, G., Werner, W.M.L., 1996. TheWOCE Indonesianthroughflow repeat hydrography sections: I10 and IR6. Int. WOCE Newsl. 24, 25–28.
Wyrtki, K., 1962. The upwelling in the region between Java and Australia during thesouth-east monsoon. Aust. J. Mar. Freshw. Res. 13, 217–225.
Yan, X.-H., Ho, C.-R., Zheng, Q., Klemas, V., 1992. Temperature and size variabilities of theWestern Pacific warm pool. Science 258, 1643–1645.
Yokoyama, Y., Lambeck, K., De Deckker, P., Fifield, L.K., 2000. Timing of the Last GlacialMaximum from observed sea-level minima. Nature 406, 713–716.
Yokoyama, Y., De Deckker, P., Lambeck, K., Fifield, L.K., 2001. Sea-level at the Last GlacialMaximum: evidence from northwestern Australia to constrain ice volumes foroxygen isotope 2. Palaeogeogr. Palaeoclimat. Palaeoecol. 165, 281–297.
Young, M.D., 2006. The Distribution of Organic- and Calcareous-Walled DinoflagellateCysts from the Eastern Indian Ocean; A Proxy for Late Quaternary Palaeoceano-graphic Reconstructions. PhD thesis, Australian National University, Canberra,Australia. 342pp.
Zonneveld, K.A.F., 1997. New species of organic walled dinoflagellate cysts frommodernsediments of the Arabian Sea (Indian Ocean). Rev. Palaeobot. Palynol. 97, 319–337.
Zonneveld, K.A.F., Brummer, G.-J.A., 2000. (Palaeo-)ecological significance, transportand preservation of organic-walled dinoflagellate cysts in the Somali Basin, NWArabian Sea. Deep-Sea Res. II 47, 2229–2256.
Zonneveld, K.A.F., Versteegh, G.J.M., de Lange, G.J., 1997. Preservation of organic walleddinoflagellate cysts in different oxygen regimes: a 10 000 years natural experiment.Mar. Micropaleontol. 29, 393–405.
Zonneveld, K.A.F., Versteegh, G.J.M., de Lange, G.J., 2001. Palaeoproductivity and post-depositional aerobic organic matter decay reflected by dinoflagellate cystassemblages of the Eastern Mediterranean S1 sapropel. Mar. Geol. 172, 181–195.