Risk Analysis Of Offshore Aquaculture Ocean Plantation System
16
Australian Journal of Basic and Applied Sciences, 7(14) December 2013, Pages: 380-395 AENSI Journals Australian Journal of Basic and Applied Sciences Journal home page: www.ajbasweb.com Corresponding Author: A. Saman.A. Kader, Marine Technology center, University Technology Malaysia. UTM Skudai, 81310, Johor, Malaysia, Phone:+60197175860; E-mail: [email protected] Risk Analysis Of Offshore Aquaculture Ocean Plantation System 1 Oladokun. S. Oanrewaju, 1 A. Saman. A. Kader, 2 Allan Ma gee 1 Marine Technology Center, University Technology Malaysia, Malaysia. 1 Marine Technology Center, University Technology Malaysia, Malaysia. 2 Technip, Kuala Lumpur, Malaysia. ARTICLE INFO ABSTRACT Article history: Received 22 October 2013 Received in revised form 14 January 2014 Accepted 20 January 2014 Available online 1 February 2014 Key words: Risk, Reliability, Offshore, Aquaculture, Algae, Oceanic, Farming Risk based design is widely being adapted as decision system for engineering infrastructure, Aaquaculture industry is the fastest growing food producing sector in the world. Considerable interest exists in developing open ocean aquaculture in response to a shortage of suitable, sheltered inshore locations and possible husbandry advantages of oceanic sites. Adopting the concept of very large floating structure in aquaculture farming in ocean is like to produce more aquaculture product like seaweed. All being property and support for growing aquaculture industry. On risk analysis study of offshore aquaculture ocean plantation system is very important to determine the system functionality and capability that meet sustainable and reliability requirement. The paper discuss qualitative and quantitative risk analysis if offshore aquaculture system. © 2013 AENSI Publisher All rights reserved. To Cite This Article: Oladokun. S. Oanrewaju, A. Saman.A. Kader, Allan Ma gee., Risk Analysis Of Offshore Aquaculture Ocean Plantation System. Aust. J. Basic & Appl. Sci., 7(14): 380-395, 2013 Background: The technology, for very large floating structures has developed continually, while changing societal needs have resulted in many different applications of the technology for floating structure. Very large floating structure for offshore aquaculture of seaweed could be adapted TO offshore aquaculture ocean plantation system for oceanic farming of fish, prawn, squid and many more. The design of very large floating structure for offshore aquaculture ocean plantation system required a reliable and risk free system with robust mathematical and simulation, risk and reliability of the hydroelastic structure, mooring system, structure, and material. Hence, the study of risk and reliability for the mooring system of offshore aquaculture ocean plantation system is required to make sure the system can function well, be monitored, and accessed safety and efficiency. Typical mooring structure for offshore aquaculture include piers, docks, floats and buoys and their associated pilings, ramps, lifts and railways. Mooring structure is required to follow local and international requirements for offshore standards, materials, installation timing and surveys. The mooring structures should; be able to withstand in critical saltwater and freshwater habitats when the standards, overwater structures shall be constructed to the minimum size necessary to meet the needs of ocean resources exploration use. Mooring system for VLFS need risk and reliability analysis of the associated criticality. Risk analysis of offshore aquaculture ocean plantation system focus on analyzing mooring structure with hope to help determine safe, reliability and efficiency of the system (ISSC2006., 2006). Qualitative assessment and quantitative risk assessment analysis methods are explored towards reliable decision support for VLFS. Qualitative assessment analysis employed qualitative tools like checklist, and HAZOP (Hazard and Operability Study) that define the system while quantitative risk analysis, the methods employed include Failure Modes and Effects Analysis (FMEA), Fault Tree Analysis (FTA), Risk Control Option based on HAZID (Hazard Identification) process. The risk of disaster cannot be eliminated, but risk can be reduced by employing better safety detection technique and establishing safety criteria prior to an accident occurrence. This paper describe development of simplified but holistic methodology that determine risk based decision support for reliable design and development of VLFS system, the risk analysis focus on mooring structure failure and reliability through employment of risk tools like FMEA, FTA, RCO and HAZID. The significant of this using risk method for VLFS are (Ayyub, B.M., et al., 2002; Koichiro Yoshida, K.K.-S., 1993): i.to avoid system failure according recommendation from quantifying and deduction of improvement measures
-
Upload
independent -
Category
Documents
-
view
1 -
download
0
Transcript of Risk Analysis Of Offshore Aquaculture Ocean Plantation System
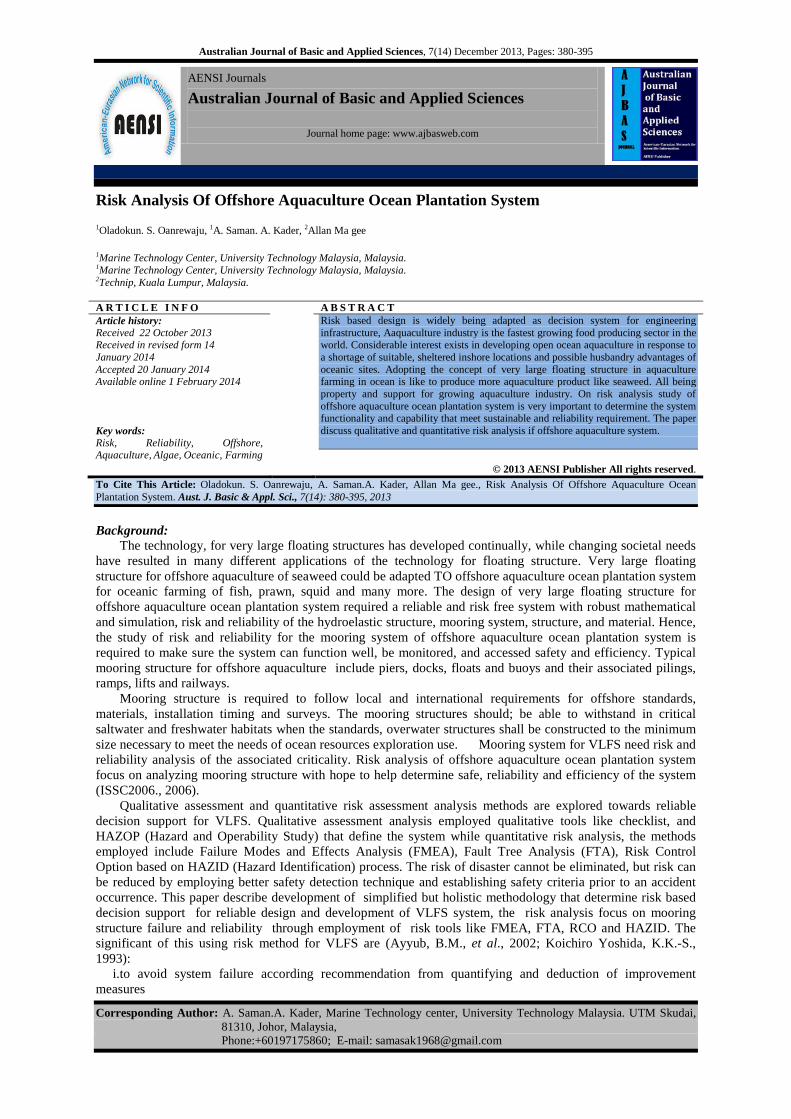
Australian Journal of Basic and Applied Sciences, 7(14) December 2013, Pages: 380-395
AENSI Journals
Australian Journal of Basic and Applied Sciences
Journal home page: www.ajbasweb.com
Corresponding Author: A. Saman.A. Kader, Marine Technology center, University Technology Malaysia. UTM Skudai, 81310, Johor, Malaysia,
Phone:+60197175860; E-mail: [email protected]
Risk Analysis Of Offshore Aquaculture Ocean Plantation System 1Oladokun. S. Oanrewaju, 1A. Saman. A. Kader, 2Allan Ma gee 1Marine Technology Center, University Technology Malaysia, Malaysia. 1Marine Technology Center, University Technology Malaysia, Malaysia. 2Technip, Kuala Lumpur, Malaysia. A R T I C L E I N F O A B S T R A C T Article history: Received 22 October 2013 Received in revised form 14 January 2014 Accepted 20 January 2014 Available online 1 February 2014 Key words: Risk, Reliability, Offshore, Aquaculture, Algae, Oceanic, Farming
Risk based design is widely being adapted as decision system for engineering infrastructure, Aaquaculture industry is the fastest growing food producing sector in the world. Considerable interest exists in developing open ocean aquaculture in response to a shortage of suitable, sheltered inshore locations and possible husbandry advantages of oceanic sites. Adopting the concept of very large floating structure in aquaculture farming in ocean is like to produce more aquaculture product like seaweed. All being property and support for growing aquaculture industry. On risk analysis study of offshore aquaculture ocean plantation system is very important to determine the system functionality and capability that meet sustainable and reliability requirement. The paper discuss qualitative and quantitative risk analysis if offshore aquaculture system.
© 2013 AENSI Publisher All rights reserved. To Cite This Article: Oladokun. S. Oanrewaju, A. Saman.A. Kader, Allan Ma gee., Risk Analysis Of Offshore Aquaculture Ocean Plantation System. Aust. J. Basic & Appl. Sci., 7(14): 380-395, 2013
Background:
The technology, for very large floating structures has developed continually, while changing societal needs have resulted in many different applications of the technology for floating structure. Very large floating structure for offshore aquaculture of seaweed could be adapted TO offshore aquaculture ocean plantation system for oceanic farming of fish, prawn, squid and many more. The design of very large floating structure for offshore aquaculture ocean plantation system required a reliable and risk free system with robust mathematical and simulation, risk and reliability of the hydroelastic structure, mooring system, structure, and material. Hence, the study of risk and reliability for the mooring system of offshore aquaculture ocean plantation system is required to make sure the system can function well, be monitored, and accessed safety and efficiency. Typical mooring structure for offshore aquaculture include piers, docks, floats and buoys and their associated pilings, ramps, lifts and railways.
Mooring structure is required to follow local and international requirements for offshore standards, materials, installation timing and surveys. The mooring structures should; be able to withstand in critical saltwater and freshwater habitats when the standards, overwater structures shall be constructed to the minimum size necessary to meet the needs of ocean resources exploration use. Mooring system for VLFS need risk and reliability analysis of the associated criticality. Risk analysis of offshore aquaculture ocean plantation system focus on analyzing mooring structure with hope to help determine safe, reliability and efficiency of the system (ISSC2006., 2006).
Qualitative assessment and quantitative risk assessment analysis methods are explored towards reliable decision support for VLFS. Qualitative assessment analysis employed qualitative tools like checklist, and HAZOP (Hazard and Operability Study) that define the system while quantitative risk analysis, the methods employed include Failure Modes and Effects Analysis (FMEA), Fault Tree Analysis (FTA), Risk Control Option based on HAZID (Hazard Identification) process. The risk of disaster cannot be eliminated, but risk can be reduced by employing better safety detection technique and establishing safety criteria prior to an accident occurrence. This paper describe development of simplified but holistic methodology that determine risk based decision support for reliable design and development of VLFS system, the risk analysis focus on mooring structure failure and reliability through employment of risk tools like FMEA, FTA, RCO and HAZID. The significant of this using risk method for VLFS are (Ayyub, B.M., et al., 2002; Koichiro Yoshida, K.K.-S., 1993):
i.to avoid system failure according recommendation from quantifying and deduction of improvement measures

381 Oladokun et al, 2013 Australian Journal of Basic and Applied Sciences, 7(14) December 2013, Pages: 380-395
ii.Identify inadequate mooring strength due to poor material quality of fatigue in order to determine required
mitigation. iii.Identified excessive environmental forces for example under estimated or freak environmental condition
and determine solution for system additional uncertainty. iv.Predicted incorrectly mooring tension based on the reviews and analysis of the system. v.Perfumed risk and reliability leads to recommend the best safety level integrity of oceanic aquaculture
seaweed plantation for mooring structure to alert the risk and improve reliability of this system.
INTRODUCTION The study involves conduct and determination the risk and reliability analysis that can reduce the
probability of accident risk occurrence and impact in offshore aquaculture system for ocean plantation. Especially mooring structure system integrity and reduction of consequence of failure. The study accesses the risk, system functionality and capability of offshore aquaculture seaweed plantation for mooring structure. The study also estimate the risk in design of mooring structure for deployment of very large floating structure for oceanic aquaculture seaweed plantation and decision recommendation will be offered for level integrity of oceanic aquaculture seaweed plantation for mooring structure.
Algae Cultivation:
Harvesting seaweed from wild population is an ancient practices dating back to the fourth and sixth centuries in Japan and China, respectively, but it was not until the mid-twentieth century that methods for major seaweed cultivation were developed. Seaweed has traditionally been grown in nearshore coastal waters, with some smaller operations on land. Offshore systems which are the focus of this study are an emerging seaweed culture technology. The seaweed extract, (Carrageenan) is an important hydrocolloids product for food additive ingredient and it is highly demanded in the world market. Seaweed is also used for biomass energy production as well as pharmaceutical and medicinal product The demand for seaweed has created huge market for this raw material, especially, the Cottonii seaweed also known as Kappaphycus (Euchema spp). For exemple, under the Malaysian Government NKEA, there is need to produce 1 million tonnes seaweed every year. Unfortunately, currently there is no proper system or platform to deliver this demand (Kaur, C.R., 2009).
The mooring system failure analysis is very important part in the development offshore aquaculture ocean plantation system; risk analysis is required to determine the system function duty and performance. Besides that, there will be increasing demand for concept of floating technology worldwide, so the concept of offshore aquaculture ocean plantation system can be applied for the technology platform required. There is currently no systematic and formal proactive methodology for offshore aquaculture floating structure design. Offshore floating structure is required to be reliable in order to to withstand harsh environment. A risk and reliability studies of offshore aquaculture system for mooring structure will contribute to sustainable development of the seaweed farming industry as well as improvement of technology platform for other aquaculture farming in open seas (Huse, E., 1996; Moan, T., 2004).
Risk And Reliability Analysis:
Risk is defined as an objective, systematic, standardized and defensible method of assessing the likelihood of negative consequences occurring due to a proposed action or activity and the likely magnitude of those consequences, or, simply put; it is “science-based decision-making”. “Risk” is the potential for realization of unwanted, adverse consequences to human life, health, property or the environment. Its estimation involves both the likelihood (probability) of a negative event occurring as the result of a proposed action and the consequences that will result if it does happen. For example, in some sector, “Risk – means the likelihood of the occurrence and the likely magnitude of the consequences of an adverse event to public, aquatic animal or terrestrial animal health in the importing country during a specified time period.” While some sectors incorporate consideration of potential benefits that may result from a “risk” being realized (e.g. financial risk analysis), others specifically exclude benefits from being taken into account. Risk analysis provides answer to the following questions: What can go wrong?, What are the chances that, it will go wrong? And what is the expected consequence if it does go wrong?
Risk is defined as the potential for loss as a result of a system failure, when assessing and evaluating uncertainties associated with an event, it can be measured as a pair of factors, one being the probability of occurrences of an event, also called a failure scenario, and the other being the potential outcome or consequence associated with the event’s occurrence (Ayyub, B.M., et al., 2002). The definition of “risk” varies somewhat depending on the sector. Most definitions incorporate the concepts of:
i. uncertainty of outcome (of an action or situation), ii. probability or likelihood (of an unwanted event occurring), and iii. consequence or impact (if the unwanted event happens).

382 Oladokun et al, 2013 Australian Journal of Basic and Applied Sciences, 7(14) December 2013, Pages: 380-395
Risk assessment is the process used to determine the risk based on the likelihood and impact of an event.
Failure history through experience (qualitative) and data (quantitative) may be used to perform a risk assessment (Huse, E., 1996). Moreover, risk assessment is the determination of quantitative or qualitative value of risk related to a concrete situation and recognized threat.
Risk analysis is concerned with using available data to determine risk posed by safety hazards and usually consists of steps such as scope definition, hazard identification and risk determination. The phase in which the decision process is inundated with metrics and judgments is called the risk evaluation. The purpose of analysis is to determine the contributory causes and circumstances of the accident as a basis for making recommendation, if any, with the aim of preventing similar accidents occurring again. “Risk analysis” is usually defined either by its components and/or its processes. The Society for Risk Analysis www.sera.org offers the following definitions of “risk analysis”:
i.a detailed examination including risk assessment, risk evaluation and risk management alternatives, performed to understand the nature of unwanted, negative consequences to human life, health, property or the environment;
ii.an analytical process to provide information regarding undesirable events; iii.the process of quantification of the probabilities and expected consequences for identified risks.
All risk analysis sectors involve the assessment of risk posed by a threat or “hazard”. The definition of “hazard” depends on the sector and the perspective from which risk is viewed (e.g. risks to aquaculture or risks from aquaculture). A hazard thus can be:
i.a physical agent having the potential to cause harm, for example: a. a biological pathogen (pathogen risk analysis); b. an aquatic organism that is being introduced or transferred (genetic risk analysis, ecological risk
analysis, invasive alien species risk analysis); c. a chemical, heavy metal or biological contaminant (human health and food safety risk analysis,
environmental risk analysis); or ii.the inherent capacity or property of a physical agent or situation to cause adverse effects, as in
iii.social risk analysis, iv.financial risk analysis, and v.environmental risk analysis.
Reliability analysis methods have been proposed in several studies as the primary tool to handle this
category of risks (ISSC2006., 2006). Traditionally, the research and the development of reliability analysis methods have focused on generation and transmission. However, several studies have shown that most of the customer outrages depend on failures at the distribution level (Koichiro Yoshida, K.K.-S., 1993). Furthermore, there is an international tendency towards adopt new performance based tariff regulation methods (Moan, T., 2004). Hence, reliability of a system can be defined as the system’s ability to fulfill its design functions for a specified time. This ability is commonly measured using probabilities. Reliability is, therefore, the probability that the complementary event that will occur will deads to failure. Based on this definition, reliability is one of the components of risk. Safety can be defined as the judgment of a risk’s acceptability for the system safety, making to a component of risk management (Ayyub, B.M., et al., 2002).
Modeling Risk For offshore Aquaculture Seaweed Farming: System Functionality and Standard Analysis:
The analysis starts with system definition where input and output are highlighted. This followed by risk assessment, a risk assessment is the process used to determine the risk based on the likelihood and impact of an event. Failure history through experience (qualitative) and data (quantitative) may be used to perform a risk assessment (Glickman and Gough, 1993). Risk analysis is concerned with using available data to determine risk posed by safety hazards and usually consists of steps such as scope definition, hazard identification and risk determination. The phase in which the decision process is inundated with metrics and judgments is called the risk evaluation. The purpose of analysis is to determine the contributory causes and circumstances of the accident as a basis for making recommendation, if any, with the aim of preventing similar accidents occurring again.
Quantitative and qualitative risk analysis:
Qualitative analysis relies on statistical methods and databases that identify the probability and consequence. This objective approach examines the system in greater detail for risk (Tang, W.H., and R.B. Gilbert, 1993). Quantitative risk analysis generally provides a more uniform understanding among different individuals, but requires quality data for accurate results. Quantitative analysis involve introduction of science, holistic and sustainability approach to analyses and quantify risk. It leads necessary weightage to assist decision

383 Oladokun et al, 2013 Australian Journal of Basic and Applied Sciences, 7(14) December 2013, Pages: 380-395
required for the system in question. There are many methods and technique that have been developed to perform various types of analysis, in areas such as reliability and safety. In order to perform risk assessment and analysis method, this can be determined by quantitative and qualitative risk analysis tools presented in Table 2 below.
Table 1: Quantitative and qualitative risk analysis.
QUALITATIVE METHODS Checklist : Ensures that organizations are complying with standard practice. Safety/Review Audit: Identify equipment conditions or operating procedures that could lead to a casualty or result in property damage or environment impacts. What-If: Identify hazards, hazardous situations, or specific accident events that could lead to undesirable consequences. Hazard and Operability Study (HAZOP): Identify system deviations and their causes that can lead to undesirable consequences and determine recommended actions to reduce the frequency and/or consequences of the deviations. Preliminary Hazard Analysis (PrHA): Identify and prioritize hazards leading to undesirable consequences early in the life of a system. Determine recommended actions to reduce the frequency and/or consequences of prioritized hazards. QUANTITATIVE METHODS Failure Modes and Effects Analysis (FMEA) Identifies the components (equipment) failure modes and the impact on the surrounding components and the system. Fault Tree Analysis (FTA) Identify combinations of equipment failure and human errors that can result in an accident. Event Tree Analysis (ETA) Identify various consequences of events, both failures and successes that can lead to an accident. Frequency Analysis Consequence Analysis ALARP: Possible to demonstrate that the cost involved in reducing the risk further would be grossly disproportionate to the benefit gained. Cost Effectiveness Analysis
Reliability Analysis:
Reliability analysis methods have been proposed in several studies as the primary tool to handle various category of risks (Billinton 2004; Janjic and Popovic 2007). Traditionally, the research and the development of reliability analysis methods have focused on generation and transmission (Kwok 1988). However, several studies have shown that most of the customer outrages depend on failures at the distribution level (Billinton and Allan 1996; Billinton and Sankarakrishnan 1994; Bertling, 2002). Furthermore, there is an international tendency towards adopt new performance based tariff regulation methods (Billinton 2004; Mielczarski 2006; Mielczarski 2005).
Risk Analysis in Maritime Industry:
International Maritime Organization state that, Formal Safety Assessment (FSA) is a structured and systematic methodology, aimed at enhancing maritime safety, including protection of life, health, the marine environment and property, by using risk analysis and cost benefit assessment. FSA can be used as a tool to help in the evaluation of new regulations for maritime safety and protection of the marine environment or in making a comparison between existing and possibly improved regulations, with a view to achieving a balance between the various technical and operational issues, including the human element, and benefit between maritime safety or protection of the marine environment and costs. FSA consists of five steps which are, firstly is identification of hazards that means a list of all relevant accident scenarios with potential causes and outcomes, secondly is assessment of risks means that the evaluation of risk factors, thirdly is risk control options that is devising regulatory measures to control and reduce the identified risks, fourthly is cost benefit assessment which determining cost effectiveness of each risk control option and lastly recommendations for decision-making conclusion from the information about the hazards, their associated risks and the cost effectiveness of alternative risk control options.
The ALARP principle:
ALARP (As Low As Reasonably Practicable), is a used in the analysis of safety-critical and high-integrity systems. The ALARP principle define residual risk that shall be as low as reasonably practicable, it has been used for decision support for Nuclear Safety Justification, is derived from legal requirements in the UK's Health & Safety at Work Act 1974 and is explicitly defined in the Ionising Radiation Regulations, 1999. The ALARP principle is part of a safety culture philosophy and means that a risk is low enough that attempting to make it lower would actually be more costly than cost lkely to come from the risk itself. This is called a tolerable risk. The meaning and value of the ALARP tolerability risk presented in Figure 1 the triangle represents increasing levels of 'risk' for a particular hazardous activity, as we move from the bottom of the triangle towards the top".

384 Oladokun et al, 2013 Australian Journal of Basic and Applied Sciences, 7(14) December 2013, Pages: 380-395
Fig. 1: Levels of Risk and As Low As Is Reasonably Practicable (ALARP)
Offshore Industry Risk Analysis: Traditionally, offshore quantitative risk analyses (QRAs) have had a rather crude analysis of barrier
performance, emphasizing technical aspects related to consequence reducing systems. However, recently the Petroleum Safety Authority Norway (PSA) has been focusing on safety barriers and their performance, both in regulations concerning health, safety and environment (PSA, 2001) and in their supervisory activities. The development of offshore Quantitative Risk Assessment (QRA) has been lead by the mutual influence and interaction between the regulatory authorities for the UK and Norwegian waters as well as the oil companies operating in the work sea. Also, other countries have participated in this development, but to some extent this has often been based on the British and Norwegian initiatives according to DNV Consulting Support, GI 291, Det Norske Veitas AS, 1322 Hovik, Norway.
In more recent times, efforts to protect citizens and natural resources, has make governments to be more involved, requiring corporations to employ risk-reducing measures, secure certain types of insurance and even, in some cases, demonstrate that they can operate with an acceptable level of risk. During the 1980’s and 1990’s, more and more governmental agencies have required industry to apply risk assessment techniques. For instance, the U.S. Environmental Protection Agency requires new facilities to describe “worst case” and “expected” environmental release scenarios as part of the permitting process. Also, the United Kingdom requires submittal of “Safety Cases” which are intended to demonstrate the level of risk associated with each offshore oil and gas production facility (ABS Guidance Notes On Risk Assessment, 2000)
Offshore Rule for Offshore Structure:
The variety of offshore structures concerning the function, size, geometrical configuration and material selection as well as the variability of the environmental factors complicate the development of a unique design procedure (Research Centre Asia Classification Society, 2003). Therefore, the separate investigation of the interaction between the actual structure and the environment is necessary. For mooring system offshore rules (Bureau Veritas, 2010) use reference documents NI 493 “Classfication of Mooring System for Permanent Offshore Units”. The design and specification of mooring structure for offshore aquaculture ocean plantation system must be based on all requirements had listed and mention in NI 493 document.
Safety And Risk of Offshore Aquaculture:
The EC–JRC International Workshop on ‘‘Promotion of Technical Harmonization on Risk-Based Decision Making’’ (Stresa/Ispra, May 2000) investigated the use of risk-based decision making across different industries and countries. Under the UK safety case regulations (UK Health and Safety Executive, 1992), each operator in the UK Sector is required to prepare a Safety Case for each of its installations, fixed or mobile, to demonstrate that [14];
iThe management system adequately covers all statutory requirements. iiThere are proper arrangements for independent audit of the system;
iiiThe risks of major accidents have been identified and assessed; ivMeasures to reduce risks to people to the lowest level reasonably practicable have been taken; vProper systems for emergency arrangements on evacuation, escape and rescue are in place.
Before an installation is allowed to operate, the Safety Case must be formally accepted by the Health and
Safety Executive (HSE).Like any aquaculture industry, offshore aquaculture will benefit from thoughtful site selection. Offshore enterprises should be sited in areas that meet optimal biological criteria for species grow-out

385 Oladokun et al, 2013 Australian Journal of Basic and Applied Sciences, 7(14) December 2013, Pages: 380-395
and minimize user conflicts with other established groups. Careful site selection may also ensure the development of offshore aquaculture zones or parks to expedite industry development.
Failure of Mooring System:
It is clearly identified that mooring systems on Floating Production Systems are category 1 safety critical systems (Noble Denton Europe Limited, 2006). Multiple mooring line failure is required to put lives at risk both on the drifting unit and on surrounding installations. There is also a potential pollution risk. Research to date indicates that there is an imbalance between the critical nature of mooring systems and the attention which they receive. The mooring system failure probability is considerably reduced with increases safety factor in particular for system with several parallel loads sharing element. For system with low overall safety factor, the mooring system failure probability is expected to increase with increasing in number of lines, whereas for high safety factors, the system failure probability is expected to reduce with the increasing number of lines. While for the same load distribution and number of lines, a wire system is in general more reliable than a chain system with the same overall safety factor (Tang, W.H., and R.B. Gilbert, 1993).
Risk analysis is a process that provides a flexible framework within which the risks of adverse consequences resulting from a course of action can be evaluated in a systematic, science-based manner. Risk analysis is now widely applied in many fields that touch human daily lives and activities. These include decisions about risks due to chemical and physical stressors (natural disasters, climate change, contaminants in food and water, pollution etc.), biological stressors (human, plant and animal pathogens; plant and animal pests; invasive species, invasive genetic material), social and economic stressors (unemployment, financial losses, public security, including risk of terrorism), construction and engineering (building safety, fire safety, military applications) and business (project operations, insurance, litigation, credit, cost risk maintenance etc.). Risk analysis has wide applicability to aquaculture. So far, it has mainly been applied in assessing risks to society and the environment posed by hazards created by or associated with aquaculture development depending on aquaculture farming in question. The risks include risks of environmental degradation; introduction and spread of pathogens, pests and invasive species; genetic impacts; unsafe foods; and negative social and economic impacts.
Risk Framework:
The general framework for risk analysis typically consists of four major components: a. Hazard identification – the process of identifying hazards that could potentially produce consequences; b. Risk assessment – the process of evaluating the likelihood that a potential hazard will be realized and
estimating the biological, social, economic, environmental and failure consequences; c. Risk management – the seeking of means to reduce either the likelihood or the consequences of it
going wrong; and d. Risk communication – the process by which stakeholders are consulted, information and opinions
gathered and risk analysis results and management measures communicated. Risk analysis process:
The risk analysis process is a flexible process, Its structure and components vary and depend on the sector (e.g. technical, social or financial), the user (e.g. government, company or individual), the scale (e.g. international, local or entity-level) and the purpose (e.g. to gain understanding of the processes that determine risk or to form the basis for legal measures). It can be qualitative (probabilities of events happening expressed, for example, as high, medium or low) or quantitative (numerical probabilities). General idea of the risk and reliability analysis study of offshore aquaculture ocean plantation system focus on mooring structure of offshore aquaculture systems well as investigation of the problem, goal and objectives, advantage, disadvantage, limitation, design for environment, data reliability. Analysis of historical information from various sources play important role in the outcome of system identification. Flow chart and tables and mathematical governing equation are used to present detail of the process and procedure. The outcome of risk leads to recommendation for system reliability of future work. This study process followed three tier, preliminary system identification, qualitative risk assessment that involve HAZID process and quantitative risk. The process of the approach is more elaborated as followed (Bercha, F.G., et al., 2004; Sulaiman Oladokun Olenwanju, 2012).
i.Preliminary system assessment and involve the review of past work data collection and general requirement for mooring structure. Data of analyses of offshore aquaculture ocean plantation mooring system and structure are collected in order to define system, deduce system risk areas and reliability areas.
ii.(HAZID) Hazard Identification qualitative process involves clarification risk. For risk analysis had two processes which are qualitative analysis and quantitative analysis. Qualitative assessment use HAZOP and checklist, Fault Modes and Effect Analysis (FMEA), Fault Tree Analysis (FTA).

386 Oladokun et al, 2013 Australian Journal of Basic and Applied Sciences, 7(14) December 2013, Pages: 380-395
iii.Quantitative analysis involves Analytical process that employed hybrid of deterministic, statistical,
reliability and probabilistic method to redefine system behavior in the past, present and future. These use of law physics, help to strength the analysis and support the study of the risk and reliability of this system.
iv.In result of each of the tier can lead to risk matrix, ALARP graph, Risk Control Option (RCO) and cost Effectiveness Analysis.
Since the design of VLFS for seaweed farming is required new methodology based on risk, guideline system for solving a problem with specific components such as phases, tasks, methods, technique and tools that are incoroporated are (Irny, S.I. and Rose, A.A, 2005). It can define as follows:
i.“the analysis of the principles of method, rules, and postulates employed by a discipline”, ii.“the systematic study of methods that are, can be, or have been applied within a discipline”,
iii.“the study of description of methods”.
Safety And Environmental Risk Model (Serm): SERM intend to address risk over the entire life of the complex system. SERM address quantitatively
accidents frequency and consequences, as shown in Figure 1. SERM methology adapted from [9] intend to address risk over the entire life of the complex system. SERM address qualitative aspect as well quantitatively accidents frequency and consequences VLFS, as shown in Figure 2.
Fig. 2: SERM
The study divided into 2 main parts. The first part is focused on qualitative analysis. In this part, 3 methods
were using to analyze the system. The 3 methods were Checklist, FMEA, and FTA. Next part is the quantitative analysis stage of performance of the system. In this part, analysis of the probability of failure had done against the consequence. The consequence of environmental load, mooring risk analysis, and risk cost benefit analysis is determined.
Data Analysis:
The raw collection data is obtained from specific places and method. The right sources should be chosen to make sure the data is reliable and valid for the study analysis. Some of the data will be obtained from model test, Meteorology Department, JPS (Jabatan Pengaliran dan Saliran), Offshore Company, Aquaculture Company and last but not least Seaweed Block System “SBS Project” in Setiu, Terengganu and Sabah.

387 Oladokun et al, 2013 Australian Journal of Basic and Applied Sciences, 7(14) December 2013, Pages: 380-395
Qualitative risk assessment and analysis method: Checklist:
This is qualitative approach that to insure the organization are complying with standard practice. The checklist can be used as a preparation for system design, deployment, maintenance and monitoring to avoid unnecessary problems and delays. The checklist included in the International Safety Management (ISM) procedures as documentation about checks for maintenance can be adopted for this study. The list can be filled in manually or printout electronically. Checklist analysis is a systematic evaluation against pre-established criteria in the form of one or more checklists. It is applicable for high-level or detailed-level analysis and is used primarily to provide structure for interviews, documentation reviews and field inspections of the system being analyzed. The technique generates qualitative lists of conformance and non-conformance determinations with recommendations for correcting non-conformances. Checklist analysis is frequently used as a supplement to or integral part of another method especially what-if analysis to address specific requirements. The quality of evaluation is determined primarily by the experience of people creating the checklists and the training of the checklist users (Sade, A., 2006).
Failure Modes and Effect Analysis (FMEA):
A failure modes and effects analysis (FMEA) is a procedure in product development and operations management for analysis of potential failure modes within a system for classification by the severity and likelihood of the failures. A successful FMEA activity helps a team to identify potential failure modes based on past experience with similar products or processes, enabling the team to design those failures out of the system with the minimum of effort and resource expenditure, thereby reducing development time and costs. It is widely used in manufacturing industries in various phases of the product life cycle and is now increasingly finding use in the service industry. Failure modes are any errors or defects in a process, design, or item, especially those that affect the intended function of the product and or process, and can be potential or actual. Effects analysis refers to studying the consequences of those failures. The Figure 3 below shows the Risk Priority Number (RPN) methodology (Stamatis, D.H., 2003).
Fig. 3: Risk Priority Number.
The RPN (Risk Priority Number) is the product of Severity, Occurrence and Detection (RPN = S x O x D),
and is often used to determine the relative risk of a FMEA line item. In the past, RPN has been used to determine when to take action. RPN should not be used this way. RPN is a technique for analyzing the risk associated with potential problems identified during a Failure Mode and Effects Analysis. RPN = Severity Rating x Occurrences Rating x Detection Rating, is the formula used in FMEA.
Fault Tree Analysis (FTA):
Fault tree analysis (FTA) is a top down, deductive failure analysis in which an undesired state of a system is analyzed using boolean logic to combine a series of lower-level events. This analysis method is mainly used in the field of safety engineering and Reliability engineering to determine the probability of a safety accident or a particular system level (functional) failure. In Aerospace the more general term "system Failure Condition" is used for the "undesired state" / Top event of the fault tree. These conditions are classified by the severity of their effects. The most severe conditions require the most extensive fault tree analysis. These "system Failure Conditions" and their classification are often previously determined in the functional Hazard analysis. FTA can be used to:
iUnderstand the logic leading to the top event / undesired state. iiShow compliance with the (input) system safety / reliability requirements.
iiiPrioritize the contributors leading to the top event - Creating the Critical Equipment/Parts/Events lists for different importance measures.

388 Oladokun et al, 2013 Australian Journal of Basic and Applied Sciences, 7(14) December 2013, Pages: 380-395
ivMonitor and control the safety performance of the complex system (e.g. is it still safe to fly an Aircraft if
fuel valve x is not "working"? For how long is it allowed to fly with this valve stuck closed?). vMinimize and optimize resources. Assist in designing a system. The FTA can be used as a design tool that
helps to create (output / lower level) requirements. viFunction as a diagnostic tool to identify and correct causes of the top event. It can help with the creation of
diagnostic manuals / processes. Many different approaches can be used to model a FTA, but the most common and popular way can be
summarized in a few steps. Remember that a fault tree is used to analyze a single fault event and that one and only one event can be analyzed during a single fault tree. Even though the “fault” may vary dramatically, a FTA follows the same procedure for an event, be it a delay of 0.25 msec for the generation of electrical power, or the random, unintended launch of an (Intercontinental Ballistic Missiles) ICBM.
Quantitative risk assessment and analysis method:
A mooring device is failed when the mooring reaction force W, due to oscillation of the floating structure, exceeds the yield strength R. The floating structure drifts when all its mooring devices are failed. Failure of a mooring device indicates presence of an event satisfying the following condition:
Zk (t) = Wk (t; X) > 0 0 ≤ t ≤ T
where X is natural condition parameters, T duration of the natural condition parameters, and Rk the random
variable for the final yield strength of mooring device k, X and Rk are independent of each other. The total reliability for years of service life is approximated by the following equation:
RN (T) = (1- Pf (T)) N
Failure probability for oscillation of the floating structure is
where X: displacement vector of horizontal plane response of the floating structure; Mij :inertia matrix of
the floating structure; mij (∞): added mass matrix at the infinite frequency; Fv: viscous damping coefficient vector; Lij : Memory influence function; FM: Mooring reaction force vector; Fcurrent : current load vector, F1 and F2: first and second current force vectors respectively. Estimation of wave force vector is generally expressed as the sum of linear wave force proportional to wave height and the slowly varying drift force proportional to the square of the wave height. See the equation below.
F (t) = F1 (t) + F2 (t) = ⨜ h1 (𝜏𝜏) Ϛ (t – 𝜏𝜏) d𝜏𝜏 + ∬ h2 (𝜏𝜏1, 𝜏𝜏2) Ϛ (t – 𝜏𝜏1) Ϛ (t – 𝜏𝜏2) d𝜏𝜏1 d𝜏𝜏2 Where h1 (𝜏𝜏) h2 (𝜏𝜏1, 𝜏𝜏2) are the vectors of impulse response function of wave force. ζ (t) is the time series of
surface elevation of incident waves. Current are considered the dominant impact factor to algae cultivation offshore, Static loads due current are separated into longitudinal load, lateral load. Flow mechanisms which influence these loads include main rope drag, main buoy drag, seaweed drag, and planting lines drag. The general equation used to determine lateral and longitudinal current load are:
Floating structure and the pressure drag for the lateral walls. Average wind velocity distribution on the
horizontal plane is assumed uniform. The velocity profile in the perpendicular direction expressed using the logarithmic rule. For the fluctuating wind velocity, the mainstream direction (average wind velocity direction) is the sole element of consideration (Li, Y. and A. Kareem, 1993).
Assessment of Functional And Serviceability:
Modern safety criteria for marine structures are expressed by limit states as indicate in the Table 2 below and are briefly outlined in the following. This will be applied to stages of risk and reliability assessment and analyzing the system required.

389 Oladokun et al, 2013 Australian Journal of Basic and Applied Sciences, 7(14) December 2013, Pages: 380-395
Table 2: Safety Criteria (e.g. ISO 19900 1994, Moan 2004)
Limit State Description Remarks Ultimate (ULS) • Overall structure stability.
• Ultimate strength of structure. • Ultimate strength of mooring system.
(Not relevant for VLFS) Component design check
Fatigue • Failure of joint-normal welded joins in hull and mooring system.
Component design check depending on residual system strength after fatigue failure.
Accidental collapse (ALS) • Ultimate capacity of damaged structure (due to fabrication defects or accident loads) or operational error.
System design check
Serviceability (SLS) • Structure fails its serviceability if the criteria of the (SLS) are not met during the specified service life and with the required reliability
Disruption of normal use due to excessive deflection, deformation, motion or vibration.
The analysis on quantitative analysis is progress; the analysis is done to obtain probability of exceedance, system and mooring reaction relative to annual maximum current velocity, extreme wave return period, maximum mooring force and strength while the reliability will determined the mean current, conditional probability of failure and eventual determination of variation of failure probability and acceptable number of mooring required for the system (Snell, R., et al., 1999).
Cost Analysis:
Risk control measures are used to group risk into a limited number of well practical regulatory and capability options. Risk Control Option (RCO) aimed to achieve (David, 1996):
i. Preventive: reduce probability of occurrence ii. Mitigation: reduce severity of consequence Total cost = present value of future cost + Cost of protective measure (Cc) = Co +Cc The cost effective risk reduction measures should be sought in all areas. It is represented by followed: Acceptable quotient = Benefit/ (Risk /Cost)
RESULT AND DISCUSSION
Preliminary hazard analysis: Risk analysis is less commonly used to achieve successful and sustainable aquaculture by assessing the
risks to aquaculture posed by the physical, social and economic environment in which it takes place. Table in appendix provide general risk for aquaculture, this include environmental risks (e.g. due to poor siting or severe weather events), biological risks (infection by pathogens via transfer from native stocks, predation by seals and sharks; red tides etc.), operational risks (poor planning, work-related injuries), financial risks (e.g. market changes, currency fluctuations, emergence of new competitors, etc.) and social risks (negative image and resulting product boycott, lack of skilled manpower, competition from other sectors). Table given in the appendix represent result of preliminary hazard analysis whose matrix is given in Figure.
Checklist: Checklist:
The Figure 4a and Figure 4b show the score of likehood which revealed the aspect of potential failure mode for the system, the checklist is divided by two, and where risk to the system and risk from the system to outside were is conducted.
Fig. 4a: Histogram graph score for likelihood risk to the system

390 Oladokun et al, 2013 Australian Journal of Basic and Applied Sciences, 7(14) December 2013, Pages: 380-395
The histogram graph on risk to the system shows that the potential failure modes anchor and mooring
system, environment and design scores the highest marks, 9. Whereas, buoy, cost and location scores 8 marks compare to planting line, human, and operation scores 7 marks. In addition, frame and boundary scores 6 marks followed by connector, floating platform, GHG and manual scores 3 marks, besides, seaweed scores 2 marks only and natural disaster and pollution only score 1 mark.
Fig. 4b: Histogram graph score for likelihood risk from the system to outside
The histogram graph risk from the system to outside shows that the potential failure modes anchor passing
vessels/navigations scores the highest marks, 7. Nevertheless, ecology and health scores 8 marks compare to human scores 7 marks. This highlight that, the priority which failure must be concern more and at critical stage for risk from the system to outside. That conclude risk to system is higher than risk from the system to outside. The high modes potential of failure was environment, design, anchor and mooring system, cost, location and as well as buoy. They highlight the need of area if risk to research at the critical stage and need to get more attention.
Fault Mode and Effects Analysis (FMEA):
According to FMEA analysis the top potential modes for this system after we define are anchor and mooring system, environment, design, cost, buoy and location. For anchor and mooring system requirement, the severity almost reaches the highest mark which is 9 marks, but for occurrence and detection they are 8 and 7 marks respectively. That brings 504 Risk Priority Numbers.
According to FMEA analysis the top potential failure modes for this system after we define are anchor and mooring system, environment, design, cost, buoy and location. For anchor and mooring system requirement, the severity almost reaches the highest mark which is 9 marks, but for occurrence and detection they are 8 and 7 marks respectively. That result to 504 Risk Priority Numbers.
For environment requirement, like wave, wind, current, and seabed the severity number is 9 marks same with detection and the occurrence is 8 marks. Hence, the RPN is 648. Furthermore, for design requirement for example the inappropriate design, configuration, structure integrity make the severity number is 9 marks share the marks with detection while occurrence is 8 marks, from that, the RPN is 648 same with environment. Moreover, the costs also contribute the biggest potential modes for this system like system deployment. The severity number for the cost is 9 marks, the occurrence is 8 marks and the detection is 7 marks, that make the RPN is 504. Besides that, buoy and location requirements are also very important. For buoy like corner buoy and intermediate buoy make the severity number is 8, the occurrence number is 7 and detection number is also 8 marks. So the RPN is 448.
Meanwhile, the selection for the location is playing the strong point. For the severity it achieves 8 marks same with occurrence, and the detection is 7 marks. From that, the RPN is 448. There are also, potential failure modes failure for example frame and boundary, connector, planting line, floating platform, natural disaster, pollution, seaweed, human, manual, operation, ecology, passing vessel or navigations and health. But, they only score medium and low marks for severity, occurrence and detection. As summarize, the most potential modes failure are environment and design. While anchor and mooring system with cost are below them and followed by location and buoy. From this deduced observation the quantitative analysis focus more on environment, cost and mooring system.

391 Oladokun et al, 2013 Australian Journal of Basic and Applied Sciences, 7(14) December 2013, Pages: 380-395
Fig. 5: Histogram graph comparision of Risk Priority Number Revised Risk Priority Number
The histogram graph Risk Priority Number versus Revised Risk Priority Number shows result of the
comparison between these two numbers and the difference before revised and after revised. The figure that shows before and after revised, the highest failure modes score, 648 in RPN were environment and design score 180 and 150 respectively after revised. Furthermore, for anchor and mooring system score 504 after revised score 100, for cost and location from RPN score 448, after revised reduced until 120and 150 respectively.
For environment requirement, like wave, wind, current, and seabed the severity number is 9 marks same with detection and the occurrence is 8 marks. So, the RPN is 648. Furthermore, for design requirement for example the inappropriate design, configuration, structure integrity make the severity number is 9 marks share the marks with detection while occurrence is 8 marks, from that, the RPN is 648 same with environment. Moreover, the costs also contribute the biggest potential modes for this system like system deployment. The severity number for the cost is 9 marks, the occurrence is 8 marks and the detection is 7 marks, that make the RPN is 504. Besides that, for buoy and location requirements are also very important. For buoy like corner buoy and intermediate buoy make the severity number is 8, the occurrence number is 7 and detection number is also 8 marks. So the RPN is 448. Meanwhile, the selection for the location is playing the strong point. For the severity it achieves 8 marks same with occurrence, and the detection is 7 marks. From that, the RPN is 448. There are also having another potential modes failure for example frame and boundary, connector, planting line, floating platform, natural disaster, pollution, seaweed, human, manual, operation, ecology, passing vessel or navigations and health. But, they only score medium and low marks for severity, occurrence and detection. As summarize, the most potential modes failure are environment and design. While anchor and mooring system with cost below them and followed by location and buoy. From that, in quantitative analysis we focus more on environment, cost and mooring system. Table 5 show risk matrix for likelihood (from checklist) and severity (FMEA).
Table 5: Risk Matrix Risk Rating = Likelihood x Severity
Risk Rating Severity (FMEA) 1 2 3 4 5 6 7 8 9 10
Like
lihoo
d(C
hekl
ist)
10 10 20 30 40 50 60 70 80 90 100 9 9 18 27 36 45 54 63 72 81 90 8 8 16 24 32 40 48 56 64 72 80 7 7 14 21 28 35 42 49 56 63 70 6 6 12 18 24 30 36 42 48 54 60 5 5 10 15 20 25 30 35 40 45 50 4 4 8 12 16 20 24 28 32 36 40 3 3 6 9 12 15 18 21 24 27 30 2 2 4 6 8 10 12 14 16 18 20 1 1 2 3 4 5 6 7 8 9 10
Likelihood*Severity 0-2 Zero to very low 0-2 No injury or illness 3-4 Very unlikely 3-4 First aid injury or illness 5-6 Unlikely 5-6 Minor injury or illness 7-8 Likely 7-8“Three day” injury or illness 9-10 Very Likely 9-10 Major injury or illness Score Action to be taken 0-16 No further action needed. 20-36 Appropriate additional control measures should be implemented 42-100 Work should not be started or should cease until appropriate additional control measures are implemented

392 Oladokun et al, 2013 Australian Journal of Basic and Applied Sciences, 7(14) December 2013, Pages: 380-395
Fault Tree Analysis (FTA):
The resulting fault tree diagram is a graphical representation of the chain of events in the system or process, built using events and logical gate configurations.
MSF = MLB AF AHF ACF = MLB + AF + AHF + ACF Minimal cut expression for the top event
Fig. 4: FTA
MSF = MLB AF AHF ACF = MLB + AF + AHF + ACF Minimal cut expression for the top event T = C1 + C2 +C3 +.....+ CN T = CAF + CMLB + CACF +CAHF
= 0.0457015 + 0.0450327 + 0.0438 + 0.0132 = 0.1480042 per year.
Fig. 6: Fault three analysis summary

393 Oladokun et al, 2013 Australian Journal of Basic and Applied Sciences, 7(14) December 2013, Pages: 380-395
From the calculation of minimal cut set it is found that the probability of top event mooring system failure
is 0.1480042 per year, in terms of frequency index it is classified as reasonably probable. The graph shows the most critical event in mooring system failure is due to anchor failure (AF) with the probability 0.0457015 per year. The second critical event is mooring line break (MLB) 0.0453027 per year, followed by appurtenances connection failure (ACF) 0.0438 per year, and anchor handling failure with probability (AHF) 0.0132 per year. Environmental Load:
The Figure 7 obliviously shows that, when the current velocity was increases, the current drag force also increases. That represent the current velocity is one of the biggest factors that control the current drag force.
Fig. 7: Current drag force
Figure 8 below show the lateral current drag coefficient compared with longitudinal current drag
coefficient. The figure shows clearly that, the lateral current drag coefficient was more higher than longitudinal current drag coefficient. This is becauses the lateral direction is more exposed and at critical stage compared to longitudinal direction.
Fig. 8: Lateral and longitudinal current drag coefficient
Figure 9 shows that the drag current coefficient of tow two lines transverse across the basin is more higher
than another four test case. Furthermore, for tow one line, tow one line transverse across the basin has more drag current coefficient compared to tow one line diagonally across the basin.
Fig. 9: Drag current coefficient at the tow test
394 Oladokun et al, 2013 Australian Journal of Basic and Applied Sciences, 7(14) December 2013, Pages: 380-395
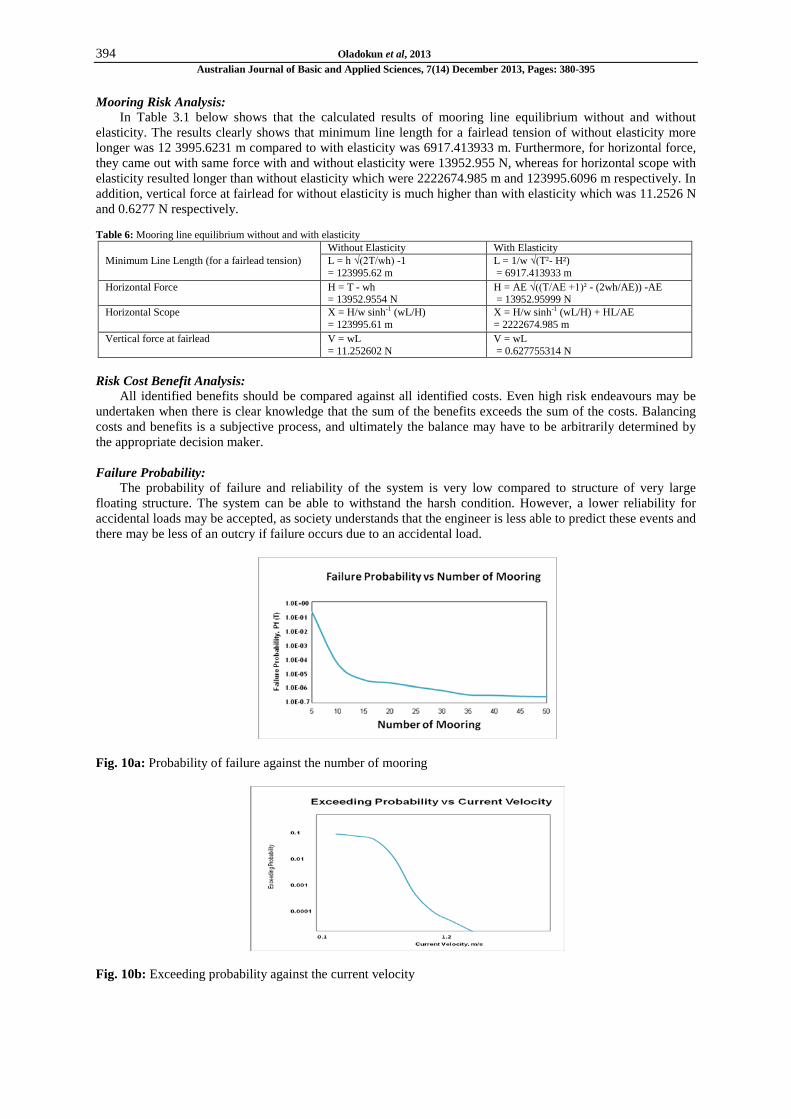
Mooring Risk Analysis:
In Table 3.1 below shows that the calculated results of mooring line equilibrium without and without elasticity. The results clearly shows that minimum line length for a fairlead tension of without elasticity more longer was 12 3995.6231 m compared to with elasticity was 6917.413933 m. Furthermore, for horizontal force, they came out with same force with and without elasticity were 13952.955 N, whereas for horizontal scope with elasticity resulted longer than without elasticity which were 2222674.985 m and 123995.6096 m respectively. In addition, vertical force at fairlead for without elasticity is much higher than with elasticity which was 11.2526 N and 0.6277 N respectively.
Table 6: Mooring line equilibrium without and with elasticity
Without Elasticity With Elasticity
Minimum Line Length (for a fairlead tension) L = h √(2T/wh) -1 L = 1/w √(T²- H²)
= 123995.62 m = 6917.413933 m
Horizontal Force H = T - wh H = AE √((T/AE +1)² - (2wh/AE)) -AE
= 13952.9554 N = 13952.95999 N
Horizontal Scope X = H/w sinh-1 (wL/H) X = H/w sinh-1 (wL/H) + HL/AE
= 123995.61 m = 2222674.985 m
Vertical force at fairlead V = wL V = wL
= 11.252602 N = 0.627755314 N
Risk Cost Benefit Analysis:
All identified benefits should be compared against all identified costs. Even high risk endeavours may be undertaken when there is clear knowledge that the sum of the benefits exceeds the sum of the costs. Balancing costs and benefits is a subjective process, and ultimately the balance may have to be arbitrarily determined by the appropriate decision maker.
Failure Probability:
The probability of failure and reliability of the system is very low compared to structure of very large floating structure. The system can be able to withstand the harsh condition. However, a lower reliability for accidental loads may be accepted, as society understands that the engineer is less able to predict these events and there may be less of an outcry if failure occurs due to an accidental load.
Fig. 10a: Probability of failure against the number of mooring
Fig. 10b: Exceeding probability against the current velocity

395 Oladokun et al, 2013 Australian Journal of Basic and Applied Sciences, 7(14) December 2013, Pages: 380-395
Conclusion:
An integrated approach to risk analysis will assist the aquaculture sector in reducing risks to successful operations from both internal and external hazards and can similarly help to protect the environment, society and other resource users from adverse and often unpredicted impacts. This could lead to improved profitability and sustainability of the sector, while at the same time improving the public’s perception of aquaculture as a responsible, sustainable and environmentally friendly activity. There exists, considerable scope to develop and expand the use of risk analysis for the benefit of aquaculture and the social and physical environments in which it takes place. Design based on risk continue to be a best practice in many industry such as offshore, nuclear, airline, power plant and others where occurrence of accident is unacceptable. Offshore platform design has been successful because of risk approach to design. The maritime industry has adopted risk based design for reliability of marine system in order avoids accident that can lead to Loss of life Loss of property, Loss of money and Destruction of environment. The result of quantitative risk will be provided in other paper. The quantitative risk analyze the risk, system functionality and capability of offshore aquaculture for seaweed plantation for mooring structure and also estimate the risk in design mooring structure and deployment of very large floating structure for oceanic aquaculture seaweed plantation.
REFERENCES
Ayyub, B.M., J.E. Beach, S. Sarkani, I.A. Assakkaf, 2002. Risk Analysis anad Management for Marine
System. Naval Engineers Journal, 114(2): 181-206. Huse, E., 1996. Workshop on Model Testing of Deep Sea Offshore Structures. ITTC1996, 21st
International Towing Tank Conference (pp. 161-174). Trondheim, Norway,: NTNU, Norwegian University of Science and Technology.
ISSC2006., 2006. ISSC Commitee VI.2 "Very large Floating Structures". 16th International Ship & Offshore Structures Congress 2, (pp. 391-442). Southampton, UK.
Koichiro Yoshida, K.K.-S., 1993. Model Tests on Multi-Unit Floating Structures In Waves. (N. Saxena, Ed.) Recent Advances In Marine Science and Technology, 92: 317-332.
Moan, T., 2004. “Safety of floating offshore structures” Proc. 9th PRADS Conference, Keynote lecture, PRADS Conference, Luebeck-Travemuende, Germany, pp: 12-17.
Tang, W.H., and R.B. Gilbert, 1993. "Case study of offshore pile system reliability." Proceedings of Annual Offshore Technology Conference, OTC 7196, Houston, TX, USA, pp: 677-683.
Bercha, F.G., M. Cervosek and W. Abel, 2004. Assessment of the Reliability of Marine Installation Escape, Evacuation, and Rescue Systems and Procedures, in Proceedings of the 14th International offshore and Polar Engineering Conference (ISOPE), Toulon, France.
Sade, A., 2006. "Seaweed Industri in Sabah, East Malaysia". In A. T. Phang Siew-Moi, Advances In Seaweed Cultivation And Utilization In Asia (pp. 41-52). Kota Kinabalu, Sabah: University of Malaya Maritime Research Centre.
Sulaiman Oladokun Olenwanju, 2012. “Safety and Environmental Risk Model for Inland Water Transportation”. University Technology Malaysia.
Stamatis, D.H., 2003. Failure Mode and Effect Analysis: FMEA from Theory to Excecution, 2nd Ed. United States of American Society for Quality.
Li, Y. and A. Kareem, 1993. Multivariate Hermite expansion of hydrodynamic drag loads on tension leg platforms. J. Engrg. Mech. ASCE, 119(1): 91-112.
Snell, R., R.B. Ahilan and T. Versavel, 1999. "Reliability of Mooring Systems: Application to Polyester Moorings," Proceedings of Annual Offshore Technology Conference, OTC 10777, Houston, TX, USA, 125-130.
Dessi, D., A.G., 2004. Experiment and Numerical Analysis of a Moored Floating Strucuture Response to Waves. Retrieved April 2012, from International Workshop on Water Waves and Floating Bodies: http://www.iwwwfb.org/Abstracts/iwwwfb19/iwwwfb19_10.pdf
Kaur, C.R., 2009. Developing Malaysia's Seaweed Aquaculture Sector. Retrieved November 1, 2011, from BairdMaritime: http://www.bairdmaritime.com Watanabe, E., C.W., 2004. Very Large Floating Structures: Application, Analysis & Design. Singapore:
Centre for Offshore Research and Engineering National University of Singapore.