50,000 tree plantation
392
* {IT$ar gft[q o]"l"fu-Gq ftrBts South Eastern Coalfields Limited (d-d glYqT ol yia eTcr/A Subsidiary Of Coal lndia Ltd) orsfdrr:- q-ilqqsrfi. -qtlhf,r Se OFFICE OF THE GENERAL MANAGER, DIPKA AREA P.O.: Dipka, Distt.: Korba (CC)-495452 Tel : 07815-23901 7 j763300,26?3OL Fax:07 gISZSgOOz e-mail: gmdpk.secl@coalindia"in Trqim: \rw.t.m.qmlfr.* .frqf.nozl t 2 Z f, 7 ftqiff, zt .6s'.zo2i q'h, Additional I']rincrpal Chief Conservator of Irorcsts, IIrS [Central), Ministry of Ilnvironmcnt, ljorcsl and Climatc Changr:, Regronal Office (W C7.), Ground Irloor, l.)ast Wing, Ncw Secri:tariat Iluilding Civil Lincs, Nagpur-44000 1 E - m a i I : ap-eefc_qrlral_t:gp:[email protected] Bqq:Submission of six monlhly (Ocl 202}-March 2021) IIC compliance report of Dipka I.)xpansion Projcct, Dipka Area, SIICL. rglEq, Please find enclosed hcrcwith the six monthly [Oct 2020-March 2021) EC compliance rcport of Dipka Iixpansion Projcct, Dipka Area, SIjCL.'i.his is for your kincl information plcase. rFIltC-f(, fl.{sl }f{flq, !ftftfi: 1, tres qf?-q, oqqf s q, {qg{ : ?qqr qrrmt-fr tg r 2. q-6lq"ir6, dqot Sz , g.rcr qrq-flfl tg r 3, qoq"irf,rqqD qi€Sqd Rmvgt , FlqT qr.rml-fr t-g r 4. &]fiq r{M, irqC$ q, mtlqTr s. qtsd qfUsr8, frcror at r i
-
Upload
khangminh22 -
Category
Documents
-
view
1 -
download
0
Transcript of 50,000 tree plantation
*{IT$ar gft[q o]"l"fu-Gq ftrBts
South Eastern Coalfields Limited(d-d glYqT ol yia eTcr/A Subsidiary Of Coal lndia Ltd)
orsfdrr:- q-ilqqsrfi. -qtlhf,r SeOFFICE OF THE GENERAL MANAGER, DIPKA AREA
P.O.: Dipka, Distt.: Korba (CC)-495452
Tel : 07815-23901 7 j763300,26?3OL Fax:07 gISZSgOOz
e-mail: gmdpk.secl@coalindia"in
Trqim: \rw.t.m.qmlfr.* .frqf.nozl t 2 Z f, 7 ftqiff, zt .6s'.zo2i
q'h,
Additional I']rincrpal Chief Conservator of Irorcsts, IIrS [Central),Ministry of Ilnvironmcnt, ljorcsl and Climatc Changr:,Regronal Office (W C7.),
Ground Irloor, l.)ast Wing,Ncw Secri:tariat Iluilding Civil Lincs,Nagpur-44000 1
E - m a i I : ap-eefc_qrlral_t:gp:[email protected]
Bqq:Submission of six monlhly (Ocl 202}-March 2021) IIC compliance report of Dipka
I.)xpansion Projcct, Dipka Area, SIICL.
rglEq,
Please find enclosed hcrcwith the six monthly [Oct 2020-March 2021) EC
compliance rcport of Dipka Iixpansion Projcct, Dipka Area, SIjCL.'i.his is for your kinclinformation plcase.
rFIltC-f(,
fl.{sl
}f{flq,
!ftftfi:1, tres qf?-q, oqqf s q, {qg{ : ?qqr qrrmt-fr tg r
2. q-6lq"ir6, dqot Sz , g.rcr qrq-flfl tg r
3, qoq"irf,rqqD qi€Sqd Rmvgt , FlqT qr.rml-fr t-g r
4. &]fiq r{M, irqC$ q, mtlqTr
s. qtsd qfUsr8, frcror at r
i
SOUTH EASTERN COALFIELDS LIMITED
(A MrNr RATNA COMPANY)
Br LASPU R (CH HATTTSGARH)
DIPKA OC PROJECT
SIX MONTHLY REPORT OF MONITORING THE IMPLEMENTATION OF ENVIRONMENT SAFE
GUARDS FOR THE PERIOD OF OCTOBER 2O2O TO MARCH 2021
&
COMPLIANCE STATUS OF THE CONDITIONS IMPOSED IN THE EC LETTER ISSUED VIDE LETTER
NO. J 1101s /48712OO7-rA.il(M)PT DT.20.02.2018, 20.03.2019 & 09.03.2020 FOR EXPANSION
OF DIPKA OPENCAST COAL MINE FROM 31 MTPA TO 35 MTPAi
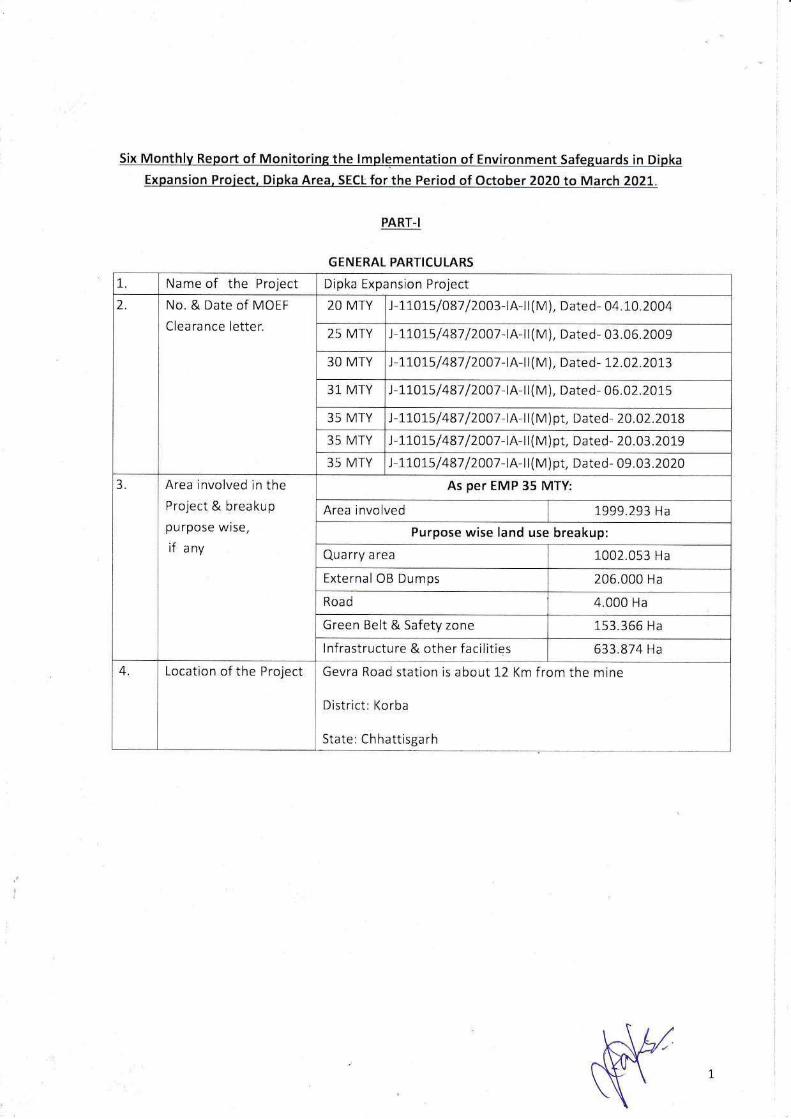
Six Monthlv Report of Monitoring the Implementation of Environment Safeguards in Dipka
Expansion Proiect. ka Area, SECL for the Period of October 2020 to March 2021.
PART.I
GENERAL PARTICULARS
1. Name of the Project Dipka Expanslon Project
2. No. & Date of MOEF
Clearance letter.
20 MTY J - 1 101s/087 / 2oo3-t A-tl ( M ), Dated - 04.1A.2a04
25 MTY )-1,L01s / 487 / 2oo1 -t A-tt ( M ), Date d - 03. 06. 2009
30 MTY J -11.A$ / 487 / zoot -l A ll ( VI ), D ate d - 12.02.2013
31 MTY J-1"101s / 487 / 2oo7 -t A-ll ( M ), Date d- 06. 02. 20 1 5
35 MTY J - 1,1.015 / 487 / 2Oo7 -t A-tl ( M ) pt, D a te d - 20 .02.2018
35 MTY J - I1.OL5 / 487 / 2OO7 -l A-ll ( M ) pt, D a te d - 20 .03 .2019
35 IV]TY )-L1.0t5 / 487 / 2AO7 -l A-ll ( M ) pt, Date d- 09. 03. 2020
3 Area involved in the
Project & breakup
purpose wise,
if any
As per EMP 35 MTY:
Area involved 1999.293 Ha
Purpose wise land use breakup
Qua rry a rea 1002.053 Ha
ExternalOB Dumps 206.000 Ha
Road 4.000 Ha
Green Belt & Safety zone 153.366 Ha
Infrastructure & other facilities 633.874 Ha
4 Location of the Project Gevra Road statlon is about l-2 Km from the mine
District: Korba
State:Chhattisgarh
i
1
PART-II
PROJECT STATUS
i
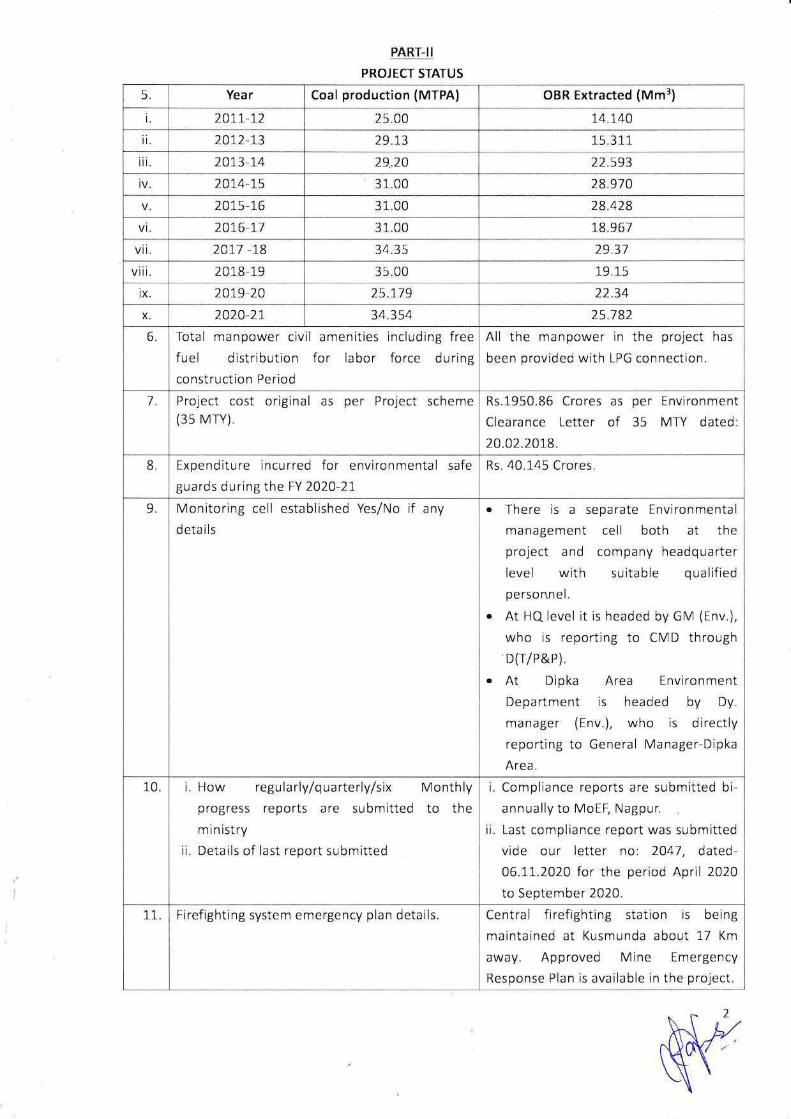
5 Year Coal production (MTPA) OBR Extracted (Mm3)
i 201.1-12 2:1.00 14.140
ii 2012 1.) 29.13 15 " 311
2013-14 29.20 22.593
iv 20]-4-15 31.00 28.9t0
2015-16 31 .00 28.428
VI 2016 17 31 .00 18.967
vii 2017 18 34.31; 29.31
viii. 201U 19 3 5.00 19.15
ix 201.9-20 25.Lt9 22.34
X 2020 21 34.354 25.182
6 lotal manpower civil amenities including free
fuel distribution for labor force during
construction Period
All the manpower in the project has
been provided with LPG connection.
7 Prolect cost orrginal as per Project scheme
(35 M rY)
Its.1950.86 Crores as per Environment
Clearance Letter of 35 MTY dated:
20.o2.201.8.
8 Expenditure incurred for environmental safe
guards during the FY 2O2O-21
Rs. 40.1-45 Crores.
9 IVlonitoring cell establrshed Yes/No if any
details
. There is a separate Environmental
management cell both at the
project and company headquarter
level with surtable qualified
person,nel.
r At FIQ level it is headed by Glvl (Env.),
who is reporting to CMD through
D(r/P&P).
o At Dipka Area Environment
Department is headed by Dy.
manager (Env.), who is directly
reporting to General Manager Dipka
Area.
10. i. l-1ow regularly/quarterly/six IVlonthly
progress reports are submitted to the
ministry
ii. Details of last report submitted
i. Compliance reports are submitted bi-
annually to IVoEF, Nagpur.
ii. Last compliance report was submitted
vide our letter no: 2041 , dated
06.1-1-.2020 for the period April 2020
to Septemb er 2O2O-
11. Firefighting system emergency plan details Central firefighting station is being
maintained at Kusmunda about 17 Knl
away. Approved Mine Emergency
Response Plan is available in the project.
2
iii.
PART-III
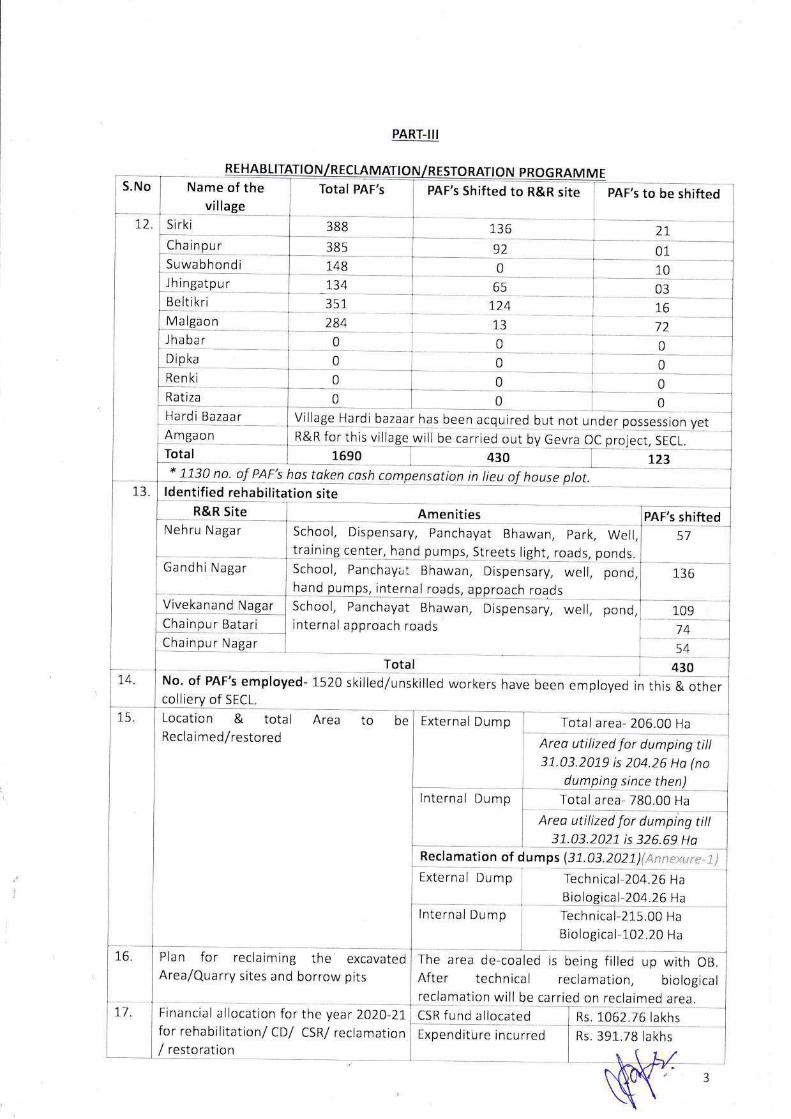
LITATI RATI ROGRAMS.No Name of the
villageTotal PAF's PAF's to be shifted
Sirki 388
PAF's Shifted to R&R site
136 21Cha in pu r 385 92 01Suwabhondi 148 0 10
03
Ma on
Jhin t
Be ltikri
284
134
3s1 161')
Jhabar0
Dipka
U
0
65
0
13
0
L24
0Renki 0 0 0
uired but not underVilla Hardi bazaar has been a
Am on ect, SECL.will be car ried out by Gevra OC pro
of*
1 013 no. hPAF,S os token hCAS en onsati lieutncomp .shou. e
ession yet
Ratiza t.) 0 0Hardi Bazaar
R&R for this villTotal 1690 430 723
ldentified rehabilitation site
L2
13
14
15
School, Dispensary, Panchayat Bhawan, park,
School, Panchaya,- Bhawan, Dispensary, well,
School, Panchayat Bhawan, Dispensary, well, pond,internal approach roads
employed- 1520 skilled/unskilled workers have beencL.
Reclamation of dumps (3 1. 03. 2O2 1 ),' t, :. :, ;,,
Gandhi Nagar 136
Total
r
No. of PAF's
colliery of SE
employed in this & other
, Streets light, roadhand pumtrainin center
approach roadsha nd um , internal roads
Chainpur Na r
External Dump
Bio ic:al-204.26 lla
R&R Site
Nehru Nagar
Amenities PAF's shifted
5lWell,
pond,
nds
Vivekanand N
Chainpur Batari109
430
l454
Total area- 206.00 Ha
nq since then
lnternal Dump Total area- 780.00 Ha
lechnical-204.26 HaExternal Dunrp
lnternal Dunrp
Location & total Area to be
Recla imed/restoredArea utilized t'or dumping till31.03.2019 is 204.26 t-ta (no
Areo utilized for dumping till31,.03.2021 is 326.69 Ho
lech n ica l-21 5.00 lla
16 -T-he area de-coaled is being filled up with OB.
After ter:hnical reclarnation, biological
reclamation will be r:arried on reclaimed area.
CStt fund allocated lis. 1062.76 lakhs1l
Plan for reclaiming the excavated
Area/Quarry sites and borrow pits
Financ.ial allocation for the year 2020-21
for rehabilitation/ CD/ CSR/ reclamation
/ restorationExpenditure incurred Ils.391.711 lakhs
\(L/3
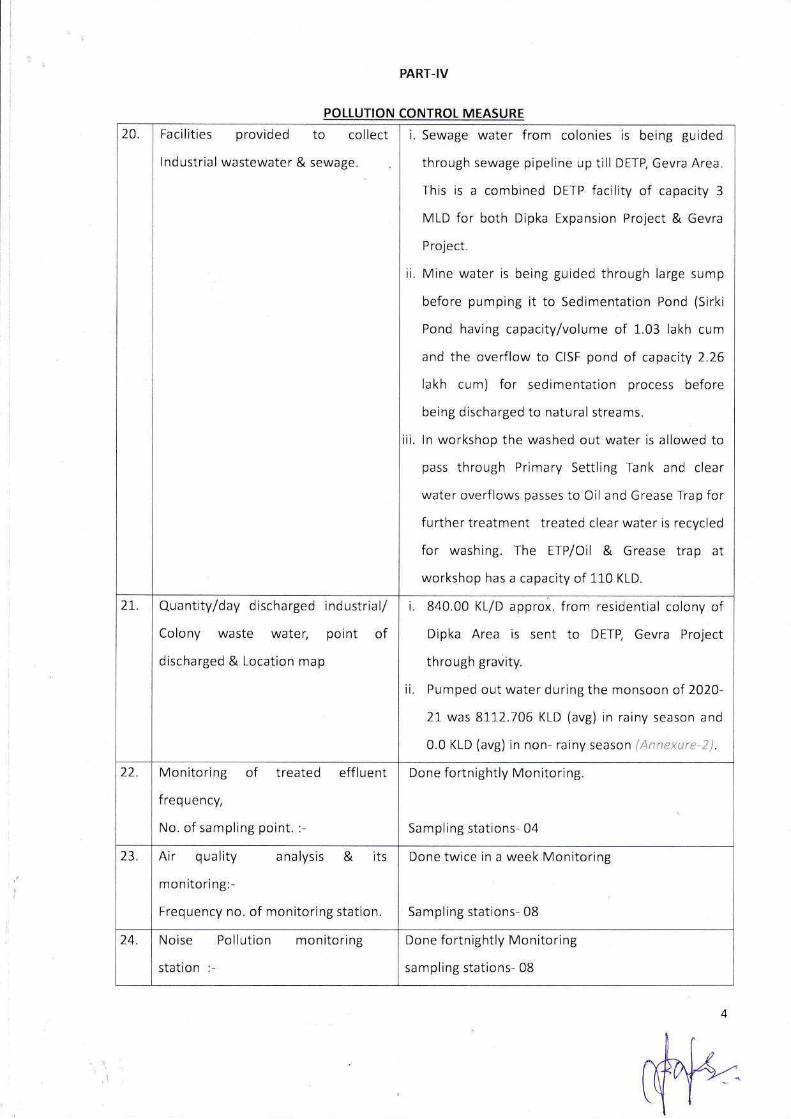
PART-IV
POLLUTTON CONTROL MEASURE
t
20. Facilities provided to collect
lndustrial wastewater & sewage.
i. Sewage water from colonies is being guided
through sewage pipeline up till DETP, Gevra Area.
lhls is a combined DETP facility of capacity 3
MLD for both Dipka Expansion Project & Gevra
Drniart, ,utLLr.
ii. Mine water is being gurded through large sump
before pumping it to Sedimentation Pond (Sirki
Pond having capacity/volume of 1.03 lakh cum
and the overflow to CISF pond of capacrty 2.26
Iakh cum) for sedimentation process before
being discharged to natural streams.
lii. ln workshop the washed out water is allowed to
pass through Prrmary Settling Tank and clear
water overflows passes to Oiland Grease Trap for
further treatment treated clear water is recycled
for washing. The ETP/Oil & Grease trap at
workshop has a capacity of 110 KLD.
21. Quantity/day discharged industrlal/
Colony waste water, point of
discharged & Locatron map
i. 840.00 KL/D approx. from residential colony of
Dipka Area is sent to DETP, Gevra Project
through gravity.
ii. Pumped out water during the monsoon of 2020-
21 was 81-1.2.7OG KLD (avg) in rainy season and
0.0 KLD (avg) in non- rainy season r:::':r':.':.' ,: .
22 Monitoring of treated effluent
frequency,
No. of sampling point. :-
Done fortnightly Monitoring.
Sampling stations- 04
23 Air quality analysis & its
mon itoring:-
Frequency no. of monitoring station.
Done twice in a week Monitoring
Sampling stations- 08
24. Noise Pollution monitoring
station:-
Done fortnightly Monitoring
sampling stations- 08
t
4
i
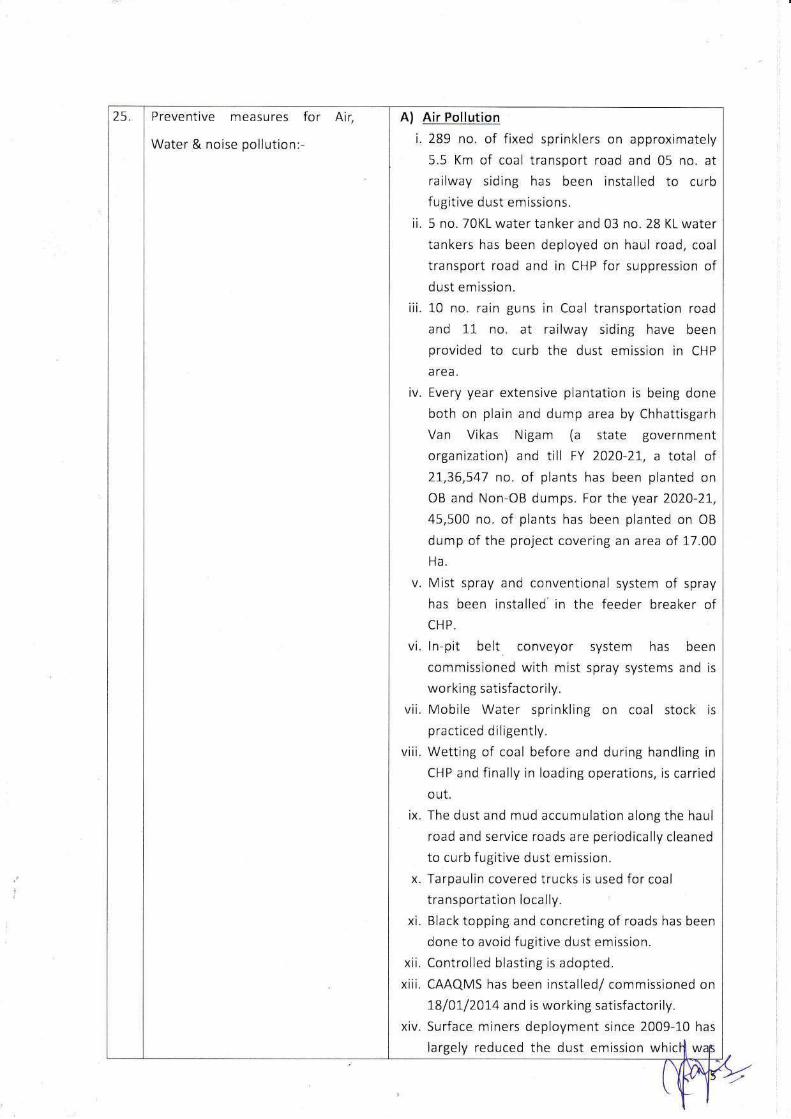
25 Preventive measures for Air,
Water & noise pollution:-
A) Air Pollution
i. 289 no. of fixed sprinklers on approximately
5.5 Km of coal transport road and 05 no. at
railway siding has been installed to curb
fugitive dust emissions.
ii" 5 no. 70KL water tanker and 03 no. 28 KL water
tankers has been deployed on haul road, coal
transport road and in CHP for suppression of
dust emission.
iii. 10 no. rain guns in Coal transportation road
and LL no. at railway siding have been
provided to curb the dust emission in CHP
a rea.
iv. Every year extensive plantation is being done
both on plain and dump area by Chhattisgarh
Van Vikas Nigam (a state government
organization) and till FY 2020-21, a total of
2L,36,54l no. of plants has been planted on
OB and Non-OB dumps. For the year 2O2O-21.,
45,500 no. of plants has been planted on OB
dump of the project covering an area of 17.00
Ha.
v. Mist spray and conventional system of spray
has been installed'in the feeder breaker of
CH P.
vi. ln-pit belt conveyor system has been
commissioned with mist spray systems and is
working satisfactorily.
vii" Mobile Water sprinkling on coal stock is
practiced diligently.
viii. Wetting of coal before and during handling in
CHP and finally in loading operations, is carried
o ut.
ix. The dust and mud accumulation along the haul
road and service roads are periodically cleaned
to curb fugitive dust emission.
x. Tarpaulin covered trucks is used for coal
tra nsportation locally.
xi. Black topping and concreting of roads has been
done to avoid fugitive dust emission.
xri. Controlled blasting rs adopted.
xiii. CAAQMS has been installed/ commissioned on
18/01,/201,4 and is working satisfactorrly.
xiv. Surface miners deployment since 2009-l-0 has
largely reduced the dust emission whic{ wap

I
emitting through drilling, blasting and
crushers.
xv. Long Range Fogging lVachine was
commissioned at Dipka Project on 02.05.2019,
to arrest the dust emissions from temporary
coal stocks, coal transportation roads and
railway siding.
xvi. lVechanized Sweeping Machine was
commissioned at Dipka Project during Nov
2019 to further minimize the dust near
colonies, and office areas.
(B) Water Pollution
i, The sedimentation ponds are provideC for
treating the mine water discharge. The treated
mine water is used for dust suppression
activities. There are 02 sedimentation ponds
namely Sirki pond (Capacity of 1.03 lakh cum),
CISF pond (Capacity of 2.26 lakh cum) and
Pragati Nagar pond (Capacity of 2.33 lakh cum)
acts as ground water recharge pond.
ii. Oil & Grease trap of 110 KL capacity has been
installed in workshop area for the treatment of
effluent generated after washing the HEMIV.
The O&G generated are treated through primary
effluent treatment plant. The treated effluent is
re-used for washing HEtVlVl's in workshop.
iii.3.2 km pucca catch drain has been constructed
around dump no. 3 & 5 to control soil erosion
and water pollution. Regular de-siltation of
drains is carried out before monsoon.
iv. 20,000 cu.m of check dams were constructed at
Jingatpur in-pit dump and 8000 Cum at Renki
Dump of Dipka OCP.
v. Domestic effluent treatment plant of 3.00 MLD
capacity has been constructed. The plant is
combined with the Gevra project.
vi. Storm water drains have been constructed in the
office buildings and colony.
vii. Rainwater harvesting have been installed in the
colony and office buildings. There are 51 RWH
systems constructed in Dipka area.
viii. Garland drains being made around the periphery
of the quarry to drarn off the rain water away
from the workings in order to maintain surface
water drainage.
6
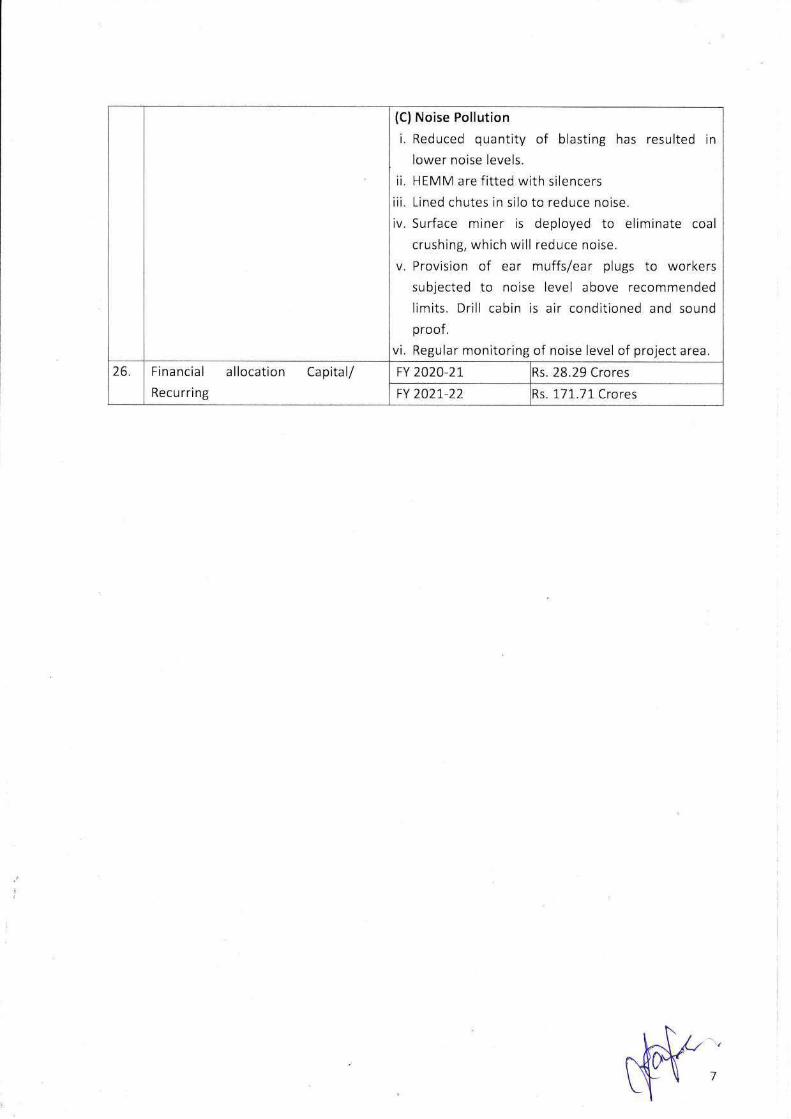
(C) Noise Pollution
i. Reduced quantity of blasting has resulted in
lower noise levels.
ii. HEMM are fitted with silencers
iii. Lined chutes in silo to reduce noise.
iv. Surface miner is deployed to eliminate coal
crushing, which will reduce noise.
v. Provision of ear muffs/ear plugs to workers
subjected to noise level above recommended
limits. Drill cabin is air condrtioned and sound
proof .
vi. Regular monitoring of noise level of project area.
26. Financial allocation Capital/
Recu rri ng
FY 2020-21" Rs. 28.29 Crores
tY 2021"-22 Rs. llL.ll Crores
i
7W
PART-V
GREEN BELT AND AFFORESTATION
I
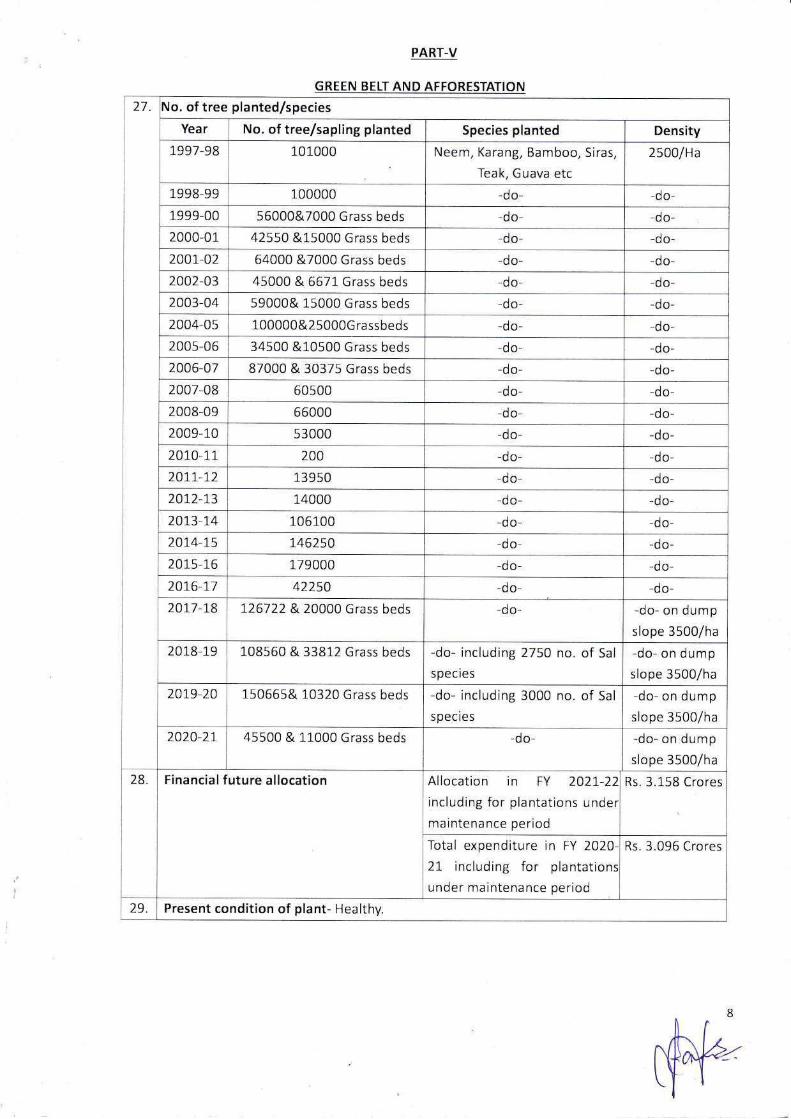
27 No. of tree planted/species
Year No. of tree/sapling planted Species planted Density
1.991-98 101000 Neem, Karang, Bamboo, Siras,
Teak, Guava etc
2500/Ha
1998-99 100000 -do- -do-
1999-00 56000&7000 Grass beds -do- -do-
2000-01 42550 &15000 Grass beds -do- -do-
200L-02 64000 &7000 Grass beds -do- -do-
2002-03 45000 &6671, Grass beds -do- -do-
2003-04 59000& 15000 Grass beds -do- -do-
2004-05 100000&25000G rassbeds -do- -do-
2005-06 34500 &10500 Grass beds -do- -do-
2006-07 87000 & 30375 Grass beds -do- -do-
2007-08 60500 -do- -do-
2008-09 66000 -do- -do-
2009-10 s3000 -do -do-
2010-L1 200 -do- -do
2011-12 13950 -do- -do
2012-13 14000 -do- -do-
2013-14 106100 -do- -do-
2014-15 146250 -do- -do-
2015- 16 179000 -do- -do-
2016-17 42250 -do- -do-
2017-18 126722 & 20000 Grass beds -do- -do- on dump
slope 3500/ha
201"8-19 108560 & 33812 Grass beds -do including 2750 no. of Sal
species
-do- on dump
slope 3500/ha
20t9-20 150665& 10320 Grass beds -do- rncluding 3000 no. of Sal
spec ies
-do- on dump
slope 3500/ha
2020-21 45500 & 11000 Grass beds -do- -do- on dump
slope 3500/ha
28 Financial f uture allocation Allocation in FY 2021-22
including for plantations under
maintenance perrod
Rs. 3.158 Crores
Total expenditure in FY 2020-
21 including for plantations
under maintenance period
Rs. 3.096 Crores
29 Present condition of plant- Healthy
8
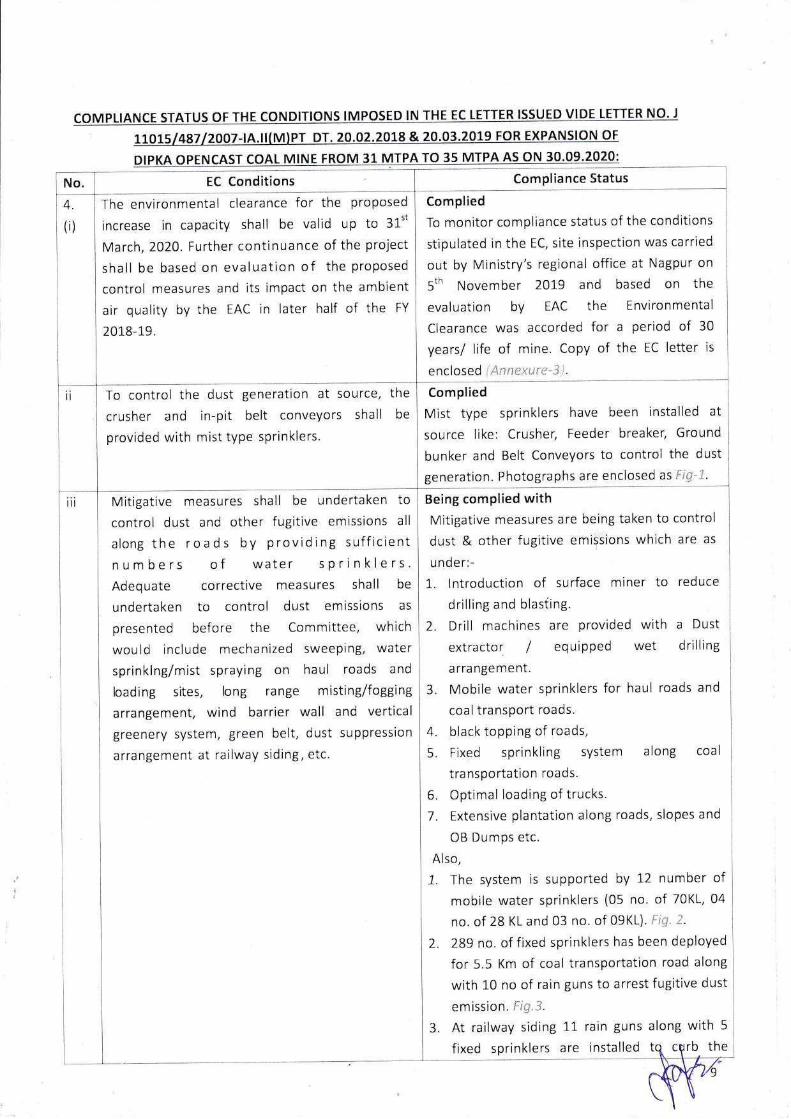
COMPLIANCE STATUS OF THE CON NS IMPOSED IN THE C TETTER ISSUED VIDE ETTER NO. J
11015/48712007-lA.ll(M)PT DT. 20.02.2018 & 20.03.2019 FOR EXPANSION OF
DIPKA L MINE FRO TO 09.2020:
t
Compliance StatusEC ConditionsNo
Complied
To monitor compliance status of the conditions
stipulated in the EC, site inspection was carried
out by Ministry's regional office at Nagpur on
5th November 2O1-g and based on the
evaluation by EAC the Environmental
Clearance was accorded for a period of 30
years/ life of mine. Copy of the EC letter is
e nc losed
4
(i)
The environmental clearance for the proposed
increase in capacrty shall be valid up to 31't
March, 2020. Further continuance of the project
shall be based on evaluation of the proposed
control measures and its irnpact on the ambient
air quality by the EAC in later half of the Fy
2018-19.
Complied
Mist type sprinklers have been installed at
source like: Crusher, Feeder breaker, Ground
bunker and Belt Conveyors to control the dust
generation. Photographs are enclosed as,' ..
ii To control the dust generation at source, the
crusher and in-pit belt conveyors shall be
provided with mist type sprinklers.
Being complied with
Mitigative measures are being taken to control
dust & other fugitive ernissions whrch are as
under:-
1. lntroduction of surface miner to reduce
drilling and blasting.
2. Drill machines are provided with a Dust
extractor / equiPPed wet drilling
a rra ngeme nt.
3. Mobile water sprinklers for haul roads and
coal transport roads.
4. black topping of roads,
5. Flxed sprinkling system along coal
transportation roads.
6. Optimal loading of trucks.
7. Extensive plantatron along roads, slopes and
OB Dumps etc.
Also,
1. The system is supported by 12 number of
mobile water sprinklers (05 no. of 70K1, 04
no. of 28 KL and 03 no. of 09KL). i:, , , .
?-. 289 no. of fixed sprinklers has been deployed
for 5.5 Km of coal transportation road along
with 10 no of rain guns to arrest f ugitive dust
ernission. lr::,:, .a.
3, At railway siding 11 rain guns along with 5
fixed sprinklers are installed eC rb th
Mrtigative measures shall be undertaken to
control dust and other fugitrve emissions all
along the roads by providing sufficient
numbers of water sPrinklers'Adequate corrective measures shall be
undertaken to control dust emissions as
presented before the Committee, which
would include rnechanized sweeping, water
sprinklng/mist spraying on haul roads and
loading sltes, long range misting/fogging
arrangement, wind barrier wall and vertical
greenery system, green belt, dust suppression
arrangement at railway siding, etc.
iii

i
iv Efforts shall be made to explore the possibility
of providing wind shield/breaker arrangement
with creepers and climbers.
Being complied
1. A temporary wind barrier wall has been
constructed at Railway Siding to reduce the
fugitive dust being emitted along the siding.
2. Construction of Permanent Wind barrier wall
has already started at railway siding of Dipka
OCP. Vertical rails has been erected at the
prolect for 750 m length along the Railway
siding. Procurement of Gl sheets is under
process.
3. Development of Vertical greenery system
along the railway siding at a cost of Rs.22.35
lakhs was carried out through CGRVVN along
the wind barrier wall poles. .;+ .rr.
10
fugitive dust emissions.
4. One N/echanrzed Sweeping Machine was
procured at a cost of Rs.32.00 lakhs and
deployed in the project during the month of
November, 2019 to curb the fugitive dusts
along the road at the project. I he
photograph is enclosed 35 ; ", .'i.
5" One Long Range Fogging Vlachine was
procured at a cost of Rs.45.66 lakhs and
deployed in the project during the month of
May, 2019 to tackle the problem of airborne
dust particles generated at the project. The
truck mounted fogging machine is directed
at the point sources such as stockpiles and at
high volume dust generating sources such as
loading/ unloadrng points to rapidly suppress
the emitted dust before it can disperse. The
photograph is enclosed as.r',. :r, .
6. Construction of Wind Barrier Wall (750m) at
railway siding to reduce the average wind
speed carrying fugitive dust being emitted
along the siding is underway. Vertical
rails/poles were erected on railway siding for
the length of 750m. . ,, i Procurement of Gl
sheets to be fixed on the vertical rails is
under process. Temporary green netting has
been done in the meantime.
7. Vertical greenery system at Railway siding
was completed through CGRVVN, Korba. ,:i,.l,
w
i
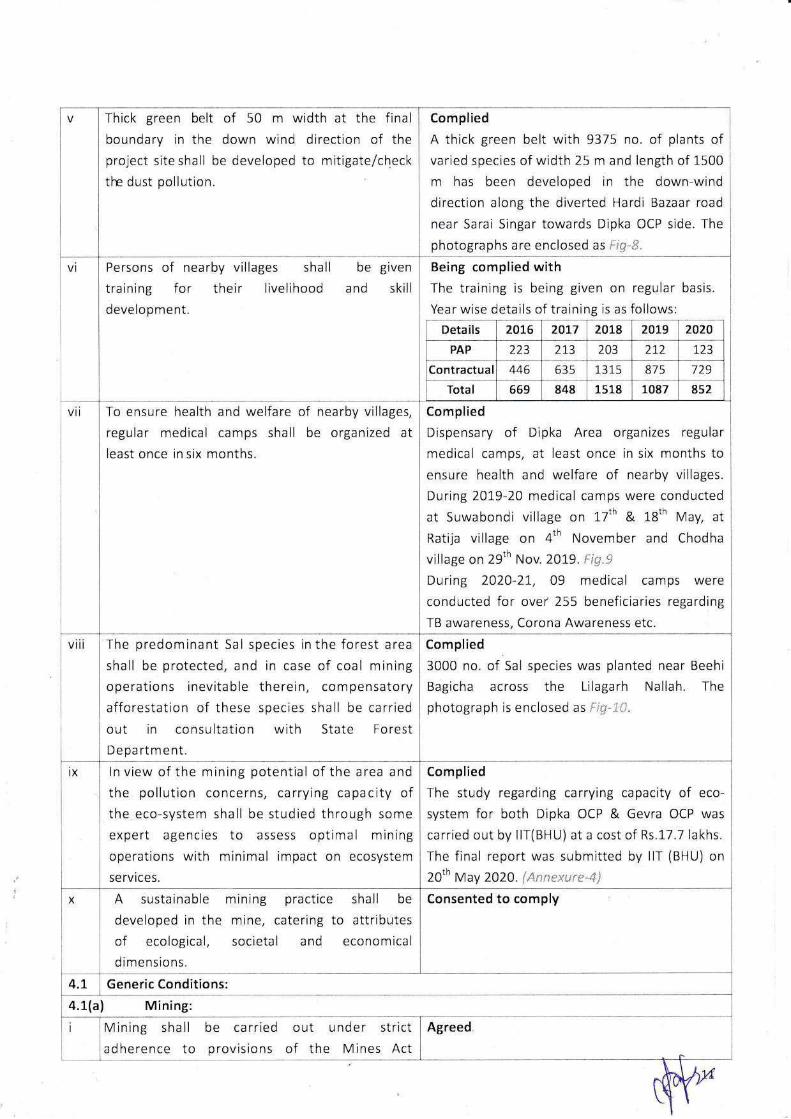
Complied
A thick green belt with 9375 no. of plants of
varied species of width 25 m and length of 1500
m has been developed in the down-wind
direction along the diverted Hardi Bazaar road
near Sarai Singar towards Dipka OCP side. The
photographs are enclosed as ; :;; .:r
Thick green belt of 50 m width at the final
boundary in the down wrnd drrection of the
project site shall be developed to mitigate/check
the dust pollution.
vi Persons of nearby villages shall
tra in ing fo r t h eir live Iih ood
development.
be given
and skill
Being complied with
The training is being given on regular basis
Year wise details of training is as follows:
Details 202020t6 201920L7 2018
223 203
Contractual 729446 875635 13 15
569 8s2848 1518 1087
zt2 1_23
Total
vii To ensure health and welfare of nearby villages,
regular medical camps shall be organized at
least once in six months.
Complied
Dispensary of Dipka Area organizes regular
medical camps, at least once in six months to
ensure health and welfare of nearby villages.
During 201,9-20 medical camps were conducted
at Suwabondi village on l-7th & 18th May, at
Ratija village on 4th November and Chodha
vrllage on 291h Nov,2019. ';r,:.:iDuring 2O2O-21, 09 medical camps were
conducted for over 255 beneficiaries regarding
TB awareness, Corona Awareness etc.
viii The predominant Sal species in the forest area
shall be protected, and in case of coal mining
operations inevitable therein, compensatory
afforestation of these species shall be carried
out in consultation with State Forest
Department.
Complied
3000 no. of Sal species was planted near Beehi
Bagicha across the Lilagarh Nallah" The
photograph is enclosed as ,r,'it l1.
ix ln view of the mining potential of the area and
the pollution concerns, carrying capacrty of
the eco-system shall be studied through some
expert agencies to assess optimal mining
operations with minimal impact on ecosystem
services.
Complied
The study regardrng carrying capacity of eco-
system for both Dipka OCP & Gevra OCP was
carried out by llT(BHU) at a cost of Rs.17.7 lakhs.
The final report was submitted by llT (BHU) on
20th May ,OrO. ;':t::::r'ttr...'tt':",1 i
Consented to complyX A sustainable mining practice shall be
developed in the mine, catering to attrtbutes
of ecological, societal and economical
d ime nsions.
Generic Conditions:
a.l(a) Mining:
Mining shall
adherence to
be carried out under strrct
provisions of the M ines Act
Agreed.
r
I
PAP 213
4,L
i
1952 and subordinate legislations made there-
under as applicable.
No change in mining method i.e. OC to tJG,
calendar programme and scope of work shall be
made without obtaining prior approval of the
lVinistry of Environment, Forest ;:nd Climate
Change (Mott & CC).
Agreed
lVlining shall be carried out as per the approved
mining plan(including Mine Closure Plan)
abiding by mining laws related to coal mining
and the relevant circulars issued by
Directorate General IVines Safety (DGMS).
Agreed
iv No mining shall be carried out in forest land
without obtaining Forestry Clearance as per
Forest (Conservation) Act, 1980 and also
adhering to The Scheduled Tribes and Other
Traditional Forest Dwellers (Recognition of Forest
Rights) Act,2006 read with provisions of lndian
Forest Acl, 1921.
Agreed
4.1 (b) Land reclamation and water conservation
Digital Survey of entire leasehold area/ core
zone using Satellite Remote Sensing survey
shall be carried out at least once in three
years for monitoring land use pattern and
report in 1:50,000 scale shall be submitted to
Ministry of Environment, Forest and Clrmate
Change/Regional Office (RO).
Being Complied
Land use & land reclamation status is being
monitored by CIVIPDIL every year through
satellite imagery & the report is regularly
submitted to Regional office lVloEF&CC, Nagpur.
Copy of the same is available in SECL official
website "
The surface drainage plan including surface
water conservation plan for the area of
influence affected by the said mining
operations, considering the presence of
river/rivulet/pond/lake etc, shall be prepared
and implemented by the project proponent"
The surface drainage plan and/or any diversion
of natural water courses shall be as per the
approved Mining Plan/EIAIEMP report and
with due approval of the concerned State/Gol
Authority. The construction of embankment to
prevent any danger against inrush of surface
water into the mine should be as per the
approved Mining Plan and as per the
permission of DGMS.
Complied.
r The surface drainage plan including surface
water conservation plan for Dipka Expansion
Project was prepared by Chhattisgarh Council
of Science & Technology, Raipur at a total cost
of Rs.7.16 lakhs. The frnai report of the study
was submitted by CCoST, Raipur on 1.2.06.2020
. As per the approved Mining Plan/ElA/EMP
report there is no diversion of natural water
CO U TSES,
. All the mining activities are as per approved
Mining Plan and as per the permission of
DGMS.
iii The final mine void depth should preferably
be as per the approved Mine Closure Plan, and
Agreed
. lt will be complred during post-mining
12
ii
iii
I
period "
Reclamation of OB dumps will be carried out
as per the approved Mine Closure Plan.
a
in case it exceeds 40 m, adequate engineering
interventions shall be provided for sustenance
of aquatic life therein. The remaining area shall
be backfilled and covered with thick and alive
top soil^ Post-mining land be rendered usable
for agricultural/forestry purposes and shall be
handed over to the respective state
government as speclfied in the guidelines for
Preparation of Mine Closure Plan issued by
the Ministry of Coal dated 27th August, 2009
and subsequent amendments.
Agreed.
. The land use in Dipka project will be in
conformity with "durrng minrng / post
mining" land-use pattern as per approved
Mining Plan and the EIA/EMP submitted to
this Ministry.
. Slx monthly EC compliance report is being
regularly sent to MoEF & CC, Regional Office,
N agpu r
The entrre excavated area, backfrlling, external
OB dumping (including top soil) and
afforestation plan shall be in conformity with
the "during mining / post mining" land-use
pattern, which is an integral part of the
approved Mrning PIan and the EIA/EMP
submitted to this Ministry. Progressive
compliance status vis-a-vis the post-mining land
use pattern shall be submitted to the Ministry
of Environment, Forest and Climate
Change/Regional Office on six monthly basis.
Being Complied
. In West Section (lnternal dump) of Dipka
Expansion Project, an area of 12.00 Ha has
been earmarked for the storage of top soil
and the same is being stored at the
earmarked Site , :,;, . .i.
. The top soil is being spread on the OB dump
and plarns during biological reclamation. The
thickness of spread top soil ranges from 30-
50 cm.
. Backfilling and afforestation of excavated
area will be in line with the approved Mine
Closure PIan.
r During the FY 2020-2L,9,62,150 cum of top
soil was removed, which was spread over OB
Dumps for Biological Reclamation.
The top soil shall temporarily be stored at
earmarked site(s) only and shall not be kept
unutilized for long. The top soil shall be used
for land reclamation and plantation purposes.
Active OB dumps shall be stabrlized with
native grass species to prevent erosion and
surface run off. The other overburden dumps
shall be vegetated with native flora species.
The excavated area shall be backfilled and
afforested in line with the approved Mtne
Closure Plan. Monitoring and management of
rehabilitated areas shall continue until the
vegetation becomes self-sustaining.
Compliance status shall be submitted to the
Ministry of Environment, Forest and Climate
Change/ Regional Office on six monthly basts.
a.1 (c) Emissions, effluents & waste disposal
Being complied with
i. Coal production is being done by Surface
Miner, which eliminates the crushing of coal
in CHP.
ii. Water guns are installed at coal stock yard &
railway sidings to suppress f u dust
Transportation of coal, to the extent
permitted by road, shall be carried out by
covered trucks/conveyors. Effective control
measures such as regular water/mist
sprinkling/ rain gun etc shall be carried out in
critical areas prone to air pollution (with

i
higher values of PMro/PM2 5) such as haul
road, loading/unloading and transfer points.
Fugitive dust emissions from all sources
shall be controlled regularly. lt shall be
ensured that the Ambient Air Quality
parameters conform to the norms
prescribed by the Central/State Pollution
Control Board.
em ission.
iii. IVlechanized Sweeprng Machine is deployed in
the project to curb the fugrtive dusts along
the road at the prolect.
iv. Long Range Fogging Machrne is deployed in
the project to tackle the problem of airborne
dust particles. The truck mounted fogging
machine is being directed at the point sources
such as stockpiles, haul road and at high
volume dust generating sources such as
loading/ unloading and transfer points to
rapidly suppress the emitted dust before it
can disperse.
v. Trucks are optimally loaded and vehicle used
for transportation of coal outside the mine
area are being covered with Tarpaulins.
vi. ln addition to it, conventional perforated pipe
method of spraying is installed in 09 no. of
feeder breakers and mist spray systems in 03
no. of feeder breaker.
vii. 112 no.s of mist spray systems are provided
at CHP and 50 nos. are provided at Silo to
arrest the coal dust emission"
'iii. 13 no. of rain guns are also installed for
effective dust suppression in coal
transportation road.
ix.294 no. of fiied sprinklers are provided for
5.5 Km of coal transportation road to arrest
fugitive dust em ission.
x. Additionally,05 no. of 70 Kl,03 no. of 28 KL
and 03 no. of 09KL IVlobile water tankers
(contractual) are also deployed for water
sprinkling along the haul roads.
xl. The Ambient Air Quality pa ra meters are
in conformity to the norms prescribed by the
Central/State Pollution Control Board.
Greenbelt consisting of 3 tier plantation of
width not less than 7.5 m shall be developed all
along the mine lease area rn a phased
manner" The green belt comprising a mix of
native species shall be developed all along the
major approach/ coal transportation roads.
Being complied with
. Every year extensive plantations are being
carried out on both plain and OB dump area
by Chhattisgarh Van Vikas Nigam (a state
government organization) "
r During the FY 2020-2L,45,500 plants were
planted over an area of 1l Ha and in 20L9-
20,1".51akh plants has been planted in 58.33
1_4
7
i
Ha. .':;t.,;.'1,1..
The cost expended for plantation & its
maintenance during FY 2020-2L was Rs.
3 ,09 ,61,213 c ro re .
As on date a total of 2L,36,547 no. of plants
have been planted at Dipka Project since
1992 to 2020-21by CGRVVN.Ltd. The details
are enclosed as
25 m thick plantation (9375 no. of plants) has
been planted along the road side for a length
of 1500 m towards Dipka OCP side of
diverted Hardi Bazar road near Sarai Singar.
Green belt of 4.91 Km has been developed
around the project.
Specres include: Neem, Karenj, Amla, Siras,
Sishu, Bel, Bamboo, Ganga lmli, Bahera,
Ashok, Gulmohar, Satwan, CassiaGemec,
Teak, Jamun, Peltaforum,CassiaGulco,
Bogan vallia, Khamar, Sitaphal, Amrood,
Kathal, lmli, Mango, Sisham, Jatropa, etc.
a
a
a
a
a
The transportation of coal shall be carried out
as per the provisions and route proposed in
the approved Mining Plan. Transportatron of
the coal through the existing road passing
through any village shall be avoided. ln case,
it is proposed to construct a'bypass' road, rt
should be so constructed so that the impact of
sound, dust and accidents could be
appropriately mitigated.
Complied.
Diverted Hardi Bazar bypass road near Sarai
Singar has been completed.
iv Vehicular emissions shall be kept under
control and regularly monitored. All the
vehicles engaged in minrng and allied
activitres shall operate only after obtaining
'PUC' certificate frorn the authorized pollution
testing centers.
Being complied with.
Vehrcle emissions are periodically (Six Monthly)
monitored and a PUC certificate to this effect is
being issued to each vehicle by the authorized
agency of Transport Department Government of
Chhattisgarh. Records are being maintained at
the auto-section Dept. of Dipka Area.
Coal stock pile,/crusher/feeder and breaker
material transfer points shall invariably be
provided with dust suppression systern. Belt-
conveyors shall be fully covered to avoid air
borne dust" Side cladding all along the
conveyor gantry should be made to avoid air
borne dust. Drills shall be wet operated or
fitted with dust extractors.
Being complied with
1. Drills are wet operated/provided with dust
ext ra cto rs .
2. L72 no.s of rnist spray systems are provided
at Cl-lP and 50 nos" are provided at Silo to
arrest the coal dust emission"
3. 294 fixed sprinklers and 21 rain guns are
installed at Dipka Project to curb fugitive
dust emissions along coal trangportation
1-5
i
road and at railway siding.
4. Surface miners have been deployed for Coal
extraction which eliminates Conventional
drilling & blasting of coal seams.
5. The surface miner has inbuilt jet spray
sprinkler system to suppress dust at the
source of dust emission.
6.09 no. of conventional perforated pipe
method of spraying and 03 no. of mist spray
systems has been installed in feeder
breakers.
7. Also truck mounted Long Range Fogging
Machine has been deployed in the project to
tackle the problem of airborne dust particles
generated at the point sources such as
stockpiles and at high volume dust
generating sources such as loading/
unloading and transfer points to rapidly
suppress the emitted dust before it can
d is pe rse.
vi Coal handling plant shall be operated with
effective control measures viz. bag
filters/water or mist sprinkling system etc to
check fugitrve emissions from crushing
operations, conveyor system, transfer points,
etc.
Being complied with
1. 1-/2 no"s of mist spray systems are provided
at CHP and 50 nos. are provided at Silo to
arrest the coal dust emission.
2. Conventional perforated pipe method of
spraying is installed in 9 no. of feeder
breakers and'mist spray systems of 3 no. in
feeder breaker.
Ground water, excludrng mine water, shall not
be u sed fo r m in ing o pe ratio ns. Ra inwa te r
harvesting shall be implemented for
conservation and augmentation of ground
water resources.
Being complied
. Approval for 23.2 lakh cum/year withdrawal
of ground water was obtained vide NOC No:
CGWA/NoC/MlN /ORtc/2aI914890 dated:
1-4.O3.2019, from CGWA, lViinistry of water
Resources (Gol). The NOC was valid upto
25.02.2021. A copy of NOC is enclosed as
,':l:r.;.,.,,;rr:...,"..r RengWal Of NOC fOf GW
abstraction was applied on 25.02.2021 vide
application no: 21-4/673/CT lMlN/2011
:,":l;.',,t,-,,r::r''t.-i.),'. Site inspection by CGWB,
Raipur is awaited. For mining operations, no
additional tube-well/ground water abstraction
structures, which deplete ground water, will be
constructed.
o Mine water obtained during extraction of coal
& Rainwater accumulated is utilized for
16
vii
i
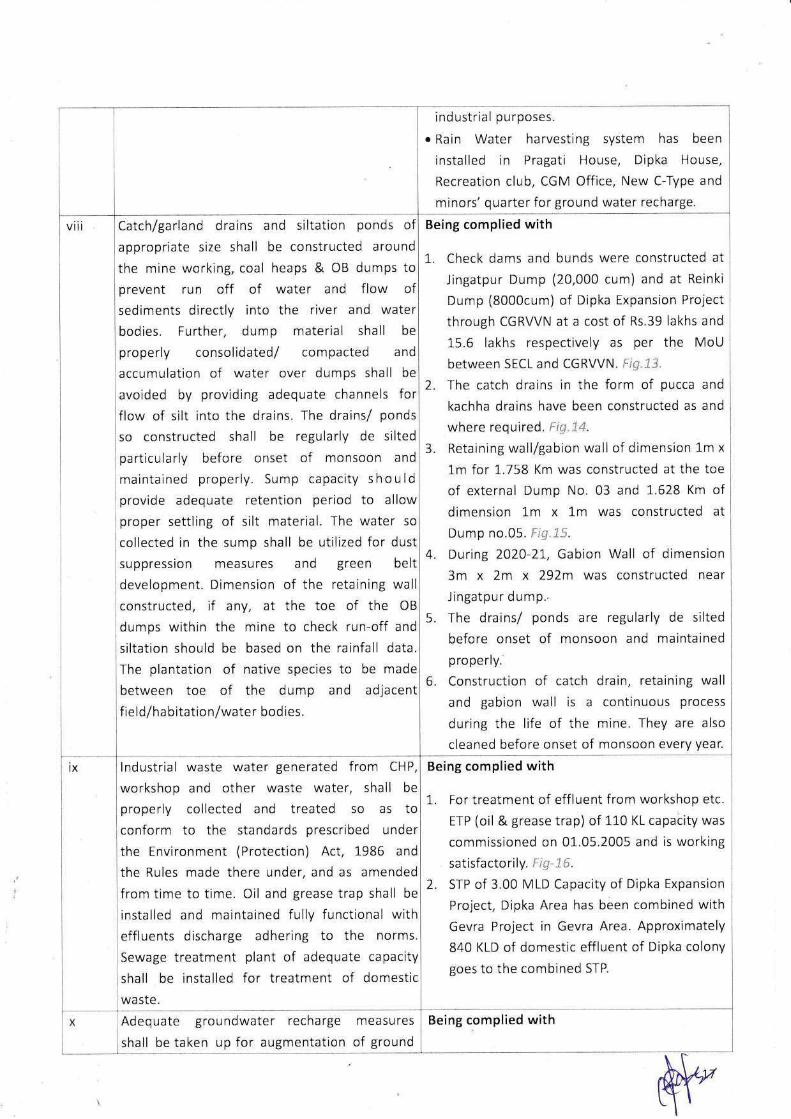
industrial purposes.
. Rain Water harvesting system has been
installed in Pragati House, Dipka House,
Recreation club, CGVI Office, New C-Type and
minors' quarter for ground water recharge.
1". Check dams and bunds were constructed at
Jingatpur Dump (20,000 cum) and at Reinki
Dump (8000cum) of Dipka Expansion Project
through CGRVVN at a cost of Rs.39 lakhs and
15.6 Iakhs respectively as per the MoU
between SECL and CGRVVN. ,-;t:; .!":.
2. The catch drains in the form of pucca and
kachha drains have been constructed as and
where required.
3. Retaining wall/gabion wall of dimension 1m x
1m for 1.758 Km was constructed at the toe
of external Dump No. 03 and l-.628 Km of
dimension 1m x 1m was constructed at
Dump no.05. i,;-; !..'i.
4. During 2020-21, Gabion Wall of dimension
3m x 2m x 292n was constructed near
Jingatpur durnp..
5. The drains/ ponds are regularly de silted
before onset of rnonsoon and maintained
properly"
6. Construction of catch drain, retaining wall
and gabion wall is a continuous process
during the life of the mine. They are also
cleaned before onset of monsoon every year.
Being complied withvilt Catch/garland drains and siltation ponds of
appropriate size shall be constructed around
the mine working, coal heaps & OB dumps to
prevent run off of water and flow of
sediments directly into the river and water
bodies. Further, dump material shall be
properly consolidated/ compacted and
accumulation of water over dumps shall be
avoided by providing adequate channels for
flow of silt into the drains. The drains/ ponds
so constructed shall be regularly de silted
particularly before onset of monsoon and
maintained properly. Sump capacity should
provide adequate retention period to allow
proper settling of silt rnaterial. The water so
collected in the sump shall be utilized for dust
suppression measures and green belt
developmerrt. Dimension of the retarning wall
constructed, if any, at the toe of the OB
dumos within the mine to check run-off and
siltation should be based on the rainfall data.
The plantation of native species to be made
between toe of the dump and adjacent
field/habitation/water bodies.
1. For treatment of effl uent from workshop etc.
ETP (oil & grease trap) of 110 KL capacity was
comrnissioned on 0i.05.2005 and is working
satisfactorily. t :.,' :,::.
2. Sl-P of 3.00 MLD Capacity of Dipka Expansion
Project, Dipka Area has been combined with
Gevra Project in Gevra Area. Approximately
840 KLD of domestic effluent of Dipka colony
goes to the combined STP.
Being complied withix lndustrial waste water generated from Cl-lP,
workshop and other waste water, shall be
properly collected and treated so as to
conforrn to the standards prescribed under
the Environment (Protection) Act, 1986 and
the Rules made there under, and as amended
fronr time to time. Oil and grease trap shall be
installed and maintained fully functronal with
effluents discharge adhering to the norms.
Sewage treatment plant of adequate capacity
shall be installed for treatment of domestic
waste.
Adequate groundwater recharge measures
shall be taken up for augmentation of ground
Being complied withx
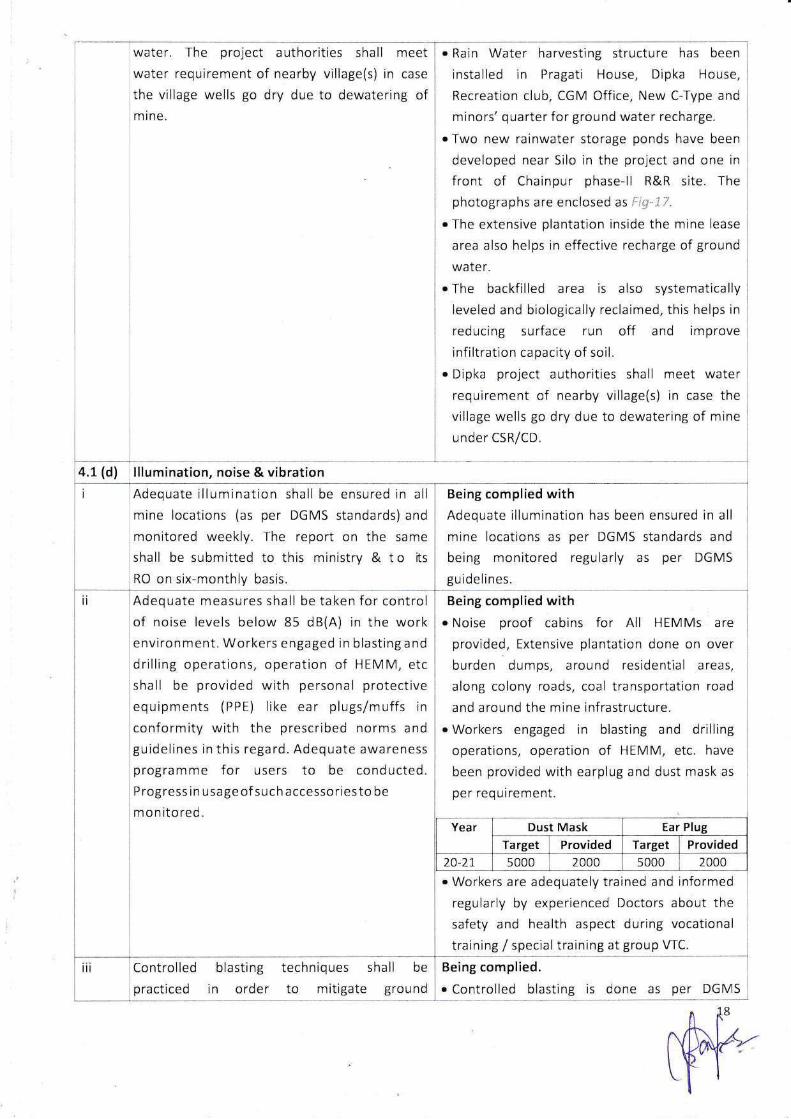
I
water. The project authorities shall meet
water requirement of nearby village(s) in case
the village wells go dry due to dewatering of
mine.
. Rain Water harvesting structure has been
installed in Pragati House, Dipka House,
Recreation club, CGM Office, New C-Type and
minors' quarter for ground water recharge.
r Two new rainwater storage ponds have been
developed near Silo in the project and one in
front of Chainpur phase-ll R&R site. The
photographs are enclosed as ',, -, '"
r The extensive plantation inside the mine lease
area also helps in effectrve recharge of ground
wate r.
. The backfilled area is also systematically
leveled and biologically reclaimed, this helps in
reducing surface run off and improve
infiltration capacity of soil.
. Drpka project authorities shall meet water
requirement of nearby village(s) in case the
village wells go dry due to dewatering of mine
under CSR/CD.
4.1 (d) lllumination, noise & vibration
Adequate illumination shall be ensured in all
mine locations (as per DGMS standards) and
monitored weekly. The report on the same
shall be submitted to this ministry & t o rts
RO on six-monthly basis.
Being complied with
Adequate illumination has been ensured in all
mine locations as per DGMS standards and
being monitored regularly as per DGMS
guide lines.
Adequate measures shall be taken for control
of noise levels below 85 dB(A) in the work
environment. Workers engaged in blasting and
drilling operations, operation of HEMM, etc
shall be provided with personal protective
equipments (PPE) like ear plugs/muffs in
conformity with the prescribed norms and
guidelines in this regard. Adequate awareness
programme for users to be conducted.
Progress in usageof such accessoriesto be
monitored.
Being complied with
. Noise proof cabins for All HEMMs are
provided, Extensive plantation done on over
burden dumps, around residential areas,
along colony roads, coal transportation road
and around the mine infrastructure.
. Workers engaged in blasting and drilling
operations, operation of HEMM, etc. have
been provided with earplug and dust mask as
per requirement.
Year Dust Mask Ear Plug
Target Provided Target Provided
2A-71" 5000 2000 s000 2000
o Workers are adequately trained and informed
regularly by experienced Doctors about the
safety and health aspect during vocational
training / special training at group WC.
Controlled
p racti ced
blasting
in order
techniques shall be
to mitigate ground
Being complied.
. Controlled blasting is done as per DGMS
8
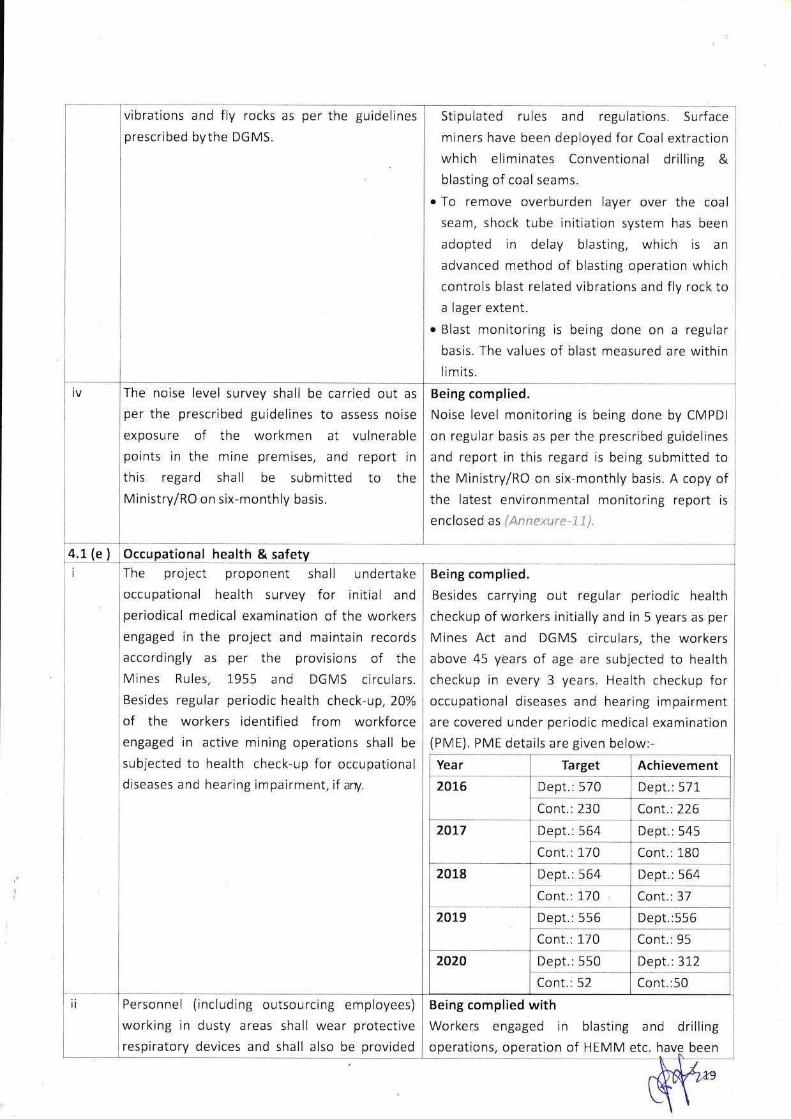
iii
i
vibrations and fly rocks as per the guidelines
prescribed bythe DGMS.
Stipulated rules and regulations. Surface
miners have been deployed for Coal extraction
which eliminates Conventional drilling &blasting of coal seams.
r To remove overburden layer over the coal
seam, shock tube initiation system has been
adopted in delay blasting, which is an
advanced method of blastrng operation which
controls blast related vibrations and fly rock to
a lager extent.
r Blast monitoring is being done on a regular
basis. The values of blast measured are within
limits.
iv The noise level survey shall be carried out as
per the prescribed guidelines to assess noise
exposure of the workmen at vulnerable
points in the mine premises, and report in
this regard shall be submitted to the
Ministry/RO on six-monthly basis.
Being complied.
Noise level monitoring is being done by CMPDI
on regular basis as per the prescrrbed guidelines
and report in this regard is being submitted to
the Ministry/RO on six-monthly basis" A copy of
the latest environmental monitoring report is
enclosed as
a.1 (e ) Occupational health & safety
The pro.lect proponent shall undertake
occupational health survey for initial and
periodical medical examination of the workers
engaged in the project and maintain records
accordrngly as per the provisions of the
lVlines Rules, 1955 and DGMS circulars.
Besides regular periodic health check-up, 20%
of the workers identif ied f rom workforce
engaged in active mining operations shall be
subjected to health check-up for occupational
diseases and hearing impairment, if arry.
Being complied.
Besides carrying out regular periodic health
checkup of workers initially and in 5 years as per
Mines Act and DG IVIS circulars, the workers
above 45 years of age are subjected to health
checkup in every 3 years. Health checkup for
occupational diseases and hearing impairment
are covered under periodic medical examination
(PME). PME details are given below:-
Target Achievement
Dept.:570 Dept.:571
Dept.:564 Dept.:545
Dept.:564 Dept.: 564
Dept.:556 Dept.:556
Dept.:550 Dept.:312
Year
2076
2017
2078
201.9
Cr:nt": 170
2020
Cont.:50Cont.:52
Cont.:230 Cont.:226
Cont.: 170 Cont.:180
Cont.: 1"70 Cont.: 37
Cont.:95
Personnel (including outsourcing employees)
working in dusty areas shall wear protective
respiratory devices and shall also be provrded
Being complied with
Workers engaged in blasting and drilling
operations, operation of HEMM etc. havg been

1
with adequate training and information on
safety and health aspects.
provided with earplug and dust mask.
Vocational training provided to the
departmental and outsourcing employees
covers both safety and health aspects. The
detail ls given below:
Year Dept Cont ( i nclu ding refe rred )
201.8-19Target: 203
13 1sAch: 203
20L9-20 Target:211875
Ach 2L2
2020-21. farg,el'. \772L27
Ach:167
Skill training as per safety norms specified by
DGIVIS shall be provided to all workmen
including the outsourcing employees to ensure
high safety stanoards in mines.
Being complied with
Regular Skill training as per safety norms
specified by DGIVIS is berng provided to all
workmen including the outsourcing employees
to ensure high safety standards in mines.
4.1(f) Ecosystem & biodiversity conservation
The project proponent shall take all
precautionary measures during mining
operation for conservation and protection of
endangered flora/fauna, if any,
spotted/reported rn the study area. The Action
plan in this regard, f any, shall be prepared
and rmplemented in consultation with the State
Forest and Wildlife Department.
Being complied
. Wildlife Conservation Plan for Dipka Expansion
Project was prepared by TFRI, Jabalpur at a
cost of Rs.14.90 lakhs as per the MoU has been
signed between lndian Councrl of Forestry
Research and Education (ICFRE), Dehradun and
Coal lndia Limited, Kolkata.
r The final report of Wildlife Conservation plan
was submitted by I FRl, labalpur on
12.08.2020. Copy of the report ls enclosed as
. As per the recommendation in the WL plan, a
2.00 Ha site has been identified at Chainpur
village to develop a herbal garden. The work is
being taken up through CGRVVN, Korba and
the scheme is under preparation.
4.1 (e) Public hearing, R&R & CSR
lmplementation of the action plan on the
issues raised during the public hearing shall be
ensured. The project proponent shall
undertake all the tasks/measures as per the
action plan submitted with budgetary
provisions during the public hearing. Land
oustees shall be compensated as per the
norms laid down in the R&R policy of the
co m pa ny/State G ove rn me nt/Ce ntra I
Being complied with
r All the issues raised during public hearing
conducted on 05.09.2008 have been resolved.
r R&R policy 2012 & Chhattisgarh Rajya Adarsh
Punarvas Niti 2007 and employment is
provided to project affected persons as per
approved policy.
iii
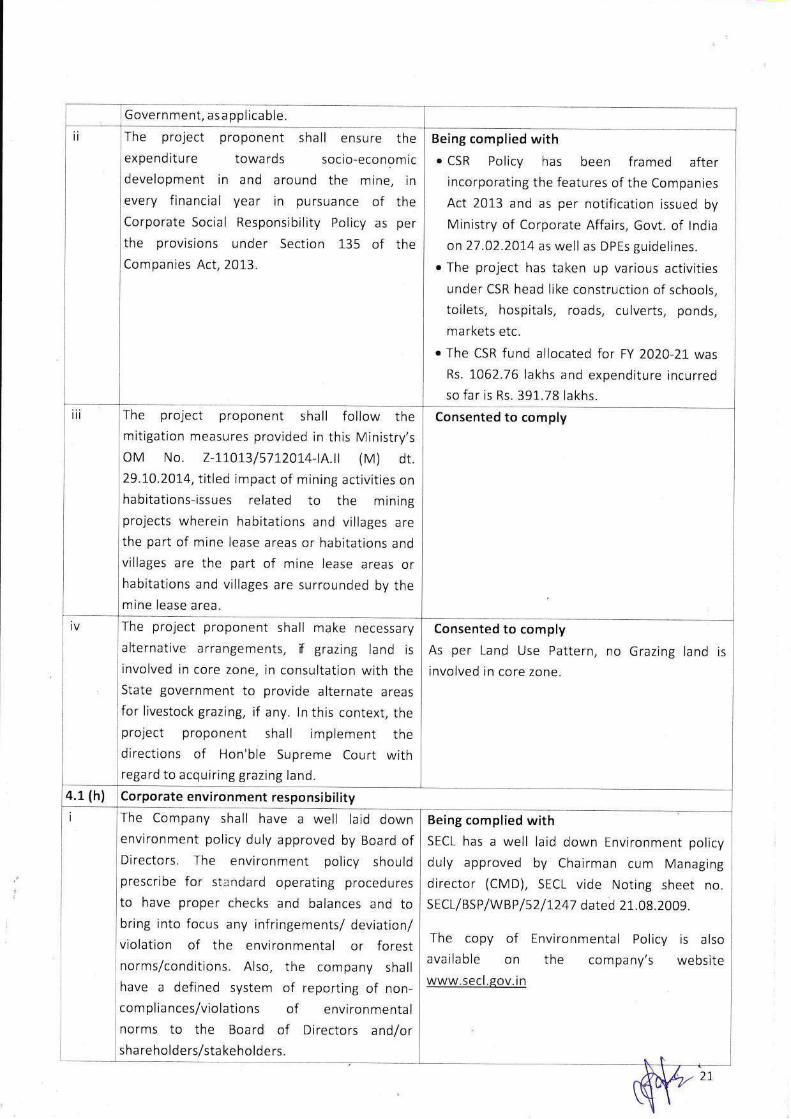
Government, asapplicable
The project proponent shall ensure the
expenditure towards soclo-economic
development in and around the mine, inevery financral year in pursuance of the
Corporate Social Responsibllity Policy as per
the provisions under Section 135 of the
Companies Act,2013.
Being complied with
r CSR Policy has been framed after
incorporating the features of the Companies
Act 2013 and as per notification issued by
Ministry of Corporate Affairs. Govt. of lndia
on 21.02.2014 as well as DPEs guidelines.
. The project has ta ken u p va rious activities
under CSR head like construction of schools,
toilets, hospitals, roads, culverts, ponds,
markets etc.
r The CSR fund allocated for FY 2020-21 was
Rs. 1062"76 lakhs and expenditure incurred
so far is Rs.391.78 lakhs.
The project proponent shall follow the
mitigation measures provided in thrs Ministry's
OM No. Z-11"01.3/s712014-tA.| (M) dt.
29.1,0.2014, titled impact of mining activities on
habitations-issues related to the minrng
projects wherein habitations and villages are
the part of mine lease areas or habitations and
villages are the part of mine lease areas or
habitations and villages are surrounded by the
mine lease area.
Consented to comply
The project proponent shall make necessary
alternative arrangements, if grazing land is
involved in core zone, in consultation with the
State government to provide alternate areas
for livestock grazing, if any. ln this context, the
project proponent shall implement the
directions of Hon'ble Supreme Court with
regard to acquiring grazing land.
Consented to comply
As per Land Use Pattern, no Grazing Iand is
involved in core zone.
4.1 (h)
The Company shall have a well laid down
environment policy duly approved by Board of
Directors. The environment policy should
prescribe for st.:ndard operating procedures
to have proper checks and balances and to
bring into focus any infringements/ deviation/
violation of the environmental or forest
norms/conditions. Also, the company shall
have a defined system of reportlng of non-
compliances/violations of environmental
norms to the Board of Directors and/or
sha reholders/sta keholde rs.
SECL has a well laid down Environment policy
duly approved by Chairman cum Managing
director (CMD), SECL vide Noting sheet no.
S ECL/BSP/WBP / s2 I 1247 dated 2 1.08.2009.
The copy of Environmental Policy is alsc:
available on the company's websrte
www.secl.gov.in
Being complied with
ZI
iii
Corporate environment responsibility
rF
i
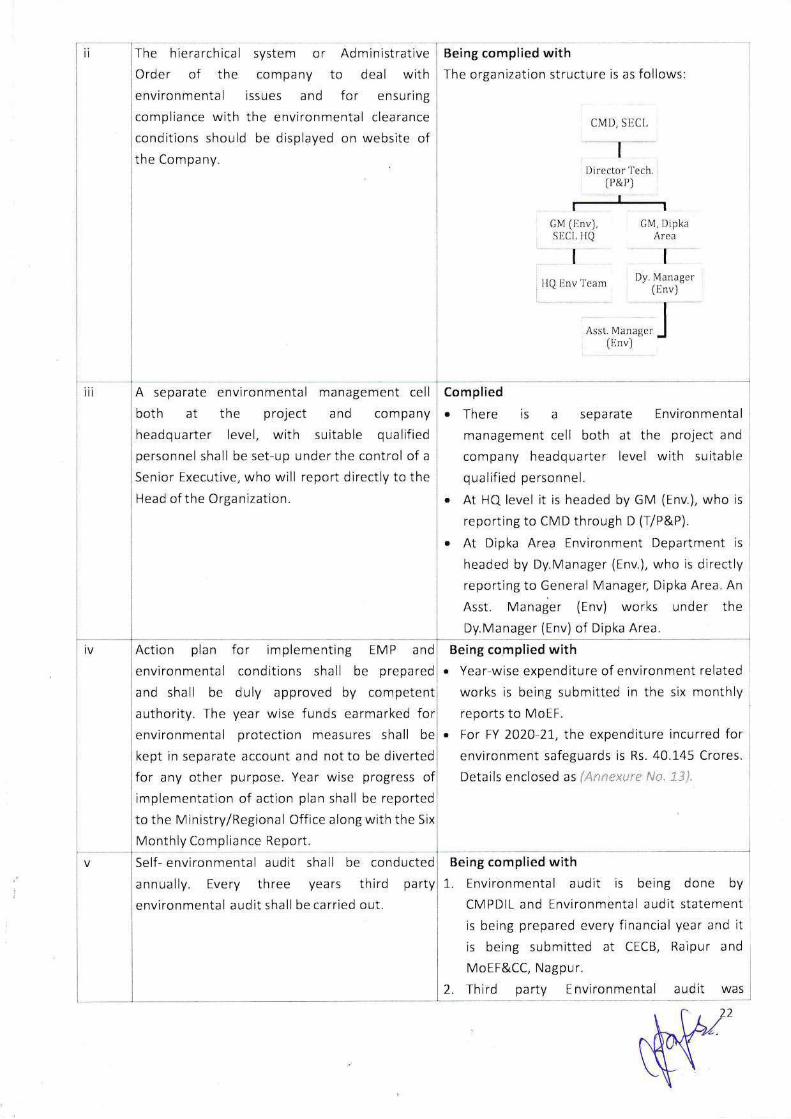
ii The hierarchical system or Admrnistrative
Order of the company to deal with
environmental issues and for ensuring
r:ompliance with the environmental clearance
conditions should be displayed on website of
the Company.
Being complied with
The organization structure is as follows
CMt), SIiCL
Director'l'e(P&t,)
GM []invl,SIJCI, iiQ
IIQ Iinv'1 cam
Area
I)y. Manager
[Ijnv)
GM, D ip ka
Assl. Managcr
flinvJ
ill A separate environmental management cell
both at the project and company
headquarter level, with surtable qualified
personnel shall be set-up under the control of a
Senior Executive, who will report directly to the
Head of the Organization.
Complied
r There is a separate Environmental
management r:ell both at the project and
company headquarter level with suitable
qualified personnel.
r At HQ level it is headed by GIV (Env.), who is
reporting to CMD through D (T/P&P).
r At Dipka Area Environment Department is
headed by Dy.lVlanager (Env.), who is directly
reporting to General Manager, Dipka Area. An
Asst. lVlanager (Env) works under the
Dy.Vlanager (Env) of Dipka Area"
iv Action plan for implementing EMP and
environmental conditions shall be prepared
and shall be duly approved by competent
authority. The year wise funds earmarked for
environmental protection measures shall be
kept in separate account and not to be diverted
for any other purpose. Year wise progress of
implementation of action plan shall be reported
to the lVlinistry/Regronal Office along with the Six
IVonthly Complia nce Report.
Being complied with
. Year-wise expenditure of environment related
works is being submitted in the six monthly
reports to MoEF.
. For FY 2020-21. the expenditure incurred for
environment safeguards is Rs. 40.145 Crores.
Dctails enclosed as
Self- environmental audit shall be conducted
annually. Every three years third party
environmental audit shall be carried out.
Being complied with
1,. Environmental audit is being done by
CMPDIL and Environmental audit statement
is being prepared every fi nancial year ano it
rs berng submitted at CECB, Raipur and
MoEF&CC, Nagpur.
2. Third party E nvironmental audit was
I
iii
conducted by ICFRE Dehradun during 2017-
18 and by CAG June-Nov 1.8.
4.1 (i) Statutory Obligations
The environmental clearance shall be subject
to orders of Hon'ble Supreme Court of lndia,
l-ion'ble High Court, NGI and any other Court of
Law from time to tirne, and as applicable to the
project.
Consented to comply
This environmental clearance shall be subject
to obtaining wildlife clearance, if applir:able,
from the Standing Committee of National Boarrj
for Wildlife.
The project proponent shall obtain Consent to
Establish/Operate under the Air Act, 1981 and
the Water Act, 1974 from the concerned State
Pollutton Control Board.
Complied
Consent to Operate (renewed) for 35 MIy has
been obtained from Chhattisgarh State
Pollution Control Board, Raipur vide letter No.
10290, dated- 23.02.202-1, valid till 28.02.202i
The copy of the consent is enclosed as
:..:.i".,....,',t :,..
Not Applicable
iv lhe project proponent shall obtain the
necessary permission from the Central Ground
Water Authority (CcWA).
Complied
. Approval for ?-3.?_ lakh cum/year withdrawal
of ground water was obtained vide NOC No:
CGWA/Noc/lvllN loRtc/201914890 dated:
14.03.20Ig, from CGWA, Mrnistry of water
Resources (Gol). The NOC was valid upto
25.02.2021. A copy of NOC is enclosed as
r Renewal of NOC for GW abstraction was
applied on 25.0?-.2021 vide application no:
?-l 4/613/CTIMlN/2017. Site inspection by
CGWU, Raipur is awaited.
4.1 U) Monitorirlg of Project
Being complied with.
. Eight ambient air quality rnonitoring stations
have been established (four in buffer zone and
four in core zone) Llased on the rneteorological
data, topographical features and in
r:onsultation wrth the State pollution Control
Uoa rd.
r For Onlinet rnonitoring of CAAQMS and real
tirne data acquisition, sig,nal availability add on
c.ard '4-20 analog port is installed in the lO T
devicc of analyzer.
r A r;opv of latest Invironrnental Monitoring
report and heavy rnetal rn air re
Adequate ambient air quality rnonitoring
stations shall be established in the core zone
as well as in the buffer zone for monitoring
pollutants, narnely PM10, PM2 ,, SO, 3pl N Ox.
Location of the stations sha ll be decided based
on the rneteorological data, topographicalfeatures and envirr:nrrrentally and ecologically
sensitive targets in consultation with the
State Pollution Control Boarcl. Online arnbient
air quality rnonitoring stations rnay also be
installed in addition to the regular rnonitori
stations as per the requirernent and/or
consultation with the SPCU. Vlonitorirrg
tn
o
ii
L-.-,_-_,-

heavy metals such as llg, As, Ni, Cd, Cr, etc to
be carried out at least once in six months.
enclosed as ldnn*:x*rs--?-? &,&*n*xur* ff*; 35J.
I he Ambient Air Quality monitoring in the
core zone shall be carried out to ensure the
Coal lndustry Standards notified vide GSR 742
(E) dated 25.9.2000 and as amended from
time to time by the Central Pollution Control
Board. Data on ambient air quality and heavy
metals such as Hg, As, Ni, Cd, Cr and other
monitoring data shall be regularly reported to
the Vlinistry/Regional Office and to the
CPCB/SPCB.
Being complied with.
Eight ambient air quality monitoring stations
have been established (four in buffer zone and
four in core zone) based on the meteorological
data and the readings are being submitted
regularly to CECB and also to MoEF&CC Nagpur
at regular interval.
The effluent discharge (mine waste water,
workshop effluent) shall be monitored in terms
of the parameters notified under the Coal
lndustry Standards vide GSR 742 (E) dated
25.9.2000 and as amended from time to time
by the Central Pollution Control Board.
Being complied.
Regular/ fortnight Monitoring done by CMPDI
and reports sent to CECB at regular intervals.
IV The monitoring data shall be uploaded on the
company's websrte and displayed at the
project site at a suitable location. The circular
No. )-2001,2/1/2006-1A.11 (M) dated
21.05.2009 issued by Ministry of Environment,
Forest and Climate Change shall also be
referred in this regard for rts compliance.
Being complied.
Continuous Ambient Air Quality Monitoring
Station has been installed at Dipka Area since
18.01.201-4 and readings are regularly being
monitored.
Regular monitoring of ground water level and
ouality shall be carried out in and around the
mine lease area by establishing a network of
existing wells and constructing new
piezometers during the mining operations. The
monitoring of ground water leve ls shall be
carried out four times a year i.e. pre-monsoon,
monsoon, post-monsoon and winter. The
ground water quality shall be monitored once a
year, and the data thus collected shall be sent
regularly to Ministry of Environment, Forest
and Cllmate Change/Regional Office.
Being complied with.
r A total 08 no. of piezometers have been
constructed at the project and also established
a network of existing wells where water Ievels
are monitored.
r Out of 08 no. of piezometers, 04 were installed
recently at the down dip of the project; the
locations are Anganbari school premise at new
Suwabhondi village and at Sarva Shiksha Vlilan
near Hardi Bazaar (Amgaon and Bhilai Bazaar
junction).
. Regular monitoring of piezometer is being
done through Civil Dept. The reading of
piezometer for the last six months is given in
r rj Il r';,r1: .:, ifr:li ,'r.l.il ; : . a
. Monitoring of ground water level in and
around the mine lease area using existing wells
for every 03 months once. The copy of the
report is enclosed as
i
24
i
Vi Monitoring of water quality upstream and
downstream of water bodies shall be carried
out once in six months and record of
monitoring data shall be maintained and
submitted to the Ministry of Environment,
Forest and Climate Change/Regional Office.
Being complied.
Monitoring is being done by CMPDIL and report
sent to CECB on monthly basis.
vil The project proponent shall submit six monthly
reports on the status of the implementation of
the stipulated environmental conditions to the
Ministry of Environment, Forest and Climate
Change/Regional Office. For half yearly
monitoring reports, the data should be
monitored for the period of April to September
and October to March of the financial years.
Being complied with.
i. Six monthly EC compliance report are being
sent to MoEF & CC, Nagpur Office bi-
annually.
ii. Last compliance report was submitted vide
our letter no 2047, dated- 06.11.2020 for
the period April 2020 to September 2020.
vilt The Regional Offlce of this Mrnistry shall
monitor compliance of the stipulated
conditions. The project authorrties should
extend full cooperation to the officer (s) of
the Regional Office by furnishing the
requisite data / information/monrtoring
reports.
Agreed to comply
4.1(k) Miscellaneous
i Efforts should be made to reduce energy
consumption by conservation, efficiency
improvements and use of renewable energy.
Being complied with
1. Halogen lamps were replaced by energy
efficient LED Lighting system ln the mines.
2. During 2O2O-21,3323 no. of LED lights were
procured for installation and the total
expenditure incurred was Rs.81.70 lakhs.
3. Proper maintenance of Lighting, working of
AC cabins, electrical equipment's etc. in
HEMM are ensured.
The project authorities shall inform to the
Regional Office regarding commencement
of mining operations.
Complied.
A copy of the environmental clearance shall
be marked to concern Panchayat. A copy of
the same shall also be sent to the concerned
State Pollution Control Board, Regional
Office, District lndustry Sector and
Collector's Office / Tehsildar Office for
information in public domain within 30 days.
Complied.
Information of extended EC accorded by MoEF
& CC for 35 MTY coal production was
submitted to CECB, the Collector's Office;
Tehsildar's Office and concerned Panchayats.
I-he EC shall be uploaded on the
company's website. The compliance status
of the stipulated EC conditions shall also be
uploaded by the project authorities on therr
Complied.-Ihe six monthly EC compliance has been
uploaded in the official SECL website.
ii
i
website and updated at least once every six
months so as to bring the same in public
doma in.
The project authorities shall advertise at
least in two local newspapers widely
crrculated, one of which shall be in the
vernacular language of the locality
concerned, within 7 days of the issue of the
clearance letter informing that the project
has been accorded environmental clearance
and a copy of the clearance letter is
available with the State Pollution Control
Board and also at web site of the Ministry of
Environment, Forest and Climate Change at
www.environmentclearance.nic.in and a
copy of the same shall be forwarded to the
Regional Office.
Complied.
The 35 IVITPA EC extension was published in Lok
sadan (Korba), Navbharat (Bilaspur) &
Navbharat (Raipur) on 18th June 2020. The copy
is enclosed as
vi The environmental statement for each
financial year ending 31 March in Form-V is
mandated to be submitted by the project
proponent for the concerned State Pollution
Control Board as prescribed under the
Environment (Protection) Rules, 1986, as
amended subsequently, shall also be
uploaded on the Company's website along
with the status of compliance of EC
conditions and shall be sent to the respective
Regional Offices of the MoEF&CC by e-mail.
Concerns rose during public hearing.
Being complied.
Environmental Audit Statement is regularly
submitted to CECB and MoEF-Nagpur Offices.
vil Th e Vlin istry may stipu late a ny f u rthe r
condition for environmental protection, if so
required in due course of time.
Agreed
viii The above conditions will be enforced inter-
alia, under the provisions of the Water
(Prevention & Control of Pollution) Act,
1974, the Air (Prevention & Control of
Pollution) Act, l-981, the Environment
(Protection) Act, 1986 and the Public Liability
Insurance Act, 1991 along with their
amendments and Rules and any other orders
passed by the Hon'ble Supreme Court of
lndia/High Courts and any other Court of Law
relating to the subject matter.
Agreed
5 The proponent shall abide by all the
commitments and recommendations made
Agreed to comply
26
t
in the EIA/EMP report and also that during
presentation to the EAC. All the
commitments made on the issues raised
during public hearing shall also be
implemented in letter and spirit.
6 The proponent shall obtain all necessary
clearances/approvals that may be required
before the start of the project. The IVlinistry
or any other competent authority may
stipulate any further condition for
environmental protection. The Ministry or
any other competent authority may
stipulate any further condition for
environmenta I protection.
Agreed to comply
7 Concealing factual data or submission of
false/fabricated data and failure to comply
with any of the conditions mentioned above
may result in withdrawal of this clearance
and attract action under the provisions of
Environment (Protection) Act, 1986.
Agreed
8 Any appeal against this environmental
clearance shall lie with the National Green
Tribunal, if preferred, within a period of 30
days as prescrrbed under Section 16 of the
NationalGreen Tribunal Act, 2010.
Agreed to comply
9 The coal company/project proponent shall
be liable to pay the compensation against
the illegal mining, if any, and as raised by the
respective State Governments at any point of
time, in terms of the orders dated 2nd
August,2017 of Hon'ble Supreme Court in
WP (Civil) No.114/201,4 in the matter of
'Common Cause Vs Union of lndia & others'.
Agreed to comply
10 The project proponent, without pre.ludice to
this EC, shall be bound to comply wrth any
other interpretation of the orders of Hon'ble
Supreme Court also, in due course of time.
Agreed to comply
1.1. This EC supersedes the earlier EC granted
vide letter No.J-11015 /481l2OO7-lA.ll (M)
dated 06.02.2015 with a capacity 31 lvlTPA.
Agreed
anager (M),
Project, SECL.Dipka Expansio
27
No.
4 (i) EAC desired that the IVoC may direct CIL
subsrdiarres to r:ornply the ECIfC/CIO
conditions strictly within certain tinie bound
manner so that the mining, operations wrll be:
environmenta lly sustai na ble/vrable etc.
Agreed
Partially Complied
The site identified for plantation of 50000 no. of
native species (Sagwan) is at Kasarpali for an area
of 20 Ha. A 05-year scheme was prepared
through Divisional I-orest Office, Katghora and
DFO raised a demand of Rs. 99.91 lakhs. The
payment is under Budgetary concurrence
(ii) Also, EAC asked project proponent to plant
50,000 nos. of native trees (excluding other
conditions of plantation given by this Ministry)
with broad leaves along the villages and
transportation route to prevent the effect of
air pollution in three years" After completion
of tree plantatron, number of trees shall be
duly endorsed from District Forest Office.
All Partially and non-complied conditions
reported by Vlinistry's ilegronal Office in itscertified r-ompliance report dated 2Jtn
November,2019 shall be completed in 2 years
from the date of issue of this letter.
Agreed to comply
(iv) Ihe project proponent shall comply with all
the statutory requirements and judgment of
tlon'ble Supreme Court dated the 2nd August
2011 in Writ Petition(Civil) No. 114 of 2014 in
the matter of Common Cause versus L.l nron of
lndia and Ors" State Government shall ensure
that the entire compensation levied, if any, for
illegal mining paid by the project proponent
through their respective department in strict
compliance of judgment of Hon'ble Supreme
Court dated the 2nd August 2017 in Writ
Petitlon(Civil) No. 114 of 2014 \n the matter of
Common Cause versus Union of lndia and Ors.
State Govcrnrnent.
Agreed to comply
(v)
COMPLIANCE STATIJS OF THE CONDITIONS IMPOSED IN TI-IE EC LETTER ISSUED VIDE LETTER NO
)_tr.ol,slAEZl2QqZ:l.AJ.llMl!_r-__Qr{9.03.202919_8 EXpANslQIloF Qle(A_o_EN_EA5_r_qQA!_t4_lN!
!8qu 3l rvr]?L ro 3s MrPA AS ON 30.09,2020:
EC Conditions Com liance Status
(iii)
Project Proponent shall obtain the necessary
prior permission f rom the Centra I Ground
Water Authority (CGWA) in case of
intersecting the Ground water table. The
intersecting ground water table can only be
commence after conducting detailed
hydrogeological study and necessary
permission from the CGWA. The report on six
monthly basis on changes in Ground water
level and quality shall be submitted to the
Regronal Office of the IVlinistry, CGWA and
State Pollution Control Board"
Being Complied
. Approval for 23.20 lakh cum/year withdrawal
of ground water was obtained vide NOC No:
CGWA/NOC/MlN /OR|G/201.914890 dated:
14.03.2019, from CGWA, IVlinistry of water
Resources (Gol). The NOC was valid upto
25.02.2021.
. Renewal of NOC for GW abstraction was
applied on 25.02.2021 vide application no 21--
4/673/Clll\AlN/2017. Site inspection by
CGWB, Raipur is awaited.
r Rcgular lVonitoring of Ground Water level is
carried out through 04 sets of piezometers
ated locations and
28
i
constructed at des
W

readings of the same is submrtted along withevery six monthly EC Compliance Report.
The Ground Water Quality is measured duringevery 3 months by CMPDIL. Thc Ground Water
Quality Report for the period January'21 to
a
March'21 is enclosed as {Artrz*xur* Na. 23}.(vi) Proponent shall appoint an Occupational
Health Specralist for Regular and periodical
nredical exarnination of the workers engaged
in the project and rnaintain records
accordingly; also, Occupational health check-
ups for workers having some ailrnents Iike Bp,
diabetes, habitual srnoking, etc. shall be
undertaken once in six months and necessary
remedial/preventive rneasures takenaccordingly. The recommendations of Nationallnstitute for ensuring good occupationalenvironment for ensuring good occupationalenvironment for mineworkers shall be
implemented; The prevention measure forburns, rnalaria, and provision of antisnake
venom including all other paramedical
safeguards may be ensured before initiatingthe mining activities.
Project Proponent shall follow the mitigationrneasures provided in office memorandum no.
Z-11013 lst /2014-1A.il(M), dated 29tf, October,2014, titled "lmpact of mining activities on
l-labitations-lssues related to the rnining..,L^-^ .- r r--i -
Lne parr Qr rnlne lease aieaS oi" Habitatioi.rslrln \/lllaooc i)ro cr rrr^rr^d^/l li1, +h^
-i^.. l-----^_..". _,.,"o*, ,rilrtL tLoJE
rL rrL l\JrvlELL
-i^^^:--- -J:--- | a : a
ttrdtLtt Ut ltlH \/t tt.tpP\ tr,t -tlptt r tat(a Trt rntnrno':a
ooerattons l-lahit;rfions havc, ;i riohi fnr, :.. ": t:: - :-.-J- -l-.,vurr\rrLJJ oltu ttillilttlOt tlUt)E II::VUl5 rlL III$,llL.
P[)s rnLtst r.nqlJrar th;rt tho l'rinlnrrirrl r-lr;r1,,.(r! v,vr\/r\ruu
L:r.-.. :rrrut)!r uij(viircu uv uiiL",iLiiiil rii(j
f|..,.!t;;-L... I -------t-^ --...--.. r-I lLl(ltl I lt' I I I \/ I I l.l\K \ .ltn/.1\/ I r alrTl I rlar \/ll llOArC 1)r\rl
EF/'r rx LrrE trut)lJ tcvut5 welt wil,lllll LIlg
a rea
I rrrr rna !1!
Being Complied. Regular Periodical lVledical txamination (pVf E)
of the workers engaged in the project is carriedout through Pragati Nagar Dispensary of Dipka
OC Project under the supervision of Chief
Medical Officer..l-lealth checkup for occupational diseases and
hearing impairment are covered under pME.
Details are iven below:-
Year Target Achievement2016 De t.:570 De 5t1
Cont.:230 Conl.:226
2017 De 564 De 545
Cont.:170 Cont.: 180
201_8 De 564 564
Cont.:170 Cont.:37
2019 Dept.:556 556
Cont.:170 Cont.:952020 De t.:550 De l.:312
Cont.:52 Cont.:50
Being Complied
The cr:mpliance of mitigation measures provided
in OM no: Z'11013 /57/2014-lA.lt (M), dated 29th
October, 2014 is attached i)s ,',':1 ,;1.;.,.,;, ::. t.,,)..', .i .'
urrrrt LvlttlJItEu
- iii:rr,,i,, ,i i,,^ -,^d ^,.,,".; .,i ^-^.^^. -:!-- :-rIrrruLrvrr utru )uuttu (tl !rtr.rlt:.t_t- 5lLeS l\
^-J _- ,. ' rl
'-- -- r-"i iiirrrru i^r,^i ,..^^;+,.,i^^ ;- i^^.-^ .J^^^ L..
vrr r!;ruiui uGiii ui oci iiiL- ilif'rai iiii ii
Ytl!tlr!t! !r\
l-ire or"r-.!er-t r:rrlr.rr.rnlpot i l--i-.'-li i:tlo :rii D^i-- r^--i:^J
rrrrirj-Irrlirtn:ri,r rrr^:r.,,r^I .i,,,.i,.,.:,",:"'y r'lLqiurL-) uu!t!tli rIIilttX
-
r)nf:r;ltlr)r1 iair rnn<orrr:rtitrr :rrirl rirni..-ii^",.ilULLULIVI '
UI
c -ri,- r.-.- ".-''i
a-.,,'-,.-, if -, --., - ----++^.! i -.,1. -- --!. . i- .LrruurrFlLrru rourta, tt at tv, )uuLtcu ill LIle 5LUUy
i-., - --I- X I I.l
I l'rr: I
LPur sv vy I I rrr:
a l-rr\ rr,_\- -' '''-'i+4.^,J -,+ . L^ioii vvu-_r )UiXjitLiCU q\ LiiU
(vii)
area. Action plan for conservation of flora and
fauna shall be prepared and implernented in
consultation with the State Forest and Wildiife
Department. A copy of action plan shall be
submitted to the ministry of Environment,
Forest and Climate Change and its Regional
Office.
Katghora vide our letter no: 2056 dated-
13.11-2020 for preparation of scheme and
demand note
As per the recommendation in the WL plan, a
2.00 l-la site has been identified at Chainpur
village to develop an herbal garden. The work
is being taken up thrsough CGRVVN, Korba
and the scheme is under preparation.
a
(x) Hon'ble Supreme Court in an Writ Petition(s)
Civil No. 114/2014, Common Cause vs Union
of lndia & Ors vide its judgment dated 8th
January, 2020 has directed the Union of India
to impose a condition in the mining lease and
a similar condition in the environmental
clearance and the mining plan to the effectthat the mrning lease holders shall, after
ceasing mtning operations undertake
regressing the mining area and any other area
which may have been disturbed due to theirmining activities and restore the land to a
condition which is fit for growth of fodder,
flora, fauna etc. Complrance of this condition
after the mining activity is over at the cost of
the mining lease holders/Project proponent".
The implementation report of the above said
condition shall be sent to Regional Office ofthe Ministry.
Agreed to comply
5 All other terms and conditions stipulated in
the said environmental clearance dated 2Oth
February, 2018 shall remain unchanged
Agreed
G ager (M),
Dipka Expansion Project, SECL.
i
30
W
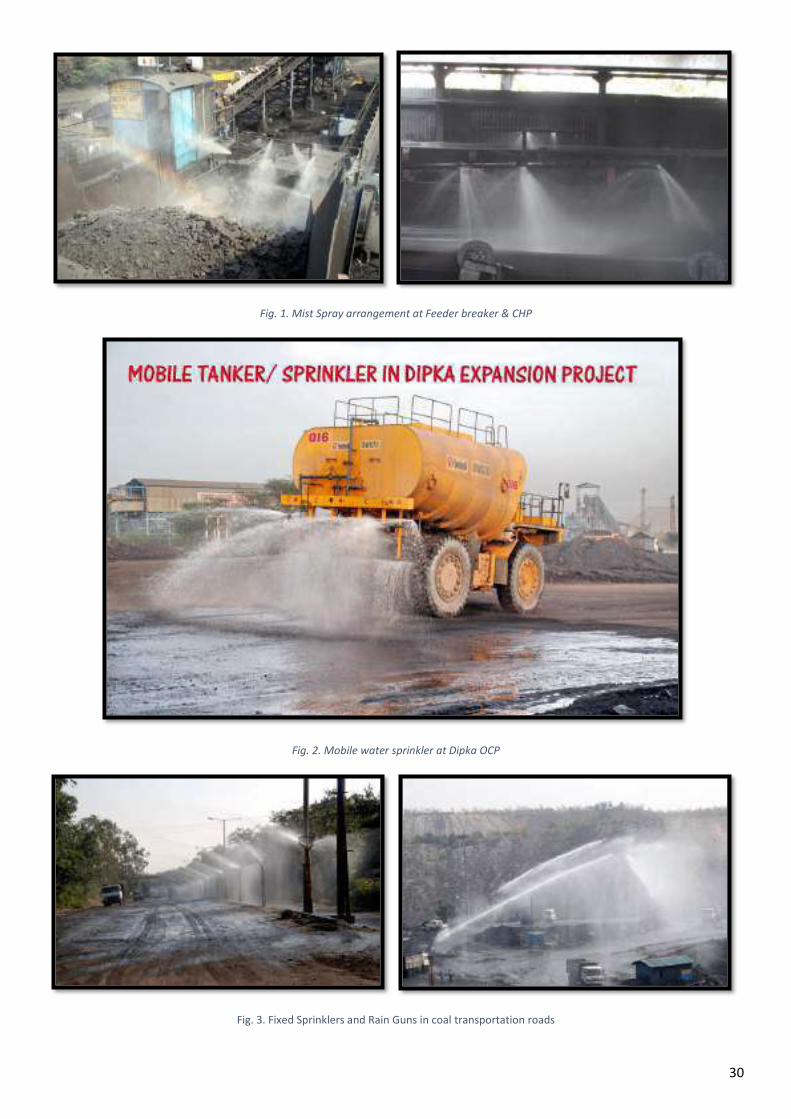
30
Fig. 1. Mist Spray arrangement at Feeder breaker & CHP
Fig. 2. Mobile water sprinkler at Dipka OCP
Fig. 3. Fixed Sprinklers and Rain Guns in coal transportation roads
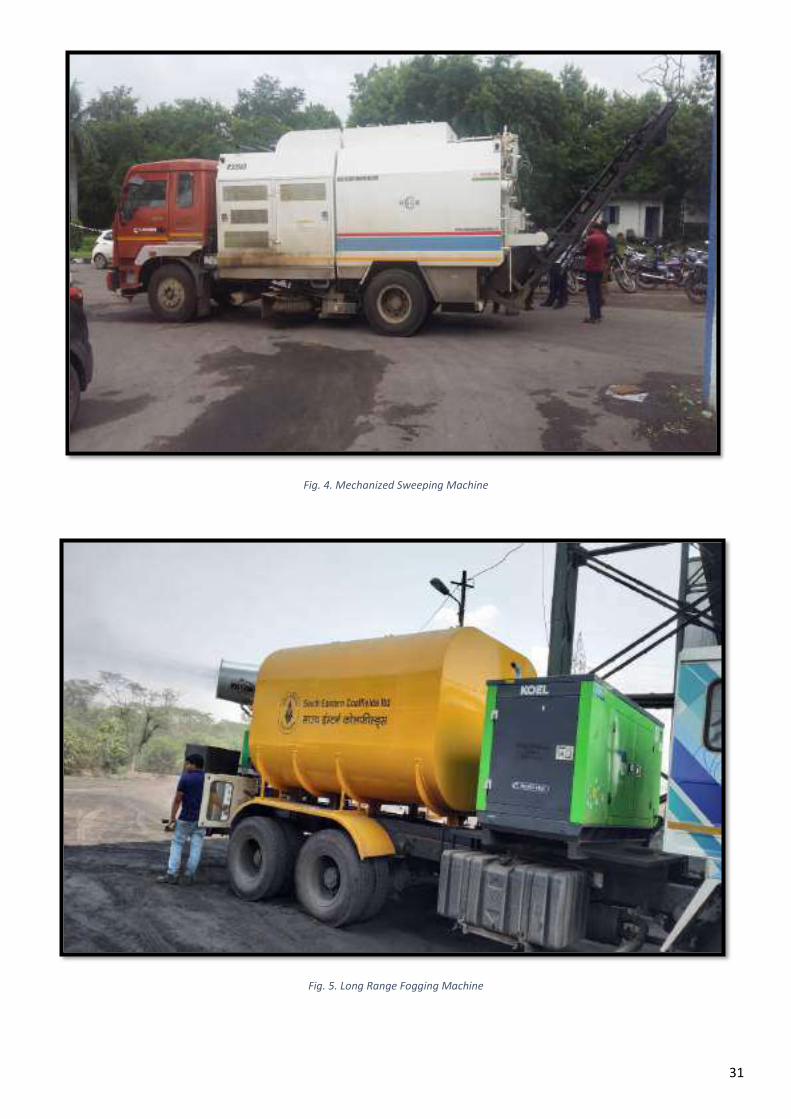
31
Fig. 4. Mechanized Sweeping Machine
Fig. 5. Long Range Fogging Machine
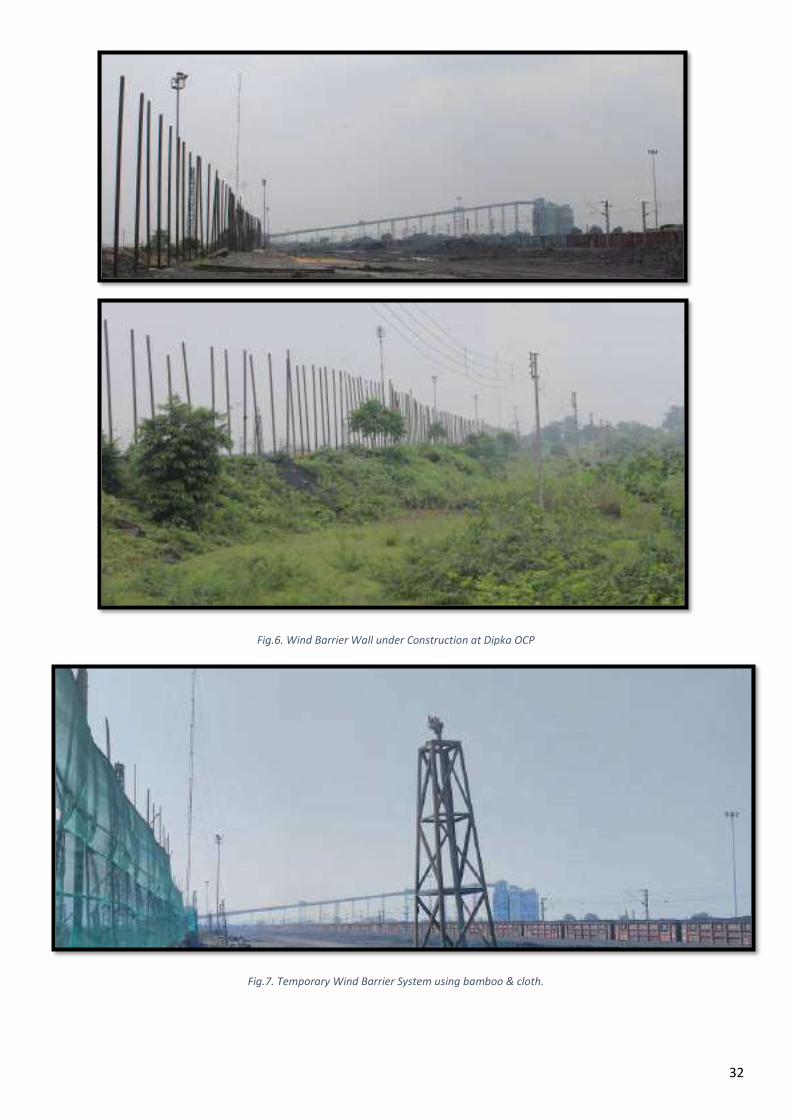
32
Fig.6. Wind Barrier Wall under Construction at Dipka OCP
Fig.7. Temporary Wind Barrier System using bamboo & cloth.
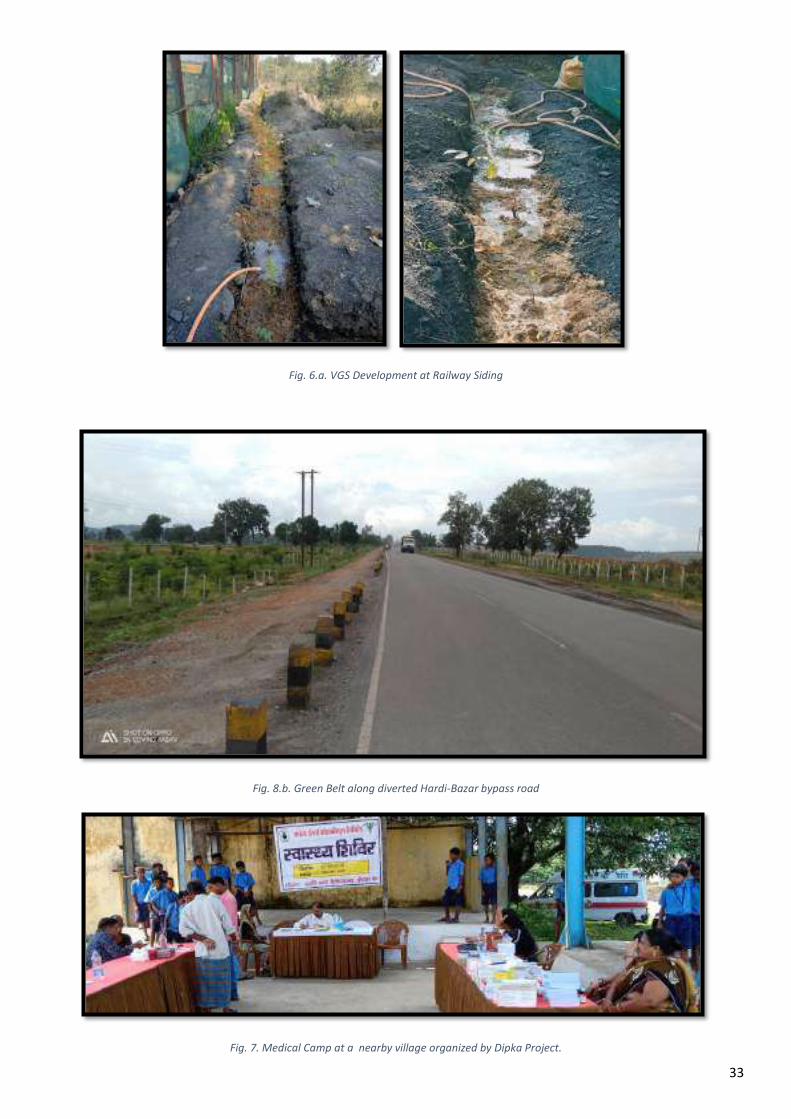
33
Fig. 6.a. VGS Development at Railway Siding
Fig. 8.b. Green Belt along diverted Hardi-Bazar bypass road
Fig. 7. Medical Camp at a nearby village organized by Dipka Project.

34
Fig. 8. Sal Plantation near Bihi-Bagicha during 2019
Fig. 9. Top Soil Storage site at Dipka OCP

35
Fig. 10. Plantation at Dipka OCP through CGRVVN
Fig. 11. Check Dams under construction at Renki Dump of Dipka OCP
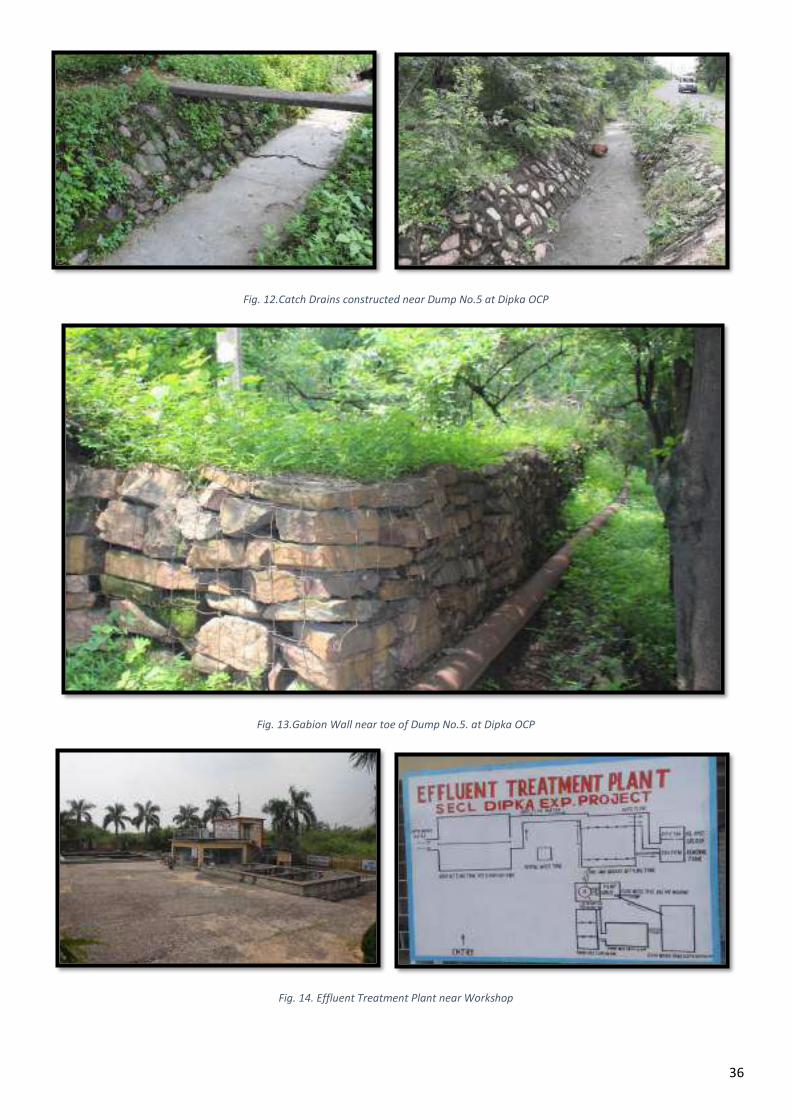
36
Fig. 12.Catch Drains constructed near Dump No.5 at Dipka OCP
Fig. 13.Gabion Wall near toe of Dump No.5. at Dipka OCP
Fig. 14. Effluent Treatment Plant near Workshop
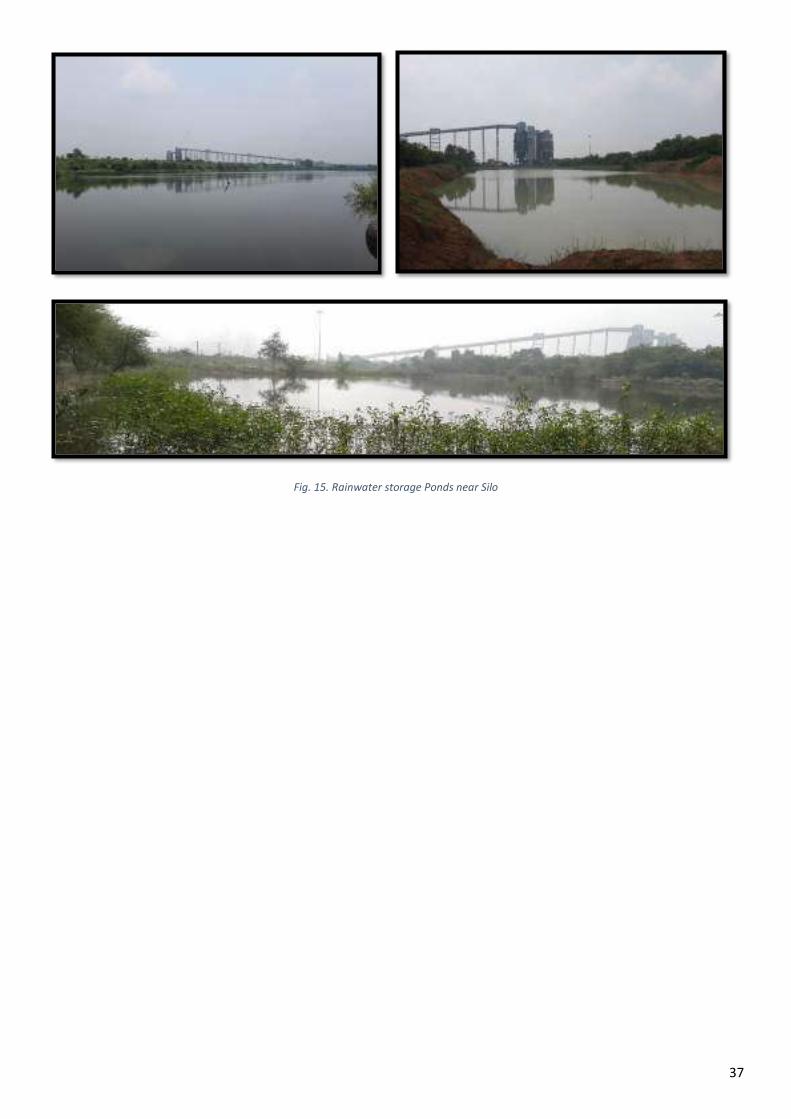
37
Fig. 15. Rainwater storage Ponds near Silo
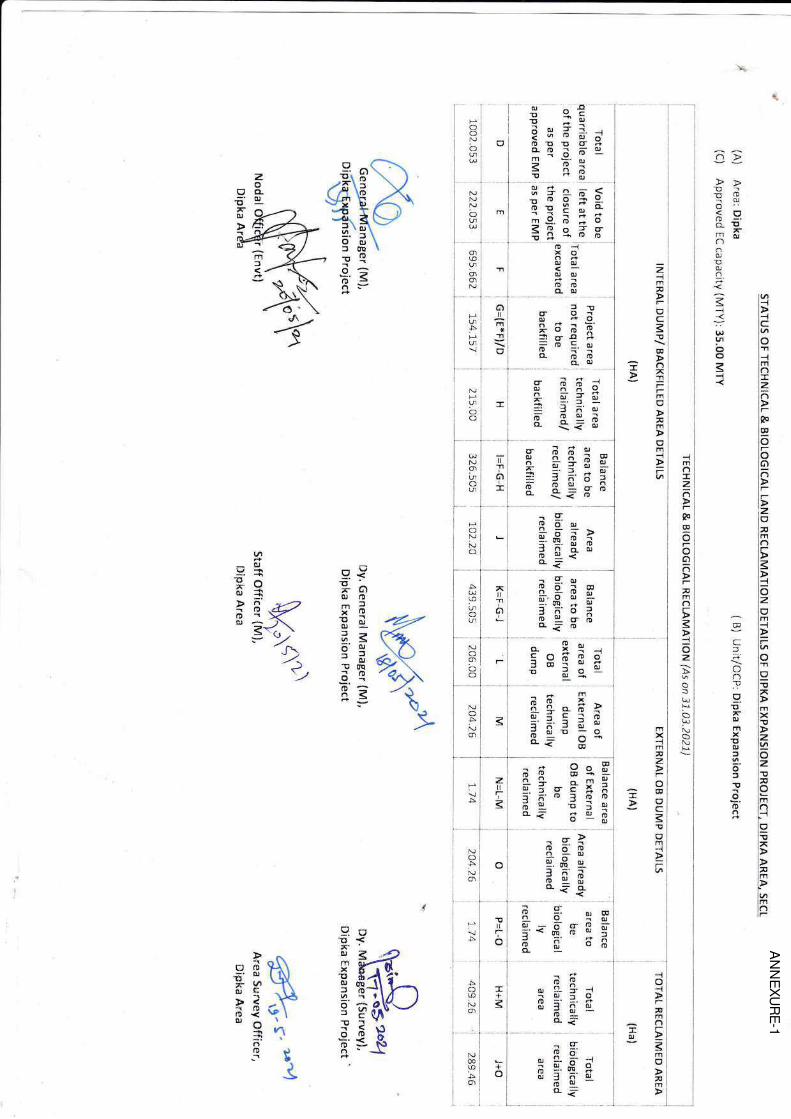
a)>
!noroo'<oo-.CLE-Intur)()c)co)cl.
a
tal libaoro --i
-{ra\
-lew
o-o6)a')
-t-r>.2i(]:umr);7t-.t
oztlm
w-{.=.h
alo^-lr-lv.1, i-lxY. i>!l-6'+-f i,:.i torln
r!
xd9. 1;olnalJd L,
lo!x>nm
Lm..]a-
1e-aS:Efi!.hla[*ilB-
0
Eo
015!ooo-m
!
x,om
=
o
()C)
!OUI
azoo-o)
m
g:o-o)
f0,)
oqo!
oo6
6
-oY.<P;)oJO
seET-a36'9-o)tda6q6'=6<
v
Eo
ia€U^r\
3-r' \_ ./t\,.,.)
Eg",q;f!t1or)j-b
3
\
Bin E3$,l'of i:q a't 3 e o6u r jPo-€ 69rn
-9:Im^6rr=o9.8 g-
I-;o$'dio.. g
,i. s' -'l r
: <g lJ 3 !d I irl;
0) :-i a_ -i-rUrOrc ::' =. r+^,
-f at !!*.6 1'--rr<-
_g.OO
-. at :- -.J
-o.!iOfu rj. vl. .ro-,lrro
;o-'
1
I's!
()UJ
iro)
\lbt\)\
U5
v\(:
o
a';'7$ornx.(,o)56.
of,.E
oo6
l:U
.+
o
f!c0U)\o\
N
NO
(!
m
2-jmF
-oC
.E
CE
?.1
r-mU
nm
om-t
rima)Iz6-eo
E
ro6)6-xm.)r
3-1ozEo
(^)
q)$,f\)Ol.r
oU]
o)o!
n
o-lxoooaoooo-a
J!fo-il+O
*6;E'l: ri i.ir,o='Io-frio
oo
ojo
J6tuoo:R..= U
onx*o
f'Ur!
d)il
rl*
t
o
-N
alO
NIu(fU]
OPNC)
TiI
C}
I
EffX*il- r- ii 9l-
e aiil<<- lD
-s:Ss ;- f="i.oOJ !l o-oo 11.<
- 9q3o;P-.o qr :-
f -'o ?o 9rhio-<o
o-xlr5903e:*i^o
o-06r:I::o
tr
IC)
i<ila1
o
-C)
IC)c)
frximxz-o
T
C
orI"JDr
NOI:NO)
r;tuxi{aoePii:i c - nj:: A'J o -* o-o -Of,*= g -
r!5
zII-
N().ANo
!tlr-
-Il.
I
"t.-i
r-'nrt6-E
rnC'
Am
o
f,.oEoo6
ilt00
,
AN
NE
XU
RE
-1
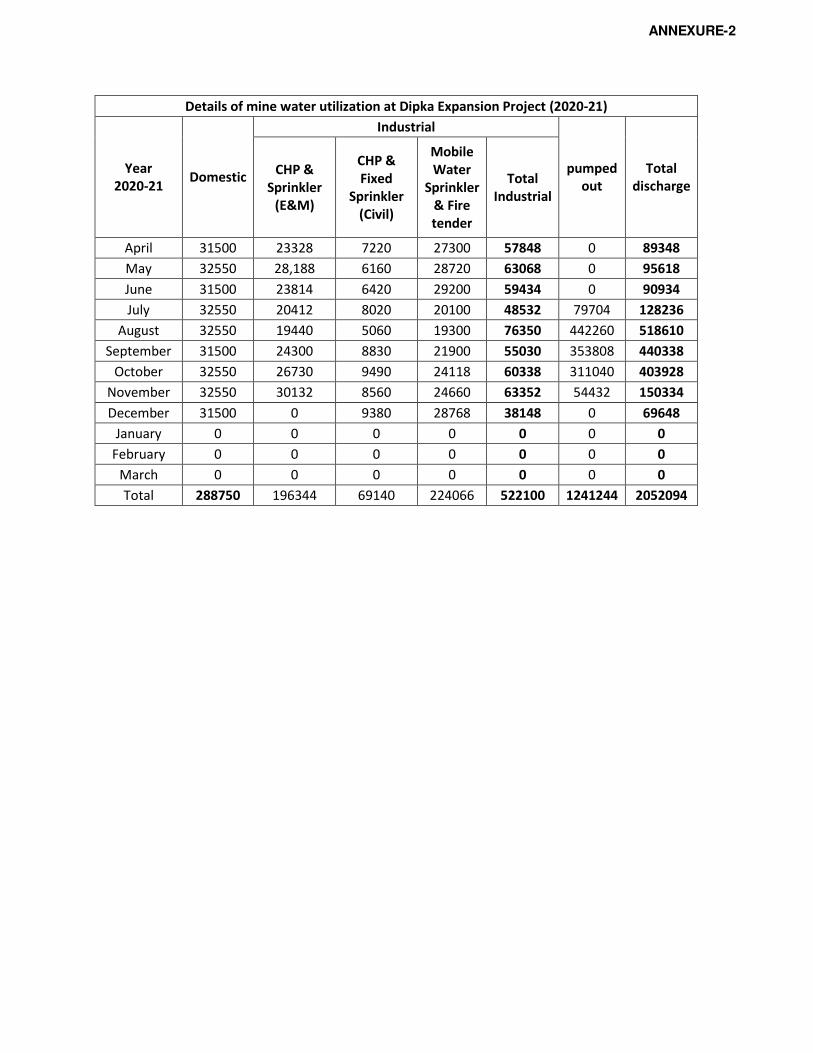
Details of mine water utilization at Dipka Expansion Project (2020-21)
Year
2020-21 Domestic
Industrial
pumped
out
Total
discharge
CHP &
Sprinkler
(E&M)
CHP &
Fixed
Sprinkler
(Civil)
Mobile
Water
Sprinkler
& Fire
tender
Total
Industrial
April 31500 23328 7220 27300 57848 0 89348
May 32550 28,188 6160 28720 63068 0 95618
June 31500 23814 6420 29200 59434 0 90934
July 32550 20412 8020 20100 48532 79704 128236
August 32550 19440 5060 19300 76350 442260 518610
September 31500 24300 8830 21900 55030 353808 440338
October 32550 26730 9490 24118 60338 311040 403928
November 32550 30132 8560 24660 63352 54432 150334
December 31500 0 9380 28768 38148 0 69648
January 0 0 0 0 0 0 0
February 0 0 0 0 0 0 0
March 0 0 0 0 0 0 0
Total 288750 196344 69140 224066 522100 1241244 2052094
ANNEXURE-2

ANNEXURE-3
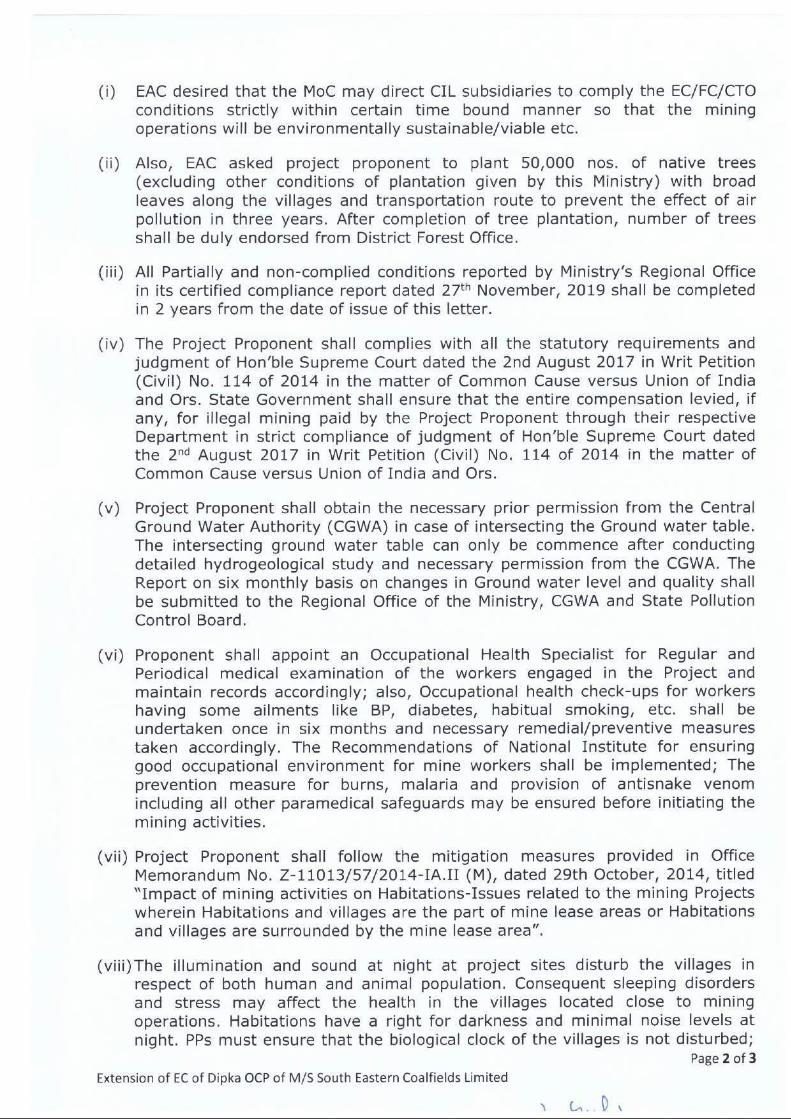
FINAL REPORT
ON
COMPREHENSIVE STUDY FOR DIPKA & GEVRA OCPs
REGARDING CARRYING CAPACITY OF THE ECO-SYSTEM
TO ASSESS OPTIMAL MINING OPERATIONS WITH
MINIMAL IMPACT ON ECO-SYSTEM SERVICES
ANNEXURE-4
FINAL REPORT
ON
COMPREHENSIVE STUDY FOR DIPKA & GEVRA OCPs REGARDING CARRYING
CAPACITY OF THE ECO-SYSTEM TO ASSESS OPTIMAL MINING OPERATIONS
WITH MINIMAL IMPACT ON ECO-SYSTEM SERVICES
Submitted To
The General Manager
SECL, Bilaspur
By
Professor Aarif Jamal
Principal consultant
Department of Mining Engineering
Indian Institute of Technology (BHU)
Varanasi – 221005
December 2019

Title of Consultancy Project
COMPREHENSIVE STUDY FOR DIPKA & GEVRA OCPs REGARDING CARRYING CAPACITY
OF THE ECO-SYSTEM TO ASSESS OPTIMAL MINING OPERATIONS WITH MINIMAL
IMPACT ON ECO-SYSTEM SERVICES.
Name of Consultants
1. Principal consultant Prof. A. Jamal
Professor& Former Head
Department of Mining Engineering
Indian Institute of Technology (B.H.U)
2. External Expert/ Consultants Prof. S. Ratan
Retired Professor & Former Head
Department of Mining Engineering
Indian Institute of Technology (B.H.U)
Prof. R. Kumar
Former Director (Tech) &Visiting Faculty
Department of Mining Engineering
Indian Institute of Technology (B.H.U)

PREFACE
Large scale mining activities are allowing urbanization and industrialization near coalfield
has an impact on the natural ecosystem. Opencast coal mines generally result in
significant visual and ecological effects. It drastically damages flora and fauna, thereby
reducing biodiversity and disrupting fundamental environmental relationships. It also
deteriorates soil characteristics and modifies the topography and alters soil properties.
The signs of stress on the essential natural assets like air and water are evident from the
deteriorating air quality, soil degradation, polluted groundwater, rivers and streams, and
the general status of the environment in mining areas. The envisaged economic benefits
from such large coal mining projects cannot be fully realized unless they are
environmentally and socially sound and sustainable. It is now well recognized that, for
sustainable development and optimal use of natural resources, environmental
considerations are required to be integrated into the planning, designing, and
implementation of mining and industrial development projects. The air, water, noise, and
soil are the significant components of ecosystem services, and impact on them to be
within the acceptable limits determines the carrying capacity of a particular mining area.
Field studies and preliminary laboratory investigations have revealed that the effects of
mining activities in the study area are higher on air quality in comparison to water and
soil. There is no severe deterioration of water quality in the study area and can be
controlled easily with the application of conventional control processes. The soil is the
least affected parameter. Since air is the most affected parameter by opencast coal
mining activities, hence in this report, detailed investigations have been carried out on
this significant parameter along with gaseous pollutants like SO2 and NOX. The other
parameters related to water and soil has also been included in the report.
The services and advice of external consultants/ experts – Professor Shambhu Ratan,
Professor, and Former Head, Department of Mining Engineering, IIT BHU and Dr.
Ramesh Kumar, Former Director (Technical) of Central Coalfields Limited, provided
during the completion of the work and preparation of the Final Report is gratefully
acknowledged. Finally, I would like to acknowledge the support and help provided by
SECL Management to our research team working in this project.
(AARIF JAMAL)
CONTENTS
CHAPTER-I INTRODUCTION
CHAPTER-II BRIEF DESCRIPTION OF PROJECTS
2.1 GEVRA OPENCAST PROJECT .................................................................................................. 9
2.1.1 BACKGROUND OF THE PROJECT ............................................................................................. 9
2.1.2KORBA COALFIELD ................................................................................................................. 10
2.1.3 LOCATION .............................................................................................................................. 11
2.1.4 COMMUNICATION ................................................................................................................ 11
2.1.5 GENERAL GEOLOGY ............................................................................................................... 11
2.1.6 COAL BEARING FORMATION ................................................................................................. 12
2.1.7 SEQUENCE OF COAL SEAMS ................................................................................................... 13
2.1.8 STRUCTURAL SETTING ........................................................................................................... 14
2.1.9 DIP & STRIKE .......................................................................................................................... 15
2.1.10 FAULTS ................................................................................................................................. 15
2.1.11 BLOCK BOUNDARIES AND MINE BOUNDARIES .................................................................. 16
2.2 DIPKA OPENCAST PROJECT .................................................................................................. 16
2.2.1 BACKGROUND OF THE PROJECT REPORT .............................................................................. 16
2.2.2 LOCATION ............................................................................................................................... 17
2.2.3 COMMUNICATION ................................................................................................................. 17
2.2.4 PHYSIOGRAPHY ..................................................................................................................... 17
2.2.5 HIGH FLOOD LEVEL ................................................................................................................ 18
2.2.6 KORBA COALFIELD .................................................................................................................. 18
2.2.7 STRIKE & DIP: ......................................................................................................................... 18
2.2.8 FAULTS: .................................................................................................................................. 18
2.2.9 GEOLOGICAL BLOCK BOUNDARY .......................................................................................... 20
2.2.10 INING BLOCK BOUNDARY .................................................................................................... 20
2.2.11 SEQUENCE OF COAL SEAMS:................................................................................................. 21
2.2.12 DESCRIPTION OF COAL SEAMS: ............................................................................................ 21
2.2.13METHOD OF MINING ............................................................................................................ 22
2.3 ENVIRONMENTAL POLLUTION AND CONTROL MEASURES ...................................................... 26
CHAPTER-III: METHODOLOGY - ECOSYSTEM SERVICES AND CARRYING CAPACITYASSESSMENT
3.1 ECOLOGICAL FOOTPRINT .......................................................................................................... 35
3.2 ECOLOGICAL SAMPLING............................................................................................................. 36
3.3 DENSITY AND DISPERSION PATTERNS ....................................................................................... 38
3.4 CARRYING CAPACITY OF ECO-SYSTEM ...................................................................................... 38
3.5 METHODOLOGY FOR CARRYING CAPACITY OF AIRQUALITY ..................................................... 39
3.5.1 CARRYING CAPACITY OF AIRQUALITY ..................................................................................... 39
3.5.2 CARRYING CAPACITY OFWATER ............................................................................................ 40
3.5.3 CARRYING CAPACITY OF NOISE LEVEL .................................................................................... 40
3.5.4 CARRYING CAPACITY OF LAND .................................................................................................40
CHAPTER- IV: FIELD OBSERVATION AND INVESTIGATION
4.1.1 SELECTION OF AIR QUALITY MONITORING SITES ................................................................... 41
4.1.2 SELECTION OF WATER QUALITY MONITORING SITES ............................................................. 42
4.1.3 SELECTION OF SITES FOR SOIL QUALITY ASSESSMENT ............................................................ 47
4.2 SAMPLING EQUIPMENT FOR ENVIRONMENTAL QUALITY MONITORING .................................. 49
4.3 METHODOLOGY USED FOR AIR QUALITY MONITORING ............................................................. 54
4.4 METHODOLOGY USED FOR CALCULATION OF WATER QUALITY INDEX .................................... 55
4.5 AIR QUALITY AND WATER QUALITY ASSESMENT INDEX. .......................................................... 57
4.6 CHANGES IN LAND USED PATTERN ............................................................................................. 59
CHAPTER-V: CARRYING CAPACITY ASSESMENT OF THE STUDY AREA
5.1 ENVIRONMENTAL QUALITY MONITORING IN GEVRA OCP ....................................................... 68
5.1.1 ASSESSMENT OF AIR QUALITY ............................................................................................... 69
5.1.2 ASSESSMENT OF WATERQUALITY .......................................................................................... 98
5.1.3 ASSESSMENT OF NOISEQUALITY ...........................................................................................113
5.2 ENVIRONMENTAL QUALITY MONITORING INDIPKA OCP ....................................................... 114
5.2.1 ASSESSMENT OF AIR QUALITY ............................................................................................. 115
5.2.2 ASSESSMENT OFWATERQUALITY ..........................................................................................142
5.2.3 ASSESSMENT OF NOISE QUALITY ......................................................................................... 150
CHAPTER-VI: OUTCOME OF THE STUDY
6.1 CARRYING CAPACITY OF AIR .................................................................................................... 152
6.2 CARRYING CAPACITY OF WATER ............................................................................................. 153
6.3 NOISE LEVEL IN THE AREA. .......................................................................................................153
6.4 CHANGESIN LAND USED PATTERN ............................................................................................. 154
CHAPTER-VII: CONCLUSIONS AND RECOMMENDATION
7.1 CONCLUSIONS ......................................................................................................................... 155
7.2 RECOMMENDATION ................................................................................................................ 155
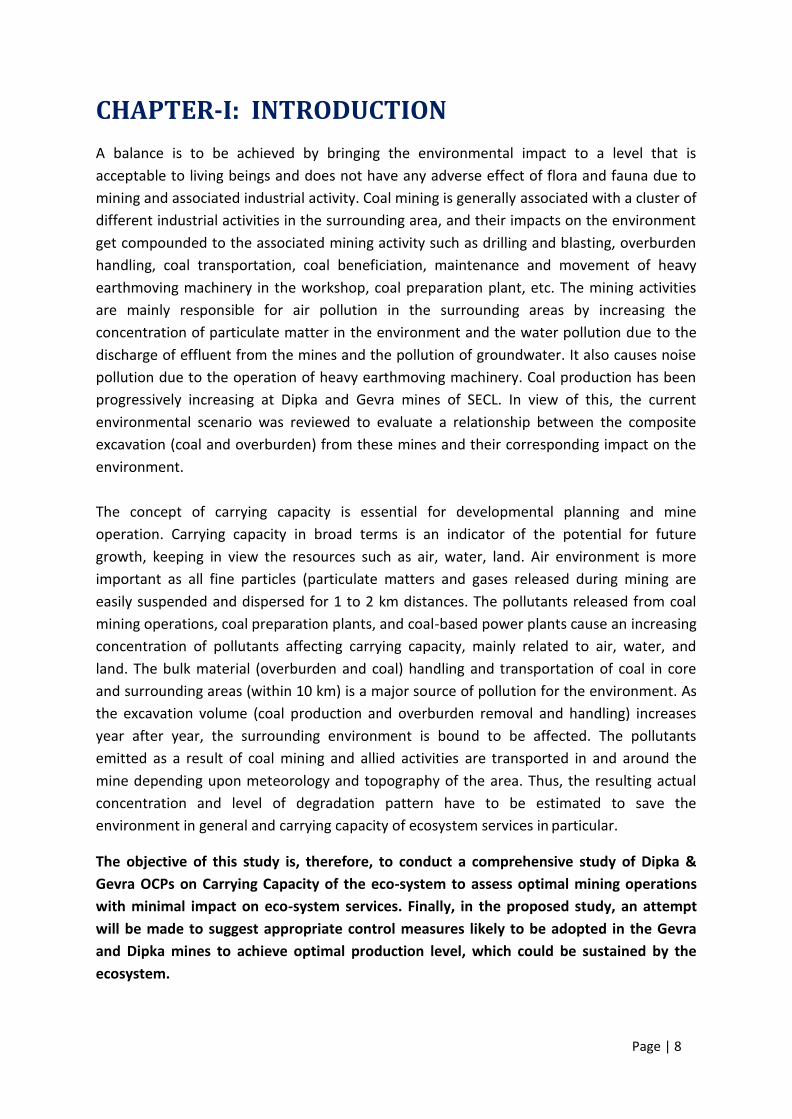
Page | 8
CHAPTER-I: INTRODUCTION
A balance is to be achieved by bringing the environmental impact to a level that is
acceptable to living beings and does not have any adverse effect of flora and fauna due to
mining and associated industrial activity. Coal mining is generally associated with a cluster of
different industrial activities in the surrounding area, and their impacts on the environment
get compounded to the associated mining activity such as drilling and blasting, overburden
handling, coal transportation, coal beneficiation, maintenance and movement of heavy
earthmoving machinery in the workshop, coal preparation plant, etc. The mining activities
are mainly responsible for air pollution in the surrounding areas by increasing the
concentration of particulate matter in the environment and the water pollution due to the
discharge of effluent from the mines and the pollution of groundwater. It also causes noise
pollution due to the operation of heavy earthmoving machinery. Coal production has been
progressively increasing at Dipka and Gevra mines of SECL. In view of this, the current
environmental scenario was reviewed to evaluate a relationship between the composite
excavation (coal and overburden) from these mines and their corresponding impact on the
environment.
The concept of carrying capacity is essential for developmental planning and mine
operation. Carrying capacity in broad terms is an indicator of the potential for future
growth, keeping in view the resources such as air, water, land. Air environment is more
important as all fine particles (particulate matters and gases released during mining are
easily suspended and dispersed for 1 to 2 km distances. The pollutants released from coal
mining operations, coal preparation plants, and coal-based power plants cause an increasing
concentration of pollutants affecting carrying capacity, mainly related to air, water, and
land. The bulk material (overburden and coal) handling and transportation of coal in core
and surrounding areas (within 10 km) is a major source of pollution for the environment. As
the excavation volume (coal production and overburden removal and handling) increases
year after year, the surrounding environment is bound to be affected. The pollutants
emitted as a result of coal mining and allied activities are transported in and around the
mine depending upon meteorology and topography of the area. Thus, the resulting actual
concentration and level of degradation pattern have to be estimated to save the
environment in general and carrying capacity of ecosystem services in particular.
The objective of this study is, therefore, to conduct a comprehensive study of Dipka &
Gevra OCPs on Carrying Capacity of the eco-system to assess optimal mining operations
with minimal impact on eco-system services. Finally, in the proposed study, an attempt
will be made to suggest appropriate control measures likely to be adopted in the Gevra
and Dipka mines to achieve optimal production level, which could be sustained by the
ecosystem.

Page | 9
CHAPTER- II: BRIEF DESCRIPTION OF PROJECTS
2.1 GEVRA OPENCAST PROJECT
2.1.1 BACKGROUND OF THE PROJECT
Gevra Opencast Project is an operating mine under the Gevra area of South Eastern
Coalfields Limited. Initially, Project Report was prepared for an annual capacity of 6.0 MT of
coal by CMPDI in March 1979, but it was approved in December 1979 for an annual capacity
of 5 MT. Later, for expansion of the Gevra Opencast Project report was prepared in March
1982 for an annual production of 10.0 MT. and was approved by the Government of India
on 18th September 1985. In the year 1992-93, a scheme for Gevra Opencast Project was
prepared for augmentation of production by another 2.0 MTPA and was sanctioned on 19th
September 1992 by CIL Board and was declared completed on 31st March 1995. A capacity
augmentation scheme for Gevra CHP (from 10 MTPA to 12 MTPA) was also prepared and
sanctioned on 31st July 1992. To enhance the production further, the project report for
Gevra O/C Expansion (25 MTPA) was prepared by CMPDI and approved by GOI on 12th July
2005. The mining Plan of the project for 35 MTPA was approved by the Ministry of Coal on
20.12.2006. Further, EC was granted vide letter no. J-11015/484/2007-IA.II(M) dated 3rd
June 2009 for capacity expansion from 25 MTPA to 35 MTPA in an area of 4184.486 Ha.
Environmental Clearance for Gevra Opencast Expansion Project was obtained from
MoEF&CC for a production capacity of 35.00MTPA & within 4184.486Ha of lease-area.
Under Clause 7(ii) of EIA Notification 2006 & MoEF&CC OM no. J-11015/30/2004-IA.II dated
19.10.2012, Environment Clearance has been obtained for a production capacity of
40.00MTPA for an area of 4058.146 Ha of land vide MoEF&CC letter No. J-11015/85/2010-
IA-II (M) Dtd. 31.01.2014. Further under Clause 7(ii) of EIA Notification 2006 & MoEF&CC
OM no. J-11015/30/2004-IA.II dated 02.09.2014, Environment Clearance has been obtained
for a production capacity of 41.00MTPA vide MoEF&CC letter No. J-11015/85/2010-IA-II(M)
Dtd. 06-02-2015 Recently, the Project Report for Gevra Expansion Opencast Project (35.0 to
70.0 MTY) was approved by CIL Board on dated 5th March 2016.
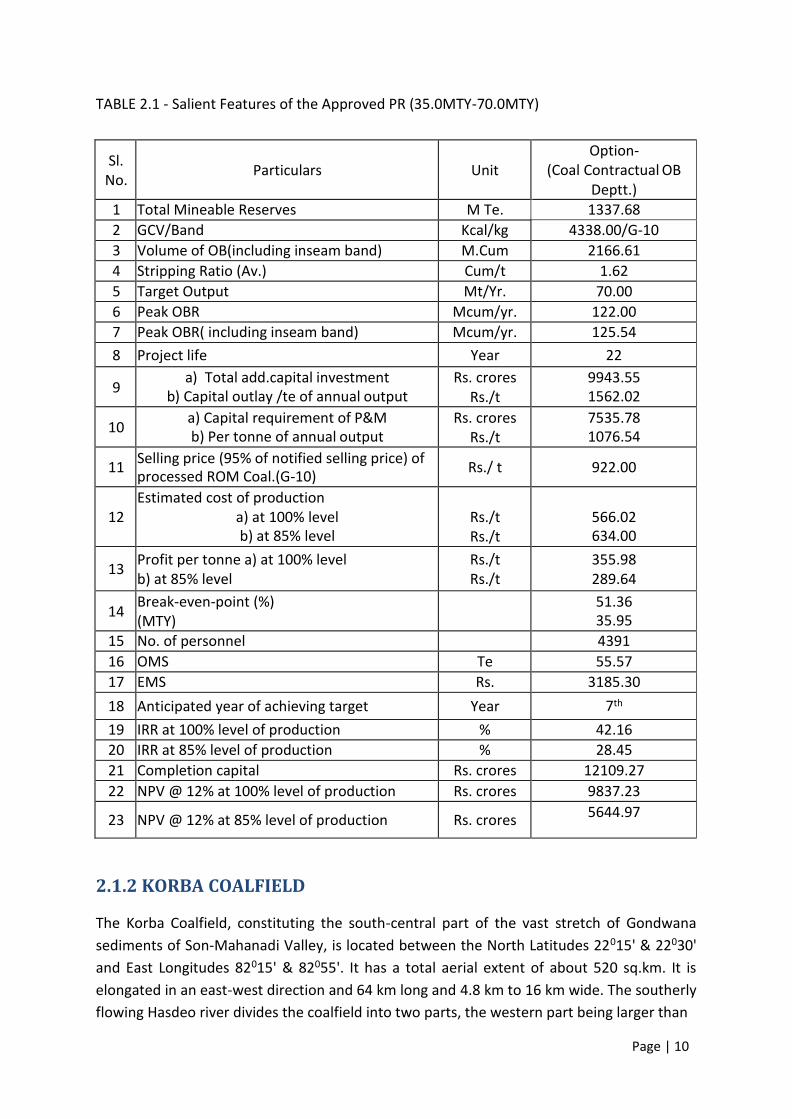
Page | 10
TABLE 2.1 - Salient Features of the Approved PR (35.0MTY-70.0MTY)
Sl.
No.
Particulars
Unit
Option-
(Coal Contractual OB
Deptt.)
1 Total Mineable Reserves M Te. 1337.68
2 GCV/Band Kcal/kg 4338.00/G-10
3 Volume of OB(including inseam band) M.Cum 2166.61
4 Stripping Ratio (Av.) Cum/t 1.62
5 Target Output Mt/Yr. 70.00
6 Peak OBR Mcum/yr. 122.00
7 Peak OBR( including inseam band) Mcum/yr. 125.54
8 Project life Year 22
9 a) Total add.capital investment
b) Capital outlay /te of annual output
Rs. crores
Rs./t
9943.55
1562.02
10 a) Capital requirement of P&M
b) Per tonne of annual output
Rs. crores
Rs./t
7535.78
1076.54
11 Selling price (95% of notified selling price) of
processed ROM Coal.(G-10) Rs./ t 922.00
12
Estimated cost of production
a) at 100% level
b) at 85% level
Rs./t
Rs./t
566.02
634.00
13 Profit per tonne a) at 100% level
b) at 85% level
Rs./t
Rs./t
355.98
289.64
14 Break-even-point (%)
(MTY)
51.36
35.95
15 No. of personnel 4391
16 OMS Te 55.57
17 EMS Rs. 3185.30
18 Anticipated year of achieving target Year 7th
19 IRR at 100% level of production % 42.16
20 IRR at 85% level of production % 28.45
21 Completion capital Rs. crores 12109.27
22 NPV @ 12% at 100% level of production Rs. crores 9837.23
23 NPV @ 12% at 85% level of production Rs. crores 5644.97
2.1.2 KORBA COALFIELD
The Korba Coalfield, constituting the south-central part of the vast stretch of Gondwana
sediments of Son-Mahanadi Valley, is located between the North Latitudes 22015' & 22030'
and East Longitudes 82015' & 82055'. It has a total aerial extent of about 520 sq.km. It is
elongated in an east-west direction and 64 km long and 4.8 km to 16 km wide. The southerly
flowing Hasdeo river divides the coalfield into two parts, the western part being larger than
Page | 11
the eastern part. The Dipka Block lies in the western part of the coalfield. The physiography
of the project area is detailed in table 2.2.
Table 2.2: Detailed physiography of project area
Particulars Details Values if any
General topography Gently undulating 288-328 m above mean sea
level
General slope Towards East
Drainage Hasdeo River, a major tributary of Mahanadi River flowing
along the eastern side in a north-south direction, controls
the drainage of the area. The mining block is drained by
Laxman nalla flowing in a west-east direction and joins
Aharan nadi, a tributary of Hasdeo River, at about 4.5km in
NE from the mine. The other stream Kholar nala also a
tributary of Hasdeo River, controls the drainage in the
northern part and whereas, Lilagar Nadi and Gangdel nala
control the south-west and south-east respectively. These
streams, mostly perennial, behave as constant recharge
sources. The pattern of drainage in the area is mostly
dendritic in nature
2.1.3LOCATION
Gevra Opencast Block is located in the South-Central part of Korba Coalfield in Korba District
of Chhattisgarh. The Gevra Mining Block was having an area of about 19.03 sq.km. is located
in the Central part of Korba Coalfield. It is included in the Survey of India Topo-sheet No. 64
J/ a d is ou ded latitudes ° a d ° a d lo gitudes ° to ° .
2.1.4 COMMUNICATION
The block is well connected by rail and road. Gevra Road and Korba Railway Stations on
Champa-Gevra Road branch line of S.E. Railway are at a distance of 10 km and 16 km,
respectively. Important distance by Rail to Gevra Road Station from Bilaspur (Company HQ)
is 93 km.
2.1.5 GENERAL GEOLOGY
The east-west trending crescent-shaped Korba Coalfield, which derives its name from the
Korba town, is spread over an area of about 520 sq.km. in the Korba district of Chhattisgarh
State. The coalfield is about 64km long, and its width varies from 4.8km to 16km and is
bounded by latitudes 22o15' - 22o N & lo gitudes o - 82o E. It is o e ed i the
Survey of India Toposheet Nos. 64 J/7, J/11, and J/15. The southerly flowing Hasdeo River
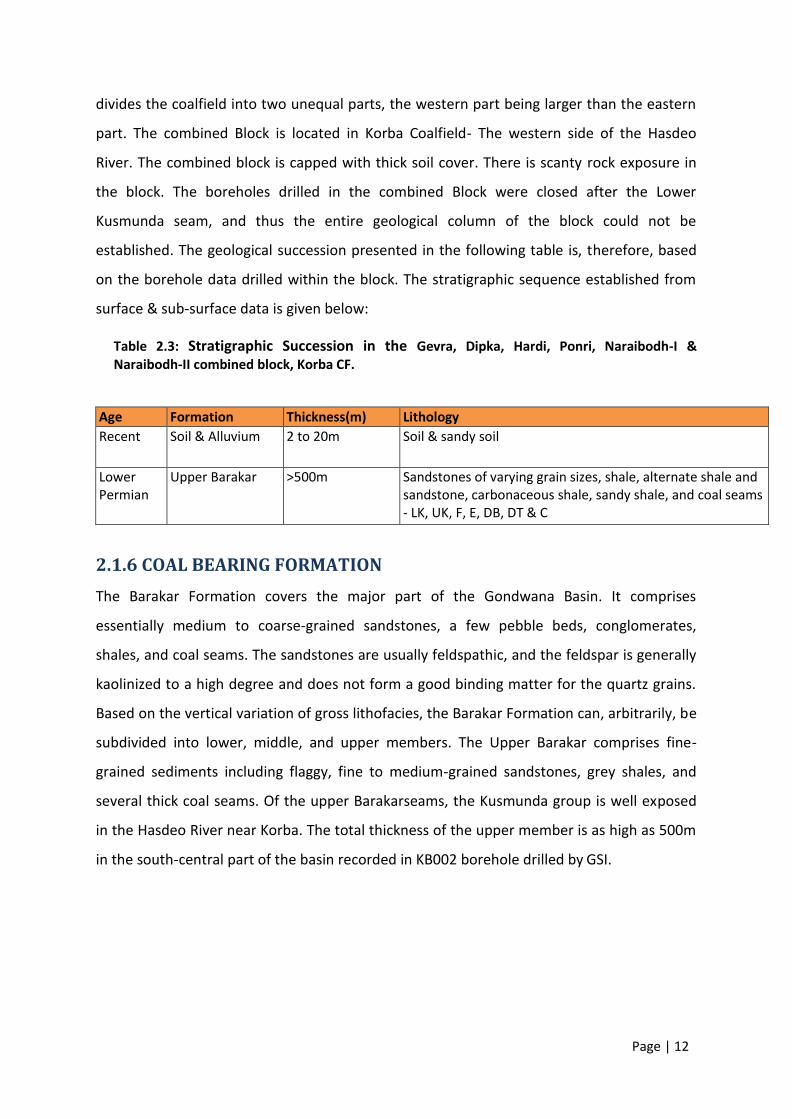
Page | 12
divides the coalfield into two unequal parts, the western part being larger than the eastern
part. The combined Block is located in Korba Coalfield- The western side of the Hasdeo
River. The combined block is capped with thick soil cover. There is scanty rock exposure in
the block. The boreholes drilled in the combined Block were closed after the Lower
Kusmunda seam, and thus the entire geological column of the block could not be
established. The geological succession presented in the following table is, therefore, based
on the borehole data drilled within the block. The stratigraphic sequence established from
surface & sub-surface data is given below:
Table 2.3: Stratigraphic Succession in the Gevra, Dipka, Hardi, Ponri, Naraibodh-I &
Naraibodh-II combined block, Korba CF.
Age Formation Thickness(m) Lithology
Recent Soil & Alluvium 2 to 20m Soil & sandy soil
Lower
Permian
Upper Barakar >500m Sandstones of varying grain sizes, shale, alternate shale and
sandstone, carbonaceous shale, sandy shale, and coal seams
- LK, UK, F, E, DB, DT & C
2.1.6 COAL BEARING FORMATION
The Barakar Formation covers the major part of the Gondwana Basin. It comprises
essentially medium to coarse-grained sandstones, a few pebble beds, conglomerates,
shales, and coal seams. The sandstones are usually feldspathic, and the feldspar is generally
kaolinized to a high degree and does not form a good binding matter for the quartz grains.
Based on the vertical variation of gross lithofacies, the Barakar Formation can, arbitrarily, be
subdivided into lower, middle, and upper members. The Upper Barakar comprises fine-
grained sediments including flaggy, fine to medium-grained sandstones, grey shales, and
several thick coal seams. Of the upper Barakarseams, the Kusmunda group is well exposed
in the Hasdeo River near Korba. The total thickness of the upper member is as high as 500m
in the south-central part of the basin recorded in KB002 borehole drilled by GSI.

Page | 13
2.1.7SUCCESSION OF COAL SEAMS
Table 2.4 : Succession of coal seams within the boundary of the project.
Coal
Seam /
Parting
Nos. of Bhs
intersection
(Full section)
Thickness
Range (m)
Generalized thickness Range
(m)
Min.
Max.
Min.
Max.
C 08 0.90
(CMKN028)
4.34
(CMKN032)
2.5 3.5
Parting 08 9.96
(CMKN032) 20.46
(CMKN027) -
DT
35 0.70
(CMKN046)
7.97
(CKPR054)
3 5
Parting 42 2.07
(CMKN049)
12.55
(CMKN041) -
DB 53 5.31
(CMKL038)
25.02
(CMGE015)
10 15
Parting 41 60.12
(CMKN003)
90.05
(CKPR026) -
EF 119 2.95
(CKDP067)
19.95
(CKDP089)
10 15
Parting
with DB 32
63.64
(CMKN042)
78.69
(CMKN069) -
E 60 0.90
(MKD017)
13.60
(CKDP095) 5 10
Parting 60 2.42
(CMKN056)
7.08
(CKPR002) -
F 61 1.53
(CMKN044)
6.30
(MKD017) 1.5 3
Parting
with EF 73
24.98
(CMGE015)
83.81
(CMKN019) -
Parting
with F 48
55.35
(CMKL036)
93.70
(CMKL100) -
UK 171 23.33
(CKPR023)
36.65
(CKDP100) 26 30
Parting
with EF
8 24.75
(CKHD022)
59.10
(CKDP088)
-
UTM 9 11.60
(CMGE012)
17.95
(CKDP088) 10 16
Parting
with EF 36
8.11
(CMGE014)
37.70
(CMGE017) -
Parting
with F 7
15.20
(CKDP125)
23.10
(CKDP095) -
UT 47 0.69
(CMKK013)
5.85
(CMGE017) 3 4
Parting 27 3.15
(CKDP066)
29.84
(CMGE011) -
UMB 27 19.00
(CKPR050)
31.76
(CKDP165) 20 22
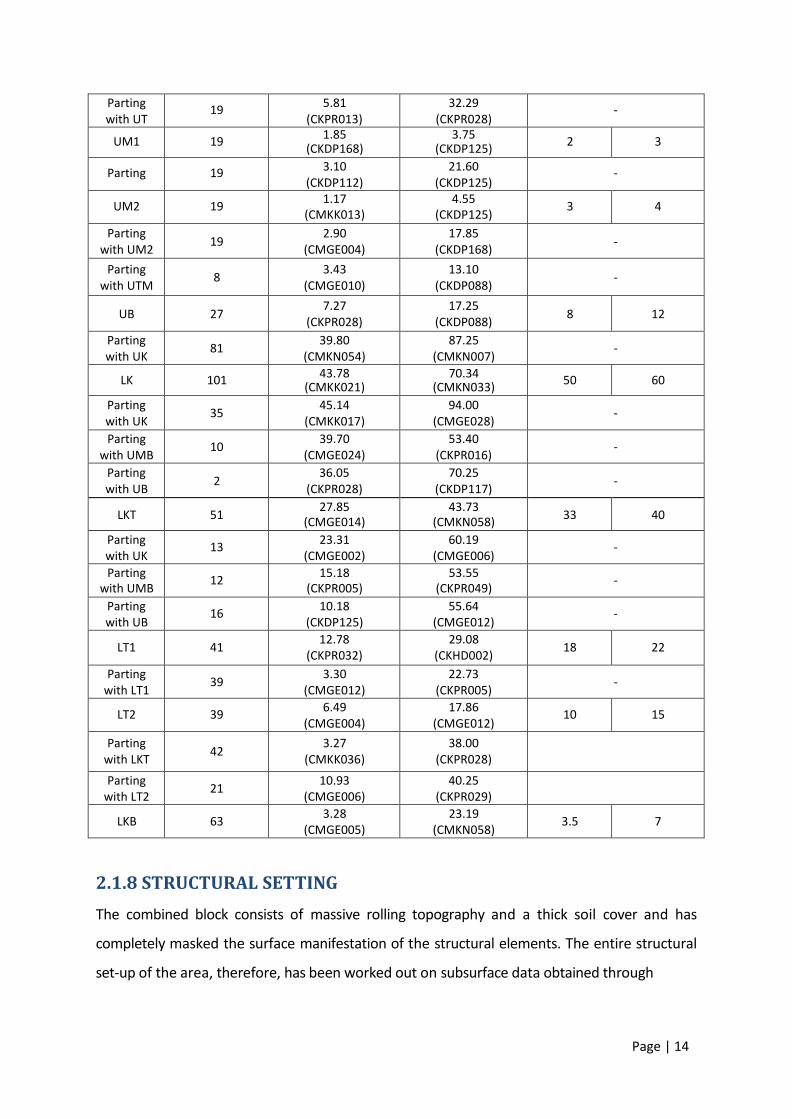
Page | 14
Parting
with UT 19
5.81
(CKPR013)
32.29
(CKPR028) -
UM1 19 1.85
(CKDP168) 3.75
(CKDP125) 2 3
Parting 19 3.10
(CKDP112)
21.60
(CKDP125) -
UM2 19 1.17
(CMKK013)
4.55
(CKDP125) 3 4
Parting
with UM2 19
2.90
(CMGE004)
17.85
(CKDP168) -
Parting
with UTM 8
3.43
(CMGE010)
13.10
(CKDP088) -
UB 27 7.27
(CKPR028)
17.25
(CKDP088) 8 12
Parting
with UK 81
39.80
(CMKN054)
87.25
(CMKN007) -
LK 101 43.78
(CMKK021) 70.34
(CMKN033) 50 60
Parting
with UK 35
45.14
(CMKK017)
94.00
(CMGE028) -
Parting
with UMB 10
39.70
(CMGE024)
53.40
(CKPR016) -
Parting
with UB 2
36.05
(CKPR028)
70.25
(CKDP117) -
LKT 51 27.85
(CMGE014)
43.73
(CMKN058) 33 40
Parting
with UK 13
23.31
(CMGE002)
60.19
(CMGE006) -
Parting
with UMB 12
15.18
(CKPR005)
53.55
(CKPR049) -
Parting
with UB 16
10.18
(CKDP125)
55.64
(CMGE012) -
LT1 41 12.78
(CKPR032)
29.08
(CKHD002) 18 22
Parting
with LT1 39
3.30
(CMGE012)
22.73
(CKPR005) -
LT2 39 6.49
(CMGE004)
17.86
(CMGE012) 10 15
Parting
with LKT 42
3.27
(CMKK036)
38.00
(CKPR028)
Parting
with LT2 21
10.93
(CMGE006)
40.25
(CKPR029)
LKB 63 3.28
(CMGE005)
23.19
(CMKN058) 3.5 7
2.1.8 STRUCTURAL SETTING
The combined block consists of massive rolling topography and a thick soil cover and has
completely masked the surface manifestation of the structural elements. The entire structural
set-up of the area, therefore, has been worked out on subsurface data obtained through
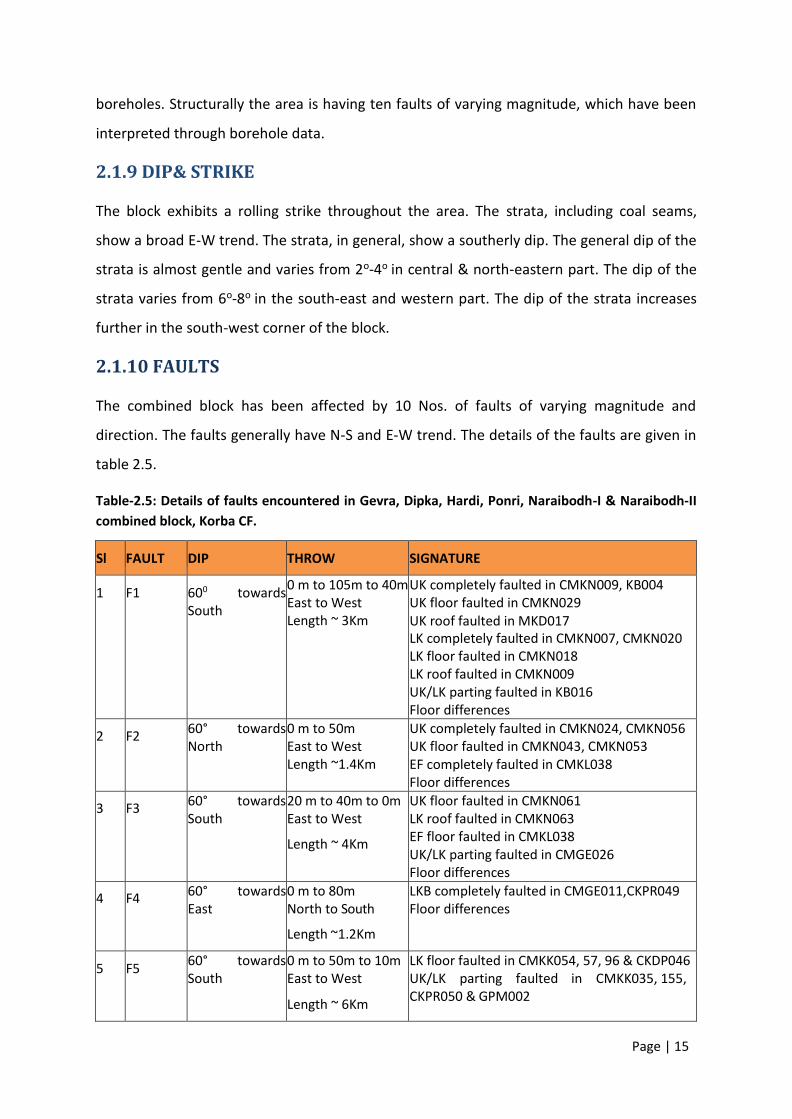
Page | 15
boreholes. Structurally the area is having ten faults of varying magnitude, which have been
interpreted through borehole data.
2.1.9 DIP& STRIKE
The block exhibits a rolling strike throughout the area. The strata, including coal seams,
show a broad E-W trend. The strata, in general, show a southerly dip. The general dip of the
strata is almost gentle and varies from 2o-4o in central & north-eastern part. The dip of the
strata varies from 6o-8o in the south-east and western part. The dip of the strata increases
further in the south-west corner of the block.
2.1.10 FAULTS
The combined block has been affected by 10 Nos. of faults of varying magnitude and
direction. The faults generally have N-S and E-W trend. The details of the faults are given in
table 2.5.
Table-2.5: Details of faults encountered in Gevra, Dipka, Hardi, Ponri, Naraibodh-I & Naraibodh-II
combined block, Korba CF.
Sl FAULT DIP THROW SIGNATURE
1 F1 600 towards
South
0 m to 105m to 40m
East to West
Length ~ 3Km
UK completely faulted in CMKN009, KB004
UK floor faulted in CMKN029
UK roof faulted in MKD017
LK completely faulted in CMKN007, CMKN020
LK floor faulted in CMKN018
LK roof faulted in CMKN009
UK/LK parting faulted in KB016
Floor differences
2 F2 60° towards
North
0 m to 50m
East to West
Length ~1.4Km
UK completely faulted in CMKN024, CMKN056
UK floor faulted in CMKN043, CMKN053
EF completely faulted in CMKL038
Floor differences
3 F3 60° towards
South
20 m to 40m to 0m
East to West
Length ~ 4Km
UK floor faulted in CMKN061
LK roof faulted in CMKN063
EF floor faulted in CMKL038
UK/LK parting faulted in CMGE026
Floor differences
4 F4 60° towards
East
0 m to 80m
North to South
Length ~1.2Km
LKB completely faulted in CMGE011,CKPR049
Floor differences
5 F5 60° towards
South
0 m to 50m to 10m
East to West
Length ~ 6Km
LK floor faulted in CMKK054, 57, 96 & CKDP046
UK/LK parting faulted in CMKK035, 155,
CKPR050 & GPM002
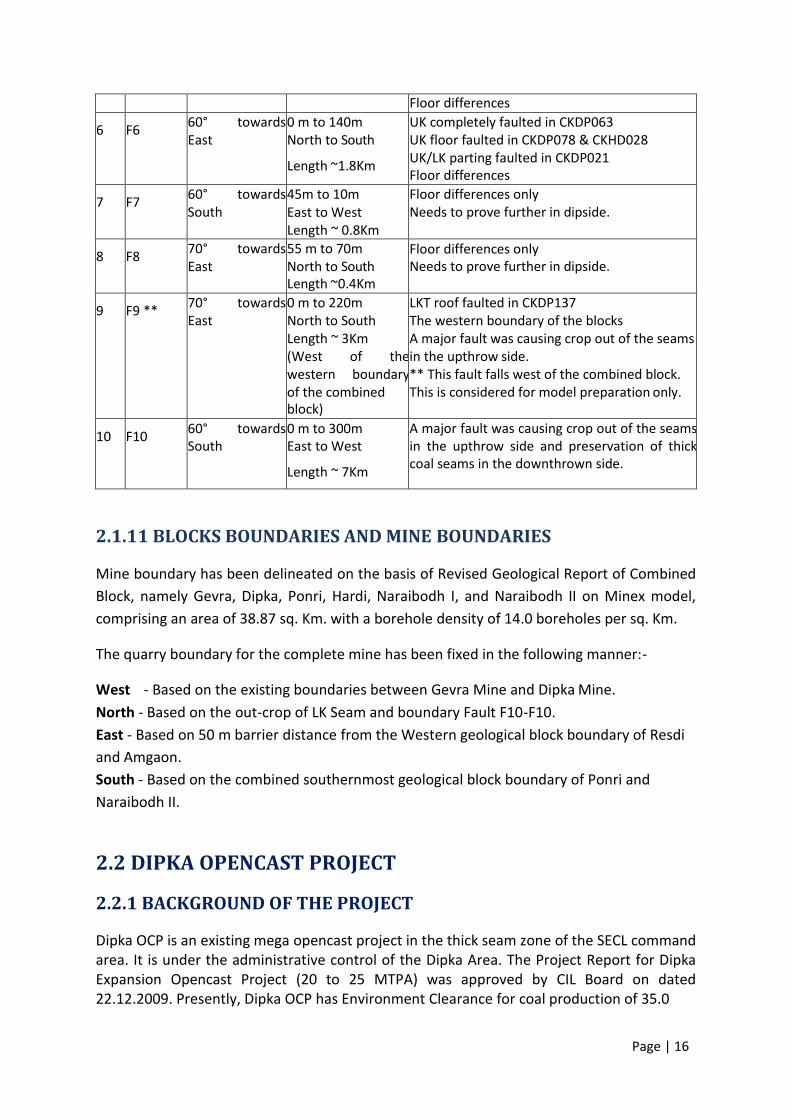
Page | 16
Floor differences
6 F6 60° towards
East
0 m to 140m
North to South
Length ~1.8Km
UK completely faulted in CKDP063
UK floor faulted in CKDP078 & CKHD028
UK/LK parting faulted in CKDP021
Floor differences
7 F7 60° towards
South
45m to 10m
East to West
Length ~ 0.8Km
Floor differences only
Needs to prove further in dipside.
8 F8 70° towards
East
55 m to 70m
North to South
Length ~0.4Km
Floor differences only
Needs to prove further in dipside.
9 F9 ** 70° towards
East
0 m to 220m
North to South
Length ~ 3Km
(West of the
western boundary
of the combined
block)
LKT roof faulted in CKDP137
The western boundary of the blocks
A major fault was causing crop out of the seams
in the upthrow side.
** This fault falls west of the combined block.
This is considered for model preparation only.
10 F10 60° towards
South
0 m to 300m
East to West
Length ~ 7Km
A major fault was causing crop out of the seams
in the upthrow side and preservation of thick
coal seams in the downthrown side.
2.1.11 BLOCKS BOUNDARIES AND MINE BOUNDARIES
Mine boundary has been delineated on the basis of Revised Geological Report of Combined
Block, namely Gevra, Dipka, Ponri, Hardi, Naraibodh I, and Naraibodh II on Minex model,
comprising an area of 38.87 sq. Km. with a borehole density of 14.0 boreholes per sq. Km.
The quarry boundary for the complete mine has been fixed in the following manner:-
West - Based on the existing boundaries between Gevra Mine and Dipka Mine.
North - Based on the out-crop of LK Seam and boundary Fault F10-F10.
East - Based on 50 m barrier distance from the Western geological block boundary of Resdi
and Amgaon.
South - Based on the combined southernmost geological block boundary of Ponri and
Naraibodh II.
2.2 DIPKA OPENCAST PROJECT
2.2.1 BACKGROUND OF THE PROJECT
Dipka OCP is an existing mega opencast project in the thick seam zone of the SECL command
area. It is under the administrative control of the Dipka Area. The Project Report for Dipka
Expansion Opencast Project (20 to 25 MTPA) was approved by CIL Board on dated
22.12.2009. Presently, Dipka OCP has Environment Clearance for coal production of 35.0

Page | 17
MTPA. The mine has achieved the coal production of 35.0 MTPA in the years 2018-19. Based
on the approved mining plan of Dipka OC - 35 MTPA, Environment Clearance for 35.0 MTPA
has been obtained vide letter No. J-11015/487/2007-IA-II (M)pt dated 20.02.2018.
Since this is a running mine, the current status of the reserve has been changed/reduced,
the balance reserves of the mine come to 258.84 MT, and the balance life of the mine is also
reduced to 7 years as on 01/04/2019.
2.2.2 LOCATION
Dipka OCP Expansion, a part of Dipka and Hardi Blocks, is located in the south-central part of
Korba Coalfield in Korba district of Chhattisgarh. Details are given in the table below-
Particulars Details
Area of Geological Block (excluding the area
required for road, colony & infrastructure)
12.42 sq. km
Latitudes 22o18'59" and 22o19'43" North
Longitudes 82030'47" to 82033'34" East
Reference Survey of India Topo-sheet No. 64 /11
2.2.3 COMMUNICATION
Nearest roadway Nearest railway
Connected by Distance from
Blocks
Connected by Distance from
blocks
Well connected by
nearest town
Ko a.
26 km Gevra Road Railway Stations'
on Champa- Gevra Road
branch Line of S.E.C Railway
12 km
At present, Coal from Dipka OCP is being dispatched through the existing Railway Sidings at
Junadih and Gevra Road. SECL headquarters, Bilaspur, is at a distance of about 90 km by
road.
2.2.4 PHYSIOGRAPHY
Particulars Details Values if any
General topography Gently undulating 298-326 m above mean
sea level
General slope Towards South
Drainage Mainly by Lilagarh river which marks the south-western
the boundary of the block.
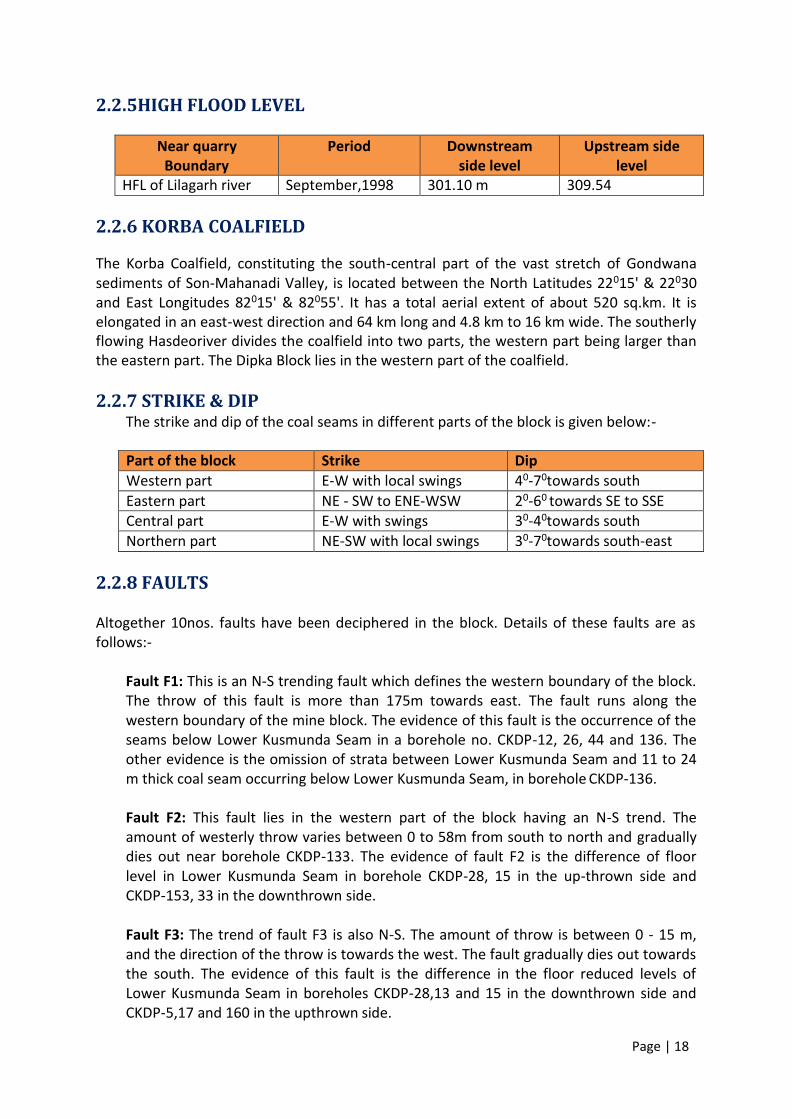
Page | 18
2.2.5HIGH FLOOD LEVEL
Near quarry
Boundary
Period Downstream
side level
Upstream side
level
HFL of Lilagarh river September,1998 301.10 m 309.54
2.2.6 KORBA COALFIELD
The Korba Coalfield, constituting the south-central part of the vast stretch of Gondwana
sediments of Son-Mahanadi Valley, is located between the North Latitudes 22015' & 22030
and East Longitudes 82015' & 82055'. It has a total aerial extent of about 520 sq.km. It is
elongated in an east-west direction and 64 km long and 4.8 km to 16 km wide. The southerly
flowing Hasdeoriver divides the coalfield into two parts, the western part being larger than
the eastern part. The Dipka Block lies in the western part of the coalfield.
2.2.7 STRIKE & DIP The strike and dip of the coal seams in different parts of the block is given below:-
Part of the block Strike Dip
Western part E-W with local swings 40-70towards south
Eastern part NE - SW to ENE-WSW 20-60 towards SE to SSE
Central part E-W with swings 30-40towards south
Northern part NE-SW with local swings 30-70towards south-east
2.2.8 FAULTS
Altogether 10nos. faults have been deciphered in the block. Details of these faults are as
follows:-
Fault F1: This is an N-S trending fault which defines the western boundary of the block.
The throw of this fault is more than 175m towards east. The fault runs along the
western boundary of the mine block. The evidence of this fault is the occurrence of the
seams below Lower Kusmunda Seam in a borehole no. CKDP-12, 26, 44 and 136. The
other evidence is the omission of strata between Lower Kusmunda Seam and 11 to 24
m thick coal seam occurring below Lower Kusmunda Seam, in borehole CKDP-136.
Fault F2: This fault lies in the western part of the block having an N-S trend. The
amount of westerly throw varies between 0 to 58m from south to north and gradually
dies out near borehole CKDP-133. The evidence of fault F2 is the difference of floor
level in Lower Kusmunda Seam in borehole CKDP-28, 15 in the up-thrown side and
CKDP-153, 33 in the downthrown side.
Fault F3: The trend of fault F3 is also N-S. The amount of throw is between 0 - 15 m,
and the direction of the throw is towards the west. The fault gradually dies out towards
the south. The evidence of this fault is the difference in the floor reduced levels of
Lower Kusmunda Seam in boreholes CKDP-28,13 and 15 in the downthrown side and
CKDP-5,17 and 160 in the upthrown side.

Page | 19
Fault F4 (Malgaon Sector): This fault has a NE-SW trend with a throw direction of NW.
The amount of throw varies between 10 to 20 m. This fault has been interpreted on the
basis of difference in floor reduced levels of Lower Kusmunda Seam in borehole CKDP-
155 in up thrown side and CKDP-145, 144 in the downthrown side.
Fault F4 (Hardi): This fault has a NE-SW strike, and the direction and amount of throw
are SE and 0-20 m, respectively. The fault has an Arial extent of 0.3 km. This fault is
interpreted on the basis of difference in floor reduced levels of seams on both the sides
of fault and floor of UK seam is faulted along with 20 m parting reduction in between
UK and LK Top Seams in CKHD-28.
Fault F5 (Malgaon): This fault has a NE-SW trend extending upto 0.56 km in the block.
The direction of throw of fault is towards NW, and the amount of throw is 5 m and dies
out in the west. This fault is interpreted on the basis of difference in the floor reduced
levels of Lower Kusmunda Seam in borehole CKDP-152, 28 in the upthrown side, and
CKDP-155 in the downthrown side.
Fault F5 (Hardi): Fault F5 has a strike ENE-WSW extending upto 2.8 km strike length.
The amount of throw varies between 0-40 m. The direction of the throw is SSE. The
evidence of the fault is the part thickness of Lower Kusmunda Seam in CKHD-28, and
the parting between Lower Kusmunda Top and Upper Kusmunda Seams are thin in
CKDP-34 due to faulting.
Fault F6 (Hardi): The fault has a strike NE trending towards the east. The amount of
throw varies between 120m to 20m, and it dies out towards the southwest. The fault
has a strike length of 1.85km. On the basis of difference in the floor, reduced levels of
seams on both sides of faults.
Fault F7: The trend of the fault is NE-SW to E-W, and the direction of the throw is NW
to N. The amount of the throw varies between 0-15. The fault merges with fault F8
between the boreholes CKDP-47 and 23. The fault has a curvilinear shape and is
evidenced by the difference in floor reduced level of the Lower Kusmunda Seam in
boreholes CKDP-49, CMKK-61 in up thrown side, and CMKK-55, 56 in the downthrown
side.
Fault F8: The fault has a NE-SW trend in the central part and becomes E-W towards
east. The direction of the throw is NW to the north. The fault has a maximum throw of
15 m in the central part, and it dies out towards the southwest. The fault has a strike
length of 4.3 km and is interpreted on the basis of difference in floor reduced level of
Upper Kusmunda and Lower Kusmunda Seams in boreholes MKD-21, CKDP-22, 50,
CKHD-25 in the upthrown side and boreholes CKHD-32, CKHD-31, CKDP-140, 70 and
CMKK-44 in the downthrown side. The parting between Upper and Lower Kusmunda
Seam is also reduced in CKHD-28 due to fault F8.
Fault F9: The fault has a NE-SW to ENE-WSW trend with the throw direction of NW to
NNW. The fault has a maximum throw of 60 m in the central part and gradually reduces
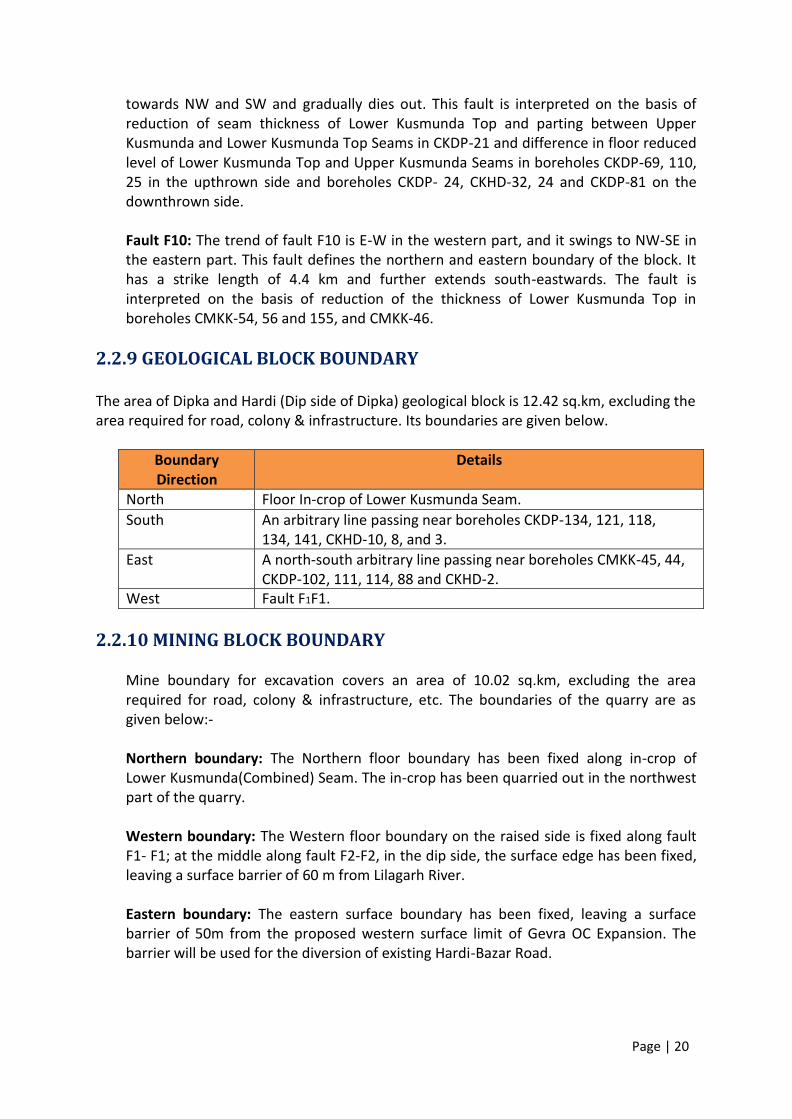
Page | 20
towards NW and SW and gradually dies out. This fault is interpreted on the basis of
reduction of seam thickness of Lower Kusmunda Top and parting between Upper
Kusmunda and Lower Kusmunda Top Seams in CKDP-21 and difference in floor reduced
level of Lower Kusmunda Top and Upper Kusmunda Seams in boreholes CKDP-69, 110,
25 in the upthrown side and boreholes CKDP- 24, CKHD-32, 24 and CKDP-81 on the
downthrown side.
Fault F10: The trend of fault F10 is E-W in the western part, and it swings to NW-SE in
the eastern part. This fault defines the northern and eastern boundary of the block. It
has a strike length of 4.4 km and further extends south-eastwards. The fault is
interpreted on the basis of reduction of the thickness of Lower Kusmunda Top in
boreholes CMKK-54, 56 and 155, and CMKK-46.
2.2.9 GEOLOGICAL BLOCK BOUNDARY
The area of Dipka and Hardi (Dip side of Dipka) geological block is 12.42 sq.km, excluding the
area required for road, colony & infrastructure. Its boundaries are given below.
Boundary
Direction
Details
North Floor In-crop of Lower Kusmunda Seam.
South An arbitrary line passing near boreholes CKDP-134, 121, 118,
134, 141, CKHD-10, 8, and 3.
East A north-south arbitrary line passing near boreholes CMKK-45, 44,
CKDP-102, 111, 114, 88 and CKHD-2.
West Fault F1F1.
2.2.10 MINING BLOCK BOUNDARY
Mine boundary for excavation covers an area of 10.02 sq.km, excluding the area
required for road, colony & infrastructure, etc. The boundaries of the quarry are as
given below:-
Northern boundary: The Northern floor boundary has been fixed along in-crop of
Lower Kusmunda(Combined) Seam. The in-crop has been quarried out in the northwest
part of the quarry.
Western boundary: The Western floor boundary on the raised side is fixed along fault
F1- F1; at the middle along fault F2-F2, in the dip side, the surface edge has been fixed,
leaving a surface barrier of 60 m from Lilagarh River.
Eastern boundary: The eastern surface boundary has been fixed, leaving a surface
barrier of 50m from the proposed western surface limit of Gevra OC Expansion. The
barrier will be used for the diversion of existing Hardi-Bazar Road.
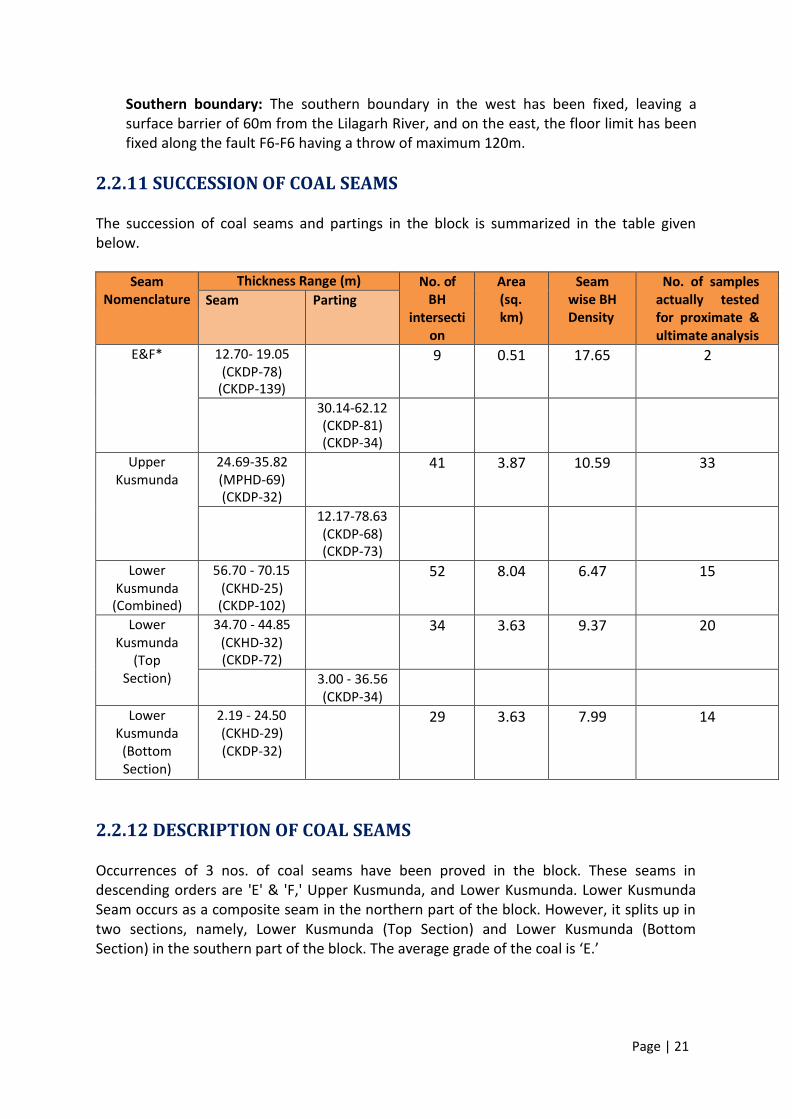
Page | 21
Southern boundary: The southern boundary in the west has been fixed, leaving a
surface barrier of 60m from the Lilagarh River, and on the east, the floor limit has been
fixed along the fault F6-F6 having a throw of maximum 120m.
2.2.11 SUCCESSION OF COAL SEAMS
The succession of coal seams and partings in the block is summarized in the table given
below.
Seam
Nomenclature
Thickness Range (m) No. of
BH
intersecti
on
Area
(sq.
km)
Seam
wise BH
Density
No. of samples
actually tested
for proximate &
ultimate analysis
Seam Parting
E&F* 12.70- 19.05
(CKDP-78)
(CKDP-139)
9 0.51 17.65 2
30.14-62.12
(CKDP-81)
(CKDP-34)
Upper
Kusmunda
24.69-35.82
(MPHD-69)
(CKDP-32)
41 3.87 10.59 33
12.17-78.63
(CKDP-68)
(CKDP-73)
Lower
Kusmunda
(Combined)
56.70 - 70.15
(CKHD-25)
(CKDP-102)
52 8.04 6.47 15
Lower
Kusmunda
(Top
Section)
34.70 - 44.85
(CKHD-32)
(CKDP-72)
34 3.63 9.37 20
3.00 - 36.56
(CKDP-34)
Lower
Kusmunda
(Bottom
Section)
2.19 - 24.50
(CKHD-29)
(CKDP-32)
29 3.63 7.99 14
2.2.12 DESCRIPTION OF COAL SEAMS
Occurrences of 3 nos. of coal seams have been proved in the block. These seams in
descending orders are 'E' & 'F,' Upper Kusmunda, and Lower Kusmunda. Lower Kusmunda
Seam occurs as a composite seam in the northern part of the block. However, it splits up in
two sections, namely, Lower Kusmunda (Top Section) and Lower Kusmunda (Bottom
Section) in the southern part of the block. The average grade of the coal is E.
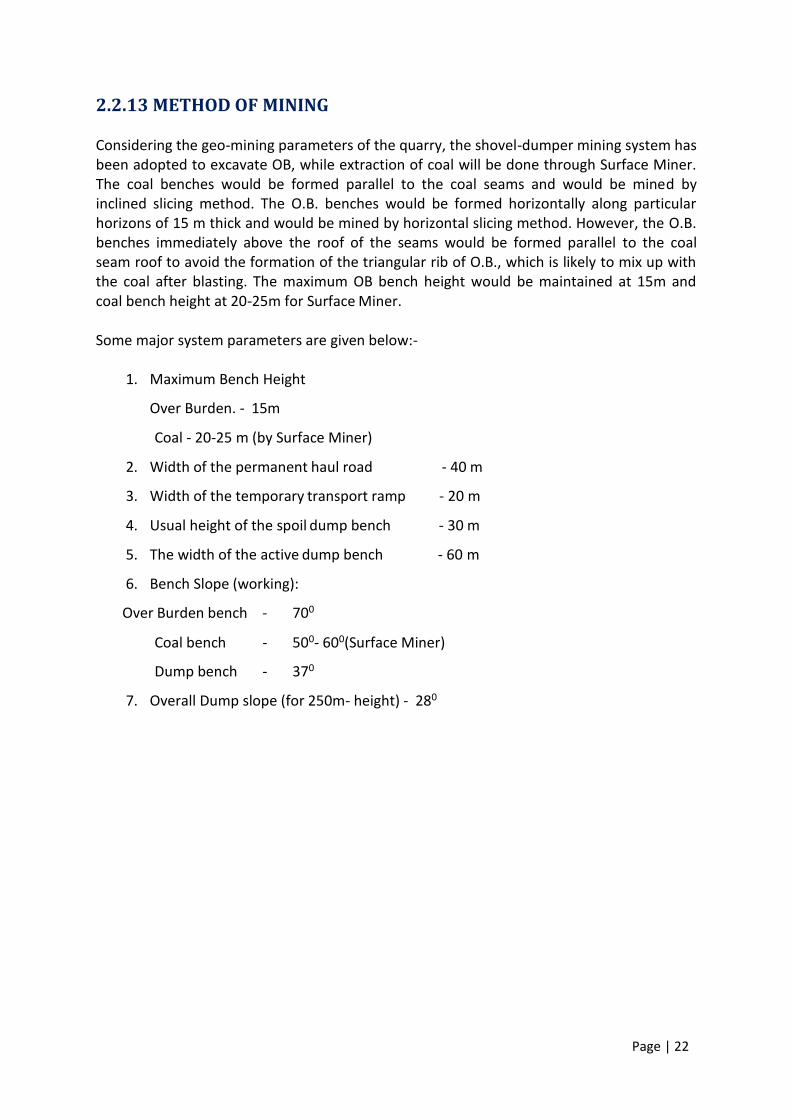
Page | 22
2.2.13 METHOD OF MINING
Considering the geo-mining parameters of the quarry, the shovel-dumper mining system has
been adopted to excavate OB, while extraction of coal will be done through Surface Miner.
The coal benches would be formed parallel to the coal seams and would be mined by
inclined slicing method. The O.B. benches would be formed horizontally along particular
horizons of 15 m thick and would be mined by horizontal slicing method. However, the O.B.
benches immediately above the roof of the seams would be formed parallel to the coal
seam roof to avoid the formation of the triangular rib of O.B., which is likely to mix up with
the coal after blasting. The maximum OB bench height would be maintained at 15m and
coal bench height at 20-25m for Surface Miner.
Some major system parameters are given below:-
1. Maximum Bench Height
Over Burden. - 15m
Coal - 20-25 m (by Surface Miner)
2. Width of the permanent haul road - 40 m
3. Width of the temporary transport ramp - 20 m
4. Usual height of the spoil dump bench - 30 m
5. The width of the active dump bench - 60 m
6. Bench Slope (working):
Over Burden bench - 700
Coal bench - 500- 600(Surface Miner)
Dump bench - 370
7. Overall Dump slope (for 250m- height) - 280
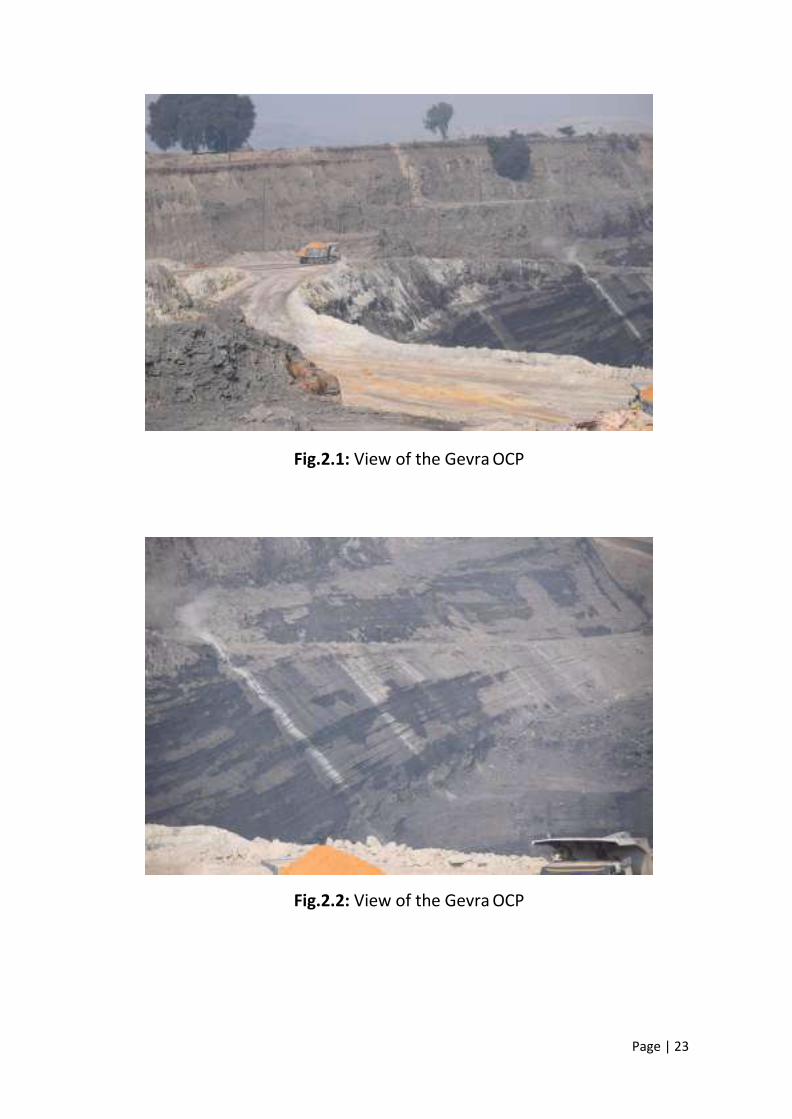
Page | 23
Fig.2.1: View of the Gevra OCP
Fig.2.2: View of the Gevra OCP
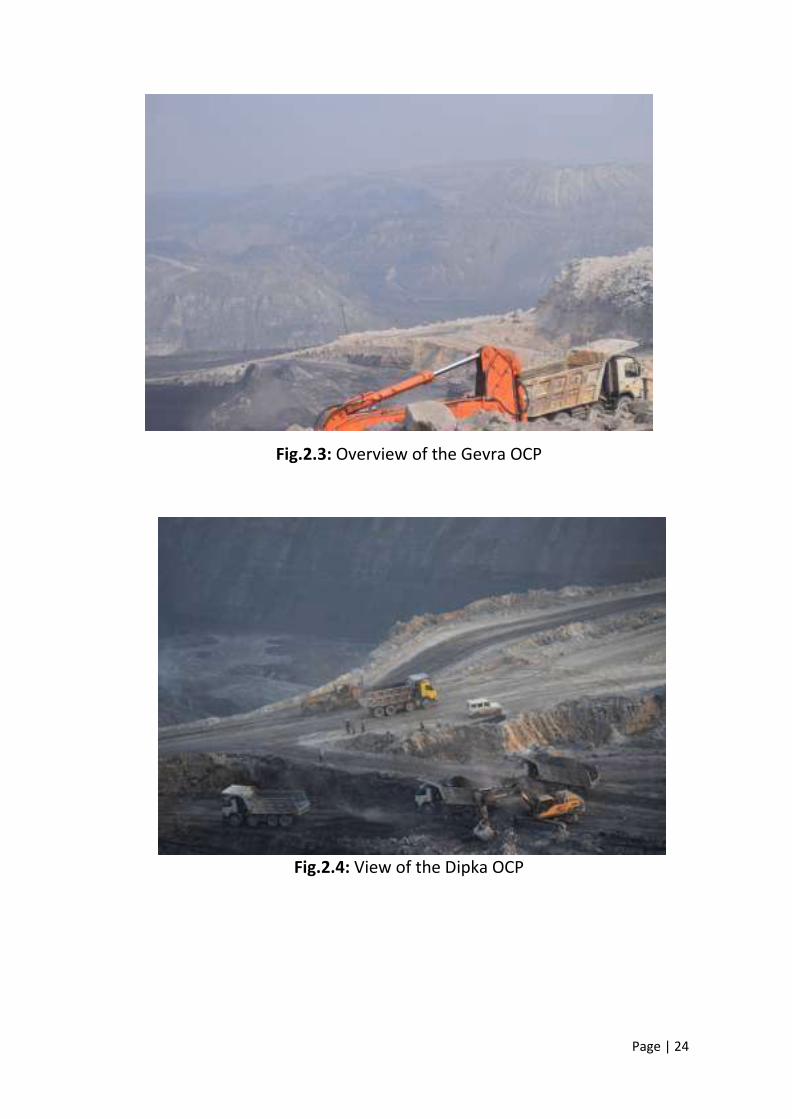
Page | 24
Fig.2.3: Overview of the Gevra OCP
Fig.2.4: View of the Dipka OCP

Page | 25
Fig.2.5: Overview of the Dipka OCP
Fig.2.6: Overview of the Dipka OCP
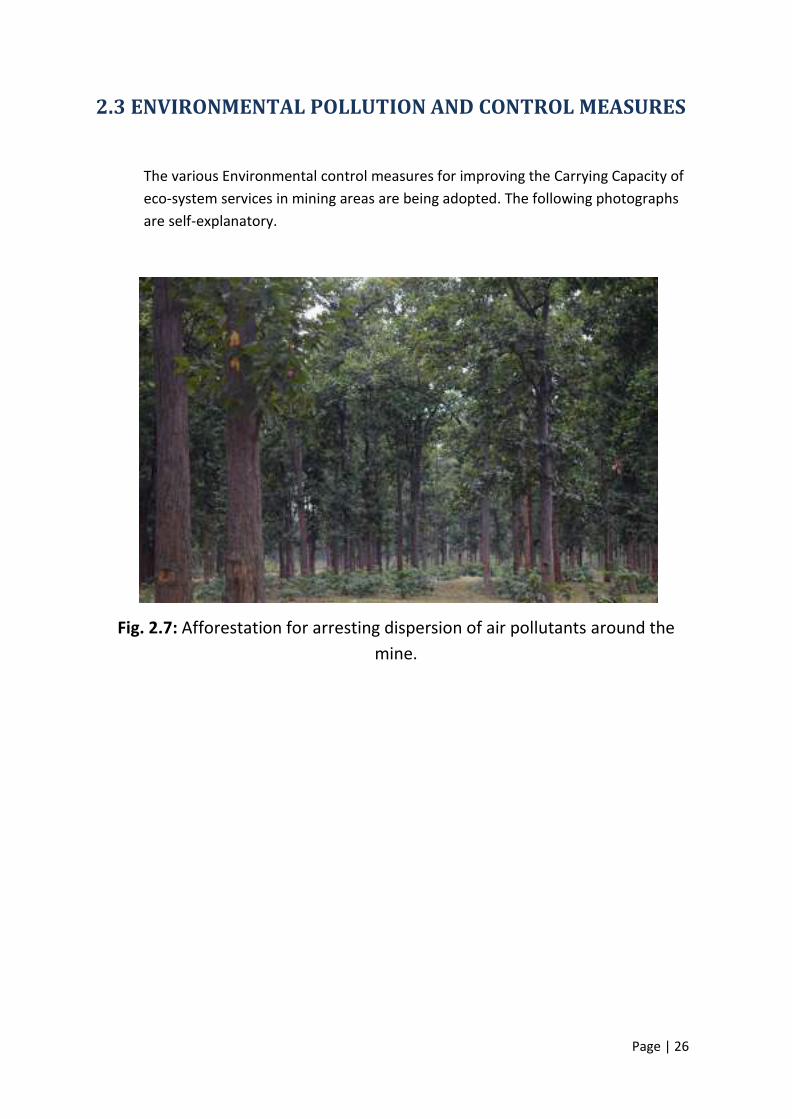
Page | 26
2.3 ENVIRONMENTAL POLLUTION AND CONTROL MEASURES
The various Environmental control measures for improving the Carrying Capacity of
eco-system services in mining areas are being adopted. The following photographs
are self-explanatory.
Fig. 2.7: Afforestation for arresting dispersion of air pollutants around the
mine.
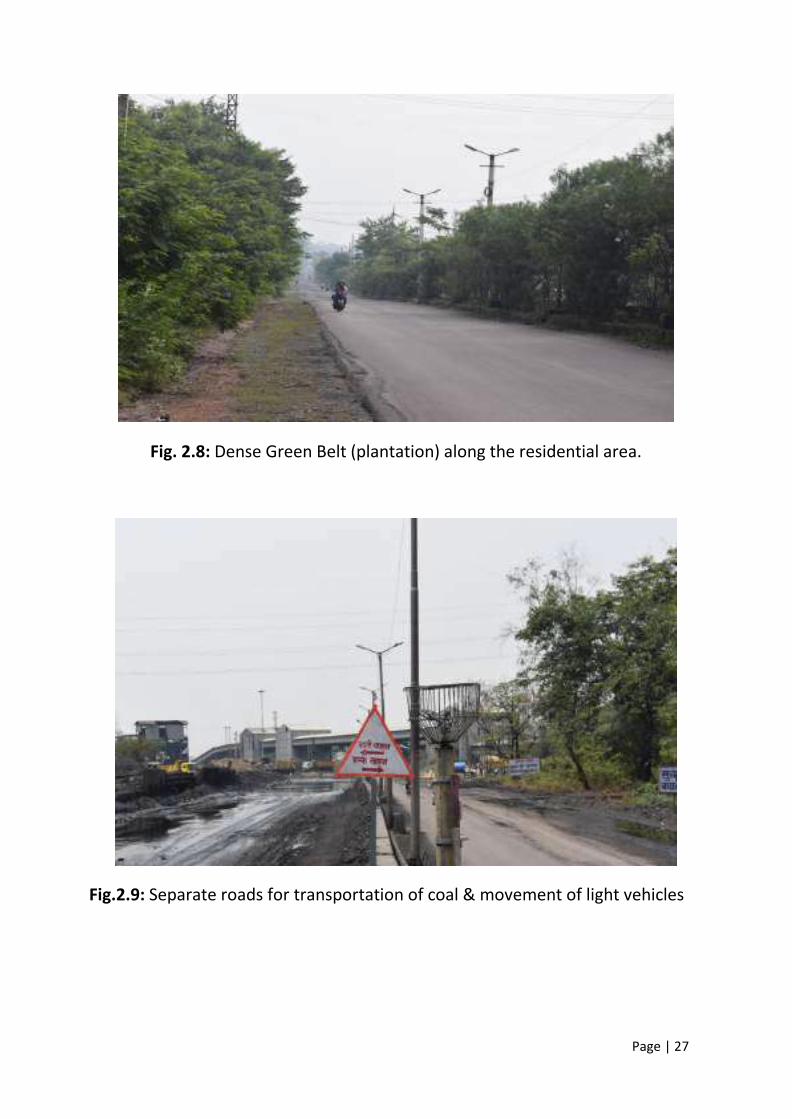
Page | 27
Fig. 2.8: Dense Green Belt (plantation) along the residential area.
Fig.2.9: Separate roads for transportation of coal & movement of light vehicles

Page | 28
Fig. 2.10: Water spraying through water tank on hall road in mine
Fig. 2.11: Water sprinkling system along the road for control of dust during
coal transportation

Page | 29
Fig. 2.12: Transportation of coal through a covered conveyor belt.
Fig.2.13: Transportation of coal by properly covered truck.
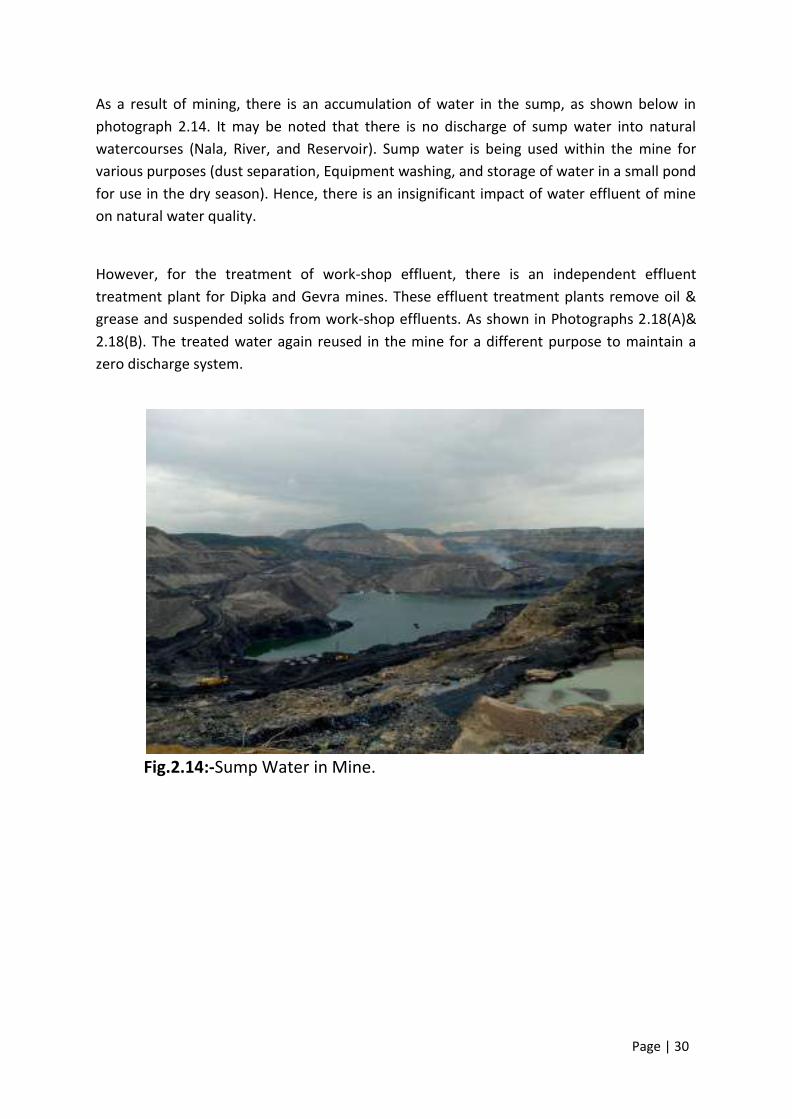
Page | 30
As a result of mining, there is an accumulation of water in the sump, as shown below in
photograph 2.14. It may be noted that there is no discharge of sump water into natural
watercourses (Nala, River, and Reservoir). Sump water is being used within the mine for
various purposes (dust separation, Equipment washing, and storage of water in a small pond
for use in the dry season). Hence, there is an insignificant impact of water effluent of mine
on natural water quality.
However, for the treatment of work-shop effluent, there is an independent effluent
treatment plant for Dipka and Gevra mines. These effluent treatment plants remove oil &
grease and suspended solids from work-shop effluents. As shown in Photographs 2.18(A)&
2.18(B). The treated water again reused in the mine for a different purpose to maintain a
zero discharge system.
Fig.2.14:-Sump Water in Mine.
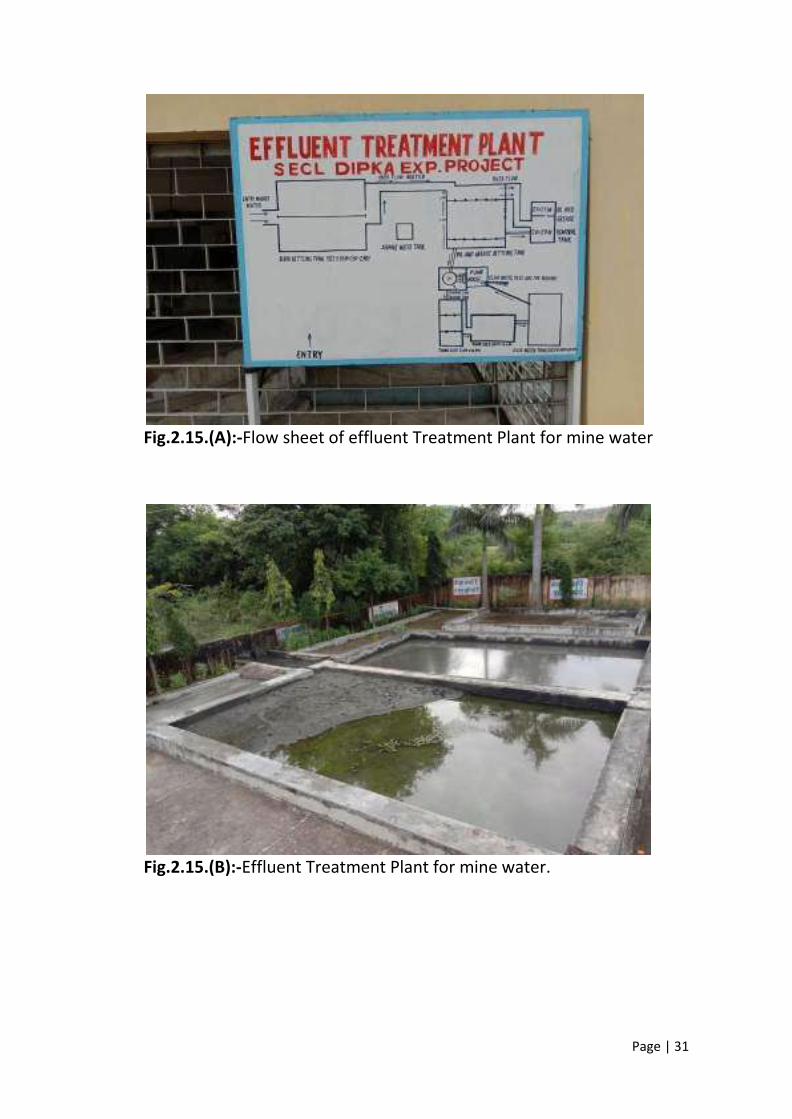
Page | 31
Fig.2.15.(A):-Flow sheet of effluent Treatment Plant for mine water
Fig.2.15.(B):-Effluent Treatment Plant for mine water.
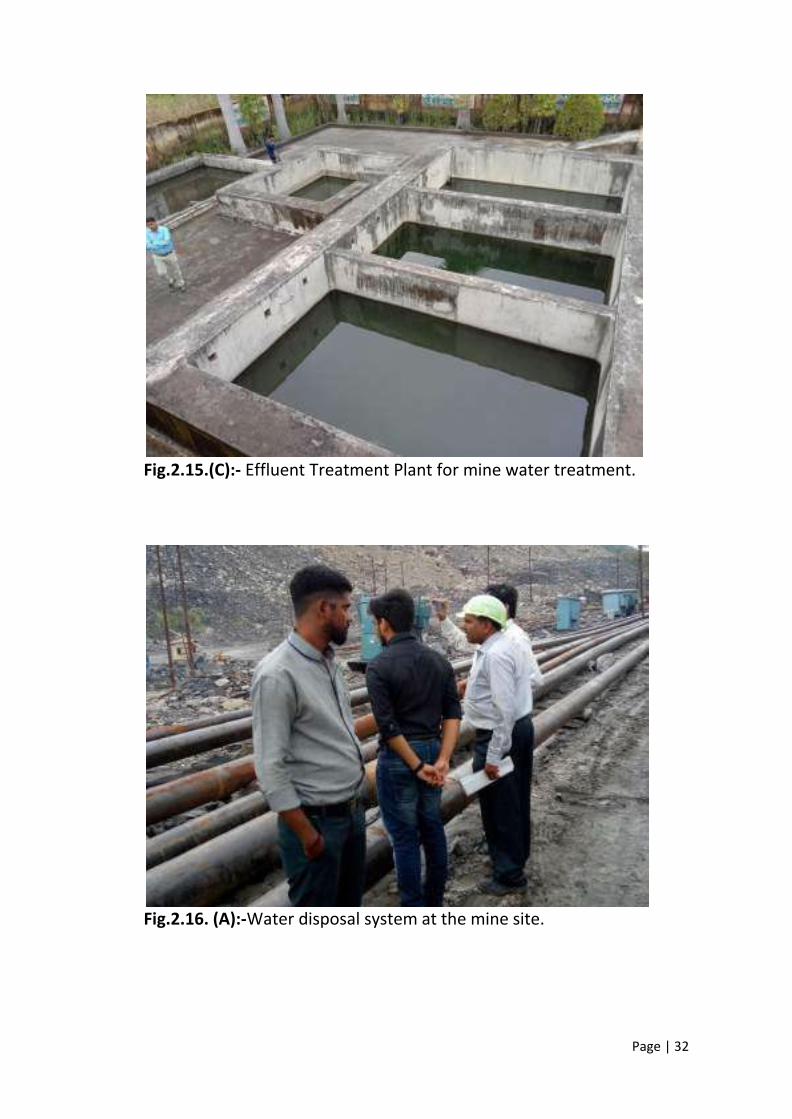
Page | 32
Fig.2.15.(C):- Effluent Treatment Plant for mine water treatment.
Fig.2.16. (A):-Water disposal system at the mine site.

Page | 33
Fig.2.16 (B):-Water disposal system at the mine site.
Fig.2.17 (A):-Mine water pond in the Mine premises.

Page | 34
Fig.2.17 (B):-Mine water pond in the Mine premises.
Page | 35
CHAPTER-III: METHODOLOGY - ECO-SYSTEM
SERVICES AND CARRYING CAPACITY ASSESSMENT
Ecosystem services are the benefits that people freely get from the natural environment and
from properly-functioning ecosystems. Such services include agro ecosystems, forest
ecosystems, grassland ecosystems, and aquatic ecosystems. When ecosystems function
properly, provide agricultural produce, timber, and aquatic organisms such as fishes and
crabs. Collectively, these benefits are known as Ecosystem Services and are often integral to
the other plants. Ecosystem Services are commonly categorized into Provisioning Services
(e.g., water, food, raw materials, and medicinal resources), Regulating Services (e.g., the
control of climate, air quality, carbon sequestration and storage, and diseases), Cultural
Services (e.g., aesthetic values, recreational opportunities, spiritual and tourism), and the
underpinning Supporting Services (e.g., crop pollination). They often arise from actions and
interventions by people; therefore, it is useful to think of ecosystem services as co-produced
by ecosystems and society.
3.1 ECOLOGICAL FOOTPRINT
Through increasing the consumption of resources by man increasingly causes environmental
problems, such as climate change, depletion in the ozone layer, loss of biodiversity, erosion,
and desertification, as well as pollution of soil, water, and air. The most-known indicator of
consumption of natural resources is the so-called ecological footprint. It quantifies the
question, how many renewable resources there are required by human consumption of
products and services. This means that the consumption of material, land, and energy is
calculated in terms of space. The consumption of fossil energy sources is calculated in terms
of the required CO2 absorption area, i.e., of the space of forest and ocean required. Other
indicators for measuring the consumption of resources are, for instance, the water
backpack, which indicates in relation to products how much water has been consumed in
their production or the material backpack, also called ecological backpack, which calculates
consumption of renewable and non-renewable raw materials for products or even for
states.
Ecological footprint analysis (EFA) is used as a measure of carrying capacity. EFA is a
esou e a d e issio s a ou ti g tool desig ed to t a k the de a d o the iosphe e s regenerative capacity. Ecological footprints are increasingly used as indicators of
organizational and corporate environmental performance and product sustainability. To
dete i e the size of a i e s e ologi al footp i t, la d e ui e e ts fo all atego ies of
consumption and waste discharge must be summed up. This land is only made up of the
ecologically productive land and water in various classes (cropland, pasture, forests, etc.)
required on an on-going basis to provide all energy and material resources consumed and
absorb wastes. A challenge in conducting an EFA for a mine is the shortage of accessible
Page | 36
data. Undertaking an EFA for a corporation or individual site entails compiling consumption
and emissions data (which can be used for other reporting applications). The footprint
esults the sel es highlight the ost iti al aspe ts of a o ga izatio s impact on the
environment and provide a platform for focusing actions and for educating the workforce to
improve their contribution to best-practice operations. The components of EFA are the Air
Footprint – This is a tool for assessing the prevalent air quality in the air shed of the coal
mining area. This is an indicator of the ambient air quality, which is crucial for coal mining.
The water Footprint- This is a tool for assessing water use along supply chains and is a
comprehensive indicator of the appropriation of freshwater resources. Carbon Footprint- a
method of assessing the magnitude of the emissions from activities. Emissions to the
atmosphere are converted to carbon dioxide equivalents (CO2e) to assess the total impact
of the o ga izatio s a ti ities. Biodiversity Footprint- is a modified form of the ecological
footprint that takes specific biodiversity impacts of direct land use and combines them with
the specific biodiversity impact of CO2emissions. Life-Cycle Assessment (LCA)- is a tool for
assessing environmental aspects and potential impacts associated with a product by
o pili g a i e to of i puts a d outputs th oughout a p odu t s life cycle and
evaluating the possible resulting impacts. Materials Flow Analysis (MFA)—a quantitative
tool for assessing the flow of materials and energy through an economy. MFA assesses
whether the flow of materials is sustainable in terms of the environmental impacts that
result from it. Ecological Footprint Analysis (EFA) is a resource and emissions accounting tool
desig ed to t a k the de a d pla ed o the iosphe e s ege e ati e apa it a defi ed entity. An EFA contrasts the biologically productive area appropriated by the company with
the capacity of the planet to provide ecosystem services, originally developed as an
indicator of environmental impacts of nations, individuals, or the human population. EFAs
have been undertaken to produce a baseline of consumption and emissions for mining
o pa ies, to assess possi le easu es to edu e the o pa ies footp i t a eas a d determine steps required to implement such measures.
3.2 ECOLOGICAL SAMPLING
One of the first things a field ecologist will want to know about an animal or plant species is:
how dense is the population per unit area or volume. Another important issue is: how are
the organisms dispersed within the habitat? In most cases, it is impossible to count every
individual or plot their location on a map [This would be a census] because of the time,
effort, or money involved. So it would be useful if there were some way that we could get
an accurate representation of some spatial characteristics of the population without having
to map every organism. Sampling must be done properly if we want our representation to
be valid. To ensure adequate representation, some guidelines must be followed. To obtain
an unbiased estimate of the population, sampling should be done at random, or more
specifically; the sampling should be conducted in such a way that the probability of each
individual being selected in the sample is the same. There are three general types of
sampling methods used to select individuals from a population situated in space: quadrats,

Page | 37
transect lines, and plotless techniques. A quadrat is a frame (usually a square or a circle) of
the known area used to isolate a subset of the population. This subset will comprise one
sample. The use of a quadrat is very simple: It is placed randomly in the sampling area (the
habitat of the species of interest), and all the individuals within the quadrat are counted
and/or measured. Quadrats are most useful when the area is fairly uniform, and movement
within the area is easy. The transect method is useful when the area to be sampled is zoned
in some way or has some sort of gradients running through it. Think of the intertidal habitat
on a small scale or the vegetation running up the side of a mountain on a larger scale. If
someone wants to study the zonation itself, the transect lines will usually be run normal to
the margins of the zones, while if the between zone differences are to be minimized, the
transect lines are laid within zones parallel to the boundaries. Once the line has been
randomly laid, points along the line are selected (or quadrats could be used too). The points
might be randomly or uniformly placed, depending on the question being asked. In this way,
the distribution of a species across (or within) the environmental gradient can be
determined. The plotless technique is the nearest-neighbour method. It is particularly
useful in areas where carrying large quadrats would be difficult to manage, such as a dense
forest. It is also most suited to habitats that are relatively uniform. Plotless methods do not
use a defined area (like a quadrat), nor are they arranged linearly as in transect methods,
rather, they use distances between a point and an individual, or between two individuals.
D1 = the distance from the randomly selected point to the closest individual of interest. D2 =
the distance to the nearest neighbour in this technique, each sample consists of a pair of
measurements, d1 and d2. To obtain the next sample, a new random point is chosen, and
another pair of measurements is made. While nearest neighbour methods are especially
useful in certain field situations like dense forests etc. you will see that unlike quadrate
methods, they are not that useful for determining density. They are, however, quite useful
for determining the dispersion pattern of the organisms.
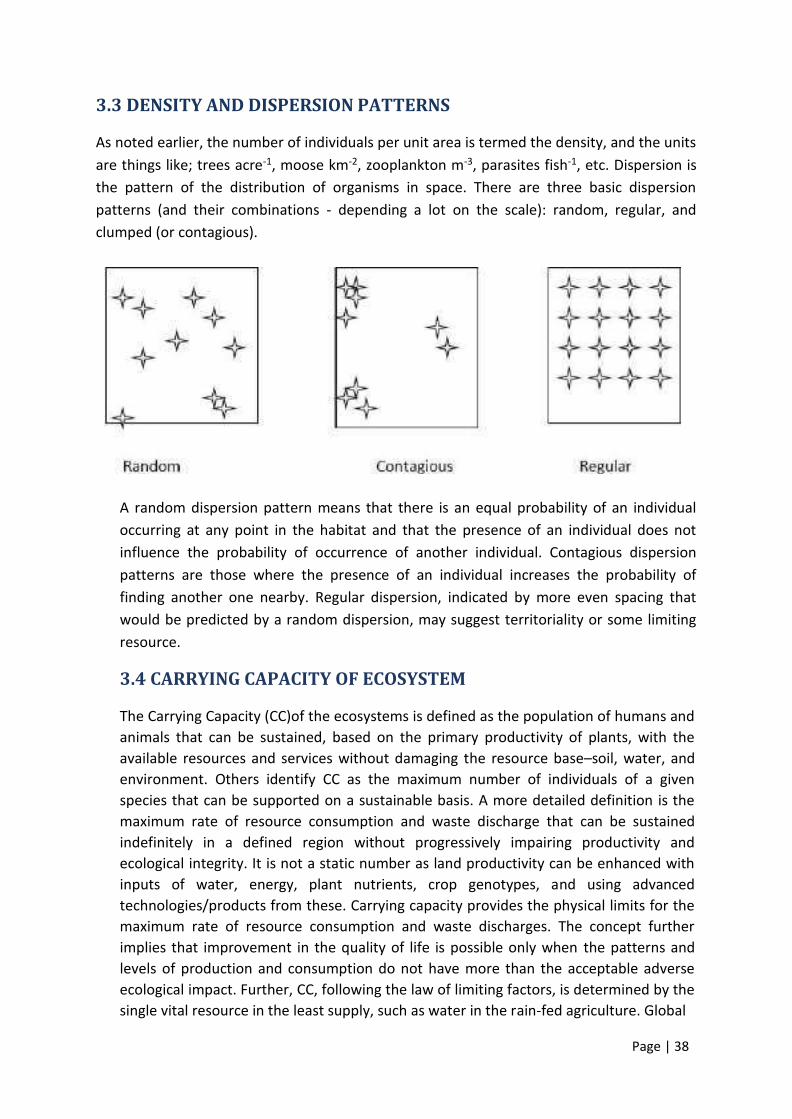
Page | 38
3.3 DENSITY AND DISPERSION PATTERNS
As noted earlier, the number of individuals per unit area is termed the density, and the units
are things like; trees acre-1, moose km-2, zooplankton m-3, parasites fish-1, etc. Dispersion is
the pattern of the distribution of organisms in space. There are three basic dispersion
patterns (and their combinations - depending a lot on the scale): random, regular, and
clumped (or contagious).
A random dispersion pattern means that there is an equal probability of an individual
occurring at any point in the habitat and that the presence of an individual does not
influence the probability of occurrence of another individual. Contagious dispersion
patterns are those where the presence of an individual increases the probability of
finding another one nearby. Regular dispersion, indicated by more even spacing that
would be predicted by a random dispersion, may suggest territoriality or some limiting
resource.
3.4 CARRYING CAPACITY OF ECOSYSTEM
The Carrying Capacity (CC)of the ecosystems is defined as the population of humans and
animals that can be sustained, based on the primary productivity of plants, with the
available resources and services without damaging the resource base–soil, water, and
environment. Others identify CC as the maximum number of individuals of a given
species that can be supported on a sustainable basis. A more detailed definition is the
maximum rate of resource consumption and waste discharge that can be sustained
indefinitely in a defined region without progressively impairing productivity and
ecological integrity. It is not a static number as land productivity can be enhanced with
inputs of water, energy, plant nutrients, crop genotypes, and using advanced
technologies/products from these. Carrying capacity provides the physical limits for the
maximum rate of resource consumption and waste discharges. The concept further
implies that improvement in the quality of life is possible only when the patterns and
levels of production and consumption do not have more than the acceptable adverse
ecological impact. Further, CC, following the law of limiting factors, is determined by the
single vital resource in the least supply, such as water in the rain-fed agriculture. Global
Page | 39
food production has increased several folds with the inputs of chemical fertilizers, that
provided crop nutrients, and inputs of energy derived from fossil fuels. Estimations of
human CC are not easy due to a large number of variables involved, including variation
in the consumption of food and the use of resources in different societies. The maximum
human population that can be sustained biophysically in an area is referred to as
biophysical CC, while social CC is the maximum population that can be sustained under
different social systems. However, in considering the CC of Indian agriculture, the
question of sustainable food production or sustainable CC based on food production is
required. The carrying capacity based planning process involves the integration of
societal expectations and ecological capabilities by minimizing the difference between
demand and supply. It uses various modelling and computation techniques to estimate
changes in CC indicators. It identifies the socially acceptable tradeoffs, and the use of
improved technologies.
3.5 METHODOLOGY FOR CARRYING CAPACITY ASSESSMENT
The carrying capacity consists of the supportive and assimilative capacity of the study
area around both Gevra and Dipka OCP s. The e ti e stud a ea a ou d k f o the periphery of the mines has been taken into consideration for assessment of the
supportive and assimilative capacity of the eco-system.
3.5.1 CARRYING CAPACITY OF AIR QUALITY
The assimilative potential of the atmosphere entails the capacity of the atmosphere to
accept and dissipate the pollutant discharge without exceeding the standard limits. This
can be an important tool for suggesting the safe limits of disposal of pollutants for
industrial operations as well as for the area-based management of air pollution like that
of opencast mines and to mitigate the pollution levels. The assimilative capacity of the
atmosphere may be examined either using a ventilation coefficient or by estimating
pollution potential using air pollution dispersion models. The ventilation coefficient is
defined as the rate at which the air is transported within the Convective Boundary Layer
(CBL). It is directly proportional to the assimilation potential of the atmosphere. It is a
crucial factor in the dispersion of air pollutants and determines the dispersal potential of
pollutants over a region of interest. The ventilation coefficient is the product of two
meteorological parameters; mixing height and average wind speed through the mixing
layers.
Ventilation coefficient = Zi* U
Where, Ziis the atmospheric boundary layer height (mixing height), in m, and U the
average wind velocity in the mixed layer, ms-1.
In the second approach, the assimilative capacity can be estimated in terms of
permissible emission load that is the difference between the permissible and the

Page | 40
existing pollutant concentration levels. The current concentration levels can either be
monitored or predicted using an appropriate dispersion model. This approach has some
advantages over the previous one because the ventilation coefficient can only represent
the dispersion potential of the region in terms of low, medium, or high. This
representation does not give any idea about the amount of emission load that can be
assimilated in the region without exceeding the standard limits The assimilative capacity
has been determined based on the baseline ambient air quality, environmental monitoring
report of the past four years of the surrounding mines and air quality impact prediction for
both Gevra and Dipka OCP’s. The Air Quality Index has also been determined, based on CPCB methodology, for carrying capacity assessment.
3.5.2 CARRYING CAPACITY OF WATER
The water balance study of the study area has been carried keeping in view of the water
a aila ilit , o peti g use e ui e e ts, i ludi g that of oth Ge a a d Dipka OCP s. The status of the water regime has been worked out to understand the supporting
capacity of the study area. Based on the surface, drinking, and effluent water quality of
the nearby mines, the assimilative potential of the water has worked out. Water quality
monitoring was conducted for surface water bodies existing in and around the Gevra
and Dipka opencast mines. The water samples were collected from the sump & other
locations from 21 May 2019 to 20 November 2019. The rivers in the nearby area are
Ahiran and Lilagarh. The up-stream & down-stream water samples were also collected
to assess the impact of mining on water bodies. Water samples were collected in 1-liter
plastic cane directly from the surface of the water body from each station. Analysis of
some of the Physico-chemical parameters such as pH, dissolved oxygen, and TDS was
carried out immediately at the time of sampling in the field itself. Water samples for
other Physico-chemical parameters were stored and carried to the laboratory for further
analysis. The Physico-chemical parameters were analyzed by the following methods, as
given in Adoni (1985), Trivedi and Goel (1986), APHA (1998), and NEERI manual,
1991).
3.5.3 CARRYING CAPACITY OF NOISE LEVELS
The carrying capacity (assimilative capacity) of the area in terms of noise level has been
worked out based on the baseline noise level.
3.5.4 CARRYING CAPACITY OF LAND
The present and post-mining land use pattern envisaged for the project have been
considered for assessment of the carrying capacity of the land resource in the study
area. The provisions of mine closure, mine closure cost, Net Present Value (NPV),
forests, and compensatory afforestation (CA) has also been considered.
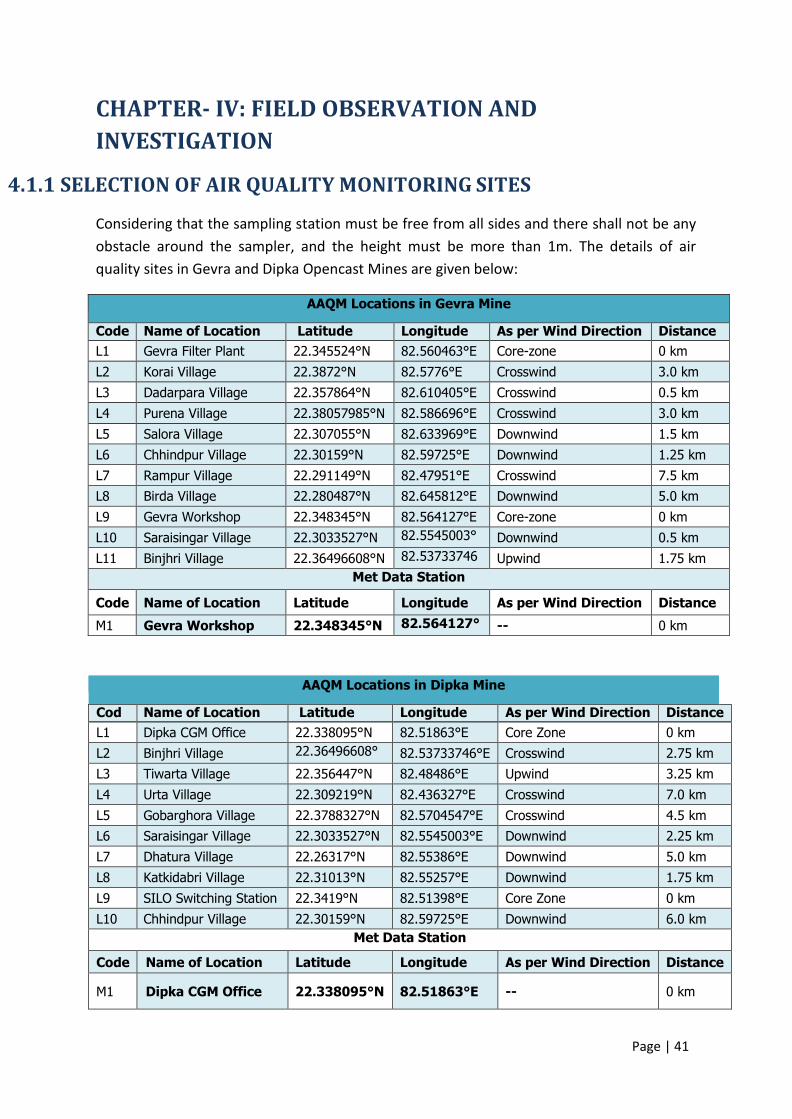
Page | 41
CHAPTER- IV: FIELD OBSERVATION AND
INVESTIGATION
4.1.1 SELECTION OF AIR QUALITY MONITORING SITES
Considering that the sampling station must be free from all sides and there shall not be any
obstacle around the sampler, and the height must be more than 1m. The details of air
quality sites in Gevra and Dipka Opencast Mines are given below:
AAQM Locations in Gevra Mine
Code Name of Location Latitude Longitude As per Wind Direction Distance
L1 Gevra Filter Plant 22.345524°N 82.560463°E Core-zone 0 km
L2 Korai Village 22.3872°N 82.5776°E Crosswind 3.0 km
L3 Dadarpara Village 22.357864°N 82.610405°E Crosswind 0.5 km
L4 Purena Village 22.38057985°N 82.586696°E Crosswind 3.0 km
L5 Salora Village 22.307055°N 82.633969°E Downwind 1.5 km
L6 Chhindpur Village 22.30159°N 82.59725°E Downwind 1.25 km
L7 Rampur Village 22.291149°N 82.47951°E Crosswind 7.5 km
L8 Birda Village 22.280487°N 82.645812°E Downwind 5.0 km
L9 Gevra Workshop 22.348345°N 82.564127°E Core-zone 0 km
L10 Saraisingar Village 22.3033527°N 82.5545003° Downwind 0.5 km
L11 Binjhri Village 22.36496608°N 82.53733746 Upwind 1.75 km
Met Data Station
Code Name of Location Latitude Longitude As per Wind Direction Distance
M1 Gevra Workshop 22.348345°N 82.564127° -- 0 km
AAQM Locations in Dipka Mine
Cod Name of Location Latitude Longitude As per Wind Direction Distance
L1 Dipka CGM Office 22.338095°N 82.51863°E Core Zone 0 km
L2 Binjhri Village 22.36496608° 82.53733746°E Crosswind 2.75 km
L3 Tiwarta Village 22.356447°N 82.48486°E Upwind 3.25 km
L4 Urta Village 22.309219°N 82.436327°E Crosswind 7.0 km
L5 Gobarghora Village 22.3788327°N 82.5704547°E Crosswind 4.5 km
L6 Saraisingar Village 22.3033527°N 82.5545003°E Downwind 2.25 km
L7 Dhatura Village 22.26317°N 82.55386°E Downwind 5.0 km
L8 Katkidabri Village 22.31013°N 82.55257°E Downwind 1.75 km
L9 SILO Switching Station 22.3419°N 82.51398°E Core Zone 0 km
L10 Chhindpur Village 22.30159°N 82.59725°E Downwind 6.0 km
Met Data Station
Code Name of Location Latitude Longitude As per Wind Direction Distance
M1 Dipka CGM Office 22.338095°N 82.51863°E -- 0 km
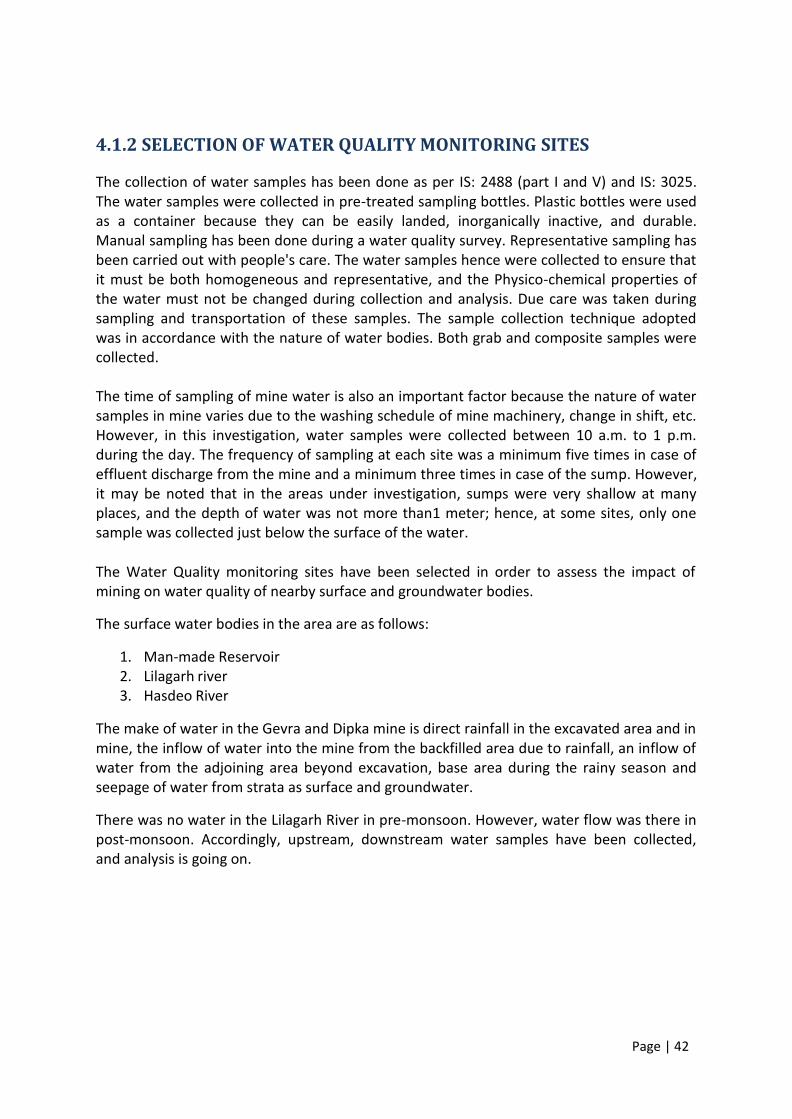
Page | 42
4.1.2 SELECTION OF WATER QUALITY MONITORING SITES
The collection of water samples has been done as per IS: 2488 (part I and V) and IS: 3025.
The water samples were collected in pre-treated sampling bottles. Plastic bottles were used
as a container because they can be easily landed, inorganically inactive, and durable.
Manual sampling has been done during a water quality survey. Representative sampling has
been carried out with people's care. The water samples hence were collected to ensure that
it must be both homogeneous and representative, and the Physico-chemical properties of
the water must not be changed during collection and analysis. Due care was taken during
sampling and transportation of these samples. The sample collection technique adopted
was in accordance with the nature of water bodies. Both grab and composite samples were
collected.
The time of sampling of mine water is also an important factor because the nature of water
samples in mine varies due to the washing schedule of mine machinery, change in shift, etc.
However, in this investigation, water samples were collected between 10 a.m. to 1 p.m.
during the day. The frequency of sampling at each site was a minimum five times in case of
effluent discharge from the mine and a minimum three times in case of the sump. However,
it may be noted that in the areas under investigation, sumps were very shallow at many
places, and the depth of water was not more than1 meter; hence, at some sites, only one
sample was collected just below the surface of the water.
The Water Quality monitoring sites have been selected in order to assess the impact of
mining on water quality of nearby surface and groundwater bodies.
The surface water bodies in the area are as follows:
1. Man-made Reservoir
2. Lilagarh river
3. Hasdeo River
The make of water in the Gevra and Dipka mine is direct rainfall in the excavated area and in
mine, the inflow of water into the mine from the backfilled area due to rainfall, an inflow of
water from the adjoining area beyond excavation, base area during the rainy season and
seepage of water from strata as surface and groundwater.
There was no water in the Lilagarh River in pre-monsoon. However, water flow was there in
post-monsoon. Accordingly, upstream, downstream water samples have been collected,
and analysis is going on.
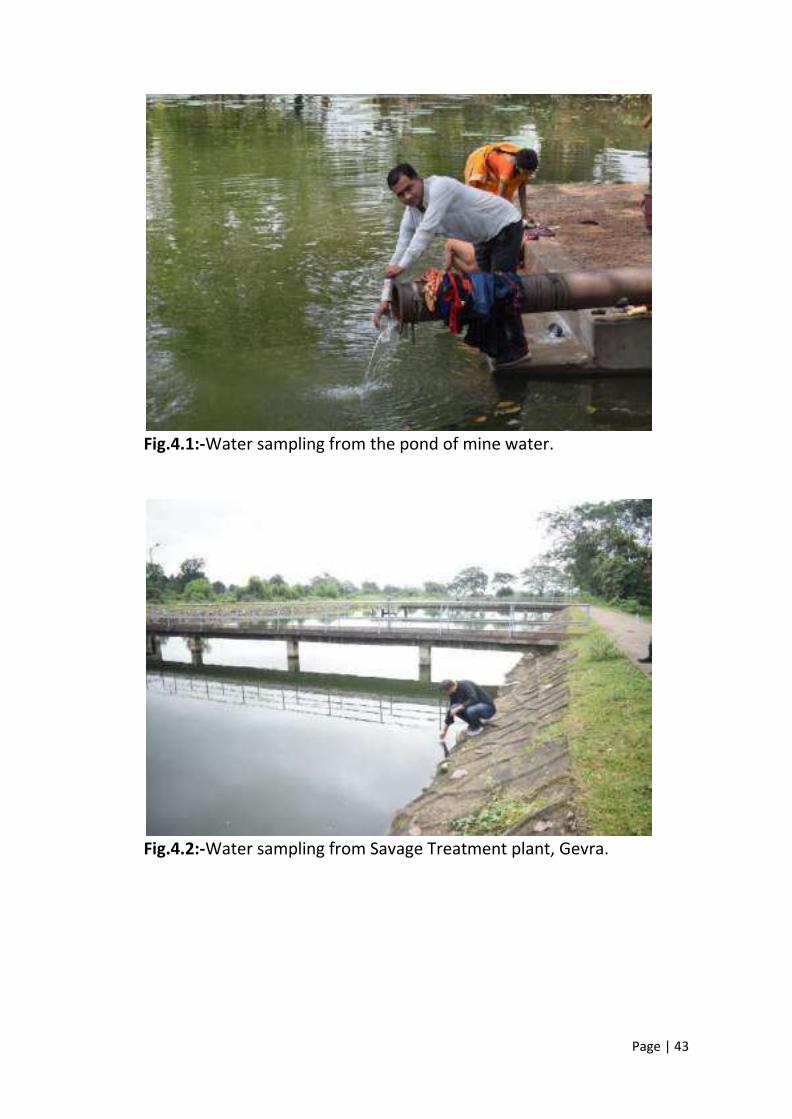
Page | 43
Fig.4.1:-Water sampling from the pond of mine water.
Fig.4.2:-Water sampling from Savage Treatment plant, Gevra.
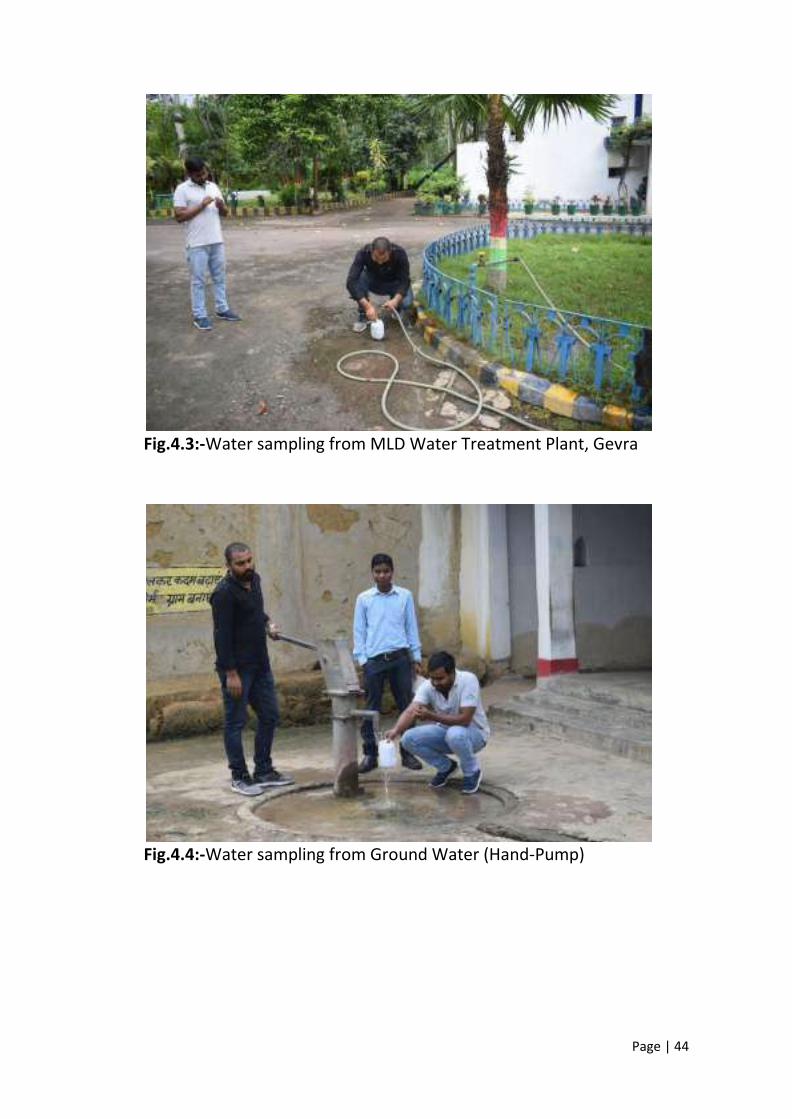
Page | 44
Fig.4.3:-Water sampling from MLD Water Treatment Plant, Gevra
Fig.4.4:-Water sampling from Ground Water (Hand-Pump)
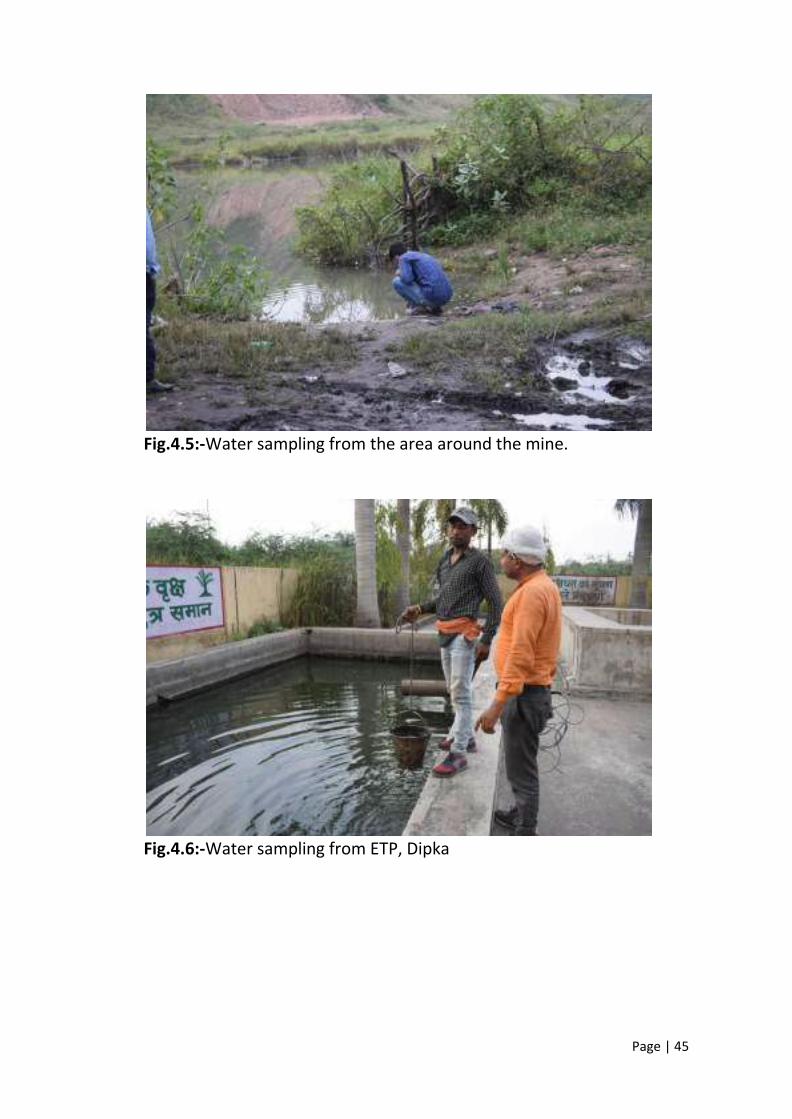
Page | 45
Fig.4.5:-Water sampling from the area around the mine.
Fig.4.6:-Water sampling from ETP, Dipka
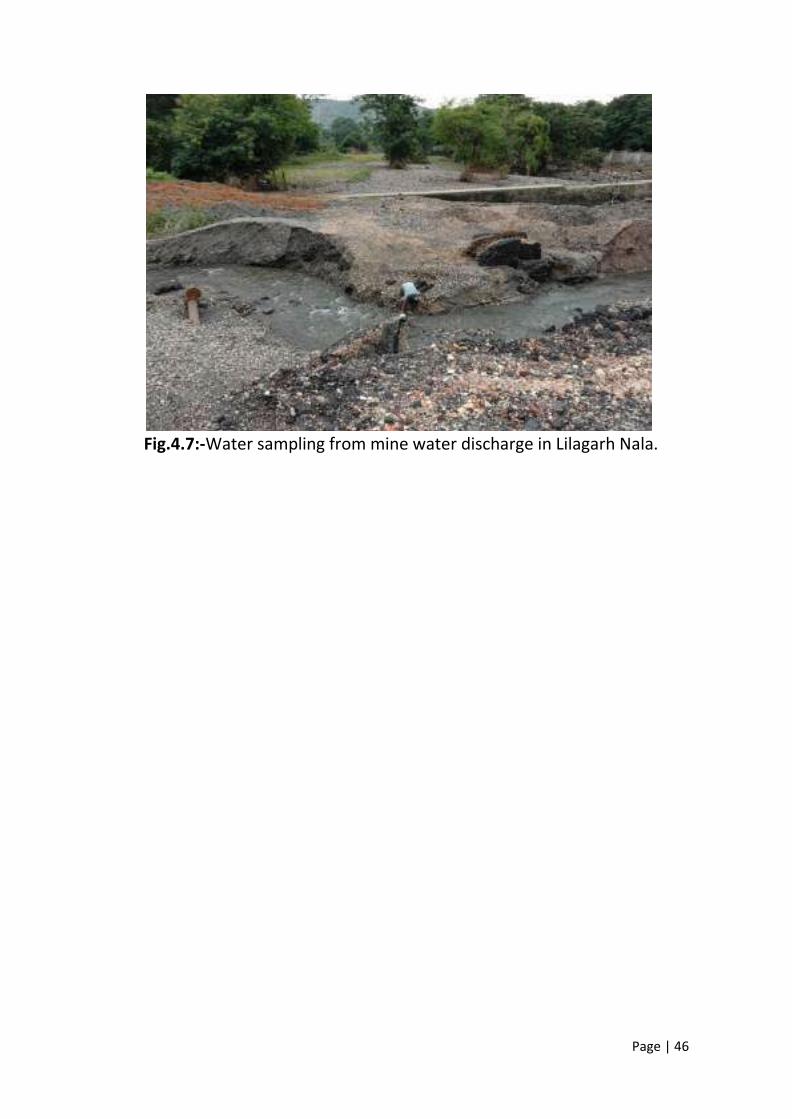
Page | 46
Fig.4.7:-Water sampling from mine water discharge in Lilagarh Nala.

Page | 47
4.1.3SELECTION OF SITES FOR SOIL QUALITY ASSESSMENT
Soil carrying capacity has been assessed to measure whether the local land resources are
effectively used to support activities and are the human population. The soil quality has
been evaluated by collecting soil samples at a different distance in KM from the coal mining
area. Important parameters have been analyzed and compared with the standard
permissible limit to assess the impact caused by mining on soil quality.
Fig.4.8:-Collection of soil from agricultural land to assess the impact
caused by the Gevra mine.
Fig.4.9:-Collection of soil from agricultural land of the Gevra area.
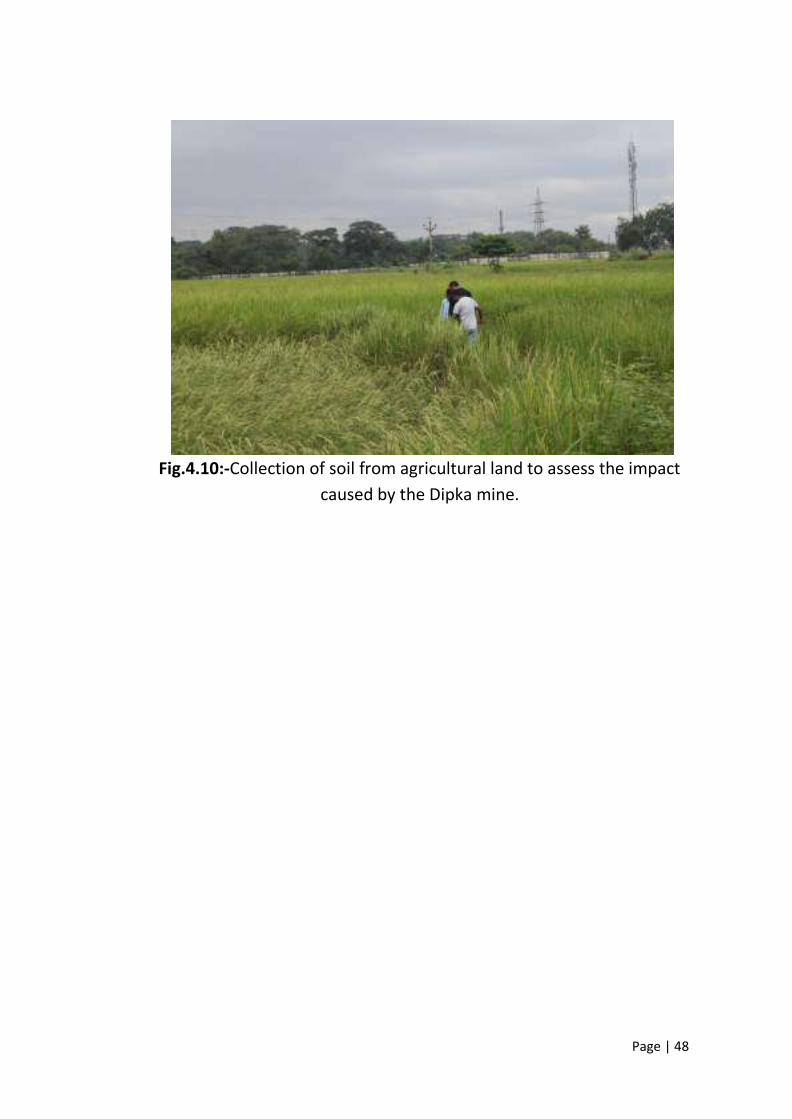
Page | 48
Fig.4.10:-Collection of soil from agricultural land to assess the impact
caused by the Dipka mine.
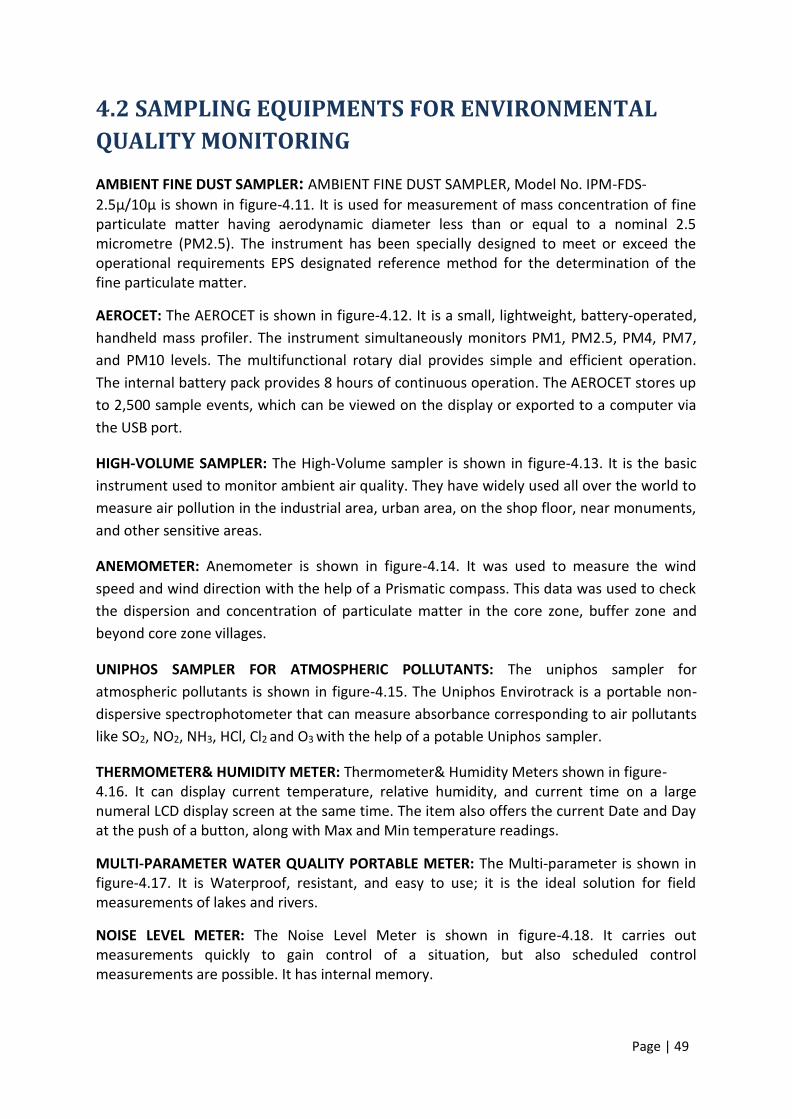
Page | 49
4.2 SAMPLING EQUIPMENTS FOR ENVIRONMENTAL
QUALITY MONITORING
AMBIENT FINE DUST SAMPLER: AMBIENT FINE DUST SAMPLER, Model No. IPM-FDS-
2.5µ/10µ is shown in figure-4.11. It is used for measurement of mass concentration of fine
particulate matter having aerodynamic diameter less than or equal to a nominal 2.5
micrometre (PM2.5). The instrument has been specially designed to meet or exceed the
operational requirements EPS designated reference method for the determination of the
fine particulate matter.
AEROCET: The AEROCET is shown in figure-4.12. It is a small, lightweight, battery-operated,
handheld mass profiler. The instrument simultaneously monitors PM1, PM2.5, PM4, PM7,
and PM10 levels. The multifunctional rotary dial provides simple and efficient operation.
The internal battery pack provides 8 hours of continuous operation. The AEROCET stores up
to 2,500 sample events, which can be viewed on the display or exported to a computer via
the USB port.
HIGH-VOLUME SAMPLER: The High-Volume sampler is shown in figure-4.13. It is the basic
instrument used to monitor ambient air quality. They have widely used all over the world to
measure air pollution in the industrial area, urban area, on the shop floor, near monuments,
and other sensitive areas.
ANEMOMETER: Anemometer is shown in figure-4.14. It was used to measure the wind
speed and wind direction with the help of a Prismatic compass. This data was used to check
the dispersion and concentration of particulate matter in the core zone, buffer zone and
beyond core zone villages.
UNIPHOS SAMPLER FOR ATMOSPHERIC POLLUTANTS: The uniphos sampler for
atmospheric pollutants is shown in figure-4.15. The Uniphos Envirotrack is a portable non-
dispersive spectrophotometer that can measure absorbance corresponding to air pollutants
like SO2, NO2, NH3, HCl, Cl2 and O3 with the help of a potable Uniphos sampler.
THERMOMETER& HUMIDITY METER: Thermometer& Humidity Meters shown in figure-
4.16. It can display current temperature, relative humidity, and current time on a large
numeral LCD display screen at the same time. The item also offers the current Date and Day
at the push of a button, along with Max and Min temperature readings.
MULTI-PARAMETER WATER QUALITY PORTABLE METER: The Multi-parameter is shown in
figure-4.17. It is Waterproof, resistant, and easy to use; it is the ideal solution for field
measurements of lakes and rivers.
NOISE LEVEL METER: The Noise Level Meter is shown in figure-4.18. It carries out
measurements quickly to gain control of a situation, but also scheduled control
measurements are possible. It has internal memory.
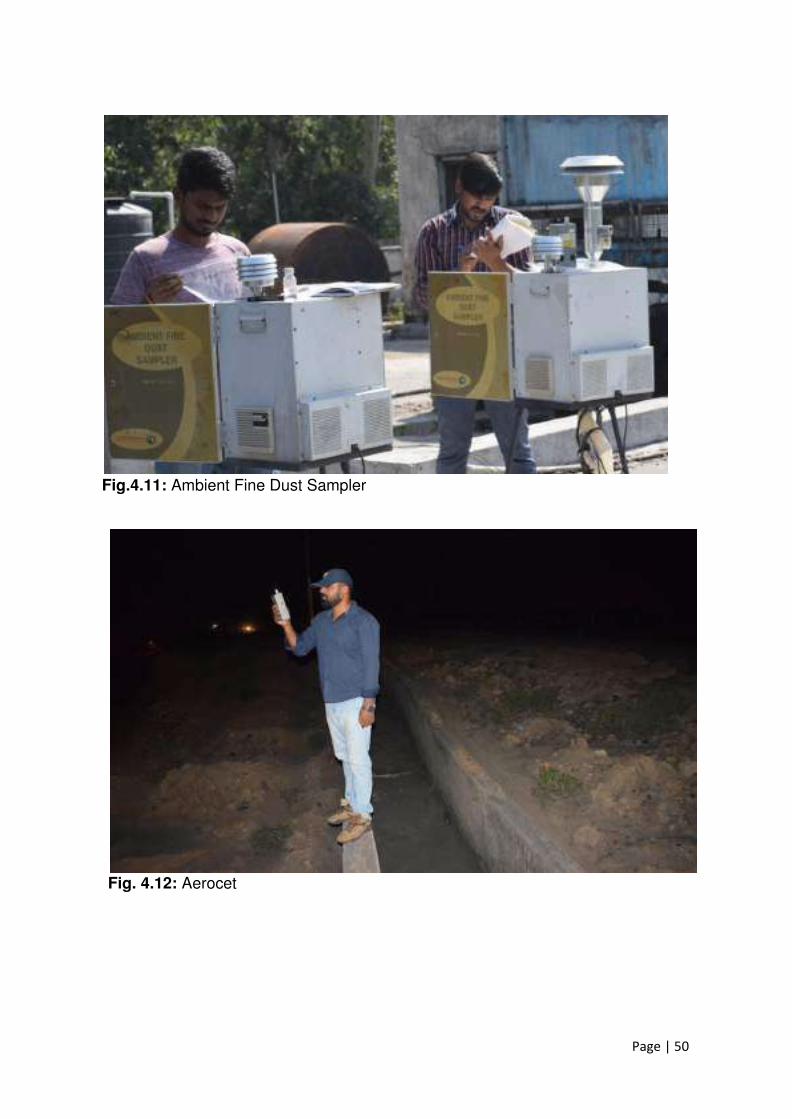
Page | 50
Fig.4.11: Ambient Fine Dust Sampler
Fig. 4.12: Aerocet

Page | 51
Fig.4.13: High Volume Sampler
Fig. 4.14: The Uniphos sampler for atmospheric pollutants
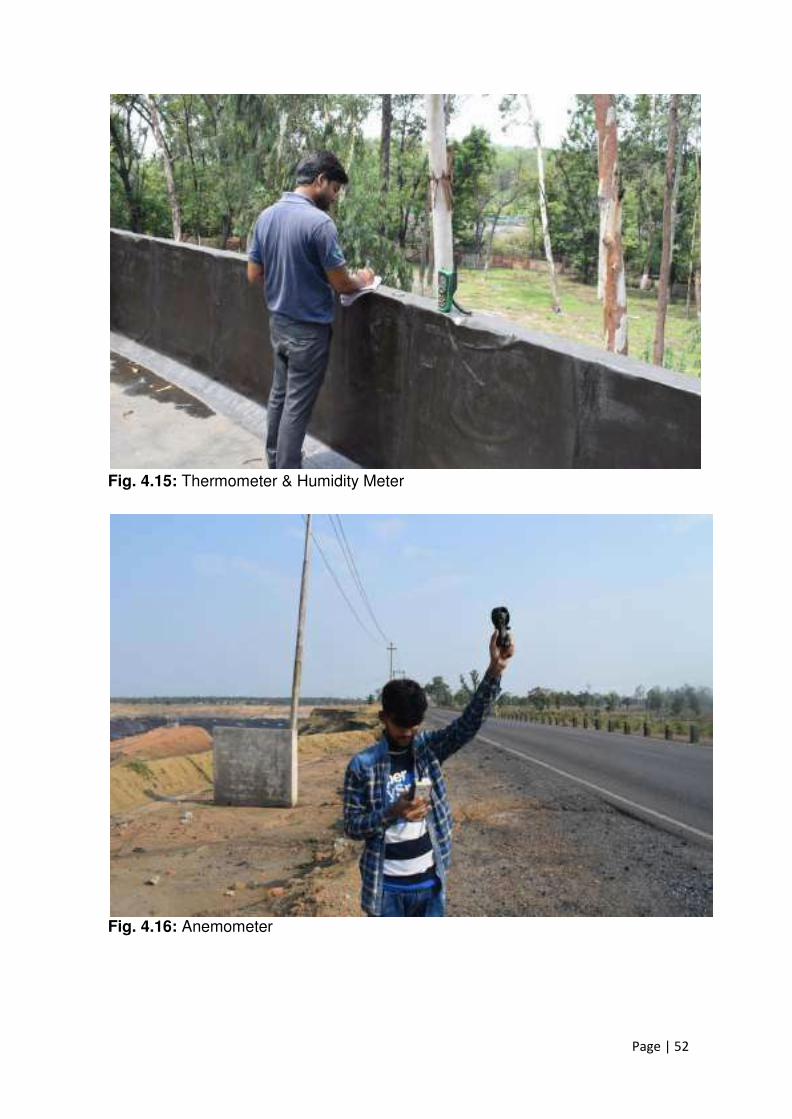
Page | 52
Fig. 4.15: Thermometer & Humidity Meter
Fig. 4.16: Anemometer
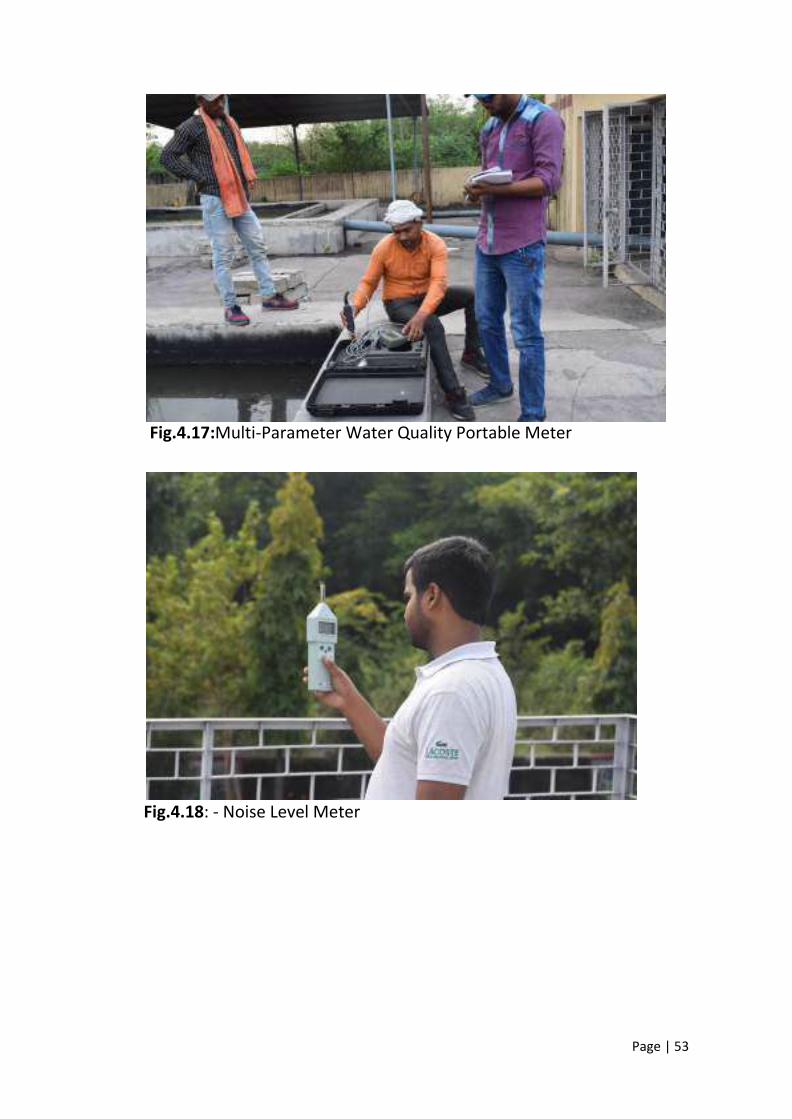
Page | 53
Fig.4.17:Multi-Parameter Water Quality Portable Meter
Fig.4.18: - Noise Level Meter
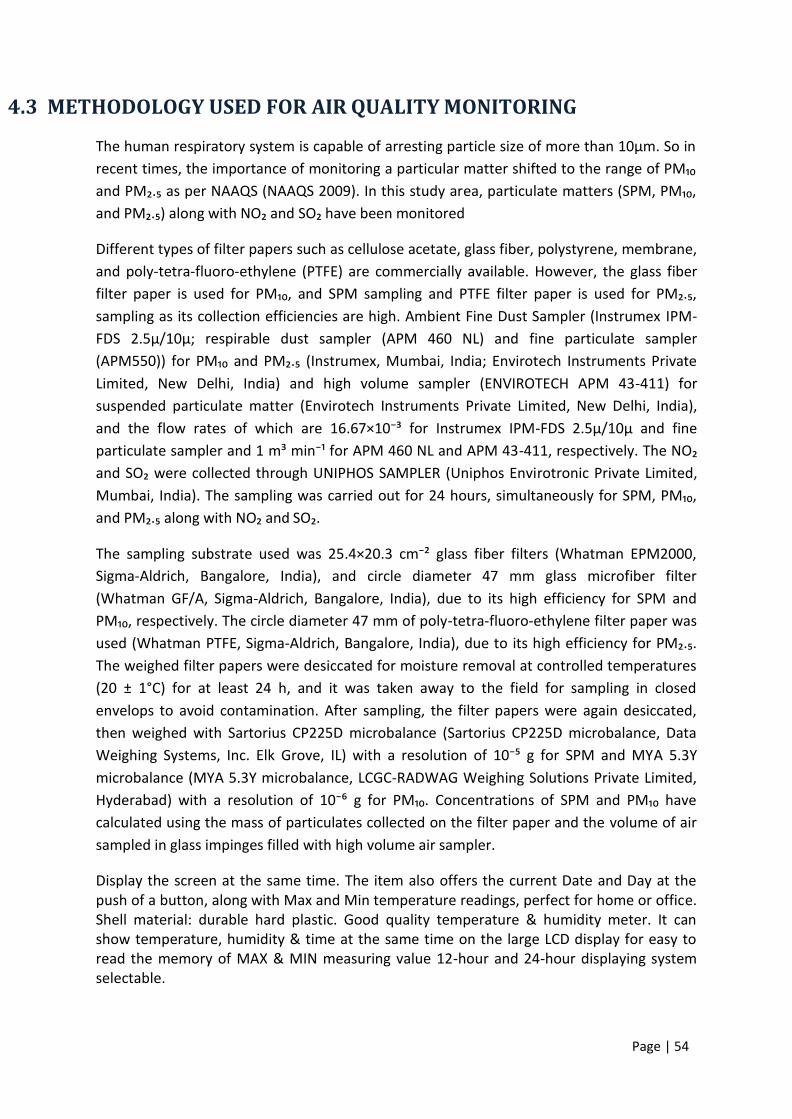
Page | 54
4.3 METHODOLOGY USED FOR AIR QUALITY MONITORING
The human respiratory system is capable of arresting particle size of more than 10µm. So in
e e t ti es, the i po ta e of o ito i g a pa ti ula atte shifted to the a ge of PM a d PM .₅ as pe NAAQ“ NAAQ“ . I this stud a ea, pa ti ulate atte s “PM, PM , a d PM .₅ alo g ith NO a d “O ha e ee o ito ed
Different types of filter papers such as cellulose acetate, glass fiber, polystyrene, membrane,
and poly-tetra-fluoro-ethylene (PTFE) are commercially available. However, the glass fiber
filte pape is used fo PM , a d “PM sa pli g a d PTFE filte pape is used fo PM .₅, sampling as its collection efficiencies are high. Ambient Fine Dust Sampler (Instrumex IPM-
FDS 2.5µ/10µ; respirable dust sampler (APM 460 NL) and fine particulate sampler
APM fo PM a d PM .₅ I st u e , Mu ai, I dia; E i ote h I st u e ts P i ate Limited, New Delhi, India) and high volume sampler (ENVIROTECH APM 43-411) for
suspended particulate matter (Envirotech Instruments Private Limited, New Delhi, India),
a d the flo ates of hi h a e . × ⁻ fo I st u e IPM-FDS 2.5µ/10µ and fine
pa ti ulate sa ple a d i ⁻¹ fo APM NL a d APM - , espe ti el . The NO a d “O e e olle ted th ough UNIPHO“ “AMPLE‘ U iphos E irotronic Private Limited,
Mu ai, I dia . The sa pli g as a ied out fo hou s, si ulta eousl fo “PM, PM , a d PM .₅ alo g ith NO a d “O .
The sa pli g su st ate used as . × . ⁻ glass fi e filte s What a EPM , Sigma-Aldrich, Bangalore, India), and circle diameter 47 mm glass microfiber filter
(Whatman GF/A, Sigma-Aldrich, Bangalore, India), due to its high efficiency for SPM and
PM , espe ti el . The i le dia ete of pol -tetra-fluoro-ethylene filter paper was
used (Whatman PTFE, Sigma-Ald i h, Ba galo e, I dia , due to its high effi ie fo PM .₅. The weighed filter papers were desiccated for moisture removal at controlled temperatures
(20 ± 1°C) for at least 24 h, and it was taken away to the field for sampling in closed
envelops to avoid contamination. After sampling, the filter papers were again desiccated,
then weighed with Sartorius CP225D microbalance (Sartorius CP225D microbalance, Data
Weighi g “ ste s, I . Elk G o e, IL ith a esolutio of ⁻ g fo “PM a d MYA 5.3Y
microbalance (MYA 5.3Y microbalance, LCGC-RADWAG Weighing Solutions Private Limited,
H de a ad ith a esolutio of ⁻ g fo PM . Co e t atio s of “PM a d PM ha e calculated using the mass of particulates collected on the filter paper and the volume of air
sampled in glass impinges filled with high volume air sampler.
Display the screen at the same time. The item also offers the current Date and Day at the
push of a button, along with Max and Min temperature readings, perfect for home or office.
Shell material: durable hard plastic. Good quality temperature & humidity meter. It can
show temperature, humidity & time at the same time on the large LCD display for easy to
read the memory of MAX & MIN measuring value 12-hour and 24-hour displaying system
selectable.

Page | 55
In the present study, the following are the standard methods used for collection, analysis &
interpretation of data:
AAQM “a pli g & a al sis: I dia “ta da ds I“ , Guideli es fo the easu e e t of Ambient Air Pollutants, Vol-I, CPCB, & U“EPA ethods e e used fo A ie t Ai sampling and analysis to study the present pollution load around the Proposed Project
location.
Parameters of
AAQM Standard Methods Analytical Instruments
PM10 IS 5182 (P23):2006 Semi micro Balance
PM2.5 GGMPL/SOP/AA/60 Semi micro Balance
SPM IS 5182 (P4):1999 Semi micro Balance
Oxides of
Nitrogen(NOx) IS 5182 (P6):2006 Spectrophotometer
Oxides of Sulphur
(SO2) IS 5182 (P2):2001 Spectrophotometer
4.4 METHODOLOGY USED FOR CALCULATION OF WATER
QUALITY INDEX
The surface water samples (i.e., reservoir Water samples & industrial water samples) quality
was calculated by using CCME WOI formula developed by the British Columbia Ministry of
Environment, Lands, Parks & modified by Alberta Environment. In this method, the final
index value ranges between 0-100 in which the higher value indicates depletion in quality of
water while the lower value of WQI represents an inc. in quality of water according to the
CCME WOI ranked:-
Excellent: (CCME WQI Value 95-100) - water quality is protected with a visual absence of
threat or impairment, conditions very close to natural or pristine levels.
Good: (CCME WQI Value 80-94) – water quality is protected with only a minor degree of
threat or impairment; conditions rarely depart from natural or desirable levels.
Fair: (CCME WOI Value 65-79) - water quality is usually protected but occasionally
threatened or impaired; conditions sometimes depart from natural or desirable levels.
Marginal: (CCME WOI Value 45-64)- water quality is usually protected but occasionally
threatened or impaired, conditions sometimes depart from natural or desirable levels.
Poor: (CCME WOI Vaiz0-44)- water quality is usually protected but occasionally threatened
or impaired, conditions sometimes depart from natural or desirable levels.

Page | 56
After the bodies of water, the period office, and the variables and objectives have been
defined, each of the three factors that make up the index must be called the calculated. The
calculation of F1 and F2 is relatively straightforward; F3requires some additional steps.
F1(Scope) represents the percentage of variables that do not meet their objectives at least
once during the time period under consideration ("failed variables"), relative to the total
number of variables measured:
F1 = ( � � )
(� � ) X 100
F2 (Frequency) represents the percentage of individual tests that do not meet objectives
failed tests : F1 =
( � � )
(� ) X 100
F3 (Amplitude) represents the amount by which failed test values do not meet their
objectives.
F3 is calculated in three steps.
1) The number of times by which individual concentration is greater than (or less than,
when the objective is a minimum) the objective is termed an "excursion" and is
expressed as follows. When the test value must not exceed the objective:
� � �
excursioni = - 1
For the cases in which the test value must not fall below the objective:
excursioni =
- 1 � � �
2) The collective amount by which individual tests are out of compliance is calculated
by summing the excursions of individual tests from their objectives and dividing by
the total number of tests (both those meeting objectives and those not meeting
objectives). This variable referred to as the normalized sum of excursions, or nse, is
calculated as:
nse = ∑ � n
#
3) F3 is then calculated by an asymptotic function that scales the normalized sum of the
excursions from objectives (nse) to yield a range between 0 and 100.
F3 =
0.01 +0.01
Once the factors have been obtained, the index itself can be calculated by summing the
three factors as if they were vectors. The sum of the squares of each factor is, therefore,
equal to the square of the index. This approach treats the index as a three-dimensional

Page | 57
space defined by each factor along one axis. With this model, the index changes in direct
proportion to changes in all three factors.
The CCME Water Quality Index (CCME WQI):
The divisor 1.732 normalizes the resultant values to a range between 0 and 100, where 0
represents the "worst" water quality and 100 represents the "best" water quality.
CCMEWQI = 100 – √�12+ �22+ �32
1.732
The divisor 1.732 normalizes the resultant values to a range between 0 and 100, where 0
represents the "worst" water quality, and 100 represents the "best" water quality.
4.5 AIR AND WATER QUALITY ASSESSMENT INDEX
AIR QUALITY INDEX:
Air quality index is one of the popular methods for assessing the quality of the air of a
particular area. Category and the associated health impact on human beings of AQI is given
in the following table:
AQI INDEXES, CATEGORIES, AND ASSOCIATED HEALTH IMPACTS
Air Quality
Index Values
AirQuality
Index
Categories
Associated Health Impacts
0-50 Good Minimal Impact
51-100 Satisfactory May cause minor breathing discomfort to sensitive people
101-200 Moderately
Polluted
May cause breathing discomfort to the people with lung disease such as
asthma and discomfort to people with heart disease, children and older
adults
201-300 Poor May cause breathing discomfort to people on prolonged exposure and
discomfort to people with heart disease
301-400 Very Poor May cause respiratory illness to the people on prolonged exposure. Effect
may be more pronounced in people with lung and heart diseases
401-500
Severe
May cause respiratory effects even on healthy people and serious health
impacts on people with lung/heart diseases. The health impacts may be
experienced even during light physical activity
Water Quality Index (WQI)
The Water Quality Index (WQI) analysis provides a comprehensive picture of the quality of
surface and groundwater for most domestic uses. WQI is defined as a rating that reflects the
composite influence of different water quality parameters. It is an important parameter for
assessing groundwater quality and its suitability for drinking purposes. Types of water
quality are shown in the following table:
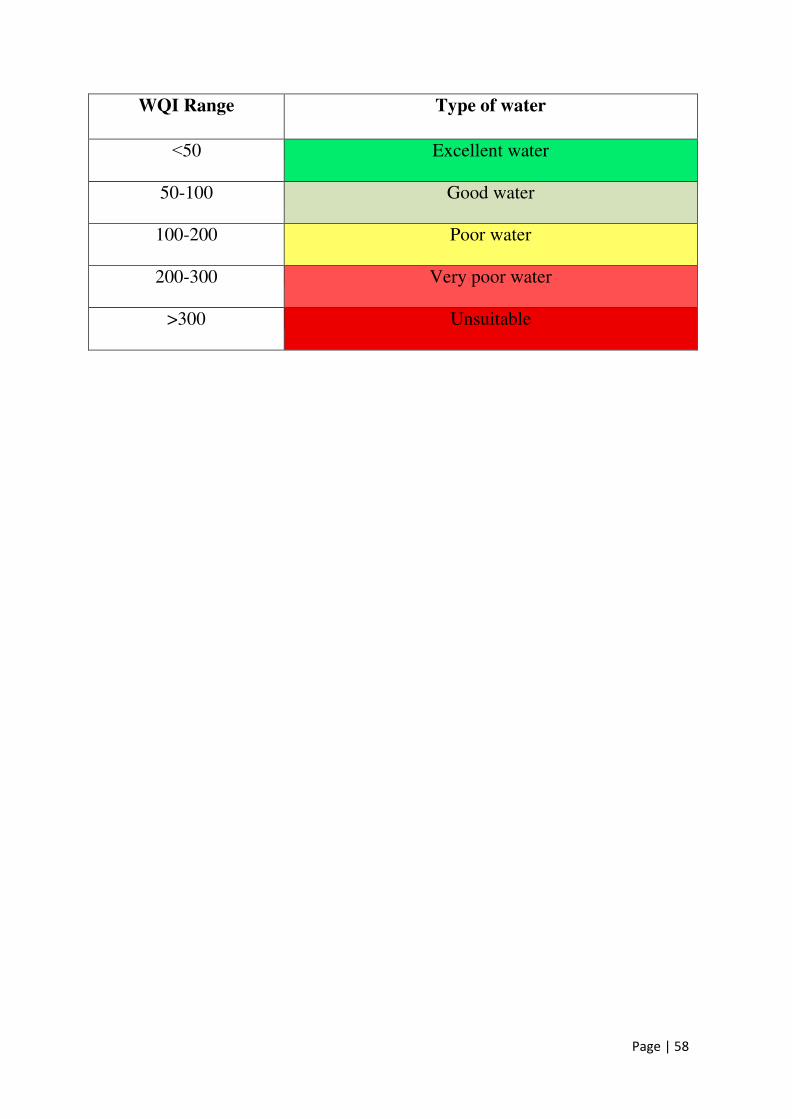
Page | 58
WQI Range Type of water
˂50 Excellent water
50-100 Good water
100-200 Poor water
200-300 Very poor water
>300 Unsuitable

Page | 59
4.6 CHANGES IN LAND USED PATTERN
Land used pattern in the study area has been shown in satellite photograph
Figure- 4.19 Land used pattern shown satellite photograph 1994

Page | 60
Figure- 4.20 Land used pattern shown satellite photograph 1999
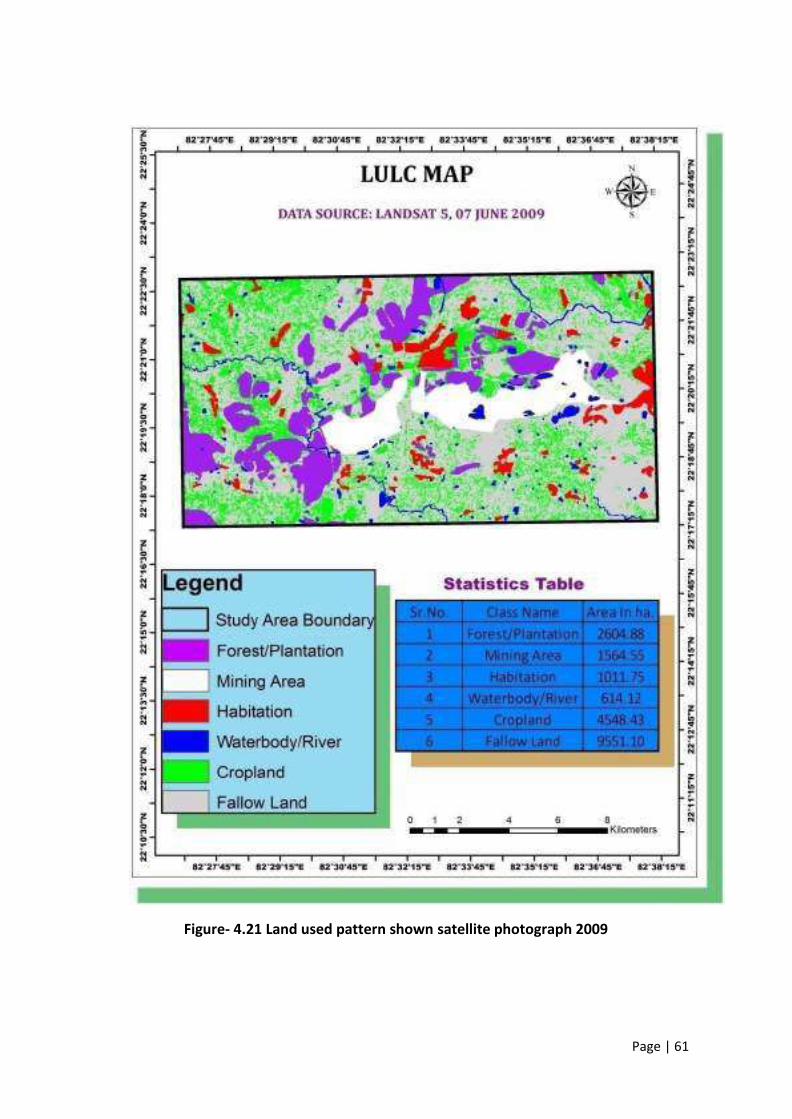
Page | 61
Figure- 4.21 Land used pattern shown satellite photograph 2009

Page | 62
Figure- 4.22 Land used pattern shown satellite photograph 2014

Page | 63
Figure- 4.23 Land used pattern shown satellite photograph 2019
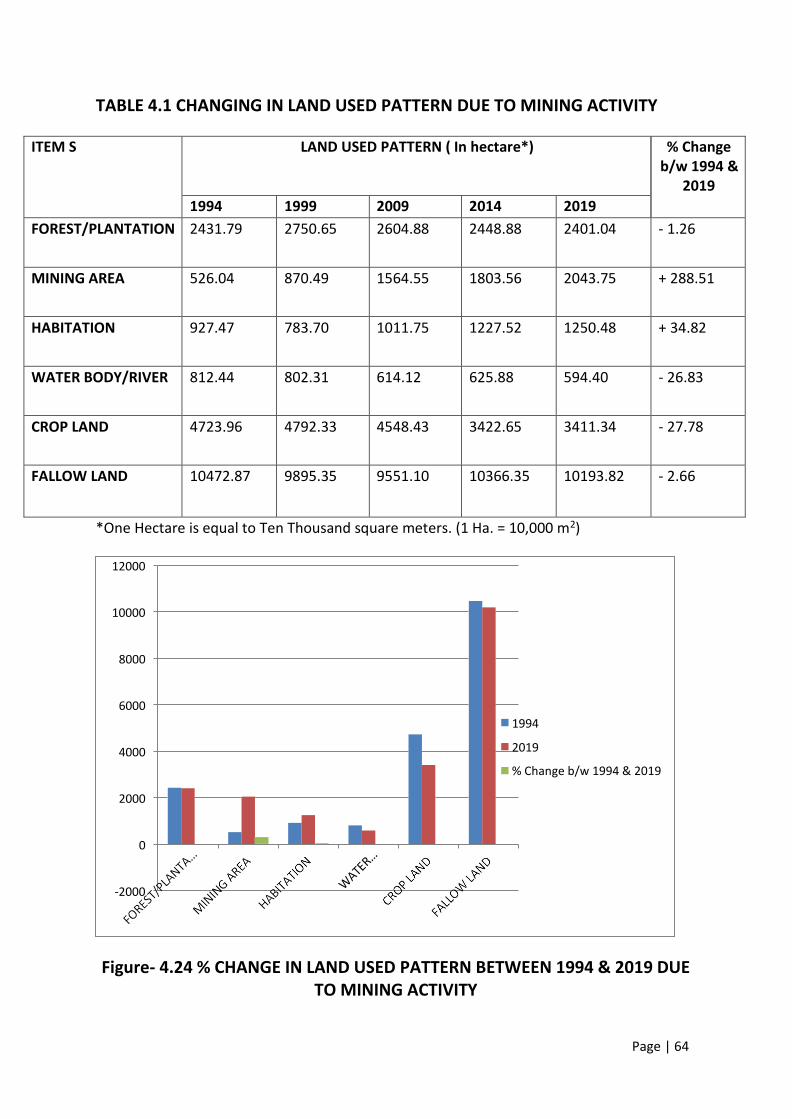
Page | 64
-2000
0
2000
2019
% Change b/w 1994 & 2019
4000
1994
6000
8000
10000
12000
TABLE 4.1 CHANGING IN LAND USED PATTERN DUE TO MINING ACTIVITY
ITEM S LAND USED PATTERN ( In hectare*) % Change
b/w 1994 &
2019
1994 1999 2009 2014 2019
FOREST/PLANTATION 2431.79 2750.65 2604.88 2448.88 2401.04 - 1.26
MINING AREA 526.04 870.49 1564.55 1803.56 2043.75 + 288.51
HABITATION 927.47 783.70 1011.75 1227.52 1250.48 + 34.82
WATER BODY/RIVER 812.44 802.31 614.12 625.88 594.40 - 26.83
CROP LAND 4723.96 4792.33 4548.43 3422.65 3411.34 - 27.78
FALLOW LAND 10472.87 9895.35 9551.10 10366.35 10193.82 - 2.66
*One Hectare is equal to Ten Thousand square meters. (1 Ha. = 10,000 m2)
Figure- 4.24 % CHANGE IN LAND USED PATTERN BETWEEN 1994 & 2019 DUE
TO MINING ACTIVITY

Page | 65
Besides ground-level fieldwork, Satellite photograph (Imaginary) has also been used to
assess the carrying capacity of eco-system services of Gevra and Dipka open cast coal mining
complexes. 5 Satellite images starting from 1994 to 2019 has been thoroughly observed.
Following parameters have been studies to see the % of changes in the past 25 years due to
mining activity:
1. Forest/Plantation
2. Mining Area
3. Habitation
4. Water bodies/River
5. Cropland
6. Fallow land
The results are given in Table 4.1 and shown in Figure 4.24 It may be observed from Table
4.1 & Figure 4.19-4.23 That is 1994, the Forest/Plantation cover was 2431.79 hectares, and
it was increased to 2750.65 in 1999. Further, there is a marginal decrease in
Forest/Plantation cover from 2009 (2604.88 Hectare) to 2019 (2401.04). However, there is a
marginal negative % change between the last 25 years. This is due to the expansion of the
open cast mining area during this period, as observed from the table 4.1 This negative %
change in Forest/Plantation may become positive after Reclamation/Afforestation of
overburden dumped area.
It may also be being observed from Table 4.1 & Figure 4.24 that there is a negative % change
in the following items considered for determining the impact of mining on ecosystem
services of the area.
1. Water bodies/River
2. Cropland
3. Fallow land
Another important impact of coal mining on carrying capacity of eco-system services –
Water (Water body/River) has also been investigated in detail. The results from 1994 to
2019 are given in table numbers 4.1 for 25 years. Figure numbers from 4.19 To 4.23 also
depict visual changes. The water bodies (Sump, Pond, Reservoir River) in the area has been
decreased significantly, as observed from figure and table in the last 25 years. This may be
due to coverage of land for habitation, construction of road and mining activity in the area
under investigation. The loss of water bodies due to various reasons should be reduced.
As per Pre-monsoon and post-monsoon water level data, it seems that there is a marginal
fluctuation of water level in the area. This may be due to various factors such as rainfall
patterns, consumption of water due to an increase in population, which was more than 30%
in the area.
However, the water (Rainfall and groundwater) collected in the mined out and filled area is
acting as a major source of recharge of groundwater in the area. Through this area in figure
is measured as the mined-out area, which is connected as a groundwater recharge area.
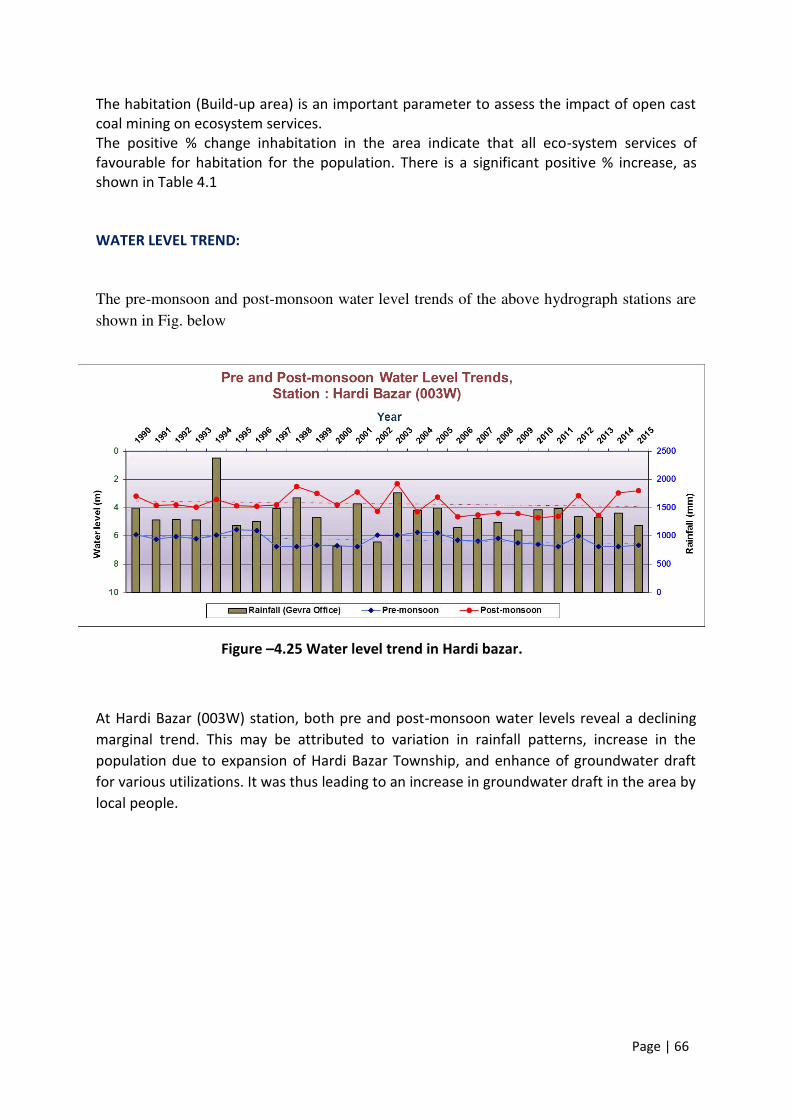
Page | 66
The habitation (Build-up area) is an important parameter to assess the impact of open cast
coal mining on ecosystem services.
The positive % change inhabitation in the area indicate that all eco-system services of
favourable for habitation for the population. There is a significant positive % increase, as
shown in Table 4.1
WATER LEVEL TREND:
The pre-monsoon and post-monsoon water level trends of the above hydrograph stations are
shown in Fig. below
Figure –4.25 Water level trend in Hardi bazar.
At Hardi Bazar (003W) station, both pre and post-monsoon water levels reveal a declining
marginal trend. This may be attributed to variation in rainfall patterns, increase in the
population due to expansion of Hardi Bazar Township, and enhance of groundwater draft
for various utilizations. It was thus leading to an increase in groundwater draft in the area by
local people.

Page | 67
Figure –4.26 Water level trend in Banki Mogra.
At Banki Mogra station, post-monsoon water levels reveal an increasing marginal trend and
attributed to the position of a well in the recharge area. Contrastingly, the appreciable
declining trends of water level at this station for pre-monsoon season is ascribed to, location
of well immediately above underground mine working sand large mine water pumping as
well as an increase in groundwater draft in the area by local people.

Page | 68
CHAPTER-V: CARRYING CAPACITY ASSESSMENT OF
STUDY AREA
For undertaki g the e ologi al footp i t a al sis of oth the Ge a a d Dipka OCP s a d its surrounding area, the environmental quality and ecological data were collected and
presented below:
5.1 ENVIRONMENTAL QUALITY MONITORING IN GEVRA MINE
Micro Meteorological Condition
A micrometeorological station has been installed for the study period from May 2019 to Nov 2019.
The predominant wind direction has been observed from S to E. The average wind speed was 3.91
m/s, and for 36.15 %, calm conditions have prevailed in the study area.
FIGURE 5.1: WIND-ROSE DIAGRAM SHOWING PREDOMINANT WIND DIRECTION
The lo atio s fo ai sa pli g e e sele ted o the asis of joi t site su e , e -
a i atio of topo sheet of the p oje t a ea , se o da i o eteo ologi al data a al sis , histo i al i d di e tio patte a d a aila ilit of esou es fo a ie t ai quality monitoring and noise level monitoring.
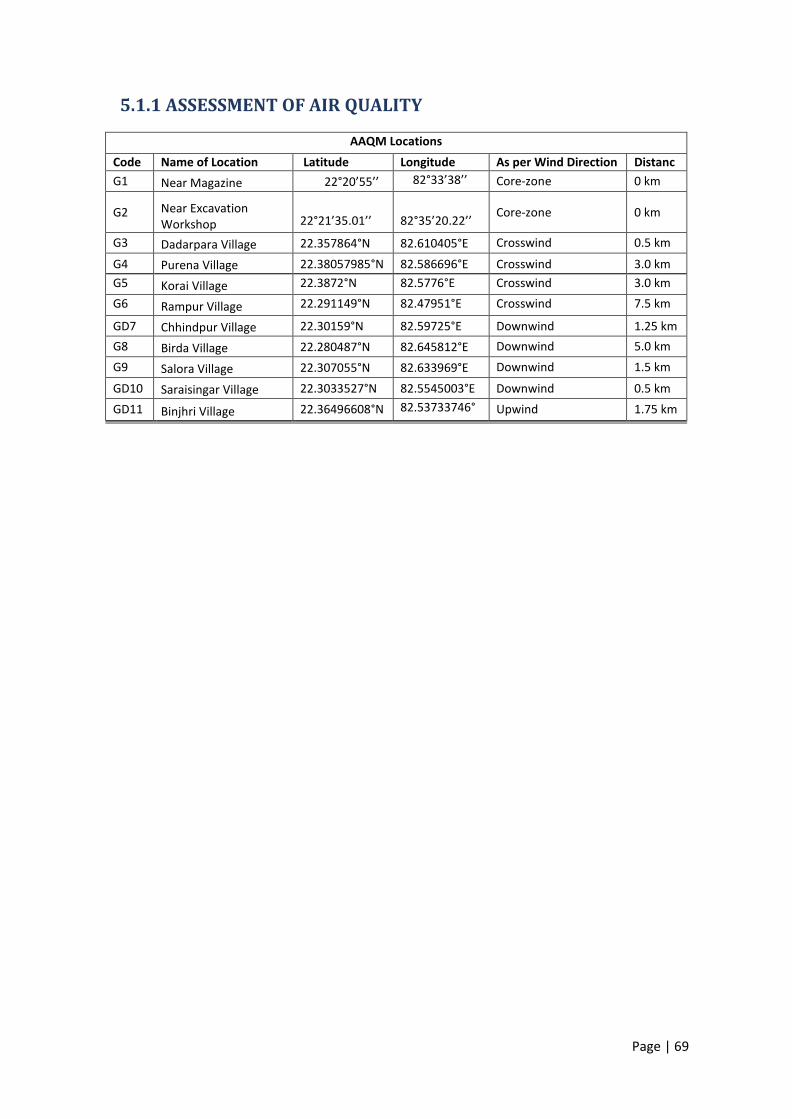
Page | 69
5.1.1 ASSESSMENT OF AIR QUALITY
AAQM Locations
Code Name of Location Latitude Longitude As per Wind Direction Distanc
G1 Near Magazine ° ° Core-zone 0 km
G2 Near Excavation
Workshop
° .
° .
Core-zone 0 km
G3 Dadarpara Village 22.357864°N 82.610405°E Crosswind 0.5 km
G4 Purena Village 22.38057985°N 82.586696°E Crosswind 3.0 km
G5 Korai Village 22.3872°N 82.5776°E Crosswind 3.0 km
G6 Rampur Village 22.291149°N 82.47951°E Crosswind 7.5 km
GD7 Chhindpur Village 22.30159°N 82.59725°E Downwind 1.25 km
G8 Birda Village 22.280487°N 82.645812°E Downwind 5.0 km
G9 Salora Village 22.307055°N 82.633969°E Downwind 1.5 km
GD10 Saraisingar Village 22.3033527°N 82.5545003°E Downwind 0.5 km
GD11 Binjhri Village 22.36496608°N 82.53733746° Upwind 1.75 km

Page | 70
Name of Location
(G1)
G1-NEAR MAGAZINE (GEVRA)
Sr. No.
Date of
Sampling
SPM
PM10
PM2.5
SO2
NOx
DAILY
EXCAVATED
QUANTITY
Unit µg/m3 µg/m3
µg/m3 µg/m3
µg/m3 (1000,m^3)
GSR 742 (E) 600 300 - 120 120 -
1. 23.05.2019 284.3 173.6 51.3 32.5 32.7 309.532
2. 27.05.2019 312.5 186.4 57.8 31.4 26.5 313.343
3. 30.05.2019 289.1 166.3 51.3 28.6 20.1 300.351
4. 03.06.2019 271.6 172.9 49.3 42.5 38.4 297.555
5. 06.06.2019 293.4 179.3 47.3 44.1 29.5 290.996
6. 10.06.2019 311.7 187.3 52.8 26.5 20.1 289.174
7. 13.06.2019 413.8 203.4 66.7 28.6 19.5 302.805
8. 16.09.2019 285.4 171.8 51.9 19.7 12.5 184.727
9. 20.09.2019 345.3 189.3 56.8 31.2 20.6 190.965
10. 23.09.2019 298.6 173.8 49.8 30.7 22.6 174.602
11. 27.09.2019 261.3 143.8 47.2 19.8 13.5 102.881
12. 30.09.2019 305.6 172.9 55.8 26.5 23.6 36.06
13. 04.10.2019 289.6 158.3 53.4 28.8 19.5 182.362
14. 07.10.2019 276.8 169.8 53.9 31.4 20.5 168.348
15. 11.10.2019 312.8 183.4 56.1 42 23 211.578
16. 14.10.2019 319.7 187.3 54.6 41.2 30.8 227.176
17. 18.10.2019 276.8 155.8 46.8 39.2 28 173.604
18. 21.10.2019 309.8 179.3 52.7 35.5 21.5 191.668
19. 25.10.2019 397.8 198.3 61.3 39.9 27.6 209.099
20. 28.10.2019 274.8 166.3 48.6 35 20.6 227.858
21 01.11.2019 318.6 169.8 55.8 41.8 21.9 221.696
22. 04.11.2019 272.5 146.9 53.4 43.3 22.9 237.558
23. 08.11.2019 312.5 172.3 56.1 39.5 19.5 250.175
24. 11.11.2019 370.1 185.3 58.3 42.9 23.5 261.782
25. 15.11.2019 273.1 146.7 52.1 38.2 22.4 256.71
26. 18.11.2019 284.9 159.4 51.7 32.5 32.5 247.385
27. 22.11.2019 266.1 162.5 52.3 28.1 28.2 258.212
28. 25.11.2019 273.8 152.9 48.9 36.3 32.8 260.522
29. 29.11.2019 268.3 167.9 55.4 31.7 29.5 250.252
30. 02.12.2019 236.4 142.6 54.9 31.5 30.1 271.477
31. 06.12.2019 319.4 172.6 53.8 32.6 30.5 277.632
32. 09.12.2019 276.8 161.8 52.7 31.4 29.8 260.945
33. 13.12.2019 341.8 187.9 58.9 31.5 33.1 268.351
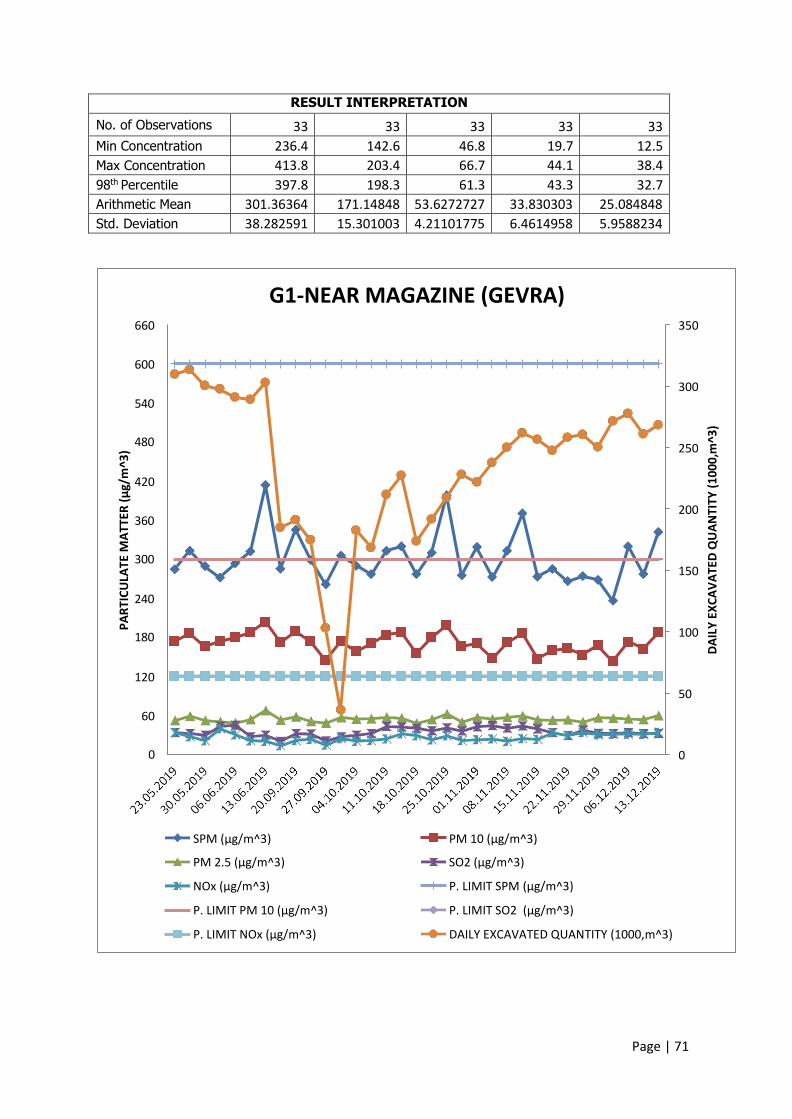
Page | 71
RESULT INTERPRETATION
No. of Observations 33 33 33 33 33
Min Concentration 236.4 142.6 46.8 19.7 12.5
Max Concentration 413.8 203.4 66.7 44.1 38.4
98th Percentile 397.8 198.3 61.3 43.3 32.7
Arithmetic Mean 301.36364 171.14848 53.6272727 33.830303 25.084848
Std. Deviation 38.282591 15.301003 4.21101775 6.4614958 5.9588234
G1-NEAR MAGAZINE (GEVRA) 660 350
600
300
540
480
250
420
200 360
300
150
240
180 100
120
50
60
0 0
“PM μg/ ^
PM . μg/ ^
NO μg/ ^
P. LIMIT PM μg/ ^
P. LIMIT NO μg/ ^
PM μg/ ^
“O μg/ ^
P. LIMIT SPM μg/ ^
P. LIMIT SO2 μg/ ^
DAILY EXCAVATED QUANTITY (1000,m^3)
PART
ICUL
ATE
MAT
TER
μg/m
^3
DA
ILY
EX
CA
VA
TE
D Q
UA
NT
ITY
(1
00
0,m
^3
)
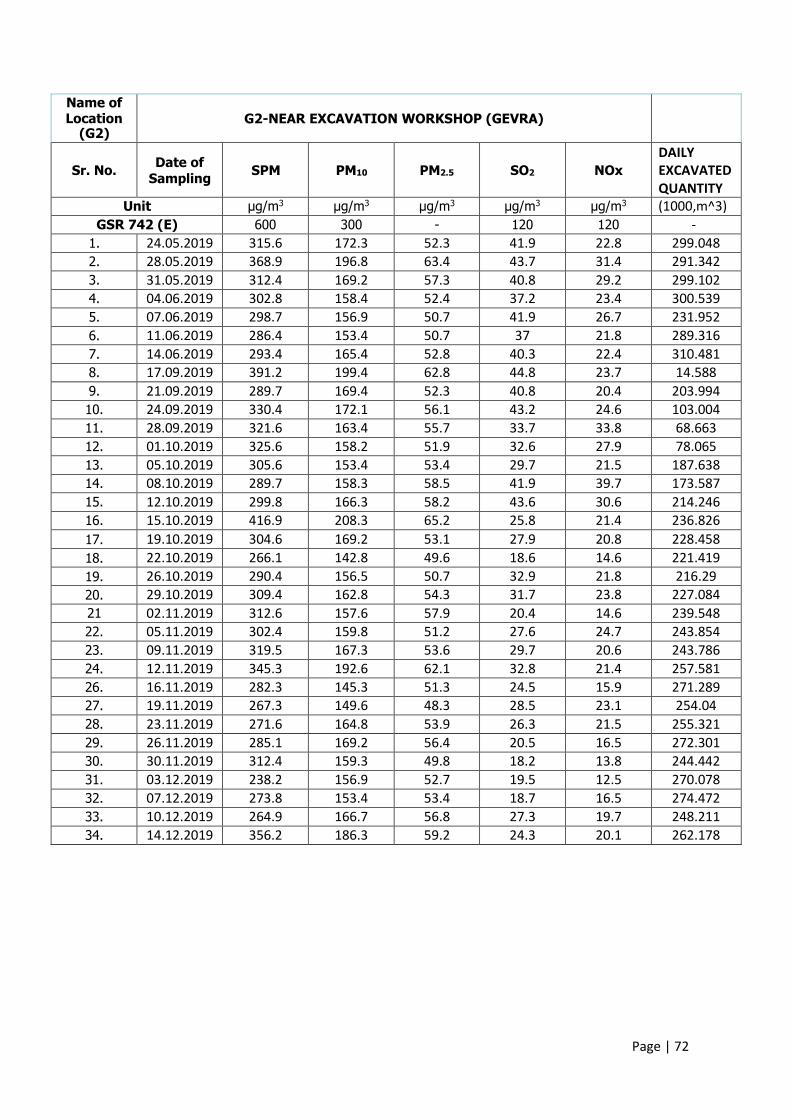
Page | 72
Name of Location
(G2)
G2-NEAR EXCAVATION WORKSHOP (GEVRA)
Sr. No.
Date of
Sampling
SPM
PM10
PM2.5
SO2
NOx
DAILY
EXCAVATED
QUANTITY
Unit µg/m3 µg/m3
µg/m3 µg/m3
µg/m3 (1000,m^3)
GSR 742 (E) 600 300 - 120 120 -
1. 24.05.2019 315.6 172.3 52.3 41.9 22.8 299.048
2. 28.05.2019 368.9 196.8 63.4 43.7 31.4 291.342
3. 31.05.2019 312.4 169.2 57.3 40.8 29.2 299.102
4. 04.06.2019 302.8 158.4 52.4 37.2 23.4 300.539
5. 07.06.2019 298.7 156.9 50.7 41.9 26.7 231.952
6. 11.06.2019 286.4 153.4 50.7 37 21.8 289.316
7. 14.06.2019 293.4 165.4 52.8 40.3 22.4 310.481
8. 17.09.2019 391.2 199.4 62.8 44.8 23.7 14.588
9. 21.09.2019 289.7 169.4 52.3 40.8 20.4 203.994
10. 24.09.2019 330.4 172.1 56.1 43.2 24.6 103.004
11. 28.09.2019 321.6 163.4 55.7 33.7 33.8 68.663
12. 01.10.2019 325.6 158.2 51.9 32.6 27.9 78.065
13. 05.10.2019 305.6 153.4 53.4 29.7 21.5 187.638
14. 08.10.2019 289.7 158.3 58.5 41.9 39.7 173.587
15. 12.10.2019 299.8 166.3 58.2 43.6 30.6 214.246
16. 15.10.2019 416.9 208.3 65.2 25.8 21.4 236.826
17. 19.10.2019 304.6 169.2 53.1 27.9 20.8 228.458
18. 22.10.2019 266.1 142.8 49.6 18.6 14.6 221.419
19. 26.10.2019 290.4 156.5 50.7 32.9 21.8 216.29
20. 29.10.2019 309.4 162.8 54.3 31.7 23.8 227.084
21 02.11.2019 312.6 157.6 57.9 20.4 14.6 239.548
22. 05.11.2019 302.4 159.8 51.2 27.6 24.7 243.854
23. 09.11.2019 319.5 167.3 53.6 29.7 20.6 243.786
24. 12.11.2019 345.3 192.6 62.1 32.8 21.4 257.581
26. 16.11.2019 282.3 145.3 51.3 24.5 15.9 271.289
27. 19.11.2019 267.3 149.6 48.3 28.5 23.1 254.04
28. 23.11.2019 271.6 164.8 53.9 26.3 21.5 255.321
29. 26.11.2019 285.1 169.2 56.4 20.5 16.5 272.301
30. 30.11.2019 312.4 159.3 49.8 18.2 13.8 244.442
31. 03.12.2019 238.2 156.9 52.7 19.5 12.5 270.078
32. 07.12.2019 273.8 153.4 53.4 18.7 16.5 274.472
33. 10.12.2019 264.9 166.7 56.8 27.3 19.7 248.211
34. 14.12.2019 356.2 186.3 59.2 24.3 20.1 262.178
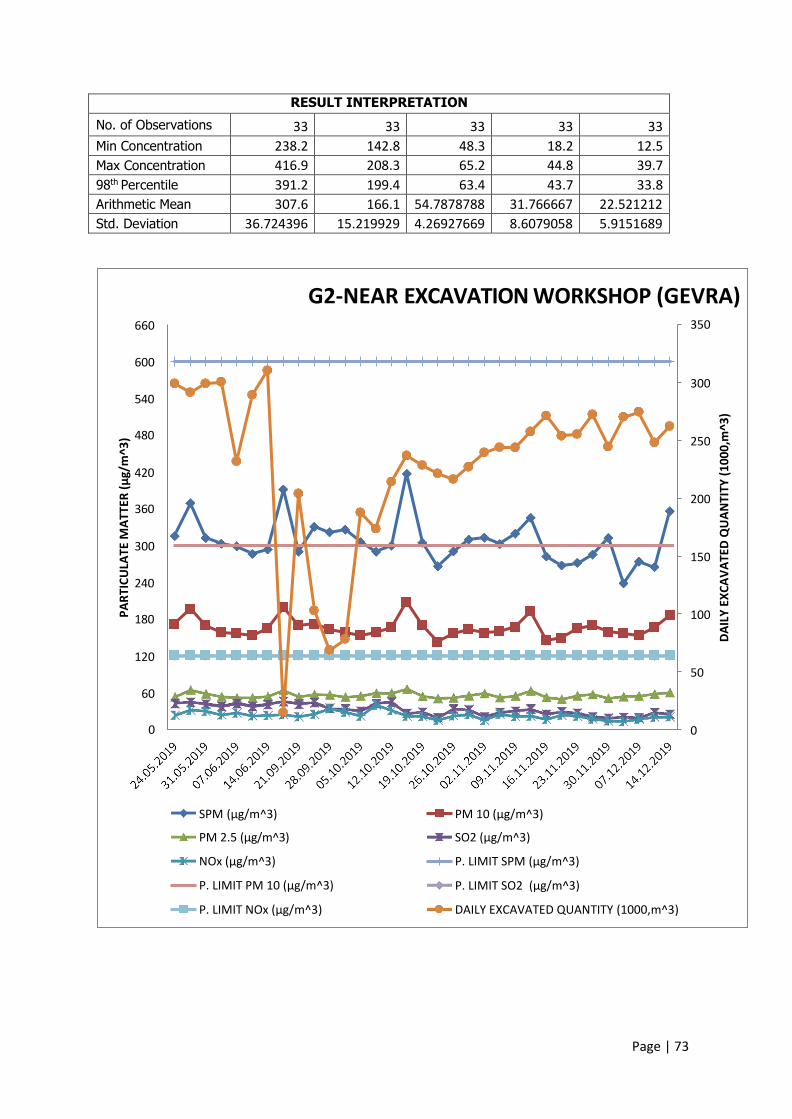
Page | 73
RESULT INTERPRETATION
No. of Observations 33 33 33 33 33
Min Concentration 238.2 142.8 48.3 18.2 12.5
Max Concentration 416.9 208.3 65.2 44.8 39.7
98th Percentile 391.2 199.4 63.4 43.7 33.8
Arithmetic Mean 307.6 166.1 54.7878788 31.766667 22.521212
Std. Deviation 36.724396 15.219929 4.26927669 8.6079058 5.9151689
660
G2-NEAR EXCAVATION WORKSHOP (GEVRA) 350
600
300
540
480
250
420
360
200
300 150
240
180 100
120
50
60
0 0
SPM μg/ ^
PM 2.5 μg/ ^
NOx μg/ ^
P. LIMIT PM μg/ ^
P. LIMIT NO μg/ ^
PM μg/ ^
“O μg/ ^
P. LIMIT SPM μg/ ^
P. LIMIT SO2 μg/ ^
DAILY EXCAVATED QUANTITY (1000,m^3)
PART
ICUL
ATE
MAT
TER
μg/m
^3
DA
ILY
EX
CA
VA
TE
D Q
UA
NT
ITY
(1
00
0,m
^3
)

Page | 74
Name of Location
(G3)
G3-DADARPARA VILLAGE (GEVRA)
Sr. No.
Date of
Sampling
SPM
PM10
PM2.5
SO2
NOx
DAILY
EXCAVATED
QUANTITY
Unit µg/m3 µg/m3
µg/m3 µg/m3
µg/m3 (1000,m^3)
GSR 826 (E) - 100 60 80 80 -
1. 23.05.2019 172.6 85.3 41.3 39.1 26.5 309.532
2. 27.05.2019 138.2 70.2 32.4 32.6 20.8 313.343
3. 30.05.2019 149.3 79.6 39.1 29.6 22.6 300.351
4. 03.06.2019 165.2 83.1 33.4 29.5 24.3 297.555
5. 06.06.2019 169.4 80.3 29.5 27.4 21.9 290.996
6. 10.06.2019 154.2 79.4 36.4 23.5 19.5 289.174
7. 13.06.2019 129.6 82.4 39.1 23.5 18.4 302.805
8. 16.09.2019 138.2 81.9 41.8 21.5 16.8 184.727
9. 20.09.2019 150.2 76.3 40.7 29.5 16.5 190.965
10. 23.09.2019 165.2 82.4 36.8 38.5 28.5 174.602
11. 27.09.2019 126.4 80.2 33.1 26.5 21.6 102.881
12. 30.09.2019 150.3 79.6 36.4 23.6 20.1 36.06
13. 04.10.2019 150.4 81.9 38.2 21.5 18.5 182.362
14. 07.10.2019 129.4 77.2 31.2 29.5 16.5 168.348
15. 11.10.2019 150.2 68.2 33.4 20.1 18.5 211.578
16. 14.10.2019 158.3 84.7 41.8 23.5 19.5 227.176
17. 18.10.2019 138.4 81.9 43.2 22.1 17.5 173.604
18. 21.10.2019 170.2 83.4 37.2 29.5 22.6 191.668
19. 25.10.2019 165.9 80.7 40.2 20.6 21.9 209.099
20. 28.10.2019 172.4 84.9 42.1 21.5 16.5 227.858
21. 01.11.2019 154.3 73.1 33.5 20.9 17.5 221.696
22. 04.11.2019 164.2 86.4 38.9 26.5 20.6 237.558
23. 08.11.2019 159.8 72.1 29.4 21.5 20.9 250.175
24. 11.11.2019 166.2 86.4 39.1 23.5 17.9 261.782
25. 15.11.2019 173.1 82.1 40.7 24.6 19.4 256.71
26. 18.11.2019 144.8 68.4 29.4 26.4 19.7 247.385
27. 22.11.2019 154.2 72.9 38.4 20.8 13.5 258.212
28. 25.11.2019 131.5 63.5 39.5 26.8 16.8 260.522
29. 29.11.2019 150.7 68.4 36.8 20.4 18.2 250.252
30. 02.12.2019 142.6 76.9 42.8 22.6 15.3 271.477
31. 06.12.2019 140.9 63.5 41.2 32.4 21.6 277.632
32. 09.12.2019 139.4 69.8 28.3 33.4 18.4 260.945
33. 13.12.2019 134.6 64.9 36.2 24.3 19.3 268.351
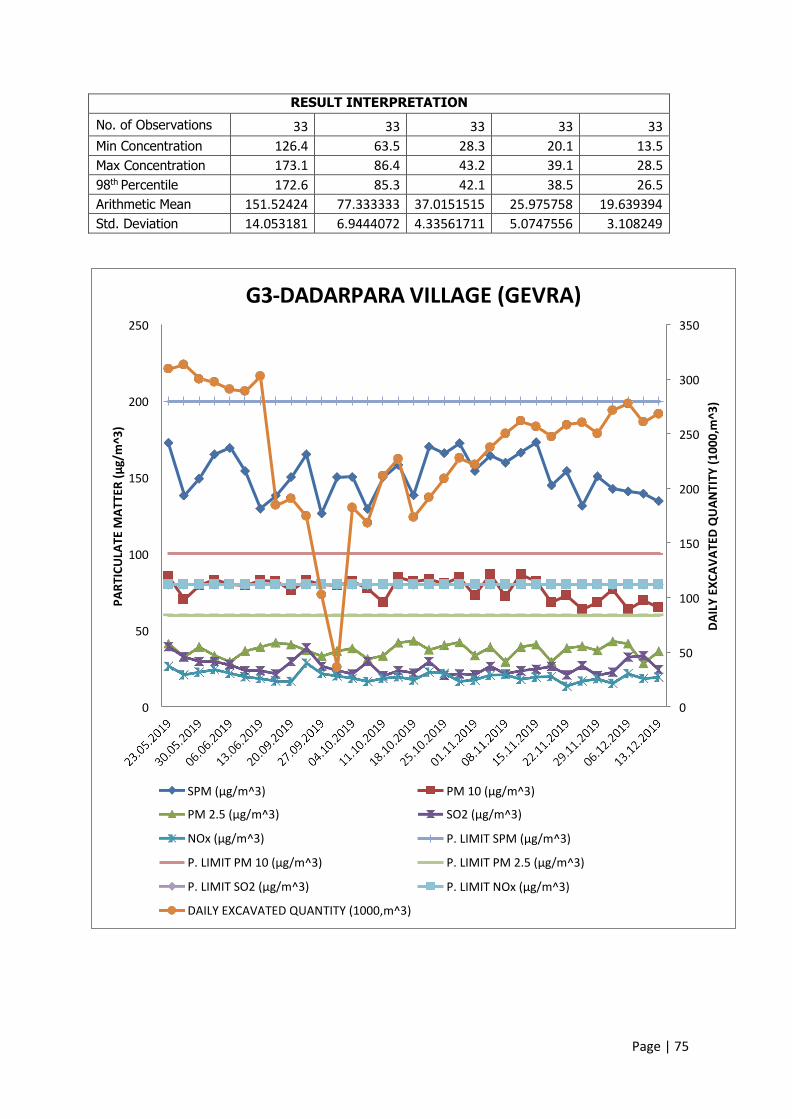
Page | 75
RESULT INTERPRETATION
No. of Observations 33 33 33 33 33
Min Concentration 126.4 63.5 28.3 20.1 13.5
Max Concentration 173.1 86.4 43.2 39.1 28.5
98th Percentile 172.6 85.3 42.1 38.5 26.5
Arithmetic Mean 151.52424 77.333333 37.0151515 25.975758 19.639394
Std. Deviation 14.053181 6.9444072 4.33561711 5.0747556 3.108249
G3-DADARPARA VILLAGE (GEVRA) 250 350
300
200
250
150 200
150 100
100
50
50
0 0
“PM μg/ ^
PM . μg/ ^
NO μg/ ^
P. LIMIT PM μg/ ^
P. LIMIT “O μg/ ^
DAILY EXCAVATED QUANTITY (1000,m^3)
PM μg/ ^
“O μg/ ^
P. LIMIT “PM μg/ ^
P. LIMIT PM . μg/ ^
P. LIMIT NO μg/ ^
PART
ICUL
ATE
MAT
TER
μg/m
^3
DA
ILY
EX
CA
VA
TE
D Q
UA
NT
ITY
(1
00
0,m
^3
)

Page | 76
Name of Location
(G4)
G4-PURENA VILLAGE (GEVRA)
Sr. No.
Date of
Sampling
SPM
PM10
PM2.5
SO2
NOx
DAILY
EXCAVATED
QUANTITY
Unit µg/m3 µg/m3
µg/m3 µg/m3
µg/m3 (1000,m3)
GSR 826 (E) - 100 60 80 80 -
1. 23.05.2019 171.3 70.3 28.3 20.9 12.6 309.532
2. 27.05.2019 154.6 62.4 20.1 19.8 13.5 313.343
3. 30.05.2019 160.7 80.3 31.2 23.5 14.2 300.351
4. 03.06.2019 165.3 76.1 29.6 27.4 12.5 297.555
5. 06.06.2019 131.2 66.4 30.5 14.5 10.5 290.996
6. 10.06.2019 138.4 69.4 28.3 18.6 9.5 289.174
7. 13.06.2019 143.2 70.9 32.4 19.5 13.5 302.805
8. 16.09.2019 139.4 72.4 27.6 23.4 14.6 184.727
9. 20.09.2019 132.4 61.3 18.2 21.5 18.4 190.965
10. 23.09.2019 144.2 74.5 31.6 27.1 17.9 174.602
11. 27.09.2019 156.8 69.4 29.4 18.6 13.2 102.881
12. 30.09.2019 168.3 76.1 33.4 13.2 18.4 36.06
13. 04.10.2019 146.3 72.4 28.6 19.5 12.6 182.362
14. 07.10.2019 138.4 71.6 23.4 23.6 12.6 168.348
15. 11.10.2019 157.9 72.9 31.8 25.4 14.3 211.578
16. 14.10.2019 165.3 80.3 35.9 26.5 13.2 227.176
17. 18.10.2019 132.4 65.4 19.4 20.1 15.4 173.604
18. 21.10.2019 126.4 70.2 20.8 19.3 11.8 191.668
19. 25.10.2019 130.2 61.3 19.7 30.2 22.6 209.099
20. 28.10.2019 145.9 85.1 41.8 28.4 21.5 227.858
21. 01.11.2019 130.4 84.2 39.2 21.5 18.6 221.696
22. 04.11.2019 126.4 79.3 36.8 27.4 13.5 237.558
23. 08.11.2019 168.9 70.3 38.1 21.6 21.4 250.175
24. 11.11.2019 151.2 66.4 29.4 25.1 17.6 261.782
25. 15.11.2019 176.3 73.2 47.1 23.5 18.4 256.71
26. 18.11.2019 170.2 81.2 31.2 20.1 14.2 247.385
27. 22.11.2019 139.2 62.8 28.2 29.4 19.3 258.212
28. 25.11.2019 164.2 74.3 35.4 24.5 14.5 260.522
29. 29.11.2019 158.2 87.6 30.4 22.9 19.3 250.252
30. 02.12.2019 150.2 74 36.4 20.8 16.5 271.477
31. 06.12.2019 146.3 76.9 32.3 20.5 16.2 277.632
32. 09.12.2019 131.2 63.8 26.4 23.7 15.4 260.945
33. 13.12.2019 144.8 74.5 30.2 22.8 17.8 268.351
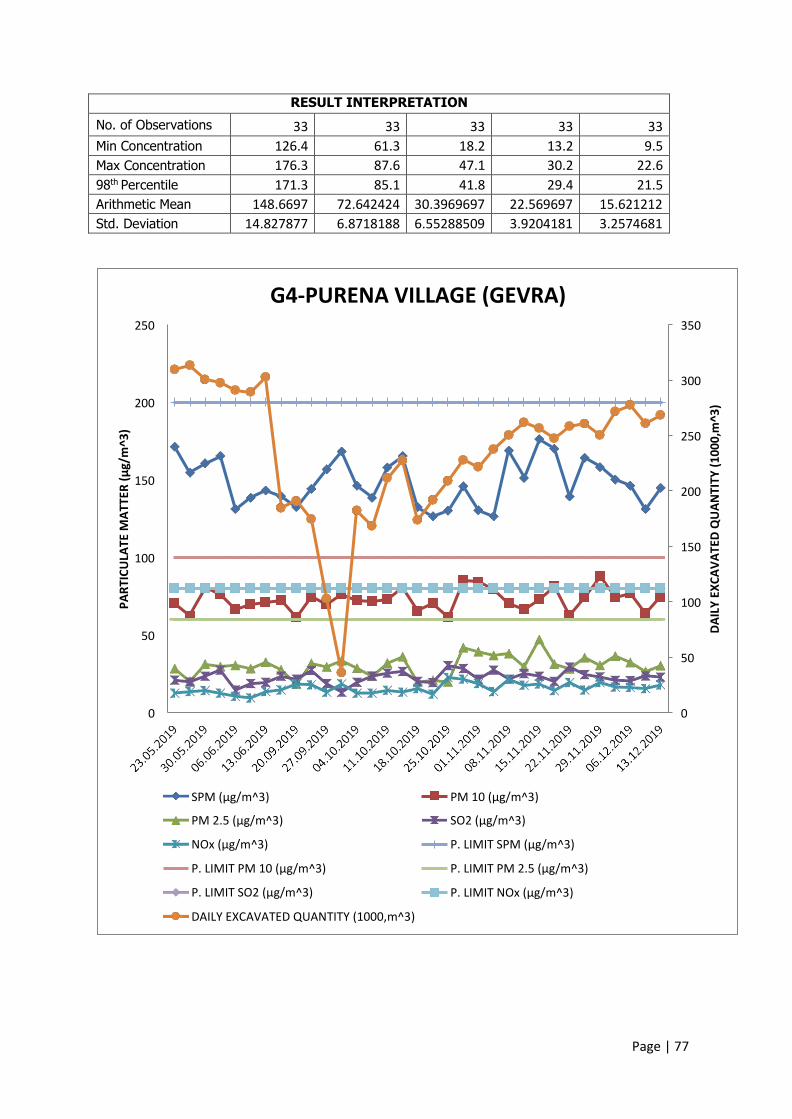
Page | 77
RESULT INTERPRETATION
No. of Observations 33 33 33 33 33
Min Concentration 126.4 61.3 18.2 13.2 9.5
Max Concentration 176.3 87.6 47.1 30.2 22.6
98th Percentile 171.3 85.1 41.8 29.4 21.5
Arithmetic Mean 148.6697 72.642424 30.3969697 22.569697 15.621212
Std. Deviation 14.827877 6.8718188 6.55288509 3.9204181 3.2574681
G4-PURENA VILLAGE (GEVRA) 250 350
300
200
250
150 200
150 100
100
50
50
0 0
“PM μg/ ^
PM . μg/ ^
NO μg/ ^
P. LIMIT PM μg/ ^
P. LIMIT “O μg/ ^
DAILY EXCAVATED QUANTITY (1000,m^3)
PM μg/ ^
“O μg/ ^
P. LIMIT “PM μg/ ^
P. LIMIT PM . μg/ ^
P. LIMIT NO μg/ ^
PART
ICUL
ATE
MAT
TER
μg/m
^3
DA
ILY
EX
CA
VA
TE
D Q
UA
NT
ITY
(1
00
0,m
^3
)
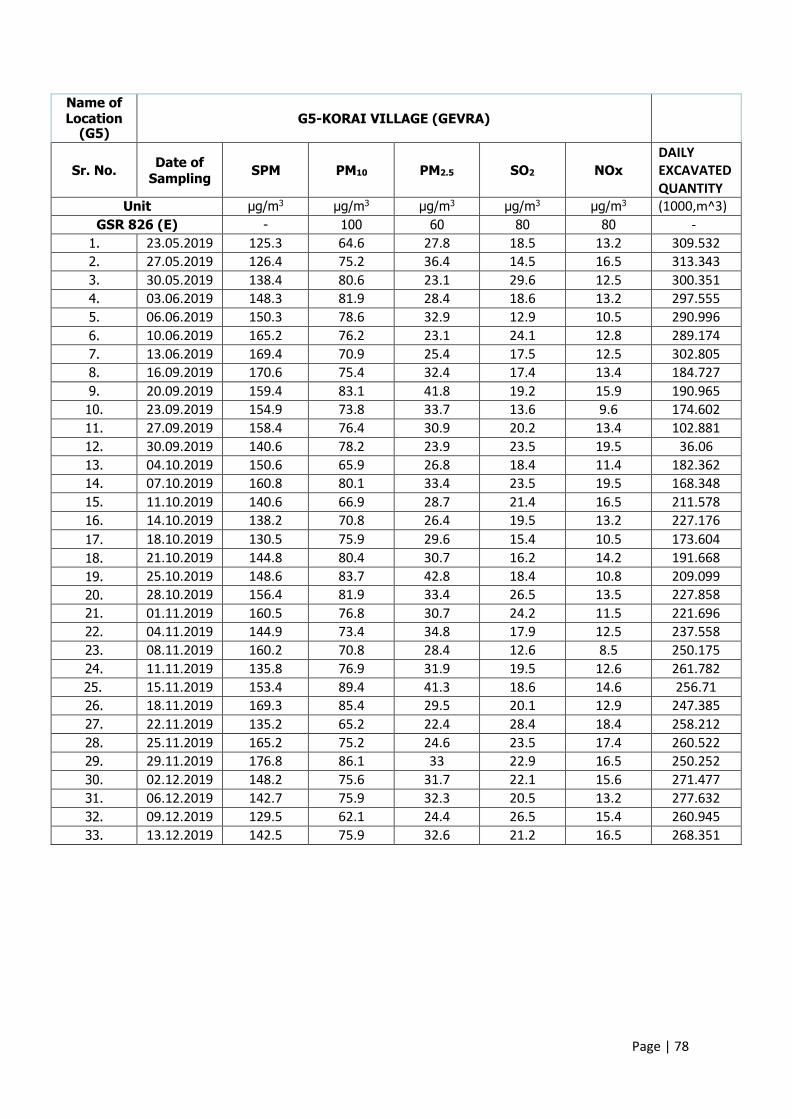
Page | 78
Name of Location
(G5)
G5-KORAI VILLAGE (GEVRA)
Sr. No.
Date of
Sampling
SPM
PM10
PM2.5
SO2
NOx
DAILY
EXCAVATED
QUANTITY
Unit µg/m3 µg/m3
µg/m3 µg/m3
µg/m3 (1000,m^3)
GSR 826 (E) - 100 60 80 80 -
1. 23.05.2019 125.3 64.6 27.8 18.5 13.2 309.532
2. 27.05.2019 126.4 75.2 36.4 14.5 16.5 313.343
3. 30.05.2019 138.4 80.6 23.1 29.6 12.5 300.351
4. 03.06.2019 148.3 81.9 28.4 18.6 13.2 297.555
5. 06.06.2019 150.3 78.6 32.9 12.9 10.5 290.996
6. 10.06.2019 165.2 76.2 23.1 24.1 12.8 289.174
7. 13.06.2019 169.4 70.9 25.4 17.5 12.5 302.805
8. 16.09.2019 170.6 75.4 32.4 17.4 13.4 184.727
9. 20.09.2019 159.4 83.1 41.8 19.2 15.9 190.965
10. 23.09.2019 154.9 73.8 33.7 13.6 9.6 174.602
11. 27.09.2019 158.4 76.4 30.9 20.2 13.4 102.881
12. 30.09.2019 140.6 78.2 23.9 23.5 19.5 36.06
13. 04.10.2019 150.6 65.9 26.8 18.4 11.4 182.362
14. 07.10.2019 160.8 80.1 33.4 23.5 19.5 168.348
15. 11.10.2019 140.6 66.9 28.7 21.4 16.5 211.578
16. 14.10.2019 138.2 70.8 26.4 19.5 13.2 227.176
17. 18.10.2019 130.5 75.9 29.6 15.4 10.5 173.604
18. 21.10.2019 144.8 80.4 30.7 16.2 14.2 191.668
19. 25.10.2019 148.6 83.7 42.8 18.4 10.8 209.099
20. 28.10.2019 156.4 81.9 33.4 26.5 13.5 227.858
21. 01.11.2019 160.5 76.8 30.7 24.2 11.5 221.696
22. 04.11.2019 144.9 73.4 34.8 17.9 12.5 237.558
23. 08.11.2019 160.2 70.8 28.4 12.6 8.5 250.175
24. 11.11.2019 135.8 76.9 31.9 19.5 12.6 261.782
25. 15.11.2019 153.4 89.4 41.3 18.6 14.6 256.71
26. 18.11.2019 169.3 85.4 29.5 20.1 12.9 247.385
27. 22.11.2019 135.2 65.2 22.4 28.4 18.4 258.212
28. 25.11.2019 165.2 75.2 24.6 23.5 17.4 260.522
29. 29.11.2019 176.8 86.1 33 22.9 16.5 250.252
30. 02.12.2019 148.2 75.6 31.7 22.1 15.6 271.477
31. 06.12.2019 142.7 75.9 32.3 20.5 13.2 277.632
32. 09.12.2019 129.5 62.1 24.4 26.5 15.4 260.945
33. 13.12.2019 142.5 75.9 32.6 21.2 16.5 268.351
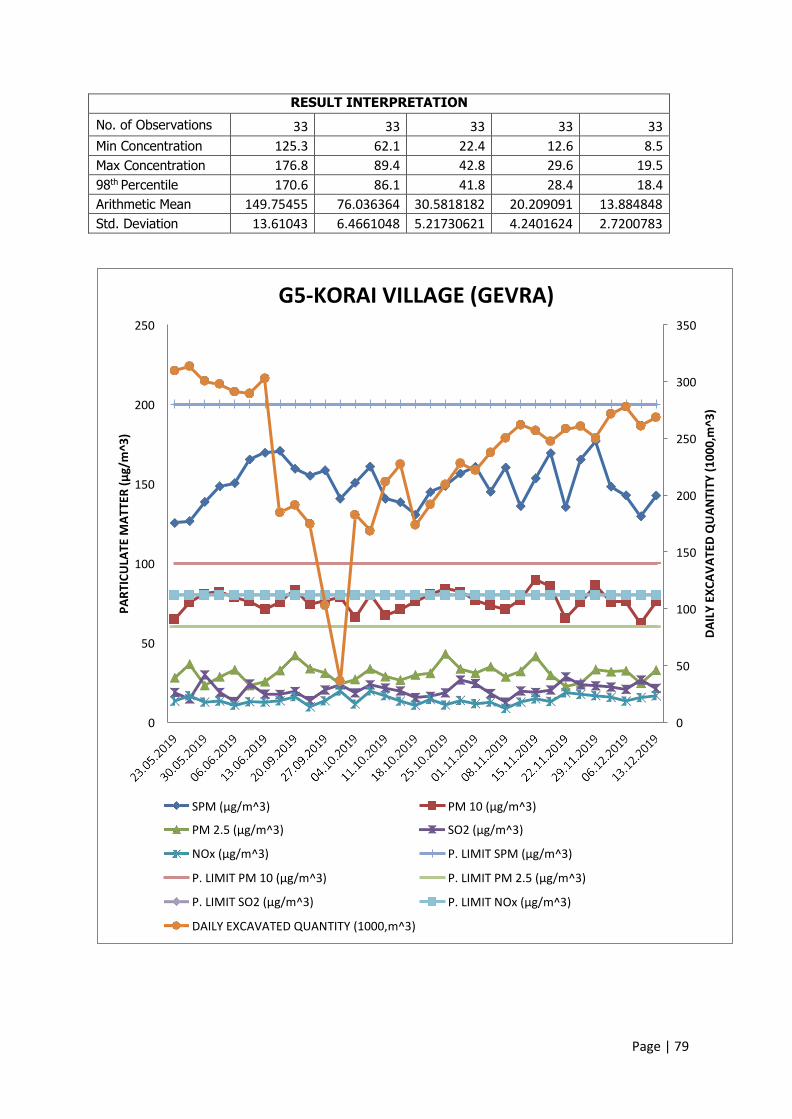
Page | 79
RESULT INTERPRETATION
No. of Observations 33 33 33 33 33
Min Concentration 125.3 62.1 22.4 12.6 8.5
Max Concentration 176.8 89.4 42.8 29.6 19.5
98th Percentile 170.6 86.1 41.8 28.4 18.4
Arithmetic Mean 149.75455 76.036364 30.5818182 20.209091 13.884848
Std. Deviation 13.61043 6.4661048 5.21730621 4.2401624 2.7200783
G5-KORAI VILLAGE (GEVRA) 250 350
300
200
250
150 200
150 100
100
50
50
0 0
“PM μg/ ^
PM . μg/ ^
NO μg/ ^
P. LIMIT PM μg/ ^
P. LIMIT “O μg/ ^
DAILY EXCAVATED QUANTITY (1000,m^3)
PM μg/ ^
“O μg/ ^
P. LIMIT “PM μg/ ^
P. LIMIT PM . μg/ ^
P. LIMIT NO μg/ ^
PART
ICUL
ATE
MAT
TER
μg/m
^3
DA
ILY
EX
CA
VA
TE
D Q
UA
NT
ITY
(1
00
0,m
^3
)
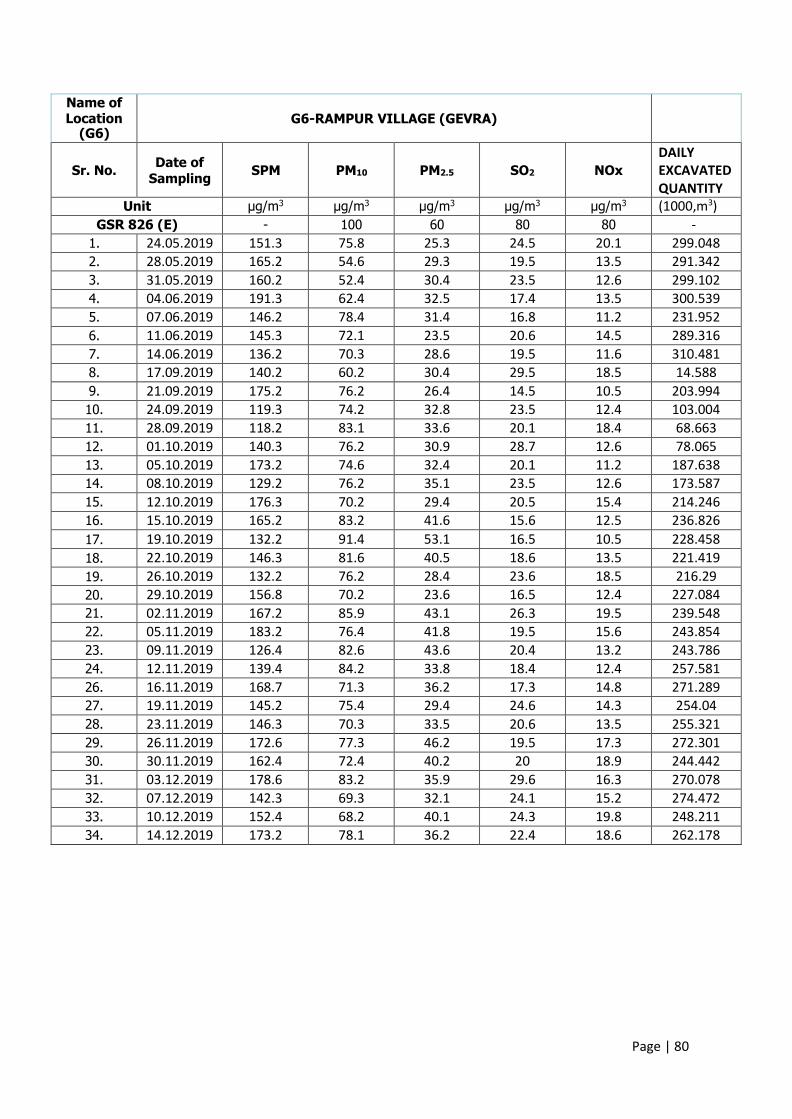
Page | 80
Name of Location
(G6)
G6-RAMPUR VILLAGE (GEVRA)
Sr. No.
Date of
Sampling
SPM
PM10
PM2.5
SO2
NOx
DAILY
EXCAVATED
QUANTITY
Unit µg/m3 µg/m3
µg/m3 µg/m3
µg/m3 (1000,m3)
GSR 826 (E) - 100 60 80 80 -
1. 24.05.2019 151.3 75.8 25.3 24.5 20.1 299.048
2. 28.05.2019 165.2 54.6 29.3 19.5 13.5 291.342
3. 31.05.2019 160.2 52.4 30.4 23.5 12.6 299.102
4. 04.06.2019 191.3 62.4 32.5 17.4 13.5 300.539
5. 07.06.2019 146.2 78.4 31.4 16.8 11.2 231.952
6. 11.06.2019 145.3 72.1 23.5 20.6 14.5 289.316
7. 14.06.2019 136.2 70.3 28.6 19.5 11.6 310.481
8. 17.09.2019 140.2 60.2 30.4 29.5 18.5 14.588
9. 21.09.2019 175.2 76.2 26.4 14.5 10.5 203.994
10. 24.09.2019 119.3 74.2 32.8 23.5 12.4 103.004
11. 28.09.2019 118.2 83.1 33.6 20.1 18.4 68.663
12. 01.10.2019 140.3 76.2 30.9 28.7 12.6 78.065
13. 05.10.2019 173.2 74.6 32.4 20.1 11.2 187.638
14. 08.10.2019 129.2 76.2 35.1 23.5 12.6 173.587
15. 12.10.2019 176.3 70.2 29.4 20.5 15.4 214.246
16. 15.10.2019 165.2 83.2 41.6 15.6 12.5 236.826
17. 19.10.2019 132.2 91.4 53.1 16.5 10.5 228.458
18. 22.10.2019 146.3 81.6 40.5 18.6 13.5 221.419
19. 26.10.2019 132.2 76.2 28.4 23.6 18.5 216.29
20. 29.10.2019 156.8 70.2 23.6 16.5 12.4 227.084
21. 02.11.2019 167.2 85.9 43.1 26.3 19.5 239.548
22. 05.11.2019 183.2 76.4 41.8 19.5 15.6 243.854
23. 09.11.2019 126.4 82.6 43.6 20.4 13.2 243.786
24. 12.11.2019 139.4 84.2 33.8 18.4 12.4 257.581
26. 16.11.2019 168.7 71.3 36.2 17.3 14.8 271.289
27. 19.11.2019 145.2 75.4 29.4 24.6 14.3 254.04
28. 23.11.2019 146.3 70.3 33.5 20.6 13.5 255.321
29. 26.11.2019 172.6 77.3 46.2 19.5 17.3 272.301
30. 30.11.2019 162.4 72.4 40.2 20 18.9 244.442
31. 03.12.2019 178.6 83.2 35.9 29.6 16.3 270.078
32. 07.12.2019 142.3 69.3 32.1 24.1 15.2 274.472
33. 10.12.2019 152.4 68.2 40.1 24.3 19.8 248.211
34. 14.12.2019 173.2 78.1 36.2 22.4 18.6 262.178
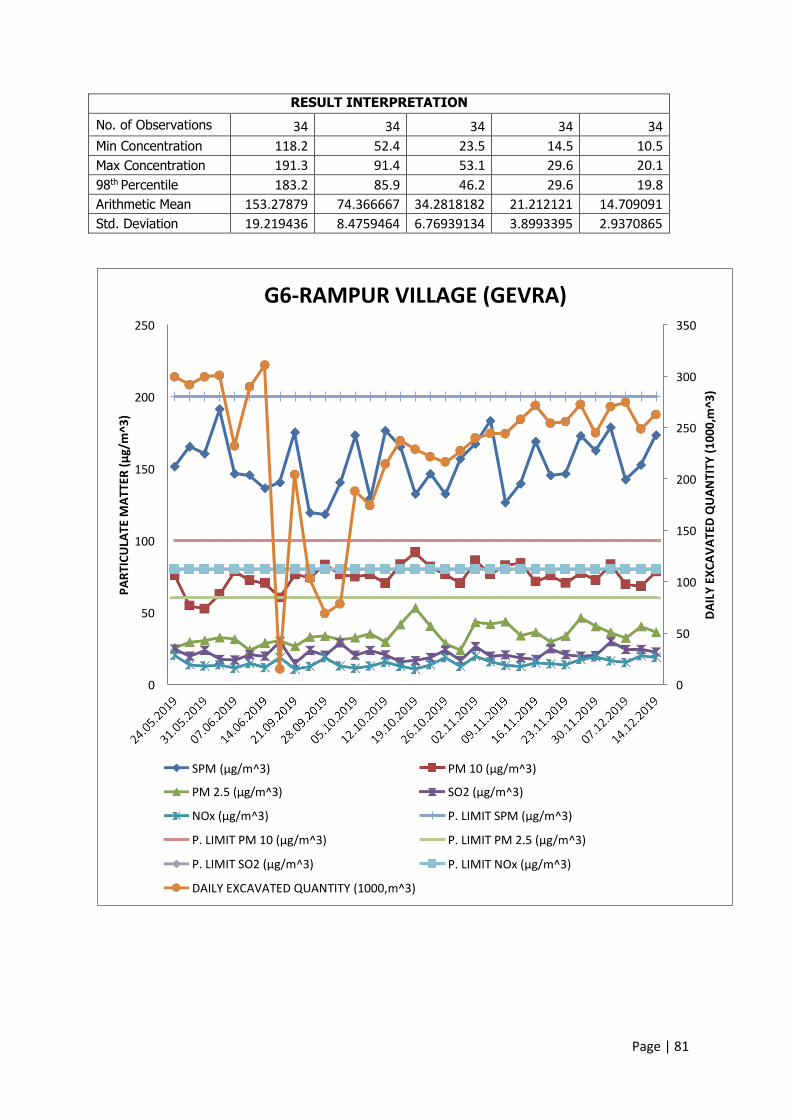
Page | 81
RESULT INTERPRETATION
No. of Observations 34 34 34 34 34
Min Concentration 118.2 52.4 23.5 14.5 10.5
Max Concentration 191.3 91.4 53.1 29.6 20.1
98th Percentile 183.2 85.9 46.2 29.6 19.8
Arithmetic Mean 153.27879 74.366667 34.2818182 21.212121 14.709091
Std. Deviation 19.219436 8.4759464 6.76939134 3.8993395 2.9370865
G6-RAMPUR VILLAGE (GEVRA) 250 350
300
200
250
150 200
100 150
100
50
50
0 0
SPM μg/ ^
PM 2.5 μg/ ^
NOx μg/ ^
P. LIMIT PM μg/ ^
P. LIMIT “O μg/ ^
DAILY EXCAVATED QUANTITY (1000,m^3)
PM μg/ ^
“O μg/ ^
P. LIMIT “PM μg/ ^
P. LIMIT PM . μg/ ^
P. LIMIT NO μg/ ^
PART
ICUL
ATE
MAT
TER
μg/m
^3
DA
ILY
EX
CA
VA
TE
D Q
UA
NT
ITY
(1
00
0,m
^3
)

Page | 82
Name of Location (GD-7)
GD7-CHHINDPUR VILLAGE (GEVRA)
Sr. No.
Date of
Sampling
SPM
PM10
PM2.5
SO2
NOx
DAILY
EXCAVATED
QUANTITY
Unit µg/m3 µg/m3
µg/m3 µg/m3
µg/m3 (1000,m^3)
GSR 826 (E) - 100 60 80 80 -
1. 23.05.2019 157.3 82.6 43.5 23.4 15.4 309.532
2. 27.05.2019 172.3 80.3 39.2 25.1 18.4 313.343
3. 30.05.2019 165.2 73.2 32.5 19.3 19.8 300.351
4. 03.06.2019 183.4 65.1 29.4 21.6 21.4 297.555
5. 06.06.2019 175.2 70.6 23.6 22.4 18.2 290.996
6. 10.06.2019 187.3 83 31.8 26.8 14.6 289.174
7. 13.06.2019 184.3 81.9 42.6 23.7 20.7 302.805
8. 16.09.2019 142.3 70.3 30.8 22.4 22.5 184.727
9. 20.09.2019 150.2 82.4 32.8 29.4 19.7 190.965
10. 23.09.2019 157.9 78.2 27.9 19.5 16.7 174.602
11. 27.09.2019 170.3 72.6 26.1 17.3 14.8 102.881
12. 30.09.2019 149.3 83.2 22.5 32.4 23.4 36.06
13. 04.10.2019 142.3 72.4 29.4 28.1 22.8 182.362
14. 07.10.2019 175.6 81.5 24.6 31.4 26.4 168.348
15. 11.10.2019 165.3 79.2 24 19.6 17.3 211.578
16. 14.10.2019 183.2 82.4 31.6 22.4 21.5 227.176
17. 18.10.2019 140.2 73 23.4 24.1 15.2 173.604
18. 21.10.2019 150.8 70.2 28.6 23.8 21.8 191.668
19. 25.10.2019 183.4 80.9 39.4 20.1 16.4 209.099
20. 28.10.2019 166.9 82.4 36.8 29.4 18.3 227.858
21 01.11.2019 176.3 71.3 33.4 24.6 21.6 221.696
22. 04.11.2019 160.2 69.8 27.6 27.1 16.8 237.558
23. 08.11.2019 168.2 80.4 33.9 25.3 14.3 250.175
24. 11.11.2019 129.5 71.6 34.1 26.1 19.4 261.782
25. 15.11.2019 167.3 78.2 41.8 22.6 18.2 256.71
26. 18.11.2019 169.3 85.4 29.5 20.1 20.5 247.385
27. 22.11.2019 138.6 65.2 22.4 28.4 18.4 258.212
28. 25.11.2019 165.2 75.2 24.6 23.5 17.4 260.522
29. 29.11.2019 179.4 82.4 33 20.3 21.5 250.252
30. 02.12.2019 148.2 75.6 31.7 22.1 15.6 271.477
31. 06.12.2019 142.3 75.9 32.3 19.8 18.2 277.632
32. 09.12.2019 138.6 64.3 24.4 26.5 19.8 260.945
33. 13.12.2019 139.5 74.2 34.6 21.2 16.5 268.351
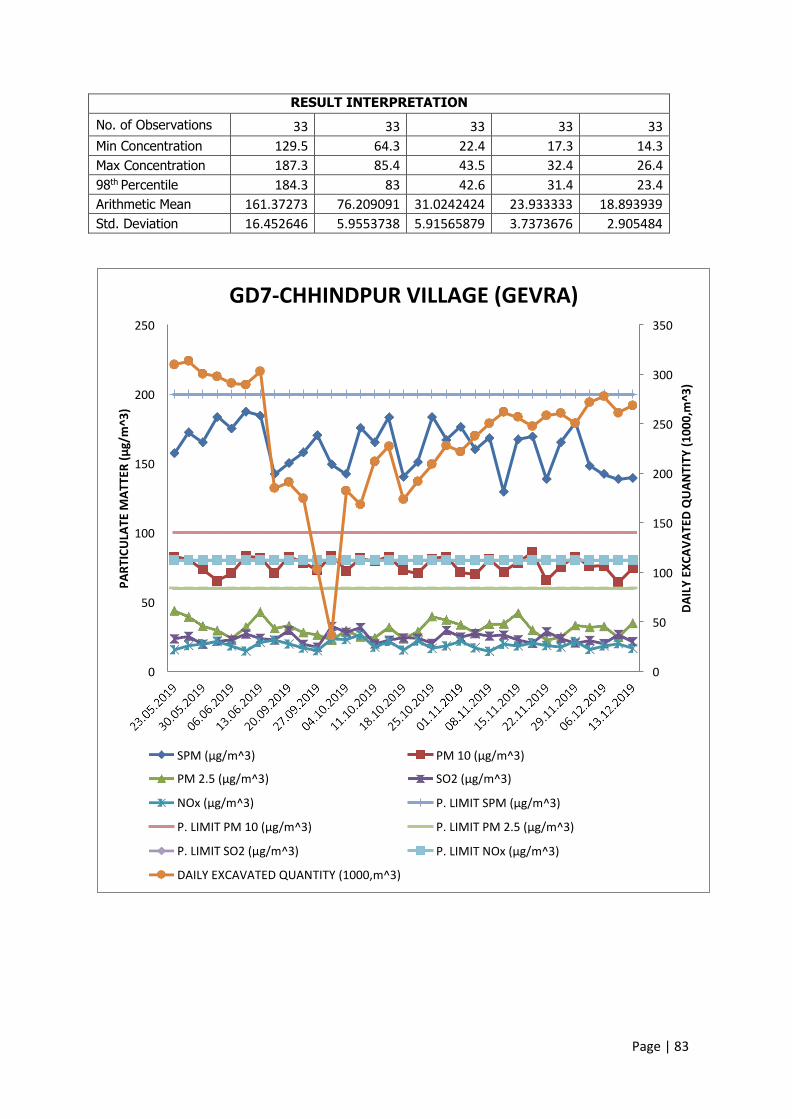
Page | 83
RESULT INTERPRETATION
No. of Observations 33 33 33 33 33
Min Concentration 129.5 64.3 22.4 17.3 14.3
Max Concentration 187.3 85.4 43.5 32.4 26.4
98th Percentile 184.3 83 42.6 31.4 23.4
Arithmetic Mean 161.37273 76.209091 31.0242424 23.933333 18.893939
Std. Deviation 16.452646 5.9553738 5.91565879 3.7373676 2.905484
GD7-CHHINDPUR VILLAGE (GEVRA) 250 350
300
200
250
150 200
100 150
100
50
50
0 0
“PM μg/ ^
PM . μg/ ^
NO μg/ ^
P. LIMIT PM μg/ ^
P. LIMIT “O μg/ ^
DAILY EXCAVATED QUANTITY (1000,m^3)
PM μg/ ^
“O μg/ ^
P. LIMIT “PM μg/ ^
P. LIMIT PM . μg/ ^
P. LIMIT NO μg/ ^
PART
ICUL
ATE
MAT
TER
μg/m
^3
DA
ILY
EX
CA
VA
TE
D Q
UA
NT
ITY
(1
00
0,m
^3
)

Page | 84
Name of Location
(G8)
G8-BIRDA VILLAGE (GEVRA)
Sr. No.
Date of
Sampling
SPM
PM10
PM2.5
SO2
NOx
DAILY
EXCAVATED
QUANTITY
Unit µg/m3 µg/m3
µg/m3 µg/m3
µg/m3 (1000,m^3)
GSR 826 (E) - 100 60 80 80 -
1. 24.05.2019 140.2 76.1 36.4 16.5 14.9 299.048
2. 28.05.2019 131.6 65.2 28.2 17.5 13.6 291.342
3. 31.05.2019 159.3 84.3 41.8 13.5 10.5 299.102
4. 04.06.2019 145.2 72.3 32.4 16.5 12.5 300.539
5. 07.06.2019 159.8 71.7 22.3 17.4 11.9 231.952
6. 11.06.2019 150.1 82.6 44.9 13.5 10.8 289.316
7. 14.06.2019 123.4 75.3 33.1 12.9 8.5 310.481
8. 17.09.2019 146.8 65.9 28.4 18.2 13.6 14.588
9. 21.09.2019 157.3 61.3 21.8 20.4 12.5 203.994
10. 24.09.2019 123.5 72.4 33.4 16.5 14.9 103.004
11. 28.09.2019 132.4 76.9 27.3 20.6 13.5 68.663
12. 01.10.2019 148.3 78.2 23.4 19.5 10.6 78.065
13. 05.10.2019 166.7 80.3 33.8 20 9.5 187.638
14. 08.10.2019 140.2 78.4 22.4 29.6 8.5 173.587
15. 12.10.2019 137.3 66.3 25.6 32.5 7.9 214.246
16. 15.10.2019 145.3 71.2 31.8 30 10.6 236.826
17. 19.10.2019 151.8 63.4 23.7 26.5 15.4 228.458
18. 22.10.2019 167.2 81.2 32.9 18.5 13.5 221.419
19. 26.10.2019 152.3 83.7 31.7 16.4 12.6 216.29
20. 29.10.2019 153.4 85.9 22.6 13.2 10.5 227.084
21. 02.11.2019 140.3 78.5 39.8 18.4 9.8 239.548
22. 05.11.2019 154.3 83.4 41.6 12.5 14.5 243.854
23. 09.11.2019 151.8 74.3 37.8 10.9 11.9 243.786
24. 12.11.2019 165.3 71.5 22.1 17.3 14.5 257.581
26. 16.11.2019 167.9 75.2 37.9 18.6 19.1 271.289
27. 19.11.2019 138.4 68.4 30.4 19.2 18.7 254.04
28. 23.11.2019 157.3 69.6 28.9 17.8 18.2 255.321
29. 26.11.2019 148.1 84.6 22.7 20.1 21.9 272.301
30. 30.11.2019 132.4 79.1 29.1 23.7 16.4 244.442
31. 03.12.2019 163.2 72.9 32.5 22.8 15.8 270.078
32. 07.12.2019 176.2 86.4 29.4 24.6 16.4 274.472
33. 10.12.2019 160.4 72.5 30.8 20.4 18.3 248.211
34. 14.12.2019 172.3 81.3 35.4 23.9 13.7 262.178
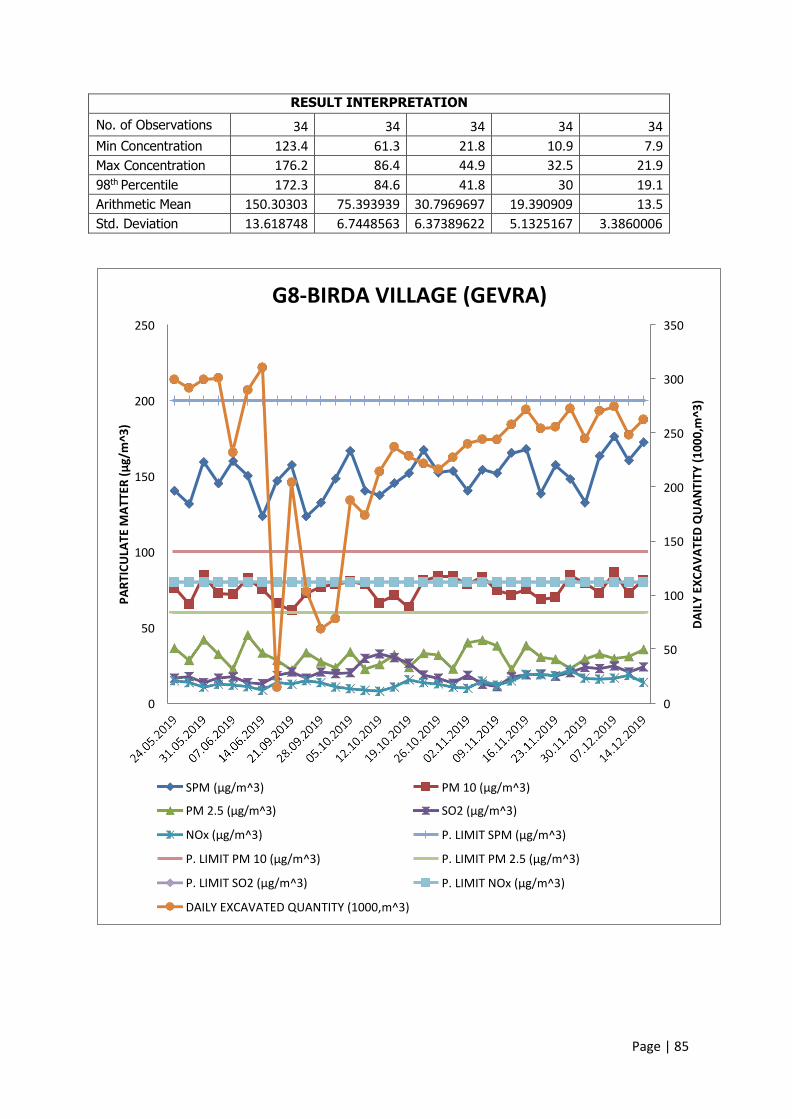
Page | 85
RESULT INTERPRETATION
No. of Observations 34 34 34 34 34
Min Concentration 123.4 61.3 21.8 10.9 7.9
Max Concentration 176.2 86.4 44.9 32.5 21.9
98th Percentile 172.3 84.6 41.8 30 19.1
Arithmetic Mean 150.30303 75.393939 30.7969697 19.390909 13.5
Std. Deviation 13.618748 6.7448563 6.37389622 5.1325167 3.3860006
G8-BIRDA VILLAGE (GEVRA) 250 350
300
200
250
150 200
150 100
100
50
50
0 0
SPM μg/ ^
PM 2.5 μg/ ^
NOx μg/ ^
P. LIMIT PM μg/ ^
P. LIMIT “O μg/ ^
DAILY EXCAVATED QUANTITY (1000,m^3)
PM μg/ ^
“O μg/ ^
P. LIMIT “PM μg/ ^
P. LIMIT PM . μg/ ^
P. LIMIT NOx μg/ ^
PART
ICUL
ATE
MAT
TER
μg/m
^3
DA
ILY
EX
CA
VA
TE
D Q
UA
NT
ITY
(1
00
0,m
^3
)
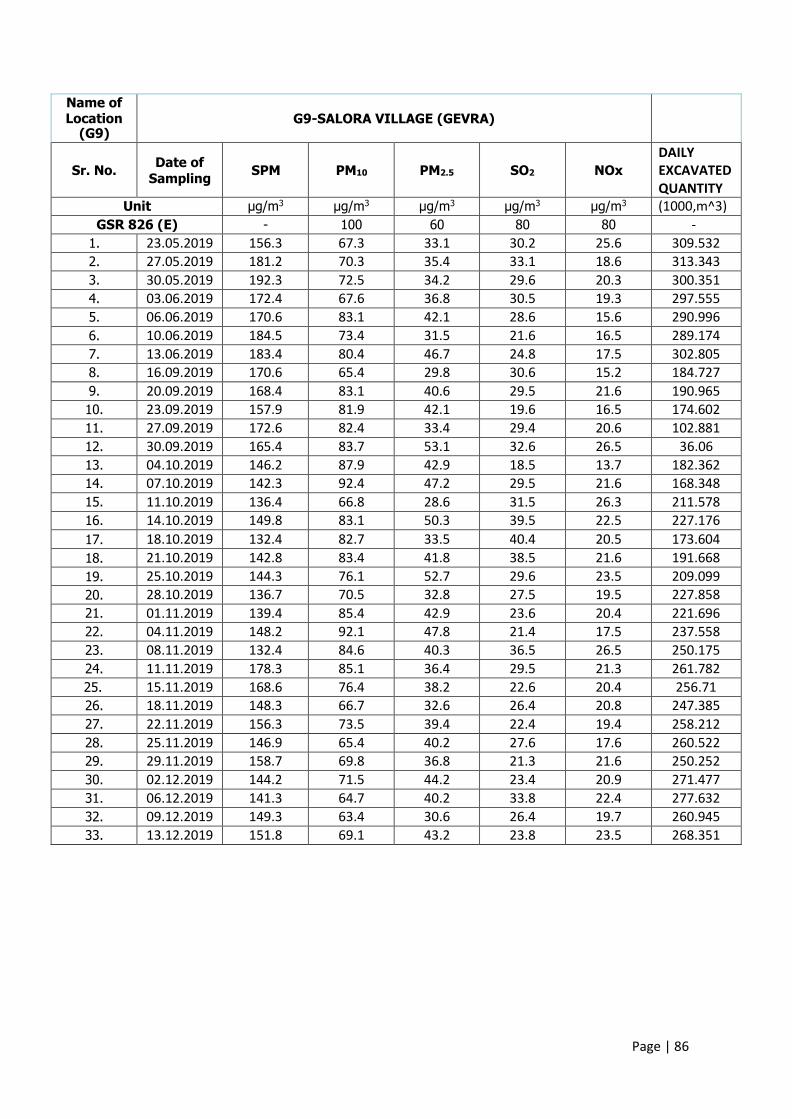
Page | 86
Name of Location
(G9)
G9-SALORA VILLAGE (GEVRA)
Sr. No.
Date of
Sampling
SPM
PM10
PM2.5
SO2
NOx
DAILY
EXCAVATED
QUANTITY
Unit µg/m3 µg/m3
µg/m3 µg/m3
µg/m3 (1000,m^3)
GSR 826 (E) - 100 60 80 80 -
1. 23.05.2019 156.3 67.3 33.1 30.2 25.6 309.532
2. 27.05.2019 181.2 70.3 35.4 33.1 18.6 313.343
3. 30.05.2019 192.3 72.5 34.2 29.6 20.3 300.351
4. 03.06.2019 172.4 67.6 36.8 30.5 19.3 297.555
5. 06.06.2019 170.6 83.1 42.1 28.6 15.6 290.996
6. 10.06.2019 184.5 73.4 31.5 21.6 16.5 289.174
7. 13.06.2019 183.4 80.4 46.7 24.8 17.5 302.805
8. 16.09.2019 170.6 65.4 29.8 30.6 15.2 184.727
9. 20.09.2019 168.4 83.1 40.6 29.5 21.6 190.965
10. 23.09.2019 157.9 81.9 42.1 19.6 16.5 174.602
11. 27.09.2019 172.6 82.4 33.4 29.4 20.6 102.881
12. 30.09.2019 165.4 83.7 53.1 32.6 26.5 36.06
13. 04.10.2019 146.2 87.9 42.9 18.5 13.7 182.362
14. 07.10.2019 142.3 92.4 47.2 29.5 21.6 168.348
15. 11.10.2019 136.4 66.8 28.6 31.5 26.3 211.578
16. 14.10.2019 149.8 83.1 50.3 39.5 22.5 227.176
17. 18.10.2019 132.4 82.7 33.5 40.4 20.5 173.604
18. 21.10.2019 142.8 83.4 41.8 38.5 21.6 191.668
19. 25.10.2019 144.3 76.1 52.7 29.6 23.5 209.099
20. 28.10.2019 136.7 70.5 32.8 27.5 19.5 227.858
21. 01.11.2019 139.4 85.4 42.9 23.6 20.4 221.696
22. 04.11.2019 148.2 92.1 47.8 21.4 17.5 237.558
23. 08.11.2019 132.4 84.6 40.3 36.5 26.5 250.175
24. 11.11.2019 178.3 85.1 36.4 29.5 21.3 261.782
25. 15.11.2019 168.6 76.4 38.2 22.6 20.4 256.71
26. 18.11.2019 148.3 66.7 32.6 26.4 20.8 247.385
27. 22.11.2019 156.3 73.5 39.4 22.4 19.4 258.212
28. 25.11.2019 146.9 65.4 40.2 27.6 17.6 260.522
29. 29.11.2019 158.7 69.8 36.8 21.3 21.6 250.252
30. 02.12.2019 144.2 71.5 44.2 23.4 20.9 271.477
31. 06.12.2019 141.3 64.7 40.2 33.8 22.4 277.632
32. 09.12.2019 149.3 63.4 30.6 26.4 19.7 260.945
33. 13.12.2019 151.8 69.1 43.2 23.8 23.5 268.351
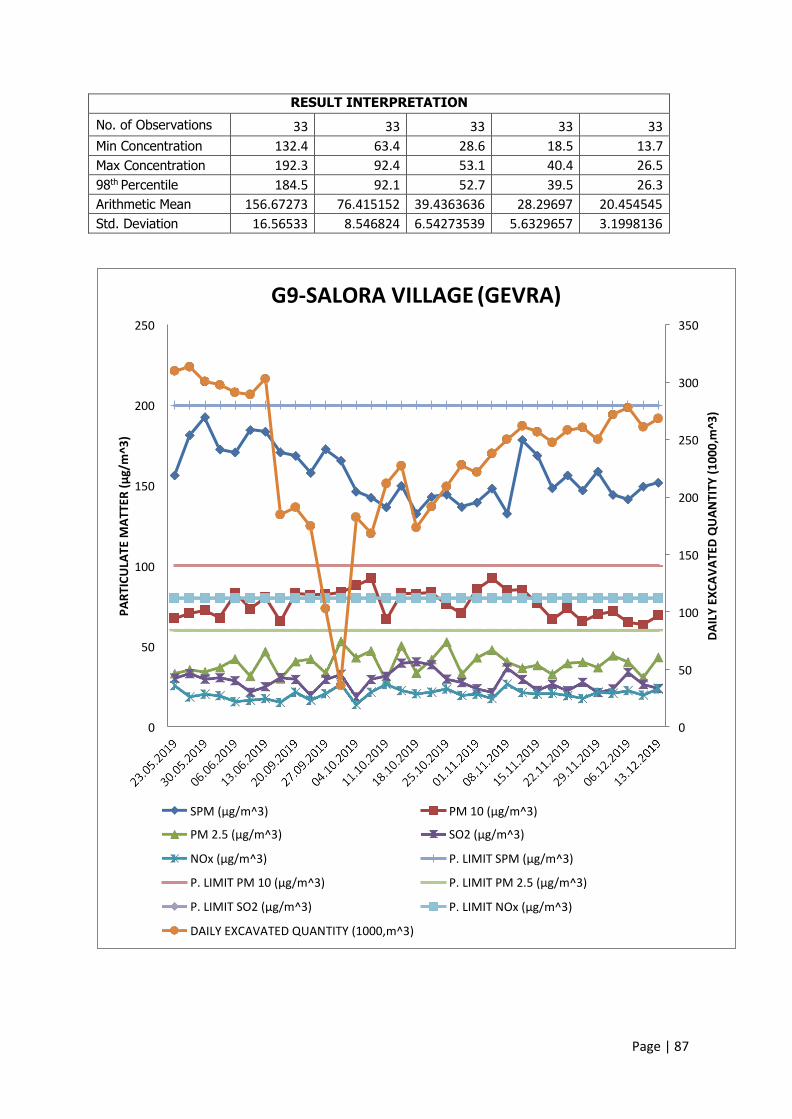
Page | 87
RESULT INTERPRETATION
No. of Observations 33 33 33 33 33
Min Concentration 132.4 63.4 28.6 18.5 13.7
Max Concentration 192.3 92.4 53.1 40.4 26.5
98th Percentile 184.5 92.1 52.7 39.5 26.3
Arithmetic Mean 156.67273 76.415152 39.4363636 28.29697 20.454545
Std. Deviation 16.56533 8.546824 6.54273539 5.6329657 3.1998136
G9-SALORA VILLAGE (GEVRA) 250 350
300
200
250
150 200
150 100
100
50
50
0 0
“PM μg/ ^
PM . μg/ ^
NO μg/ ^
P. LIMIT PM μg/ ^
P. LIMIT “O μg/ ^
DAILY EXCAVATED QUANTITY (1000,m^3)
PM μg/ ^
“O μg/ ^
P. LIMIT “PM μg/ ^
P. LIMIT PM . μg/ ^
P. LIMIT NO μg/ ^
PART
ICUL
ATE
MAT
TER
μg/m
^3
DA
ILY
EX
CA
VA
TE
D Q
UA
NT
ITY
(1
00
0,m
^3
)

Page | 88
Name of Location (GD-10)
GD10-SARAISINGAR VILLAGE (GEVRA)
Sr. No.
Date of
Sampling
SPM
PM10
PM2.5
SO2
NOx
DAILY
EXCAVATED
QUANTITY
Unit µg/m3 µg/m3
µg/m3 µg/m3
µg/m3 (1000,m^3)
GSR 826 (E) - 100 60 80 80 -
1. 24.05.2019 182.3 78.3 40.3 19.8 13.6 299.048
2. 28.05.2019 192.4 82.6 41.9 29.1 15.3 291.342
3. 31.05.2019 151.3 84.3 43.7 25.9 18.4 299.102
4. 04.06.2019 156.2 86.4 44.2 30.1 12.5 300.539
5. 07.06.2019 196.4 80.9 39.2 29.7 22.4 231.952
6. 11.06.2019 176.3 87.3 41.7 18.1 13.8 289.316
7. 14.06.2019 182.9 76.3 36.8 30.1 22.6 310.481
8. 17.09.2019 139.4 80.7 35.9 21.8 16.9 14.588
9. 21.09.2019 168.2 79.1 37.2 26.9 23.5 203.994
10. 24.09.2019 168.3 78.4 34.9 22.5 27.8 103.004
11. 28.09.2019 137.2 73.2 38.4 28.1 22.6 68.663
12. 01.10.2019 170.9 80.9 41.3 22.8 20.4 78.065
13. 05.10.2019 163.4 79.4 33.9 24.3 19.8 187.638
14. 08.10.2019 184.3 78.6 38.7 25.9 21.6 173.587
15. 12.10.2019 158.2 72.5 36.7 26.8 14.9 214.246
16. 15.10.2019 184.9 74.6 36.4 28.7 22.8 236.826
17. 19.10.2019 166.8 76.2 38.2 29.4 19.8 228.458
18. 22.10.2019 198.1 83.4 41.9 26.8 24.3 221.419
19. 26.10.2019 176.9 86.1 41.1 25.1 21.6 216.29
20. 29.10.2019 146.2 80.8 42.7 29 22.8 227.084
21 02.11.2019 188.2 82.9 44.6 27.6 21.6 239.548
22. 05.11.2019 183.9 84.1 40.5 26.3 20.4 243.854
23. 09.11.2019 156.2 85.3 41.8 23.4 23.5 243.786
24. 12.11.2019 140.7 50.8 43.1 26.8 21.6 257.581
26. 16.11.2019 165.2 83.1 33.4 29.5 24.3 271.289
27. 19.11.2019 169.4 80.3 29.5 27.4 21.9 254.04
28. 23.11.2019 154.2 79.4 36.4 23.5 19.5 255.321
29. 26.11.2019 129.6 82.4 39.1 23.5 18.4 272.301
30. 30.11.2019 138.2 81.9 41.8 21.5 16.8 244.442
31. 03.12.2019 150.2 76.3 40.7 29.5 16.5 270.078
32. 07.12.2019 165.2 82.4 36.8 28.6 23.4 274.472
33. 10.12.2019 126.4 80.2 33.1 26.5 21.6 248.211
34. 14.12.2019 150.3 79.6 36.4 23.6 20.1 262.178
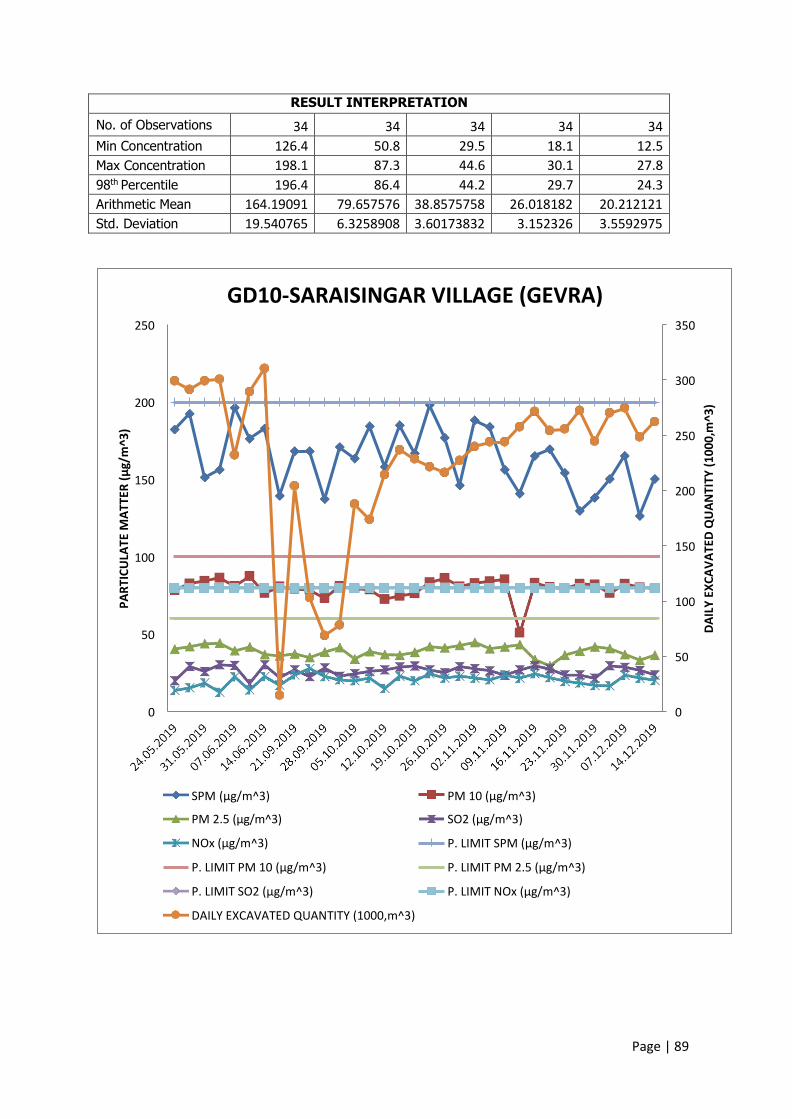
Page | 89
RESULT INTERPRETATION
No. of Observations 34 34 34 34 34
Min Concentration 126.4 50.8 29.5 18.1 12.5
Max Concentration 198.1 87.3 44.6 30.1 27.8
98th Percentile 196.4 86.4 44.2 29.7 24.3
Arithmetic Mean 164.19091 79.657576 38.8575758 26.018182 20.212121
Std. Deviation 19.540765 6.3258908 3.60173832 3.152326 3.5592975
GD10-SARAISINGAR VILLAGE (GEVRA) 250 350
300
200
250
150 200
150 100
100
50
50
0 0
SPM μg/ ^
PM 2.5 μg/ ^
NOx μg/ ^
P. LIMIT PM 10 μg/ ^
P. LIMIT “O μg/ ^
DAILY EXCAVATED QUANTITY (1000,m^3)
PM μg/ ^
“O μg/ ^
P. LIMIT “PM μg/ ^
P. LIMIT PM . μg/ ^
P. LIMIT NO μg/ ^
PART
ICUL
ATE
MAT
TER
μg/m
^3
DA
ILY
EX
CA
VA
TE
D Q
UA
NT
ITY
(1
00
0,m
^3
)

Page | 90
Name of Location (GD-11)
GD11-BINJHRI VILLAGE (GEVRA)
Sr. No.
Date of
Sampling
SPM
PM10
PM2.5
SO2
NOx
DAILY
EXCAVATED
QUANTITY
Unit µg/m3 µg/m3
µg/m3 µg/m3
µg/m3 (1000,m^3)
GSR 826 (E) - 100 60 80 80 -
1. 22.05.2019 141 82.7 31.8 20.6 20.1 264.601
2. 26.05.2019 162.2 85.1 34.5 20.1 13.2 311.335
3. 29.05.2019 145.3 84.6 40.7 17.5 20.3 313.404
4. 02.06.2019 131.2 80 39.8 18.5 17.0 280.975
5. 05.06.2019 144.3 78.4 32.6 13.2 21.2 289.818
6. 09.06.2019 148.9 82.7 38.7 16.5 22.3 272.434
7. 12.06.2019 146.5 77.5 36.9 19.5 21.3 296.457
8. 15.09.2019 138.7 67.9 34.7 20.4 20.1 167.625
9. 19.09.2019 153.2 71.6 33.2 23.1 21.4 195.623
10. 22.09.2019 137.6 88.7 42.6 21.5 22.1 198.448
11. 26.09.2019 141.2 80.4 38.2 22.8 25.1 100.844
12. 29.09.2019 136.9 82.4 37.4 22.9 18.6 22.13
13. 03.10.2019 186 93.4 40.9 24.5 12.4 167.824
14. 06.10.2019 101.2 64.9 33.7 29.3 16.3 200.789
15. 10.10.2019 146.3 86.1 41.8 22.1 14.7 194.438
16. 13.10.2019 141.3 83.2 36.9 30.1 13.5 211.211
17. 17.10.2019 138.9 82.5 40.2 28.4 23.4 258.212
18. 20.10.2019 153.4 74.8 33.7 25.1 12.6 168.916
19. 24.10.2019 132.4 72.9 31.8 19.6 21.2 187.913
20. 27.10.2019 185.6 54.2 39.1 28.4 15.4 162.068
21 31.10.2019 103.2 83.1 25.8 15.6 22.5 226.845
22. 03.11.2019 134.2 74.6 32.1 19.5 26.5 237.056
23. 07.11.2019 123.2 68.1 36.4 32.5 21.7 242.902
24. 10.11.2019 132.8 84.6 33.1 31.2 21.8 251.499
25. 14.11.2019 137.6 83.1 51.6 29.1 18.5 234.343
26. 17.11.2019 168.3 76.1 33.4 13.2 18.4 265.651
27. 21.11.2019 146.3 72.4 28.6 19.5 12.6 253.981
28. 24.11.2019 138.4 71.6 23.4 23.6 12.6 267.076
29. 28.11.2019 157.9 72.9 31.8 25.4 14.3 244.001
30. 01.12.2019 165.3 80.3 35.9 26.5 13.2 255.073
31. 05.12.2019 132.4 65.4 19.4 20.1 15.4 270.939
32. 08.12.2019 126.4 70.2 20.8 19.3 11.8 279.352
33. 12.12.2019 130.2 61.3 19.7 30.2 22.6 263.513
34. 15.12.2019 154.3 64.8 26.9 16.4 11.8 274.522
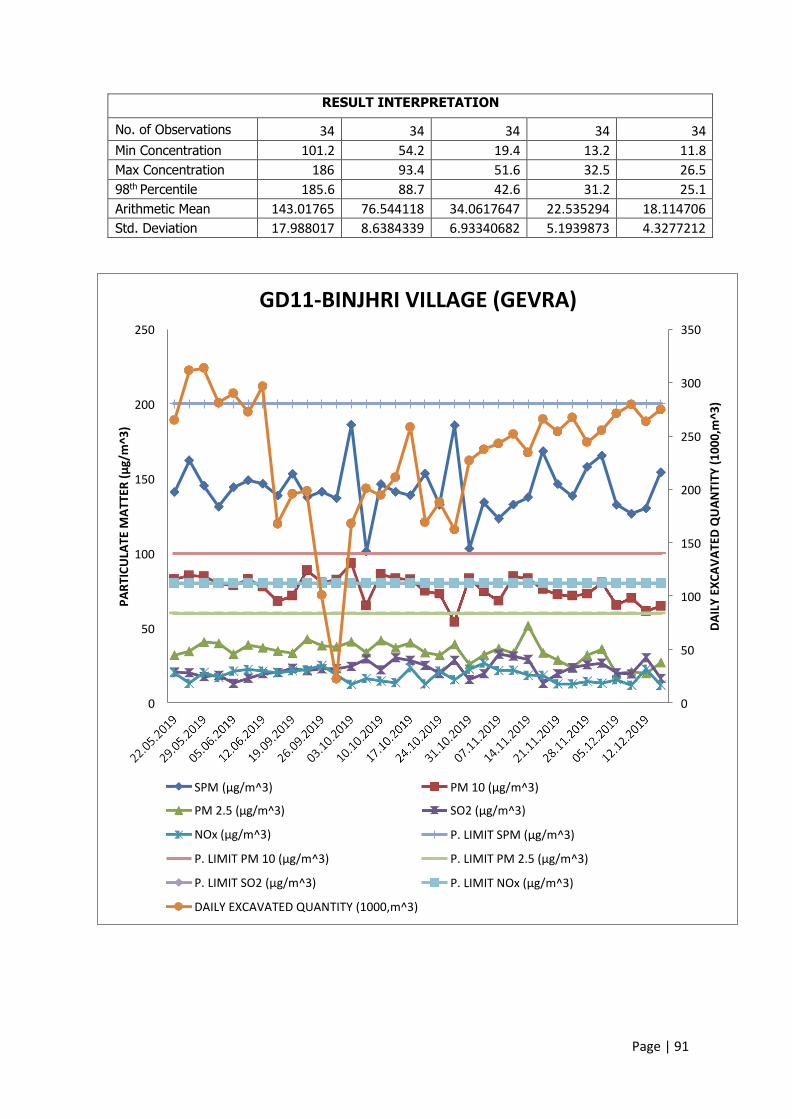
Page | 91
RESULT INTERPRETATION
No. of Observations 34 34 34 34 34
Min Concentration 101.2 54.2 19.4 13.2 11.8
Max Concentration 186 93.4 51.6 32.5 26.5
98th Percentile 185.6 88.7 42.6 31.2 25.1
Arithmetic Mean 143.01765 76.544118 34.0617647 22.535294 18.114706
Std. Deviation 17.988017 8.6384339 6.93340682 5.1939873 4.3277212
GD11-BINJHRI VILLAGE (GEVRA) 250 350
300
200
250
150 200
100 150
100
50
50
0 0
SPM μg/ ^
PM 2.5 μg/ ^
NOx μg/ ^
P. LIMIT PM μg/ ^
P. LIMIT SO2 μg/ ^
DAILY EXCAVATED QUANTITY (1000,m^3)
PM μg/ ^
“O μg/ ^
P. LIMIT “PM μg/ ^
P. LIMIT PM . μg/ ^
P. LIMIT NO μg/ ^
PART
ICUL
ATE
MAT
TER
μg/m
^3
DA
ILY
EX
CA
VA
TE
D Q
UA
NT
ITY
(1
00
0,m
^3
)
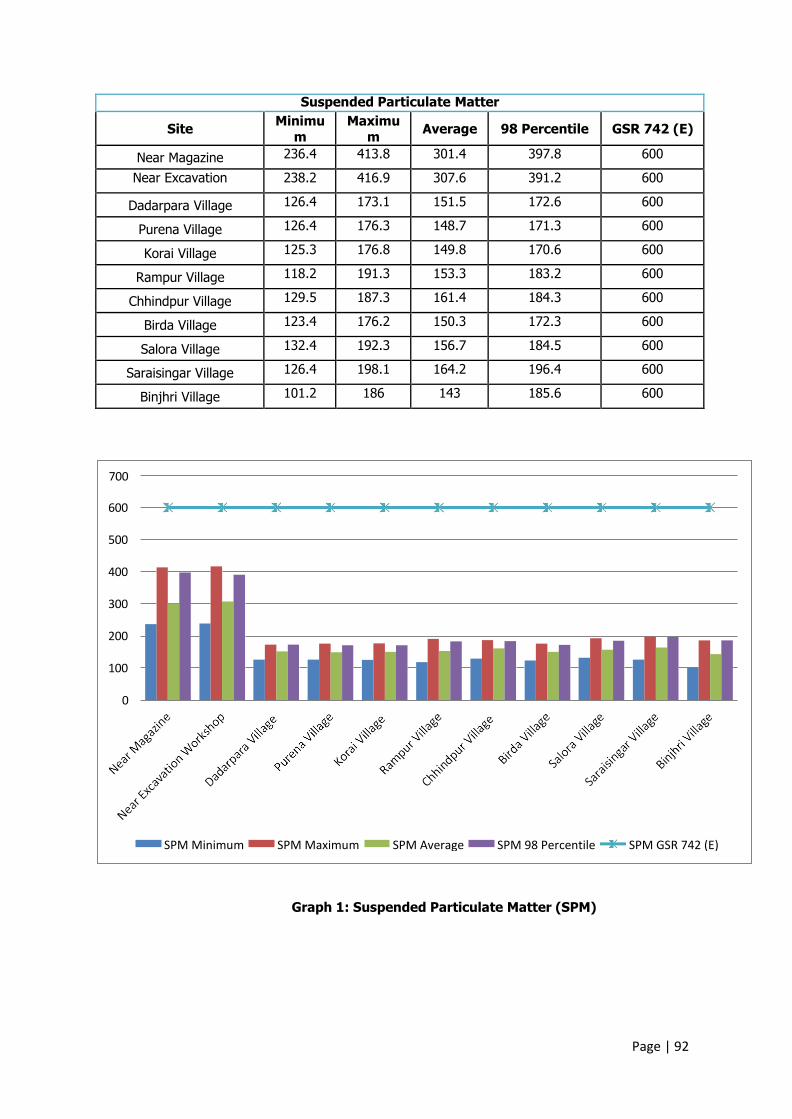
Page | 92
SPM GSR 742 (E) SPM 98 Percentile SPM Average SPM Maximum SPM Minimum
700
600
500
400
300
200
100
0
Suspended Particulate Matter
Site Minimu
m Maximu
m Average 98 Percentile GSR 742 (E)
Near Magazine 236.4 413.8 301.4 397.8 600
Near Excavation 238.2 416.9 307.6 391.2 600
Dadarpara Village 126.4 173.1 151.5 172.6 600
Purena Village 126.4 176.3 148.7 171.3 600
Korai Village 125.3 176.8 149.8 170.6 600
Rampur Village 118.2 191.3 153.3 183.2 600
Chhindpur Village 129.5 187.3 161.4 184.3 600
Birda Village 123.4 176.2 150.3 172.3 600
Salora Village 132.4 192.3 156.7 184.5 600
Saraisingar Village 126.4 198.1 164.2 196.4 600
Binjhri Village 101.2 186 143 185.6 600
Graph 1: Suspended Particulate Matter (SPM)
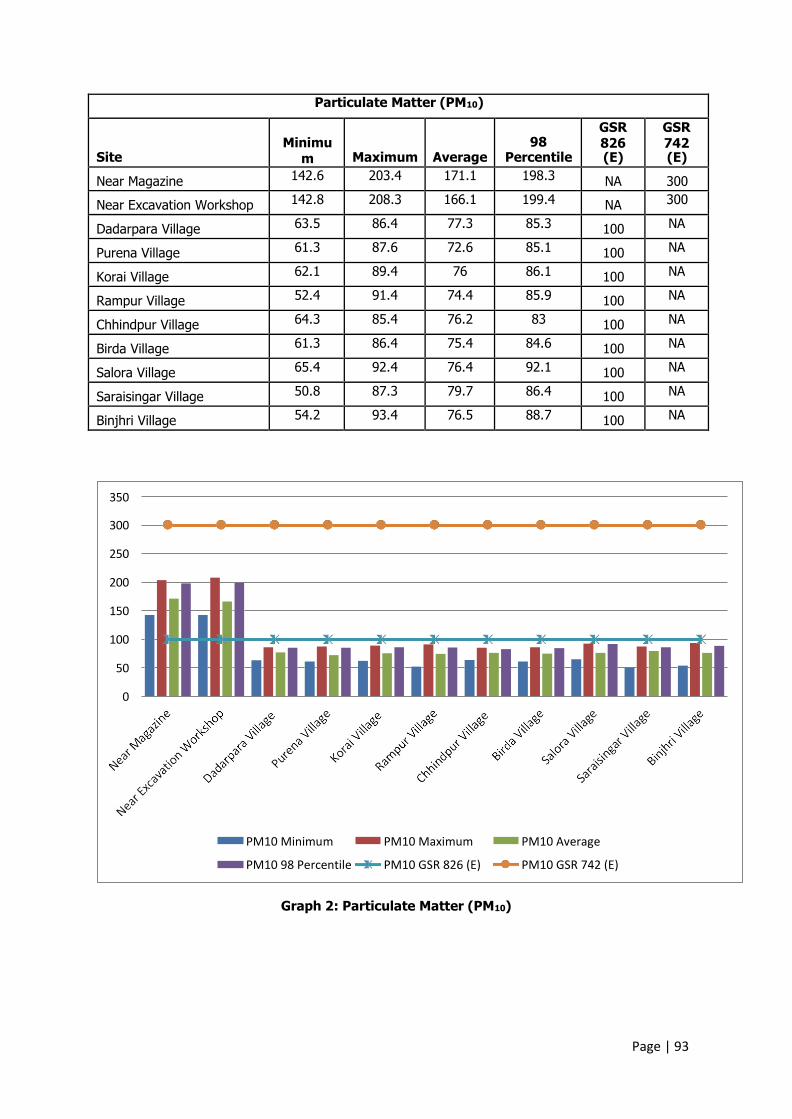
Page | 93
350
300
250
200
150
100
50
0
PM10 Minimum
PM10 98 Percentile
PM10 Maximum
PM10 GSR 826 (E)
PM10 Average
PM10 GSR 742 (E)
Particulate Matter (PM10)
Site
Minimu m
Maximum
Average
98 Percentile
GSR 826 (E)
GSR 742 (E)
Near Magazine 142.6 203.4 171.1 198.3 NA 300
Near Excavation Workshop 142.8 208.3 166.1 199.4 NA 300
Dadarpara Village 63.5 86.4 77.3 85.3 100 NA
Purena Village 61.3 87.6 72.6 85.1 100 NA
Korai Village 62.1 89.4 76 86.1 100 NA
Rampur Village 52.4 91.4 74.4 85.9 100 NA
Chhindpur Village 64.3 85.4 76.2 83 100 NA
Birda Village 61.3 86.4 75.4 84.6 100 NA
Salora Village 65.4 92.4 76.4 92.1 100 NA
Saraisingar Village 50.8 87.3 79.7 86.4 100 NA
Binjhri Village 54.2 93.4 76.5 88.7 100 NA
Graph 2: Particulate Matter (PM10)
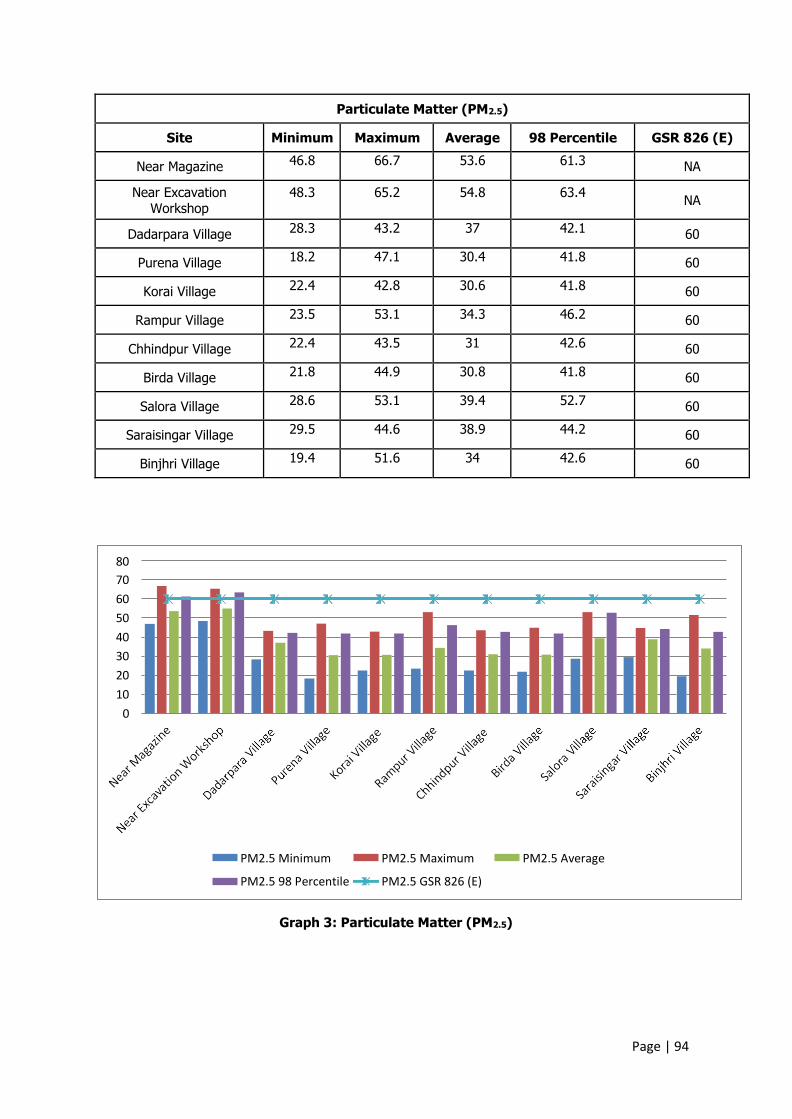
Page | 94
PM2.5 Average PM2.5 Maximum
PM2.5 GSR 826 (E)
PM2.5 Minimum
PM2.5 98 Percentile
80
70
60
50
40
30
20
10
0
Particulate Matter (PM2.5)
Site Minimum Maximum Average 98 Percentile GSR 826 (E)
Near Magazine 46.8 66.7 53.6 61.3 NA
Near Excavation Workshop
48.3 65.2 54.8 63.4 NA
Dadarpara Village 28.3 43.2 37 42.1 60
Purena Village 18.2 47.1 30.4 41.8 60
Korai Village 22.4 42.8 30.6 41.8 60
Rampur Village 23.5 53.1 34.3 46.2 60
Chhindpur Village 22.4 43.5 31 42.6 60
Birda Village 21.8 44.9 30.8 41.8 60
Salora Village 28.6 53.1 39.4 52.7 60
Saraisingar Village 29.5 44.6 38.9 44.2 60
Binjhri Village 19.4 51.6 34 42.6 60
Graph 3: Particulate Matter (PM2.5)
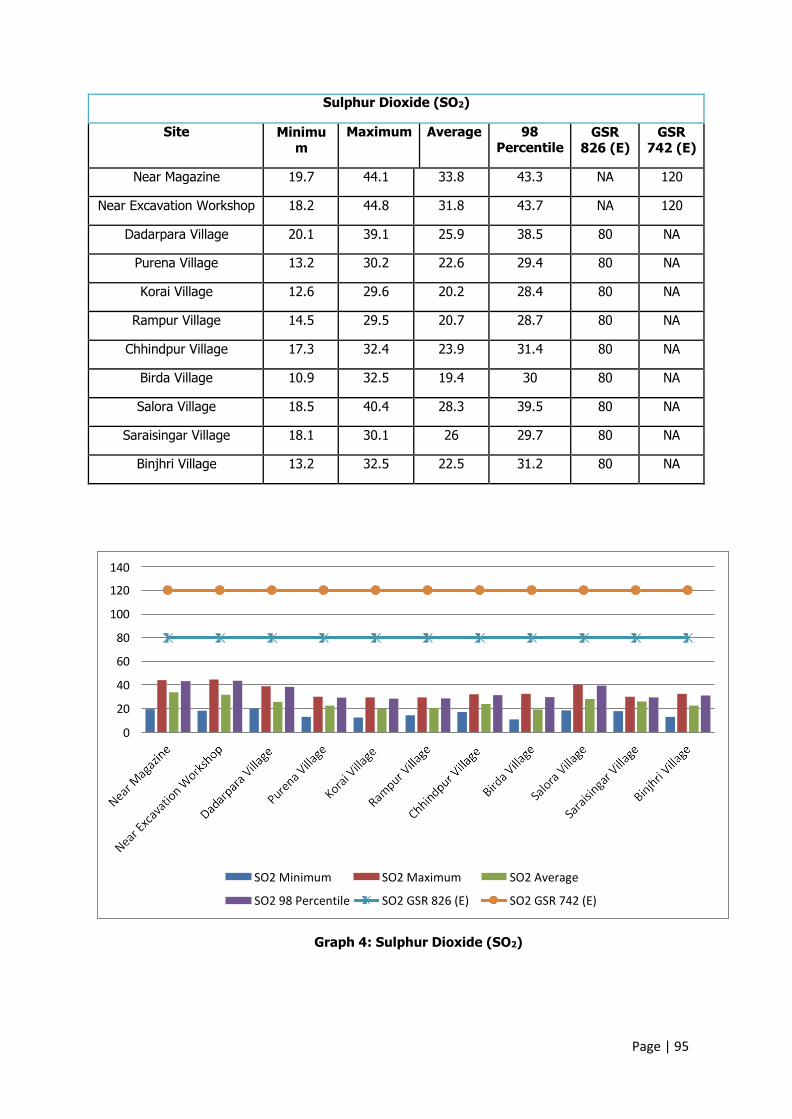
Page | 95
SO2 Average
SO2 GSR 742 (E)
SO2 Maximum
SO2 GSR 826 (E)
SO2 Minimum
SO2 98 Percentile
140
120
100
80
60
40
20
0
Sulphur Dioxide (SO2)
Site Minimu m
Maximum Average 98 Percentile
GSR 826 (E)
GSR 742 (E)
Near Magazine 19.7 44.1 33.8 43.3 NA 120
Near Excavation Workshop 18.2 44.8 31.8 43.7 NA 120
Dadarpara Village 20.1 39.1 25.9 38.5 80 NA
Purena Village 13.2 30.2 22.6 29.4 80 NA
Korai Village 12.6 29.6 20.2 28.4 80 NA
Rampur Village 14.5 29.5 20.7 28.7 80 NA
Chhindpur Village 17.3 32.4 23.9 31.4 80 NA
Birda Village 10.9 32.5 19.4 30 80 NA
Salora Village 18.5 40.4 28.3 39.5 80 NA
Saraisingar Village 18.1 30.1 26 29.7 80 NA
Binjhri Village 13.2 32.5 22.5 31.2 80 NA
Graph 4: Sulphur Dioxide (SO2)
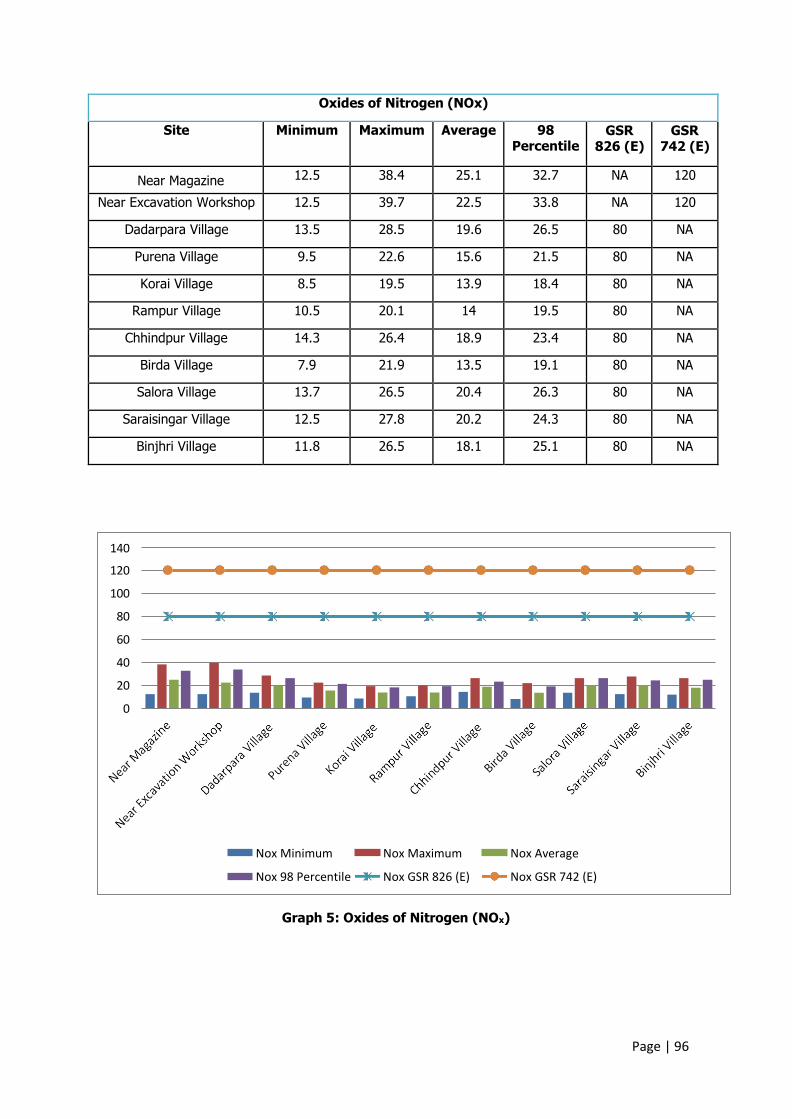
Page | 96
Nox Average
Nox GSR 742 (E)
Nox Maximum
Nox GSR 826 (E)
Nox Minimum
Nox 98 Percentile
140
120
100
80
60
40
20
0
Oxides of Nitrogen (NOx)
Site Minimum Maximum Average 98 Percentile
GSR 826 (E)
GSR 742 (E)
Near Magazine 12.5 38.4 25.1 32.7 NA 120
Near Excavation Workshop 12.5 39.7 22.5 33.8 NA 120
Dadarpara Village 13.5 28.5 19.6 26.5 80 NA
Purena Village 9.5 22.6 15.6 21.5 80 NA
Korai Village 8.5 19.5 13.9 18.4 80 NA
Rampur Village 10.5 20.1 14 19.5 80 NA
Chhindpur Village 14.3 26.4 18.9 23.4 80 NA
Birda Village 7.9 21.9 13.5 19.1 80 NA
Salora Village 13.7 26.5 20.4 26.3 80 NA
Saraisingar Village 12.5 27.8 20.2 24.3 80 NA
Binjhri Village 11.8 26.5 18.1 25.1 80 NA
Graph 5: Oxides of Nitrogen (NOx)
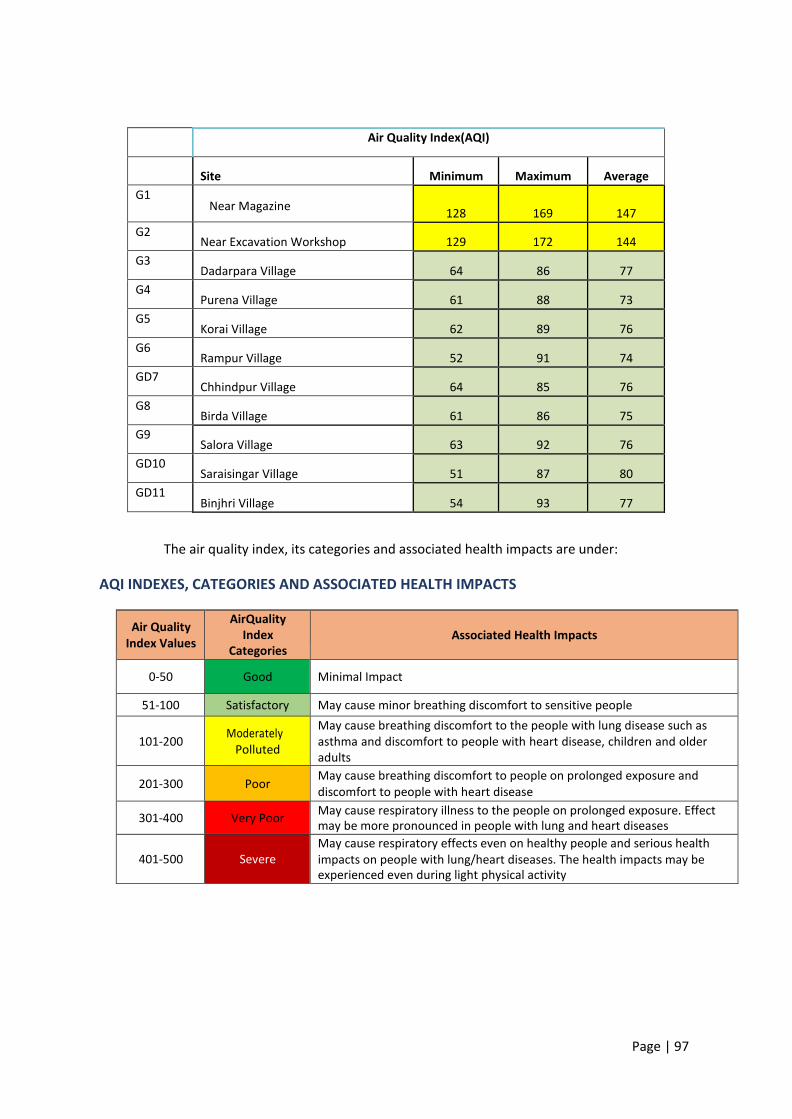
Page | 97
Air Quality Index(AQI)
Site Minimum Maximum Average
G1 Near Magazine
128
169
147
G2 Near Excavation Workshop 129 172 144
G3 Dadarpara Village 64 86 77
G4 Purena Village 61 88 73
G5 Korai Village 62 89 76
G6 Rampur Village 52 91 74
GD7 Chhindpur Village 64 85 76
G8 Birda Village 61 86 75
G9 Salora Village 63 92 76
GD10 Saraisingar Village 51 87 80
GD11 Binjhri Village 54 93 77
The air quality index, its categories and associated health impacts are under:
AQI INDEXES, CATEGORIES AND ASSOCIATED HEALTH IMPACTS
Air Quality
Index Values
AirQuality
Index
Categories
Associated Health Impacts
0-50 Good Minimal Impact
51-100 Satisfactory May cause minor breathing discomfort to sensitive people
101-200 Moderately
Polluted
May cause breathing discomfort to the people with lung disease such as
asthma and discomfort to people with heart disease, children and older
adults
201-300 Poor May cause breathing discomfort to people on prolonged exposure and
discomfort to people with heart disease
301-400 Very Poor May cause respiratory illness to the people on prolonged exposure. Effect
may be more pronounced in people with lung and heart diseases
401-500
Severe
May cause respiratory effects even on healthy people and serious health
impacts on people with lung/heart diseases. The health impacts may be
experienced even during light physical activity

Page | 98
ASSESMENT OF WATER QUALITY
The locations of the water quality monitoring stations have been provided below. The
project area contains seasonal nallah which ultimately joins river lilagarh.
WATER SAMPLING LOCATIONS
S. No. Name of the sites
G1 BATARI VILLAGE NEAR SASAKIYA HIGH SCHOOL, BADRINAGAR
G2 AMGAON NEAR BASAHAT
G3 AMGAON NEAR HARDIBAZAR
G4 RALIYA BASTI
G5 DOMESTIC EFFLUENT TREATMENT PLANT
G6 MINE WATER DISCHARGE TO TREATMENT PLANT
G7 MAIN SUMP WATER STORAGE POND NEAR JONAHDIH SIDING
G8 TREATMENT PLANT OF JONADIH SIDING POND
G9 BIJHRA VILLAGE SUPPLY WATER
G10 INTERNAL POND FOR WATER STORAGE IN MINE
G11 E&F SEAM OF EAST SECTION SEEPAGE WATER
G12 ETP, RAW WATER
G13 ETP, AFTER TREATMENT
G14 GANGANAGAR PUNARWAS NEAR SEAL POND
G15 ROHINA BASTI (ONLY FOR DOMESTIC PURPOSE)
G16 MANGLAN VILLAGE
G17 NARAIBODH VILLAGE
G18 BHATHORA VILLAGE NEAR RAMJANKI MANDIR
G19 SALORA VILLAGE AT SARPANCH HOUSE
G20 BUDHWARI BAJAR NEAR GURUDWARA
G21 SHIVMANDIR, URJANAGAR
G22 DHURAINA BASTI
G23 KATKI DABRI VILLAGE
G24 NAWAPARA VILLAGE
G25 CHINDPUR VILLAGE NEAR DURGA MANDIR
The water quality of the study area has been surveyed and status is as under:
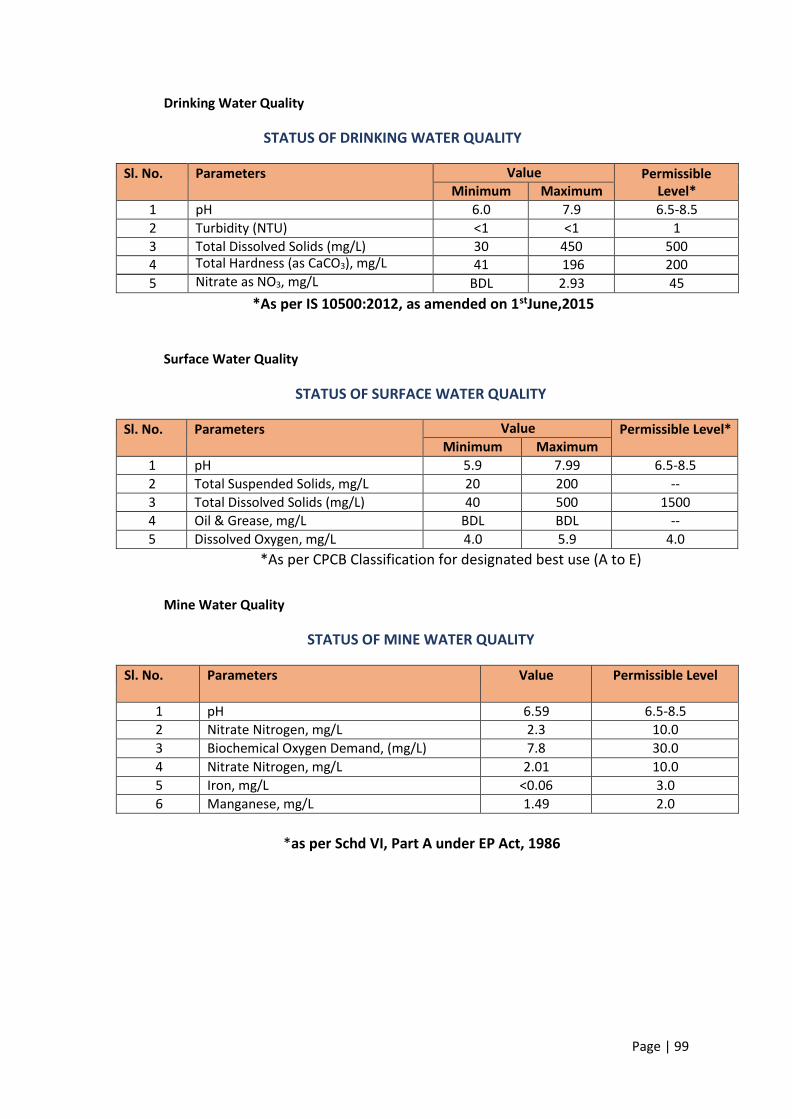
Page | 99
Drinking Water Quality
STATUS OF DRINKING WATER QUALITY
Sl. No. Parameters Value Permissible
Level* Minimum Maximum
1 pH 6.0 7.9 6.5-8.5
2 Turbidity (NTU) <1 <1 1
3 Total Dissolved Solids (mg/L) 30 450 500
4 Total Hardness (as CaCO3), mg/L 41 196 200
5 Nitrate as NO3, mg/L BDL 2.93 45
*As per IS 10500:2012, as amended on 1stJune,2015
Surface Water Quality
STATUS OF SURFACE WATER QUALITY
Sl. No. Parameters Value Permissible Level*
Minimum Maximum
1 pH 5.9 7.99 6.5-8.5
2 Total Suspended Solids, mg/L 20 200 --
3 Total Dissolved Solids (mg/L) 40 500 1500
4 Oil & Grease, mg/L BDL BDL --
5 Dissolved Oxygen, mg/L 4.0 5.9 4.0
*As per CPCB Classification for designated best use (A to E)
Mine Water Quality
STATUS OF MINE WATER QUALITY
Sl. No. Parameters Value Permissible Level
1 pH 6.59 6.5-8.5
2 Nitrate Nitrogen, mg/L 2.3 10.0
3 Biochemical Oxygen Demand, (mg/L) 7.8 30.0
4 Nitrate Nitrogen, mg/L 2.01 10.0
5 Iron, mg/L <0.06 3.0
6 Manganese, mg/L 1.49 2.0
*as per Schd VI, Part A under EP Act, 1986
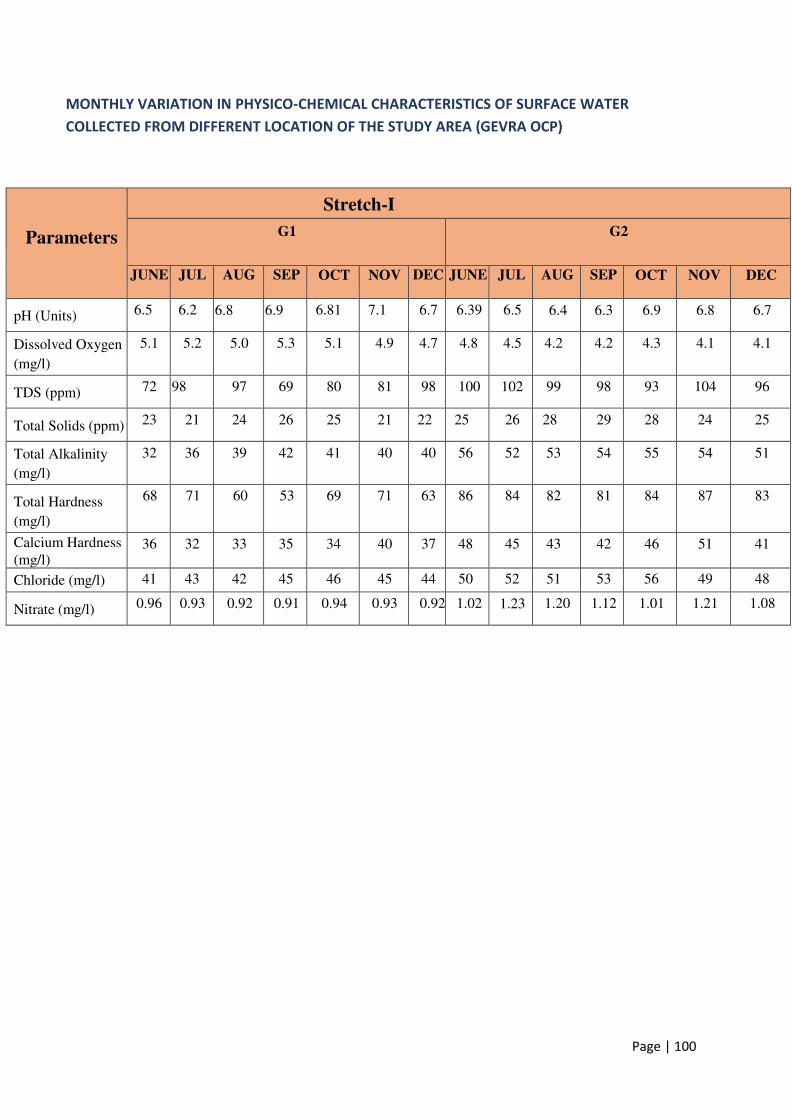
Page | 100
MONTHLY VARIATION IN PHYSICO-CHEMICAL CHARACTERISTICS OF SURFACE WATER
COLLECTED FROM DIFFERENT LOCATION OF THE STUDY AREA (GEVRA OCP)
Parameters
Stretch-I
G1 G2
JUNE JUL AUG SEP OCT NOV DEC JUNE JUL AUG SEP OCT NOV DEC
pH (Units) 6.5 6.2 6.8 6.9 6.81 7.1 6.7 6.39 6.5 6.4 6.3 6.9 6.8 6.7
Dissolved Oxygen
(mg/l)
5.1 5.2 5.0 5.3 5.1 4.9 4.7 4.8 4.5 4.2 4.2 4.3 4.1 4.1
TDS (ppm) 72 98 97 69 80 81 98 100 102 99 98 93 104 96
Total Solids (ppm) 23 21 24 26 25 21 22 25 26 28 29 28 24 25
Total Alkalinity
(mg/l)
32 36 39 42 41 40 40 56 52 53 54 55 54 51
Total Hardness
(mg/l)
68 71 60 53 69 71 63 86 84 82 81 84 87 83
Calcium Hardness
(mg/l) 36 32 33 35 34 40 37 48 45 43 42 46 51 41
Chloride (mg/l) 41 43 42 45 46 45 44 50 52 51 53 56 49 48
Nitrate (mg/l) 0.96 0.93 0.92 0.91 0.94 0.93 0.92 1.02 1.23 1.20 1.12 1.01 1.21 1.08

Page | 101
MONTHLY VARIATION IN PHYSICO-CHEMICAL CHARACTERISTICS OF SURFACE WATER
COLLECTED FROM DIFFERENT LOCATION OF THE STUDY AREA (GEVRA OCP)
Parameters
Stretch-II
G3 G4
JUNE JUL AUG SEP OCT NOV DEC JUNE JUL AUG SEP OCT NOV DEC
pH (Units) 6.9 6.5 6.8 6.7 7.1 6.8 6.5 6.9 6.5 6.4 6.8 6.7 7.0 6.8
Dissolved Oxygen
(mg/l)
4.1 4.3 4.5 4.6 5.0 4.9 4.3 4.0 4.1 4.2 4.3 4.5 4.6 4.5
TDS (ppm) 82 86 74 78 89 87 76 97 95 96 94 92 91 90
Total Solids (ppm) 25 26 28 27 28 32 29 42 41 43 45 46 41 42
Total Alkalinity
(mg/l)
38 37 36 35 34 37 35 26 25 24 28 30 31 29
Total Hardness
(mg/l)
60 62 65 64 63 67 64 68 68 65 67 64 63 64
Calcium Hardness
(mg/l)
25 26 24 28 32 31 26 32 35 36 34 33 34 32
Chloride (mg/l) 38 37 36 35 34 38 36 41 42 45 46 47 45 44
Nitrate (mg/l) 0.92 0.92 0.91 0.83 0.87 0.94 0.89 1.02 1.03 1.04 1.33 1.34 1.35 1.2
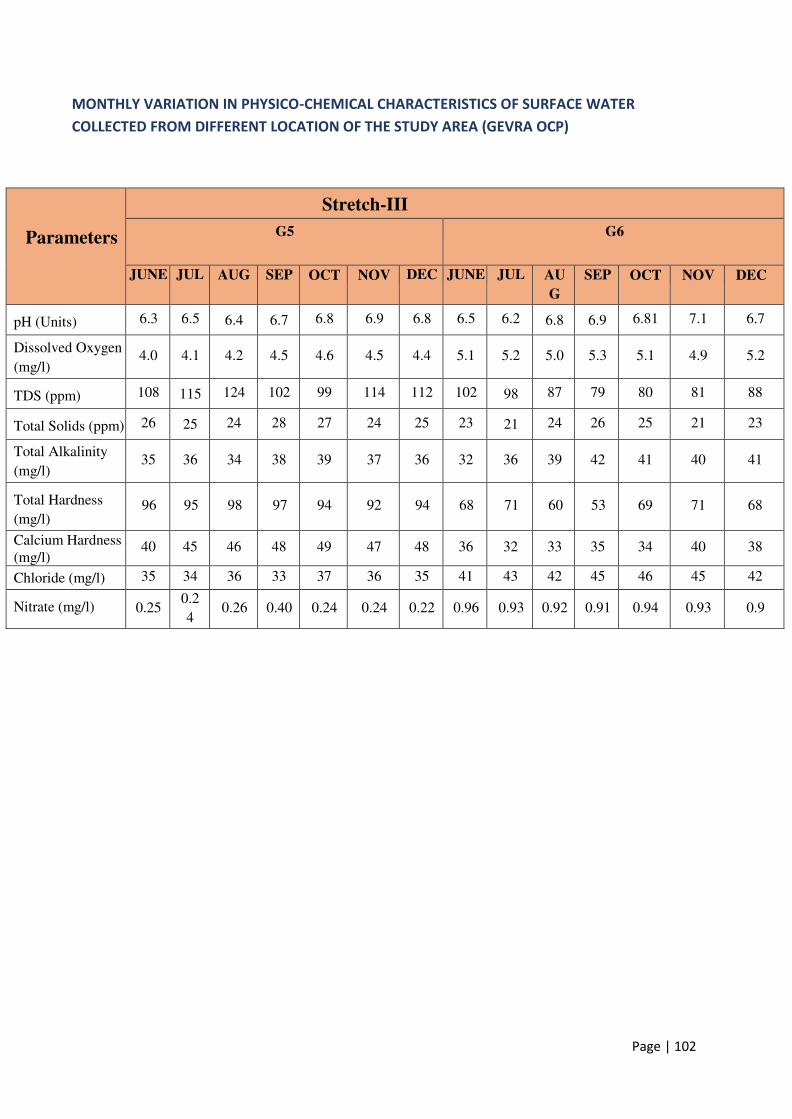
Page | 102
MONTHLY VARIATION IN PHYSICO-CHEMICAL CHARACTERISTICS OF SURFACE WATER
COLLECTED FROM DIFFERENT LOCATION OF THE STUDY AREA (GEVRA OCP)
Parameters
Stretch-III
G5 G6
JUNE JUL AUG SEP OCT NOV DEC JUNE JUL AU
G
SEP OCT NOV DEC
pH (Units) 6.3 6.5 6.4 6.7 6.8 6.9 6.8 6.5 6.2 6.8 6.9 6.81 7.1 6.7
Dissolved Oxygen
(mg/l) 4.0 4.1 4.2 4.5 4.6 4.5 4.4 5.1 5.2 5.0 5.3 5.1 4.9 5.2
TDS (ppm) 108 115 124 102 99 114 112 102 98 87 79 80 81 88
Total Solids (ppm) 26 25 24 28 27 24 25 23 21 24 26 25 21 23
Total Alkalinity
(mg/l) 35 36 34 38 39 37 36 32 36 39 42 41 40 41
Total Hardness
(mg/l) 96 95 98 97 94 92 94 68 71 60 53 69 71 68
Calcium Hardness
(mg/l) 40 45 46 48 49 47 48 36 32 33 35 34 40 38
Chloride (mg/l) 35 34 36 33 37 36 35 41 43 42 45 46 45 42
Nitrate (mg/l) 0.25 0.2
4 0.26 0.40 0.24 0.24 0.22 0.96 0.93 0.92 0.91 0.94 0.93 0.9
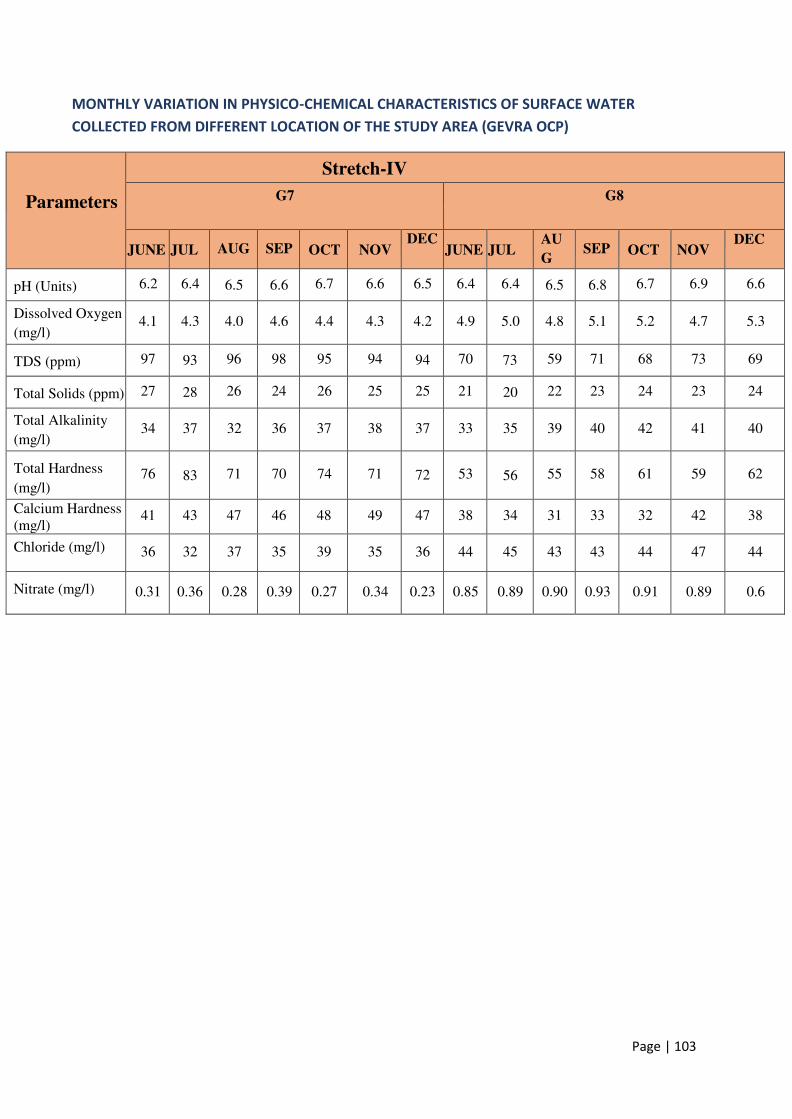
Page | 103
MONTHLY VARIATION IN PHYSICO-CHEMICAL CHARACTERISTICS OF SURFACE WATER
COLLECTED FROM DIFFERENT LOCATION OF THE STUDY AREA (GEVRA OCP)
Parameters
Stretch-IV
G7 G8
JUNE JUL AUG SEP OCT NOV DEC
JUNE JUL AU
G SEP OCT NOV
DEC
pH (Units) 6.2 6.4 6.5 6.6 6.7 6.6 6.5 6.4 6.4 6.5 6.8 6.7 6.9 6.6
Dissolved Oxygen
(mg/l) 4.1 4.3 4.0 4.6 4.4 4.3 4.2 4.9 5.0 4.8 5.1 5.2 4.7 5.3
TDS (ppm) 97 93 96 98 95 94 94 70 73 59 71 68 73 69
Total Solids (ppm) 27 28 26 24 26 25 25 21 20 22 23 24 23 24
Total Alkalinity
(mg/l) 34 37 32 36 37 38 37 33 35 39 40 42 41 40
Total Hardness
(mg/l) 76
83 71 70 74 71
72 53
56 55 58 61 59 62
Calcium Hardness
(mg/l) 41 43 47 46 48 49 47 38 34 31 33 32 42 38
Chloride (mg/l) 36 32 37 35 39 35 36 44 45 43 43 44 47 44
Nitrate (mg/l) 0.31 0.36 0.28 0.39 0.27 0.34 0.23 0.85 0.89 0.90 0.93 0.91 0.89 0.6
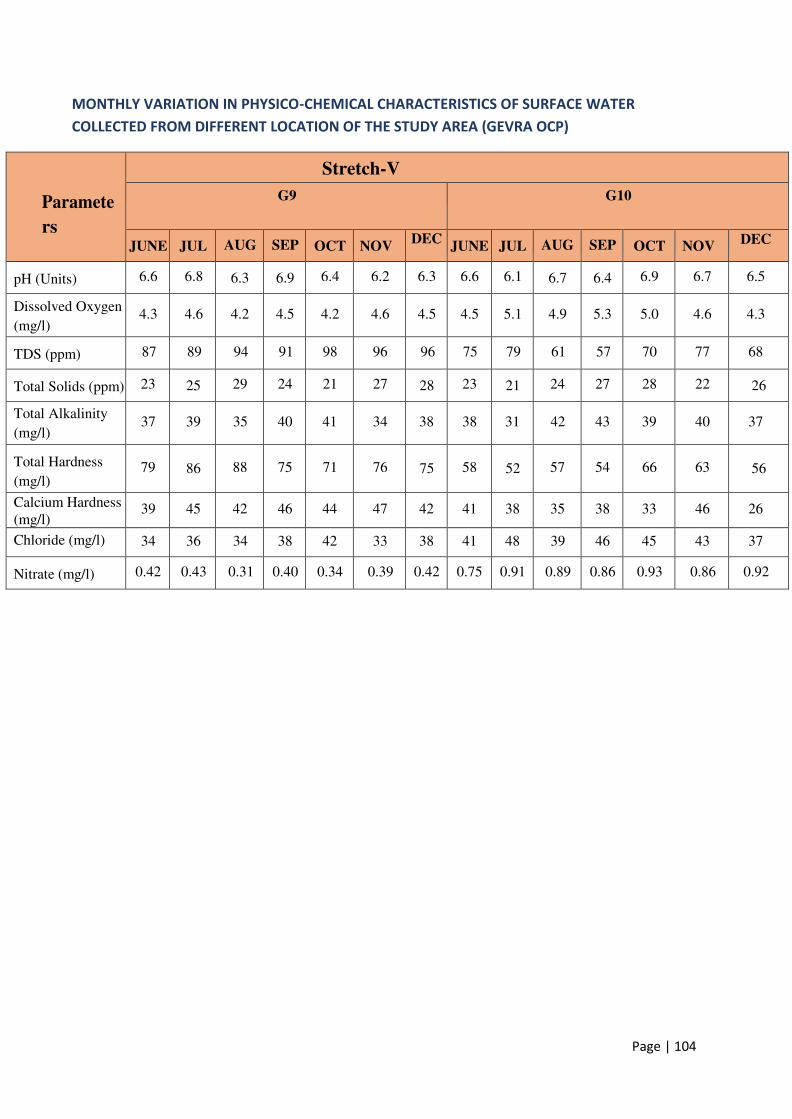
Page | 104
MONTHLY VARIATION IN PHYSICO-CHEMICAL CHARACTERISTICS OF SURFACE WATER
COLLECTED FROM DIFFERENT LOCATION OF THE STUDY AREA (GEVRA OCP)
Paramete
rs
Stretch-V
G9 G10
JUNE JUL AUG SEP OCT NOV DEC
JUNE JUL AUG SEP OCT NOV DEC
pH (Units) 6.6 6.8 6.3 6.9 6.4 6.2 6.3 6.6 6.1 6.7 6.4 6.9 6.7 6.5
Dissolved Oxygen
(mg/l) 4.3 4.6 4.2 4.5 4.2 4.6 4.5 4.5 5.1 4.9 5.3 5.0 4.6 4.3
TDS (ppm) 87 89 94 91 98 96 96 75 79 61 57 70 77 68
Total Solids (ppm) 23 25 29 24 21 27 28 23 21 24 27 28 22 26
Total Alkalinity
(mg/l) 37 39 35 40 41 34 38 38 31 42 43 39 40 37
Total Hardness
(mg/l) 79
86 88 75 71 76
75 58
52 57 54 66 63
56
Calcium Hardness
(mg/l) 39 45 42 46 44 47 42 41 38 35 38 33 46 26
Chloride (mg/l) 34 36 34 38 42 33 38 41 48 39 46 45 43 37
Nitrate (mg/l) 0.42 0.43 0.31 0.40 0.34 0.39 0.42 0.75 0.91 0.89 0.86 0.93 0.86 0.92
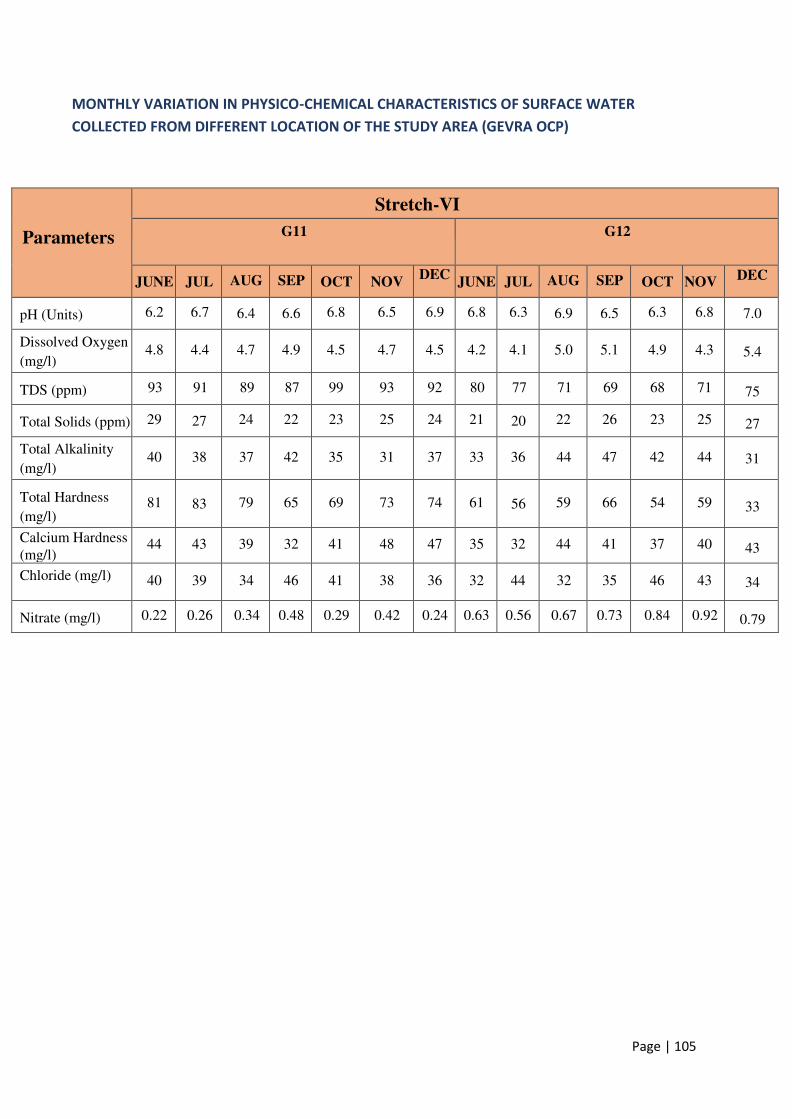
Page | 105
MONTHLY VARIATION IN PHYSICO-CHEMICAL CHARACTERISTICS OF SURFACE WATER
COLLECTED FROM DIFFERENT LOCATION OF THE STUDY AREA (GEVRA OCP)
Parameters
Stretch-VI
G11 G12
JUNE JUL AUG SEP OCT NOV DEC
JUNE JUL AUG SEP OCT NOV DEC
pH (Units) 6.2 6.7 6.4 6.6 6.8 6.5 6.9 6.8 6.3 6.9 6.5 6.3 6.8 7.0
Dissolved Oxygen
(mg/l) 4.8 4.4 4.7 4.9 4.5 4.7 4.5 4.2 4.1 5.0 5.1 4.9 4.3 5.4
TDS (ppm) 93 91 89 87 99 93 92 80 77 71 69 68 71 75
Total Solids (ppm) 29 27 24 22 23 25 24 21 20 22 26 23 25 27
Total Alkalinity
(mg/l) 40 38 37 42 35 31 37 33 36 44 47 42 44 31
Total Hardness
(mg/l) 81
83 79 65 69 73 74 61
56 59 66 54 59
33
Calcium Hardness
(mg/l) 44 43 39 32 41 48 47 35 32 44 41 37 40 43
Chloride (mg/l) 40 39 34 46 41 38 36 32 44 32 35 46 43 34
Nitrate (mg/l) 0.22 0.26 0.34 0.48 0.29 0.42 0.24 0.63 0.56 0.67 0.73 0.84 0.92 0.79
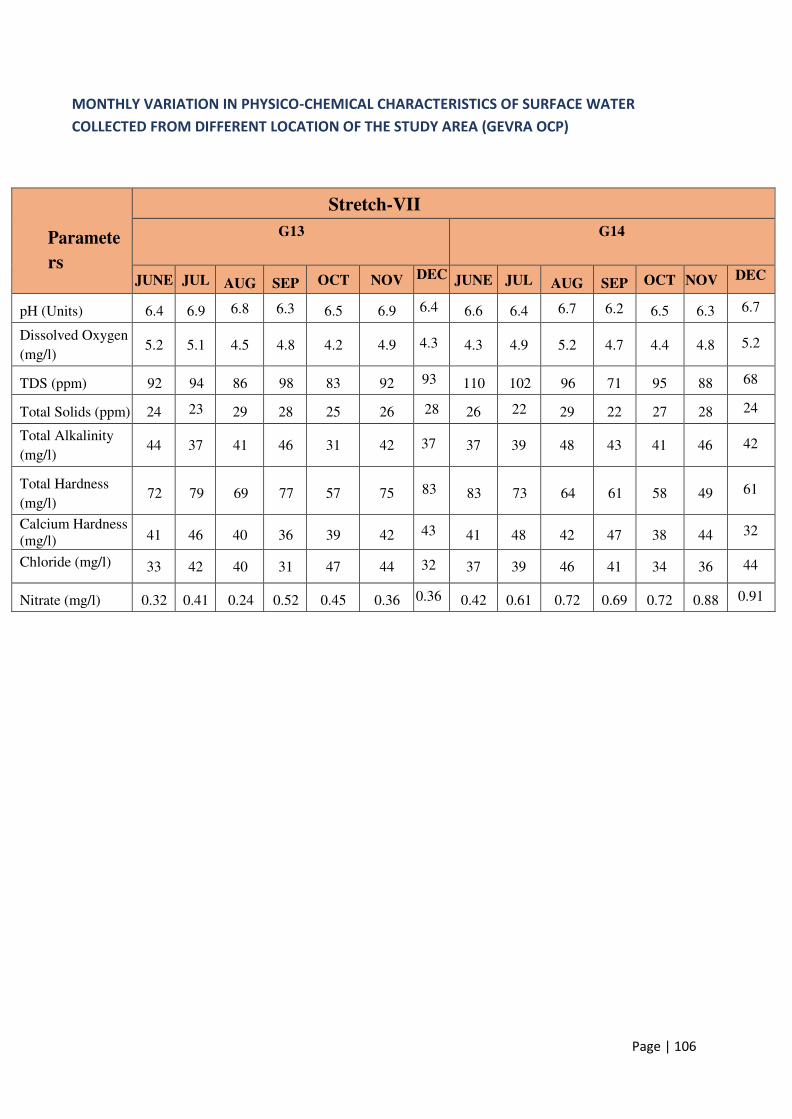
Page | 106
MONTHLY VARIATION IN PHYSICO-CHEMICAL CHARACTERISTICS OF SURFACE WATER
COLLECTED FROM DIFFERENT LOCATION OF THE STUDY AREA (GEVRA OCP)
Paramete
rs
Stretch-VII
G13 G14
JUNE JUL AUG SEP OCT NOV DEC JUNE JUL AUG SEP OCT NOV DEC
pH (Units) 6.4 6.9 6.8 6.3 6.5 6.9 6.4 6.6 6.4 6.7 6.2 6.5 6.3 6.7
Dissolved Oxygen
(mg/l) 5.2 5.1 4.5 4.8 4.2 4.9 4.3 4.3 4.9 5.2 4.7 4.4 4.8 5.2
TDS (ppm) 92 94 86 98 83 92 93 110 102 96 71 95 88 68
Total Solids (ppm) 24 23 29 28 25 26 28 26 22 29 22 27 28 24
Total Alkalinity
(mg/l) 44 37 41 46 31 42 37 37 39 48 43 41 46 42
Total Hardness
(mg/l)
72
79
69
77
57
75 83
83
73
64
61
58
49 61
Calcium Hardness
(mg/l) 41 46 40 36 39 42 43 41 48 42 47 38 44 32
Chloride (mg/l) 33 42 40 31 47 44 32 37 39 46 41 34 36 44
Nitrate (mg/l) 0.32 0.41 0.24 0.52 0.45 0.36 0.36 0.42 0.61 0.72 0.69 0.72 0.88 0.91
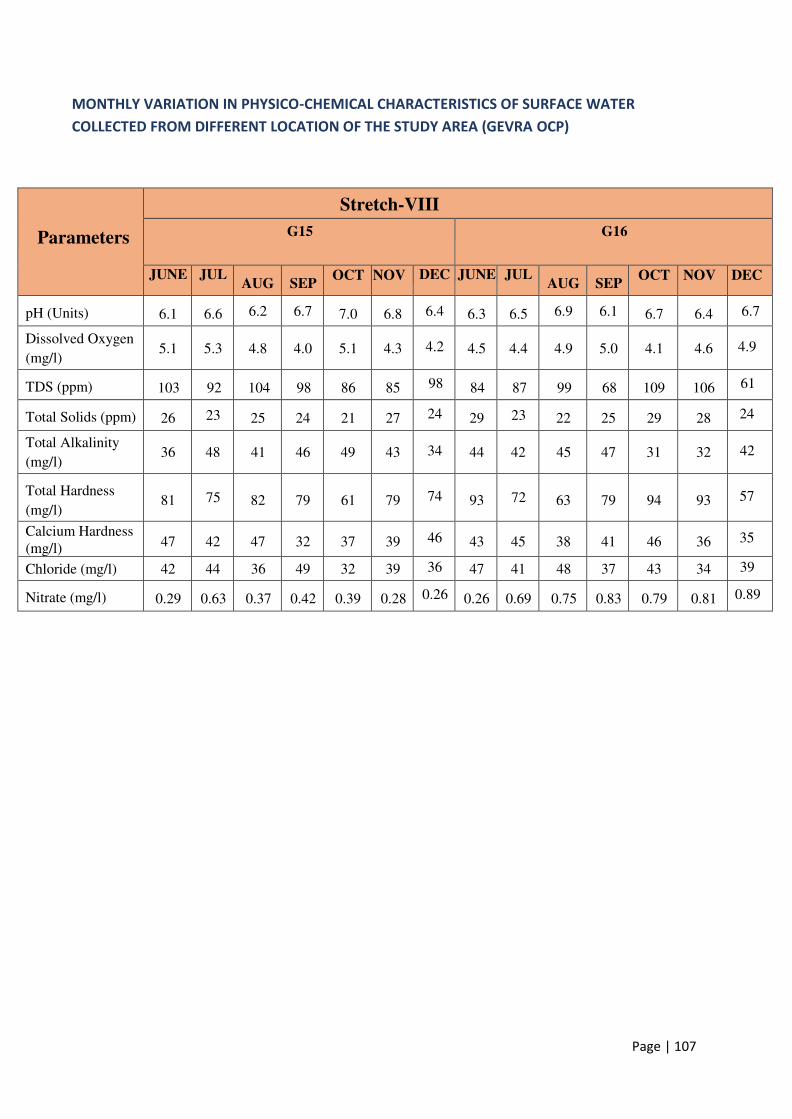
Page | 107
MONTHLY VARIATION IN PHYSICO-CHEMICAL CHARACTERISTICS OF SURFACE WATER
COLLECTED FROM DIFFERENT LOCATION OF THE STUDY AREA (GEVRA OCP)
Parameters
Stretch-VIII
G15 G16
JUNE JUL AUG SEP
OCT NOV DEC JUNE JUL AUG SEP
OCT NOV DEC
pH (Units) 6.1 6.6 6.2 6.7 7.0 6.8 6.4 6.3 6.5 6.9 6.1 6.7 6.4 6.7
Dissolved Oxygen
(mg/l) 5.1 5.3 4.8 4.0 5.1 4.3 4.2 4.5 4.4 4.9 5.0 4.1 4.6 4.9
TDS (ppm) 103 92 104 98 86 85 98 84 87 99 68 109 106 61
Total Solids (ppm) 26 23 25 24 21 27 24 29 23 22 25 29 28 24
Total Alkalinity
(mg/l) 36 48 41 46 49 43 34 44 42 45 47 31 32 42
Total Hardness
(mg/l)
81
75
82
79
61
79 74
93
72
63
79
94
93 57
Calcium Hardness
(mg/l) 47 42 47 32 37 39 46 43 45 38 41 46 36 35
Chloride (mg/l) 42 44 36 49 32 39 36 47 41 48 37 43 34 39
Nitrate (mg/l) 0.29 0.63 0.37 0.42 0.39 0.28 0.26 0.26 0.69 0.75 0.83 0.79 0.81 0.89

Page | 108
MONTHLY VARIATION IN PHYSICO-CHEMICAL CHARACTERISTICS OF SURFACE WATER
COLLECTED FROM DIFFERENT LOCATION OF THE STUDY AREA (GEVRA OCP)
Parameters
Stretch-IX
G17 G18
JUNE JUL AUG SEP
OCT NOV DEC JUNE JUL AUG SEP
OCT NOV DEC
pH (Units) 6.3 6.4 6.5 6.3 6.8 6.1 6.7 6.3 6.9 6.2 7.0 6.4 6.2 6.5
Dissolved Oxygen
(mg/l) 4.0 4.6 4.9 4.3 4.7 4.2 4.4 5.2 5.6 4.7 5.4 5.6 4.9 4.2
TDS (ppm) 101 99 110 88 84 115 91 96 92 85 75 72 84 83
Total Solids (ppm) 26 27 28 25 27 22 27 23 29 21 27 29 21 25
Total Alkalinity
(mg/l) 42 40 37 38 48 32 38 49 41 48 31 37 36 31
Total Hardness
(mg/l)
43
44
36
39
48
41 83
36
47
31
33
39
45
57
Calcium Hardness
(mg/l) 41 44 46 33 38 43 43 47 49 39 43 42 35 39
Chloride (mg/l) 45 42 39 46 35 36 39 49 38 51 34 46 31 47
Nitrate (mg/l) 0.42 0.56 0.32 0.82 0.75 0.66 0.46 0.29 0.31 0.5 0.79 0.71 0.44 0.45
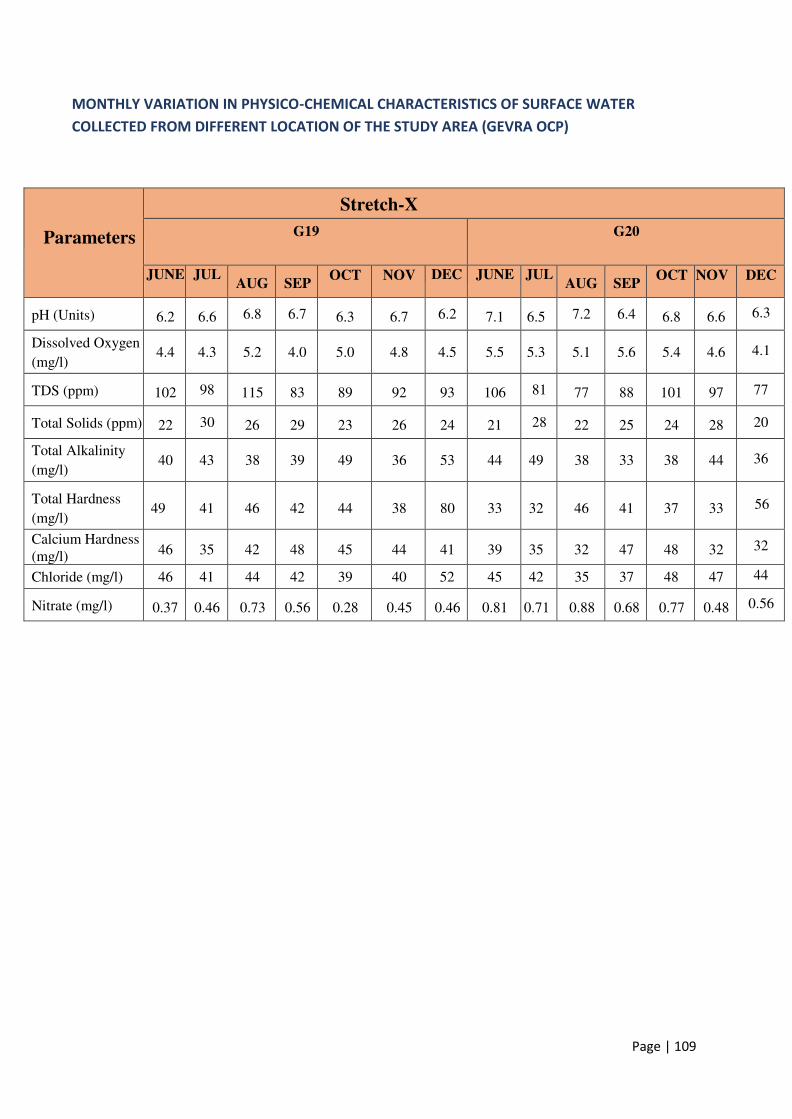
Page | 109
MONTHLY VARIATION IN PHYSICO-CHEMICAL CHARACTERISTICS OF SURFACE WATER
COLLECTED FROM DIFFERENT LOCATION OF THE STUDY AREA (GEVRA OCP)
Parameters
Stretch-X
G19 G20
JUNE JUL AUG SEP
OCT NOV DEC JUNE JUL AUG SEP
OCT NOV DEC
pH (Units) 6.2 6.6 6.8 6.7 6.3 6.7 6.2 7.1 6.5 7.2 6.4 6.8 6.6 6.3
Dissolved Oxygen
(mg/l) 4.4 4.3 5.2 4.0 5.0 4.8 4.5 5.5 5.3 5.1 5.6 5.4 4.6 4.1
TDS (ppm) 102 98 115 83 89 92 93 106 81 77 88 101 97 77
Total Solids (ppm) 22 30 26 29 23 26 24 21 28 22 25 24 28 20
Total Alkalinity
(mg/l) 40 43 38 39 49 36 53 44 49 38 33 38 44 36
Total Hardness
(mg/l)
49
41
46
42
44
38
80
33
32
46
41
37
33 56
Calcium Hardness
(mg/l) 46 35 42 48 45 44 41 39 35 32 47 48 32 32
Chloride (mg/l) 46 41 44 42 39 40 52 45 42 35 37 48 47 44
Nitrate (mg/l) 0.37 0.46 0.73 0.56 0.28 0.45 0.46 0.81 0.71 0.88 0.68 0.77 0.48 0.56
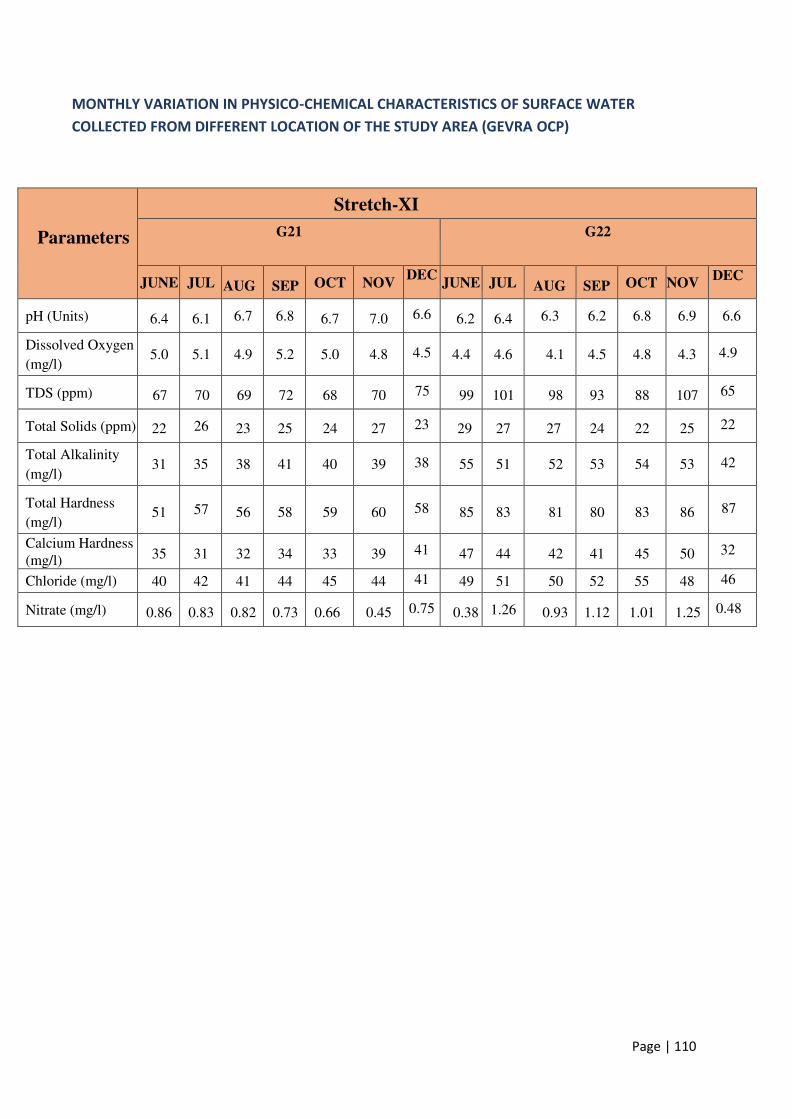
Page | 110
MONTHLY VARIATION IN PHYSICO-CHEMICAL CHARACTERISTICS OF SURFACE WATER
COLLECTED FROM DIFFERENT LOCATION OF THE STUDY AREA (GEVRA OCP)
Parameters
Stretch-XI
G21 G22
JUNE JUL AUG SEP OCT NOV DEC
JUNE JUL AUG SEP OCT NOV DEC
pH (Units) 6.4 6.1 6.7 6.8 6.7 7.0 6.6 6.2 6.4 6.3 6.2 6.8 6.9 6.6
Dissolved Oxygen
(mg/l) 5.0 5.1 4.9 5.2 5.0 4.8 4.5 4.4 4.6 4.1 4.5 4.8 4.3 4.9
TDS (ppm) 67 70 69 72 68 70 75 99 101 98 93 88 107 65
Total Solids (ppm) 22 26 23 25 24 27 23 29 27 27 24 22 25 22
Total Alkalinity
(mg/l) 31 35 38 41 40 39 38 55 51 52 53 54 53 42
Total Hardness
(mg/l)
51
57
56
58
59
60 58
85
83
81
80
83
86 87
Calcium Hardness
(mg/l) 35 31 32 34 33 39 41 47 44 42 41 45 50 32
Chloride (mg/l) 40 42 41 44 45 44 41 49 51 50 52 55 48 46
Nitrate (mg/l) 0.86 0.83 0.82 0.73 0.66 0.45 0.75 0.38 1.26 0.93 1.12 1.01 1.25 0.48
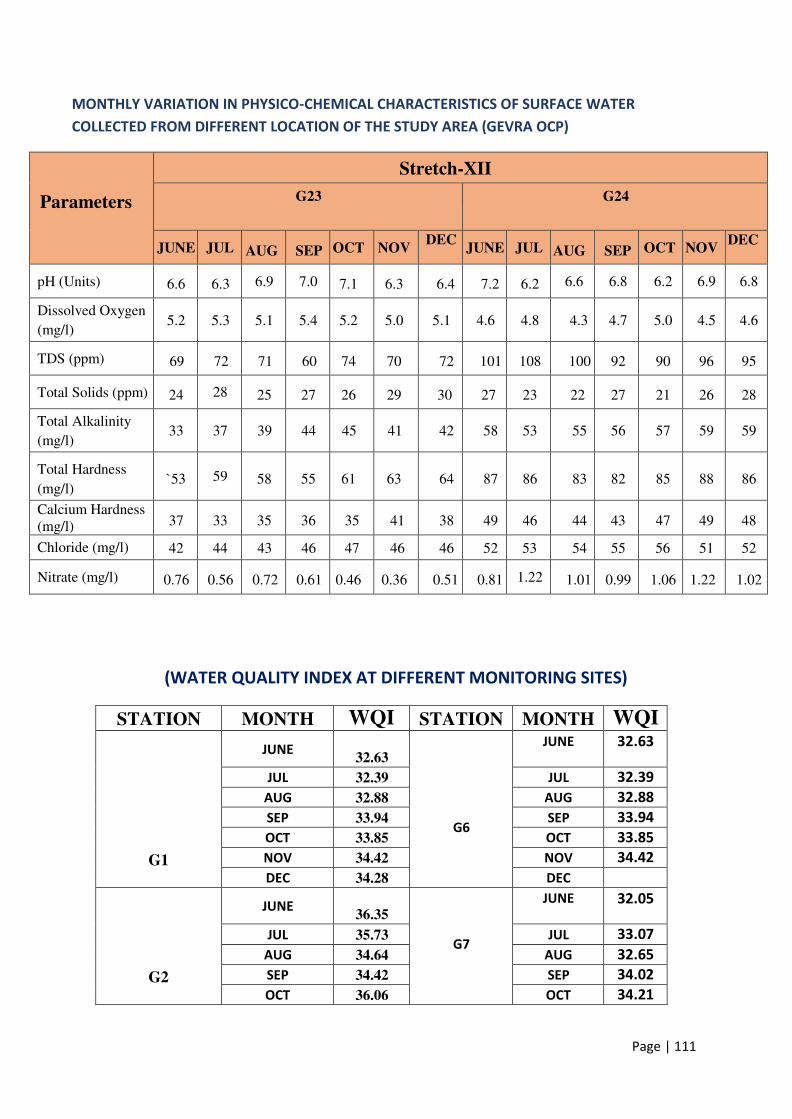
Page | 111
MONTHLY VARIATION IN PHYSICO-CHEMICAL CHARACTERISTICS OF SURFACE WATER
COLLECTED FROM DIFFERENT LOCATION OF THE STUDY AREA (GEVRA OCP)
Parameters
Stretch-XII
G23 G24
JUNE JUL AUG SEP OCT NOV DEC
JUNE JUL AUG SEP OCT NOV DEC
pH (Units) 6.6 6.3 6.9 7.0 7.1 6.3 6.4 7.2 6.2 6.6 6.8 6.2 6.9 6.8
Dissolved Oxygen
(mg/l) 5.2 5.3 5.1 5.4 5.2 5.0 5.1 4.6 4.8 4.3 4.7 5.0 4.5 4.6
TDS (ppm) 69 72 71 60 74 70 72 101 108 100 92 90 96 95
Total Solids (ppm) 24 28 25 27 26 29 30 27 23 22 27 21 26 28
Total Alkalinity
(mg/l) 33 37 39 44 45 41 42 58 53 55 56 57 59 59
Total Hardness
(mg/l)
`53
59
58
55
61
63
64
87
86
83
82
85
88
86
Calcium Hardness
(mg/l) 37 33 35 36 35 41 38 49 46 44 43 47 49 48
Chloride (mg/l) 42 44 43 46 47 46 46 52 53 54 55 56 51 52
Nitrate (mg/l) 0.76 0.56 0.72 0.61 0.46 0.36 0.51 0.81 1.22 1.01 0.99 1.06 1.22 1.02
(WATER QUALITY INDEX AT DIFFERENT MONITORING SITES)
STATION MONTH WQI STATION MONTH WQI
G1
JUNE
32.63
G6
JUNE 32.63
JUL 32.39 JUL 32.39
AUG 32.88 AUG 32.88
SEP 33.94 SEP 33.94
OCT 33.85 OCT 33.85
NOV 34.42 NOV 34.42
DEC 34.28 DEC
G2
JUNE
36.35
G7
JUNE 32.05
JUL 35.73 JUL 33.07
AUG 34.64 AUG 32.65
SEP 34.42 SEP 34.02
OCT 36.06 OCT 34.21
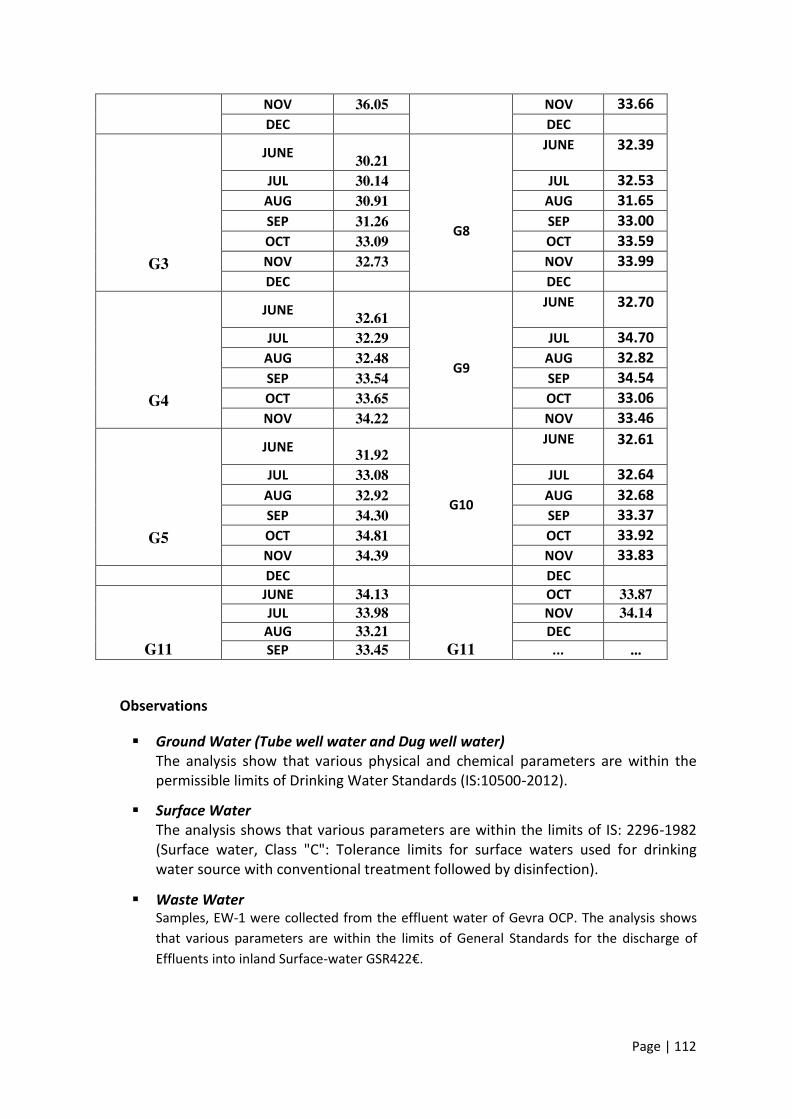
Page | 112
NOV 36.05 NOV 33.66
DEC DEC
G3
JUNE
30.21
G8
JUNE 32.39
JUL 30.14 JUL 32.53
AUG 30.91 AUG 31.65
SEP 31.26 SEP 33.00
OCT 33.09 OCT 33.59
NOV 32.73 NOV 33.99
DEC DEC
G4
JUNE
32.61
G9
JUNE 32.70
JUL 32.29 JUL 34.70
AUG 32.48 AUG 32.82
SEP 33.54 SEP 34.54
OCT 33.65 OCT 33.06
NOV 34.22 NOV 33.46
G5
JUNE
31.92
G10
JUNE 32.61
JUL 33.08 JUL 32.64
AUG 32.92 AUG 32.68
SEP 34.30 SEP 33.37
OCT 34.81 OCT 33.92
NOV 34.39 NOV 33.83 DEC DEC
G11
JUNE 34.13
G11
OCT 33.87
JUL 33.98 NOV 34.14
AUG 33.21 DEC
SEP 33.45 ... ...
Observations
Ground Water (Tube well water and Dug well water)
The analysis show that various physical and chemical parameters are within the
permissible limits of Drinking Water Standards (IS:10500-2012).
Surface Water
The analysis shows that various parameters are within the limits of IS: 2296-1982
(Surface water, Class "C": Tolerance limits for surface waters used for drinking
water source with conventional treatment followed by disinfection).
Waste Water
Samples, EW-1 were collected from the effluent water of Gevra OCP. The analysis shows
that various parameters are within the limits of General Standards for the discharge of
Effluents into inland Surface- ate G“‘ €.
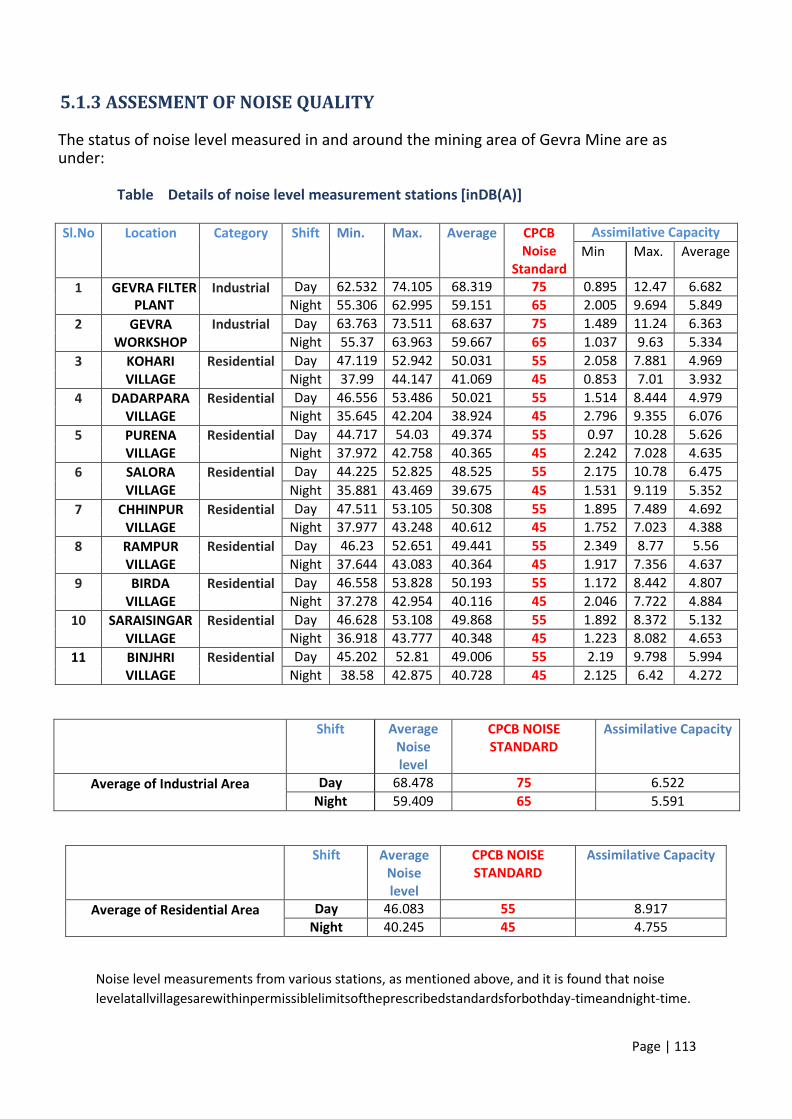
Page | 113
5.1.3 ASSESMENT OF NOISE QUALITY
The status of noise level measured in and around the mining area of Gevra Mine are as under:
Table Details of noise level measurement stations [inDB(A)]
Sl.No Location Category Shift Min. Max. Average CPCB
Noise
Standard
Assimilative Capacity
Min Max. Average
1 GEVRA FILTER
PLANT
Industrial Day 62.532 74.105 68.319 75 0.895 12.47 6.682
Night 55.306 62.995 59.151 65 2.005 9.694 5.849
2 GEVRA
WORKSHOP
Industrial Day 63.763 73.511 68.637 75 1.489 11.24 6.363
Night 55.37 63.963 59.667 65 1.037 9.63 5.334
3 KOHARI
VILLAGE
Residential Day 47.119 52.942 50.031 55 2.058 7.881 4.969
Night 37.99 44.147 41.069 45 0.853 7.01 3.932
4 DADARPARA
VILLAGE
Residential Day 46.556 53.486 50.021 55 1.514 8.444 4.979
Night 35.645 42.204 38.924 45 2.796 9.355 6.076
5 PURENA
VILLAGE
Residential Day 44.717 54.03 49.374 55 0.97 10.28 5.626
Night 37.972 42.758 40.365 45 2.242 7.028 4.635
6 SALORA
VILLAGE
Residential Day 44.225 52.825 48.525 55 2.175 10.78 6.475
Night 35.881 43.469 39.675 45 1.531 9.119 5.352
7 CHHINPUR
VILLAGE
Residential Day 47.511 53.105 50.308 55 1.895 7.489 4.692
Night 37.977 43.248 40.612 45 1.752 7.023 4.388
8 RAMPUR
VILLAGE
Residential Day 46.23 52.651 49.441 55 2.349 8.77 5.56
Night 37.644 43.083 40.364 45 1.917 7.356 4.637
9 BIRDA
VILLAGE
Residential Day 46.558 53.828 50.193 55 1.172 8.442 4.807
Night 37.278 42.954 40.116 45 2.046 7.722 4.884
10 SARAISINGAR
VILLAGE
Residential Day 46.628 53.108 49.868 55 1.892 8.372 5.132
Night 36.918 43.777 40.348 45 1.223 8.082 4.653
11 BINJHRI
VILLAGE
Residential Day 45.202 52.81 49.006 55 2.19 9.798 5.994
Night 38.58 42.875 40.728 45 2.125 6.42 4.272
Shift Average
Noise
level
CPCB NOISE
STANDARD
Assimilative Capacity
Average of Industrial Area Day 68.478 75 6.522
Night 59.409 65 5.591
Shift Average
Noise
level
CPCB NOISE
STANDARD
Assimilative Capacity
Average of Residential Area Day 46.083 55 8.917
Night 40.245 45 4.755
Noise level measurements from various stations, as mentioned above, and it is found that noise
levelatallvillagesarewithinpermissiblelimitsoftheprescribedstandardsforbothday-timeandnight-time.

Page | 114
5.2 ENVIRONMENTAL QUALITYMONITORING IN DIPKA OCP
Micro Meteorological Condition
A micrometeorological station has been installed for the study period from May 2019 to Nov 2019.
The predominant wind direction has been observed from NW to N. The average wind speed was
1.30 m/s, and 29.26% calm conditions prevailed in the study area.
FIGURE: WIND-ROSE DIAGRAM SHOWING PREDOMINANT WIND DIRECTION
The lo atio s fo ai sa pli g e e sele ted o the asis of joi t site su e , e -
a i atio of topo sheet of the p oje t a ea , se o da i o eteo ologi al data a al sis , histo i al i d di e tio patte a d a aila ilit of esou es fo a ie t ai quality monitoring and noise level monitoring.
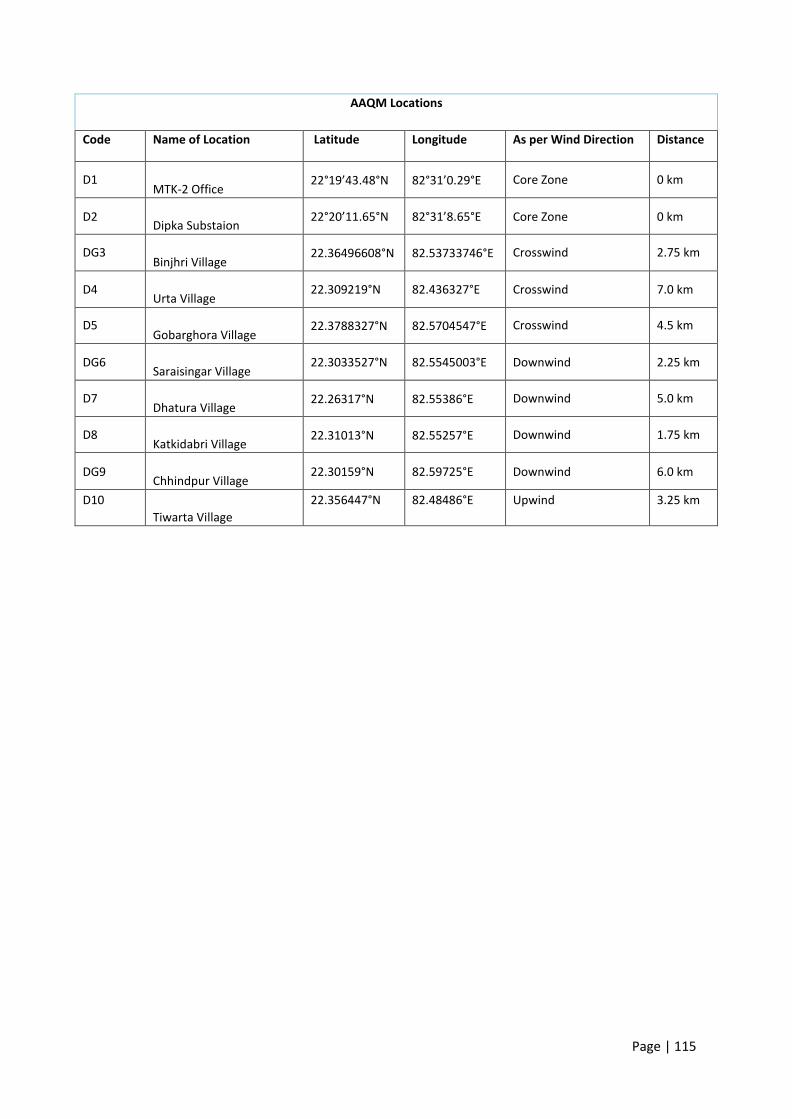
Page | 115
AAQM Locations
Code Name of Location Latitude Longitude As per Wind Direction Distance
D1
MTK-2 Office ° . °N ° . °E Core Zone 0 km
D2
Dipka Substaion ° . °N ° . °E Core Zone 0 km
DG3
Binjhri Village 22.36496608°N 82.53733746°E Crosswind 2.75 km
D4
Urta Village 22.309219°N 82.436327°E Crosswind 7.0 km
D5
Gobarghora Village 22.3788327°N 82.5704547°E Crosswind 4.5 km
DG6
Saraisingar Village 22.3033527°N 82.5545003°E Downwind 2.25 km
D7
Dhatura Village 22.26317°N 82.55386°E Downwind 5.0 km
D8
Katkidabri Village 22.31013°N 82.55257°E Downwind 1.75 km
DG9
Chhindpur Village 22.30159°N 82.59725°E Downwind 6.0 km
D10 Tiwarta Village
22.356447°N 82.48486°E Upwind 3.25 km

Page | 116
5.2.1 ASSESSMENT OF AIR QUALITY
Name of
Location (D1)
D1- MTK-2 OFFICE
Sr. No.
Date of Sampling
SPM
PM10
PM2.5
SO2
NOx
DAILY
EXCAVATED
QUANTITY
Unit µg/m3 µg/m3
µg/m3 µg/m3
µg/m3 (1000,m^3)
GSR 742 (E) 600 300 - 120 120 -
1. 22.05.2019 256.7 140.6 47.3 32.1 28.7 79.117
2. 26.05.2019 389.7 196.7 52.3 33.4 29.2 94.669
3. 29.05.2019 276.3 169.8 54.6 29.3 27.1 88.407
4. 02.06.2019 299 180.4 65.4 32.6 30.1 78.79
5. 05.06.2019 294.3 163.7 56.8 36.4 24.8 89.613
6. 09.06.2019 251.9 165.3 52.4 29.1 26.8 100.392
7. 12.06.2019 264.8 160.4 49.8 32.8 26.9 89.316
8. 15.09.2019 265.9 139.8 54.9 35.4 28.3 115.582
9. 19.09.2019 285.9 168.2 54.8 36.7 26.7 123.259
10. 22.09.2019 412.4 209.7 68.7 28.2 31.3 63.301
11. 26.09.2019 309.1 172.4 57.1 33.1 26.8 39.282
12. 29.09.2019 251.8 155.7 51.6 32.5 21.9 4.723
13. 03.10.2019 292.3 152.3 55.2 31.3 30.3 81.187
14. 06.10.2019 310.4 140.4 56.8 27.8 30.4 96.829
15. 10.10.2019 325.4 182.4 55.9 41.3 31.6 117.264
16. 13.10.2019 284.9 159.4 51.7 32.5 32.5 103.339
17. 17.10.2019 256.4 142.8 52.3 28.1 28.2 115.878
18. 20.10.2019 273.8 146.8 48.9 36.3 32.8 78.522
19. 24.10.2019 264.7 138.6 55.4 31.7 29.5 95.79
20. 27.10.2019 230.4 137.8 54.9 31.5 30.1 105.834
21 31.10.2019 315.4 158.6 53.8 32.6 29.2 116.276
22. 03.11.2019 276.8 161.8 52.7 31.4 29.8 113.916
23. 07.11.2019 342.1 189.7 59.7 31.5 27.1 119.409
24. 10.11.2019 295.3 169.4 57.3 35.9 25.2 135.052
25. 14.11.2019 396.3 207.6 67.8 32.5 26.7 129.016
26. 17.11.2019 261.3 143.8 47.2 19.8 13.5 132.91
27. 21.11.2019 305.6 172.9 55.8 26.5 23.6 129.111
28. 24.11.2019 289.6 158.3 53.4 28.8 19.5 137.316
29. 28.11.2019 276.8 169.8 53.9 31.4 20.5 148.375
30. 01.12.2019 312.8 183.4 56.1 42 23 147.776
31. 05.12.2019 319.7 187.3 54.6 41.2 30.8 134.137
32. 08.12.2019 276.8 155.8 46.8 39.2 28 158.236
33. 12.12.2019 309.8 179.3 52.7 35.5 21.5 159.924
34. 15.12.2019 397.8 198.3 61.3 39.9 27.6 164.885
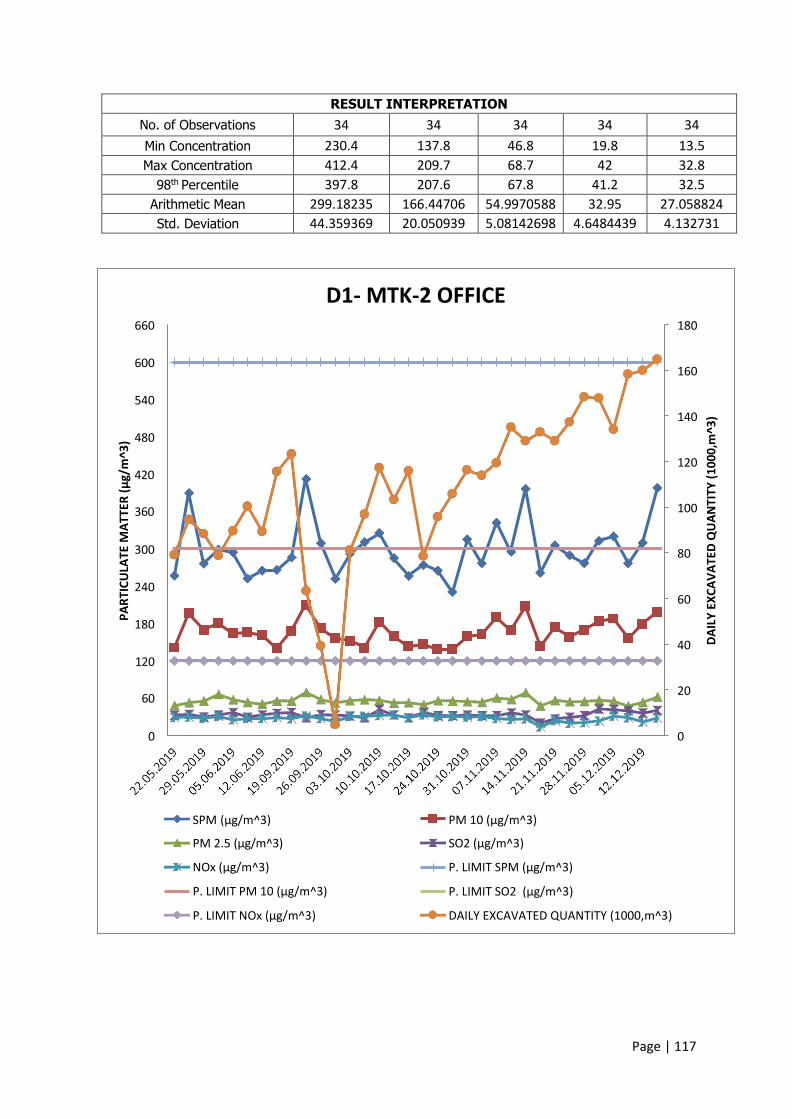
Page | 117
RESULT INTERPRETATION
No. of Observations 34 34 34 34 34
Min Concentration 230.4 137.8 46.8 19.8 13.5
Max Concentration 412.4 209.7 68.7 42 32.8
98th Percentile 397.8 207.6 67.8 41.2 32.5
Arithmetic Mean 299.18235 166.44706 54.9970588 32.95 27.058824
Std. Deviation 44.359369 20.050939 5.08142698 4.6484439 4.132731
D1- MTK-2 OFFICE 660 180
600 160
540
140
480
120 420
360 100
300 80
240 60
180
40
120
60
20
0 0
SPM μg/ ^
PM 2.5 μg/ ^
NOx μg/ ^
P. LIMIT PM μg/ ^
P. LIMIT NO μg/ ^
PM μg/ ^
“O μg/ ^
P. LIMIT SPM μg/ ^
P. LIMIT SO2 μg/ ^
DAILY EXCAVATED QUANTITY (1000,m^3)
PART
ICUL
ATE
MAT
TER
μg/m
^3
DA
ILY
EX
CA
VA
TE
D Q
UA
NT
ITY
(1
00
0,m
^3
)

Page | 118
Name of Location
(D2)
D-2 DIPKA SUBSTATION
Sr. No.
Date of
Sampling
SPM
PM10
PM2.5
SO2
NOx
DAILY
EXCAVATED
QUANTITY
Unit µg/m3 µg/m3
µg/m3 µg/m3
µg/m3 (1000,m^3)
GSR 742 (E) 600 300 - 120 120 -
1. 22.05.2019 352.1 172.1 56.7 28.3 17.3 79.117
2. 26.05.2019 276.1 166.4 53.1 23.8 21.6 94.669
3. 29.05.2019 259.3 148.3 47.3 21.4 17.4 88.407
4. 02.06.2019 282.3 145.3 51.3 24.5 15.9 78.79
5. 05.06.2019 267.3 149.6 48.3 28.5 23.1 89.613
6. 09.06.2019 271.6 164.8 53.9 26.3 21.5 100.392
7. 12.06.2019 285.1 169.2 56.4 20.5 16.5 89.316
8. 15.09.2019 312.4 159.3 49.8 18.2 13.8 115.582
9. 19.09.2019 238.2 156.9 52.7 19.5 12.5 123.259
10. 22.09.2019 273.8 153.4 53.4 18.7 16.5 63.301
11. 26.09.2019 264.9 166.7 56.8 27.3 19.7 39.282
12. 29.09.2019 418.7 206.7 63.4 20.1 16.5 4.723
13. 03.10.2019 356.1 189.7 58.6 26.5 20.1 81.187
14. 06.10.2019 282.6 146.9 48.7 23.4 19.2 96.829
15. 10.10.2019 264.8 167.3 53.1 20.1 13.5 117.264
16. 13.10.2019 316.9 173.2 52.9 31.5 16.4 103.339
17. 17.10.2019 253.4 138.4 43.2 30.5 22.6 115.878
18. 20.10.2019 379.6 186.3 59.3 21.4 21.8 78.522
19. 24.10.2019 268.4 168.9 53.4 27.1 20.4 95.79
20. 27.10.2019 279.6 183.6 54.8 27.4 26.5 105.834
21 31.10.2019 267.3 172.9 53.6 21.6 18.5 116.276
22. 03.11.2019 253.6 168.7 48.6 24.3 12.4 113.916
23. 07.11.2019 282.3 157.8 53.4 20.4 18.3 119.409
24. 10.11.2019 265.3 153.6 48.7 28.4 22.3 135.052
25. 14.11.2019 345.2 182.4 62.1 27.3 21.4 129.016
26. 17.11.2019 298.7 156.9 50.7 31.8 26.7 132.91
27. 21.11.2019 286.4 153.4 50.7 37 21.8 129.111
28. 24.11.2019 293.4 165.4 52.8 34.2 22.4 137.316
29. 28.11.2019 391.2 199.4 62.8 44.8 23.7 148.375
30. 01.12.2019 289.7 169.4 52.3 32.5 20.4 147.776
31. 05.12.2019 330.4 172.1 56.1 43.2 24.6 134.137
32. 08.12.2019 321.6 163.4 55.7 33.7 33.8 158.236
33. 12.12.2019 325.6 158.2 51.9 32.6 27.9 159.924
34. 15.12.2019 305.6 153.4 53.4 29.7 21.5 164.885
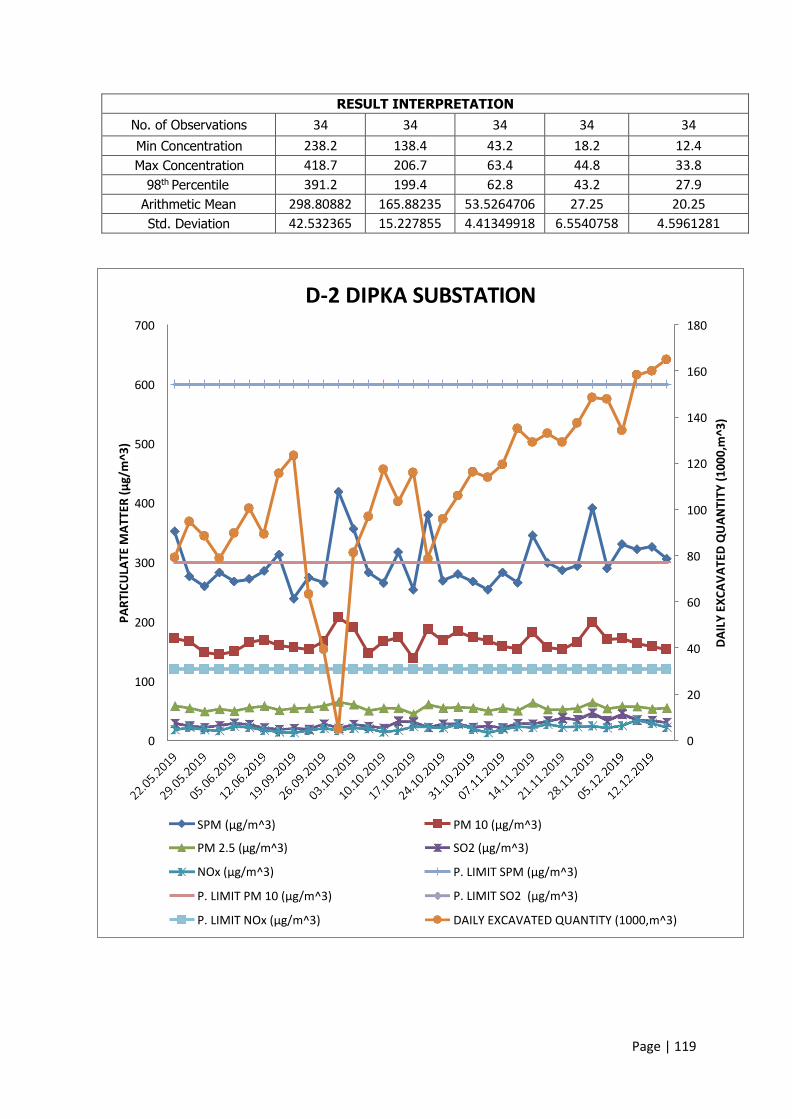
Page | 119
RESULT INTERPRETATION
No. of Observations 34 34 34 34 34
Min Concentration 238.2 138.4 43.2 18.2 12.4
Max Concentration 418.7 206.7 63.4 44.8 33.8
98th Percentile 391.2 199.4 62.8 43.2 27.9
Arithmetic Mean 298.80882 165.88235 53.5264706 27.25 20.25
Std. Deviation 42.532365 15.227855 4.41349918 6.5540758 4.5961281
D-2 DIPKA SUBSTATION 700 180
160 600
140
500
120
400 100
300 80
60
200
40
100 20
0 0
SPM μg/ ^
PM 2.5 μg/ ^
NOx μg/ ^
P. LIMIT PM μg/ ^
P. LIMIT NO μg/ ^
PM μg/ ^
“O μg/ ^
P. LIMIT SPM μg/ ^
P. LIMIT SO2 μg/ ^
DAILY EXCAVATED QUANTITY (1000,m^3)
PART
ICUL
ATE
MAT
TER
μg/m
^3
DA
ILY
EX
CA
VA
TE
D Q
UA
NT
ITY
(1
00
0,m
^3
)
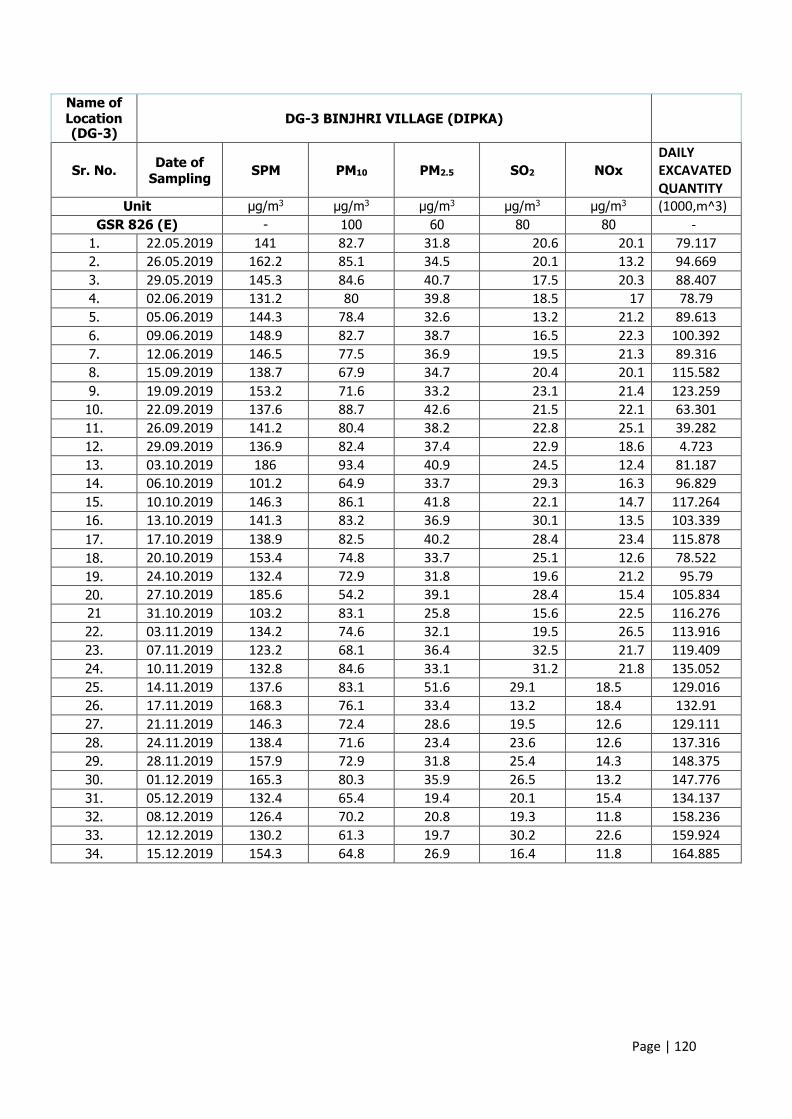
Page | 120
Name of Location (DG-3)
DG-3 BINJHRI VILLAGE (DIPKA)
Sr. No.
Date of
Sampling
SPM
PM10
PM2.5
SO2
NOx
DAILY
EXCAVATED
QUANTITY
Unit µg/m3 µg/m3
µg/m3 µg/m3
µg/m3 (1000,m^3)
GSR 826 (E) - 100 60 80 80 -
1. 22.05.2019 141 82.7 31.8 20.6 20.1 79.117
2. 26.05.2019 162.2 85.1 34.5 20.1 13.2 94.669
3. 29.05.2019 145.3 84.6 40.7 17.5 20.3 88.407
4. 02.06.2019 131.2 80 39.8 18.5 17 78.79
5. 05.06.2019 144.3 78.4 32.6 13.2 21.2 89.613
6. 09.06.2019 148.9 82.7 38.7 16.5 22.3 100.392
7. 12.06.2019 146.5 77.5 36.9 19.5 21.3 89.316
8. 15.09.2019 138.7 67.9 34.7 20.4 20.1 115.582
9. 19.09.2019 153.2 71.6 33.2 23.1 21.4 123.259
10. 22.09.2019 137.6 88.7 42.6 21.5 22.1 63.301
11. 26.09.2019 141.2 80.4 38.2 22.8 25.1 39.282
12. 29.09.2019 136.9 82.4 37.4 22.9 18.6 4.723
13. 03.10.2019 186 93.4 40.9 24.5 12.4 81.187
14. 06.10.2019 101.2 64.9 33.7 29.3 16.3 96.829
15. 10.10.2019 146.3 86.1 41.8 22.1 14.7 117.264
16. 13.10.2019 141.3 83.2 36.9 30.1 13.5 103.339
17. 17.10.2019 138.9 82.5 40.2 28.4 23.4 115.878
18. 20.10.2019 153.4 74.8 33.7 25.1 12.6 78.522
19. 24.10.2019 132.4 72.9 31.8 19.6 21.2 95.79
20. 27.10.2019 185.6 54.2 39.1 28.4 15.4 105.834
21 31.10.2019 103.2 83.1 25.8 15.6 22.5 116.276
22. 03.11.2019 134.2 74.6 32.1 19.5 26.5 113.916
23. 07.11.2019 123.2 68.1 36.4 32.5 21.7 119.409
24. 10.11.2019 132.8 84.6 33.1 31.2 21.8 135.052
25. 14.11.2019 137.6 83.1 51.6 29.1 18.5 129.016
26. 17.11.2019 168.3 76.1 33.4 13.2 18.4 132.91
27. 21.11.2019 146.3 72.4 28.6 19.5 12.6 129.111
28. 24.11.2019 138.4 71.6 23.4 23.6 12.6 137.316
29. 28.11.2019 157.9 72.9 31.8 25.4 14.3 148.375
30. 01.12.2019 165.3 80.3 35.9 26.5 13.2 147.776
31. 05.12.2019 132.4 65.4 19.4 20.1 15.4 134.137
32. 08.12.2019 126.4 70.2 20.8 19.3 11.8 158.236
33. 12.12.2019 130.2 61.3 19.7 30.2 22.6 159.924
34. 15.12.2019 154.3 64.8 26.9 16.4 11.8 164.885
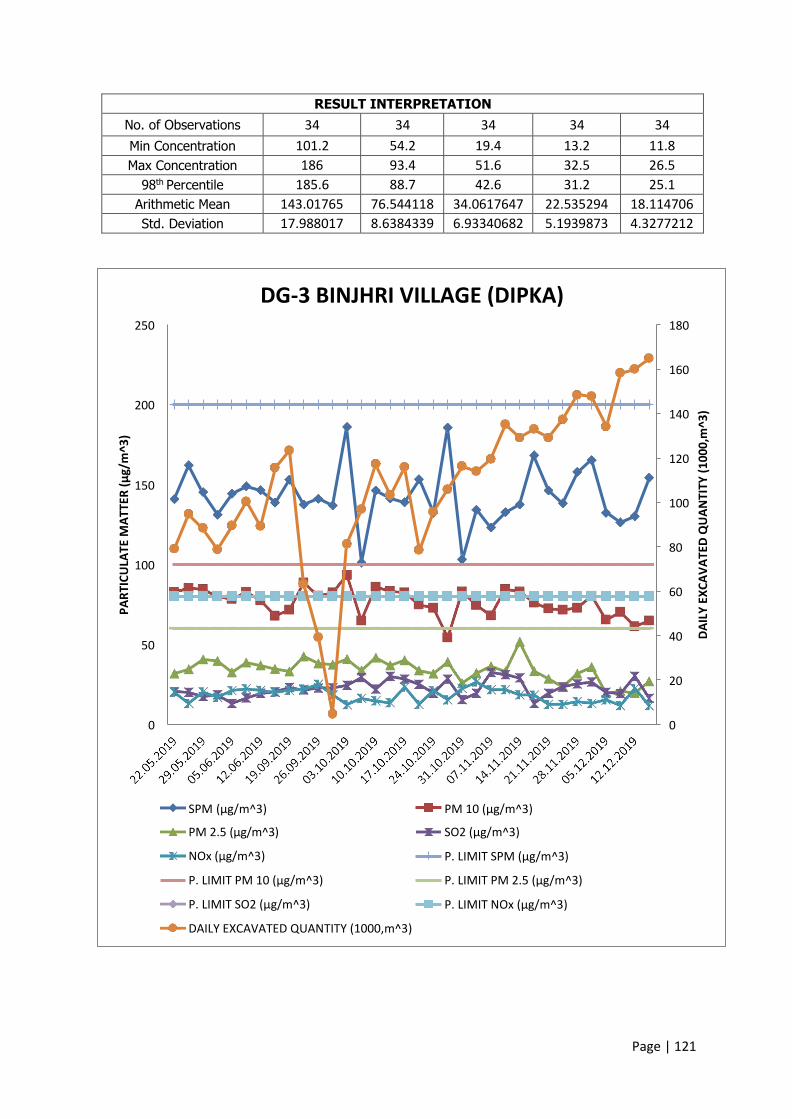
Page | 121
RESULT INTERPRETATION
No. of Observations 34 34 34 34 34
Min Concentration 101.2 54.2 19.4 13.2 11.8
Max Concentration 186 93.4 51.6 32.5 26.5
98th Percentile 185.6 88.7 42.6 31.2 25.1
Arithmetic Mean 143.01765 76.544118 34.0617647 22.535294 18.114706
Std. Deviation 17.988017 8.6384339 6.93340682 5.1939873 4.3277212
DG-3 BINJHRI VILLAGE (DIPKA) 250 180
160
200 140
120
150
100
80
100
60
50 40
20
0 0
SPM μg/ ^
PM 2.5 μg/ ^
NOx μg/ ^
P. LIMIT PM μg/ ^
P. LIMIT “O μg/ ^
DAILY EXCAVATED QUANTITY (1000,m^3)
PM μg/ ^
“O μg/ ^
P. LIMIT “PM μg/ ^
P. LIMIT PM 2.5 μg/ ^
P. LIMIT NO μg/ ^
PART
ICUL
ATE
MAT
TER
μg/m
^3
DA
ILY
EX
CA
VA
TE
D Q
UA
NT
ITY
(1
00
0,m
^3
)
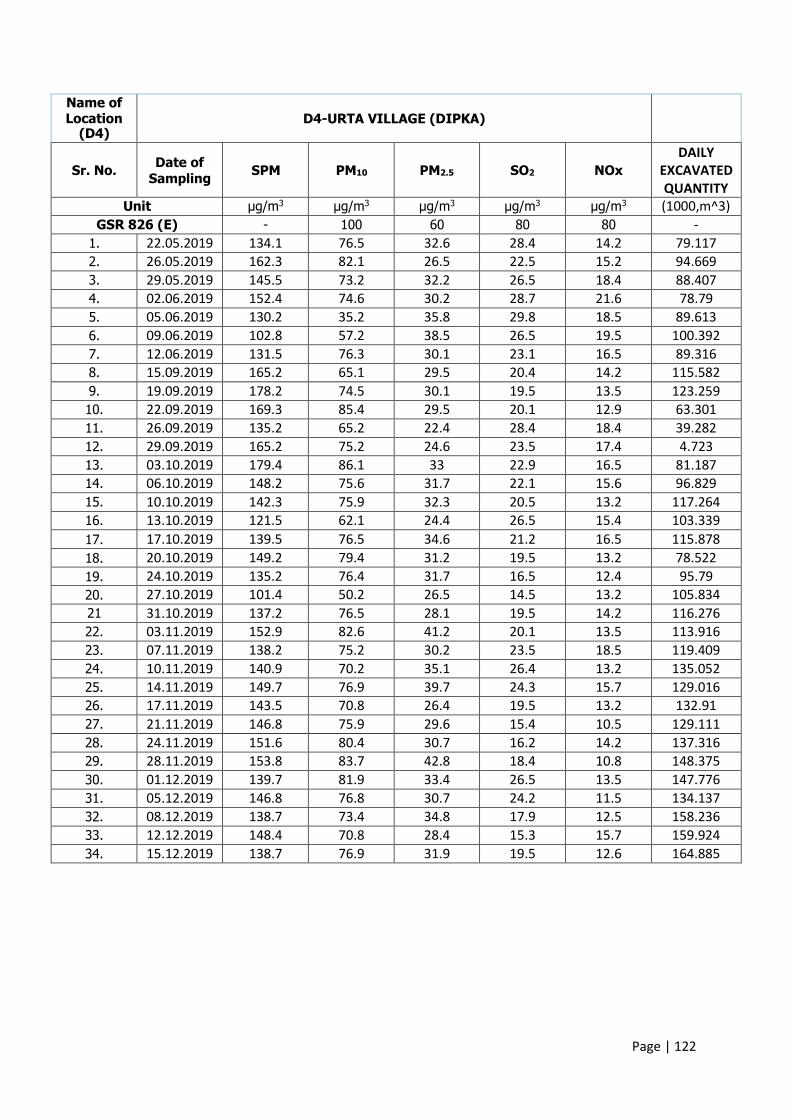
Page | 122
Name of Location
(D4)
D4-URTA VILLAGE (DIPKA)
Sr. No.
Date of
Sampling
SPM
PM10
PM2.5
SO2
NOx
DAILY
EXCAVATED
QUANTITY
Unit µg/m3 µg/m3
µg/m3 µg/m3
µg/m3 (1000,m^3)
GSR 826 (E) - 100 60 80 80 -
1. 22.05.2019 134.1 76.5 32.6 28.4 14.2 79.117
2. 26.05.2019 162.3 82.1 26.5 22.5 15.2 94.669
3. 29.05.2019 145.5 73.2 32.2 26.5 18.4 88.407
4. 02.06.2019 152.4 74.6 30.2 28.7 21.6 78.79
5. 05.06.2019 130.2 35.2 35.8 29.8 18.5 89.613
6. 09.06.2019 102.8 57.2 38.5 26.5 19.5 100.392
7. 12.06.2019 131.5 76.3 30.1 23.1 16.5 89.316
8. 15.09.2019 165.2 65.1 29.5 20.4 14.2 115.582
9. 19.09.2019 178.2 74.5 30.1 19.5 13.5 123.259
10. 22.09.2019 169.3 85.4 29.5 20.1 12.9 63.301
11. 26.09.2019 135.2 65.2 22.4 28.4 18.4 39.282
12. 29.09.2019 165.2 75.2 24.6 23.5 17.4 4.723
13. 03.10.2019 179.4 86.1 33 22.9 16.5 81.187
14. 06.10.2019 148.2 75.6 31.7 22.1 15.6 96.829
15. 10.10.2019 142.3 75.9 32.3 20.5 13.2 117.264
16. 13.10.2019 121.5 62.1 24.4 26.5 15.4 103.339
17. 17.10.2019 139.5 76.5 34.6 21.2 16.5 115.878
18. 20.10.2019 149.2 79.4 31.2 19.5 13.2 78.522
19. 24.10.2019 135.2 76.4 31.7 16.5 12.4 95.79
20. 27.10.2019 101.4 50.2 26.5 14.5 13.2 105.834
21 31.10.2019 137.2 76.5 28.1 19.5 14.2 116.276
22. 03.11.2019 152.9 82.6 41.2 20.1 13.5 113.916
23. 07.11.2019 138.2 75.2 30.2 23.5 18.5 119.409
24. 10.11.2019 140.9 70.2 35.1 26.4 13.2 135.052
25. 14.11.2019 149.7 76.9 39.7 24.3 15.7 129.016
26. 17.11.2019 143.5 70.8 26.4 19.5 13.2 132.91
27. 21.11.2019 146.8 75.9 29.6 15.4 10.5 129.111
28. 24.11.2019 151.6 80.4 30.7 16.2 14.2 137.316
29. 28.11.2019 153.8 83.7 42.8 18.4 10.8 148.375
30. 01.12.2019 139.7 81.9 33.4 26.5 13.5 147.776
31. 05.12.2019 146.8 76.8 30.7 24.2 11.5 134.137
32. 08.12.2019 138.7 73.4 34.8 17.9 12.5 158.236
33. 12.12.2019 148.4 70.8 28.4 15.3 15.7 159.924
34. 15.12.2019 138.7 76.9 31.9 19.5 12.6 164.885
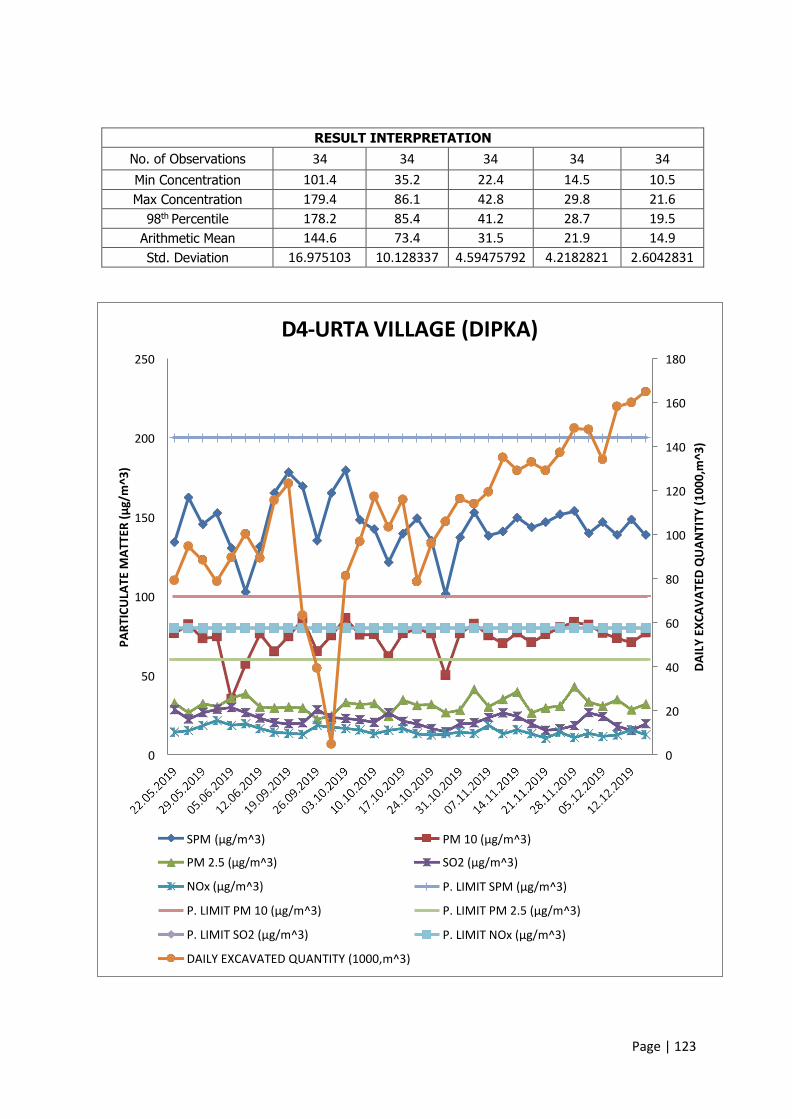
Page | 123
RESULT INTERPRETATION
No. of Observations 34 34 34 34 34
Min Concentration 101.4 35.2 22.4 14.5 10.5
Max Concentration 179.4 86.1 42.8 29.8 21.6
98th Percentile 178.2 85.4 41.2 28.7 19.5
Arithmetic Mean 144.6 73.4 31.5 21.9 14.9
Std. Deviation 16.975103 10.128337 4.59475792 4.2182821 2.6042831
D4-URTA VILLAGE (DIPKA) 250 180
160
200 140
120
150
100
80
100
60
50 40
20
0 0
SPM μg/ ^
PM 2.5 μg/ ^
NOx μg/ ^
P. LIMIT PM μg/ ^
P. LIMIT “O μg/ ^
DAILY EXCAVATED QUANTITY (1000,m^3)
PM μg/ ^
“O μg/ ^
P. LIMIT “PM μg/ ^
P. LIMIT PM . μg/ ^
P. LIMIT NO μg/ ^
PART
ICUL
ATE
MAT
TER
μg/m
^3
DA
ILY
EX
CA
VA
TE
D Q
UA
NT
ITY
(1
00
0,m
^3
)

Page | 124
Name of Location
(D5)
D5-GOBARAGHORA VILLAGE (DIPKA)
Sr. No.
Date of Sampling
SPM
PM10
PM2.5
SO2
NOx
DAILY
EXCAVATED
QUANTITY
Unit µg/m3 µg/m3
µg/m3 µg/m3
µg/m3 (1000,m^3)
GSR 826 (E) - 100 60 80 80 -
1. 22.05.2019 147.3 65.2 34.9 23.1 15.2 79.117
2. 26.05.2019 133.6 67.3 30.8 26.4 16.9 94.669
3. 29.05.2019 150.7 62.4 25.9 29.7 23.8 88.407
4. 02.06.2019 163.4 64.1 29.8 21.5 19.7 78.79
5. 05.06.2019 183.9 78.1 34.9 29.8 13.4 89.613
6. 09.06.2019 156.7 79.6 35.8 31.6 12.9 100.392
7. 12.06.2019 144.8 68.4 29.4 26.4 19.7 89.316
8. 15.09.2019 154.2 72.9 38.4 20.8 13.5 115.582
9. 19.09.2019 131.5 63.5 36.2 26.8 16.8 123.259
10. 22.09.2019 150.7 68.4 34.9 17.7 11.6 63.301
11. 26.09.2019 142.6 76.9 42.8 19.6 11.3 39.282
12. 29.09.2019 140.9 62.4 40.7 38.4 21.6 4.723
13. 03.10.2019 139.4 69.8 28.3 33.4 18.4 81.187
14. 06.10.2019 134.6 64.9 36.2 19.8 14.6 96.829
15. 10.10.2019 141.5 67.9 31.6 25.4 13.9 117.264
16. 13.10.2019 164.7 75.8 35.4 21.1 16.7 103.339
17. 17.10.2019 143.8 70.9 41.2 22.8 12.5 115.878
18. 20.10.2019 141.3 73.4 36.1 18.5 15.6 78.522
19. 24.10.2019 139.5 81.3 31.8 16.9 10.9 95.79
20. 27.10.2019 144.2 76.9 29.5 18.4 12.4 105.834
21 31.10.2019 153.9 78.3 43.9 21.9 13.8 116.276
22. 03.11.2019 139.4 74.3 37.2 21.9 16.7 113.916
23. 07.11.2019 168.7 81.9 38.4 23.1 15.9 119.409
24. 10.11.2019 143.9 77.6 35.1 21.5 12.8 135.052
25. 14.11.2019 165.8 82.3 41.9 22.4 12.6 129.016
26. 17.11.2019 140.6 66.9 28.7 21.4 16.5 132.91
27. 21.11.2019 138.2 70.8 26.4 19.5 13.2 129.111
28. 24.11.2019 130.5 75.9 29.6 15.4 10.5 137.316
29. 28.11.2019 144.8 80.4 30.7 16.2 14.2 148.375
30. 01.12.2019 148.6 83.7 42.8 18.4 10.8 147.776
31. 05.12.2019 156.4 81.9 33.4 26.5 13.5 134.137
32. 08.12.2019 160.5 76.8 30.7 24.2 11.5 158.236
33. 12.12.2019 144.9 73.4 34.8 17.9 12.5 159.924
34. 15.12.2019 160.2 70.8 28.4 12.6 8.5 164.885

Page | 125
RESULT INTERPRETATION
No. of Observations 34 34 34 34 34
Min Concentration 130.5 62.4 25.9 12.6 8.5
Max Concentration 183.9 83.7 43.9 38.4 23.8
98th Percentile 168.7 82.3 42.8 33.4 21.6
Arithmetic Mean 148.40294 73.091176 34.3117647 22.676471 14.541176
Std. Deviation 11.891899 6.3905881 4.97860664 5.4558869 3.3400343
D5-GOBARAGHORA VILLAGE (DIPKA) 250 180
160
200 140
120
150
100
80
100
60
50 40
20
0 0
“PM μg/ ^
PM . μg/ ^
NO μg/ ^
P. LIMIT PM μg/ ^
P. LIMIT “O μg/ ^
DAILY EXCAVATED QUANTITY (1000, m^3)
PM μg/ ^
“O μg/ ^
P. LIMIT “PM μg/ ^
P. LIMIT PM . μg/ ^
P. LIMIT NO μg/ ^
PART
ICUL
ATE
MAT
TER
μg/m
^3
DA
ILY
EX
CA
VA
TE
D Q
UA
NT
ITY
(1
00
0,m
^3
)

Page | 126
Name of Location (GD-6)
DG-6 SARAISINGAR VILLAGE (DIPKA)
Sr. No.
Date of
Sampling
SPM
PM10
PM2.5
SO2
NOx
DAILY
EXCAVATED
QUANTITY
Unit µg/m3 µg/m3
µg/m3 µg/m3
µg/m3 (1000,m^3)
GSR 826 (E) - 100 60 80 80 -
1. 24.05.2019 182.3 78.3 40.3 19.8 13.6 99.556
2. 28.05.2019 192.4 82.6 41.9 29.1 15.3 85.248
3. 31.05.2019 151.3 84.3 43.7 25.9 18.4 88.063
4. 04.06.2019 156.2 86.4 44.2 30.1 12.5 99.364
5. 07.06.2019 196.4 80.9 39.2 29.7 22.4 89.043
6. 11.06.2019 176.3 87.3 41.7 18.1 13.8 95.566
7. 14.06.2019 182.9 76.3 36.8 30.1 22.6 96.576
8. 17.09.2019 139.4 80.7 35.9 21.8 16.9 0.876
9. 21.09.2019 168.2 79.1 37.2 26.9 23.5 71.522
10. 24.09.2019 168.3 78.4 34.9 22.5 27.8 19.298
11. 28.09.2019 137.2 73.2 38.4 28.1 22.6 38.895
12. 01.10.2019 170.9 80.9 41.3 22.8 20.4 58.861
13. 05.10.2019 163.4 79.4 33.9 24.3 19.8 96.227
14. 08.10.2019 184.3 78.6 38.7 25.9 21.6 77.584
15. 12.10.2019 158.2 72.5 36.7 26.8 14.9 115.588
16. 15.10.2019 184.9 74.6 36.4 28.7 22.8 92.871
17. 19.10.2019 166.8 76.2 38.2 29.4 19.8 118.7
18. 22.10.2019 198.1 83.4 41.9 26.8 24.3 125.206
19. 26.10.2019 176.9 86.1 41.1 25.1 21.6 121.558
20. 29.10.2019 146.2 80.8 42.7 29 22.8 114.857
21 02.11.2019 188.2 82.9 44.6 27.6 21.6 121.507
22. 05.11.2019 183.9 84.1 40.5 26.3 20.4 117.065
23. 09.11.2019 156.2 85.3 41.8 23.4 23.5 130.186
24. 12.11.2019 140.7 50.8 43.1 26.8 21.6 158.778
26. 16.11.2019 165.2 83.1 33.4 29.5 24.3 138.444
27. 19.11.2019 169.4 80.3 29.5 27.4 21.9 129.359
28. 23.11.2019 154.2 79.4 36.4 23.5 19.5 124.799
29. 26.11.2019 129.6 82.4 39.1 23.5 18.4 147.995
30. 30.11.2019 138.2 81.9 41.8 21.5 16.8 154.932
31. 03.12.2019 150.2 76.3 40.7 29.5 16.5 130.071
32. 07.12.2019 165.2 82.4 36.8 28.6 23.4 149.063
33. 10.12.2019 126.4 80.2 33.1 26.5 21.6 158.605
34. 14.12.2019 150.3 79.6 36.4 23.6 20.1 161.596

Page | 127
RESULT INTERPRETATION
No. of Observations 34 34 34 34 34
Min Concentration 126.4 50.8 29.5 18.1 12.5
Max Concentration 198.1 87.3 44.6 30.1 27.8
98th Percentile 196.4 86.4 44.2 29.7 24.3
Arithmetic Mean 164.19091 79.657576 38.8575758 26.018182 20.212121
Std. Deviation 19.540765 6.3258908 3.60173832 3.152326 3.5592975
DG-6 SARAISINGAR VILLAGE (DIPKA) 250 180
160
200 140
120
150
100
80
100
60
50 40
20
0 0
SPM μg/ ^
PM 2.5 μg/ ^
NOx μg/ ^
P. LIMIT PM μg/ ^
P. LIMIT “O μg/ ^
DAILY EXCAVATED QUANTITY (1000,m^3)
PM μg/ ^
“O μg/ ^
P. LIMIT “PM μg/ ^
P. LIMIT PM . μg/ ^
P. LIMIT NO μg/ ^
PART
ICUL
ATE
MAT
TER
μg/m
^3
DA
ILY
EX
CA
VA
TE
D Q
UA
NT
ITY
(1
00
0,m
^3
)
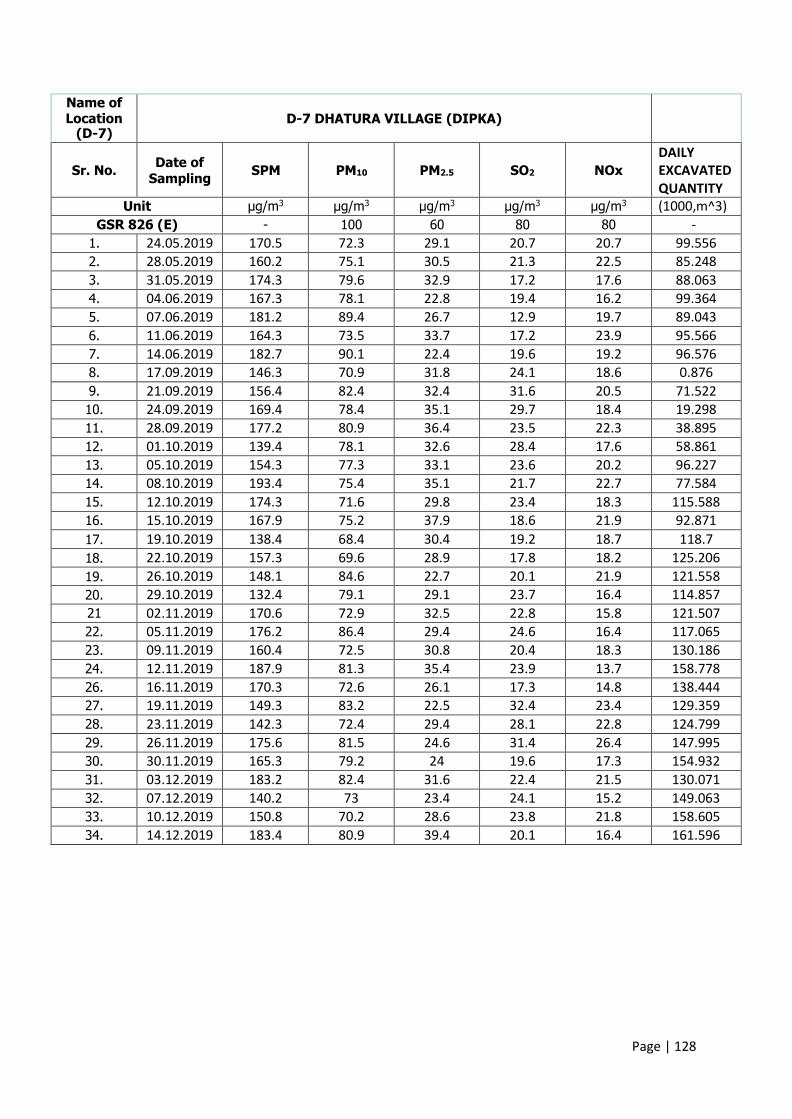
Page | 128
Name of Location
(D-7)
D-7 DHATURA VILLAGE (DIPKA)
Sr. No.
Date of
Sampling
SPM
PM10
PM2.5
SO2
NOx
DAILY
EXCAVATED
QUANTITY
Unit µg/m3 µg/m3
µg/m3 µg/m3
µg/m3 (1000,m^3)
GSR 826 (E) - 100 60 80 80 -
1. 24.05.2019 170.5 72.3 29.1 20.7 20.7 99.556
2. 28.05.2019 160.2 75.1 30.5 21.3 22.5 85.248
3. 31.05.2019 174.3 79.6 32.9 17.2 17.6 88.063
4. 04.06.2019 167.3 78.1 22.8 19.4 16.2 99.364
5. 07.06.2019 181.2 89.4 26.7 12.9 19.7 89.043
6. 11.06.2019 164.3 73.5 33.7 17.2 23.9 95.566
7. 14.06.2019 182.7 90.1 22.4 19.6 19.2 96.576
8. 17.09.2019 146.3 70.9 31.8 24.1 18.6 0.876
9. 21.09.2019 156.4 82.4 32.4 31.6 20.5 71.522
10. 24.09.2019 169.4 78.4 35.1 29.7 18.4 19.298
11. 28.09.2019 177.2 80.9 36.4 23.5 22.3 38.895
12. 01.10.2019 139.4 78.1 32.6 28.4 17.6 58.861
13. 05.10.2019 154.3 77.3 33.1 23.6 20.2 96.227
14. 08.10.2019 193.4 75.4 35.1 21.7 22.7 77.584
15. 12.10.2019 174.3 71.6 29.8 23.4 18.3 115.588
16. 15.10.2019 167.9 75.2 37.9 18.6 21.9 92.871
17. 19.10.2019 138.4 68.4 30.4 19.2 18.7 118.7
18. 22.10.2019 157.3 69.6 28.9 17.8 18.2 125.206
19. 26.10.2019 148.1 84.6 22.7 20.1 21.9 121.558
20. 29.10.2019 132.4 79.1 29.1 23.7 16.4 114.857
21 02.11.2019 170.6 72.9 32.5 22.8 15.8 121.507
22. 05.11.2019 176.2 86.4 29.4 24.6 16.4 117.065
23. 09.11.2019 160.4 72.5 30.8 20.4 18.3 130.186
24. 12.11.2019 187.9 81.3 35.4 23.9 13.7 158.778
26. 16.11.2019 170.3 72.6 26.1 17.3 14.8 138.444
27. 19.11.2019 149.3 83.2 22.5 32.4 23.4 129.359
28. 23.11.2019 142.3 72.4 29.4 28.1 22.8 124.799
29. 26.11.2019 175.6 81.5 24.6 31.4 26.4 147.995
30. 30.11.2019 165.3 79.2 24 19.6 17.3 154.932
31. 03.12.2019 183.2 82.4 31.6 22.4 21.5 130.071
32. 07.12.2019 140.2 73 23.4 24.1 15.2 149.063
33. 10.12.2019 150.8 70.2 28.6 23.8 21.8 158.605
34. 14.12.2019 183.4 80.9 39.4 20.1 16.4 161.596
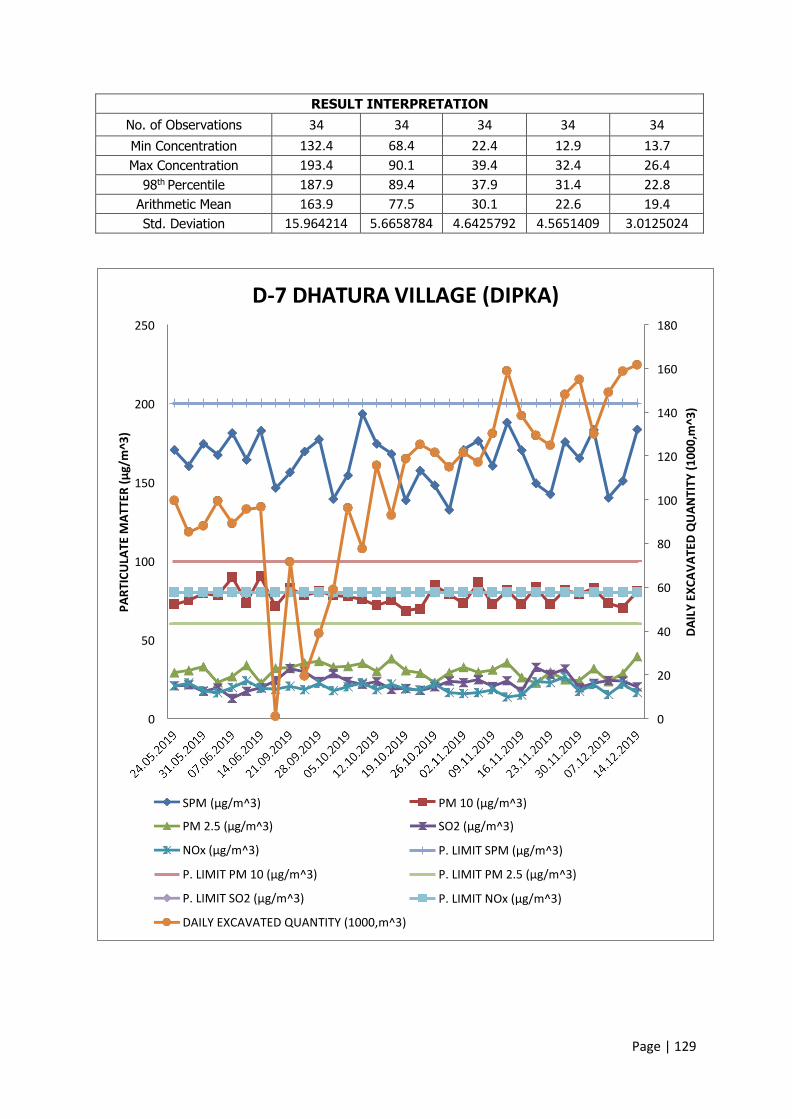
Page | 129
RESULT INTERPRETATION
No. of Observations 34 34 34 34 34
Min Concentration 132.4 68.4 22.4 12.9 13.7
Max Concentration 193.4 90.1 39.4 32.4 26.4
98th Percentile 187.9 89.4 37.9 31.4 22.8
Arithmetic Mean 163.9 77.5 30.1 22.6 19.4
Std. Deviation 15.964214 5.6658784 4.6425792 4.5651409 3.0125024
D-7 DHATURA VILLAGE (DIPKA) 250 180
160
200 140
120
150
100
80
100
60
50 40
20
0 0
SPM μg/ ^
PM 2.5 μg/ ^
NOx μg/ ^
P. LIMIT PM μg/ ^
P. LIMIT “O μg/ ^
DAILY EXCAVATED QUANTITY (1000,m^3)
PM μg/ ^
“O μg/ ^
P. LIMIT “PM μg/ ^
P. LIMIT PM . μg/ ^
P. LIMIT NO μg/ ^
PART
ICUL
ATE
MAT
TER
μg/m
^3
DA
ILY
EX
CA
VA
TE
D Q
UA
NT
ITY
(1
00
0,m
^3
)

Page | 130
Name of Location
(D-8)
D-8 KATKIDABRI VILLAGE (DIPKA)
Sr. No.
Date of
Sampling
SPM
PM10
PM2.5
SO2
NOx
DAILY
EXCAVATED
QUANTITY
Unit µg/m3 µg/m3
µg/m3 µg/m3
µg/m3 (1000,m^3)
GSR 826 (E) - 100 60 80 80 -
1. 24.05.2019 171.3 78.3 29.1 31.2 19.2 99.556
2. 28.05.2019 173.2 86.4 31.2 18.5 11.9 85.248
3. 31.05.2019 162.3 82.4 42.8 20.6 12.4 88.063
4. 04.06.2019 181.9 92.4 46.1 20.1 15.4 99.364
5. 07.06.2019 165.4 69.2 28.1 17.5 11.9 89.043
6. 11.06.2019 172.6 70.2 31.5 18.5 12.6 95.566
7. 14.06.2019 180.9 75.4 29.4 13.2 9.4 96.576
8. 17.09.2019 170.2 86.4 42.3 16.5 10.7 0.876
9. 21.09.2019 176.4 80.1 39.1 19.5 11.6 71.522
10. 24.09.2019 140.3 65.8 27.9 20.4 12.5 19.298
11. 28.09.2019 162.8 70.8 29.1 23.1 13.5 38.895
12. 01.10.2019 160.7 72.9 26.1 21.5 11.7 58.861
13. 05.10.2019 140.7 81.2 44.6 22.9 13.6 96.227
14. 08.10.2019 151.2 67.3 33.1 24.5 19.5 77.584
15. 12.10.2019 156.8 80.2 39.1 29.3 22.1 115.588
16. 15.10.2019 165.4 70.4 30.8 22.1 16.2 92.871
17. 19.10.2019 176.4 75.9 29.4 30.1 11.5 118.7
18. 22.10.2019 160.4 81.2 43.1 28.4 13.4 125.206
19. 26.10.2019 165.8 78.1 31.7 25.1 18.4 121.558
20. 29.10.2019 160.4 72.4 29.4 19.6 11.2 114.857
21 02.11.2019 150.7 75.2 30.6 28.4 13.5 121.507
22. 05.11.2019 162.4 69.4 31.8 15.6 10.5 117.065
23. 09.11.2019 150.4 73.4 28.4 19.5 11.6 130.186
24. 12.11.2019 140.2 78.2 33.4 32.5 20.1 158.778
26. 16.11.2019 145.3 71.2 31.8 30 10.6 138.444
27. 19.11.2019 151.8 63.4 23.7 26.5 15.4 129.359
28. 23.11.2019 167.2 81.2 32.9 18.5 13.5 124.799
29. 26.11.2019 152.3 83.7 31.7 19.8 12.6 147.995
30. 30.11.2019 153.4 81.9 22.6 23.4 10.5 154.932
31. 03.12.2019 142.5 75.6 39.8 18.4 13.8 130.071
32. 07.12.2019 154.3 83.4 41.6 22.5 14.5 149.063
33. 10.12.2019 153.2 74.3 37.8 16.9 16.9 158.605
34. 14.12.2019 162.4 71.5 22.1 17.3 14.5 161.596

Page | 131
RESULT INTERPRETATION
No. of Observations 34 34 34 34 34
Min Concentration 140.2 63.4 22.1 13.2 9.4
Max Concentration 181.9 92.4 46.1 32.5 22.1
98th Percentile 180.9 86.4 44.6 31.2 20.1
Arithmetic Mean 160.03636 76.345455 33.0939394 22.178788 13.839394
Std. Deviation 11.697217 6.6103182 6.4521285 4.9912272 3.133283
D-8 KATKIDABRI VILLAGE (DIPKA) 250 180
160
200 140
120
150
100
80
100
60
50 40
20
0 0
SPM μg/ ^
PM 2.5 μg/ ^
NOx μg/ ^
P. LIMIT PM μg/ ^
P. LIMIT “O μg/ ^
DAILY EXCAVATED QUANTITY (1000,m^3)
PM μg/ ^
“O μg/ ^
P. LIMIT “PM μg/ ^
P. LIMIT PM . μg/ ^
P. LIMIT NO μg/ ^
PART
ICUL
ATE
MAT
TER
μg/m
^3
DA
ILY
EX
CA
VA
TE
D Q
UA
NT
ITY
(1
00
0,m
^3
)
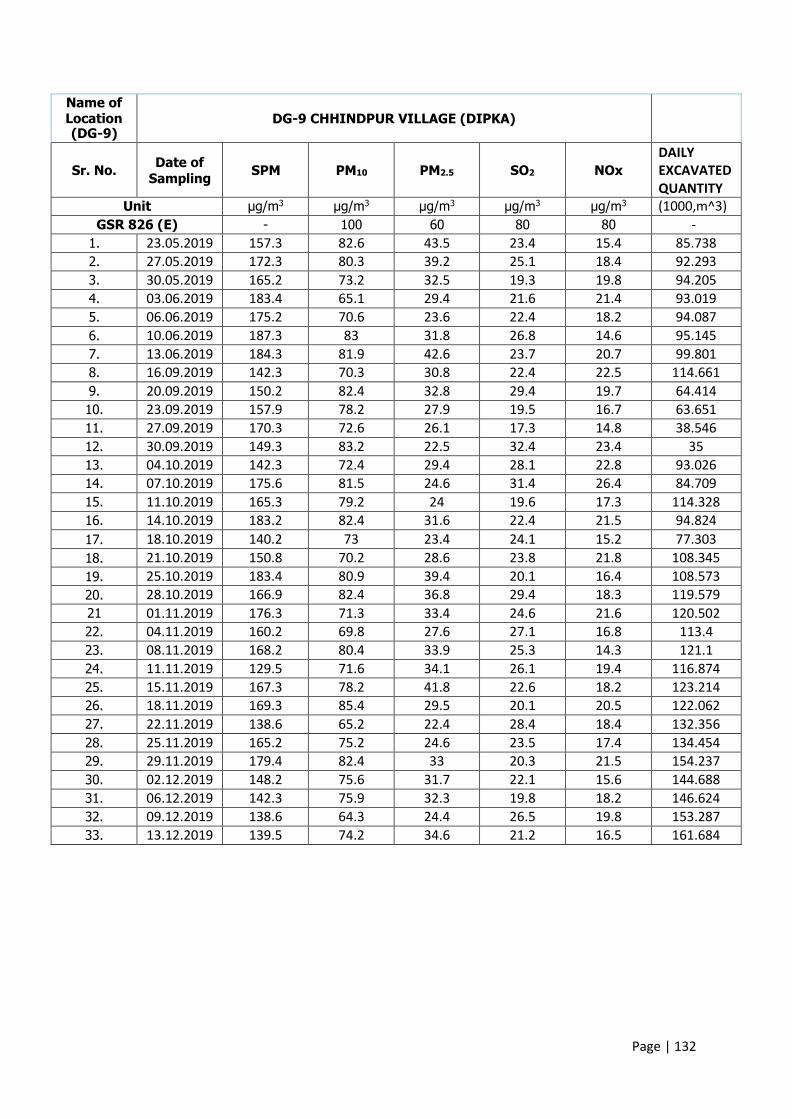
Page | 132
Name of Location (DG-9)
DG-9 CHHINDPUR VILLAGE (DIPKA)
Sr. No.
Date of
Sampling
SPM
PM10
PM2.5
SO2
NOx
DAILY
EXCAVATED
QUANTITY
Unit µg/m3 µg/m3
µg/m3 µg/m3
µg/m3 (1000,m^3)
GSR 826 (E) - 100 60 80 80 -
1. 23.05.2019 157.3 82.6 43.5 23.4 15.4 85.738
2. 27.05.2019 172.3 80.3 39.2 25.1 18.4 92.293
3. 30.05.2019 165.2 73.2 32.5 19.3 19.8 94.205
4. 03.06.2019 183.4 65.1 29.4 21.6 21.4 93.019
5. 06.06.2019 175.2 70.6 23.6 22.4 18.2 94.087
6. 10.06.2019 187.3 83 31.8 26.8 14.6 95.145
7. 13.06.2019 184.3 81.9 42.6 23.7 20.7 99.801
8. 16.09.2019 142.3 70.3 30.8 22.4 22.5 114.661
9. 20.09.2019 150.2 82.4 32.8 29.4 19.7 64.414
10. 23.09.2019 157.9 78.2 27.9 19.5 16.7 63.651
11. 27.09.2019 170.3 72.6 26.1 17.3 14.8 38.546
12. 30.09.2019 149.3 83.2 22.5 32.4 23.4 35
13. 04.10.2019 142.3 72.4 29.4 28.1 22.8 93.026
14. 07.10.2019 175.6 81.5 24.6 31.4 26.4 84.709
15. 11.10.2019 165.3 79.2 24 19.6 17.3 114.328
16. 14.10.2019 183.2 82.4 31.6 22.4 21.5 94.824
17. 18.10.2019 140.2 73 23.4 24.1 15.2 77.303
18. 21.10.2019 150.8 70.2 28.6 23.8 21.8 108.345
19. 25.10.2019 183.4 80.9 39.4 20.1 16.4 108.573
20. 28.10.2019 166.9 82.4 36.8 29.4 18.3 119.579
21 01.11.2019 176.3 71.3 33.4 24.6 21.6 120.502
22. 04.11.2019 160.2 69.8 27.6 27.1 16.8 113.4
23. 08.11.2019 168.2 80.4 33.9 25.3 14.3 121.1
24. 11.11.2019 129.5 71.6 34.1 26.1 19.4 116.874
25. 15.11.2019 167.3 78.2 41.8 22.6 18.2 123.214
26. 18.11.2019 169.3 85.4 29.5 20.1 20.5 122.062
27. 22.11.2019 138.6 65.2 22.4 28.4 18.4 132.356
28. 25.11.2019 165.2 75.2 24.6 23.5 17.4 134.454
29. 29.11.2019 179.4 82.4 33 20.3 21.5 154.237
30. 02.12.2019 148.2 75.6 31.7 22.1 15.6 144.688
31. 06.12.2019 142.3 75.9 32.3 19.8 18.2 146.624
32. 09.12.2019 138.6 64.3 24.4 26.5 19.8 153.287
33. 13.12.2019 139.5 74.2 34.6 21.2 16.5 161.684
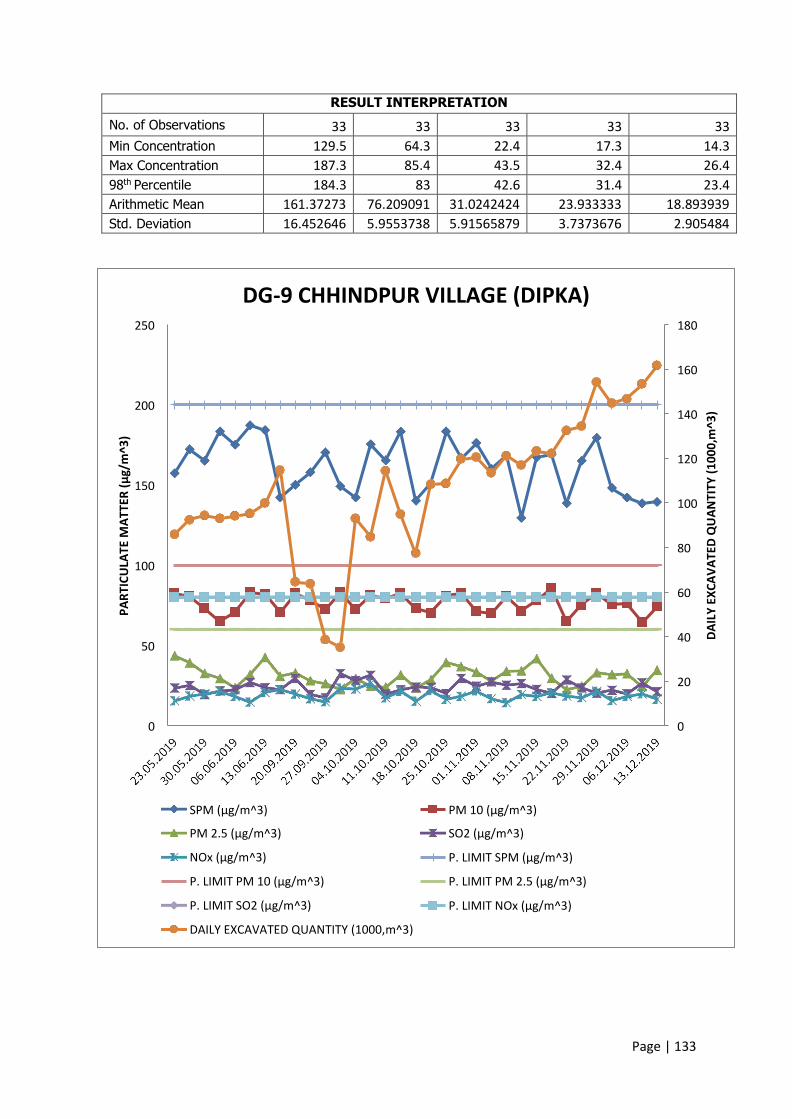
Page | 133
RESULT INTERPRETATION
No. of Observations 33 33 33 33 33
Min Concentration 129.5 64.3 22.4 17.3 14.3
Max Concentration 187.3 85.4 43.5 32.4 26.4
98th Percentile 184.3 83 42.6 31.4 23.4
Arithmetic Mean 161.37273 76.209091 31.0242424 23.933333 18.893939
Std. Deviation 16.452646 5.9553738 5.91565879 3.7373676 2.905484
DG-9 CHHINDPUR VILLAGE (DIPKA) 250 180
160
200 140
120
150
100
80
100
60
50 40
20
0 0
“PM μg/ ^
PM . μg/ ^
NO μg/ ^
P. LIMIT PM μg/ ^
P. LIMIT “O μg/ ^
DAILY EXCAVATED QUANTITY (1000,m^3)
PM μg/ ^
“O μg/ ^
P. LIMIT “PM μg/ ^
P. LIMIT PM . μg/ ^
P. LIMIT NO μg/ ^
PART
ICUL
ATE
MAT
TER
μg/m
^3
DA
ILY
EX
CA
VA
TE
D Q
UA
NT
ITY
(1
00
0,m
^3
)

Page | 134
Name of Location (D-10)
D-10 TIWARTA VILLAGE (DIPKA)
Sr. No.
Date of
Sampling
SPM
PM10
PM2.5
SO2
NOx
DAILY
EXCAVATED
QUANTITY
Unit µg/m3 µg/m3
µg/m3 µg/m3
µg/m3 (1000,m^3)
GSR 826 (E) - 100 60 80 80 -
1. 22.05.2019 137.6 68.7 28.3 27 19.3 79.117
2. 26.05.2019 144.9 81.6 42.7 22.8 18.4 94.669
3. 29.05.2019 158.4 78.4 36.4 27.7 17.5 88.407
4. 02.06.2019 130.7 65.4 33.1 26.6 18.2 78.79
5. 05.06.2019 153.4 57.3 35.8 27.6 20.3 89.613
6. 09.06.2019 110.9 58.1 29.4 22 18.2 100.392
7. 12.06.2019 117.5 62.9 31.2 22.4 20.5 89.316
8. 15.09.2019 130.4 60.7 33.7 28.5 17.2 115.582
9. 19.09.2019 156.9 67.4 32.6 27.7 18.4 123.259
10. 22.09.2019 149.7 80.2 39.7 27.4 19.9 63.301
11. 26.09.2019 150.2 69.5 36.5 28.6 18.2 39.282
12. 29.09.2019 132.6 71.9 33.8 27.8 19.4 4.723
13. 03.10.2019 138.4 73.5 34.6 26 15.3 81.187
14. 06.10.2019 122.5 83.2 41.1 27 20.1 96.829
15. 10.10.2019 116.5 66.5 31.2 24.2 17.3 117.264
16. 13.10.2019 141.3 69.4 36.5 28.3 17.4 103.339
17. 17.10.2019 127.5 80.5 36.2 21.4 16.9 115.878
18. 20.10.2019 131.5 83.4 41.8 23.1 17.8 78.522
19. 24.10.2019 128.4 60.7 32.2 29.7 18.2 95.79
20. 27.10.2019 139.5 78.5 38.9 29.6 19.9 105.834
21 31.10.2019 128.6 74.2 36.4 29.9 22.1 116.276
22. 03.11.2019 135.2 73.2 32.8 27.3 21.2 113.916
23. 07.11.2019 120.5 69.1 31.4 29.4 20.1 119.409
24. 10.11.2019 121.6 83.5 40.5 27.4 21.4 135.052
25. 14.11.2019 137.3 81.9 47.6 22.6 20.1 129.016
26. 17.11.2019 146.2 84.6 42.9 18.5 13.7 132.91
27. 21.11.2019 142.3 88.1 47.2 29.5 21.6 129.111
28. 24.11.2019 136.4 66.8 28.6 31.5 23.4 137.316
29. 28.11.2019 142.5 83.1 46.8 35.4 22.5 148.375
30. 01.12.2019 132.4 82.7 33.5 26.8 20.5 147.776
31. 05.12.2019 142.8 83.4 41.8 29.4 21.6 134.137
32. 08.12.2019 136.5 76.1 41.9 29.6 23.5 158.236
33. 12.12.2019 132.8 70.5 32.8 27.5 19.5 159.924
34. 15.12.2019 139.4 85.4 42.9 23.6 20.4 164.885
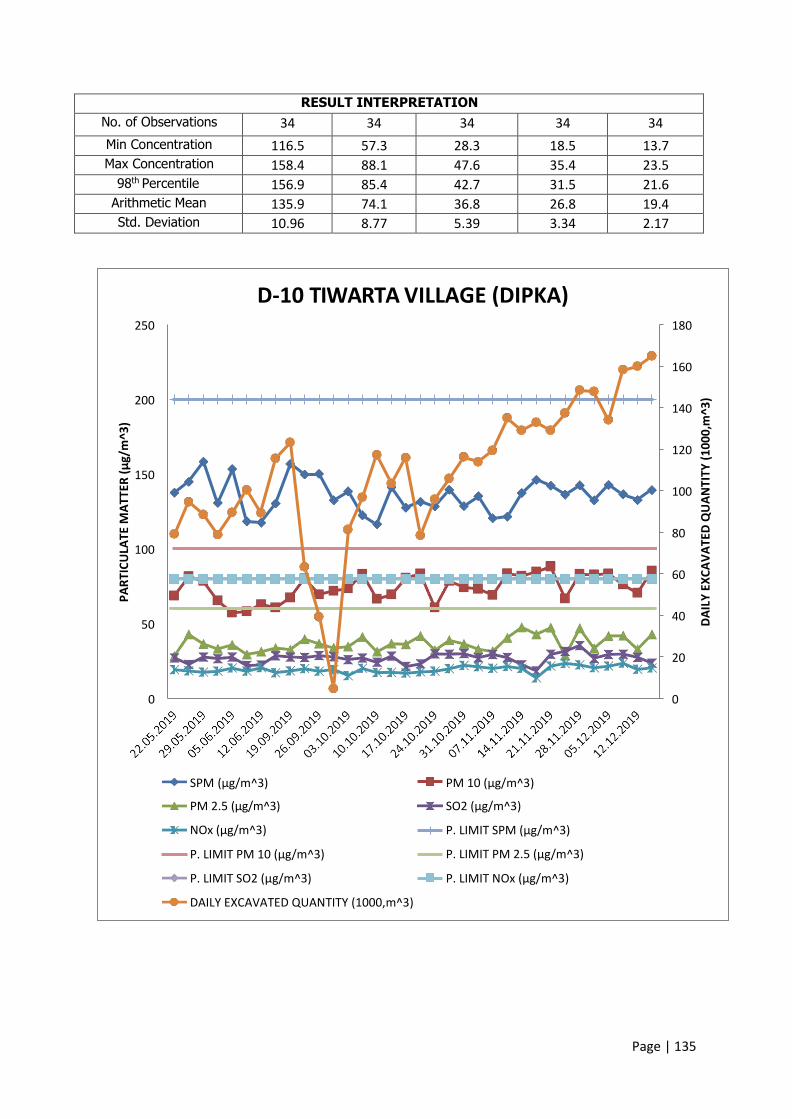
Page | 135
RESULT INTERPRETATION
No. of Observations 34 34 34 34 34
Min Concentration 116.5 57.3 28.3 18.5 13.7
Max Concentration 158.4 88.1 47.6 35.4 23.5
98th Percentile 156.9 85.4 42.7 31.5 21.6
Arithmetic Mean 135.9 74.1 36.8 26.8 19.4
Std. Deviation 10.96 8.77 5.39 3.34 2.17
D-10 TIWARTA VILLAGE (DIPKA) 250 180
160
200 140
120
150
100
80
100
60
50 40
20
0 0
SPM μg/ ^
PM 2.5 μg/ ^
NOx μg/ ^
P. LIMIT PM μg/ ^
P. LIMIT “O μg/ ^
DAILY EXCAVATED QUANTITY (1000,m^3)
PM μg/ ^
“O μg/ ^
P. LIMIT “PM μg/ ^
P. LIMIT PM . μg/ ^
P. LIMIT NO μg/ ^
PART
ICUL
ATE
MAT
TER
μg/m
^3
DA
ILY
EX
CA
VA
TE
D Q
UA
NT
ITY
(1
00
0,m
^3
)
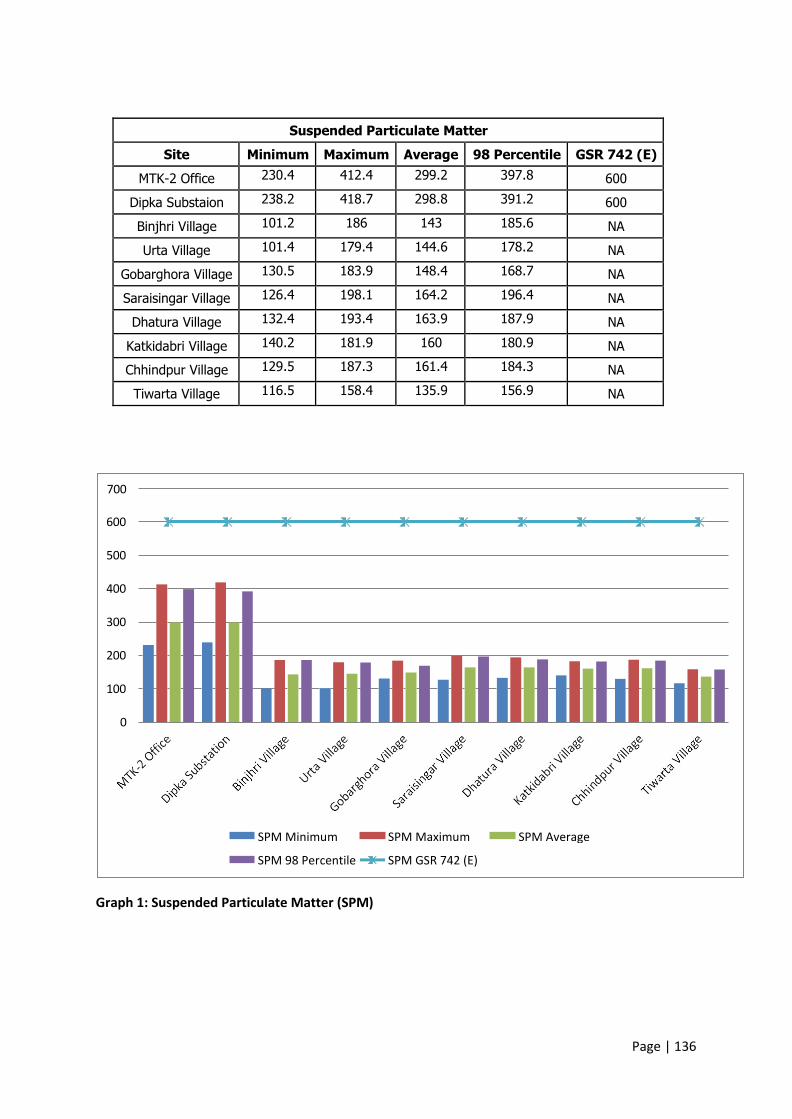
Page | 136
SPM Average SPM Maximum
SPM GSR 742 (E)
SPM Minimum
SPM 98 Percentile
700
600
500
400
300
200
100
0
Suspended Particulate Matter
Site Minimum Maximum Average 98 Percentile GSR 742 (E)
MTK-2 Office 230.4 412.4 299.2 397.8 600
Dipka Substaion 238.2 418.7 298.8 391.2 600
Binjhri Village 101.2 186 143 185.6 NA
Urta Village 101.4 179.4 144.6 178.2 NA
Gobarghora Village 130.5 183.9 148.4 168.7 NA
Saraisingar Village 126.4 198.1 164.2 196.4 NA
Dhatura Village 132.4 193.4 163.9 187.9 NA
Katkidabri Village 140.2 181.9 160 180.9 NA
Chhindpur Village 129.5 187.3 161.4 184.3 NA
Tiwarta Village 116.5 158.4 135.9 156.9 NA
Graph 1: Suspended Particulate Matter (SPM)
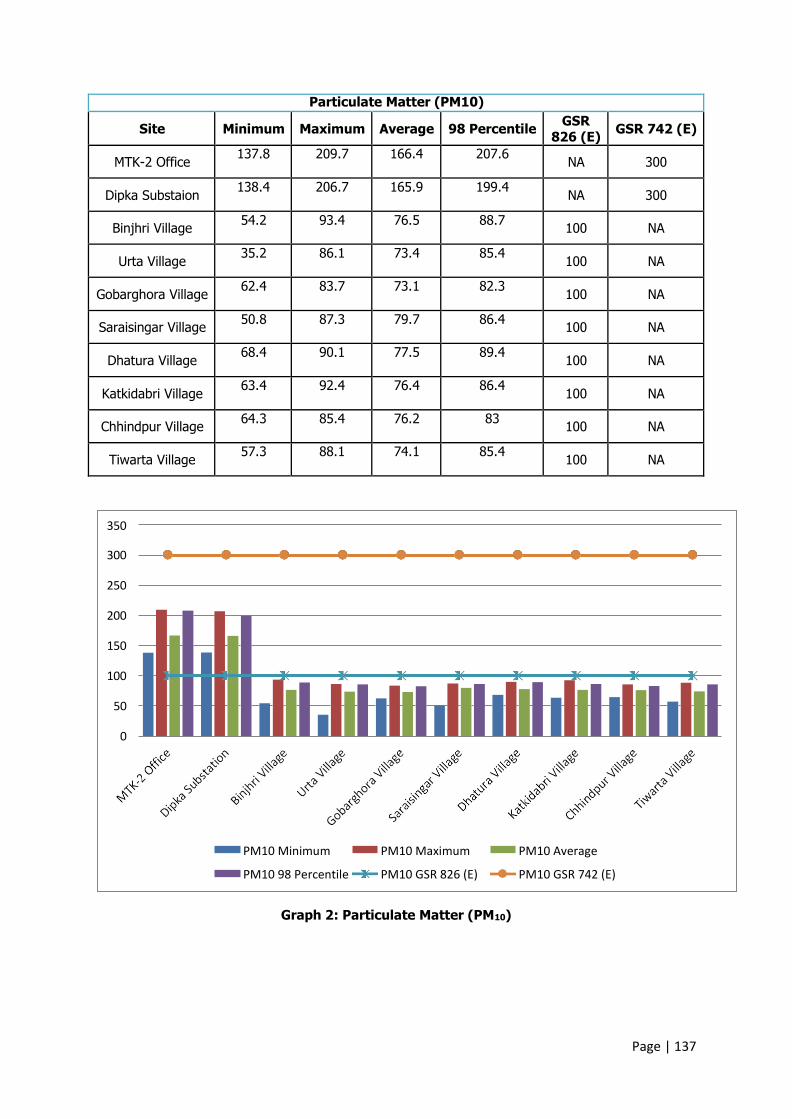
Page | 137
PM10 Average
PM10 GSR 742 (E)
PM10 Maximum
PM10 GSR 826 (E)
PM10 Minimum
PM10 98 Percentile
350
300
250
200
150
100
50
0
Particulate Matter (PM10)
Site Minimum Maximum Average 98 Percentile GSR
826 (E) GSR 742 (E)
MTK-2 Office 137.8 209.7 166.4 207.6
NA 300
Dipka Substaion 138.4 206.7 165.9 199.4
NA 300
Binjhri Village 54.2 93.4 76.5 88.7
100 NA
Urta Village 35.2 86.1 73.4 85.4
100 NA
Gobarghora Village 62.4 83.7 73.1 82.3
100 NA
Saraisingar Village 50.8 87.3 79.7 86.4
100 NA
Dhatura Village 68.4 90.1 77.5 89.4
100 NA
Katkidabri Village 63.4 92.4 76.4 86.4
100 NA
Chhindpur Village 64.3 85.4 76.2 83
100 NA
Tiwarta Village 57.3 88.1 74.1 85.4
100 NA
Graph 2: Particulate Matter (PM10)

Page | 138
PM2.5 Average PM2.5 Maximum
PM2.5 GSR 826 (E)
PM2.5 Minimum
PM2.5 98 Percentile
80
70
60
50
40
30
20
10
0
Particulate Matter (PM2.5)
Site Minimum Maximum Average 98 Percentile GSR 826 (E)
MTK-2 Office
46.8 68.7 54.9 67.8 NA
Dipka Substaion
43.2 63.4 53.5 62.8 NA
Binjhri Village
19.4 51.6 34 42.6 60
Urta Village
22.4 42.8 31.5 41.2 60
Gobarghora Village
25.9 43.9 34.3 42.8 60
Saraisingar Village
29.5 44.6 38.9 44.2 60
Dhatura Village
22.4 39.4 30.1 37.9 60
Katkidabri Village
22.1 46.1 33.1 44.6 60
Chhindpur Village
22.4 43.5 31 42.6 60
Tiwarta Village
28.3 47.6 36.8 42.7 60
Graph 3: Particulate Matter (PM2.5)

Page | 139
SO2 Average
SO2 GSR 742 (E)
SO2 Maximum
SO2 GSR 826 (E)
SO2 Minimum
SO2 98 Percentile
140
120
100
80
60
40
20
0
Sulphur Dioxide (SO2)
Site
Minimum
Maximum
Average
98 Percentile GSR 826 (E)
GSR 742 (E)
MTK-2 Office 19.8 42 32.9 41.2
NA 120
Dipka Substaion 18.2 44.8 27.3 43.2
NA 120
Binjhri Village 13.2 32.5 22.5 31.2
80 NA
Urta Village 14.5 29.8 21.9 28.7
80 NA
Gobarghora Village 12.6 38.4 22.7 33.4
80 NA
Saraisingar Village 18.1 30.1 26 29.7
80 NA
Dhatura Village 12.9 32.4 22.6 31.4
80 NA
Katkidabri Village 13.2 32.5 22.2 31.2
80 NA
Chhindpur Village 17.3 32.4 23.9 31.4
80 NA
Tiwarta Village 18.5 35.4 26.9 31.5
80 NA
Graph 4: Sulphur Dioxide (SO2)
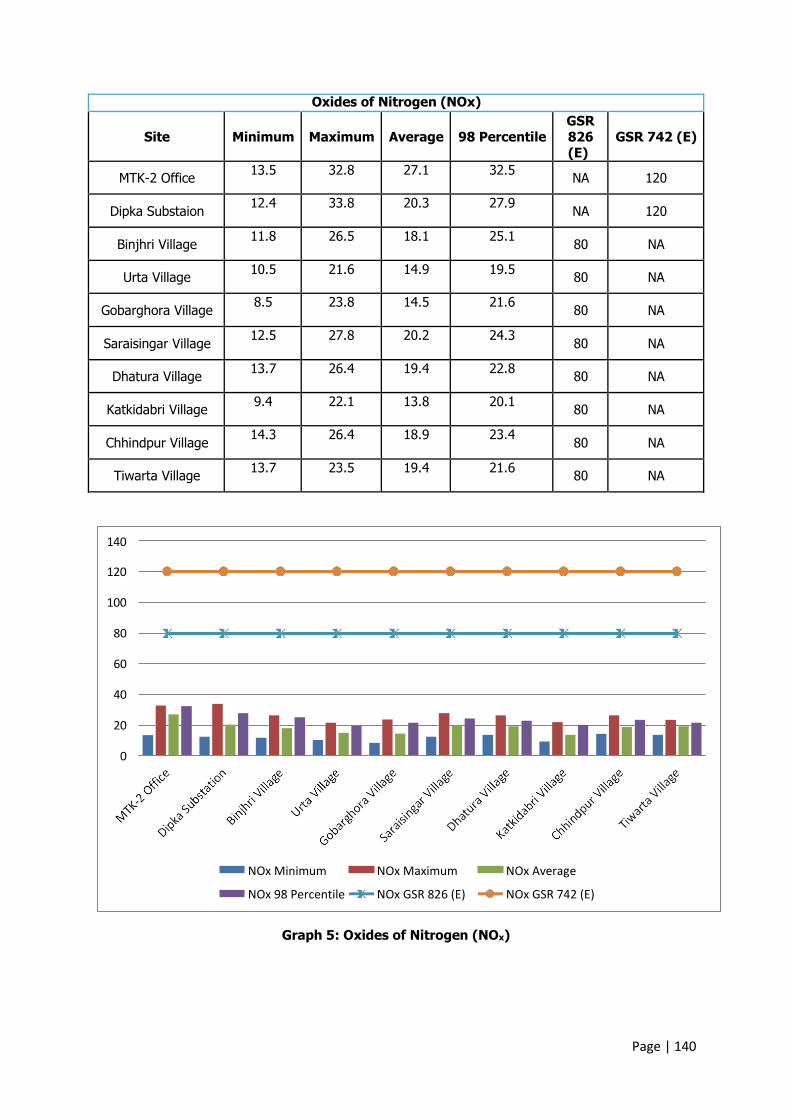
Page | 140
NOx Average
NOx GSR 742 (E)
NOx Maximum
NOx GSR 826 (E)
NOx Minimum
NOx 98 Percentile
140
120
100
80
60
40
20
0
Oxides of Nitrogen (NOx)
Site
Minimum
Maximum
Average
98 Percentile GSR 826 (E)
GSR 742 (E)
MTK-2 Office 13.5 32.8 27.1 32.5
NA 120
Dipka Substaion 12.4 33.8 20.3 27.9
NA 120
Binjhri Village 11.8 26.5 18.1 25.1
80 NA
Urta Village 10.5 21.6 14.9 19.5
80 NA
Gobarghora Village 8.5 23.8 14.5 21.6
80 NA
Saraisingar Village 12.5 27.8 20.2 24.3
80 NA
Dhatura Village 13.7 26.4 19.4 22.8
80 NA
Katkidabri Village 9.4 22.1 13.8 20.1
80 NA
Chhindpur Village 14.3 26.4 18.9 23.4
80 NA
Tiwarta Village 13.7 23.5 19.4 21.6
80 NA
Graph 5: Oxides of Nitrogen (NOx)
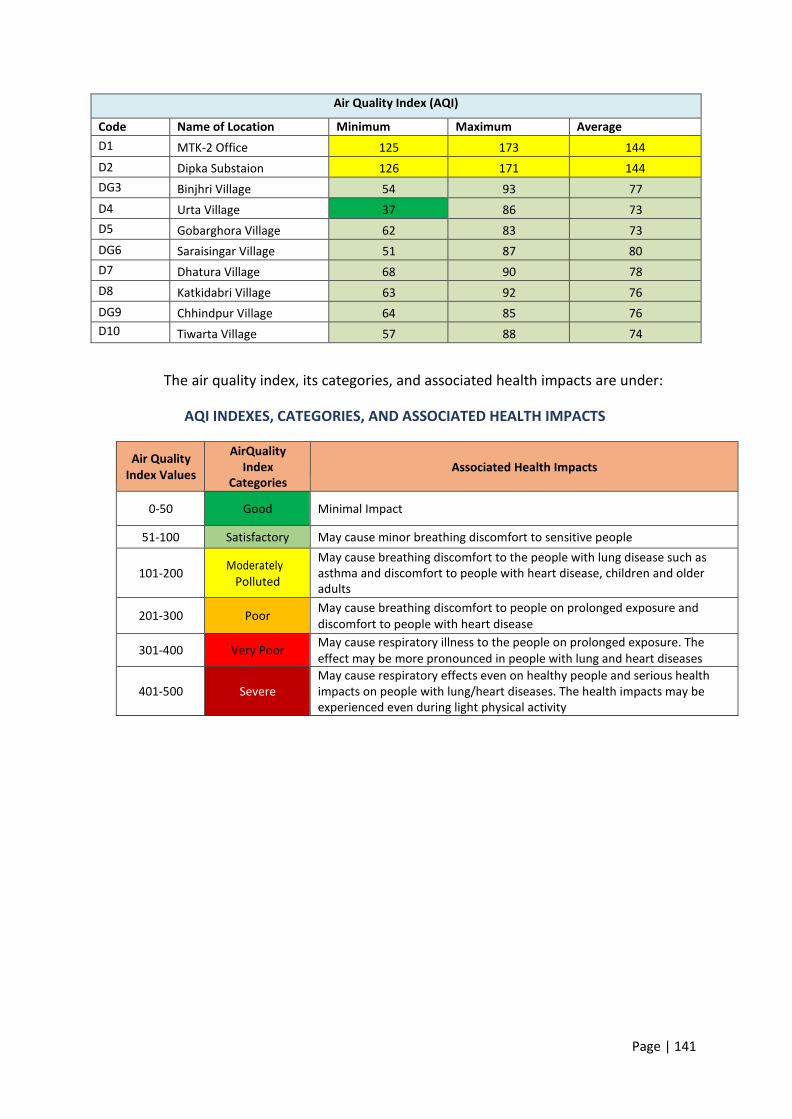
Page | 141
Air Quality Index (AQI)
Code Name of Location Minimum Maximum Average
D1 MTK-2 Office 125 173 144
D2 Dipka Substaion 126 171 144
DG3 Binjhri Village 54 93 77
D4 Urta Village 37 86 73
D5 Gobarghora Village 62 83 73
DG6 Saraisingar Village 51 87 80
D7 Dhatura Village 68 90 78
D8 Katkidabri Village 63 92 76
DG9 Chhindpur Village 64 85 76
D10 Tiwarta Village 57 88 74
The air quality index, its categories, and associated health impacts are under:
AQI INDEXES, CATEGORIES, AND ASSOCIATED HEALTH IMPACTS
Air Quality
Index Values
AirQuality
Index
Categories
Associated Health Impacts
0-50 Good Minimal Impact
51-100 Satisfactory May cause minor breathing discomfort to sensitive people
101-200 Moderately
Polluted
May cause breathing discomfort to the people with lung disease such as
asthma and discomfort to people with heart disease, children and older
adults
201-300 Poor May cause breathing discomfort to people on prolonged exposure and
discomfort to people with heart disease
301-400 Very Poor May cause respiratory illness to the people on prolonged exposure. The
effect may be more pronounced in people with lung and heart diseases
401-500
Severe
May cause respiratory effects even on healthy people and serious health
impacts on people with lung/heart diseases. The health impacts may be
experienced even during light physical activity
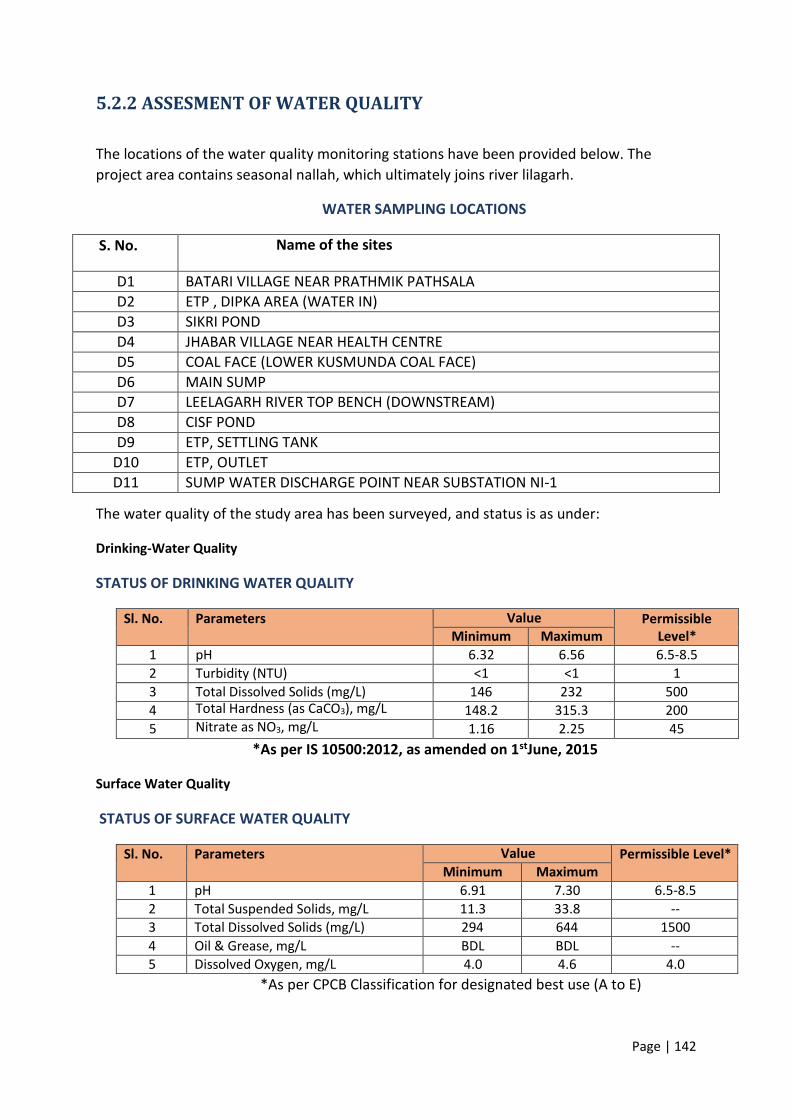
Page | 142
5.2.2 ASSESMENT OF WATER QUALITY
The locations of the water quality monitoring stations have been provided below. The
project area contains seasonal nallah, which ultimately joins river lilagarh.
WATER SAMPLING LOCATIONS
S. No. Name of the sites
D1 BATARI VILLAGE NEAR PRATHMIK PATHSALA
D2 ETP , DIPKA AREA (WATER IN)
D3 SIKRI POND
D4 JHABAR VILLAGE NEAR HEALTH CENTRE
D5 COAL FACE (LOWER KUSMUNDA COAL FACE)
D6 MAIN SUMP
D7 LEELAGARH RIVER TOP BENCH (DOWNSTREAM)
D8 CISF POND
D9 ETP, SETTLING TANK
D10 ETP, OUTLET
D11 SUMP WATER DISCHARGE POINT NEAR SUBSTATION NI-1
The water quality of the study area has been surveyed, and status is as under:
Drinking-Water Quality
STATUS OF DRINKING WATER QUALITY
Sl. No. Parameters Value Permissible
Level* Minimum Maximum
1 pH 6.32 6.56 6.5-8.5
2 Turbidity (NTU) <1 <1 1
3 Total Dissolved Solids (mg/L) 146 232 500
4 Total Hardness (as CaCO3), mg/L 148.2 315.3 200
5 Nitrate as NO3, mg/L 1.16 2.25 45
*As per IS 10500:2012, as amended on 1stJune, 2015
Surface Water Quality
STATUS OF SURFACE WATER QUALITY
Sl. No. Parameters Value Permissible Level*
Minimum Maximum
1 pH 6.91 7.30 6.5-8.5
2 Total Suspended Solids, mg/L 11.3 33.8 --
3 Total Dissolved Solids (mg/L) 294 644 1500
4 Oil & Grease, mg/L BDL BDL --
5 Dissolved Oxygen, mg/L 4.0 4.6 4.0
*As per CPCB Classification for designated best use (A to E)
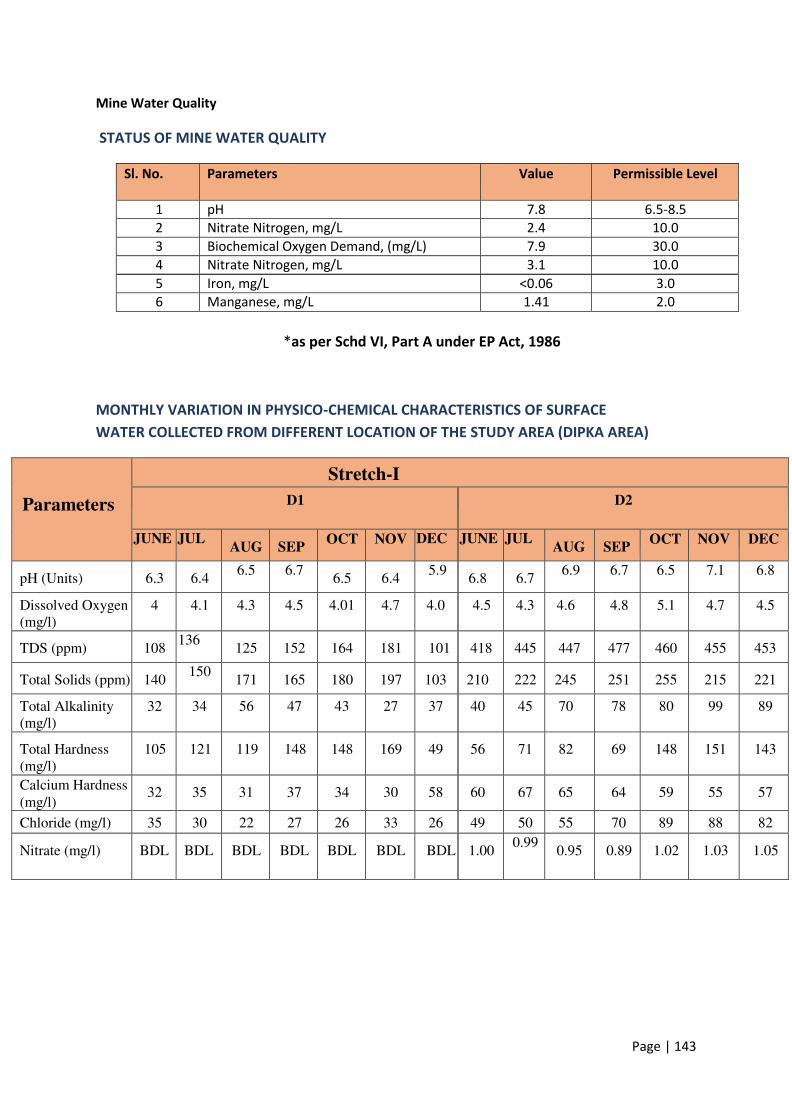
Page | 143
Mine Water Quality
STATUS OF MINE WATER QUALITY
Sl. No. Parameters Value Permissible Level
1 pH 7.8 6.5-8.5
2 Nitrate Nitrogen, mg/L 2.4 10.0
3 Biochemical Oxygen Demand, (mg/L) 7.9 30.0
4 Nitrate Nitrogen, mg/L 3.1 10.0
5 Iron, mg/L <0.06 3.0
6 Manganese, mg/L 1.41 2.0
*as per Schd VI, Part A under EP Act, 1986
MONTHLY VARIATION IN PHYSICO-CHEMICAL CHARACTERISTICS OF SURFACE
WATER COLLECTED FROM DIFFERENT LOCATION OF THE STUDY AREA (DIPKA AREA)
Parameters
Stretch-I
D1 D2
JUNE JUL AUG SEP
OCT NOV DEC JUNE JUL AUG SEP
OCT NOV DEC
pH (Units) 6.3 6.4 6.5 6.7
6.5 6.4 5.9
6.8 6.7 6.9 6.7 6.5 7.1 6.8
Dissolved Oxygen
(mg/l)
4 4.1 4.3 4.5 4.01 4.7 4.0 4.5 4.3 4.6 4.8 5.1 4.7 4.5
TDS (ppm) 108 136
125 152 164 181 101 418 445 447 477 460 455 453
Total Solids (ppm) 140 150
171 165 180 197 103 210 222 245 251 255 215 221
Total Alkalinity
(mg/l)
32 34 56 47 43 27 37 40 45 70 78 80 99 89
Total Hardness
(mg/l)
105 121 119 148 148 169 49 56 71 82 69 148 151 143
Calcium Hardness
(mg/l) 32 35 31 37 34 30 58 60 67 65 64 59 55 57
Chloride (mg/l) 35 30 22 27 26 33 26 49 50 55 70 89 88 82
Nitrate (mg/l) BDL BDL BDL BDL BDL BDL BDL 1.00 0.99
0.95 0.89 1.02 1.03 1.05
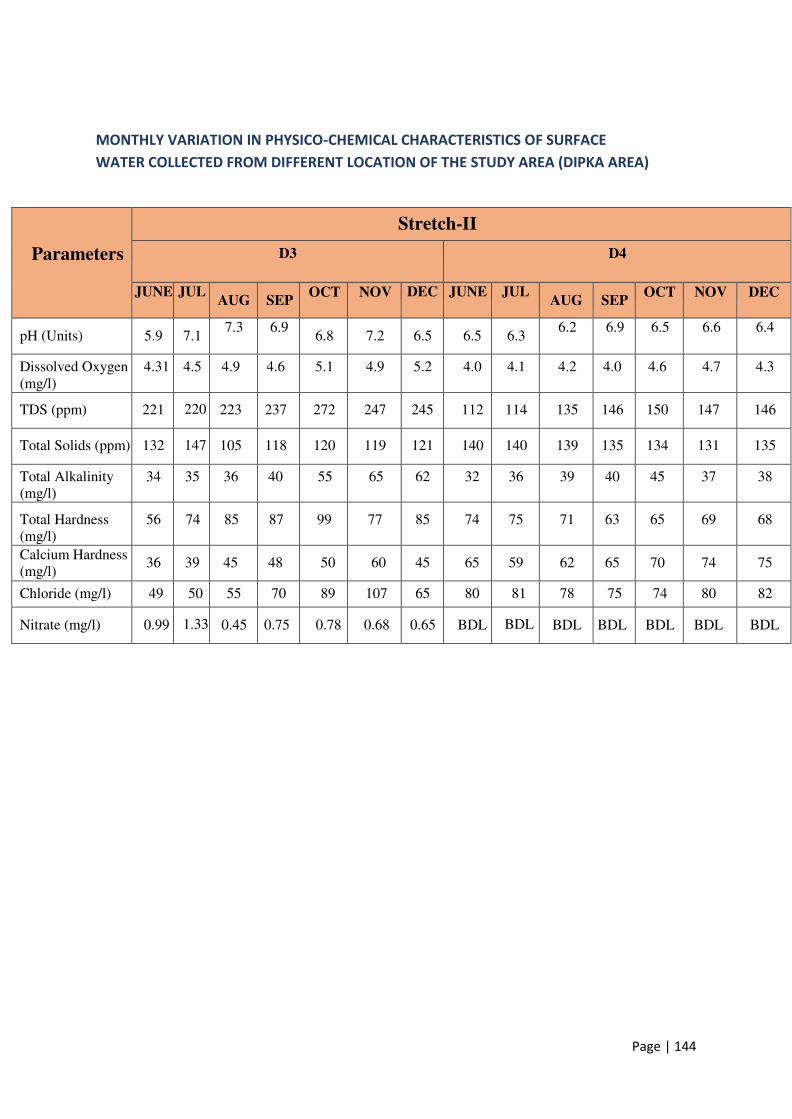
Page | 144
MONTHLY VARIATION IN PHYSICO-CHEMICAL CHARACTERISTICS OF SURFACE
WATER COLLECTED FROM DIFFERENT LOCATION OF THE STUDY AREA (DIPKA AREA)
Parameters
Stretch-II
D3 D4
JUNE JUL AUG SEP
OCT NOV DEC JUNE JUL AUG SEP
OCT NOV DEC
pH (Units) 5.9 7.1 7.3 6.9
6.8 7.2 6.5 6.5 6.3 6.2 6.9 6.5 6.6 6.4
Dissolved Oxygen
(mg/l)
4.31 4.5 4.9 4.6 5.1 4.9 5.2 4.0 4.1 4.2 4.0 4.6 4.7 4.3
TDS (ppm) 221 220 223 237 272 247 245 112 114 135 146 150 147 146
Total Solids (ppm) 132 147 105 118 120 119 121 140 140 139 135 134 131 135
Total Alkalinity
(mg/l)
34 35 36 40 55 65 62 32 36 39 40 45 37 38
Total Hardness
(mg/l)
56 74 85 87 99 77 85 74 75 71 63 65 69 68
Calcium Hardness
(mg/l) 36 39 45 48 50 60 45 65 59 62 65 70 74 75
Chloride (mg/l) 49 50 55 70 89 107 65 80 81 78 75 74 80 82
Nitrate (mg/l) 0.99 1.33 0.45 0.75 0.78 0.68 0.65 BDL BDL BDL BDL BDL BDL BDL
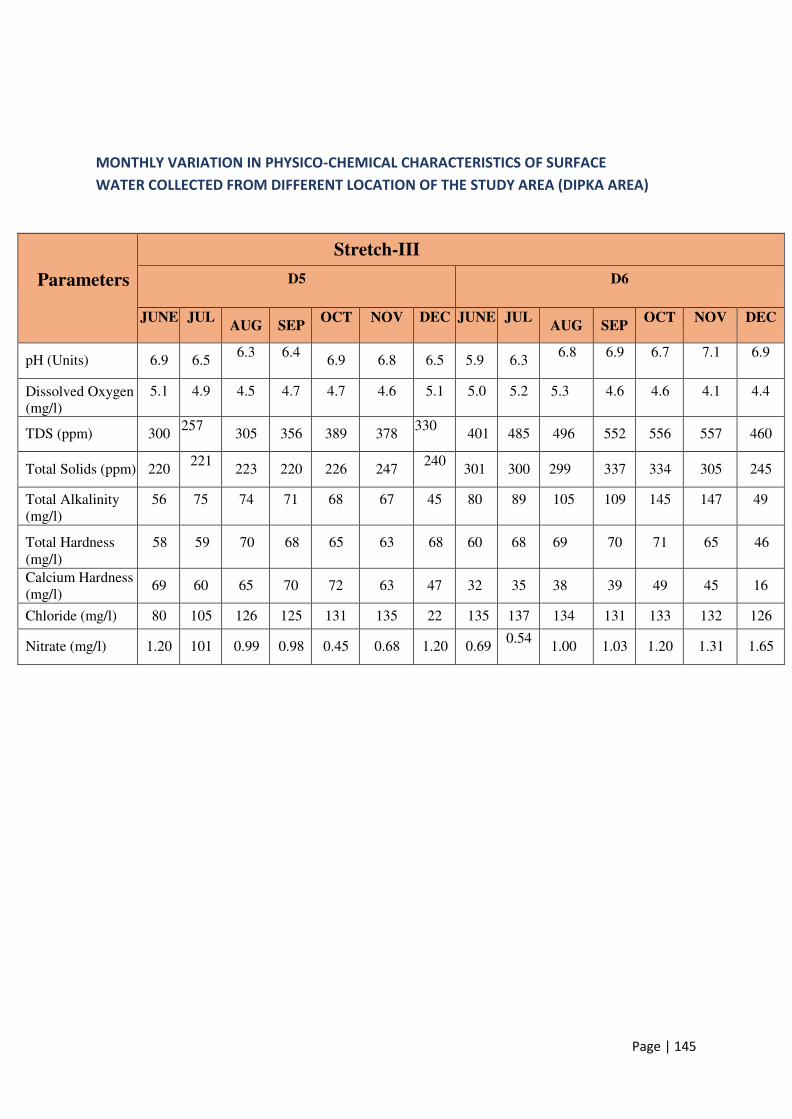
Page | 145
MONTHLY VARIATION IN PHYSICO-CHEMICAL CHARACTERISTICS OF SURFACE
WATER COLLECTED FROM DIFFERENT LOCATION OF THE STUDY AREA (DIPKA AREA)
Parameters
Stretch-III
D5 D6
JUNE JUL AUG SEP
OCT NOV DEC JUNE JUL AUG SEP
OCT NOV DEC
pH (Units) 6.9 6.5 6.3 6.4
6.9 6.8 6.5 5.9 6.3 6.8 6.9 6.7 7.1 6.9
Dissolved Oxygen (mg/l)
5.1 4.9 4.5 4.7 4.7 4.6 5.1 5.0 5.2 5.3 4.6 4.6 4.1 4.4
TDS (ppm) 300 257
305 356 389 378 330
401 485 496 552 556 557 460
Total Solids (ppm) 220 221
223 220 226 247 240
301 300 299 337 334 305 245
Total Alkalinity
(mg/l)
56 75 74 71 68 67 45 80 89 105 109 145 147 49
Total Hardness
(mg/l)
58 59 70 68 65 63 68 60 68 69 70 71 65 46
Calcium Hardness
(mg/l) 69 60 65 70 72 63 47 32 35 38 39 49 45 16
Chloride (mg/l) 80 105 126 125 131 135 22 135 137 134 131 133 132 126
Nitrate (mg/l) 1.20 101 0.99 0.98 0.45 0.68 1.20 0.69 0.54
1.00 1.03 1.20 1.31 1.65
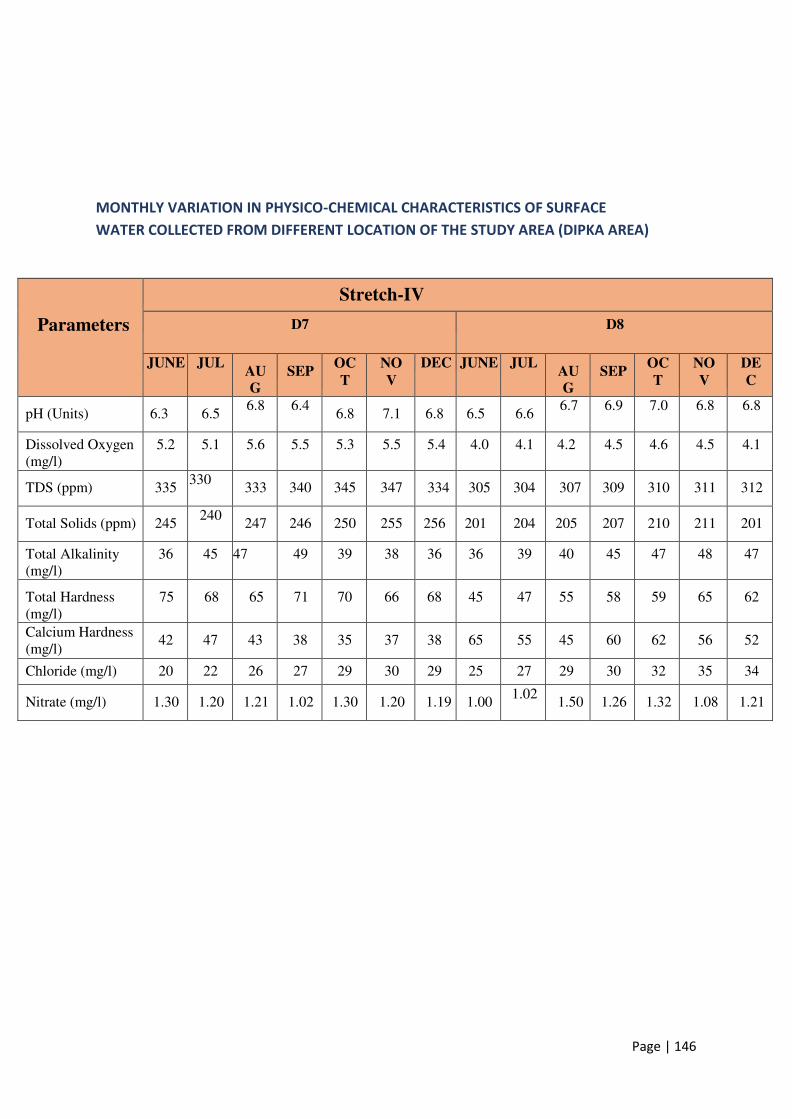
Page | 146
MONTHLY VARIATION IN PHYSICO-CHEMICAL CHARACTERISTICS OF SURFACE
WATER COLLECTED FROM DIFFERENT LOCATION OF THE STUDY AREA (DIPKA AREA)
Parameters
Stretch-IV
D7 D8
JUNE JUL AU G
SEP OC
T
NO
V
DEC JUNE JUL AU G
SEP OC
T
NO
V
DE
C
pH (Units) 6.3 6.5 6.8 6.4
6.8 7.1 6.8 6.5 6.6 6.7 6.9 7.0 6.8 6.8
Dissolved Oxygen
(mg/l)
5.2 5.1 5.6 5.5 5.3 5.5 5.4 4.0 4.1 4.2 4.5 4.6 4.5 4.1
TDS (ppm) 335 330
333 340 345 347 334 305 304 307 309 310 311 312
Total Solids (ppm) 245 240
247 246 250 255 256 201 204 205 207 210 211 201
Total Alkalinity
(mg/l)
36 45 47 49 39 38 36 36 39 40 45 47 48 47
Total Hardness
(mg/l)
75 68 65 71 70 66 68 45 47 55 58 59 65 62
Calcium Hardness
(mg/l) 42 47 43 38 35 37 38 65 55 45 60 62 56 52
Chloride (mg/l) 20 22 26 27 29 30 29 25 27 29 30 32 35 34
Nitrate (mg/l) 1.30 1.20 1.21 1.02 1.30 1.20 1.19 1.00 1.02
1.50 1.26 1.32 1.08 1.21
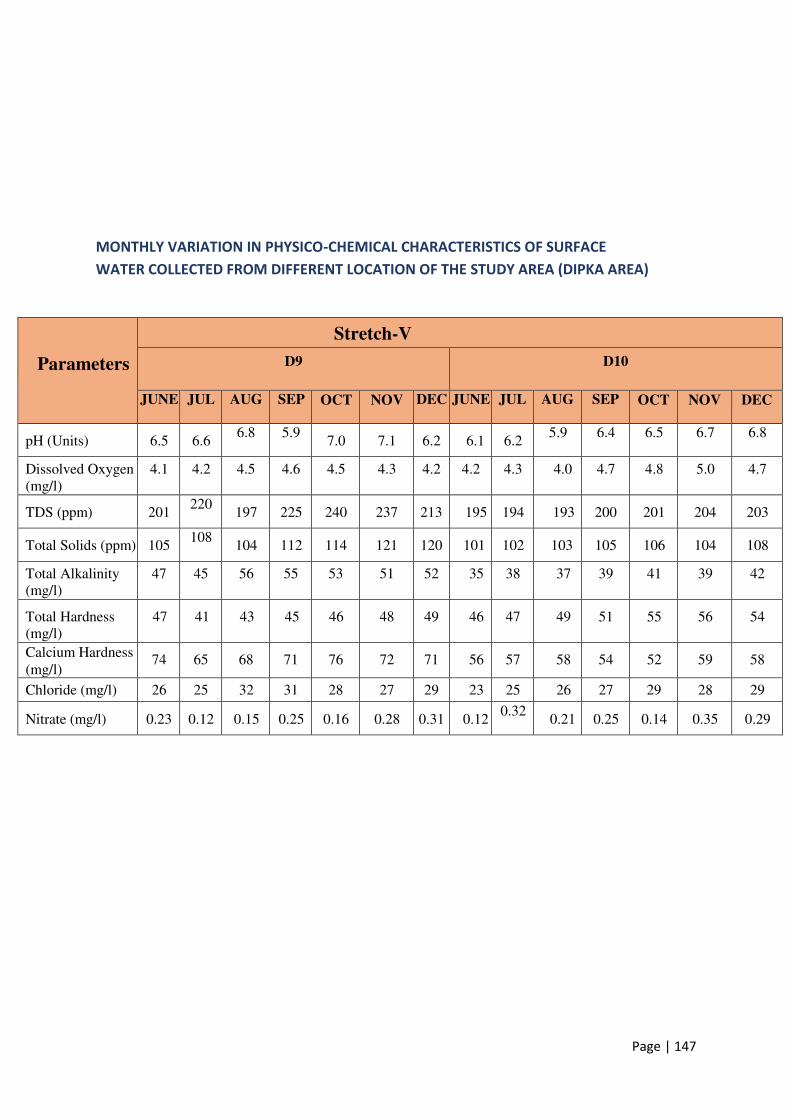
Page | 147
MONTHLY VARIATION IN PHYSICO-CHEMICAL CHARACTERISTICS OF SURFACE
WATER COLLECTED FROM DIFFERENT LOCATION OF THE STUDY AREA (DIPKA AREA)
Parameters
Stretch-V
D9 D10
JUNE JUL AUG SEP OCT NOV DEC JUNE JUL AUG SEP OCT NOV DEC
pH (Units) 6.5 6.6 6.8 5.9
7.0 7.1 6.2 6.1 6.2 5.9 6.4 6.5 6.7 6.8
Dissolved Oxygen
(mg/l)
4.1 4.2 4.5 4.6 4.5 4.3 4.2 4.2 4.3 4.0 4.7 4.8 5.0 4.7
TDS (ppm) 201 220
197 225 240 237 213 195 194 193 200 201 204 203
Total Solids (ppm) 105 108
104 112 114 121 120 101 102 103 105 106 104 108
Total Alkalinity
(mg/l)
47 45 56 55 53 51 52 35 38 37 39 41 39 42
Total Hardness
(mg/l)
47 41 43 45 46 48 49 46 47 49 51 55 56 54
Calcium Hardness
(mg/l) 74 65 68 71 76 72 71 56 57 58 54 52 59 58
Chloride (mg/l) 26 25 32 31 28 27 29 23 25 26 27 29 28 29
Nitrate (mg/l) 0.23 0.12 0.15 0.25 0.16 0.28 0.31 0.12 0.32
0.21 0.25 0.14 0.35 0.29
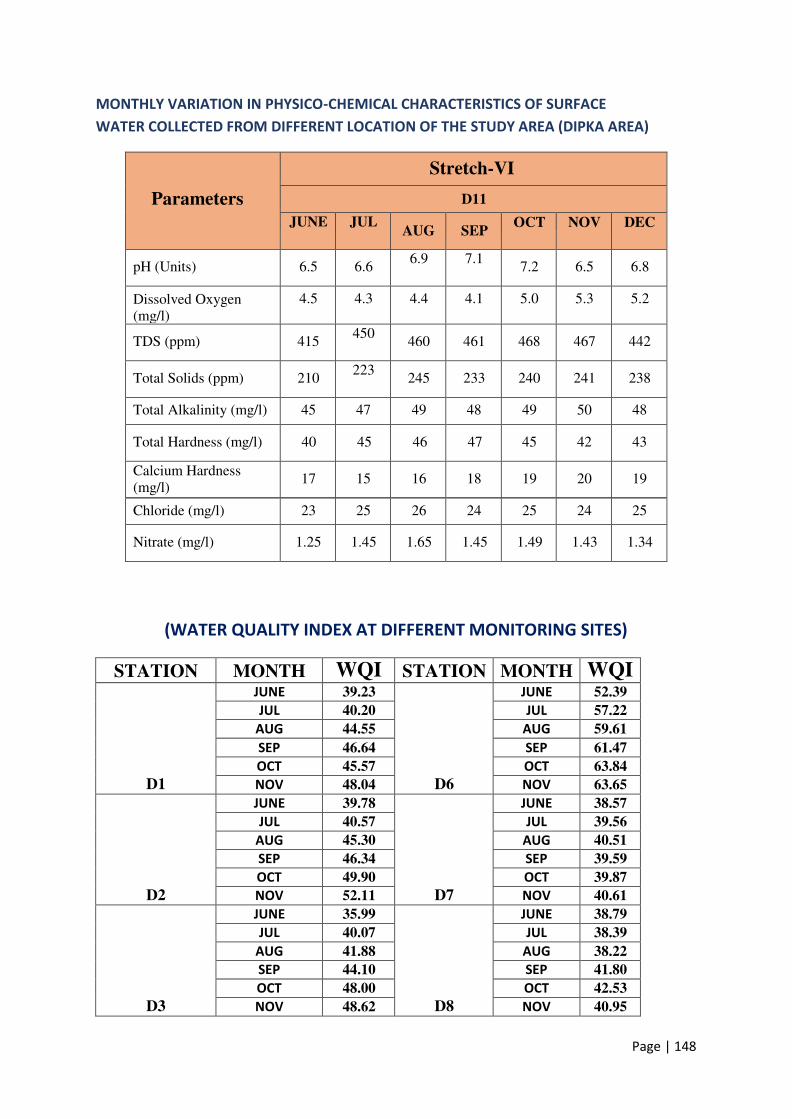
Page | 148
MONTHLY VARIATION IN PHYSICO-CHEMICAL CHARACTERISTICS OF SURFACE
WATER COLLECTED FROM DIFFERENT LOCATION OF THE STUDY AREA (DIPKA AREA)
Parameters
Stretch-VI
D11
JUNE JUL AUG SEP
OCT NOV DEC
pH (Units) 6.5 6.6 6.9 7.1
7.2 6.5 6.8
Dissolved Oxygen (mg/l)
4.5 4.3 4.4 4.1 5.0 5.3 5.2
TDS (ppm) 415 450
460 461 468 467 442
Total Solids (ppm) 210 223
245 233 240 241 238
Total Alkalinity (mg/l) 45 47 49 48 49 50 48
Total Hardness (mg/l) 40 45 46 47 45 42 43
Calcium Hardness
(mg/l) 17 15 16 18 19 20 19
Chloride (mg/l) 23 25 26 24 25 24 25
Nitrate (mg/l) 1.25 1.45 1.65 1.45 1.49 1.43 1.34
(WATER QUALITY INDEX AT DIFFERENT MONITORING SITES)
STATION MONTH WQI STATION MONTH WQI
D1
JUNE 39.23
D6
JUNE 52.39
JUL 40.20 JUL 57.22
AUG 44.55 AUG 59.61
SEP 46.64 SEP 61.47
OCT 45.57 OCT 63.84
NOV 48.04 NOV 63.65
D2
JUNE 39.78
D7
JUNE 38.57
JUL 40.57 JUL 39.56
AUG 45.30 AUG 40.51
SEP 46.34 SEP 39.59
OCT 49.90 OCT 39.87
NOV 52.11 NOV 40.61
D3
JUNE 35.99
D8
JUNE 38.79
JUL 40.07 JUL 38.39
AUG 41.88 AUG 38.22
SEP 44.10 SEP 41.80
OCT 48.00 OCT 42.53
NOV 48.62 NOV 40.95

Page | 149
D4
JUNE 36.24
D9
JUNE 40.01
JUL 35.99 JUL 40.22
AUG 36.44 AUG 44.13
SEP 37.00 SEP 42.51
OCT 37.88 OCT 44.91
NOV 38.76 NOV 44.62
D5
JUNE 48.92
D10
JUNE 36.13
JUL 85.63 JUL 35.66
AUG 50.61 AUG 34.58
SEP 53.05 SEP 36.85
OCT 55.35 OCT 37.27
NOV 53.10 NOV 38.46
D11
JUNE 37.28
D11
SEP 38.75
JUL 37.19 OCT 41.14
AUG 38.14 NOV 40.59
Observations
Ground Water (Tube well water and Dug well water)
The analyses shows that various physical and chemical parameters are within the
permissible limits of Drinking Water Standards (IS:10500-2012).
Surface Water
The analysis shows that various parameters are within the limits of IS: 2296-1982
(Surface water, Class "C": Tolerance limits for surface waters used for drinking
water source with conventional treatment followed by disinfection).
Waste Water
Samples, EW-1 were collected from effluent water of Dipka OCP. The analysis
shows that various parameters are within the limits of General Standards for
dis ha ge of Efflue ts i to i la d “u fa e ate G“‘ €

Page | 150
5.2.3 ASSESMENT OF NOISE QUALITY
The status of noise level measured in and around the Dipka Mining area are as under
Table Details of noise level measurement [in DB (A)]
DIPKA MINE
Sl.
No
Location Category Shift Min. Max
.
Avera
ge
CPCB
Noise
Standard
Assimilative
Capacity
Min Max. Avera
ge
1 CGM OFFICE
DIPKA
Industrial Day 54.99 61.89 58.44 75 13.11 20.01 16.56
Night 43.08 49.38 46.23 65 15.62 21.92 18.77
2 SILO
SWITCHING
STATION
Industrial Day 56.17 60.35 58.26 75 14.65 18.83 16.74
Night 49.29 51.58 50.435 65 13.42 15.71 14.565
3 BINJHRI
VILLAGE
Residential Day 44.8 49.84 47.32 55 5.16 10.2 7.68
Night 37.43 40.52 38.975 45 4.48 7.57 6.025
4 TIWARTA
VILLAGE
Residential Day 45.11 49.44 47.275 55 5.56 9.89 7.725
Night 38.75 41.13 39.94 45 3.87 6.25 5.06
5 URTA
VILLAGE
Residential Day 43.84 47.77 45.805 55 7.23 11.16 9.195
Night 36.99 39.82 38.405 45 5.18 8.01 6.595
6 GOBARGHOR
A VILLAGE
Residential Day 46.71 48.47 47.59 55 6.53 8.29 7.41
Night 36.94 38.32 37.63 45 6.68 8.06 7.37
7 SARAISINGAR
VILLAGE
Residential Day 44.98 47.67 46.325 55 7.33 10.02 8.675
Night 36.91 38.4 37.655 45 6.6 8.09 7.345
8 DHATURA
VILLAGE
Residential Day 44.07 46.52 45.295 55 8.48 10.93 9.705
Night 35.89 37.97 36.93 45 7.03 9.11 8.07
9 KATKIDABRI
VILLAGE
Residential Day 44.69 47.42 46.055 55 7.58 10.31 8.945
Night 37.56 39.08 38.32 45 5.92 7.44 6.68
10 CHHINDPUR
VILLAGE
Residential Day 48.14 51.27 49.705 55 3.73 6.86 5.295
Night 37.53 40.43 38.98 45 4.57 7.47 6.02
Shift Average Noise Level CPCB NOISE
STANDARD
Assimilative Capacity
Industrial Area Day 58.35 75 16.65
Night 48.3325 65 16.6675
Shift Average Noise Level CPCB NOISE
STANDARD
Assimilative Capacity
Residential Area Day 46.92125 55 8.07875
Night 38.35438 45 6.645625

Page | 151
Noise level measurements from various stations, as mentioned above, and it is found that
noise level at all villages are within permissible limits of the prescribed standards for both
day-time and night-time.
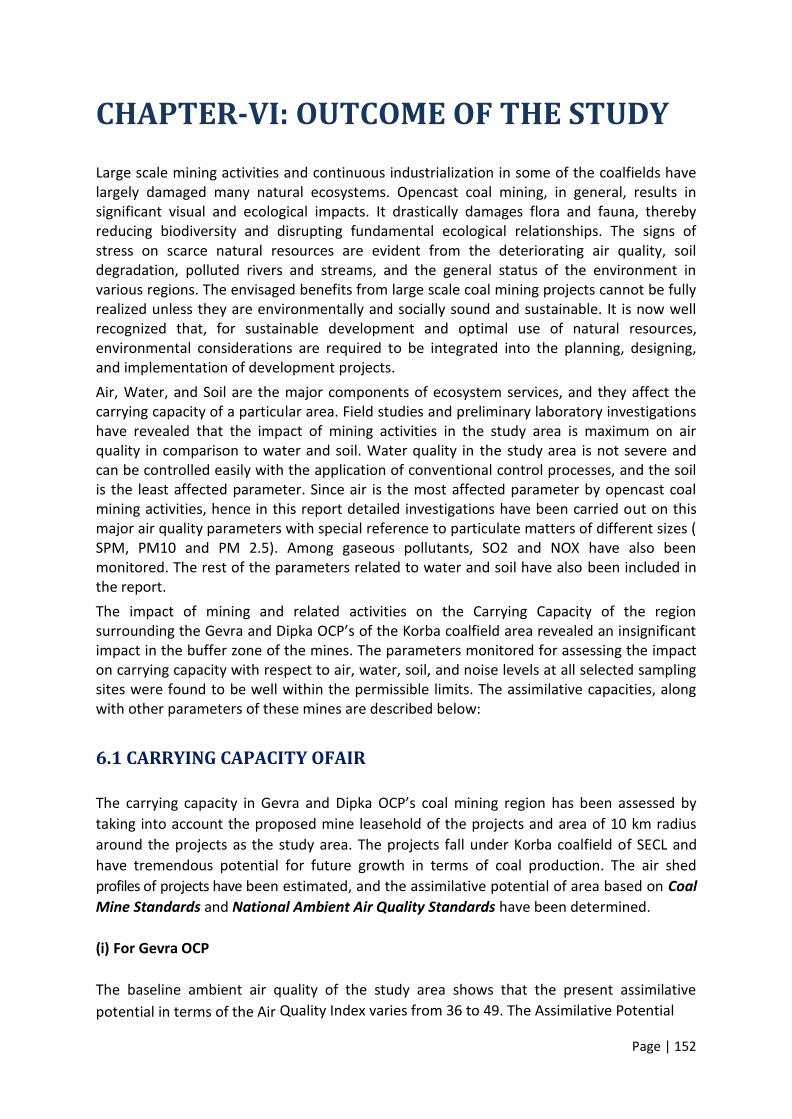
Page | 152
CHAPTER-VI: OUTCOME OF THE STUDY
Large scale mining activities and continuous industrialization in some of the coalfields have
largely damaged many natural ecosystems. Opencast coal mining, in general, results in
significant visual and ecological impacts. It drastically damages flora and fauna, thereby
reducing biodiversity and disrupting fundamental ecological relationships. The signs of
stress on scarce natural resources are evident from the deteriorating air quality, soil
degradation, polluted rivers and streams, and the general status of the environment in
various regions. The envisaged benefits from large scale coal mining projects cannot be fully
realized unless they are environmentally and socially sound and sustainable. It is now well
recognized that, for sustainable development and optimal use of natural resources,
environmental considerations are required to be integrated into the planning, designing,
and implementation of development projects.
Air, Water, and Soil are the major components of ecosystem services, and they affect the
carrying capacity of a particular area. Field studies and preliminary laboratory investigations
have revealed that the impact of mining activities in the study area is maximum on air
quality in comparison to water and soil. Water quality in the study area is not severe and
can be controlled easily with the application of conventional control processes, and the soil
is the least affected parameter. Since air is the most affected parameter by opencast coal
mining activities, hence in this report detailed investigations have been carried out on this
major air quality parameters with special reference to particulate matters of different sizes (
SPM, PM10 and PM 2.5). Among gaseous pollutants, SO2 and NOX have also been
monitored. The rest of the parameters related to water and soil have also been included in
the report.
The impact of mining and related activities on the Carrying Capacity of the region
su ou di g the Ge a a d Dipka OCP s of the Ko a oalfield a ea e ealed a i sig ifi a t impact in the buffer zone of the mines. The parameters monitored for assessing the impact
on carrying capacity with respect to air, water, soil, and noise levels at all selected sampling
sites were found to be well within the permissible limits. The assimilative capacities, along
with other parameters of these mines are described below:
6.1 CARRYING CAPACITY OFAIR
The a i g apa it i Ge a a d Dipka OCP s oal i i g egio has ee assessed taking into account the proposed mine leasehold of the projects and area of 10 km radius
around the projects as the study area. The projects fall under Korba coalfield of SECL and
have tremendous potential for future growth in terms of coal production. The air shed
profiles of projects have been estimated, and the assimilative potential of area based on Coal
Mine Standards and National Ambient Air Quality Standards have been determined.
(i) For Gevra OCP
The baseline ambient air quality of the study area shows that the present assimilative
potential in terms of the Air Quality Index varies from 36 to 49. The Assimilative Potential

Page | 153
for both–PM10 and PM2.5 have been estimated. It has been noted that the Assimilative
Potentialin terms of PM10 is still available in the area as it ranges from 27.9 µg/m3 to 144.9
µg/m3.TheAssimilativePotentialoftheatmosphereatselectedreceptorsinterms of PM2.5 varies
from20.2µg/m3 to 29.9 µg/m3. The above results show that the atmosphere will have
sufficient Assimilative Potential in terms of the level of PM2.5 and PM10 with the current
control measures adopted in mine for air quality management.
(ii) For Dipka OCP
The baseline ambient air quality in the study area shows that the present Assimilative
Potential in terms of the Air Quality Index varies from 22 to 63. The Assimilative Potential
for both–PM10 and PM2.5 have been estimated. It has been observed that the Assimilative
Potential with control measures in terms of PM10 is still available in the area, and it ranges
from 28.1 µg/m3 to 161.2 µg/m3. The Assimilative Potential of the atmosphere at selected
receptors in terms of PM2.5varies from 20.3 µg/m3 to 29.1 µg/m3. The above results show
that the atmosphere in the study has sufficient Assimilative Potential in terms of the level of
PM2.5 and PM10.
Air Quality is the critical limiting parameter for the future growth of mining in the region.
The Air Quality Index based on the Environmental Monitoring Report has been determined,
and the results exhibit poor category of Air Quality Index at some sampling sites in the study
area.ItisproposedthattheAirPollutionControlMeasuresandAirQuality Monitoring reports have
to be reviewed at fortnightly intervals to ensure that the air quality in and around the mine
area remains within the permissible limit.
6.2 CARRYING CAPACITY OFWATER
Gevra coal mining area, consists of seasonal nallahs that ultimately join the Ahiran river, and
the Dipka, coal mining area, consists of seasonal nallahs that ultimately join river Lilagarh.
The i e ate of oth OCP s is ei g utilized to the maximum possible extent in these
mines. The competing user requirements for the study area have been assessed with
respect to the availability of groundwater and the stages of groundwater development in
the core and buffer zones have been estimated to be safe. This shows that the project has
ample supportive capacity in terms of groundwater.
The quality of drinking water, surface water, and mine water of the study area have been
assessed, and the assimilative capacity of the water basin is endurable and will be able to
support mining activities in the area.
6.3 NOISE LEVEL IN THE AREA
The noise level in the study area of the Gevra area has been monitored for eleven receptors
– two receptors located within the core zone and the rest nine receptors located in the
buffer zone. Similarly, the noise level in the study area of the Dipka area has been
monitored for Ten receptors – two receptors located within the core zone and the rest eight
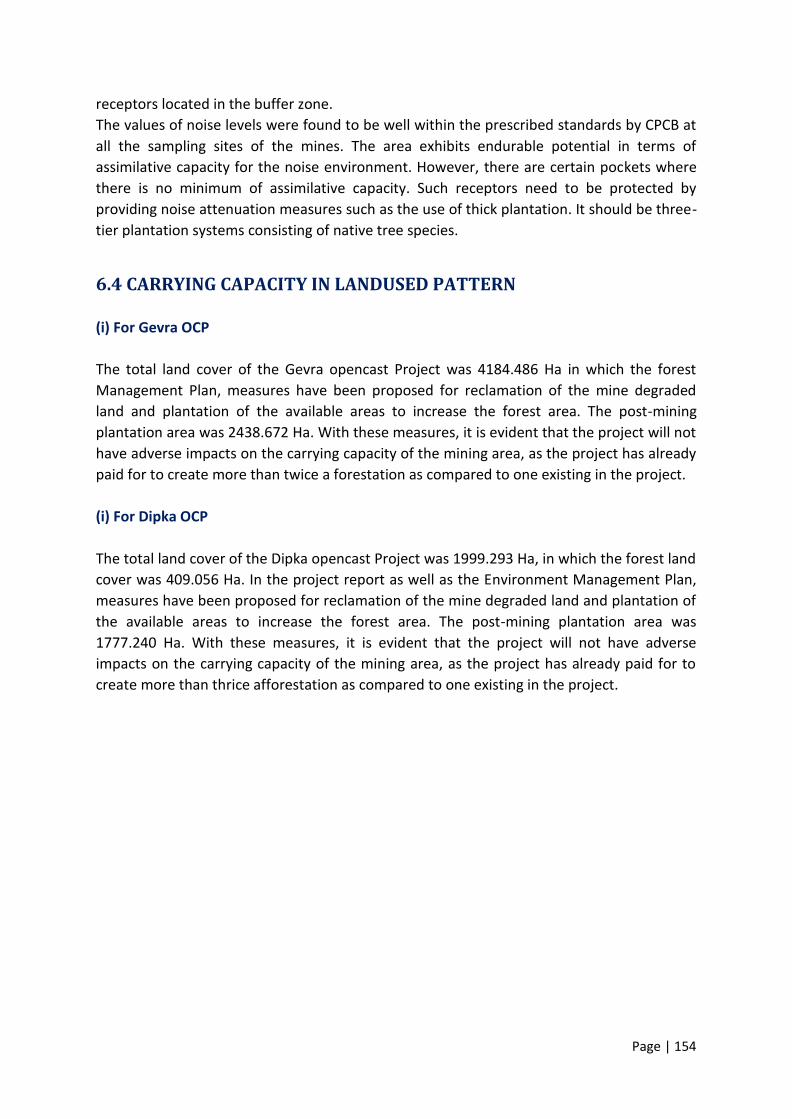
Page | 154
receptors located in the buffer zone.
The values of noise levels were found to be well within the prescribed standards by CPCB at
all the sampling sites of the mines. The area exhibits endurable potential in terms of
assimilative capacity for the noise environment. However, there are certain pockets where
there is no minimum of assimilative capacity. Such receptors need to be protected by
providing noise attenuation measures such as the use of thick plantation. It should be three-
tier plantation systems consisting of native tree species.
6.4 CARRYING CAPACITY IN LANDUSED PATTERN
(i) For Gevra OCP
The total land cover of the Gevra opencast Project was 4184.486 Ha in which the forest
Management Plan, measures have been proposed for reclamation of the mine degraded
land and plantation of the available areas to increase the forest area. The post-mining
plantation area was 2438.672 Ha. With these measures, it is evident that the project will not
have adverse impacts on the carrying capacity of the mining area, as the project has already
paid for to create more than twice a forestation as compared to one existing in the project.
(i) For Dipka OCP
The total land cover of the Dipka opencast Project was 1999.293 Ha, in which the forest land
cover was 409.056 Ha. In the project report as well as the Environment Management Plan,
measures have been proposed for reclamation of the mine degraded land and plantation of
the available areas to increase the forest area. The post-mining plantation area was
1777.240 Ha. With these measures, it is evident that the project will not have adverse
impacts on the carrying capacity of the mining area, as the project has already paid for to
create more than thrice afforestation as compared to one existing in the project.
Page | 155
CHAPTER-VII: CONCLUSIONS AND
RECOMMENDATIONS
7.1 CONCLUSIONS
It has been noted from the literature survey that even one million tons per year of coal
production from an opencast mine may significantly damage the surrounding eco-system to
an extent if proper control measures are not adopted in the mine. It is the control measures
adopted at various polluting sources that decide whether the carrying capacity of the eco-
system in the mining and surrounding area will be affected or not.
On examining the past mining records of Gevra and Dipka opencast mines, it is evident that
due to adoption of the effective pollution control measures in the mines at different levels
of excavation, the carrying capacity of the area around the mines was not much affected
because most of the important air and water quality parameters of the area were within the
permissible levels. Further, from field monitoring data collected with respect to air quality in
summer and winter seasons, it is evident that the control measures adopted by the mines
at most of the dust generating sources were effective, and the air quality of the area was
least affected even at the current production levels. It seems from an interpretation of the
collected data that the present coal production level of these mines is least affecting the
ecosystem services of both the area of Gevra and Dipka opencast mines. However, if coal
production has to be further increased, then additional effective control measures as
suggested in the recommendations have to be implemented in both the mines. It may,
however, be mentioned that our studies are primarily related to the impact on Air, Water,
Soil, and Noise levels as they are the relevant parameters for mining purposes. Some studies
were also carried out on the cropping system of the area, and it was noted that normal
agricultural activities are continuing in the area.
7.2 RECOMMENDATIONS
In order to reduce the environmental impact on ecosystem services, emphasis should be
given to the coal transportation system. If the coal is not damped correctly during
transportation, it releases a wide range of coal particle sizes in the environment. The larger
particles settle out of air quickly and are hazardous to the workers and those residing in the
immediate vicinity of the mine. AQI focuses on the dust of PM10 & PM2.5 particles. Such
finer particles (PM10 and PM2.5) are transported further and can cause health hazards. In
general, the dust can be controlled in the mines by (i) Sprinkling of water / fine water spray
from nozzles to suppress dust re-suspension at the site. (ii) Coal transported with proper
cover. The common dust control measures generally used in coal transportation are to cover
the coal by a sheet made of either jute, tarpaulin, plastic sheet, or any other effective
material. (III) In addition, to avoid the fall of coal from loaded trucks during transportation,
Page | 156
the trucks should not be overloaded. Road surfaces should be well maintained so that the
coal loaded tucks are not subjected to jerks. Regular periodic maintenance of the roads used
for transportation of coal and overburden has to be done to keep the roads free from
potholes. Dust emissions from unpaved surfaces are usually higher than from paved
surfaces. In the case of paved surfaces, the dust emissions can be minimized through
controlling the movement and handling of fine materials to prevent spillages on to the
paved surfaces. Remove mud and dust from the paved area regularly. At present, one
sweeping machine is deployed in each area. The effectiveness of the machine is to be
improved by increasing its running time, and some more such equipment has to be installed
in the future. Fixed and mobile sprinklers have been provided in the mines, some of them
are fitted with mist arrangement also. These machines are to be maintained properly for
giving good effective results. For effective dust suppression on haul roads and coal
transport roads, running time and frequency of different mobile sprinklers have to be
studied for different seasons, and machines are deployed accordingly. One long-range mist
spray machine is in operation in each area, number of such machines will be helpful to
reduce dust pollution as it can cover a large area and deployed at different locations in the
mine to suppress the PM10 and PM2.5 levels.
In many cases, the coal has to be transported over several kilometres. Water spraying under
such conditions would be major challenges because it needs regular sweeping to assist in
reducing re-suspension of dust due to the movement of trucks. To avoid such a problem,
truck transportation is replaced by belt conveyors particularly from coal loading points to
coal disposal points. In addition, the maintenance of existing conveyor belts should be
looked into to avoid the spillage of coal, minimization of break down period of conveyor
belts. Dust emissions from conveyors can be caused by wind pick up and through losses
during loading, discharge, and transfer points. Some of the options to be considered to
minimize dust picked up from conveyors are: (i) Use water spray or sprinklers or enclosures
at conveyor transfer points. (II) Regular clean-up of spillages around the transfer points and
any other places where this might occur. (Iii) Use of enclosed conveyor (closed belt conveyor
system) for coal transportation.
In addition to this, in most of the developed countries, exposure to airborne particulate
matter (PM2.5) has become a serious health issue in open cast coal mines. In India, also
owing to rising health concerns, particularly in an urban area, the uses of life-saving products
are gaining popularity. One such product is Pollution Mask, which filters out airborne
particles and prevents workers from exposure to harmful gases. Pollution masks consist of a
high-quality filter that fits on face accordingly and work effectively to prevent employees
against the inhalation of harmful pollutant particles such as PM2.5.
At the current level of production of 45MT at Gevra and 35MT in Dipka, the environmental
control measures adopted by these mines are adequate as per the studies conducted. These
control measures are sufficient to keep the environmental parameters Air, Water, Soil, and
Noise within the permissible limits.If the further expansion of these projects has to be
Page | 157
considered, then not only some additional equipment has to be deployed in the mines but
also innovative control measures available and used in other industries have to be
introduced in these mines in combination with the existing control units. The list of some
additional control measures to be deployed are long-range fogging machine, mechanical
road sweeping machine, wind barrier system, water spraying arrangements at strategic
points of dust generation, tyre washing arrangement at exit point of coal, use of closed belt
conveyor for coal transportation. The implementation of these dust control technology is
expected to result adequate management of dust emission from the mines.
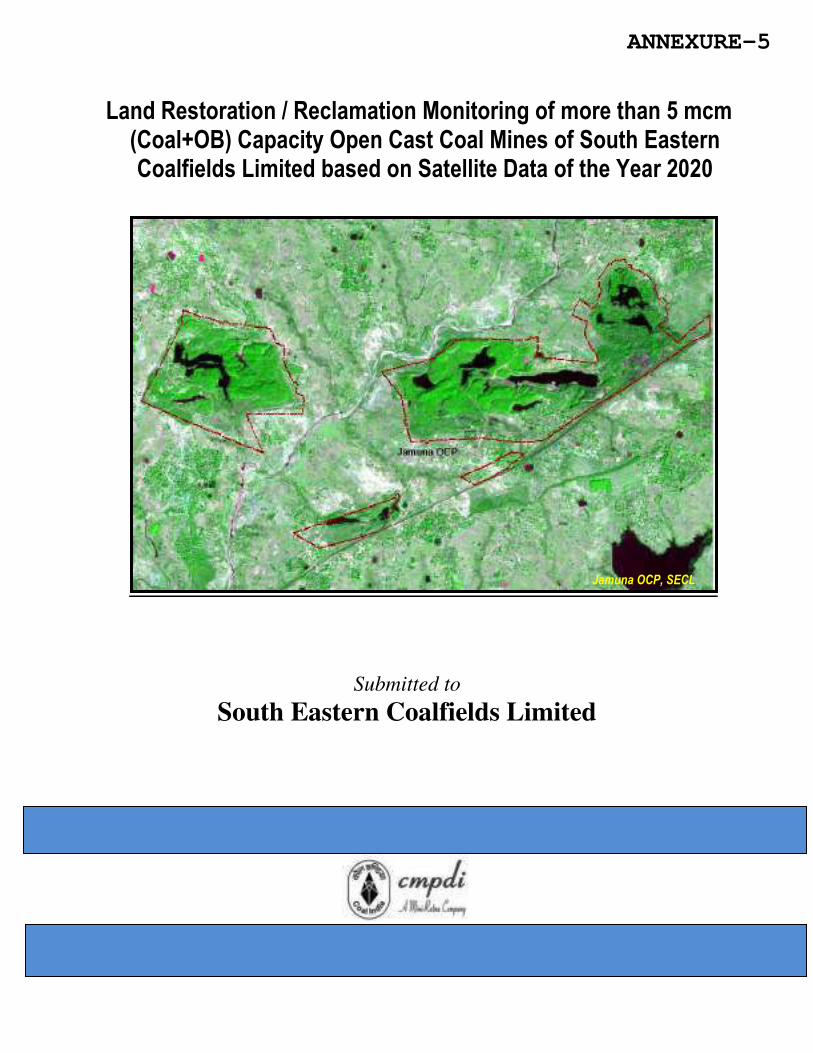
Land Restoration / Reclamation Monitoring of more than 5 mcm (Coal+OB) Capacity Open Cast Coal Mines of South Eastern Coalfields Limited based on Satellite Data of the Year 2020
Submitted to
South Eastern Coalfields Limited
Jamuna OCP, SECL
ANNEXURE-5
CMPDI
Job No 561410027/(SECL) i
Land Restoration / Reclamation Monitoring of more than 5 mcm (Coal+OB) Capacity Open Cast Coal Mines of South Eastern
Coalfields Limited Based on Satellite Data of the Year 2020
February-2021
Remote Sensing Cell Geomatics Division
CMPDI, Ranchi
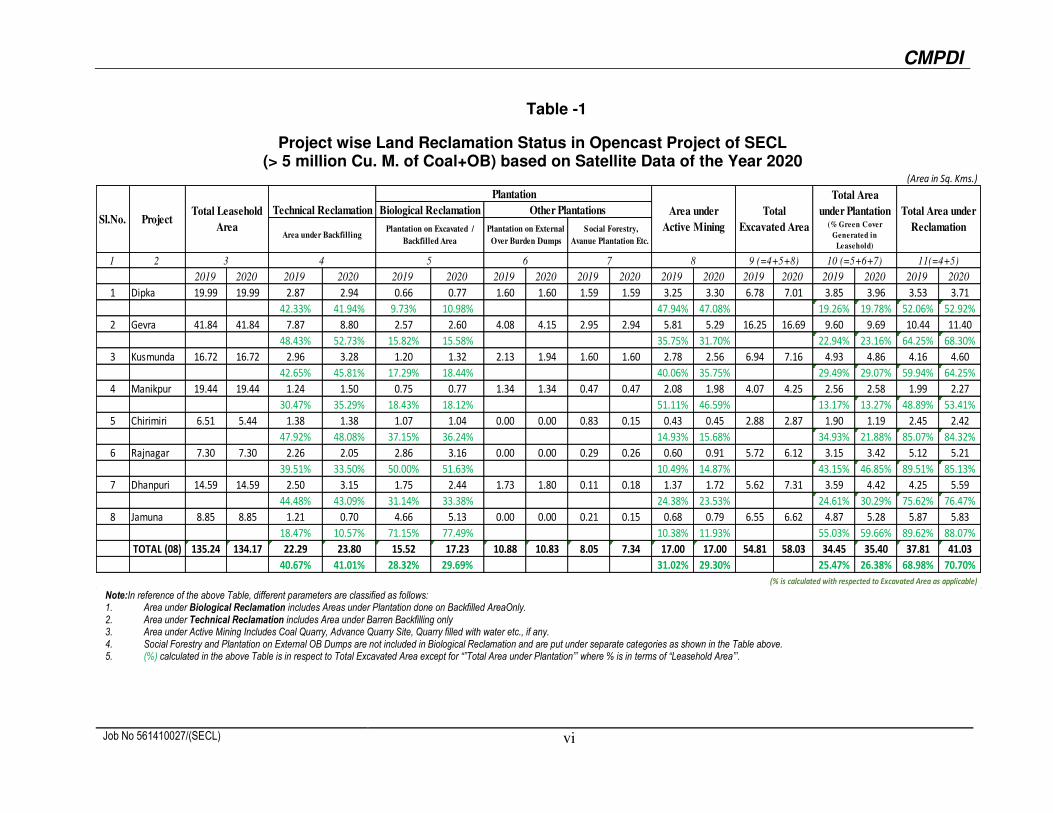
CMPDI
Job No 561410027/(SECL) vi
Table -1
Project wise Land Reclamation Status in Opencast Project of SECL (> 5 million Cu. M. of Coal+OB) based on Satellite Data of the Year 2020
Note:In reference of the above Table, different parameters are classified as follows: 1. Area under Biological Reclamation includes Areas under Plantation done on Backfilled AreaOnly. 2. Area under Technical Reclamation includes Area under Barren Backfilling only 3. Area under Active Mining Includes Coal Quarry, Advance Quarry Site, Quarry filled with water etc., if any. 4. Social Forestry and Plantation on External OB Dumps are not included in Biological Reclamation and are put under separate categories as shown in the Table above. 5. (%) calculated in the above Table is in respect to Total Excavated Area except for “”Total Area under Plantation”’ where % is in terms of “Leasehold Area”’.
1 2
2019 2020 2019 2020 2019 2020 2019 2020 2019 2020 2019 2020 2019 2020 2019 2020 2019 2020
1 Dipka 19.99 19.99 2.87 2.94 0.66 0.77 1.60 1.60 1.59 1.59 3.25 3.30 6.78 7.01 3.85 3.96 3.53 3.71
42.33% 41.94% 9.73% 10.98% 47.94% 47.08% 19.26% 19.78% 52.06% 52.92%
2 Gevra 41.84 41.84 7.87 8.80 2.57 2.60 4.08 4.15 2.95 2.94 5.81 5.29 16.25 16.69 9.60 9.69 10.44 11.40
48.43% 52.73% 15.82% 15.58% 35.75% 31.70% 22.94% 23.16% 64.25% 68.30%
3 Kusmunda 16.72 16.72 2.96 3.28 1.20 1.32 2.13 1.94 1.60 1.60 2.78 2.56 6.94 7.16 4.93 4.86 4.16 4.60
42.65% 45.81% 17.29% 18.44% 40.06% 35.75% 29.49% 29.07% 59.94% 64.25%
4 Manikpur 19.44 19.44 1.24 1.50 0.75 0.77 1.34 1.34 0.47 0.47 2.08 1.98 4.07 4.25 2.56 2.58 1.99 2.27
30.47% 35.29% 18.43% 18.12% 51.11% 46.59% 13.17% 13.27% 48.89% 53.41%
5 Chirimiri 6.51 5.44 1.38 1.38 1.07 1.04 0.00 0.00 0.83 0.15 0.43 0.45 2.88 2.87 1.90 1.19 2.45 2.42
47.92% 48.08% 37.15% 36.24% 14.93% 15.68% 34.93% 21.88% 85.07% 84.32%
6 Rajnagar 7.30 7.30 2.26 2.05 2.86 3.16 0.00 0.00 0.29 0.26 0.60 0.91 5.72 6.12 3.15 3.42 5.12 5.21
39.51% 33.50% 50.00% 51.63% 10.49% 14.87% 43.15% 46.85% 89.51% 85.13%
7 Dhanpuri 14.59 14.59 2.50 3.15 1.75 2.44 1.73 1.80 0.11 0.18 1.37 1.72 5.62 7.31 3.59 4.42 4.25 5.59
44.48% 43.09% 31.14% 33.38% 24.38% 23.53% 24.61% 30.29% 75.62% 76.47%
8 Jamuna 8.85 8.85 1.21 0.70 4.66 5.13 0.00 0.00 0.21 0.15 0.68 0.79 6.55 6.62 4.87 5.28 5.87 5.83
18.47% 10.57% 71.15% 77.49% 10.38% 11.93% 55.03% 59.66% 89.62% 88.07%
TOTAL (08) 135.24 134.17 22.29 23.80 15.52 17.23 10.88 10.83 8.05 7.34 17.00 17.00 54.81 58.03 34.45 35.40 37.81 41.03
40.67% 41.01% 28.32% 29.69% 31.02% 29.30% 25.47% 26.38% 68.98% 70.70%
(Area in Sq. Kms.)
Sl.No. ProjectTechnical Reclamation
Plantation
Area under
Active Mining
Total
Excavated Area
Total Leasehold
Area
Total Area
under Plantation (% Green Cover
Generated in
Leasehold)
Total Area under
Reclamation
Biological Reclamation Other Plantations
Area under BackfillingPlantation on Excavated /
Backfilled Area
Plantation on External
Over Burden Dumps
Social Forestry,
Avanue Plantation Etc.
3 10 (=5+6+7) 11(=4+5)
(% is calculated with respected to Excavated Area as applicable)
4 5 6 7 8 9 (=4+5+8)
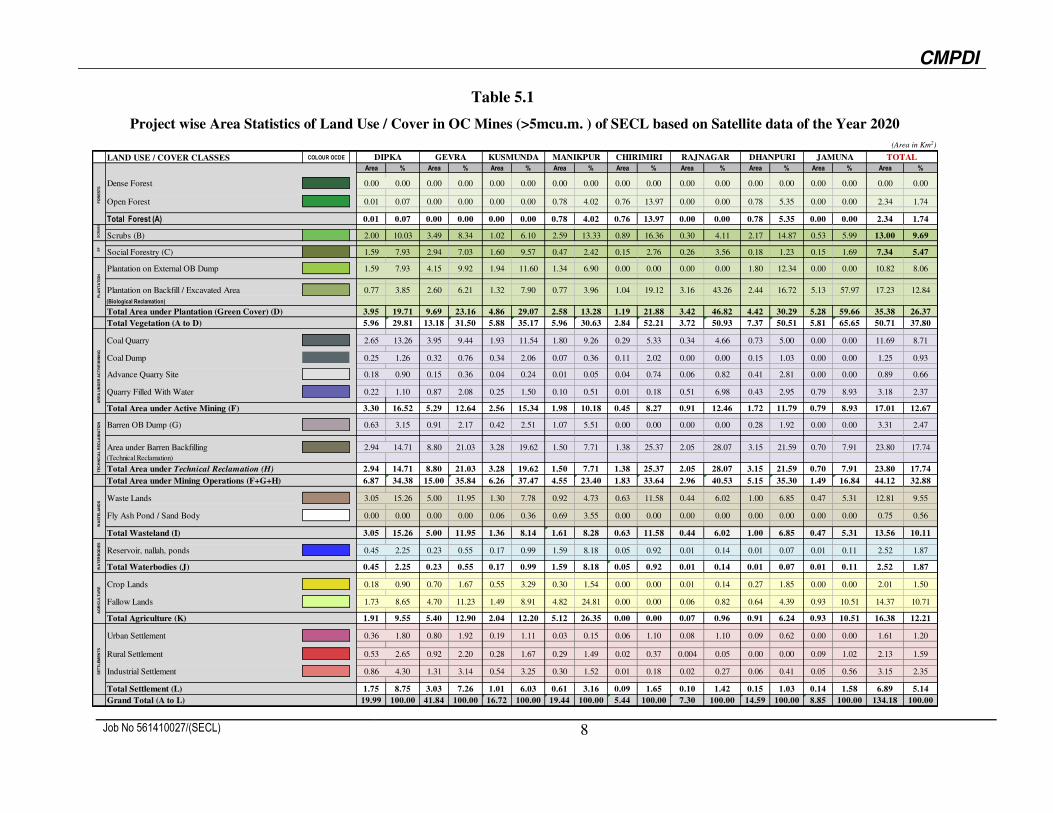
CMPDI
Job No 561410027/(SECL) 8
Table 5.1
Project wise Area Statistics of Land Use / Cover in OC Mines (>5mcu.m. ) of SECL based on Satellite data of the Year 2020
(Area in Km2)
LAND USE / COVER CLASSES COLOUR OCDE
Area % Area % Area % Area % Area % Area % Area % Area % Area %
Dense Forest 0.00 0.00 0.00 0.00 0.00 0.00 0.00 0.00 0.00 0.00 0.00 0.00 0.00 0.00 0.00 0.00 0.00 0.00
Open Forest 0.01 0.07 0.00 0.00 0.00 0.00 0.78 4.02 0.76 13.97 0.00 0.00 0.78 5.35 0.00 0.00 2.34 1.74
Total Forest (A) 0.01 0.07 0.00 0.00 0.00 0.00 0.78 4.02 0.76 13.97 0.00 0.00 0.78 5.35 0.00 0.00 2.34 1.74
Scrubs (B) 2.00 10.03 3.49 8.34 1.02 6.10 2.59 13.33 0.89 16.36 0.30 4.11 2.17 14.87 0.53 5.99 13.00 9.69
Social Forestry (C) 1.59 7.93 2.94 7.03 1.60 9.57 0.47 2.42 0.15 2.76 0.26 3.56 0.18 1.23 0.15 1.69 7.34 5.47
Plantation on External OB Dump 1.59 7.93 4.15 9.92 1.94 11.60 1.34 6.90 0.00 0.00 0.00 0.00 1.80 12.34 0.00 0.00 10.82 8.06
Plantation on Backfill / Excavated Area 0.77 3.85 2.60 6.21 1.32 7.90 0.77 3.96 1.04 19.12 3.16 43.26 2.44 16.72 5.13 57.97 17.23 12.84
(Biological Reclamation)
Total Area under Plantation (Green Cover) (D) 3.95 19.71 9.69 23.16 4.86 29.07 2.58 13.28 1.19 21.88 3.42 46.82 4.42 30.29 5.28 59.66 35.38 26.37
Total Vegetation (A to D) 5.96 29.81 13.18 31.50 5.88 35.17 5.96 30.63 2.84 52.21 3.72 50.93 7.37 50.51 5.81 65.65 50.71 37.80
Coal Quarry 2.65 13.26 3.95 9.44 1.93 11.54 1.80 9.26 0.29 5.33 0.34 4.66 0.73 5.00 0.00 0.00 11.69 8.71
Coal Dump 0.25 1.26 0.32 0.76 0.34 2.06 0.07 0.36 0.11 2.02 0.00 0.00 0.15 1.03 0.00 0.00 1.25 0.93
Advance Quarry Site 0.18 0.90 0.15 0.36 0.04 0.24 0.01 0.05 0.04 0.74 0.06 0.82 0.41 2.81 0.00 0.00 0.89 0.66
Quarry Filled With Water 0.22 1.10 0.87 2.08 0.25 1.50 0.10 0.51 0.01 0.18 0.51 6.98 0.43 2.95 0.79 8.93 3.18 2.37
Total Area under Active Mining (F) 3.30 16.52 5.29 12.64 2.56 15.34 1.98 10.18 0.45 8.27 0.91 12.46 1.72 11.79 0.79 8.93 17.01 12.67
Barren OB Dump (G) 0.63 3.15 0.91 2.17 0.42 2.51 1.07 5.51 0.00 0.00 0.00 0.00 0.28 1.92 0.00 0.00 3.31 2.47
Area under Barren Backfilling 2.94 14.71 8.80 21.03 3.28 19.62 1.50 7.71 1.38 25.37 2.05 28.07 3.15 21.59 0.70 7.91 23.80 17.74
(Technical Reclamation)
Total Area under Technical Reclamation (H) 2.94 14.71 8.80 21.03 3.28 19.62 1.50 7.71 1.38 25.37 2.05 28.07 3.15 21.59 0.70 7.91 23.80 17.74
Total Area under Mining Operations (F+G+H) 6.87 34.38 15.00 35.84 6.26 37.47 4.55 23.40 1.83 33.64 2.96 40.53 5.15 35.30 1.49 16.84 44.12 32.88
Waste Lands 3.05 15.26 5.00 11.95 1.30 7.78 0.92 4.73 0.63 11.58 0.44 6.02 1.00 6.85 0.47 5.31 12.81 9.55
Fly Ash Pond / Sand Body 0.00 0.00 0.00 0.00 0.06 0.36 0.69 3.55 0.00 0.00 0.00 0.00 0.00 0.00 0.00 0.00 0.75 0.56
Total Wasteland (I) 3.05 15.26 5.00 11.95 1.36 8.14 1.61 8.28 0.63 11.58 0.44 6.02 1.00 6.85 0.47 5.31 13.56 10.11
Reservoir, nallah, ponds 0.45 2.25 0.23 0.55 0.17 0.99 1.59 8.18 0.05 0.92 0.01 0.14 0.01 0.07 0.01 0.11 2.52 1.87
Total Waterbodies (J) 0.45 2.25 0.23 0.55 0.17 0.99 1.59 8.18 0.05 0.92 0.01 0.14 0.01 0.07 0.01 0.11 2.52 1.87
Crop Lands 0.18 0.90 0.70 1.67 0.55 3.29 0.30 1.54 0.00 0.00 0.01 0.14 0.27 1.85 0.00 0.00 2.01 1.50
Fallow Lands 1.73 8.65 4.70 11.23 1.49 8.91 4.82 24.81 0.00 0.00 0.06 0.82 0.64 4.39 0.93 10.51 14.37 10.71
Total Agriculture (K) 1.91 9.55 5.40 12.90 2.04 12.20 5.12 26.35 0.00 0.00 0.07 0.96 0.91 6.24 0.93 10.51 16.38 12.21
Urban Settlement 0.36 1.80 0.80 1.92 0.19 1.11 0.03 0.15 0.06 1.10 0.08 1.10 0.09 0.62 0.00 0.00 1.61 1.20
Rural Settlement 0.53 2.65 0.92 2.20 0.28 1.67 0.29 1.49 0.02 0.37 0.004 0.05 0.00 0.00 0.09 1.02 2.13 1.59
Industrial Settlement 0.86 4.30 1.31 3.14 0.54 3.25 0.30 1.52 0.01 0.18 0.02 0.27 0.06 0.41 0.05 0.56 3.15 2.35
Total Settlement (L) 1.75 8.75 3.03 7.26 1.01 6.03 0.61 3.16 0.09 1.65 0.10 1.42 0.15 1.03 0.14 1.58 6.89 5.14
Grand Total (A to L) 19.99 100.00 41.84 100.00 16.72 100.00 19.44 100.00 5.44 100.00 7.30 100.00 14.59 100.00 8.85 100.00 134.18 100.00
RAJNAGAR
AG
RIC
UL
TU
RE
SE
TT
LE
ME
NT
S
DHANPURI JAMUNA TOTAL
FO
RE
ST
SS
CR
UB
SP
LA
NT
AT
ION
AR
EA
UN
DE
R A
CT
IVE
MIN
ING
TE
CH
NIC
AL
RE
CL
AIM
AT
ION
WA
ST
EL
AN
DS
WA
TE
RB
OD
IES
SF
DIPKA GEVRA KUSMUNDA MANIKPUR CHIRIMIRI

CMPDI
Job No 561410027/(SECL) 9
Plate – 1
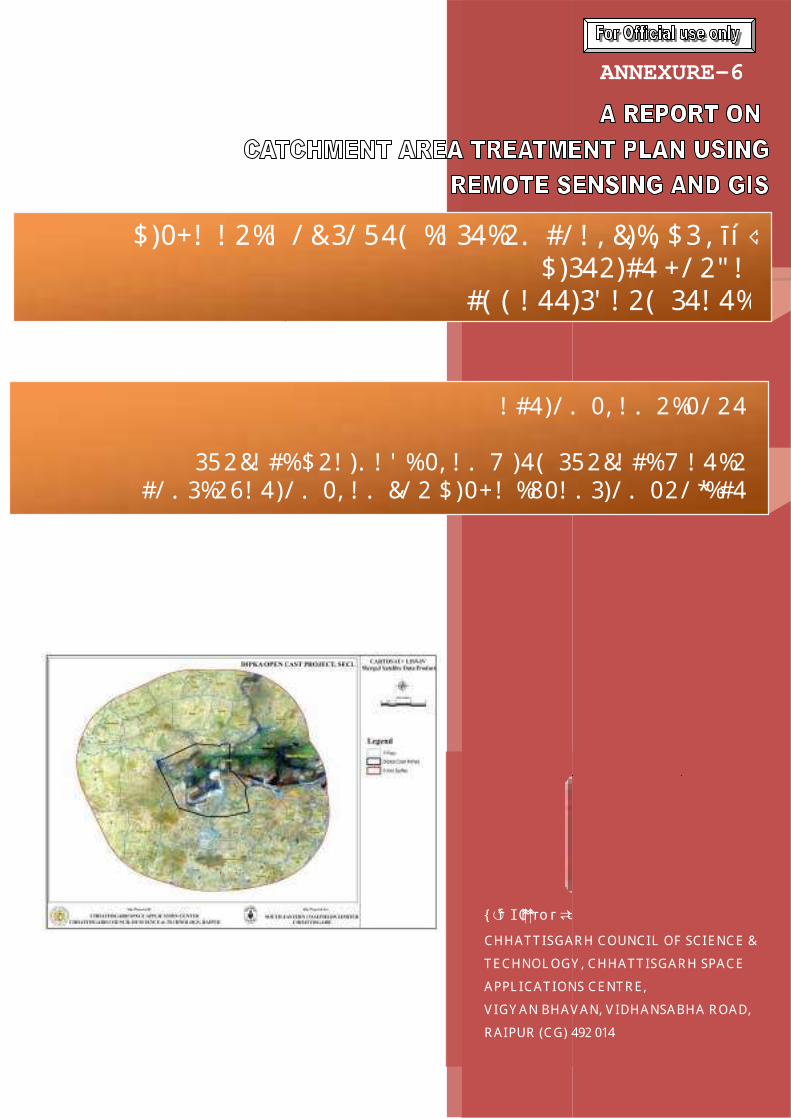
D)0+A A 2EA / & 3/ 54( EA 34E2. C/ A b &)Eb D3 b td ,
352&A CE D 2A ). A G E 0b A . 7 )4( 352&A CE 7 A 4E2 C/ . 3E26A 4)/ . 0b A . &/ 2 D )0+ A E80A . 3)/ . 02/ *EC4
Su itted y:
CHHAT T ISGAR H COUNCIL OF S
T E CHNOL OGY b CHHAT T ISGAR H SPACE
APPL ICAT IONS CE NT R E b
V IGY AN BHAV ANb V IDHANSABHA R OAD
R AIPUR (CG) 492
A 2EA / & 3/ 54( EA 34E2. C/ A b &)Eb D3 b td , D)342)C4
C( ( A 44)3G A 2( 34A 4E
A C4)/ . 0b A . 2E0/ 24
352&A CE D 2A ). A G E 0b A . 7 )4( 352&A CE 7 A 4E2 C/ . 3E26A 4)/ . 0b A . &/ 2 D )0+ A E80A . 3)/ . 02/ *EC4
CHHAT T ISGAR H COUNCIL OF SCIE NC E &
T E CHNOL OGY b CHHAT T ISGAR H SPACE
APPL ICAT IONS CE NT R E b
V IGY AN BHAV ANb V IDHANSABHA R OADb
492 014
A 2EA / & 3/ 54( EA 34E2. C/ A b &)Eb D3 b td , D)342)C4 +/ 2B A
C( ( A 44)3G A 2( 34A 4E
A C4)/ . 0b A . 2E0/ 24
352&A CE D 2A ). A G E 0b A . 7 )4( 352&A CE 7 A 4E2 C/ . 3E26A 4)/ . 0b A . &/ 2 D )0+ A E80A . 3)/ . 02/ *EC4
ANNEXURE-6

i
Table of Content
List of Figures ............................................................................................................................. ii List of Tables .............................................................................................................................. ii Preamble .................................................................................................................................... iii 1. Technical Proposal .............................................................................................................. 1
1.1. Study area ...............................................................................................................................1 1.2. Scope of the work ...................................................................................................................3 1.3. Work Elements .......................................................................................................................4 1.4. Methodology Adopted ............................................................................................................6 1.5. Satellite data Processing .........................................................................................................6 1.6. Outputs ...................................................................................................................................7 1.7. Snapshots of the SECL Area ..................................................................................................8
2. Erosion Control Recommendations ................................................................................... 24 2.1. Field Observation of Erosion and Sediment Sources ...........................................................24 2.2. Weightages assigned ............................................................................................................25 2.3. SubcWatershed Prioritization ...............................................................................................27
2.3.1. Objectives of Erosion Control Measures ..........................................................................29 2.4. Other Erosion and Sediment Control Measures ...................................................................29
2.4.1. Settling tanks/Ditching .....................................................................................................29 2.4.2. Revegetation .....................................................................................................................29 2.4.3. Silt Fencing .......................................................................................................................30 2.4.4. Sheeting/Matting ..............................................................................................................30 2.4.5. Proposed Species for Plantation .......................................................................................30
ii
L ist of F igures
Figure 1c1 Regional Location of SECL Project Area ..............................................................................2 Figure 1c2 SECL Area location with Satellite Data Footprints ................................................................6 Figure 1c3 Population Density of villages around SECL project area .....................................................8 Figure 1c4 L iteracy of villages around SECL project area .......................................................................9 Figure 1c5 Dipka Project Area as viewed on CARTOSAT+ L ISScIV merged Satellite data Product ..10 Figure 1c6 Geology of Dipka Project Area ...........................................................................................11 Figure 1c7 Geological Structures of Dipka Project Area ......................................................................12 Figure 1c8 Geomorphology of Dipka Project Area (Based on Satellite data interpretation) ................13 Figure 1c9 Existing Landuse of Dipka Project Area (Based on Satellite data interpretation) ................14 Figure 1c10 Slope of Dipka Project Area ...............................................................................................15 Figure 1c11 Drainage of Dipka Project Area .........................................................................................16 Figure 1c12 Waterbodies of Dipka Project Area ....................................................................................17 Figure 1c13 Watersheds of Dipka Project Area (Based on NBSSLUP Atlas) .......................................18 Figure 1c14 Transport Infrastructure of Dipka Project Area ..................................................................19 Figure 1c15 Settlement Locations around Dipka Project Area...............................................................20 Figure 1c16 V illage Boundaries within Dipka Project Area ..................................................................21 Figure 1c17 Forest Boundaries within Dipka Project Area ....................................................................22 Figure 1c18 Cadastral Details (Transformed on 1:10b000 scale) within Dipka Project Area .................23 Figure 2c1 Erosion Potential areas within Dipka Project Area ..............................................................26 Figure 2c2 Prioritize Subcwatershed within Dipka Project Area ............................................................27 Figure 2c3 Action Plan for Surface Drainage including Surface Conservation Plan within Dipka
Project Area ....................................................................................................................................28
L ist of Tables
Table 2c1 Landuse Recommendations ...................................................................................................24 Table 2c2 Erosion Control Recommendations .......................................................................................24 Table 2c3 Weightages assigned to each thematic class ..........................................................................25 Table 2c4 Recommended Species of Plants ...........................................................................................31

iii
Preamble
Effective utilization of natural resources and their management is essential for the growth and development of any economy. This requires systematic planning so that development issues do not come in the way of environmental considerations. K eeping the environmental issues in mind while planning is the most crucial ingredient for any development planning. Reliable and timely information on resources is precrequisite for the mining development of a plan.
V arious central and state departments are involved in the process of monitoring the Environmental impact of anthropogenic activities. Information on natural resources when viewed on a Satellite Data gives a synoptic view of the area of interest and thematic interpretation is possible to identify areas that need specific attention for initiating conservation measures.
GIS and Remote Sensing over the years have served a useful tool for decision support. Most of the information is not available in the form that they can be directly depicted spatially over various other layers. This information is mostly available in tabular format and spread over many departments. GIS and Remote Sensing allows us to transform information from various sources to one platform and enables decisions or planning exercises in a scientific and timely manner for the benefit of the target group.
The Council has established Chhattisgarh Space Applications Centre to monitor the States natural resources. The CGSAC has been established:
a. To carry out all work related to Remote Sensing Applications and GIS for the State of Chhattisgarh.
b. To carry out work related to Satellite Communications for Trainingb Education and Healthb etc. for the State of Chhattisgarh.
c. To take up the National projects within the State as well as outside the State.
The CGSAC also promotes training in Remote Sensing/GIS technology for the various line departments and students & faculty members of various Universities and colleges to popularize the techniques.
Chhattisgarh Space Applications Centre of Chhattisgarh Council of Science and Technology over the years has built inchouse capacity to takecup tasks that are information intensive and require scientific data interpretation skills for natural resource mapping and GIS database creation. CGSAC of the council has well trained team of Senior Scientists to undertake this task.
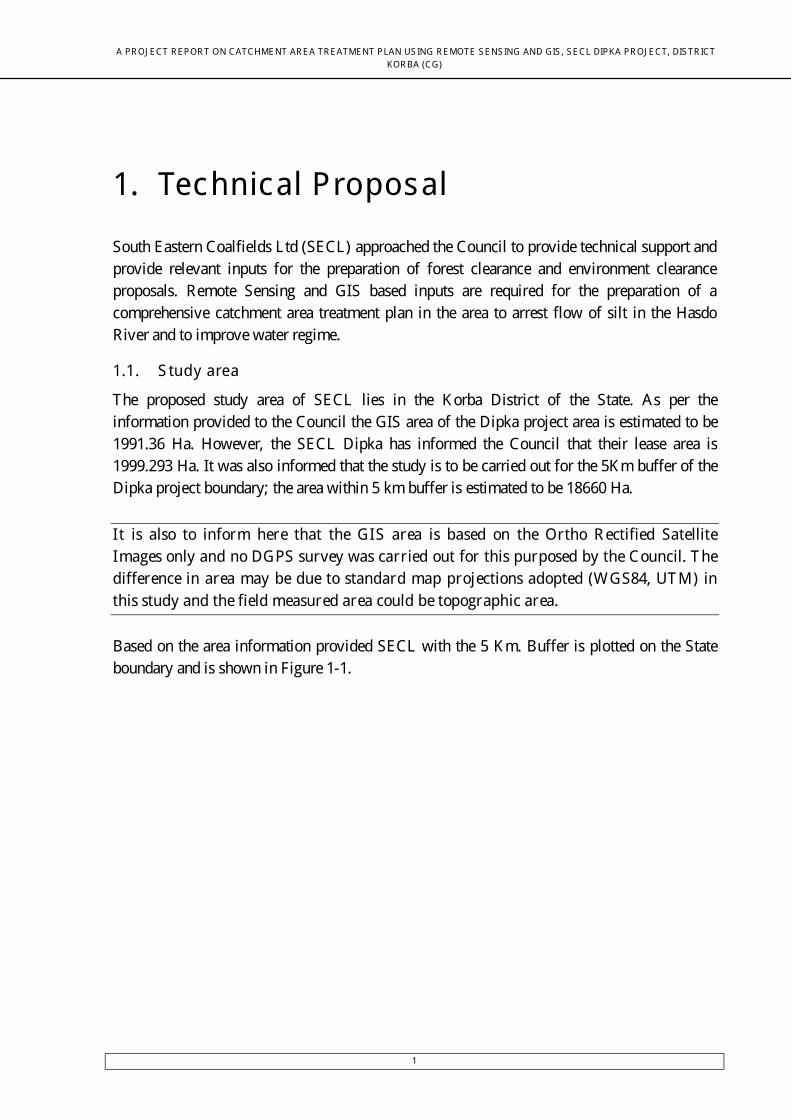
A PR OJ E CT R E POR T ON CATCHME NT AR E A TR E ATME NT PLAN US ING R E MOTE S E NS ING AND GIS b S E CL DIPKA PR OJ E CTb DIS TR ICT KOR BA (CG)
1
1. Technical Proposal
South Eastern Coalfields Ltd (SECL) approached the Council to provide technical support and provide relevant inputs for the preparation of forest clearance and environment clearance proposals. Remote Sensing and GIS based inputs are required for the preparation of a comprehensive catchment area treatment plan in the area to arrest flow of silt in the Hasdo River and to improve water regime.
1.1. S tudy area
The proposed study area of SECL lies in the K orba District of the State. As per the information provided to the Council the GIS area of the Dipka project area is estimated to be 1991.36 Ha. Howeverb the SECL Dipka has informed the Council that their lease area is 1999.293 Ha. It was also informed that the study is to be carried out for the 5K m buffer of the Dipka project boundary; the area within 5 km buffer is estimated to be 18660 Ha. It is also to inform here that the GIS area is based on the Ortho R ectified Satellite Images only and no DGPS survey was carried out for this purposed by the Council. T he difference in area may be due to standard map projections adopted (WGS84b UT M) in this study and the field measured area could be topographic area. Based on the area information provided SECL with the 5 K m. Buffer is plotted on the State boundary and is shown in Figure 1c1.
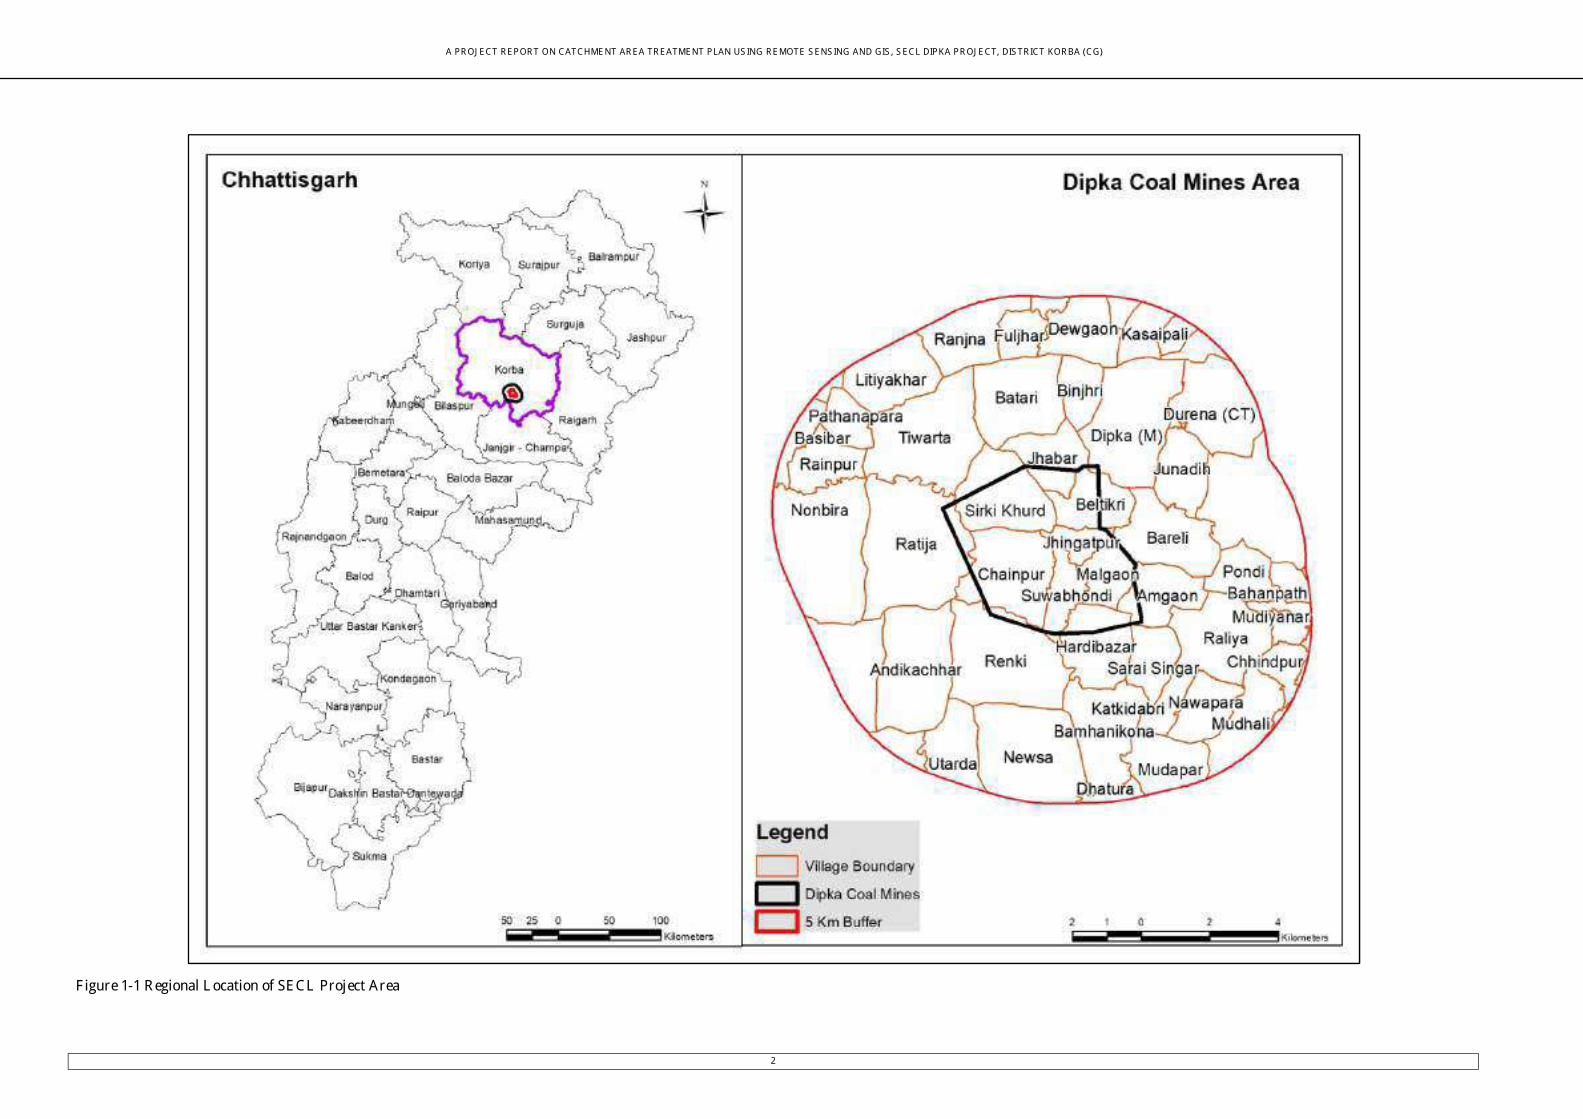
A PR OJ E CT R E POR T ON CATCHME NT AR E A TR E ATME NT PLAN US ING R E MOTE S E NS ING AND GIS b S E CL DIPKA PR OJ E CTb DIS TR ICT KOR BA (CG)
2
F igure 1c1 R egional L ocation of SE CL Project Area

A PR OJ E CT R E POR T ON CATCHME NT AR E A TR E ATME NT PLAN US ING R E MOTE S E NS ING AND GIS b S E CL DIPKA PR OJ E CTb DIS TR ICT KOR BA (CG)
3
1.2. S cope of the work
The Scope of the work indicated by the SECL vide letter no. SECL/DA/ENV T/2018/1320 dated 02/11/2018 is as under: The study to be carried out by the council should enable the South Eastern Coalfields Ltd. to address the issues:
1. The problem of silt and debris load to river from the susceptible areas of the catchment based on Universal Soil Loss Equation (USLE) and field observation.
2. Checking the sediment load from the tributaries directly discharging into the river.
3. Protecting the directly draining catchment from scouring / sloughing 4. Mitigative measures for the erosion and other hazards resulting from the
project activities After carefully going through the requirementsb Council proposes to process and generate the following maps to meet the requirements of SECL:
1. Rectification & Geo Coding of High Resolution 2. Satellite data based interpretation of Geology. 3. Overlay of Geological Structures on the Geology map. 4. Landuse/landcover of the area 5. Geomorphological setup 6. Slope 7. Drainage network 8. Surface waterbody 9. Infrastructure facilities including details of existing features:
a. Road b. Rail c. Settlement locations
10. V illage boundary with 2011 census based socioceconomic profile 11. Forest & Cadastral information. 12. Action plan for soil and water conservation

A PR OJ E CT R E POR T ON CATCHME NT AR E A TR E ATME NT PLAN US ING R E MOTE S E NS ING AND GIS b S E CL DIPKA PR OJ E CTb DIS TR ICT KOR BA (CG)
4
1.3. Work E lements
Council’s proposal against each of the work element indicated by SECL are enumerated below for getting technical consent from SECL:
Sl As indicated by SE CL L td.
Council’s Proposal R emarks
1 E stimation of soil erosion
Council proposes to use Universal Soil Loss Equation to identify and delineate areas that are prone to erosion
Widely used in erosion related research studies.
a Study of drainage pattern of the catchment area
Council shall create drainage network map from Survey of India toposheets and High Resolution satellite images created under SIScDP project
Standard procedure adopted in GIS studies
b Delineation of watersheds and subcwatersheds of free draining catchment
Council shall use the National Atlas of Watersheds published by National Bureau of Soil Survey an Landuse Survey as standard base and subdivide the published watershed boundaries into smaller manageable Microb Minib Milli cwatersheds
Standard procedure adopted in GIS studies
c Assessment of slope of the catchment area
Council shall generate slope from the DEM generated from the CARTOSAT – 1 Stereo images
Slope based on DEM at 10 mts. Posting is available.
d L and use and land cover mapping using remote sensing and GIS
Council shall create landuse/landcover map of the entire study area. Using existing satellite images and 10 mts pixel images available in free domain. (SECL provided boundary) As per initial estimated the GIS areas of the mine is = 1991.36 Ha. And SECL Reported area is 1999.293 Ha. And the 5 km buffer of the boundary amounts to = 18660 Ha)
The boundary provided by SECL has been used and a buffer of 5 kms shall be created.
e Study of soil parameters under directly draining area
Council has soil physiographic class maps of the study areab which would be provided as deliverables.
Not fresh mapping required.
f Study of soil detailsb silt yield and its delivery potential
Council proposes to use Universal Soil Loss Equation to identify and delineate areas that are prone to erosion
Widely used in erosion related research studies.
A PR OJ E CT R E POR T ON CATCHME NT AR E A TR E ATME NT PLAN US ING R E MOTE S E NS ING AND GIS b S E CL DIPKA PR OJ E CTb DIS TR ICT KOR BA (CG)
5
Sl As indicated by SE CL L td.
Council’s Proposal R emarks
2 Prioritization of Subcwatersheds
Based on the intensity in erosion the watersheds shall be prioritized
c
a Preparation of a framework of subcwatersheds
The framework shall be based on the enumeration at point no. 1b
No separate effort is required
b Generation of a map indicating erosioncintensity
Council shall generate erosioncintensity map based on the results of the processing enumerated at 1f
Output maps shall be presented on A3 paper with the final report.
c Assignment of weightage values to various mapping units
Council shall use the landuse/ landcoverb soil and erosion intensity maps as input to derive Prioritization of watersheds
As adopted in multi criteria analysis in GIS.
d Assignment of maximum delivery ratios to various erosion intensity mapping units and assessment of adjusted delivery ratios for different subcwatersheds
As universal soil loss equation shall be usedb the outputs should suffice the present need
Not fresh analysis will be carried out.
e Computing SiltcY ield Index for individual subcwatersheds
As universal soil loss equation shall be usedb the outputs should suffice the present need
Not fresh analysis will be carried out.
f Grading of subcwatersheds for prioritization
As indicated in 2c c
3 Identification of area for Comprehensive Area T reatment
As indicated in 2c c
4 Preparation of Schedule of Implementation
Council shall generate a suggestive action plan map of the 18660 Ha study area.
c

A PR OJ E CT R E POR T ON CATCHME NT AR E A TR E ATME NT PLAN US ING R E MOTE S E NS ING AND GIS b S E CL DIPKA PR OJ E CTb DIS TR ICT KOR BA (CG)
6
Sl As indicated by SE CL L td.
Council’s Proposal R emarks
5 Preparation of treatment measures and their cost estimate
Actual engineering design of each structure and their costing shall be prepared by SECL/officers of irrigation departments
Beyond the Council’s purview
For the aboveb South Eastern Coalfields Ltd. provided work order to the council.
1.4. Methodology Adopted
As per the needs identified in Section 1b Council proposes following methodology:
1.5. S atellite data Processing
Council shall process the CARTOSAT and suitable LISScIV satellite data so as to enable 1:10b000 scale mapping of the feature in the 5 K m. Buffer of SECL area. The total area to be mapped is estimated to be about 186.60 Sq.K m (18660 Ha.). The area of interest (18660 Ha) falls in one RESOURCESATc1b L ISScIV Mx scenes and three CARTOSATc1 scenes. Figure 1c2 shows the SECL area with 5 K m. buffer and satellite data foot prints.
F igure 1c2 SE CL Area location with Satellite Data Footprints
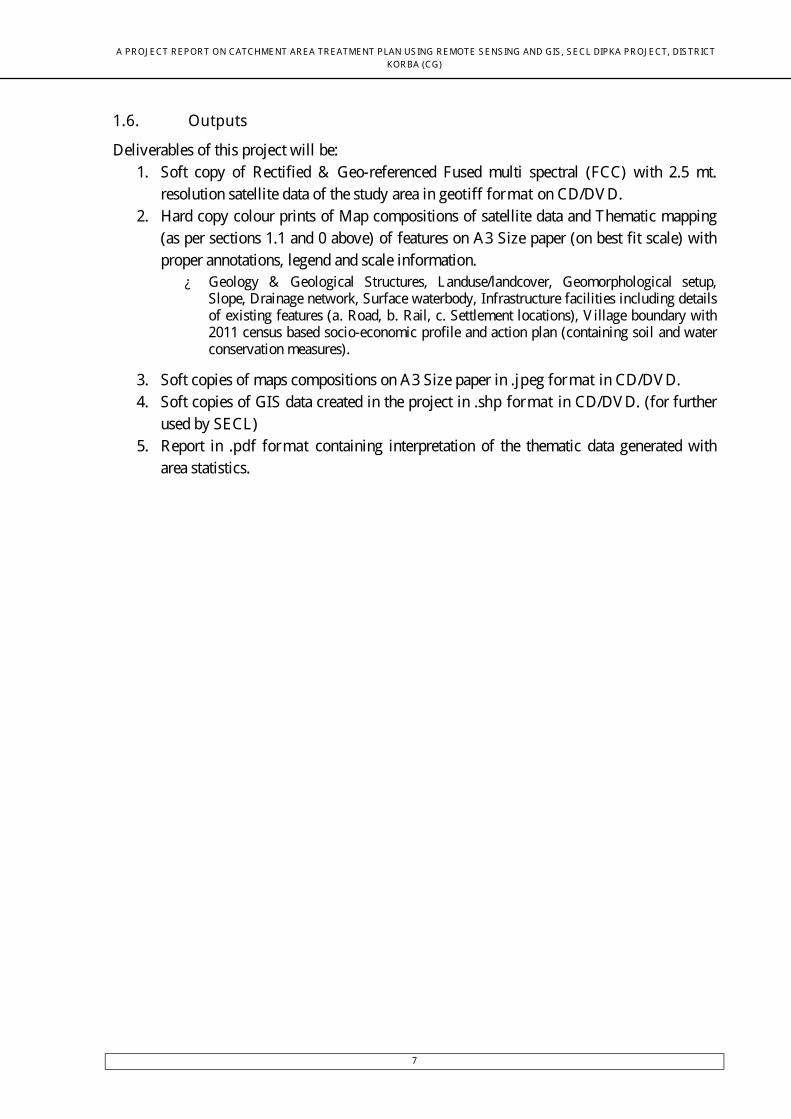
A PR OJ E CT R E POR T ON CATCHME NT AR E A TR E ATME NT PLAN US ING R E MOTE S E NS ING AND GIS b S E CL DIPKA PR OJ E CTb DIS TR ICT KOR BA (CG)
7
1.6. Outputs
Deliverables of this project will be: 1. Soft copy of Rectified & Geocreferenced Fused multi spectral (FCC) with 2.5 mt.
resolution satellite data of the study area in geotiff format on CD/DV D. 2. Hard copy colour prints of Map compositions of satellite data and Thematic mapping
(as per sections 1.1 and 0 above) of features on A3 Size paper (on best fit scale) with proper annotationsb legend and scale information.
Geology & Geological Structuresb Landuse/landcoverb Geomorphological setupb Slopeb Drainage networkb Surface waterbodyb Infrastructure facilities including details of existing features (a. Roadb b. Railb c. Settlement locations)b V illage boundary with 2011 census based socioceconomic profile and action plan (containing soil and water conservation measures).
3. Soft copies of maps compositions on A3 Size paper in .jpeg format in CD/DV D. 4. Soft copies of GIS data created in the project in .shp format in CD/DV D. (for further
used by SECL) 5. Report in .pdf format containing interpretation of the thematic data generated with
area statistics.

A PR OJ E CT R E POR T ON CATCHME NT AR E A TR E ATME NT PLAN US ING R E MOTE S E NS ING AND GIS b S E CL DIPKA PR OJ E CTb DIS TR ICT KOR BA (CG)
8
1.7. S napshots of the S E CL Area
F igure 1c3 Population Density of villages around SE CL project area
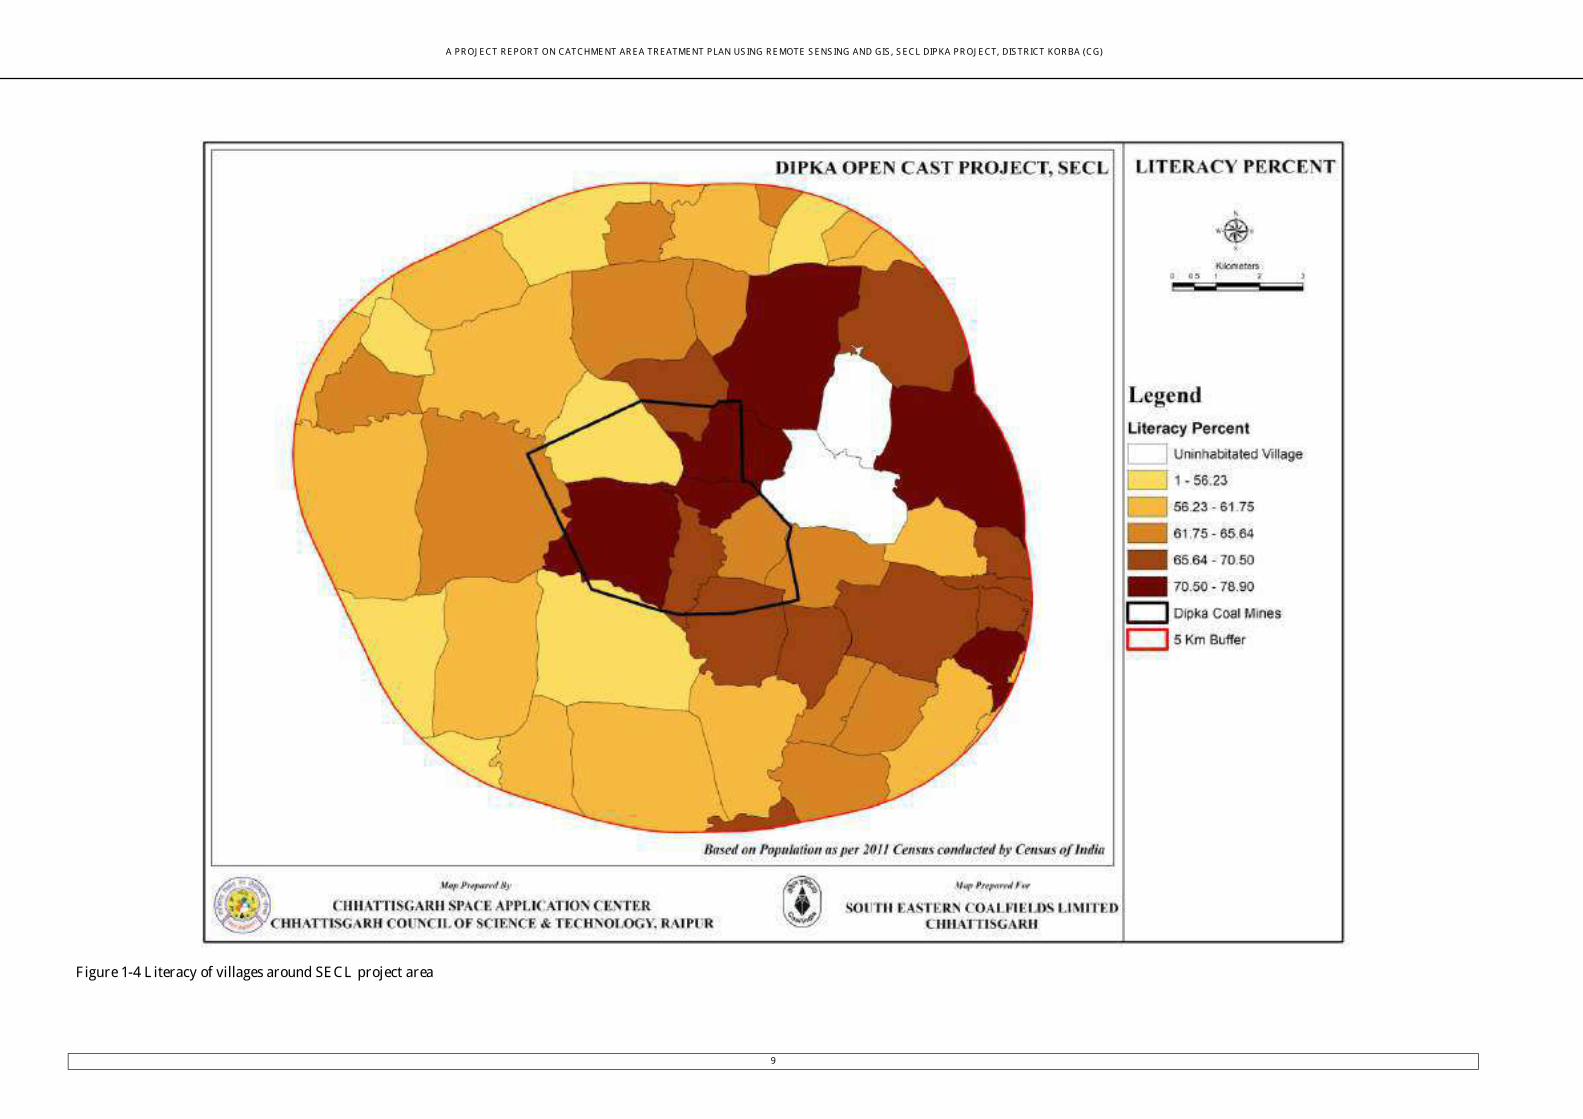
A PR OJ E CT R E POR T ON CATCHME NT AR E A TR E ATME NT PLAN US ING R E MOTE S E NS ING AND GIS b S E CL DIPKA PR OJ E CTb DIS TR ICT KOR BA (CG)
9
F igure 1c4 L iteracy of villages around SE CL project area
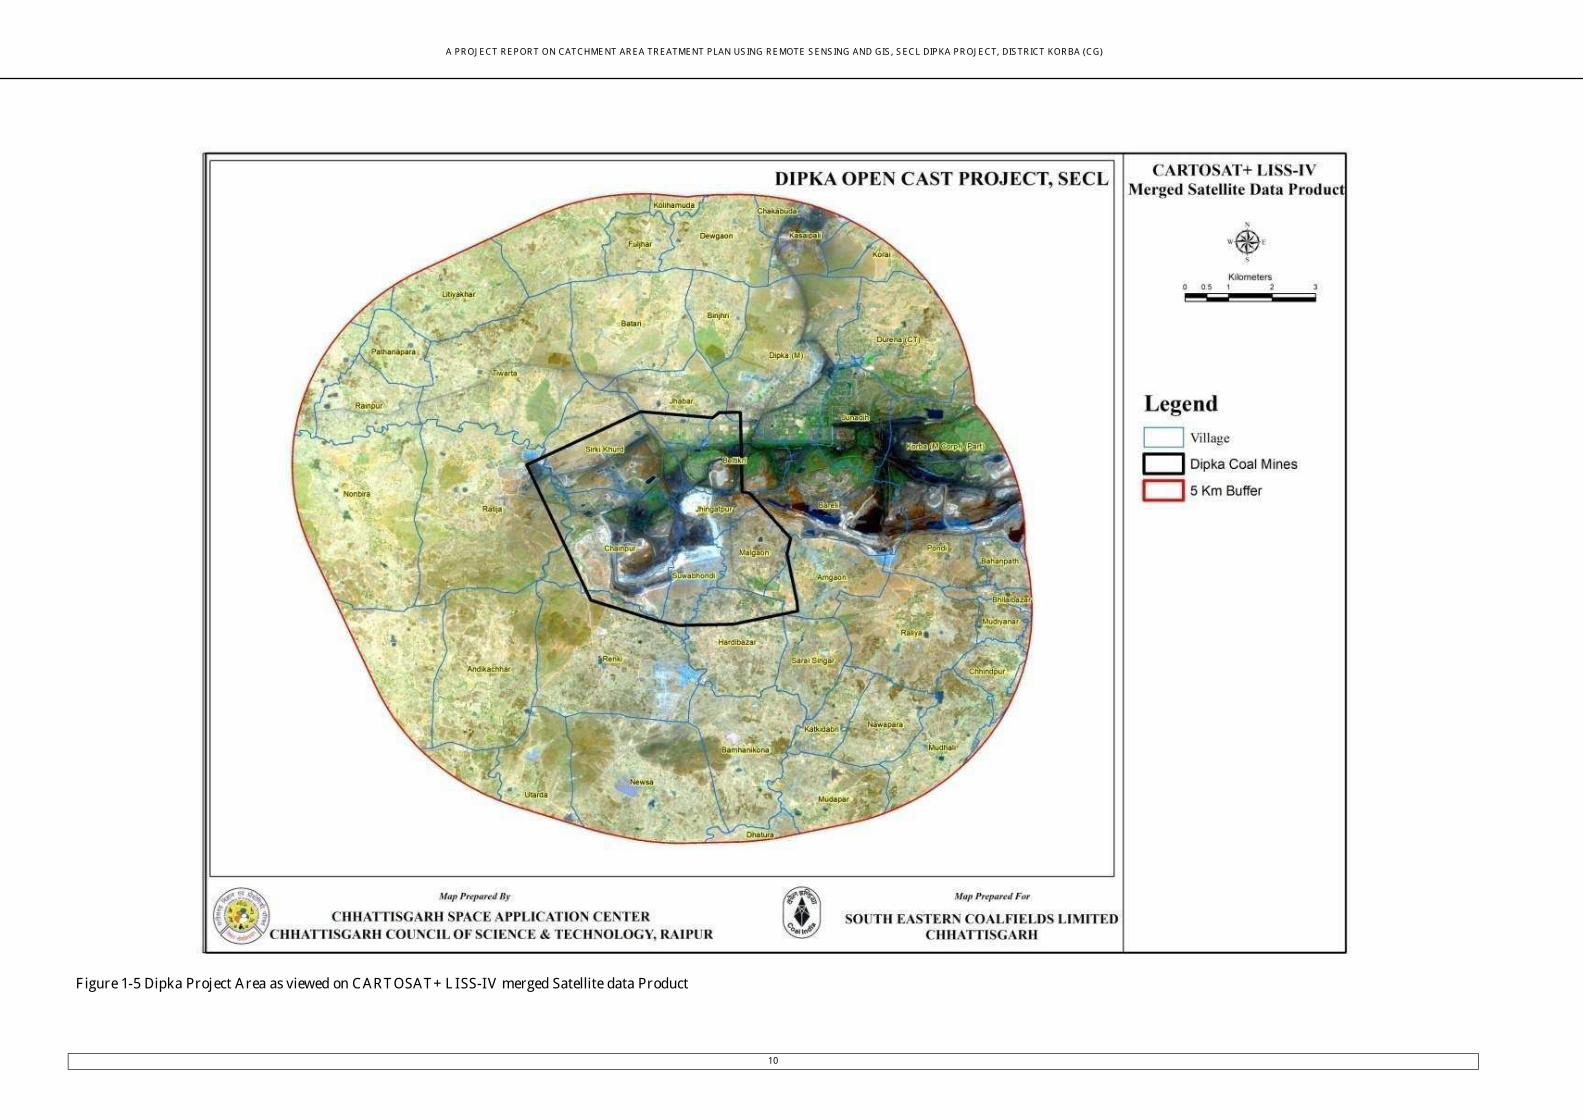
A PR OJ E CT R E POR T ON CATCHME NT AR E A TR E ATME NT PLAN US ING R E MOTE S E NS ING AND GIS b S E CL DIPKA PR OJ E CTb DIS TR ICT KOR BA (CG)
10
F igure 1c5 Dipka Project Area as viewed on CART OSAT + L ISScIV merged Satellite data Product
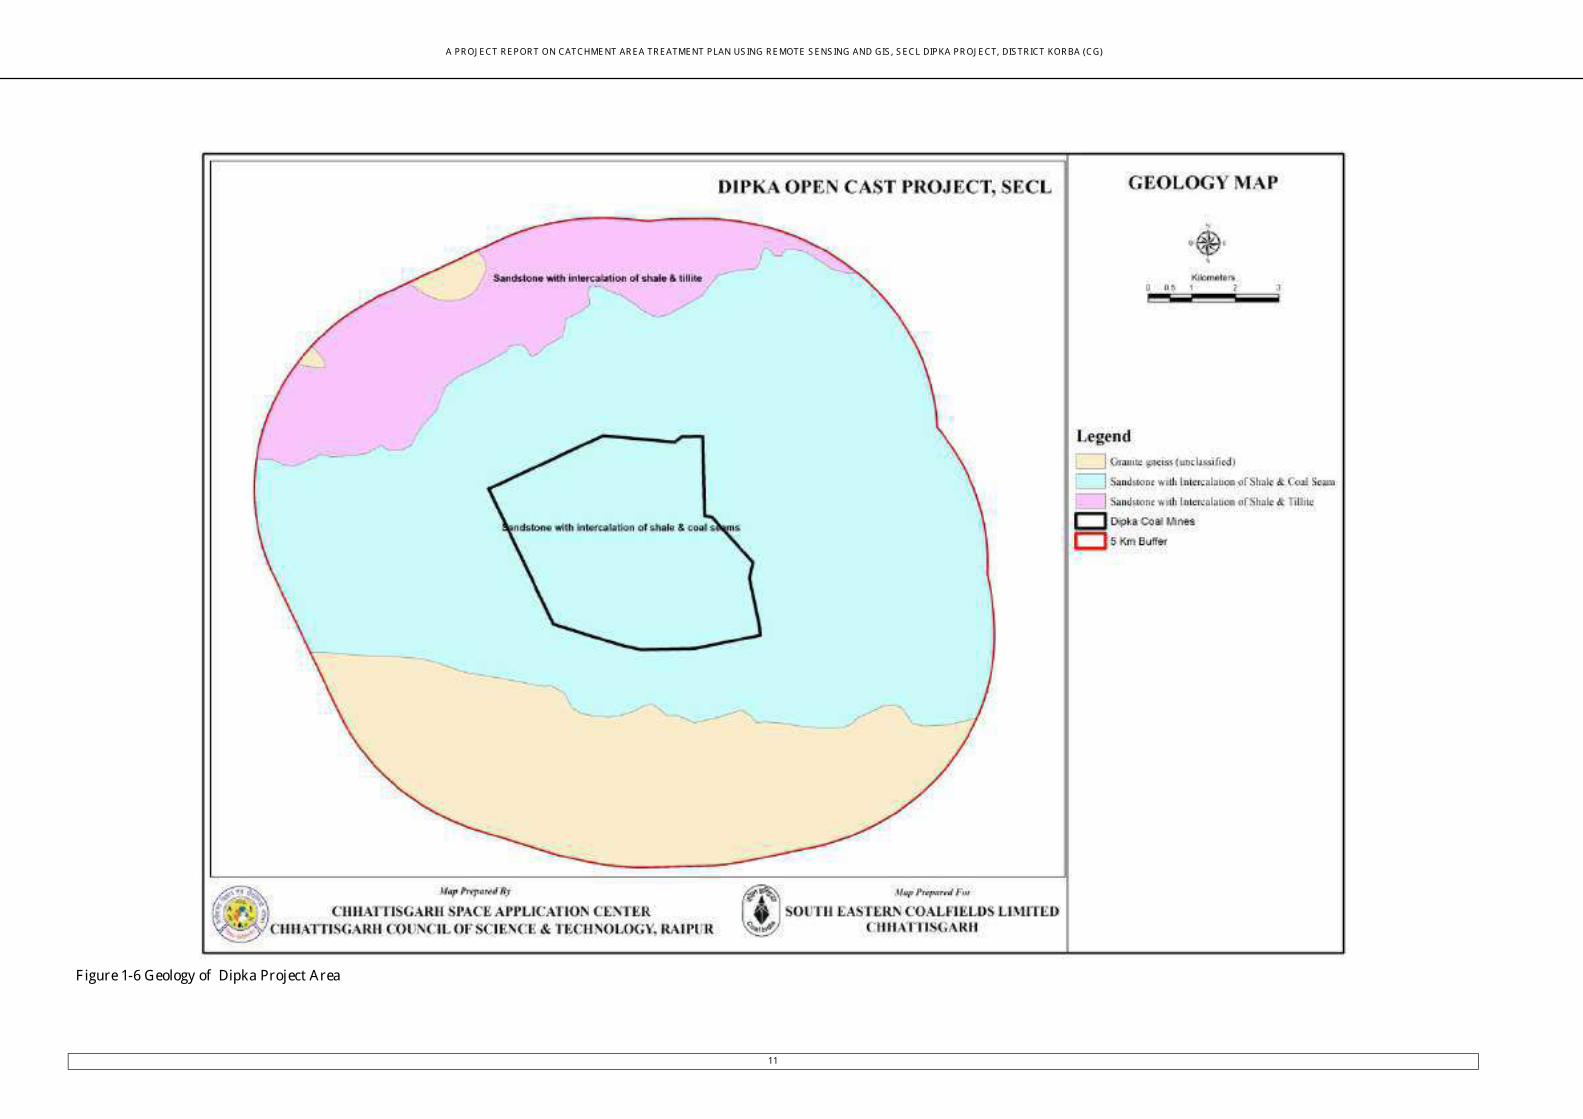
A PR OJ E CT R E POR T ON CATCHME NT AR E A TR E ATME NT PLAN US ING R E MOTE S E NS ING AND GIS b S E CL DIPKA PR OJ E CTb DIS TR ICT KOR BA (CG)
11
F igure 1c6 Geology of Dipka Project Area

A PR OJ E CT R E POR T ON CATCHME NT AR E A TR E ATME NT PLAN US ING R E MOTE S E NS ING AND GIS b S E CL DIPKA PR OJ E CTb DIS TR ICT KOR BA (CG)
12
F igure 1c7 Geological Structures of Dipka Project Area

A PR OJ E CT R E POR T ON CATCHME NT AR E A TR E ATME NT PLAN US ING R E MOTE S E NS ING AND GIS b S E CL DIPKA PR OJ E CTb DIS TR ICT KOR BA (CG)
13
F igure 1c8 Geomorphology of Dipka Project Area (Based on Satellite data interpretation)
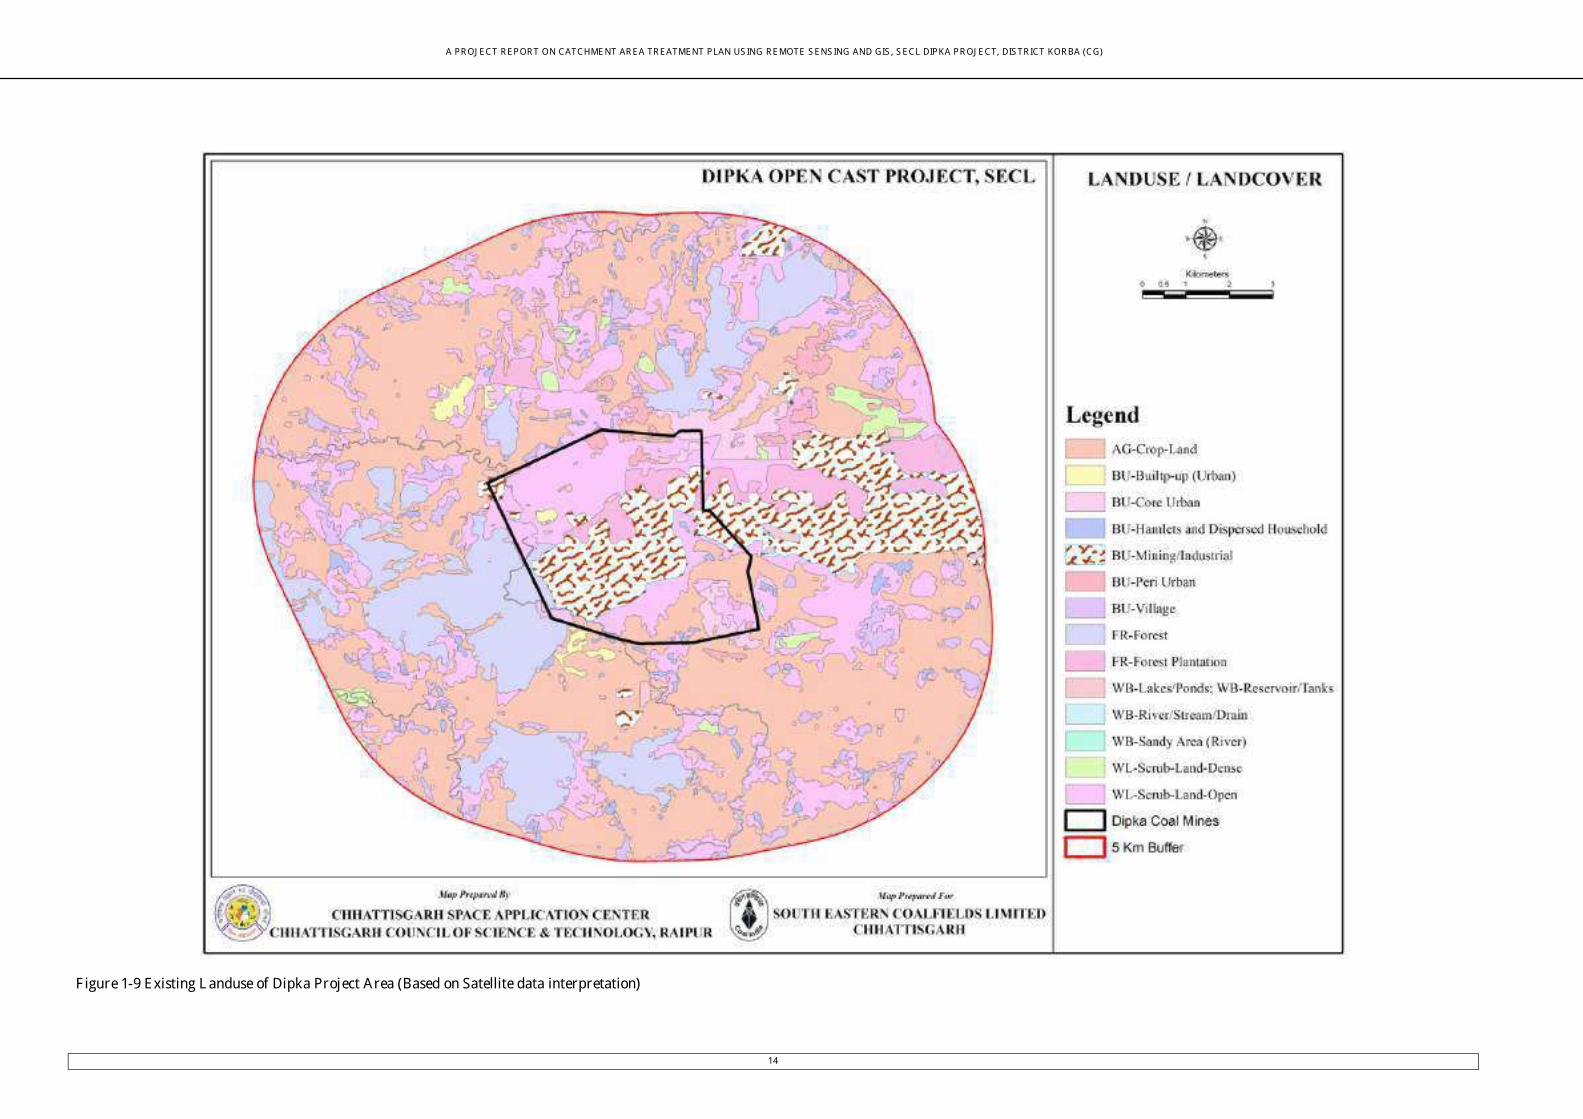
A PR OJ E CT R E POR T ON CATCHME NT AR E A TR E ATME NT PLAN US ING R E MOTE S E NS ING AND GIS b S E CL DIPKA PR OJ E CTb DIS TR ICT KOR BA (CG)
14
F igure 1c9 E xisting L anduse of Dipka Project Area (Based on Satellite data interpretation)
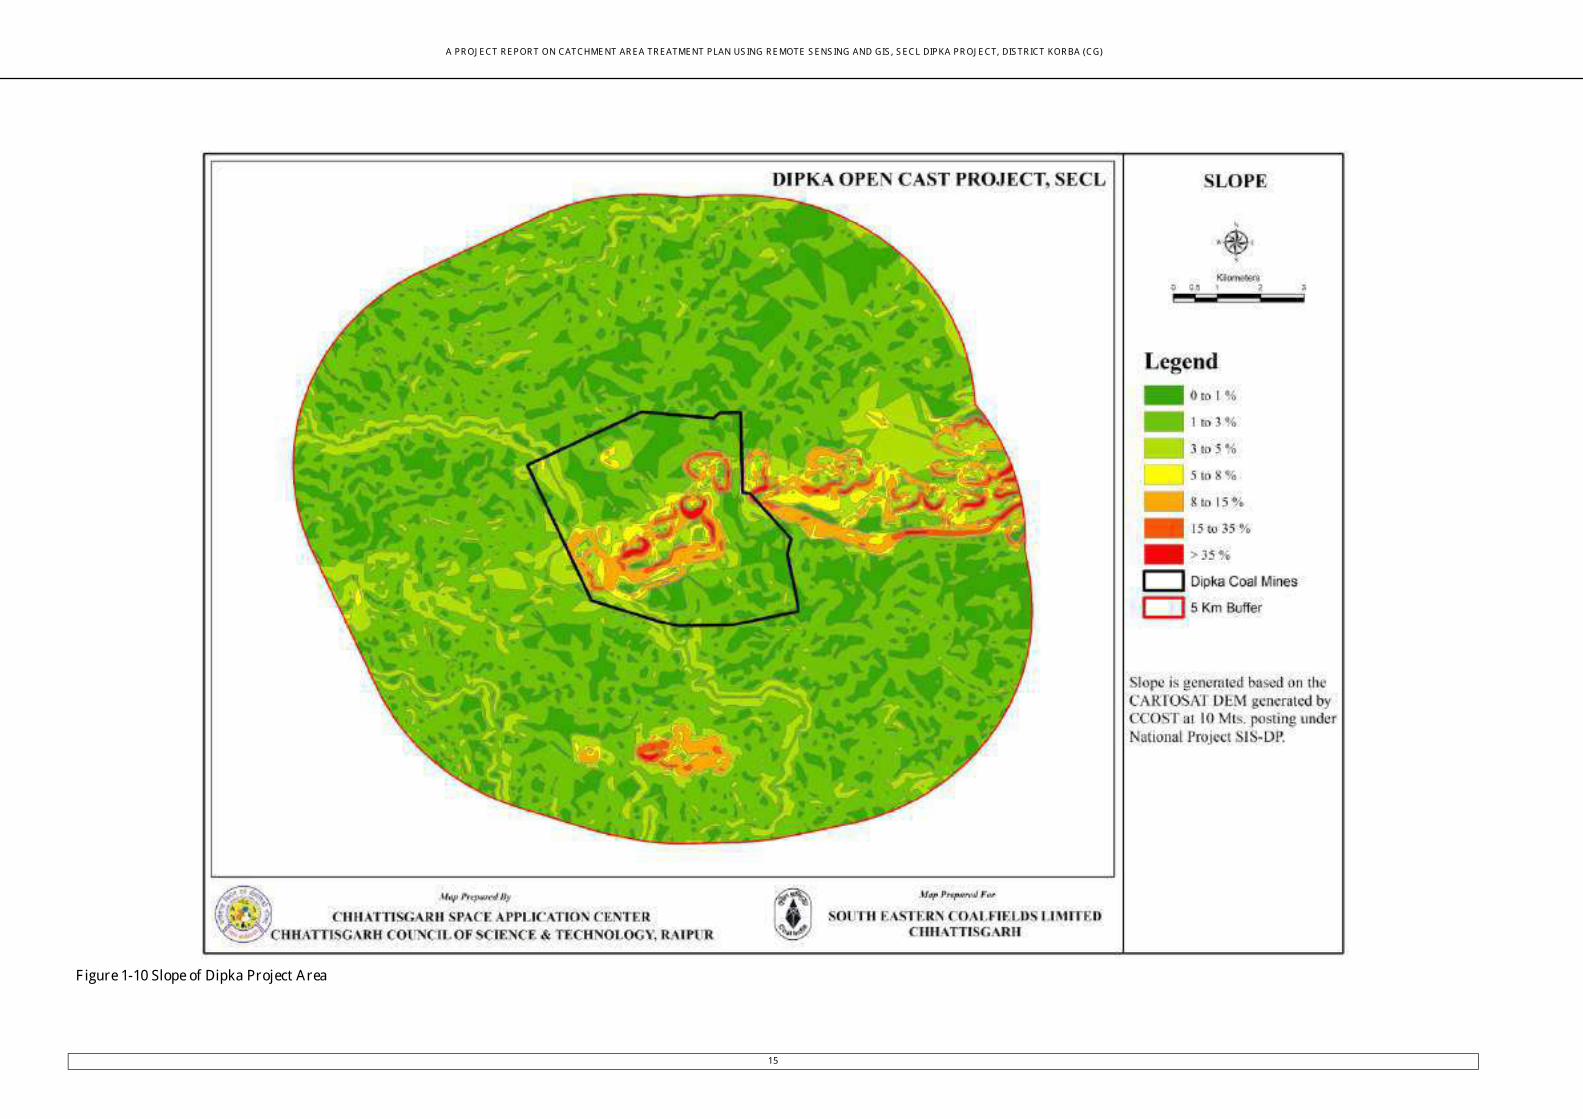
A PR OJ E CT R E POR T ON CATCHME NT AR E A TR E ATME NT PLAN US ING R E MOTE S E NS ING AND GIS b S E CL DIPKA PR OJ E CTb DIS TR ICT KOR BA (CG)
15
F igure 1c10 Slope of Dipka Project Area
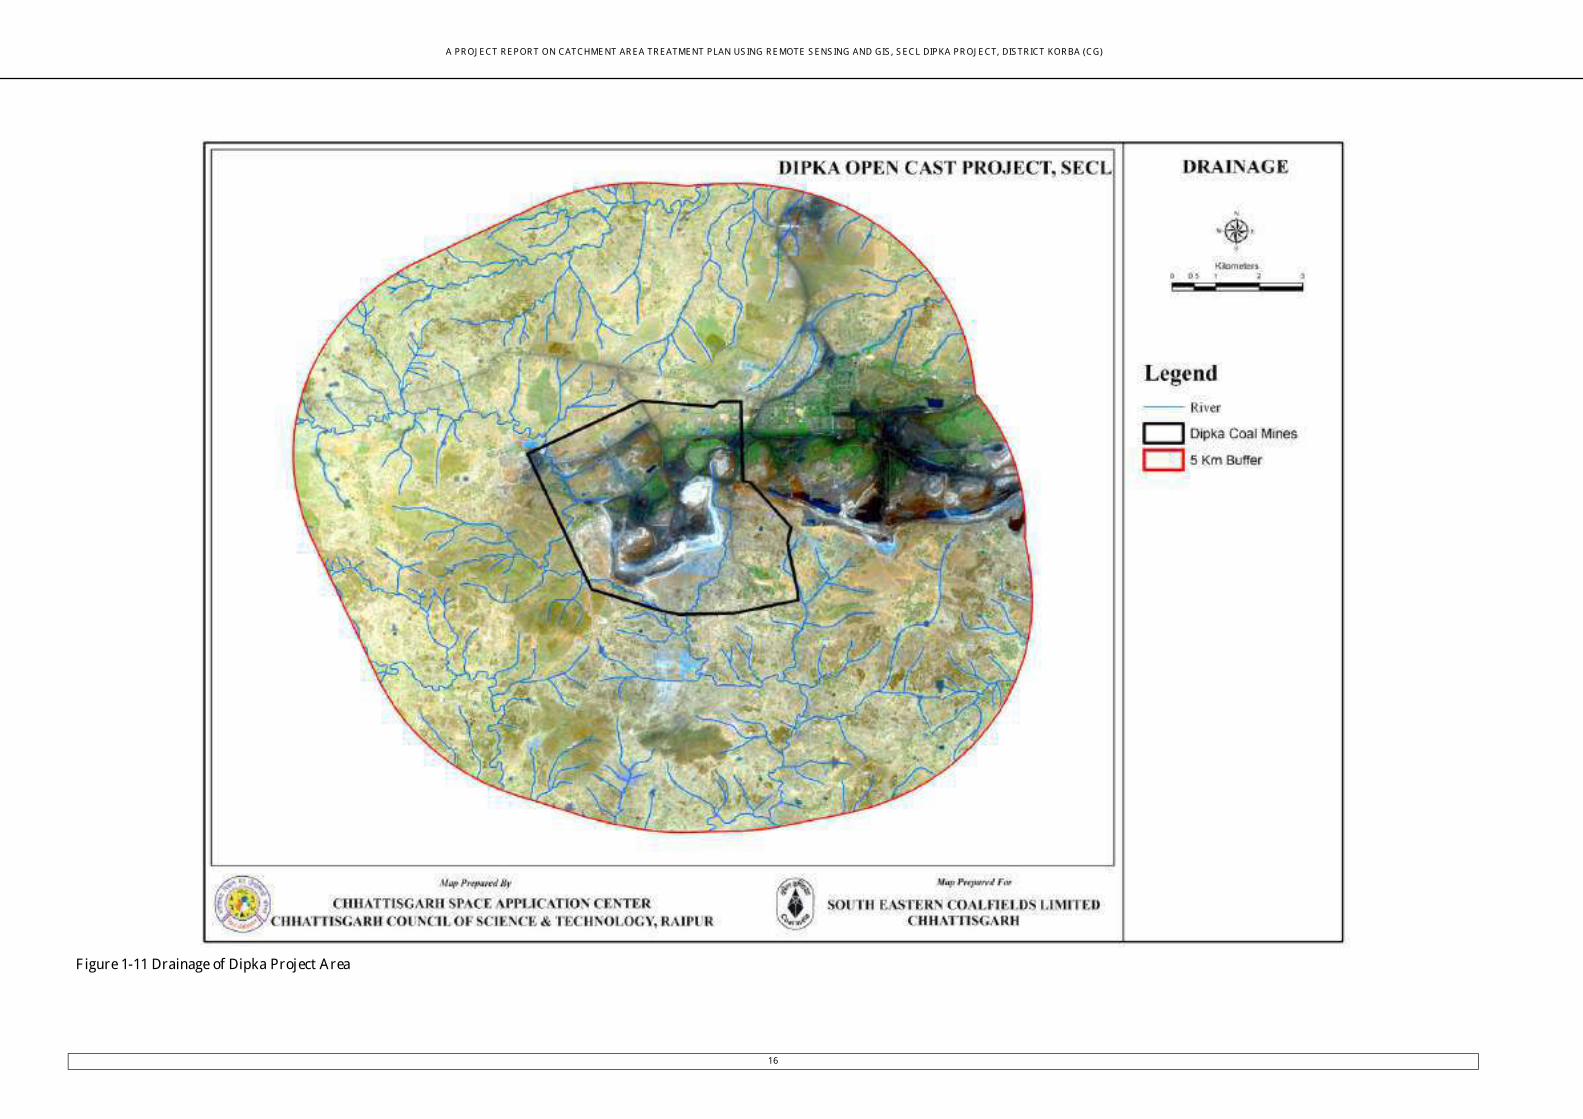
A PR OJ E CT R E POR T ON CATCHME NT AR E A TR E ATME NT PLAN US ING R E MOTE S E NS ING AND GIS b S E CL DIPKA PR OJ E CTb DIS TR ICT KOR BA (CG)
16
F igure 1c11 Drainage of Dipka Project Area

A PR OJ E CT R E POR T ON CATCHME NT AR E A TR E ATME NT PLAN US ING R E MOTE S E NS ING AND GIS b S E CL DIPKA PR OJ E CTb DIS TR ICT KOR BA (CG)
17
F igure 1c12 Waterbodies of Dipka Project Area
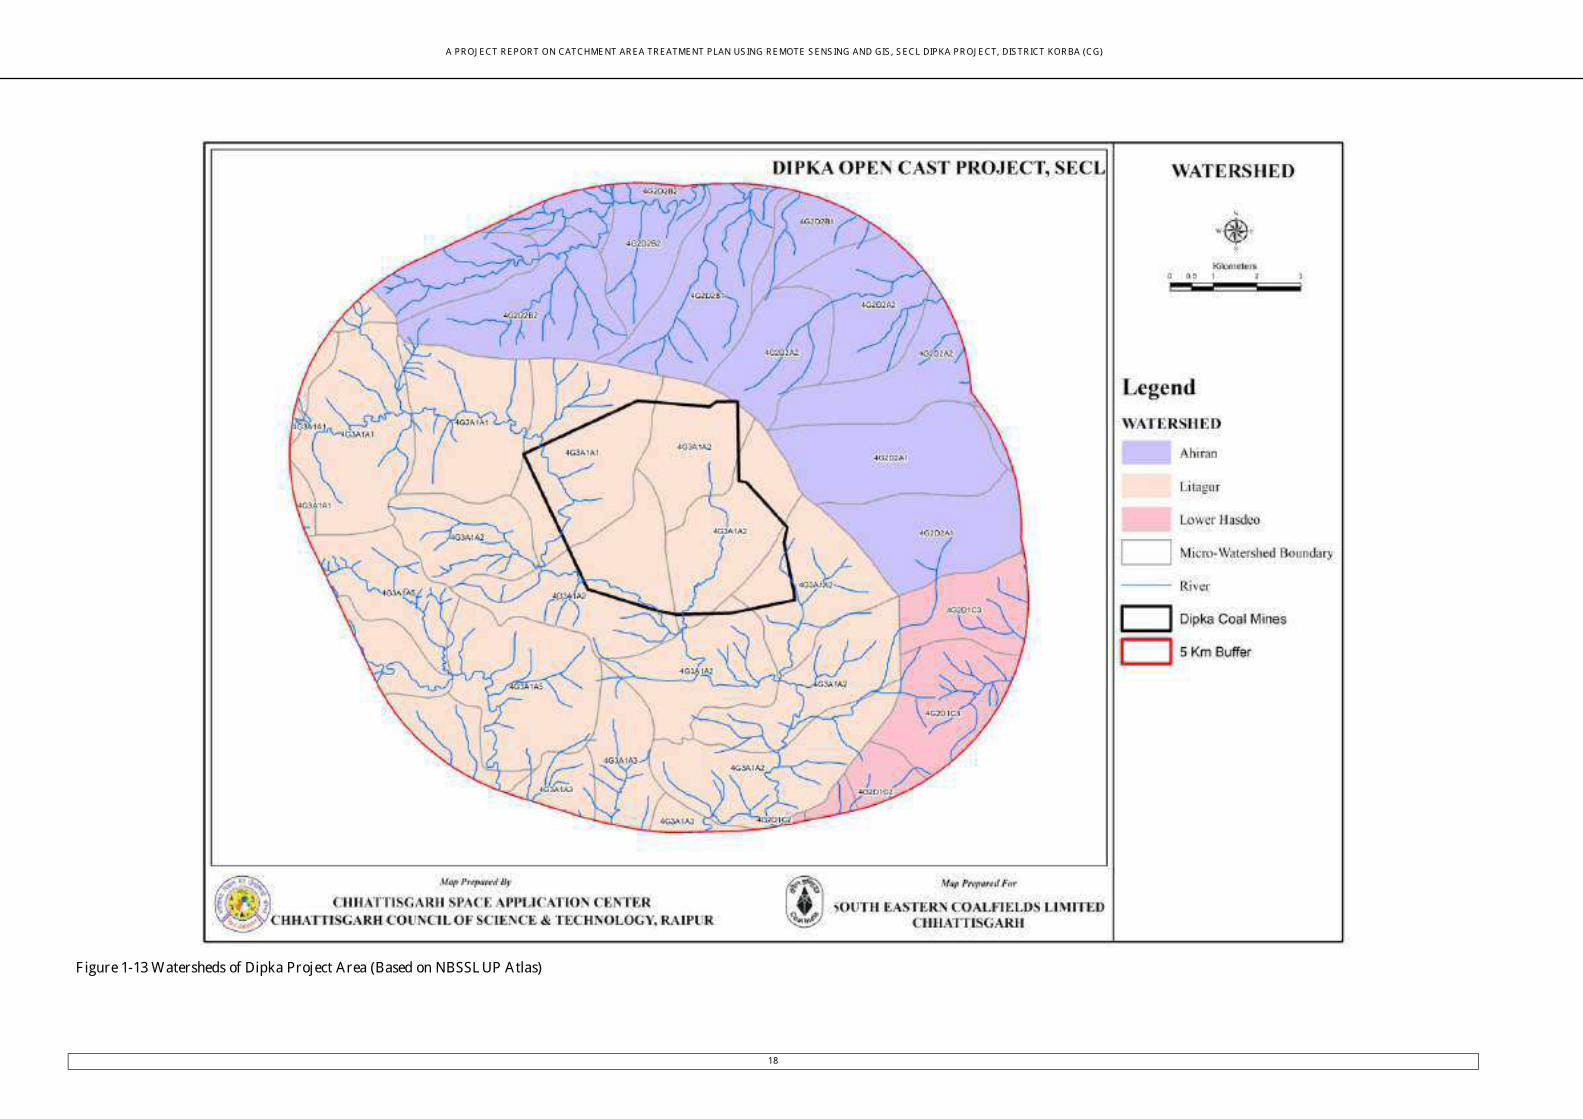
A PR OJ E CT R E POR T ON CATCHME NT AR E A TR E ATME NT PLAN US ING R E MOTE S E NS ING AND GIS b S E CL DIPKA PR OJ E CTb DIS TR ICT KOR BA (CG)
18
F igure 1c13 Watersheds of Dipka Project Area (Based on NBSSL UP Atlas)
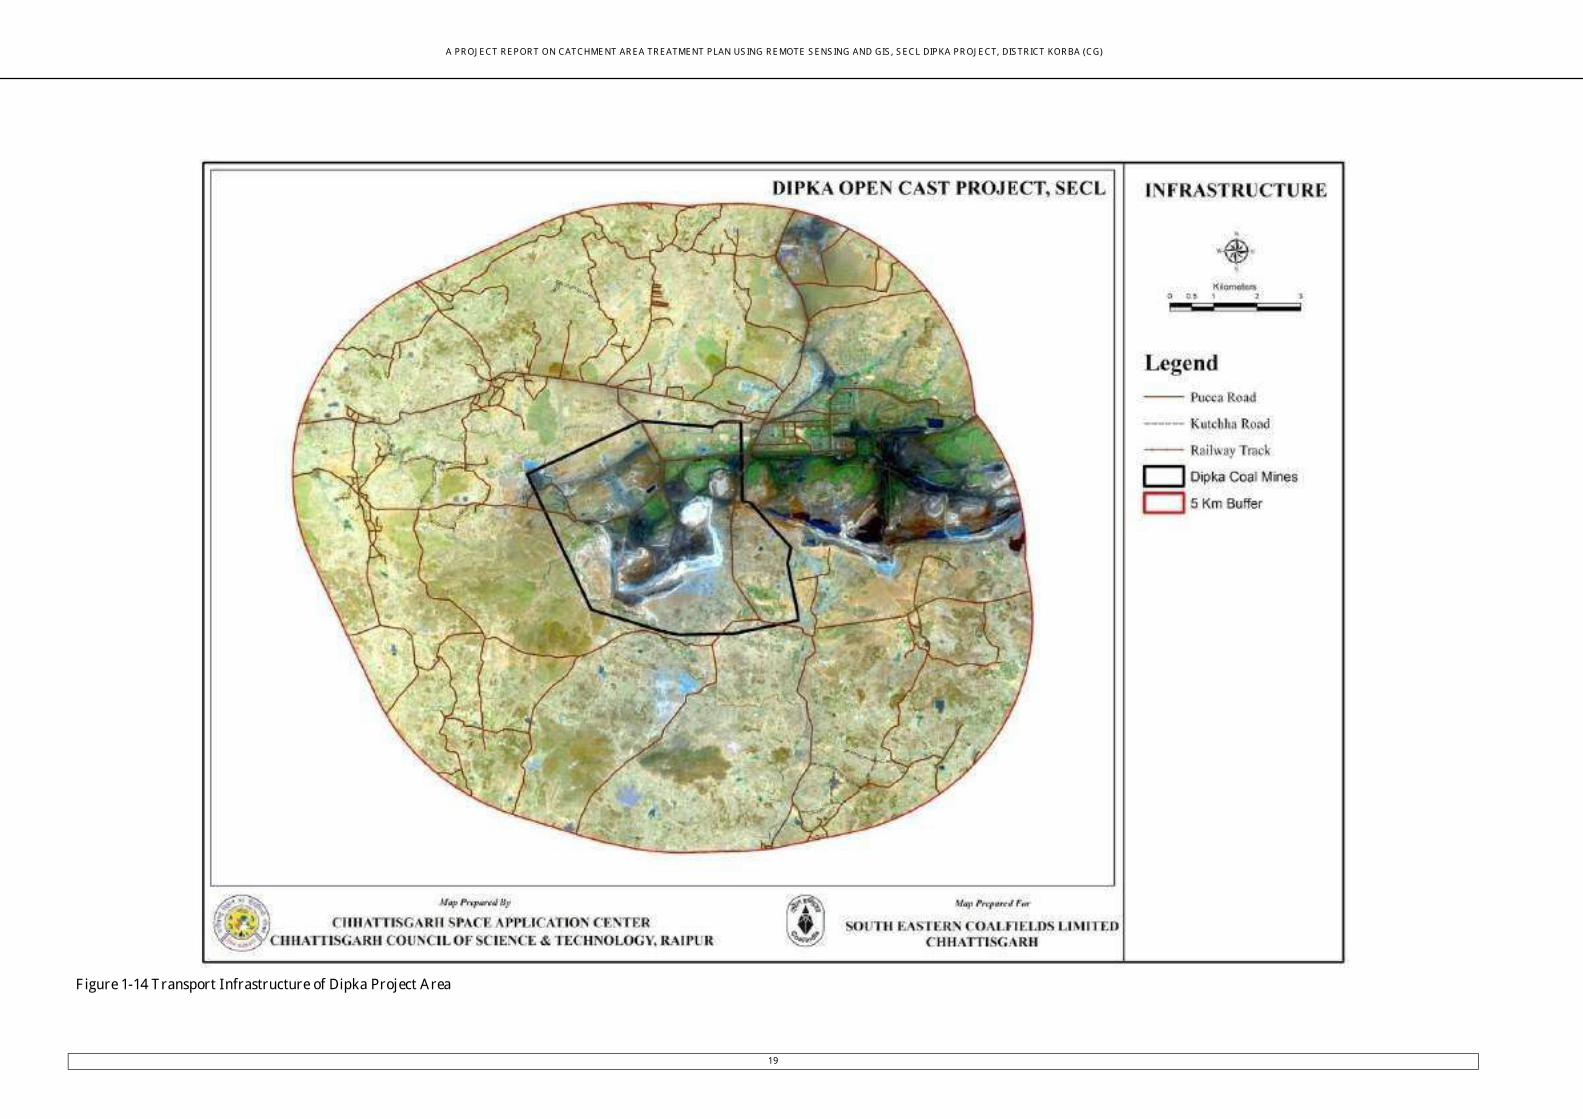
A PR OJ E CT R E POR T ON CATCHME NT AR E A TR E ATME NT PLAN US ING R E MOTE S E NS ING AND GIS b S E CL DIPKA PR OJ E CTb DIS TR ICT KOR BA (CG)
19
F igure 1c14 T ransport Infrastructure of Dipka Project Area
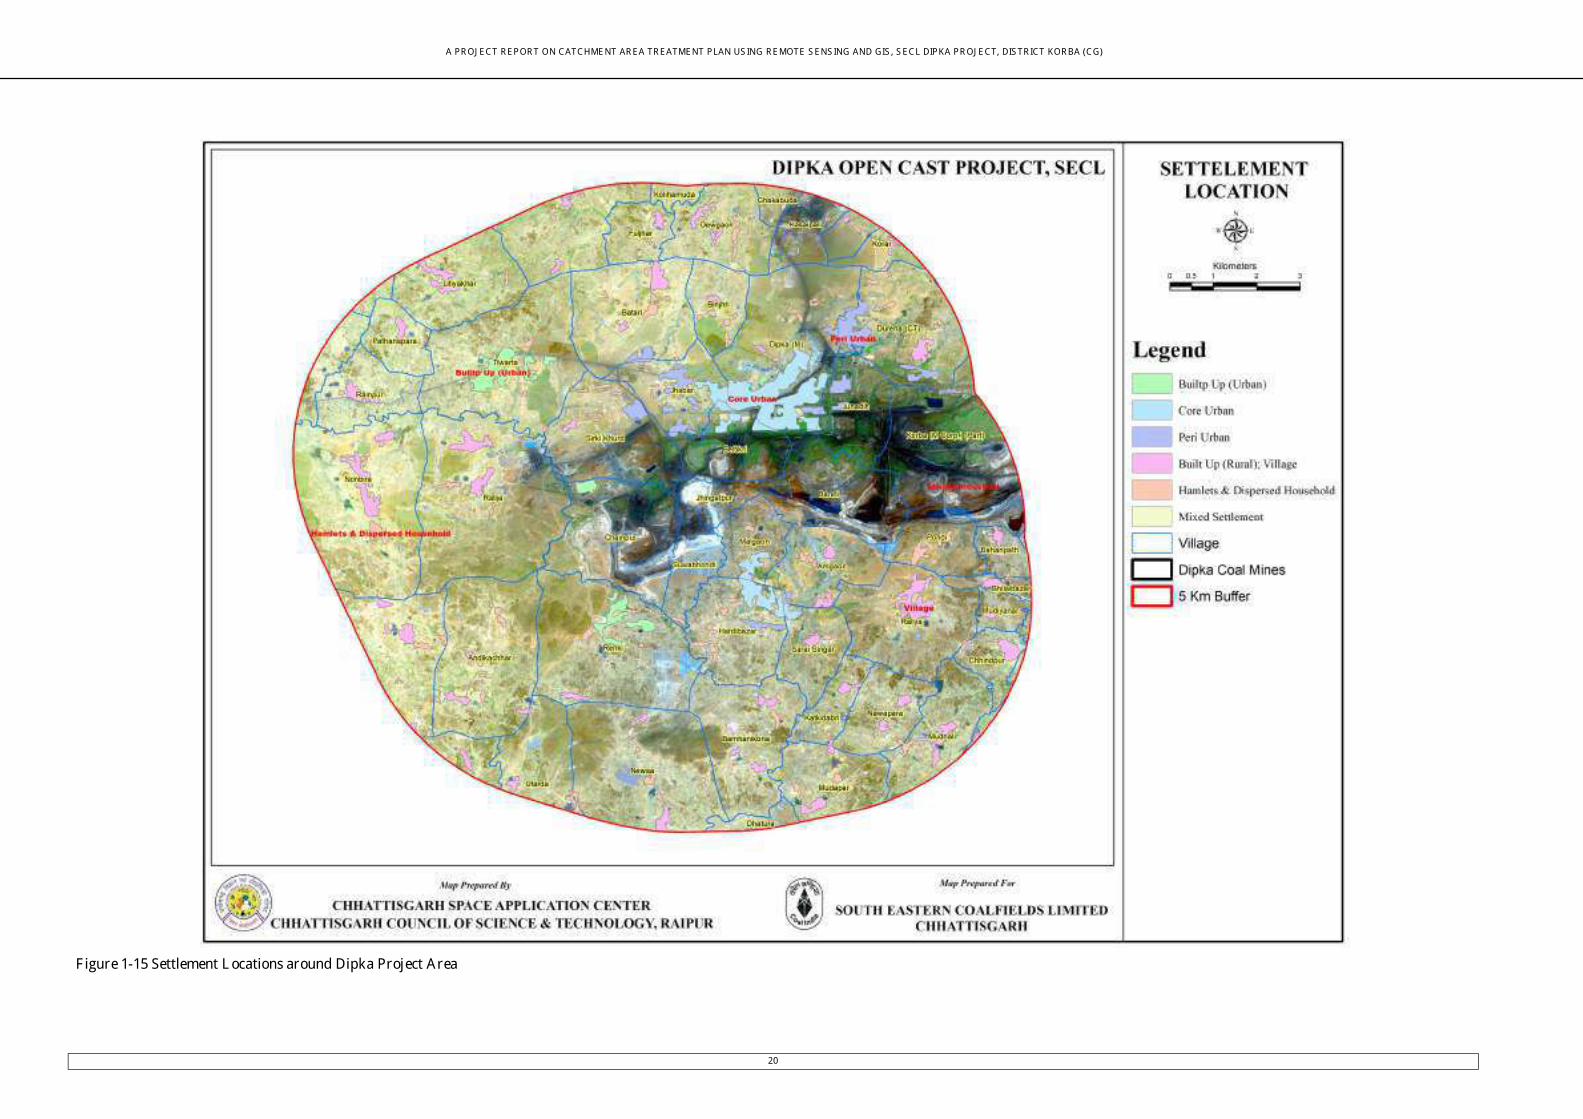
A PR OJ E CT R E POR T ON CATCHME NT AR E A TR E ATME NT PLAN US ING R E MOTE S E NS ING AND GIS b S E CL DIPKA PR OJ E CTb DIS TR ICT KOR BA (CG)
20
F igure 1c15 Settlement L ocations around Dipka Project Area
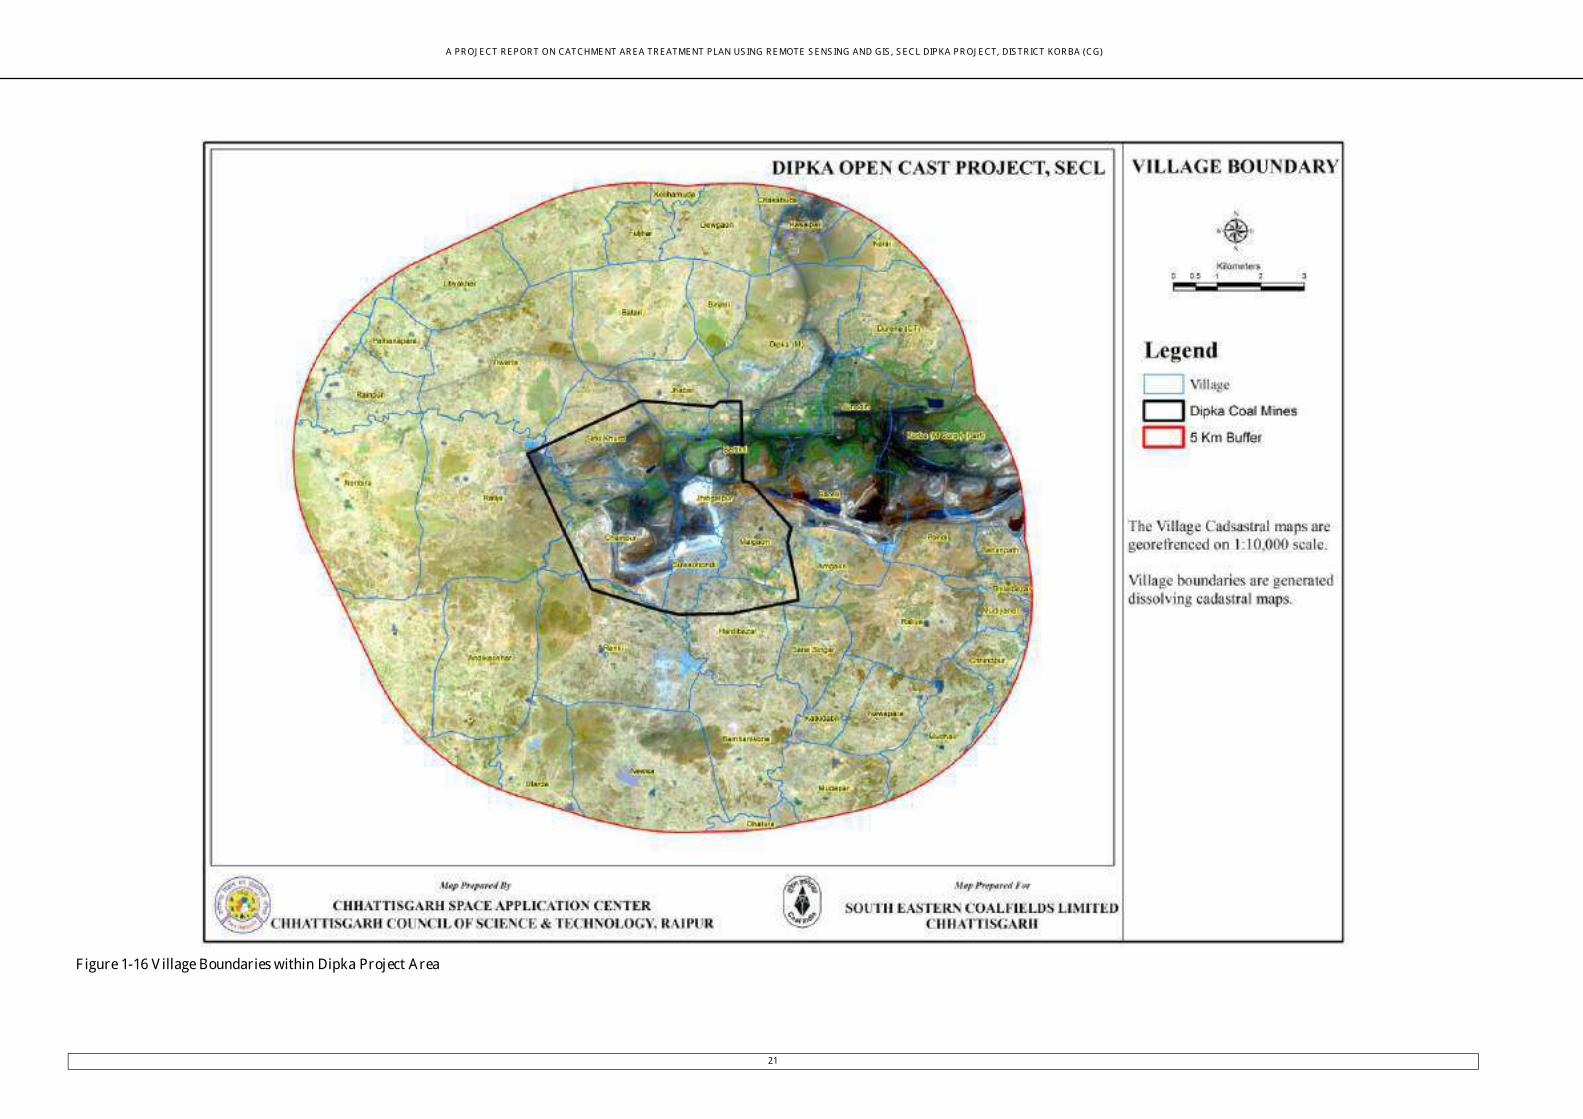
A PR OJ E CT R E POR T ON CATCHME NT AR E A TR E ATME NT PLAN US ING R E MOTE S E NS ING AND GIS b S E CL DIPKA PR OJ E CTb DIS TR ICT KOR BA (CG)
21
F igure 1c16 V illage Boundaries within Dipka Project Area

A PR OJ E CT R E POR T ON CATCHME NT AR E A TR E ATME NT PLAN US ING R E MOTE S E NS ING AND GIS b S E CL DIPKA PR OJ E CTb DIS TR ICT KOR BA (CG)
22
F igure 1c17 Forest Boundaries within Dipka Project Area
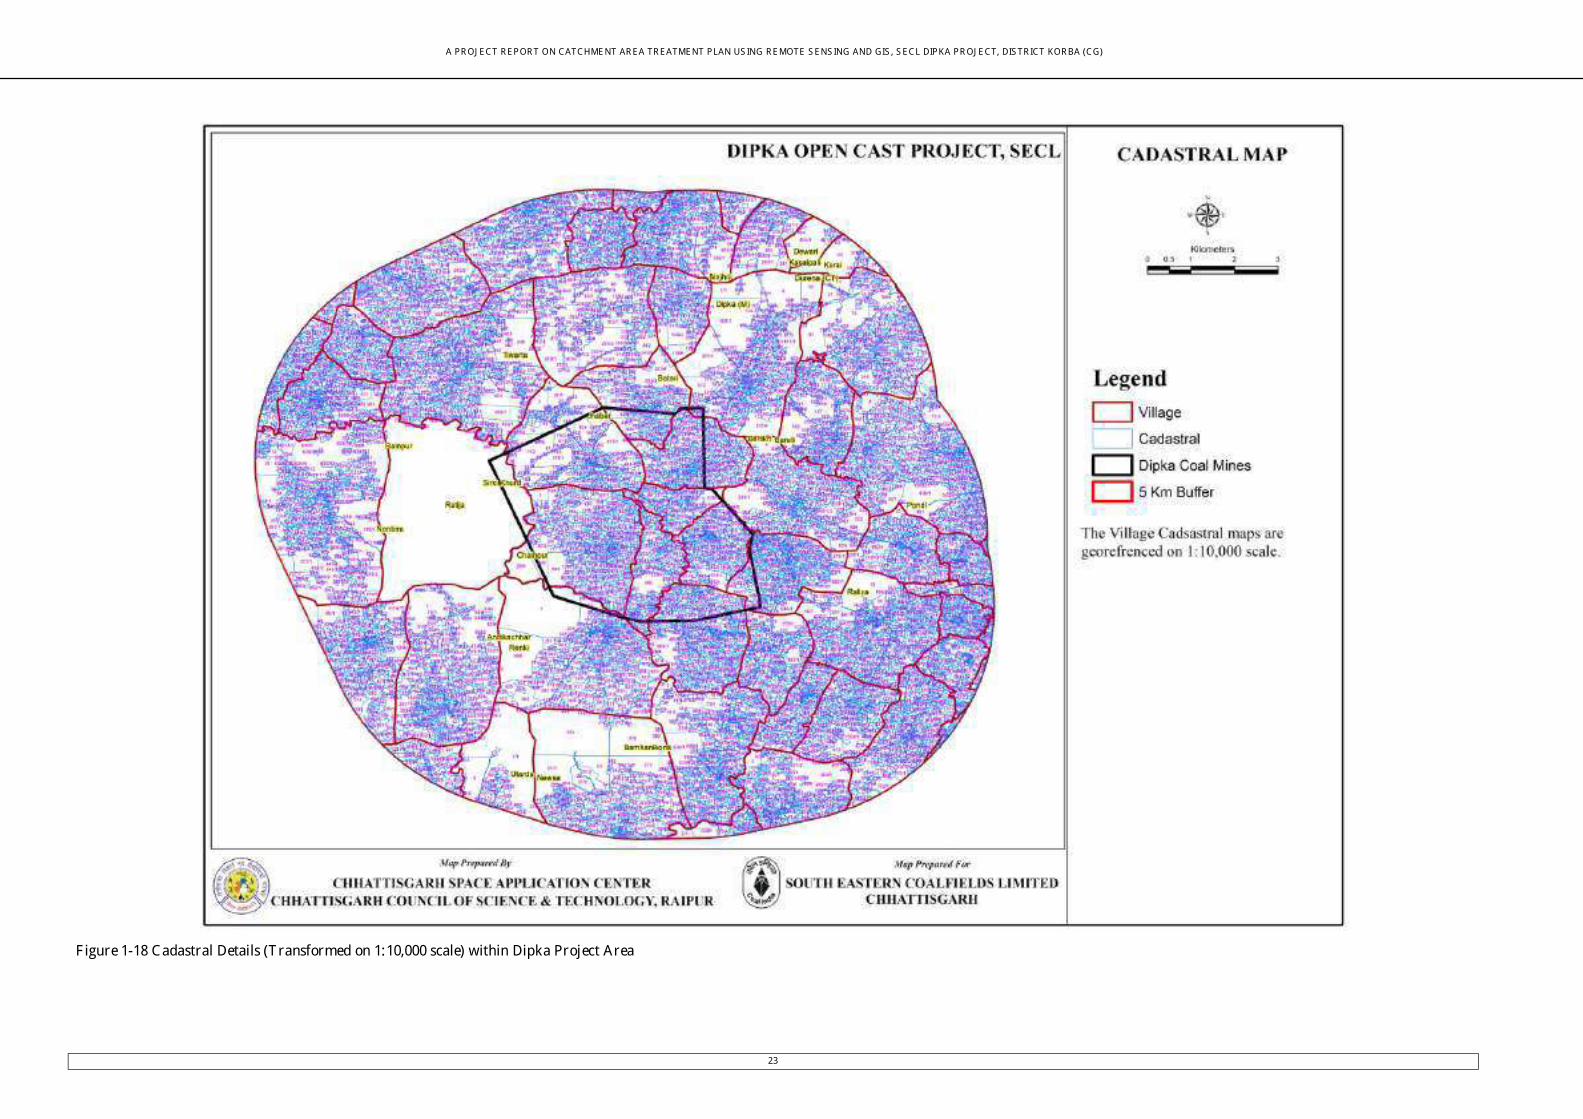
A PR OJ E CT R E POR T ON CATCHME NT AR E A TR E ATME NT PLAN US ING R E MOTE S E NS ING AND GIS b S E CL DIPKA PR OJ E CTb DIS TR ICT KOR BA (CG)
23
F igure 1c18 Cadastral Details (T ransformed on 1:10b000 scale) within Dipka Project Area
A PR OJ E CT R E POR T ON CATCHME NT AR E A TR E ATME NT PLAN US ING R E MOTE S E NS ING AND GIS b S E CL DIPKA PR OJ E CTb DIS TR ICT KOR BA (CG)
24
2. E rosion Control R ecommendations
2.1. F ield Observation of E rosion and S ediment S ources
There are numerous potential sources of erosion and sediment transport. The four key areas of concern at the DipkacSECL Mine include:
Steep slopes present throughout the Mine siteb and various other areas with high potential for water and wind induced erosion;
Areas where mining has exposed fresh rock and loose material of fresh dump the vegetative cover is removed which exposes erosion prone material. The weathering agents and process can create runoff and fluidized movement of soils and overburden;
Mine Outlet drains are not mapable from the satellite data used. These Outlet drains also require vegetative bunds where ever erosion is seen on the ground.
The field observations were further seen expressed on the satellite images and have been mapped for deriving erosion control measures in the DipkacSECL Mine area.
A lso the outputs of Universal Soil Loss Equation (ULSE) bring out the areas of erosion. Both the modeled output and the field observation were put together to derive the recommendations for change in existing landuse and built erosion control measures within the existing drainage (small nalasb streams and rivers)
As field observation it is strongly recommended that the Garland Drainage constructed by SECL needs to be strengthened and maintained regularly. The Garland Drainage being not mapable it could not be reflected on the Action Plan Map submitted here.
T able 2c1 L anduse Recommendations
E R OSION CONT R OL ME ASUR E S (PR OPOSE D L ANDUSE )
AR E A (Ha.)
Area Proposed for Phase Wise Plantation 139.38 Gap Plantation 11.78 Steep Slope Stability Measures/Carpeting 8.34
T able 2c2 E rosion Control R ecommendations
E rosion Control Measures (Proposed Structures)
Number of Structures
Check Dam 3 Nala Bunds/Boulder Checks 10 V egetative Bunds 18
A PR OJ E CT R E POR T ON CATCHME NT AR E A TR E ATME NT PLAN US ING R E MOTE S E NS ING AND GIS b S E CL DIPKA PR OJ E CTb DIS TR ICT KOR BA (CG)
25
2.2. Weightages assigned
The Weightages assigned to each thematic class used as input to execute Universal Soil Loss Equation are as under:
T able 2c3 Weightages assigned to each thematic class
Name of thematic map c Landuse layer L anduse C lasses / Ca tor W eightages t Ca tor W eightages A D/ w / rop La d . . . U a b a i i g/L dustrial . . . U wI I e lets A d 5ispersed I ouse I old . . . U wU U r a . . . U wV V illage . . . U U / / ore U r a . . . U U t t eriur a . . . U U w . uiltup U r a . . Cw59 Corest . . Cwt L Corest t la tatio . . W . / b / a al . W . L t Lake/t od . W . wS wiver/Stree . W . wT weservoir/Ta ks . W . S A Sa dy A rea . . W L A 5 A tive 5u p . W L . w . arre wok . . W L5S 5u p Slope . W LDU Duilled/wave ious . W Lh5 hld 5u p . W L S5 S ru La d 5e se . . W L St S ru La d hpe . . W L W L W aterLogged . .
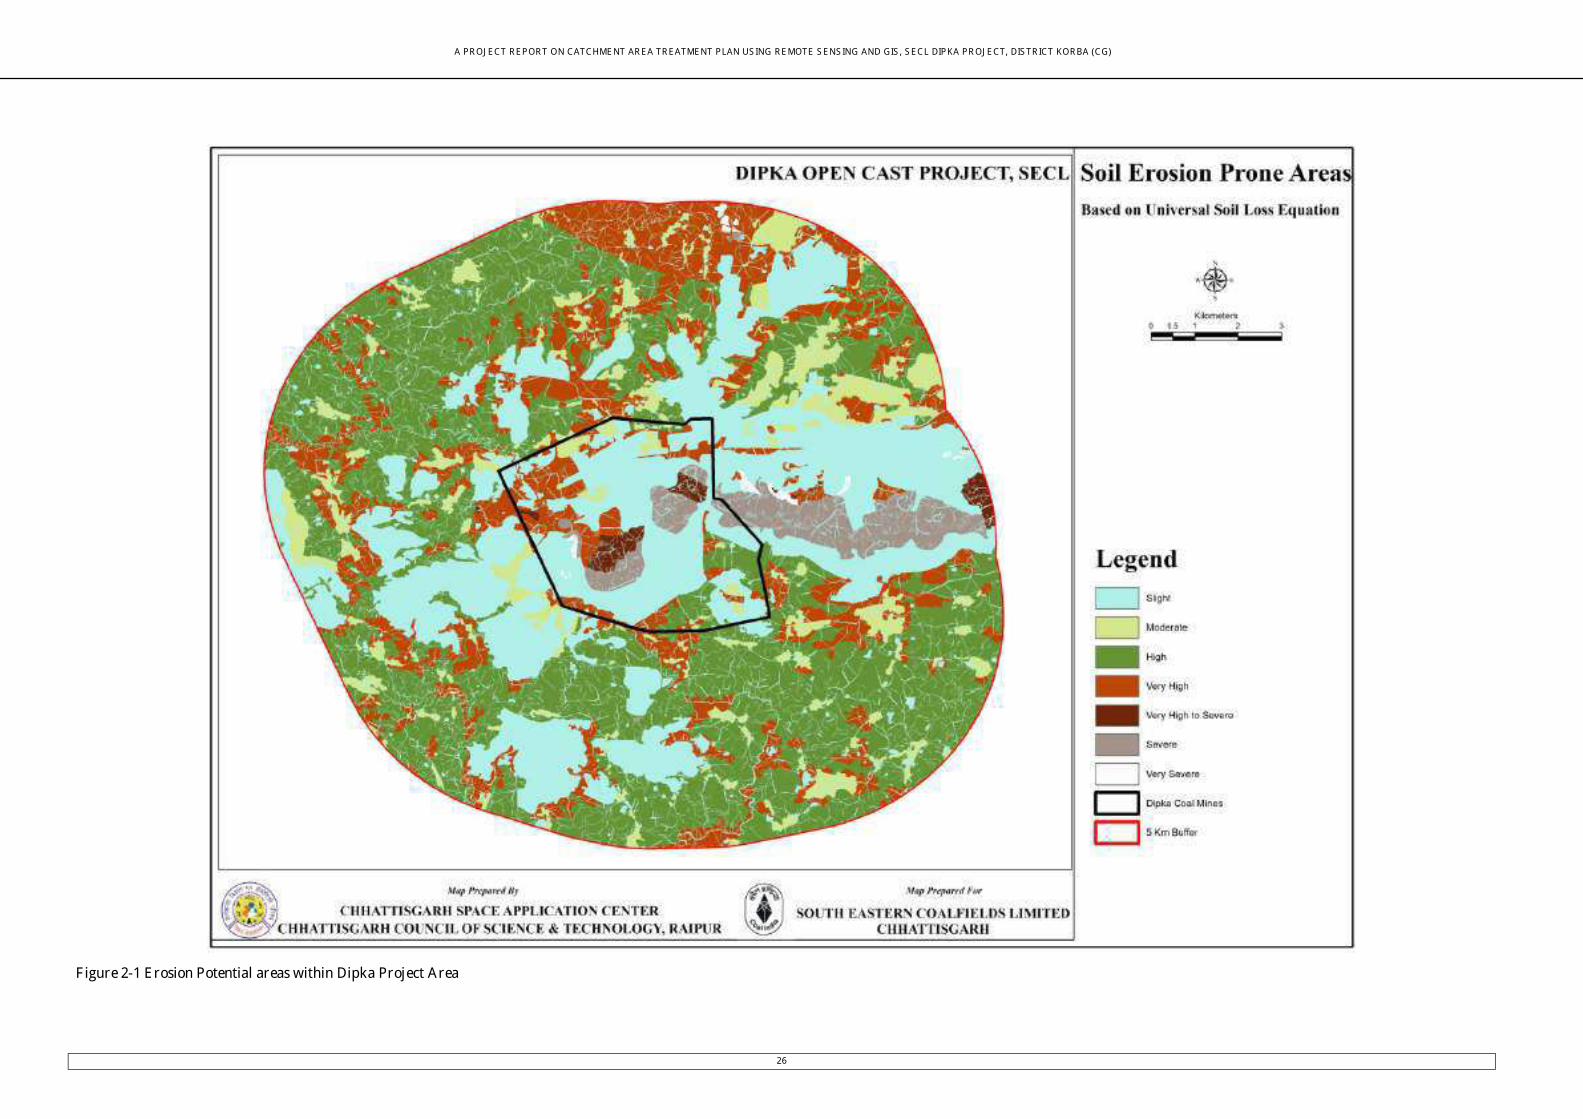
A PR OJ E CT R E POR T ON CATCHME NT AR E A TR E ATME NT PLAN US ING R E MOTE S E NS ING AND GIS b S E CL DIPKA PR OJ E CTb DIS TR ICT KOR BA (CG)
26
F igure 2c1 E rosion Potential areas within Dipka Project Area
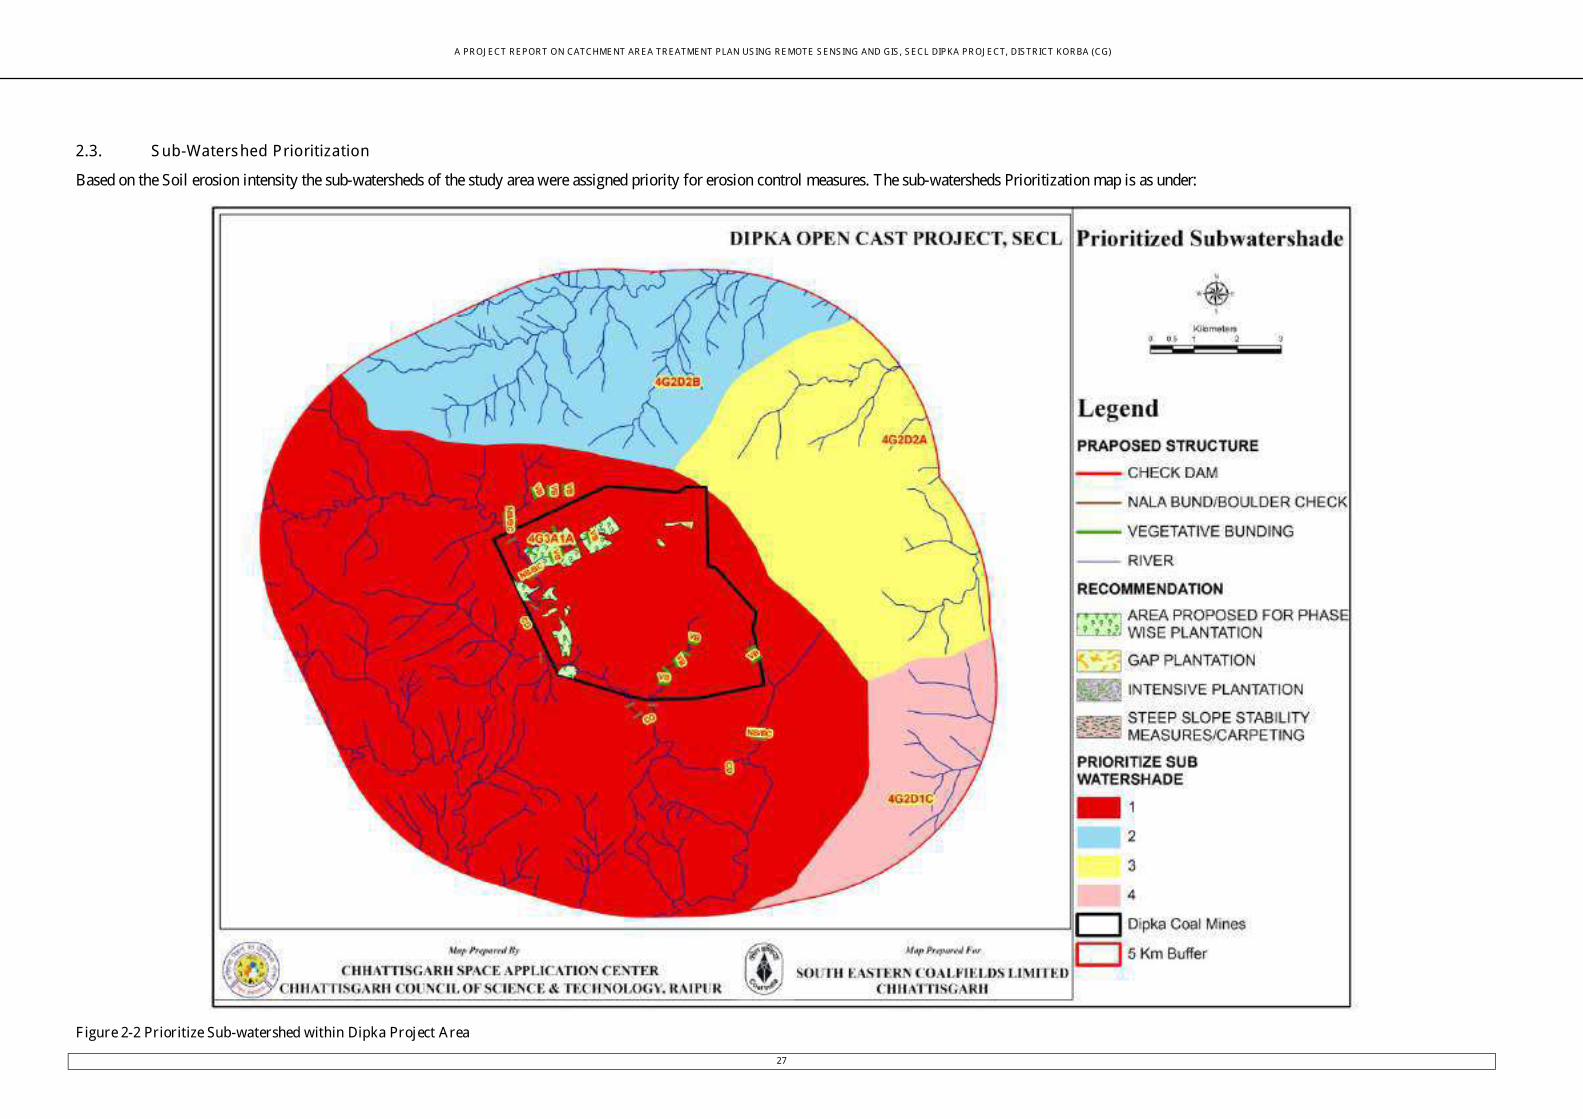
A PR OJ E CT R E POR T ON CATCHME NT AR E A TR E ATME NT PLAN US ING R E MOTE S E NS ING AND GIS b S E CL DIPKA PR OJ E CTb DIS TR ICT KOR BA (CG)
27
2.3. S ubcWatershed Prioritization
Based on the Soil erosion intensity the subcwatersheds of the study area were assigned priority for erosion control measures. The subcwatersheds Prioritization map is as under:
F igure 2c2 Prioritize Subcwatershed within Dipka Project Area

A PR OJ E CT R E POR T ON CATCHME NT AR E A TR E ATME NT PLAN US ING R E MOTE S E NS ING AND GIS b S E CL DIPKA PR OJ E CTb DIS TR ICT KOR BA (CG)
28
F igure 2c3 Action Plan for Surface Drainage including Surface Conservation Plan within Dipka Project Area
A PR OJ E CT R E POR T ON CATCHME NT AR E A TR E ATME NT PLAN US ING R E MOTE S E NS ING AND GIS b S E CL DIPKA PR OJ E CTb DIS TR ICT KOR BA (CG)
29
2.3.1. Objectives of E rosion Control Measures
Intercepting raindropsb reducing their velocity and lessening the erosive effect of rainfall;
Reducing the velocity of surface runoffb thereby reducing the rate of erosion; Sustaining plant rootsb and their associated microorganismsb helping to bind soil
togetherb increasing infiltration and reducing runoff; and Promoting deeply rooted plantsb thus providing tensile strength to slopes and
decreasing the incidence of erosionb slumpingb and slope failure
2.4. Other E rosion and S ediment Control Measures
Multiple control methods outline in this section provide Dipka Mine options that can be tailored to the type of erosion and sedimentation to be prevented or reduced. On site application of mitigation measures will be determined based on a variety of factorsb and the most appropriate should be implemented.
2.4.1. S ettling tanks/Ditching
During heavy rainfall and thawing eventsb water movement on site can be significant. Strategically placed ditches and runoff collection structures can help direct water movement by reducing the total amount of water and reducing its interaction with erosion prone sites. Creating an intercepting ditch above the cut slope will catch water and direct it to less erosion prone areasb thereby reducing runoff over sensitive regions. Intercepting ditches around the mine site convey water to the Main Pit which can be subsequently pumped to water treatment plant.
2.4.2. R evegetation
Establishing a vegetative layer is critical to sites where there are exposed slopes and no further construction is planned. Once establishedb a vegetative layer eliminates the need for continual monitoring and maintenance by protecting the lighterb organic soil fractions from being displacedb retaining moistureb and preventing slope destabilization. Establishing permanent areas of vegetationb or the temporary seeding of hardyb fast growing speciesb can offer short or long term erosion control. The choice of vegetation species will depend on many factorsb such as availabilityb hardiness and emergence.
Two important factors in choosing vegetation well suited specifically for erosion control are; those that provide roughness on the site surfaceb and have extensive rooting systems that will break up the top layer of soil. Both of these factors will improve water infiltration into the soil. Seedbed preparations for vegetation establishment on steep slopes will have to be considered for those sites where it is determined to be a concernb and could include slope stabilizationb stream course protection through the use of mats and mulch or organic matter application. Soil properties including organic matter content and nutrient level must also be addressed to promote successful recvegetation. Revegetation must be done with appropriate engineering consultation to ensure that the roots of seeded species will not adversely affect
A PR OJ E CT R E POR T ON CATCHME NT AR E A TR E ATME NT PLAN US ING R E MOTE S E NS ING AND GIS b S E CL DIPKA PR OJ E CTb DIS TR ICT KOR BA (CG)
30
the structural properties of the surface to be revegetated. Following construction of mine infrastructureb revegetation can be immediately implemented on areas disturbed during constructionb but which are no longer required for operations (e.g.b overburden stockpilesb disturbed pitsb along road routes and road ditches).
2.4.3. S ilt Fencing
Installing silt fence as a sediment control method is a common method employed for level areas with diffuse erosion potential from sheeting on light soils. Silt fences are used to protect downslope areas and prevent further movement of the sediment as it is being transported. Settling of coarser material occurs as the runoff ponds upstream of the fence. Silt fencing is not appropriate for heavy flow areas and requires continuous maintenance.
2.4.4. S heeting/Matting
Impermeable polyethylene sheets can offer immediate and temporary erosion control. Their use is suited for emergency responses or for short term protection in an area where the sheets will not be disturbedb because they are susceptible to tearing or movement by wind and heavy rainfall events. Alsob they require inspection and maintenance until more permanent erosion measures can be implemented. Howeverb properly installed and anchoredb they can provide complete isolation of the erodible surfaces from the effects of wind and water erosion.
Blanco et alb (2008) mentioned the importance of coir matting in dump stability. The coir matting is widely used in the dump slope stabilization and prevention of dump failures. It is a biodegradable coir geoctextile made of coconut fiber or husk. It facilitates new vegetation by absorbing water and preventing topsoil from drying out. Seeding or plantation is done after blanketing the coir matting on the dump slope. They provide dump soil good support allowing natural vegetation to become established. The process of coir matt blanketing on the dump slopes is strongly recommended. First the dump soil slopes are maintained properly. The seeding is done next. After that the coir matt are placed on the dump with proper anchor. Then the seedling will soon cover the dump with vegetation which stabilizes the dump.
Paithankar A. G. et alb (2001) described the plantation system in the dump slope. V egetation in dump slope protects dump failures through root systems and plant coverb which improve soil particle aggregation in a low cohesion situationb preventing the dump failures. The roots of the fast growing plants and bushes penetrate through the failure zones to the stable and the compact soil beneath. So it holds the moving dump soil mass and prevents the dump failures.
2.4.5. Proposed S pecies for Plantation
It is very important to evolve vegetation at multiple levels c plant treesb shrubsb and groundcovers. A multiclevel canopy will do the best job of intercepting and slowing precipitation before it hits the groundb thus reducing surface erosion.
A lso species selection should be such that species found in the state should be preferred and Leguminous should be planted in conjunction with other species. The recommended planting material for the SECL area are as under:
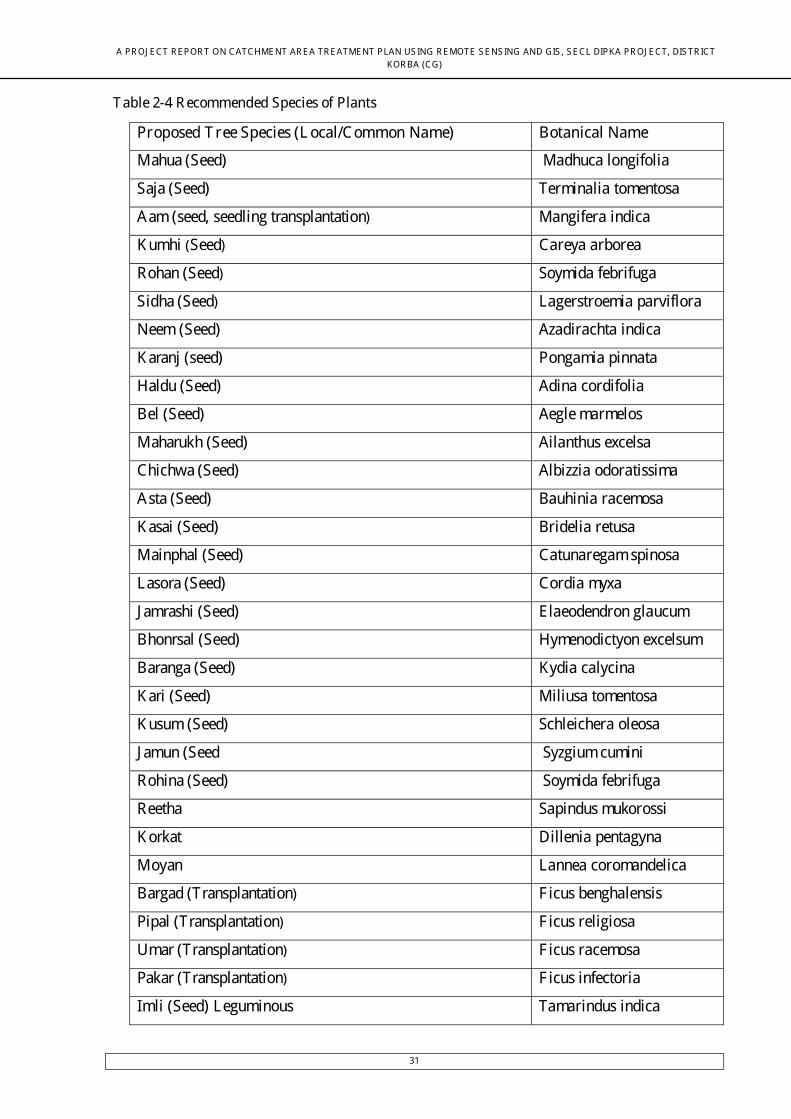
A PR OJ E CT R E POR T ON CATCHME NT AR E A TR E ATME NT PLAN US ING R E MOTE S E NS ING AND GIS b S E CL DIPKA PR OJ E CTb DIS TR ICT KOR BA (CG)
31
T able 2c4 R ecommended Species of Plants
Proposed T ree Species (L ocal/Common Name) Botanical Name
Mahua (Seed) Madhuca longifolia
Saja (Seed) Terminalia tomentosa
Aam (seedb seedling transplantation) Mangifera indica
K umhi (Seed) Careya arborea
Rohan (Seed) Soymida febrifuga
Sidha (Seed) Lagerstroemia parviflora
Neem (Seed) Azadirachta indica
K aranj (seed) Pongamia pinnata
Haldu (Seed) Adina cordifolia
Bel (Seed) Aegle marmelos
Maharukh (Seed) Ailanthus excelsa
Chichwa (Seed) Albizzia odoratissima
Asta (Seed) Bauhinia racemosa
K asai (Seed) Bridelia retusa
Mainphal (Seed) Catunaregam spinosa
Lasora (Seed) Cordia myxa
J amrashi (Seed) Elaeodendron glaucum
Bhonrsal (Seed) Hymenodictyon excelsum
Baranga (Seed) Kydia calycina
K ari (Seed) Miliusa tomentosa
K usum (Seed) Schleichera oleosa
J amun (Seed Syzgium cumini
Rohina (Seed) Soymida febrifuga
Reetha Sapindus mukorossi
K orkat Dillenia pentagyna
Moyan Lannea coromandelica
Bargad (Transplantation) F icus benghalensis
Pipal (Transplantation) F icus religiosa
Umar (Transplantation) F icus racemosa
Pakar (Transplantation) F icus infectoria
Imli (Seed) Leguminous Tamarindus indica

A PR OJ E CT R E POR T ON CATCHME NT AR E A TR E ATME NT PLAN US ING R E MOTE S E NS ING AND GIS b S E CL DIPKA PR OJ E CTb DIS TR ICT KOR BA (CG)
32
Amaltas (Seed) Leguminous Cassia fistula
Babool (Seed) Leguminous Acacia nilotica
K ala siris (Seed) Leguminous Albizzia lebbeck
Palas (Seed) Leguminous Butea monosperma
Proposed Shrub Species (L ocal/Common Name) Botanical Name
Chilhi (Seed) Casearia tomentosa
Dikamali (Seed) Gardenia gummifera
Adusa (Seed) Adhatoda vasica
Akol (Seed) Alangium salvifolium
K aronda (Seed) Carissa spinarum
Baibirang (Seed) Embelia ribes
Marodphali (Seed) Helecteres isora
Dudhi (Seedb Transplantation) Holarrhena antidysentirica
Chipti (Seed) Leguminous Desmodium pulchellum
Chapar (Seed) Leguminous Moghamia chapar
Proposed C limbers and L ianas Species (L ocal/Common
Name)
Botanical Name
Satawar (Seedb Tuber) Asparagus racemosus–
Dangkanda (Seedb Tuberb Bulbil) Dioscorea bulbifera
Baichandi (Tuberb Bulbil) Dioscorea hispida
Gudmar (Cuttingb Seed) Gymnema sylvestre
Palasbel (Seed) Spatholobus roxburghii
Malkangni (Seed) Celestrus peniculata
Dhimarbel (Seed) Ichnocarpus frutescens
Ramdaton (Seed) Smilax zeylanica
Guruch (Cuttingb Seed) Tinospora cordifolia
K eoti (Seed) Vallaris heynei
K eoti (Seed) Ventilago calyculata
Mahul (Seed) Leguminous Bauhinia vahlii
Bel Palas (Leguminous) Butea roxburghii
Soil Stabilizer Grasses Botanical Name
V etiver grass Chrysopogon zizanioides
Moonj grass Saccharum munja

A PR OJ E CT R E POR T ON CATCHME NT AR E A TR E ATME NT PLAN US ING R E MOTE S E NS ING AND GIS b S E CL DIPKA PR OJ E CTb DIS TR ICT KOR BA (CG)
33
Stylish Hemata grass Stylosanthes Sp.
Andropogon aciculatus
Dicanthium (Bothriochloa) pertusa
Saccharum spontaneum
For water logged areas Botanical Name
Bermuda grass also known as V ilfa stellate Cynodon dactylon
2.4.5.1. Mechanism
Planting a relatively large areab especially on steep slopes of old dumps where fresh erosion is seenb hydroseeding can be carried out in a very short period of time. It can be very effective for hillsides and sloping lawns to help with erosion control and quick planting. Hydro seeding will typically cost effective than planting with sodb but more than broadcast seeding. Results are often quick with high germination rates producing grass growth in about a week and mowing maintenance beginning around 3 to 4 weeks from the date of application. Fiber mulch accelerates the growing process by maintaining moisture around the seeds thereby increasing the rate of germination.
***********
ANNEXURE-7
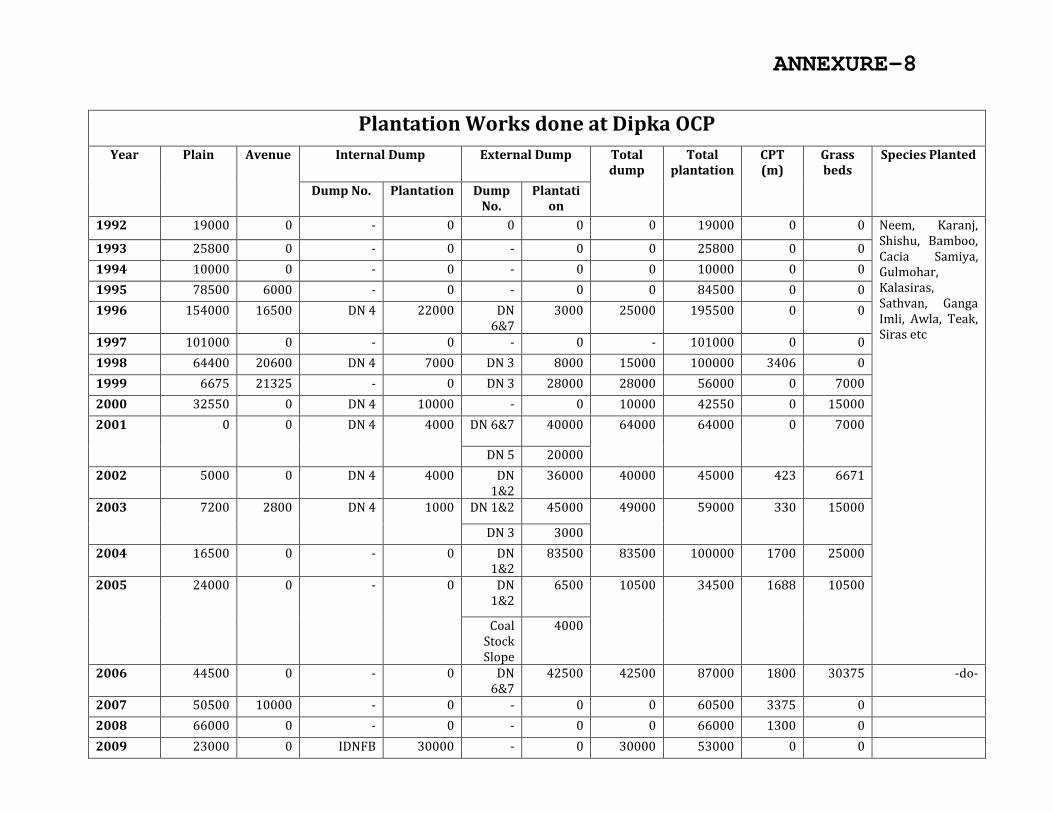
Plantation Works done at Dipka OCP
Year Plain Avenue Internal Dump External Dump Total
dump
Total
plantation
CPT
(m)
Grass
beds
Species Planted
Dump No. Plantation Dump
No.
Plantati
on
1992 19000 0 - 0 0 0 0 19000 0 0 Neem, Karanj,
Shishu, Bamboo,
Cacia Samiya,
Gulmohar,
Kalasiras,
Sathvan, Ganga
Imli, Awla, Teak,
Siras etc
1993 25800 0 - 0 - 0 0 25800 0 0
1994 10000 0 - 0 - 0 0 10000 0 0
1995 78500 6000 - 0 - 0 0 84500 0 0
1996 154000 16500 DN 4 22000 DN
6&7
3000 25000 195500 0 0
1997 101000 0 - 0 - 0 - 101000 0 0
1998 64400 20600 DN 4 7000 DN 3 8000 15000 100000 3406 0
1999 6675 21325 - 0 DN 3 28000 28000 56000 0 7000
2000 32550 0 DN 4 10000 - 0 10000 42550 0 15000
2001 0 0 DN 4 4000 DN 6&7 40000 64000 64000 0 7000
DN 5 20000
2002 5000 0 DN 4 4000 DN
1&2
36000 40000 45000 423 6671
2003 7200 2800 DN 4 1000 DN 1&2 45000 49000 59000 330 15000
DN 3 3000
2004 16500 0 - 0 DN
1&2
83500 83500 100000 1700 25000
2005 24000 0 - 0 DN
1&2
6500 10500 34500 1688 10500
Coal
Stock
Slope
4000
2006 44500 0 - 0 DN
6&7
42500 42500 87000 1800 30375 -do-
2007 50500 10000 - 0 - 0 0 60500 3375 0
2008 66000 0 - 0 - 0 0 66000 1300 0
2009 23000 0 IDNFB 30000 - 0 30000 53000 0 0
ANNEXURE-8
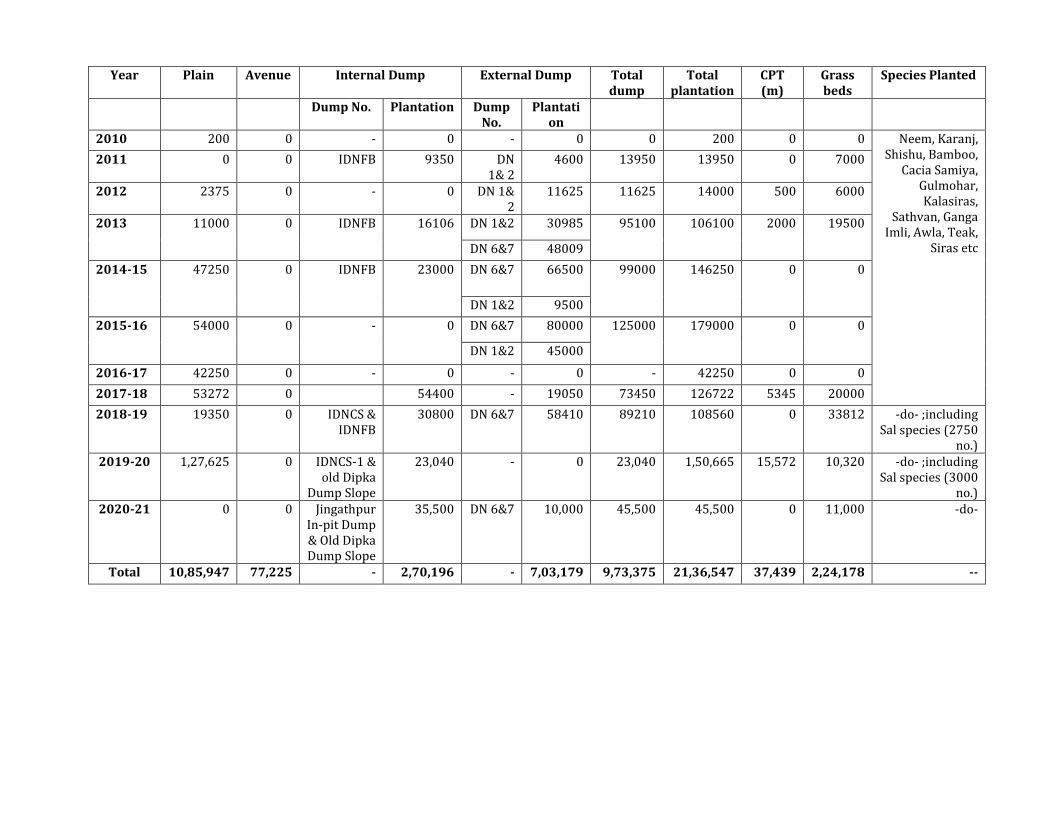
Year Plain Avenue Internal Dump External Dump Total
dump
Total
plantation
CPT
(m)
Grass
beds
Species Planted
Dump No. Plantation Dump
No.
Plantati
on
2010 200 0 - 0 - 0 0 200 0 0 Neem, Karanj,
Shishu, Bamboo,
Cacia Samiya,
Gulmohar,
Kalasiras,
Sathvan, Ganga
Imli, Awla, Teak,
Siras etc
2011 0 0 IDNFB 9350 DN
1& 2
4600 13950 13950 0 7000
2012 2375 0 - 0 DN 1&
2
11625 11625 14000 500 6000
2013 11000 0 IDNFB 16106 DN 1&2 30985 95100 106100 2000 19500
DN 6&7 48009
2014-15 47250 0 IDNFB 23000 DN 6&7 66500 99000 146250 0 0
DN 1&2 9500
2015-16
54000 0 - 0 DN 6&7 80000 125000 179000 0 0
DN 1&2 45000
2016-17 42250 0 - 0 - 0 - 42250 0 0
2017-18 53272 0 54400 - 19050 73450 126722 5345 20000
2018-19 19350 0 IDNCS &
IDNFB
30800 DN 6&7 58410 89210 108560 0 33812 -do- ;including
Sal species (2750
no.)
2019-20 1,27,625 0 IDNCS-1 &
old Dipka
Dump Slope
23,040 - 0 23,040 1,50,665 15,572 10,320 -do- ;including
Sal species (3000
no.)
2020-21 0 0 Jingathpur
In-pit Dump
& Old Dipka
Dump Slope
35,500 DN 6&7 10,000 45,500 45,500 0 11,000 -do-
Total 10,85,947 77,225 - 2,70,196 - 7,03,179 9,73,375 21,36,547 37,439 2,24,178 --
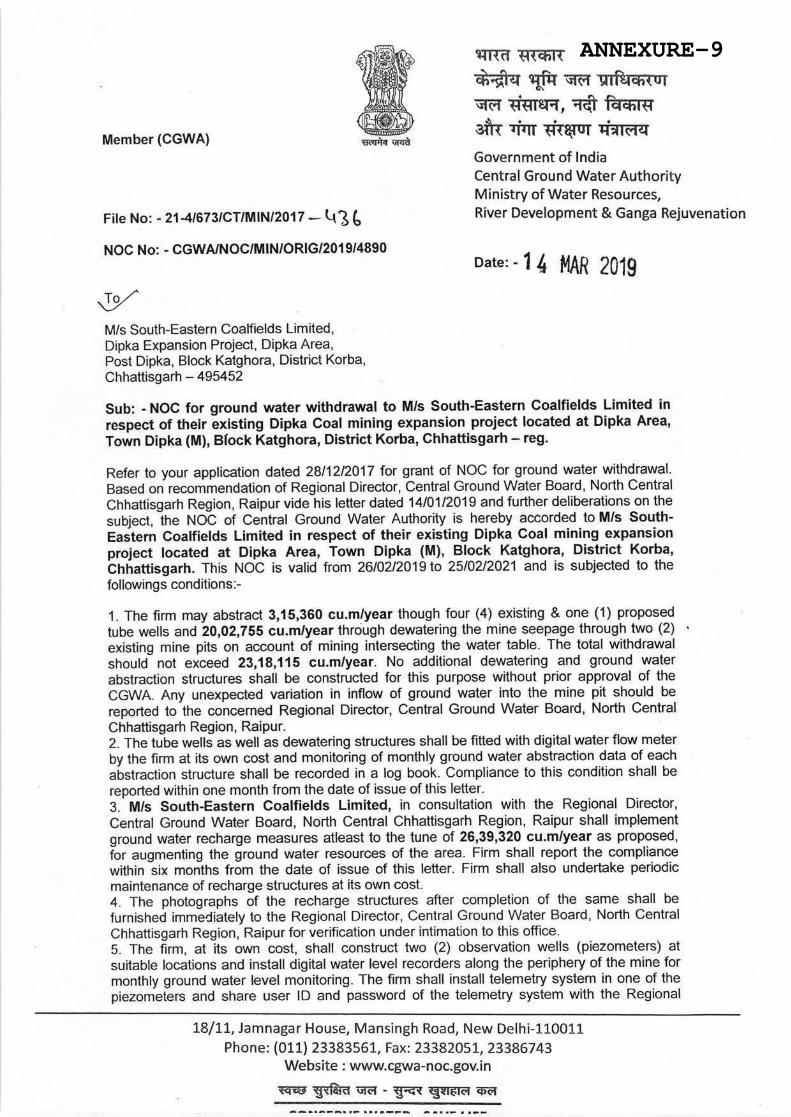
Member (CGWA)
t{m wf,65rr
*ffiq qp vnn rrreffirurqd{ dsrtr{, T{ frfrrfr
r\r..SIR ITTT Ttfq{UT qTilETq
Government of lndia
Central Ground Water AuthorityMinistry of Water Resources,
River Development & Ganga RejuvenationFile No: -214t673tcTlMlN/2017 - lq3
6
NOC No: - CGWA/NOC,MIN/ORIG/201 9/4890Date:-l $ t4AR Z01g
M/s South-Eastern Coalfields Limited,
Dipka Expansion Project, Dipka Area,
Post Dipka, Block Katghora, District Korba,
Chhattisgarh - 495452
Sub: - NOC for ground water withdrawal to M/s South-Eastern Coalfields Limited in
respect of their existing Dipka Coal mining expansion project located at Dipka Area,
Town Dipka (M), Block Katghora, District Korba, Ghhattisgarh - reg.
Refer to your application dated 28t12t2017 for grant of NOC for ground water withdrawal.
Based on recommendation of Regional Director, Central Ground Water Board, North Central
Chhattisgarh Region, Raipur vide his letter dated 1410112019 and further deliberations on the
subject, 1ne ruOC of Central Ground Water Authority is hereby accorded to Mls South-
Eaitern Coalfields Limited in respect of their existing Dipka Coal mining expansion
project located at Dipka Area, Town Dipka (M), Block Katghora, District Korba,
btrtrattisgarh. This NOC is valid from 26102120191o 2510212021 and is subjected to the
followings conditions:-
1. The firm may abstract 3,15,360 cu.m/year though four (4) existing & one (1) proposed
tube wetls and 20,02,755 cu.m/year through dewatering the mine seepage through two (2)
existing mine pits on account of mining intersecting the water table. The total withdrawal
should not exceed 23,18,115 cu.m/year. No additional dewatering and ground water
abstraction structures shall be constructed for this purpose without prior approval of the
CGWA. Any unexpected variation in inflow of ground water into the mine pit should be
reported to the concerned Regional Director, Central Ground Water Board, North Central
Chhattisgarh Region, Raipur.
2. The tube wells as well as dewatering structures shall be fitted with digitalwater flow meter
by the firm at its own cost and monitoring of monthly ground water abstraction data of each
abstraction structure shall be recorded in a log book. Compliance to this condition shall be
reported within one month from the date of issue of this letter.
3. M/s South-Eastern Coalfields Limited, in consultation with the Regional Director,
Central Ground Water Board, North Central Chhattisgarh Region, Raipur shall implement
ground water recharge measures atleast to the tune of 26,39,320 cu.m/year as proposed,
ior augmenting the ground water resources of the area. Firm shall report the compliance
within six months from the date of issue of this letter. Firm shall also undertake periodic
maintenance of recharge structures at its own cost.
4. The photographs of the recharge structures after completion of the same shall be
furnished immediately to the Regional Director, Central Ground Water Board, North Central
Chhattisgarh Region, Raipur for verification under intimation to this office.
5. The firm, at its own cost, shall construct two (2) observation wells (piezometers) at
su1able locations and install digital water level recorders along the periphery of the mine for
monthly ground water level monitoring. The firm shall install telemetry system in one of the
piezometers and share user lD and password of the telemetry system with the Regional
t<t,Jamnagar House, Mansingh Road, New Delhi-110011
Phone: (011) 23383561, Fax: 23382051, 233867 43Website : www.cgwa-noc.gov. i n
wa 5tfea ira - Eq{ q1qrdra 6rd
ANNEXURE-9

Director, Central Ground Water Board, North Central Chhattisgarh Region, Raipur. Further,
the firm shall execute ground water level monitoring four (4) times a year (January, May'
August and November) in core and buffer zone by establishing sufficient number of key wells
in ionsultation with the Regional Director, Central Ground Water Board, North Central
Chhattisgarh Region, RaiPur.
6. The giound witer quality shall be monitored once in a year (during pre-monsoon perlod).
7. The -ground
water moniioring data in respect of S. No. 2, 5 & 6 shall be submitted to the
Regionil Director, Central Ground Water Board, North Central Chhattisgarh Region, Raipur
on regular basis at least once in a year.
B. Th; firm shall ensqe proper recycling and reuse of waste water after adequate treatment.
9. Action taken repoS[in respect of S. No. 1 to 8 shall be submitted to CGWA within one year
period.
iO. fnis NOC is liable to be cancelled in case of non-compliance of any of the conditions as
mentioned in S. No. 1 to 9.
11. The project proponent shall take all necessary measures to prevent contamination of
groundwatei in'tne premises failing which the firm shall be responsible for any
consequences arising there uPon.
12. This NOC is sub]ect to pievailing Central/State Government rules/laws or Court orders
related to construction of tubewell/ground water withdrawal/construction of recharge or
conservation structure/discharge of effluents or any such matter as applicable.
13. The firm shall report self-compliance online in the website (www.cgwa-noc.gov.in) within
one year from the date of issue of this NOC.
t+. ffris NOC does not absolve the applicant / proponent of this obligation / requirement to
obtain other statutory and administrative clearances from other statutory and administrative
authorities.15. The NOC does not imply that other statutory / administrative clearances shall be granted
to the project by the conceined authorities. Such authorities would consider the project on
merits and be taking decisions independently of the NOC.
Copy to:
1. The Member Secretary, Chhattisgarh Environment Conservation Board, Paryavas
Bhavan, North Block Sector-19, Naya Raipur, Chhattisgarh.
2. Direcior I A lll (V), Ministry oi Enrironment, Forest & Ctimate Change I A Diviso-n-, 3'd floor,
Vayu Block, lndira Paryavaran Bhawan, Jor Bagh Road, Aliganj, New Delhi - 1 10003'
e. ine District Coltectoi & Magistrate, District Korba, Chhattisgarh for necessary action.
4. The Regional Director, Central Ground Water Board, North Central Chhattisgarh Region,
Raipur. This has reference to your recommendation dated 1410112019.
5. Guard File 2018-19.
/Member (CGWA)
Member (CGWA)
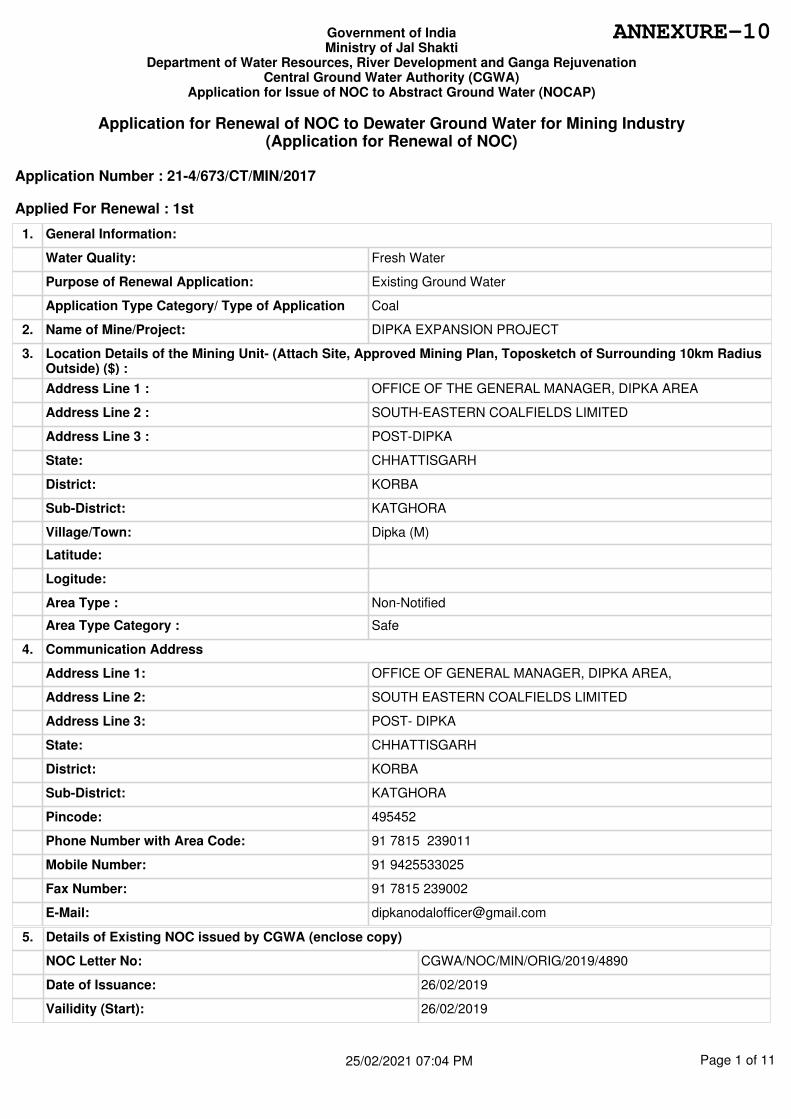
1. General Information:
Water Quality: Fresh Water
Purpose of Renewal Application: Existing Ground Water
Application Type Category/ Type of Application Coal
2. Name of Mine/Project: DIPKA EXPANSION PROJECT
3. Location Details of the Mining Unit- (Attach Site, Approved Mining Plan, Toposketch of Surrounding 10km Radius Outside) ($) :
Address Line 1 : OFFICE OF THE GENERAL MANAGER, DIPKA AREA
Address Line 2 : SOUTH-EASTERN COALFIELDS LIMITED
Address Line 3 : POST-DIPKA
State: CHHATTISGARH
District: KORBA
Sub-District: KATGHORA
Village/Town: Dipka (M)
Latitude:
Logitude:
Area Type : Non-Notified
Area Type Category : Safe
4. Communication Address
Address Line 1: OFFICE OF GENERAL MANAGER, DIPKA AREA,
Address Line 2: SOUTH EASTERN COALFIELDS LIMITED
Address Line 3: POST- DIPKA
State: CHHATTISGARH
District: KORBA
Sub-District: KATGHORA
Pincode: 495452
Phone Number with Area Code: 91 7815 239011
Mobile Number: 91 9425533025
Fax Number: 91 7815 239002
E-Mail: [email protected]
5. Details of Existing NOC issued by CGWA (enclose copy)
NOC Letter No: CGWA/NOC/MIN/ORIG/2019/4890
Date of Issuance: 26/02/2019
Vailidity (Start): 26/02/2019
Page 1 of 1125/02/2021 07:04 PM
Government of IndiaMinistry of Jal Shakti
Department of Water Resources, River Development and Ganga RejuvenationCentral Ground Water Authority (CGWA)
Application for Issue of NOC to Abstract Ground Water (NOCAP)
Application for Renewal of NOC to Dewater Ground Water for Mining Industry(Application for Renewal of NOC)
Application Number : 21-4/673/CT/MIN/2017
Applied For Renewal : 1st
ANNEXURE-10
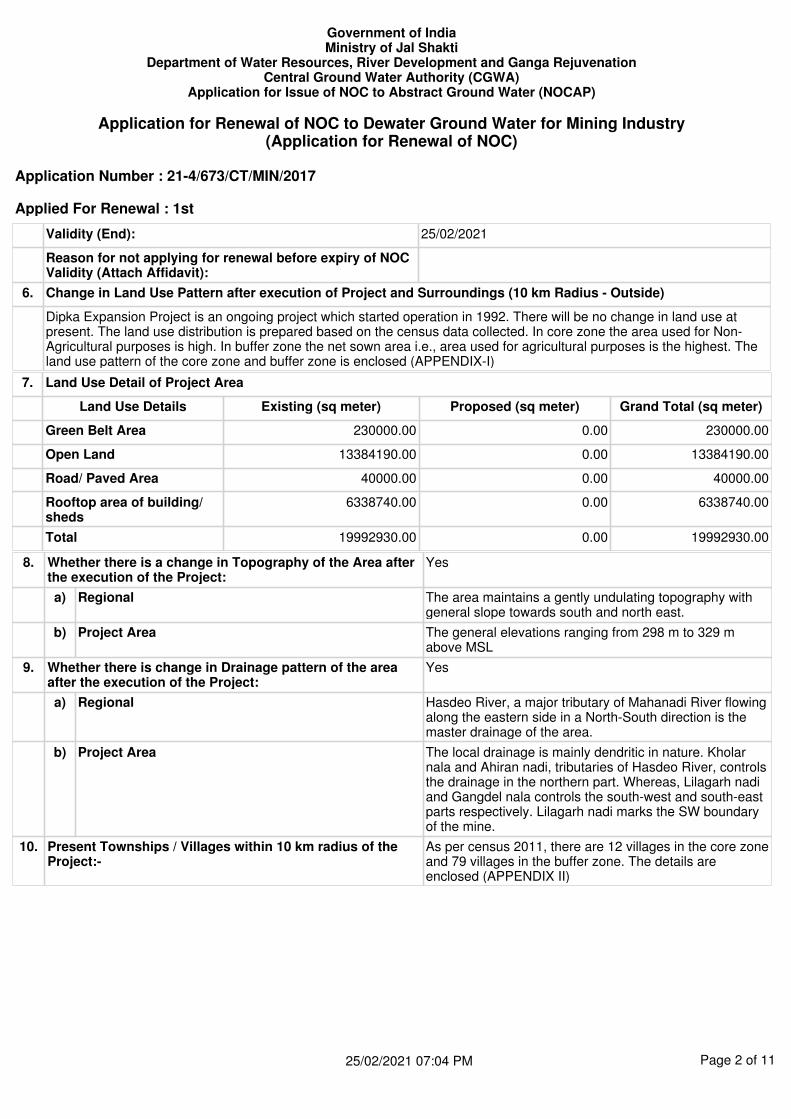
7. Land Use Detail of Project Area
Land Use Details Existing (sq meter) Proposed (sq meter) Grand Total (sq meter)
Green Belt Area 230000.00 0.00 230000.00
Open Land 13384190.00 0.00 13384190.00
Road/ Paved Area 40000.00 0.00 40000.00
Rooftop area of building/ sheds
6338740.00 0.00 6338740.00
Total 19992930.00 0.00 19992930.00
8. Whether there is a change in Topography of the Area after the execution of the Project:
Yes
a) Regional The area maintains a gently undulating topography with general slope towards south and north east.
b) Project Area The general elevations ranging from 298 m to 329 m above MSL
9. Whether there is change in Drainage pattern of the area after the execution of the Project:
Yes
a) Regional Hasdeo River, a major tributary of Mahanadi River flowing along the eastern side in a North-South direction is the master drainage of the area.
b) Project Area The local drainage is mainly dendritic in nature. Kholar nala and Ahiran nadi, tributaries of Hasdeo River, controls the drainage in the northern part. Whereas, Lilagarh nadi and Gangdel nala controls the south-west and south-east parts respectively. Lilagarh nadi marks the SW boundary of the mine.
10. Present Townships / Villages within 10 km radius of the Project:-
As per census 2011, there are 12 villages in the core zone and 79 villages in the buffer zone. The details are enclosed (APPENDIX II)
Validity (End): 25/02/2021
Reason for not applying for renewal before expiry of NOC Validity (Attach Affidavit):
6. Change in Land Use Pattern after execution of Project and Surroundings (10 km Radius - Outside)
Dipka Expansion Project is an ongoing project which started operation in 1992. There will be no change in land use at present. The land use distribution is prepared based on the census data collected. In core zone the area used for Non-Agricultural purposes is high. In buffer zone the net sown area i.e., area used for agricultural purposes is the highest. The land use pattern of the core zone and buffer zone is enclosed (APPENDIX-I)
Page 2 of 1125/02/2021 07:04 PM
Government of IndiaMinistry of Jal Shakti
Department of Water Resources, River Development and Ganga RejuvenationCentral Ground Water Authority (CGWA)
Application for Issue of NOC to Abstract Ground Water (NOCAP)
Application for Renewal of NOC to Dewater Ground Water for Mining Industry(Application for Renewal of NOC)
Application Number : 21-4/673/CT/MIN/2017
Applied For Renewal : 1st

11. Whether the Groundwater Table will be Intersected by Activity :- Yes
(a) At What Depth (m bgl) Pre-monsoon Post-monsoon
Minimum (m bgl) 5.76 2.30
Maximum (m bgl) 12.07 6.95
(b) Maximum Depth Proposed to Dewater (m bgl) 290.00
(c) Groundwater Flow Direction (Attach Map)($) Enclosed as Annexure-A
(d) Any Other Information No
12. Total Water Requirment for various Purpose to be Mentioned Existing(m3/day)
Additional(m3/day)
Existing(m3/year)
Additional(m3/year)
Ground Water Required through Abstract Structure 1164.00 424860.00
Ground Water Abstracted on account of Dewatering / Mining Seepage
5173.00 1888145.00
Total Ground Water Withdrawal 6337.00 0 2313005.00 0
13. Details of De-Watering Structure
(a) De-Watering Existing Structure
Number of Existing Structures: 2
SNo. Type of Structure
Name / Year of
Construction
Depth(Meter) /Diameter
(mm)
Depthto
WaterLevel
(Metersbelow
Ground Level)
Discharge (m3/Hour)
Operational Hours(Day)
/ Days(Year)
Mode of
Lift Name
Horse Power
of Pump
Whether fitted with
Water Meter
WhetherPermissionRegisteredwith CGWA
/If so Details Thereof
1 Mining Pits / 2009
190.00 / - 575.00 8 / 365 Centrifugal Pump
Yes Yes / GWC was initially obtained on 25.03.2004 for withdrawal of 6404 m3/day of groundwater(MineDischarge)
Page 3 of 1125/02/2021 07:04 PM
Government of IndiaMinistry of Jal Shakti
Department of Water Resources, River Development and Ganga RejuvenationCentral Ground Water Authority (CGWA)
Application for Issue of NOC to Abstract Ground Water (NOCAP)
Application for Renewal of NOC to Dewater Ground Water for Mining Industry(Application for Renewal of NOC)
Application Number : 21-4/673/CT/MIN/2017
Applied For Renewal : 1st
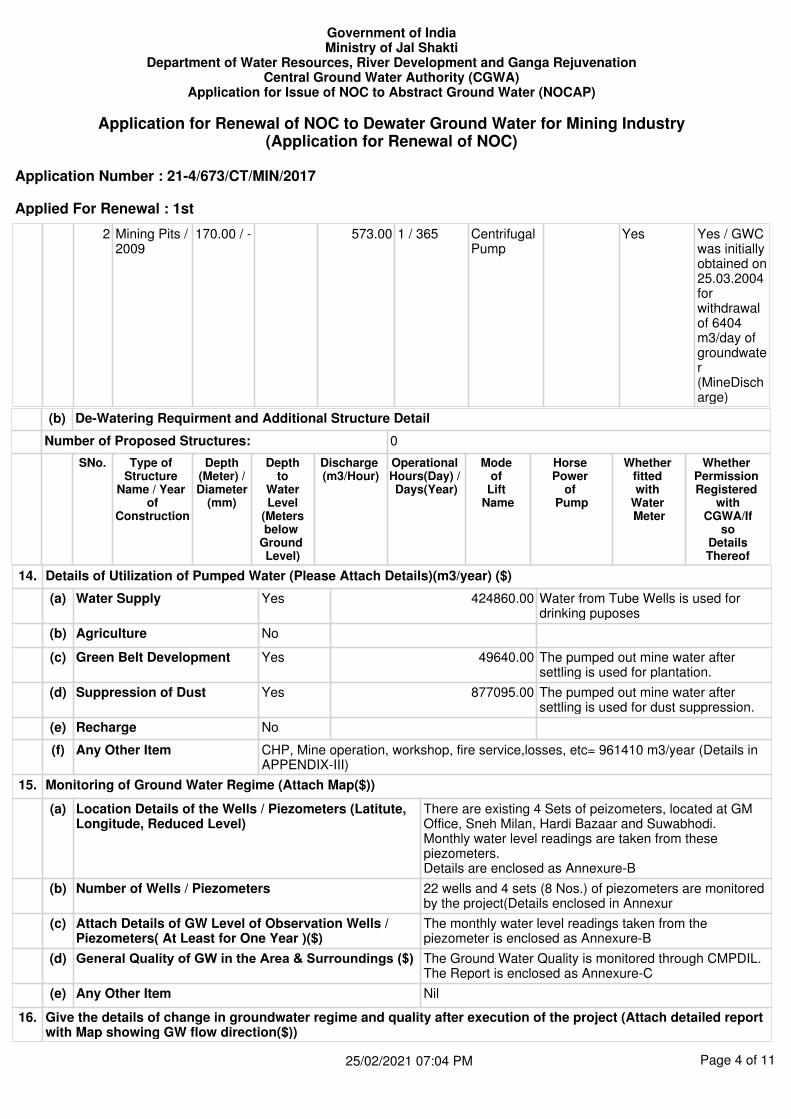
14. Details of Utilization of Pumped Water (Please Attach Details)(m3/year) ($)
(a) Water Supply Yes 424860.00 Water from Tube Wells is used for drinking puposes
(b) Agriculture No
(c) Green Belt Development Yes 49640.00 The pumped out mine water after settling is used for plantation.
(d) Suppression of Dust Yes 877095.00 The pumped out mine water after settling is used for dust suppression.
(e) Recharge No
(f) Any Other Item CHP, Mine operation, workshop, fire service,losses, etc= 961410 m3/year (Details in APPENDIX-III)
15. Monitoring of Ground Water Regime (Attach Map($))
(a) Location Details of the Wells / Piezometers (Latitute, Longitude, Reduced Level)
There are existing 4 Sets of peizometers, located at GM Office, Sneh Milan, Hardi Bazaar and Suwabhodi. Monthly water level readings are taken from these piezometers.Details are enclosed as Annexure-B
(b) Number of Wells / Piezometers 22 wells and 4 sets (8 Nos.) of piezometers are monitored by the project(Details enclosed in Annexur
(c) Attach Details of GW Level of Observation Wells / Piezometers( At Least for One Year )($)
The monthly water level readings taken from the piezometer is enclosed as Annexure-B
(d) General Quality of GW in the Area & Surroundings ($) The Ground Water Quality is monitored through CMPDIL. The Report is enclosed as Annexure-C
(e) Any Other Item Nil
16. Give the details of change in groundwater regime and quality after execution of the project (Attach detailed report with Map showing GW flow direction($))
2 Mining Pits / 2009
170.00 / - 573.00 1 / 365 Centrifugal Pump
Yes Yes / GWC was initially obtained on 25.03.2004 for withdrawal of 6404 m3/day of groundwater(MineDischarge)
(b) De-Watering Requirment and Additional Structure Detail
Number of Proposed Structures: 0
SNo. Type of Structure
Name / Year of
Construction
Depth(Meter) /Diameter
(mm)
Depthto
WaterLevel
(Metersbelow
Ground Level)
Discharge (m3/Hour)
Operational Hours(Day) / Days(Year)
Mode of
Lift Name
Horse Power
of Pump
Whether fitted with
Water Meter
Whether Permission Registered
withCGWA/If
soDetailsThereof
Page 4 of 1125/02/2021 07:04 PM
Government of IndiaMinistry of Jal Shakti
Department of Water Resources, River Development and Ganga RejuvenationCentral Ground Water Authority (CGWA)
Application for Issue of NOC to Abstract Ground Water (NOCAP)
Application for Renewal of NOC to Dewater Ground Water for Mining Industry(Application for Renewal of NOC)
Application Number : 21-4/673/CT/MIN/2017
Applied For Renewal : 1st
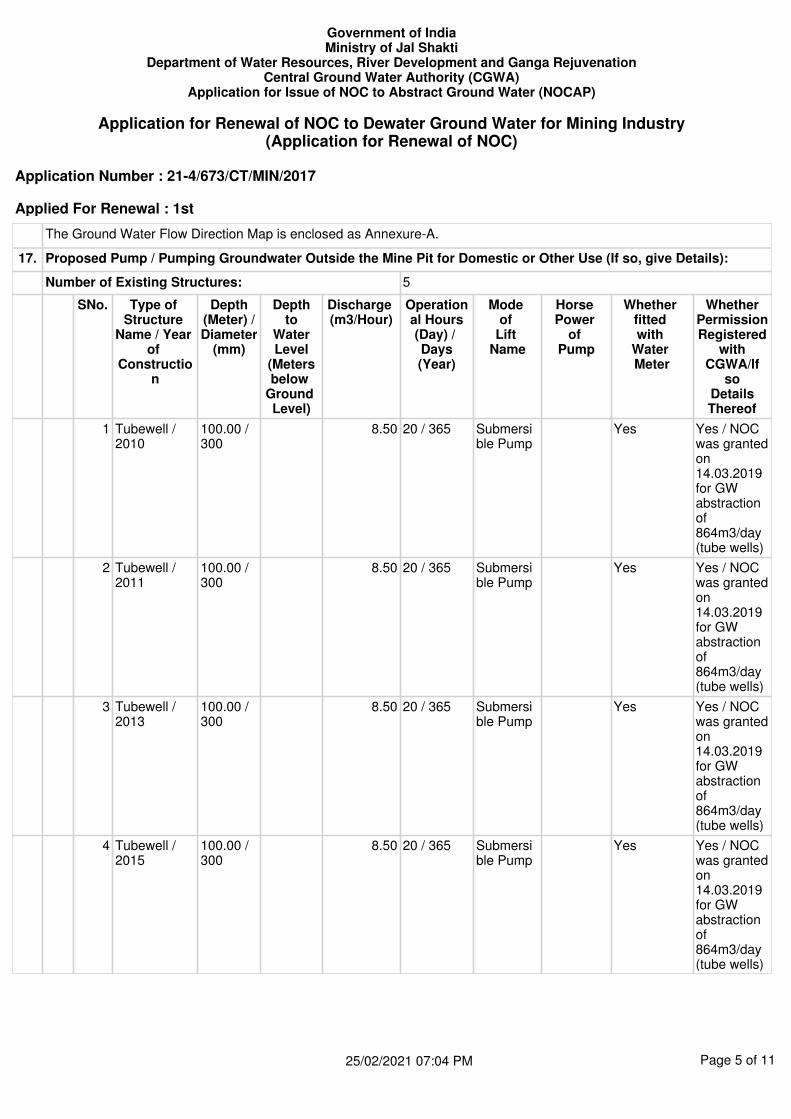
The Ground Water Flow Direction Map is enclosed as Annexure-A.
17. Proposed Pump / Pumping Groundwater Outside the Mine Pit for Domestic or Other Use (If so, give Details):
Number of Existing Structures: 5
SNo. Type of Structure
Name / Year of
Construction
Depth(Meter) /Diameter
(mm)
Depthto
WaterLevel
(Metersbelow
Ground Level)
Discharge (m3/Hour)
Operational Hours(Day) / Days(Year)
Mode of
Lift Name
Horse Power
of Pump
Whether fitted with
Water Meter
WhetherPermissionRegistered
withCGWA/If
soDetailsThereof
1 Tubewell / 2010
100.00 / 300
8.50 20 / 365 Submersible Pump
Yes Yes / NOC was granted on 14.03.2019 for GW abstraction of 864m3/day (tube wells)
2 Tubewell / 2011
100.00 / 300
8.50 20 / 365 Submersible Pump
Yes Yes / NOC was granted on 14.03.2019 for GW abstraction of 864m3/day (tube wells)
3 Tubewell / 2013
100.00 / 300
8.50 20 / 365 Submersible Pump
Yes Yes / NOC was granted on 14.03.2019 for GW abstraction of 864m3/day (tube wells)
4 Tubewell / 2015
100.00 / 300
8.50 20 / 365 Submersible Pump
Yes Yes / NOC was granted on 14.03.2019 for GW abstraction of 864m3/day (tube wells)
Page 5 of 1125/02/2021 07:04 PM
Government of IndiaMinistry of Jal Shakti
Department of Water Resources, River Development and Ganga RejuvenationCentral Ground Water Authority (CGWA)
Application for Issue of NOC to Abstract Ground Water (NOCAP)
Application for Renewal of NOC to Dewater Ground Water for Mining Industry(Application for Renewal of NOC)
Application Number : 21-4/673/CT/MIN/2017
Applied For Renewal : 1st
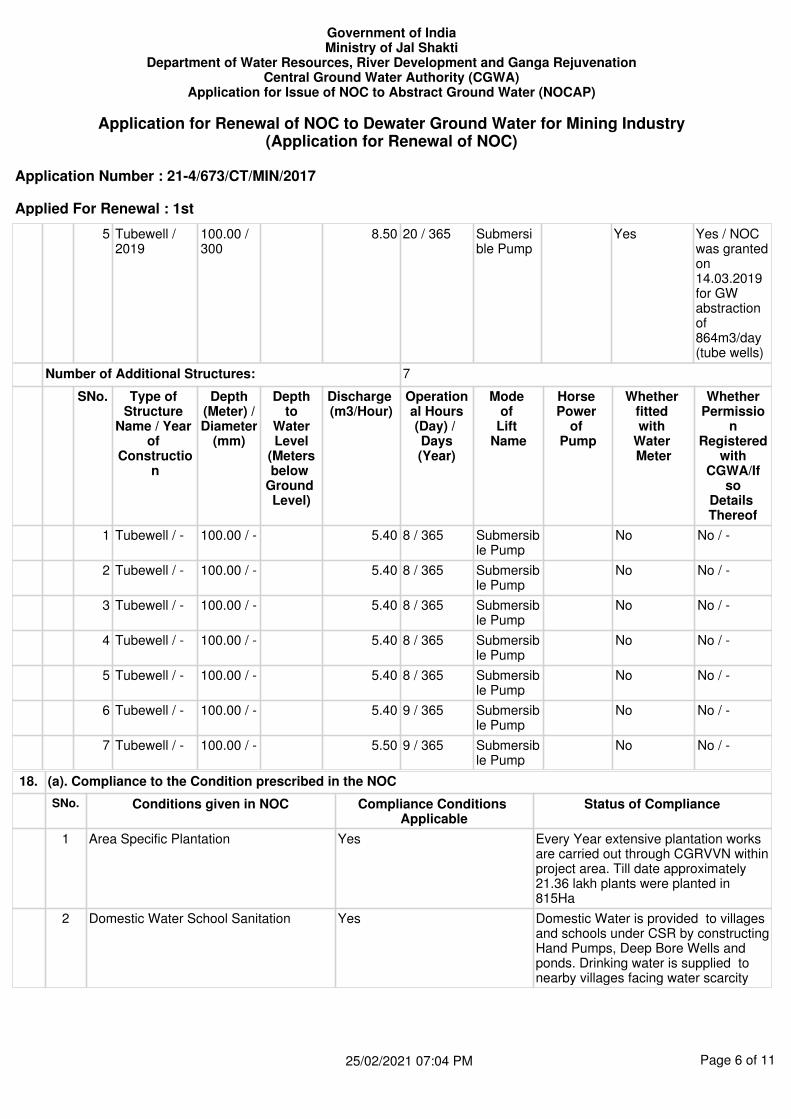
5 Tubewell / 2019
100.00 / 300
8.50 20 / 365 Submersible Pump
Yes Yes / NOC was granted on 14.03.2019 for GW abstraction of 864m3/day (tube wells)
Number of Additional Structures: 7
SNo. Type of Structure
Name / Year of
Construction
Depth(Meter) /Diameter
(mm)
Depthto
WaterLevel
(Metersbelow
Ground Level)
Discharge (m3/Hour)
Operational Hours(Day) / Days(Year)
Mode of
Lift Name
Horse Power
of Pump
Whether fitted with
Water Meter
WhetherPermissio
nRegistered
withCGWA/If
soDetails Thereof
1 Tubewell / - 100.00 / - 5.40 8 / 365 Submersible Pump
No No / -
2 Tubewell / - 100.00 / - 5.40 8 / 365 Submersible Pump
No No / -
3 Tubewell / - 100.00 / - 5.40 8 / 365 Submersible Pump
No No / -
4 Tubewell / - 100.00 / - 5.40 8 / 365 Submersible Pump
No No / -
5 Tubewell / - 100.00 / - 5.40 8 / 365 Submersible Pump
No No / -
6 Tubewell / - 100.00 / - 5.40 9 / 365 Submersible Pump
No No / -
7 Tubewell / - 100.00 / - 5.50 9 / 365 Submersible Pump
No No / -
18. (a). Compliance to the Condition prescribed in the NOC
SNo. Conditions given in NOC Compliance Conditions Applicable
Status of Compliance
1 Area Specific Plantation Yes Every Year extensive plantation works are carried out through CGRVVN within project area. Till date approximately 21.36 lakh plants were planted in 815Ha
2 Domestic Water School Sanitation Yes Domestic Water is provided to villages and schools under CSR by constructing Hand Pumps, Deep Bore Wells and ponds. Drinking water is supplied to nearby villages facing water scarcity
Page 6 of 1125/02/2021 07:04 PM
Government of IndiaMinistry of Jal Shakti
Department of Water Resources, River Development and Ganga RejuvenationCentral Ground Water Authority (CGWA)
Application for Issue of NOC to Abstract Ground Water (NOCAP)
Application for Renewal of NOC to Dewater Ground Water for Mining Industry(Application for Renewal of NOC)
Application Number : 21-4/673/CT/MIN/2017
Applied For Renewal : 1st

3 Groundwater quality monitoring - Pre monsoon and Post monsoon
Yes Ground Water Quality is monitored through CMPDIL quarterly. The latest ground water quality report is attached as Annexure-C
4 Maintenance of recharge structures Yes The maintenance of artificial recharge structures are carried out as and when required and the recharge ponds are de-silted before onset of monsoon.
5 Number of Pizometers as per NOC and Water Level Record
Yes 08 No of piezometers are constructed (4 deep and 4 shallow) and monthly water level records are maintained.(Annexure-B)
6 Number of Tubewells Borewales as per NOC
Yes Total of five bore wells as per NOC is used for GW abstraction. The bore wells are fitted with water meters.
7 Pizometer fitted with AWLRs with telemetrry as per NOC
Yes Two piezometers are fitted with AWLRs and one of them has telemetry system installed as per NOC.
8 Quantum of Groundwater as per NOC Yes The total GW extracted from existing structures is 6315KLd and proposed Quantum of GW for extraction is attached as Appendix-III
9 Recharge through ponds Yes Ground Water Recharge Ponds are constructed in 10 locations within the project. The details are attached as Appendix-IV
10 Recycle and reuse of water Yes Workshop Effluent is treated at ETP and reused for HEMM washing. The dewatered mine water is settled and reused for dust suppression, firefighting and plantation.
11 RWH and AR structures implemented Yes Detailed Report on RWH and AR structures implemented by the project is attached as Appendix-IV
12 Submission of Compliance report to the Region
Yes The self compliance report was submitted to CGWA vide letter no:1792, dated: 14.03.2020.
13 Water conservation measures Yes Artificial recharge ponds are constructed at 10 locations in and around the mines. The pumped out water from mines is stored in 2 sedimentation ponds which is used for dust suppression and plantation
14 Water Security Plan of villages Yes Drinking Water is supplied to Nearby villages facing scarcity of water such as Malgaon, Sirki, hardi Bazar, Krishna Nagar, Reinki and Suwabhodi.
Page 7 of 1125/02/2021 07:04 PM
Government of IndiaMinistry of Jal Shakti
Department of Water Resources, River Development and Ganga RejuvenationCentral Ground Water Authority (CGWA)
Application for Issue of NOC to Abstract Ground Water (NOCAP)
Application for Renewal of NOC to Dewater Ground Water for Mining Industry(Application for Renewal of NOC)
Application Number : 21-4/673/CT/MIN/2017
Applied For Renewal : 1st
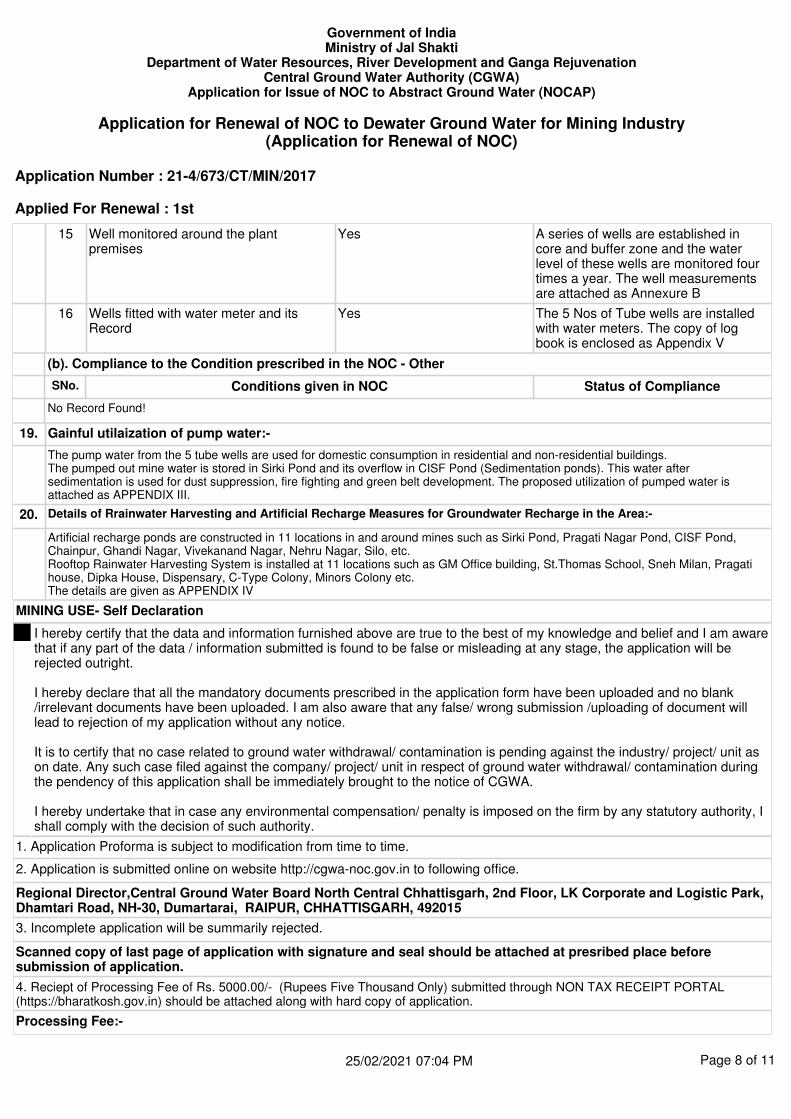
MINING USE- Self Declaration
I hereby certify that the data and information furnished above are true to the best of my knowledge and belief and I am aware that if any part of the data / information submitted is found to be false or misleading at any stage, the application will be rejected outright.
I hereby declare that all the mandatory documents prescribed in the application form have been uploaded and no blank /irrelevant documents have been uploaded. I am also aware that any false/ wrong submission /uploading of document will lead to rejection of my application without any notice.
It is to certify that no case related to ground water withdrawal/ contamination is pending against the industry/ project/ unit as on date. Any such case filed against the company/ project/ unit in respect of ground water withdrawal/ contamination during the pendency of this application shall be immediately brought to the notice of CGWA.
I hereby undertake that in case any environmental compensation/ penalty is imposed on the firm by any statutory authority, I shall comply with the decision of such authority.
1. Application Proforma is subject to modification from time to time.
2. Application is submitted online on website http://cgwa-noc.gov.in to following office.
Regional Director,Central Ground Water Board North Central Chhattisgarh, 2nd Floor, LK Corporate and Logistic Park, Dhamtari Road, NH-30, Dumartarai, RAIPUR, CHHATTISGARH, 492015
3. Incomplete application will be summarily rejected.
Scanned copy of last page of application with signature and seal should be attached at presribed place before submission of application.
4. Reciept of Processing Fee of Rs. 5000.00/- (Rupees Five Thousand Only) submitted through NON TAX RECEIPT PORTAL (https://bharatkosh.gov.in) should be attached along with hard copy of application.
Processing Fee:-
15 Well monitored around the plant premises
Yes A series of wells are established in core and buffer zone and the water level of these wells are monitored four times a year. The well measurements are attached as Annexure B
16 Wells fitted with water meter and its Record
Yes The 5 Nos of Tube wells are installed with water meters. The copy of log book is enclosed as Appendix V
(b). Compliance to the Condition prescribed in the NOC - Other
SNo. Conditions given in NOC Status of Compliance
No Record Found!
19. Gainful utilaization of pump water:-
The pump water from the 5 tube wells are used for domestic consumption in residential and non-residential buildings.The pumped out mine water is stored in Sirki Pond and its overflow in CISF Pond (Sedimentation ponds). This water after sedimentation is used for dust suppression, fire fighting and green belt development. The proposed utilization of pumped water is attached as APPENDIX III.
20. Details of Rrainwater Harvesting and Artificial Recharge Measures for Groundwater Recharge in the Area:-
Artificial recharge ponds are constructed in 11 locations in and around mines such as Sirki Pond, Pragati Nagar Pond, CISF Pond, Chainpur, Ghandi Nagar, Vivekanand Nagar, Nehru Nagar, Silo, etc.Rooftop Rainwater Harvesting System is installed at 11 locations such as GM Office building, St.Thomas School, Sneh Milan, Pragati house, Dipka House, Dispensary, C-Type Colony, Minors Colony etc. The details are given as APPENDIX IV
Page 8 of 1125/02/2021 07:04 PM
Government of IndiaMinistry of Jal Shakti
Department of Water Resources, River Development and Ganga RejuvenationCentral Ground Water Authority (CGWA)
Application for Issue of NOC to Abstract Ground Water (NOCAP)
Application for Renewal of NOC to Dewater Ground Water for Mining Industry(Application for Renewal of NOC)
Application Number : 21-4/673/CT/MIN/2017
Applied For Renewal : 1st
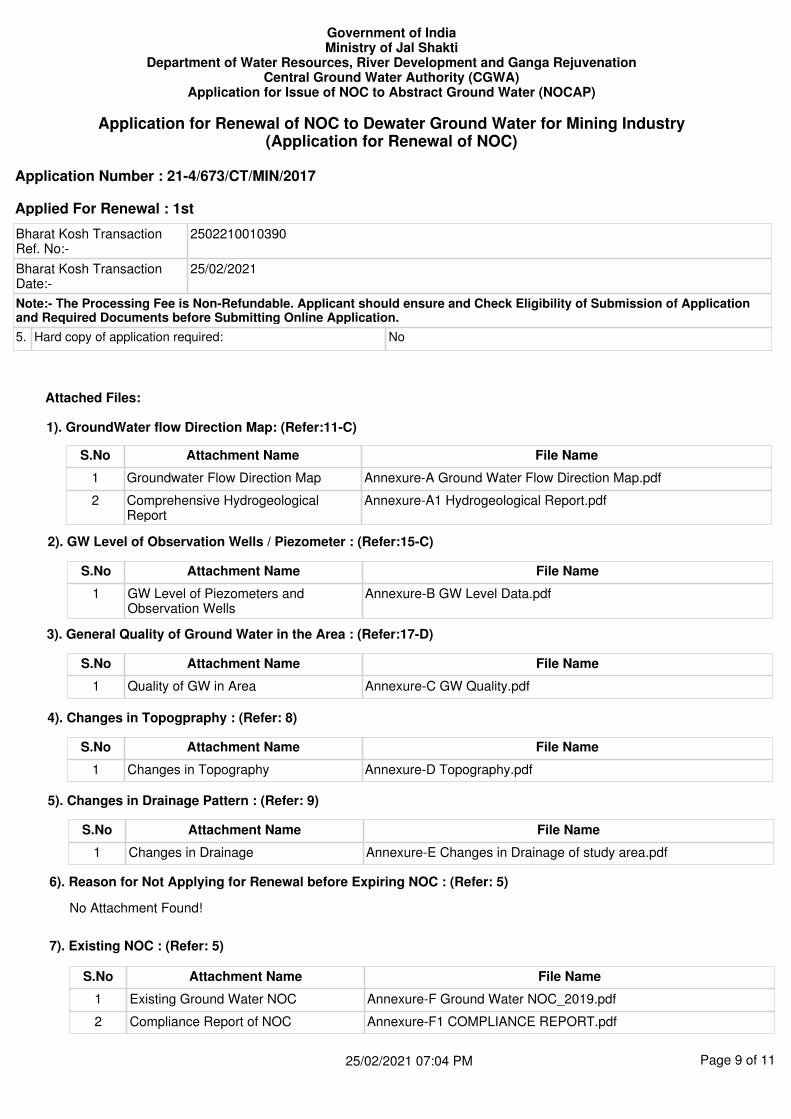
Bharat Kosh Transaction Ref. No:-
2502210010390
Bharat Kosh Transaction Date:-
25/02/2021
Note:- The Processing Fee is Non-Refundable. Applicant should ensure and Check Eligibility of Submission of Application and Required Documents before Submitting Online Application.
5. Hard copy of application required: No
Attached Files:
1). GroundWater flow Direction Map: (Refer:11-C)
4). Changes in Topogpraphy : (Refer: 8)
S.No Attachment Name File Name
1 Groundwater Flow Direction Map Annexure-A Ground Water Flow Direction Map.pdf
2 Comprehensive Hydrogeological Report
Annexure-A1 Hydrogeological Report.pdf
S.No Attachment Name File Name
1 Changes in Topography Annexure-D Topography.pdf
2). GW Level of Observation Wells / Piezometer : (Refer:15-C)
S.No Attachment Name File Name
1 GW Level of Piezometers and Observation Wells
Annexure-B GW Level Data.pdf
3). General Quality of Ground Water in the Area : (Refer:17-D)
S.No Attachment Name File Name
1 Quality of GW in Area Annexure-C GW Quality.pdf
5). Changes in Drainage Pattern : (Refer: 9)
S.No Attachment Name File Name
1 Changes in Drainage Annexure-E Changes in Drainage of study area.pdf
6). Reason for Not Applying for Renewal before Expiring NOC : (Refer: 5)
7). Existing NOC : (Refer: 5)
No Attachment Found!
S.No Attachment Name File Name
1 Existing Ground Water NOC Annexure-F Ground Water NOC_2019.pdf
2 Compliance Report of NOC Annexure-F1 COMPLIANCE REPORT.pdf
Page 9 of 1125/02/2021 07:04 PM
Government of IndiaMinistry of Jal Shakti
Department of Water Resources, River Development and Ganga RejuvenationCentral Ground Water Authority (CGWA)
Application for Issue of NOC to Abstract Ground Water (NOCAP)
Application for Renewal of NOC to Dewater Ground Water for Mining Industry(Application for Renewal of NOC)
Application Number : 21-4/673/CT/MIN/2017
Applied For Renewal : 1st
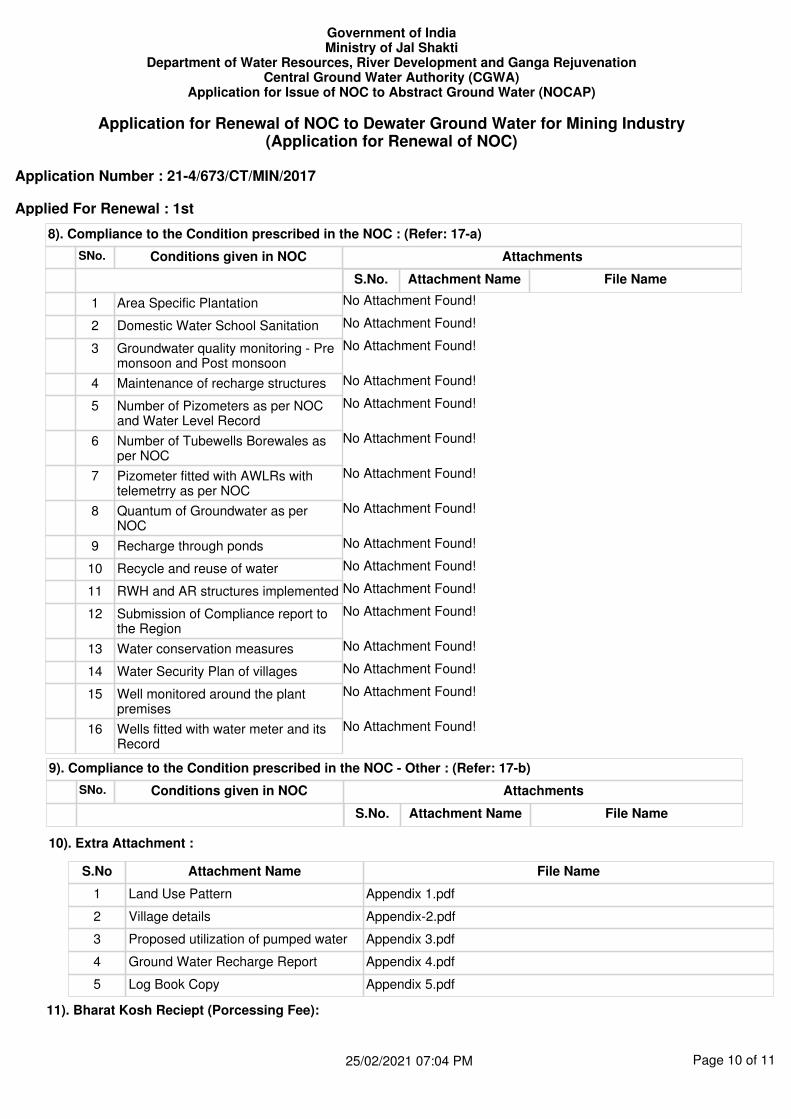
10). Extra Attachment :
S.No Attachment Name File Name
1 Land Use Pattern Appendix 1.pdf
2 Village details Appendix-2.pdf
3 Proposed utilization of pumped water Appendix 3.pdf
4 Ground Water Recharge Report Appendix 4.pdf
5 Log Book Copy Appendix 5.pdf
8). Compliance to the Condition prescribed in the NOC : (Refer: 17-a)
SNo. Conditions given in NOC Attachments
S.No. Attachment Name File Name
1 Area Specific Plantation No Attachment Found!
2 Domestic Water School Sanitation No Attachment Found!
3 Groundwater quality monitoring - Pre monsoon and Post monsoon
No Attachment Found!
4 Maintenance of recharge structures No Attachment Found!
5 Number of Pizometers as per NOC and Water Level Record
No Attachment Found!
6 Number of Tubewells Borewales as per NOC
No Attachment Found!
7 Pizometer fitted with AWLRs with telemetrry as per NOC
No Attachment Found!
8 Quantum of Groundwater as per NOC
No Attachment Found!
9 Recharge through ponds No Attachment Found!
10 Recycle and reuse of water No Attachment Found!
11 RWH and AR structures implemented No Attachment Found!
12 Submission of Compliance report to the Region
No Attachment Found!
13 Water conservation measures No Attachment Found!
14 Water Security Plan of villages No Attachment Found!
15 Well monitored around the plant premises
No Attachment Found!
16 Wells fitted with water meter and its Record
No Attachment Found!
9). Compliance to the Condition prescribed in the NOC - Other : (Refer: 17-b)
SNo. Conditions given in NOC Attachments
S.No. Attachment Name File Name
11). Bharat Kosh Reciept (Porcessing Fee):
Page 10 of 1125/02/2021 07:04 PM
Government of IndiaMinistry of Jal Shakti
Department of Water Resources, River Development and Ganga RejuvenationCentral Ground Water Authority (CGWA)
Application for Issue of NOC to Abstract Ground Water (NOCAP)
Application for Renewal of NOC to Dewater Ground Water for Mining Industry(Application for Renewal of NOC)
Application Number : 21-4/673/CT/MIN/2017
Applied For Renewal : 1st
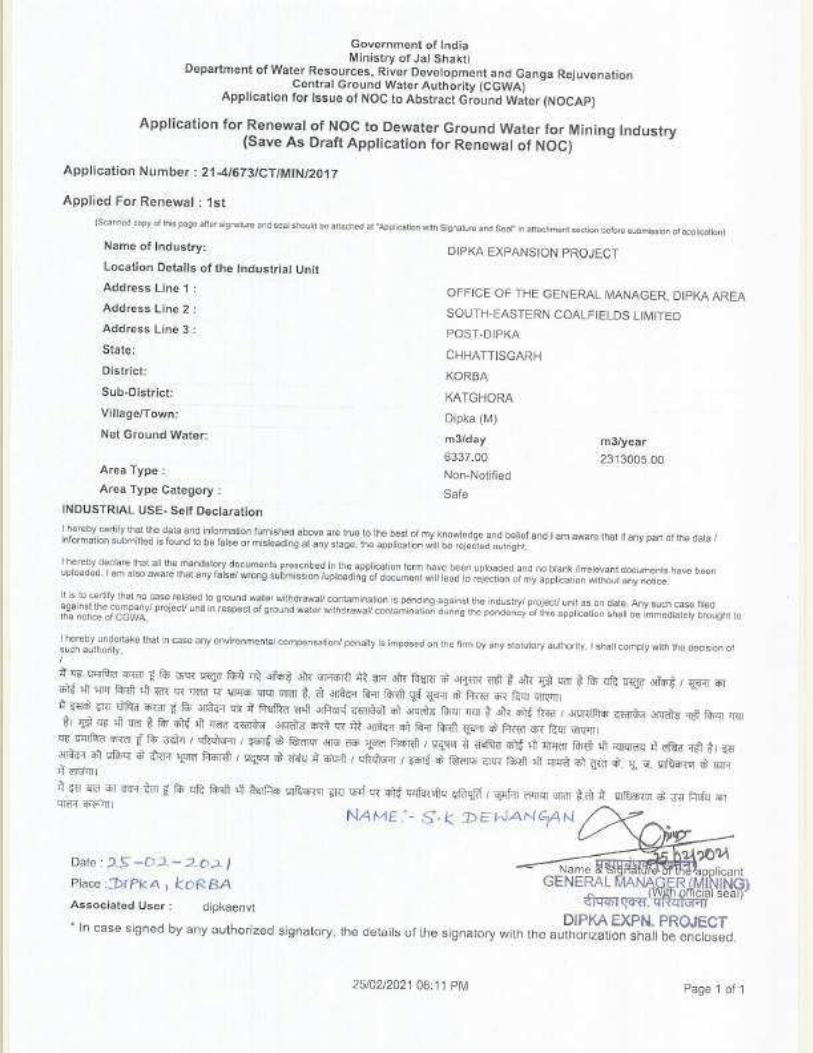
Government of lndia'Ministry of Jal Shakti
Department of Water Resources, River Development and Ganga RejuvenationCentral Ground Water Authority (CGWA)
Application for lssue of NOC to Abstract Ground Water {NOCAP)
Application for Renewal of NOC to Dewater Ground Water for Mining lndustry(Application for Renewal of NOG)
ipplication Nurmber : 21 4167 SICT/MI N/201 7
upplied For Renewal : 1st
S.hlo Attacirment Name File Name
I Bharat Kosh Chal$an Bharath Kosh Challan.pdf
12). Application with Signature and Seal:
e !.:.-.
Date: 25*O2-2921Place : Dl?kA, KOeBa
Signature and Seal Document Signature and Seal Document.pdf
N,quE:-s'k DErIANEA.,
File Name
Name & appiicant
qArmiqo (ss, official seal)
GENERAL MANAGER (MINING}
ftvzffiq'fiT. qRq}_sfl
DIPI(A EXPN. PROJECTAssociatedUser: dipkaenvt
Submitt*d Ey User: dipkaenvt
SubmissE*n Date : 25rc212}21
" ln case signed by any authorized signatory, the details of the signatory with the authorization shall beenclosed.
Attachnrenrt Name
4
1
251021202107:04 PtM Page 1"i cf '1

COPYRIGHT WITH
CMPDI
A MINI RATNA
ISO 9001 COMPANY
Central Mine Planning & Design Institute Limited Regional Institute – V, CMPDI Complex,
BILASPUR (C.G.)
ENVIRONMENTAL MONITORING REPORT
AIR, NOISE & EFFLUENT
(DIPKA AREA)
SOUTH EASTERN COALFIELDS LIMITED
(A Mini Ratna Company)
MARCH - 2021
ANNEXURE-11
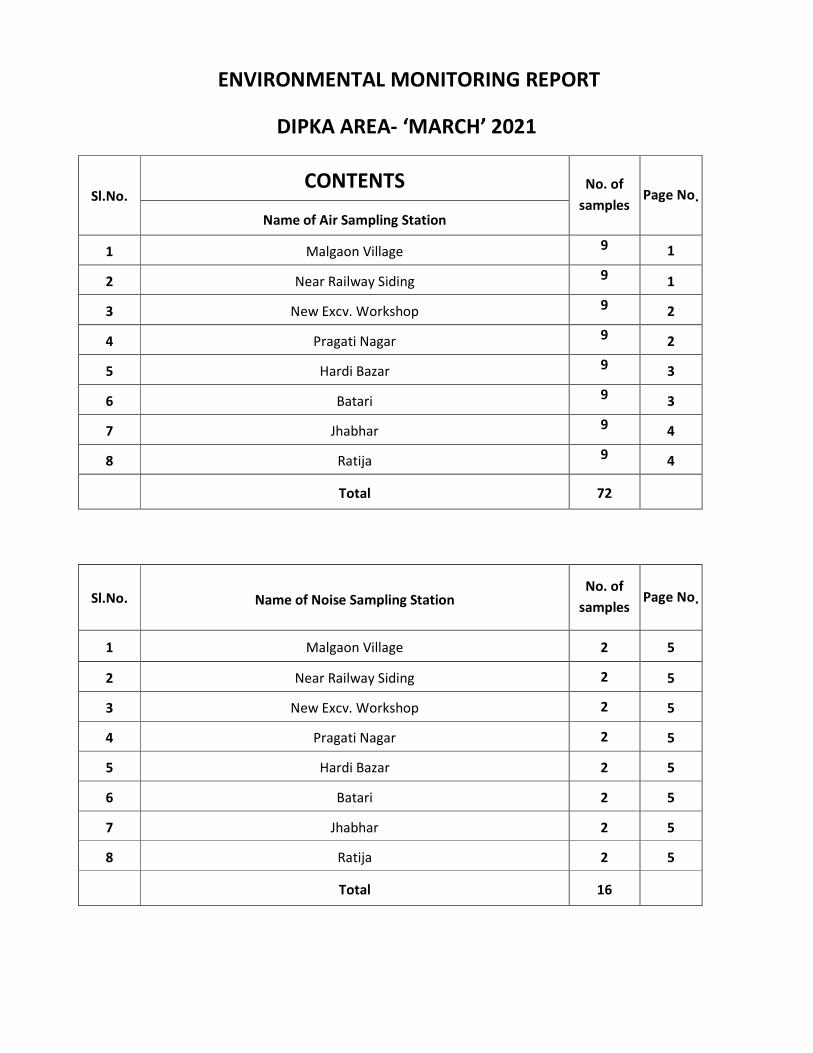
ENVIRONMENTAL MONITORING REPORT
DIPKA AREA- ‘MARCH’ 2021
Sl.No. CONTENTS No. of
samples Page No.
Name of Air Sampling Station
1 Malgaon Village 9 1
2 Near Railway Siding 9 1
3 New Excv. Workshop 9 2
4 Pragati Nagar 9 2
5 Hardi Bazar 9 3
6 Batari 9 3
7 Jhabhar 9 4
8 Ratija 9 4
Total 72
Sl.No. Name of Noise Sampling Station No. of
samples Page No.
1 Malgaon Village 2 5
2 Near Railway Siding 2 5
3 New Excv. Workshop 2 5
4 Pragati Nagar 2 5
5 Hardi Bazar 2 5
6 Batari 2 5
7 Jhabhar 2 5
8 Ratija 2 5
Total 16
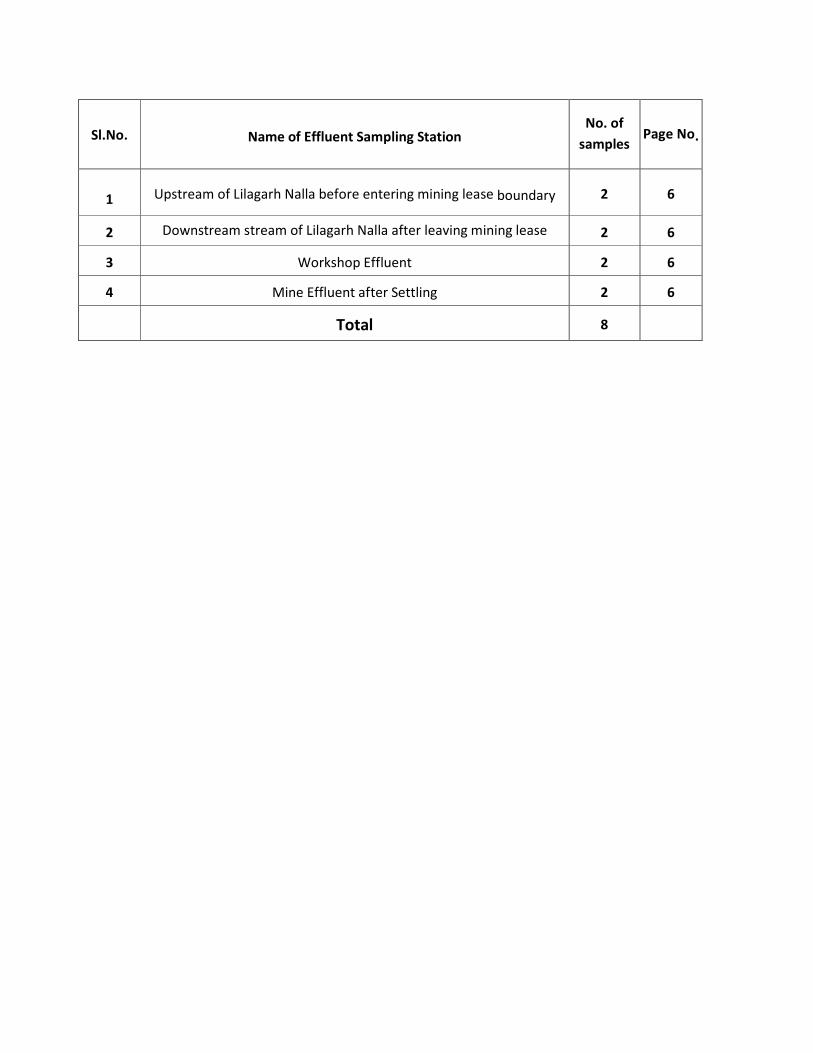
Sl.No. Name of Effluent Sampling Station No. of
samples Page No.
1 Upstream of Lilagarh Nalla before entering mining lease boundary 2 6
2 Downstream stream of Lilagarh Nalla after leaving mining lease 2 6
3 Workshop Effluent 2 6
4 Mine Effluent after Settling 2 6
Total 8
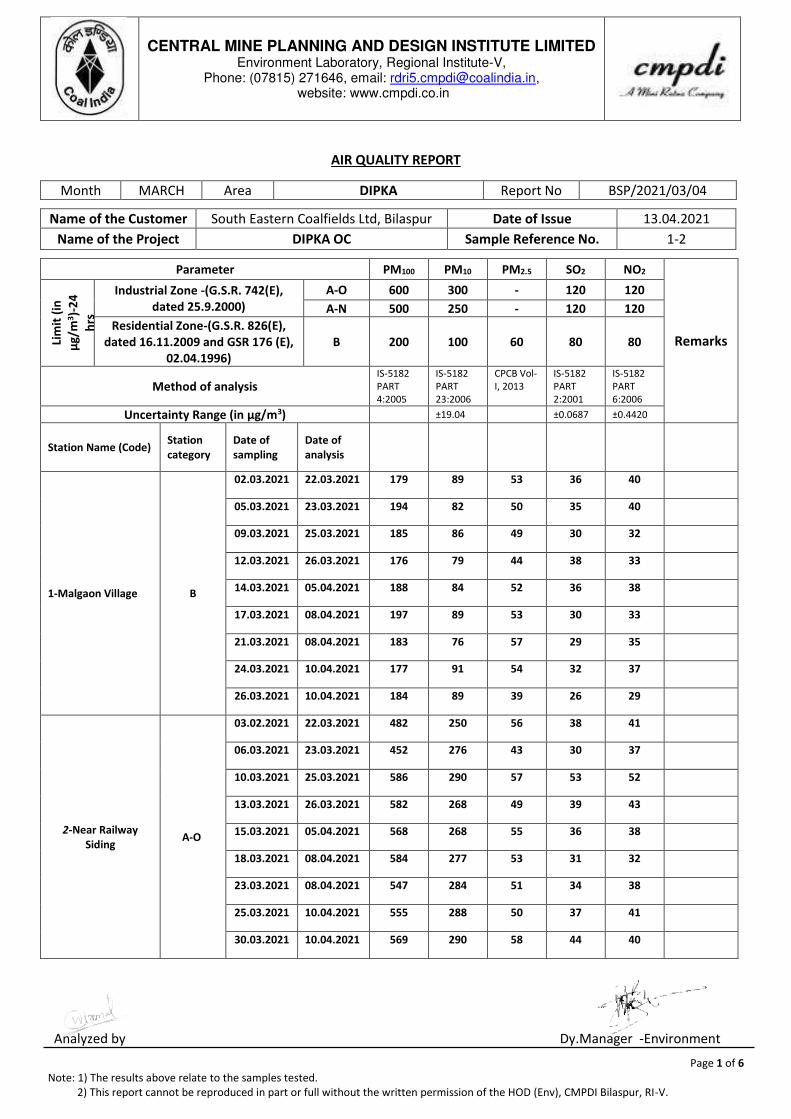
Analyzed by Dy.Manager -Environment
Page 1 of 6
Note: 1) The results above relate to the samples tested.
2) This report cannot be reproduced in part or full without the written permission of the HOD (Env), CMPDI Bilaspur, RI-V.
CENTRAL MINE PLANNING AND DESIGN INSTITUTE LIMITED Environment Laboratory, Regional Institute-V,
Phone: (07815) 271646, email: [email protected], website: www.cmpdi.co.in
AIR QUALITY REPORT
Month MARCH Area DIPKA Report No BSP/2021/03/04
Name of the Customer South Eastern Coalfields Ltd, Bilaspur Date of Issue 13.04.2021
Name of the Project DIPKA OC Sample Reference No. 1-2
Parameter PM100 PM10 PM2.5 SO2 NO2
Remarks Lim
it (
in
µg
/m3)-
24
hrs
Industrial Zone -(G.S.R. 742(E),
dated 25.9.2000)
A-O 600 300 - 120 120
A-N 500 250 - 120 120
Residential Zone-(G.S.R. 826(E),
dated 16.11.2009 and GSR 176 (E),
02.04.1996)
B 200 100 60 80 80
Method of analysis IS-5182
PART
4:2005
IS-5182
PART
23:2006
CPCB Vol-
I, 2013
IS-5182
PART
2:2001
IS-5182
PART
6:2006
Uncertainty Range (in µg/m3) ±19.04 ±0.0687 ±0.4420
Station Name (Code) Station
category
Date of
sampling
Date of
analysis
1-Malgaon Village B
02.03.2021 22.03.2021 179 89 53 36 40
05.03.2021 23.03.2021 194 82 50 35 40
09.03.2021 25.03.2021 185 86 49 30 32
12.03.2021 26.03.2021 176 79 44 38 33
14.03.2021 05.04.2021 188 84 52 36 38
17.03.2021 08.04.2021 197 89 53 30 33
21.03.2021 08.04.2021 183 76 57 29 35
24.03.2021 10.04.2021 177 91 54 32 37
26.03.2021 10.04.2021 184 89 39 26 29
2-Near Railway
Siding A-O
03.02.2021 22.03.2021 482 250 56 38 41
06.03.2021 23.03.2021 452 276 43 30 37
10.03.2021 25.03.2021 586 290 57 53 52
13.03.2021 26.03.2021 582 268 49 39 43
15.03.2021 05.04.2021 568 268 55 36 38
18.03.2021 08.04.2021 584 277 53 31 32
23.03.2021 08.04.2021 547 284 51 34 38
25.03.2021 10.04.2021 555 288 50 37 41
30.03.2021 10.04.2021 569 290 58 44 40

Analyzed by Dy.Manager -Environment
Page 2 of 6
Note: 1) The results above relate to the samples tested.
2) This report cannot be reproduced in part or full without the written permission of the HOD (Env), CMPDI Bilaspur, RI-V.
CENTRAL MINE PLANNING AND DESIGN INSTITUTE LIMITED Environment Laboratory, Regional Institute-V,
Phone: (07815) 271646, email: [email protected], website: www.cmpdi.co.in
AIR QUALITY REPORT
Month MARCH Area DIPKA Report No BSP/2021/03/04
Name of the Customer South Eastern Coalfields Ltd, Bilaspur Date of Issue 13.04.2021
Name of the Project DIPKA OC Sample Reference No. 3-4
Parameter PM100 PM10 PM2.5 SO2 NO2
Remarks Lim
it (
in
µg
/m3)-
24
hrs
Industrial Zone -(G.S.R. 742(E),
dated 25.9.2000)
A-O 600 300 - 120 120
A-N 500 250 - 120 120
Residential Zone-(G.S.R. 826(E),
dated 16.11.2009 and GSR 176 (E),
02.04.1996)
B 200 100 60 80 80
Method of analysis IS-5182
PART
4:2005
IS-5182
PART
23:2006
CPCB Vol-
I, 2013
IS-5182
PART
2:2001
IS-5182
PART
6:2006
Uncertainty Range (in µg/m3) ±19.04 ±0.0687 ±0.4420
Station Name (Code) Station
category
Date of
sampling
Date of
analysis
3-Near Excv.
Workshop A-O
03.03.2021 22.03.2021 494 287 53 37 33
06.03.2021 23.03.2021 543 298 48 27 32
10.03.2021 25.03.2021 434 282 38 39 42
13.03.2021 26.03.2021 576 296 49 35 39
15.03.2021 05.04.2021 587 286 52 30 35
18.03.2021 08.04.2021 498 278 58 27 32
23.03.2021 08.04.2021 555 287 49 33 36
25.03.2021 10.04.2021 589 268 50 35 40
30.03.2021 10.04.2021 567 287 53 38 42
4-Pragati Nagar B
02.03.2021 22.03.2021 167 89 49 29 33
05.03.2021 23.03.2021 188 90 50 37 30
09.03.2021 25.03.2021 167 86 55 31 35
12.03.2021 26.03.2021 184 83 53 30 32
14.03.2021 05.04.2021 167 78 44 35 38
17.03.2021 08.04.2021 185 87 51 33 35
21.03.2021 08.04.2021 179 69 39 38 34
24.03.2021 10.04.2021 187 66 56 36 39
26.03.2021 10.04.2021 185 82 52 32 34

Analyzed by Dy.Manager -Environment
Page 3 of 6
Note: 1) The results above relate to the samples tested.
2) This report cannot be reproduced in part or full without the written permission of the HOD (Env), CMPDI Bilaspur, RI-V.
CENTRAL MINE PLANNING AND DESIGN INSTITUTE LIMITED Environment Laboratory, Regional Institute-V,
Phone: (07815) 271646, email: [email protected], website: www.cmpdi.co.in
AIR QUALITY REPORT
Month MARCH Area DIPKA Report No BSP/2021/03/04
Name of the Customer South Eastern Coalfields Ltd, Bilaspur Date of Issue 13.04.2021
Name of the Project DIPKA OC Sample Reference No. 5-6
Parameter PM100 PM10 PM2.5 SO2 NO2
Remarks Lim
it (
in
µg
/m3)-
24
hrs
Industrial Zone -(G.S.R. 742(E),
dated 25.9.2000)
A-O 600 300 - 120 120
A-N 500 250 - 120 120
Residential Zone-(G.S.R. 826(E),
dated 16.11.2009 and GSR 176 (E),
02.04.1996)
B 200 100 60 80 80
Method of analysis IS-5182
PART
4:2005
IS-5182
PART
23:2006
CPCB Vol-
I, 2013
IS-5182
PART
2:2001
IS-5182
PART
6:2006
Uncertainty Range (in µg/m3) ±19.04 ±0.0687 ±0.4420
Station Name (Code) Station
category
Date of
sampling
Date of
analysis
5-Hardi Bazar B
02.03.2021 22.03.2021 152 85 54 23 28
05.03.2021 23.03.2021 184 60 57 31 33
09.03.2021 25.03.2021 192 86 47 27 30
12.03.2021 26.03.2021 182 83 50 33 39
14.03.2021 05.04.2021 187 79 53 29 31
17.03.2021 08.04.2021 177 83 58 32 36
21.03.2021 08.04.2021 169 88 54 36 30
24.03.2021 10.04.2021 166 76 53 31 36
26.03.2021 10.04.2021 187 84 55 38 40
6-Batari B
03.03.2021 22.03.2021 188 73 58 30 32
06.03.2021 23.03.2021 185 80 50 24 27
10.03.2021 25.03.2021 180 83 53 35 33
13.03.2021 26.03.2021 162 87 49 37 38
15.03.2021 05.04.2021 187 83 55 35 38
18.03.2021 08.04.2021 165 75 57 29 32
23.03.2021 08.04.2021 187 77 53 36 38
25.03.2021 10.04.2021 191 69 49 34 30
30.03.2021 10.04.2021 178 82 50 37 42

Analyzed by Dy.Manager -Environment
Page 4 of 6
Note: 1) The results above relate to the samples tested.
2) This report cannot be reproduced in part or full without the written permission of the HOD (Env), CMPDI Bilaspur, RI-V.
CENTRAL MINE PLANNING AND DESIGN INSTITUTE LIMITED Environment Laboratory, Regional Institute-V,
Phone: (07815) 271646, email: [email protected], website: www.cmpdi.co.in
AIR QUALITY REPORT
Month MARCH Area DIPKA Report No BSP/2021/03/04
Name of the Customer South Eastern Coalfields Ltd, Bilaspur Date of Issue 13.04.2021
Name of the Project DIPKA OC Sample Reference No. 7-8
Parameter PM100 PM10 PM2.5 SO2 NO2
Remarks Lim
it (
in
µg
/m3)-
24
hrs
Industrial Zone -(G.S.R. 742(E),
dated 25.9.2000)
A-O 600 300 - 120 120
A-N 500 250 - 120 120
Residential Zone-(G.S.R. 826(E),
dated 16.11.2009 and GSR 176 (E),
02.04.1996)
B 200 100 60 80 80
Method of analysis IS-5182
PART
4:2005
IS-5182
PART
23:2006
CPCB Vol-
I, 2013
IS-5182
PART
2:2001
IS-5182
PART
6:2006
Uncertainty Range (in µg/m3) ±19.04 ±0.0687 ±0.4420
Station Name (Code) Station
category
Date of
sampling
Date of
analysis
7-Jhabar B
03.03.2021 22.03.2021 162 89 55 28 40
06.03.2021 23.03.2021 188 77 48 31 33
10.03.2021 25.03.2021 173 86 50 27 33
13.03.2021 26.03.2021 169 84 55 25 33
15.03.2021 05.04.2021 184 80 49 37 39
18.03.2021 08.04.2021 178 76 55 40 44
23.03.2021 08.04.2021 182 79 56 37 38
25.03.2021 10.04.2021 169 81 53 33 29
30.03.2021 10.04.2021 177 82 50 39 40
8 –Ratija B
03.03.2021 22.03.2021 185 91 53 32 50
06.03.2021 23.03.2021 189 75 50 36 57
10.03.2021 25.03.2021 181 70 44 45 51
13.03.2021 26.03.2021 176 83 53 29 37
15.03.2021 05.04.2021 184 88 48 38 33
15.03.2021 08.04.2021 169 79 53 39 40
23.03.2021 08.04.2021 188 85 51 44 46
25.03.2021 10.04.2021 167 88 58 42 40
30.03.2021 10.04.2021 185 78 54 46 44
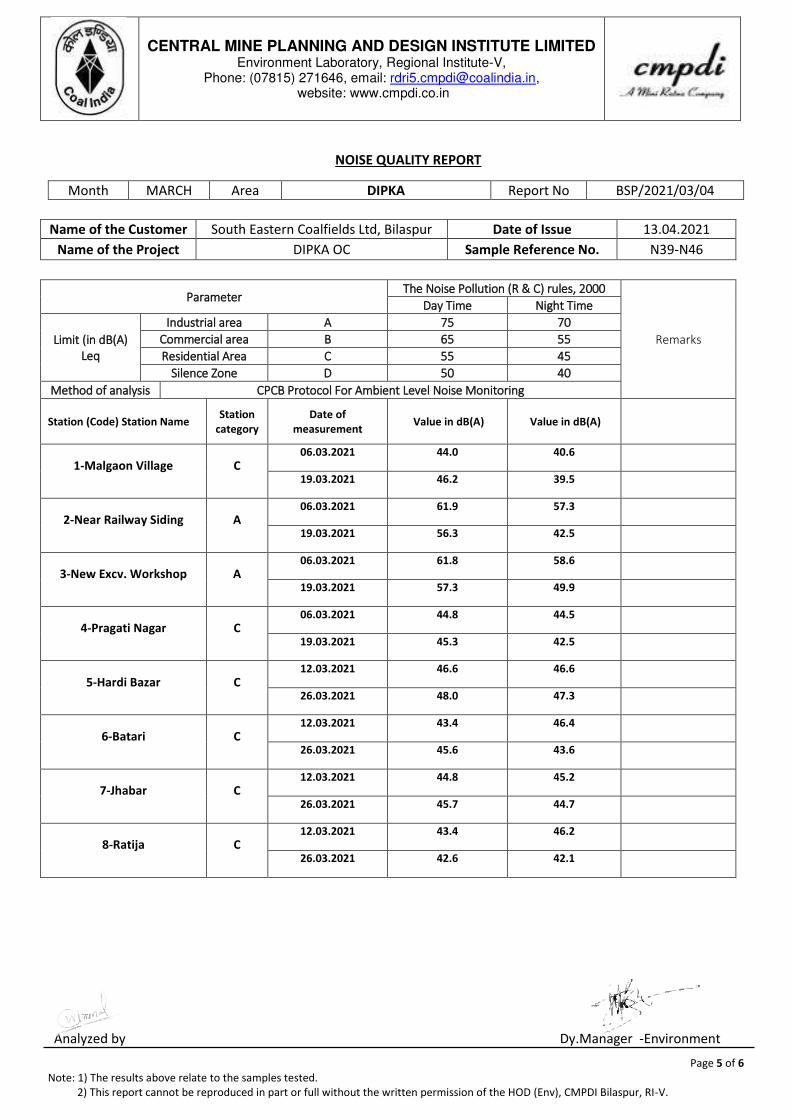
Analyzed by Dy.Manager -Environment
Page 5 of 6
Note: 1) The results above relate to the samples tested.
2) This report cannot be reproduced in part or full without the written permission of the HOD (Env), CMPDI Bilaspur, RI-V.
CENTRAL MINE PLANNING AND DESIGN INSTITUTE LIMITED Environment Laboratory, Regional Institute-V,
Phone: (07815) 271646, email: [email protected], website: www.cmpdi.co.in
NOISE QUALITY REPORT
Month MARCH Area DIPKA Report No BSP/2021/03/04
Name of the Customer South Eastern Coalfields Ltd, Bilaspur Date of Issue 13.04.2021
Name of the Project DIPKA OC Sample Reference No. N39-N46
Parameter The Noise Pollution (R & C) rules, 2000
Remarks
Day Time Night Time
Limit (in dB(A)
Leq
Industrial area A 75 70
Commercial area B 65 55
Residential Area C 55 45
Silence Zone D 50 40
Method of analysis CPCB Protocol For Ambient Level Noise Monitoring
Station (Code) Station Name Station
category
Date of
measurement Value in dB(A) Value in dB(A)
1-Malgaon Village C 06.03.2021 44.0 40.6
19.03.2021 46.2 39.5
2-Near Railway Siding A 06.03.2021 61.9 57.3
19.03.2021 56.3 42.5
3-New Excv. Workshop A 06.03.2021 61.8 58.6
19.03.2021 57.3 49.9
4-Pragati Nagar C 06.03.2021 44.8 44.5
19.03.2021 45.3 42.5
5-Hardi Bazar C 12.03.2021 46.6 46.6
26.03.2021 48.0 47.3
6-Batari C 12.03.2021 43.4 46.4
26.03.2021 45.6 43.6
7-Jhabar C 12.03.2021 44.8 45.2
26.03.2021 45.7 44.7
8-Ratija C 12.03.2021 43.4 46.2
26.03.2021 42.6 42.1
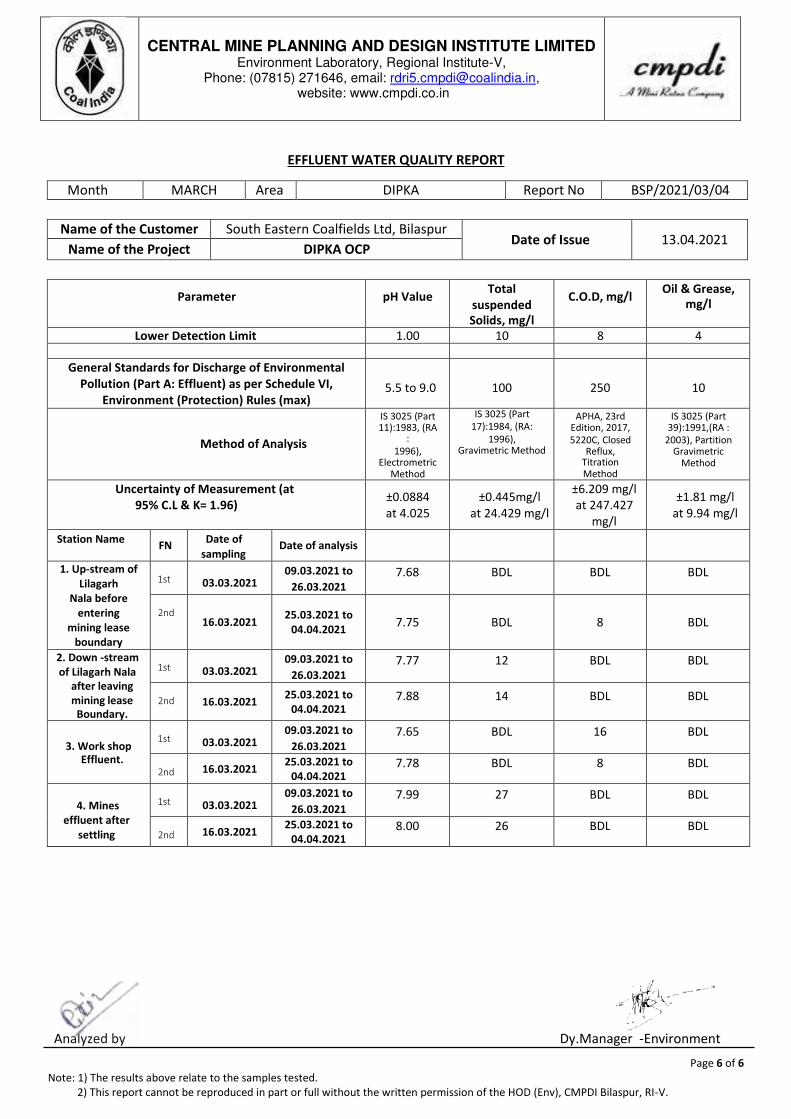
Analyzed by Dy.Manager -Environment
Page 6 of 6
Note: 1) The results above relate to the samples tested.
2) This report cannot be reproduced in part or full without the written permission of the HOD (Env), CMPDI Bilaspur, RI-V.
CENTRAL MINE PLANNING AND DESIGN INSTITUTE LIMITED Environment Laboratory, Regional Institute-V,
Phone: (07815) 271646, email: [email protected], website: www.cmpdi.co.in
EFFLUENT WATER QUALITY REPORT
Month MARCH Area DIPKA Report No BSP/2021/03/04
Name of the Customer South Eastern Coalfields Ltd, Bilaspur Date of Issue 13.04.2021
Name of the Project DIPKA OCP
Parameter pH Value Total
suspended
Solids, mg/l
C.O.D, mg/l Oil & Grease,
mg/l
Lower Detection Limit 1.00 10 8 4
General Standards for Discharge of Environmental
Pollution (Part A: Effluent) as per Schedule VI,
Environment (Protection) Rules (max)
5.5 to 9.0
100
250
10
Method of Analysis
IS 3025 (Part 11):1983, (RA
:
1996), Electrometric
Method
IS 3025 (Part
17):1984, (RA:
1996), Gravimetric Method
APHA, 23rd Edition, 2017,
5220C, Closed Reflux,
Titration Method
IS 3025 (Part 39):1991,(RA :
2003), Partition Gravimetric
Method
Uncertainty of Measurement (at
95% C.L & K= 1.96) ±0.0884
at 4.025
±0.445mg/l
at 24.429 mg/l
±6.209 mg/l
at 247.427
mg/l
±1.81 mg/l
at 9.94 mg/l
Station Name FN
Date of
sampling Date of analysis
1. Up-stream of
Lilagarh
Nala before
entering
mining lease
boundary
1st 03.03.2021 09.03.2021 to
26.03.2021
7.68 BDL BDL BDL
2nd 16.03.2021
25.03.2021 to
04.04.2021 7.75 BDL 8 BDL
2. Down -stream
of Lilagarh Nala
after leaving
mining lease
Boundary.
1st 03.03.2021 09.03.2021 to
26.03.2021
7.77 12 BDL BDL
2nd 16.03.2021 25.03.2021 to
04.04.2021 7.88 14 BDL BDL
3. Work shop Effluent.
1st 03.03.2021 09.03.2021 to
26.03.2021
7.65 BDL 16 BDL
2nd 16.03.2021 25.03.2021 to
04.04.2021 7.78 BDL 8 BDL
4. Mines
effluent after
settling
1st 03.03.2021 09.03.2021 to
26.03.2021
7.99 27 BDL BDL
2nd 16.03.2021 25.03.2021 to
04.04.2021 8.00 26 BDL BDL
ANNEXURE-12
WILDLIFE CONSERVATION PLAN FOR DIPKA EXPANSION PROJECT
Key Contributors
Shri M. Rajkumar,
Scientist-C, Forest Ecology and Climate Change Ecological Work and Coordinator
Dr. S. Chakrabarti, Scientist-G, Forest Ecology and Climate Change
Birds, Spiders and other Animals
Shri Dheeraj Kumar Gupta, Scientist-C, GIS Cell
GIS and RS
Shri V. Ramu Naik Technical Assistance
Shri Manoj Poosam Field cum Technical Assistance
Shri Ganesh Pawar
Field cum Technical Assistance
Mrs. Shashi Kiran Barve Laboratorical identification
Citation: TFRI (2020). Wildlife Conservation Plan for Dipka Expansion Project, SECL Dipka Area,
Chhattisgarh. Tropical Forest Research Institute, Jabalpur, India.
Tropical Forest Research Institute South Eastern Coalfields Limited
i
CONTENTS
Executive Summary 01 Chapter - I 02 Introduction Current Project Approach Location Method of mining Proposed methods for over burden dumping and management Dump OB accommodated in Mcum Geology Soil Drainage Climate Rainfall Hydrogeology Chapter – II 07 Objectives Methodology Rapid study Study of forest type Sampling technique Quadrat method and Importance Value Index (IVI) Species diversity Chapter – III 11 Forest cover classification Forest type Status of Plant diversity Species Importance Value Index (IVI) Dominant species Species and their uses RET species Chapter – IV 15 Wildlife Impact of the proposed project on wildlife Chapter – V 17 Habitat management Site specific prescriptions for Sloth Bear Behaviour and biology Manual monitoring Habitat enrichment Site specific prescriptions for Leopard Behaviour and biology Habitat enrichment Monitoring Factors to be considered in conservation efforts of Leopard
ii
Chapter – VI 21 Mitigation measures and restoration strategies Catchment area and channel treatment Habitat improvement through enrichment plantation Green belt Potential Conservation Areas (PCA) Raising of plantations in and around villages Conservation Education Sensitization/Awareness programme for the villagers and school children Training for the officials of SECL, Dipka Area Training for minimising the man-animal conflict Immediate compensation to villagers for crop damage/human injury Development of herbal garden Chapter – VII 26 Research and Monitoring Biodiversity monitoring Habitat Monitoring Ecological Monitoring Water quality monitoring Wildlife Monitoring of the Area Vigil and Fire Protection Structure and Responsibilities Contingency Corpus Fund Plan period Monitoring Committee Funding Chapter – VIII 29 The budget References 42 Photographs
iii
LIST OF TABLES AND MAPS
List of tables
1. The geographical locations of the quadrats laid for the study in and around Dipka OCP.
2. Forest cover classification in the project area and its 10 km buffer. 3. List of plant species recorded during the field survey of the forest in and around
Dipka OCP. 4. Phyto-sociological attributes of tree species in and around Dipka OCP. 5. Phyto-sociological attributes of tree saplings and shrubs in and around Dipka OCP. 6. Phyto-sociological attributes of seedlings (trees and shrubs) and herbs in and around
Dipka OCP. 7. List of medicinal plants recorded from the sampled list of species in and around
Dipka OCP. 8. List of fodder plants recorded from the sampled list of species in and around Dipka
OCP. 9. List of food plants recorded from the sampled list of species in and around Dipka
OCP. 10. List of timber trees recorded from the sampled list of species in and around Dipka
OCP. 11. Indicative budget.
List of Figures
1. Dominance Diversity Curve for Tree Shrubs and Herb species in the studied community List of Maps
1. Map showing the outer boundary of Achanakmar Amarkantak Bioshpere Reserve and 10 km
buffer boundary of Dipka OCP.
2. Streams and channels within 10 km buffer are of the proposed Dipka OCP.
3. Forest density map of the proposed Dipka OCP and its 10 km buffer.
4. Vegetation type map of the proposed Dipka OCP and its 10 km buffer as per Champion and Seth 1968.
5. Land use land cover map of the proposed Dipka OCP and its 10 km buffer.
6. Location of villages within proposed Dipka OCP and its 10 km buffer.
iv
LIST OF ACRONYMS AND ABBREVIATIONS
DFO Divisional Forest Officer DBH Diameter at Breast Height SECL South Eastern Coalfields Limited FSI Forest Survey of India GIS Geographical Information System IUCN International Union for Conservation of Nature and Natural Resources KM Kilometre M Metre mm Millimetre MSL Mean Sea Level NTCA National Tiger Conservation Authority SFR State of Forest Report Sp. Species VDF Very Dense Forest MDF Moderate Dense Forest WPA Wildlife Protection Act

1
EXECUTIVE SUMMARY
Dipka Expansion Opencast Coal Mining Project (31 MTY) is an expansion project of SECL, Dipka Area.
The project area proposed for diversion falls beyond a distance of 10 Km from the areas of high conservation value ie. Achanakmar Amarkantak Biosphere Reserve.
Southern Dry Mixed Deciduous Forest, Moist Peninsular High Level Sal Forest, Dry Peninsular Sal Forest and Northern Dry Mixed Deciduous Forest are the predominant forest types found in the region.
A total of 83 species distributed in 72 genera and 38 families of higher plants were recorded from the proposed project area and its 10 km buffer.
The plant community is dominated by Shorea robusta, with Diospyros melanoxylon and Madhuca indica as codominants.
Lantana camara dominates the shrub layer. Saplings of Butea monosperma and Diospyros melanoxylon were present in high densities.
Within the sampled list, it was found that, there were 24 species of medicinal plants, 6 species of fodder plants, 14 species of food plants and 20 species of timber trees.
Among the surveyed list of plants, there were two species which appears in the IUCN Red List of Threatened Species Dalbergia latifolia (Vulnerable) and Pterocarpus marsupium (Near Threatened).
Except sightings of few groups of langurs, butterflies and birds, no other carnivores or herbivores could be recorded directly in the surveyed area. But the larger landscape of Umaria Forest Division has records of many fauna (carnivores and herbivores) such as Tiger, Leopard, Sloth bear, Spotted deer, Sambar deer, Barking deer, Wild dogs, Common Jungle Cat, Jacka and Striped Hyaena.
Smaller mammals (nocturnal and diurnal) and birds are bound to face displacement due to opencast mining pit.
Coal seams are invariably found beneath Sal forests. Hence, there will be many Sal trees (Shorea robusta) that will be cut resulting in crucial changes to the habitat.
It is suggested that, within a period of five years, an area of 900.12 ha falling under the category of scrub/degraded forest within 10 km buffer of the Dipka OCP may be afforested in a phased manner within the 10 km buffer.
Potential Conservation Areas (PCA) are identified for the possibility of carrying out
conservation and mitigation measures for wildlife.
Creation of Green belt and Herbal garden are suggested.
An indicative budget for Rs. 1132 Lakhs is proposed for various activities to be undertaken based on the proposed mitigative measures for five years. The DFO, Katghora will work out the actual costing and monitor the implementation of the prescriptions.
2
CHAPTER - I
Introduction
Coal continues to remain as the principal source of energy in India, and the coal reserves
are abundant in the country. Coal mining has inevitable impacts on forests and forest soils.
The risks posed by forest diversion during land clearing activities in coal mining are
significant. Because forests, apart from being source of timber and non-timber forest
products, they also provide critical environmental/ecosystem services that are crucial for all
life forms locally as well as regionally.
In order to strike a balance between development and conservation, it has to be ensured
that any activity involving diversion of forest land may be considered only after thorough
investigation. It should take into account its impending impact on the biodiversity of the area
and consequently on the management of the ecosystem.
A critical part of this balanced approach is to spell out the possible impact and possible
mitigation measures to address such impacts. Any activities which would be taken up in the
project area need to comply with the statutory requirements as provided in the Wildlife
(Protection) Act, 1972 and subsequent amendments.
In this regard, MoEF&CC guidelines warrants preparation of a project specific Conservation
Plan for endangered/Schedule-I faunal species reported in the study area. While the project
authorities shall also participate in the Conservation Plan through budgetary support over the
life of the project. The plan will be implemented in consultation with the State Forest and
Wildlife Departments.
The current project
Dipka Opencast Coal Mining Project (from 25 MTY-normative to 30 MTY-peak) is an
upcoming project of SECL, Dipka Area. The MoEF has considered its application for
enhancement of production capacity form 25 MTPA to 33.75 MTPA in an existing area of
1999.417 ha. The mine is situated in one of the critically polluted areas of the country.
Environmental Clearance for 31 MTY from the ministry was accorded on in February 2015.
Under the EC, the user agency is required to prepare a Wildlife Conservation Plan as a
compliance condition (Condition no. 13) which reads “A programme for conservation of the wildlife particularly the rare and endangered species schedule fauna and endangered flora
and species of medicinal important found in the study area shall be formulated and
implemented in consultation with the forest and wildlife department in the state government
separate funds shall be earmarked for implementation of the various activities than there
under and the status thereof shall be earmarked for implementation of the various activities
and regularly reported to the ministry”
Of the total project area of 1999.417 ha, 409.180 ha is revenue forestland. 1409.244 ha is
agriculture land and 180.993 ha is Government land.
Staff Officer (Envt./Forest), SECL, Dipka Area vide his letter No. SECL/GM
SECL/GM/DA/ENVT/16/660 Dt. 23.07.2016 referring the above mentioned facts, has
approached Tropical Forest Research Institute, Jabalpur for preparation of wildlife
conservation plan.
3
Thereby, SECL, Dipka Area awarded the work to Tropical Forest Research Institute,
Jabalpur through its Work Order No. SECL/GM SECL/DA/ENVT/17/840 Dt. 12.03.2017 and
the same was accepted in its form on 27.03.2017.
The current wildlife conservation plan is for Dipka Opencast Coal Mine Project which lies in
Korba District of Chhattisgarh. The details of Mine Lease (ML) area is given below:
The proposed area does not form part of National Park, Biosphere Reserve, Tiger Reserve,
Elephant Corridor etc. The project area proposed for diversion falls beyond a aerial distance
of 37 Km from the Achanakmar Amarkantak Biosphere Reserve (AABR) (Map 1).
Approach
The Korba Coalfield is located in the basin of the Hasdeo River, a tributary of the Mahanadi
in Korba district of Chhattisgarh.
Korba Coalfield is located between latitudes 22° 15‟ N and 22° 30‟ N and longitudes 82° 15‟ E and 82° 55 ‟ E. Korba Coalfield covers an area of about 530 square kilometres (200 sq mi). According to Geological Survey of India, total reserves (including proved, indicated and
inferred reserves) of non-coking coal (as on 1.1.2004) in Korba Coalfield was 10,074.77
million tonnes, out of which 7,732.87 was up to a depth of 300 m and 2,341.90 million tonnes
was at a depth of 300–600 m.
Proposed methods for over burden dumping and management
The project authorities aim that; the top soil from top bench of OB will be stacked and stored
separately. The spoil dump benches in the internally backfilled OB will be in the form of
benches. With the sufficient advance of coal production bench, the backfilled OB will be
leveled with dozer. Dumper/Tipper will transport soil/alluvium OB from the top OB bench and
will dump the soil directly on the leveled backfilled OB.
Initial external OB are proposed to be dumped within quarry area to keep the land requirement bare minimum. The OB so dumped is proposed to be rehandled back to the internal dump. Site of external dump has been proposed within the quarry boundary area to save forest land as well as tenancy land beyond quarry excavation area. Geology
Physiographically, the structural land forms of Korba region is represented by plateau, hills
and valleys. The norther part of this region is represented by hilly terrain, which is northern
part of Amarkantak hills extending in East-west direction.
Total mineable reserve is 617.00 MT and balance mineable reserve 479.512 MT. Average
grade of coal is E grade (4000-4300 kcal/kg), ultimate working depth of the quarry is 250 m.
Soil
The Korba district is covered by various rock types viz Basaltic, Sedimentary and Grainitic
terrains. Soil is also depending upon lithology of the area.
Soils of Late rite Terrain, which are commonly found in undulating land are slightly deep,
well-drained loamy skeleton to loamy soils with moderate erosion.
Soils of Basaltic Rocks, which are commonly found in hills and hill ranges, are very thin
stony with moderate erosion, moderately well drained clayey soils on gently sloping plateau.
4
Soils of Sedimentary Rocks (Gondwanas), which are commonly found in the undulated
plateau, are deep, moderately well drained clayey soils on foothills slopes with moderate
erosion.
Drainage
There are number of rivers and nallas such as Lilagarh nadi, Kholar nala and channels
flowing within and in the vicinity of the mine lease area and ultimately joining Hasdeo river
which is at the distance of 8 km. Water table is in the range of 6.57-8.21 m bgl during pre-
monsoon and 3.78-4.49 bgl during post-monsoon. Map 2.
Climate
The Climate of this region is characterized by a hot summer and general dryness, except
during southwest monsoon season. The year may be divided into four seasons. The cold
season, December to February is followed by the hot season from March to about the middle
of June. The period from the middle June to September is the southwest monsoon season.
October and November from the post monsoon or transition period. There is one IMD
meteorological observatory located at district headquarters Umaria.
Rainfall
The average annual rainfall of Korba district is about 1208.8 mm. The maximum rainfall
takes place during the south-west monsoon period i.e. from June to September. The August
month is the wettest month of the year and about 30% of the annual rainfall takes place only
during this month. During winter & summer season about 10% & 3% of respectively rainfall
takes place. From October to May, only 13% of the annual rainfall takes place.
Hydrogeology
The main source of ground water recharge in Korba district is rainfall. The major part of the
district is underlain by Gondwana sedimentary formations, which are potential aquifers in the
area. the other geological formation occurring in the districts are Archaeans lower vindhyans.
Granular zones govern occurrence and movement of ground water in semi consolidated
Gondwana formations.
Within these formations and impervious horizons like coal seams trapped in between this
rock occurrence and movement of ground water in hard rocks is essentially by development
and nature of secondary joints and fractures while priming vesicular in basalt also plays on
important role. Ground water in general in hard rocks areas occurs under unconfined to semi
confined conditions while in Gondwana rocks it is also found under confined conditions.

5
Map 1: Map showing the outer boundary of Achanakmar Amarkantak Biosphere Reserve
(AABR) and 10 km buffer boundary of Dipka OCP.

6
Map 2:

7
CHAPTER - II
Objectives and Methodology
Following are the three main objectives of this wildlife conservation plan:
(i) Assess the flora (trees, shrubs and herbs) and fauna (terrestrial mammals and birds)
within 10 km buffer of the proposed opencast mine in order to take stock of the forest,
plant species and habitat conditions for wildlife.
(ii) Predict the probable impacts caused due to the mining activities
(iii) Suggest measures to mitigate the anticipated impacts.
Various aspects covered within these objectives include the following:
Flora – vegetation status
1. Characterization of forest types (as per Champion and Seth classification) in the study
area.
2. Inventory of plant communities including trees and ground flora.
3. Phyto-sociology of plant communities with respect to dominance, density, frequency,
abundance, diversity index, importance value index (IVI) of the study area based on
sampling through Quadrat methods.
4. Listing out economically important species like medicinal plants, timber, fuel wood, fodder,
etc.
5. Details of endemic and endangered/Schedule-I species found in the project area.
6. Flora under RET categories as per IUCN and Botanical Survey of India‟s Red Data list.
7. Determining the distance and existence of areas of high conservation priority such as
National park, Sanctuary, Biosphere Reserve etc in the study area.
Terrestrial Fauna
1. Conducting occupancy surveys for mammals by walking line transects.
2. Documenting the “presence-absence” of important wildlife through existing secondary
information.
3. Status of avifauna and assessing their threat.
4. Documentation of important pollinators (butterflies and bees) found in the area.
5. Endemic and Endangered/Schedule-I species found/recorded from the study area.
6. RET species as per different schedule of Indian Wildlife (Protection) Act, 1972 and IUCN
Red Data list.
7. Determining the existence of habitat and corridors for important wildlife.
8
Preparation of maps using GIS and Remote Sensing
1. Land Use Land Cover (LULC) data/map are used to give inputs on the land use pattern.
2. Maps for Forest Density and Vegetation Types are prepared for ascertaining the different
forest types and its density.
3. Location of villages within 10 km buffer will be mapped.
4. Streams/Channel/Natural drainage within the study area and its 10 km buffer will be
mapped.
Methodology
Rapid study
The study in terms of duration is characterised as a rapid study. This kind of rapid study for
understanding biodiversity and wildlife of the region could give ample idea to formulate
policies. The current study has tried to explore various biological aspects of the project area
to understand the structure and function of the forest ecosystem present.
Study of forest type
The forest type of the project area was studied using Champion and Seth (1968).
Additionally, secondary information such as Working Plan of the State Forest Department
was used to understand the forest type and its species.
Sampling technique
Random sampling technique was used to study the various ecological factors in order to
understand the species composition, density and abundance. Studies in the proposed
location were carried out both pre-monsoon and post-monsoon.
Quadrat method and Importance Value Index (IVI)
Quadrat sampling was done in (a) core project area which will be mined out in future (b) the
adjacent 10 km buffer area. In each of the sampling site, a square quadrat of 10 m × 10 m
size was laid out for trees and 1 m × 1 m small quadrat within each quadrat was laid for
herbs and shrubs.
Table 1: The geographical locations of the quadrats laid for the study in and around Dipka
OCP.
Sl. No. Latitude N Longitude E Nearest Village
Habitat type
1 22º 18‟ 36.4” 82º 31‟ 31.7” Near Suabundi village Revenue Forest
2 22º 18‟ 46.4” 82º 31‟ 47.4” - Revenue Forest
3 22º 19‟ 41.8” 82º 30‟ 22.9” - Degraded land
4 22º 18‟ 44.8” 82º 30‟ 35.7” Dipka Revenue Forest
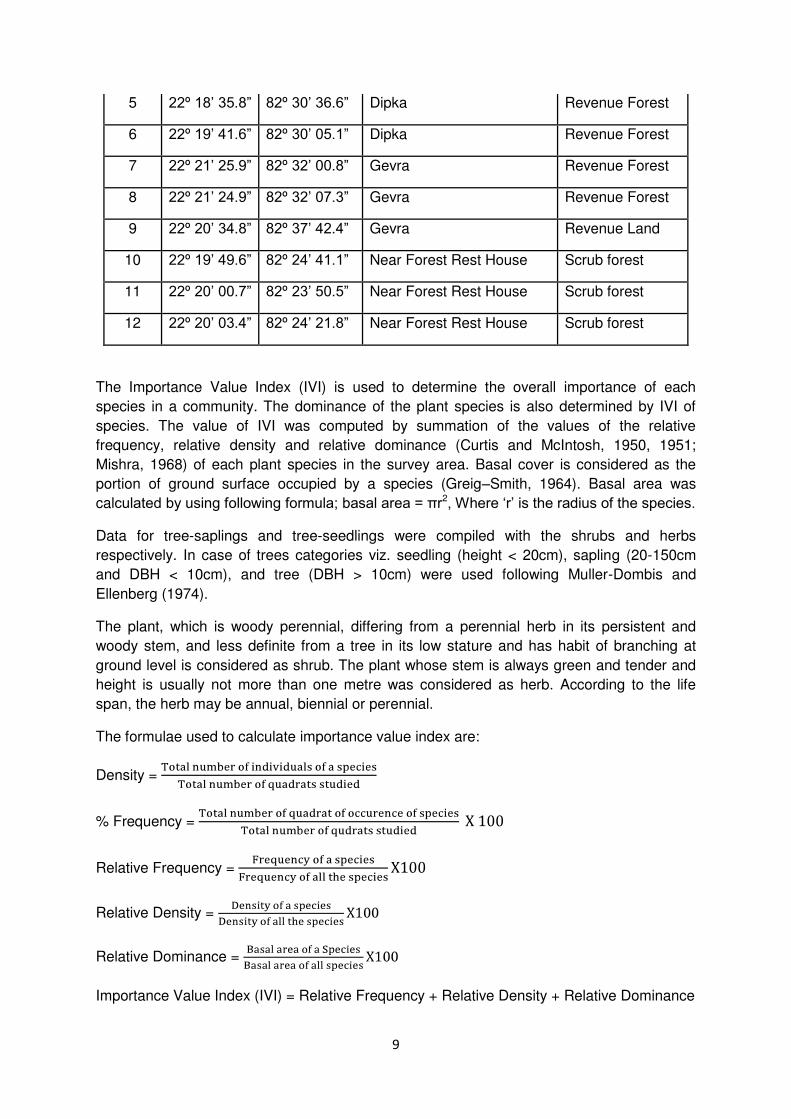
9
5 22º 18‟ 35.8” 82º 30‟ 36.6” Dipka Revenue Forest
6 22º 19‟ 41.6” 82º 30‟ 05.1” Dipka Revenue Forest
7 22º 21‟ 25.9” 82º 32‟ 00.8” Gevra Revenue Forest
8 22º 21‟ 24.9” 82º 32‟ 07.3” Gevra Revenue Forest
9 22º 20‟ 34.8” 82º 37‟ 42.4” Gevra Revenue Land
10 22º 19‟ 49.6” 82º 24‟ 41.1” Near Forest Rest House Scrub forest
11 22º 20‟ 00.7” 82º 23‟ 50.5” Near Forest Rest House Scrub forest
12 22º 20‟ 03.4” 82º 24‟ 21.8” Near Forest Rest House Scrub forest
The Importance Value Index (IVI) is used to determine the overall importance of each
species in a community. The dominance of the plant species is also determined by IVI of
species. The value of IVI was computed by summation of the values of the relative
frequency, relative density and relative dominance (Curtis and McIntosh, 1950, 1951;
Mishra, 1968) of each plant species in the survey area. Basal cover is considered as the
portion of ground surface occupied by a species (Greig–Smith, 1964). Basal area was
calculated by using following formula; basal area = πr2, Where „r‟ is the radius of the species.
Data for tree-saplings and tree-seedlings were compiled with the shrubs and herbs
respectively. In case of trees categories viz. seedling (height < 20cm), sapling (20-150cm
and DBH < 10cm), and tree (DBH > 10cm) were used following Muller-Dombis and
Ellenberg (1974).
The plant, which is woody perennial, differing from a perennial herb in its persistent and
woody stem, and less definite from a tree in its low stature and has habit of branching at
ground level is considered as shrub. The plant whose stem is always green and tender and
height is usually not more than one metre was considered as herb. According to the life
span, the herb may be annual, biennial or perennial.
The formulae used to calculate importance value index are:
Density =
% Frequency =
Relative Frequency =
Relative Density =
Relative Dominance =
Importance Value Index (IVI) = Relative Frequency + Relative Density + Relative Dominance
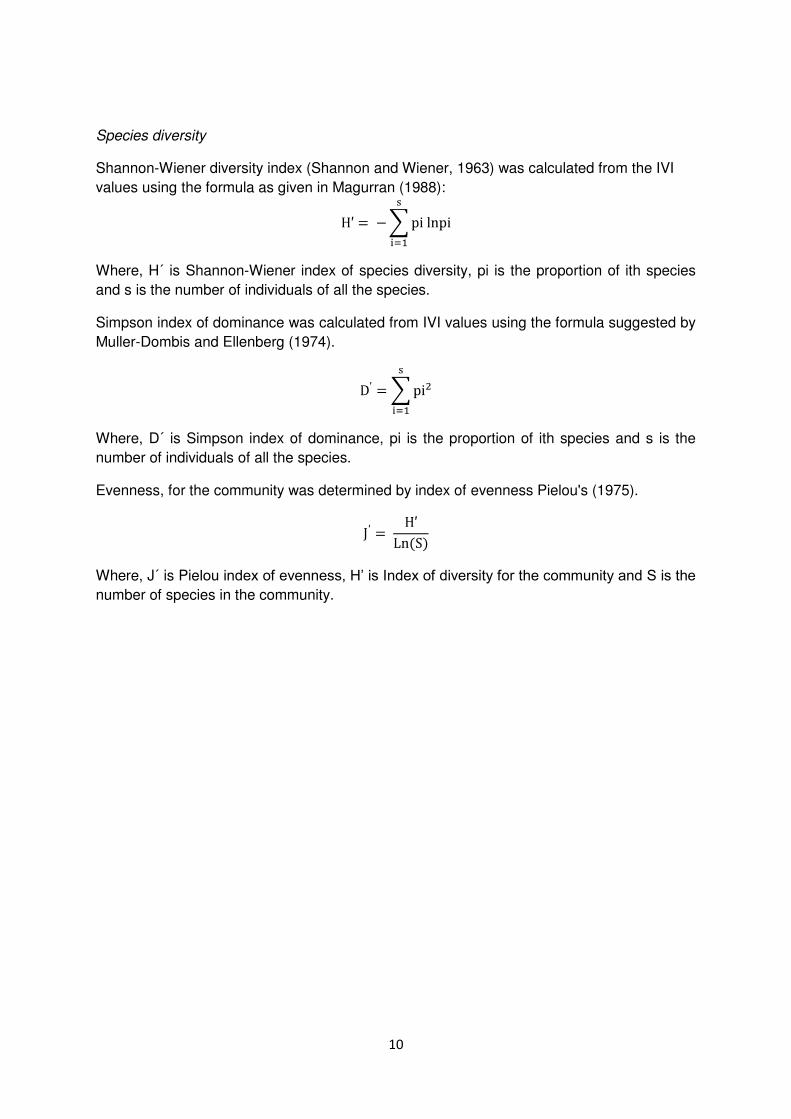
10
Species diversity
Shannon-Wiener diversity index (Shannon and Wiener, 1963) was calculated from the IVI
values using the formula as given in Magurran (1988):
Where, H´ is Shannon-Wiener index of species diversity, pi is the proportion of ith species
and s is the number of individuals of all the species.
Simpson index of dominance was calculated from IVI values using the formula suggested by
Muller-Dombis and Ellenberg (1974).
Where, D´ is Simpson index of dominance, pi is the proportion of ith species and s is the
number of individuals of all the species.
Evenness, for the community was determined by index of evenness Pielou's (1975).
Where, J´ is Pielou index of evenness, H‟ is Index of diversity for the community and S is the number of species in the community.
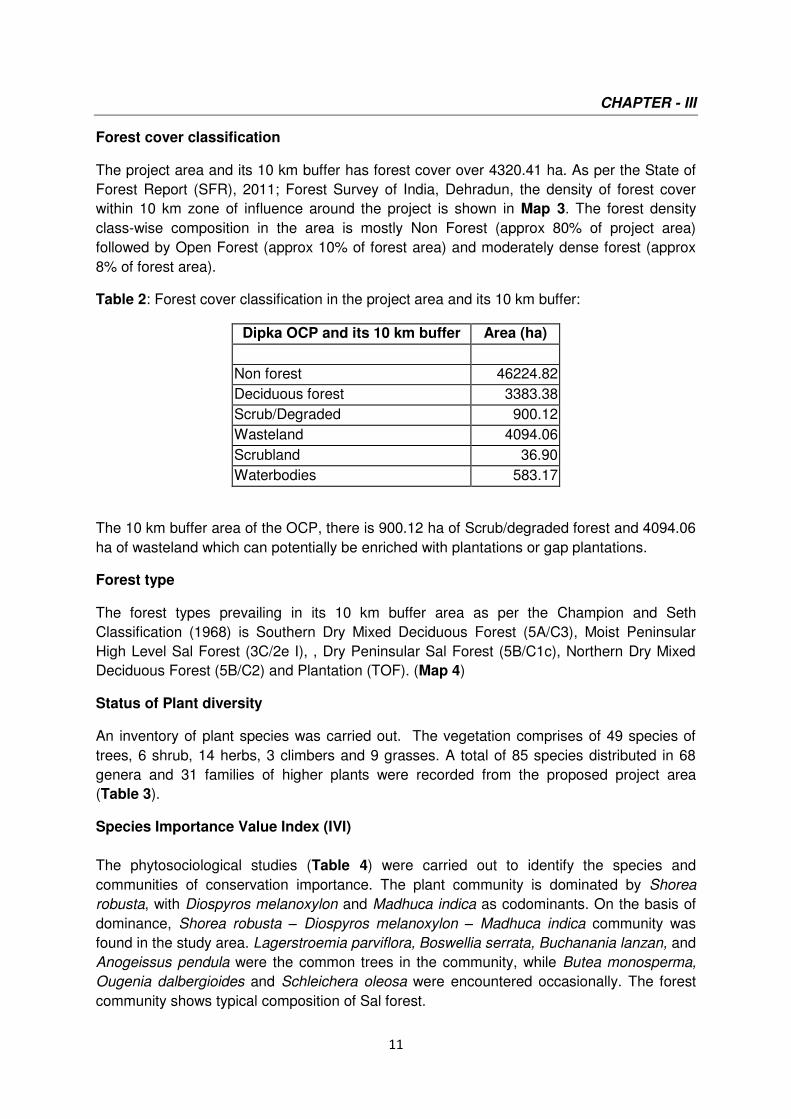
11
CHAPTER - III
Forest cover classification
The project area and its 10 km buffer has forest cover over 4320.41 ha. As per the State of
Forest Report (SFR), 2011; Forest Survey of India, Dehradun, the density of forest cover
within 10 km zone of influence around the project is shown in Map 3. The forest density
class-wise composition in the area is mostly Non Forest (approx 80% of project area)
followed by Open Forest (approx 10% of forest area) and moderately dense forest (approx
8% of forest area).
Table 2: Forest cover classification in the project area and its 10 km buffer:
Dipka OCP and its 10 km buffer Area (ha)
Non forest 46224.82
Deciduous forest 3383.38
Scrub/Degraded 900.12
Wasteland 4094.06
Scrubland 36.90
Waterbodies 583.17
The 10 km buffer area of the OCP, there is 900.12 ha of Scrub/degraded forest and 4094.06
ha of wasteland which can potentially be enriched with plantations or gap plantations.
Forest type
The forest types prevailing in its 10 km buffer area as per the Champion and Seth
Classification (1968) is Southern Dry Mixed Deciduous Forest (5A/C3), Moist Peninsular
High Level Sal Forest (3C/2e I), , Dry Peninsular Sal Forest (5B/C1c), Northern Dry Mixed
Deciduous Forest (5B/C2) and Plantation (TOF). (Map 4)
Status of Plant diversity
An inventory of plant species was carried out. The vegetation comprises of 49 species of
trees, 6 shrub, 14 herbs, 3 climbers and 9 grasses. A total of 85 species distributed in 68
genera and 31 families of higher plants were recorded from the proposed project area
(Table 3).
Species Importance Value Index (IVI)
The phytosociological studies (Table 4) were carried out to identify the species and
communities of conservation importance. The plant community is dominated by Shorea
robusta, with Diospyros melanoxylon and Madhuca indica as codominants. On the basis of
dominance, Shorea robusta – Diospyros melanoxylon – Madhuca indica community was
found in the study area. Lagerstroemia parviflora, Boswellia serrata, Buchanania lanzan, and
Anogeissus pendula were the common trees in the community, while Butea monosperma,
Ougenia dalbergioides and Schleichera oleosa were encountered occasionally. The forest
community shows typical composition of Sal forest.
12
The shrub layer was composed of 13 species. Saplings (having height 20-150 cm and DBH
< 10 cm) of 11 tree species along with 2 shrub species were recorded from the shrub layer.
Lantana camara, a forest invasive species dominates the shrub layer with highest IVI.
Saplings of Butea monosperma, Diospyros melanoxylon, Gardenia gummifera, Shorea
robusta, Madhuca indica and Anogeissus latifolia were frequently found in the study area
(Table 5).
The herb layer in the community is composed of 27 species, out of which seedlings of 2 tree
species and 23 herbaceous species were recorded from the forest floor. Among the tree
regeneration, the highest IVI was recorded for Shorea robusta (14.03) indicating
regeneration of the tree species. Seedlings of Shorea robusta were also recorded in the
forest floor with IVI value of 5.07, (Table 6). Highest IVI was recorded for Hyptis suaveolens
which is an invasive species.
Shorea robusta dominates the site and is the major canopy species. However, the species is
poorly represented in shrub layer indicating poor regeneration. Saplings of Butea
monosperma and Diospyros melanoxylon were present in high densities in the study area,
which shows that these species are very hardy and are easily established in the new sites.
Dominant species
A dominance-diversity curve (Figure 1) was used to depict the distribution and dominance of
the species. Shorea robusta dominates the tree layer and have access to majority of the
available resources. The other associates are sparsely distributed in the community. It can
be said that the distribution of other species in the community is largely regulated by the
density of dominant species. Lantana camara dominates the shrub layer. However, saplings
of Butea monosperma and Diospyros melanoxylon are also found in the community. Both
species are hardy and regenerate and establish successfully in the new areas. The herb
layer shows log normal distribution, which is common in tropical forests. It indicates that the
niche space occupied by the species is determined by the number of conditions such as
food, space, microclimate and other variables that affect the success of one species in
competition with another.
Species and their uses
Within the enumerated list, we found that, there were 24 species of medicinal plants (Table
7), 6 species of fodder plants (Table 8), 14 species of food plants (Table 9), and 20 species
of timber trees (Table 10) were present in and around the Dipka OCP.
RET species
Among the surveyed list of plants, there were two species which appears in the RET
category according to IUCN Redlist (The IUCN Red List of Threatened Species. Version
2017-3. Accessed on 28.01.2018). They are Dalbergia latifolia (Vulnerable) and
Pterocarpus marsupium (Near Threatened) Table 3.

13
Map 3:

14
Map 4:
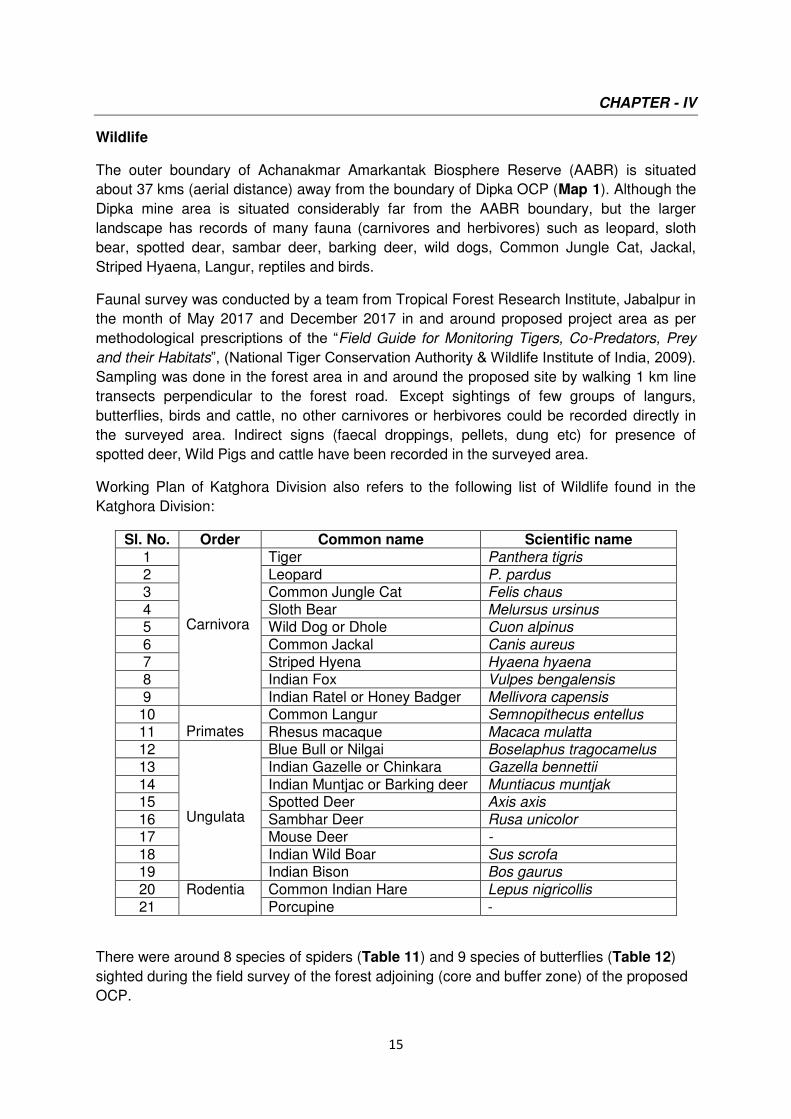
15
CHAPTER - IV
Wildlife
The outer boundary of Achanakmar Amarkantak Biosphere Reserve (AABR) is situated
about 37 kms (aerial distance) away from the boundary of Dipka OCP (Map 1). Although the
Dipka mine area is situated considerably far from the AABR boundary, but the larger
landscape has records of many fauna (carnivores and herbivores) such as leopard, sloth
bear, spotted dear, sambar deer, barking deer, wild dogs, Common Jungle Cat, Jackal,
Striped Hyaena, Langur, reptiles and birds.
Faunal survey was conducted by a team from Tropical Forest Research Institute, Jabalpur in
the month of May 2017 and December 2017 in and around proposed project area as per
methodological prescriptions of the “Field Guide for Monitoring Tigers, Co-Predators, Prey
and their Habitats”, (National Tiger Conservation Authority & Wildlife Institute of India, 2009). Sampling was done in the forest area in and around the proposed site by walking 1 km line
transects perpendicular to the forest road. Except sightings of few groups of langurs,
butterflies, birds and cattle, no other carnivores or herbivores could be recorded directly in
the surveyed area. Indirect signs (faecal droppings, pellets, dung etc) for presence of
spotted deer, Wild Pigs and cattle have been recorded in the surveyed area.
Working Plan of Katghora Division also refers to the following list of Wildlife found in the
Katghora Division:
Sl. No. Order Common name Scientific name 1
Carnivora
Tiger Panthera tigris 2 Leopard P. pardus 3 Common Jungle Cat Felis chaus 4 Sloth Bear Melursus ursinus 5 Wild Dog or Dhole Cuon alpinus 6 Common Jackal Canis aureus 7 Striped Hyena Hyaena hyaena 8 Indian Fox Vulpes bengalensis 9 Indian Ratel or Honey Badger Mellivora capensis 10
Primates Common Langur Semnopithecus entellus
11 Rhesus macaque Macaca mulatta 12
Ungulata
Blue Bull or Nilgai Boselaphus tragocamelus 13 Indian Gazelle or Chinkara Gazella bennettii 14 Indian Muntjac or Barking deer Muntiacus muntjak 15 Spotted Deer Axis axis 16 Sambhar Deer Rusa unicolor 17 Mouse Deer - 18 Indian Wild Boar Sus scrofa 19 Indian Bison Bos gaurus 20 Rodentia Common Indian Hare Lepus nigricollis 21 Porcupine -
There were around 8 species of spiders (Table 11) and 9 species of butterflies (Table 12)
sighted during the field survey of the forest adjoining (core and buffer zone) of the proposed
OCP.

16
Impact of the proposed project on wildlife
The likely impacts of the proposed expansion of Dipka opencast coal mine project are being
described below:
a) Impact on the wildlife within core area of project
All though the identified location for opencast may not have flagship animal species such as
Tiger and Leopard because of its proximity to villages and distance from its territory. But,
there are definitely smaller mammals (nocturnal and diurnal), birds and tree species which
would face the impact of the proposed project and may also result in displacement or
readjustment to various degrees.
b) Impacts on the wildlife of the surrounding area due to activities involved in mining
It is foreseen that, the environment within 5 km radius from the proposed mine boundary will
be the zone of influence because of the mining activities. The adjacent forest areas
protected/reserve/village forest will be influenced by the mining activities. Many wildlife with
inherent limitation to surpass the barrier, those with limited flight / slow land movement would
be fragmented due to opencast mine pit. In due course of time, some animal species may
learn to adapt to the opencast pit through avoidance.
c) Direct loss of habitat
Opencast mining will cause direct loss to a number of trees of different age groups. In these
regions, coal seams are invariably found beneath Sal forests. Hence, there will be many Sal
trees (Shorea robusta) that will be cut resulting in crucial changes to the habitat. Those
areas comprising of travel roads / gravel roads for trucks meant for transportation of coal are
greatly affected by pollution and reduces the scope for the moment of any wildlife.
d) Habitat and population fragmentation
Mining pit will break the already existing continuous habitat patches which would gradually
result in creation of smaller patch sizes and higher edge to interior ratio. The loss of interior
habitat is of concern for edge-sensitive species.
e) Avoidance and reduced access to vital habitats
Some wildlife species might avoid areas adjacent to mine area due to noise and human
activity associated with it. This reduces the access to vital habitats of wildlife found in the
area.
The above mentioned impacts are bound to happen with the mining activities. Therefore,
appropriate mitigation measures are needed to be executed during the mining operations as
well as after the mine closure.
17
CHAPTER – V
Habitat management
The following section deals with species-specific suggestions/measures for some important
animals in order to improve and better manage their habitat:
1. Sloth Bear
Site specific prescriptions for Sloth Bear (Melursus ursinus)
Sloth Bear (Bhalu in Hindi) is listed in Schedule I of the Indian Wildlife Protection Act and
Vulnerable under IUCN Red list which necessitates legal protection of the animal.
Behaviour and biology
Sloth Bear is a nocturnal insect eating mammal found throughout Indian Subcontinent. Sloth
bears subsist primarily on termites, ants, and fruits. This is the only species of bear adapted
specifically for ant and termite-eating. In areas where forest cover is less, and where daytime
temperatures are high, the bear is largely nocturnal and usually shelters in rock outcrops,
thickets, and tree cavities during the heat of the day. Although sloth bears may be active
during the day in protected areas, they tend to be almost exclusively nocturnal in disturbed
and fragmented forests interspersed with human habitations (Akhtar et al. 2004).
Sloth bears typically breed during June-July, and females give birth, usually to one or two
cubs, during November –January (Joshi et al. 1999, Chauhan et al. 2003).
Studies in Nepal and Sri Lanka suggest that sloth bears avoid areas where human
disturbance is high, so crop depredation by sloth bears is typically rare (Joshi et al. 1995).
On the contrary, in some parts of India, sloth bears routinely raid peanut, maize, and fruit
crops (e.g., Changani 2002). Chauhan (2006) suggests that such crop depredations may
occur because these habitats are severely affected by human exploitation, including the
extraction of several food sources for bears.
The most important threat for sloth bear is largely related to deteriorating habitat, which
increases the chance of interaction between people and bears. Thus, habitat improvements
would be helpful in alleviating such conflicts.
Manual monitoring
Date, time and place of direct sighting of the animals should be recorded by the field staff.
Photographs if possible should be taken to make the sightings more prudent. The data
gathered over time, will help in identifying the frequently visited sites and timings. This data
would be significant in order to take appropriate course of action for the field staff and
villagers to avoid such sites to minimize the bear-human conflicts.
Habitat enrichment
Extensive reforestation programme should be carried out for fruiting trees such as, Syzigium
cumini (Jamun), Madhuca indica (Mahua), Ficus glomerata (Gular) and Ziziphus spp. (Jungli
baer or Van baer) in order to make more fruiting trees available for the bear. Termite
mounds should not be disturbed and Extensive awareness programme should be initiated to
18
make people of the area understand the importance of wildlife and linkage with the forest
area. Any efforts on the part of the villagers to protect and conserve the sloth bear should be
incentivized occasionally in the form of rewards as well.
2. Leopard
Site specific prescriptions for Leopard (Panthera pardus fusca)
Leopard (Panthera pardus fusca) is listed in Schedule I of the Indian Wildlife Protection Act
and Vulnerable under IUCN Red list which necessitates legal protection of the animal.
Behaviour and biology
Leopards occur in the widest range of habitats. They thrive in arid region to rainforests.
Leopard subpopulations also occur in suburban and urban environments in India. Leopards
have survived outside protected areas in many parts of India since historical times (Daniel
1999) and even today high density of Leopards do occur among high human densities
(Singh 2005, Athreya et al. 2013), although associated levels of conflict can also be high
(Athreya et al. 2011).
Leopard diet is related to prey availability and presence of larger competitors. Generally,
Leopards prefer medium-sized ungulate prey (10- 40 kgs). They have a highly varied diet,
however, feeding on insects, reptiles, birds and small mammals up to large ungulates.
Though the Leopard as a species has the reputation of being a generalist, often individuals
will become adept specialists for a particular prey item. These individuals will feed almost
exclusively on that prey, occasionally supplementing their diet with other food items when
necessary. There are records which state that dogs, goats and cattle forms a large
proportion of their diet.
Where competitors are present Leopards will catch their kills under thick vegetation or hoist
their prey into the branches of a tree. In the absence of larger competitors, leopards feed on
larger prey (Ramakrishnan et al. 1999).
Habitat enrichment
Leopards mostly inhabit terrains such as rocky ridges, ravines and grasslands, which would
provide them den, protection and escape ways. Areas which are moderately to very steep
(>40-50° slopes) with good vegetation cover is a good habitat for them. Specific topographic
features and landforms are preferred for their cover requirements. Because of its large
range, estimating their density has always been varying.
As human encroachment into leopard habitat increases, the value of secure escape,
denning and hiding cover which offers concealment from humans also increases. Secluded
rocky areas with a readily available food supply are critical during the first few months after
birth of the cubs. Cubs venture from the den at 5-6 weeks, and consume small quantities of
meat when 6-8 weeks old.
19
Monitoring
The primary threats to Leopards are anthropogenic. Habitat fragmentation, reduced prey
base and conflict with livestock have reduced Leopard populations throughout most of its
range. Diversion of forest habitats may have significant impact on Leopard range.
Factors to be considered in conservation efforts of Leopard
Isolation: The degree of buffering of the core area under consideration is important in terms
of leopard behaviour and ecology. Efforts should be made in order to curtail human
disturbances
Habitat connectivity: Adjacent, sparsely inhabited or protected areas, particularly national
parks and wildlife sanctuaries should be connected through corridors for easy ranging of
leopard population.
Identify Hotspot and Protection: Hunting is an important factor for their reduced population
and fragmentation. Hence, efforts should be made to give protection at key locations where
they have been known to frequent.
Community based conflict alleviation initiatives: Awareness needs to be created with
villagers to avoid direct conflicts with leopards and the livestock population and pattern
should be regulated.
Guarding: Problem predators needs to be controlled through trapping and other traditional
control methods and if needed may be relocated to other nearby parks or wildlife
sanctuaries.
Monitoring: Stakeholders should employ simple but realistic manual monitoring. Expertise
from wildlife biologist should be blended with local knowledge, whenever conflicts arise.
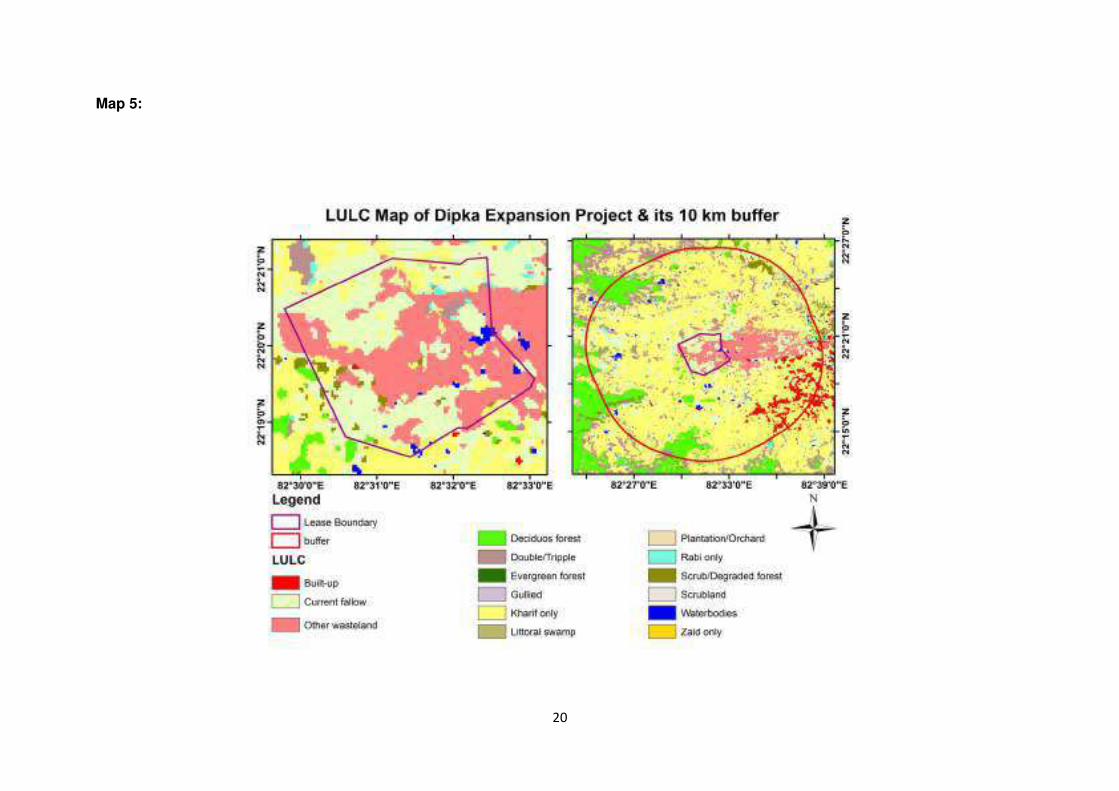
20
Map 5:
21
CHAPTER - VI
Mitigation measures and restoration strategies
Keeping in view the analysis of the ground situation, following mitigation measures and
restoration strategies are proposed to tackle the adverse impacts of mining operations:
Catchment area and channel treatment
To ensure water availability to flora and fauna during pinch period, channels most affected
due to erosion and gullies formation would be treated as per the standard soil and moisture
conservation measures being practiced, under the supervision of the forest department.
Katghora Forest Division will identify the locations for catchment area treatment and
thereafter water harvesting structures may be created as and when funds will be made
available by the user agency.
Habitat improvement through enrichment plantation
Since many species of fauna frequent the area, enrichment plantation is proposed in open
forest of the 10 km buffer area of the proposed mine boundary, so that canopy cover is
improved and enough food plants are available for birds and animals. The choice of species
as food plants for Sloth bear may be Ficus sp., Cordia myxa, Zizyphus jujuba, Mangifera
indica, Syzygium cimini, Casia fistula etc (Schaller, 2004) and Diospyros melanoxylon,
Zizyphus mauritiana (Yoganand et.al., 2005). Additionally, the area-wise choice of species
may also be decided by the DFO, Katghora while preparing annual plan of operation every
year.
It is suggested that, within a period of five years, an area 900.12 ha around Dipka OCP ie.
may be afforested in a phased manner within the 10 km buffer.
Green belt
A green belt along the outer periphery of the proposed OCP would be beneficial in many
ways leading to conservation of biodiversity, retention of soil moisture, recharge of ground
water and maintaining pleasant micro climate of the region. In addition, vegetation cover can
also absorb pollutants from the environment and helps in effective pollution control. Green
belts in and around mining areas are important to the ecological health of any given region.
Caution has to be ensured while selecting the species for green belt plantation. Plantation
species should be indigenous and those that are already available in the landscape. A land
use land cover (LULC) map is given in this report so as to facilitate identifying the locations
for green belt locations (Map 5).
Topsoil conservation
The soil profile is made up of a number of layers, including the topsoil and overburden
layers. The topsoil layer contains a large store of seed and nutrients that are vital to the
success of the future mine rehabilitation. Using topsoil during the restoration process can
improve the productivity and rate of revegetation. To achieve improved rates, the topsoil
must retain its chemical, physical, and biological properties (Visser et al. 1984).
The soil is adversely affected by the removal and storage. Several researchers have shown
that stockpiling also has adverse effects on biological properties. Anaerobic conditions are

22
created in the deeper depths. Decrease in microbial activity and mycorrhizal infection
potential of stockpiled soil are common. The number of bacteria, fungi, actinomycetes, and
algae are found to be comparatively less in the stored soil than in the undisturbed sites. All
this can lead to reduced nutrient cycling and lower availability of nutrients, having adverse
effects on the establishment and production of plants when revegetating (Stark and Redente
1987).
In view of the above the stock pile of the topsoil should be inoculated with Vesicular
arbuscular mycorrhizal fungi (VAM). To increase the fertility the stock pile will be seeded with
various species of leguminous plants. All care should be undertaken to select stockpile
location to avoid slopes, natural drainage ways and traffic routes. The above suggestions
are to be followed regarding the top soil during the process of mining till the date of back
filling.
Potential Conservation Areas (PCA)
Habitat conservation/ improvement is being suggested to carry out in some of the below
identified areas in a phased manner. The list of areas mentioned here are minimal, there can
be more areas which can be identified by the DFO, Katghora in due course to execute the
works related to habitat improvement. The work needs to be started after getting final forest
clearance and other clearances and commencement of mining activities. Within the 10 km
buffer of the proposed OCP, there are many areas which are Reserved Forest. All such
works are needed to be conducted within the prescriptions of Forest Working Plan and in
consultation with DFO, Katghora.
Habitat improvement/development by ex-situ conservation through plantation, soil
conservation, and development of water bodies is suggested in the following locations,
which were surveyed to identify the possibility of carrying out conservation and mitigation
measures for wildlife. Activities such as compensatory plantation, plantation of fruiting trees
and desilting of ponds may be carried out in the below mentioned locations and forest
compartments.
Sl.
No.
Potential
conservation
areas
Latitude/Longitude
Comp.
No.
Habitat
Type
1 Gevra N 22˚ 20' 03.4", E 082˚ 24' 21.8" Foot hill
2 Inside mine area N 22˚ 19' 41.8", E 082˚ 30' 22.9" - Overburden areas
3
Devpahari
Range N 22˚ 36' 06.6", E 082˚ 51' 18.2" - Hill forest
4 Hasdeo valley N 22˚ 37' 03.3", E 082˚ 30' 24.3" - Foot hills Scrub
The open forest areas within the 10 km buffer of proposed OCP are found to have less than
10% canopy cover. Therefore, these are ideal places for undertaking plantation work. The
choice of species for plantation has to be indigenous and should resemble the natural
species composition of the area (which can also be referred from the species list given in
this plan).
Raising of plantations in and around villages
23
Plantation is proposed in the degraded land of the villages (Map 6) of buffer area so as to
enrich biodiversity in consultation with the forest department. The preferred list of the
species to be planted and the area may be decided through village level consultative
meetings by the officials of Forest Department and villagers.
The seedlings to be planted needs to be tall saplings of atleast two years old and should
follow the standard planting practises of State Forest Department or Forest Corporations. It
is suggested that the selected species should atleast consists of 40% fodder species for
herbivores, 30 % timber species, 20 % fuel wood species and 10 % NTFP species.
Furthermore, it has to be ensured that, there is atleast 80% survival rate at the end of 3rd
year.
Grass layer for erosion reduction
Grasses are drought tolerant and can colonize fast in low nutrient soil due to the presence of
fibrous roots and helps to reduce soil erosion as they are the best sand binders. The grasses
available locally in abundance can be used for biological treatment. For stabilization of loose
material and steep slopes, clumps of grasses can be collected from adjacent and nearby
areas without destroying the grass cover of the adjacent areas. The grass species
suggested for planting in the form of slips and root stocks are given in Table 13, which may
be grown and multiplied in the nursery.
Hydroseeding
In order to avoid erosion and to achieve quick seed broadcasting in relatively large area
hydro seeding can be a suitable method. This method is very effective on slopes. The results
This method results in quick and is with high germination rates .In this method grasses and
seeds of herb species especially seeds of legume species along with mulch, AM fungi and
bio fertilizers are mixed in water with a consistency of slurry and the slurry is sprayed with
the help of a pump. The process of Hydro seeding must be carried out at least two months
before the onset of monsoon. Hydro seeding during monsoon may wash away the slurry
along with the seed material and nutrients. The species suggested for seed
broadcasting/hydro seeding is given in the Table 14 and these species will get established in
disturbed areas, in due course of time.
Conservation Education
Sensitization/Awareness programme for the villagers and school children
For effective implementation of the conservation strategies, active co-operation of the all
villagers of the buffer area and other stakeholders is required. Meetings and seminars are
needed to be organised in villages on regular basis to keep people actively involved. The
training and awareness programme may include the forest and its utility, Forest and wildlife
interaction, man-animal conflict, Forest and water regime of the area, Conservation and
Development, habitat degradation etc.
Training for the officials of SECL, Dipka Area
24
Sensitization programme are needed to be organised for the officials of SECL, Dipka area regarding forest, wildlife and environmental conservation.
Training for minimising the man-animal conflict
It is imperative to train the villagers on the ways to avoid/minimise the interface with wild
animals whenever they come in direct contact with them. Do's and don‟ts for villagers must be widely circulated either formally or informally to avoid conflicts with wildlife and especially
during Mahua flowering months of December and January when bear cubs are born in order
to minimise the conflict.
Immediate compensation to villagers for crop damage/human injury
Immediate compensation to villagers should be given in case of injuries/death of human,
crop raiding and damages to property caused by any wild animals as per the rates notified
by the state forest department and after assessment of damage in consultation with the local
forest officers.
Development of herbal garden SECL, Dipka Area must undertake development of an herbal garden at an appropriate place
in consultation with DFO, Katghora preferably in the undisturbed area in atleast 2 ha area to
rehabilitate vulnerable species and species of medicinal importance. The common medicinal
plants found in this region are enlisted in Table 7. This would serve the purpose of
conservation, awareness as well as improve the aesthetics of the area.
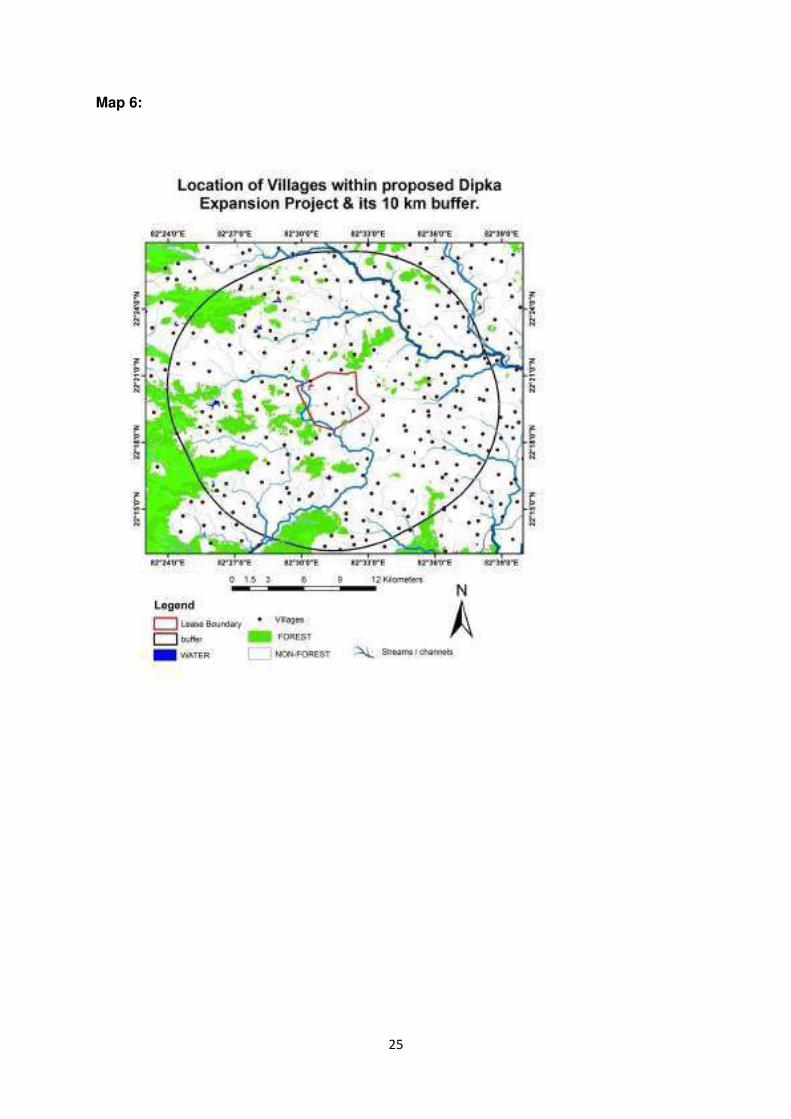
25
Map 6:
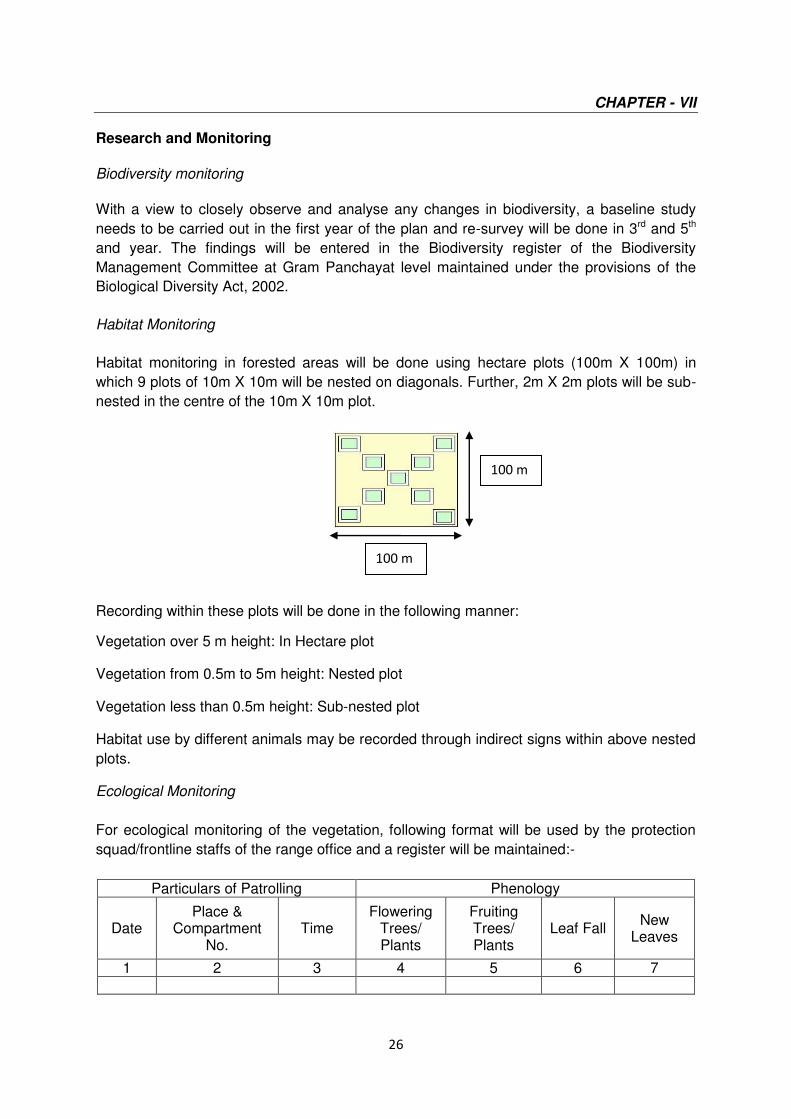
26
CHAPTER - VII
Research and Monitoring
Biodiversity monitoring
With a view to closely observe and analyse any changes in biodiversity, a baseline study
needs to be carried out in the first year of the plan and re-survey will be done in 3rd and 5th
and year. The findings will be entered in the Biodiversity register of the Biodiversity
Management Committee at Gram Panchayat level maintained under the provisions of the
Biological Diversity Act, 2002.
Habitat Monitoring
Habitat monitoring in forested areas will be done using hectare plots (100m X 100m) in
which 9 plots of 10m X 10m will be nested on diagonals. Further, 2m X 2m plots will be sub-
nested in the centre of the 10m X 10m plot.
Recording within these plots will be done in the following manner:
Vegetation over 5 m height: In Hectare plot
Vegetation from 0.5m to 5m height: Nested plot
Vegetation less than 0.5m height: Sub-nested plot
Habitat use by different animals may be recorded through indirect signs within above nested
plots.
Ecological Monitoring
For ecological monitoring of the vegetation, following format will be used by the protection
squad/frontline staffs of the range office and a register will be maintained:-
Particulars of Patrolling Phenology
Date Place &
Compartment No.
Time Flowering
Trees/ Plants
Fruiting Trees/ Plants
Leaf Fall New
Leaves
1 2 3 4 5 6 7
100 m
100 m
27
Following indices will be prepared for each species of plants:
Frequency = Number of plots in which species Occur/Total number of plots surveyed x 100
Density = Total number of individuals of the species/Total number of plots surveyed x 100
Relative frequency = Frequency of a species /Sum of frequency of all the species x 100
Relative density = Density of a species / Sum of density of all species x 100
Species Richness Index d = S-1/log N
Where S = Number of species tallied over all Plots
N = Number of individuals tallied over all Plots
Shanon Index of general density:
H = Σ (ni /N) x log (ni/N)
Where ni = Importance value of each species
N = Total of importance values of all species
ni/N = Importance probability of each species (Importance value is based on number of
basal area)
The data collected during various phases for sampling for Vegetation, Human disturbance
will be collated and put in GIS Domain. This can be correlated with animal base presence.
Any change in the habitat can be monitored by time-series data analysis in GIS over the
years.
Water quality monitoring
Quality testing of water in the water bodies to assess their content with regard to silt, heavy
metals, toxins etc will be done from a certified laboratory and the report will be submitted to
the DFO, Katghora every year.
Wildlife Monitoring of the Area
To maintain and preserve the wild animals for maintaining ecological processes of the area,
periodic monitoring of major species has to be carried out based on standard protocols using
line transect, road transect for monitoring herbivores and carnivores, block count for
elephant and point counts for monitoring birds during different seasons in different habitats.
All tree species being used by the birds for nesting must be retained as such and these
species should be included in the plantation of the adjoining area. Snags should also be
allowed to remain as such that are likely to be utilised by many bird species for nesting and
perching.
Vigil and Fire Protection
Apprehending increase in biotic pressure on forest resources due to upcoming mining
activities in the region, there would be need for heightened vigil. Measures such as,
28
enhanced patrolling and creation of fire lines are being suggested. Few observation towers /
watch towers are also needed to be created at vulnerable locations to help monitoring
wildlife movements as well as incidence of fire.
Structure and Responsibilities
Contingency Corpus Fund
A corpus fund with an initial corpus of Rs. 50 lakh (for 5 years) will be maintained with DFO,
Katghora in a separate account to which contribution will be made by SECL, Dipka Area to
meet the requirement of immediate ex-gratia payment (for damages caused by wild animals)
to the people of the zone of influence area.
Plan period
The plan is for a Plan period 05 year period from 2020-21 to 2025-26. Intermediate revision
may be undertaken if felt necessary by the forest department.
Monitoring Committee
A monitoring committee under the Chairmanship of the DFO Karghora needs be formed with
one representative from SECL Dipka Area, village representatives and Range officer as
members. The committee will oversee the smooth implementation of plan. The committee
will assess the progress of implementation twice in a year based on the annual plan of
operations and Budget. The committee will also ensure that the adherence to conditions
imposed under statutory clearances is complied with in letter and spirit.
Funding
The plan will be fully funded by the South Eastern Coalfields Limited, Dipka Area. A separate
account shall be maintained for this purpose with DFO, Katghora who shall be implementing
agency.

29
CHAPTER - VIII
The budget
An indicative budget for Rs. 1132 Lakhs is proposed for various activities to be undertaken
based on the proposed mitigative measures for five years. The DFO, Katghora will work out
the actual costing and monitor the implementation of the prescriptions. The details of the
items are listed in the Table 15.
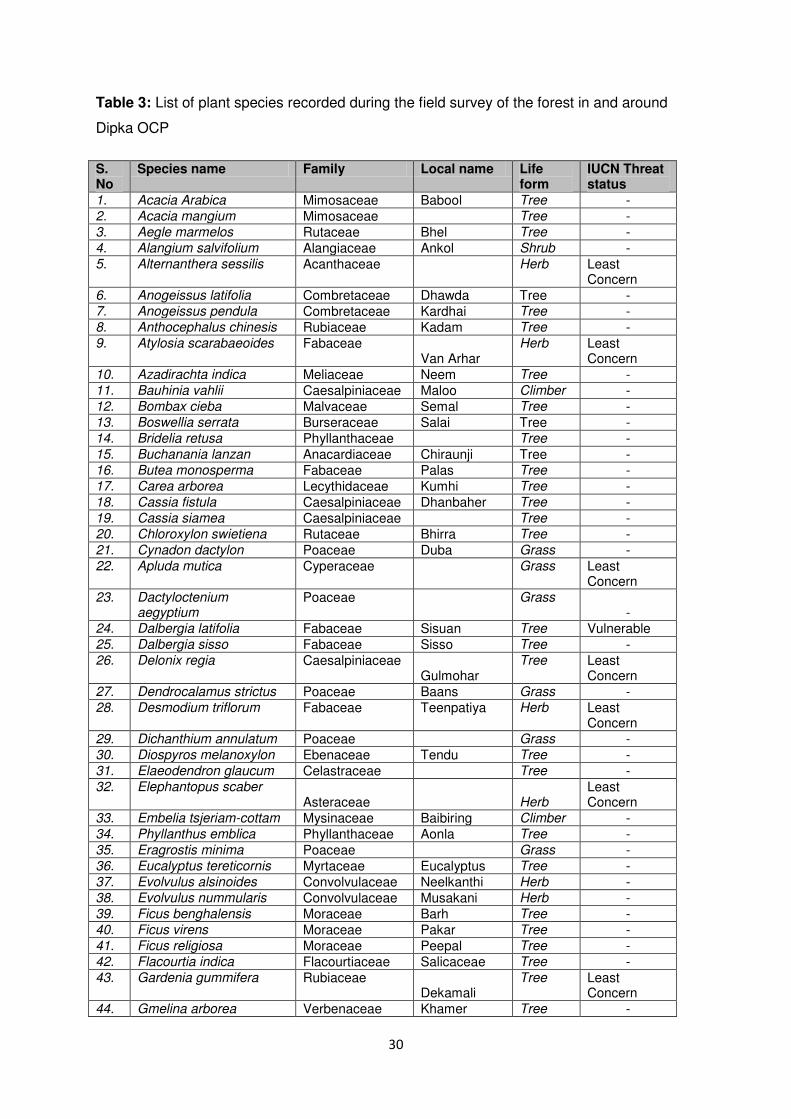
30
Table 3: List of plant species recorded during the field survey of the forest in and around
Dipka OCP
S. No
Species name Family Local name Life form
IUCN Threat status
1. Acacia Arabica Mimosaceae Babool Tree - 2. Acacia mangium Mimosaceae Tree - 3. Aegle marmelos Rutaceae Bhel Tree - 4. Alangium salvifolium Alangiaceae Ankol Shrub - 5. Alternanthera sessilis Acanthaceae Herb Least
Concern 6. Anogeissus latifolia Combretaceae Dhawda Tree - 7. Anogeissus pendula Combretaceae Kardhai Tree - 8. Anthocephalus chinesis Rubiaceae Kadam Tree - 9. Atylosia scarabaeoides Fabaceae
Van Arhar Herb Least
Concern 10. Azadirachta indica Meliaceae Neem Tree - 11. Bauhinia vahlii Caesalpiniaceae Maloo Climber - 12. Bombax cieba Malvaceae Semal Tree - 13. Boswellia serrata Burseraceae Salai Tree - 14. Bridelia retusa Phyllanthaceae Tree - 15. Buchanania lanzan Anacardiaceae Chiraunji Tree - 16. Butea monosperma Fabaceae Palas Tree - 17. Carea arborea Lecythidaceae Kumhi Tree - 18. Cassia fistula Caesalpiniaceae Dhanbaher Tree - 19. Cassia siamea Caesalpiniaceae Tree - 20. Chloroxylon swietiena Rutaceae Bhirra Tree - 21. Cynadon dactylon Poaceae Duba Grass - 22. Apluda mutica Cyperaceae Grass Least
Concern 23. Dactyloctenium
aegyptium Poaceae Grass
- 24. Dalbergia latifolia Fabaceae Sisuan Tree Vulnerable 25. Dalbergia sisso Fabaceae Sisso Tree - 26. Delonix regia Caesalpiniaceae
Gulmohar Tree Least
Concern 27. Dendrocalamus strictus Poaceae Baans Grass - 28. Desmodium triflorum Fabaceae Teenpatiya Herb Least
Concern 29. Dichanthium annulatum Poaceae Grass - 30. Diospyros melanoxylon Ebenaceae Tendu Tree - 31. Elaeodendron glaucum Celastraceae Tree - 32. Elephantopus scaber
Asteraceae Herb Least Concern
33. Embelia tsjeriam-cottam Mysinaceae Baibiring Climber - 34. Phyllanthus emblica Phyllanthaceae Aonla Tree - 35. Eragrostis minima Poaceae Grass - 36. Eucalyptus tereticornis Myrtaceae Eucalyptus Tree - 37. Evolvulus alsinoides Convolvulaceae Neelkanthi Herb - 38. Evolvulus nummularis Convolvulaceae Musakani Herb - 39. Ficus benghalensis Moraceae Barh Tree - 40. Ficus virens Moraceae Pakar Tree - 41. Ficus religiosa Moraceae Peepal Tree - 42. Flacourtia indica Flacourtiaceae Salicaceae Tree - 43. Gardenia gummifera Rubiaceae
Dekamali Tree Least
Concern 44. Gmelina arborea Verbenaceae Khamer Tree -
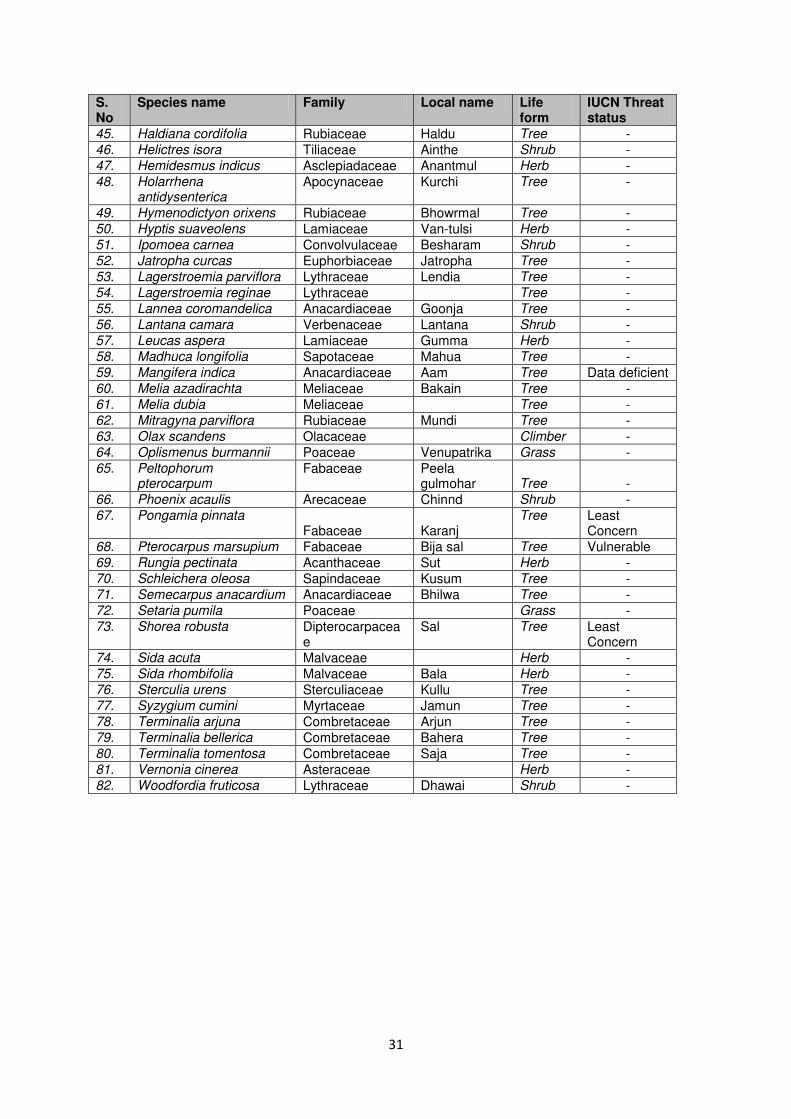
31
S. No
Species name Family Local name Life form
IUCN Threat status
45. Haldiana cordifolia Rubiaceae Haldu Tree - 46. Helictres isora Tiliaceae Ainthe Shrub - 47. Hemidesmus indicus Asclepiadaceae Anantmul Herb - 48. Holarrhena
antidysenterica Apocynaceae Kurchi Tree -
49. Hymenodictyon orixens Rubiaceae Bhowrmal Tree - 50. Hyptis suaveolens Lamiaceae Van-tulsi Herb - 51. Ipomoea carnea Convolvulaceae Besharam Shrub - 52. Jatropha curcas Euphorbiaceae Jatropha Tree - 53. Lagerstroemia parviflora Lythraceae Lendia Tree - 54. Lagerstroemia reginae Lythraceae Tree - 55. Lannea coromandelica Anacardiaceae Goonja Tree - 56. Lantana camara Verbenaceae Lantana Shrub - 57. Leucas aspera Lamiaceae Gumma Herb - 58. Madhuca longifolia Sapotaceae Mahua Tree - 59. Mangifera indica Anacardiaceae Aam Tree Data deficient 60. Melia azadirachta Meliaceae Bakain Tree - 61. Melia dubia Meliaceae Tree - 62. Mitragyna parviflora Rubiaceae Mundi Tree - 63. Olax scandens Olacaceae Climber - 64. Oplismenus burmannii Poaceae Venupatrika Grass - 65. Peltophorum
pterocarpum Fabaceae Peela
gulmohar Tree - 66. Phoenix acaulis Arecaceae Chinnd Shrub - 67. Pongamia pinnata
Fabaceae Karanj Tree Least
Concern 68. Pterocarpus marsupium Fabaceae Bija sal Tree Vulnerable 69. Rungia pectinata Acanthaceae Sut Herb - 70. Schleichera oleosa Sapindaceae Kusum Tree - 71. Semecarpus anacardium Anacardiaceae Bhilwa Tree - 72. Setaria pumila Poaceae Grass - 73. Shorea robusta Dipterocarpacea
e Sal Tree Least
Concern 74. Sida acuta Malvaceae Herb - 75. Sida rhombifolia Malvaceae Bala Herb - 76. Sterculia urens Sterculiaceae Kullu Tree - 77. Syzygium cumini Myrtaceae Jamun Tree - 78. Terminalia arjuna Combretaceae Arjun Tree - 79. Terminalia bellerica Combretaceae Bahera Tree - 80. Terminalia tomentosa Combretaceae Saja Tree - 81. Vernonia cinerea Asteraceae Herb - 82. Woodfordia fruticosa Lythraceae Dhawai Shrub -
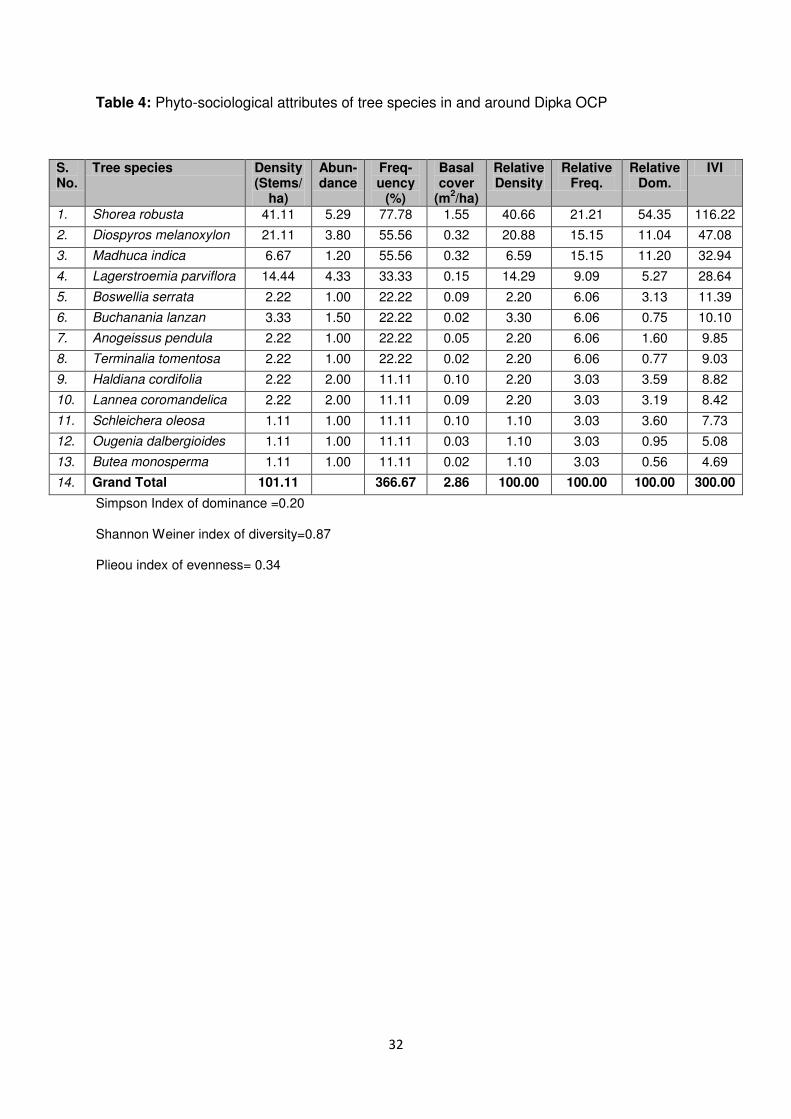
32
Table 4: Phyto-sociological attributes of tree species in and around Dipka OCP
S. No.
Tree species Density (Stems/
ha)
Abun- dance
Freq-uency
(%)
Basal cover
(m2/ha)
Relative Density
Relative Freq.
Relative Dom.
IVI
1. Shorea robusta 41.11 5.29 77.78 1.55 40.66 21.21 54.35 116.22
2. Diospyros melanoxylon 21.11 3.80 55.56 0.32 20.88 15.15 11.04 47.08
3. Madhuca indica 6.67 1.20 55.56 0.32 6.59 15.15 11.20 32.94
4. Lagerstroemia parviflora 14.44 4.33 33.33 0.15 14.29 9.09 5.27 28.64
5. Boswellia serrata 2.22 1.00 22.22 0.09 2.20 6.06 3.13 11.39
6. Buchanania lanzan 3.33 1.50 22.22 0.02 3.30 6.06 0.75 10.10
7. Anogeissus pendula 2.22 1.00 22.22 0.05 2.20 6.06 1.60 9.85
8. Terminalia tomentosa 2.22 1.00 22.22 0.02 2.20 6.06 0.77 9.03
9. Haldiana cordifolia 2.22 2.00 11.11 0.10 2.20 3.03 3.59 8.82
10. Lannea coromandelica 2.22 2.00 11.11 0.09 2.20 3.03 3.19 8.42
11. Schleichera oleosa 1.11 1.00 11.11 0.10 1.10 3.03 3.60 7.73
12. Ougenia dalbergioides 1.11 1.00 11.11 0.03 1.10 3.03 0.95 5.08
13. Butea monosperma 1.11 1.00 11.11 0.02 1.10 3.03 0.56 4.69
14. Grand Total 101.11 366.67 2.86 100.00 100.00 100.00 300.00
Simpson Index of dominance =0.20
Shannon Weiner index of diversity=0.87
Plieou index of evenness= 0.34
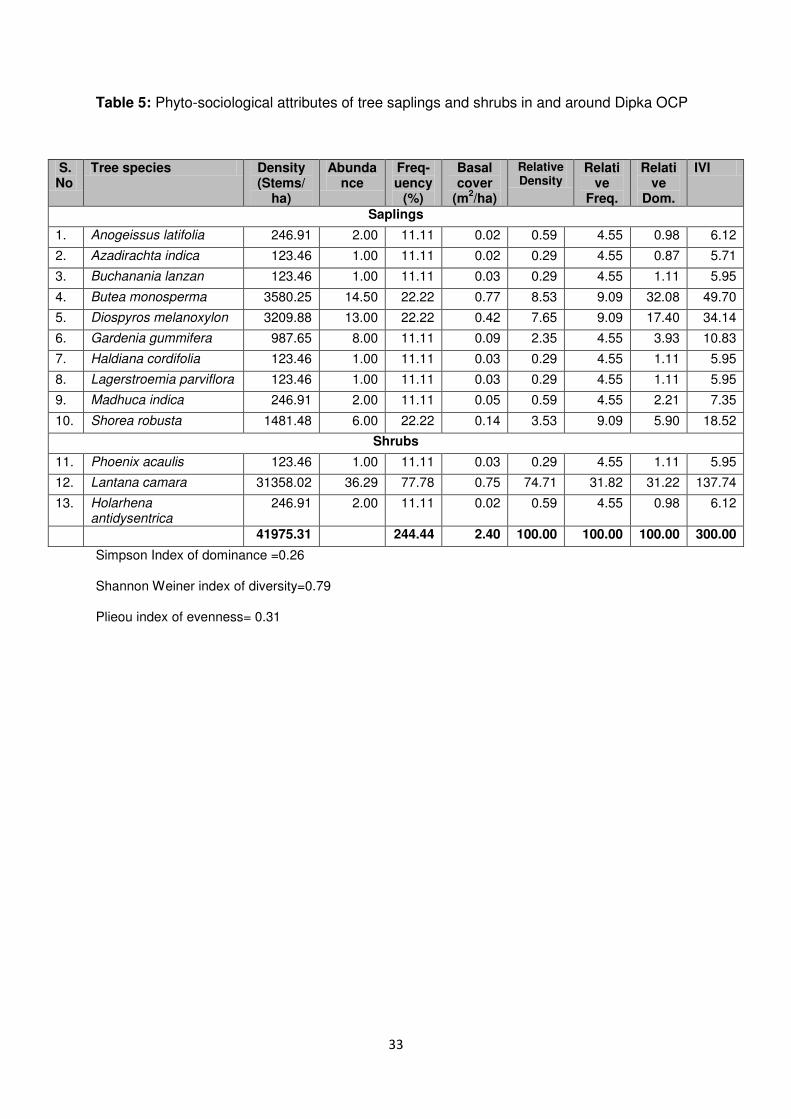
33
Table 5: Phyto-sociological attributes of tree saplings and shrubs in and around Dipka OCP
S. No
Tree species Density (Stems/
ha)
Abundance
Freq-uency
(%)
Basal cover
(m2/ha)
Relative Density
Relative
Freq.
Relative
Dom.
IVI
Saplings
1. Anogeissus latifolia 246.91 2.00 11.11 0.02 0.59 4.55 0.98 6.12
2. Azadirachta indica 123.46 1.00 11.11 0.02 0.29 4.55 0.87 5.71
3. Buchanania lanzan 123.46 1.00 11.11 0.03 0.29 4.55 1.11 5.95
4. Butea monosperma 3580.25 14.50 22.22 0.77 8.53 9.09 32.08 49.70
5. Diospyros melanoxylon 3209.88 13.00 22.22 0.42 7.65 9.09 17.40 34.14
6. Gardenia gummifera 987.65 8.00 11.11 0.09 2.35 4.55 3.93 10.83
7. Haldiana cordifolia 123.46 1.00 11.11 0.03 0.29 4.55 1.11 5.95
8. Lagerstroemia parviflora 123.46 1.00 11.11 0.03 0.29 4.55 1.11 5.95
9. Madhuca indica 246.91 2.00 11.11 0.05 0.59 4.55 2.21 7.35
10. Shorea robusta 1481.48 6.00 22.22 0.14 3.53 9.09 5.90 18.52
Shrubs
11. Phoenix acaulis 123.46 1.00 11.11 0.03 0.29 4.55 1.11 5.95
12. Lantana camara 31358.02 36.29 77.78 0.75 74.71 31.82 31.22 137.74
13. Holarhena antidysentrica
246.91 2.00 11.11 0.02 0.59 4.55 0.98 6.12
41975.31 244.44 2.40 100.00 100.00 100.00 300.00
Simpson Index of dominance =0.26
Shannon Weiner index of diversity=0.79
Plieou index of evenness= 0.31
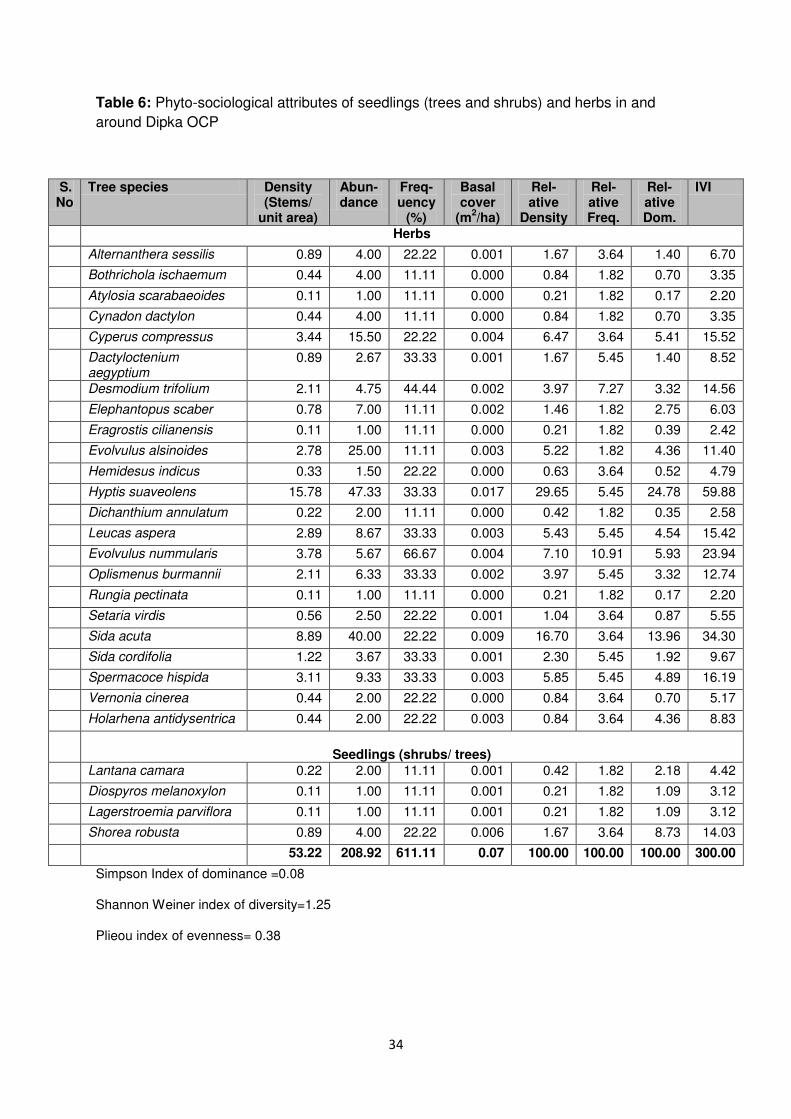
34
Table 6: Phyto-sociological attributes of seedlings (trees and shrubs) and herbs in and
around Dipka OCP
S. No
Tree species Density (Stems/
unit area)
Abun- dance
Freq- uency
(%)
Basal cover
(m2/ha)
Rel-ative
Density
Rel- ative Freq.
Rel- ative Dom.
IVI
Herbs
1.Alternanthera sessilis 0.89 4.00 22.22 0.001 1.67 3.64 1.40 6.70
2.Bothrichola ischaemum 0.44 4.00 11.11 0.000 0.84 1.82 0.70 3.35
3.Atylosia scarabaeoides 0.11 1.00 11.11 0.000 0.21 1.82 0.17 2.20
4.Cynadon dactylon 0.44 4.00 11.11 0.000 0.84 1.82 0.70 3.35
5.Cyperus compressus 3.44 15.50 22.22 0.004 6.47 3.64 5.41 15.52
6.Dactyloctenium aegyptium
0.89 2.67 33.33 0.001 1.67 5.45 1.40 8.52
7.Desmodium trifolium 2.11 4.75 44.44 0.002 3.97 7.27 3.32 14.56
8.Elephantopus scaber 0.78 7.00 11.11 0.002 1.46 1.82 2.75 6.03
9.Eragrostis cilianensis 0.11 1.00 11.11 0.000 0.21 1.82 0.39 2.42
10.Evolvulus alsinoides 2.78 25.00 11.11 0.003 5.22 1.82 4.36 11.40
11.Hemidesus indicus 0.33 1.50 22.22 0.000 0.63 3.64 0.52 4.79
12.Hyptis suaveolens 15.78 47.33 33.33 0.017 29.65 5.45 24.78 59.88
13.Dichanthium annulatum 0.22 2.00 11.11 0.000 0.42 1.82 0.35 2.58
14.Leucas aspera 2.89 8.67 33.33 0.003 5.43 5.45 4.54 15.42
15.Evolvulus nummularis 3.78 5.67 66.67 0.004 7.10 10.91 5.93 23.94
16.Oplismenus burmannii 2.11 6.33 33.33 0.002 3.97 5.45 3.32 12.74
17.Rungia pectinata 0.11 1.00 11.11 0.000 0.21 1.82 0.17 2.20
18.Setaria virdis 0.56 2.50 22.22 0.001 1.04 3.64 0.87 5.55
19.Sida acuta 8.89 40.00 22.22 0.009 16.70 3.64 13.96 34.30
20.Sida cordifolia 1.22 3.67 33.33 0.001 2.30 5.45 1.92 9.67
21.Spermacoce hispida 3.11 9.33 33.33 0.003 5.85 5.45 4.89 16.19
22.Vernonia cinerea 0.44 2.00 22.22 0.000 0.84 3.64 0.70 5.17
23.Holarhena antidysentrica 0.44 2.00 22.22 0.003 0.84 3.64 4.36 8.83
Seedlings (shrubs/ trees)
24.Lantana camara 0.22 2.00 11.11 0.001 0.42 1.82 2.18 4.42
25.Diospyros melanoxylon 0.11 1.00 11.11 0.001 0.21 1.82 1.09 3.12
26.Lagerstroemia parviflora 0.11 1.00 11.11 0.001 0.21 1.82 1.09 3.12
27.Shorea robusta 0.89 4.00 22.22 0.006 1.67 3.64 8.73 14.03
53.22 208.92 611.11 0.07 100.00 100.00 100.00 300.00
Simpson Index of dominance =0.08
Shannon Weiner index of diversity=1.25
Plieou index of evenness= 0.38
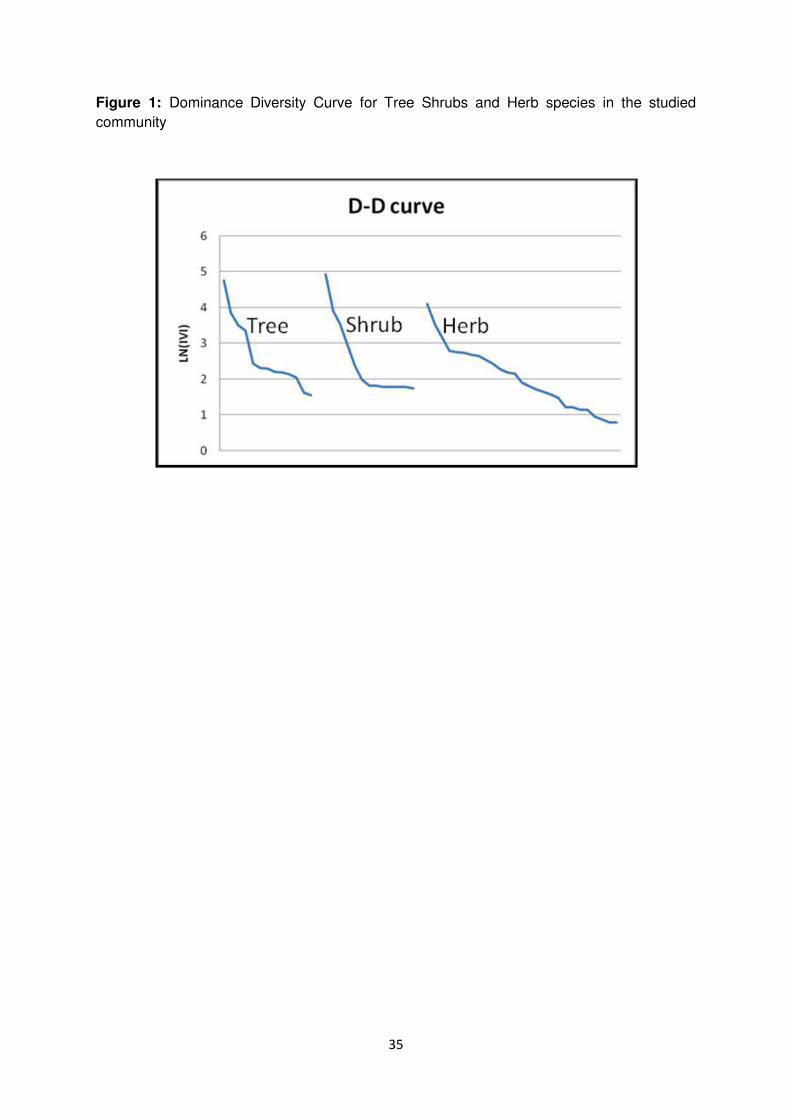
35
Figure 1: Dominance Diversity Curve for Tree Shrubs and Herb species in the studied
community
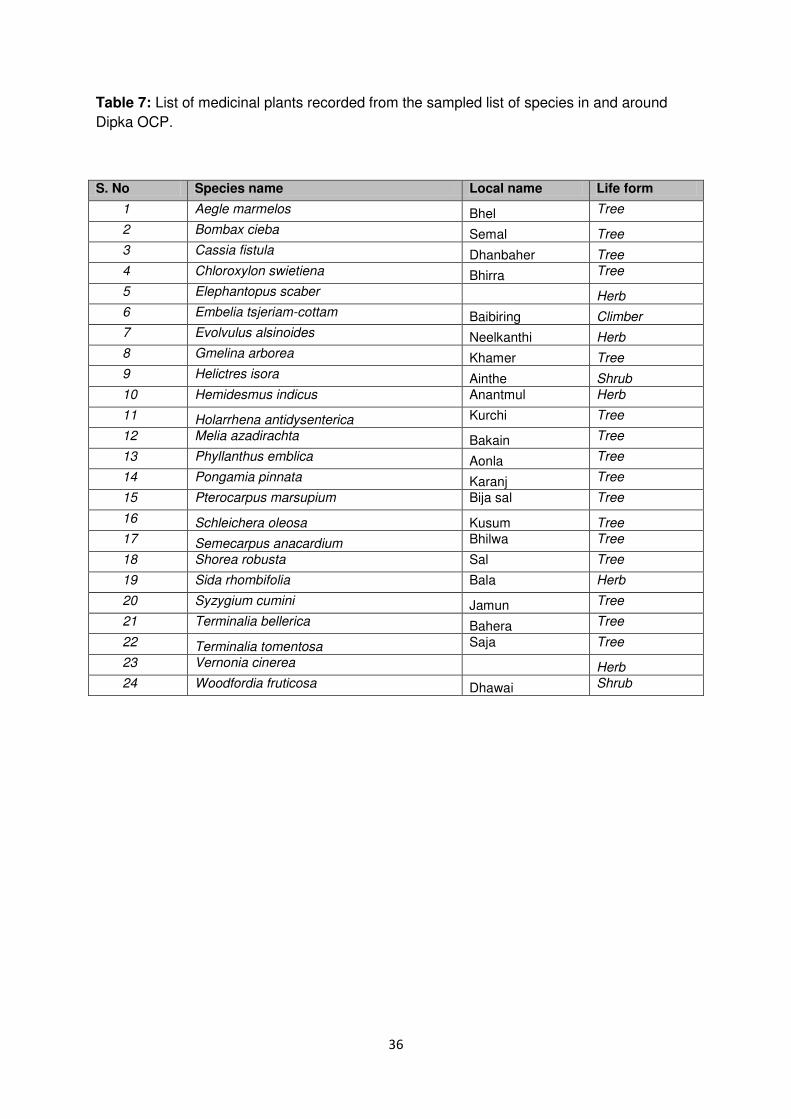
36
Table 7: List of medicinal plants recorded from the sampled list of species in and around
Dipka OCP.
S. No Species name Local name Life form
1 Aegle marmelos Bhel Tree
2 Bombax cieba Semal Tree
3 Cassia fistula Dhanbaher Tree
4 Chloroxylon swietiena Bhirra Tree
5 Elephantopus scaber
Herb
6 Embelia tsjeriam-cottam Baibiring Climber
7 Evolvulus alsinoides Neelkanthi Herb
8 Gmelina arborea Khamer Tree
9 Helictres isora Ainthe Shrub
10 Hemidesmus indicus Anantmul Herb
11 Holarrhena antidysenterica Kurchi Tree
12 Melia azadirachta Bakain Tree
13 Phyllanthus emblica Aonla Tree
14 Pongamia pinnata Karanj Tree
15 Pterocarpus marsupium Bija sal Tree
16 Schleichera oleosa Kusum Tree
17 Semecarpus anacardium Bhilwa Tree
18 Shorea robusta Sal Tree
19 Sida rhombifolia Bala Herb
20 Syzygium cumini Jamun Tree
21 Terminalia bellerica Bahera Tree
22 Terminalia tomentosa Saja Tree
23 Vernonia cinerea
Herb
24 Woodfordia fruticosa Dhawai Shrub
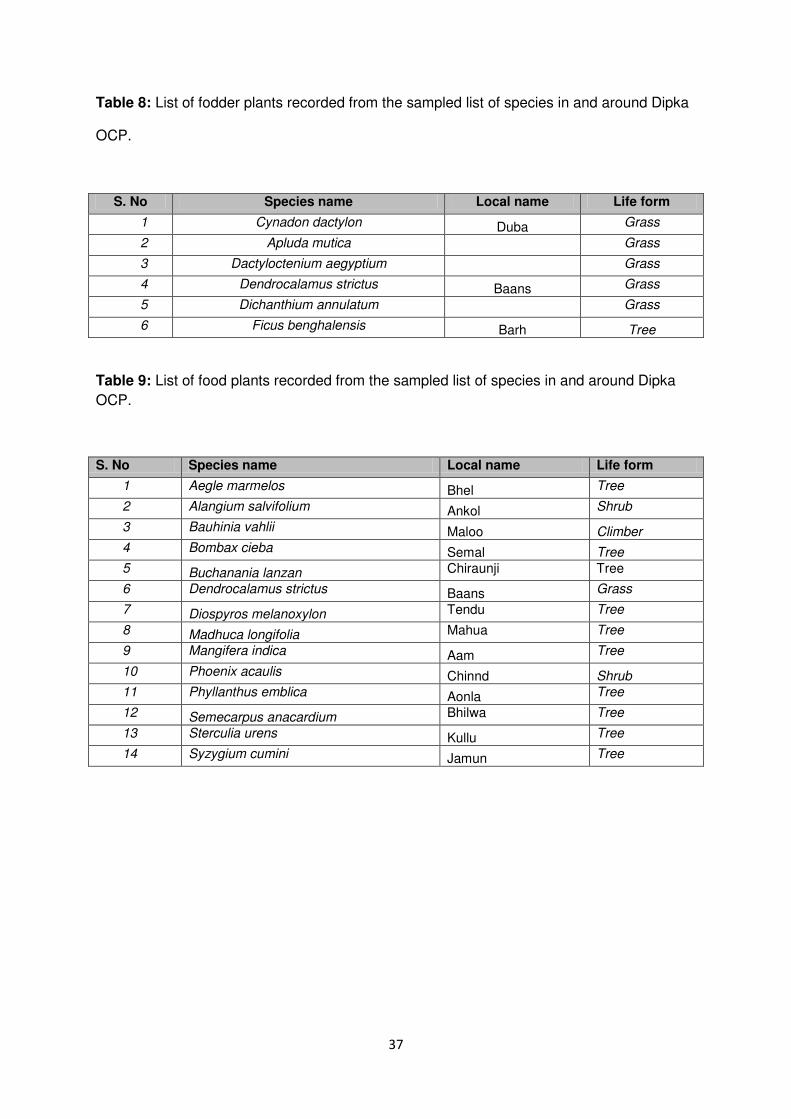
37
Table 8: List of fodder plants recorded from the sampled list of species in and around Dipka
OCP.
S. No Species name Local name Life form
1 Cynadon dactylon Duba Grass
2 Apluda mutica
Grass
3 Dactyloctenium aegyptium
Grass
4 Dendrocalamus strictus Baans Grass
5 Dichanthium annulatum
Grass
6 Ficus benghalensis Barh Tree
Table 9: List of food plants recorded from the sampled list of species in and around Dipka
OCP.
S. No Species name Local name Life form
1 Aegle marmelos Bhel Tree
2 Alangium salvifolium Ankol Shrub
3 Bauhinia vahlii Maloo Climber
4 Bombax cieba Semal Tree
5 Buchanania lanzan Chiraunji Tree
6 Dendrocalamus strictus Baans Grass
7 Diospyros melanoxylon Tendu Tree
8 Madhuca longifolia Mahua Tree
9 Mangifera indica Aam Tree
10 Phoenix acaulis Chinnd Shrub
11 Phyllanthus emblica Aonla Tree
12 Semecarpus anacardium Bhilwa Tree
13 Sterculia urens Kullu Tree
14 Syzygium cumini Jamun Tree

38
Table 10: List of timber trees recorded from the sampled list of species in and around Dipka
OCP.
S. No Species name Local name Life form
1 Anogeissus latifolia Dhawda Tree
2 Bridelia retusa - Tree 3 Cassia fistula Dhanbaher Tree 4 Chloroxylon swietiena Bhirra Tree
5 Dalbergia latifolia Sisuan Tree
6 Dalbergia sisso Sisso Tree
7 Gmelina arborea Khamer Tree 8 Haldiana cordifolia Haldu Tree 9 Lagerstroemia parviflora Lendia Tree
10 Lannea coromandelica Goonja Tree 11 Madhuca longifolia Mahua Tree
12 Mangifera indica Aam Tree
13 Mitragyna parviflora Mundi Tree 14 Ougeinia dalbergioides Tinsa Tree 15 Pterocarpus marsupium Bija sal Tree
16 Schleichera oleosa Kusum Tree 17 Setaria pumila - Grass 18 Shorea robusta Sal Tree
19 Syzygium cumini Jamun Tree
20 Terminalia arjuna Arjun Tree
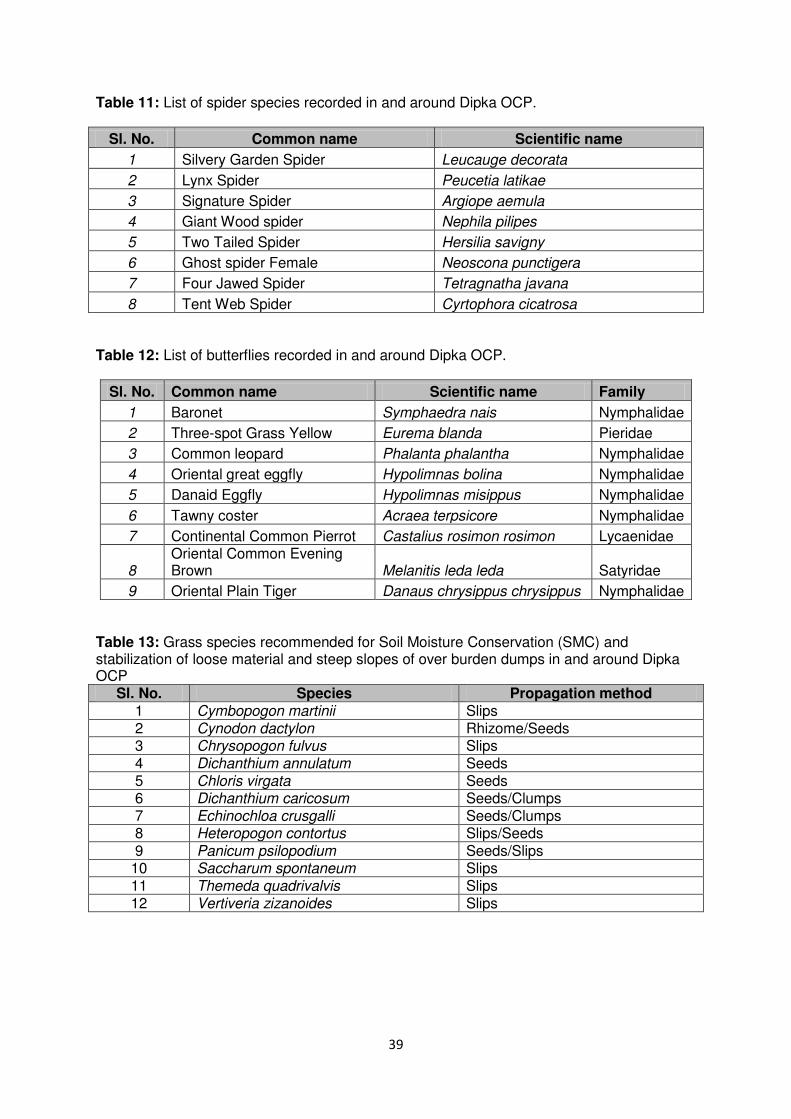
39
Table 11: List of spider species recorded in and around Dipka OCP.
Sl. No. Common name Scientific name
1 Silvery Garden Spider Leucauge decorata
2 Lynx Spider Peucetia latikae
3 Signature Spider Argiope aemula
4 Giant Wood spider Nephila pilipes
5 Two Tailed Spider Hersilia savigny
6 Ghost spider Female Neoscona punctigera
7 Four Jawed Spider Tetragnatha javana
8 Tent Web Spider Cyrtophora cicatrosa
Table 12: List of butterflies recorded in and around Dipka OCP.
Sl. No. Common name Scientific name Family
1 Baronet Symphaedra nais Nymphalidae
2 Three-spot Grass Yellow Eurema blanda Pieridae
3 Common leopard Phalanta phalantha Nymphalidae
4 Oriental great eggfly Hypolimnas bolina Nymphalidae
5 Danaid Eggfly Hypolimnas misippus Nymphalidae
6 Tawny coster Acraea terpsicore Nymphalidae
7 Continental Common Pierrot Castalius rosimon rosimon Lycaenidae
8 Oriental Common Evening Brown Melanitis leda leda Satyridae
9 Oriental Plain Tiger Danaus chrysippus chrysippus Nymphalidae Table 13: Grass species recommended for Soil Moisture Conservation (SMC) and stabilization of loose material and steep slopes of over burden dumps in and around Dipka OCP
Sl. No. Species Propagation method
1 Cymbopogon martinii Slips
2 Cynodon dactylon Rhizome/Seeds
3 Chrysopogon fulvus Slips
4 Dichanthium annulatum Seeds
5 Chloris virgata Seeds
6 Dichanthium caricosum Seeds/Clumps
7 Echinochloa crusgalli Seeds/Clumps
8 Heteropogon contortus Slips/Seeds
9 Panicum psilopodium Seeds/Slips
10 Saccharum spontaneum Slips
11 Themeda quadrivalvis Slips
12 Vertiveria zizanoides Slips
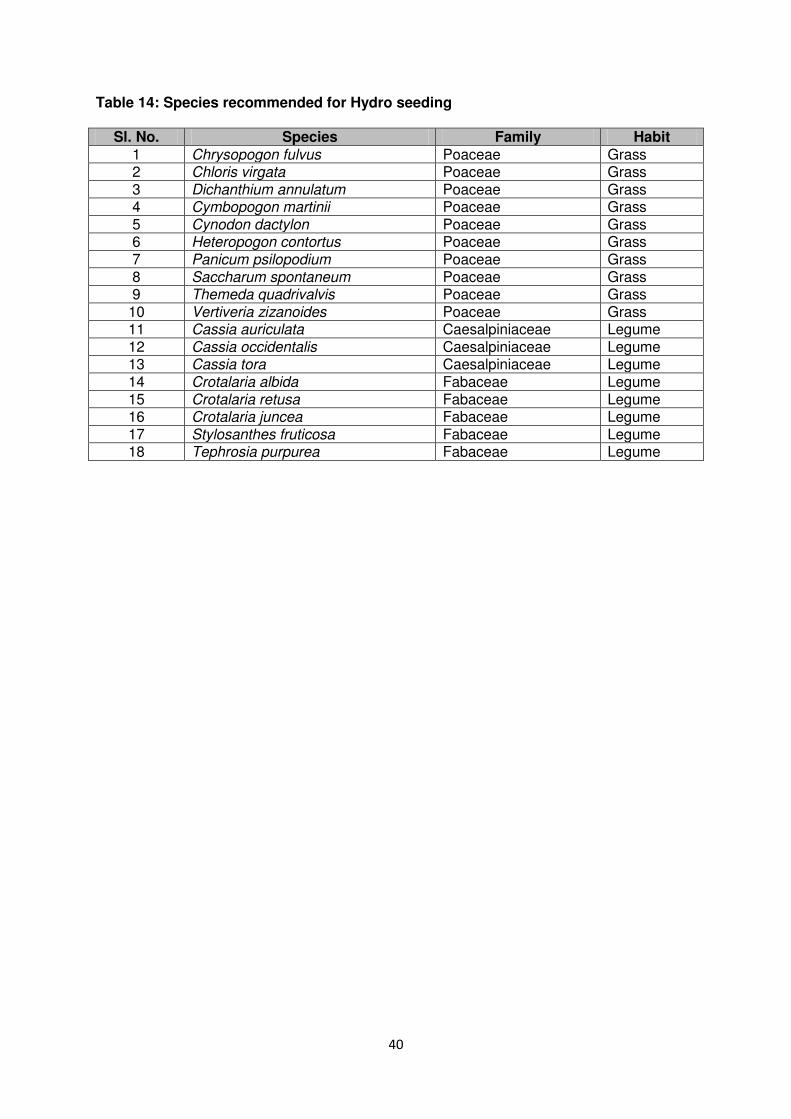
40
Table 14: Species recommended for Hydro seeding
Sl. No. Species Family Habit 1 Chrysopogon fulvus Poaceae Grass
2 Chloris virgata Poaceae Grass
3 Dichanthium annulatum Poaceae Grass
4 Cymbopogon martinii Poaceae Grass
5 Cynodon dactylon Poaceae Grass
6 Heteropogon contortus Poaceae Grass
7 Panicum psilopodium Poaceae Grass
8 Saccharum spontaneum Poaceae Grass
9 Themeda quadrivalvis Poaceae Grass
10 Vertiveria zizanoides Poaceae Grass
11 Cassia auriculata Caesalpiniaceae Legume
12 Cassia occidentalis Caesalpiniaceae Legume
13 Cassia tora Caesalpiniaceae Legume
14 Crotalaria albida Fabaceae Legume
15 Crotalaria retusa Fabaceae Legume
16 Crotalaria juncea Fabaceae Legume
17 Stylosanthes fruticosa Fabaceae Legume
18 Tephrosia purpurea Fabaceae Legume

41
Table 13: An Indicative budget
Sl. No.
Category Items of work Year 1 Year 2 Year 3 Year 4 Year 5 Total
amount in Rs.
(in Lakhs)
1 Biodiversity monitoring
a. Habitat survey of the proposed site 10.00 10.00 05.00 - - 25.00
b. Ecological/Environmental monitoring 03.20 03.20 03.20 03.20 03.20 16.00
c. Monitoring of physicochemical properties of water bodies near site
1.00 1.00 1.00 1.00 1.00 5.00
d. Creation of biodiversity park / herbal garden 50.00 25.00 - - - 75.00
2 Habitat improvement a. Enrichment plantation of suitable species 20.00 20.00 10.00 - - 50.00
b. Raising of plantations in and around villages 40.00 40.00 20.00 - - 100.00
c. Protection work (Fencing of boundaries, fields and villages)
20.00 20.00 20.00 20.00 20.00 100.00
d. Weed/Invasive species eradication works 10.00 10.00 10.00 10.00 10.00 50.00
e. Green belt 20.00 20.00 20.00 20.00 20.00 100.00
3 Catchment area and channel treatment
a. Soil and moisture conservation works 10.00 10.00 10.00 10.00 10.00 50.00
b. Existing watershed development 10.00 10.00 10.00 10.00 10.00 50.00
c. Reclamation of streams 3.00 3.00 3.00 3.00 3.00 15.00
4 Training and awareness
Empowering and sensitizing villagers for protection of wildlife
40.00 20.00 10.00 - - 70.00
5 Compensation Provision for compensation for loss/damage/injury to crop, property, human and livestock
20.00 20.00 20.00 20.00 20.00 100.00
6 Protection a. Fire protection, watch towers 30.00 30.00 15.00 - - 75.00
b. Protection work like CPT, Fencing of boundaries, fields and villages, wherever necessary
30.00 30.00 25.00 18.00 18.00 121.00
c. Patrolling vehicles for wildlife monitoring 30.00 - - - - 30.00
7 Contingency corpus
fund
Corpus fund to remain with concerned DFO Khatgora to meet any contingency and miscellaneous work as approved by concerned authorities
50.00 - 50.00 - - 100.00
Total
397.20 272.20 232.20 115.20 115.20 1132.00

42
REFERENCES
1. Akhtar, N., Bargali, H. S. and Chauhan, N. P. S. 2004. Sloth bear habitat use in disturbed and unprotected areas of Madhya Pradesh, India. Ursus 15: 203-211.
2. Athreya, V., Odden, M., Linnell, J.D.C., and Karanth, U. 2011. Translocation as a tool for mitigating conflict with leopards in human-dominated landscapes of India. . Conservation Biology 25: 133-141.
3. Athreya, V., Odden, M., Linnell, J.D.C., Krishnaswamy, J. and Karanth, U. 2013. Big cats in our backyards: Persistence of large carnivores in a human dominated landscape in India. . Plos-One 8(3): 1-8.
4. Champion H. G. and S. K. Seth. 1968. A Revised Survey of the Forest Types of India. Published by Govt. of India Press.
5. Chauhan, N. P. S., Bargali, H. S. and Akhtar, N. 2003. Ecology and management of problematic
sloth bear in North Bilaspur forest division Madhya Pradesh. Wildlife Institute of India, Dehradun, India.
6. Chauhan, N. S. 2006. The status of sloth bears in India. Understanding Asian bears to secure
their future, pp. 26-34. Japan Bear Network, Ibaraki, Japan.
7. Chhangani, A. K. 2002. Food and feeding of sloth bear (Melursus ursinus) in Aravalli Hills of Rajasthan, India. Tiger Paper 29(2): 1-6.
8. Curtis, J. T. and McIntosh, R. P. (1950) The inter-relations of certain analytical and synthetic
phytosociological character. Ecology 31: 434-455.
9. Curtis, J. T. and McIntosh, R. P. (1951) An upland forest continuum in the Prairie-forest border region of Wisconsin. Ecology 32: 476-496
10. Daniel, J.C. 1999. The Leopard in India: A Natural History. Natraj Publishers, Duhradun, India.
11. Dookia, S., Rawat, M., Jakher, G.R. and Dookia, B.R., 2009. Status of the Indian Gazelle (Gazella bennettii Sykes, 1831) in the Thar Desert of Rajasthan, India. In Faunal Ecology and Conservation of the Great Indian Desert (pp. 193-207).
12. Field Guide for Monitoring Tigers, Co-Predators, Prey and their Habitats (2009). National Tiger Conservation Authority & Wildlife Institute of India.
13. Greig–Smith (1964) Quantitative plant ecology. 2nd Edition Butterworth, London.
14. IUCN (2017), retrieved on 24.01.2018 www.iucnredlist.org
15. Joshi, A. R., Garshelis, D. L. and Smith, L. D. 1995. Home ranges of sloth bears to Nepal:
Implications for conservation. Journal of Wildlife Management 59: 204-214.
16. Joshi, A. R., Smith, J. L. D. and Garshelis, D. L. 1999. Sociobiology of the myrmecophagous sloth beer in Nepal. Canadian Journal of Zoology 77: 1690-1704.
17. Magurran, A. E. (2005) Measuring biological diversity. Oxford, U. K. Blackwell Science.
18. Mishra (1968) Ecology Workbook, Oxford & IBH Co. New Delhi. pp. 244.
43
19. Muller-Dombis and Ellenberg (1974) Aims and methods of vegetation ecology, John Wiley and Sons, New York.
20. Pielou, E. C. (1975) Ecological Diversity, New York: Wiley.
21. Quantum Geographical Information System. Version 1.7.4., www.qgis.com
22. Ramakrishnan, U., Coss, R.G., and Pelkey, N.W. 1999. Tiger decline caused by the reduction of
large ungulate prey: evidence from a study of leopard diets in southern India. Biological Conservation 89: 113-120.
23. Schaller, G. B. (2004). The Deer and The Tiger- A study of wildlife in India, Nataraj Publishers, Dehradun, 312.
24. Shannon, C. E. and Wiener, W. (1963) The mathematical theory of communication. University of
Illinois Press, Urbana, pp 117.
25. Singh, H. S. 2005. Status of the leopard P. p. fusca in India. Cat News 42: 15-17.
26. State of Forest Report (SFR), 2011; Forest Survey of India, Dehradun
27. Working plan of Umaria Forest Division (2010-11 to 2019-2020), Chhattisgarh Forest Department.
28. Yoganand, K., Rice C.G. & Johnsingh A.J.T. (2005). Evaluating Panna National Park with special reference to ecology of Sloth Bear, Wildlife Institute of India, Dehradun.
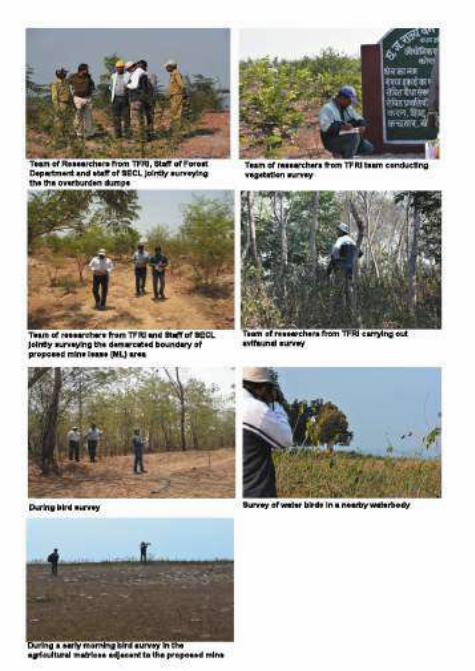

EXPENDITURE INCURRED ON ENVIRONMENT RELATED ACTIVITIES
Categories Activities Expenditure incurred in Rs.
2018-19 2019-20 2020-21
Biological Reclamation Current plantation including plantation of
maintenance period 29049850.00 29862647.00 30961213.00
Technical reclamation OB dump-dozing 235670150.00 218257353.00 226678787.00
Air Pollution
Dust suppression of road (fixed sprinklers,
mobile sprinklers etc.) 29049850.00 29862647.00
10378296.59
Dust suppression of road (mist sprinklers,
CHP, Silo etc.) 6037171.00
Dust suppression of road (Mobile Tankers) 106286297.00 92256161.00 46337800.48
Temporary Wind Barrier Wall at siding 0.00 0.00 200000
Vertical greenery System at railway siding
(5-year work) 0.00 0.00 982892
Water Pollution control ETP (O&M) 628000 898000 160000
Pollution Control in
Township
Sanitation, Cleaning, Garbage Collection &
Disposal, RWH, Horticulture, Water Supply
etc.
23100000 9700000 11800000
Statutory payment Statutory payments 2600000 0 1300000
Forest Payment CA & PCA 10790000 61560000 10790000
Environment
Monitoring
Environment Monitoring Cost 28074014 13940900 19387834
CAAQMS 391500 0 391612.5
GW monitoring (DWFM & DWLM) 0 0 779700
Studies Environment related studies 2601900 750000 1838692
Awareness Environment Awareness 1,00,041.80 65,000.00 8,000.00
R&R Land & compensation 1,79,00,000.00 2,64,00,000.00 3,32,00,000.00
infrastructure 1,96,11,000.00 1,75,22,000.00 1,18,000.00
CD Community Development 1,96,00,000.00 69,00,000.00 1,00,000.00
Grand Total 525452602.80 507974708.00 401449998.57
ANNEXURE-13
1 D:\R.K. Sharma S ir_2019\Consent Letter_Online\2021\CTR_Auto Renewal\DIPKA OPENCAST COAL MINE, SECL, MINING OF COAL - 35 MTPA.docx LRN
CHHATTISGARH ENVIRONMENT CONSERVATION BOARD
Paryavas Bhawan, North Block, Sector - 19, Nava Raipur Atal Nagar, District - Raipur (C.G.)
e-mail - [email protected] � No.10290/TS/CECB/ 2021 Nava Raipur Atal Nagar, Raipur, Dated 23/02/2021 To,
The Chief General Manager M/s Dipka Opencast Coal Mine, South Eastern Coal Fields Limited, Dipka Area, Tehsil-Katghora, District - Korba (C.G)
Sub: - Renewal of the consent of the Board under section 25 of the Water (Prevention and Control of Pollution) Act, 1974 and under section 21 of the Air (Prevention and Control of Pollution) Act, 1981.
Ref: - 1. Consent of the Board issued under section 25 of the Water
(Prevention and Control of Pollution) Act, 1974 vide letter no. 6797/TS/CECB/2018, Raipur dated: 01/03/2018 and under section 21 of the Air (Prevention and Control of Pollution) Act, 1981 vide letter no. 6799/TS/CECB/2018, Raipur dated: 01/03/2018.
2. Last renewal of the Board issued under section 25 of the Water (Prevention and Control of Pollution) Act, 1974 and under section 21 of the Air (Prevention and Control of Pollution) Act, 1981 vide letter no. 7320/TS/CECB/2019 Atal Nagar Raipur, dated: 28/01/2019.
3. Your online application no. 6086344, dated 06/10/2020 and
subsequent correspondence ending dated 05/11/2020.
--:: oo ::--
With reference to your above application, consents under section 25 of the Water (Prevention and Control of Pollution) Act, 1974 and under section 21 of the Air (Prevention and Control of Pollution) Act, 1981 are hereby renewed for the period of 01/03/2021 to 28/02/2022, subject to the fulfillment of the terms and conditions incorporated in the water consent letter no. 6797/TS/CECB/2018, Raipur dated: 01/03/2018 and air consent letter no. 6799/TS/CECB/2018, Raipur dated: 01/03/2018 and subsequent renewal(s)/amendment(s) issued by the Board and additional conditions mentioned below.
This renewal of consent is valid for production capacity of: -
Product Production Capacity
Mining of Coal 35 Million Tonne/Annum (Thirty Five Million Tonne per Annum)
ANNEXURE-14

2 D:\R.K. Sharma S ir_2019\Consent Letter_Online\2021\CTR_Auto Renewal\DIPKA OPENCAST COAL MINE, SECL, MINING OF COAL - 35 MTPA.docx LRN
Additional Conditions
A. Water (Prevention and Control of Pollution) Act, 1974 1. Industry shall operate and maintain effluent treatment system regularly to
meet prescribed standards all the time. No effluent shall be discharged outside of the factory premises in any circumstances; hence zero discharge condition outside the factory promises shall be maintained all the time.
2. Mine management shall complete the work as mentioned in action plan submitted along with bank guarantee vide letter dated 17/02/2018. In case the mine management fails to complete above works in the stipulated time period, the bank guarantee submitted by the mine management may be forfeited.
3. Mine management shall comply with guidelines issued by CPCB for railway siding for pollution control and environmental conservation.
4. Mine Management shall comply the provisions of notification issued by MoEF & CC (as amended up to date) regarding utilization of fly ash in back filling & overburden.
5. Mine Management shall transport the coal in properly covered vehicles to avoid dust emission during transportation and transportation shall be ensured through mechanically covered track from 12.07.2021 (if required).
6. Mine Management shall comply with the provision of Hazardous and Other Wastes (Management and Transboundary Movement) Rules, 2016.
7. All the solid waste industrial and domestic shall be disposed off in environment friendly manner as per rule.
8. All the internal roads shall made pucca. Roads shall be cleaned regularly. Dust, muck and sludge collected from roads shall be disposed properly.
9. Extensive tree plantation shall be carried out in the open areas available within and around the plant premises in during monsoon season. Fruit bearing species like mango, tamarind, guava etc. shall be given preference in this regard.
10. This renewal of consent is being issued under the "Scheme of Auto-
Renewal of Consent" of the Board issued vide office order no. 5937 dated 29/01/2018 as per self certificate submitted by authorized signatory Mr. S.K. Dewangan, General Manager (Mining) of M/s Dipka Opencast Coal Mine, South Eastern Coal Fields Limited, Dipka Area, Tehsil-Katghora, District - Korba (C.G.).
3 D:\R.K. Sharma S ir_2019\Consent Letter_Online\2021\CTR_Auto Renewal\DIPKA OPENCAST COAL MINE, SECL, MINING OF COAL - 35 MTPA.docx LRN
11. Chhattisgarh Environment Conservation Board reserves the rights to revoke the consent / renewal of consent at any time for any violation/non-compliance.
B. Air (Prevention and Control of Pollution) Act, 1981
1. Industry shall operate and maintain the air pollution control equipments properly. Industry shall ensure the emission quality meets the standards prescribed by the Board.
2. Mine management shall complete the work as mentioned in action plan submitted along with bank guarantee vide letter dated 17/02/2018. In case the mine management fails to complete above works in the stipulated time period, the bank guarantee submitted by the mine management may be forfeited.
3. Mine management shall comply with guidelines issued by CPCB for railway siding for pollution control and environmental conservation.
4. Celebration and data validation shall be carried out off all CAAQMS and availability of real time data shall be ensured in CECB server.
5. Ambient air quality within mine area shall be kept within latest prescribed standards.
6. Mine Management shall comply with the provision of Hazardous and Other Wastes (Management and Transboundary Movement) Rules, 2016. All the solid waste industrial and domestic shall be disposed off in environment friendly manner.
7. All the internal roads shall made pucca. Roads shall be cleaned regularly. Dust, muck and sludge collected from roads shall be disposed properly.
8. Mine Management shall comply the provisions of notification issued by MoEF & CC (as amended up to date) regarding utilization of fly ash in back filling & overburden.
9. Mine Management shall transport the coal in properly covered vehicles to avoid dust emission during transportation and transportation shall be ensured through mechanically covered track from 12.07.2021 (if required).
10. Mine Management shall provide necessary pollution control arrangement for
railway siding as per the guideline issued by CPCB for the same.
11. Extensive tree plantation shall be carried out in the open areas available within and around the plant premises in during monsoon season. Fruit bearing species like mango, tamarind, guava etc. shall be given preference in this regard.
12. This renewal of consent is being issued under the "Scheme of Auto-Renewal
of Consent" of the Board issued vide office order no. 5937 dated 29/01/2018
4 D:\R.K. Sharma S ir_2019\Consent Letter_Online\2021\CTR_Auto Renewal\DIPKA OPENCAST COAL MINE, SECL, MINING OF COAL - 35 MTPA.docx LRN
as per self certificate submitted by authorized signatory Mr. S.K. Dewangan, General Manager (Mining) of M/s Dipka Opencast Coal Mine, South Eastern Coal Fields Limited, Dipka Area, Tehsil-Katghora, District - Korba (C.G.).
13. Chhattisgarh Environment Conservation Board reserves the rights to revoke
the consent / renewal of consent at any time for any violation/non-compliance.
Member Secretary Chhattisgarh Environment Conservation Board
Nava Raipur Atal Nagar, Raipur (C.G.)
Endt. No. 10291/TS/CECB/ 2021 Nava Raipur Atal Nagar, Raipur, Dated 23/02/2021 Copy to: - Regional Officer, Regional Office, Chhattisgarh Environment
Conservation Board, Korba (C.G.). Please ensure compliance and report, if any condition/conditions are violated by the industry.
Sd/- Member Secretary
Chhattisgarh Environment Conservation Board Nava Raipur Atal Nagar, Raipur (C.G.)
COPYRIGHT WITH
CMPDI
A MINI RATNA
ISO 9001 COMPANY
Central Mine Planning & Design Institute Limited
Regional Institute – V, CMPDI Complex,
BILASPUR (C.G.)
ENVIRONMENTAL MONITORING REPORT
AIR (HEAVY METALS)
SOUTH EASTERN COALFIELDS LIMITED
(A Mini Ratna Company)
1st
Half Year of 2021
(DIPKA AREA)
ANNEXURE-15
INDEX
Sl.No Name of stations Page no.
DIPKA AREA
Dipka OC
1 Malgaon village 1
2 Near Railway siding 1
3 Near Excv. Workshop 1
4 Pragati Nagar 1
5 Hardi Bazar 1
6 Batari 1
7 Jhabhar 1
8 Ratija 1
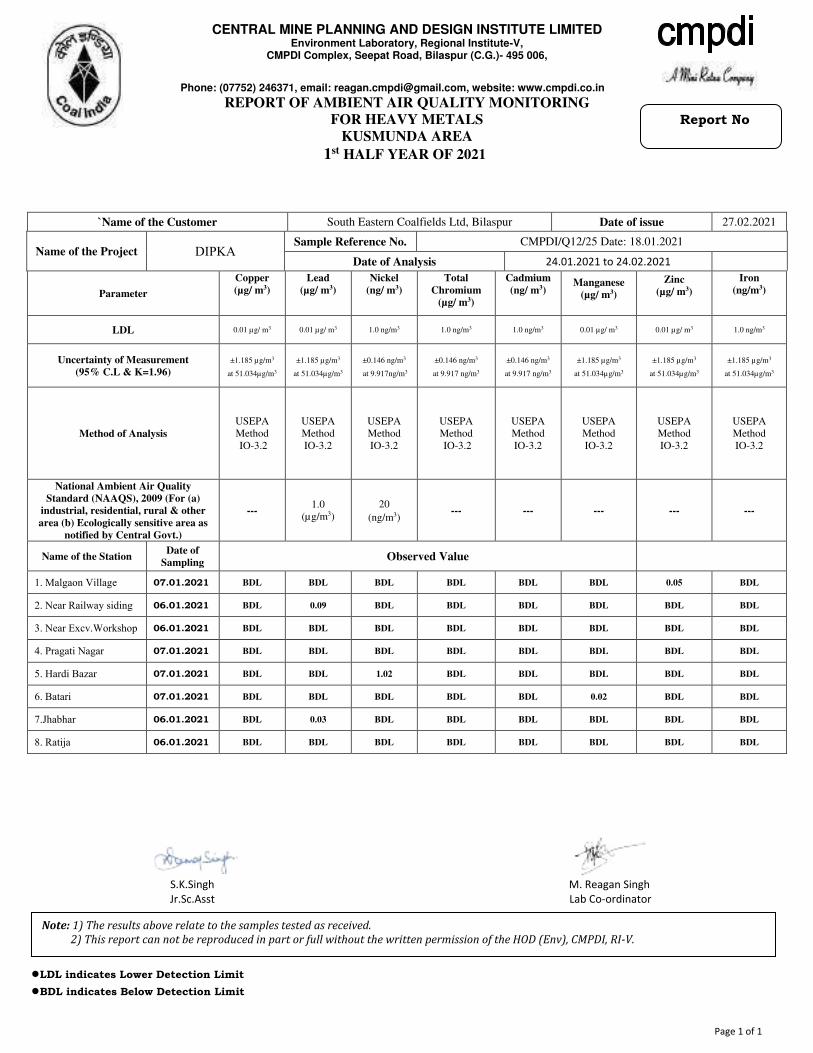
CENTRAL MINE PLANNING AND DESIGN INSTITUTE LIMITED
Environment Laboratory, Regional Institute-V, CMPDI Complex, Seepat Road, Bilaspur (C.G.)- 495 006,
Phone: (07752) 246371, email: [email protected], website: www.cmpdi.co.in
REPORT OF AMBIENT AIR QUALITY MONITORING FOR HEAVY METALS
KUSMUNDA AREA
1st HALF YEAR OF 2021
S.K.Singh M. Reagan Singh
Jr.Sc.Asst Lab Co-ordinator
●LDL indicates Lower Detection Limit
●BDL indicates Below Detection Limit
Page 1 of 1
Report No
Note: 1) The results above relate to the samples tested as received.
2) This report can not be reproduced in part or full without the written permission of the HOD (Env), CMPDI, RI-V.
`Name of the Customer South Eastern Coalfields Ltd, Bilaspur Date of issue 27.02.2021
Name of the Project DIPKA Sample Reference No. CMPDI/Q12/25 Date: 18.01.2021
Date of Analysis 24.01.2021 to 24.02.2021
Parameter
Copper
(µg/ m3)
Lead
(µg/ m3)
Nickel
(ng/ m3)
Total
Chromium
(µg/ m3)
Cadmium
(ng/ m3)
Manganese
(µg/ m3)
Zinc
(µg/ m3)
Iron
(ng/m3)
LDL 0.01 µg/ m3 0.01 µg/ m3 1.0 ng/m3 1.0 ng/m3 1.0 ng/m3 0.01 µg/ m3 0.01 µg/ m3 1.0 ng/m3
Uncertainty of Measurement
(95% C.L & K=1.96)
±1.185 µg/m3
at 51.034µg/m3
±1.185 µg/m3
at 51.034µg/m3
±0.146 ng/m3
at 9.917ng/m3
±0.146 ng/m3
at 9.917 ng/m3
±0.146 ng/m3
at 9.917 ng/m3
±1.185 µg/m3
at 51.034µg/m3
±1.185 µg/m3
at 51.034µg/m3
±1.185 µg/m3
at 51.034µg/m3
Method of Analysis
USEPA
Method
IO-3.2
USEPA
Method
IO-3.2
USEPA
Method
IO-3.2
USEPA
Method
IO-3.2
USEPA
Method
IO-3.2
USEPA
Method
IO-3.2
USEPA
Method
IO-3.2
USEPA
Method
IO-3.2
National Ambient Air Quality
Standard (NAAQS), 2009 (For (a)
industrial, residential, rural & other
area (b) Ecologically sensitive area as
notified by Central Govt.)
--- 1.0
(µg/m3)
20
(ng/m3) --- --- --- --- ---
Name of the Station Date of
Sampling Observed Value
1. Malgaon Village 07.01.2021 BDL BDL BDL BDL BDL BDL 0.05 BDL
2. Near Railway siding 06.01.2021 BDL 0.09 BDL BDL BDL BDL BDL BDL
3. Near Excv.Workshop 06.01.2021 BDL BDL BDL BDL BDL BDL BDL BDL
4. Pragati Nagar 07.01.2021 BDL BDL BDL BDL BDL BDL BDL BDL
5. Hardi Bazar 07.01.2021 BDL BDL 1.02 BDL BDL BDL BDL BDL
6. Batari 07.01.2021 BDL BDL BDL BDL BDL 0.02 BDL BDL
7.Jhabhar 06.01.2021 BDL 0.03 BDL BDL BDL BDL BDL BDL
8. Ratija 06.01.2021 BDL BDL BDL BDL BDL BDL BDL BDL
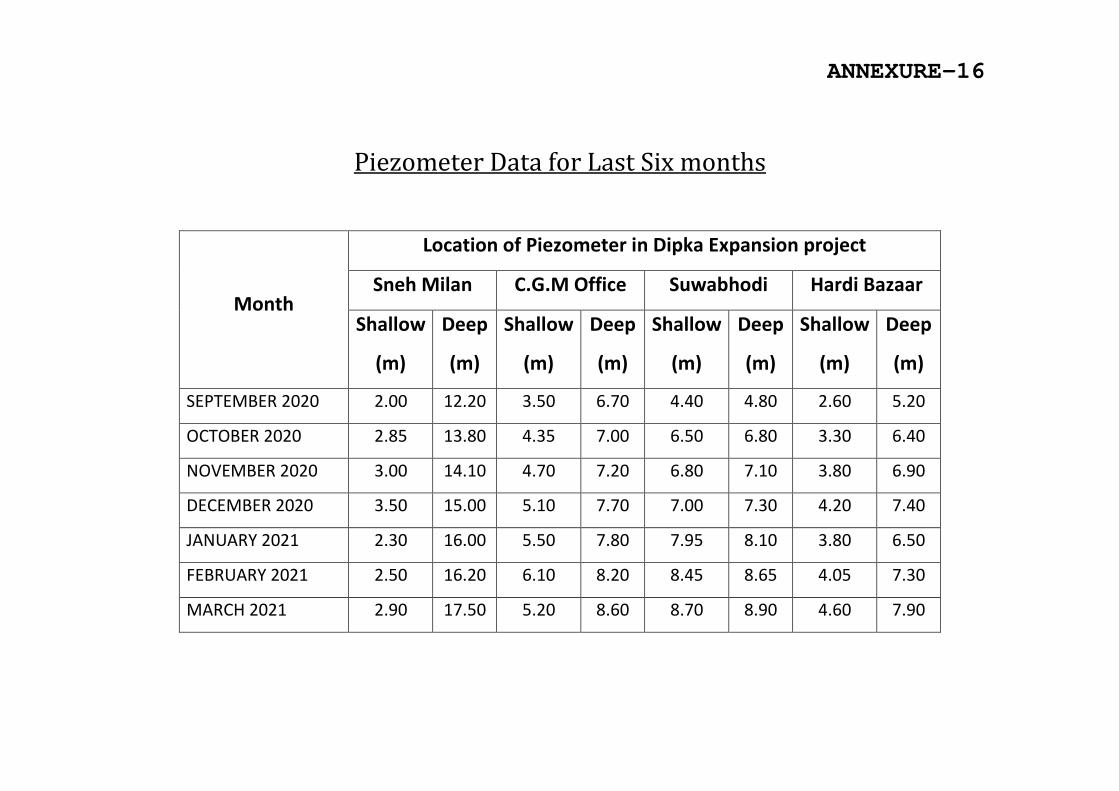
Piezometer Data for Last Six months
Month
Location of Piezometer in Dipka Expansion project
Sneh Milan C.G.M Office Suwabhodi Hardi Bazaar
Shallow
(m)
Deep
(m)
Shallow
(m)
Deep
(m)
Shallow
(m)
Deep
(m)
Shallow
(m)
Deep
(m)
SEPTEMBER 2020 2.00 12.20 3.50 6.70 4.40 4.80 2.60 5.20
OCTOBER 2020 2.85 13.80 4.35 7.00 6.50 6.80 3.30 6.40
NOVEMBER 2020 3.00 14.10 4.70 7.20 6.80 7.10 3.80 6.90
DECEMBER 2020 3.50 15.00 5.10 7.70 7.00 7.30 4.20 7.40
JANUARY 2021 2.30 16.00 5.50 7.80 7.95 8.10 3.80 6.50
FEBRUARY 2021 2.50 16.20 6.10 8.20 8.45 8.65 4.05 7.30
MARCH 2021 2.90 17.50 5.20 8.60 8.70 8.90 4.60 7.90
ANNEXURE-16
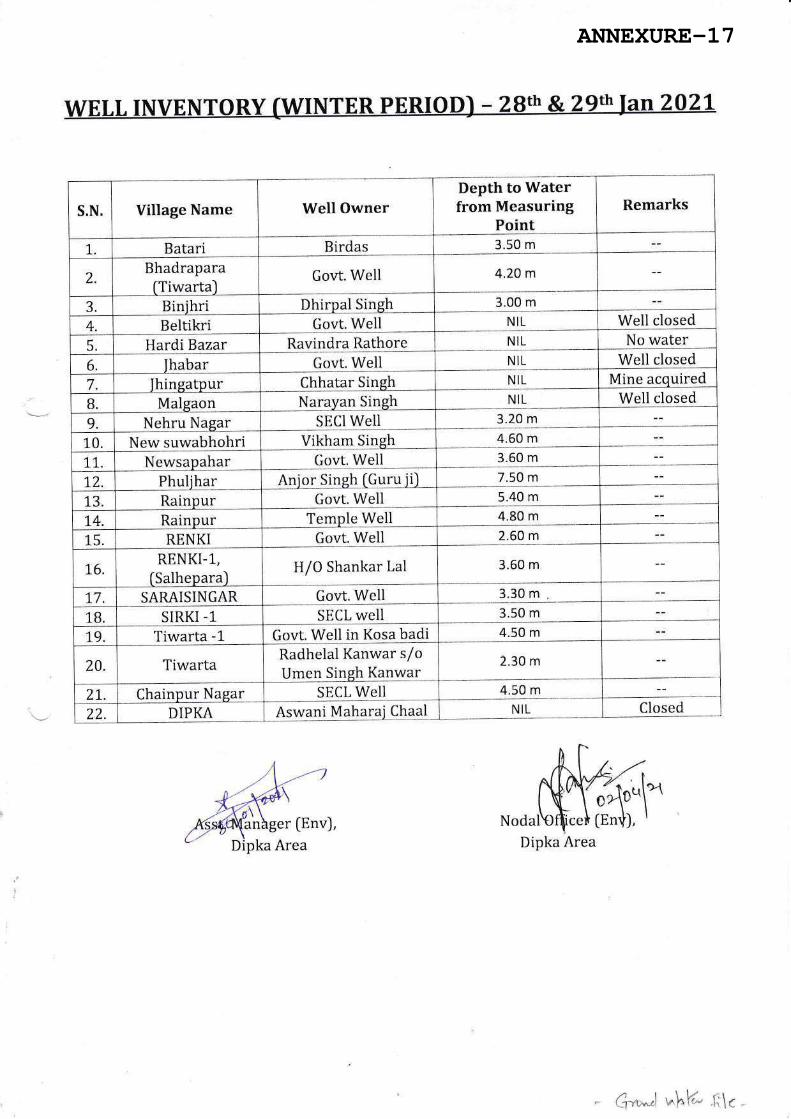
wELL INVENTORY (WINTER PERIOD) - 28ttt & 29ttt Jan 2021
S.N. Village Name Well Owner
Depth to Waterfrom Measuring
PointRemarks
1.. Batari Birdas 3.50 m
2Bhadrapara
ITiwartaJGovt. Well 4.20m
3 Binjhri Dhirpal Singh 3.00 m
4 Beltikri Govt. Well NIL Well closed
5. Hardi Bazar Ravindra Rathore NIL No water
6. Ihabar Govt. Well NIL Well closed
7 Jhingatpur Chhatar Singh NIL Mine acquired
B Narayan Singh NIL Well closed
9 Nehru Nagar SECI Well 3.20 m
10 New suwabhohri Vikham Singh 4.60 m
1L Newsapahar Govt. Well 3.60 m
L2 Phulihar Anior Singh fGuru jiJ 7.50 m
13 Rainpur Govt. Well 5.40 m
L4. Rainpur Templc Well 4.80 m
15 RENKI Govt. Well 2.60 m
L6RENKI-1,
ISalheparaJH/O Shankar Lal 3.60 m
17 SARAISINGAR Govt. Well 3.30 m
18. SIRKI -1 SECL well 3.50 m
L9 Tiwarta -1 Govt. Well in Kosa badi 4.50 m
20. TiwartaRadhelal Kanwar s/o
Umen Kanwar2.30 m
21. Chainpur Nagar SECL Well 4.50 m
22 DIPKA Aswani Maharaj Chqql NIL Closed
[Env), No
0 Oq\"
[En
pka Area Dipka Area
i
- G*J "hl* .f;\c."
Malgaon
ANNEXURE-17
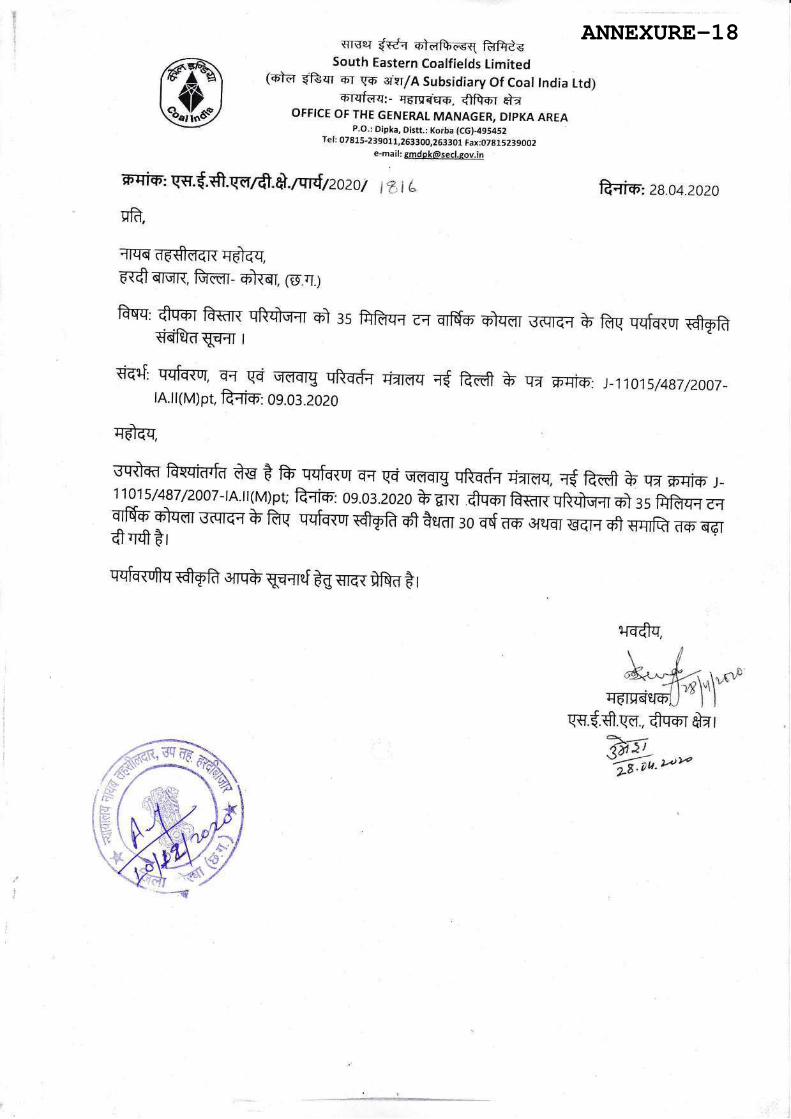
srser {sdc 6fficq fuHeSouth Eastern Coalfields Limited
(ola qRqr sr \16 diw/ASubsidiary Of Coal tndia ttd)o-rqfilq;- rrtmq"qo.. *fro-r *,
OFFICE OF THE GENERAL MANAGER, DIPKA AREAp.O.: Dipka, Dhtt.: Koiba (CG)495452
rel:0781s-z3eo11,z!33:o.,2^63391Faf 7s:15z3soo2
trqiv: qv.€.qft.qm/fi. d.rqff{tzazot tzt L ftqiE, 2l.o4.zozo
sfr,
qrrq d-f,$-f,{R q-e{q
EtdErqR, fr-frT- +t{fl, (-s.q.)
frsq: AqsT frffiR qfIfrqqT o1 :s Eftqr e{ Erffi-r ElTsr c-srE;i } ftq qqfu-{ur rfi-Sfr$dl$aqu-+ I
vq{: qqfr{q, T{ \fti qo-flg qfudifu rizrdq r{ ffi }-q* F-qio: )_1101s/4nl/zoo7_tA.r I (M)pt Fqi6-: os.o3.2o2o
qfr(q,
BTtffi Bqqirrrld ds e fr qqfT{q s{ q?i qcflg qMr rirrerdr, T{ fuffi }.q{ drqim.r_1 1 0 1 s / 487 / 2007 - t A. il (M) pc F{im-: os.o3.zozo &' Amr .*q-ol frwR qffiil ol r s frfu-q e-{qlNE- elTdT udlrE;r fu frq q-qfq-{ur ffi ot auil 30 q{ ilf, oiurfl tr{H
"t *",m ils-qdifrffitr
qqffiq ffi srqb E+Tnf BE Hil ifuo B r
rt{fiq,
q-s.trfr.W., frqfilA-dtA--.=:?fi'el-*;{'iu'wwsqE
*..-{
.t!'
i
l
I
l
\i'4+---f-< t,.r."
ilr!'1-\ l"qdiq6iu6, l" 1 l
ANNEXURE-18
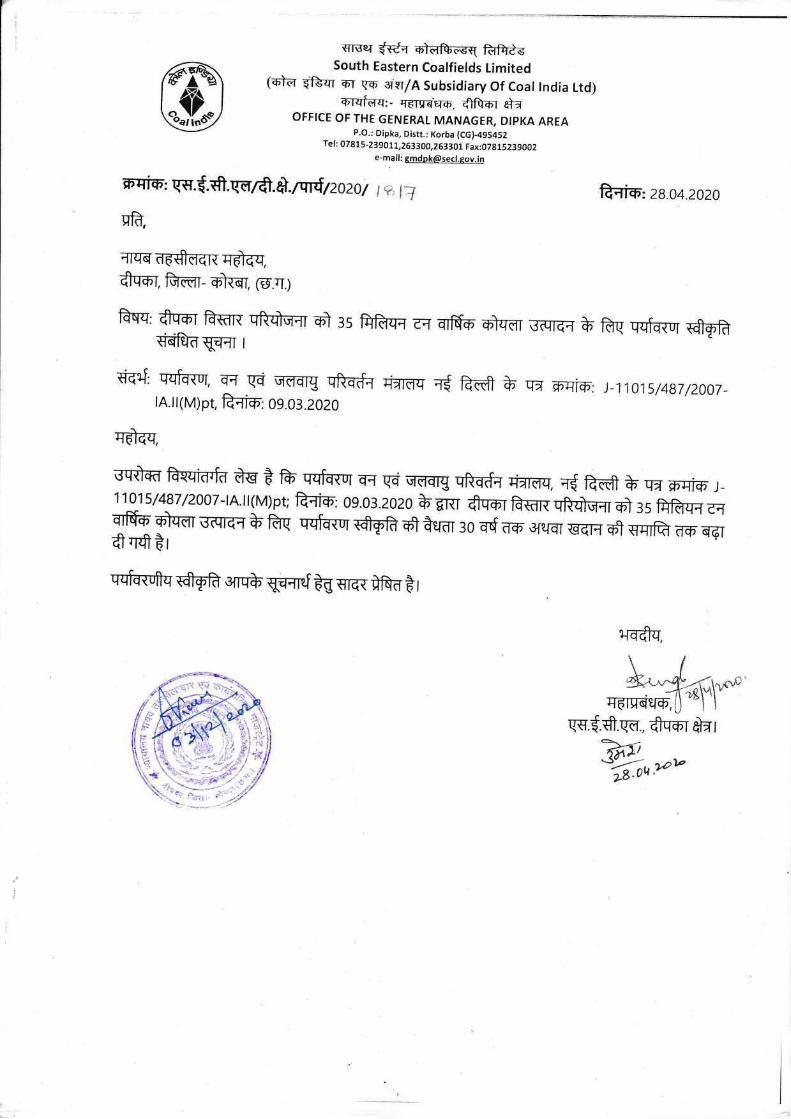
t
srse{ *Cq 6h{fu-,6q fuffisSouth Eastern Coalfields Limited
fottl Vkqr ir'r \rm uv/A Subsidiary Of Coal tndia Ltd)srrqlf,q:- q-6:rqq'q-fi. *fu6r *J
OFFICE OF THE GENERAL MANAGER, DIPKA AREAp.O.: Dipka, Distt.: (orba (CC)-495452
re t : ozers -2 3 s 01 1,2!33!0.,2-633 0. 1 Fax-:o t a Ls z3s a 02
ffiqiqt' gs.{.*.\'dl4" d.rqir{nozo t t * tV frqiq': zl.o4.2ozo
sfr,
qrrq d-6*f,qj{ q*{q,frTs-r, BIET- otaqr, Cs'.rt.)
Eyq: fuf,{ B{dR qffiqqr o1 :s Efrqq e{ qrFh eiqmT rdlrfi } frq qqfq-iur ffiriGilfdg+{r r
S-d{: qq|q{ur, T{ qri qcr-qlg qftTdq qffiq ri ffi }.qa o-siE-: J_1101 s/487/2007_tA.t I (M)pt, frqim': 09.03.2020
q+{q,
Br0-ffi E{qi-arrfu ds t fu qqfq{q T{ \fti q6qrg qffiq riarercr, a$ ffi }.q* Fqio-J_1 1 01 s / 487 /2007-lA' l l (M) pt fr{im: os.o3.zozo } gnr frq-*-r BFrR qffiil oJ : s frRrq e{EINE- Elqdr sf,trq;i e ftq qqfq-{ur ffi e1 AstET 30 E{ Ts- oflrfl *" A sqTR ils-E-drfrqfrBr
qqfqurtq ffi o{Tqb WrTef fu srEq ifra t r
ErdMderfr-,
ll{&q,
q-s.{.S.qd, dq-or dzr
Hti"'{su ?o*&tr:-
:
i
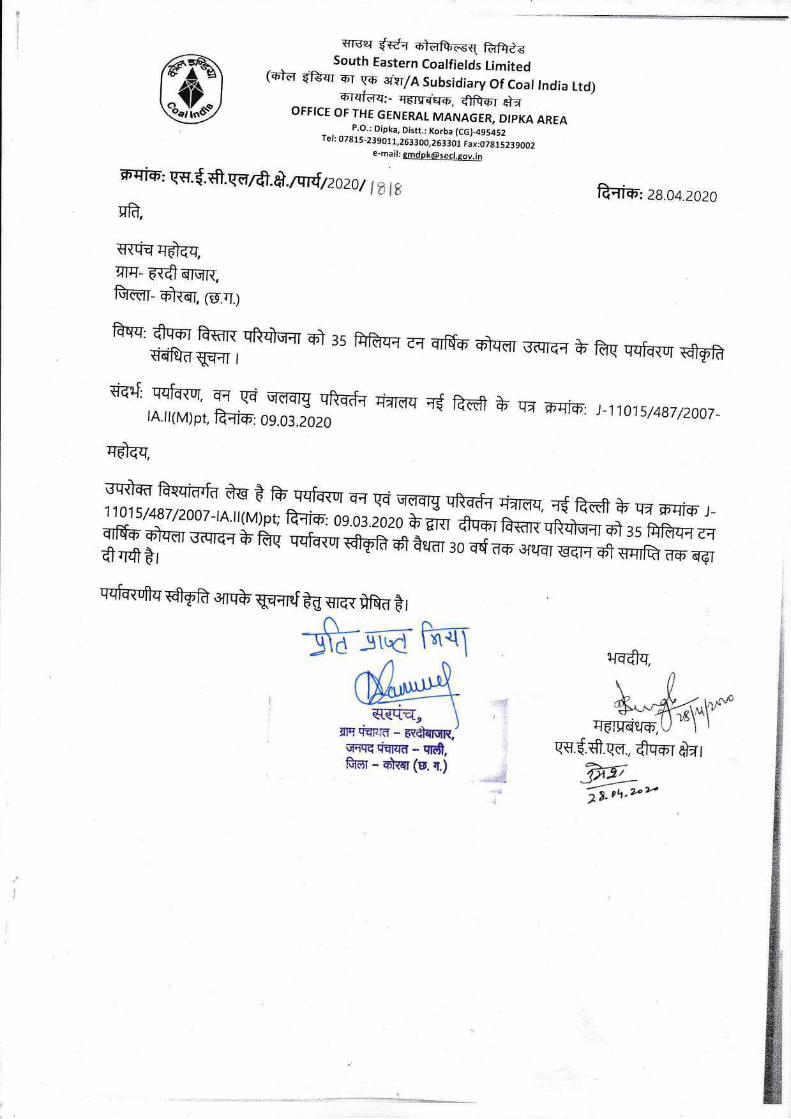
qrser i\Cn 6tafr_6s fdmsSouth Eastern Coalfields Limited
toJ*e $R-m irr r'n qyr/A Subsidiary Oiirrilndia rtd)orqfcq:- rrrrc_Eq6. flfuol +{
OFFICE OF THE GENERAT MANAGER, DIPKA AREA_ . -_^r.9.,
Dipka, Distt.: Korba (CG)_495452r er: 07815-23901r,zsesoo,zot:oi
F;xtol Btsz3goozil: [email protected],in
*'mH,qtuf.qo, oJ :s ?q EIffi6-ol..dT tsEl"o b ftq qqfd-{q ffiva{: qqlq{u,' u, gq qmflg qMq qiT-dq T$ ffi }' q-* drqi' )-1101s/487/2007-tA.ll(M)pt, m*-: og.o3.2O2O
T+{q,
tsrf0-ffi B{{iilrfu At{ e fu qqhtrr r{ qJZi tr--dsrg qffiq Eiil-f,q, T{ fuffi &.qa q;qio.",_1 1 0 1 s / 487 / 200 7 - rA. r r (M) pu ftqift-: os.o:l azo e ET{T dr* RRrt qftffi
'oJ
: s frhq{ zq
ffi ry o-nr,, b ftq r.frd -fufr *t a* ro ut o, o* #'a **6 E-*- qdr
qqffiq ffi qqar qqqrf Bg sTe{ }B-d Br
5a-ftH1
sfr,
qriiq q+{q,
,IIT- 6{frqTqK,e-ffir- et{qr, [s.q.)
d
ft,rio', zl"o4.2o2o
s-f,iqdeffr-,
HT*q,
flcqqFn - R*d[qR,q-q'qq qqrqa - qrd,
&-dr - frt{fl (u.q.)
qq.trft.q-f,., *qqrr &br4*<-Q)l2/
7fr';7'--.4,i
i
:
i:l srsel *Cn 6ffi1sq filffis
South Eastern Coalfields Limited(ola E'R'qr iD=r \riD' cryr/A Subsidiary of Coat tndia Ltd)
or{rf-cq:- q6xeq-fltr. qtfuor *,OFFICE OF THE GENERAL MANAGE& DIPKA AREA
P.O.: Dipka, Distt.: Xorba (CG)-495452Tel: O7815-23901 L,Z633si,263gOt Faxt1t BlS23gOO?
e-mail: r{[email protected]
r$iv': $T.t Tfr.qorfi. &.rqr6tzoz0/ I b t ssh,
ad$il-{Rq*{q,E-dfr{t, fuiur- +t{qr, Cs.{.)
ffiE: zl.o4.zozo
Eqq: dIrf,r fr€rR qft$-s{r o1 :s EfrT{ ra qrFfo. o.tqm tsErtrr b ftq qqfilq ffiritilfd{fir r
tiEd: ssfqtut, T{ qii qE-drg qHr Hilcq d ffi &- qa trqio- J-1101s/487/z0ot-lA.il(M)pt, fu6: OI.O3.ZOZO
Til{q,
ur0-ff lMd As B fu qqf*q ffi \rri q-f,qrg qMr rirrf,q, T{ ffi }.q* Frriq, J_1 1 0 1 s / 487 / 2007 - l A. l l (M) pt fr{iE: os.a3.zozo &. am ilqf,r ksrq qR*qil o1 r s ftfrzrq .o@" q* sflrtrT & frq qqiq-{ur ffi frt aE-dr ,ru{* B{,r-qT silq a *"rm dcF-q6rd rnft tr
qffiffiflRqrqbqq-rTd
1{-ddq,
l.l.
-:rqdr-trdr{-f,,
q-s.€.rfr.q-d., dtqm-r *d r
7t?T*^.r6Y
i
Ar"1c
I

’⁄U¬Ê‹Ë @ loksadan.com
∑§Ù⁄UÙŸÊflÊÿ⁄U‚ ◊„Ê◊Ê⁄UË ∑‘§ ∑§Ê⁄UáÊ ß‚‚Ê‹ wv ¡ÍŸ ∑§Ù ¿∆Ê •¥Ã⁄U⁄UÊC˝Ëÿ ÿÙª ÁŒfl‚∑§Ê »§Ù∑§‚ ÉÊ⁄U ¬⁄U ⁄U„∑§⁄U ¬Á⁄UflÊ⁄U ∑‘§ ‚ÊÕÿÙª ∑§⁄UŸ ¬⁄U „Ò– ¬˝œÊŸ◊¥òÊË Ÿ⁄U¥Œ˝ ◊ÙŒË ŸÿÙª ÁŒfl‚ ∑§Ù ‹∑§⁄U ∞∑§ ߸fl¥≈U ‹ÊÚãø Á∑§ÿÊ„Ò– ß‚∑§Ê ŸÊ◊ “◊Ê߸ ‹Êß»§ ◊Ê߸ ÿ٪ʔ „Ò–ß‚ ‚Ê‹ •¥Ã⁄U⁄UÊC˝Ëÿ ÿÙª ÁŒfl‚ ∑§Ë ÕË◊“ÉÊ⁄U ¬⁄U ÿÙªÊ •ı⁄U ¬Á⁄UflÊ⁄U ∑‘§ ‚ÊÕ ÿ٪ʔ∑§⁄UŸÊ „Ò– ∑§Ù⁄UÙŸÊflÊÿ⁄U‚ ◊„Ê◊Ê⁄UË ∑‘§ ø‹Ã‹ÙªÙ¥ ‚ ÉÊ⁄U ¬⁄U „Ë ÿÙª ÁŒfl‚ ◊ŸÊŸ ∑§Ë•¬Ë‹ ∑§Ë ¡Ê ⁄U„Ë „Ò– ß‚ fl¡„ ‚ ◊Ê߸‹Êß»§ ◊Ê߸ ÿÙªÊ ∑§Êÿ¸R§◊ ∑§Ù ‡ÊÈM§ Á∑§ÿʪÿÊ „Ò, ÃÊÁ∑§ ‹ÙªÙ¥ ∑§Ù •¬Ÿ ¬Á⁄UflÊ⁄U ∑‘§‚ÊÕ ÿÙª ∑§⁄UŸ ∑‘§ Á‹∞ ¬Á⁄Uà Á∑§ÿÊ ¡Ê‚∑‘§– •≈U‹ Á’„Ê⁄UË flÊ¡¬ÿË ÁflEÁfllÊ‹ÿÁ’‹Ê‚¬È⁄U ‚ ‚ê’h ‡ÊÊ‚∑§Ëÿ ◊„ÊÁfllÊ‹ÿ’⁄U¬Ê‹Ë ◊¥ ÿ„ ÿÙª ÁŒfl‚ Á«Á¡≈U‹Ë ◊ŸÊÿÊ¡ÊÿªÊ– ¡Í◊ ∞å¬ ∑‘§ mÊ⁄UÊ ◊„ÊÁfllÊ‹ÿS≈UÊÚ»§ ∞fl¥ ¿ÊòÊ-¿ÊòÊÊ∞¥ •¬Ÿ ÉÊ⁄U ◊¥ „Ë⁄U„∑§⁄U ÿÙª ∑§⁄U¥ªË– ‚¥SÕÊ ∑‘§ ¬˝ÊøÊÿ¸ «ÊÚ⁄U¥¡ŸÊ ŸÊÕ ¡Í◊ ∞å¬ ∑§Ù „ÙS≈U ∑§⁄U¥ªË– ⁄UÊC˝Ëÿ‚flÊ ÿÙ¡ŸÊ ∑‘§ ∑§Êÿ¸R§◊ •Áœ∑§Ê⁄UË «ÊÚÁ‡ÊflŒÿÊ‹ ¬≈U‹ ¡Ù ÿÙªÊøÊÿ¸ „Ò •ı⁄U
‡ÊÊ‚∑§Ëÿ ÿÙª ¬˝Á‡ÊˇÊáÊ ◊„ÊÁfllÊ‹ÿ ÷٬ʋ‚ ÿÙª ¬˝Á‡ÊÁˇÊà „Ò¥, •ÊÿÈflŒ, ÿÙª ∞fl¥¬˝Ê∑§ÎÁÃ∑§ ÁøÁ∑§à‚Ê, ÿÍŸÊŸË, Á‚h ∞fl¥„ÙêÿÙ¬ÒÕË •ÊÿÈ· ◊¥òÊÊ‹ÿ mÊ⁄UÊ ÁŸœÊ¸Á⁄Uà ÿÙª¬Ò∑‘§¡ ∑§Ê •èÿÊ‚ ¬˝Ê× {:yz ’¡ ‚ |:xÆ’¡ Ã∑§ yz Á◊Ÿ≈U ∑§⁄UÊÿ¥ª– ß‚ ¬Ò∑‘§¡ ◊¥¬˝ÊÕ¸ŸÊ, ‚Í ◊ √ÿÊÿÊ◊, π«∏ „Ù∑§⁄U Á∑§ÿ ¡ÊŸflÊ‹ ¬Ê°ø •Ê‚Ÿ ÃÊ«∏Ê‚Ÿ, flÎ ÊÊ‚Ÿ, ¬ÊŒ„SÃÊ‚Ÿ, •œ¸ øR§Ê‚Ÿ, ÁòÊ∑§ÙáÊÊ‚Ÿ ’Ò∆∑§⁄UÁ∑§ÿ ¡ÊŸ flÊ‹ ¿„ •Ê‚Ÿ ÷Œ˝Ê‚Ÿ,fl¡˝Ê‚Ÿ, ©C˝Ê‚Ÿ, ‡Ê‡ÊÊ¥∑§Ê‚Ÿ,©ûÊÊŸ ◊¥«Í∑§Ê‚Ÿ, flR§Ê‚Ÿ ¬≈U ∑‘§’‹ ‹≈U∑§⁄U Á∑§ÿ ¡ÊŸ flÊ‹ ÃËŸ•Ê‚Ÿ ◊∑§⁄UÊ‚Ÿ, ÷È¡¥ªÊ‚Ÿ,‡Ê‹÷Ê‚Ÿ, ¬Ë∆ ∑‘§ ’‹ ‹≈U∑§⁄UÁ∑§ÿ ¡ÊŸ flÊ‹ ¬Ê°ø •Ê‚Ÿ‚ÃÈ’°œÊ‚Ÿ, ©ûÊÊŸ¬ÊŒÊ‚Ÿ,•œ¸„‹Ê‚Ÿ, ¬flŸ ◊ÈQ§Ê‚Ÿ,‡ÊflÊ‚Ÿ, ∑§¬Ê‹÷ÊÁÃ,ŸÊ«∏ˇÊÙœŸ, ‡ÊËËË, ÷˝Ê◊⁄Uˬ˝ÊáÊÊÿÊ◊, äÿÊŸ, ◊Á«≈U‡ÊŸ,‚¥∑§À¬ •ı⁄U ‡ÊÊ¥Áà ¬Ê∆ ‡ÊÊÁ◊‹„Ò– ‚¥SÕÊ ∑‘§ ¬˝ÊøÊÿ¸ Ÿ ¿ÊòÊ-¿ÊòÊÊ•Ù¥ ∑§Ù •Áœ∑§ÊÁœ∑§ ‚¥ÅÿÊ◊¥ ‡ÊÊÁ◊‹ „ÙŸ ∑§Ë •¬Ë‹ ∑§Ë „Ò–
‹Ê∑§‚ŒŸ ·¤æðÚUÕæU ·¤æðÚUÕæ, »éM¤ßæÚU v} ÁêÙ w®w®
SflàflÊÁäÊ∑§Ê⁄UË, ◊ÈŒ˝∑§ ∞fl¥ ¬˝∑§Ê‡Ê∑§ •Á◊à •ª˝flÊ‹ mUÊ⁄UÊ M§Œ˝ÊˇÊ Á¬˝¥≈U‚¸, vzy, ߥUÁŒ⁄UÊ ∑§Ê◊Á‡Ê¸ÿ‹ ∑§Êêå‹Ä‚ ≈UË.¬Ë.Ÿª⁄U ∑§Ê⁄U’Ê (¿U.ª.) ‚ ◊ÈÁŒ˝Ã ∞fl¥ ¬˝∑§ÊÁ‡ÊÖ «UÊ∑§ ¬¥¡ËÿŸ ∑˝§◊Ê¥∑§ — ¡Ë.w-vvw/‚Ë.¡Ë./’Ë.∞‹.¬Ë./Æ|w/wÆv~-wÆwv‚¥¬ÊŒ∑§ - Á‡Êfl‡Ê¥∑§⁄U •ª˝flÊ‹, ∑§Êÿ¸∑§Ê⁄UË ‚¥¬ÊŒ∑§-‚È⁄‘U‡Êø¥Œ˝ ⁄UÊ„U⁄UÊ– ŒÍ⁄U÷Ê· - Æ||z~-wy{wxv, ◊Ê.Ÿ¥. — ~{{~y{ÆÆÆÆ, ~|zzzzÆÆÆÆ (•Ê⁄U.∞Ÿ.•Ê߸U. ⁄UÁ¡.∑˝§. CHHHIN/2010/33639)
www.loksadan.com
8
âæª¤Í §üUSÅUÙü ·¤æðÜȤèËÇU÷â çÜç×ÅðUÇUÒÒ ×Ùè ÚU% ·¤÷ÂÙè ÓÓ
(·¤æðÜ §´UçÇUØæ çÜç×ÅðUÇU ·¤æ ©U·ý¤×)
G-25718/1
Ûæ×æÛæ× ÕæçÚUàæ Ùð ׿æ§üU ÌÕæãUè∑§Ê⁄U’Ê @ loksadan.com
◊¥ª‹flÊ⁄U ∑§Ë ⁄UÊà „È߸ á ’ÊÁ⁄U‡Ê Ÿ¡Ÿ¡ËflŸ •SÃ√ÿSà ∑§⁄U ÁŒÿÊ– ‹ª÷ªx ÉÊ¥≈U „È߸ ◊Í‚‹ÊœÊ⁄U ’ÊÁ⁄U‡Ê ‚ ÁŸø‹Ë’ÁSÃÿÙ¥ ∑‘§ ◊∑§ÊŸÙ¥ ◊¥ ¬ÊŸË ÷⁄U ªÿÊ–fl„Ë¥ ‡Ê„⁄U ∑§Ë ¬Êfl⁄U „Ê߸≈U˜‚ ∑§Ê‹ÙŸË ÷Ë‹’Ê‹’ ⁄U„Ë– ß‚∑‘§ •‹ÊflÊ ◊È«∏ʬÊ⁄UÃÊ‹Ê’ ◊¥ ÁŸ◊ʸáÊ ∑§Êÿ¸ ◊¥ ‹ª ÷Ê⁄UËflÊ„Ÿ ‚Á„à fl∑§¸‡ÊÊÚ¬ ∑‘§ ∑§ß¸ flÊ„Ÿ «Í’ª∞– •ãÿ ß‹Ê∑§Ù¥ ◊¥ ÷Ë ’ÊÁ⁄U‡Ê ∑‘§∑§Ê⁄UáÊ ¡‹ ÁŸ∑§Ê‚Ë ◊¥ ¬⁄U‡ÊÊŸË ’ŸË⁄U„Ë–
◊¥ª‹flÊ⁄U ∑§Ë ⁄UÊÁòÊ ‹ª÷ª ~.xÆ ’¡‡ÊÈM§ „È߸ á ’ÊÁ⁄U‡Ê ⁄UÊà vw ’¡ ∑‘§ ’ÊŒ ÷Ë„ÙÃË ⁄U„Ë– ’ÊÁ⁄U‡Ê ßÃŸË Ã¡ ÕË Á∑§ ‡Ê„⁄U ∑‘§‹ª÷ª ‚÷Ë ◊ʪ¸ ¡‹◊ÇŸ „Ù ª∞– fl„Ë¥
’ÈœflÊ⁄UË ÁSÕà ¬Êfl⁄U „Êß≈U˜‚ ∑§Ê‹ÙŸË ◊¥‹ÙªÙ¥ ∑§Ù ÷Ê⁄UË ¬⁄U‡ÊÊŸË „È߸– ∑§Ê‹ÙŸË ◊¥‹ª÷ª z ‚ { »§Ë≈U Ã∑§ ¬ÊŸË ÷⁄UÊ ⁄U„Ê–∑§Ê‹ÙŸË ◊¥ π«∏Ë ªÊÁ«∏ÿÊ¥ «Í’ ªß¸– ∑§Ê‹ÙŸË∑‘§ ÃËŸÙ¥ é‹Ê∑§ ◊¥ ‹ª÷ª v{ ÉÊ⁄UÙ¥ ◊¥ ¬ÊŸËÉÊÈ‚ ªÿÊ– ÿ„Ê¥ ⁄U„Ÿ flÊ‹ ‹ÙªÙ¥ Ÿ ™§¬⁄UË Ã‹◊¥ ‡Ê⁄UáÊ ‹Ë– ß‚∑‘§ •‹ÊflÊ ≈UË¬Ë Ÿª⁄U ‚‹∑§⁄U ∑§Ù‚Ê’Ê«∏Ë øı∑§ fl ⁄UÊ◊¬È⁄U •Ê߸≈UË•Ê߸øı∑§ Ã∑§ ∑§Ë ‚«∏∑§ ◊¥ ¬ÊŸË ÷⁄UÊ ⁄U„Ê– ¬ÊŸËÁŸ∑§Ê‚Ë ∑§Ë √ÿflSÕÊ ŒÈM§Sà Ÿ„Ë¥ „ÙŸ ‚‹ÙªÙ¥ ∑§Ù •Áœ∑§ ¬⁄U‡ÊÊŸË „È߸– fl„Ë¥ ‡Ê„⁄U ∑‘§‚ÊÕ-‚ÊÕ ª˝Ê◊ËáÊ fl ©¬Ÿª⁄UËÿ ß‹Ê∑§Ù¥ ◊¥÷Ë ÷Ê⁄UË ’ÊÁ⁄U‡Ê ‚ ¡Ÿ¡ËflŸ ¬⁄U √ÿʬ∑§•‚⁄U ¬«∏Ê „Ò–
ÅêUÅðU ×·¤æÙ ‚ËÃÊ◊áÊË ß‹Ê∑‘§ ∑‘§ ŸÊ‹Ê ∑§Ë ‚»§Ê߸
Á¬¿‹ ∑§ß¸ fl·Ù¥¸ ‚ Ÿ„Ë¥ „È߸ „Ò, Á¡‚ ‹∑§⁄U’ÊÁ⁄U‡Ê ∑‘§ ∑§Ê⁄UáÊ ˇÊòÊ ∑‘§ x ◊∑§ÊŸ ¡‹÷⁄UÊfl„ÙŸ ‚ ˇÊÁê˝Sà „Ù ª∞– ß‚∑‘§ •‹ÊflÊ‚ËÃÊ◊áÊË flÒcáÊÙ Œ⁄U’Ê⁄U ◊¥ÁŒ⁄U ◊¥ ÷Ë ¬ÊŸË ÷⁄UªÿÊ– ˇÊòÊ ∑‘§ ÉÊ⁄UÙ¥ ◊¥ ÃÙ •ı⁄U ÷Ë ’È⁄UÊ „Ê‹⁄U„Ê–
Âýðâ ·¤æ÷ŒÜð�â ×ð´ ÖÚUæ ÂæÙè≈UË¬Ë Ÿª⁄U ÁSÕà ¬‚ ∑§ÊꬋÄU‚ ◊¥ ÷Ë
¬ÊŸË ÷⁄UÊ ⁄U„Ê ∑§È¿ •π’Ê⁄U ∑‘§ ŒçUÃ⁄U ∑‘§ •¥Œ⁄UÃ∑§ ¬ÊŸË ÷⁄UÊ ªÿÊ ÕÊ ÁŸª◊ ∑‘§ ¡ÙŸ ¬˝÷Ê⁄UËŸ ÃÙ »§ÙŸ ©∆ÊŸÊ „Ë ¡M§⁄UË Ÿ„Ë ‚◊¤ÊÊ •ı⁄UÃÙ •ı⁄U ∑§È¿ ‚◊ÿ ’ÊŒ ◊Ù’Ê߸‹ ’¥Œ „Ë ∑§⁄UÁŒÿÊ– ’ÊŒ ◊¥ ◊„ʬÊÒ⁄U Ÿ ¬‚ ¬Á⁄U‚⁄U ∑§Ë ‚ÈäÊ‹Ë– ‹Á∑§Ÿ ÉÊ¥≈UÊ ’Ëà ¡ÊŸ ∑‘§ ’ÊŒ ÷Ë ∑§Ù߸•Áœ∑§Ê⁄UË ÿÊ ∑§◊¸øÊ⁄UË ŒπŸ Ã∑§ Ÿ„Ë ¬¥„Èø–ª¡’ ∑§Ê •Ê‹◊ ŒπŸ ∑§Ê Á◊‹Ê ÁŸª◊ ∑§Ê–
¥´ŠæðÚÔU ×ð ÇêUÕæ ÚUãUæ çÁÜæU
á ’ÊÁ⁄U‡Ê ∑‘§ ∑§Ê⁄UáÊ Á¡‹ ÷⁄U ◊¥‹ª÷ª x ‚ y ÉÊ¥≈U Ã∑§ Á’¡‹Ë ªÈ‹ ⁄U„Ë–∑§ß¸ ß‹Ê∑§Ù¥ ◊¥ ⁄UÊà v-w ’¡ ∑‘§ ’ÊŒ ÁfllÈÕʬÍÁø ’„Ê‹ „Ù ‚∑§Ë– fl„Ë¥ ‡Ê„⁄U ∑‘§ ∑§ß¸ß‹Ê∑‘§ ∞‚ Õ ¡„Ê¥ ‚È’„ vv ’¡ Ã∑§ ÷ËÁfllÈà √ÿflSÕÊ ’ÊÁœÃ ÕË– ©¬ Ÿª⁄UËÿ flª˝Ê◊ËáÊ ß‹Ê∑§Ù¥ ◊¥ ÷Ë ⁄UÊà ‚ ªÈ‹ ⁄U„ËÁ’¡‹Ë •’ Ã∑§ ’„Ê‹ Ÿ„Ë¥ ∑§Ë ¡Ê ‚∑§Ë „ÒÁ¡‚‚ ‹ÙªÙ¥ ∑§Ù ¬ÿ¡‹ ∑‘§ Á‹∞ ∞∑§ ’Ê⁄UÁ»§⁄U ‚◊SÿÊ ∑§Ê ‚Ê◊ŸÊ ∑§⁄UŸÊ ¬«∏Ê–
Õɸæ ÁÜSÌÚU
◊¥ª‹flÊ⁄U ∑§Ë ⁄UÊà „È߸ ◊Í‚‹ÊœÊ⁄U ’ÊÁ⁄U‡Ê
Ÿ ’Ê¥ªÙ ’Ê¥œ ∑§Ê ¡‹SÃ⁄U ™§¥øÊ ∑§⁄U ÁŒÿÊ „Ò–∑§Ù⁄U’Ê Á¡‹Ê ‚Á„à ∑§ÙÁ⁄UÿÊ, •¥Á’∑§Ê¬È⁄U flÁø⁄UÁ◊⁄UË ◊¥ „È߸ ¤Ê◊ʤÊ◊ ’ÊÁ⁄U‡Ê ‚ ¡‹SÃ⁄U◊¥ yz ‚ã≈UË◊Ë≈U⁄U ∑§Ë flÎÁh „È߸ „Ò– ’ÊÁ⁄U‡Ê ∑§ÊR§◊ ¡Ê⁄UË ⁄U„Ê ÃÙ ª≈U πÙ‹Ÿ ∑§Ë ÁSÕÁÃÁŸÁ◊¸Ã „Ù ‚∑§ÃË „Ò–
ÇêUÕð ßæãUهʄ⁄U ∑‘§ ’Ëø ÁSÕà ◊È«∏ʬÊ⁄U ÃÊ‹Ê’
∑§‹ ⁄UÊà „È߸ ’ÊÁ⁄U‡Ê ‚ ‹’Ê‹’ ÷⁄U ªÿÊ– {◊Ê„ ‚ ÃÊ‹Ê’ ª„⁄UË∑§⁄UáÊ ∑§Ê ∑§Êÿ¸ ø‹ ⁄U„Ê„Ò– •øÊŸ∑§ „È߸ ’ÊÁ⁄U‡Ê ∑‘§ ∑§Ê⁄UáÊ ÃÊ‹Ê’ ◊¥¡‹SÃ⁄U ’…∏Ê •ı⁄U ÁŸ◊ʸáÊ ∑§Êÿ¸ ◊¥ ‹ªË¡‚Ë’Ë fl ≈˛ÒÄU≈U⁄U ‚Á„à ÁŸ◊ʸáÊ ‚Ê◊ª˝Ë ¬ÊŸË◊¥ «Í’ ªß¸– ß‚Ë Ã⁄U„ ◊È«∏ʬÊ⁄U ÁSÕà ◊ÊM§ÁÇÊÙ-M§◊ ∑‘§ fl∑§¸‡ÊÊÚ¬ ◊¥ ¬ÊŸË ÷⁄U ¡ÊŸ ‚∑§ß¸ ªÊÁ«∏ÿÊ¥ «Í’ ªß¸– ˇÊòÊ ∑‘§ ÉÊ⁄UÙ¥ ◊¥ ÷Ë
¬ÊŸË ÷⁄U ¡ÊŸ ‚ ‹Ùª ¬⁄U‡ÊÊŸ ⁄U„– ©ã„¥•ÊÁÕ¸∑§ ŸÈ∑§‚ÊŸ ©∆ÊŸÊ ¬«∏Ê–
ƒæÚUæð´ ×ð´ ƒæéâæ ÂæÙè‡Ê„⁄U ‚ ‹ª ŒÊŒ⁄UŸÊ‹Ê ¬⁄U ¬Ê≈UË ∑§Ë ªß¸
Á◊^Ë ‚ ß‚∑§Ë øı«∏Ê߸ ∑§◊ „Ù ªß¸ „Ò– ŸÊ‹∑§Ê M§π ◊Ù«∏Ê ªÿÊ „Ò ß‚‚ ’ÊÁ⁄U‡Ê •Áœ∑§„ÙŸ ¬⁄U ¬ÊŸË ∑§Ë ÁŸ∑§Ê‚Ë Ÿ„Ë¥ „Ù ¬ÊÃË „Ò–ÉÊ⁄UÙ¥ ◊¥ ’ÊÁ⁄U‡Ê ∑§Ê ¬ÊŸË ÉÊÈ‚Ë– ßU‚‚ ¬„U‹fl„UÊ¥ ∑§ ⁄U„UflÊ‚Ë ‚¥’¥ÁäÊà ¡ÊŸ ∑§Êÿʸ‹ÿ ◊¥ßU‚∑§Ë Á‡Ê∑§Êÿà ÷Ë ∑§⁄U øÈ∑§ Õ– ‹Á∑§ŸÁŸª◊ •◊‹ Ÿ ‚◊ÿ ⁄U„Uà ßU‚ ¬⁄U ∑§Ê߸UäÿÊŸ Ÿ„UË¥ ÁŒÿÊ– ¬Ífl¸ ◊¥ ˇÊòÊ ∑‘§ ÉÊ⁄UÙ¥ ◊¥ ¬ÊŸË÷Ë ÉÊÈ‚ øÈ∑§Ê „Ò– ß‚∑‘§ •‹ÊflÊ ∞◊¬Ë Ÿª⁄U,⁄UÁfl‡Ê¥¥∑§⁄U Ÿª⁄U, ⁄UÊÃÊπÊ⁄U, ÃÈ‹‚ËŸª⁄U ˇÊòÊ ◊¥÷Ë ∑§ß¸ ◊∑§ÊŸÙ¥ ◊¥ ¬ÊŸË ÉÊÈ‚ ¡ÊŸ ‚ ‹ÊªÊ¥∑§Ê ÷Ê⁄UË ¬⁄‘U‡ÊÊÁŸÿÊ¥ ∑§Ê ‚Ê◊ŸÊ ∑§⁄UŸÊ ¬«∏Ê–
Âýðâ ·¤æ÷ŒÜð�â âçãUÌ ¥Ùð·¤ ÿæð˜ææ𴠷𤠷¤æÜæðçÙØæð´ ×ð´ ƒæéâæ ÂæÙè
∑§Ê⁄U’Ê @ loksadan.com
÷Ê⁄UÃËÿ ¡ŸÃÊ ¬Ê≈U˸ ∑§Ë ⁄UÊC˝Ëÿ◊„Ê◊¥òÊË fl ‚¥‚Œ ‚ŒSÿ (⁄UÊíÿ‚÷Ê)«ÊÚ. ‚⁄UÙ¡ ¬Ê¥«ÿ Ÿ ∑§„Ê „Ò Á∑§ ÁflE ◊¥÷Ê⁄Uà •ı⁄U ÷Ê⁄UÃËÿ ŸÃÎàfl ∑§ËSflË∑§Êÿ¸ÃÊ ’…∏Ë „Ò •ı⁄U ÿ„ ¬˝œÊŸ◊¥òÊËŸ⁄U¥Œ˝ ◊ÙŒË ‚ ‚ˇÊ◊ fl ‚’‹ ŸÃÎàfl ∑‘§∑§Ê⁄UáÊ ‚¥÷fl „È•Ê „Ò– ∑‘§¥Œ˝ ‚⁄U∑§Ê⁄U ∑‘§„⁄U ÁŸáʸÿ •ı⁄U ÿÙ¡ŸÊ•Ù¥ ∑‘§ ∑‘§¥Œ˝ ◊¥‚◊Ê¡ ∑§Ë •¥ÁÃ◊ ¬¥ÁQ§ ∑§Ê •¥ÁÃ◊√ÿÁQ§ „Ë ⁄U„Ê „Ò– «ÊÚ. (‚ÈüÊË) ¬Ê¥«ÿ’ÈœflÊ⁄U ∑§Ù ÿ„Ê° ∑§È‡ÊÊ÷Ê™§ ∆Ê∑§⁄U S◊ÎÁìÁ⁄U‚⁄U ◊¥ ÷Ê¡¬Ê mÊ⁄UÊ •Ê„Íà Á¡‹Ê¡Ÿ‚¥flÊŒ ∑§Êÿ¸R§◊ ∑‘§ Äà ∑§Ù⁄U’ÊÁ¡‹Ê ∑§Ë flËÁ«ÿÙ ∑§ÊÚ㻧˝¥Á‚¥ª ‚÷Ê ∑§Ù‚¥’ÙÁœÃ ∑§⁄U ⁄U„Ë ÕË¥– ÁflÁŒÃ ⁄U„, ¬˝Œ‡Ê÷Ê¡¬Ê mÊ⁄UÊ ∑‘§¥Œ˝ ‚⁄U∑§Ê⁄U ∑‘§ ŒÍ‚⁄U∑§Êÿ¸∑§Ê‹ ∑‘§ ∞∑§ fl·¸ ¬Íáʸ „ÙŸ ¬⁄UÁ¡‹Ê SÃ⁄U ¬⁄U ߟ ‚÷Ê•Ù¥ ∑§Ê •ÊÿÙ¡Ÿ⁄UπÊ ¡Ê ⁄U„Ê „Ò •ı⁄U ÿ„ ‚÷Ê ß‚ R§◊◊¥ øıÕ ÁŒŸ ∑§Ë ¬„‹Ë ‚÷Ê ÕË–
÷Ê¡¬Ê ⁄UÊC˝Ëÿ ◊„Ê◊¥òÊË fl ‚Ê¥‚Œ«ÊÚ. (‚ÈüÊË) ¬Ê¥«ÿ Ÿ ∑§„Ê Á∑§ ‚ŸwÆvy ∑‘§ •Ê◊ øÈŸÊfl ‚ ¬„‹ Œ‡Ê∑§÷⁄U∑§Ê ∑§Ê¥ª˝‚ ‡ÊÊ‚Ÿ ÷˝CÊøÊ⁄U •ı⁄U ÉÊÙ≈UÊ‹Ù¥∑§Ê ⁄U„Ê– Ãà∑§Ê‹ËŸ ¬˝œÊŸ◊¥òÊË ∑§Ù߸ÁŸáʸÿ ‹ Ÿ„Ë¥ ‚∑§Ÿ flÊ‹, ‹ÊøÊ⁄U •ı⁄U◊¡∏’Í⁄U Õ, fl Á‚»∏§¸ ©ÃŸÊ „Ë ∑§„Ã,Á¡ÃŸÊ ©ã„¥ ‚¥∑‘§Ã Á∑§ÿÊ ¡ÊÃÊ– ©‚
∑§Ê‹ ◊¥ Œ‡Ê òÊÊÁ„-òÊÊÁ„ ∑§⁄UŸ ‹ªÊ ÕÊ–‚Ÿ wÆvy ∑‘§ •Ê◊øÈŸÊfl ◊¥ ¡’ üÊË◊ÙŒË ∑‘§ ¬˝œÊŸ◊¥ÁòÊàfl ◊¥ ∑‘§¥Œ˝ ◊¥ ÷Ê¡¬Ê∑§Ë ‚⁄U∑§Ê⁄U •ÁSÃàfl ◊¥ •Ê߸ Ã’ ©‚Ÿ•¬Ÿ ∑§ÊÿÙ¥¸, ÿÙ¡ŸÊ•Ù¥ fl ∑§Êÿ¸R§◊Ù¥ ‚ª∏⁄UË’Ë ◊ÈQ§ •ı⁄U ÷˝CÊøÊ⁄U ◊ÈQ§ ÷Ê⁄Uà ∑§ËÁŒ‡ÊÊ ◊¥ Œ‡Ê ∑§Ù •Êª ‹ ¡ÊŸ ∑§Ê ∑§Ê◊Á∑§ÿÊ– «ÊÚ. (‚ÈüÊË) ¬Ê¥«ÿ Ÿ Sflë¿ÃÊ•Á÷ÿÊŸ, ©îfl‹Ê ªÒ‚ ∑§ŸÄU‡ÊŸÿÙ¡ŸÊ, ¡Ÿ-œŸ πÊÃÊ ‚◊à •Ÿ∑§ÿÙ¡ŸÊ•Ù¥ fl ª∏⁄UË’ Á„ÃÒ·Ë ∑§Êÿ¸R§◊Ù¥ ∑§ÊÁ¡R§ ∑§⁄Uà „È∞ ∑§„Ê Á∑§ ¬˝œÊŸ◊¥òÊË üÊË◊ÙŒË ∑‘§ ŸÃÎàfl ◊¥ ÿ Á‚»∏§¸ ÿÙ¡ŸÊ∞° Ÿ„Ë¥,’ÁÀ∑§ ∞∑§ Ÿß¸ ∑§Êÿ¸¬˝áÊÊ‹Ë •ı⁄U‚¥S∑§ÎÁà ∑§Ê Œ‡Ê¸Ÿ „Ò¥ Á¡Ÿ∑§Ë ’ÈÁŸÿÊŒ ¬⁄U∑‘§¥Œ˝ ‚⁄U∑§Ê⁄U Ÿ •¬Ÿ ŒÍ‚⁄U ∑§Êÿ¸∑§Ê‹ ◊¥∞ÁÄÊÁ‚∑§, ‚Ê„Á‚∑§ fl R§Ê¥ÁÃ∑§Ê⁄U˻ҧ‚‹ Á‹∞ •ı⁄U ⁄UÊC˝Ëÿ •π¥«ÃÊ,
SflÊÁ÷◊ÊŸ fl ‚Ê◊ÊÁ¡∑§ ‚◊ÊŸÃÊ ∑§Ë•flœÊ⁄UáÊÊ ∑§Ù ◊¡∏’Íà Á∑§ÿÊ–
◊ı¡∏ÍŒÊ ∑§Ù⁄UÙŸÊ ‚¥∑§≈U ∑§Ë øøʸ ∑§⁄U«ÊÚ. (‚ÈüÊË) ¬Ê¥«ÿ Ÿ ∑§„Ê Á∑§ ∞∑§ •Ù⁄U¡’ ÁflE ∑§Ë •ÊÁÕ¸∑§ ◊„ʇÊÁQ§ÿÊ° ß‚◊„Ê◊Ê⁄UË ∑‘§ •Êª ÉÊÈ≈UŸ ≈U∑§ÃË Ÿ¡∏⁄U •Ê⁄U„Ë „Ò, Ã’ ¬˝œÊŸ◊¥òÊË üÊË ◊ÙŒË ŸŒÍ⁄UŒÁ‡Ê¸ÃʬÍáʸ ÁŸáʸÿ ‹∑§⁄U ÷Ê⁄Uà ∑‘§‚Ê◊Õ¸˜ÿflÊŸ ŸÃÎàfl ∑§Ê ‹Ù„Ê ◊ŸflÊÿÊ•ı⁄U ÁflE Ÿ ÷Ê⁄Uà ∑§Ë •Ù⁄U •Ê‡ÊÊ÷⁄UËÁŸªÊ„Ù¥ ‚ ŒÙπÊ, ÷Ê⁄Uà ‚ ◊ŒŒ ◊Ê¥ªË•ı⁄U ÷Ê⁄Uà Ÿ ÿÕÊ‚¥÷fl ÁflE ∑‘§ Œ‡ÊÙ¥∑§Ë ◊ŒŒ ∑§Ë– ŒÈ÷ʸÇÿ ‚ Áfl¬ˇÊ ß‚ ◊Èg¬⁄U ÷Ë ¬˝‹Ê¬ ∑§⁄UÃÊ ⁄U„Ê– ∑§Ù⁄UÙŸÊ ∑§Ê‹◊¥ Œ‡Ê ∑§Ë •Õ¸√ÿflSÕÊ ∑§Ù ‚ê„Ê‹Ÿ•ı⁄U ∞∑§ ÷Ê⁄UÃ-üÊD ÷Ê⁄Uà ∑‘§ ‚ÊÕ „Ë•Êà◊ÁŸ÷¸⁄U ÷Ê⁄Uà ’ŸÊŸ ∑§Ë ÁŒ‡ÊÊ ◊¥∑‘§¥Œ˝ ‚⁄U∑§Ê⁄U ’…∏ ⁄U„Ë „Ò •ı⁄U ß‚∑‘§ Á‹∞
wÆ ‹Êπ ∑§⁄UÙ«∏ L§¬ÿÙ¥ ∑§Ê ¬Ò∑‘§¡ ∑‘§¥Œ˝‚⁄U∑§Ê⁄U Ÿ ÉÊÙÁ·Ã Á∑§ÿÊ „Ò– ¬˝flÊ‚ËüÊÁ◊∑§Ù¥ ∑‘§ flŸ Ÿ‡ÊŸ-flŸ ⁄Uʇʟ ∑§Ê«¸•ı⁄U Á∑§‚ÊŸÙ¥ ∑‘§ Á‹∞ ∞∑§ Œ‡Ê-∞∑§’Ê¡Ê⁄U-∞∑§ ◊¥«Ë ∑§Ê R§Ê¥ÁÃ∑§Ê⁄UË »Ò§‚‹Ê‹∑§⁄U ∑‘§¥Œ˝ ‚⁄U∑§Ê⁄U Ÿ •¬Ÿ ‚¥flŒŸˇÊ◊ŸÃÎàfl ∑§Ê ¬Á⁄Uøÿ ÁŒÿÊ „Ò–
÷Ê¡¬Ê ⁄UÊC˝Ëÿ ◊„Ê◊¥òÊË fl ‚Ê¥‚Œ«ÊÚ. (‚ÈüÊË) ¬Ê¥«ÿ Ÿ ¬˝Œ‡Ê ‚⁄U∑§Ê⁄U ¬⁄U‚¥ÉÊËÿ √ÿflSÕÊ ∑§Ê ¬Ê‹Ÿ Ÿ„Ë¥ ∑§⁄UŸ∑§Ê •Ê⁄UÙ¬ ŒÈ„⁄UÊà „È∞ ∑§„Ê Á∑§ ¬˝Œ‡Ê ∑‘§◊ÈÅÿ◊¥òÊË Ÿ •¬ŸË ⁄UÊ¡ŸËÁÃ∑§◊„àflÊ∑§Ê¥ˇÊÊ•Ù¥ fl •Ê‹Ê∑§◊ÊŸ ∑‘§‚◊ˇÊ •¬ŸÊ ª˝Ê»§ ™§°øÊ ∑§⁄UŸ ∑§Ë‹‹∑§ ◊¥ Ÿ ∑‘§fl‹ ‚¥ÉÊËÿ √ÿflSÕÊ ∑§Ë•fl„‹ŸÊ ∑§Ë, •Á¬ÃÈ ∑§Ù⁄UÙŸÊ ∑§Ê‹ ◊¥¬˝Œ‡Ê ∑§Ë ¡ŸÃÊ ∑§Ë SflÊSâÿ-‚È⁄UˇÊÊ ∑§ÙŒÊ¥fl ¬⁄U ÷Ë ‹ªÊ ÁŒÿÊ– ÿ„ ¬˝Œ‡Ê‚⁄U∑§Ê⁄U Á∑§‚Ë ÷Ë ◊Ùø¸ ¬⁄U ߸◊ÊŸŒÊ⁄UË ‚∑§Ê◊ Ÿ„Ë¥ ∑§⁄U ⁄U„Ë „Ò– ‡Ê⁄UÊ’’¥ŒË ∑§⁄UŸ∑‘§ ’¡Êÿ ‡Ê⁄UÊ’ ∑‘§ ¬Ò‚Ù¥ ‚ ‚⁄U∑§Ê⁄Uø‹ÊŸ ∑§Ê ∑§Ê◊ „Ù ⁄U„Ê „Ò– ¡ŸÃÊ ∑§ÊÁflEÊ‚ ÃÙ«∏Ÿ flÊ‹Ë ∞‚Ë ¬˝Œ‡Ê ‚⁄U∑§Ê⁄U∑§Ë ŸÃÎàfl„ËŸÃÊ, ∑§ÈŸËÁÃÿÙ¥ •ı⁄U’ŒŸËÿÃË ∑‘§ ’Ê⁄U ◊¥ ÷Ë ¬˝Œ‡Ê ∑§Ë ¡ŸÃÊ∑§Ù ∑§Êÿ¸∑§Ãʸ •flªÃ ∑§⁄UÊ∞°–
‚÷Ê ∑§Ë ‡ÊÈL§•Êà ∑§Ù⁄U’Ê Á¡∏‹Ê÷Ê¡¬Ê •äÿˇÊ •‡ÊÙ∑§ øÊfl‹ÊŸË Ÿ∑§Êÿ¸R§◊ ∑§Ë ¬˝SÃÊflŸÊ ⁄UπË– ÷Ê¡¬Êfløȸ•‹ ⁄UÒ‹Ë ∑‘§ ¬˝Œ‡Ê ∑‘§ ‚„ ‚¥ÿÙ¡∑§
fl ¬˝Œ‡Ê ¬˝flQ§Ê ÷ͬ¥Œ˝ ‚flÛÊË Ÿ ‚÷Ê ∑§Ë∑§Êÿ¸flÊ„Ë ‚¥øÊÁ‹Ã ∑§⁄Uà „È∞¬˝ÊSÃÊÁfl∑§ ÷Ê·áÊ ÁŒÿÊ– ∑§Êÿ¸∑˝§◊ ∑‘§•¥Ã ◊¥ ÷Ê¡¬Ê ŸÃÊ ‹Ù∑‘§‡Ê ∑§ÊflÁ«∏ÿÊ Ÿ‚’∑§Ù •Êà◊ÁŸ÷¸⁄U ÷Ê⁄Uà ∑§Ë ‚¥⁄UøŸÊ∑§Ê ‚¥∑§À¬ ÁŒ‹ÊÿÊ– ¡Ÿ ‚¥flÊŒ ∑§Ë‡ÊÈL§•Êà ◊¥ ÷Ê⁄UÃËÿ ‚Ë◊Ê ¬⁄U ‡Ê„ËŒ „È∞¬˝Œ‡Ê ∑‘§ ªáʇÊ⁄UÊ◊ ∑§È¥¡Ê◊ ‚Á„à ‚÷ˇʄˌ ¡flÊŸÙ¥ ∑§Ù ÷Êfl¬Íáʸ üÊhÊ¥¡Á‹•Á¬¸Ã ∑§Ë ªß¸– •Ê÷Ê⁄U ¬˝Œ‡Ê¸Ÿ Á¡∏‹Ê∑§Ù·ÊäÿˇÊ ∞fl¥ ‚„ ¬˝÷Ê⁄UË Áfl∑§Ê‚◊„ÃÙ Ÿ Á∑§ÿÊ–
ß‚ ◊ı∑‘§ ¬⁄U ÷Ê¡¬Ê ¡Ÿ‚¥flÊŒflËÁ«ÿÙ ∑§Ê¥»§˝¥Á‚¥ª ¬˝Œ‡Ê ‚¥ÿÙ¡∑§ fl¬Ífl¸ ◊¥òÊË ⁄UÊ¡‡Ê ◊ÍáÊÃ, ¬Ífl¸ ◊¥òÊËŸŸ∑§Ë⁄UÊ◊ ∑§°fl⁄U, ’ŸflÊ⁄UË ‹Ê‹•ª˝flÊ‹ ¬Ífl¸ ‚¥‚ŒËÿ ‚Áøfl ‹πŸ‹Ê‹ ŒflÊ¥ªŸ, íÿÙÁà Ÿ¥Œ ŒÈ’, ¬Ífl¸◊„ʬı⁄U ¡Ùª‡Ê ‹Ê¥’Ê, ÃL§áÊ Á◊üÊÊ,‚¥¡ÿ ÷ÊflŸÊŸË, Œfl¥Œ˝ ¬Ê¥« ªÙ¬Ê‹◊ÙŒË, ⁄UÊ¡¥Œ˝ •ª˝flÊ‹ L§∑§◊áÊË ŸÊÿ⁄U‚ÃÁfl¥Œ⁄U ’ǪÊ, ◊ŸÙ¡ Á‚¥„, ◊˟ʇÊ◊ʸ, íÿÙÁà fl◊ʸ, ¬˝»§ÈÑ ÁÃflÊ⁄UË,ÿÙª‡Ê ¡ÒŸ, ◊ŸÙ¡ Á◊üÊÊ, ⁄UÊ◊ ÁòʬÊ∆Ë,ªıÃ◊ ◊hÁ‡ÊÿÊ, ◊ŒŸ ‚Ê„Í ¬¥∑§¡¬˝¡Ê¬ÁÃ, ‚¥ŒË¬ ‚„ª‹, ‹∑§Ë Ÿ¥ŒÊ•ÁŸ‹ øı⁄UÁ‚ÿÊ ¬ÈŸË ⁄UÊ◊ ‡Ê„ËŒ ∑§Ê»§Ë‚¥ÅÿÊ ◊¥ ¬ŒÊÁœ∑§Ê⁄UË fl ∑§Êÿ¸∑§Ãʸ¡Ÿ‚¥flÊŒ flËÁ«ÿÙ ∑§Ê¥»§˝ ¥Á‚¥ª ∑‘§◊Êäÿ◊ ‚ ¡È«∏ Õ–
∑§Ê⁄U’Ê @ loksadan.com
flŸ Áfl÷ʪ ∑§Ë ¡◊ËŸ ¬⁄U πÙŒÊ߸∞fl¥ •flÒœ ∑§é¡Ê ∑§Ë ‚ÍøŸÊ ¬⁄U ÿ„Ê¥•fl‹Ù∑§Ÿ ∑§⁄UŸ ∞fl¥ ∑§Êÿ¸ ⁄UÙ∑§Ÿ ∑‘§ Á‹∞¬„È¥øË flŸ ⁄U Ê∑§ ∑‘§ ‚ÊÕ •÷Œ˝ÃÊ ∑§⁄UÄÈ∞ ŒË¬∑§Ê Ÿª⁄U ¬ÊÁ‹∑§Ê •äÿˇÊ ∞fl¥ •ãÿ‹ÙªÙ¥ Ÿ •¥¡Ê◊ ÷Ȫß •ı⁄U Ã⁄U„-Ã⁄U„ ∑§Ëœ◊Á∑§ÿÊ¥ ŒË– ¬ÈÁ‹‚ Ÿ flŸ ⁄U Ê∑§ ∑§ËÁ⁄U¬Ù≈U ¬⁄U ¬ÊÁ‹∑§Ê •äÿˇÊ ‚◊à vz ‹ÙªÙ¥∑‘§ ÁflL§h •¬⁄UÊœ ¬¥¡Ë’h ∑§⁄U Á‹ÿÊ „Ò–ß‚ ∑§Ê⁄UflÊß ∑§Ù ‹∑§⁄U Ÿª⁄U ¬ÊÁ‹∑§ÊŒË¬∑§Ê ˇÊòÊ ‚Á„à Á¡‹ ◊¥ ‚⁄Uª◊Ë „Ò–
¡ÊŸ∑§Ê⁄UË ∑‘§ •ŸÈ‚Ê⁄U ∑§≈UÉÊÙ⁄UÊflŸ◊¥«‹ •¥ÃªÃ ŒË¬∑§Ê ‚Á∑§‹ ◊¥ ∑§È◊Ê⁄UË©Á◊‹Ê ŒflË ⁄UÊ¡ Á¬ÃÊ Sfl. ’Ê‹Á‚¥„ flŸ
⁄U Ê∑§ ∑§Êÿ⁄Uà „Ò– ŒË¬∑§Ê‚Á∑§‹ •¥ÃªÃ fl Ÿª⁄U¬ÊÁ‹∑§Ê ŒË¬∑§Ê ∑‘§ flÊ«R§. w íÿÙÁߪ⁄U ◊¥ vx¡ÍŸ ∑§Ù ‚È’„ ∑§⁄UË’ {’¡ flŸ ÷ÍÁ◊ ¬⁄U ¡‚Ë’ËmÊ⁄UÊ •flÒœ πÙŒÊß ∑§⁄UŸ∑§Ë ‚ÍøŸÊ ©Á◊‹Ê ŒflË∑§Ù Á◊‹Ë ÕË– ‚ÍøŸÊ ¬⁄U
ÃSŒË∑§ ∑§⁄UŸ fl„ ‚È’„ {.xÆ ’¡íÿÙÁߪ⁄U ¬„È¥øË ¡„Ê¥‡◊‡ÊÊŸÉÊÊ≈U ∑‘§•Êª ¡‚Ë’ËmÊ⁄UÊ •flÒœπÙŒÊß ∑§⁄UìÊÿÊ ªÿÊ–flŸ ÷ÍÁ◊ŒË¬∑§Ê ∑‘§•Ù∞/|}| ◊¥ flŸ ÷ÍÁ◊¬⁄U ∑§é¡Ê ∑§⁄UŸ „ÃÈ πÙŒ ¡Ê ⁄U„ªbÊ ∑‘§ ‚¥’¥œ ◊¥ øı∑§ËŒÊ⁄U ’Ê‹E⁄U Á‚¥„Á¬ÃÊ ⁄UÊ◊¬‚ÊŒ ∑‘§ ‚ÊÕ ¬„È¥ø∑§⁄U ©Á◊‹Ê Ÿ¡‚Ë’Ë ∑‘§ øÊ‹∑§ ‚ ‚flÊ‹-¡flÊ’Á∑§ÿÊ– ß‚ Œı⁄UÊŸ ¡‚Ë’Ë ‹∑§⁄U øÊ‹∑§÷ʪ ªÿÊ– ©Á◊‹Ê Ÿ ’ÃÊÿÊ Á∑§ ÕÙ«∏Ë Œ⁄U
◊¥ Ÿª⁄U ¬ÊÁ‹∑§Ê •äÿˇÊ ‚¥ÃÙ·Ë ŒËflÊŸ,©ûÊ◊ ŒÈ’, ‚¥ÃÙ· Á‚¥„ •ı⁄U •ãÿ vÆ-vz‹Ùª fl„Ê¥ ¬„È¥ø •ı⁄U •ÊR§Ù‡Ê ¬Ífl∑§ ©‚¡ÊŸ ‚ ◊Ê⁄UŸ ∑§Ë œ◊∑§Ë ÁŒ∞ •ı⁄U ªÊ«∏Ë∑§Ù ∑§Ê◊ ∑§⁄UŸ ‚ ⁄UÙ∑§Ÿ ∑§Ë Á„ê◊à ∑Ò§‚ „Èß∑§„∑§⁄U ≈Ê¥‚»§⁄U ∑§⁄UÊ ŒŸ ∑§Ë œ◊∑§Ë ŒË–vÆ-vz ‹ÙªÙ¥ ∑§Ù π«∏ ∑§⁄U ÉÊÍ‚ ‹Ÿ ∑§Ê¤ÊÍ∆Ê ∑‘§‚ ’ŸÊ ŒŸ ∑§Ë ÷Ë œ◊∑§Ë Œ∑§⁄U fl„Ê¥‚ ÷ʪ ¡ÊŸ Ÿ„Ë¥ ÃÙ •¥¡Ê◊ ÷Ȫß ∑§ËøÃÊflŸË ŒË ªß¸– ©Á◊¸‹Ê Ÿ •¬Ÿ
•Áœ∑§ÊÁ⁄UÿÙ¥ ‚ ÁfløÊ⁄U-Áfl◊‡Ê¬pÊà ߂∑§Ë Á⁄U¬Ù≈U •Ê¡
ŒË¬∑§Ê ÕÊŸÊ ◊¥ Œ¡∑§⁄UÊ߸– ¬ÈÁ‹‚ ŸŸª⁄U ¬ÊÁ‹∑§Ê•äÿˇÊ ‚¥ÃÙ·Ë
ŒËflÊŸ, ©ûÊ◊ ŒÈ’,‚¥ÃÙ· Á‚¥„ fl •ãÿ
vÆ-vz ‹ÙªÙ¥ ∑‘§ ÁflL§h œÊ⁄UÊv}{, zÆ{, xy ÷ÊŒÁfl ∑‘§ Äà •¬⁄UÊœ
¬¥¡Ë’h ∑§⁄U ÁflfløŸÊ ¬Ê⁄U¥÷ ∑§Ë „Ò– Ÿª⁄U¬ÊÁ‹∑§Ê •äÿˇÊ ∞fl¥ ©Ÿ∑‘§ ‚„ÿÙÁªÿÙ¥ ∑‘§ÁflL§h •¬⁄UÊœ ¬¥¡Ë’h „ÙŸ ∑‘§ ß‚◊Ê◊‹ Ÿ ŒË¬∑§Ê ∑§Ë ⁄UÊ¡ŸËÁÃ∑§ ‚⁄Uª◊˸’…∏Ê ŒË „Ò–
ŒË¬∑§Ê/ªfl⁄UÊ @ loksadan.com
Ÿª⁄U ¬ÊÁ‹∑§Ê ¬Á⁄U·ŒŒË¬∑§Ê ∑‘§ ¬Ífl¸ ‚Ê¥‚Œ ¬˝ÁÃÁŸÁœŒË¬∑§ ¡Êÿ‚flÊ‹ ∑‘§ ŸÃÎàfl ◊¥•Ê¡ ‹gÊ𠪋flÊŸ ÉÊÊ≈UË ◊¥„È∞ „◊‹ ◊¥ ‡Ê„ËŒ ÷Ê⁄UÃËÿ‚ÒÁŸ∑§Ù¥ ∑§Ë ‡Ê„ʌà ∑§Ù ∑Ò§¥«‹¡‹Ê∑§⁄U üÊhÊ¥¡Á‹ •Á¬¸Ã ∑§Ëªß¸ ÃÕÊ øËŸ∑‘§ ⁄UÊC˝Ëÿ äfl¡∑§Ù ¡‹ÊÿʪÿÊ ∞fl¥ øËŸ‚Ê◊Áª˝ÿÙ¥ ∑§Ê’Á„c∑§Ê⁄U ∑§⁄UŸ∑§Ê ÁŸáʸÿÁ‹ÿÊ ªÿÊ ß‚•fl‚⁄U ¬⁄U Ÿª⁄U¬ÊÁ‹∑§Ê ¬Á⁄U·ŒŒË¬∑§Ê ∑‘§ ¬Ífl¸‚Ê¥‚Œ ¬˝ÁÃÁŸÁœ ŒË¬∑§¡Êÿ‚flÊ‹ Ÿ ∑§„Ê Á∑§ øËŸ„◊‡ÊÊ ∑§Êÿ⁄UÃÊ ¬Ífl¸∑§ ∑§Êÿ¸∑§⁄Uà „È∞ ÷Ê⁄Uà ¬⁄U „◊‹ ∑§Ë‚ÊÁ¡‡Ê ⁄UøÃÊ „Ò ¡Ù Á’À∑§È‹ª‹Ã „Ò •Ê¡ ¬Í⁄UÊ ÁflE ◊¥ ÷Ê⁄UÃ∑§Ê ∑§Œ ¬˝œÊŸ◊¥òÊË Ÿ⁄U¥Œ˝ ◊ÙŒË∑‘§ ŸÃÎàfl ◊¥ Ã¡Ë ∑‘§ ‚ÊÕ •Êª’…∏Ê „Ò •ı⁄U ÷Ê⁄Uà ÁflE ªÈL§ ∑§Ë•Ù⁄U •ª˝‚⁄U „Ù ⁄U„Ê „Ò øËŸ ∑§Ë„⁄U∑§Ã ∑§Ù ¬Í⁄UÊ ÁflE ¡ÊŸ øÈ∑§Ê
„Ò ª‹flÊŸ ÉÊÊ≈UË ◊¥ „È∞ „◊‹øËŸ ∑§Ë ‚ÊÁ¡‡Ê „Ò Á¡‚∑§Ê÷Ê⁄UÃËÿ ‚ÒÁŸ∑§Ù¥ Ÿ ◊È¥„ ÃÙ«∏¡flÊ’ ÁŒÿÊ „Ò ß‚ „◊‹ ◊¥‡Ê„ËŒ „È∞ flË⁄U ¡flÊŸÙ¥ ∑§Ê‡Ê„ʌà √ÿÕ¸ Ÿ„Ë¥ ¡Ê∞ªÊ ß‚•fl‚⁄U ¬⁄U ÷Ê¡¬Ê Á¡‹Ê©¬ÊäÿˇÊ ◊Á„‹Ê ◊Ùøʸ fl„ ¬Ífl¸◊¥«‹ ∞À«⁄U◊ÒŸ ’ÈœflÊ⁄UÊ
ŒflÊ¥ªŸ ◊Á„‹Ê ◊Ùøʸ ◊„Ê◊¥òÊË•ŸËÃÊ ¬≈U‹ ◊¥«‹ ◊¥òÊË ŒË¬∑§Ê‚¥¡ÿ ¡Êÿ‚flÊ‹ ‹ˇ◊ËŸÊÕŒflÊ¥ªŸ R§Ê¥Áà ¬≈U‹ ÷Ê¡ÿÈ◊ÙŸÃÊ ¬ËÿÍ· ¡Êÿ‚flÊ‹ ◊„ÊflË⁄U∑‘§fl≈U ‚¥ÃÙ· „‹flÊ߸ øR§œ⁄U‚Ê„Í ⁄UÊ◊ ∑§È◊Ê⁄U üÊËflÊ‚ ‚¥¡ÿüÊËflÊ‚ •Ù◊ ‡Ê¥∑§⁄U ⁄UÊ¡ ÁŸÃ‡Ê‚ÙŸË ‚ʪ⁄U ¬≈U‹ ÷Ê⁄Uà ¬≈U‹ªÙÁfl¥ŒÊ ‚Á„à •Ÿ∑§Ù¥ ∑§Êÿ¸∑§Ãʸ∞fl¥ ¬ŒÊÁœ∑§Ê⁄UË ©¬ÁSÕà Ֆ
·Ô¤´Îý âÚU·¤æÚU ·Ô¤ ÎêâÚUð ·¤æØü·¤æÜ ·Ô¤ °·¤ ßáü Âê‡æü ãôÙð ÂÚU çÁ¸Üæ ÖæÁÂæ ·¤è ßèçÇØô ·¤æò‹È¤ýð´çâ´» âÖæ
ÙÂæ ¥ŠØÿæ Ùð Îè ßÙ ÚUÿæ·¤ ·¤ô Ï×·¤è, vz Üæð»æð´ ÂÚU ¥ÂÚUæÏ ÎÁüßÙ Öêç× ÂÚU ¥ßñÏ ·¤�Áæ ÚUô·¤Ùð Âãé´¿è Íè ·¤×èü
ÖæÁÂæ§Øô´ Ùð àæãèÎô´·¤ô Îè Ÿæhæ´ÁçÜ
øËŸ ∑§Ë ‚Ê◊ÊÁª˝ÿÊ¥ ∑§Ê ’Á„Uc∑§Ê⁄U, ¡‹ÊÿÊ äfl¡
’⁄U¬Ê‹Ë ∑§ÊÚ‹¡ ◊¥ ◊ŸÊÿÊ¡Ê∞ªÊ Á«Á¡≈U‹Ë ÿÙª ÁŒfl‚
ANNEXURE-19

QZVf-d½fQZVfwww.navabharat.org
d¶f»ffÀf´fbSX, ¦fb÷Y½ffSX, 18 ªfc³f 2020 5Follow as on @navabharatcg
´fi±f¸f fÈ¿NX IYf Vû¿f
BÀfSXû fmÔ PXfÔ¨ff¦f°f ¶fý»ff½f IYû»fZIYSX ff²f½f³f ³fZ dIY¹ff Af¦ffWXw EªfZÔÀfeÜ ¶fmÔ¦f»fb÷Y..
www.navabharat.org
dý¦¦fªf AÔ°fdSXÃf ½f`Äffd³fIY ªfe ¸ff²f½f³f³ff¹fSX ³fm ·ffSX°fe¹f AÔ°fdSXÃf A³fbÀfÔ²ff³fÀfÔ¦fNX³f (BÀfSXû) ¸fmÔ dIYÀfe ´fiIYfSX IZYPXfÔ¨ff¦f°f ¶fý»ff½f IZY fid°f Af¦ffWX dIY¹ffWX`. BÀf ýüSXf³f C³WXûÔ³fm ýmVf IYe AÔ°fdSXÃfEªfmÔÀfe AüSX E»f³f ¸fÀIY IYe‘À´fmÀfE¢Àf’ IZY ¶fe¨f IYf¸f fcSXf IYSX³fmIYe Vff³fýfSX Ãf¸f°ff IZY d»f¹fm EIYeIYÈ°fIY¸ff³f WXû³fm IZY ¸ff¸f»fm ¸fmÔ Àf¸ff³f°ff IYfdªfIiY dIY¹ff. BÀfSXû IZY ´fc½fÊ A²¹fÃf ³fmIYWXf dIY WXf»f fmÔ IbYLX fedOX¹ff dSX´fûMXÊ fmÔAüôûd¦fIY ·ff¦feýfSXe IYSX³fm IYû »fmIYSX·ffSX°fe¹f AÔ°fdSXÃf IYf¹fÊIiY¸f IZY A´fi·ff½feWXû³fm IYe J¶fSXmÔ AfBÊÔ AüSX BÀf ÃfmÂf ¸fmÔ
Ad²fIY d½fÀ°ffSX IZY d»fE PXfÔ¨ff ¸fmÔÀfÔ·ffd½f°f ¶fý»ff½f IYf ÀfbÓff½f dý¹ff ¦f¹ff.C³WXûÔ³fm IYWXf, »fû¦fûÔ IYû A¶f °fIY WXbEd½fIYfÀf AüSX d½fÀ°ffSX IZY ¶ffSXm ¸fmÔ°f±¹ff°¸fIY dÀ±fd°f ªff³f³fm IYf Ad²fIYfSX WX`. BÀfSXû Àf¶fÀfm A¨LXf´fiýVfʳf IYSX³fm½ff»ff ÀfSXIYfSXe ÀfÔ¦fNX³f WX`,dªfÀf³fm ¶fmWXý A°¹ff²fbd³fIY AÔ°fdSXÃf´fiüôûd¦fIYe fmÔ ·fe fc¯fÊ°f: À½fýmVfe °fSXeIZYÀfm ¸fWXfSX°f WXfdÀf»f IYe AüSX Àf¸f¹f ÀfmAÔ°fdSXÃf d¸fVf³f IYû AÔªff¸f ýmIYSX Af¸f»fû¦fûÔ IYe Af½fV¹fIY°ffAûÔ AüSX ÀfbSXÃffªføYSX°fûÔ IYf ·fe J¹ff»f SXJf. C³WXûÔ³fmIYWXf dIY ¹fWX ýcSX¦ff¸fe údáIYû¯f WX`dªfÀf³fm ·ffSX°f IYû ½f`dV½fIY AÔ°fdSXÃf°ffIY°fûÔ IZY ¶fe¨f Ad¦fi¸f IY°ffSX fmÔ ªf¦fWX
WXfdÀf»f IYSX³fm fmÔ ÀfÃf¸f ¶f³ff¹ff WX`. WXf»fWXe ¸fmÔ ÀfSXIYfSX ³fm IYWXf ±ff dIY d³fªfeÃfmÂfûÔ IYû BÀfSXû IZY ´fid°fâf³fûÔ AüSXÀfbd½f²ffAûÔ IYf BÀ°fm¸ff»f IYSX³fm IYeBªffªf°f ýe ªffE¦fe AüSX C³WXmÔ C´f¦fiWX,´fiÃfm´f¯f AüSX AÔ°fdSXÃf Af²ffdSX°fÀfm½ffAûÔ fmÔ Àf¸ff³f A½fÀfSX dý¹ff ªffE¦ff.
³ff¹fSX ³fm IYWXf dIY À´fmÀfE¢Àf IYû d³fªfeAÔ°fdSXÃf fiÃfm f¯f ½ffWX³f d½fIYfÀf IZY ÃfmÂf¸fmÔ ÀfRY»f°ff IYe IYWXf³fe IZY °füSX fSX ýmJfªff°ff WX` AüSX EmÀff WX` ·fe. C³WXûÔ³fmA¸fmdSXIYf ¸fmÔ AÔ°fdSXÃf IYf¹fÊIiY¸f IZYBd°fWXfÀf IYû ¹ffý dIY¹ff. C³WXûÔ³fm IYWXfdIY ³ffÀff IZY IYf¹fÊIiY¸fûÔ IZY IbY´fi¶fÔ²f³fIYe ½fªfWX Àfm d³fªfe ÃfmÂf IYû »ff·f d¸f»ffC³WXûÔ³fm IYWXf dIY E»f³f ¸fÀIY IYeÀ´fmÀfE¢Àf AüSX BÀfSXû IZY ¶fe¨f Àf¸ff³f°ff´fSX ¦füSX IYSX³ff dý»f¨fÀ´f WX` ýû³fûÔ IZY´ffÀf EIY WXe IY¸ff³f IZY °fWX°f EIYeIYÈ°f´fi¯ff»fe WX` AüSX ýû³fûÔ EIY LX°f/C°´ffý³fA½f²ffSX¯ff Àfm f»f°fm WX`Ô AüSX ¶ffWXSX IZYC°´ffý³f ´fSX »f¦f·f¦f ³fWXeÔ IZY ¶fSXf¶fSXd³f·fÊSX WX`Ô.
ªf½ff³fûÔ IYe VfWXfý°f fSX´feE¸f Jf¸fûVf ¢¹fûÔ WX`Ô
³f¹fe dý»»fe. IYfÔ¦fimÀf IZY fc½fÊ A²¹fÃfSXfWXb»f ¦ffÔ²fe ³fm »fïfJ IYe ¦f»f½ff³fe§ffMXe fmÔ fe³fe Àf`d³fIYûÔ IZY Àff±f dÔWXÀfIYMXIYSXf½f ¸fmÔ 20 ·ffSX°fe¹f ªf½ff³fûÔ IZYVfWXeý WXû³fm IYe fÈâ·fcd¸f fmÔ ¶fb²f½ffSX IYûÀf½ff»f dIY¹ff dIY fi²ff³f¸fÔÂfe ³fSXmÔýi fûýeBÀf ff¸f»fm fSX Jf¸fûVf ¢¹fûÔ WX`Ô. C³WXûÔ³fm
MÐX½feMX dIY¹ff,´fi²ff³f¸fÔÂfeJf¸fûVf ¢¹fûÔWXÔ? ½fWX dLX fm WXbE¢¹fûÔ WX`Ô? A¶f¶fWXb°f WXû ¨fbIYf.WX¸fmÔ ¹fWX ªff³f³fm
IYe ªføYSX°f WX` dIY ¢¹ff WXbAf WX`. IYfÔ¦fimÀf³fm°ff ³fm IYWXf, WX¸ffSXm Àf`d³fIYûÔ IYe WX°¹ffIYSX³fm IYe ¨fe³f IYe dWX¸¸f°f I`YÀfm WXbBÊ?WX¸ffSXe ·fcd¸f fSX IY¶ªff IYSX³fm IYe C³fIYedWX¸¸f°f I`YÀfm WXbBÊ? ¦füSX°f»f¶f WX` dIY»fïfJ IYe ¦f»f½ff³f §ffMXe ¸fmÔ Àfû¸f½ffSXSXf°f ¨fe³fe Àf`d³fIYûÔ IZY Àff±f kdÔWXÀfIYÓfOÞX´fl fmÔ ·ffSX°fe¹f Àfm³ff IZY 20 ªf½ff³fVfWXeý WXû ¦fE. Àfm³ff ³fm ¸fÔ¦f»f½ffSX IYû¹fWX ªff³fIYfSXe ýe.
ÀfeAfBÊE IYû OZXMXf fûSXe IYf f°ff WXe ³fWXeÔ f»ff w EªfZÔÀfeÜ ½ffdÔVf¦fMX³f.
www.navabharat.org
WX`dÔIY¦f IZY A°¹ff²fbd³fIY °fSXeIZY E½fÔÀffB¶fSX WXd±f¹ffSX d½fIYdÀf°f IYSX³fm ½ff»feA¸fmdSXIYf IYe JbdRY¹ff EªfmÔÀfe ÀfeAfBÊEIYe EIY d½fVfm¿f BIYfBÊ A´f³fm WXeAd·f¹ff³fûÔ Àfm ªfbOÞXe ªff³fIYfdSX¹fûÔ IYeÀfbSXÃff IYSX³fm fmÔ ³ffIYf¸f SXWXe AüSX fûSXeWXû ªff³fm IZY ¶ffý ·fe CÀfm BÀfIYe ·f³fIY·fe ³fWXeÔ »f¦fe.
JbdRY¹ff EªfmÔÀfe IZY Bd°fWXfÀf fmÔ OXmMXf¨fûSXe WXû³fm IYe Àf¶fÀfm ¶fOÞXe §fMX³ff IZY¶ffý °f`¹ffSX AfÔ°fdSXIY dSX´fûMXÊ fmÔ ¹fWX IYWXf¦f¹ff WX`. EIY dSX´fûMXÊ IZY A³fbÀffSX ¹fm Àf·fe
IYd¸f¹ffÔ IYf¸f IYSX³fm IYe ½f¿fûÊÔ fbSXf³fe CÀfÀfÔÀIYÈd°f IYû dýJf°fe WX`Ô dªfÀf¸fmÔ A´f³feÀfbSXÃff ´fi¯ff»fe IYû ÀfbSXdÃf°f IYSX³fm ´fSXª¹ffýf ²¹ff³f ³fWXeÔ dý¹ff ªff°ff. BÀf dSX´fûMXʸfmÔ BÀf A¸fmdSXIYe JbdRY¹ff EªfmÔÀfe ¸fmÔÀffB¶fSX ÀfbSXÃff IYû »fmIYSX IYBÊ ¦fÔ·feSXÀf½ff»f CNXfE ¦fE WX`Ô. Àfe³fmMX JbdRY¹ffÀfd¸fd°f IZY ½fdSXâ ÀfýÀ¹f E½fÔ Àfe³fmMXSXSXfg³f ½ffBOX³f ³fm ³¹ff¹f d½f·ff¦f Àfm BÀfÀfÔVfûd²f°f dSX´fûMXÊ IYû WXfdÀf»f dIY¹ff WX`.BÀfm fWX»fm BÀf Àff»f ÀfeAfBÊE IZY WX`dÔIY¦f°fSXeIYûÔ IYe fûSXe IZY ÀfÔ¶fÔ²f fmÔ Àf¶fc°f IZY°füSX fSX Aýf»f°f fmÔ fmVf dIY¹ff ¦f¹ff ±ff.C³WXûÔ³fm fÔ¦f»f½ffSX IYû EIY fÂf IZY Àff±f
BÀfm ªffSXe dIY¹ff WX`. ¹fWX ´fÂf C³WXûÔ³fmJbdRY¹ff d³fýmVfIY ªffg³f SXmMXd¢»fRY IYûd»fJf WX` AüSX C³fÀfm Àf½ff»f dIY¹ff dIYÀfÔ§fe¹f JbdRY¹ff EªfmÔÀfe IZY ´ffÀf SXf¿MÑXIYe ªfû JbdRY¹ff ªff³fIYfdSX¹ffÔ WX`Ô, ½fWXCÀfIYe ÀfbSXÃff IZY d»fE ¢¹ff IYSX SXWXm WX`Ô.2017 IYe dSX´fûMXÊ ¸fmÔ ÀfeAfBÊE õfSXfd½fSXûd²f¹fûÔ IZY ³fmMX½fIYÊ IYû WX`IY IYSX³fmIZY °f`¹ffSX dIYE ¦fE WX`dÔIY¦f IZY Af²fbd³fIY¸ff²¹f¸fûÔ IYe ¨fûSXe IYe ªffÔ¨f IZY ÀfÔ¶fÔ²f¸fmÔ ªff³fIYfdSX¹ffÔ ±feÔ. ¹fWX dSX´fûMXÊ Àf¶fÀfm´fWX»fm k½ffdÔVf¦fMX³f fûÀMXl ³fm fiIYfdVf°fIYe ±fe. dSX´fûMXÊ ¸fmÔ ¶f°ff¹ff ¦f¹ff WX` dIYd½fIYe»fe¢Àf ³fm fWXe³fûÔ fWX»fm ¹fWX §fû¿f¯ff
IYe ±fe dIY C³WXûÔ³fm ÀfeAfBÊE IZY d½fVfm¿fÀffB¶fSX JbdRY¹ff IZÔYýi õfSXf °f`¹ffSX dIYE¦fE WX`dÔIY¦f IZY °fSXeIYûÔ IYû WXfdÀf»f dIY¹ffWX`. ½fWXeÔ d½fdIY»fe¢Àf ³fm B³f¸fmÔ Àfm 35 IZY¶ffSXm fmÔ d½fÀ°fÈ°f ªff³fIYfSXe ·fe fiIYfdVf°fIYSX ýe ±fe. dSX´fûMXÊ fmÔ ¶f°ff¹ff ¦f¹ff WX` dIY2016 ¸fmÔ WXbBÊ ¹fWX ¨fûSXe Bd°fWXfÀf ¸fmÔAfÔIYOÞXûÔ IYe Àf¶fÀfm ¶fOÞXe fûSXe ff³fe ªffSXWXe WX`. BÀf¸fmÔ 180 ¦fe¦ff¶ffBMX Àfm »fmIYSX34 MXmSXf¶ffBMX °fIY »fÔ¶fe ªff³fIYfdSX¹ffÔ¨fûSXe WXbBÊ ±feÔ. EªfmÔÀfe IYû BÀf fûSXe IZY¶ffSXm ¸fmÔ ´f°ff ·fe CÀf Àf¸f¹f ¨f»ff, ªf¶fd½fdIY»fe¢Àf ³fm WXe EIY Àff»f ¶ffý BÀf¨fûSXe IYe §fû¿f¯ff IYe.
A¶f ²fûJZ¶ffþ fe³f ...
´fcUeÊ »fQÐQfJ fZÔ ¶fe°fe Àfû¸fUfSX IYe SXf°f·ffSX°fe¹f ÀfZ³ff IZY þUf³fûÔ IYe fe³fe ÀfZ³ffIZY þUf³fûÔ IZY Àff±f dWXÔÀfIY ÓfOÞX´f WXû¦fBÊ ±fe, dþÀf¸fZÔ 20 ·ffSX°fe¹f þUf³fûÔIYe þf³f f»fe ¦fBÊ W`X, dþÀfÀfZ dIY fWX»fZÀfZ Àfe¸ff fSX f»f SXWXf °f³ffU AüSX ³ffþbIYdÀ±fd°f fZÔ Af ¦f¹ff W`X. UWXeÔ, ¶fOÞXe ÀfÔ£¹ff¸fZÔ fe³fe Àf`d³fIY ·fe ffSXZ ¦fE. WXf»ffÔdIY¨fe³f IYe ÀfZ³ff IZY dIY°f³fZ dÀf´ffWXe ¸ffSXZ¦fE BÀfZ »fZIYSX IYûBÊ ·fe Afd²fIYfdSXIY¶f¹ff³f A·fe °fIY ³ff ·ffSX°f IYe °fSXRY ÀfZAf¹ff W`X AüSX ³ff ¨fe³f IYe °fSXRY ÀfZ.´fi²ff³f¸fÔÂfe ³fSXZÔýi fûQe VfbIiYUfSX IYû Vff¸f´ffÔ¨f ¶fþZ ¶fb»ffBÊ ¦fBÊ BÀf fedMXÔ¦f fZÔ Af¦fZIYe fdSXdÀ±fd°f¹fûÔ fSX f¨ffÊ IYSXZÔ¦fZ.´fcSXZ E»fEÀfe ´fSX ÀfZ³ff A»fMXÊ,IY¸ffÔOXSXûÔ IYû Jb»fe LcMX - ÀfcÂfûÔ IYe¸ff³fZÔ, °fû fe³f ¶ffgOXÊSX IZY WXf»ff°f fZÔ A·feª¹ffQf ¶fQ»ffU ³fWXeÔ Af¹ff W`X. ¶ff°f¨fe°fIYf IYûBÊ WX»f d³fIY»fIYSX Àff¸f³fZ ³fWXeÔAf¹ff W`X. A¶f dÀfRÊY »fQÐQfJ WXe ³fWXeÔ¶fd»IY fcSXZ E»fEÀfe fSX ÀfZ³ff A»fMXÊ W`X.ÀfbSXÃff¶f»fûÔ IYû ¨fe³f IYe dIYÀfe ·fedWX¸ffIY°f IYf ·fSX´fcSX þUf¶f QZ³fZ IYûIYWXf ¦f¹ff W`X. ÀfZ³ff, Uf¹fbÀfZ³ff AüSX³füÀfZ³ff IYû CX¨¨f°f¸f À°fSX ´fSX A»fMXÊSXWX³fZ IYû IYWXf ¦f¹ff W`X. Àf·fe ÀfZ³ffAûÔIYû ¶fbSXe ÀfZ ¶fbSXe dÀ±fd°f IZY d»fE °f`¹ffSXSXWX³fZ IYû IYWXf ¦f¹ff W`X. ÀfZ³ff, Uf¹fbÀfZ³ffAüSX ³fZUe CX¨¨f°f¸f À°fSX IZY A»fMXÊ fSXW`XÔ AüSX ¶f°ff¹ff þf SXWXf W`X dIY WXd±f¹ffSXûÔIYf fcU¸fZÔMX ·fe VfbøY WXû fbIYf W`X. ÀfcÂfûÔ³fZ ¶f°ff¹ff dIY »fûIY»f IY¸ffÔOXSXûÔ IYû¨fe³f ÀfZ d³f´fMX³fZ IZY d»fE Jb»fe LcMX QZQe ¦fBÊ W`X.¨fe³f ³fZ §fMX³ff IYf ´fcSXf Qû¿f ·ffSX°f´fSX OXf»ff - ¦f»fUf³f §ffMXe ÀfÔ§f¿fÊ fSX¨fe³fe dUQZVf fÔÂff»f¹f IZY fiU¢°ff ÓffAûd»fdþ¹f³f ³fZ IYWXf dIY ¨fe³fe ´fÃf ÀfZ,WX¸f ·ffSX°f IZY Àff±f AüSX Ad²fIY ÓfOÞX´fûÔIYû ³fWXeÔ QZJ³ff ffWX°fZ W`XÔ. ¦f»fUf³f §ffMXeÃfZÂf IYe ÀfÔ fi·fb°ff WX fZVff fe³f ÀfZ ÀfÔ¶fÔd²f°fSXWXe W`X. Àfe¸ff ÀfZ þbOÞXZ fbQÐQûÔ AüSX WX¸ffSXeIY¸ffÔOXSX À°fSX IYe Uf°ffÊ IYe ÀfUÊÀf¸¸fd°fIZY ¶ffQ ·fe ·ffSX°fe¹f Àf`d³fIYûÔ ³fZ WX¸ffSXeÀfe¸ff ´fiûMXûIYfg»f IYf CX»»fÔ§f³f dIY¹ff
W`X. WX¸f ·ffSX°f ÀfZ A´f³fZ Àfe¸ffU°feÊÀf`d³fIYûÔ IYû Àf£°fe ÀfZ A³fbVffdÀf°fIYSX³fZ, CX»»fÔ§f³f AüSX CXØfZþIY¦fd°fdUd²f IYû SXûIY³fZ IZY d»fE ¶ff°f¨fe°fIZY ff²¹f¸f ÀfZ f°f·fZQûÔ IYû Àfb»fÓff³fZ IZYd»fE IYWX°fZ SXWXZ W`XÔ. WX¸f SXfþ³fd¹fIY AüSXÀf`³¹f f`³f»fûÔ IZY ff²¹f¸f ÀfZ ÀfÔ¨ffSX IYSXSXWXZ W`XÔ. BÀfIYf ÀfWXe AüSX ¦f»f°f WXû³ff¶fWXb°f À´fá W`X . WX¸f IcYMX³fed°fIY AüSXÀf`³¹f ¨f`³f»fûÔ IZY ¸ff²¹f¸f ÀfZ ¶ff°f¨fe°fIYSX SXWXZ W`XÔ. BÀfIYf ÀfWXe AüSX ¦f»f°f¶fWXb°f À´fá W`X ... ¹fWX §fMX³ff E»fEÀfe IZY¨fe³fe ÀffBOX ´fSX WXbBÊ AüSX BÀfIZY d»fE¨fe³f IYû Qû¿f ³fWXeÔ dQ¹ff þf³ff ffdWXE. ·ffSX°f-¨fe³f IZY ¶fe¨f fZþSX þ³fSX»f»fZU»f IYe ¶ff°f ¶fZ³f°feªff SXWXe -·ffSX°f AüSX fe³f IZY ¶fe¨f fZþSX þ³fSX»f»fZU»f IZY ¶fe¨f 3 §faMZX f»fe ¶ff°f¨fe°f¶fZ³f°feªff SXWXe. ¦f»fUf³f §ffMXe fZÔ WXe Qû³fûÔQZVfûÔ IZY ¶fe¨f ¹fZ ¶ff°f¨fe°f WXû SXWXe ±fe,°ffdIY füþcQf °f³ffU IYû §fMXf¹ff þfE.
3 OXfg¢MXSX AüSX »f`¶f ...BÀf Jb»ffÀfZ IZY ¶ffQ A²fZOÞX IZY
´fdSXªf³fûÔ Àf¸fZ°f ¶ffIYe ÀffSmX »fû¦fûÔ IYeªffa¨f VfbøY IYe ªff SXWXe W`X. A²fZOÞXSXfªf³ffaQ¦ffa½f IYe EIY A³ffªf QbIYf³f fZÔIYf¸f IYSX°ff ±ff. AdJ»f ·ffSX°fe¹fAf¹fbdUÊÄff³f ÀfaÀ±ff³f(E¸Àf) ÀfZ d´fLX»fZ24 §faMZX ¸fZÔ ªfWXfa BX»ffªf IZY d»fE ·f°feÊ23 ¸fSXeªfûÔ IYû À½fÀ±f WXû³fZ IZY ¶ffQdOXÀ¨ffªfÊ IYSX dQ¹ff ¦f¹ff. ½fWXeÔ ffSX ³f¹fZ¸fSXeªfûÔ IYû AfBXÀfû»fZVf³f ½ffOÊX fZÔ BX»ffªfIZY d»fE ·f°feÊ dIY¹ff ¦f¹ff. BX²fSX ¶fb²f½ffSXIYû E¸Àf IYe »f`¶f ³fZ 24 ffgdªfdMX½f IYe´fbd¿MX ·fe WXû ¦fBÊX. E¸Àf IZY OXf¹fSmX¢MXSXOXfg. d³fd°f³f E¸f ³ff¦fSXIYSX ³fZ ¶f°ff¹ff dIYA·fe E¸Àf IZY IYûdUOX UfOXÊ ¸fZa 163¸fSXeªfûÔ IYf BX»ffªf f»f SXWXf W`X.
VfWXeQ IYf fdSX½ffSX ...CXÀfIZY ff°ff-d´f°ff ³fZ CX³fIZY d»fE »fOÞXIYe·fe PXcaPX SXJe ±fe, ¶fÀf Ba°fþfSX ±ff ¦f¯fZVfIZY Uf´fÀf Af³fZ IYf, »fZdIY³f CX³WXZa ¢¹ff´f°ff ±ff dIY ¦f¯fZVf IYe VfWXfQ°f IYe J¶fSXAfE¦fe. ¦f¯fZVf IZY QûÀ°f fWXZaQi ³fZ ¶f°ff¹ffdIY ½fWX IY·fe ·fe Àfe¸ff IZY WXf»ff°f fSX¨f¨ffÊ ³fWXea IYSX°ff ±ff. ¶fd»IY þ¶f ·fe
d¸f»f°fZ, fÀ°fe fªffIY WXe WXfZ°fe ±fe.
¦fSXe¶fûÔ IYû EIY dIY»fû ...ªfc³f ¸fmÔ ASXWXSX ýf»f d½f°fSX¯f IZY d»fEMXm¶f»fmMX ¸fmÔ Af½fV¹fIY ´fif½f²ff³f dIY¹ff¦f¹ff WX`. Jfô Àfd¨f½f ³fm SXfª¹f IZY Àf·feIY»fm¢MXSXûÔ IYû SXfVf³fIYfOXʲffSXe ¦fSXe¶f´fdSX½ffSXûÔ IYû d³f:Vfb»IY ASXWXSX ýf»fCd¨f°f ¸fc»¹f IYe ýbIYf³fûÔ Àfm ¸ffWX ªfc³fIYf d½f°fSX¯f IYSXf³fm IYû IYWXf WX`.
´fiQZVf IZY WXSX ½f³f ...´fVfb d¨fdIY°Àff d½f·ff¦f ÀfZ d¨fdIY°ÀfIYûÔIYû ½f³f d½f·ff¦f ¸fZÔ ´fid°fd³f¹fbd¢°f¹ffa QeªffEa¦fe. U³¹f ´fifd¯f¹fûa °f±ff ªfa¦f»feWXfd±f¹fûÔ IYe Àf°f°f d³f¦fSXf³fe IZY d»fEÀf·fe fi·ffd½f°f ½f³f f¯OX»fûÔ fZÔ 10-10»fû¦fûÔ IYe MXe¸f °f`¹ffSX IYe ªffE¦fe.
¶f`NXIY fZÔ EIY Àf´°ffWX IZY Aa°fSXf»f¸fZÔ 5 WXfd±f¹fûÔ IYe ¸fü°f IYû »fZIYSX ·fe¨f¨ffÊ WbXBÊ. d½f¨ffSX - d½f¸fVfÊ IZY ¶ffQ °f¹fWbXAf W`X dIY U³¹f ´fifd¯f¹fûa IZY CX´f¨ffSXIZY d»fE Qû A°¹ff²fbd³fIY AüSXÀfUÊÀfbdU²ff ¹fböY AÀ´f°ff»f dUIYdÀf°fdIY¹ff ªffE. fb£¹f¸faÂfe ³fZ U³¹f fifd¯f¹fûaIYû °UdSX°f CX´f¨ffSX dQ»ff³fZX ³f¹ff SXf¹f´fbSXIZY þa¦f»f ÀfRYfSXe dÀ±f°f ´fVfbd¨fdIY°Àff»f¹f AüSX d¶f»ffÀf´fbSX IZYIYf³f³f fZaOXfSXe dÀ±f°f fVfb d¨fdIY°Àff»f¹fIYû A°¹ff²fbd³fIY AüSX ÀfUÊÀfbdU²ff ¹fböYAÀ´f°ff»f IZY øY´f ¸fZa dUIYdÀf°f IYSX³fZIZY d³fQÊZVf dQE. U³f ¸faÂfe ¸fûWX¸¸fQAIY¶fSX ³fZ ¶f°ff¹ff dIY U³f dU·ff¦f ¸fZaU°fʸff³f ¸fZa IYf¹fÊSX°f ´fVfb d¨fdIY°ÀfIYÀfadUQf d³f¹fbdöY fSX WX`a. U³¹f fifd¯f¹fûa IZYCX´f¨ffSX IZY d»fE dUVfZ¿fÄf d¨fdIY°ÀfIY¶f³f³fZ IZY ´fWX»fZ WXe IYBÊ d¨fdIY°ÀfIYA³¹f ÀfZUfAûa fZa f»fZ þf°fZ WX`a, dþÀfIZYIYfSX¯f U³¹f´fifd¯f¹fûa IZY CX´f¨ffSX fZa IYBʶffSX IYdNX³ffB¹ffa Af°fe WX`a. fb£¹f¸faÂfe ³fZU³f faÂfe IZY A³fbSXû²f fSX fVfb d¨fdIY°ÀffdU·ff¦f fZa IYf¹fÊSX°f d¨fdIY°ÀfIYûa IYû U³fdU·ff¦f fZa fid°fd³f¹fbdöY fSX »fZ³fZ IZY d³fQÊZVfdQE. CX³WXûa³fZ Àf·fe 20 U³f f¯OX»fûa fZaþWXfa U³¹f ´fifd¯f¹fûa IYe Àfa£¹ff ª¹ffQfWX, UWXfa B³f d¨fdIY°ÀfIYûa IYû fif±fd¸fIY°ffÀfZ °f`³ff°f IYSX³fZ IYWXf.
OXfg¢MXSX IZY dJ»ffRY ERYAfBÊAfSX ff¸f»fm¸fmÔ IYûMÊX ³fZ dý»»fe ÀfSXIYfSX IYû Qe fm°ff½f³fe
w EªfZÔÀfeÜ ³fBÊX dQ»»fe. www.navabharat.org
C¨¨f°f¸f ³¹ff¹ff»f¹f ³fm ÀfSXIYfSXeAÀ´f°ff»f IYe ¶fýWXf»fe IYe½fedOX¹fû¦fifRYe IYSXIZY BÀfm ÀffÓff IYSX³fm½ff»fm OXfg¢MXSX IZY dJ»ffRY ´fif±fd¸fIYeýªfÊ IYSXf³fm IYe IYfSXʽffBÊ fSX IYOÞXf ÷YJA´f³ff°fm WXb¹fm ¶fb²f½ffSX IYû IZYªfSXe½ff»fÀfSXIYfSX Àfm IYWXf dIY C³WXmÔ fSXmVff³f IYSX³ff¶fÔý IYSXm.
Vfe¿fÊ Aýf»f°f ³fm dý»»fe ÀfSXIYfSXÀfm ªff³f³ff ffWXf dIY CÀf³fm C°°fSXe dý»»fe¸fmÔ dÀ±f°f ÀfSXIYfSXe AÀ´f°ff»f fmÔ d³f¹fböYOXfg¢MXSX IZY dJ»ffRY ERYAfBÊAfSX ¢¹fûÔýªfÊ IYSXf¹fe AüSX CÀfm ½fedOX¹fû ÀffÓffIYSX³fm ´fSX d³f»fÔd¶f°f ¢¹fûÔ dIY¹ff?³¹ff¹ff»f¹f ³fm Àf£°f Vf¶ýûÔ ¸fmÔ IYWXf,´fifd²fIYfdSX¹fûÔ IYû CÀfm ´fSXmVff³f IYSX³ff¶fÔý IYSX³ff ffdWX¹fm. feNX ³fm À´fá Vf¶ýûÔ
¸fmÔ IYWXf dIY ¹fm OXfg¢MXSX AüSX ³fÀfÊ IYûSXû³ff¹fûðf WX`Ô AüSX B³WXmÔ ÀfÔSXÃf¯f fiýf³f IYSX³fmIYe Af½fV¹fIY°ff WX`Ü ³¹ff¹f¸fcÍ°f AVfûIY·fc¿f¯f, ³¹ff¹f¸fcÍ°f ÀfÔªf¹f dIYVf³f IYü»fAüSX ³¹ff¹f¸fcÍ°f E¸f AfSX VffWX IYe feNX³fm ÀfSXIYfSXe AÀ´f°ff»fûÔ fmÔ IYûd½fOX-19IZY fSXeªfûÔ IZY Àff±f WXû SXWXm ½¹f½fWXfSX °f±ffVf½fûÔ IZY fi¶fÔ²f³f IZY ff¸f»fm IYf ½fedOX¹fûIYfg³RiYmÔÀf IZY ¸ff²¹f¸f Àfm Àfb³f½ffBÊ IZYýüSXf³f dý»»fe ÀfSXIYfSX IYû IYOÞXeRYMXIYfSX »f¦ffBÊÜ feNX ³fm BÀf ff¸f»fm IYfÀ½f°f: WXe ÀfÔÄff³f d»f¹ff ±ff. dýneÀfSXIYfSX IYe AûSX Àfm Ad°fdSXöY
Àffd»fÀfeMXSX ªf³fSX»f ÀfÔªf¹f ªf`³f ³fm feNXÀfm IYWXf dIY ½fWX SXfªf²ff³fe ¸fmÔ ¸fSXeªfûÔIYe ýmJ·ff»f IYSX³fm, Vf½fûÔ IZY ´fi¶fÔ²f³fAüSX IYûd½fOX -19 IYe ªffÔ f IYe ÀfÔ£¹ff¶fPXÞf³fm IZY d»f¹fm ´fid°f¶fð WX`. dý»»feÀfSXIYfSX ³fm ´feNX IYû Àfcd¨f°f dIY¹ff dIY»fûIY³ff¹fIY ªf¹f´fiIYfVf AÀ´f°ff»f IYfIZY³ýie¹f ¦fÈWX fÔÂfe Ad¸f°f VffWX ³fm WXf»fWXe fmÔ ýüSXf dIY¹ff ±ff AüSX BÀfIZY ¶ffý Àfm½fWXfÔ dÀ±fd°f fmÔ Àfb²ffSX WXbAf WX`. feNX ³fmIZY³ýi Àfm IYWXf dIY AÀ´f°ff»f Àfm LXb˜e´ff³fm ½ff»fm IYûd½fOX-19 IZY ¸fSXeªfûÔ IZY¶ffSXm ¸fmÔ CÀfIYe ·ffSX°fe¹f d¨fdIY°ÀffA³fbÀfÔ²ff³f ´fdSX¿fý IZY dýVffd³fýmÊVfûÔ IZYA³fbøY´f EIY ³fed°f WXû³fe ffdWXE. feNX³fm IZY³ýi AüSX A³¹f õfSXf ýfdJ»fWX»fRY³ff¸fûÔ IZY A½f»fûIY³f IZY ¶ffýIYWXf dIY BÀf ¸ff¸f»fm ¸fmÔ A¶f 19 ªfc³fIYû Af¦fm d½f¨ffSX dIY¹ff ªff¹fm¦ff.
OXfg¢MXSX ³fZ ÀfSXIYfSXe AÀ´f°ff»f IYe ¶fQWXf»fe IYe ½fedOX¹fû¦fifRYe IYSX ½ff¹fSX»f dIY¹ff ±ff
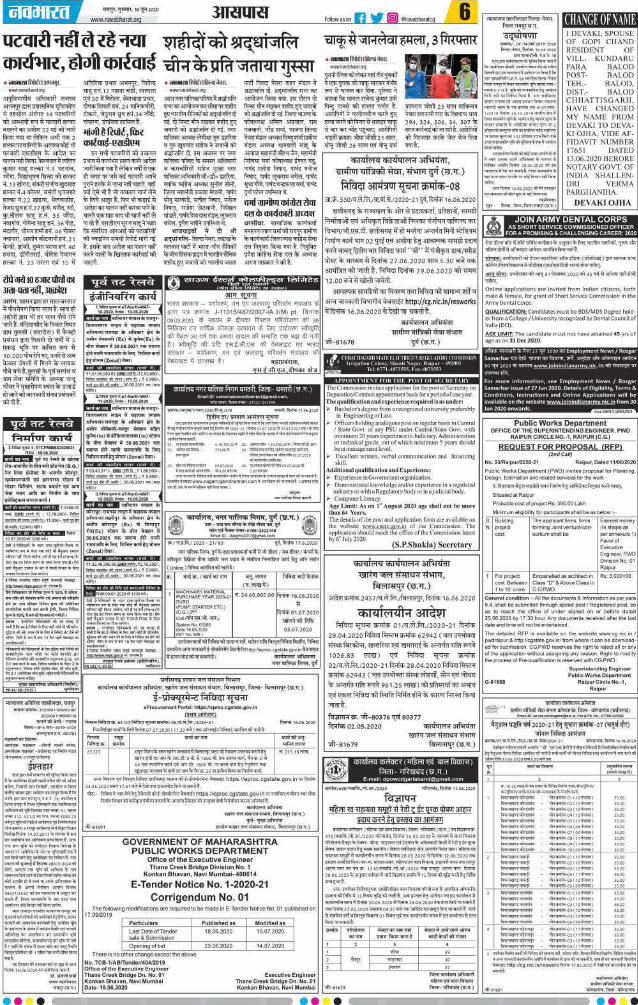
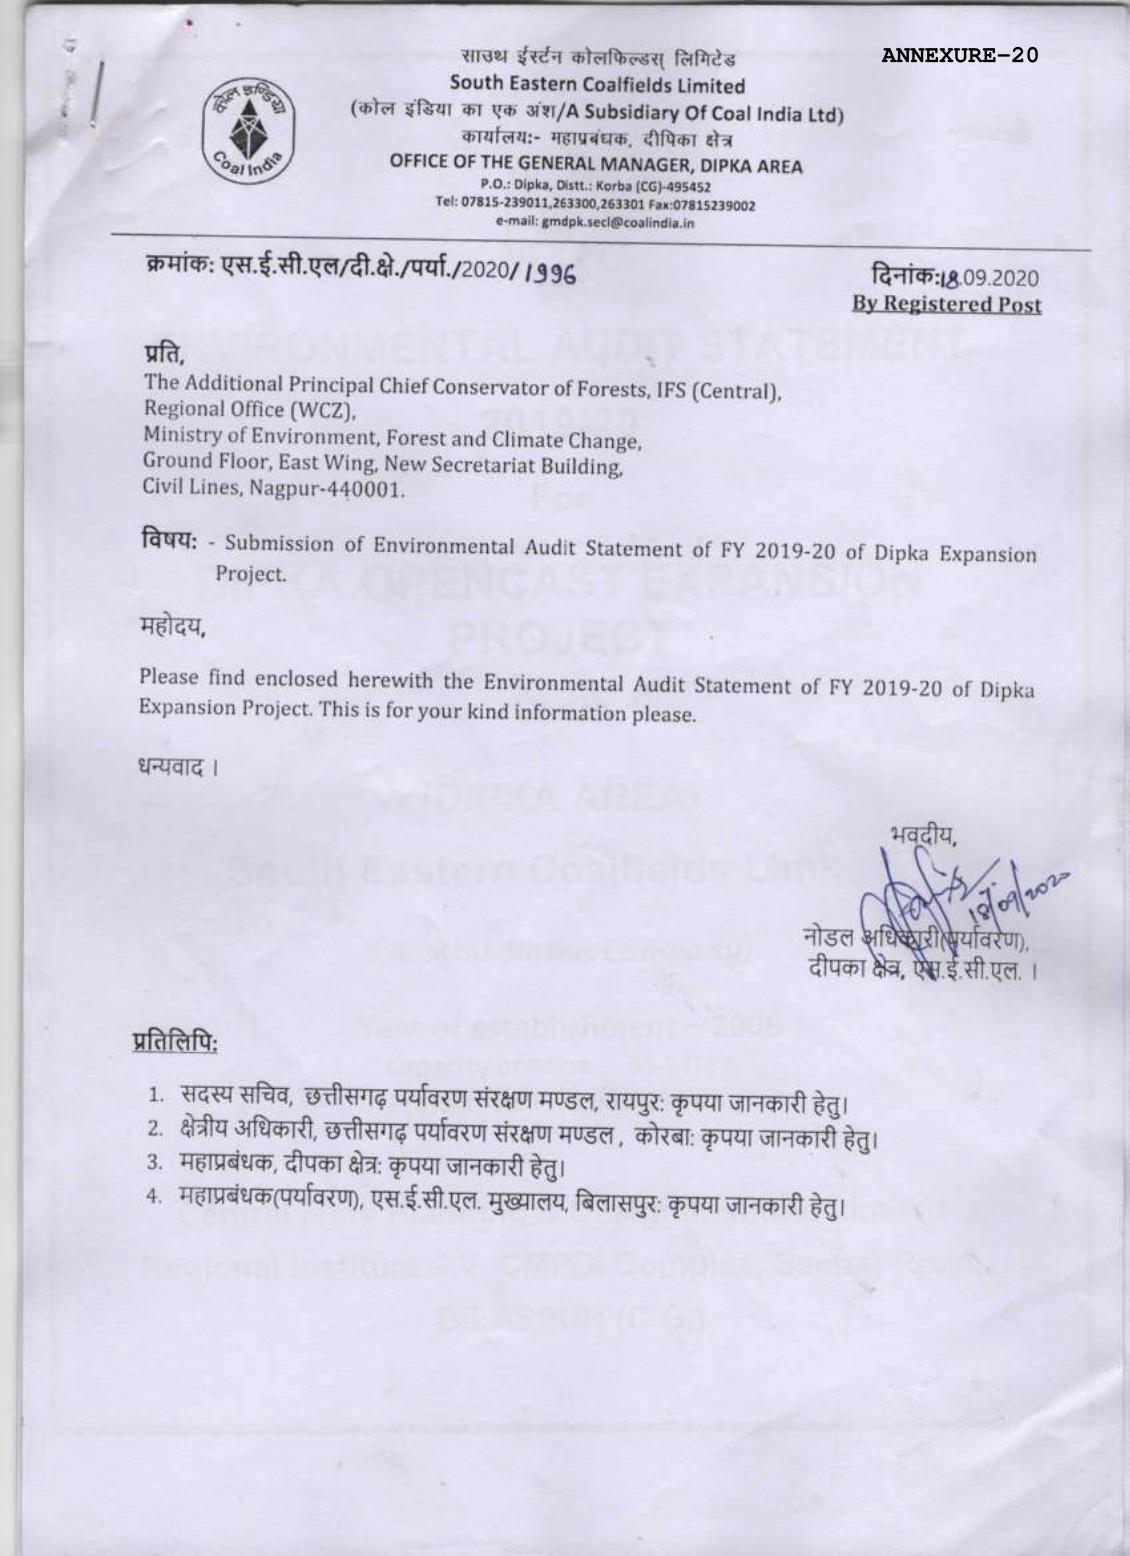
ANNEXURE-20
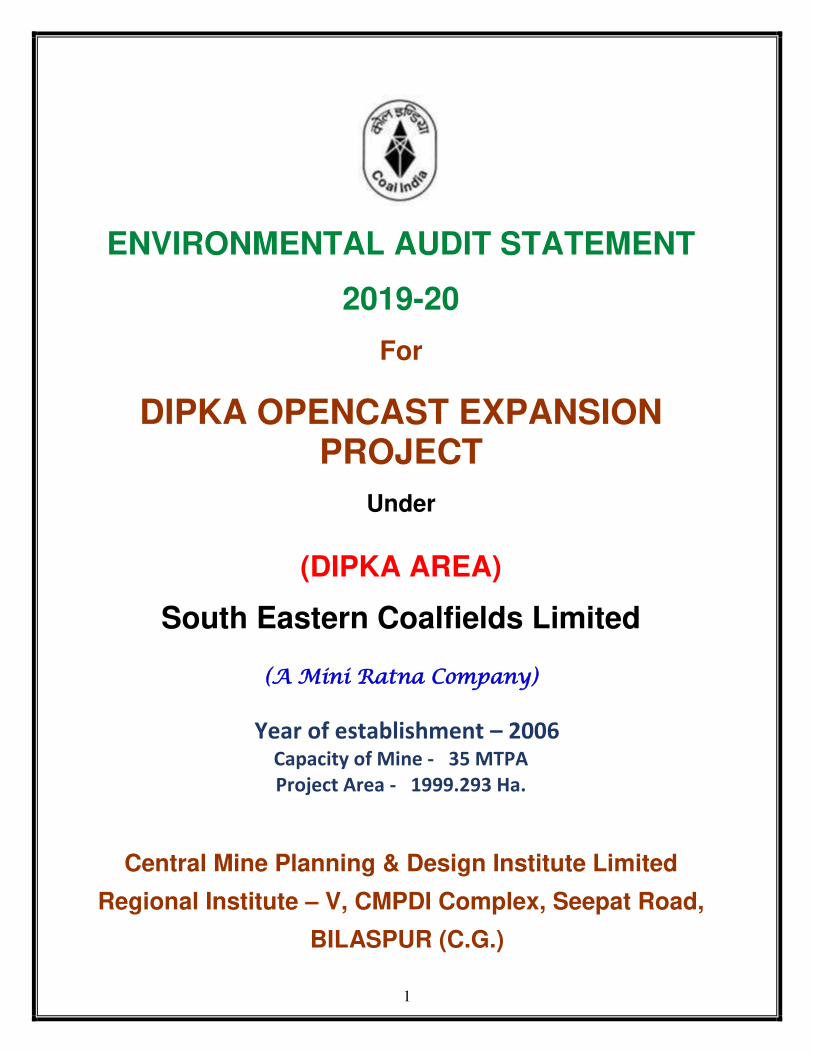
1
ENVIRONMENTAL AUDIT STATEMENT
2019-20
For
DIPKA OPENCAST EXPANSION PROJECT
Under
(DIPKA AREA)
South Eastern Coalfields Limited
(A Mini Ratna Company)
Year of establishment – 2006 Capacity of Mine - 35 MTPA
Project Area - 1999.293 Ha.
Central Mine Planning & Design Institute Limited
Regional Institute – V, CMPDI Complex, Seepat Road,
BILASPUR (C.G.)
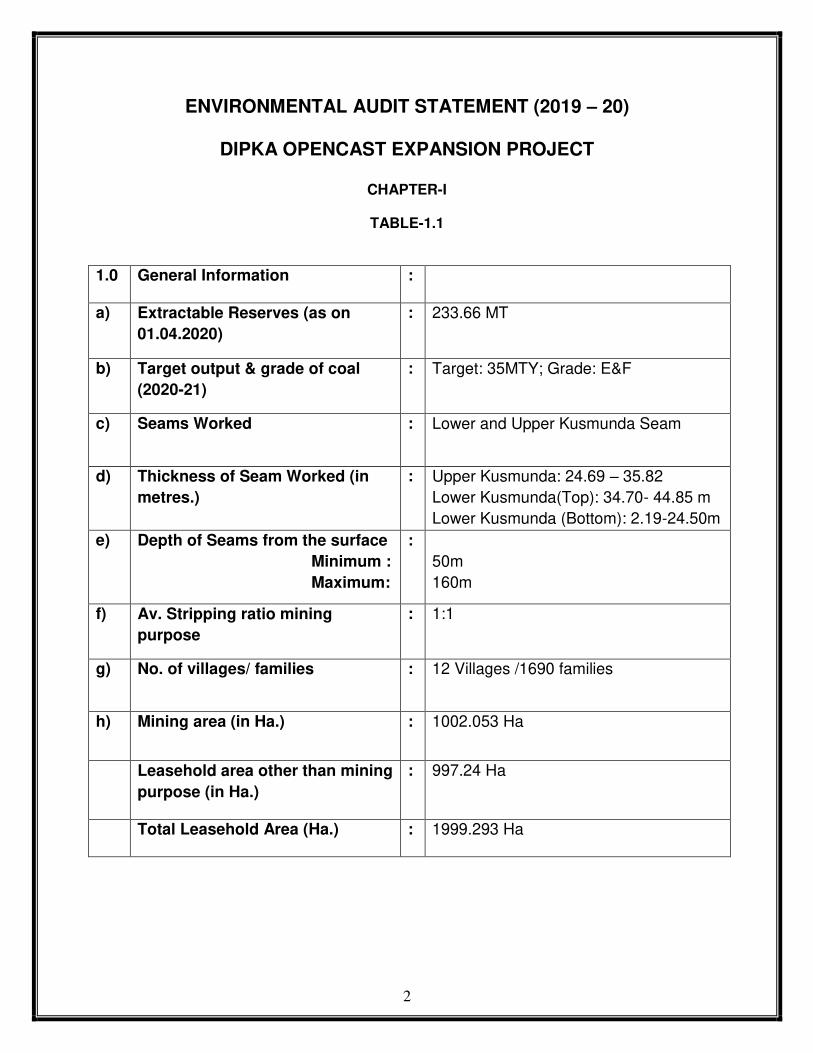
2
ENVIRONMENTAL AUDIT STATEMENT (2019 – 20)
DIPKA OPENCAST EXPANSION PROJECT
CHAPTER-I
TABLE-1.1
1.0 General Information :
a) Extractable Reserves (as on
01.04.2020)
: 233.66 MT
b) Target output & grade of coal
(2020-21)
: Target: 35MTY; Grade: E&F
c) Seams Worked : Lower and Upper Kusmunda Seam
d) Thickness of Seam Worked (in
metres.)
: Upper Kusmunda: 24.69 – 35.82
Lower Kusmunda(Top): 34.70- 44.85 m
Lower Kusmunda (Bottom): 2.19-24.50m
e) Depth of Seams from the surface
Minimum :
Maximum:
:
50m
160m
f) Av. Stripping ratio mining
purpose
: 1:1
g) No. of villages/ families : 12 Villages /1690 families
h) Mining area (in Ha.) : 1002.053 Ha
Leasehold area other than mining
purpose (in Ha.)
: 997.24 Ha
Total Leasehold Area (Ha.) : 1999.293 Ha
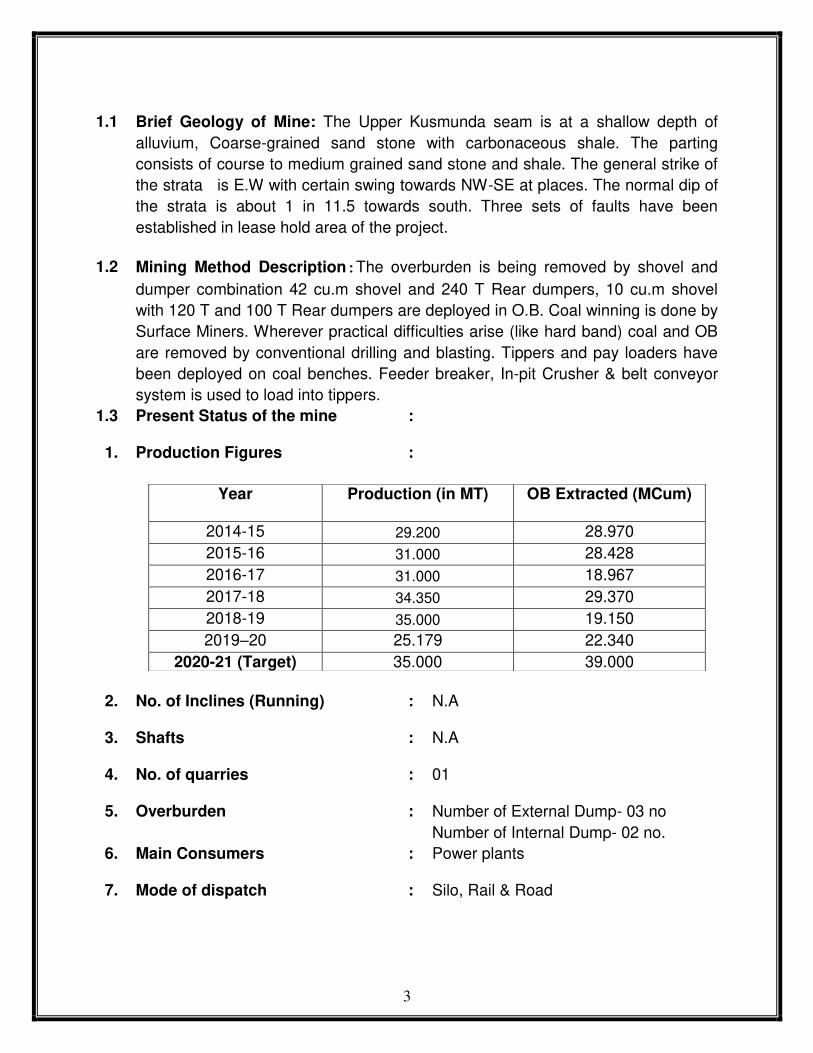
3
1.1 Brief Geology of Mine: The Upper Kusmunda seam is at a shallow depth of
alluvium, Coarse-grained sand stone with carbonaceous shale. The parting
consists of course to medium grained sand stone and shale. The general strike of
the strata is E.W with certain swing towards NW-SE at places. The normal dip of
the strata is about 1 in 11.5 towards south. Three sets of faults have been
established in lease hold area of the project.
1.2 Mining Method Description:The overburden is being removed by shovel and
dumper combination 42 cu.m shovel and 240 T Rear dumpers, 10 cu.m shovel
with 120 T and 100 T Rear dumpers are deployed in O.B. Coal winning is done by
Surface Miners. Wherever practical difficulties arise (like hard band) coal and OB
are removed by conventional drilling and blasting. Tippers and pay loaders have
been deployed on coal benches. Feeder breaker, In-pit Crusher & belt conveyor
system is used to load into tippers.
1.3 Present Status of the mine :
1. Production Figures :
Year Production (in MT) OB Extracted (MCum)
2014-15 29.200 28.970
2015-16 31.000 28.428
2016-17 31.000 18.967
2017-18 34.350 29.370
2018-19 35.000 19.150
2019–20 25.179 22.340
2020-21 (Target) 35.000 39.000
2. No. of Inclines (Running) : N.A
3. Shafts : N.A
4. No. of quarries : 01
5. Overburden : Number of External Dump- 03 no
Number of Internal Dump- 02 no.
6. Main Consumers : Power plants
7. Mode of dispatch : Silo, Rail & Road
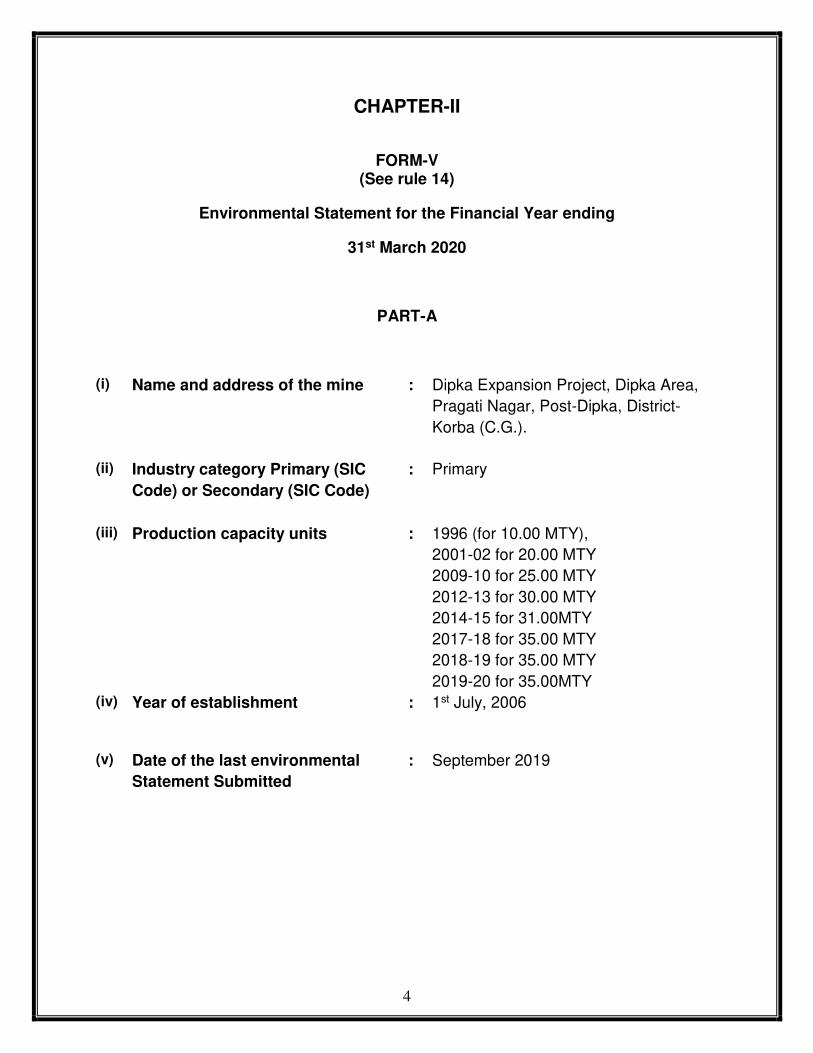
4
CHAPTER-II
FORM-V
(See rule 14)
Environmental Statement for the Financial Year ending
31st March 2020
PART-A
(i) Name and address of the mine : Dipka Expansion Project, Dipka Area,
Pragati Nagar, Post-Dipka, District-
Korba (C.G.).
(ii) Industry category Primary (SIC
Code) or Secondary (SIC Code)
: Primary
(iii) Production capacity units : 1996 (for 10.00 MTY),
2001-02 for 20.00 MTY
2009-10 for 25.00 MTY
2012-13 for 30.00 MTY
2014-15 for 31.00MTY
2017-18 for 35.00 MTY
2018-19 for 35.00 MTY
2019-20 for 35.00MTY
(iv) Year of establishment : 1st July, 2006
(v) Date of the last environmental
Statement Submitted
: September 2019

5
PART-B
Water and Raw Materials Consumption
(i) Water Consumption (KLD)
Industrial consumption: Rainy Season - 1678.40 KLD Non-Rainy Season - 2327.02 KLD
Domestic consumption: - 1050 KLD
Name of Products
Process water consumption per product output During the previous financial
year 2018-19 During the current financial
year 2019-20 Coal Water is not required during coal production
(ii) Raw materials consumption *Name of raw materials
Name of products
Consumption of raw material per unit of output During the previous
financial year 2018-19 During the current
financial year 2019-20 Explosive Coal 0.257 kg/tonne 0.539 kg/tonne
P.O.L Coal 0.355 lit/tonne 0.455 lit/tonne
*Industry may use codes if disclosing details of raw materials would violate contractual obligations, otherwise all industries have to name the raw materials used.
PART-C
POLLUTANT DISCHARGED TO ENVIRONMENT/ UNIT OF OUTPUT
(Parameters as specified in the consent issued) Pollutants
(Including mine & colony discharge of water)
Quantity of pollutants
discharged (mass/day)
Concentrations of pollutants in discharges
(mass/ volume)
Percentage of variation from
prescribed standards with
reasons
Air Not Quantified
Environmental Monitoring report
enclosed
Environmental Monitoring report
enclosed
Water 1. Mine water pumped out 10,776.52 KLD 2. Industrial water
discharged Nil
3. Colony water discharged 840.00KLD(approx)
Noise Not Quantified
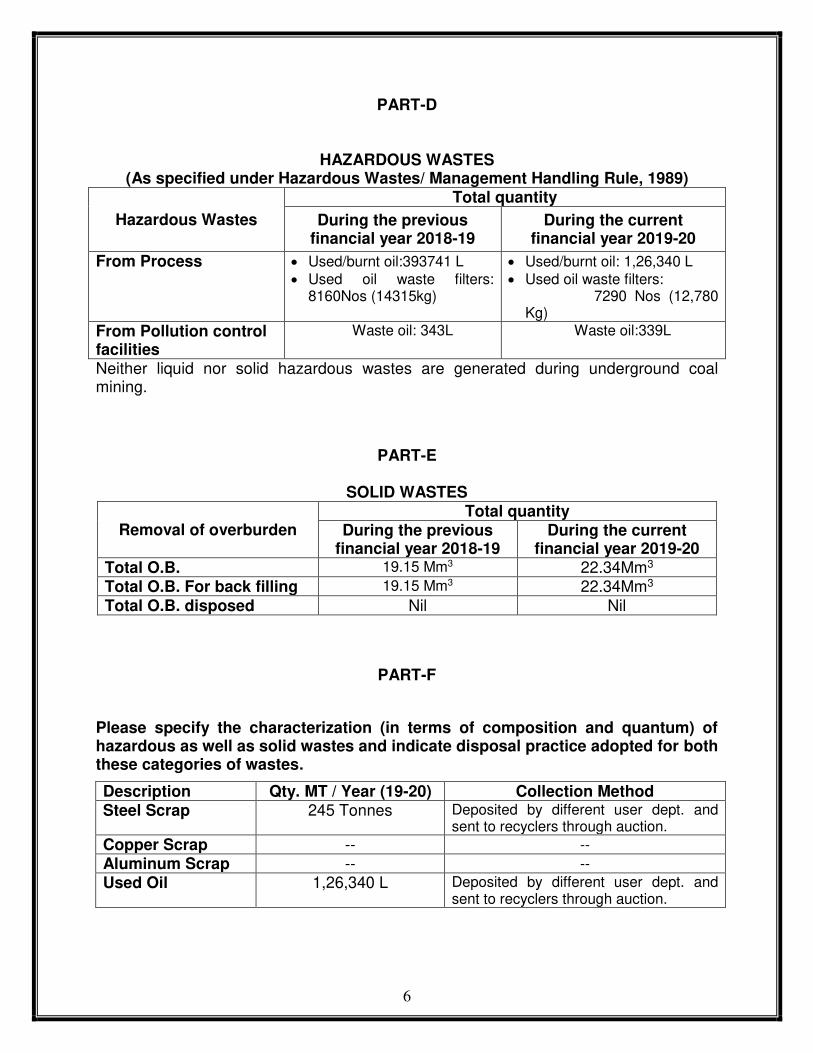
6
PART-D
HAZARDOUS WASTES (As specified under Hazardous Wastes/ Management Handling Rule, 1989)
Hazardous Wastes
Total quantity
During the previous financial year 2018-19
During the current financial year 2019-20
From Process Used/burnt oil:393741 L
Used oil waste filters: 8160Nos (14315kg)
Used/burnt oil: 1,26,340 L
Used oil waste filters: 7290 Nos (12,780 Kg)
From Pollution control facilities
Waste oil: 343L Waste oil:339L
Neither liquid nor solid hazardous wastes are generated during underground coal mining.
PART-E
SOLID WASTES
Removal of overburden Total quantity
During the previous financial year 2018-19
During the current financial year 2019-20
Total O.B. 19.15 Mm3 22.34Mm3
Total O.B. For back filling 19.15 Mm3 22.34Mm3
Total O.B. disposed Nil Nil
PART-F
Please specify the characterization (in terms of composition and quantum) of hazardous as well as solid wastes and indicate disposal practice adopted for both these categories of wastes.
Description Qty. MT / Year (19-20) Collection Method Steel Scrap 245 Tonnes Deposited by different user dept. and
sent to recyclers through auction.
Copper Scrap -- --
Aluminum Scrap -- --
Used Oil 1,26,340 L Deposited by different user dept. and sent to recyclers through auction.
7
PART-G Impact of the pollution abatement measure taken on conservation of natural resources and on the cost of production.
Air Pollution, Control & Conservation Measures:
1. 289 Nos. of fixed sprinklers has been installed on approximately 5.5 Km of coal
transport road and 5 Nos. at railway siding and is working satisfactory.
2. 5 no. 70KL, 03 no. 28 KL and 03 no. 10KL water tankers has been deployed on
haul road for suppression of dust emission.
3. Every year extensive plantation is being done both on plain and dump area by
Chhattisgarh Van Vikas Nigam (a state government organization) and till date
about 20,91,047 nos of plant planted on approx 798.81 Ha area. During the FY
2019-20, 150665 plants have been planted in 58.33 Ha of land.
4. 10 no. rain guns have been provided in Coal transportation road and 11 Nos. in
railway siding for effective dust suppression.
5. Black topping of transport road for 9.7 km has been done to arrest fugitive dust
emission.
6. Concreting of coal transport road from BSES chowk to Shramik chowk to Dipka
police station chowk and also concreting of road from Shramik chowk to
Gandhinagar is being done to avoid fugitive dust emission.
7. Inpit belt conveyor system has been commissioned with mist spray systems and
is working satisfactorily.
8. Mist spray and conventional system of spray has been installed in the feeder
breaker of CHP.
9. Mobile Water sprinkling on coal stock is practiced diligently.
10. Wetting of coal before handling in CHP during handling in CHP and finally in
loading operations.
11. The dust and mud accumulation along the haul road and service roads are
periodically cleaned to curb fugitive dust emission.
12. CAAQMS has been installed/commissioned on 18/01/2014 at Dipka Area.
13. Adequate green belts have been developed in and around the pragati nagar
residential colony, office complexes etc.
14. Surface Miners deployment since 2009-2010 has largely reduced the dust
emission which was emitting through drilling, blasting and crushers.
15. Long Range Fogging Machine has been received in April 2019 and is deployed
in Dipka OCP for dust suppression.
16. Mechanized Sweeping Machine has been deployed during Nov 2019 at Dipka
OCP for dust suppression at township and colony roads.

8
Water Pollution, Control & Conservation Measures:
1. The sedimentation ponds are provided for treating the mine water discharge. The
treated mine water is used for dust suppression activities. There are 02
sedimentation ponds namely Sirki and Chainpur. Pragati nagar pond and Silo
Pond acts as ground water recharge pond.
2. O&G trap of 110KL capacity has been installed in workshop area for the
treatment of effluent generated after washing the HEMM trough oil and grease
trap in effluent treatment plant. The treated effluent is re-used for washing
HEMM‘s in workshop. 3. 3.2km pucca catch drain has been constructed around dump no 3&5 to control
soil erosion and water pollution. Regular de-siltation of drains is carried out
before monsoon.
4. Domestic effluent treatment plant of 3.00 MLD capacity has been constructed.
The plant is combined with the Gevra project.
5. Storm water drains have been constructed in the office buildings and colony.
6. Rainwater harvesting have been installed in the colony and office buildings.
There are 51 RWH systems constructed in Dipka area.
7. Garland drains being made around the periphery of the quarry to drain off the
rain water away from the workings in order to maintain surface water drainage.
Noise Pollution Control Measures:
1. Every year extensive plantation is being done both on plain and dump area by
Chhattisgarh van vikas nigam (a state government organization) and till date
about 20,91,047 nos. of plant planted on approx. 798.81 Ha area.
2. Reduced quantity of blasting has resulted in lower noise levels.
3. Lined chutes in silo to reduce noise.
4. Surface miner deployed to eliminate coal crushing will reduce noise.
5. Provision of ear muffs/ear plugs to workers subjected to noise level above
recommended limits.
6. Regular monitoring of noise level of project area.
Hazardous Wastes Management:
1. Oil and grease filters are stored in a drum placed on cemented concrete floor to
prevent contamination of soil & ground water. The storage area of Hazardous
Wastes is marked by erecting danger sign boards outside.
2. The waste oil is stored in a container in the workshop for proper disposal.
3. Used oil/burnt oil are stored in specified drums at work sites on concrete floors.
4. Oil & grease generated at workshop after treatment by oil & grease trap is safely
stored and disposed.
5. Good housekeeping of workshop is followed diligently.
---------------------------------------------------------------------------------------------------------------------

9
PART-H
Additional measures/investment proposals for environmental protection
including abatement of pollution, prevention of pollution.
1. During the FY 2019-20, 1, 50,665 no. of plants have been planted in 58.33 Ha of
area.
2. Long Range Fogging Machine has been has been deployed from Aril 2019 in Dipka
OCP for dust suppression around railway siding and coal stock areas in Dipka
project.
3. Mechanized sweeping machine has been deployed from November 2019 by the
project for dust control in the township and colony roads.
---------------------------------------------------------------------------------------------------------------------
PART-I
Any other particulars for improving the quality of the environment.
1. Long Range Fogging Machine has been deployed in Dipka OCP for dust
suppression around railway siding and coal stock areas in Dipka project.
2. Mechanized sweeping machine has been deployed by the project for dust control in
the township and colony roads.
Thick vegetation and plantation on the overburden dumps.
3. During the FY 2019-20, 25,040 no. of plants were planted over OB Dumps in an area
of 8.08 Ha.
---------------------------------------------------------------------------------------------------------------------
*****

ÛÒÊ×ÎÑÒÓÛÒÌßÔ ÓÑÒ×ÌÑÎ×ÒÙ
ÎÛÐÑÎÌ
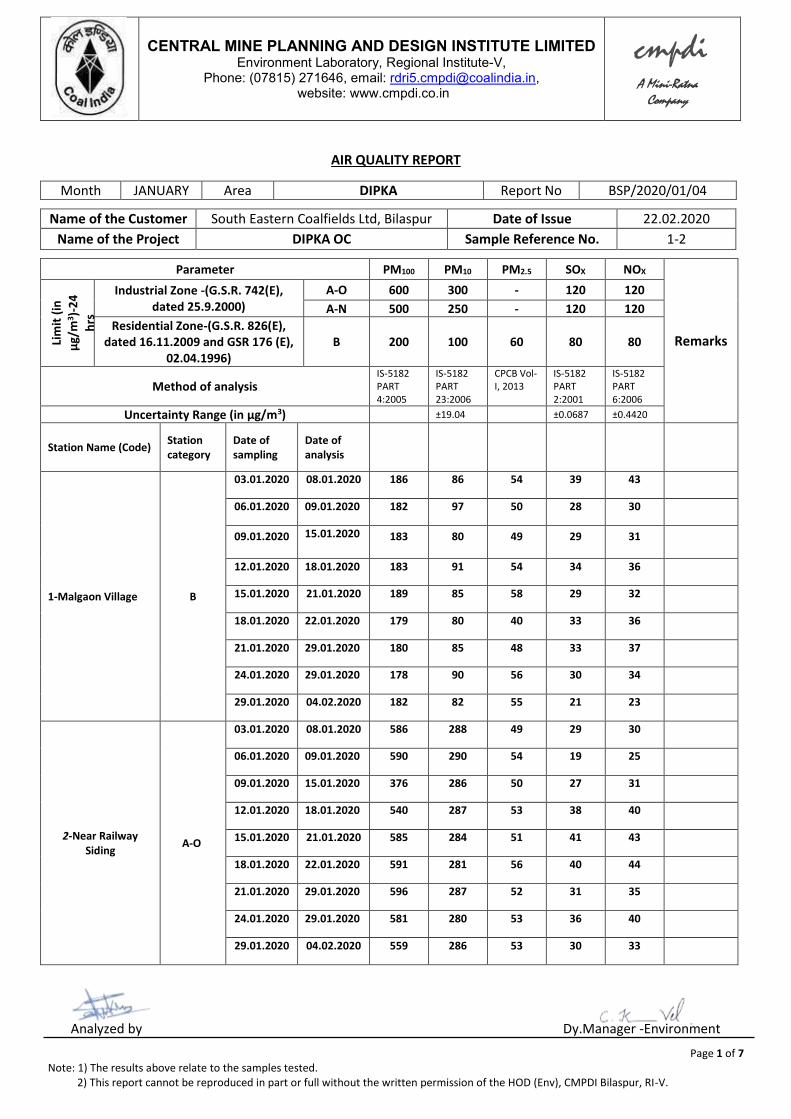
Analyzed by Dy.Manager -Environment
Page 1 of 7
Note: 1) The results above relate to the samples tested.
2) This report cannot be reproduced in part or full without the written permission of the HOD (Env), CMPDI Bilaspur, RI-V.
CENTRAL MINE PLANNING AND DESIGN INSTITUTE LIMITED
Environment Laboratory, Regional Institute-V, Phone: (07815) 271646, email: [email protected],
website: www.cmpdi.co.in
cmpdi
A Mini-Ratna Company
AIR QUALITY REPORT
Month JANUARY Area DIPKA Report No BSP/2020/01/04
Name of the Customer South Eastern Coalfields Ltd, Bilaspur Date of Issue 22.02.2020
Name of the Project DIPKA OC Sample Reference No. 1-2
Parameter PM100 PM10 PM2.5 SOX NOX
Remarks Lim
it (
in
µg
/m3)-
24
hrs
Industrial Zone -(G.S.R. 742(E),
dated 25.9.2000)
A-O 600 300 - 120 120
A-N 500 250 - 120 120
Residential Zone-(G.S.R. 826(E),
dated 16.11.2009 and GSR 176 (E),
02.04.1996)
B 200 100 60 80 80
Method of analysis IS-5182
PART
4:2005
IS-5182
PART
23:2006
CPCB Vol-
I, 2013
IS-5182
PART
2:2001
IS-5182
PART
6:2006
Uncertainty Range (in µg/m3) ±19.04 ±0.0687 ±0.4420
Station Name (Code) Station
category
Date of
sampling
Date of
analysis
1-Malgaon Village B
03.01.2020 08.01.2020 186 86 54 39 43
06.01.2020 09.01.2020 182 97 50 28 30
09.01.2020 15.01.2020 183 80 49 29 31
12.01.2020 18.01.2020 183 91 54 34 36
15.01.2020 21.01.2020 189 85 58 29 32
18.01.2020 22.01.2020 179 80 40 33 36
21.01.2020 29.01.2020 180 85 48 33 37
24.01.2020 29.01.2020 178 90 56 30 34
29.01.2020 04.02.2020 182 82 55 21 23
2-Near Railway
Siding A-O
03.01.2020 08.01.2020 586 288 49 29 30
06.01.2020 09.01.2020 590 290 54 19 25
09.01.2020 15.01.2020 376 286 50 27 31
12.01.2020 18.01.2020 540 287 53 38 40
15.01.2020 21.01.2020 585 284 51 41 43
18.01.2020 22.01.2020 591 281 56 40 44
21.01.2020 29.01.2020 596 287 52 31 35
24.01.2020 29.01.2020 581 280 53 36 40
29.01.2020 04.02.2020 559 286 53 30 33
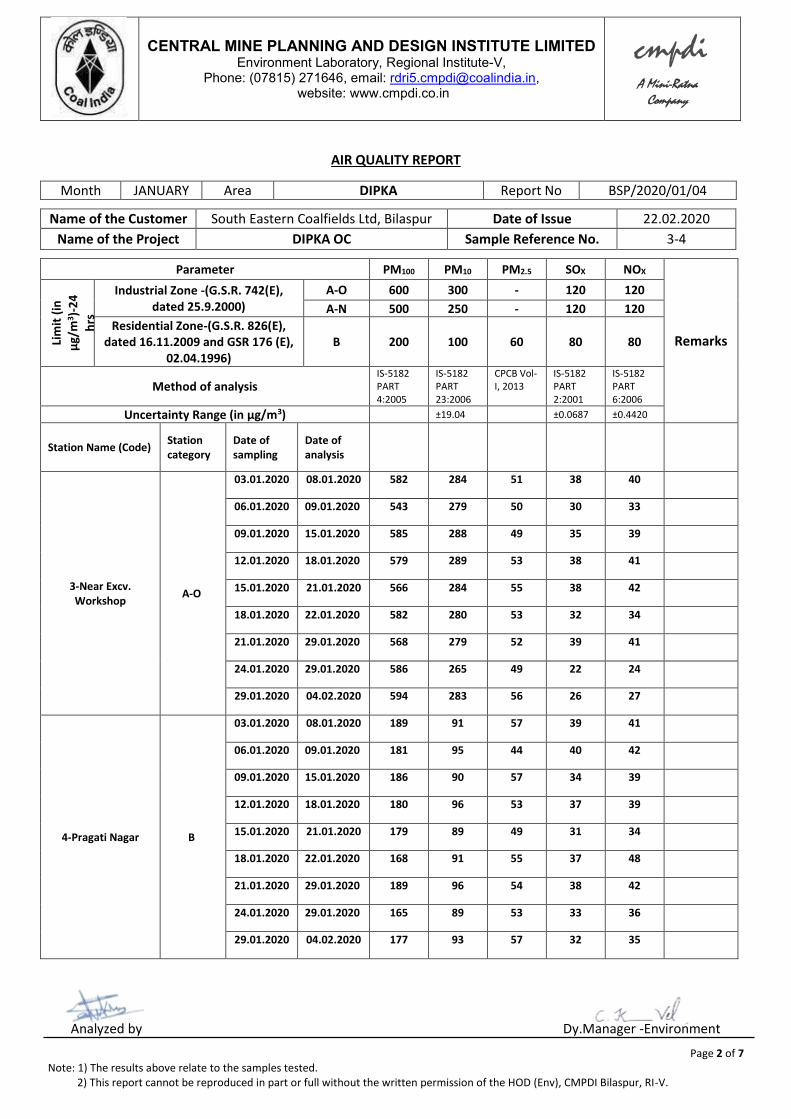
Analyzed by Dy.Manager -Environment
Page 2 of 7
Note: 1) The results above relate to the samples tested.
2) This report cannot be reproduced in part or full without the written permission of the HOD (Env), CMPDI Bilaspur, RI-V.
CENTRAL MINE PLANNING AND DESIGN INSTITUTE LIMITED
Environment Laboratory, Regional Institute-V, Phone: (07815) 271646, email: [email protected],
website: www.cmpdi.co.in
cmpdi
A Mini-Ratna Company
AIR QUALITY REPORT
Month JANUARY Area DIPKA Report No BSP/2020/01/04
Name of the Customer South Eastern Coalfields Ltd, Bilaspur Date of Issue 22.02.2020
Name of the Project DIPKA OC Sample Reference No. 3-4
Parameter PM100 PM10 PM2.5 SOX NOX
Remarks Lim
it (
in
µg
/m3)-
24
hrs
Industrial Zone -(G.S.R. 742(E),
dated 25.9.2000)
A-O 600 300 - 120 120
A-N 500 250 - 120 120
Residential Zone-(G.S.R. 826(E),
dated 16.11.2009 and GSR 176 (E),
02.04.1996)
B 200 100 60 80 80
Method of analysis IS-5182
PART
4:2005
IS-5182
PART
23:2006
CPCB Vol-
I, 2013
IS-5182
PART
2:2001
IS-5182
PART
6:2006
Uncertainty Range (in µg/m3) ±19.04 ±0.0687 ±0.4420
Station Name (Code) Station
category
Date of
sampling
Date of
analysis
3-Near Excv.
Workshop A-O
03.01.2020 08.01.2020 582 284 51 38 40
06.01.2020 09.01.2020 543 279 50 30 33
09.01.2020 15.01.2020 585 288 49 35 39
12.01.2020 18.01.2020 579 289 53 38 41
15.01.2020 21.01.2020 566 284 55 38 42
18.01.2020 22.01.2020 582 280 53 32 34
21.01.2020 29.01.2020 568 279 52 39 41
24.01.2020 29.01.2020 586 265 49 22 24
29.01.2020 04.02.2020 594 283 56 26 27
4-Pragati Nagar B
03.01.2020 08.01.2020 189 91 57 39 41
06.01.2020 09.01.2020 181 95 44 40 42
09.01.2020 15.01.2020 186 90 57 34 39
12.01.2020 18.01.2020 180 96 53 37 39
15.01.2020 21.01.2020 179 89 49 31 34
18.01.2020 22.01.2020 168 91 55 37 48
21.01.2020 29.01.2020 189 96 54 38 42
24.01.2020 29.01.2020 165 89 53 33 36
29.01.2020 04.02.2020 177 93 57 32 35
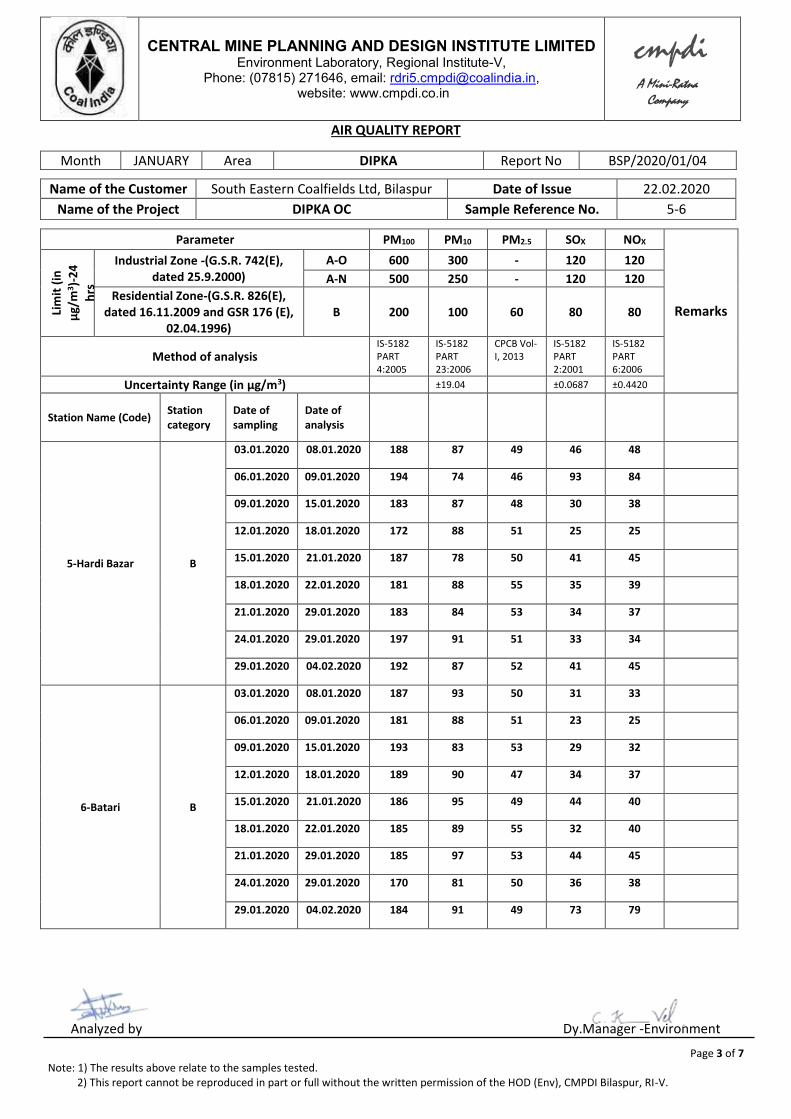
Analyzed by Dy.Manager -Environment
Page 3 of 7
Note: 1) The results above relate to the samples tested.
2) This report cannot be reproduced in part or full without the written permission of the HOD (Env), CMPDI Bilaspur, RI-V.
CENTRAL MINE PLANNING AND DESIGN INSTITUTE LIMITED
Environment Laboratory, Regional Institute-V, Phone: (07815) 271646, email: [email protected],
website: www.cmpdi.co.in
cmpdi
A Mini-Ratna Company
AIR QUALITY REPORT
Month JANUARY Area DIPKA Report No BSP/2020/01/04
Name of the Customer South Eastern Coalfields Ltd, Bilaspur Date of Issue 22.02.2020
Name of the Project DIPKA OC Sample Reference No. 5-6
Parameter PM100 PM10 PM2.5 SOX NOX
Remarks Lim
it (
in
µg
/m3)-
24
hrs
Industrial Zone -(G.S.R. 742(E),
dated 25.9.2000)
A-O 600 300 - 120 120
A-N 500 250 - 120 120
Residential Zone-(G.S.R. 826(E),
dated 16.11.2009 and GSR 176 (E),
02.04.1996)
B 200 100 60 80 80
Method of analysis IS-5182
PART
4:2005
IS-5182
PART
23:2006
CPCB Vol-
I, 2013
IS-5182
PART
2:2001
IS-5182
PART
6:2006
Uncertainty Range (in µg/m3) ±19.04 ±0.0687 ±0.4420
Station Name (Code) Station
category
Date of
sampling
Date of
analysis
5-Hardi Bazar B
03.01.2020 08.01.2020 188 87 49 46 48
06.01.2020 09.01.2020 194 74 46 93 84
09.01.2020 15.01.2020 183 87 48 30 38
12.01.2020 18.01.2020 172 88 51 25 25
15.01.2020 21.01.2020 187 78 50 41 45
18.01.2020 22.01.2020 181 88 55 35 39
21.01.2020 29.01.2020 183 84 53 34 37
24.01.2020 29.01.2020 197 91 51 33 34
29.01.2020 04.02.2020 192 87 52 41 45
6-Batari B
03.01.2020 08.01.2020 187 93 50 31 33
06.01.2020 09.01.2020 181 88 51 23 25
09.01.2020 15.01.2020 193 83 53 29 32
12.01.2020 18.01.2020 189 90 47 34 37
15.01.2020 21.01.2020 186 95 49 44 40
18.01.2020 22.01.2020 185 89 55 32 40
21.01.2020 29.01.2020 185 97 53 44 45
24.01.2020 29.01.2020 170 81 50 36 38
29.01.2020 04.02.2020 184 91 49 73 79
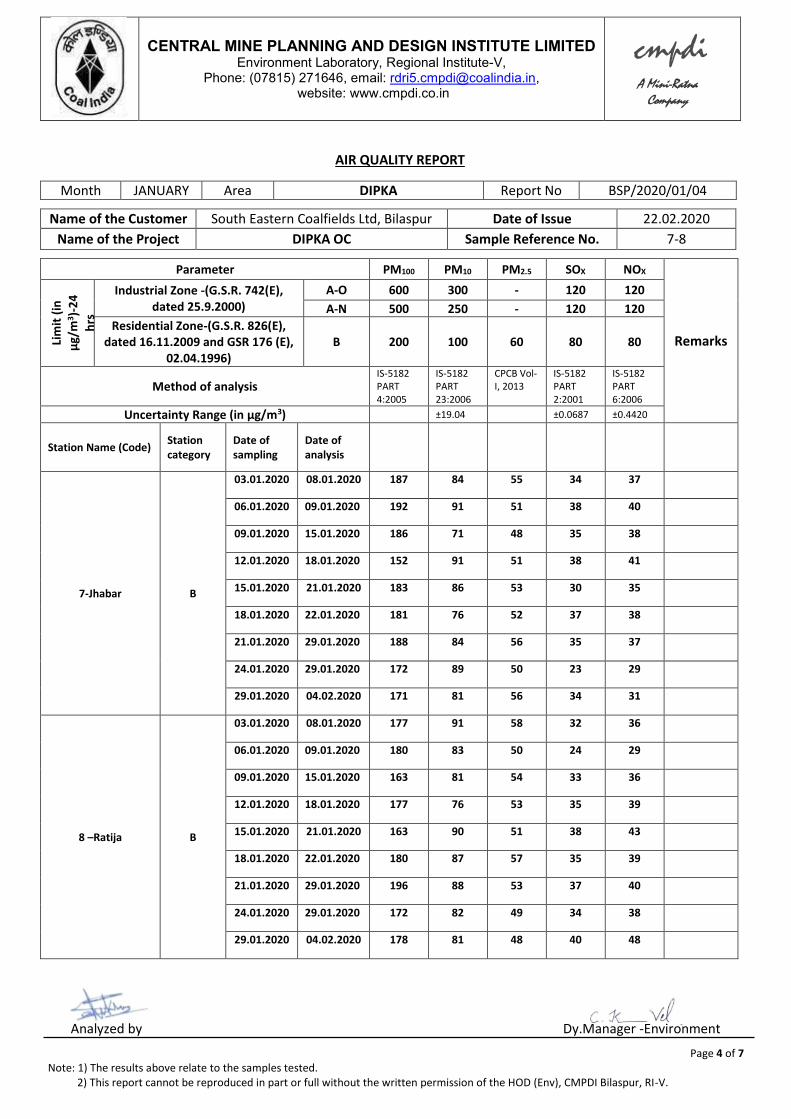
Analyzed by Dy.Manager -Environment
Page 4 of 7
Note: 1) The results above relate to the samples tested.
2) This report cannot be reproduced in part or full without the written permission of the HOD (Env), CMPDI Bilaspur, RI-V.
CENTRAL MINE PLANNING AND DESIGN INSTITUTE LIMITED
Environment Laboratory, Regional Institute-V, Phone: (07815) 271646, email: [email protected],
website: www.cmpdi.co.in
cmpdi
A Mini-Ratna Company
AIR QUALITY REPORT
Month JANUARY Area DIPKA Report No BSP/2020/01/04
Name of the Customer South Eastern Coalfields Ltd, Bilaspur Date of Issue 22.02.2020
Name of the Project DIPKA OC Sample Reference No. 7-8
Parameter PM100 PM10 PM2.5 SOX NOX
Remarks Lim
it (
in
µg
/m3)-
24
hrs
Industrial Zone -(G.S.R. 742(E),
dated 25.9.2000)
A-O 600 300 - 120 120
A-N 500 250 - 120 120
Residential Zone-(G.S.R. 826(E),
dated 16.11.2009 and GSR 176 (E),
02.04.1996)
B 200 100 60 80 80
Method of analysis IS-5182
PART
4:2005
IS-5182
PART
23:2006
CPCB Vol-
I, 2013
IS-5182
PART
2:2001
IS-5182
PART
6:2006
Uncertainty Range (in µg/m3) ±19.04 ±0.0687 ±0.4420
Station Name (Code) Station
category
Date of
sampling
Date of
analysis
7-Jhabar B
03.01.2020 08.01.2020 187 84 55 34 37
06.01.2020 09.01.2020 192 91 51 38 40
09.01.2020 15.01.2020 186 71 48 35 38
12.01.2020 18.01.2020 152 91 51 38 41
15.01.2020 21.01.2020 183 86 53 30 35
18.01.2020 22.01.2020 181 76 52 37 38
21.01.2020 29.01.2020 188 84 56 35 37
24.01.2020 29.01.2020 172 89 50 23 29
29.01.2020 04.02.2020 171 81 56 34 31
8 –Ratija B
03.01.2020 08.01.2020 177 91 58 32 36
06.01.2020 09.01.2020 180 83 50 24 29
09.01.2020 15.01.2020 163 81 54 33 36
12.01.2020 18.01.2020 177 76 53 35 39
15.01.2020 21.01.2020 163 90 51 38 43
18.01.2020 22.01.2020 180 87 57 35 39
21.01.2020 29.01.2020 196 88 53 37 40
24.01.2020 29.01.2020 172 82 49 34 38
29.01.2020 04.02.2020 178 81 48 40 48

Analyzed by Dy.Manager -Environment
Page 5 of 7
Note: 1) The results above relate to the samples tested.
2) This report cannot be reproduced in part or full without the written permission of the HOD (Env), CMPDI Bilaspur, RI-V.
CENTRAL MINE PLANNING AND DESIGN INSTITUTE LIMITED
Environment Laboratory, Regional Institute-V, Phone: (07815) 271646, email: [email protected],
website: www.cmpdi.co.in
cmpdi
A Mini-Ratna Company
NOISE QUALITY REPORT
Month JANUARY Area DIPKA Report No BSP/2020/01/04
Name of the Customer South Eastern Coalfields Ltd, Bilaspur Date of Issue 22.02.2020
Name of the Project DIPKA OC Sample Reference No. N39-N46
Parameter The Noise Pollution (R & C) rules, 2000
Remarks
Day Time Night Time
Limit (in dB(A)
Leq
Industrial area A 75 70
Commercial area B 65 55
Residential Area C 55 45
Silence Zone D 50 40
Method of analysis CPCB Protocol For Ambient Level Noise Monitoring
Station (Code) Station Name Station
category
Date of
measurement Value in dB(A) Value in dB(A)
1-Malgaon Village C 15.01.2020 44.3 44.3
30.01.2020 43.0 37.9
2-Near Railway Siding A 15.01.2020 69.8 65.4
30.01.2020 62.9 59.2
3-New Excv. Workshop A 15.01.2020 58.7 62.7
30.01.2020 47.7 57.3
4-Pragati Nagar C 15.01.2020 45.6 43.8
30.01.2020 45.9 39.3
5-Hardi Bazar C 09.01.2020 52.0 33.5
21.01.2020 44.6 42.2
6-Batari C 09.01.2020 49.2 33.6
21.01.2020 40.4 40.8
7-Jhabar C 09.01.2020 51.0 33.7
21.01.2020 44.8 42.8
8-Ratija C 09.01.2020 50.4 33.8
21.01.2020 40.7 40.7
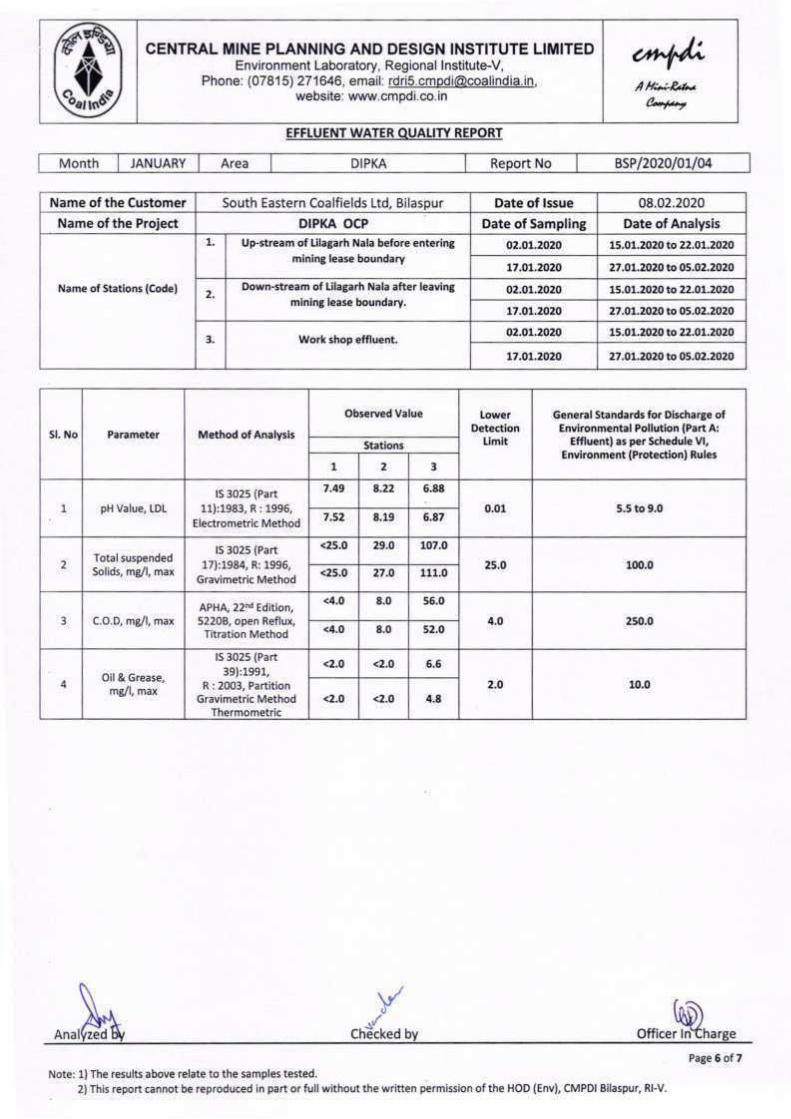
cr+/;A P:..:-&r..1
e-*,,
CENTRAL MINE PLANNING AND DESIGN INSTITUTE LIMITEDEnvironment Laboratory, Regional lnstitute-V,
Phone: (0781 5) 27 1646, email: [email protected],
website: www.cmpdi.co.in
Month DIPKA Report No BS?l2O2Ol01l04
Name of the Customer South Eastern Coalfields Ltd, Bilaspur Date of lssue 08.02.2020
Name of the Project DIPKA OCP Date of Sampling Date of Analysis
1 Up-stream of Lilagarh Nala before entering
mining leas€ boundary
02.o7.2020 15.01.2020 to 22.01.2020
t7,07.2020 27.01.2020 to 05.02.2020
Down-stream of Lilagarh Nala after leaving
minint lease boundary.02.o7.2020 15.01.2020 to 22.01.2020
17.07.2020 27.01.2020 to 05.02.2020
3. Work shop efrluent02.01.2020 15.01.2020 to 22.01.2020
L7.07.2020 27 .OL.2O2O to 05.O2.2O2O
Sl. No Parameter Method of Analysis
Observed Value Lower
Detection
Limit
General Standards tor Discharge ofEnvironmental Pollution (Part A:
Eflluent) as per schedule vl,Environment (Protection) Rules
Stations
1 2 3
1 pH Value, LDL
lS 3025 (Part
11):1983, R : 1996,
Electrometric Method
7.49 4.22 6.88
0.01 5.5 to 9.07.52 8.19 6.87
2Totalsuspended
Solids, m&/1, max
lS 3025 (Part
17):1984, R: 1996,
Gravimetric Method
<25.0 29.0 107.0
25.0<25.0 27.0 111.0
C.O.D, m&/1, max
<4.0 8.0
4.0 250.0<4.0 8.0
4Oil & Grease,
m6/1, max
lS 3025 (Part
39):1991,
R : 2003, PartitionGravimetric Method
Thermometric
<2.0 <2.0 6.6
2.0 10.0
<2.0 <2.0 4.8
Anal cnt(ea uvhEr lnrChOfflce arge
Page 6 of 7
EFFTUENT WATER QUALIW REPORT
JANUARY Area
Name of Stations (Code)2.
100.0
3
APHA, 22nd Edition,
52208, open Reflux,
Titration Method
56.0
s2.0
Note: 1)The results above relate to the samples tested,
2)This report cannot be reproduced in part orfull without the written permission ofthe HOD (Env), CMPDI Eilaspur, Rl-V,

CENTRAL MINE PLANNING AND DESIGN INSTITUTE LIMITEDEnvironment Laboratory, Regional lnstitute-V,
Phone: (0781 5) 271646, email: [email protected],website: www.cmpdi.co.in
c,t"lr/;n Ht;-&e<
EFFLUENT WATER QUATITY REPORT
Month ]ANUARY Area DIPKA Report No BSP/2020/OL/04
Name of the Customer South Eastern Coalfields Ltd, Bilaspur Date of lssue 08.02.2020
Name of the Project Date of Sampling Date of Analysis
Name ol Stations (Code) 402.01.2020 15.01.2020 to 22.01.2020
17.01.2020 27.01.2020 to 05.02.2020
Sl. No Parameter Method of Analysis
Observed value General Standards for Discharge ofEnvironmental Pollution (Part A:
Effluent) as per schedule vl,Environment (Protection) Rules
Stations
4
1 pH Value, tDL
lS 3025 (Pa rt
11):1983, R r 1996,
Electrometric Method
7.49
5.50 to 9.007.44
2Totalsuspended
Solids, mg,/|, max
lS 3025 (Part
17):1984, R: 1996,
Gravimetric Method
41.0
c.o.D, mg/|, max
APHA, 22"d Edition,
52208, open Reflu&
Titration Method4.0 2s0.0
32.O
4Oil & Grease,
mg/|, max
lS 3025 (Part
39):1991,
R | 2003, Partition
G.avimetric MethodThermometric
<2.0
10.0
<2.0
/offi.",l*D,,.c"Anal
Note: 1)The results above relate to the samples tested.
2) This report cannot be reproduced in pan or full without the written permission of the HOD (Env), CMPDI Bilaspur, Rl-V
d
PaEeT of7
DIPKA OCP
Mines effluent after settling
Lower DetectionLimit
0.01
2s.0 100.040.0
28.0
2.0
Checked

January 2020 Area
i
ii
to
i iiAcceptable
Limit (Max)*
1 BDL 3 5
2 Agreeable Agreeable Agreeable
3 BDL BDL 0.001
4 BDL BDL 1
5 6.94 6.73 6.5-8.5
6 20 103 200
7 28 112 200
8 0.07 0.06 0.3
9 11.5 14.5 250
10 BDL BDL 0.2
11 120 185 500
12 5.57 24.65 75
13 BDL BDL 0.05
14 0.07 BDL 0.1
15 4.58 7.08 200
16 12.62 7.52 45
17 BDL 0.11 1
18 BDL BDL 0.01
19 BDL BDL 0.01
20 BDL BDL 0.01
21 2.31 0.08 5
22 BDL BDL 0.05
23 NIL NIL Nil
24 BDL BDL 0.5
Junior Scientific Asst Technical Manager
Note: The results above relate to the samples tested as received. This report cannot be reproduced in part or full without the written
permission of the HOD (Env), CMPDI, RI-V. The Green, Yellow and Red color highlights in observed values indicate acceptable values, values
exceeding acceptable limits but below permissible limits and values exceeding permissible limits respectively.
Page H1
*Except Sl. No. 10 for which Acceptable Limit is Min LDL indicates Lower Detection Limit & BDL indicates Below
Puspa Pandey M. Reagan Singh
Fecal Coliform, MPN/100 mlAPHA, 22nd Edition, 9221
Multiple Tube Fermentation Tech.No relaxation ---
Boron, mg/l
LDL: 0.5 mg/l
APHA, 23rd Edition,2017, 4500-B,
Carmine Method1 ±0.310 mg/l at 5.16 mg/l
Zinc, mg/l
LDL: 0.01 mg/l
IS 3025 ( Part 49 ) : 1994, R : 2009, AAS-Flame
Method15 ±0.0013 mg/l at 0.01 mg/l
Total Chromium, mg/l
LDL: 0.05 mg/lIS 3025 ( Part 52 ) : 2003, AAS-Flame Method No relaxation ±0.004 mg/l at 0.05 mg/l
Arsenic, mg/l
LDL: 0.002 mg/l
IS 3025 (Part 37):1988,R 2003,
AAS- VGA Method0.05 ±.0081 mg/l at 0.018 mg/l
Lead, mg/l
LDL: 0.005 mg/l
APHA, 23rd Edition,2017, 3113B,
AAS-GTA MethodNo relaxation ±0.000266 mg/l at 0.005 mg/l
Fluoride, mg/l
LDL: 0.1 mg/l
APHA, 23rd Edition,2017, 4500, F- D SPADNS
Method1.5 ±0.014 mg/l at 0.98 mg/l
Selenium, mg/l
LDL: 0.001 mg/l
IS 3025 (Part 56):2003
AAS- VGA MethodNo relaxation ±0.000938 mg/l at 0.001 mg/l
Sulphate, mg/l
LDL: 2.0 mg/l
APHA, 23rd Edition,2017, 4500- SO42- E
Turbidimetric Method400 ±0.640 mg/l at 19.88 mg/l
Nitrate, mg/l
LDL: 0.5 mg/l
APHA, 23rd Edition,2017, 4500, B
UV-Spectrophotometric MethodNo relaxation ±0.528 mg/l at 20.41 mg/l
Copper, mg/l
LDL: 0.03 mg/l
IS 3025 (Part 42) : 1992
R : 2009, AAS-Flame Method1.5 ±0.131 mg/l at 4.90 mg/l
Manganese, mg/l
LDL: 0.05 mg/l
IS 3025 (Part 59) : 2006,
AAS-Flame Method0.3 ±0.026 mg/l at 2.44 mg/l
Total Dissolved Solids, mg/l
LDL: 30.0 mg/l
IS 3025 (Part 16):1984
R : 2006, Gravimetric Method2000 ±4.473 mg/l at 592.0 mg/l
Calcium, mg/l
LDL: 5.0 mg/l
IS 3025 (Part 40): 1991,
R : 2009, EDTA Method200 ±2.512 mg/l at 99.8 mg/l
Chlorides, mg/l
LDL: 5.0 mg/l
IS 3025(Part 32):1988 ,
R : 2007, Argentometric Method1000 ±6.551 mg/l at 253.5 mg/l
Residual Free Chlorine, mg/l
LDL: 0.1 mg/l
APHA, 23rd Edition,2017, 4500G,
DPD Colorimetric Method1 ±0.0082 mg/l at 0.1 mg/l
Total Hardness, mg/l as CaCO3
LDL: 4.0 mg/l
IS 3025 (Part 21):2009,
EDTA Method600 ±11.545 mg/l at 612.8 mg/l
Iron, mg/l
LDL: 0.05 mg/l
IS 3025 (Part 53) :2003, R:2009
AAS-Flame MethodNo relaxation ±0.0782 mg/l at 7.95 mg/l
pH
LDL: 4.00
IS 3025 (Part 11):1983,
R : 2012, Electrometric MethodNo relaxation ±0.1272 at 7.01
Alkalinity, mg/l as CaCO3
LDL: 5.0 mg/l
IS 3025(Part 23):1986,R 2003
Titration Method600 ±0.19696 mg/l at 10.0 mg/l
Phenolic compounds, mg/l
LDL: 0.001 mg/l
APHA, 23rd Edition,2017, 5530. C, Chloroform
Extraction Method0.002 ±0.0204 mg/l at 0.100 mg/l
Turbidity, NTU
LDL: 1.0 NTU
IS 3025 (Part 10):1984, R : 2006, Nephelometric
Method5 ±0.855 NTU at 41.58 NTU
Permissible Limit in
the Absence of
Alternate Source
(Max)
Colour, Hazen
LDL: 1.0 Hazen
APHA, 23rd Edition,2017, 2120. C. Spectrometric
single wavelength method15 ±1.05+ Hazen at 49.86 Hazen
Odour IS 3025 (Part 5):1983, Physical (Qualitative) Agreeable None
Date of Analysis 2-Jan-2020 10-Feb-2020
Sl.
No.Parameter Method of Analysis
Observed Values IS 10500: 2012
Uncertainty of Measurement
(at 95% Confidence Level &
K= 1.96)
Project Dipka OC Sample Ref. No. CMPDI/Q9/04, Date:-02/01/2020
Sampling StationsDipka Colony Drinking Water Guest House Date of Sampling 2-Jan-2020
Drinking water from CGM office Dipka Date of Sampling 2-Jan-2020
CENTRAL MINE PLANNING AND DESIGN INSTITUTE LIMITED
Environment Laboratory, Regional Institute-V
DRINKING WATER ANALYSIS REPORT
Month Dipka Report No. JN20DK
Customer South Eastern Coalfields Ltd (SECL), Bilaspur Date of Issue 13-02-20 11:32
SECL Complex, Seepat Road
Bilaspur (C.G.)- 495 006
Phone: (07752) 246371
email: [email protected]; [email protected]

Analyzed by Dy.Manager -Environment
Page 1 of 7
Note: 1) The results above relate to the samples tested.
2) This report cannot be reproduced in part or full without the written permission of the HOD (Env), CMPDI Bilaspur, RI-V.
CENTRAL MINE PLANNING AND DESIGN INSTITUTE LIMITED
Environment Laboratory, Regional Institute-V, Phone: (07815) 271646, email: [email protected],
website: www.cmpdi.co.in
cmpdi
A Mini-Ratna Company
AIR QUALITY REPORT
Month FEBRUARY Area DIPKA Report No BSP/2020/02/04
Name of the Customer South Eastern Coalfields Ltd, Bilaspur Date of Issue 28.03.2020
Name of the Project DIPKA OC Sample Reference No. 1-2
Parameter PM100 PM10 PM2.5 SOX NOX
Remarks Lim
it (
in
µg
/m3)-
24
hrs
Industrial Zone -(G.S.R. 742(E),
dated 25.9.2000)
A-O 600 300 - 120 120
A-N 500 250 - 120 120
Residential Zone-(G.S.R. 826(E),
dated 16.11.2009 and GSR 176 (E),
02.04.1996)
B 200 100 60 80 80
Method of analysis IS-5182
PART
4:2005
IS-5182
PART
23:2006
CPCB Vol-
I, 2013
IS-5182
PART
2:2001
IS-5182
PART
6:2006
Uncertainty Range (in µg/m3) ±19.04 ±0.0687 ±0.4420
Station Name (Code) Station
category
Date of
sampling
Date of
analysis
1-Malgaon Village B
03.02.2020 17.02.2020 190 93 49 30 33
06.02.2020 17.02.2020 151 81 51 32 36
09.02.2020 18.02.2020 176 86 53 29 32
12.02.2020 18.02.2020 188 73 51 33 37
15.02.2020 02.03.2020 184 91 50 35 41
18.02.2020 02.03.2020 169 88 44 31 43
23.02.2020 03.03.2020 177 79 58 37 39
26.02.2020 03.03.2020 187 82 53 40 44
2-Near Railway
Siding A-O
03.02.2020 17.02.2020 556 279 58 31 43
06.02.2020 17.02.2020 573 281 54 37 39
09.02.2020 18.02.2020 568 289 48 40 44
12.02.2020 18.02.2020 589 288 52 30 38
15.02.2020 02.03.2020 579 282 43 31 43
18.02.2020 02.03.2020 566 289 56 37 39
23.02.2020 03.03.2020 586 276 50 40 44
26.02.2020 03.03.2020 585 275 57 33 37
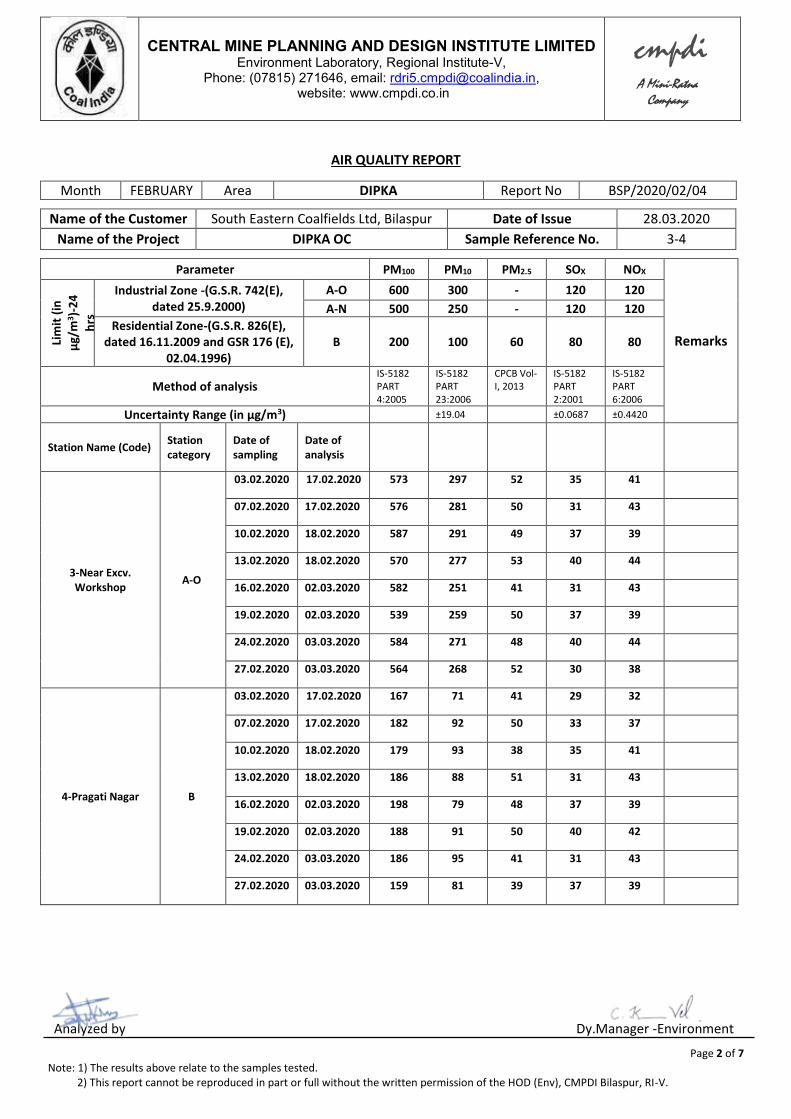
Analyzed by Dy.Manager -Environment
Page 2 of 7
Note: 1) The results above relate to the samples tested.
2) This report cannot be reproduced in part or full without the written permission of the HOD (Env), CMPDI Bilaspur, RI-V.
CENTRAL MINE PLANNING AND DESIGN INSTITUTE LIMITED
Environment Laboratory, Regional Institute-V, Phone: (07815) 271646, email: [email protected],
website: www.cmpdi.co.in
cmpdi
A Mini-Ratna Company
AIR QUALITY REPORT
Month FEBRUARY Area DIPKA Report No BSP/2020/02/04
Name of the Customer South Eastern Coalfields Ltd, Bilaspur Date of Issue 28.03.2020
Name of the Project DIPKA OC Sample Reference No. 3-4
Parameter PM100 PM10 PM2.5 SOX NOX
Remarks Lim
it (
in
µg
/m3)-
24
hrs
Industrial Zone -(G.S.R. 742(E),
dated 25.9.2000)
A-O 600 300 - 120 120
A-N 500 250 - 120 120
Residential Zone-(G.S.R. 826(E),
dated 16.11.2009 and GSR 176 (E),
02.04.1996)
B 200 100 60 80 80
Method of analysis IS-5182
PART
4:2005
IS-5182
PART
23:2006
CPCB Vol-
I, 2013
IS-5182
PART
2:2001
IS-5182
PART
6:2006
Uncertainty Range (in µg/m3) ±19.04 ±0.0687 ±0.4420
Station Name (Code) Station
category
Date of
sampling
Date of
analysis
3-Near Excv.
Workshop A-O
03.02.2020 17.02.2020 573 297 52 35 41
07.02.2020 17.02.2020 576 281 50 31 43
10.02.2020 18.02.2020 587 291 49 37 39
13.02.2020 18.02.2020 570 277 53 40 44
16.02.2020 02.03.2020 582 251 41 31 43
19.02.2020 02.03.2020 539 259 50 37 39
24.02.2020 03.03.2020 584 271 48 40 44
27.02.2020 03.03.2020 564 268 52 30 38
4-Pragati Nagar B
03.02.2020 17.02.2020 167 71 41 29 32
07.02.2020 17.02.2020 182 92 50 33 37
10.02.2020 18.02.2020 179 93 38 35 41
13.02.2020 18.02.2020 186 88 51 31 43
16.02.2020 02.03.2020 198 79 48 37 39
19.02.2020 02.03.2020 188 91 50 40 42
24.02.2020 03.03.2020 186 95 41 31 43
27.02.2020 03.03.2020 159 81 39 37 39

Analyzed by Dy.Manager -Environment
Page 3 of 7
Note: 1) The results above relate to the samples tested.
2) This report cannot be reproduced in part or full without the written permission of the HOD (Env), CMPDI Bilaspur, RI-V.
CENTRAL MINE PLANNING AND DESIGN INSTITUTE LIMITED
Environment Laboratory, Regional Institute-V, Phone: (07815) 271646, email: [email protected],
website: www.cmpdi.co.in
cmpdi
A Mini-Ratna Company
AIR QUALITY REPORT
Month FEBRUARY Area DIPKA Report No BSP/2020/02/04
Name of the Customer South Eastern Coalfields Ltd, Bilaspur Date of Issue 28.03.2020
Name of the Project DIPKA OC Sample Reference No. 5-6
Parameter PM100 PM10 PM2.5 SOX NOX
Remarks Lim
it (
in
µg
/m3)-
24
hrs
Industrial Zone -(G.S.R. 742(E),
dated 25.9.2000)
A-O 600 300 - 120 120
A-N 500 250 - 120 120
Residential Zone-(G.S.R. 826(E),
dated 16.11.2009 and GSR 176 (E),
02.04.1996)
B 200 100 60 80 80
Method of analysis IS-5182
PART
4:2005
IS-5182
PART
23:2006
CPCB Vol-
I, 2013
IS-5182
PART
2:2001
IS-5182
PART
6:2006
Uncertainty Range (in µg/m3) ±19.04 ±0.0687 ±0.4420
Station Name (Code) Station
category
Date of
sampling
Date of
analysis
5-Hardi Bazar B
03.02.2020 17.02.2020 184 85 50 32 35
06.02.2020 17.02.2020 181 79 49 34 37
09.02.2020 18.02.2020 196 92 47 41 44
12.02.2020 18.02.2020 179 89 39 32 34
15.02.2020 02.03.2020 181 94 40 38 35
18.02.2020 02.03.2020 161 88 44 16 21
23.02.2020 03.03.2020 176 86 56 33 36
26.02.2020 03.03.2020 191 84 57 48 51
6-Batari B
03.02.2020 17.02.2020 149 88 56 35 31
07.02.2020 18.02.2020 156 99 50 29 26
10.02.2020 18.02.2020 198 99 49 25 32
13.02.2020 19.02.2020 197 83 47 28 28
16.02.2020 02.03.2020 183 87 53 31 39
19.02.2020 02.03.2020 179 92 54 35 37
24.02.2020 04.03.2020 186 79 58 31 86
27.02.2020 04.03.2020 183 91 51 41 42

Analyzed by Dy.Manager -Environment
Page 4 of 7
Note: 1) The results above relate to the samples tested.
2) This report cannot be reproduced in part or full without the written permission of the HOD (Env), CMPDI Bilaspur, RI-V.
CENTRAL MINE PLANNING AND DESIGN INSTITUTE LIMITED
Environment Laboratory, Regional Institute-V, Phone: (07815) 271646, email: [email protected],
website: www.cmpdi.co.in
cmpdi
A Mini-Ratna Company
AIR QUALITY REPORT
Month FEBRUARY Area DIPKA Report No BSP/2020/02/04
Name of the Customer South Eastern Coalfields Ltd, Bilaspur Date of Issue 28.03.2020
Name of the Project DIPKA OC Sample Reference No. 7-8
Parameter PM100 PM10 PM2.5 SOX NOX
Remarks Lim
it (
in
µg
/m3)-
24
hrs
Industrial Zone -(G.S.R. 742(E),
dated 25.9.2000)
A-O 600 300 - 120 120
A-N 500 250 - 120 120
Residential Zone-(G.S.R. 826(E),
dated 16.11.2009 and GSR 176 (E),
02.04.1996)
B 200 100 60 80 80
Method of analysis IS-5182
PART
4:2005
IS-5182
PART
23:2006
CPCB Vol-
I, 2013
IS-5182
PART
2:2001
IS-5182
PART
6:2006
Uncertainty Range (in µg/m3) ±19.04 ±0.0687 ±0.4420
Station Name (Code) Station
category
Date of
sampling
Date of
analysis
7-Jhabar B
03.02.2020 17.02.2020 189 94 55 33 37
07.02.2020 18.02.2020 179 68 56 23 29
10.02.2020 19.02.2020 190 76 54 29 34
13.02.2020 18.02.2020 167 95 49 37 39
16.02.2020 02.03.2020 166 94 46 22 24
19.02.2020 02.03.2020 172 85 38 33 34
24.02.2020 03.03.2020 186 89 39 36 40
27.02.2020 03.03.2020 163 74 37 19 20
8 –Ratija B
03.02.2020 17.02.2020 195 86 52 30 27
07.02.2020 17.02.2020 180 95 44 34 32
10.02.2020 18.02.2020 197 82 57 35 36
13.02.2020 18.02.2020 124 74 46 29 33
16.02.2020 02.03.2020 194 88 54 35 38
19.02.2020 02.03.2020 197 92 51 41 46
24.02.2020 03.03.2020 169 90 44 38 36
27.02.2020 03.03.2020 140 80 50 31 32
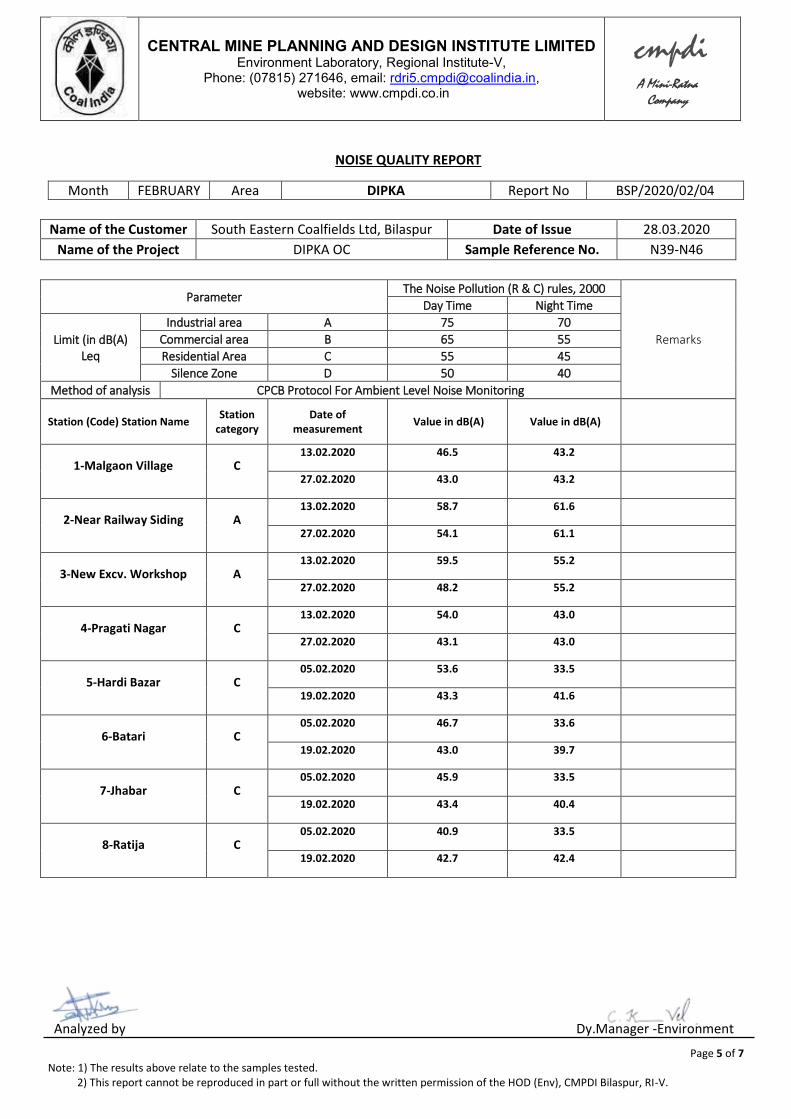
Analyzed by Dy.Manager -Environment
Page 5 of 7
Note: 1) The results above relate to the samples tested.
2) This report cannot be reproduced in part or full without the written permission of the HOD (Env), CMPDI Bilaspur, RI-V.
CENTRAL MINE PLANNING AND DESIGN INSTITUTE LIMITED
Environment Laboratory, Regional Institute-V, Phone: (07815) 271646, email: [email protected],
website: www.cmpdi.co.in
cmpdi
A Mini-Ratna Company
NOISE QUALITY REPORT
Month FEBRUARY Area DIPKA Report No BSP/2020/02/04
Name of the Customer South Eastern Coalfields Ltd, Bilaspur Date of Issue 28.03.2020
Name of the Project DIPKA OC Sample Reference No. N39-N46
Parameter The Noise Pollution (R & C) rules, 2000
Remarks
Day Time Night Time
Limit (in dB(A)
Leq
Industrial area A 75 70
Commercial area B 65 55
Residential Area C 55 45
Silence Zone D 50 40
Method of analysis CPCB Protocol For Ambient Level Noise Monitoring
Station (Code) Station Name Station
category
Date of
measurement Value in dB(A) Value in dB(A)
1-Malgaon Village C 13.02.2020 46.5 43.2
27.02.2020 43.0 43.2
2-Near Railway Siding A 13.02.2020 58.7 61.6
27.02.2020 54.1 61.1
3-New Excv. Workshop A 13.02.2020 59.5 55.2
27.02.2020 48.2 55.2
4-Pragati Nagar C 13.02.2020 54.0 43.0
27.02.2020 43.1 43.0
5-Hardi Bazar C 05.02.2020 53.6 33.5
19.02.2020 43.3 41.6
6-Batari C 05.02.2020 46.7 33.6
19.02.2020 43.0 39.7
7-Jhabar C 05.02.2020 45.9 33.5
19.02.2020 43.4 40.4
8-Ratija C 05.02.2020 40.9 33.5
19.02.2020 42.7 42.4

Analyzed by Dy.Manager -Environment
Page 6 of 7
Note: 1) The results above relate to the samples tested.
2) This report cannot be reproduced in part or full without the written permission of the HOD (Env), CMPDI Bilaspur, RI-V.
CENTRAL MINE PLANNING AND DESIGN INSTITUTE LIMITED
Environment Laboratory, Regional Institute-V, Phone: (07815) 271646, email: [email protected],
website: www.cmpdi.co.in
cmpdi
A Mini-Ratna Company
EFFLUENT WATER QUALITY REPORT
Month FEBRUARY Area DIPKA Report No BSP/2020/02/04
Name of the Customer South Eastern Coalfields Ltd, Bilaspur Date of Issue 28.03.2020
Name of the Project DIPKA OCP Date of Sampling Date of Analysis
Name of Stations (Code)
1.
Up-stream of Lilagarh Nala before entering
mining lease boundary 04.02.2020 14.02.2020 to 23.02.2020
22.02.2020 29.03.2020 to 09.03.2020
2. Down-stream of Lilagarh Nala after leaving
mining lease boundary. 04.02.2020 14.02.2020 to 23.02.2020
22.02.2020 29.03.2020 to 09.03.2020
3. Work shop effluent. 04.02.2020 14.02.2020 to 23.02.2020
22.02.2020 29.03.2020 to 09.03.2020
Sl. No Parameter Method of Analysis
Observed Value Lower
Detection Limit
General Standards for Discharge of
Environmental Pollution (Part A: Effluent) as per
Schedule VI, Environment
(Protection) Rules
Uncertainty of Measurement (at 95% C.L &
K= 1.96)
Stations
1 2 3
1 pH Value, LDL
IS 3025 (Part
11):1983, R : 1996,
Electrometric Method
7.44 8.24 6.79
0.01 5.5 to 9.0 ±0.8841821 at
4.025 7.49 8.22 6.81
2 Total suspended Solids, mg/l, max
IS 3025 (Part
17):1984, R: 1996,
Gravimetric Method
<25.0 <25.0 98.0
25.0 100.0 ±0.445mg/l at 24.429 mg/l <25.0 <25.0 112.0
3 C.O.D, mg/l, max APHA, 22nd Edition, 5220B, open Reflux,
Titration Method
<4.0 8.0 44.0
4.0 250.0 ±0.61535782 at
16.2892 mg/l <4.0 8.0 40.0
4 Oil & Grease,
mg/l, max
IS 3025 (Part
39):1991,
R : 2003, Partition
Gravimetric Method Thermometric
<2.0 <2.0 6.2
2.0 10.0 ±0.207mg/l at
10.314mg/l <2.0 <2.0 8.0
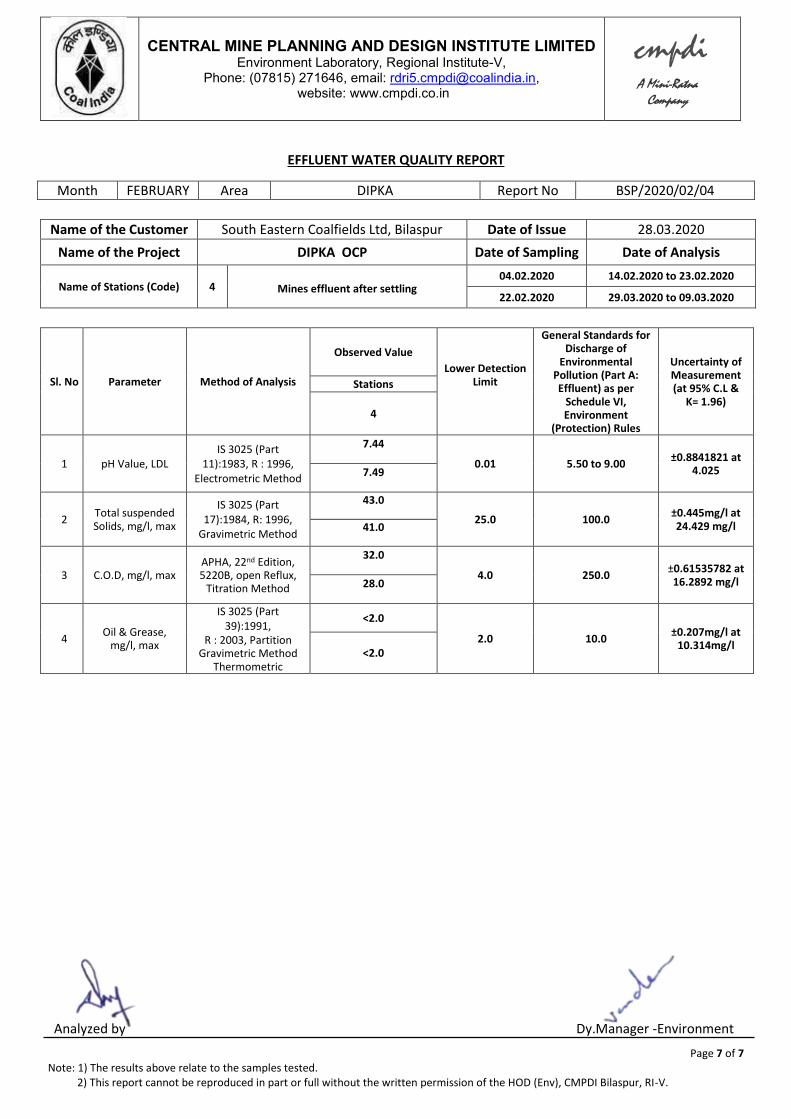
Analyzed by Dy.Manager -Environment
Page 7 of 7
Note: 1) The results above relate to the samples tested.
2) This report cannot be reproduced in part or full without the written permission of the HOD (Env), CMPDI Bilaspur, RI-V.
CENTRAL MINE PLANNING AND DESIGN INSTITUTE LIMITED
Environment Laboratory, Regional Institute-V, Phone: (07815) 271646, email: [email protected],
website: www.cmpdi.co.in
cmpdi
A Mini-Ratna Company
EFFLUENT WATER QUALITY REPORT
Month FEBRUARY Area DIPKA Report No BSP/2020/02/04
Name of the Customer South Eastern Coalfields Ltd, Bilaspur Date of Issue 28.03.2020
Name of the Project DIPKA OCP Date of Sampling Date of Analysis
Name of Stations (Code) 4 Mines effluent after settling 04.02.2020 14.02.2020 to 23.02.2020
22.02.2020 29.03.2020 to 09.03.2020
Sl. No Parameter Method of Analysis
Observed Value
Lower Detection Limit
General Standards for Discharge of
Environmental Pollution (Part A: Effluent) as per
Schedule VI, Environment
(Protection) Rules
Uncertainty of Measurement (at 95% C.L &
K= 1.96)
Stations
4
1 pH Value, LDL
IS 3025 (Part
11):1983, R : 1996,
Electrometric Method
7.44
0.01 5.50 to 9.00 ±0.8841821 at
4.025 7.49
2 Total suspended
Solids, mg/l, max
IS 3025 (Part
17):1984, R: 1996,
Gravimetric Method
43.0
25.0 100.0 ±0.445mg/l at 24.429 mg/l 41.0
3 C.O.D, mg/l, max APHA, 22nd Edition, 5220B, open Reflux,
Titration Method
32.0
4.0 250.0 ±0.61535782 at 16.2892 mg/l 28.0
4 Oil & Grease,
mg/l, max
IS 3025 (Part
39):1991,
R : 2003, Partition Gravimetric Method
Thermometric
<2.0
2.0 10.0 ±0.207mg/l at
10.314mg/l <2.0
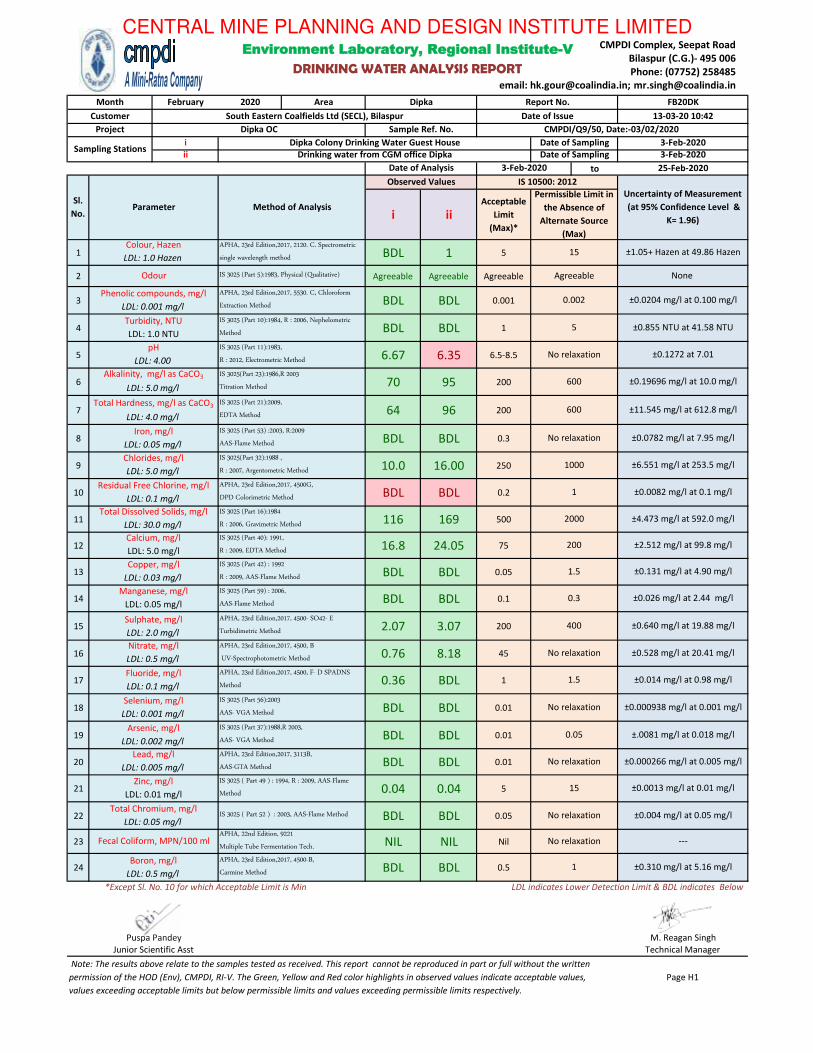
February 2020 Area
i
ii
to
i iiAcceptable
Limit
(Max)*
1 BDL 1 5
2 Agreeable Agreeable Agreeable
3 BDL BDL 0.001
4 BDL BDL 1
5 6.67 6.35 6.5-8.5
6 70 95 200
7 64 96 200
8 BDL BDL 0.3
9 10.0 16.00 250
10 BDL BDL 0.2
11 116 169 500
12 16.8 24.05 75
13 BDL BDL 0.05
14 BDL BDL 0.1
15 2.07 3.07 200
16 0.76 8.18 45
17 0.36 BDL 1
18 BDL BDL 0.01
19 BDL BDL 0.01
20 BDL BDL 0.01
21 0.04 0.04 5
22 BDL BDL 0.05
23 NIL NIL Nil
24 BDL BDL 0.5
CENTRAL MINE PLANNING AND DESIGN INSTITUTE LIMITED
Environment Laboratory, Regional Institute-V
DRINKING WATER ANALYSIS REPORT
Month Dipka Report No. FB20DK
Customer South Eastern Coalfields Ltd (SECL), Bilaspur Date of Issue 13-03-20 10:42
Project Dipka OC Sample Ref. No. CMPDI/Q9/50, Date:-03/02/2020
Sampling StationsDipka Colony Drinking Water Guest House Date of Sampling 3-Feb-2020
Drinking water from CGM office Dipka Date of Sampling 3-Feb-2020
Date of Analysis 3-Feb-2020 25-Feb-2020
Sl.
No.Parameter Method of Analysis
Observed Values IS 10500: 2012
Uncertainty of Measurement
(at 95% Confidence Level &
K= 1.96)
Phenolic compounds, mg/l
LDL: 0.001 mg/l
APHA, 23rd Edition,2017, 5530. C, Chloroform
Extraction Method0.002 ±0.0204 mg/l at 0.100 mg/l
Turbidity, NTU
LDL: 1.0 NTU
IS 3025 (Part 10):1984, R : 2006, Nephelometric
Method5 ±0.855 NTU at 41.58 NTU
Permissible Limit in
the Absence of
Alternate Source
(Max)Colour, Hazen
LDL: 1.0 Hazen
APHA, 23rd Edition,2017, 2120. C. Spectrometric
single wavelength method15 ±1.05+ Hazen at 49.86 Hazen
Odour IS 3025 (Part 5):1983, Physical (Qualitative) Agreeable None
Total Hardness, mg/l as CaCO3
LDL: 4.0 mg/l
IS 3025 (Part 21):2009,
EDTA Method600 ±11.545 mg/l at 612.8 mg/l
Iron, mg/l
LDL: 0.05 mg/l
IS 3025 (Part 53) :2003, R:2009
AAS-Flame MethodNo relaxation ±0.0782 mg/l at 7.95 mg/l
pH
LDL: 4.00
IS 3025 (Part 11):1983,
R : 2012, Electrometric MethodNo relaxation ±0.1272 at 7.01
Alkalinity, mg/l as CaCO3
LDL: 5.0 mg/l
IS 3025(Part 23):1986,R 2003
Titration Method600 ±0.19696 mg/l at 10.0 mg/l
Total Dissolved Solids, mg/l
LDL: 30.0 mg/l
IS 3025 (Part 16):1984
R : 2006, Gravimetric Method2000 ±4.473 mg/l at 592.0 mg/l
Calcium, mg/l
LDL: 5.0 mg/l
IS 3025 (Part 40): 1991,
R : 2009, EDTA Method200 ±2.512 mg/l at 99.8 mg/l
Chlorides, mg/l
LDL: 5.0 mg/l
IS 3025(Part 32):1988 ,
R : 2007, Argentometric Method1000 ±6.551 mg/l at 253.5 mg/l
Residual Free Chlorine, mg/l
LDL: 0.1 mg/l
APHA, 23rd Edition,2017, 4500G,
DPD Colorimetric Method1 ±0.0082 mg/l at 0.1 mg/l
Sulphate, mg/l
LDL: 2.0 mg/l
APHA, 23rd Edition,2017, 4500- SO42- E
Turbidimetric Method400 ±0.640 mg/l at 19.88 mg/l
Nitrate, mg/l
LDL: 0.5 mg/l
APHA, 23rd Edition,2017, 4500, B
UV-Spectrophotometric MethodNo relaxation ±0.528 mg/l at 20.41 mg/l
Copper, mg/l
LDL: 0.03 mg/l
IS 3025 (Part 42) : 1992
R : 2009, AAS-Flame Method1.5 ±0.131 mg/l at 4.90 mg/l
Manganese, mg/l
LDL: 0.05 mg/l
IS 3025 (Part 59) : 2006,
AAS-Flame Method0.3 ±0.026 mg/l at 2.44 mg/l
Arsenic, mg/l
LDL: 0.002 mg/l
IS 3025 (Part 37):1988,R 2003,
AAS- VGA Method0.05 ±.0081 mg/l at 0.018 mg/l
Lead, mg/l
LDL: 0.005 mg/l
APHA, 23rd Edition,2017, 3113B,
AAS-GTA MethodNo relaxation ±0.000266 mg/l at 0.005 mg/l
Fluoride, mg/l
LDL: 0.1 mg/l
APHA, 23rd Edition,2017, 4500, F- D SPADNS
Method1.5 ±0.014 mg/l at 0.98 mg/l
Selenium, mg/l
LDL: 0.001 mg/l
IS 3025 (Part 56):2003
AAS- VGA MethodNo relaxation ±0.000938 mg/l at 0.001 mg/l
Fecal Coliform, MPN/100 mlAPHA, 22nd Edition, 9221
Multiple Tube Fermentation Tech.No relaxation ---
Boron, mg/l
LDL: 0.5 mg/l
APHA, 23rd Edition,2017, 4500-B,
Carmine Method1 ±0.310 mg/l at 5.16 mg/l
Zinc, mg/l
LDL: 0.01 mg/l
IS 3025 ( Part 49 ) : 1994, R : 2009, AAS-Flame
Method15 ±0.0013 mg/l at 0.01 mg/l
Total Chromium, mg/l
LDL: 0.05 mg/lIS 3025 ( Part 52 ) : 2003, AAS-Flame Method No relaxation ±0.004 mg/l at 0.05 mg/l
Technical Manager
Note: The results above relate to the samples tested as received. This report cannot be reproduced in part or full without the written
permission of the HOD (Env), CMPDI, RI-V. The Green, Yellow and Red color highlights in observed values indicate acceptable values,
values exceeding acceptable limits but below permissible limits and values exceeding permissible limits respectively.
Page H1
*Except Sl. No. 10 for which Acceptable Limit is Min LDL indicates Lower Detection Limit & BDL indicates Below
Puspa Pandey M. Reagan Singh
Junior Scientific Asst
CMPDI Complex, Seepat Road
Bilaspur (C.G.)- 495 006
Phone: (07752) 258485
email: [email protected]; [email protected]
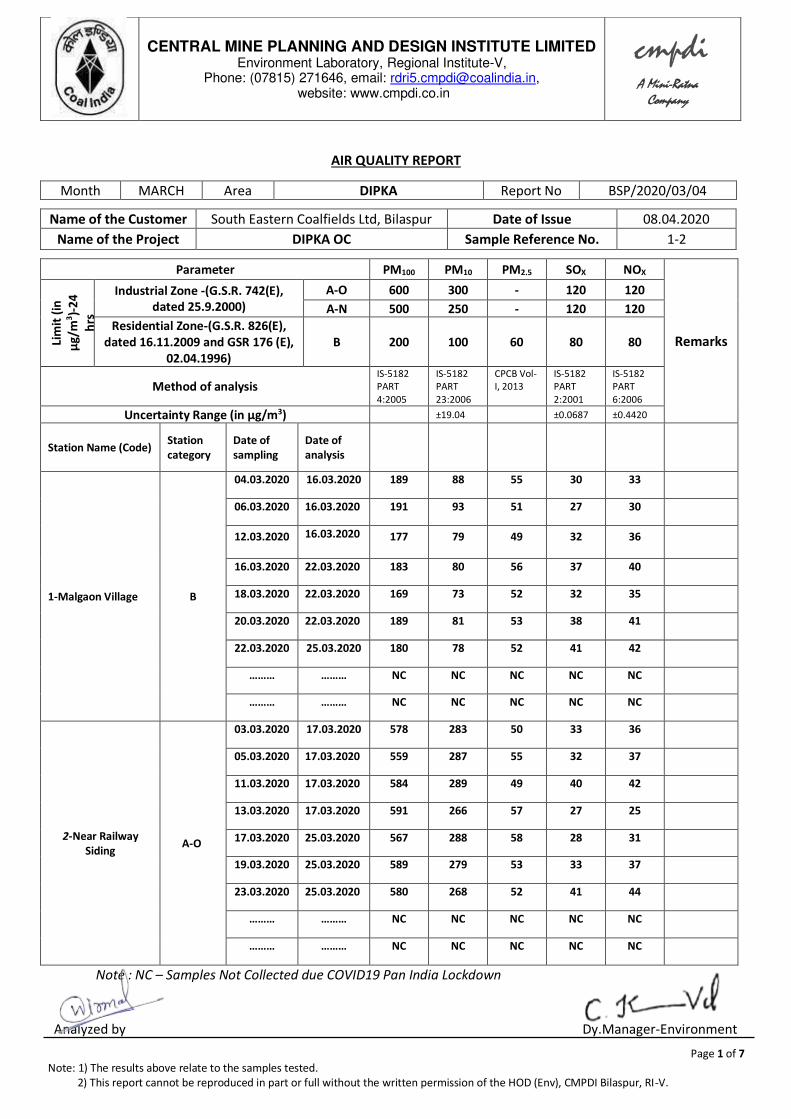
Analyzed by Dy.Manager-Environment
Page 1 of 7
Note: 1) The results above relate to the samples tested.
2) This report cannot be reproduced in part or full without the written permission of the HOD (Env), CMPDI Bilaspur, RI-V.
CENTRAL MINE PLANNING AND DESIGN INSTITUTE LIMITED
Environment Laboratory, Regional Institute-V, Phone: (07815) 271646, email: [email protected],
website: www.cmpdi.co.in
cmpdi
A Mini-Ratna Company
AIR QUALITY REPORT
Month MARCH Area DIPKA Report No BSP/2020/03/04
Name of the Customer South Eastern Coalfields Ltd, Bilaspur Date of Issue 08.04.2020
Name of the Project DIPKA OC Sample Reference No. 1-2
Parameter PM100 PM10 PM2.5 SOX NOX
Remarks Lim
it (
in
µg
/m3)-
24
hrs
Industrial Zone -(G.S.R. 742(E),
dated 25.9.2000)
A-O 600 300 - 120 120
A-N 500 250 - 120 120
Residential Zone-(G.S.R. 826(E),
dated 16.11.2009 and GSR 176 (E),
02.04.1996)
B 200 100 60 80 80
Method of analysis IS-5182
PART
4:2005
IS-5182
PART
23:2006
CPCB Vol-
I, 2013
IS-5182
PART
2:2001
IS-5182
PART
6:2006
Uncertainty Range (in µg/m3) ±19.04 ±0.0687 ±0.4420
Station Name (Code) Station
category
Date of
sampling
Date of
analysis
1-Malgaon Village B
04.03.2020 16.03.2020 189 88 55 30 33
06.03.2020 16.03.2020 191 93 51 27 30
12.03.2020 16.03.2020 177 79 49 32 36
16.03.2020 22.03.2020 183 80 56 37 40
18.03.2020 22.03.2020 169 73 52 32 35
20.03.2020 22.03.2020 189 81 53 38 41
22.03.2020 25.03.2020 180 78 52 41 42
……… ……… NC NC NC NC NC
……… ……… NC NC NC NC NC
2-Near Railway
Siding A-O
03.03.2020 17.03.2020 578 283 50 33 36
05.03.2020 17.03.2020 559 287 55 32 37
11.03.2020 17.03.2020 584 289 49 40 42
13.03.2020 17.03.2020 591 266 57 27 25
17.03.2020 25.03.2020 567 288 58 28 31
19.03.2020 25.03.2020 589 279 53 33 37
23.03.2020 25.03.2020 580 268 52 41 44
……… ……… NC NC NC NC NC
……… ……… NC NC NC NC NC
Note : NC – Samples Not Collected due COVID19 Pan India Lockdown

Analyzed by Dy.Manager-Environment
Page 2 of 7
Note: 1) The results above relate to the samples tested.
2) This report cannot be reproduced in part or full without the written permission of the HOD (Env), CMPDI Bilaspur, RI-V.
CENTRAL MINE PLANNING AND DESIGN INSTITUTE LIMITED
Environment Laboratory, Regional Institute-V, Phone: (07815) 271646, email: [email protected],
website: www.cmpdi.co.in
cmpdi
A Mini-Ratna Company
AIR QUALITY REPORT
Month MARCH Area DIPKA Report No BSP/2020/03/04
Name of the Customer South Eastern Coalfields Ltd, Bilaspur Date of Issue 08.04.2020
Name of the Project DIPKA OC Sample Reference No. 3-4
Parameter PM100 PM10 PM2.5 SOX NOX
Remarks Lim
it (
in
µg
/m3)-
24
hrs
Industrial Zone -(G.S.R. 742(E),
dated 25.9.2000)
A-O 600 300 - 120 120
A-N 500 250 - 120 120
Residential Zone-(G.S.R. 826(E),
dated 16.11.2009 and GSR 176 (E),
02.04.1996)
B 200 100 60 80 80
Method of analysis IS-5182
PART
4:2005
IS-5182
PART
23:2006
CPCB Vol-
I, 2013
IS-5182
PART
2:2001
IS-5182
PART
6:2006
Uncertainty Range (in µg/m3) ±19.04 ±0.0687 ±0.4420
Station Name (Code) Station
category
Date of
sampling
Date of
analysis
3-Near Excv.
Workshop A-O
03.03.2020 16.03.2020 589 287 52 32 35
05.03.2020 16.03.2020 594 277 56 36 39
11.03.2020 16.03.2020 578 285 57 38 33
13.03.2020 22.03.2020 568 291 53 29 31
17.03.2020 22.03.2020 587 278 49 27 30
19.03.2020 22.03.2020 567 288 58 34 37
23.03.2020 25.03.2020 588 274 57 40 42
……… ……… NC NC NC NC NC
……… ……… NC NC NC NC NC
4-Pragati Nagar B
04.03.2020 16.03.2020 190 88 52 33 36
06.03.2020 16.03.2020 187 86 49 27 31
12.03.2020 16.03.2020 179 77 51 29 32
16.03.2020 22.03.2020 168 81 53 33 37
18.03.2020 22.03.2020 194 90 50 35 40
20.03.2020 22.03.2020 196 91 48 37 38
22.03.2020 25.03.2020 188 84 47 42 40
……… ……… NC NC NC NC NC
……… ……… NC NC NC NC NC
Note : NC – Samples Not Collected due COVID19 Pan India Lockdown

Analyzed by Dy.Manager-Environment
Page 3 of 7
Note: 1) The results above relate to the samples tested.
2) This report cannot be reproduced in part or full without the written permission of the HOD (Env), CMPDI Bilaspur, RI-V.
CENTRAL MINE PLANNING AND DESIGN INSTITUTE LIMITED
Environment Laboratory, Regional Institute-V, Phone: (07815) 271646, email: [email protected],
website: www.cmpdi.co.in
cmpdi
A Mini-Ratna Company
AIR QUALITY REPORT
Month MARCH Area DIPKA Report No BSP/2020/03/04
Name of the Customer South Eastern Coalfields Ltd, Bilaspur Date of Issue 08.04.2020
Name of the Project DIPKA OC Sample Reference No. 5-6
Parameter PM100 PM10 PM2.5 SOX NOX
Remarks Lim
it (
in
µg
/m3)-
24
hrs
Industrial Zone -(G.S.R. 742(E),
dated 25.9.2000)
A-O 600 300 - 120 120
A-N 500 250 - 120 120
Residential Zone-(G.S.R. 826(E),
dated 16.11.2009 and GSR 176 (E),
02.04.1996)
B 200 100 60 80 80
Method of analysis IS-5182
PART
4:2005
IS-5182
PART
23:2006
CPCB Vol-
I, 2013
IS-5182
PART
2:2001
IS-5182
PART
6:2006
Uncertainty Range (in µg/m3) ±19.04 ±0.0687 ±0.4420
Station Name (Code) Station
category
Date of
sampling
Date of
analysis
5-Hardi Bazar B
04.03.2020 16.03.2020 187 87 50 29 31
06.03.2020 16.03.2020 198 86 55 34 33
12.03.2020 16.03.2020 187 82 53 37 38
16.03.2020 22.03.2020 179 79 56 40 43
18.03.2020 22.03.2020 168 83 51 29 34
20.03.2020 22.03.2020 189 93 52 42 46
22.03.2020 25.03.2020 188 98 54 39 41
……… ……… NC NC NC NC NC
……… ……… NC NC NC NC NC
6-Batari B
03.03.2020 16.03.2020 177 87 53 27 31
05.03.2020 16.03.2020 168 79 49 29 33
11.03.2020 16.03.2020 182 82 51 31 33
13.03.2020 22.03.2020 191 88 53 24 28
17.03.2020 22.03.2020 187 91 57 33 37
19.03.2020 22.03.2020 166 87 46 36 40
23.03.2020 25.03.2020 178 96 57 29 44
……… ……… NC NC NC NC NC
……… ……… NC NC NC NC NC
Note : NC – Samples Not Collected due COVID19 Pan India Lockdown
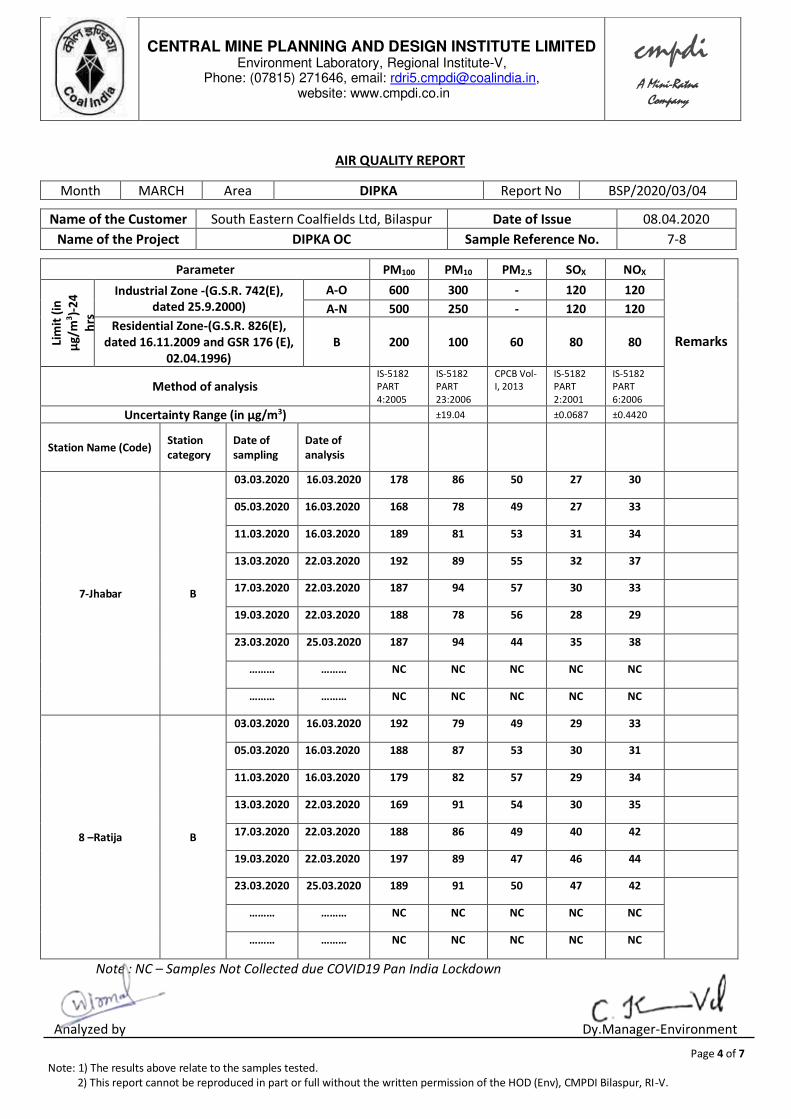
Analyzed by Dy.Manager-Environment
Page 4 of 7
Note: 1) The results above relate to the samples tested.
2) This report cannot be reproduced in part or full without the written permission of the HOD (Env), CMPDI Bilaspur, RI-V.
CENTRAL MINE PLANNING AND DESIGN INSTITUTE LIMITED
Environment Laboratory, Regional Institute-V, Phone: (07815) 271646, email: [email protected],
website: www.cmpdi.co.in
cmpdi
A Mini-Ratna Company
AIR QUALITY REPORT
Month MARCH Area DIPKA Report No BSP/2020/03/04
Name of the Customer South Eastern Coalfields Ltd, Bilaspur Date of Issue 08.04.2020
Name of the Project DIPKA OC Sample Reference No. 7-8
Parameter PM100 PM10 PM2.5 SOX NOX
Remarks Lim
it (
in
µg
/m3)-
24
hrs
Industrial Zone -(G.S.R. 742(E),
dated 25.9.2000)
A-O 600 300 - 120 120
A-N 500 250 - 120 120
Residential Zone-(G.S.R. 826(E),
dated 16.11.2009 and GSR 176 (E),
02.04.1996)
B 200 100 60 80 80
Method of analysis IS-5182
PART
4:2005
IS-5182
PART
23:2006
CPCB Vol-
I, 2013
IS-5182
PART
2:2001
IS-5182
PART
6:2006
Uncertainty Range (in µg/m3) ±19.04 ±0.0687 ±0.4420
Station Name (Code) Station
category
Date of
sampling
Date of
analysis
7-Jhabar B
03.03.2020 16.03.2020 178 86 50 27 30
05.03.2020 16.03.2020 168 78 49 27 33
11.03.2020 16.03.2020 189 81 53 31 34
13.03.2020 22.03.2020 192 89 55 32 37
17.03.2020 22.03.2020 187 94 57 30 33
19.03.2020 22.03.2020 188 78 56 28 29
23.03.2020 25.03.2020 187 94 44 35 38
……… ……… NC NC NC NC NC
……… ……… NC NC NC NC NC
8 –Ratija B
03.03.2020 16.03.2020 192 79 49 29 33
05.03.2020 16.03.2020 188 87 53 30 31
11.03.2020 16.03.2020 179 82 57 29 34
13.03.2020 22.03.2020 169 91 54 30 35
17.03.2020 22.03.2020 188 86 49 40 42
19.03.2020 22.03.2020 197 89 47 46 44
23.03.2020 25.03.2020 189 91 50 47 42
……… ……… NC NC NC NC NC
……… ……… NC NC NC NC NC
Note : NC – Samples Not Collected due COVID19 Pan India Lockdown

Analyzed by Dy.Manager-Environment
Page 5 of 7
Note: 1) The results above relate to the samples tested.
2) This report cannot be reproduced in part or full without the written permission of the HOD (Env), CMPDI Bilaspur, RI-V.
CENTRAL MINE PLANNING AND DESIGN INSTITUTE LIMITED
Environment Laboratory, Regional Institute-V, Phone: (07815) 271646, email: [email protected],
website: www.cmpdi.co.in
cmpdi
A Mini-Ratna Company
NOISE QUALITY REPORT
Month MARCH Area DIPKA Report No BSP/2020/03/04
Name of the Customer South Eastern Coalfields Ltd, Bilaspur Date of Issue 08.04.2020
Name of the Project DIPKA OC Sample Reference No. N39-N46
Parameter The Noise Pollution (R & C) rules, 2000
Remarks
Day Time Night Time
Limit (in dB(A)
Leq
Industrial area A 75 70
Commercial area B 65 55
Residential Area C 55 45
Silence Zone D 50 40
Method of analysis CPCB Protocol For Ambient Level Noise Monitoring
Station (Code) Station Name Station
category
Date of
measurement Value in dB(A) Value in dB(A)
1-Malgaon Village C 12.03.2020 44.7 40.7
……… NC NC
2-Near Railway Siding A 12.03.2020 64.9 52.7
……… NC NC
3-New Excv. Workshop A 12.03.2020 60.8 53.4
……… NC NC
4-Pragati Nagar C 12.03.2020 45.4 45.7
……… NC NC
5-Hardi Bazar C 04.03.2020 52.2 37.7
18.03.2020 47.2 44.9
6-Batari C 04.03.2020 45.0 35.6
18.03.2020 50.2 42.5
7-Jhabar C 04.03.2020 49.9 40.5
18.03.2020 49.6 46.6
8-Ratija C 04.03.2020 44.9 37.5
18.03.2020 47.5 40.9
Note : NC – Samples Not Collected due COVID19 Pan India Lockdown

Analyzed by Dy.Manager-Environment
Page 6 of 7
Note: 1) The results above relate to the samples tested.
2) This report cannot be reproduced in part or full without the written permission of the HOD (Env), CMPDI Bilaspur, RI-V.
CENTRAL MINE PLANNING AND DESIGN INSTITUTE LIMITED
Environment Laboratory, Regional Institute-V, Phone: (07815) 271646, email: [email protected],
website: www.cmpdi.co.in
cmpdi
A Mini-Ratna Company
EFFLUENT WATER QUALITY REPORT
Month MARCH Area DIPKA Report No BSP/2020/03/04
Name of the Customer South Eastern Coalfields Ltd, Bilaspur Date of Issue 08.04.2020
Name of the Project DIPKA OCP Date of Sampling Date of Analysis
Name of Stations (Code)
1.
Up-stream of Lilagarh Nala before entering
mining lease boundary 09.03.2020 12.03.2020 to 22.03.2020
19.03.2020 23.03.2020 to 02.04.2020
2. Down-stream of Lilagarh Nala after leaving
mining lease boundary. 09.03.2020 12.03.2020 to 22.03.2020
19.03.2020 23.03.2020 to 02.04.2020
3. Work shop effluent. 09.03.2020 12.03.2020 to 22.03.2020
19.03.2020 23.03.2020 to 02.04.2020
Sl. No Parameter Method of Analysis
Observed Value
Lower Detection
Limit
General Standards for Discharge of
Environmental Pollution (Part A: Effluent) as per
Schedule VI, Environment
(Protection) Rules
Uncertainty of Measurement (at 95% C.L &
K= 1.96)
Stations
1 2 3
1 pH Value, LDL
IS 3025 (Part
11):1983, R : 1996,
Electrometric Method
7.58 8.11 6.91
0.01 5.5 to 9.0 ±0.8841821 at
4.025 7.61 8.08 6.88
2 Total suspended Solids, mg/l, max
IS 3025 (Part
17):1984, R: 1996,
Gravimetric Method
<25.0 <25.0 114
25.0 100.0 ±0.445mg/l at 24.429 mg/l <25.0 <25.0 91
3 C.O.D, mg/l, max APHA, 22nd Edition, 5220B, open Reflux,
Titration Method
<4.0 <4.0 48
4.0 250.0 ±0.61535782 at
16.2892 mg/l <4.0 <4.0 48
4 Oil & Grease,
mg/l, max
IS 3025 (Part
39):1991,
R : 2003, Partition Gravimetric Method
Thermometric
<2.0 <2.0 8.2
2.0 10.0 ±0.207mg/l at
10.314mg/l <2.0 <2.0 6.8
Note : NC – Samples Not Collected due COVID19 Pan India Lockdown

Analyzed by Dy.Manager-Environment
Page 7 of 7
Note: 1) The results above relate to the samples tested.
2) This report cannot be reproduced in part or full without the written permission of the HOD (Env), CMPDI Bilaspur, RI-V.
CENTRAL MINE PLANNING AND DESIGN INSTITUTE LIMITED
Environment Laboratory, Regional Institute-V, Phone: (07815) 271646, email: [email protected],
website: www.cmpdi.co.in
cmpdi
A Mini-Ratna Company
EFFLUENT WATER QUALITY REPORT
Month MARCH Area DIPKA Report No BSP/2020/03/04
Name of the Customer South Eastern Coalfields Ltd, Bilaspur Date of Issue 08.04.2020
Name of the Project DIPKA OCP Date of Sampling Date of Analysis
Name of Stations (Code) 4 Mines effluent after settling 09.03.2020 12.03.2020 to 22.03.2020
19.03.2020 23.03.2020 to 02.04.2020
Sl. No Parameter Method of Analysis
Observed Value
Lower Detection Limit
General Standards for Discharge of
Environmental Pollution (Part A: Effluent) as per
Schedule VI, Environment
(Protection) Rules
Uncertainty of Measurement (at 95% C.L &
K= 1.96)
Stations
4
1 pH Value, LDL
IS 3025 (Part
11):1983, R : 1996,
Electrometric Method
7.48
0.01 5.50 to 9.00 ±0.8841821 at
4.025 7.52
2 Total suspended Solids, mg/l, max
IS 3025 (Part
17):1984, R: 1996,
Gravimetric Method
39
25.0 100.0 ±0.445mg/l at 24.429 mg/l 41
3 C.O.D, mg/l, max APHA, 22nd Edition, 5220B, open Reflux,
Titration Method
20
4.0 250.0 ±0.61535782 at 16.2892 mg/l 32
4 Oil & Grease,
mg/l, max
IS 3025 (Part
39):1991,
R : 2003, Partition Gravimetric Method
Thermometric
<2.0
2.0 10.0 ±0.207mg/l at
10.314mg/l <2.0
Note : NC – Samples Not Collected due COVID19 Pan India Lockdown
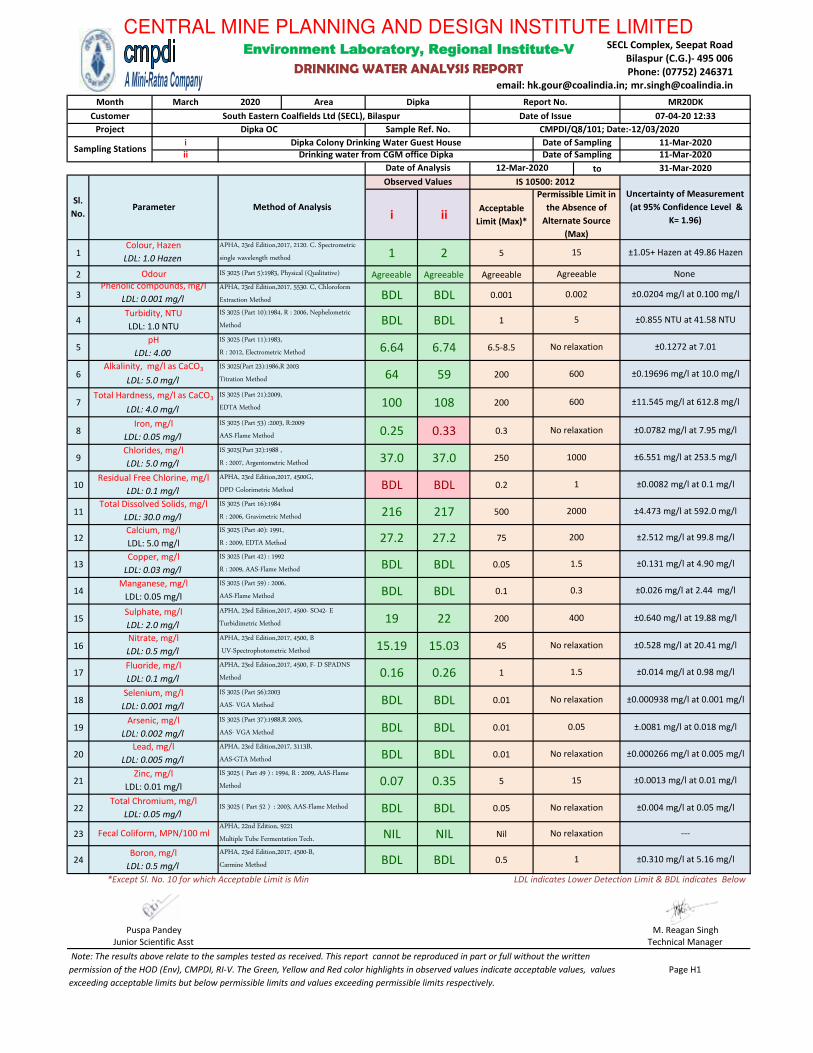
March 2020 Area
i
ii
to
i iiAcceptable
Limit (Max)*
1 1 2 5
2 Agreeable Agreeable Agreeable
3 BDL BDL 0.001
4 BDL BDL 1
5 6.64 6.74 6.5-8.5
6 64 59 200
7 100 108 200
8 0.25 0.33 0.3
9 37.0 37.0 250
10 BDL BDL 0.2
11 216 217 500
12 27.2 27.2 75
13 BDL BDL 0.05
14 BDL BDL 0.1
15 19 22 200
16 15.19 15.03 45
17 0.16 0.26 1
18 BDL BDL 0.01
19 BDL BDL 0.01
20 BDL BDL 0.01
21 0.07 0.35 5
22 BDL BDL 0.05
23 NIL NIL Nil
24 BDL BDL 0.5
Junior Scientific Asst Technical Manager
Note: The results above relate to the samples tested as received. This report cannot be reproduced in part or full without the written
permission of the HOD (Env), CMPDI, RI-V. The Green, Yellow and Red color highlights in observed values indicate acceptable values, values
exceeding acceptable limits but below permissible limits and values exceeding permissible limits respectively.
Page H1
*Except Sl. No. 10 for which Acceptable Limit is Min LDL indicates Lower Detection Limit & BDL indicates Below
Puspa Pandey M. Reagan Singh
Fecal Coliform, MPN/100 mlAPHA, 22nd Edition, 9221
Multiple Tube Fermentation Tech.No relaxation ---
Boron, mg/l
LDL: 0.5 mg/l
APHA, 23rd Edition,2017, 4500-B,
Carmine Method1 ±0.310 mg/l at 5.16 mg/l
Zinc, mg/l
LDL: 0.01 mg/l
IS 3025 ( Part 49 ) : 1994, R : 2009, AAS-Flame
Method15 ±0.0013 mg/l at 0.01 mg/l
Total Chromium, mg/l
LDL: 0.05 mg/lIS 3025 ( Part 52 ) : 2003, AAS-Flame Method No relaxation ±0.004 mg/l at 0.05 mg/l
Arsenic, mg/l
LDL: 0.002 mg/l
IS 3025 (Part 37):1988,R 2003,
AAS- VGA Method0.05 ±.0081 mg/l at 0.018 mg/l
Lead, mg/l
LDL: 0.005 mg/l
APHA, 23rd Edition,2017, 3113B,
AAS-GTA MethodNo relaxation ±0.000266 mg/l at 0.005 mg/l
Fluoride, mg/l
LDL: 0.1 mg/l
APHA, 23rd Edition,2017, 4500, F- D SPADNS
Method1.5 ±0.014 mg/l at 0.98 mg/l
Selenium, mg/l
LDL: 0.001 mg/l
IS 3025 (Part 56):2003
AAS- VGA MethodNo relaxation ±0.000938 mg/l at 0.001 mg/l
Sulphate, mg/l
LDL: 2.0 mg/l
APHA, 23rd Edition,2017, 4500- SO42- E
Turbidimetric Method400 ±0.640 mg/l at 19.88 mg/l
Nitrate, mg/l
LDL: 0.5 mg/l
APHA, 23rd Edition,2017, 4500, B
UV-Spectrophotometric MethodNo relaxation ±0.528 mg/l at 20.41 mg/l
Copper, mg/l
LDL: 0.03 mg/l
IS 3025 (Part 42) : 1992
R : 2009, AAS-Flame Method1.5 ±0.131 mg/l at 4.90 mg/l
Manganese, mg/l
LDL: 0.05 mg/l
IS 3025 (Part 59) : 2006,
AAS-Flame Method0.3 ±0.026 mg/l at 2.44 mg/l
Total Dissolved Solids, mg/l
LDL: 30.0 mg/l
IS 3025 (Part 16):1984
R : 2006, Gravimetric Method2000 ±4.473 mg/l at 592.0 mg/l
Calcium, mg/l
LDL: 5.0 mg/l
IS 3025 (Part 40): 1991,
R : 2009, EDTA Method200 ±2.512 mg/l at 99.8 mg/l
Chlorides, mg/l
LDL: 5.0 mg/l
IS 3025(Part 32):1988 ,
R : 2007, Argentometric Method1000 ±6.551 mg/l at 253.5 mg/l
Residual Free Chlorine, mg/l
LDL: 0.1 mg/l
APHA, 23rd Edition,2017, 4500G,
DPD Colorimetric Method1 ±0.0082 mg/l at 0.1 mg/l
Total Hardness, mg/l as CaCO3
LDL: 4.0 mg/l
IS 3025 (Part 21):2009,
EDTA Method600 ±11.545 mg/l at 612.8 mg/l
Iron, mg/l
LDL: 0.05 mg/l
IS 3025 (Part 53) :2003, R:2009
AAS-Flame MethodNo relaxation ±0.0782 mg/l at 7.95 mg/l
pH
LDL: 4.00
IS 3025 (Part 11):1983,
R : 2012, Electrometric MethodNo relaxation ±0.1272 at 7.01
Alkalinity, mg/l as CaCO3
LDL: 5.0 mg/l
IS 3025(Part 23):1986,R 2003
Titration Method600 ±0.19696 mg/l at 10.0 mg/l
Phenolic compounds, mg/l
LDL: 0.001 mg/l
APHA, 23rd Edition,2017, 5530. C, Chloroform
Extraction Method0.002 ±0.0204 mg/l at 0.100 mg/l
Turbidity, NTU
LDL: 1.0 NTU
IS 3025 (Part 10):1984, R : 2006, Nephelometric
Method5 ±0.855 NTU at 41.58 NTU
Permissible Limit in
the Absence of
Alternate Source
(Max)
Colour, Hazen
LDL: 1.0 Hazen
APHA, 23rd Edition,2017, 2120. C. Spectrometric
single wavelength method15 ±1.05+ Hazen at 49.86 Hazen
Odour IS 3025 (Part 5):1983, Physical (Qualitative) Agreeable None
Date of Analysis 12-Mar-2020 31-Mar-2020
Sl.
No.Parameter Method of Analysis
Observed Values IS 10500: 2012
Uncertainty of Measurement
(at 95% Confidence Level &
K= 1.96)
Project Dipka OC Sample Ref. No. CMPDI/Q8/101; Date:-12/03/2020
Sampling StationsDipka Colony Drinking Water Guest House Date of Sampling 11-Mar-2020
Drinking water from CGM office Dipka Date of Sampling 11-Mar-2020
CENTRAL MINE PLANNING AND DESIGN INSTITUTE LIMITED
Environment Laboratory, Regional Institute-V
DRINKING WATER ANALYSIS REPORT
Month Dipka Report No. MR20DK
Customer South Eastern Coalfields Ltd (SECL), Bilaspur Date of Issue 07-04-20 12:33
SECL Complex, Seepat Road
Bilaspur (C.G.)- 495 006
Phone: (07752) 246371
email: [email protected]; [email protected]
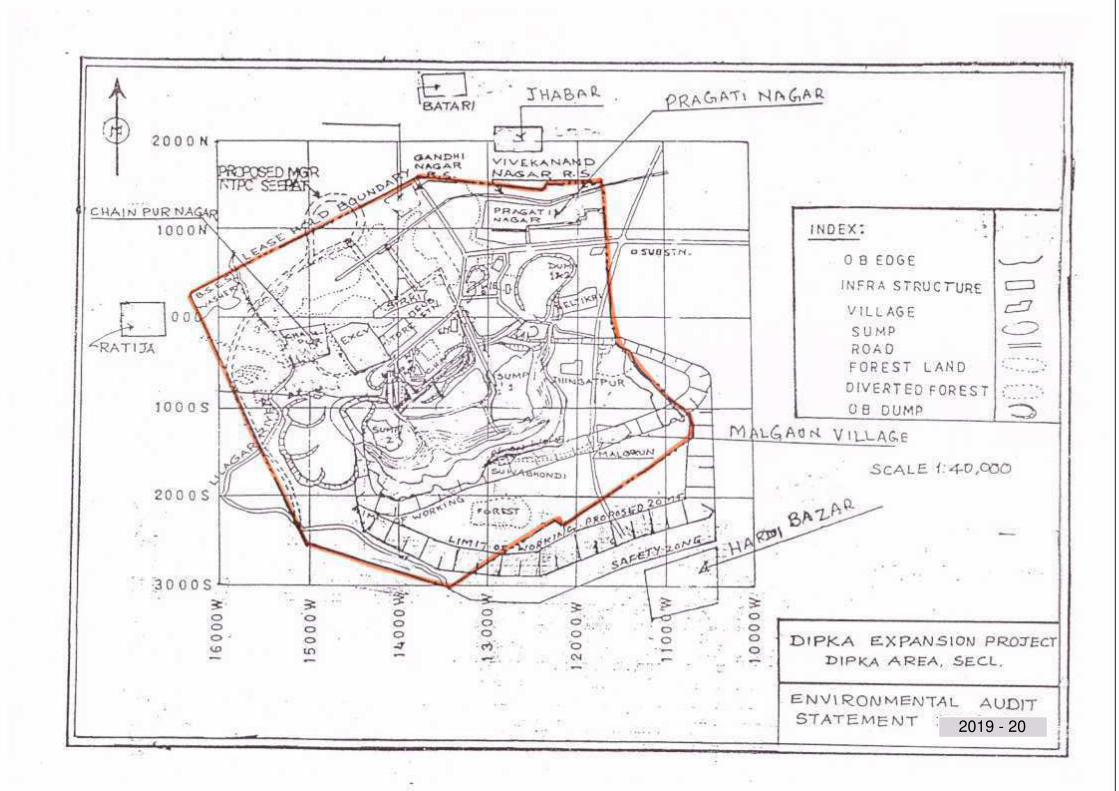
2019 - 20
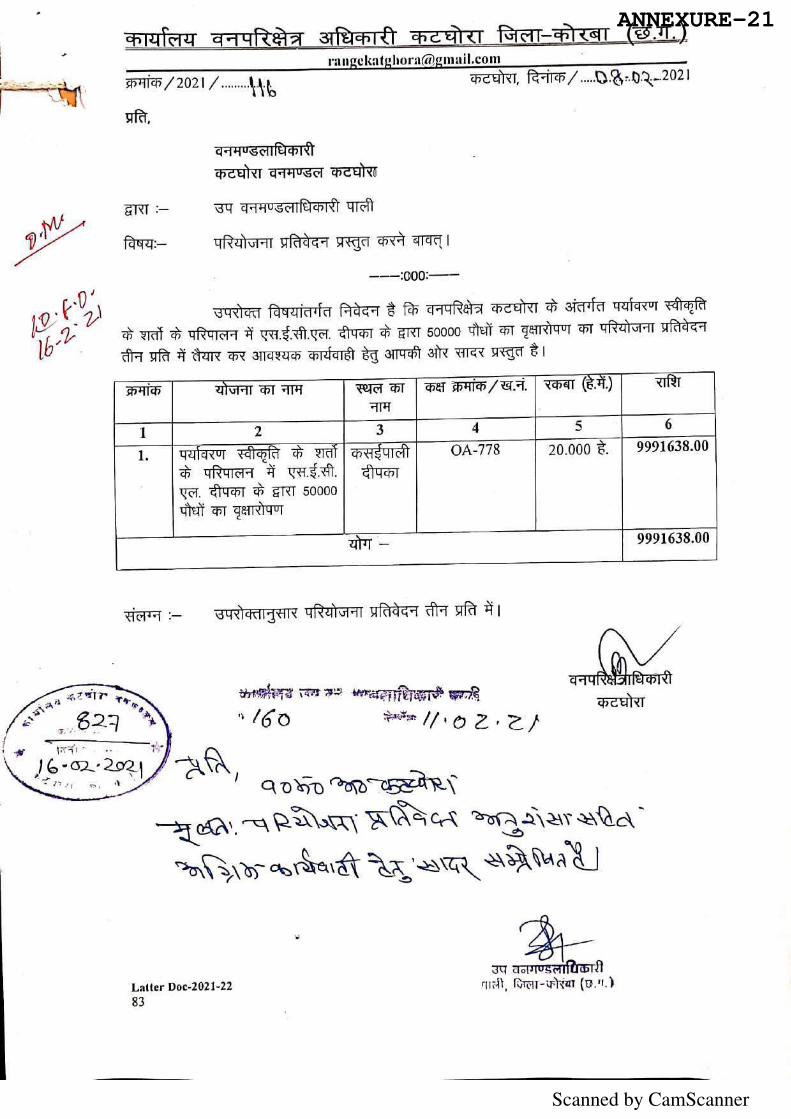
Scanned by CamScanner
ANNEXURE-21
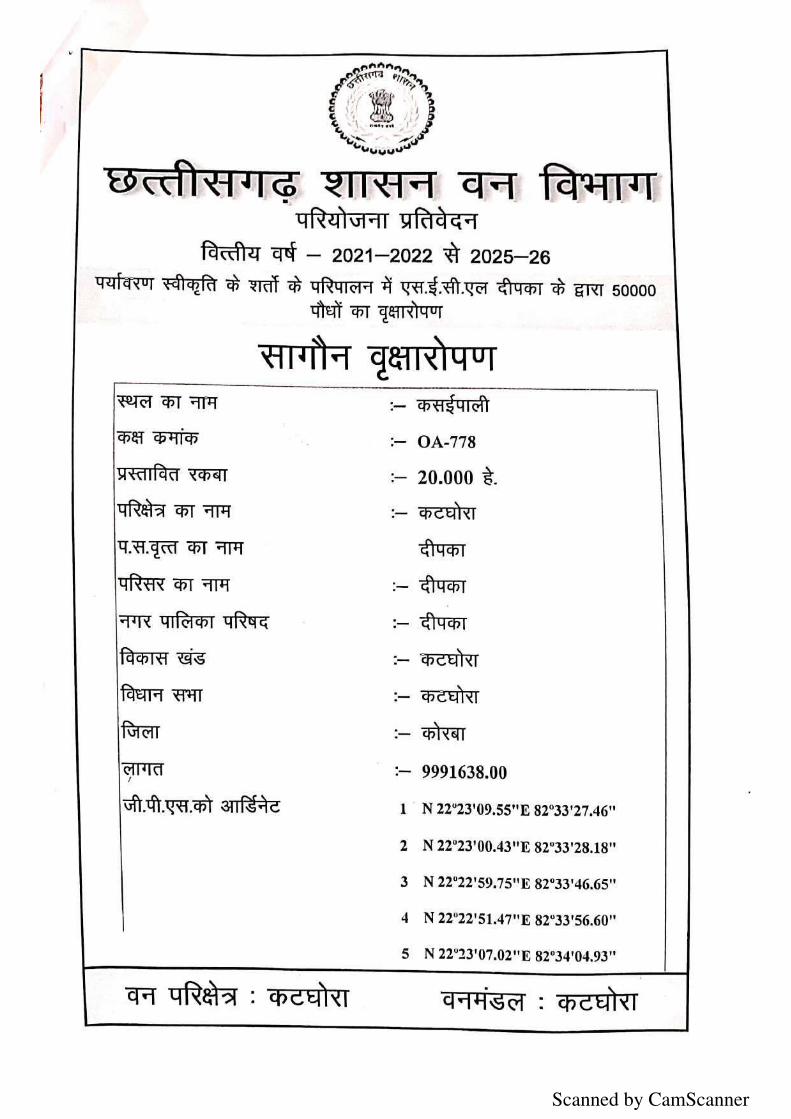
Scanned by CamScanner
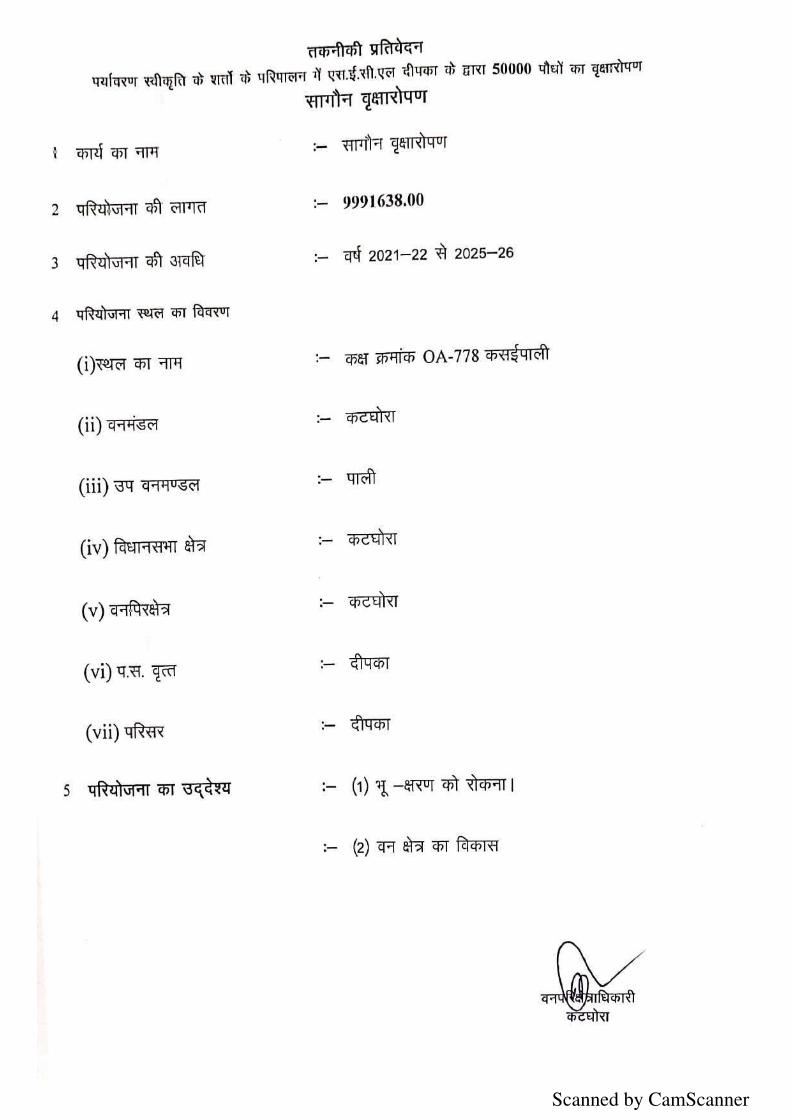
Scanned by CamScanner

Scanned by CamScanner

Scanned by CamScanner
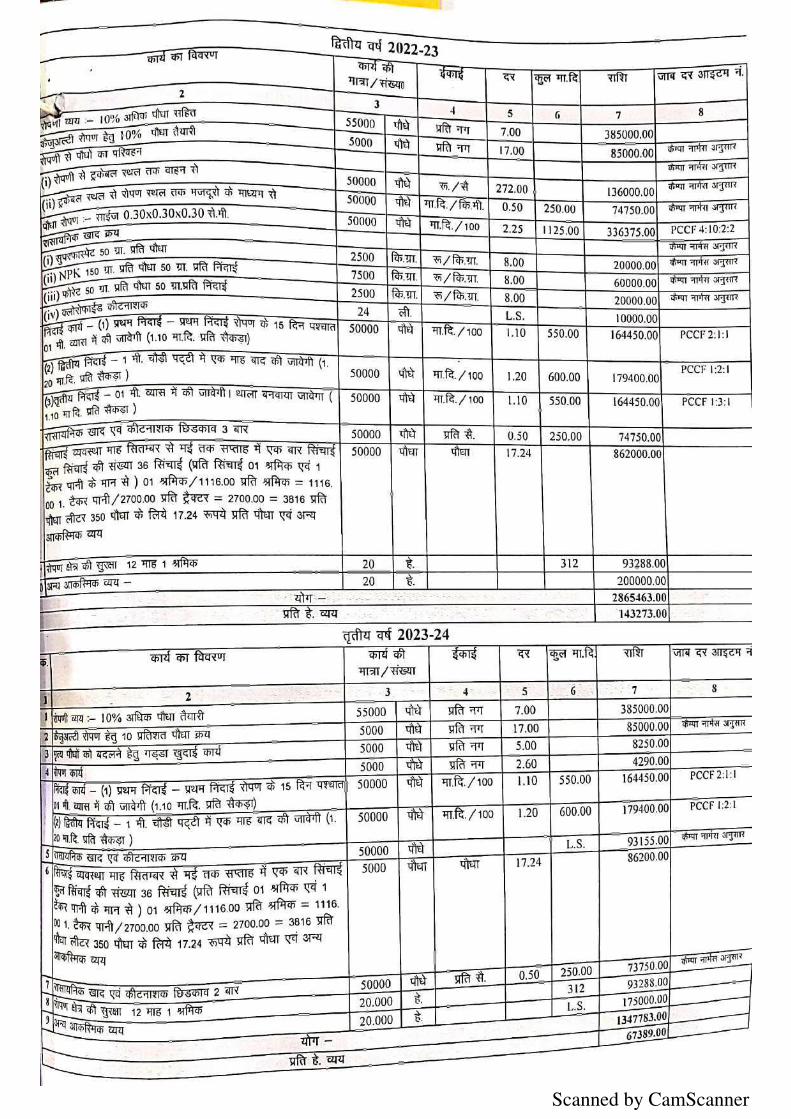
Scanned by CamScanner

Scanned by CamScanner
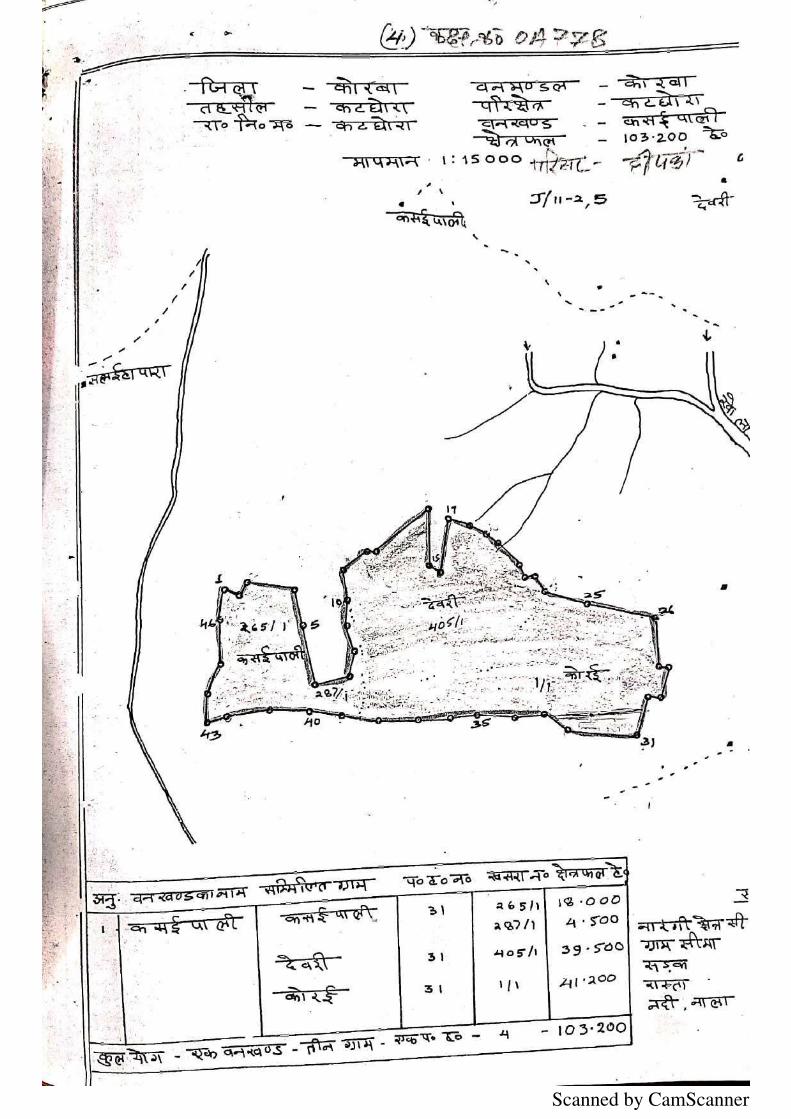
Scanned by CamScanner
COPYRIGHT WITH
CMPDI
A MINI RATNA
ISO 9001 COMPANY
Central Mine Planning & Design Institute Limited
Regional Institute – V, CMPDI Complex,
BILASPUR (C.G.)
ENVIRONMENTAL MONITORING REPORT
GROUND WATER
SOUTH EASTERN COALFIELDS LIMITED
(A Mini Ratna Company)
JANUARY to MARCH - 2021
(DIPKA AREA)
ANNEXURE-22

DIPKA AREA
Dipka OC
i Borewell water from Nunera
ii Borewell water from Suwabhohri
iii Borewell water from Tiwarta
iv Borewell water from Dipka Moore
v Borewell water from Hardi Bazaar 3
Total Number of Samples = 05
1
1
2
2
INDEX
Sl.No Name of stationsPage No
JANUARY to MARCH -2021

January 2021 Area
i
ii
to
i iiAcceptable
Limit (Max)*
1 BDL BDL 5
2 Agreeable Agreeable Agreeable
3 BDL BDL 0.001
4 1 1 1
5 6.89 6.51 6.5-8.5
6 275 15 200
7 206 40 200
8 0.10 BDL 0.3
9 53.5 17.0 250
10 BDL BDL 0.2
11 453 186 500
12 36.8 12.0 75
13 BDL BDL 0.05
14 BDL BDL 0.1
15 20 BDL 200
16 7.23 7.18 45
17 0.22 BDL 1
18 BDL BDL 0.01
19 BDL BDL 0.01
20 BDL BDL 0.01
21 0.15 0.08 5
22 BDL BDL 0.05
23 NIL NIL Nil
24 BDL BDL 0.5
CENTRAL MINE PLANNING AND DESIGN INSTITUTE LIMITEDEnvironment Laboratory, Regional Institute-V
GROUND WATER QUALITY REPORT
(January to March-2021) Month Dipka Report No. JN21DK
Customer South Eastern Coalfields Ltd (SECL), Bilaspur Date of Issue 6-Feb-2021
Project Dipka OC Sample Ref. No. CMPDI/Q20/08, Date: 11/02/2021
Sampling StationsBorewell water from Nunera Date of Sampling 11-Jan-2021
Borewell water from Suwabhohri Date of Sampling 11-Jan-2021
Date of Analysis 11-Jan-2021 29-Jan-2021
Sl.
No.Parameter Method of Analysis
Observed Values IS 10500: 2012
Uncertainty of Measurement
(at 95% Confidence Level &
K= 1.96)
Phenolic compounds, mg/l
LDL: 0.001 mg/l
APHA, 23rd Edition,2017, 5530. C,
Chloroform Extraction Method0.002 ±0.0204 mg/l at 0.100 mg/l
Turbidity, NTU
LDL: 1.0 NTU
IS 3025 (Part 10):1984, R : 2006,
Nephelometric Method5 ±0.855 NTU at 41.58 NTU
Permissible Limit in
the Absence of
Alternate Source
(Max)
Colour, Hazen
LDL: 1.0 Hazen
APHA, 23rd Edition,2017, 2120. C.
Spectrometric single wavelength
method
15 ±1.05 Hazen at 49.86 Hazen
OdourIS 3025 (Part 5):1983, Physical
(Qualitative)Agreeable None
Total Hardness, mg/l as CaCO3
LDL: 4.0 mg/l
IS 3025 (Part 21):2009,
EDTA Method600 ±11.545 mg/l at 612.8 mg/l
Iron, mg/l
LDL: 0.05 mg/l
IS 3025 (Part 53) :2003, R:2009
AAS-Flame MethodNo relaxation ±0.0782 mg/l at 7.95 mg/l
pH
LDL: 4.00
IS 3025 (Part 11):1983,
R : 2012, Electrometric MethodNo relaxation ±0.1272 at 7.01
Alkalinity, mg/l as CaCO3
LDL: 5.0 mg/l
IS 3025(Part 23):1986,R 2003
Titration Method600 ±0.19696 mg/l at 10.0 mg/l
Total Dissolved Solids, mg/l
LDL: 30.0 mg/l
IS 3025 (Part 16):1984
R : 2006, Gravimetric Method2000 ±4.473 mg/l at 592.0 mg/l
Calcium, mg/l
LDL: 5.0 mg/l
IS 3025 (Part 40): 1991,
R : 2009, EDTA Method200 ±2.512 mg/l at 99.8 mg/l
Chlorides, mg/l
LDL: 5.0 mg/l
IS 3025(Part 32):1988 ,
R : 2007, Argentometric Method1000 ±6.551 mg/l at 253.5 mg/l
Residual Free Chlorine, mg/l
LDL: 0.1 mg/l
APHA, 23rd Edition,2017, 4500G,
DPD Colorimetric Method1 ±0.0082 mg/l at 0.1 mg/l
Sulphate, mg/l
LDL: 2.0 mg/l
APHA, 23rd Edition,2017, 4500- SO42-
E Turbidimetric Method400 ±0.640 mg/l at 19.88 mg/l
Nitrate, mg/l
LDL: 0.5 mg/l
APHA, 23rd Edition,2017, 4500, B
UV-Spectrophotometric MethodNo relaxation ±0.528 mg/l at 20.41 mg/l
Copper, mg/l
LDL: 0.03 mg/l
IS 3025 (Part 42) : 1992
R : 2009, AAS-Flame Method1.5 ±0.131 mg/l at 4.90 mg/l
Manganese, mg/l
LDL: 0.05 mg/l
IS 3025 (Part 59) : 2006,
AAS-Flame Method0.3 ±0.026 mg/l at 2.44 mg/l
Arsenic, mg/l
LDL: 0.002 mg/l
IS 3025 (Part 37):1988,R 2003,
AAS- VGA Method0.05 ±.0081 mg/l at 0.018 mg/l
Lead, mg/l
LDL: 0.005 mg/l
APHA, 23rd Edition,2017, 3113B,
AAS-GTA MethodNo relaxation ±0.000266 mg/l at 0.005 mg/l
Fluoride, mg/l
LDL: 0.1 mg/l
APHA, 23rd Edition,2017, 4500, F- D
SPADNS Method1.5 ±0.014 mg/l at 0.98 mg/l
Selenium, mg/l
LDL: 0.001 mg/l
IS 3025 (Part 56):2003
AAS- VGA MethodNo relaxation ±0.000938 mg/l at 0.001 mg/l
Fecal Coliform, MPN/100 mlAPHA, 22nd Edition, 9221
Multiple Tube Fermentation Tech.No relaxation ---
Boron, mg/l
LDL: 0.5 mg/l
APHA, 23rd Edition,2017, 4500-B,
Carmine Method1 ±0.310 mg/l at 5.16 mg/l
Zinc, mg/l
LDL: 0.01 mg/l
IS 3025 ( Part 49 ) : 1994, R : 2009,
AAS-Flame Method15 ±0.0013 mg/l at 0.01 mg/l
Total Chromium, mg/l
LDL: 0.05 mg/l
IS 3025 ( Part 52 ) : 2003, AAS-Flame
MethodNo relaxation ±0.004 mg/l at 0.05 mg/l
Lab Coordinator
Note: The results above relate to the samples tested as received. This report cannot be reproduced in part or full without the written
permission of the HOD (Env), CMPDI, RI-V. The Green, Yellow and Red color highlights in observed values indicate acceptable values, values
exceeding acceptable limits but below permissible limits and values exceeding permissible limits respectively.
Page 1
*Except Sl. No. 10 for which Acceptable Limit is Min LDL indicates Lower Detection Limit & BDL indicates Below Detection Limit
R.K Thakur M. Reagan Singh
Junior Scientific Asst
CMPDI Complex, Seepat Road
Bilaspur (C.G.)- 495 006
Phone: (07752) 246371
email: [email protected]; [email protected]
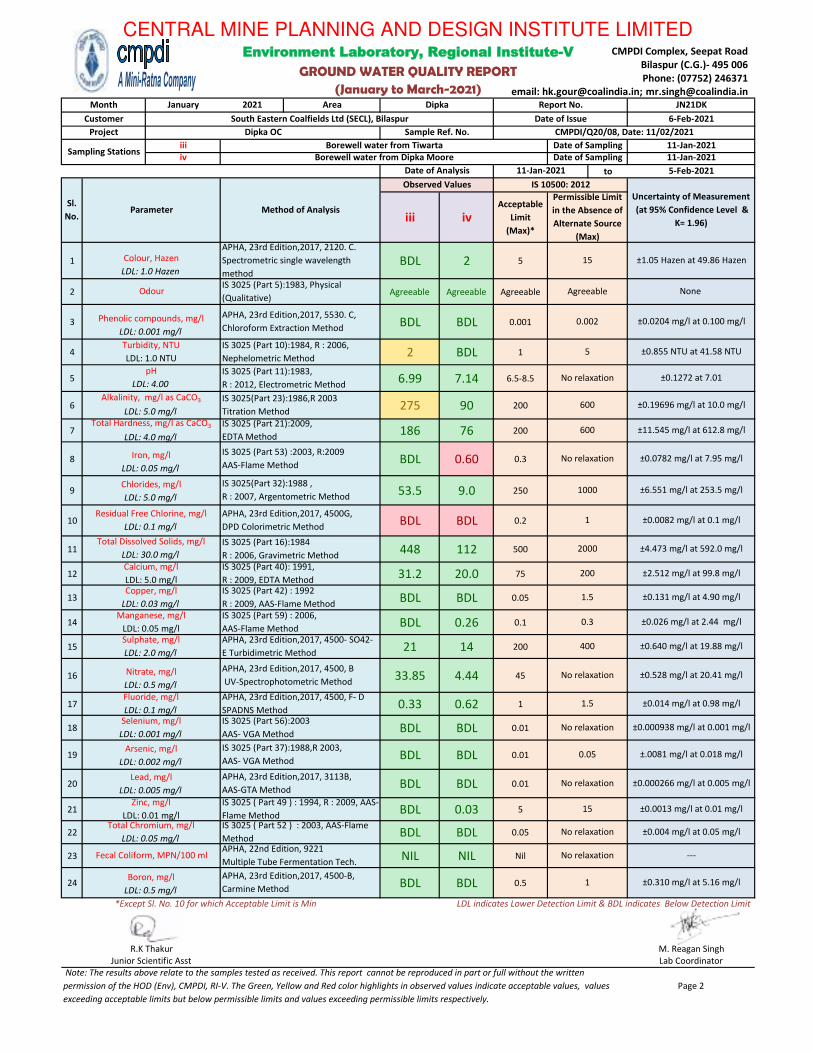
January 2021 Area
iii
iv
to
iii ivAcceptable
Limit
(Max)*
1 BDL 2 5
2 Agreeable Agreeable Agreeable
3 BDL BDL 0.001
4 2 BDL 1
5 6.99 7.14 6.5-8.5
6 275 90 200
7 186 76 200
8 BDL 0.60 0.3
9 53.5 9.0 250
10 BDL BDL 0.2
11 448 112 500
12 31.2 20.0 75
13 BDL BDL 0.05
14 BDL 0.26 0.1
15 21 14 200
16 33.85 4.44 45
17 0.33 0.62 1
18 BDL BDL 0.01
19 BDL BDL 0.01
20 BDL BDL 0.01
21 BDL 0.03 5
22 BDL BDL 0.05
23 NIL NIL Nil
24 BDL BDL 0.5
Junior Scientific Asst Lab Coordinator
Note: The results above relate to the samples tested as received. This report cannot be reproduced in part or full without the written
permission of the HOD (Env), CMPDI, RI-V. The Green, Yellow and Red color highlights in observed values indicate acceptable values, values
exceeding acceptable limits but below permissible limits and values exceeding permissible limits respectively.
Page 2
*Except Sl. No. 10 for which Acceptable Limit is Min LDL indicates Lower Detection Limit & BDL indicates Below Detection Limit
R.K Thakur M. Reagan Singh
Fecal Coliform, MPN/100 mlAPHA, 22nd Edition, 9221
Multiple Tube Fermentation Tech.No relaxation ---
Boron, mg/l
LDL: 0.5 mg/l
APHA, 23rd Edition,2017, 4500-B,
Carmine Method1 ±0.310 mg/l at 5.16 mg/l
Zinc, mg/l
LDL: 0.01 mg/l
IS 3025 ( Part 49 ) : 1994, R : 2009, AAS-
Flame Method15 ±0.0013 mg/l at 0.01 mg/l
Total Chromium, mg/l
LDL: 0.05 mg/l
IS 3025 ( Part 52 ) : 2003, AAS-Flame
MethodNo relaxation ±0.004 mg/l at 0.05 mg/l
Arsenic, mg/l
LDL: 0.002 mg/l
IS 3025 (Part 37):1988,R 2003,
AAS- VGA Method0.05 ±.0081 mg/l at 0.018 mg/l
Lead, mg/l
LDL: 0.005 mg/l
APHA, 23rd Edition,2017, 3113B,
AAS-GTA MethodNo relaxation ±0.000266 mg/l at 0.005 mg/l
Fluoride, mg/l
LDL: 0.1 mg/l
APHA, 23rd Edition,2017, 4500, F- D
SPADNS Method1.5 ±0.014 mg/l at 0.98 mg/l
Selenium, mg/l
LDL: 0.001 mg/l
IS 3025 (Part 56):2003
AAS- VGA MethodNo relaxation ±0.000938 mg/l at 0.001 mg/l
Sulphate, mg/l
LDL: 2.0 mg/l
APHA, 23rd Edition,2017, 4500- SO42-
E Turbidimetric Method400 ±0.640 mg/l at 19.88 mg/l
Nitrate, mg/l
LDL: 0.5 mg/l
APHA, 23rd Edition,2017, 4500, B
UV-Spectrophotometric MethodNo relaxation ±0.528 mg/l at 20.41 mg/l
Copper, mg/l
LDL: 0.03 mg/l
IS 3025 (Part 42) : 1992
R : 2009, AAS-Flame Method1.5 ±0.131 mg/l at 4.90 mg/l
Manganese, mg/l
LDL: 0.05 mg/l
IS 3025 (Part 59) : 2006,
AAS-Flame Method0.3 ±0.026 mg/l at 2.44 mg/l
Total Dissolved Solids, mg/l
LDL: 30.0 mg/l
IS 3025 (Part 16):1984
R : 2006, Gravimetric Method2000 ±4.473 mg/l at 592.0 mg/l
Calcium, mg/l
LDL: 5.0 mg/l
IS 3025 (Part 40): 1991,
R : 2009, EDTA Method200 ±2.512 mg/l at 99.8 mg/l
Chlorides, mg/l
LDL: 5.0 mg/l
IS 3025(Part 32):1988 ,
R : 2007, Argentometric Method1000 ±6.551 mg/l at 253.5 mg/l
Residual Free Chlorine, mg/l
LDL: 0.1 mg/l
APHA, 23rd Edition,2017, 4500G,
DPD Colorimetric Method1 ±0.0082 mg/l at 0.1 mg/l
Total Hardness, mg/l as CaCO3
LDL: 4.0 mg/l
IS 3025 (Part 21):2009,
EDTA Method600 ±11.545 mg/l at 612.8 mg/l
Iron, mg/l
LDL: 0.05 mg/l
IS 3025 (Part 53) :2003, R:2009
AAS-Flame MethodNo relaxation ±0.0782 mg/l at 7.95 mg/l
pH
LDL: 4.00
IS 3025 (Part 11):1983,
R : 2012, Electrometric MethodNo relaxation ±0.1272 at 7.01
Alkalinity, mg/l as CaCO3
LDL: 5.0 mg/l
IS 3025(Part 23):1986,R 2003
Titration Method600 ±0.19696 mg/l at 10.0 mg/l
Phenolic compounds, mg/l
LDL: 0.001 mg/l
APHA, 23rd Edition,2017, 5530. C,
Chloroform Extraction Method0.002 ±0.0204 mg/l at 0.100 mg/l
Turbidity, NTU
LDL: 1.0 NTU
IS 3025 (Part 10):1984, R : 2006,
Nephelometric Method5 ±0.855 NTU at 41.58 NTU
Permissible Limit
in the Absence of
Alternate Source
(Max)
Colour, Hazen
LDL: 1.0 Hazen
APHA, 23rd Edition,2017, 2120. C.
Spectrometric single wavelength
method
15 ±1.05 Hazen at 49.86 Hazen
OdourIS 3025 (Part 5):1983, Physical
(Qualitative)Agreeable None
Date of Analysis 11-Jan-2021 5-Feb-2021
Sl.
No.Parameter Method of Analysis
Observed Values IS 10500: 2012
Uncertainty of Measurement
(at 95% Confidence Level &
K= 1.96)
Project Dipka OC Sample Ref. No. CMPDI/Q20/08, Date: 11/02/2021
Sampling StationsBorewell water from Tiwarta Date of Sampling 11-Jan-2021
Borewell water from Dipka Moore Date of Sampling 11-Jan-2021
CENTRAL MINE PLANNING AND DESIGN INSTITUTE LIMITEDEnvironment Laboratory, Regional Institute-V
GROUND WATER QUALITY REPORT
(January to March-2021) Month Dipka Report No. JN21DK
Customer South Eastern Coalfields Ltd (SECL), Bilaspur Date of Issue 6-Feb-2021
CMPDI Complex, Seepat Road
Bilaspur (C.G.)- 495 006
Phone: (07752) 246371
email: [email protected]; [email protected]
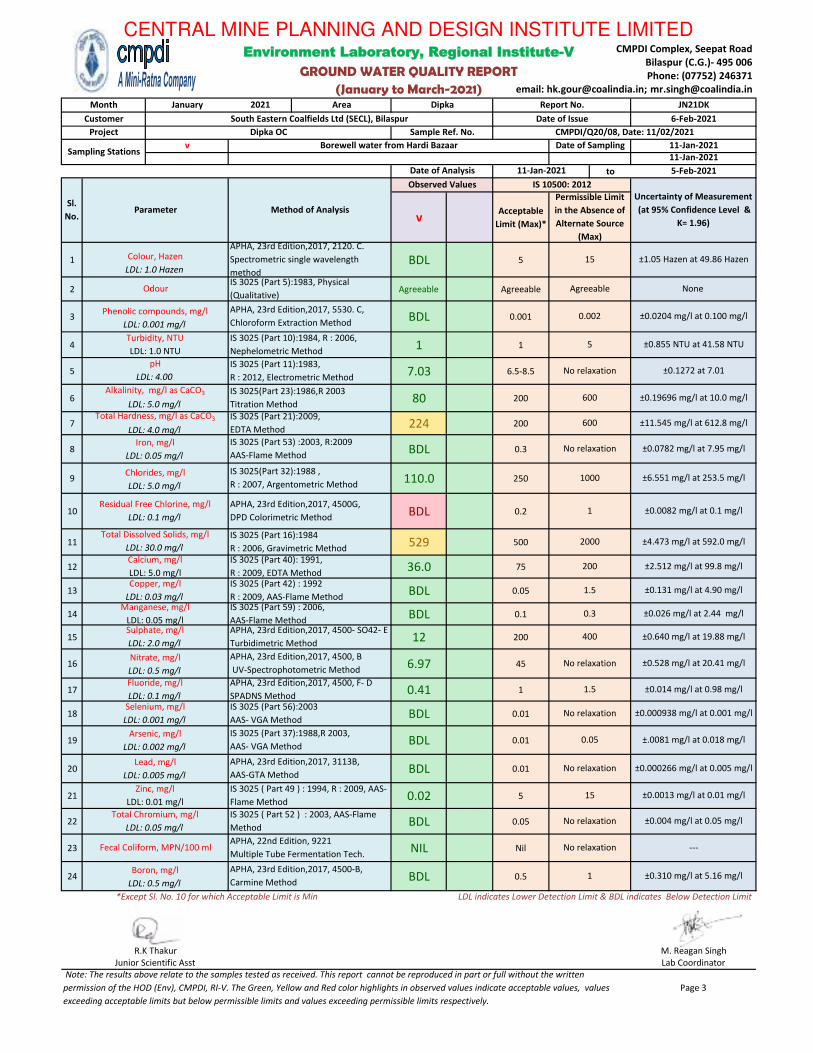
January 2021 Area
v
to
vAcceptable
Limit (Max)*
1 BDL 5
2 Agreeable Agreeable
3 BDL 0.001
4 1 1
5 7.03 6.5-8.5
6 80 200
7 224 200
8 BDL 0.3
9 110.0 250
10 BDL 0.2
11 529 500
12 36.0 75
13 BDL 0.05
14 BDL 0.1
15 12 200
16 6.97 45
17 0.41 1
18 BDL 0.01
19 BDL 0.01
20 BDL 0.01
21 0.02 5
22 BDL 0.05
23 NIL Nil
24 BDL 0.5
CENTRAL MINE PLANNING AND DESIGN INSTITUTE LIMITEDEnvironment Laboratory, Regional Institute-V
GROUND WATER QUALITY REPORT
(January to March-2021) Month Dipka Report No. JN21DK
Customer South Eastern Coalfields Ltd (SECL), Bilaspur Date of Issue 6-Feb-2021
Project Dipka OC Sample Ref. No. CMPDI/Q20/08, Date: 11/02/2021
Sampling StationsBorewell water from Hardi Bazaar Date of Sampling 11-Jan-2021
11-Jan-2021
Date of Analysis 11-Jan-2021 5-Feb-2021
Sl.
No.Parameter Method of Analysis
Observed Values IS 10500: 2012
Uncertainty of Measurement
(at 95% Confidence Level &
K= 1.96)
Phenolic compounds, mg/l
LDL: 0.001 mg/l
APHA, 23rd Edition,2017, 5530. C,
Chloroform Extraction Method0.002 ±0.0204 mg/l at 0.100 mg/l
Turbidity, NTU
LDL: 1.0 NTU
IS 3025 (Part 10):1984, R : 2006,
Nephelometric Method5 ±0.855 NTU at 41.58 NTU
Permissible Limit
in the Absence of
Alternate Source
(Max)
Colour, Hazen
LDL: 1.0 Hazen
APHA, 23rd Edition,2017, 2120. C.
Spectrometric single wavelength
method
15 ±1.05 Hazen at 49.86 Hazen
OdourIS 3025 (Part 5):1983, Physical
(Qualitative)Agreeable None
Total Hardness, mg/l as CaCO3
LDL: 4.0 mg/l
IS 3025 (Part 21):2009,
EDTA Method600 ±11.545 mg/l at 612.8 mg/l
Iron, mg/l
LDL: 0.05 mg/l
IS 3025 (Part 53) :2003, R:2009
AAS-Flame MethodNo relaxation ±0.0782 mg/l at 7.95 mg/l
pH
LDL: 4.00
IS 3025 (Part 11):1983,
R : 2012, Electrometric MethodNo relaxation ±0.1272 at 7.01
Alkalinity, mg/l as CaCO3
LDL: 5.0 mg/l
IS 3025(Part 23):1986,R 2003
Titration Method600 ±0.19696 mg/l at 10.0 mg/l
Total Dissolved Solids, mg/l
LDL: 30.0 mg/l
IS 3025 (Part 16):1984
R : 2006, Gravimetric Method2000 ±4.473 mg/l at 592.0 mg/l
Calcium, mg/l
LDL: 5.0 mg/l
IS 3025 (Part 40): 1991,
R : 2009, EDTA Method200 ±2.512 mg/l at 99.8 mg/l
Chlorides, mg/l
LDL: 5.0 mg/l
IS 3025(Part 32):1988 ,
R : 2007, Argentometric Method1000 ±6.551 mg/l at 253.5 mg/l
Residual Free Chlorine, mg/l
LDL: 0.1 mg/l
APHA, 23rd Edition,2017, 4500G,
DPD Colorimetric Method1 ±0.0082 mg/l at 0.1 mg/l
Sulphate, mg/l
LDL: 2.0 mg/l
APHA, 23rd Edition,2017, 4500- SO42- E
Turbidimetric Method400 ±0.640 mg/l at 19.88 mg/l
Nitrate, mg/l
LDL: 0.5 mg/l
APHA, 23rd Edition,2017, 4500, B
UV-Spectrophotometric MethodNo relaxation ±0.528 mg/l at 20.41 mg/l
Copper, mg/l
LDL: 0.03 mg/l
IS 3025 (Part 42) : 1992
R : 2009, AAS-Flame Method1.5 ±0.131 mg/l at 4.90 mg/l
Manganese, mg/l
LDL: 0.05 mg/l
IS 3025 (Part 59) : 2006,
AAS-Flame Method0.3 ±0.026 mg/l at 2.44 mg/l
Arsenic, mg/l
LDL: 0.002 mg/l
IS 3025 (Part 37):1988,R 2003,
AAS- VGA Method0.05 ±.0081 mg/l at 0.018 mg/l
Lead, mg/l
LDL: 0.005 mg/l
APHA, 23rd Edition,2017, 3113B,
AAS-GTA MethodNo relaxation ±0.000266 mg/l at 0.005 mg/l
Fluoride, mg/l
LDL: 0.1 mg/l
APHA, 23rd Edition,2017, 4500, F- D
SPADNS Method1.5 ±0.014 mg/l at 0.98 mg/l
Selenium, mg/l
LDL: 0.001 mg/l
IS 3025 (Part 56):2003
AAS- VGA MethodNo relaxation ±0.000938 mg/l at 0.001 mg/l
Fecal Coliform, MPN/100 mlAPHA, 22nd Edition, 9221
Multiple Tube Fermentation Tech.No relaxation ---
Boron, mg/l
LDL: 0.5 mg/l
APHA, 23rd Edition,2017, 4500-B,
Carmine Method1 ±0.310 mg/l at 5.16 mg/l
Zinc, mg/l
LDL: 0.01 mg/l
IS 3025 ( Part 49 ) : 1994, R : 2009, AAS-
Flame Method15 ±0.0013 mg/l at 0.01 mg/l
Total Chromium, mg/l
LDL: 0.05 mg/l
IS 3025 ( Part 52 ) : 2003, AAS-Flame
MethodNo relaxation ±0.004 mg/l at 0.05 mg/l
Lab Coordinator
Note: The results above relate to the samples tested as received. This report cannot be reproduced in part or full without the written
permission of the HOD (Env), CMPDI, RI-V. The Green, Yellow and Red color highlights in observed values indicate acceptable values, values
exceeding acceptable limits but below permissible limits and values exceeding permissible limits respectively.
Page 3
*Except Sl. No. 10 for which Acceptable Limit is Min LDL indicates Lower Detection Limit & BDL indicates Below Detection Limit
R.K Thakur M. Reagan Singh
Junior Scientific Asst
CMPDI Complex, Seepat Road
Bilaspur (C.G.)- 495 006
Phone: (07752) 246371
email: [email protected]; [email protected]
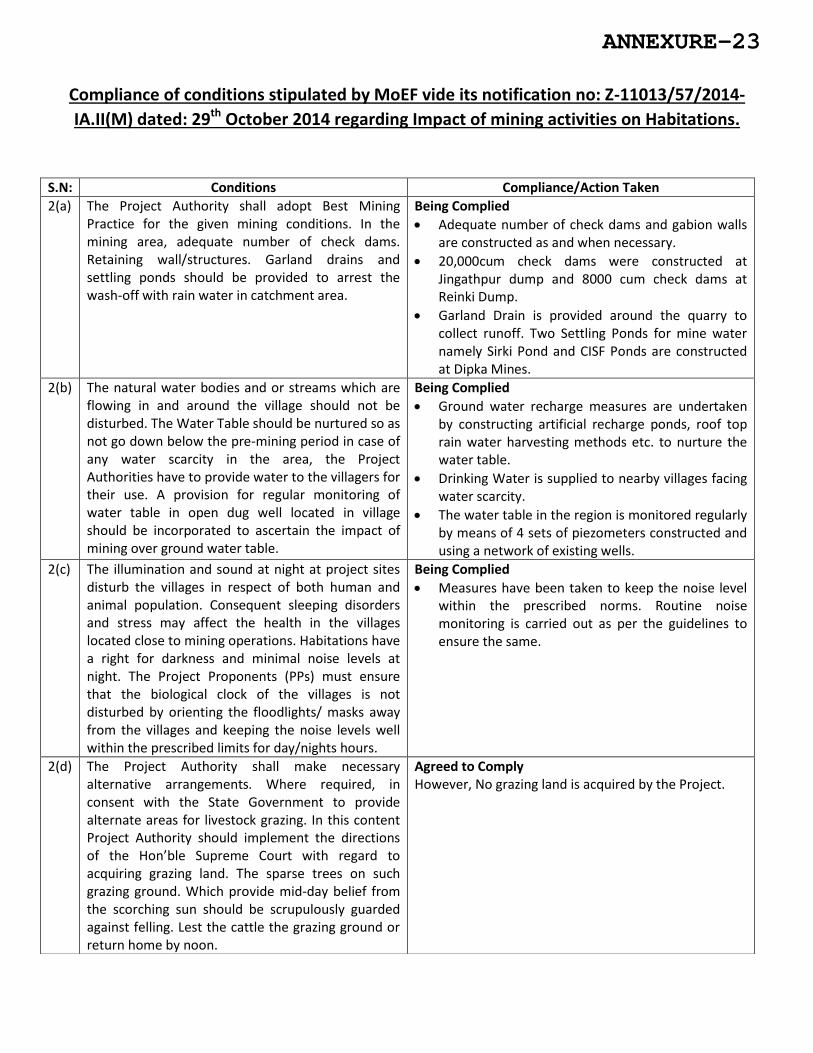
Compliance of conditions stipulated by MoEF vide its notification no: Z-11013/57/2014-
IA.II(M) dated: 29th
October 2014 regarding Impact of mining activities on Habitations.
S.N: Conditions Compliance/Action Taken
2(a) The Project Authority shall adopt Best Mining
Practice for the given mining conditions. In the
mining area, adequate number of check dams.
Retaining wall/structures. Garland drains and
settling ponds should be provided to arrest the
wash-off with rain water in catchment area.
Being Complied
Adequate number of check dams and gabion walls
are constructed as and when necessary.
20,000cum check dams were constructed at
Jingathpur dump and 8000 cum check dams at
Reinki Dump.
Garland Drain is provided around the quarry to
collect runoff. Two Settling Ponds for mine water
namely Sirki Pond and CISF Ponds are constructed
at Dipka Mines.
2(b) The natural water bodies and or streams which are
flowing in and around the village should not be
disturbed. The Water Table should be nurtured so as
not go down below the pre-mining period in case of
any water scarcity in the area, the Project
Authorities have to provide water to the villagers for
their use. A provision for regular monitoring of
water table in open dug well located in village
should be incorporated to ascertain the impact of
mining over ground water table.
Being Complied
Ground water recharge measures are undertaken
by constructing artificial recharge ponds, roof top
rain water harvesting methods etc. to nurture the
water table.
Drinking Water is supplied to nearby villages facing
water scarcity.
The water table in the region is monitored regularly
by means of 4 sets of piezometers constructed and
using a network of existing wells.
2(c) The illumination and sound at night at project sites
disturb the villages in respect of both human and
animal population. Consequent sleeping disorders
and stress may affect the health in the villages
located close to mining operations. Habitations have
a right for darkness and minimal noise levels at
night. The Project Proponents (PPs) must ensure
that the biological clock of the villages is not
disturbed by orienting the floodlights/ masks away
from the villages and keeping the noise levels well
within the prescribed limits for day/nights hours.
Being Complied
Measures have been taken to keep the noise level
within the prescribed norms. Routine noise
monitoring is carried out as per the guidelines to
ensure the same.
2(d) The Project Authority shall make necessary
alternative arrangements. Where required, in
consent with the State Government to provide
alternate areas for livestock grazing. In this content
Project Authority should implement the directions
of the Ho le “upre e Court ith regard to acquiring grazing land. The sparse trees on such
grazing ground. Which provide mid-day belief from
the scorching sun should be scrupulously guarded
against felling. Lest the cattle the grazing ground or
return home by noon.
Agreed to Comply
However, No grazing land is acquired by the Project.
ANNEXURE-23
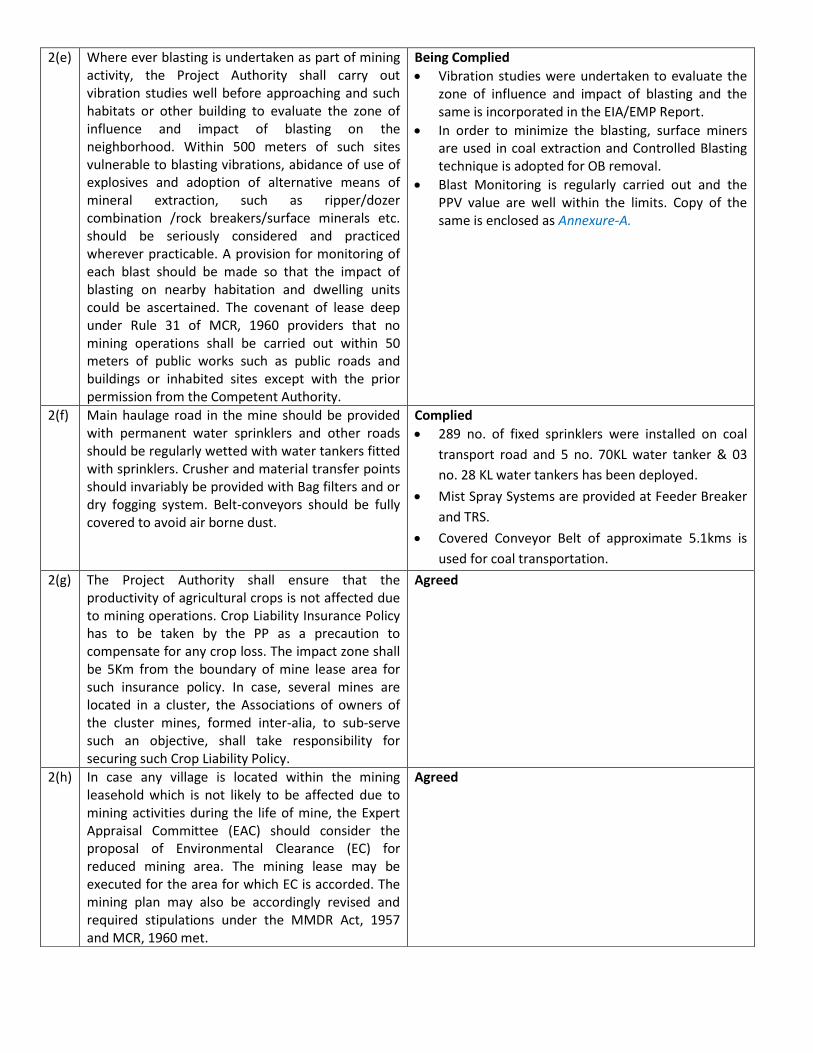
2(e) Where ever blasting is undertaken as part of mining
activity, the Project Authority shall carry out
vibration studies well before approaching and such
habitats or other building to evaluate the zone of
influence and impact of blasting on the
neighborhood. Within 500 meters of such sites
vulnerable to blasting vibrations, abidance of use of
explosives and adoption of alternative means of
mineral extraction, such as ripper/dozer
combination /rock breakers/surface minerals etc.
should be seriously considered and practiced
wherever practicable. A provision for monitoring of
each blast should be made so that the impact of
blasting on nearby habitation and dwelling units
could be ascertained. The covenant of lease deep
under Rule 31 of MCR, 1960 providers that no
mining operations shall be carried out within 50
meters of public works such as public roads and
buildings or inhabited sites except with the prior
permission from the Competent Authority.
Being Complied
Vibration studies were undertaken to evaluate the
zone of influence and impact of blasting and the
same is incorporated in the EIA/EMP Report.
In order to minimize the blasting, surface miners
are used in coal extraction and Controlled Blasting
technique is adopted for OB removal.
Blast Monitoring is regularly carried out and the
PPV value are well within the limits. Copy of the
same is enclosed as Annexure-A.
2(f) Main haulage road in the mine should be provided
with permanent water sprinklers and other roads
should be regularly wetted with water tankers fitted
with sprinklers. Crusher and material transfer points
should invariably be provided with Bag filters and or
dry fogging system. Belt-conveyors should be fully
covered to avoid air borne dust.
Complied
289 no. of fixed sprinklers were installed on coal
transport road and 5 no. 70KL water tanker & 03
no. 28 KL water tankers has been deployed.
Mist Spray Systems are provided at Feeder Breaker
and TRS.
Covered Conveyor Belt of approximate 5.1kms is
used for coal transportation.
2(g) The Project Authority shall ensure that the
productivity of agricultural crops is not affected due
to mining operations. Crop Liability Insurance Policy
has to be taken by the PP as a precaution to
compensate for any crop loss. The impact zone shall
be 5Km from the boundary of mine lease area for
such insurance policy. In case, several mines are
located in a cluster, the Associations of owners of
the cluster mines, formed inter-alia, to sub-serve
such an objective, shall take responsibility for
securing such Crop Liability Policy.
Agreed
2(h) In case any village is located within the mining
leasehold which is not likely to be affected due to
mining activities during the life of mine, the Expert
Appraisal Committee (EAC) should consider the
proposal of Environmental Clearance (EC) for
reduced mining area. The mining lease may be
executed for the area for which EC is accorded. The
mining plan may also be accordingly revised and
required stipulations under the MMDR Act, 1957
and MCR, 1960 met.
Agreed

2(i) Transportation of the minerals by road passing
through the village shall not be allowed. A bypass
road should be constructed (say, leaving a gap of at
least 200 meters) for the purpose of transportation
of the minerals of the minerals so that the impact of
sound, dust and accidents could be mitigated. The
PP shall bear the cost towards the widening and
strengthening of existing public road network in
case the same is proposed to be used for the
Project. No road movement should be allowed on
existing village road network without appropriately
increasing the carrying capacity of such roads.
Complied
Diverted Hardi Bazar road near Sarai Singar has been
completed.
2(j) Likewise, alteration or re-routing of foot paths,
pagdandies, cart roads, and village
infrastructure/public utilities or roads (for purpose
of land acquisition for mining) shall be avoided to
the extent possible and in case such acquisition is
inevitable, alternative arrangements shall be made
first and then only the area acquired. In these types
of cases, inspection Reports by site visit by expert
may be insisted upon which should be done through
reputed Institutes.
Agreed
2(k) As CSR activities by Companies including the Mining
Establishments has become mandatory to 2% of
their financial turn-over, Socio Economic
Development of the neighborhood habitats could
also be planned and executed by the PPs more
systematically based o the Need ased door to door sur ey y esta lished “o ial Institutes/Workers on the lines as required under
TO‘. ‘&‘ Pla / o pe satio details for the Project Affected People (PAP) should be furnished.
While preparing the R&R Plan. The relevant
State/National Rehabilitation & Resettlement Policy
should be kept in view. In respect of SCs/STs and
other weaker sections of the society in the study
area a need based sample survey family-wise should
be undertaken to assess their requirements, and
action programme prepared and submitted
accordingly, integrating the sectoral programme of
line departments of the State Goverments. It may
be clearly brought out whether the village located in
the mine lease area will be shifted or not. The issues
relating to shifting of Villages including their R&R
and socio-economic aspects should be discussed in
the EIA report.
Being Complied
CSR Policy has been framed after incorporating
the features of the Companies Act 2013 and as
per notification issued by Ministry of Corporate
Affairs, Govt. of India on 27.02.2014 as well as
DPEs guidelines.
The project has taken up various activities under
CSR head like construction of schools, toilets,
hospitals, roads, culverts, ponds, markets etc.
The socio-economic aspects have been studied in
the EIA/EMP ‘eport. As per CILs R&R policy 2012,
compensation & employment is provided to
project affected persons.
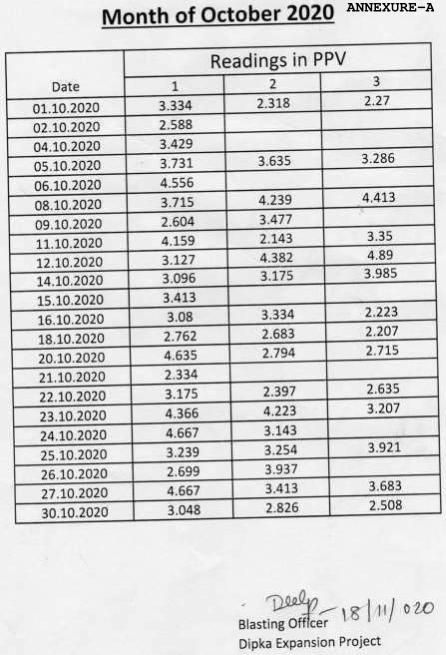
ANNEXURE-A

l.€ls'J g-€l eieii;FGtl i.;it''s
South Eastern Coalfields Lirnited
(*,1"1 giYqr E I g+, 3r{l/A Subsidiary O{ Coal lndia Ltd}
+r{ifdq:- {dluEsl'b *l-qol el;
CFFICI OF THE GENERAL MANAGER, DiFKA AREA
P'O : DiPka' Distt': Korb' (CG)'495452
T e I : 0 7 I 1 5 - 2 3 9 0 1 f ,263300'2633 o I F a x : 07 I 1 5 2 3 9 00 2
e'mai|; ilEdP!@:cglgsY il'
E qffi: qs.€.fr"q-f,rfr.S-/qqf /2o2ol2n 56qfr,
E{ q"u-gd .rff$fiT8,
q,-im-{rqqqrsm I
m-rqkt
fiq-q. 1a71161;fe Conservation Plan for Dipka Expansion Project, sECL
{icl: ro MTy EC letter dated - t2.o2.201-3 of Dipka Expansion Project'
qd(s,
sfrftrB,
1. {6r$isr6g{),qs$fiqd Eqrrq I
2. q-6Tq6itr#GCIrt{ruD,g{r€sqs ESICFI I
PleaserefertotheabovementionedECletterofDipkaExpansionProjectinwhichinspecific
condition no: xiii, lt was stipulated for the preparation of plan for conservation of wildlife particularly
the rare and endangered species of flora and fauna and species of medicinal importance in the study
area,
Accordingly, Dipka Expansion Project gave the study to TFRI' Jabalpur and the completed study
report is enclosed along with this letter' the study has proposed conservation and protection
measures to be implemented within 10 Km buffer zone arounj oipt, Expansion Project for which
indicatrve budget has arso been proposed. rt has been mentioned in the report that state Forest
Depar:r'tent would be the implementing and monitoring authority'
Hence, wild life conservation plan is being submitted to your good office for necessary action'
u-qdK
Encl: Wildlife Conservation Plan of Dipka Expansion Project' u'fig,
Pqim: 13.1 1.2020
,
,-u*]q4-
dqoT &-a, qrs{.fr.q-d. r
_-iai!&
I
\
ANNEXURE-24