mechanical weeding in a large-scale oil palm plantation
53
1 Herbicide weed control increases nutrient leaching as compared to 1 mechanical weeding in a large-scale oil palm plantation 2 3 Greta Formaglio 1 , Edzo Veldkamp 1 , Xiaohong Duan 2 , Aiyen Tjoa 3 , Marife D. Corre 1 4 5 1 Soil Science of Tropical and Subtropical Ecosystems, University of Göttingen, Göttingen, 6 37073, Germany 7 2 Institute of Biochemical Plant Pathology, Helmholtz Zentrum Munich, 85764, Germany 8 3 Faculty of Agriculture, Tadulako University, Palu, 94118, Indonesia 9 10 Correspondence to: Greta Formaglio ([email protected]) 11 12 https://doi.org/10.5194/bg-2020-153 Preprint. Discussion started: 2 June 2020 c Author(s) 2020. CC BY 4.0 License.
-
Upload
khangminh22 -
Category
Documents
-
view
2 -
download
0
Transcript of mechanical weeding in a large-scale oil palm plantation
1
Herbicide weed control increases nutrient leaching as compared to 1
mechanical weeding in a large-scale oil palm plantation 2
3
Greta Formaglio1, Edzo Veldkamp1, Xiaohong Duan 2, Aiyen Tjoa3, Marife D. Corre1 4
5
1Soil Science of Tropical and Subtropical Ecosystems, University of Göttingen, Göttingen, 6
37073, Germany 7
2Institute of Biochemical Plant Pathology, Helmholtz Zentrum Munich, 85764, Germany 8
3Faculty of Agriculture, Tadulako University, Palu, 94118, Indonesia 9
10
Correspondence to: Greta Formaglio ([email protected]) 11
12
https://doi.org/10.5194/bg-2020-153Preprint. Discussion started: 2 June 2020c© Author(s) 2020. CC BY 4.0 License.
2
Abstract 13
Nutrient leaching in intensively managed oil palm plantations can diminish soil fertility and 14
water quality. There is a need to reduce this environmental footprint without sacrificing yield. 15
We quantified nutrient leaching in a large-scale oil palm plantation on Acrisol soil with factorial 16
treatment combinations of two fertilization rates (260 N, 50 P, 220 K kg ha-1 yr-1 as conventional 17
practice, and 136 N, 17 P, 187 K kg ha-1 yr-1, equal to harvest export, as reduced management) 18
and two weeding methods (conventional herbicide, and mechanical weeding as reduced 19
management). Each of the four treatment combinations was represented by a 2500 m2 plot, 20
replicated in four blocks. In each plot, soil-pore water was collected monthly at 1.5 m depth for 21
one year in three management zones: palm circle, inter-row, and frond-stacked area. In the palm 22
circle, nutrient leaching was low due to low solute concentrations and small drainage fluxes, 23
resulting from large plant uptake. Conversely, in the inter-row, nitrate and aluminum leaching 24
losses were high due to their high concentrations, large drainage fluxes, low plant uptake, and 25
acidic pH. In the frond-stacked area, base cation leaching was high, presumably from frond 26
litter decomposition, but N leaching was low. Mechanical weeding, even with conventional 27
high fertilization rates, reduced leaching losses of all nutrients. Mechanical weeding with 28
reduced fertilization had the lowest N and base cation leaching whereas its yield and economic 29
gross margin remain comparable with the conventional management practices. Herbicide weed 30
control decreased ground vegetation, and thereby reduced efficiency of soil nutrient retention. 31
Our findings signified that mechanical weeding and reduced fertilization should be included in 32
the Indonesian Ministry of Agriculture program for precision farming (e.g. variable rates with 33
plantation age), particularly for large-scale plantations, and in the science-based policy 34
recommendations, such as those endorsed by the Roundtable for Sustainable Palm Oil 35
association. 36
https://doi.org/10.5194/bg-2020-153Preprint. Discussion started: 2 June 2020c© Author(s) 2020. CC BY 4.0 License.
3
1 Introduction 37
Agricultural expansion is a major driver of tropical deforestation (Geist and Lambin, 2002), 38
which have global impacts on reducing carbon sequestration (Asner et al., 2010; van Straaten 39
et al., 2015), greenhouse gas regulation (e.g. Meijide et al., 2020; Murdiyarso et al., 2010), and 40
biodiversity (e.g Clough et al., 2016) and increasing profit gains at the expense of ecosystem 41
multifunctionality (Grass et al., 2020). Oil palm is the most important rapidly expanding tree-42
cash crop that replaces tropical forest in Southeast Asia (Gibbs et al., 2010; Carlson et al., 2013) 43
due to its high yield with low production costs and rising global demand (Carter et al., 2007; 44
Corley, 2009). Currently, Indonesia produces 57 % of palm oil worldwide (FAO, 2018) and 45
this production is projected to expand in the future, threatening the remaining tropical forest 46
(Vijay et al., 2016; Pirker et al., 2016). Forest to oil palm conversion is associated with a 47
decrease in soil fertility, because of high nutrient export via harvest, reduced rates of soil-N 48
cycling, and decreases in soil organic carbon (SOC) and nutrient stocks (Allen et al., 2015; 49
Allen et al., 2016; van Straaten et al., 2015). The decline in soil fertility reinforces the 50
dependency on fertilizer inputs, and a severe decline can lead to abandonment of the area with 51
further expansion of oil palm plantations in another, exacerbating land-use change. Leaching 52
can contribute to the impoverishment of soil nutrients as well as reduction in water quality and 53
eutrophication of water bodies. Increased nutrient loads to water bodies due to agricultural 54
expansion and intensification, common in temperate areas (Carpenter et al., 1998), are 55
increasingly reported for tropical regions (Figueiredo et al., 2010; Teklu et al., 2018). Given the 56
typically high precipitation rates, leaching losses can possibly be large in intensively managed 57
plantations in the tropics, although deeply weathered tropical soils also have the capacity to 58
store large quantities of N and P (Jankowski et al., 2018; Neill et al., 2013). Indeed, NO3-, the 59
most leachable form of N, can be retained in the subsoil by anion exchange capacity of highly 60
weathered acidic soils (Wong et al., 1990) whereas P can be fixed to Fe and Al (hydr)oxides of 61
tropical soils (Roy et al., 2016). Nevertheless, there are some evidences of streamwater quality 62
https://doi.org/10.5194/bg-2020-153Preprint. Discussion started: 2 June 2020c© Author(s) 2020. CC BY 4.0 License.
4
reductions due to oil palm cultivation in Malaysia (Luke et al., 2017; Tokuchi et al., 2019), 63
signifying the importance of quantifying nutrient leaching losses in other areas with expansive 64
oil palm plantations, especially in Jambi, Indonesia, one of the hotspots of forest conversion to 65
oil palm in Indonesia (Drescher et al., 2016). 66
Although oil palm plantations can possibly have low leaching losses, as a consequence 67
of high evapotranspiration and thus low drainage fluxes (Tarigan et al., 2020), most of oil palm 68
plantations are large-scale enterprises that are characterized by intensive management with high 69
fertilization rates and herbicide application. Intensive agriculture in the tropics is associated 70
with high N leaching losses (Huddell et al., 2020). Even in tree-cash or perennial crop 71
plantations, despite their generally higher evapotranspiration and deeper rooting depth than 72
annual crops, high fertilization rates result in sustained, large nutrient leaching losses (e.g. 73
Cannavo et al., 2013; Wakelin et al., 2011). Large NO3- leaching from high N fertilization is 74
always accompanied by leaching of cations (Cusack et al., 2009; Dubos et al., 2017), 75
impoverishing highly weathered tropical soils that are inherently low in base cations (Allen et 76
al., 2016; Kurniawan et al., 2018). Fertilization is necessary to support high yields of oil palm 77
plantations, but reduction in fertilization rates, e.g. to levels that compensate for nutrient export 78
through harvest, may reduce nutrient leaching losses while maintaining high productivity. On 79
the other hand, the use of herbicide for weed control can exacerbate nutrient leaching losses, as 80
prolonged absence of ground vegetation reduces uptake of redistributed nutrients from applied 81
fertilizers far from reach of crop roots (Abdalla et al., 2019). Herbicide weeding, common in 82
large-scale oil palm plantation, is practiced in the area where the fertilizers are applied, to reduce 83
competition for nutrients and water with ground vegetation, and in the inter-rows, to facilitate 84
access during harvest (Corley and Tinker, 2016). However, herbicide not only eradicates 85
aboveground vegetative parts but also removes roots slowing down regeneration. In contrast, 86
https://doi.org/10.5194/bg-2020-153Preprint. Discussion started: 2 June 2020c© Author(s) 2020. CC BY 4.0 License.
5
mechanical weeding only removes aboveground part, allowing relatively fast regeneration of 87
ground vegetation, which could take up redistributed nutrients and could reduce leaching losses. 88
To investigate nutrient leaching losses in an oil palm plantation, the spatial structure 89
created by the planting design and by the management practices must be taken into account, 90
which is only partly considered in the sampling designs of previous studies. Three management 91
zones in oil palm plantations can be identified: (1) the palm circle, an area around the palm´s 92
trunk where the fertilizers are applied and weeded; (2) the inter-row, weeded less frequently 93
than the palm circle but unfertilized; and (3) the frond-stacked area, usually every second inter-94
row, where the cut senesced fronds are piled up. In these management zones, the interplay of 95
water fluxes, root uptake and soil nutrient contents determine the extent of nutrient leaching 96
losses. The palm circle despite having direct fertilization have also large water and nutrient 97
uptake (Nelson et al., 2006) because of high root density (Lamade et al., 1996) such that large 98
leaching losses may only occur following pulse high fertilization and during high drainage 99
(from high precipitation) events (Banabas et al., 2008a). The inter-row experiences higher water 100
input from precipitation than the palm circle because of lower canopy interception (Banabas et 101
al., 2008b), and large water flux within the soil because of low root uptake, stimulating nutrient 102
transport to lower depths. However, as there is no direct fertilizer application on the inter-row, 103
nutrient leaching may be low. The frond-stacked area receives nutrients from decomposition of 104
nutrient-rich fronds (Kotowska et al., 2016) and such mulching with senesced fronds prevents 105
runoff and promotes water infiltration as a consequence of enhanced macroporosity by 106
increased organic matter (Moradi et al., 2015). High water infiltration may generate high water 107
drainage fluxes, resulting in intermediate nutrient leaching losses in the frond-stacked area. 108
In this study, we aimed to quantify nutrient leaching losses in an intensively managed, 109
large-scale oil palm plantation, and to assess if reduced intensity of management (i.e. reduced 110
fertilization rates equal to harvest export and mechanical weeding) can reduce leaching losses 111
https://doi.org/10.5194/bg-2020-153Preprint. Discussion started: 2 June 2020c© Author(s) 2020. CC BY 4.0 License.
6
in oil palm plantations. We tested these hypotheses: (1) leaching losses in the palm circle will 112
be larger than in the other management zones because of direct fertilizer application; (2) 113
leaching losses under herbicide application will be higher than mechanical weeding because of 114
slower regeneration of ground vegetation that can augment nutrient retention; (3) nutrient 115
leaching fluxes under conventional high fertilization rates will be substantial compared to 116
reduced rates because of excessive nutrient inputs. Our study provides a systematic 117
quantification of an important environmental footprint of oil palm production, taking into 118
consideration its spatial variation in management zones, and evaluates the effectiveness of 119
alternative management practices for leaching reduction. 120
2 Materials and methods 121
2.1 Study area and experimental design 122
This study was conducted in a state-owned oil palm plantation in Jambi province, Indonesia (1° 123
43' 8'' S, 103° 23' 53'' E, 73 m above sea level). Mean annual air temperature is 26.7 ± 1.0 °C 124
and mean annual precipitation is 2235 ± 385 mm (1991–2011; data from Sultan Thaha airport, 125
Jambi). During our study period (March 2017–February 2018), the mean daily air temperature 126
was 26.3 °C and annual precipitation was 2772 mm, with a dry period between July and October 127
(precipitation < 140 mm month-1). The soil is highly weathered, loam Acrisol soil (Allen et al., 128
2015) and nutrient inputs from bulk precipitation in the area, measured in 2013, were 12.9 kg 129
N, 0.4 kg P, 5.5 kg K ha−1 yr−1 (Kurniawan et al., 2018). 130
This oil palm plantation was established between 1998 and 2002, and so the palms were 131
16–20 years old during our study period. The plantation encompassed 2025 ha, with a planting 132
density of approximately 142 palms ha-1, spaced 8 m apart on rows. The rows between palms 133
are used alternately for harvesting operations and to pile-up senesced fronds, which are 134
regularly cut to facilitate harvesting of fruits; this frond-stacked area covers 15 % of the 135
https://doi.org/10.5194/bg-2020-153Preprint. Discussion started: 2 June 2020c© Author(s) 2020. CC BY 4.0 License.
7
plantation. The palm circle, 2 m radius from the trunk, wherein fertilizers are applied and 136
weeded four times a year, covers 18 % of the plantation. The remaining 67 % can be classified 137
as inter-row, which is not fertilized but weeded two times a year. 138
In November 2016, a two (fertilization rates) by two (weeding methods) factorial 139
management experiment was established in this plantation as part of the framework of the 140
EFForTS project, described in detail by Darras et al. (2019). For fertilization treatments, the 141
conventional rates were 260 N, 50 P, 220 K kg ha-1 yr-1, whereas the reduced rates were 136 N, 142
17 P, 187 K kg ha-1 yr-1. Reduced fertilization rates were determined to compensate for nutrient 143
exports via fruit harvest and were based on the nutrient concentrations measured in the fruit 144
bunches multiplied by the annual yield. The fertilizer sources were urea (CH4N2O), triple 145
superphosphate (Ca(H2PO4)2·H2O) and muriate of potash (KCl), and these were applied 146
according to the plantation’s standard practices: split in two applications per year (in April and 147
October), applied in a band within a 2 m radius from the palm, and this area was raked before 148
fertilizer application. For both fertilization treatments, lime (426 kg dolomite ha-1 yr-1; 149
CaMg(CO3)2) and micronutrients (142 kg Micro-Mag ha-1 yr-1 with 0.5 % B2O3, 0.5 % CuO, 150
0.25 % Fe2O3, 0.15 % ZnO, 0.1 % MnO and 18 % MgO) were also applied besides the N, P 151
and K fertilizers, as commonly practiced in large-scale plantations on acidic Acrisol soils 152
(Pahan, 2010). For weeding treatments, the conventional method was the use of herbicide 153
(glyphosate), whereas the reduced method was mechanical weeding using a brush cutter. 154
Glyphosate was applied following plantation’s standard practice: 1.5 L ha-1 yr-1 to the palm 155
circle, split four times a year, and 0.75 L ha-1 yr-1 to the inter-row, split two times a year. The 156
mechanical weeding was carried out in the same areas and frequencies as herbicide application. 157
This management experiment comprised of four replicate blocks and each had four plots (50 m 158
x 50 m each) assigned to four treatment combinations: conventional rate–herbicide, 159
https://doi.org/10.5194/bg-2020-153Preprint. Discussion started: 2 June 2020c© Author(s) 2020. CC BY 4.0 License.
8
conventional rate–mechanical weeding, reduced rate–herbicide, and reduced rate–mechanical 160
weeding. 161
162
2.2 Soil water sampling 163
We collected monthly soil-pore water samples over one year, using suction cup lysimeters (P80 164
ceramic, maximum pore size 1 µm; CeramTec AG, Marktredwitz, Germany). We installed the 165
lysimeters in January 2017, choosing two palms per plot and sampling in the three management 166
zones: 1) in the palm circle, at 1 m from the palm trunk, 2) in the frond-stacked area, at about 167
4 m from the palm trunk, and 3) in the inter-row, at approximately 4 m from the palm trunk 168
(Fig. A1). In total, 96 lysimeters were installed (4 treatment plots x 4 replicates x 2 subplots x 169
3 management zones). The lysimeters were inserted into the soil till 1.5 m depth, so that the 170
soil-pore water was collected well below the rooting depth of 1 m which is common to oil palm 171
plantations on loam Acrisol soils near our study site (Kurniawan et al., 2018). Starting in March 172
2017, soil water was sampled by applying 40 kPa vacuum (Kurniawan et al., 2018; Dechert et 173
al., 2005) to the lysimeters and collected in dark glass bottles, which were stored in a bucket 174
buried in the field. Once a week, we transferred the collected water into plastic bottles and 175
transported them to the field station, where they were stored frozen. The collection continued 176
over a month until a volume of 100 mL was collected from each lysimeter, or until the end of 177
the month. The frozen water samples were transported by air freight to the University of 178
Goettingen, Germany, where element concentrations were determined. We measured the 179
concentrations of mineral N (NH4+ and NO3
-), total dissolved N (TDN) and Cl by continuous 180
flow injection colorimetry (SEAL Analytical AA3, SEAL Analytical GmbH, Norderstadt, 181
Germany), as described in details by Kurniawan et al. (Kurniawan et al., 2018). Dissolved 182
organic N (DON) was calculated as the difference between TDN and mineral N. We measured 183
the concentrations of base cations (Na, K, Ca, Mg), total Al, total Fe, total Mn, total S, and total 184
https://doi.org/10.5194/bg-2020-153Preprint. Discussion started: 2 June 2020c© Author(s) 2020. CC BY 4.0 License.
9
P with an inductively coupled plasma–atomic emission spectrometer (iCAP 6300; Thermo 185
Fischer Scientific GmbH, Dreieich, Germany). 186
We determined a partial cation-anion charge balance of the major elements 187
(concentrations > 0.03 mg L-1) in soil-pore water by converting the concentrations to µmolcharge 188
L-1. We assumed S to be in the form of sulfate (SO42-) and total Al to have a charge of 3+. We 189
calculated the contribution of organic acids (RCOO-) and bicarbonate (HCO3-) as the difference 190
between the measured cations and anions (2018). 191
192
2.3 Modeling water drainage 193
The water balance was modeled using the water sub-model of the Expert-N software, version 194
5.0 (Priesack, 2005), which was successfully used to estimate drainage fluxes from different 195
land uses in Indonesia (Dechert et al., 2005; Kurniawan et al., 2018). The model inputs were 196
climate data (solar radiation, temperature, precipitation, relative humidity, and wind speed), and 197
soil (texture, bulk density, and hydraulic functions) and vegetation characteristics (biomass, 198
leaf area index, and root distribution). The climate data were taken from the climatological 199
station in the plantation (described in detail by Meijide et al., 2017), and the oil palm biomass 200
was taken from a study on oil palm plantations near our study site (Kotowska et al., 2015). Soil 201
bulk density and porosity in the top 10 cm were measured in each management zone at our 202
study site, whereas for the 10–50 cm depth these were measured in the inter-row, assuming that 203
the differences in soil bulk density among management zones would be minimal below the 204
topsoil. Data for soil bulk density and porosity for the 50–200 cm depth, as well as soil texture, 205
soil hydraulic parameters (i.e. water retention curve, saturated hydraulic conductivity and Van 206
Genuchten parameters for the water retention curve), and root distribution were taken from 207
Allen et al. (2015) and Kurniawan et al. (2018), choosing their studied oil palm plantations 208
https://doi.org/10.5194/bg-2020-153Preprint. Discussion started: 2 June 2020c© Author(s) 2020. CC BY 4.0 License.
10
closest to our study site. Expert-N water sub-model calculates daily water drainage based on 209
precipitation, evapotranspiration, canopy interception, runoff, and change in soil water storage. 210
Evapotranspiration is calculated using Penman-Monteith method (Allen, 1998), applying a 211
plant factor of 1.06 (Meijide et al., 2017), with plant transpiration based on leaf area index 212
(LAI), plant biomass, and maximum rooting depth. The canopy interception is calculated from 213
the percentage of throughfall and the maximum water storage capacity of the canopy. Runoff 214
is calculated from soil texture and bulk density, which determine the water infiltration rate, and 215
from the slope, which was 5 % (Röll et al., 2019). The vertical water movement is calculated 216
using Richard´s equation based on soil hydraulic functions. 217
To model the drainage in the different management zones, we used the measured soil 218
bulk density and porosity in the top 10 cm and adjusted other input parameters to simulate 219
differences in water balance in each management zone. For the palm circle, we set the LAI to 220
3.65, which is the maximum LAI measured at our site (Fan et al., 2015), to simulate high water 221
uptake in the palm circle (Nelson et al., 2006) and maximum rooting depth to 1 m, which is 222
reported for oil palm plantations near our site (Kurniawan et al., 2018). The percentage 223
throughfall in the palm circle was set to 50 % and the water storage capacity of oil palm trunk 224
was set to 8.4 mm (Tarigan et al., 2018). For the inter-row, we set the LAI and the maximum 225
rooting depth as half of the palm circle (1.8 LAI, 50 cm rooting depth), as roots are shallower 226
between palms (Nelson et al., 2006); the throughfall was set to 10 %, and the palm trunk’s water 227
storage capacity was set to 4.7 mm (based on canopy storage capacity reported by Tarigan et 228
al., 2018). For the frond-stacked area, the LAI was set to 0.75, which is half of the minimum 229
measured in the studied plantation (Darras et al., 2019), as understory vegetation is absent at 230
this zone. Values for interception in the frond-stacked area was set to the same values as the 231
inter-row, whereas the runoff was set to 0, as mulching with senesced fronds slows down runoff 232
(Tarigan et al., 2016). 233
https://doi.org/10.5194/bg-2020-153Preprint. Discussion started: 2 June 2020c© Author(s) 2020. CC BY 4.0 License.
11
For validation of the Expert-N water sub-model outputs, we measured soil water matric 234
potential at depths of 30 cm and 60 cm over the study period and compared the measured values 235
with the modeled matric potential. Matric potential was measured by installing a tensiometer 236
(P80 ceramic, maximum pore size 1µm; CeramTec AG, Marktredwitz, Germany) at each depth 237
in each management zone near to two palms in two treatments (i.e. conventional rate‒herbicide, 238
and reduced rate‒mechanical weeding), for a total of 12 tensiometers. We summed the modeled 239
daily drainage at 1.5 m depth to get the monthly drainage fluxes, which we then multiplied with 240
the element concentrations in soil water to get the monthly nutrient leaching fluxes. 241
242
2.4 Soil biochemical characteristics and nutrient retention efficiency 243
We measured soil biochemical properties in the same sampling locations (Figure S1) at four 244
depth intervals: 0–5 cm, 5–10 cm, 10–30 cm, and 30–50 cm. Soil samples from the same 245
management zone in each plot were pooled to make one composite sample, totaling to 192 soil 246
samples (4 treatments plots x 4 replicates x 3 management zones x 4 depths). The samples were 247
air-dried and sieved (2 mm) and measured for pH (1:4 soil-to-water ratio) and for effective 248
cation exchange capacity (ECEC), by percolating the soils with unbuffered 1 mol L-1 NH4Cl 249
and measuring the cations (Ca, Mg, K, Na, Al, Fe, Mn) in percolates using ICP-AES. A 250
subsample was finely ground and analyzed for organic C and total N using a CN analyzer (Vario 251
EL Cube, Elementar Analysis Systems GmbH, Hanau, Germany), and for 15N natural 252
abundance signature using isotope ratio mass spectrometer (IRMS; Delta Plus, Finnigan MAT, 253
Bremen, Germany). We calculated the soil element stocks for each depth by multiplying the 254
element concentration with the measured bulk density and summed for the top 50 cm; other soil 255
characteristics (e.g. pH, ECEC, base saturation) in the top 50 cm soil were calculated as the 256
depth-weighted average of the sampled depths. 257
https://doi.org/10.5194/bg-2020-153Preprint. Discussion started: 2 June 2020c© Author(s) 2020. CC BY 4.0 License.
12
In addition, we calculated the N and base cation retention efficiency in the soil for each 258
experimental treatment and management zone following the formula: nutrient retention 259
efficiency = 1 – (nutrient leaching loss / soil-available nutrient) (Kurniawan et al., 2018). We 260
used the gross N mineralization rates in the top 5 cm soil (Table A1) as an index of soil-available 261
N whereas soil-available base cations was the sum of the stocks of K, Na, Mg and Ca in the top 262
10 cm soil, expressed in molcharge m-2. 263
264
2.5 Statistical analyses 265
For soil biochemical properties measured once, we tested for differences among management 266
zones as well as among experimental treatments for the entire 50 cm depth, using the analysis 267
of variances (ANOVA) with Tukey HSD as a post hoc test. The soil variables that showed non-268
normal distribution or unequal variances, tested with Shapiro–Wilk and Levene’s tests, 269
respectively, were log-transformed prior to the analysis. Base cation and N retention efficiency 270
were also tested for differences between experimental treatments in the same way. For 271
repeatedly measured variables, i.e. soil-pore water solute concentrations and leaching fluxes, 272
we used linear mixed-effects models (LME; Bates et al., 2015) to assess the differences among 273
management zones and treatments. For testing management zone differences, we conducted the 274
LME with management zone as fixed effect and random effects for sampling months and 275
experimental treatments nested with replicate plots, which were also nested with subplots. For 276
testing treatment differences, we calculated for each replicate plot on each sampling month the 277
area-weighted average of the three management zones (i.e. palm circle accounts for 18 % of the 278
plantation area, the frond-stacked area 15 %, and the inter-row 67 %), and LME was carried 279
out with treatment as fixed effect and random effects for sampling months and replicate plots 280
nested with subplots. If the residuals of the LME models were not normally distributed, we 281
applied either logarithmic or square root transformation. Differences were assessed with 282
https://doi.org/10.5194/bg-2020-153Preprint. Discussion started: 2 June 2020c© Author(s) 2020. CC BY 4.0 License.
13
ANOVA (Kuznetsova et al., 2017) followed by Tukey HSD (Hothorn et al., 2008). We also 283
used LME to assess differences in soil water matric potential among management zones, with 284
management zone as fixed effect and measurement days and depth nested with treatment as 285
random effects. Comparability between modeled and measured soil water matric potential for 286
each depth in each management zone (n = 50 field measurements) was assessed using Pearson 287
correlation test. All tests were considered significant at P ≤ 0.05, except for soil pH which we 288
considered a marginal significance at P = 0.06. All statistical analyses were performed with R 289
version 3.6.1 (R Core Team, 2019). 290
291
3 Results 292
3.1 Soil biochemical properties and water balance 293
Soil biochemical properties in the top 50 cm did not differ between experimental treatments (all 294
P > 0.05) but strongly differed among management zones (Table 1). The frond-stacked area, 295
where senesced fronds were regularly piled like mulch material, had higher SOC and total N 296
stocks (P < 0.01) compared to the other management zones. The inter-row, with regular 297
weeding but without direct fertilizer and lime inputs, showed lower exchangeable base cation 298
contents (i.e. Ca, Mg, K) compared to the other management zones (P ≤ 0.02) and higher 299
exchangeable Al content than the palm circle (P = 0.01). This was reflected in the lower base 300
saturation and higher Al saturation in the inter-row compared to the other zones (P < 0.01). 301
Also, inter-row had the lowest ECEC (P < 0.01) and marginally lower pH than the palm circle 302
(P = 0.06). The palm circle, where fertilizers and lime were applied, had generally comparable 303
exchangeable element contents with the frond-stacked area, except for K, which was higher in 304
the palm circle (P < 0.01), and for Mn, which was higher in the frond-stacked area (P < 0.01). 305
https://doi.org/10.5194/bg-2020-153Preprint. Discussion started: 2 June 2020c© Author(s) 2020. CC BY 4.0 License.
14
There were high positive correlations between field-measured and modeled soil water 306
matric potential (Fig. 1). The matric potential was generally lowest in the palm circle, 307
intermediate in the inter-row, and highest in the frond-stacked area (P < 0.01). This pattern was 308
also reflected in the low drainage flux in the palm circle and high drainage flux in the frond-309
stacked area (Table 2; Fig. 2). In the palm circle, the low drainage flux had resulted from high 310
plant transpiration and interception whereas the high drainage flux in the frond-stacked area 311
was due to low evapotranspiration and runoff with the senesced frond mulch (Table 2). In ratio 312
to annual precipitation, the calculated annual evapotranspiration was 51 %, 31 %, and 38 % in 313
the palm circle, frond-stacked area, and inter-row, respectively; annual drainage fluxes at 1.5 314
m depth were 20 % of precipitation in the palm circle, 65 % in the frond-stacked area, and 43 315
% in the inter-row. Seasonally, the monthly drainage fluxes had two peak periods, May and 316
November, after consecutive days of moderate rainfall, and were lowest during the end of the 317
dry season towards the start of the wet season (Fig. 2). 318
319
3.2 Differences in leaching losses among management zones and treatments 320
For element concentrations in soil-pore water at 1.5 m depth, treatment differences were 321
exhibited clearly in the palm circle and inter-row (Fig. 3), with the herbicide treatment showing 322
higher element concentrations than the mechanical weeding (P ≤ 0.02). The frond-stacked area 323
had generally lower ionic charge concentrations compared to the other management zones (Fig. 324
3). The dominant cations were Al3+, Ca2+, Mg2+, K+, and Na+ across experimental treatments 325
and management zones. Among the management zones, Al3+ concentrations were highest in the 326
inter-row, intermediate in the palm circle, and lowest in the frond-stacked area (P < 0.01). The 327
concentrations of Ca2+ were similar in the palm circle and frond-stacked area (P = 0.42), and 328
these were higher than the inter-row (P < 0.01). The concentrations of Mg2+ and K+ were higher 329
in the palm circle than in the other two management zones (P < 0.01). The Na+ concentrations 330
https://doi.org/10.5194/bg-2020-153Preprint. Discussion started: 2 June 2020c© Author(s) 2020. CC BY 4.0 License.
15
were higher in the palm circle and inter-row than in the frond-stacked area (P < 0.01). As for 331
dissolved N, NH4+ concentrations were lowest in the frond-stacked area, followed by the palm 332
circle, and highest in the inter-row (P = 0.01). Across treatments, NH4+ was 4˗18 % of TDN 333
whereas DON was 1˗7 % of TDN. Thus, NO3- was the main form of dissolved N, and this was 334
highest in the inter-row, followed by the frond-stacked area, and lowest in the palm circle (P < 335
0.01). The dominant anion was Cl- with higher concentrations in the palm circle than in the 336
other zones (P < 0.01). 337
Monthly leaching fluxes showed a common pattern among the major solutes (Fig. 4): 338
there were two peaks of leaching losses (May and November) that followed fertilizer 339
applications, and lower leaching losses during the dry season from July to October. Leaching 340
fluxes of NO3- showed similar pattern as its concentrations: higher in the inter-row, followed 341
by the frond-stacked area, and lowest in the palm circle (P < 0.01; Fig. 4). Total Al leaching 342
fluxes were also higher in the inter-row than the other zones (P < 0.01; Fig. 4). On the other 343
hand, although base cation concentrations were large in the palm circle (Fig. 3), the low 344
drainage fluxes in this zone (Fig. 2; Table 2) resulted in opposite patterns of base cation leaching 345
fluxes among management zones; Ca, K, and Mg leaching were higher in the frond-stacked area 346
than the palm circle and inter-row (all P < 0.01; Fig. 4). Leaching of Na was higher in both the 347
frond-stacked area and inter-row than the palm circle (P < 0.01; Fig. 4). 348
Reduced intensity of management clearly influenced nutrient leaching losses (Fig. 5; 349
Table 3). Specifically, mechanical weeding reduced NO3- and cation leaching compared to 350
herbicide weed control (P ≤ 0.03; Fig. 5; Table 3). Leaching of NO3- was highest in the 351
conventional fertilization‒herbicide treatment and lowest in reduced management treatments 352
(P ≤ 0.02; Fig. 5). This was also reflected in the leaching fluxes of accompanying cations; 353
specifically, total Al and Ca leaching were higher in conventional fertilization‒herbicide 354
treatment than the reduced management treatments (all P ≤ 0.02; Fig. 5). For the other base 355
https://doi.org/10.5194/bg-2020-153Preprint. Discussion started: 2 June 2020c© Author(s) 2020. CC BY 4.0 License.
16
cations, mechanical weeding clearly lowered leaching losses compared to herbicide weeding, 356
in particular K and Na leaching in both fertilization rates and Mg leaching in conventional 357
fertilization (all P ≤ 0.03; Fig. 5). 358
359
3.3 Annual leaching losses and nutrient retention efficiency 360
In proportion to the applied fertilizer, annual leaching losses of TDN (Table 3) were 28 % of 361
the applied N in the herbicide treatment for both conventional and reduced fertilization rates, 362
24 % in the mechanical weeding with conventional fertilization, and only 19 % in the 363
mechanical weeding with reduced fertilization. The annual leaching of K (Table 3) was 4 % of 364
the applied K fertilizer in the herbicide treatment and 3 % in the mechanical weeding for both 365
fertilization rates. In this highly weathered Acrisol soils with high capacity for P fixation by Fe 366
and Al (hydr)oxides, there was no leaching of dissolved P (Table 3). 367
Both N and base cation retention efficiencies were generally lower in the inter-row 368
compared to the other management zones (P ≤ 0.03), except for reduced fertilization‒369
mechanical weeding where there were no differences among management zones (Table 4). The 370
area-weighted average N retention efficiency was comparable among experimental treatments 371
(P = 0.89) but there was a trend of increasing efficiency with decreasing management intensity 372
(Table 4). Base cation retention efficiency showed clear differences among experimental 373
treatments for each management zones: in the palm circle, it was highest in mechanical weeding 374
and lowest in the herbicide treatment (P = 0.04); in the frond-staked area and inter-row, it was 375
lowest in the most intensive management treatment (conventional fertilization‒herbicide) and 376
highest in either mechanical weeding or reduced fertilization (P ≤ 0.05; Table 4). The area-377
weighted average base cation retention efficiency was also clearly influenced by weeding 378
https://doi.org/10.5194/bg-2020-153Preprint. Discussion started: 2 June 2020c© Author(s) 2020. CC BY 4.0 License.
17
method, being lowest in herbicide treatment and highest in mechanical weeding both with 379
conventional fertilization (P = 0.03; Table 4). 380
381
4 Discussion 382
4.1 Water model and temporal pattern of nutrient leaching losses 383
To our knowledge, this study is the first attempt to model drainage fluxes from the different 384
management zones of an oil palm plantation, making our comparisons with literature values 385
limited. Our modeled annual transpiration rate in the palm circle (Table 2) was remarkably 386
similar to the values estimated with the same Penman–Monteith method (827‒829 mm yr -1; 387
Meijide et al., 2017; Röll et al., 2019), and our average daily transpiration rate (2.3 mm d-1) was 388
within the range of that measured with drone-based photogrammetry (3 ± 1 mm d-1; 389
Ahongshangbam et al., 2019), all in the same oil palm plantation. Also, the modeled annual 390
runoff in the palm circle and inter-row (Table 2) was within the range of runoff estimates in oil 391
palm plantations in Jambi province (10‒20 % of rainfall; Tarigan et al., 2016) and in Papua 392
New Guinea (1.4‒6 % of rainfall; Banabas et al., 2008b). Considering the areal proportions of 393
the three management zones, the weighted-average drainage flux (1161 mm yr-1) was lower 394
than that estimated for smallholder oil palm plantations near our study site (1614 mm drainage 395
flux with 3418 mm precipitation measured in 2013; Kurniawan et al., 2018), although their 396
ratios to annual precipitation were comparable. Aside from the difference in precipitation 397
during our study period compared to the relatively wet year of 2013, evapotranspiration rate is 398
higher in large-scale than smallholder oil palm plantations in our study area (Röll et al., 2019), 399
which would lead to lower drainage flux in large-scale plantation. Moreover, in the frond-400
stacked area, enhanced porosity from organic matter that facilitates water infiltration (Moradi 401
et al., 2015), as indirectly indicated by its low soil bulk density (Table 1), combined with low 402
https://doi.org/10.5194/bg-2020-153Preprint. Discussion started: 2 June 2020c© Author(s) 2020. CC BY 4.0 License.
18
evapotranspiration and runoff, resulted in large drainage flux (Table 2). This suggests that piling 403
senesced fronds may amend groundwater recharge, which could moderate discharge 404
fluctuations in water catchments of oil palm converted areas (Tarigan et al., 2020). Based on 405
these comparisons with literature values and on the good agreement between modeled and 406
measured soil water matric potential (Fig. 1), we conclude that our modeled drainage fluxes 407
were reliable. 408
The temporal peaks of nutrient leaching fluxes (May and November; Fig. 4) had resulted 409
from the combined effect of high drainage flux and fertilizer application. The high drainage 410
fluxes in May and November (Fig. 2) might have stimulated the downward transport of 411
elements and decreased their residence time in the soil, and thus their adsorption onto the soil 412
exchange sites (Lohse and Matson, 2005). These high water fluxes usually dilute the element 413
concentrations in the soil-pore water; however, high concentrations were maintained because 414
of fertilizer and lime applications in the same periods, resulting in parallel peaks of drainage 415
and leaching fluxes (Figs. 2 and 4). The high NO3- leaching following urea-N fertilization (Fig. 416
4) suggests increased nitrification (Silver et al., 2005), fast NO3- transport through the soil 417
column, and reduced anion adsorbtion capacity, which otherwise would have delayed anion 418
leaching (Wong et al., 1990). The latter was possibly aggravated by the additional Cl- from 419
fertilization with KCl (Fig. 3), which could saturate the soil anion exchange sites, particularly 420
at this mature plantation with already 16–20 years of high fertilization rates. Large NO3- 421
leaching is always accompanied by large leaching of buffering cations (Dubos et al., 2017; 422
Kurniawan et al., 2018), resulting in their similar temporal patterns (Fig. 4). These findings 423
showed that fertilization should be avoided during periods of high drainage fluxes. Generally, 424
the high drainage was a consequence of a protracted period of moderate rainfall (Fig. 2). 425
Prediction of periods of high precipitation and drainage will further be confounded by climate 426
change, which is widening the range between wet and dry seasons and increasing the 427
https://doi.org/10.5194/bg-2020-153Preprint. Discussion started: 2 June 2020c© Author(s) 2020. CC BY 4.0 License.
19
uncertainties in rainfall intensity and distribution (Chou et al., 2013; Feng et al., 2013). 428
Fertilization during the dry period is also not advisable given the high volatilization of applied 429
urea even in acidic soil as this is always accompanied by liming (Goh et al., 2003; Pardon et 430
al., 2016) and the low palm uptake during the dry season (Corley and Tinker, 2016). Thus, 431
reduction of fertilization rates, e.g. at compensatory level equal to harvest export, seems a viable 432
option to reduce leaching losses without sacrificing production. One other option is the use of 433
organic amendments and slow-release fertilizers, which have been shown to reduce N leaching 434
in tropical cropping systems (Nyamangara et al., 2003; Mohanty et al., 2018; Steiner et al., 435
2008) and to improve soil fertility in oil palm plantations (Comte et al., 2013; Boafo et al., 436
2020), as was also evident with mulching of senesced oil palm fronds (i.e. high SOC, total N, 437
ECEC and base saturation in the frond-stacked area; Table 1). 438
439
4.2 Leaching losses in the different management zones 440
Contrary to our first hypothesis, leaching losses were generally higher in the inter-row, 441
especially for mineral N (largely NO3-; Fig. 3), compared to the other zones, whereas the palm 442
circle had the lowest leaching (Fig. 4). This strikingly large mineral N leaching losses in the 443
inter-row were surprising given that this area did not receive direct fertilizer inputs (see section 444
2.1). This result suggests that mineral N was transported from the directly fertilized palm circle 445
to the inter-row via surface and subsurface lateral flow as these two zones were just 3 m apart 446
(Fig. A1). Surface transport of mineral N was probably a minor process at our site because of 447
the low runoff (Table 2); in an oil palm plantation in Papua New Guinea, the loss of N fertilizer 448
via surface runoff is only 0.3–2.2 kg N ha-1 yr-1 (Banabas et al., 2008b). Mineral N was probably 449
predominantly transported to the inter-row via subsurface lateral flow. Acrisol soils are 450
characterized by clay translocation from upper to lower depths that could create an impeding 451
layer conducive to lateral water flow (Elsenbeer, 2001). Indeed, the clay contents of the Acrisol 452
https://doi.org/10.5194/bg-2020-153Preprint. Discussion started: 2 June 2020c© Author(s) 2020. CC BY 4.0 License.
20
soils at our study area increase with depth, and soil bulk density is highest at 100–150 cm than 453
at 150–200 cm depth (Allen et al., 2016). In addition, the palm roots spreading from the palm 454
circle to the inter-row may create channels for subsurface lateral flow of dissolved ions like 455
NO3- (Li and Ghodrati, 1994). Higher mineral N leaching in the inter-row than palm circle was 456
also observed in Brazil and it was attributed to lower root density and higher N mineralization 457
at increasing distance from the palm´s trunk (Schroth et al., 2000). Hence, a combination of 458
lower root uptake, higher N mineralization, and subsurface lateral transport (particularly for 459
NO3-) may all have contributed to higher mineral N leaching losses in the inter-row than the 460
palm circle. The main accompanying cation for NO3- leaching in the inter-rows was Al3+ (Figs. 461
3 and 4), as this zone’s soil pH (Table 1) was within the Al-buffering range (pH 3–5; van 462
Breemen et al., 1983), having no direct lime application and thus low base saturation (Table 1). 463
Our findings showed that if leaching is measured only within the palm circle, this largely 464
underestimates mineral N and Al leaching losses. 465
The palm circle had relatively low N leaching losses (Figs. 3 and 4) despite the direct 466
application of fertilizer. This was probably due to the large root density in this zone that 467
facilitates an efficient nutrient uptake (Edy et al., 2020; Nelson et al., 2006). Hence, the 468
dominant anion in soil-pore water in the palm circle was Cl- (Fig. 3), enhanced by the applied 469
KCl fertilizer, which was accompanied by high base cation concentrations relative to dissolved 470
Al (Fig. 3). The former was due to the applied micromag fertilizer and dolomite (section 2.1), 471
which increased pH and exchangeable bases and rendered Al in insoluble form (i.e. lower 472
exchangeable Al; Table 1; Schlesinger and Bernhardt, 2013). Despite their high concentrations, 473
the leaching fluxes of base cations in the palm circle (Fig. 4) were constrained by the low water 474
drainage flux due to high evapotranspiration (Table 2). 475
The frond-stacked area was at the same distance from the palm circle as the inter-row 476
(Fig. A1) but had substantially lower mineral N leaching losses (Figs. 3 and 4). Decomposition 477
https://doi.org/10.5194/bg-2020-153Preprint. Discussion started: 2 June 2020c© Author(s) 2020. CC BY 4.0 License.
21
of nutrient-rich fronds (Kotowska et al., 2016) resulted in high SOC and N stocks (Table 1), 478
which can support large microbial biomass in this zone (Haron et al., 1998). Thus, the low 479
mineral N leaching in the frond-stacked area may be attributed to immobilization of mineral N 480
by large microbial biomass, converting mobile NO3- to less mobile organic N (e.g. Corre et al., 481
2010). In addition, it could be possible that palm root uptake of nutrients (including mineral N) 482
was higher in the frond-stacked area compared to the inter-row as roots proliferate in nutrient-483
rich zones (Table 1; Hodge, 2004). This is supported by studies that showed higher root density 484
and higher water uptake under the frond piles compared to the inter-row (Rüegg et al., 2019; 485
Nelson et al., 2006). The high ECEC, base saturation and pH in frond-stacked area (Table 1), 486
despite having no direct lime application, were due to the release of nutrients from 487
decomposition of frond litter, which contain high levels of base cations (Kotowska et al., 2016). 488
Thus, although leaching of base cations were larger in the frond-stacked area than in the inter-489
row (Fig. 4), these losses merely mirrored their high exchangeable levels (Table 1). Finally, the 490
leaching of Al was low in the frond-stacked area (Figs. 3 and 4) because Al becomes insoluble 491
as pH increased (i.e. lower exchangeable Al; Table 1). Altogether, these results highlighted the 492
benefits of piling senesced fronds onto the soil to reduce leaching of mineral N and Al, which 493
otherwise can potentially diminish ground water quality, and to amend soil fertility (Table 1). 494
Oil palm plantations in other areas (e.g. Borneo; Rahman et al., 2018) were reported to practice 495
piling of senesced fronds on every inter-row, which we did not observed in our study region as 496
that is claimed to hinder access to palms during harvest; nonetheless, our findings implied that 497
increase in the frond-stacked area can contribute to sustainable management practices of oil 498
palm plantations. 499
500
4.3 Leaching losses under different intensity of management 501
https://doi.org/10.5194/bg-2020-153Preprint. Discussion started: 2 June 2020c© Author(s) 2020. CC BY 4.0 License.
22
There was a clear influence of management intensity treatments on nutrient leaching losses with 502
a general reduction of leaching in reduced management intensity (Fig. 5; Table 3). In line with 503
our second hypothesis, the weeding methods clearly influenced leaching losses with a common 504
pattern of lower leaching fluxes in mechanical weeding than herbicide treatment (Fig. 5; Table 505
3). Mechanical weeding was associated with more ground vegetation cover (Darras et al., 2019) 506
and higher nutrient retention efficiency than herbicide weeding (Table 4), suggesting that faster 507
regrowth of understory vegetation by mechanical weeding have additionally contributed to the 508
uptake of nutrients and thus reducing leaching losses. This is in line with some studies in 509
temperate forests and a cedar plantation, which showed that understory vegetation can take up 510
excess NO3- in the soil (Olsson and Falkengren-Grerup, 2003) and reduce NO3
- leaching and 511
the mobilization of Ca and Mg (Baba et al., 2011; Fukuzawa et al., 2006). Enhanced understory 512
vegetation in oil palm plantations may also positively impact biodiversity by increasing plant 513
species richness and soil macrofauna diversity and abundance (Luke et al., 2019; Ashton-Butt 514
et al., 2018), which may facilitate uptake and recycling of nutrients. Increase in soil macrofauna 515
might have contributed to lower leaching of Na with mechanical weeding (Fig. 5), since 516
herbivores and decomposers take up a large amount of Na (Kaspari et al., 2009). In addition, 517
the use of glyphosate is associated with possible health risks to workers and the environment 518
(van Bruggen et al., 2018); also, the economic gross margin (i.e. revenues minus costs) is 519
comparable between mechanical weeding and herbicide treatment because of needed labor for 520
periodic mechanical cutting of resistant ground vegetation in oil palm plantations with herbicide 521
weeding (Darras et al., 2019; Pahan, 2010). Altogether, these results advocate for the higher 522
sustainability of mechanical weeding over herbicide application. 523
The reduction of N fertilization rates decreased NO3- leaching, supporting our third 524
hypothesis. Comparing conventional and reduced fertilization rates, there were no differences 525
in total N stocks (section 3.1), mineral N levels (Darras et al., 2019), N retention efficiency 526
https://doi.org/10.5194/bg-2020-153Preprint. Discussion started: 2 June 2020c© Author(s) 2020. CC BY 4.0 License.
23
(Table 4) and oil palm yield (Darras et al., 2019), suggesting that excess N (above harvest 527
export; section 2.1) from high N fertilization was largely lost through leaching (Table 3). The 528
decreased Al and Ca leaching with reduced fertilization can be attributed to the lowered NO3- 529
leaching, since these were the accompanying cations (Figs. 4 and 5). Also, a reduction of Ca 530
leaching could have resulted from the lower application rate of triple superphosphate fertilizer, 531
which contains 16 % of Ca. The reduced K fertilization had no effect on K leaching (Fig. 5) 532
because K fertilization rate was only reduced by 15 % of the conventional rate due to high K 533
requirements of oil palm fruits (section 2.1). We conclude that this mature (16–20 years old) 534
plantation with conventional management was overly fertilized for N, and that a reduction in N 535
fertilization rate may be included in the Indonesian program for precision farming (Ministry of 536
Agriculture of Indonesia, 2016) to reduce environmental footprint of oil palm production. 537
Comparing the N leaching losses in the studied plantation with other fertilized tropical 538
plantations (Table A2), our plantation had higher N leaching than other large-scale oil palm 539
plantations on similar soils with comparable fertilization rates (Omoti et al., 1983; Tung et al., 540
2009). However, in these studies the leaching losses were measured in the palm circle (Omoti 541
et al., 1983) or the sampling location was not specified (Tung et al., 2009), such that N leaching 542
may be underestimated as our results showed the high contribution of the inter-row to leaching 543
losses (Figs. 3 and 4). The N leaching fluxes in our plantation were also higher than in 544
smallholder oil palm plantations in the same area, which typically had much lower fertilization 545
rates (Kurniawan et al., 2018). On the other hand, our plantation had lower N leaching losses 546
than an oil palm plantation and coffee agroforestry systems on volcanic soils (Banabas et al., 547
2008b; Cannavo et al., 2013; Tully et al., 2012), which have high inherent nutrient contents, 548
highly porous soils and high infiltration rates. The N leaching losses from our plantation were 549
also lower than in banana plantations, characterized by very high fertilization rates (Wakelin et 550
al., 2011; Armour et al., 2013). 551
https://doi.org/10.5194/bg-2020-153Preprint. Discussion started: 2 June 2020c© Author(s) 2020. CC BY 4.0 License.
24
The nutrients leached at 1.5 m depth should be considered lost from uptake of oil palm 552
roots, as majority of the root mass and the highest root density are in the top 0.5 m depth (Nelson 553
et al., 2006; Schroth et al., 2000; Kurniawan et al., 2018). The high leaching fluxes of NO3- and 554
Al implied a risk of groundwater pollution. During the high drainage fluxes following 555
fertilization, NO3- concentrations in soil-pore water reached to 20‒40 mg L-1 in the inter-row 556
(covering 67 % of the plantation area), which was close to the 50 mg L-1 limit for drinking water 557
(WHO, 2011), and Al concentrations in soil-pore water exceeded the limit of 0.2 mg L-1 in 60 558
% of the samples. Nevertheless, before reaching to streams and rivers, these NO3- and Al 559
concentrations can be diluted by surface flow and retained in the soil along flow paths: NO3- 560
can be temporarily adsorbed in the deeper layers of highly weathered soils by its inherently 561
high anion exchange capacity (Harmand et al., 2010; Jankowski et al., 2018) and can be 562
consumed by denitrification (Wakelin et al., 2011). Riparian buffers can mitigate the transport 563
of these agricultural pollutants to streams (Luke et al., 2017; Chellaiah and Yule, 2018). 564
Restoring riparian buffers in former forests converted to oil palm plantations have been listed 565
as one sustainability criteria, endorsed by the Roundtable for Sustainable Palm Oil association 566
(RSPO, 2018), and may provide additional regulation services (Woodham et al., 2019). 567
5 Conclusions 568
Our findings show that nutrient leaching losses in an oil palm plantation differed among 569
management zones, as a result of fertilization, liming, mulching and of different drainage 570
fluxes. The reduction of management intensity, i.e. mechanical weeding with reduced 571
fertilization rates, was effective in reducing nutrient leaching losses without reduction in yield 572
at least during the first two years of this experiment (Darras et al., 2019). Long-term 573
investigation of this management experiment is important to get a reliable response of yield and 574
a holistic economic analysis, including valuation of regulation services. Greenhouse gas 575
emissions should also be quantified, as another important parameter of environmental footprint 576
https://doi.org/10.5194/bg-2020-153Preprint. Discussion started: 2 June 2020c© Author(s) 2020. CC BY 4.0 License.

25
of oil palm production. Our findings and these further investigations should be incorporated 577
into science-based policy recommendations such as those endorsed by the RSPO. 578
https://doi.org/10.5194/bg-2020-153Preprint. Discussion started: 2 June 2020c© Author(s) 2020. CC BY 4.0 License.
26
Data availability 579
All data of this study are deposited at the EFForTS-IS data repository (https://efforts-is.uni-580
goettingen.de), an internal data-exchange platform, which is accessible to all members of the 581
Collaborative Research Center (CRC) 990. Based on the data sharing agreement within the 582
CRC 990, these data are currently not publicly accessible but will be made available through a 583
written request to the senior author. 584
Author contribution 585
GF performed the experiments, analysed the data and wrote the manuscript in consultation 586
with MDC. EV and MDC conceived and planned the experiment. XD helped carry out the 587
water model simulations. AT aided in field activities organization and granting collaborations 588
agreements. All authors contributed to the final version of the manuscript. 589
Competing interests 590
No conflict of interest to declare 591
Aknowledgments 592
This study was part of the project A05 in the CRC990-EFForTS, funded by the German 593
Research Foundation (DFG, Project ID: 192626868 – SFB 990). We acknowledge the 594
collaborations with PTPN VI plantation, Kevin Darras, and project Z01, for the 595
implementation and maintenance of this field experiment. We thank Christian Stiegler, with 596
project A03, for the climate data, and Eckart Priesack for the Expert-N water sub-model. We 597
especially thank our field and laboratory assistants for their valuable dedications in all field 598
and laboratory activities. This research was conducted under the research permit of Ministry 599
of Research and Technology of Indonesia, 539351/SIP/FRP/E5/Dit.KI/X/2016. 600
https://doi.org/10.5194/bg-2020-153Preprint. Discussion started: 2 June 2020c© Author(s) 2020. CC BY 4.0 License.
27
References 601
Abdalla, M., Hastings, A., Cheng, K., Yue, Q., Chadwick, D., Espenberg, M., Truu, J., Rees, 602
R. M., and Smith, P.: A critical review of the impacts of cover crops on nitrogen leaching, 603
net greenhouse gas balance and crop productivity, Global Change Biology, 25, 2530–604
2543, doi:10.1111/gcb.14644, 2019. 605
Ahongshangbam, J., Khokthong, W., Ellsäßer, F., Hendrayanto, H., Hölscher, D., and Röll, 606
A.: Drone‐based photogrammetry‐derived crown metrics for predicting tree and oil palm 607
water use, Ecohydrology, 12, 1–18, doi:10.1002/eco.2115, 2019. 608
Allen, K., Corre, M. D., Kurniawan, S., Utami, S. R., and Veldkamp, E.: Spatial variability 609
surpasses land-use change effects on soil biochemical properties of converted lowland 610
landscapes in Sumatra, Indonesia, Geoderma, 284, 42–50, 611
doi:10.1016/j.geoderma.2016.08.010, 2016. 612
Allen, K., Corre, M. D., Tjoa, A., and Veldkamp, E.: Soil nitrogen-cycling responses to 613
conversion of lowland forests to oil palm and rubber plantations in Sumatra, Indonesia, 614
PloS One, 10, e0133325, doi:10.1371/journal.pone.0133325, 2015. 615
Allen, R. G.: Crop evapotranspiration: Guidelines for computing crop water requirements, 616
FAO irrigation and drainage paper, 56, Rome, 300 pp., 1998. 617
Armour, J. D., Nelson, P. N., Daniells, J. W., Rasiah, V., and Inman-Bamber, N. G.: Nitrogen 618
leaching from the root zone of sugarcane and bananas in the humid tropics of Australia, 619
Agriculture, Ecosystems & Environment, 180, 68–78, doi:10.1016/j.agee.2012.05.007, 620
2013. 621
Ashton-Butt, A., Aryawan, A. A. K., Hood, A. S. C., Naim, M., Purnomo, D., Suhardi, 622
Wahyuningsih, R., Willcock, S., Poppy, G. M., Caliman, J.-P., Turner, E. C., Foster, W. 623
A., Peh, K. S. H., and Snaddon, J. L.: Understory vegetation in oil palm plantations 624
benefits soil biodiversity and decomposition rates, Frontiers in Forests and Global Change, 625
1, 1–13, doi:10.3389/ffgc.2018.00010, 2018. 626
https://doi.org/10.5194/bg-2020-153Preprint. Discussion started: 2 June 2020c© Author(s) 2020. CC BY 4.0 License.
28
Asner, G. P., Powell, G. V. N., Mascaro, J., Knapp, D. E., Clark, J. K., Jacobson, J., Kennedy-627
Bowdoin, T., Balaji, A., Paez-Acosta, G., Victoria, E., Secada, L., Valqui, M., and 628
Hughes, F. R.: High-resolution forest carbon stocks and emissions in the Amazon, 629
Proceedings of the National Academy of Sciences of the United States of America, 107, 630
16738–16742, doi:10.1073/pnas.1004875107, 2010. 631
Baba, M., Abe, S., Kasai, M., Sugiura, T., and Kobayashi, H.: Contribution of understory 632
vegetation to minimizing nitrate leaching in a Japanese cedar plantation, Journal of Forest 633
Research, 16, 446–455, doi:10.1007/s10310-010-0244-3, 2011. 634
Banabas, M., Scotter, D. R., and Turner, M. A.: Losses of nitrogen fertiliser under oil palm in 635
Papua New Guinea: 2. Nitrogen transformations and leaching, and a residence time model, 636
Soil Research, 46, 340–347, doi:10.1071/SR07174, 2008a. 637
Banabas, M., Turner, M. A., Scotter, D. R., and Nelson, P. N.: Losses of nitrogen fertiliser 638
under oil palm in Papua New Guinea: 1. Water balance, and nitrogen in soil solution and 639
runoff, Australian Journal of Soil Research, 46, 332–339, doi:10.1071/SR07171, 2008b. 640
Bates, D., Maechler, M., Bolker, B., and Walker, S.: Fitting linear mixed-effect models using 641
lme4, Journal of Statistical Software, 67, 1–48, 2015. 642
Boafo, D. K., Kraisornpornson, B., Panphon, S., Owusu, B. E., and Amaniampong, P. N.: 643
Effect of organic soil amendments on soil quality in oil palm production, Applied Soil 644
Ecology, 147, 103358, doi:10.1016/j.apsoil.2019.09.008, 2020. 645
Cannavo, P., Harmand, J.-M., Zeller, B., Vaast, P., Ramírez, J. E., and Dambrine, E.: Low 646
nitrogen use efficiency and high nitrate leaching in a highly fertilized Coffea arabica–Inga 647
densiflora agroforestry system: a 15N labeled fertilizer study, Nutrient Cycling in 648
Agroecosystems, 95, 377–394, doi:10.1007/s10705-013-9571-z, 2013. 649
Carlson, K. M., Curran, L. M., Asner, G. P., Pittman, A. M., Trigg, S. N., and Marion 650
Adeney, J.: Carbon emissions from forest conversion by Kalimantan oil palm plantations, 651
Nature Climate Change, 3, 283–287, doi:10.1038/nclimate1702, 2013. 652
https://doi.org/10.5194/bg-2020-153Preprint. Discussion started: 2 June 2020c© Author(s) 2020. CC BY 4.0 License.
29
Carpenter, S. R., Caraco, N. F., Correll, D. L., Howarth, R. W., Sharpley, A. N., and Smith, 653
V. H.: Nonpoint pollution of surface waters with phosphorus and nitrogen, Ecological 654
Applications, 8, 559–568, doi:10.1890/1051-0761(1998)008[0559:NPOSWW]2.0.CO;2, 655
1998. 656
Carter, C., Finley, W., Fry, J., Jackson, D., and Willis, L.: Palm oil markets and future supply, 657
European Journal of Lipid Science and Technology, 109, 307–314, 658
doi:10.1002/ejlt.200600256, 2007. 659
Chellaiah, D. and Yule, C. M.: Effect of riparian management on stream morphometry and 660
water quality in oil palm plantations in Borneo, Limnologica, 69, 72–80, 661
doi:10.1016/j.limno.2017.11.007, 2018. 662
Chou, C., Chiang, J. C. H., Lan, C.-W., Chung, C.-H., Liao, Y.-C., and Lee, C.-J.: Increase in 663
the range between wet and dry season precipitation, Nature Geoscience, 6, 263–267, 664
doi:10.1038/ngeo1744, 2013. 665
Clough, Y., Krishna, V. V., Corre, M. D., Darras, K., Denmead, L. H., Meijide, A., Moser, S., 666
Musshoff, O., Steinebach, S., Veldkamp, E., Allen, K., Barnes, A. D., Breidenbach, N., 667
Brose, U., Buchori, D., Daniel, R., Finkeldey, R., Harahap, I., Hertel, D., Holtkamp, A. 668
M., Hörandl, E., Irawan, B., Jaya, I. N. S., Jochum, M., Klarner, B., Knohl, A., Kotowska, 669
M. M., Krashevska, V., Kreft, H., Kurniawan, S., Leuschner, C., Maraun, M., Melati, D. 670
N., Opfermann, N., Pérez-Cruzado, C., Prabowo, W. E., Rembold, K., Rizali, A., Rubiana, 671
R., Schneider, D., Tjitrosoedirdjo, S. S., Tjoa, A., Tscharntke, T., and Scheu, S.: Land-use 672
choices follow profitability at the expense of ecological functions in Indonesian 673
smallholder landscapes, Nature Communications, 7, 13137, doi:10.1038/ncomms13137, 674
2016. 675
Comte, I., Colin, F., Grünberger, O., Follain, S., Whalen, J. K., and Caliman, J.-P.: 676
Landscape-scale assessment of soil response to long-term organic and mineral fertilizer 677
https://doi.org/10.5194/bg-2020-153Preprint. Discussion started: 2 June 2020c© Author(s) 2020. CC BY 4.0 License.
30
application in an industrial oil palm plantation, Indonesia, Agriculture, Ecosystems & 678
Environment, 169, 58–68, doi:10.1016/j.agee.2013.02.010, 2013. 679
Corley, R. H. V. and Tinker, P. B.: The oil palm, 5th ed., John Wiley & Sons, Ltd, Hoboken, 680
NJ, 2016. 681
Corley, R.H.V.: How much palm oil do we need?, Environmental Science & Policy, 12, 134–682
139, doi:10.1016/j.envsci.2008.10.011, 2009. 683
Corre, M. D., Veldkamp, E., Arnold, J., and Wright, S. J.: Impact of elevated N input on soil 684
N cycling and losses in old-growth lowland and montane forests in Panama, Ecology, 91, 685
1715–1729, doi:10.1890/09-0274.1, 2010. 686
Cusack, D. F., Silver, W., and McDowell, W. H.: Biological nitrogen fixation in two tropical 687
forests: ecosystem-level patterns and effects of nitrogen fertilization, Ecosystems, 12, 688
1299–1315, doi:10.1007/s10021-009-9290-0, 2009. 689
Darras, K. F. A., Corre, M. D., Formaglio, G., Tjoa, A., Potapov, A., Brambach, F., Sibhatu, 690
K. T., Grass, I., Rubiano, A. A., Buchori, D., Drescher, J., Fardiansah, R., Hölscher, D., 691
Irawan, B., Kneib, T., Krashevska, V., Krause, A., Kreft, H., Li, K., Maraun, M., Polle, 692
A., Ryadin, A. R., Rembold, K., Stiegler, C., Scheu, S., Tarigan, S., Valdés-Uribe, A., 693
Yadi, S., Tscharntke, T., and Veldkamp, E.: Reducing fertilizer and avoiding herbicides in 694
O oil palm plantations—ecological and economic valuations, Frontiers in Forests and 695
Global Change, 2, doi:10.3389/ffgc.2019.00065, 2019. 696
Dechert, G., Veldkamp, E., and Brumme, R.: Are partial nutrient balances suitable to evaluate 697
nutrient sustainability of land use systems? Results from a case study in central Sulawesi, 698
Indonesia, Nutrient Cycling in Agroecosystems, 72, 201–212, doi:10.1007/s10705-005-699
1546-2, 2005. 700
Drescher, J., Rembold, K., Allen, K., Beckschäfer, P., Buchori, D., Clough, Y., Faust, H., 701
Fauzi, A. M., Gunawan, D., Hertel, D., Irawan, B., Jaya, I. N. S., Klarner, B., Kleinn, C., 702
Knohl, A., Kotowska, M. M., Krashevska, V., Krishna, V., Leuschner, C., Lorenz, W., 703
https://doi.org/10.5194/bg-2020-153Preprint. Discussion started: 2 June 2020c© Author(s) 2020. CC BY 4.0 License.
31
Meijide, A., Melati, D., Nomura, M., Pérez-Cruzado, C., Qaim, M., Siregar, I. Z., 704
Steinebach, S., Tjoa, A., Tscharntke, T., Wick, B., Wiegand, K., Kreft, H., and Scheu, S.: 705
Ecological and socio-economic functions across tropical land use systems after rainforest 706
conversion, Philosophical Transactions of the Royal Society of London. Series B, 707
Biological sciences, 371, doi:10.1098/rstb.2015.0275, 2016. 708
Dubos, B., Snoeck, D., and Flori, A.: Excessive use of fertilizer can increase leaching 709
processes and modify soil reserves in two Ecuadorian oil palm plantations, Experimental 710
Agriculture, 53, 255–268, doi:10.1017/S0014479716000363, 2017. 711
Edy, N., Yelianti, U., Irawan, B., Polle, A., and Pena, R.: Differences in root nitrogen uptake 712
between tropical lowland rainforests and oil palm plantations, Frontiers in Plant Science, 713
11, 92, doi:10.3389/fpls.2020.00092, 2020. 714
Elsenbeer, H.: Hydrologic flowpaths in tropical rainforest soilscapes - a review, Hydrological 715
Processes, 15, 1751–1759, doi:10.1002/hyp.237, 2001. 716
Fan, Y., Roupsard, O., Bernoux, M., Le Maire, G., Panferov, O., Kotowska, M. M., and 717
Knohl, A.: A sub-canopy structure for simulating oil palm in the Community Land Model 718
(CLM-Palm): phenology, allocation and yield, Geoscientific Model Development, 8, 719
3785–3800, doi:10.5194/gmd-8-3785-2015, 2015. 720
Feng, X., Porporato, A., and Rodriguez-Iturbe, I.: Changes in rainfall seasonality in the 721
tropics, Nature Climate Change, 3, 811–815, doi:10.1038/nclimate1907, 2013. 722
Figueiredo, R. O., Markewitz, D., Davidson, E. A., Schuler, A. E., Watrin, O. d. S., and Silva, 723
P. d. S.: Land-use effects on the chemical attributes of low-order streams in the eastern 724
Amazon, Journal of Geophysical Research, 115, doi:10.1029/2009JG001200, 2010. 725
Food and Agricolture Organization, FAOSTAT: http://faostat.fao.org/site/339/default.aspx, 726
last access: 30 March 2020. 727
Fukuzawa, K., Shibata, H., Takagi, K., Nomura, M., Kurima, N., Fukazawa, T., Satoh, F., and 728
Sasa, K.: Effects of clear-cutting on nitrogen leaching and fine root dynamics in a cool-729
https://doi.org/10.5194/bg-2020-153Preprint. Discussion started: 2 June 2020c© Author(s) 2020. CC BY 4.0 License.
32
temperate forested watershed in northern Japan, Forest Ecology and Management, 225, 730
257–261, doi:10.1016/j.foreco.2006.01.001, 2006. 731
Geist, H. J. and Lambin, E. F.: Proximate causes and underlying driving forces of tropical 732
deforestation, BioScience, 52, 143–150, doi:10.1641/0006-733
3568(2002)052[0143:PCAUDF]2.0.CO;2, 2002. 734
Gibbs, H. K., Ruesch, A. S., Achard, F., Clayton, M. K., Holmgren, P., Ramankutty, N., and 735
Foley, J. A.: Tropical forests were the primary sources of new agricultural land in the 736
1980s and 1990s, Proceedings of the National Academy of Sciences of the United States 737
of America, 107, 16732–16737, doi:10.1073/pnas.0910275107, 2010. 738
Goh, K.-J., Härdter, R., and Fairhurst, T.: Fertilizing for maximum return, Oil Palm 739
Management for Large and Sustainable Yields, 279–306, 2003. 740
Grass, I., Kubitza, C., Krishna, V. V., Corre, M. D., Mußhoff, O., Pütz, P., Drescher, J., 741
Rembold, K., Ariyanti, E. S., Barnes, A. D., Brinkmann, N., Brose, U., Brümmer, B., 742
Buchori, D., Daniel, R., Darras, K. F. A., Faust, H., Fehrmann, L., Hein, J., Hennings, N., 743
Hidayat, P., Hölscher, D., Jochum, M., Knohl, A., Kotowska, M. M., Krashevska, V., 744
Kreft, H., Leuschner, C., Lobite, N. J. S., Panjaitan, R., Polle, A., Potapov, A. M., 745
Purnama, E., Qaim, M., Röll, A., Scheu, S., Schneider, D., Tjoa, A., Tscharntke, T., 746
Veldkamp, E., and Wollni, M.: Trade-offs between multifunctionality and profit in 747
tropical smallholder landscapes, Nature Communications, 11, 1186, doi:10.1038/s41467-748
020-15013-5, 2020. 749
Harmand, J.-M., Ávila, H., Oliver, R., Saint-André, L., and Dambrine, E.: The impact of 750
kaolinite and oxi-hydroxides on nitrate adsorption in deep layers of a Costarican Acrisol 751
under coffee cultivation, Geoderma, 158, 216–224, doi:10.1016/j.geoderma.2010.04.032, 752
2010. 753
https://doi.org/10.5194/bg-2020-153Preprint. Discussion started: 2 June 2020c© Author(s) 2020. CC BY 4.0 License.
33
Haron, K., Brookes, P. C., Anderson, J. M., and Zakaria, Z. Z.: Microbial biomass and soil 754
organic matter dynamics in oil palm (Elaeis Guineensis Jacq.) plantations, West Malaysia, 755
Soil Biology and Biochemistry, 30, 547–552, doi:10.1016/S0038-0717(97)00217-4, 1998. 756
Hodge, A.: The plastic plant: root responses to heterogeneous supplies of nutrients, New 757
Phytologist, 162, 9–24, doi:10.1111/j.1469-8137.2004.01015.x, 2004. 758
Hothorn, T., Bretz, F., and Westfall, P.: Simultaneous inference in general parametric models, 759
Biometrical Journal, 50, 346–363, 2008. 760
Huddell, A. M., Galford, G. L., Tully, K. L., Crowley, C., Palm, C. A., Neill, C., Hickman, J. 761
E., and Menge, D. N. L.: Meta‐analysis on the potential for increasing nitrogen losses 762
from intensifying tropical agriculture, Global Change Biology, 26, 1–13, 763
doi:10.1111/gcb.14951, 2020. 764
Jankowski, K., Neill, C., Davidson, E. A., Macedo, M. N., Costa, C. J., Galford, G. L., 765
Santos, L. M., Lefebvre, P., Nunes, D., Cerri, C. E. P., McHorney, R., O’Connell, C., and 766
Coe, M. T.: Deep soils modify environmental consequences of increased nitrogen fertilizer 767
use in intensifying Amazon agriculture, Scientific Reports, 13478, doi:10.1038/s41598-768
018-31175-1, 2018. 769
Kaspari, M., Yanoviak, S. P., Dudley, R., Yuan, M., and Clay, N. A.: Sodium shortage as a 770
constraint on the carbon cycle in an inland tropical rainforest, Proceedings of the National 771
Academy of Sciences of the United States of America, 106, 19405–19409, 772
doi:10.1073/pnas.0906448106, 2009. 773
Kotowska, M. M., Leuschner, C., Triadiati, T., and Hertel, D.: Conversion of tropical lowland 774
forest reduces nutrient return through litterfall, and alters nutrient use efficiency and 775
seasonality of net primary production, Oecologia, 180, 601–618, doi:10.1007/s00442-015-776
3481-5, 2016. 777
Kotowska, M. M., Leuschner, C., Triadiati, T., Meriem, S., and Hertel, D.: Quantifying 778
above- and belowground biomass carbon loss with forest conversion in tropical lowlands 779
https://doi.org/10.5194/bg-2020-153Preprint. Discussion started: 2 June 2020c© Author(s) 2020. CC BY 4.0 License.
34
of Sumatra (Indonesia), Global Change Biology, 21, 3620–3634, doi:10.1111/gcb.12979, 780
2015. 781
Kurniawan, S., Corre, M. D., Matson, A. L., Schulte-Bisping, H., Utami, S. R., van Straaten, 782
O., and Veldkamp, E.: Conversion of tropical forests to smallholder rubber and oil palm 783
plantations impacts nutrient leaching losses and nutrient retention efficiency in highly 784
weathered soils, Biogeosciences, 15, 5131–5154, doi:10.5194/bg-15-5131-2018, 2018. 785
Kuznetsova, A., Brockhoff, P. B., and Christensen, R. H. B.: LmerTest package: tests in linear 786
mixed effects models, Journal of Statistical Software, 82, doi:10.18637/jss.v082.i13, 2017. 787
Lamade, E., Djegui, N., and Leterme, P.: Estimation of carbon allocation to the roots from 788
soil respiration measurements of oil palm, Plant and Soil, 181, 329–339, 789
doi:10.1007/BF00012067, 1996. 790
Li, Y. and Ghodrati, M.: Preferential transport of nitrate through soil columns containing root 791
channels, Soil Science Society of America Journal, 58, 653–659, 792
doi:10.2136/sssaj1994.03615995005800030003x, 1994. 793
Lohse, K. A. and Matson, P.: Consequences of nitrogen additions for soil losses from wet 794
tropical forests, Ecological Applications, 15, 1629–1648, doi:10.1890/03-5421, 2005. 795
Luke, S. H., Barclay, H., Bidin, K., Chey, V. K., Ewers, R. M., Foster, W. A., Nainar, A., 796
Pfeifer, M., Reynolds, G., Turner, E. C., Walsh, R. P. D., and Aldridge, D. C.: The effects 797
of catchment and riparian forest quality on stream environmental conditions across a 798
tropical rainforest and oil palm landscape in Malaysian Borneo, Ecohydrology: 799
ecosystems, land and water process interactions, ecohydrogeomorphology, 10, 1-17, 800
doi:10.1002/eco.1827, 2017. 801
Luke, S. H., Purnomo, D., Advento, A. D., Aryawan, A. A. K., Naim, M., Pikstein, R. N., Ps, 802
S., Rambe, T. D. S., Soeprapto, Caliman, J.-P., Snaddon, J. L., Foster, W. A., and Turner, 803
E. C.: Effects of understory vegetation management on plant communities in oil palm 804
https://doi.org/10.5194/bg-2020-153Preprint. Discussion started: 2 June 2020c© Author(s) 2020. CC BY 4.0 License.
35
plantations in Sumatra, Indonesia, Frontiers in Forests and Global Change, 2, 1–13, 805
doi:10.3389/ffgc.2019.00033, 2019. 806
Meijide, A., La Rua, C. de, Guillaume, T., Röll, A., Hassler, E., Stiegler, C., Tjoa, A., June, 807
T., Corre, M. D., Veldkamp, E., and Knohl, A.: Measured greenhouse gas budgets 808
challenge emission savings from palm-oil biodiesel, Nature Communications, 11, 1089, 809
doi:10.1038/s41467-020-14852-6, 2020. 810
Meijide, A., Röll, A., Fan, Y., Herbst, M., Niu, F., Tiedemann, F., June, T., Rauf, A., 811
Hölscher, D., and Knohl, A.: Controls of water and energy fluxes in oil palm plantations: 812
environmental variables and oil palm age, Agricultural and Forest Meteorology, 239, 71–813
85, doi:10.1016/j.agrformet.2017.02.034, 2017. 814
Ministry of Agriculture of Indonesia: Oil palm replanting guideline, Regulation No: 815
18/Permentan/KB.330/5/2016, 2016. 816
Mohanty, S., Swain, C. K., Tripathi, R., Sethi, S. K., Bhattacharyya, P., Kumar, A., Raja, R., 817
Shahid, M., Panda, B. B., Lal, B., Gautam, P., Munda, S., and Nayak, A. K.: Nitrate 818
leaching, nitrous oxide emission and N use efficiency of aerobic rice under different N 819
application strategy, Archives of Agronomy and Soil Science, 64, 465–479, 820
doi:10.1080/03650340.2017.1359414, 2018. 821
Moradi, A., Teh, C. B. S., Goh, K. J., Husni, A. M. H., and Ishak, C. F.: Effect of four soil 822
and water conservation practices on soil physical processes in a non-terraced oil palm 823
plantation, Soil and Tillage Research, 145, 62–71, doi:10.1016/j.still.2014.08.005, 2015. 824
Murdiyarso, D., Hergoualc’h, K., and Verchot, L. V.: Opportunities for reducing greenhouse 825
gas emissions in tropical peatlands, Proceedings of the National Academy of Sciences of 826
the United States of America, 107, 19655–19660, doi:10.1073/pnas.0911966107, 2010. 827
Neill, C., Coe, M. T., Riskin, S. H., Krusche, A. V., Elsenbeer, H., Macedo, M. N., 828
McHorney, R., Lefebvre, P., Davidson, E. A., Scheffler, R., Figueira, A. M. e. S., Porder, 829
S., and Deegan, L. A.: Watershed responses to Amazon soya bean cropland expansion and 830
https://doi.org/10.5194/bg-2020-153Preprint. Discussion started: 2 June 2020c© Author(s) 2020. CC BY 4.0 License.
36
intensification, Philosophical Transactions of the Royal Society of London. Series B, 831
Biological sciences, 368, 20120425, doi:10.1098/rstb.2012.0425, 2013. 832
Nelson, P. N., Banabas, M., Scotter, D. R., and Webb, M. J.: Using soil water depletion to 833
measure spatial distribution of root activity in oil palm (Elaeis Guineensis Jacq.) 834
plantations, Plant and Soil, 286, 109–121, doi:10.1007/s11104-006-9030-6, 2006. 835
Nyamangara, J., Bergström, L. F., Piha, M. I., and Giller, K. E.: Fertilizer use efficiency and 836
nitrate leaching in a tropical sandy soil, Journal of environmental quality, 32, 599–606, 837
doi:10.2134/jeq2003.5990, 2003. 838
Olsson, M. O. and Falkengren-Grerup, U.: Partitioning of nitrate uptake between trees and 839
understory in oak forests, Forest Ecology and Management, 179, 311–320, 840
doi:10.1016/S0378-1127(02)00544-3, 2003. 841
Omoti, U., Ataga, D. O., and Isenmila, A. E.: Leaching losses of nutrients in oil palm 842
plantations determined by tension lysimeters, Plant and Soil, 73, 365–376, 843
doi:10.1007/BF02184313, 1983. 844
Pahan, I.: Complete guide to oil palm, 8th ed., Penebar Swadaya, Jakarta, Indonesia, 160-164, 845
2010. 846
Pardon, L., Bessou, C., Nelson, P. N., Dubos, B., Ollivier, J., Marichal, R., Caliman, J.-P., and 847
Gabrielle, B.: Key unknowns in nitrogen budget for oil palm plantations. A review, 848
Agronomy for Sustainable Development, 36, 20, doi:10.1007/s13593-016-0353-2, 2016. 849
Pirker, J., Mosnier, A., Kraxner, F., Havlík, P., and Obersteiner, M.: What are the limits to oil 850
palm expansion?, Global Environmental Change, 40, 73–81, 851
doi:10.1016/j.gloenvcha.2016.06.007, 2016. 852
Priesack, E.: Expert-N model library documentation, Institute of Soil Ecology, 2005. 853
R Core Team: R: A language and environment for statistical computing, Foundation for 854
Statistical Computing, Vienna, Austria, 2019. 855
https://doi.org/10.5194/bg-2020-153Preprint. Discussion started: 2 June 2020c© Author(s) 2020. CC BY 4.0 License.
37
Rahman, N., Neergaard, A. de, Magid, J., van de Ven, G. W. J., Giller, K. E., and Bruun, T. 856
B.: Changes in soil organic carbon stocks after conversion from forest to oil palm 857
plantations in Malaysian Borneo, Environmental Research Letters, 13, 105001, 858
doi:10.1088/1748-9326/aade0f, 2018. 859
Röll, A., Niu, F., Meijide, A., Ahongshangbam, J., Ehbrecht, M., Guillaume, T., Gunawan, 860
D., Hardanto, A., Hendrayanto, Hertel, D., Kotowska, M. M., Kreft, H., Kuzyakov, Y., 861
Leuschner, C., Nomura, M., Polle, A., Rembold, K., Sahner, J., Seidel, D., Zemp, D. C., 862
Knohl, A., and Hölscher, D.: Transpiration on the rebound in lowland Sumatra, 863
Agricultural and Forest Meteorology, 274, 160–171, doi:10.1016/j.agrformet.2019.04.017, 864
2019. 865
Roy, E. D., Richards, P. D., Martinelli, L. A., Della Coletta, L., Lins, S. R. M., Vazquez, F. 866
F., Willig, E., Spera, S. A., VanWey, L. K., and Porder, S.: The phosphorus cost of 867
agricultural intensification in the tropics, Nature plants, 2, 16043, 868
doi:10.1038/nplants.2016.43, 2016. 869
RSPO: Principles and criteria: For the production of sustainable palm oil, 2018. 870
Rüegg, J., Quezada, J. C., Santonja, M., Ghazoul, J., Kuzyakov, Y., Buttler, A., and 871
Guillaume, T.: Drivers of soil carbon stabilization in oil palm plantations, Land 872
Degradation & Development, 30, 1–12, doi:10.1002/ldr.3380, 2019. 873
Schlesinger, W. H. and Bernhardt, E. S.: Biogeochemistry: An analysis of global change, 3rd 874
ed., Academic Press, Waltham, Mass, 672 pp., 2013. 875
Schroth, G., Rodrigues, M.R.L., and D’Angelo, S. A.: Spatial patterns of nitrogen 876
mineralization, fertilizer distribution and roots explain nitrate leaching from mature 877
Amazonian oil palm plantation, Soil Use and Management, 16, 222–229, 878
doi:10.1111/j.1475-2743.2000.tb00197.x, 2000. 879
https://doi.org/10.5194/bg-2020-153Preprint. Discussion started: 2 June 2020c© Author(s) 2020. CC BY 4.0 License.
38
Silver, W. L., Thompson, A. W., Reich, A., Ewel, J. J., and Firestone, M. K.: Nitrogen 880
cycling in tropical plantation forests: potential controls on nitrogen retention, Ecological 881
Applications, 15, 1604–1614, doi:10.1890/04-1322, 2005. 882
Steiner, C., Glaser, B., Geraldes Teixeira, W., Lehmann, J., Blum, W. E.H., and Zech, W.: 883
Nitrogen retention and plant uptake on a highly weathered central Amazonian Ferralsol 884
amended with compost and charcoal, Journal of Plant Nutrition and Soil Science, 171, 885
893–899, doi:10.1002/jpln.200625199, 2008. 886
Tarigan, S., Stiegler, C., Wiegand, K., Knohl, A., and Murtilaksono, K.: Relative contribution 887
of evapotranspiration and soil compaction to the fluctuation of catchment discharge: case 888
study from a plantation landscape, Hydrological Sciences Journal, 58, 1–10, 889
doi:10.1080/02626667.2020.1739287, 2020. 890
Tarigan, S., Wiegand, K., Sunarti, and Slamet, B.: Minimum forest cover required for 891
sustainable water flow regulation of a watershed: a case study in Jambi Province, 892
Indonesia, Hydrology and Earth System Sciences, 22, 581–594, doi:10.5194/hess-22-581-893
2018, 2018. 894
Tarigan, S. D., Sunarti, Wiegand, K., Dislich, C., Slamet, B., Heinonen, J., and Meyer, K.: 895
Mitigation options for improving the ecosystem function of water flow regulation in a 896
watershed with rapid expansion of oil palm plantations, Sustainability of Water Quality 897
and Ecology, 8, 4–13, doi:10.1016/j.swaqe.2016.05.001, 2016. 898
Teklu, B. M., Hailu, A., Wiegant, D. A., Scholten, B. S., and van den Brink, P. J.: Impacts of 899
nutrients and pesticides from small- and large-scale agriculture on the water quality of 900
Lake Ziway, Ethiopia, Environmental Science and Pollution Research, 25, 13207–13216, 901
doi:10.1007/s11356-016-6714-1, 2018. 902
Tokuchi, N., Samejima, H., Hon, J., and Fukushima, K.: Influence of herbicide use in oil palm 903
plantations on stream water chemistry in Sarawak, Anthropogenic Tropical Forests, 209–904
216, doi:10.1007/978-981-13-7513-2_11, 2019. 905
https://doi.org/10.5194/bg-2020-153Preprint. Discussion started: 2 June 2020c© Author(s) 2020. CC BY 4.0 License.
39
Tully, K. L., Lawrence, D., and Scanlon, T. M.: More trees less loss: nitrogen leaching losses 906
decrease with increasing biomass in coffee agroforests, Agriculture, Ecosystems & 907
Environment, 161, 137–144, doi:10.1016/j.agee.2012.08.002, 2012. 908
Tung, P. G. A., Yusoff, M. K., Majid, N. M., Joo, G. K., and Huang, G. H.: Effect of N and K 909
fertilizers on nutrient leaching and groundwater quality under mature oil palm in Sabah 910
during the monsoon period, American Journal of Applied Sciences, 6, 1788–1799, 2009. 911
van Breemen, N., Mulder, J., and Driscoll, C. T.: Acidification and alkalization of soils, Plant 912
and Soil, 283–308, 1983. 913
van Bruggen, A.H.C., He, M. M., Shin, K., Mai, V., Jeong, K. C., Finckh, M. R., and Morris, 914
J. G.: Environmental and health effects of the herbicide glyphosate, Science of the Total 915
Environment, 616-617, 255–268, doi:10.1016/j.scitotenv.2017.10.309, 2018. 916
van Straaten, O., Corre, M. D., Wolf, K., Tchienkoua, M., Cuellar, E., Matthews, R. B., and 917
Veldkamp, E.: Conversion of lowland tropical forests to tree cash crop plantations loses 918
up to one-half of stored soil organic carbon, Proceedings of the National Academy of 919
Sciences of the United States of America, 112, 9956–9960, doi:10.1073/pnas.1504628112, 920
2015. 921
Vijay, V., Pimm, S. L., Jenkins, C. N., and Smith, S. J.: The impacts of oil palm on recent 922
deforestation and biodiversity loss, PloS One, 11, e0159668, 923
doi:10.1371/journal.pone.0159668, 2016. 924
Wakelin, S. A., Nelson, P. N., Armour, J. D., Rasiah, V., and Colloff, M. J.: Bacterial 925
community structure and denitrifier (nir-gene) abundance in soil water and groundwater 926
beneath agricultural land in tropical North Queensland, Australia, Soil Research, 49, 65–927
76, doi:10.1071/SR10055, 2011. 928
WHO: Guidelines for drinking-water quality, 4th ed., World Health Organization, Geneva, 929
2011. 930
https://doi.org/10.5194/bg-2020-153Preprint. Discussion started: 2 June 2020c© Author(s) 2020. CC BY 4.0 License.
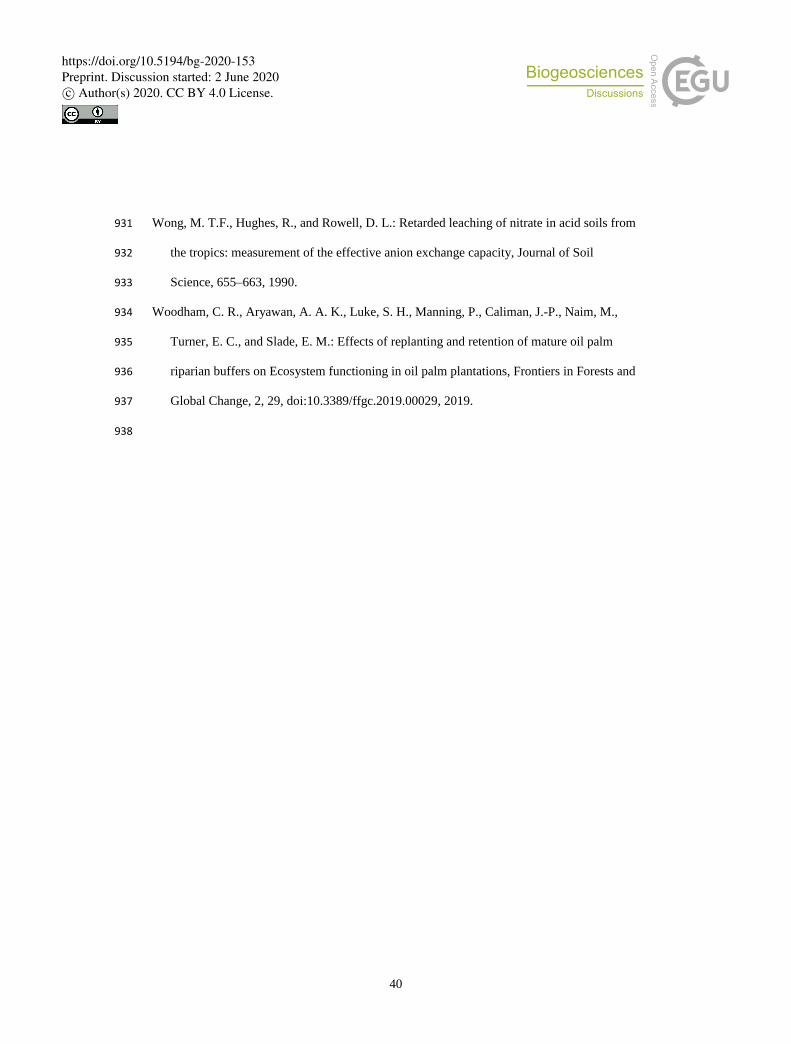
40
Wong, M. T.F., Hughes, R., and Rowell, D. L.: Retarded leaching of nitrate in acid soils from 931
the tropics: measurement of the effective anion exchange capacity, Journal of Soil 932
Science, 655–663, 1990. 933
Woodham, C. R., Aryawan, A. A. K., Luke, S. H., Manning, P., Caliman, J.-P., Naim, M., 934
Turner, E. C., and Slade, E. M.: Effects of replanting and retention of mature oil palm 935
riparian buffers on Ecosystem functioning in oil palm plantations, Frontiers in Forests and 936
Global Change, 2, 29, doi:10.3389/ffgc.2019.00029, 2019. 937
938
https://doi.org/10.5194/bg-2020-153Preprint. Discussion started: 2 June 2020c© Author(s) 2020. CC BY 4.0 License.
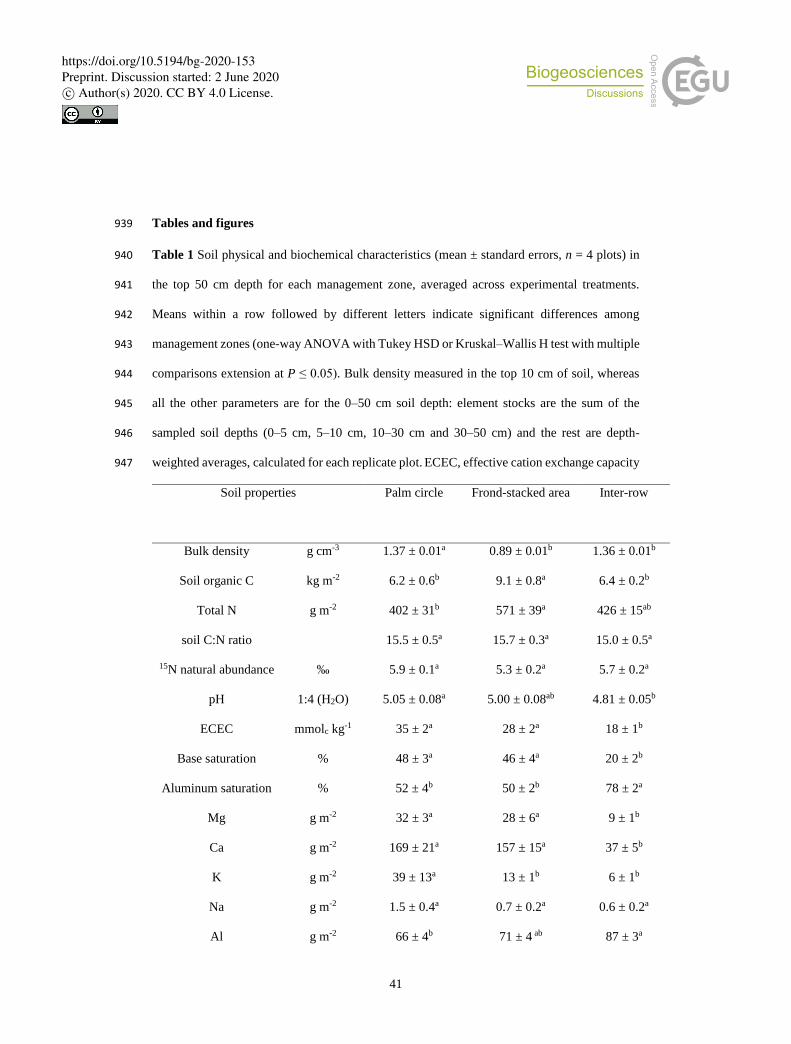
41
Tables and figures 939
Table 1 Soil physical and biochemical characteristics (mean ± standard errors, n = 4 plots) in 940
the top 50 cm depth for each management zone, averaged across experimental treatments. 941
Means within a row followed by different letters indicate significant differences among 942
management zones (one-way ANOVA with Tukey HSD or Kruskal–Wallis H test with multiple 943
comparisons extension at P ≤ 0.05). Bulk density measured in the top 10 cm of soil, whereas 944
all the other parameters are for the 0–50 cm soil depth: element stocks are the sum of the 945
sampled soil depths (0–5 cm, 5–10 cm, 10–30 cm and 30–50 cm) and the rest are depth-946
weighted averages, calculated for each replicate plot. ECEC, effective cation exchange capacity 947
Soil properties Palm circle Frond-stacked area Inter-row
Bulk density g cm-3 1.37 ± 0.01a 0.89 ± 0.01b 1.36 ± 0.01b
Soil organic C kg m-2 6.2 ± 0.6b 9.1 ± 0.8a 6.4 ± 0.2b
Total N g m-2 402 ± 31b 571 ± 39a 426 ± 15ab
soil C:N ratio 15.5 ± 0.5a 15.7 ± 0.3a 15.0 ± 0.5a
15N natural abundance ‰ 5.9 ± 0.1a 5.3 ± 0.2a 5.7 ± 0.2a
pH 1:4 (H2O) 5.05 ± 0.08a 5.00 ± 0.08ab 4.81 ± 0.05b
ECEC mmolc kg-1 35 ± 2a 28 ± 2a 18 ± 1b
Base saturation % 48 ± 3a 46 ± 4a 20 ± 2b
Aluminum saturation % 52 ± 4b 50 ± 2b 78 ± 2a
Mg g m-2 32 ± 3a 28 ± 6a 9 ± 1b
Ca g m-2 169 ± 21a 157 ± 15a 37 ± 5b
K g m-2 39 ± 13a 13 ± 1b 6 ± 1b
Na g m-2 1.5 ± 0.4a 0.7 ± 0.2a 0.6 ± 0.2a
Al g m-2 66 ± 4b 71 ± 4 ab 87 ± 3a
https://doi.org/10.5194/bg-2020-153Preprint. Discussion started: 2 June 2020c© Author(s) 2020. CC BY 4.0 License.
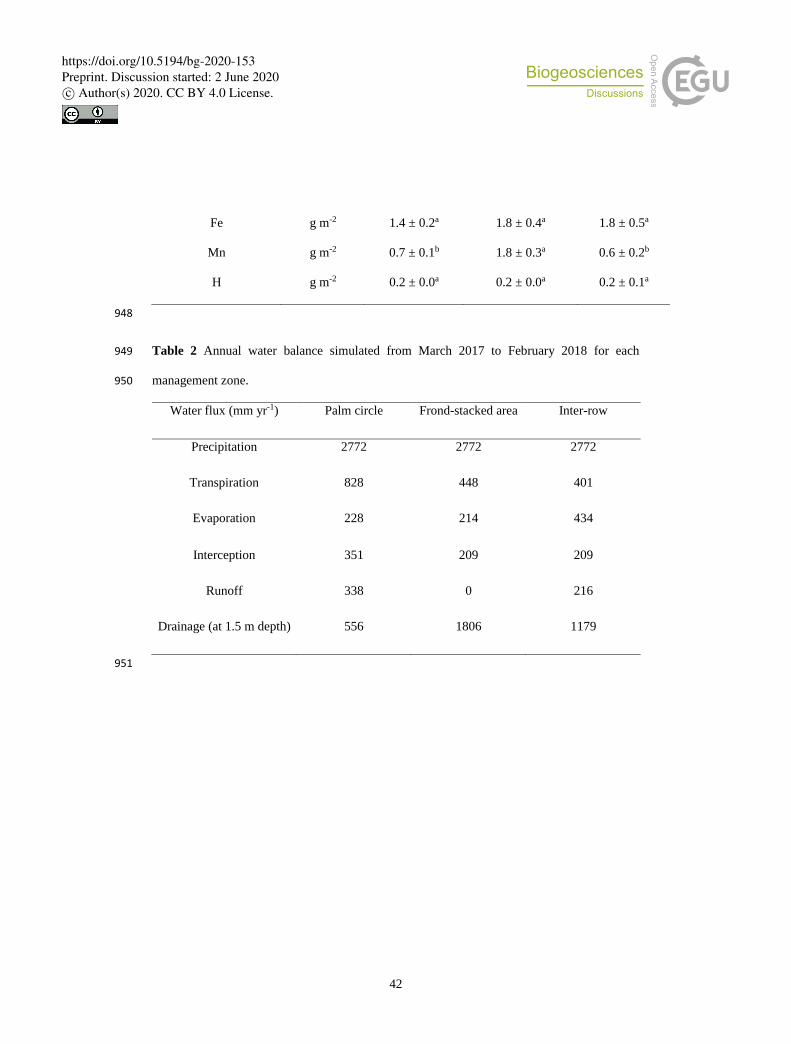
42
Fe g m-2 1.4 ± 0.2a 1.8 ± 0.4a 1.8 ± 0.5a
Mn g m-2 0.7 ± 0.1b 1.8 ± 0.3a 0.6 ± 0.2b
H g m-2 0.2 ± 0.0a 0.2 ± 0.0a 0.2 ± 0.1a
948
Table 2 Annual water balance simulated from March 2017 to February 2018 for each 949
management zone. 950
Water flux (mm yr-1) Palm circle Frond-stacked area Inter-row
Precipitation 2772 2772 2772
Transpiration 828 448 401
Evaporation 228 214 434
Interception 351 209 209
Runoff 338 0 216
Drainage (at 1.5 m depth) 556 1806 1179
951
https://doi.org/10.5194/bg-2020-153Preprint. Discussion started: 2 June 2020c© Author(s) 2020. CC BY 4.0 License.
43
Table 3 Annual leaching losses at 1.5 m depth for each experimental treatment from March 952
2017 to February 2018. Values are area-weighted averages of leaching losses in each 953
management zone (mean ± standard error, n = 4 plots). Means followed by different letters 954
indicate differences among experimental treatments (linear-mixed effect models on monthly 955
values followed by Tukey HSD test for multiple comparisons at P ≤ 0.05). Treatments: ch = 956
conventional fertilization–herbicide; cw = conventional fertilization–mechanical weeding; rh = 957
reduced fertilization–herbicide; rw = reduced fertilization–mechanical weeding. DON = 958
dissolved organic N; TDN = total dissolved N. 959
Element leaching (kg ha-1 yr-1) ch cw rh rw
NO3--N 71.5 ± 20.1a 48.2 ± 13.0ab 36.3 ± 20.1b 30.0 ± 5.7b
NH4+-N 1.7 ± 0.2a 1.7 ± 0.1a 1.8 ± 0.1a 1.7 ± 0.2a
DON 0.5 ± 0.5a 0.6 ± 0.3a 0.4 ± 0.1a 0.3 ± 0.0a
TDN 73.6 ± 20.2a 50.4 ± 13.1ab 38.4 ± 8.9b 32.0 ± 5.8b
Ca 26.6 ± 4.3a 19.4 ± 4.4b 18.2 ± 1.8b 17.0 ± 2.1b
Mg 11.6 ± 2.5a 7.7 ± 0.8b 9.1 ± 0.7ab 10.8 ± 3.6ab
K 8.1 ± 1.3a 6.2 ± 0.7b 8.9 ± 0.6a 5.7 ± 1.1b
Na 15.9 ± 3.5ab 13.6 ± 2.4b 18.9 ± 3.1a 13.1 ± 1.2b
Mn 0.3 ± 0.1a 0.2 ± 0.0b 0.2 ± 0.0bc 0.1 ± 0.0c
Total Al 40.8 ± 11.5a 20.8 ± 7.6b 19.9 ± 6.8b 21.8 ± 3.1b
Total S 2.4 ± 0.5a 1.8 ± 0.4a 2.1 ± 0.6a 4.9 ± 3.3a
Total Fe 0.2 ± 0.0a 0.5 ± 0.3a 0.2 ± 0.0a 0.5 ± 0.3a
Total P 0.0 ± 0.0a 0.1 ± 0.0a 0.0 ± 0.0a 0.0 ± 0.0a
https://doi.org/10.5194/bg-2020-153Preprint. Discussion started: 2 June 2020c© Author(s) 2020. CC BY 4.0 License.
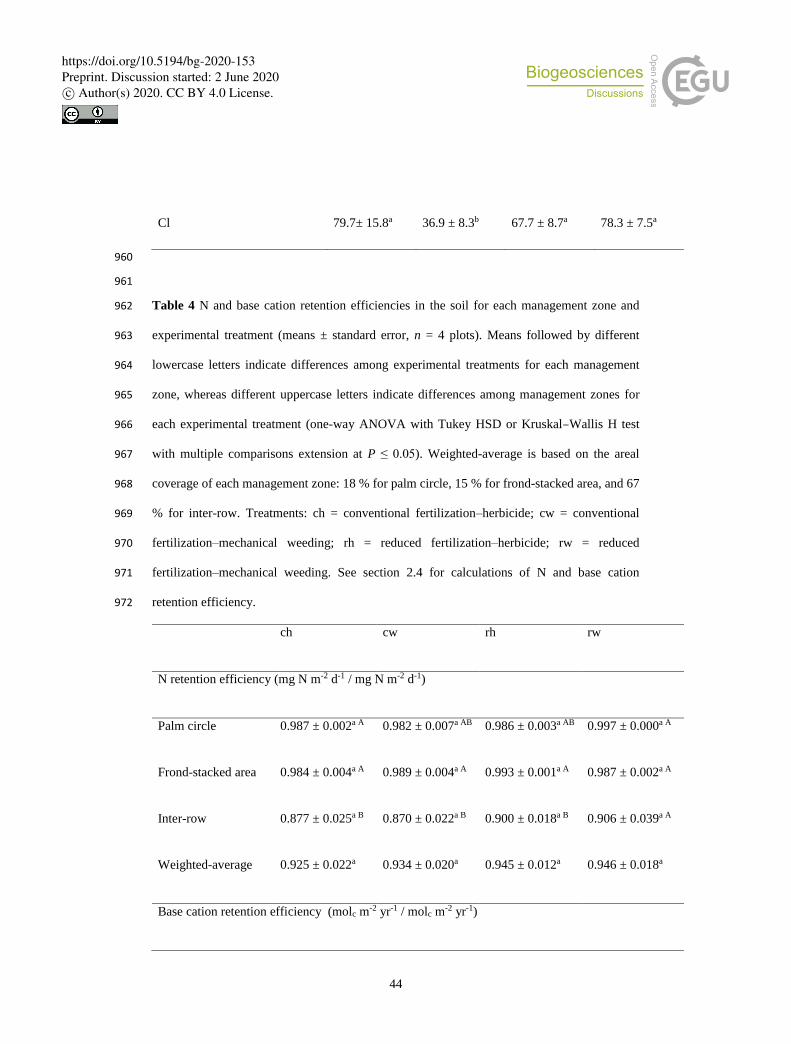
44
Cl 79.7± 15.8a 36.9 ± 8.3b 67.7 ± 8.7a 78.3 ± 7.5a
960
961
Table 4 N and base cation retention efficiencies in the soil for each management zone and 962
experimental treatment (means ± standard error, n = 4 plots). Means followed by different 963
lowercase letters indicate differences among experimental treatments for each management 964
zone, whereas different uppercase letters indicate differences among management zones for 965
each experimental treatment (one-way ANOVA with Tukey HSD or Kruskal–Wallis H test 966
with multiple comparisons extension at P ≤ 0.05). Weighted-average is based on the areal 967
coverage of each management zone: 18 % for palm circle, 15 % for frond-stacked area, and 67 968
% for inter-row. Treatments: ch = conventional fertilization–herbicide; cw = conventional 969
fertilization–mechanical weeding; rh = reduced fertilization–herbicide; rw = reduced 970
fertilization–mechanical weeding. See section 2.4 for calculations of N and base cation 971
retention efficiency. 972
ch cw rh rw
N retention efficiency (mg N m-2 d-1 / mg N m-2 d-1)
Palm circle 0.987 ± 0.002a A 0.982 ± 0.007a AB 0.986 ± 0.003a AB 0.997 ± 0.000a A
Frond-stacked area 0.984 ± 0.004a A 0.989 ± 0.004a A 0.993 ± 0.001a A 0.987 ± 0.002a A
Inter-row 0.877 ± 0.025a B 0.870 ± 0.022a B 0.900 ± 0.018a B 0.906 ± 0.039a A
Weighted-average 0.925 ± 0.022a 0.934 ± 0.020a 0.945 ± 0.012a 0.946 ± 0.018a
Base cation retention efficiency (molc m-2 yr-1 / molc m
-2 yr-1)
https://doi.org/10.5194/bg-2020-153Preprint. Discussion started: 2 June 2020c© Author(s) 2020. CC BY 4.0 License.
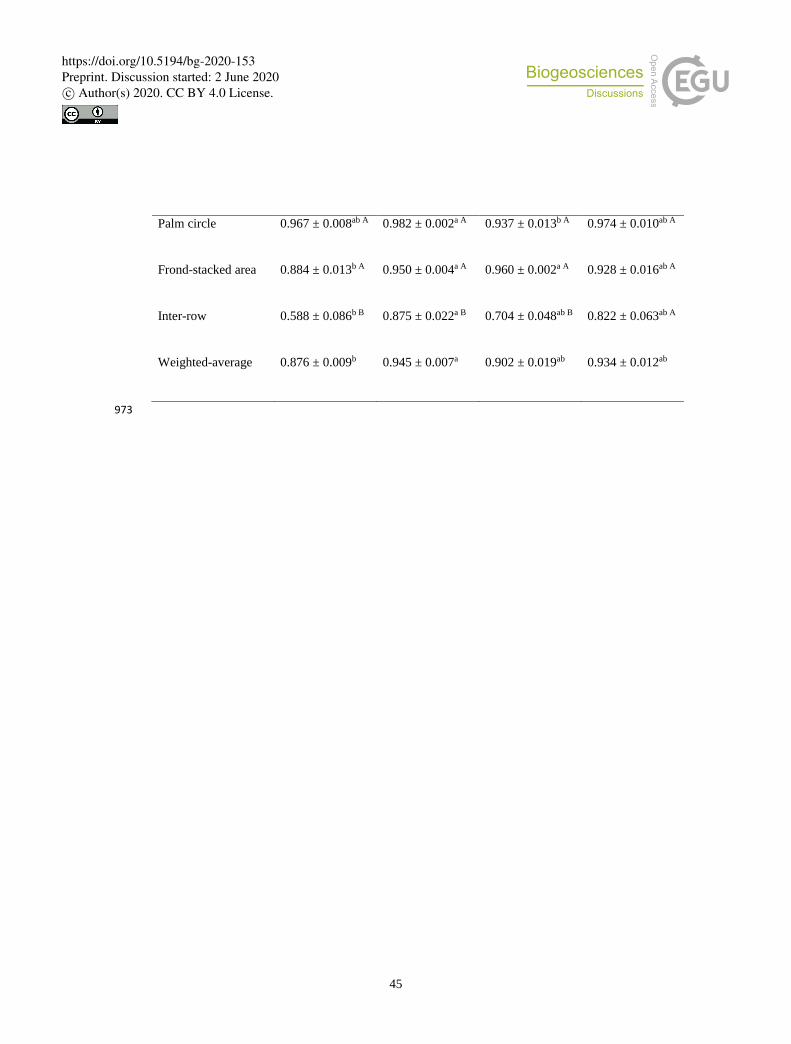
45
Palm circle 0.967 ± 0.008ab A 0.982 ± 0.002a A 0.937 ± 0.013b A 0.974 ± 0.010ab A
Frond-stacked area 0.884 ± 0.013b A 0.950 ± 0.004a A 0.960 ± 0.002a A 0.928 ± 0.016ab A
Inter-row 0.588 ± 0.086b B 0.875 ± 0.022a B 0.704 ± 0.048ab B 0.822 ± 0.063ab A
Weighted-average 0.876 ± 0.009b 0.945 ± 0.007a 0.902 ± 0.019ab 0.934 ± 0.012ab
973
https://doi.org/10.5194/bg-2020-153Preprint. Discussion started: 2 June 2020c© Author(s) 2020. CC BY 4.0 License.
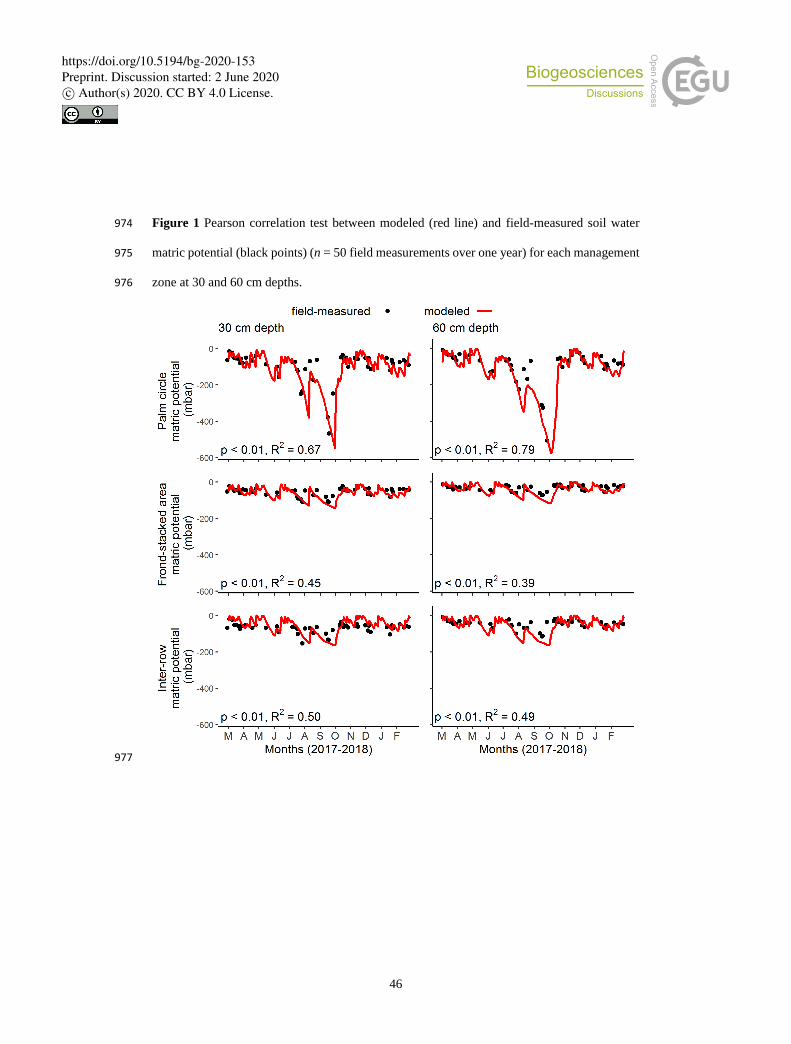
46
Figure 1 Pearson correlation test between modeled (red line) and field-measured soil water 974
matric potential (black points) (n = 50 field measurements over one year) for each management 975
zone at 30 and 60 cm depths. 976
977
https://doi.org/10.5194/bg-2020-153Preprint. Discussion started: 2 June 2020c© Author(s) 2020. CC BY 4.0 License.
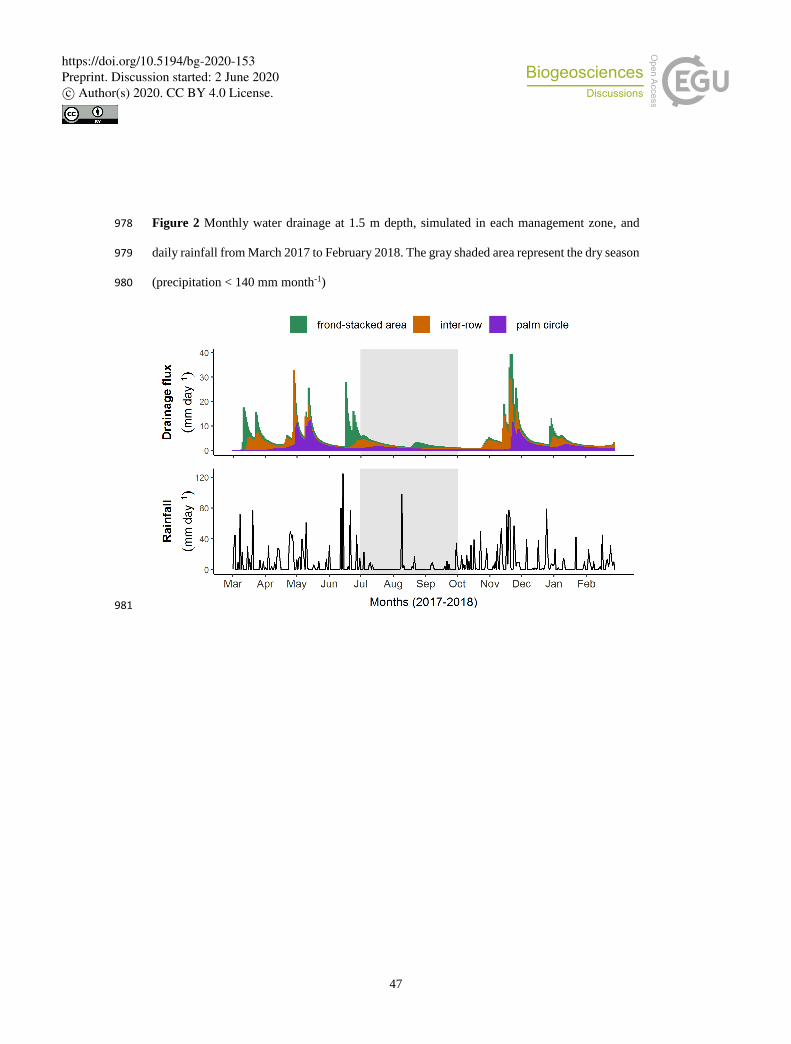
47
Figure 2 Monthly water drainage at 1.5 m depth, simulated in each management zone, and 978
daily rainfall from March 2017 to February 2018. The gray shaded area represent the dry season 979
(precipitation < 140 mm month-1) 980
981
https://doi.org/10.5194/bg-2020-153Preprint. Discussion started: 2 June 2020c© Author(s) 2020. CC BY 4.0 License.
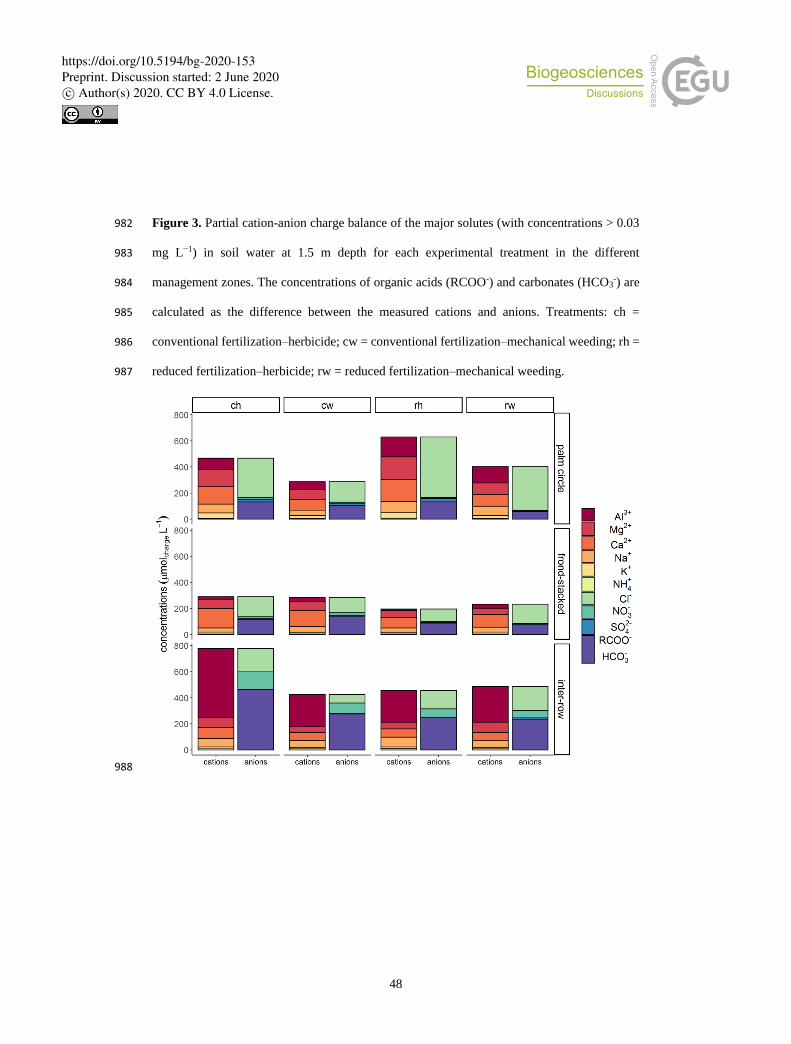
48
Figure 3. Partial cation-anion charge balance of the major solutes (with concentrations > 0.03 982
mg L−1) in soil water at 1.5 m depth for each experimental treatment in the different 983
management zones. The concentrations of organic acids (RCOO-) and carbonates (HCO3-) are 984
calculated as the difference between the measured cations and anions. Treatments: ch = 985
conventional fertilization–herbicide; cw = conventional fertilization–mechanical weeding; rh = 986
reduced fertilization–herbicide; rw = reduced fertilization–mechanical weeding. 987
988
https://doi.org/10.5194/bg-2020-153Preprint. Discussion started: 2 June 2020c© Author(s) 2020. CC BY 4.0 License.
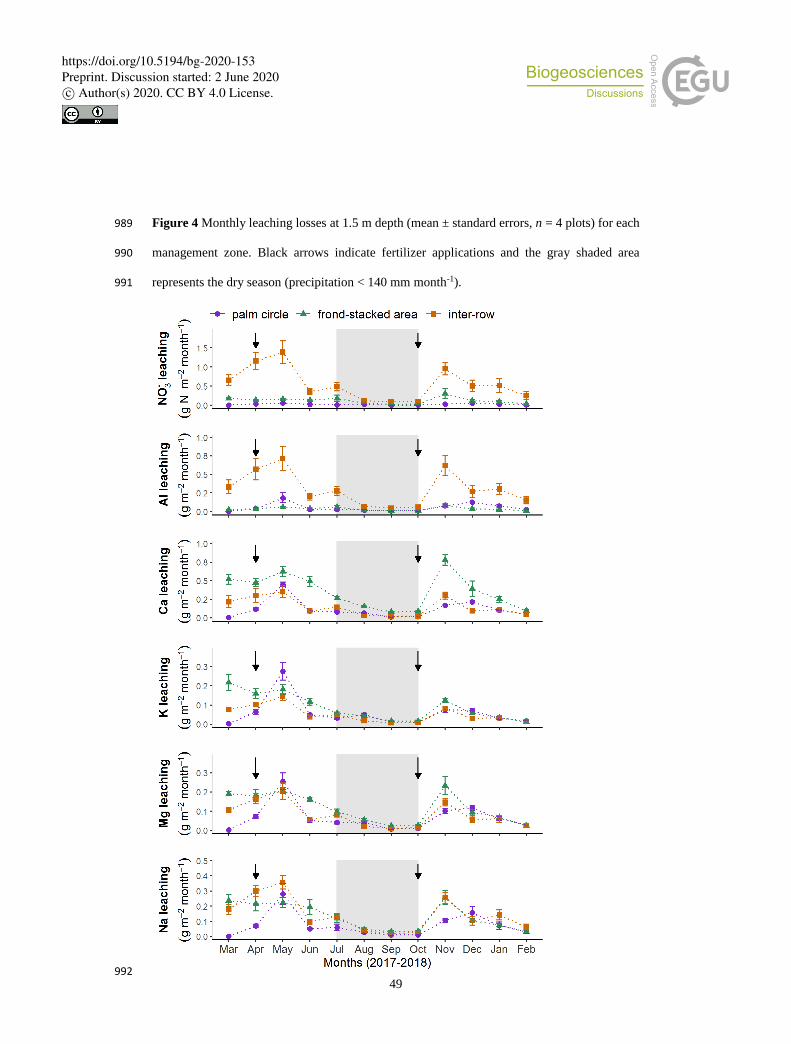
49
Figure 4 Monthly leaching losses at 1.5 m depth (mean ± standard errors, n = 4 plots) for each 989
management zone. Black arrows indicate fertilizer applications and the gray shaded area 990
represents the dry season (precipitation < 140 mm month-1). 991
992
https://doi.org/10.5194/bg-2020-153Preprint. Discussion started: 2 June 2020c© Author(s) 2020. CC BY 4.0 License.
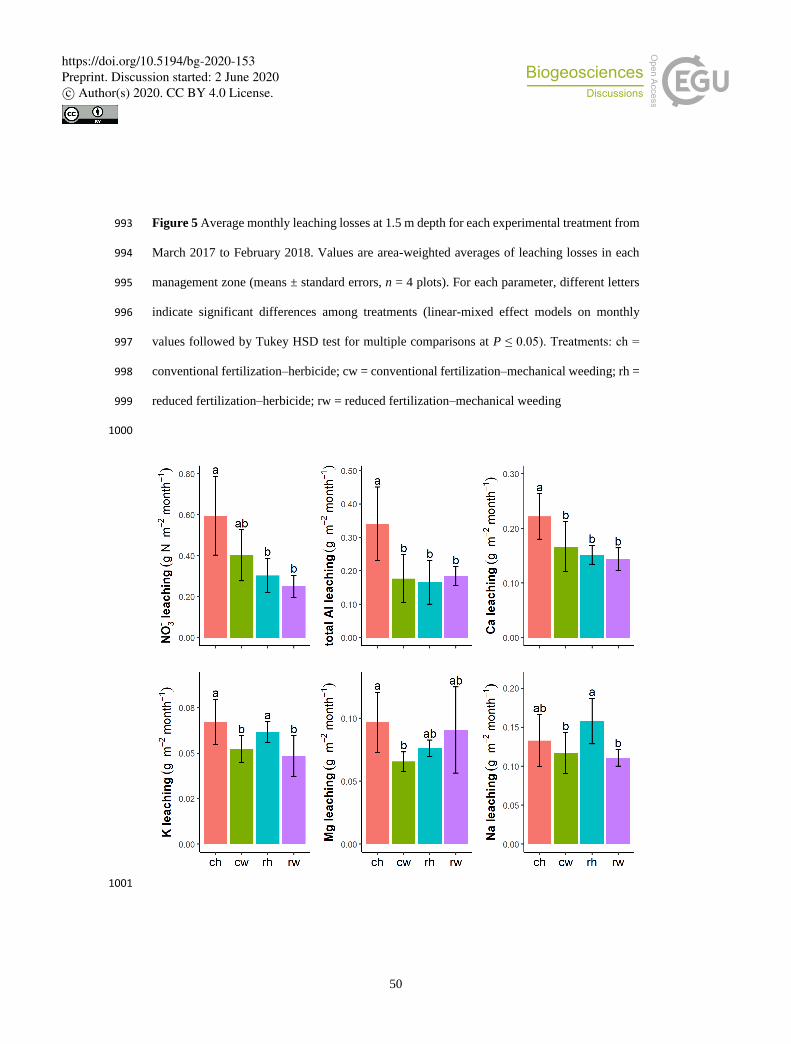
50
Figure 5 Average monthly leaching losses at 1.5 m depth for each experimental treatment from 993
March 2017 to February 2018. Values are area-weighted averages of leaching losses in each 994
management zone (means ± standard errors, n = 4 plots). For each parameter, different letters 995
indicate significant differences among treatments (linear-mixed effect models on monthly 996
values followed by Tukey HSD test for multiple comparisons at P ≤ 0.05). Treatments: ch = 997
conventional fertilization–herbicide; cw = conventional fertilization–mechanical weeding; rh = 998
reduced fertilization–herbicide; rw = reduced fertilization–mechanical weeding 999
1000
1001
https://doi.org/10.5194/bg-2020-153Preprint. Discussion started: 2 June 2020c© Author(s) 2020. CC BY 4.0 License.
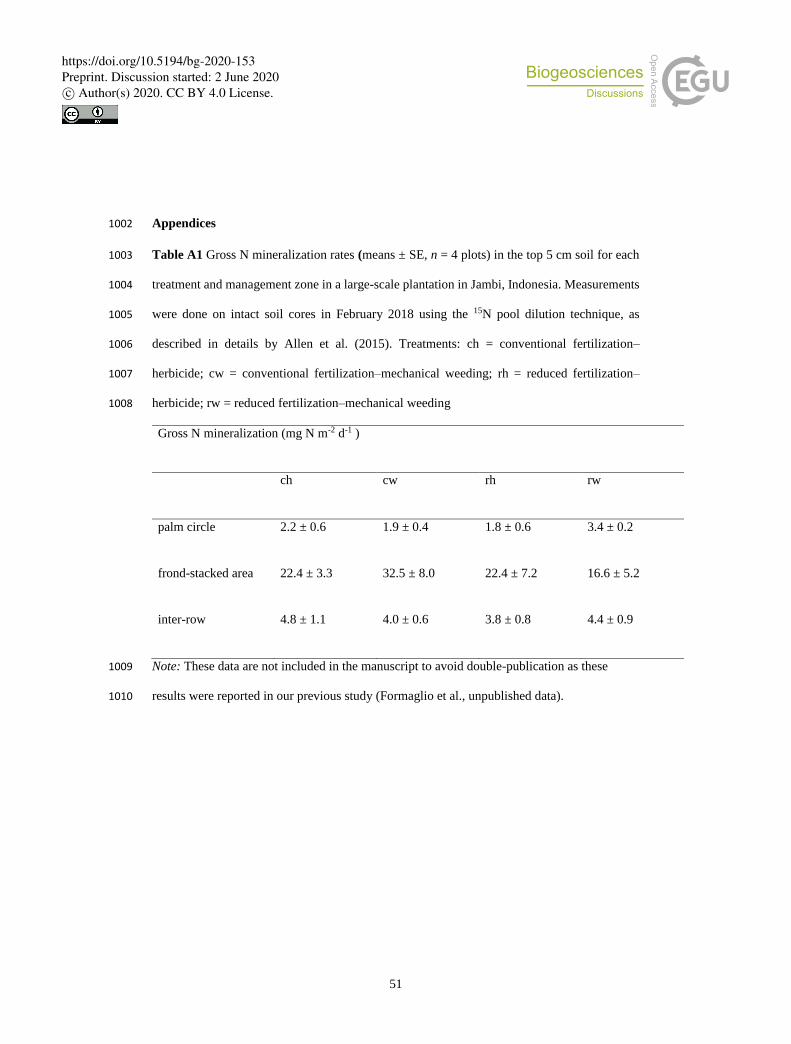
51
Appendices 1002
Table A1 Gross N mineralization rates (means ± SE, n = 4 plots) in the top 5 cm soil for each 1003
treatment and management zone in a large-scale plantation in Jambi, Indonesia. Measurements 1004
were done on intact soil cores in February 2018 using the 15N pool dilution technique, as 1005
described in details by Allen et al. (2015). Treatments: ch = conventional fertilization–1006
herbicide; cw = conventional fertilization–mechanical weeding; rh = reduced fertilization–1007
herbicide; rw = reduced fertilization–mechanical weeding 1008
Gross N mineralization (mg N m-2 d-1 )
ch cw rh rw
palm circle 2.2 ± 0.6 1.9 ± 0.4 1.8 ± 0.6 3.4 ± 0.2
frond-stacked area 22.4 ± 3.3 32.5 ± 8.0 22.4 ± 7.2 16.6 ± 5.2
inter-row 4.8 ± 1.1 4.0 ± 0.6 3.8 ± 0.8 4.4 ± 0.9
Note: These data are not included in the manuscript to avoid double-publication as these 1009
results were reported in our previous study (Formaglio et al., unpublished data). 1010
https://doi.org/10.5194/bg-2020-153Preprint. Discussion started: 2 June 2020c© Author(s) 2020. CC BY 4.0 License.
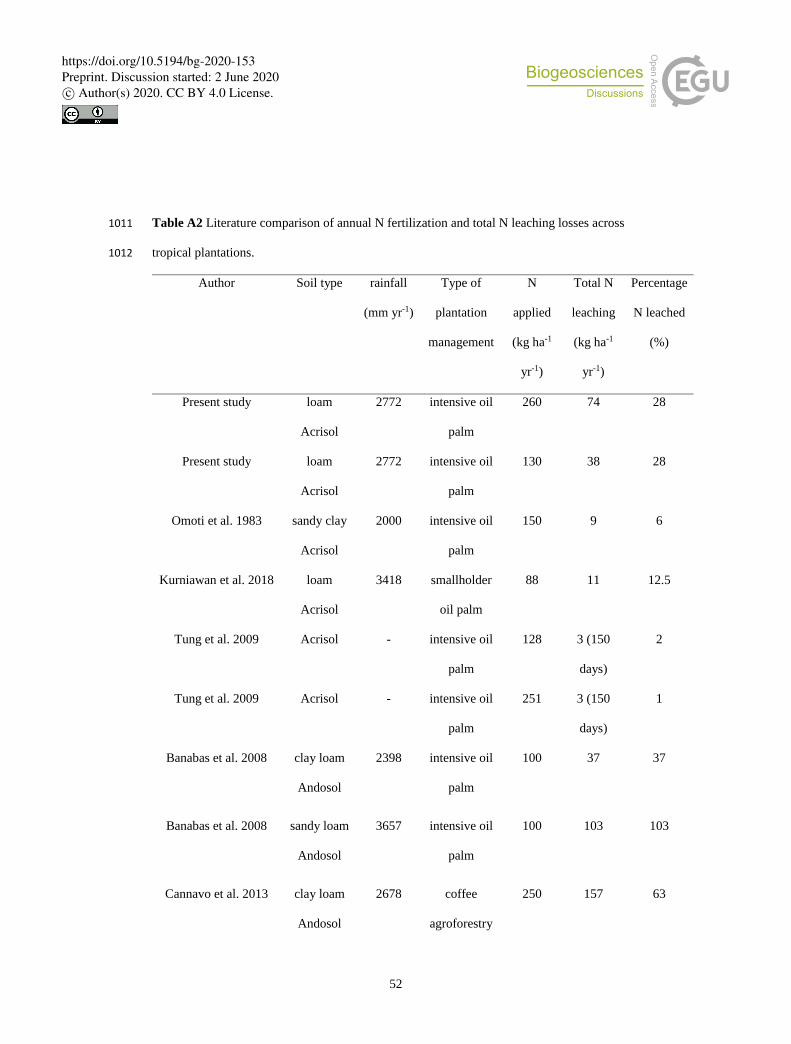
52
Table A2 Literature comparison of annual N fertilization and total N leaching losses across 1011
tropical plantations. 1012
Author Soil type rainfall
(mm yr-1)
Type of
plantation
management
N
applied
(kg ha-1
yr-1)
Total N
leaching
(kg ha-1
yr-1)
Percentage
N leached
(%)
Present study loam
Acrisol
2772 intensive oil
palm
260 74 28
Present study loam
Acrisol
2772 intensive oil
palm
130 38 28
Omoti et al. 1983 sandy clay
Acrisol
2000 intensive oil
palm
150 9 6
Kurniawan et al. 2018 loam
Acrisol
3418 smallholder
oil palm
88 11 12.5
Tung et al. 2009 Acrisol - intensive oil
palm
128 3 (150
days)
2
Tung et al. 2009 Acrisol - intensive oil
palm
251 3 (150
days)
1
Banabas et al. 2008 clay loam
Andosol
2398 intensive oil
palm
100 37 37
Banabas et al. 2008 sandy loam
Andosol
3657 intensive oil
palm
100 103 103
Cannavo et al. 2013 clay loam
Andosol
2678 coffee
agroforestry
250 157 63
https://doi.org/10.5194/bg-2020-153Preprint. Discussion started: 2 June 2020c© Author(s) 2020. CC BY 4.0 License.
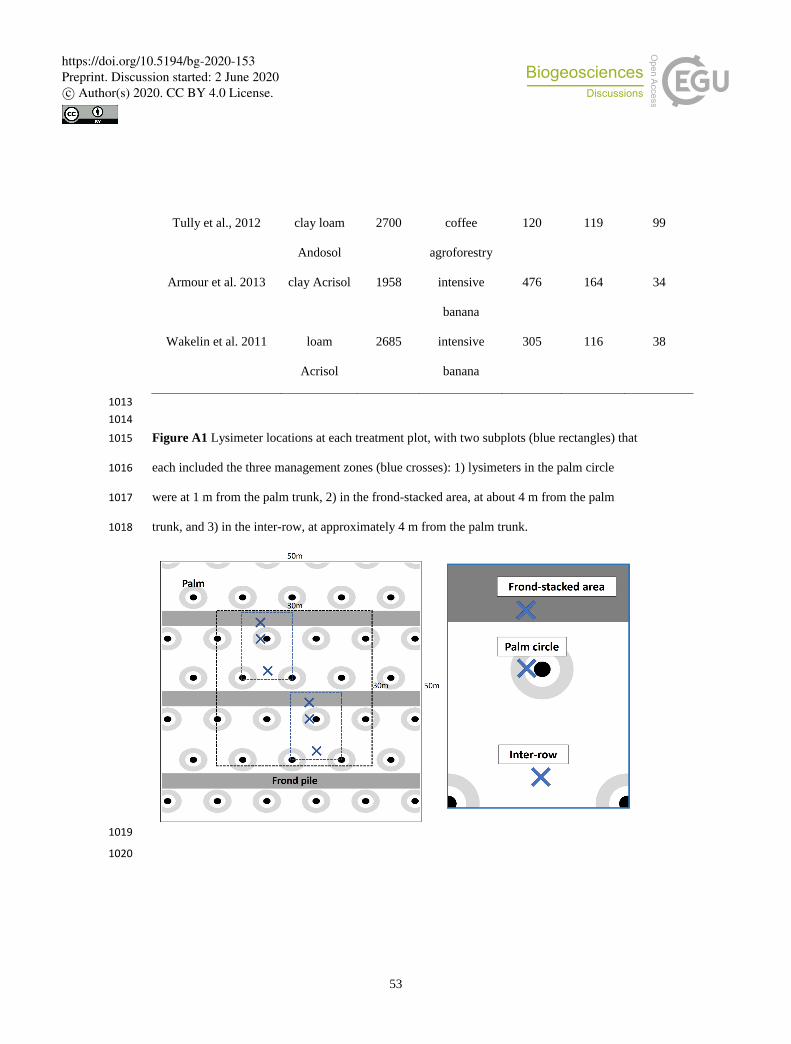
53
Tully et al., 2012 clay loam
Andosol
2700 coffee
agroforestry
120 119 99
Armour et al. 2013 clay Acrisol 1958 intensive
banana
476 164 34
Wakelin et al. 2011 loam
Acrisol
2685 intensive
banana
305 116 38
1013
1014
Figure A1 Lysimeter locations at each treatment plot, with two subplots (blue rectangles) that 1015
each included the three management zones (blue crosses): 1) lysimeters in the palm circle 1016
were at 1 m from the palm trunk, 2) in the frond-stacked area, at about 4 m from the palm 1017
trunk, and 3) in the inter-row, at approximately 4 m from the palm trunk. 1018
1019
1020
https://doi.org/10.5194/bg-2020-153Preprint. Discussion started: 2 June 2020c© Author(s) 2020. CC BY 4.0 License.