TOWN OF PALM BEACH, FLORIDA
494
TOWN OF PALM BEACH, FLORIDA COMPREHENSIVE ANNUAL BUDGET FISCAL YEAR 2018 (October 1, 2017 - September 30, 2018) Mayor and Town Council Gail L. Coniglio, Mayor Richard M. Kleid, Town Council President Danielle H. Moore, Town Council President Pro-Tem Julie Araskog, Town Council Member Bobbie Lindsay, Town Council Member Margaret Zeidman, Town Council Member Town Manager Thomas G. Bradford Prepared by the Finance Department Jane Struder, Finance Director (561) 838-5400 www.townofpalmbeach.com
-
Upload
khangminh22 -
Category
Documents
-
view
3 -
download
0
Transcript of TOWN OF PALM BEACH, FLORIDA

TOWN OF PALM BEACH, FLORIDA
COMPREHENSIVE ANNUAL BUDGET
FISCAL YEAR 2018(October 1, 2017 - September 30, 2018)
Mayor and Town Council
Gail L. Coniglio, MayorRichard M. Kleid, Town Council President
Danielle H. Moore, Town Council President Pro-TemJulie Araskog, Town Council Member
Bobbie Lindsay, Town Council MemberMargaret Zeidman, Town Council Member
Town Manager
Thomas G. Bradford
Prepared by the Finance DepartmentJane Struder, Finance Director
(561) 838-5400www.townofpalmbeach.com

TOWN OF PALM BEACHORGANIZATIONAL STRUCTURE
ELECT
APPOINTS
DIRECTOR OFPUBLIC SAFETY
Kirk W. Blouin
DIRECTOR OF RECREATION
Beth Zickar
DEPUTY TOWN MANAGER
Jay Boodheshwar
DIRECTOR OFHUMAN RESOURCES
Danielle Olson
DIRECTOR OF PUBLIC WORKS
H. Paul Brazil
DIRECTOR OF PLANNING, ZONING
AND BUILDINGJohn Page
CITIZENS OF PALM BEACH
TOWN ATTORNEY John C. Randolph
TOWN MANAGERThomas G. Bradford
ADVISORY BOARD AND COMMISSIONS
MAYORGail L. Coniglio
TOWN COUNCIL
PRESIDENTRichard M. Kleid
PRESIDENT PRO-TEMDanielle H. Moore Bobbie Lindsay
DIRECTOR OF FINANCEJane Struder
Margaret A. ZeidmanJulie Araskog
ii

Guide f or Readers FY2018
The following information might be helpful to the reader in finding information in the budget document for programs, services and financial information. The Town of Palm Beach Budget compiles financial and service delivery data in a single source document for easy reference. This guide explains the budget format and will assist in locating information which may be of particular interest. The budget is intended to serve four purposes.
THE BUDGET AS A POLICY DOCUMENT
As a policy document, the Budget indicates what services the Town of Palm Beach will provide during the upcoming fiscal year, and the reasons for these services. The Budget provides goals and objectives for each organizational unit in the Town of Palm Beach as well as the performance measures upon which programs will be monitored for the forthcoming fiscal year. All Town of Palm Beach funds are described in detail in their respective sections.
THE BUDGET AS AN OPERATIONS GUIDE
As an operations guide, the budget indicates how departments and funds are organized to provide services that will be delivered to the community. The Departments’ budget sections provide a mission statement, goals and objectives, organization chart, authorized personnel, revenue and expenditure summaries with descriptions, and performance measures for each Town of Palm Beach Department.
THE BUDGET AS A FINANCIAL PLAN
As a financial plan, the budget outlines the cost of the Town of Palm Beach services and how they will be funded. The Revenues and Expenditures Section provides an overview of the Budget including major revenue and expenditure breakdowns and categories for the following Funds: General, Debt Service, Capital, Enterprise, Internal Service Activity and Trust & Agency. The introductory section includes a budget message, Town-wide goals, demographic information, assessed value and millage rate information, Town history, a discussion of the Town of Palm Beach accounting structure and financial policies, a description of the budget preparation process and the financial structure. The budget summary section details the approved budget as well as a comparison of financial activity over a multi-year period with an analysis of the Town reserves.
THE BUDGET AS A COMMUNICATIONS DEVICE
The Budget is designed to be user friendly with summary information in text, charts, tables and graphs. A glossary of financial budget terms is included for your reference. In addition to the reader’s guide, the table of contents provides a listing of sections in the order in which they appear in this document. The statistical section includes miscellaneous information relevant to the Town of Palm Beach. Should you have a question about the Town of Palm Beach that this document does not answer, please feel free to call The Finance Department at (561) 838-5444. This Budget Document is available on the Town’s web site, www.townofpalmbeach.com.
iii

Guide f or Readers FY2018
A STEP BY STEP GUIDE
Given its size and the variety of information it contains, the budget document can be an overwhelming undertaking to review. The purpose of this section is to provide the reader with a guide to the document’s contents: where and how to find the information and how to understand or use the information.
The budget document has been prepared in a summary format intended to be easily understood by the general public. The following describes each of its major sections:
Introduction
The budget message or transmittal letter is the best place to start. It is most important in understanding where we have been and where we are going in the upcoming year. The letter provides a broad perspective of services provided and discusses taxes and millage rates, changes in operations, significant differences in revenues and expenditures, and the focus and direction of the budget year.
The introduction section also includes general information about the Town, its budget philosophy and process, financial policies (which form the foundation of the Town’s budget development and financial management processes), and other general information.
Budget Summary, General Fund, Revenues, Expenditures, Departmental Tabs and Other
The Budget Summary, General Fund, Revenues, Expenditures including Departmental and Other tabs include various presentations of the general fund budget. The Budget Summary section includes summary budget information for all funds and an analysis of Town reserves. The General Fund section includes a financial trend analysis of Revenues and Expenditures. The Revenues tab includes a detailed five-year general fund revenue history, as well as narrative and charts regarding major general fund revenue history. The Expenditures tab includes an exhibit containing four years of expenditure history by program, as well as summary budget charts.
An overview of each department/program, the largest portion of the General Fund budget, is included in this section. Each department’s section may include the following: A revenue and expenditure summary, personnel complements, an organizational chart, mission statement, goals and objectives, performance measures and workload indicators.
Debt Service, Capital, Enterprise, Internal Service and Trust & Agency Funds
These sections include budget summaries, program descriptions, trend analyses and income statement analyses for the Town’s governmental (other than general), enterprise, internal service and trust & agency funds.
Appendix
The appendix includes property tax and millage rate schedules, donation reserve account detail, financial policies, historical staffing levels, and other exhibits that may be helpful to the reader.
********************We sincerely hope this “how-to” has aided in finding and understanding information contained in the Town’s budget. If any point is unclear, or if additional information is necessary, please call the Finance Department at (561)838-5444. Should the same requests repeatedly occur, we will make an effort to incorporate clarifications in next year’s budget document.
iv

v

(This page intentionally left blank)
vi

Table of Contents FY2018
Introduction Budget Message ........................................................................................................................................... 1 Strategic Planning and Key Results Measurement .................................................................................... 18 Introductory Information Map ................................................................................................................................................ 27 Town Overview/Demographics ...................................................................................................... 28 Assessed Valuation and Millage Rate ........................................................................................... 29 Town History .................................................................................................................................. 33 Financial Policies ........................................................................................................................... 35 Budget Preparation Process .......................................................................................................... 40 Budget Calendar ............................................................................................................................ 45 Financial Structure ......................................................................................................................... 46 Long Term Financial Plan Forecast ............................................................................................... 51
Budget Summary Fund Budget Overview ................................................................................................................................ 65 Budget Summary by Fund Type, Revenues and Expenditures .................................................................. 66 Summary of Major Revenues by Fund Type .............................................................................................. 68 Summary of Expenditure Classifications by Fund Type ............................................................................. 70 Reserve Analysis ........................................................................................................................................ 73 Capital Expenditures ................................................................................................................................... 79
General Fund General Fund Revenues and Expenditures Budget Comparison ............................................................... 81
Revenues General Fund Revenues ............................................................................................................................. 83 Major Revenue Sources .............................................................................................................................. 87
Expenditures General Fund Expenditures ........................................................................................................................ 97
Legislative Legislative (111) ........................................................................................................................................ 102
General Government General Government (113) ....................................................................................................................... 104
Town Manager Town Manager’s Office Organization Chart .............................................................................................. 106 Administrative Management (121) ............................................................................................................ 108
Town Clerk Records Management (131) ..................................................................................................................... 112
Advice and Litigation Advice and Litigation (122)........................................................................................................................ 116
Information Technology Information Technology (125) ................................................................................................................... 118
Human Resources Human Resources Organization Chart ..................................................................................................... 124 Human Resources (123) ........................................................................................................................... 127
Finance Finance Organization Chart ...................................................................................................................... 134 Finance Department Revenue and Expenditure Summary ...................................................................... 136
vii

Table of Contents FY2018
Financial Management (141) .................................................................................................................... 138 Purchasing (144) ....................................................................................................................................... 142
Planning, Zoning and Building Planning, Zoning and Building Organization Chart ................................................................................... 146 Planning, Zoning and Building Department Revenue and Expenditure Summary ................................... 148 Planning and Zoning (211) ........................................................................................................................ 150 Permit Issuance (212) ............................................................................................................................... 154 Inspection and Compliance (213) ............................................................................................................. 157 Landmarks Preservation (214) .................................................................................................................. 159 Fire Prevention (215) ................................................................................................................................ 161 Code Enforcement (216) ........................................................................................................................... 163
Fire-Rescue Fire-Rescue Department Organization Chart ........................................................................................... 168 Fire-Rescue Department Revenue and Expenditure Summary ............................................................... 171 Fire Administration (411) ........................................................................................................................... 173 Operations (417) ....................................................................................................................................... 176 Training (418) ............................................................................................................................................ 180 Ocean Rescue (419) ................................................................................................................................. 182
Police Police Department Organization Chart ..................................................................................................... 186 Police Department Revenue and Expenditure Summary ......................................................................... 189 Administrative Management (421) ............................................................................................................ 191 Organized Crime Vice and Narcotics – OCVAN (422) ............................................................................. 195 Records Information System Unit (423) .................................................................................................... 197 Training and Community Relations Unit – TCR (424) .............................................................................. 199 Communications Unit (425) ....................................................................................................................... 203 Crime Scene/Evidence Unit (426) ............................................................................................................. 205 Patrol (428) ............................................................................................................................................... 207 Criminal Investigation Unit (429) ............................................................................................................... 212 Parking Control Unit (430) ......................................................................................................................... 214
Public Works Public Works Department Organization Chart .......................................................................................... 218 Public Works Department Revenue and Expenditure Summary .............................................................. 223 Administrative Management (511) ............................................................................................................ 225 Street Repair and Maintenance (521) ....................................................................................................... 227 Traffic Control (523) .................................................................................................................................. 229 Street Lighting (524) .................................................................................................................................. 231 Storm Sewer Maintenance (531) .............................................................................................................. 233 Sanitary Sewer Maintenance (532) ........................................................................................................... 236 Sanitary Sewage Treatment (533) ............................................................................................................ 239 Residential Collection (541) ...................................................................................................................... 240 Commercial Collection (542) ..................................................................................................................... 242 Refuse Disposal (543) ............................................................................................................................... 244 Yard Trash Collection (544) ...................................................................................................................... 245 Recycling (545) ......................................................................................................................................... 247 Beach Cleaning (546) ............................................................................................................................... 249 Landscape Maintenance (551) ................................................................................................................. 251 Facility Maintenance (554) ........................................................................................................................ 253 Meter Maintenance and Collection (558) .................................................................................................. 256 General Engineering Services (561) ......................................................................................................... 257 Right of Way Inspections (565) ................................................................................................................. 260 Equipment Operation and Maintenance (571) .......................................................................................... 262
viii

Table of Contents FY2018
Other Library Services (321) ............................................................................................................................... 266 Transfers to Other Funds (611 to 625) ..................................................................................................... 267 Emergency Management (710) ................................................................................................................ 268 Contingent Appropriations (711) ............................................................................................................... 269
Special Revenue Fund Town-wide Underground Utilities Fund ..................................................................................................... 271
Debt Service Debt Administration ................................................................................................................................... 275 2016A and 2013 Revenue Bonds (Fund 205) .......................................................................................... 280 2016B Worth Avenue Revenue Bond (Fund 206) .................................................................................... 281
Capital Funds Capital Funds ............................................................................................................................................ 283 Impact of Capital Investments on Operating Budget ................................................................................ 284 Capital Projects by Project Type and Fund ............................................................................................... 285 Capital Improvement Fund (Fund 307) Five Year Capital Improvement Pay-as-you-go/Facilities Program ............................................. 287 Pay-as-you-go Capital Improvement Fund .................................................................................. 288 Comprehensive Coastal Management Plan Bond Proceeds Construction Fund (Fund 309) CCMP FY16 Accomplishments and FY17 Action Plan ................................................................ 291 Comprehensive Coastal Management Project Fund ................................................................... 305 Coastal Management Program Budget ........................................................................................ 308 Worth Avenue Assessment District (Fund 311) Worth Avenue Maintenance ......................................................................................................... 309 Accelerated Capital Fund (Fund 314) 2013 Accelerated Capital Projects Fund...................................................................................... 311 Accelerated Capital Improvement Program Budget Report ......................................................... 312 Project Fact Sheets
West Palm Beach Shared Force Main Lining ................................................................. 313 Australian Avenue Sanitary Sewer Modifications ........................................................... 314 Debris Transfer Station Sanitary Pump Station Improvements (Construction) .............. 315 Sanitary Pump Station Improvements (Construction) ..................................................... 316 Sanitary Pump Station Improvements (Design) .............................................................. 319 The Breakers Sanitary Pump Station Improvements (Design) ....................................... 321 Royal Poinciana Way (South of S-2) Sanitary Pump Station Improvements (Design) ... 322 North End Paving and Drainage Improvements ............................................................. 323 North End Paving and Drainage Improvements – Onondaga Avenue ........................... 324 Lake Trail Improvements from Royal Palm Way to Reef Road ...................................... 325 La Puerta Way Drainage ................................................................................................. 326 Storm Drain Improvements Ibis Isle ............................................................................... 327 D-16 (Jungle Road) Stormwater Pump Station Improvements (Design) ........................ 328 D-18 (El Brillo Way) Stormwater Pump Station Improvements (Design) ........................ 329 D-4/D-6 Pump Station Improvements (Construction) ..................................................... 330 D-14 Pump Station Improvements .................................................................................. 331 400 Worth Avenue .......................................................................................................... 332 Ocean Outfall Abondonments ......................................................................................... 333 Landfill/Facility Improvements ......................................................................................... 334 Town Hall Square ............................................................................................................ 335 Sunrise/Sunset and North County Mast Arm Replacements/Upgrades ......................... 336 Clarke Avenue and Cocoanut Row Mast Arm Replacements/Upgrades ....................... 337 Pendleton Avenue and Cocoanut Row Mast Arm Replacements/Upgrades .................. 338 Seabreeze Avenue and Cocoanut Row Mast Arm Replacements/Upgrades ................ 339
ix
Table of Contents FY2018
Bradley Place Mast Arm Replacements/Upgrades ......................................................... 340 Town-wide Street Lighting Replacements (Less Bradley & Town Hall Square) ............. 341 Bradley Place – Royal Poinciana Way to Wells Road Street Lighting Replacements ... 342 Street Lighting Upgrades – South Ocean Boulevard, Sloan’s Curve to Lake Avenue ... 343
Recreation Enterprise Fund (Fund 403) Recreation Enterprise Fund Organization Chart ....................................................................................... 346 Recreation Enterprise Fund Revenue and Expenditure Summary ........................................................... 349 Marina ..................................................................................................................................................... 351 Golf Course ............................................................................................................................................... 356 Tennis ..................................................................................................................................................... 363 Recreation Center ..................................................................................................................................... 368 Administration ........................................................................................................................................... 373 Capital Program ........................................................................................................................................ 374 Five Year Capital Improvement Plan ........................................................................................................ 375 Depreciation Program ............................................................................................................................... 376 Equipment Replacement ........................................................................................................................... 377
Internal Service Funds Self Insurance – Risk
Self Insurance Fund – Risk Management (Fund 501) ................................................................. 379 Self Insurance – Health
Self Insurance Fund – Health Benefit (Fund 502) ....................................................................... 383 Equipment Replacement Fund Equipment Replacement Fund (Fund 320) .................................................................................. 385
Trust and Agency Funds Retirement Fund ....................................................................................................................................... 391 Employees Retirement System (Fund 600) Employees Retirement Fund ....................................................................................................... 399 Health Insurance Trust (Fund 610) Health Insurance Trust ................................................................................................................. 401
Retiree Sliding Scale Insurance Premium Rates 2017 ................................................................ 405
Appendix Authorized Positions ................................................................................................................................. 409 Donation Reserve Account Summary ....................................................................................................... 414 Financial Policies Fund Balance ............................................................................................................................... 415 Budgetary Control ........................................................................................................................ 421
Designation of General Fund Balance - Liability Related to Compensated Absences Leave Balances ..... 422 Contingency Reserve – General Fund ......................................................................................... 423 Reserve for Encumbrances, Continuing Appropriations, and Prepaid Expenses ....................... 424
Revenue Shortfall Plan ................................................................................................................ 425 Debt Management Policy ............................................................................................................. 427 Contingency Reserve – Capital Fund .......................................................................................... 428
Contingency Reserve – Equipment Replacement Fund .............................................................. 429 Equipment Replacement Reserve ............................................................................................... 430 Contingency Reserve – Recreation Enterprise Fund – Capital Fund .......................................... 431 Contingency Reserve – Recreation Enterprise Fund .................................................................. 432 Dock Replacement Reserve – Recreation Enterprise Fund ........................................................ 433 Equipment Replacement Reserve – Recreation Enterprise Fund ............................................... 434 Recreation Enterprise Fund – Maintenance and Improvement Reserves ................................... 435 Recreation Enterprise Fund Reserve ........................................................................................... 436
Contingency Reserve – Risk Fund .............................................................................................. 437 Reserve for Catastrophic Exposures/Emergencies – Risk Fund ................................................. 438
x

Table of Contents FY2018
Contingency Reserve – Health Insurance Fund .......................................................................... 439 Funding Policy for the Town of Palm Beach Retirement System ................................................ 440
Index Index…. ..................................................................................................................................................... 441
Glossary Glossary .................................................................................................................................................... 447
xi

(This page intentionally left blank)
xiixii

TOWN OF PALM BEACH BUDGET MESSAGE
Budget for Fiscal Year 2017-2018
OCTOBER 1, 2017
1

Budget Message Town of Palm Beach, Florida
October 1, 2017
Honorable Mayor and Town Council And Citizens of the Town of Palm Beach
I am pleased to submit this budget message, pursuant to the Town Charter, and to enable you to focus on the highlights of the proposed FY2018 budget.
The total proposed FY2018 town-wide budget including all funds is $249,285,005. The total proposed General Fund operating budget is $80,489,229.
The town-wide budget organized by fund type is as follows:
2

Budget Message FY18 Town-wide Goals
On April 13, 2017, the Town Council adopted Town manager goals for 2017 and 2018. These goals have been integrated into the FY18 budget. The approved goals are as follows:
1. Develop a proposed General Fund budget for FY18 that does not reduce servicelevels and is less than the Long Term Financial Plan (LTFP) General Fundassumptions for FY18. The FY18 budget excluding the extraordinary transfer to thepension fund is $176,337 less than the LTPF.
2. In conjunction with the Underground Utilities Task Force, develop arecommended financing plan and the associated initial assessment for theUnderground Utility Project. Hire the Underground Utilities Coordinator after theTown Council approves the project to facilitate better project areacommunications and monitoring of project milestones, budget and expendituresin conjunction with Public Works assigned staff project engineer. An undergroundutilities coordinator has been hired and project is underway. The financing plan hasbeen delayed by a lawsuit.
3. Develop and recommend a plan to improve enforcement of rules pertaining toconstruction related parking and related job site traffic impacts. Develop andimplement a computer/software based traffic management tool to be used bystaff to facilitate up-to-date data in the determination of ROW permit issuance toavoid conflicts in north/south roadway corridors, to facilitate the approvalprocess, and notification to the public of pending road closures and detours.Develop a matrix, listing “large” public and private construction projects,identifying traffic impacts on residents for each project and delineating if theproject is anticipated to impact an arterial roadway. Based upon final matrixcontent ascertain feasibility of modifying schedule of Town controlled projects tominimize traffic impacts. Review data and ascertain need for constructionmoratorium on Fridays when POTUS comes to Town for large projects defined asany project generating more than 10 trips per day. The FY18 budget includes anadditional .5 FTE to bring up a vacant right of way inspector from part time to fulltime for a total of 2 full time inspectors.
4. Compete Master Plan for the Town Docks, with budget, projected revenues andexpenses compared to existing budget, drawings, schedule for replacing dockswith state-of-art facility, with no marina amenities, and identify grant fundingsources and grant program funding amounts. Consider hiring marina expert tooversee process. Consultant has been hired to complete the master plan as well asa marina expert to oversee the process.
5. If the new Recreation Center is approved, develop a financing plan for the Town’sshare of the cost. The Recreation Center construction has been delayed due to alawsuit.
3

Budget Message FY18 Budget Presentation
Staff prepared the FY18 budget using Zero Line Item Budgeting. This method of budgeting did not start with last year’s budget. Rather, departments were given a blank budget request form for each line item, instead of last year’s budget or actual expenditures as the starting point – hence, the label of zero – line item is applied. Departments then rebuild their budgets from the ground up, justifying each line item. Where possible, departments were asked to provide the drivers of cost. However, not providing sufficient detail for an expenditure can be an invitation for increased scrutiny of the request.
Department requests and justifications were sent to the Finance Department and Town Manager's Office (Administration) who review them in a series of meetings with staff using the justifications, rather than what was spent last year, as the point of comparison. The budget program requests are often accompanied by a program description to gauge purpose and intended output for the program. The Administration considers the requests, further discusses them with departments as necessary, and then develops a final recommended budget. You or the public never see the process and the forms used. This year we shared these forms with the Town Council at the July 11th Special Town Council meeting so you could see the level of detail this work entails. The information can be found on our website in the preliminary budget document.
General Fund
Budget Highlights The millage rate has been reduced by 2.05% resulting in a $4 increase per million of value for homestead property owners. A Communication Specialist position has been included in the FY18 budget. Costs have been split between the General Fund, the Coastal Protection Fund and the Underground Utility Fund. The open part-time Right of Way Inspector position has been increased to a full time position. Offsetting revenue provided by an increase in building permit fees. Merit pay increases are included for all employees that are not at the top of their ranges and we have included an adjustment to the pay ranges of 2.5% these increases total $543,696. Health insurance costs have increased by 4.54% for the first time in 5 years. This will result in an increase to premiums that will be shared between the Town and our employees. The increase for the fund totaled $242,549. Estimated costs for POTUS and dignitary protection in FY18 of $226,980 have been included in the General Government section of the budget. We are using this program for these expenses in order to highlight them and track them separately from the Police Department expenditures. An extraordinary transfer to the Retirement Fund from the Town unassigned fund balance of $4,700,000 is included. Additional funds over and above the ARC for both FY17 and FY18 have been transferred and an additional $300,000 was transferred from the FY17 budget for a total transfer to the Retirement Fund UAAL of $5,420,000.
4

Budget Message
Revenues
The General Fund is the only fund to directly use property taxes as a revenue source. Property taxes (ad valorem taxes) represent the largest revenue source. Appearing on the following page is a millage rate table to help facilitate a discussion of where we are and what is proposed. The proposed FY18 millage rate of 3.2037 provides a $4 tax increase per million of value to homesteaded property owners, is a decrease of 2.05% from FY17.
Millage Rate Consideration
The State of Florida requires the Town to calculate a rolled-back millage rate. The rolled-back rate is defined as that millage rate which provides the same property tax revenue for each taxing authority as was levied during the previous year (exclusive of new construction, additions, rehabilitative improvements increasing assessed value by at least 100%, annexations, deletions). The adopted millage is 3.29% over the rolled back rate of 3.1018.
There are a number of revenue types in the General Fund. These are categorized in the table on the following page:
FY17 Millage Rate
FY18 Final Adopted
Millage Rate 3.2706 3.2037 Tax Revenue $49,374,406 $51,470,033
Millage % Increase/Decrease from FY17 n/a -2.05%
Homestead Value Increased by 2.1% $1,000,000 $1,021,000 Town Taxes $3,107 $3,111 Increase/(Decrease) over FY17 n/a $4
5

Budget Message
Significant highlights for General Fund revenues include:
Based upon the Property Appraiser's Preliminary Certification issued June 1,2017, existing property taxable values in the Town have risen 6.42% over theprior year.
The proposed budget reflects property tax revenues based on the millage rate of3.2037 which result in a $4 increase per million of value for homestead propertyowners.
Non Ad Valorem Taxes have increased due to the improved trend in water and gasutility tax revenue.
An increase in the Building permit fee is proposed to offset the cost of the additionalpositions for Right of Way inspector for the Communication specialist.
During the past year, the Departments conducted a thorough review of all of the feesassociated with their Departments. We also reviewed all fees that had not beenincreased in over 5 years. The fee increases are expected to generate $134,825 peryear and are reflected in the Licenses & Permits or Charges for Services category ofrevenues.
Charges for services have increased due to improved revenue collection for parkingmeters, an increase in the solid waste collection fees and the above mentioned feeincreases.
Fines and forfeiture revenue is declining due to improved compliance resulting infewer parking tickets.
Investment income revenue is declining due to the current interest rate environment. Miscellaneous revenue is increasing due to the expected increase in the Town’s DC
contribution forfeiture revenue based on the current level of forfeitures available
Revenue FY2017 FY2018FY17 vs. FY18
Difference%
ChangeAd Valorem Taxes 49,494,500$ 51,470,500$ 1,976,000$ 3.99%Non Ad Valorem Taxes 5,903,000 6,150,000 247,000 4.18%Licenses & Permits 9,503,500 9,947,975 444,475 4.68%Intergovernmental 1,178,500 1,185,450 6,950 0.59%Charges for Services 3,816,550 3,943,650 127,100 3.33%Fines and Forfeitures 1,255,646 1,138,800 (116,846) -9.31%Investment Earnings 704,339 581,858 (122,481) -17.39%Miscellaneous 345,112 420,000 74,888 21.70%Interfund Transfers 685,000 585,000 (100,000) -14.60%Transfers from unassigned fund balance for Extraordinary Transfer to Retirement Fund 2,500,000 3,500,000 1,000,000 40.00%Transfers from unassigned fund balance for Contingency and Compensated Absences 1,466,230 1,565,996 99,766 6.80% Total Revenues 76,852,377$ 80,489,229$ 3,636,852$ 4.73%
6

Budget Message from recent high turnover. This revenue is to be used to add to the transfer to the Retirement Fund to reduce the UAAL.
We are recommending a decrease of $100,000 in the transfer from the RecreationEnterprise Fund for the third year in a row. The revised transfer to the General Fundwill be $585,000. The Town Docks are planned to be replaced within the next 2 to 5years. We are annually accruing funds in the Dock Replacement Reserve, which afterthe FY17 accrual will total $3,710,480. The current annual accrual of $353,700 willnot be enough to have sufficient funds set aside to fund the estimated $10 to $12million cost. The budget proposal will decrease the transfer to the General Fund andincrease the annual accrual to the dock replacement fund to $453,700. The proposedaccrual will also bolster a revenue stream needed to fund debt service for the cost ofthe dock replacement in excess of the future Dock Replacement Reserve.
Expenditures
The General Fund expenditure breakdown by category is shown in the table below:
*The true total for FY18 is $5,059,016, and the remaining balance is included in the pensionbenefit amounts for FY17 and FY18.
For all departments of the Town, the overall increase in operating expenditures is 1.85% over FY17, after the extraordinary transfer to the Retirement fund the total expenditure budget increased 4.73% over FY17. Highlights of the General Fund expenditures changes are as follows:
The salary and wage increase is due to the following reasons:
• There are 1.5 proposed new positions included in the FY18 budget. The positionsinclude a proposed Communication Specialist to be charged to the General Fund,Coastal Protection Fund, and Underground Utility Project Fund and a .5 FTE to
Expenditure Category FY2017 FY2018FY17 vs. FY18
Difference%
ChangeSalary and Wages 24,737,579$ 26,001,862$ 1,264,283$ 5.11%Pension Benefits 8,774,323 9,527,616 753,293 8.59%Other Employee Benefits 8,135,225 7,844,571 (290,654) -3.57%Contractual 9,432,209 9,617,449 185,240 1.96%Commodities 1,810,844 1,949,093 138,249 7.63%Depreciation/Capital Outlay 2,694,682 2,459,607 (235,075) -8.72%Library 325,250 335,008 9,758 3.00%Other/Transfers 18,442,265 17,995,007 (447,258) -2.43% Subtotal Operating Expenditures 74,352,377 75,730,213 1,377,836 1.85%Extraordinary Transfer to Retirement Fund (*) 2,500,000 4,759,016 2,259,016 90.36% Total Expenditures 76,852,377$ 80,489,229$ 3,636,852$ 4.73%
7

Budget Message increase the part time vacant Right of Way inspector position in Public Works to a full time position.
• During FY17, three Firefighter Lieutenant positions were added when the Kelly dayfor the lieutenants was approved by the Town Council early in the fiscal year. Inaddition, at the June 13, 2017, Town Council meeting the firefighter’s union contractwas approved, and three additional firefighter positions were approved due to thechange in the Kelly day policy that was negotiated in the contract. The recentlyapproved firefighter union contractual pay increases were added to the proposedbudget. The additional costs for the Kelly day and contractual pay increases total$615,187.
• The budget includes merit pay increases for the employees not yet at the top of theirrange who have performed satisfactorily or above totaling $434,799, and a 2.5%adjustment to the pay ranges costing $108,897. The CPI index for All UrbanConsumers for the Miami-Ft. Lauderdale, FL Area (that area the Bureau of LaborStatistics says is applicable to the West Palm Beach – Boca Raton metro area)reflected a year over year increase in February of 3.95%. This increase helps ensurecompetitive salary ranges relative to our surrounding markets.
• Overtime funding for POTUS and dignitary visits has increased the salary and wagebudget by $204,000. We are including these expenses in the General Governmentsection of the budget so that the costs can be tracked separately and highlighted forat least the next 4 years.
The increase in total pension benefits of $753,293 is a combination of an increase in DB funding of $1,151,730 due in part to the smoothing of the lower returns in FY15 for the pension fund and additional funding for the changes in the mortality tables. The pension amount reflects the benefit changes for the general employees and lifeguard benefit changes that became effective May 1, 2017, and the union firefighters benefit changes that became effective August 12, 2017. Included in the pension amount are the savings that would have been generated if the town had paid out the 8% mandatory and discretionary DC contributions that were in place before the plan change. This “savings” amount totaled $123,202 and is an additional contribution into the Retirement Fund and is part of the $5,420,000 extraordinary contribution to the UAAL.
The DB pension increase was offset by reductions in the DC plan. The DC plan for union firefighters was eliminated with their benefit change and the Town’s DC costs for general employees and ocean rescue have decreased with their new benefit change. The DC reductions total $398,437.
Health insurance costs increased (4.5%) or ($242,549) for FY18 after 5 years without an increase. This will result in an increase to premiums that will be shared between the Town’s Health Insurance Reserve and Town employees.
8

Budget Message Contractual costs increased $185,240 due to increases in the IT budget for consulting assistance, improved internet access and additional software services described in the IT budget. Landscape and building maintenance costs increased.
Cost increases in commodities totaling $138,249 include uniform cost for the new firefighter positions, lockers for telecommunicators, patrol officer equipment and uniform items. In addition, travel and per diem costs were moved from the contractual area to the training costs under commodities to reflect a more accurate accounting for these costs.
Capital outlay decreased $235,075 due to purchases of new equipment made in FY17.
Coastal funding decreased $145,300 due to the elimination of two projects and the recent notice of grant funding available to the Town.
The transfer to the Capital Improvement Fund decreased $172,176 from FY17. The decrease is due to the transfer of projects from the Capital Improvement Fund to the Accelerated Capital Improvement Fund. Unspent bonded groin funds will be used for these projects.
The actuarially determined transfer to the OPEB trust fund decreased by $390,000 due to favorable investment and actuarial results in the fund.
Fund Balance
The General Fund Unassigned Fund Balance as of September 30, 2016 was $21,615,082. This amount was $5,415,788 above the policy required minimum. The FY18 budget includes a transfer of $655,877 from unassigned fund balance to fund the contingency reserve and $577,900 from the reserve for compensated absences to fund the compensated absence payouts. After the contingency transfer, the remaining balance in the unassigned fund balance will be $4,759,911.
A transfer of $3,832,893 from the General Fund unassigned fund balance to the Retirement Fund as a supplemental Town contribution to reduce the unfunded liability is included in the FY18 budget. This amount includes an amount equal to the contingency reduction that was funded from unassigned reserves and is part of the $5,420,000 extraordinary contribution. This transfer would represent the second year in a row that we were able to make an additional transfer to the Retirement Fund. In FY17 the transfer to the Retirement Fund from unassigned reserves was $2.5 million. The Town Council adopted a policy in October, 2017, to fund on an annual basis $5,420,000 over the required contribution to begin to pay down the UAAL. The policy caps the total retirement funding at $16 million per year.
9

Budget Message Personnel Complement
The total personnel complement (for all funds Townwide) for FY18 is 369.87 full-time equivalent personnel (FTEP), which is an increase of 7.0 FTEP from the adopted FY17 budget. The increase represents the addition of 3 firefighters and 3 lieutenants in Fire-Rescue, a underground utilities project coordinator, a communications specialists and ½ of a right of way inspector. These increases are offset by position changes in the Police Department including the elimination of a lieutenant position, the records systems manager, lead telecommunications supervisor and call-taker position offset by the addition of a Major, communications manager, .5 of telecommunicator. A chart of the FTEP by department is shown below:
OTHER FUNDS
Below are highlights from the budgets for other Town funds. Additional information can be found at the tabs in the back of the Budget Document behind the General Fund information. The Town’s other funds include: Special Revenue, Debt Service, Capital Improvement Funds, Recreation Enterprise Fund, Internal Service Funds (Health, Risk, Equipment Replacement), and Trust Funds (Pension and OPEB Trust).
Department/Fund FY14 FY15 FY16 FY17 FY18
Town Manager 5.10 5.10 5.00 8.00 8.00 Information Systems 6.00 8.00 8.00 8.00 8.00 Human Resources 4.38 4.63 5.13 5.03 5.03 Finance 18.14 18.64 18.56 15.56 15.56 Planning, Building & Zoning 26.25 27.25 28.25 28.25 28.25 Fire-Rescue 75.90 75.90 75.90 75.90 81.90 Police 103.35 103.35 103.35 103.35 101.85 Public Works 88.04 87.04 88.54 88.07 88.64 Recreation Enterprise Fund 26.71 26.04 27.55 25.30 25.23 Townwide Underground Fund 0.00 0.00 0.00 0.00 1.25 Coastal Management Fund 0.00 1.00 1.00 1.50 1.75 Risk Fund 1.00 1.00 1.16 1.16 1.66 Health Fund 0.79 0.79 0.97 1.01 1.01 OPEB Trust 0.73 0.73 0.90 0.95 .95 Retirement Fund 0.71 0.71 0.79 0.79 .79
Total Authorized Positions 357.10 360.18 365.09 362.87 369.87
10

Budget Message
Debt Service Funds (205, 206)
The Debt Service Funds provide for the payment of principal and interest on the Town’s outstanding bonds. During FY10, the Town authorized the issuance of $57,035,000 for a portion of the Town’s Accelerated Capital Improvement Program (ACIP) and refunding all of the Town’s existing debt. In addition, bonds totaling $14,770,000 were issued for the Worth Avenue Commercial District Project. On August 25, 2016, the Town issued bonds to refund the 2010A & 2010B bonds. This transaction produced gross savings of $8,900,539 over 23 years. The net present value savings was $6,895,965 or 13.35%.
In 2013, the Town issued $55,590,000 for the second phase of the ACIP, “bondable” coastal projects, and the Town’s portion of the Par 3 clubhouse project.
The Town’s outstanding debt as of September 30, 2017 is shown below:
As of September 30, 2017, the Town’s net bonded debt will amount to 13.2% of the legal limit of $845,575,941 (5% of preliminary FY18 taxable value of $16,911,518,815).
The 2016A and 2013 Series Revenue Bonds debt service is funded from non-ad valorem revenues. A portion of each ($198,263) is funded through the Recreation Enterprise Fund for the Town’s portion of the Par 3 golf course and clubhouse renovation, and a portion is funded through the Coastal Management Fund ($736,038). The non-ad valorem revenue transfer from the General Fund for FY18 is $5,982,332.
The 2016B Series Revenue Bonds debt service appropriation of $708,212 is funded through non ad valorem assessments on the property owners within the Worth Avenue Assessment District.
Year Issued
Outstanding Principal Balance September 30, 2017 Purpose
2010A $8,330,000 Remaining Balance on First Phase of ACIP Debt
2010B $960,000 Remaining Balance on Original Worth Ave Debt
2016A $39,320,000 First Phase of the ACIP and Refund Outstanding Debt
2016B $10,255,000 Worth Avenue Commercial District Project
2013 $52,770,000 Second Phase of ACIP, Bondable Coastal, and Par 3 Clubhouse
Total $111,635,000
11

Budget Message Capital Improvement Funds (307, 309, 311, 314)
For FY18, the following items totaling $2,721,450 are included in the Capital Improvement Fund (307):
• Pavement Management - $1,000,000• Water main improvements (WPB) - $800,000 (Funded by West Palm Beach)• Landfill site maintenance - $25,000• Facility improvements - $896,450
The transfer to the Capital Improvement Fund has decreased by $172,176.
Bonds funds in the ACIP II fund will be used to fund the remaining capital projects outlined in the ACIP II budget section of this document.
Coastal Management
The Coastal Management Fund (309) is used in part to fund the construction costs of the coastal projects. The details of the FY18 budget for Coastal Management can be found in the Annual Budget Document. This plan has been updated by Public Works to include estimates for future projects based upon current costs. The transfer to the Coastal Management Fund increased $145,300.
Recreation Enterprise Fund
The Recreation Enterprise Fund (REF) comprises all municipal recreation activities and facilities in the Town, including the Par 3 Golf Course, Seaview Park and Phipps Ocean Park Tennis Centers, the Recreation Center, and the Town Docks. The preparation of the budget was guided by the department mission of providing outstanding recreation programs, facilities and services which enrich and enhance the lives of its Palm Beach residents and visitors.
The 2018 spending plan is 2.27% lower than the FY2017 adopted budget, while revenue estimates are projected to increase by 7.85%. Continuous cost control measures will be incorporated into the operational efficiencies of each division, throughout the fiscal year, to ensure fiscally responsible decisions are made in an attempt to minimize expenses and improve upon established cost recovery goals.
Revenue
Tennis revenue projections are slightly higher for FY18. The restructuring of the tennis instruction contract and the assumption by the Town of the Pro Shop merchandise operation resulted in an increase in revenue. Fiscal year 2017 saw a significant growth in tennis instruction and pro shop net revenue. Growth in revenue from these sources are expected to continue to show modest increases for fiscal year 2018.
12

Budget Message Restructuring of the 12 Play Pass is anticipated to increase the tennis revenue stream. The previous 12 Play Pass was comprised of buy 10 daily pays and receive two free. The approved pass structure change to buy 12 daily plays, receive 1 free will produce an increase in revenue for daily play passes of 20% for each 12 Play Pass sold. In addition, revenue growth created as a result of the increase to the Maintenance and Improvement Fee is expected to show an increase of over 70%. Creative programming opportunities will also be explored in an effort to continue to grow participation.
Recreation Center revenue projections reflect the assumption of the current center remaining operational during the fiscal year. A change in this direction will result in a modification of the revenue estimations for fiscal year 2018. The revenue focus for the Recreation Center will remain on the implementation of new programs, revitalization of existing programs and the development of marketing strategies to raise awareness of program offerings. Projections for fiscal year 2018 anticipate a 2.48% increase in revenue.
Town Dock revenues are expected to increase in fiscal year 2018. This increase can be attributed to the creation of a separate reserve within the Recreation Enterprise Fund to fund the costs of non-routine maintenance and improvement (M&I) projects at the Town Docks. These funds could initially be used to supplement the Dock Replacement Reserve. Upon the completion of the dock replacement project, these funds could be utilized to support capital improvement projects and unanticipated maintenance projects necessary to keep the facility in exceptional condition. In addition, the elimination of seasonal leases, the establishment of a Utility Fee and the rise in the dockage rates are all factors in the projected revenue growth.
Golf Course revenue projections are expected to increase during FY18. The Golf Instructor contract was restructured in fiscal year 2017. This resulted in an increase in revenue of 9% from fiscal year 2016. It is anticipated that this revenue stream will continue to show positive growth. Fee changes for fiscal year 2018 include: the creation of a non-resident riding cart fee, which is $2.50 over the resident rate, the elimination of the guest/hotel rate for greens fees, increases to the non-resident (regular) rate for single, double and junior annual passes and an adjustment to the rental fee of pull carts to $7.00, regardless of season or 18/9 hole play. It is anticipated that these fee adjustments would generate revenue growth of over 15%.
Improvements being made at the Clubhouse, which include the installation of improved weather screening, are expected to heighten patronage at the on- site restaurant. This increase in restaurant patrons will positively impact revenue paid to the Town through the Food and Beverage Agreement. Additional creative revenue generating programs are currently being investigated for implementation during fiscal year 2018, this includes the launch of a new website, which would include an on-line store and the ability for residents to book tee times 30 days in advance.
13

Budget Message Expenditures
Increases in expenditures comes from increasing commodity prices, personnel costs and the desire to consistently improve operations and infrastructure. The staff take a thoughtful approach to all expenditures to ensure that these decisions are made in a fiscally responsible manner. The operating plan for fiscal year 2018 represents an overall decrease of 2.27% from the fiscal year 2017 budget.
The Administration Section proposed budget for fiscal year 2018 exhibits an increase in expenses due to the rise in personnel costs. This can be attributed to increases in salaries and wages and employee benefits. In addition, the cost for software maintenance is reflected in the Recreation/Administration budget for the first time this year. Previous years this cost had been absorbed within the budget of Information Technology. The Tennis Programs and Facilities expense budget will see a minimal budgetary decrease of .374%. The retirement of a long time tennis employee during fiscal year 2017, caused a reduction in our expenditures, within salaries and wages. The Recreation Center budget is projected to remain static for fiscal year 2018. Expenditures are being proposed utilizing the assumption of a 12 month operation for the current facility. The forward movement of the proposed new Recreation Center would result in a modification of this budget to reflect the reduction in operating costs. Budgeted funds within the Special Recreation Contracts account are directly related to the revenues credited to the youth and adult program fees. Increases to registration in programs will result in increased expenditures and conversely a decrease in registrations result in a reduction in expenditures. This is due to the structure of instructor program agreements, in which payment is based upon a percentage of revenue generated. Expenses in the Marina budget show a decrease in operating expenses. This is due to a reduction in anticipated expenses in Other Contracted Services from fiscal year 2017. During the budget development process for fiscal year 2017, it had been anticipated that alternate arrangements would need to be made for security services. Staff was able to positively resolve issues with the current firm, facilitating the continuation of the existing agreement. The estimation for electric service was budgeted at a level that was higher than necessary in fiscal year 2017. This account has been corrected, assisting in the reduction of the overall budget for fiscal year 2018. The Par 3 expenditure reduction can be attributed to the removal of expenses previously budgeted through the maintenance & improvement fund to the capital improvement program in fiscal year 2018.
Details regarding each of the programs of the REF can be found in the Recreation Enterprise Fund section of this document.
Internal Service Funds (501, 502, 320)
The transfer to the Risk Fund (501) has decreased by $9,562 (-.52%) from FY17 to FY18. The decrease is related to reductions in the fixed costs for liability and property insurance.
14

Budget Message The Health Insurance Fund (502) experienced an increase of 4.54%, or $242,549 which will be funded through an increase in employee contribution and reserves of the Health Fund.
The Equipment Replacement Fund (320) contains the accumulated depreciation of all fixed assets over the established thresholds of $2,500 for capital equipment and $1,500 for computer equipment. The annual depreciation transfer for FY18 is $2,276,600. This amount represents a decrease of $21,533. In FY18, the total expenditures for equipment purchases will be $2,980,896. A detailed listing of planned equipment purchases is located in the Internal Service Funds section of the Annual Budget Document.
Trust Funds – (600, 610)
Retirement (600)
The FY18 actuarially determined contribution to the DB plan is $9,320,235.
As mentioned earlier, an extraordinary transfer of $5,420,000 was approved by the Town Council to the Retirement Fund. A new policy was adopted that would require annual appropriations of the annual required contribution plus $5,420,000 to be capped at $16 million. The extraordinary contribution is made up of $4,759,016 from the General Fund budget including $3.5 million from reserves, excess contributions above the ARC totaling $360,984 and $300,000 from the FY17 budget DC savings and forfeiture revenue.
The Town annual contribution comparison for FY17 vs. FY18 is shown in the table below:
Town Retirement Contribution
Town Retirement Contributions FY2017 FY2018 Change % Change
General Employees DB $2,414,960 $2,997,898 $582,938 24.14%
Lifeguards DB 163,443 188,431 24,988 15.29%
Police DB 2,832,558 2,870,523 37,965 1.34%
Fire-Rescue DB 2,676,124 3,263,383 587,259 21.94%
Total DB Contribution $8,087,085 $9,320,235 1,233,150 15.25%
DC Contributions 1,029,957 $634,828 (395,129) -38.36%
Total Town DB And DC Contribution $9,117,042 $9,955,063 $838,021 9.19%
Based on recent pension changes, the Town no longer provides a DC plan for public safety employees. For General Employees and Lifeguards, the new plan was modified and now the Town contributes a mandatory match of 3% and an optional match of 2% to the Defined Contribution (DC) plan. Total employer contributions to the DC plan are shown in the chart below:
15

Budget Message Employer Defined Contribution Funding
Health Insurance (OPEB) Trust (610)
The actuarially determined transfer to the OPEB trust from the General Fund in the FY17 budget is $960,000. This amount is $379,000 (28.3%) less than FY16. The trust was established to account for and fund the liability for the Town’s share of retiree health benefits. The contributions are funded like pension benefits, taking into account the accrued cost for current employee benefits as well as the costs of retired employee benefits. The Town’s balance in the OPEB trust fund continues to be well ahead of other government agencies across the country.
Worth Avenue Special Assessment District
The budget for the Worth Avenue Special Assessment District is included in the Capital Funds and the Debt Service section of the budget document. The budget includes funding for maintenance and debt service. These costs are fully offset by the assessments charged to property owners within the district.
Inventory of Assets
The estimated inventory of parts, supplies, fuel and materials on hand as of October 1, 2017, was $349,706 and the total fixed asset inventory (which includes machinery, equipment, and vehicles with a value over $2,500 and computer equipment with a value over $1,500) was $22,119,264.
Financial Policies
The Town has 20 formally adopted financial policies. The establishment of specific reserve policies is an important part of prudent financial management and the practice is strongly recommended by the Government Finance Officers Association (GFOA) and the National Advisory Committee on State and Local Budgeting (NACSLB).
FY2014 Actual
FY2015 Actual
FY2016 Actual
FY2017 Budget
FY2018 Budget
General $699,122 $756,792 $817,696 $923,990 $626,050
Lifeguards 10,943 12,410 14,850 13,357 8,778
Police 265,191 294,148 287,545 0 0
Fire-Rescue 174,650 154,893 153,963 92,610 0
Total $1,149,906 $1,218,243 $1,274,054 $1,029,957 $634,828
16

Budget Message For FY18, The Town Council adopted a funding policy for the Town of Palm Beach Retirement System to ensure that additional funds will be appropriated in future budgets to reduce the Town’s Unfunded Actuarially Accrued Liability.
Copies of the Town’s financial policies can be found in the back of this document in the appendix.
Final Thoughts
I wish to acknowledge the efforts of Jane Struder, Director of Finance, Cheryl Somers, Assistant Director of Finance, Amy Wood, Accounting Supervisor, and Jay Boodheshwar, Deputy Town Manager for their efforts in compiling this document which was generated with the valuable input of each Department Director and their respective staffs.
Respectfully Submitted,
Thomas G. Bradford Town Manager
cc: Department Directors Jay Boodheshwar, Deputy Town Manager
17

Strategic Planning and Performance Measurement FY2018
Strategic Planning and Performance Measurement In 2003, the Town of Palm Beach developed and adopted a strategic plan. The development of the strategic plan involved input from elected officials, citizens, the business community, and staff. In conjunction with the Town’s strategic plan, staff developed an organizational vision statement which included input from all employees. Both the strategic plan and the vision statement, in addition to annually adopted Townwide goals, help us to form our department and program goals. Outlined in the following pages is a summary of our strategic plan, organizational vision, and departmental goals for FY18. Strategic Planning In 2001, the Town Council formed a Strategic Planning Board comprised of then Mayor Lesly Smith and four other Town residents. The board held a series of meetings and community forums to receive input from citizens, the business community, staff and others. The strategic plan was formally approved by the Town Council in 2003. The strategic plan is summarized below:
A Legacy Worth Keeping Palm Beach is a fully developed community, world renowned for its extraordinary beauty, quality of life, and small-town character. Our permanent and seasonal residents love our barrier island community and are determined to preserve our legacy. We do not seek to change Palm Beach, but rather to protect our community’s assets, correct any deficiencies, and to manage inevitable change so as to maintain our tradition of excellence. As we envision our future ten years from now, we see Palm Beach remaining true to the inspired legacy of our founders, a Mediterranean-style mecca of stunning architecture and natural beauty, acclaimed shopping, restaurants and hotels, a cosmopolitan culture, and an involved citizenry committed to civic and philanthropic causes and excellence in Town Government. Quality and Responsive Town Government Town government is supported by a respected Mayor and Town Council, a skilled and dedicated staff, and by the active volunteer participation of many citizens. Palm Beach provides residents with the highest level of safety and security through its vigilance and commitment to high quality training and state-of-the-art equipment. The Town has maintained its fiscal strengths with resourceful budgeting and prudent management.
18

Strategic Planning and Performance Measurement FY2018
In the future, we envision...
Continued high quality services and facilities provided in a responsive, resourceful manner. A structure of government guided by clear mandates and performance goals for Town administration and for appointed boards and commissions, continued technological innovation, and excellent internal and external communication.
Pro-active initiatives and continuous vigilance to anticipate and avert threats to public safety, enabling Palm Beachers to live secure in safe neighborhoods.
Solid fiscal strength and strong alliances with state and federal partners. Actions will be taken and communicated to residents to instill confidence that optimum services are provided for taxes paid.
Public Facilities and Infrastructure While completely developed, the Town of Palm Beach recognizes a number of redevelopment challenges and functional deficiencies among its current capital facilities. Traffic has increased and parking is at a premium. Beach erosion has become severe, threatening oceanfront property and diminishing a key scenic and recreational asset. Drainage deficiencies and occasional water shortages continue to pose a threat.
In the future we envision...
Beaches fully restored and maintained for the protection of oceanfront property, enjoyment of residents, and scenic enhancement.
Modernized, reliable infrastructure systems, including improved facilities for water distribution and storm drainage. Capital projects will be completed expeditiously and with an effort to limit the disruption they inevitably will cause to adjacent property owners.
Convenient network of roads and parking, less hampered by congestion and sufficient to meet local needs without encouraging additional traffic or visitation.
19
Strategic Planning and Performance Measurement FY2018
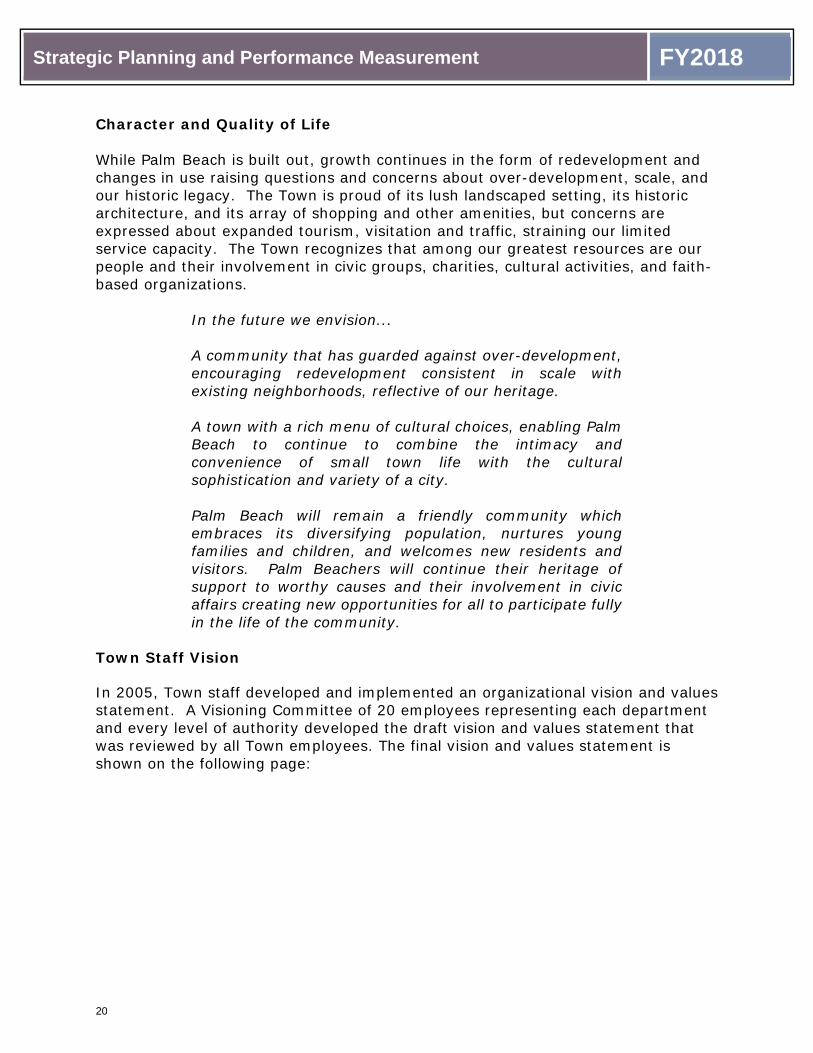
Character and Quality of Life While Palm Beach is built out, growth continues in the form of redevelopment and changes in use raising questions and concerns about over-development, scale, and our historic legacy. The Town is proud of its lush landscaped setting, its historic architecture, and its array of shopping and other amenities, but concerns are expressed about expanded tourism, visitation and traffic, straining our limited service capacity. The Town recognizes that among our greatest resources are our people and their involvement in civic groups, charities, cultural activities, and faith-based organizations.
In the future we envision...
A community that has guarded against over-development, encouraging redevelopment consistent in scale with existing neighborhoods, reflective of our heritage. A town with a rich menu of cultural choices, enabling Palm Beach to continue to combine the intimacy and convenience of small town life with the cultural sophistication and variety of a city.
Palm Beach will remain a friendly community which embraces its diversifying population, nurtures young families and children, and welcomes new residents and visitors. Palm Beachers will continue their heritage of support to worthy causes and their involvement in civic affairs creating new opportunities for all to participate fully in the life of the community.
Town Staff Vision In 2005, Town staff developed and implemented an organizational vision and values statement. A Visioning Committee of 20 employees representing each department and every level of authority developed the draft vision and values statement that was reviewed by all Town employees. The final vision and values statement is shown on the following page:
20
Strategic Planning and Performance Measurement FY2018
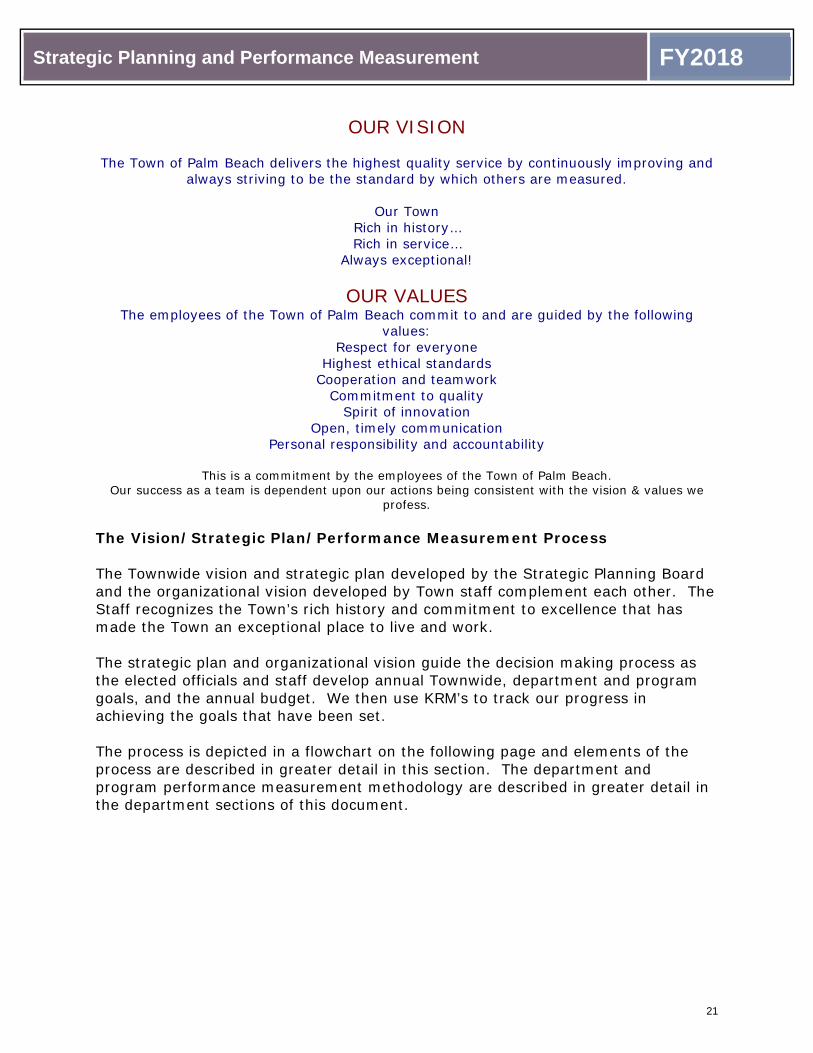
OUR VISION
The Town of Palm Beach delivers the highest quality service by continuously improving and always striving to be the standard by which others are measured.
Our Town
Rich in history… Rich in service…
Always exceptional!
OUR VALUES The employees of the Town of Palm Beach commit to and are guided by the following
values: Respect for everyone
Highest ethical standards Cooperation and teamwork
Commitment to quality Spirit of innovation
Open, timely communication Personal responsibility and accountability
This is a commitment by the employees of the Town of Palm Beach.
Our success as a team is dependent upon our actions being consistent with the vision & values we profess.
The Vision/Strategic Plan/Performance Measurement Process The Townwide vision and strategic plan developed by the Strategic Planning Board and the organizational vision developed by Town staff complement each other. The Staff recognizes the Town’s rich history and commitment to excellence that has made the Town an exceptional place to live and work. The strategic plan and organizational vision guide the decision making process as the elected officials and staff develop annual Townwide, department and program goals, and the annual budget. We then use KRM’s to track our progress in achieving the goals that have been set. The process is depicted in a flowchart on the following page and elements of the process are described in greater detail in this section. The department and program performance measurement methodology are described in greater detail in the department sections of this document.
21

Strategic Planning and Performance Measurement FY2018
The Vision/Strategic Plan/Goals and Performance Measurement Process
22

Strategic Planning and Performance Measurement FY2018
Townwide Budget Priorities for FY2018
The Town Council’s annual budget priorities for FY2018 are outlined below. These priorities were developed with input from the Mayor and Town Council, Town Manager, Department Directors, and staff. Once the Mayor and Town Council set the FY2018 priorities, the Departments developed goals and objectives that would accomplish the priorities. In addition, the Departments developed other major initiatives for the year. The Council priorities and Departmental goals will be reviewed on a continual basis throughout the fiscal year. The following is a breakdown of the Town Council Priorities, Town Manager goals and a listing of the departmental objectives that address the Council’s agenda. The table below shows the linkage between the Council’s priorities and the Department objectives that will be implemented during the year. A detailed listing of all departmental objectives and performance measurements can be found in the Department sections of this document.
Town Council Priority #1 Develop a proposed General Fund budget for FY18 that does not reduce service levels and is less than the Long Term Financial Plan (LTFP) General Fund assumptions for FY18.
Department Department Goals
Finance Work with the Town Manager and Directors to prepare a
budget that meets the Town Council goal.
Police Review FY2018 department budget and functions to achieve
possible cost savings and revenue sources for future budgets.
Town Council Priority #2 In conjunction with the Underground Utilities Task Force, develop a recommended financing plan and the associated initial assessment for the Underground Utility Project. Hire the Underground Utilities Coordinator after the Town Council approves the project to facilitate better project area communications and monitoring of project milestones, budget and expenditures in conjunction with Public Works assigned staff project engineer.
Department Department Goals
Finance
Work with the UUTF, consultants and the Town Council to prepare a cost effective and comprehensive financing plan for the underground utilities project.
23

Strategic Planning and Performance Measurement FY2018
Town Council Priority #3 Develop and recommend a plan to improve enforcement of rules pertaining to construction related parking and related job site traffic impacts. Develop and implement a computer/software based traffic management tool to be used by staff to facilitate up-to-date data in the determination of ROW permit issuance to avoid conflicts in north/south roadway corridors, to facilitate the approval process, and notification to the public of pending road closures and detours. Develop a matrix, listing “large” public and private construction projects, identifying traffic impacts on residents for each project and delineating if the project is anticipated to impact an arterial roadway. Based upon final matrix content ascertain feasibility of modifying schedule of Town controlled projects to minimize traffic impacts. Review data and ascertain need for construction moratorium on Fridays when POTUS comes to Town for large projects defined as any project generating more than 10 trips per day.
Department Department Goals
Fire-Rescue To monitor and mitigate any effects from heavy traffic caused
by all bridge closures, and/or Presidential visits.
Police
Monitor the allocation of resources to ensure the public’s safety, address traffic flow issues, and provide timely communications.
Public Works
Right-of-way maintenance and enforcement ensuring all Town right-of-ways are managed to meet the Town’s standards applicable to public rights-of-way and easements within the Town of Palm Beach.
Provide all necessary traffic control devices and markings to ensure safe pedestrian and vehicle operation.
Town Council Priority #4 Compete Master Plan for the Town Docks, with budget, projected revenues and expenses compared to existing budget, drawings, schedule for replacing docks with state-of-art facility, with no marina amenities, and identify grant funding sources and grant program funding amounts. Consider hiring marina expert to oversee process.
Recreation
Develop a strategic plan for changes in Town Recreation programs, services and facilities. Engage with patrons, parents, and community groups to incorporate feedback and ideas in programming services and facilities. Develop a public awareness plan for recreation programs. Prioritize recreation needs.
24

Strategic Planning and Performance Measurement FY2018
Town Council Priority #5 If the new Recreation Center is approved, develop a financing plan for the Town’s share of the cost. Recreation Develop a strategic plan for changes in Town Recreation
programs, services and facilities. Engage with patrons, parents, and community groups to incorporate feedback and ideas in programming services and facilities. Develop a public awareness plan for recreation programs. Prioritize recreation needs.
Finance Work with the Town Manager, Financial Advisors and staff to develop a low cost financing plan for the Town’s share of the cost.
Department Performance Measures The Town Departments have adopted goals and performance measures representing the most critical targets for their operations. The other department and program specific results are shown in the department section of the budget document.
25

(This page intentionally left blank)
26

Town of Palm Beach
Introductory Information


Location FY2018
Palm Beach is located on a barrier island east of West Palm Beach, Florida in Palm Beach County. The land area of the Town is approximately 3.77 square miles with 12.1 miles of coastline on the Atlantic Ocean. The Town is also bound on the west by 15.9 miles of Intracoastal frontage (Lake Worth), on the north by the Palm Beach Inlet, and on the south by the Town of South Palm Beach.
27

Town Overview/Demographics FY2018
DEMOGRAPHICS
Palm Beach at a Glance Date of Incorporation April 17, 1911 Form of Government Council/Manager Land Area 3.77 Square Miles FY2018 General Fund Budget $80.5 Million Taxable Property Valuation $16.9 Billion
Town of Palm Beach Demographics Population Service Statistics
2016 (Univ of Florida Est) 8,040 Police Stations 1 2015 (Univ of Florida Est) 2014 (Univ of Florida Est)
8,040 8,170
Fire-Rescue Stations 3
2013 (Univ of Florida Est) 8,168 Public Elementary School 1 2010 (Census) 8,161 Public Library 1 2000 9,676 Recreation Facilities 1990 9,814 Tennis Courts 14 1980 9,432 Par 3 Golf Course 1 1980 9,086 Marina (88 slips) 1 1960 6,055 Community Building 1 1950 3,886 Playfields 5
Bicycle Paths 9.3 miles Resident Statistics Picnic Tables 77
Median Age 67.6 yrs. Outdoors Grills 28 Avg. Household Size 1.74 Recreation Areas Median Home Value $924,100 Phipps Ocean Park 24 acres
Seaview Park 4.6 acres Neighborhood Parks
Racial Composition Bradley Park 4.5 acres Caucasian & Other Races 94.5% Kaplan Park .3 acres Hispanic/Latino 3.9% Special Use Parks African American .6% Public Park on Beach 3.0 acres Asian 1.0% Municipal Beach 5.60 acres
Peruvian/So. County Road .24 acres Bond Ratings Southern Blvd. Causeway 9.60 acres
2013/2016 Revenue Bond
Issuer’s Rating
Nature Islands 39 acres
Moody’s Aa1 AaaS&P AA+ AAA Registered Voters 7,785
28
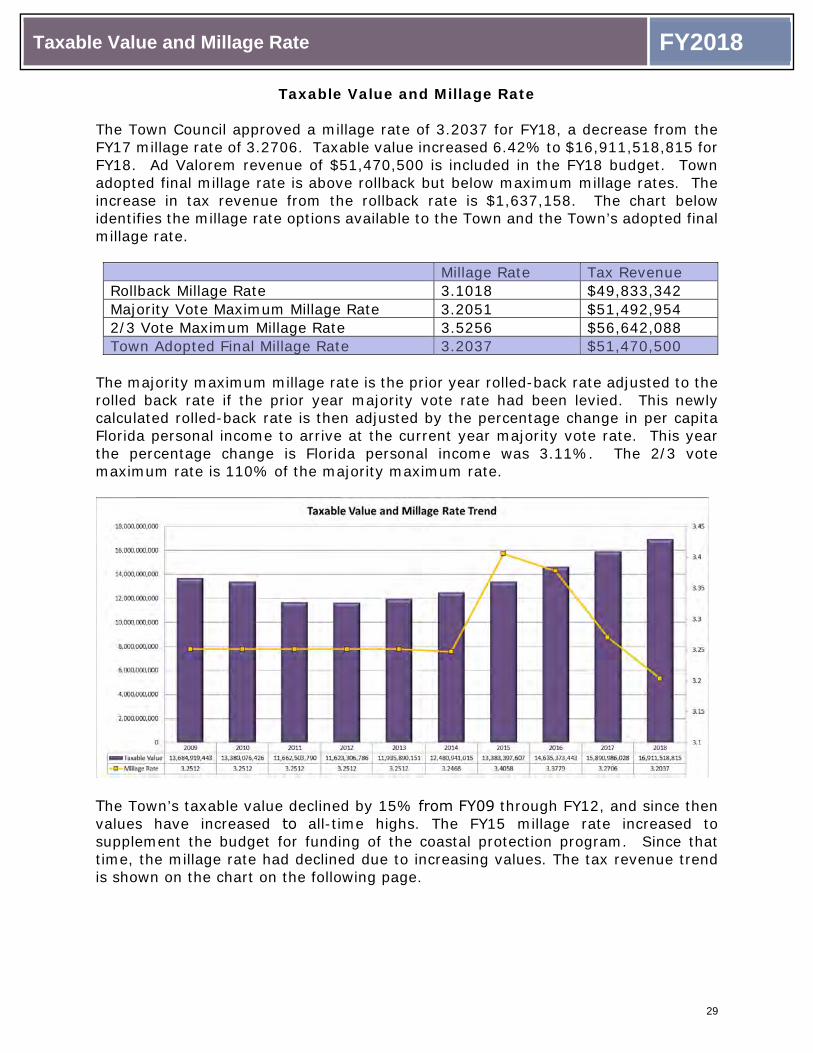
Taxable Value and Millage Rate FY2018
Taxable Value and Millage Rate
The Town Council approved a millage rate of 3.2037 for FY18, a decrease from the FY17 millage rate of 3.2706. Taxable value increased 6.42% to $16,911,518,815 for FY18. Ad Valorem revenue of $51,470,500 is included in the FY18 budget. Town adopted final millage rate is above rollback but below maximum millage rates. The increase in tax revenue from the rollback rate is $1,637,158. The chart below identifies the millage rate options available to the Town and the Town’s adopted final millage rate.
Millage Rate Tax Revenue Rollback Millage Rate 3.1018 $49,833,342 Majority Vote Maximum Millage Rate 3.2051 $51,492,954 2/3 Vote Maximum Millage Rate 3.5256 $56,642,088 Town Adopted Final Millage Rate 3.2037 $51,470,500
The majority maximum millage rate is the prior year rolled-back rate adjusted to the rolled back rate if the prior year majority vote rate had been levied. This newly calculated rolled-back rate is then adjusted by the percentage change in per capita Florida personal income to arrive at the current year majority vote rate. This year the percentage change is Florida personal income was 3.11%. The 2/3 vote maximum rate is 110% of the majority maximum rate.
The Town’s taxable value declined by 15% from FY09 through FY12, and since then values have increased to all-time highs. The FY15 millage rate increased to supplement the budget for funding of the coastal protection program. Since that time, the millage rate had declined due to increasing values. The tax revenue trend is shown on the chart on the following page.
29
mladd
Text Box
mladd
Text Box

Taxable Value and Millage Rate FY2018
The Town millage rate represents 19.23% of the total tax bill. The table below illustrates the difference between the FY17 vs. FY18 total tax bill by taxing district for a Palm Beach property owner with a taxable value of $1 million.
Impact on owner of $1 million property
The chart below shows the 10-year trend in millage rates for all taxing authorities.
FY17 FY18 FY18 Tax Change Per % of Total Taxing Authority Millage Rate Millage Rate $1 Million Value $1 million Value % Change Tax Bill
Palm Beach 3.2706 3.2037 $3,204 -$66.90 -2.05% 19.23%Palm Beach County 4.9142 4.9023 $4,902 -$11.90 -0.24% 29.43%Palm Beach County School District 7.0700 6.7690 $6,769 -$301.00 -4.26% 40.64%South Florida Water Mgmt 0.2836 0.2659 $266 -$17.70 -6.24% 1.60%Children Services 0.6833 0.6590 $659 -$24.30 -3.56% 3.96%Florida Inland Navigation 0.0320 0.0320 $32 $0.00 0.00% 0.19%Health Care District 0.8993 0.7808 $781 -$118.50 -13.18% 4.69%Everglades Construction 0.0471 0.0441 $44 -$3.00 -6.37% 0.26%Grand Total 17.2001 16.6568 $16,657 -$543.30 -3.16% 100.00%
30

Taxable Value and Millage Rate FY2018
The Town’s total millage rate is the second lowest in Palm Beach County as shown below.
Property Breakdown by Number of Parcels The Town has a total of 9,434 total parcels. Residential units total 8,879 or 94% of all parcels. Condominiums and Cooperatives represent the greatest percentage of total parcels in the Town at 68% or 6,372 parcels. Single family residential parcels are the second largest group at 2,303 parcels or 24% of the total. Commercial and industrial parcels total 400 and the balance is made up of multi-family, government, institutional and miscellaneous parcels. Properties with a Homestead exemption represent 35% of the total parcels in the Town. Property Breakdown by Taxable Value The taxable value of parcels in the Town totals $16.9 billion. Residential parcels represent 91% of the total value of parcels and single family residential represents 64% of the total value. Commercial and industrial properties represent 8% of the total value of parcels. Properties with a homestead exemption represent $6.5 billion (38.6%) of the total taxable value.
31

Taxable Value and Millage Rate FY2018
Historical Building Permit Detail During FY17, permit applications decreased from two historically high prior years. A total of 9,132 permits were issued in FY17, compared to 9,896 for FY16. Total permit valuation for FY17 was $238,640,151 compared to $289,645,824 in FY16. The decrease in permit activity in FY17, represents a slow-down in activity, but it is still much higher than it was in FY12 and prior. We expect the current levels to be maintained in FY18. The monthly trend for permit activity and permit valuation for the past five years is shown on the charts below.
32
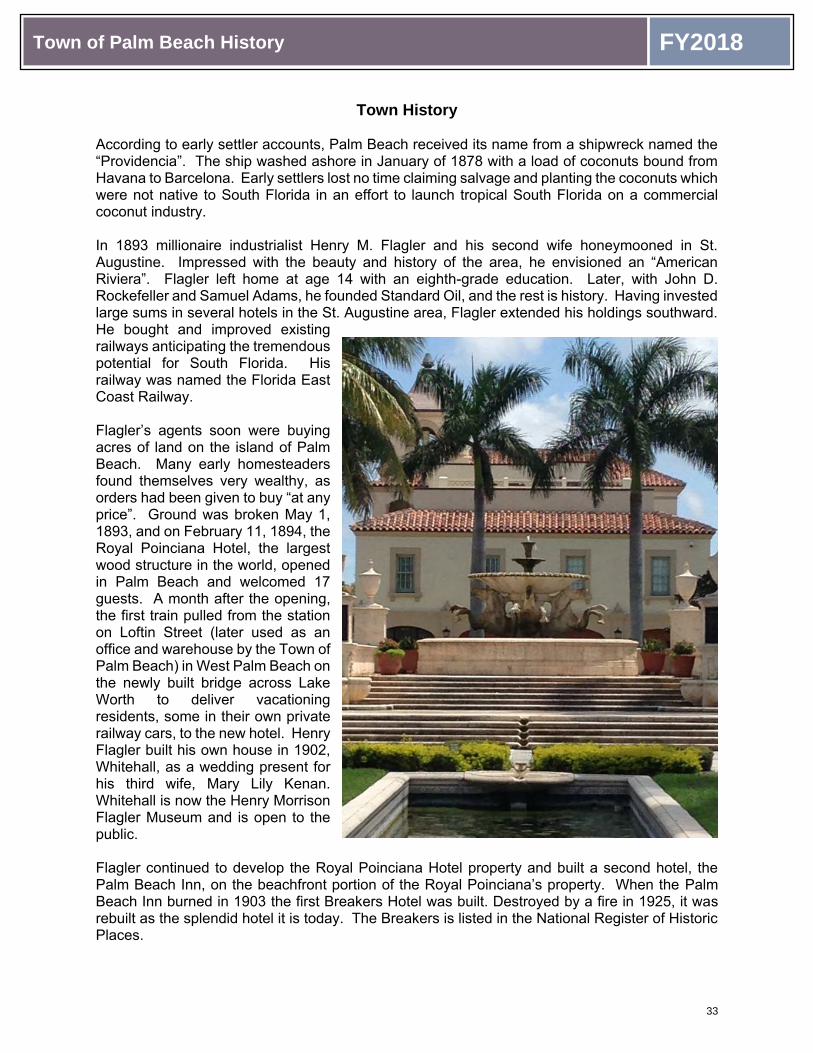
Town of Palm Beach History FY2018
Town History
According to early settler accounts, Palm Beach received its name from a shipwreck named the “Providencia”. The ship washed ashore in January of 1878 with a load of coconuts bound from Havana to Barcelona. Early settlers lost no time claiming salvage and planting the coconuts which were not native to South Florida in an effort to launch tropical South Florida on a commercial coconut industry.
In 1893 millionaire industrialist Henry M. Flagler and his second wife honeymooned in St. Augustine. Impressed with the beauty and history of the area, he envisioned an “American Riviera”. Flagler left home at age 14 with an eighth-grade education. Later, with John D. Rockefeller and Samuel Adams, he founded Standard Oil, and the rest is history. Having invested large sums in several hotels in the St. Augustine area, Flagler extended his holdings southward. He bought and improved existing railways anticipating the tremendous potential for South Florida. His railway was named the Florida East Coast Railway.
Flagler’s agents soon were buying acres of land on the island of Palm Beach. Many early homesteaders found themselves very wealthy, as orders had been given to buy “at any price”. Ground was broken May 1, 1893, and on February 11, 1894, the Royal Poinciana Hotel, the largest wood structure in the world, opened in Palm Beach and welcomed 17 guests. A month after the opening, the first train pulled from the station on Loftin Street (later used as an office and warehouse by the Town of Palm Beach) in West Palm Beach on the newly built bridge across Lake Worth to deliver vacationing residents, some in their own private railway cars, to the new hotel. Henry Flagler built his own house in 1902, Whitehall, as a wedding present for his third wife, Mary Lily Kenan. Whitehall is now the Henry Morrison Flagler Museum and is open to the public.
Flagler continued to develop the Royal Poinciana Hotel property and built a second hotel, the Palm Beach Inn, on the beachfront portion of the Royal Poinciana’s property. When the Palm Beach Inn burned in 1903 the first Breakers Hotel was built. Destroyed by a fire in 1925, it was rebuilt as the splendid hotel it is today. The Breakers is listed in the National Register of Historic Places.
33

Town of Palm Beach History FY2018
On April 17, 1911, a meeting of the registered and qualified voters of Palm Beach, Florida, was held at the Palm Beach Hotel for the purpose of incorporating the Town of Palm Beach. Thirty-four qualified voters voted to incorporate the Town.
In 1918, before the end of World War I, Addison Mizner, an established New York architect who was born in California and studied in Spain, accepted an invitation from Paris Singer to recuperate from a leg injury in Palm Beach. As Mizner’s health improved his boredom turned into creativity, and he transformed Singer’s bungalow into a Chinese villa. The conversion was a success, but Singer looked forward to a larger project. Having established two hospitals in France, Paris Singer decided to build a convalescent home in Palm Beach for service men returning from the war. The buildings were completed, but before the opening of the club house in January 1919, the “Touchstone Convalescent Club” had been transformed into the exclusive Everglades Club on Worth Avenue where it still is today. Mizner’s era had begun and was to continue along the southeast Florida coast through the 1920's.
The Town of Palm Beach soon began long range plans to develop and protect this island paradise, and the beauty which Town residents now enjoy is due to the efforts of several generations of planning activity. In 1929, the Garden Club of Palm Beach joined the Town and formally sponsored the preparation of a Town Plan. The overall goal of the 1929 Plan stated the following:
“One attractive and well managed public bath and beach, the concentration of general traffic upon a limited number of streets, beautification without especial reference to main arteries of travel, and a system of leisurely and convenient byways free from automobiles, punctuated with gardens: this is a plan which will localize recreation seeking crowds, discourage trespassing, and provide safety and quiet for residents of Palm Beach.”
Also included in the plan was the following statement:
“There are many communities which can be said to be beautiful. The places in which charm is the additional attribute are very few. The element of charm is the thing which lifts a community out of the ordinary and makes it distinctive. The attribute of charm may be produced by an intelligent development of physical advantages in an unusual way.”
Today’s Comprehensive Plan in Palm Beach builds on the early foundation as an effort to preserve the quality and beauty of Palm Beach.
The Town of Palm Beach had 7,785 registered voters in 2017, with approximately 8,160 full-time residents. The population swells to approximately 25,000 during “season,” which is from November to April. Residents and visitors enjoy the very best in dining, shopping, and luxurious surroundings. Shops on Worth Avenue attract visitors worldwide.
In 2011, the Town celebrated its Centennial with a season full of activities and events. A Centennial Commission was formed to engage with the community, residents and businesses alike, to identify ways to celebrate the 100th anniversary of the Town's incorporation on April 17, 2011.
34

Financial Policies FY2018
Financial Policies
The Town of Palm Beach financial policies, compiled below, set forth the basic framework for the overall financial management of the Town. These policies assist the Town Council’s decision-making process and provide guidelines for evaluating both current activities and proposals for future programs. Copies of Town Council adopted policies are located in the appendix section of this document.
General Policies
Annually prepare a budget, submit it to the Town Council for approval and publicly issue a budget document.
Identify costs and funding sources before recommending approval of capital and operating budgets.
Provide for sound financial planning, the best possible bond rating, funding of depreciation and adequate working capital in all funds.
Take measures to protect against catastrophic losses through a combination of insurance, funded self insurance, and cash reserves.
Follow the Town of Palm Beach Charter when preparing the Town’s budget.
Estimate and review the long-term costs associated with proposed new programs or services.
Assign all program costs as accurately as practical (including interfund transfers when necessary) utilizing intergovernmental service funds where indicated.
Annually review all existing programs to determine whether a recommendation to the Town Council to maintain, decrease, or increase service levels is appropriate.
Review annually all administrative policies governing accounting procedures, billing, purchasing, asset use and control, and risk management.
Annually appropriate additional funding policy for the Town of Palm Beach Employee Retirement Fund per policy.
Operating Budget Policies
Pay for all current year operating expenses with current year revenues and/or available fund balances.
Provide for adequate funding of all pension plans, as determined by the Town’s actuary.
35

Financial Policies FY2018
Make all purchases in an impartial, economical, efficient, and competitive manner, in accordance with all Federal, State and municipal laws and coordinated through the Purchasing Division.
The budget will be controlled at the program level within each department by the applicable department head. Budget amendment requests and transfers of funds between programs will originate from the applicable department head and the Finance Director and shall be subject to the approval of the Town Manager.
The Town Manager may authorize transfers between departments if the action is deemed necessary to meet the obligations of the Town.
Issue a Comprehensive Annual Budget Document after adoption.
Capital Budget Policies
Evaluate the relative merit of each capital project according to the Town Council’s goals and priorities.
Rely on internally generated funds and/or grants to finance its capital needs. Debt will be issued for a capital project only in the case of an emergency, or when inclusion of a project in the Town’s pay-as-you-go Capital program will preclude the construction of smaller necessary capital improvements.
Thoroughly evaluate and update the Capital Improvement Program on an annual basis providing detailed information regarding operational impacts.
Revenue Management Policies
Levy taxes to provide the desired level of service.
Annually review all revenue schedules, including taxes, rates, licenses, user fees, and other charges, to insure compliance with Town Council’s approved policies.
Maintain a diversified revenue base to help mitigate the effects of short-term fluctuations in any one revenue source.
Conservatively estimate annual revenues utilizing established industry standards along with historical trend information.
Annually review user fees for the Recreation Enterprise Fund and set same at a level that fully supports all direct and indirect costs of the fund.
Review new sources of revenue to fund operating and capital costs consistent with the Town Councils’ goals and priorities.
Investment Management Policies
Prepare a cash flow analysis of all funds on a regular basis. Disbursement, collection and deposit of all funds will be scheduled to insure cash availability.
36

Financial Policies FY2018
Deposit funds only in financial institutions which are insured by the Federal Deposit Insurance Corporation or are approved for full collateralization by the public deposit protection act or other state statutes.
Pool cash from all legally permitted funds for investment purposes.
Maximize the investment rate of return. Adhere to lawful investment options. Safety of the principal shall be the dominant requirement, followed by sufficient liquidity to meet operating requirements, and then yield.
Insure timely deposit of all collected revenues.
Debt Management Policies
Periodically approve the issuance of Debt Obligations on behalf of the Town to finance the construction or acquisition of infrastructure and other assets for the purpose of meeting its governmental obligations to its residents.
Approve the issuance of Debt Obligations to refund outstanding debt when market conditions indicate or for management considerations.
Assure that such Debt Obligations are issued and administered in such a manner as to ensure and sustain the long-term financial integrity of the Town, to achieve the highest possible credit rating and to preserve and enhance the quality of life, safety and welfare of its citizens.
Assure that such Debt Obligations shall not be issued or debt proceeds used to finance current operations of the Town except as provided herein.
Issue Debt Obligations if necessary to minimize the impact of construction or acquisition of infrastructure and other assets on the budget of the Town.
Consider long-term financing for the acquisition, maintenance, replacement, or expansion of physical assets (including land) only if they have an economic/useful life of at least five years.
Not issue debt for periods exceeding the useful life or average useful lives of the project or projects to be financed.
Normally rely on internally generated funds and/or grants to finance its capital needs. Debt will be issued for a capital project only in the case of an emergency, or when inclusion of a project in the Town’s pay-as-you-go capital program will preclude the construction of smaller necessary capital improvements.
Keep outstanding debt within the limits prescribed by Section 7.01 of the Town Charter.
Accounting, Auditing and Reporting Policies
Establish and maintain a high degree of accounting competency. Financial accounting and reporting will be done in accordance with methods prescribed by the
37

Financial Policies FY2018
Governmental Accounting Standards Board and the Government Finance Officers Association, or their equivalents.
Present monthly and annual reports to the Town Council summarizing financial activity.
Maintain financial systems to monitor expenditures, revenues and performance of all municipal programs on an ongoing basis.
Provide full disclosure in annual financial statements and bond representations.
Use an independent certified public accounting firm to perform an annual audit.
Publicly issue a Comprehensive Annual Financial Report.
Comply with all required reporting requirements related to bond issuance terms.
Reserve Policies
Maintain a contingency reserve in the General Fund equal to 1.0% of the proposed General Fund budget to address unexpected needs that occur throughout the year, subject to the formal affirmative vote of the Town Council.
Maintain a contingency reserve in the Capital Fund equal to 10% of the proposed Capital Fund budget to address unexpected needs that occur throughout the year, subject to the formal affirmative vote of the Town Council.
Maintain an assigned fund balance in the General Fund equal to a minimum of 25% of current year General Fund budgeted expenditures.
Maintain a contingency reserve for the Equipment Replacement Fund of $500,000 to address unexpected needs that occur throughout the year, subject to the formal affirmative vote of the Town Council.
Maintain a contingency reserve in the Recreation Enterprise Fund equal to 5% of the proposed Recreation Enterprise Fund operating expense budget to address unexpected needs that occur throughout the year, subject to the formal affirmative vote of the Town Council.
Maintain a contingency reserve for Recreation capital projects equal to 5% of the budget expenses to address unexpected needs that occur throughout the year, subject to the formal affirmative vote of the Town Council.
Maintain a contingency reserve in the Self-Insurance Risk Fund of $500,000 to address unexpected needs that occur throughout the year, subject to the formal affirmative vote of the Town Council.
Maintain a contingency reserve in the Self-Insurance Health Fund of $500,000 to address unanticipated expenditures and/or to meet unexpected increases in health insurance costs and claims exposure.
38

Financial Policies FY2018
Establish a reserve to designate fund balance in the amount equal to the Town’s unpaid obligations, unfinished projects and prepaid expenses that carry over from one fiscal year into the next.
Maintain minimum Net Asset levels equal to 25% of the proposed budgeted revenues in the Enterprise Fund.
Maintain a minimum reserve of $2,500,000 for the Risk Fund designated as a reserve for catastrophic exposures/emergencies.
Maintain a reserve for funding the replacement costs of General Fund existing equipment, vehicles, and computers when they reach the end of their useful lives. The reserve will be maintained at a rate of 100% of accumulated depreciation (calculated at replacement cost) of the existing equipment.
Maintain a reserve for funding the replacement costs of Recreation Fund existing equipment, vehicles, and computers when they reach the end of their useful lives. The reserve will be maintained at a rate of 100% of accumulated depreciation (calculated at replacement cost) of the existing equipment.
Maintain a reserve for funding a dock replacement fund. The reserve will be maintained at a rate of 100% of accumulated depreciation of the current docks.
Maintain a reserve for funding the maintenance and improvement projects for the Par 3 clubhouse and golf course, tennis centers and Town Docks.
Maintain a commitment of fund balance in the General Fund for payment of the liability related to compensated absences. This commitment will be funded at a rate of 100% of the fiscal year end accrued balance.
39

Budget Preparation Process FY2018
Budget Preparation Process
The accounting policies and reporting practices of the Town conform to generally accepted accounting principles as applicable to governments. The Governmental Accounting Standards Board (GASB) is the accepted standard-setting body for establishing governmental accounting and financial reporting principles. The following is a summary of significant policies and practices.
Financial Reporting Entity
For financial reporting purposes, management has defined the reporting entity in accordance with criteria set forth in generally accepted accounting principles. The basic criterion for including a potential component unit within the reporting entity is the governing body's ability to exercise oversight responsibility. The most significant manifestation of this ability is financial interdependency. Other manifestations of the ability to exercise oversight responsibility include, but are not limited to, the selection of governing authority, the designation of management, the ability to significantly influence operations, and accountability for fiscal matters. A second criterion used in evaluating potential component units is the scope of public service. Application of this criterion involves considering whether the activity benefits the government and/or its citizens, or whether the activity is conducted within the geographic boundaries of the government and is generally available to its citizens. A third criterion used to evaluate potential component units for inclusion or exclusion from the reporting entity is the existence of special financing relationships, regardless of whether the government is able to exercise oversight responsibilities. Based upon the application of these criteria, the following is a brief review of each potential component unit addressed in defining the Town's reporting entity.
Included within the reporting entity: The Town of Palm Beach Employees' Retirement System
The Town and the Systems’ participants are obligated to fund the costs based upon actuarial valuations. The Employee’s Retirement Board recommends and the Town Council is authorized to establish benefit levels and to approve the actuarial assumptions used in the determination of contribution levels.
Excluded from the reporting entity: East Central Regional Wastewater Treatment Facility ("Facility")
The Town participates in an interlocal agreement with Palm Beach County and the Cities of West Palm Beach, Riviera Beach and Lake Worth to provide wastewater treatment. The facility is governed by a Board of Directors comprised of one member from each participating entity. The Board of Directors has the authority to accept and disburse funds, approve an annual budget, transact business, enter into contracts and decide all other matters related to the Facility. The Town reimburses the Facility based upon usage and also provides funds for renewal and replacement costs. The Town does not exercise significant oversight responsibility nor can the Town significantly influence the Facility's operations and, therefore, the Facility has not been included as part of the reporting entity.
40

Budget Preparation Process FY2018
Basis of Accounting
Basis of accounting refers to when revenues and expenditures or expenses are recognized in the accounts and reported in the financial statements. Basis of accounting relates to the timing of the measurements made, regardless of the measurement focus applied.
All Governmental Funds are accounted for using the modified accrual basis of accounting. Their revenues are recognized in the period in which they become susceptible to accrual that is when they become measurable and available to pay liabilities of the current period.
Property taxes, utility and franchise taxes, intergovernmental revenues and charges for services are susceptible to accrual when collected in the current year or within sixty days subsequent to September 30th, provided that amounts received pertained to billings through the fiscal year just ended. Further, property taxes are recognized as revenue in the fiscal year for which they are levied. Investment earnings are recorded as earned since they are measurable and available. Permits, fines, forfeitures and contributions are not susceptible to accrual because, generally, they are not measurable until received in cash. Revenues collected in advance of the year to which they apply are recorded as deferred revenues.
Expenditures under the modified accrual basis of accounting are generally recognized when the related fund liability is incurred and expected to be liquidated with available resources. Exceptions to this general rule include principal and interest on general long-term debt which are recognized when due.
All Proprietary Fund types and the Pension and Nonexpendable Trust Funds are accounted for using the accrual basis of accounting. Revenue is recognized when earned, and expenses are recognized when they are incurred.
The Agency Funds are custodial in nature and do not involve measurement of results of operations. They are accounted for under the modified accrual basis of accounting. Assets and liabilities are recognized on the modified accrual basis.
Budget Basis
The budgets of general government type funds are prepared on a modified accrual basis. Briefly, this means that obligations of the Town are budgeted as expenses, but revenues are recognized only when they are actually received. Unencumbered appropriations lapse at fiscal year end.
The enterprise funds, on the other hand, are budgeted on a full accrual basis. Not only are expenditures recognized when a commitment is made but revenues are also recognized when they are obligated to the town.
The Comprehensive Annual Financial Report (CAFR) shows the status of the Town’s finances on the basis of “generally accepted accounting principles” (GAAP) and fund expenditures/revenues on both a GAAP basis and budget basis for comparison purposes.
41

Budget Preparation Process FY2018
Budgets and Budgetary Requirements
The Town follows these procedures in establishing the budgetary data reflected in the financial statements:
� Under the Laws of the State of Florida and the Town Code, prior to July 31, the Town Manager submits to the Mayor and Town Council a proposed Annual Budget and Financial Plan for the fiscal year, commencing the following October 1st. The Annual Budget and Financial Plan is prepared by fund, function and activity and includes proposed expenditures and the means of financing them.
� Two Public hearings are conducted to obtain taxpayer comments.
� Prior to October 1st, the budget is legally enacted by the Town Council through passage of a resolution.
� Encumbrance accounting, under which purchase orders, contracts, and other commitments for the expenditure of monies are recorded in order to reserve that portion of the applicable appropriation, is employed as an extension of formal budgetary control in the General Fund and Capital Projects Funds. On a Non-GAAP budgetary basis, encumbrances are recorded as expenditures of the current year. On a GAAP basis, encumbrances at year-end are reported as reservations of fund balance for subsequent-year expenditures.
� Budgets are adopted each fiscal year for the General, Debt Service, Capital Projects, Enterprise, Internal Service, and Trust Funds. Budgets are adopted on a basis consistent with generally accepted accounting principles except that budgetary comparisons for the General Fund and Capital Projects include encumbrances as expenditures.
� All annual unencumbered appropriations lapse at fiscal year end.
� Changes or amendments to the budgeted amounts at the fund level must be approved by Ordinance by the Town Council; however, changes within a function or activity may be approved at the administrative level.
Truth in Millage (Trim)
The budget and property tax rate adoption process is governed by the State Statute known as TRIM (truth in millage). In Florida, properties are assessed by the County Property Appraiser and property taxes are collected by the County Tax Collector. Property owners are eligible to receive a homestead exemption of $50,000 on their principal place of residence. All property is assessed at 85% of market value.
By State Law, the Town is required to hold two public hearings for adoption of a property tax rate and budget. The first public hearing is advertised by the Property Appraiser's mailing to each property owner a TRIM notice. In addition to notification of this first public hearing the TRIM notice contains the following information:
� The new assessed value and the assessed value for the prior year and any exemptions on the property;
� The prior year property taxes;
42

Budget Preparation Process FY2018
� The tax bill if the rolled-back rate is levied for the new year (the rolled-back rate is that property tax rate which would derive the same amount of revenue based on the new assessed values as was raised in the prior year at the old assessed values); and
� The property tax bill if the proposed budget is adopted.
The second public hearing is advertised by means of a newspaper advertisement which must be published not more than 5 days but not less than 2 days prior to the second public hearing. Accompanying this advertisement is a summary of the revenues and expenditures contained within the budget tentatively approved at the first public hearing.
43

Flow Cha rt of Budget Process FY2018
Flow Chart of Budget Process
44

FY20
18 B
udge
t Cal
enda
r Ta
sk
Date
Ta
sk
Date
Fi
nanc
e to
dis
trib
ute
FY18
Bud
get i
nstr
uctio
ns
03/0
6/20
17
Tow
n M
anag
er’s
Revi
ew o
f Tow
n M
anag
er, R
isk
Insu
ranc
e, a
nd F
inan
ce a
nd E
RF B
udge
ts
05/3
1/20
17
Tow
n Co
unci
l Mee
ting
– A
dopt
ion
of th
e To
wn
Man
ager
’s G
oals
for
FY18
03
/14/
2017
Pr
oper
ty A
ppra
iser
Issu
es P
relim
inar
y Pr
oper
ty V
alue
s 06
/1/2
017
Subm
it in
itial
CIP
Req
uest
form
s to
Publ
ic W
orks
03
/17/
2017
Fi
nal B
udge
t Doc
umen
t Pag
es R
etur
ned
to F
inan
ce
06/9
/201
7
Tow
n Co
unci
l Mee
ting
– D
iscu
ssio
n of
FY1
8 Bu
dget
Pla
n an
d LT
FP
TBD
Tow
n M
anag
er’s
Addi
tiona
l Rev
iew
of D
epar
tmen
t Bud
gets
(As
Nee
ded)
- T
own
Man
ager
re
view
of R
even
ue E
stim
ates
with
Fin
ance
Dir
ecto
r Ju
ne 2
017
CIP
Requ
est f
orm
s and
Bud
get I
nfor
mat
ion
subm
itted
to F
inan
ce
04/1
7/20
17
Not
ice
from
Pro
pert
y Ap
prai
ser o
f Pre
limin
ary
Cert
ifica
tion
of T
axab
le V
alue
06
/30/
2017
Tow
n M
anag
er’s
Revi
ew o
f IT
Budg
et
04/1
9/20
17
Dist
ribu
tion
of P
ropo
sed
FY18
Bud
get D
ocum
ent
Wee
k of
July
3
Tow
n M
anag
er’s
Revi
ew o
f Fir
e-Re
scue
Bud
get a
nd P
olic
e Bu
dget
s 04
/20/
2017
To
wn
Coun
cil M
eeti
ng to
Con
side
r Pr
opos
ed F
Y18
Budg
et a
nd In
itia
l Res
olut
ions
(s)
Adop
ting
Spe
cial
Non
-Ad
Valo
rem
Ass
essm
ents
07
/11/
2017
Tow
n M
anag
er’s
Revi
ew o
f Rec
reat
ion
Ente
rpri
se F
und
Budg
et
04/2
5/20
17
Not
ice
of P
ropo
sed
Prop
erty
Tax
es is
mai
led
from
Pal
m B
each
Pro
pert
y Ap
prai
ser
Wee
k of
Aug
ust 1
4
Tow
n M
anag
er’s
Revi
ew o
f Pla
nnin
g, Z
onin
g an
d Bu
ildin
g Bu
dget
05
/18/
2017
To
wn
Coun
cil M
eeti
ng –
Fir
st P
ublic
Hea
ring
to A
ppro
ve T
enta
tive
Bud
get a
nd
Prop
osed
Tax
Rat
e fo
r FY
18 a
nd F
inal
Res
olut
ion(
s) A
dopt
ing
Spec
ial N
on-A
d Va
lore
m A
sses
smen
ts
09/1
9/20
17
5:01
PM
Tow
n M
anag
er’s
Revi
ew o
f Pu
blic
Wor
ks, C
apita
l, an
d Co
asta
l Bud
gets
05
/16/
2017
GF
5/23
/17-
CIP/
Co
asta
l To
wn
Coun
cil M
eeti
ng –
Sec
ond
Publ
ic H
eari
ng to
Ado
pt F
Y18
Budg
et a
nd T
ax R
ate
10/0
4/20
17
5:01
PM
Tow
n M
anag
er’s
Revi
ew o
f Hum
an R
esou
rces
Bud
get (
Hea
lth a
nd O
PEB)
05
/24/
2017
Re
solu
tion
Adop
ting
Fina
l Mill
age
Rate
is F
orw
arde
d to
Pro
pert
y Ap
prai
ser a
nd T
ax
Colle
ctor
and
Cer
tific
ate
of C
ompl
ianc
e se
nt to
Dep
artm
ent o
f Rev
enue
10
/04/
2017
Janu
ary
2017
S
M
T W
TH
F
S 1
2 3
4 5
6 7
8 9
10
11
12
13
14
15
16
17
18
19
20
21
22
23
24
25
26
27
28
29
30
31
Febr
uary
201
7 S
M
T W
TH
F
S 1
2 3
4 5
6 7
8 9
10
11
12
13
14
15
16
17
18
19
20
21
22
23
24
25
26
27
28
Mar
ch 2
017
S M
T
W
TH
F S
1 2
3 4
5 6
7 8
9 10
11
12
13
14
15
16
17
18
19
20
21
22
23
24
25
26
27
28
29
31
31
Apri
l 201
7 S
M
T W
TH
F
S 1 2
3 4
5 6
7 8
9 10
11
12
13
14
15
16
17
18
19
20
21
22
23
24
25
26
27
28
29
30
May
201
7 S
M
T W
TH
F
S 1
2 3
4 5
6 7
8 9
10
11
12
13
14
15
16
17
18
19
20
21
22
23
24
25
26
27
28
29
30
31
June
201
7 S
M
T W
TH
F
S 1
2 3
4 5
6 7
8 9
10
11
12
13
14
15
16
17
18
19
20
21
22
23
24
25
26
27
28
29
30
July
201
7 S
M
T W
TH
F
S
1 2
3 4
5 6
7 8
9 10
11
12
13
14
15
16
17
18
19
20
21
22
23
24
25
26
27
28
29
30
31
Augu
st 2
017
S M
T
W
TH
F S
1 2
3 4
5 6
7 8
9 10
11
12
13
14
15
16
17
18
19
20
21
22
23
24
25
26
27
28
29
30
31
Sept
embe
r 201
7 S
M
T W
TH
F
S 1
2 3
4 5
6 7
8 9
10
11
12
13
14
15
16
17
18
19
20
21
22
23
24
25
26
27
28
29
30
Octo
ber 2
017
S M
T
W
TH
F S
1 2
3 4
5 6
7 8
9 10
11
12
13
14
15
16
17
18
19
20
21
22
23
24
25
26
27
28
29
30
31
Nov
embe
r 201
7 S
M
T W
TH
F
S 1
2 3
4 5
6 7
8 9
10
11
12
13
14
15
16
17
18
19
20
21
22
23
24
25
26
27
28
29
30
Dece
mbe
r 201
7 S
M
T W
TH
F
S 1
2 3
4 5
6 7
8 9
10
11
12
13
14
15
16
17
18
19
20
21
22
23
24
25
26
27
28
29
30
31
45

Financial Structure FY2018
Description of Funds and Fund Types For accounting purposes a state or local government is not treated as a single, integral entity. Rather, a government is viewed instead as a collection of smaller, separate entities known as “funds”. The Governmental Accounting Standards Board’s (GASB) Codification of Governmental Accounting and Financial Reporting Standards (Codification), Section 1300, defines a fund as:
A fiscal and accounting entity with a self-balancing set of accounts recording cash and other financial resources, together with all related liabilities and residual equities or balances, and changes therein, which are segregated for the purpose of carrying on specific activities or attaining certain objectives in accordance with special regulations, restrictions, or limitations.
All of the funds used by a government must be classified into one of seven “fund types.” Four of these fund types are used to account for a state or local government’s “governmental-type” activities and are known as “governmental funds”. Two of these fund types are used to account for a government’s “business-type” activities and are known as “proprietary funds”. Finally, the seventh fund type is reserved for a government’s “fiduciary activities”. Governmental Funds Four fund types are used to account for governmental-type activities. These are the general fund, special revenue funds, debt service funds, and capital projects funds. General Fund (Major) The General Fund is used to account for most of the day-to-day operations of the Town, which are financed from property taxes, fees, licenses, permits, fines and forfeitures, intergovernmental and other general revenue. There can only be one general fund. Activities financed by the General Fund include the following: General Government
Includes expenditures for Compensated Absences and other Town-wide items. Legislative Includes expenditures for the Mayor and Town Council.
Town Manager The budget of the Town Manager includes expenditures for administrative expenses relating to the Town Manager’s Office, Advice and Litigation expenses for the Town Attorney and outside counsel, Information Technology and the Town Clerk’s Office. In FY17, the Town Clerk’s Office became a division of the Town Manager’s Office. The Town Clerk’s Office is responsible for the records of the Town as well as conducting elections held within the Town. The Department also processes permits for charitable solicitations, special events, commercial motion picture-making, going-out-of-business sales, and door-to-door solicitations.
Human Resources The Human Resources Department is responsible for the recruitment, screening, and selection of employees to serve the Town. The Department is also responsible for
46

Financial Structure FY2018
employee benefits administration and compensation analysis. The Town’s Occupational Health Clinic is operated under this Department. The Human Resources Director is also the Plan Administrator for the Town’s General Employee Retirement System.
Finance The Finance Department is responsible for the administration, development and monitoring of the operating and capital budgets, preparation of the comprehensive financial reports, investments, debt management, cash management, and the maintenance of accurate financial reporting systems to meet all of the Town needs. The Department also is responsible for the operation and management of the purchasing, payroll and accounts payable functions. Planning, Zoning and Building The Planning, Zoning and Building Department is responsible for zoning changes and the issuance of permits for building, mechanical, plumbing, electrical, gas, energy, and coastal construction. The Department also assists residents, businesses, and the construction industry in code compliance. The Department strives to preserve the aesthetic, historical, and economic values of Palm Beach.
Fire-Rescue The Fire-Rescue Department provides fire suppression, fire prevention education, rescue and emergency medical care and ocean rescue functions to the citizens and visitors to the Town. The Department conducts education programs on injury, heart attack and stroke prevention.
Police The Police Department is responsible for the prevention of crime, preservation of peace, enforcement of laws and ordinances. This is accomplished through the patrol services, organized crime, vice and narcotics (OCVAN), crime scene/evidence, parking control enforcement and communications.
Public Works The Public Works Department is responsible for the repair, maintenance, and cleaning of streets within the Town, the maintenance of storm sewers and sanitary sewers, the collection and disposal of residential and commercial garbage and yard trash, beach cleaning, the maintenance of the Town parks and buildings, coastal management, and providing the general engineering services for the Town.
Other
Under this classification are expenditures relating to the Four Arts Library, disaster response expenditures and contingent appropriations.
Transfers to other Funds This classification includes transfers to the capital, risk insurance, OPEB Trust, and debt service funds.
Special Revenue Funds Special Revenue Funds are used to account for revenues derived from specific taxes or other earmarked revenue sources which, by law, are designated to finance particular functions or activities of government and which therefore cannot be diverted to other uses. The Town has the following special revenue funds for which an annual budget is not adopted:
47

Financial Structure FY2018
(101) State Forfeiture Fund (Nonmajor) - Accounts for State confiscated property through the Police Department per Florida State Statutes Section 932.
(102) Federal Forfeiture Fund (Nonmajor) - Accounts for federally confiscated property
through the Police Department. An annual report is submitted to the United States Department of Justice by November 30th of each year.
(103) Donations Fund (Nonmajor) - The Town of Palm Beach receives substantial
donations each year from its residents. Most donations are earmarked for specific departments and/or purposes.
(110) Grant Fund (Nonmajor) – Accounts for grants received by the Town. (120) Underground Utility Assessment Fund (Nonmajor) – Accounts for assessment
projects relating to undergrounding utilities in various assessment areas in the Town. (121) Special Assessment Maintenance Fund (Nonmajor) – Accounts for the non-
capitalized expenses related to the assessment districts.
The Town has the following special revenue fund for which an annual budget is adopted:
(122) Town-wide Undergrounding of Utilities Project Fund (Major) – Accounts for undergrounding utilities town-wide for all areas not previously completed.
Debt Service Funds (Nonmajor) The Debt Service Funds are used to account for the payment of interest and principal on general and special obligation debts other than those payable from special assessments and debt issued for and serviced by a governmental enterprise. The sources of revenues in these funds are transfer of non-ad valorem revenue from the General Fund and transfers of assessment revenue from the Worth Avenue Assessment Area Improvement Fund.
(205) Revenue Bond Series 2010A and 2013 – This fund accounts for the debt service for the accelerated capital improvement program.
(206) Revenue Bond Series 2010B – This fund accounts for the debt service for the Worth Avenue Special Assessment District Construction Project.
Capital Projects Funds The Capital Projects Funds account for all resources used for the acquisition and/or construction of capital infrastructure by the Town except those financed by Enterprise and Internal Service Funds. The sources of revenue in these funds are revenue bonds, transfers from other funds and grants.
(307) Capital Improvement Fund (Nonmajor) - This fund accounts for various construction projects undertaken by the Town. Any unexpended amounts at fiscal year- end, are rolled over to the new fiscal year. A five year Capital plan is presented during the budget process, of which only the first year is adopted by the Town Council. This fund is financed on a pay-as-you go basis from the General Fund.
(309) Comprehensive Coastal Management Plan (CCMP) Construction Fund (Major) - This fund was created during Fiscal Year 2000 to account for the Beach Restoration Project construction costs financed with proceeds from the 2000 Revenue Bond.
48

Financial Structure FY2018
(311) Worth Avenue Assessment Area Improvement Fund (Nonmajor) - This fund was created during Fiscal Year 2010 to account for pre-construction and ongoing maintenance costs for Worth Avenue Improvements.
(314) 2013 Accelerated Capital Fund (Major) – This fund was established with the proceeds from the 2013 Bond Issue for the second phase of the Accelerated Capital Improvement Program.
Proprietary Funds Two fund types are used to account for a government’s business-type activities (activities that receive a significant portion of their funding through user fees). These are the enterprise funds and the internal service funds. Enterprise Funds Enterprise Funds are used to account for operations that are financed and operated in a manner similar to private business enterprises; where the intent of the government’s board is that the costs of providing goods and services to the general public on a continuing basis are financed or recovered primarily through user charges; or where the government’s board has decided that periodic determination of net income is appropriate for accountability purposes.
(403) Recreation Enterprise Fund - This fund was created in FY2004 and comprises of all recreation activities in the Town. These include: Golf, Tennis, Recreation activities and Marina services. The fund also includes capital projects and the equipment replacement program for the enterprise fund.
Internal Service Funds Internal Service Funds are used to account for the financing of goods or services provided by one department or agency of a government to other department or agencies on a cost reimbursement basis. Accounting for Internal Service Funds as a proprietary fund type is designed to accumulate the total cost (including depreciation) of providing a particular service. Costs for services are reimbursed by the departments or agencies to which the services are provided.
(501) Risk Management Self Insurance Fund - This fund was established to account for the Town’s Property, Liability and Worker’s Compensation Insurance costs. Monthly funding transfers are made from the General Fund to the Risk Fund.
(502) Health Insurance Self Insurance Fund - This fund was established to account for
the Town’s health insurance costs which include medical, dental, life, long-term disability accidental death/dismemberment and supplemental life insurance. Monthly funding transfers are made from the General Fund to the Health Fund.
(320) Equipment Replacement Fund - This reserve was established to fund the
replacement cost of existing equipment, vehicles and computers when they reach the end of their useful lives. The reserve has significantly reduced the budgetary fluctuations due to purchases of equipment and established the fixed asset inventory and depreciation schedule required by GASB 34.
Fiduciary Funds These funds are used when a government holds or manages financial resources in an agent or fiduciary capacity. This single type is subdivided into four “sub-fund types” to account for various types of fiduciary obligations. These are the pension trust fund, nonexpendable trust fund, expendable trust fund, and agency funds.
49

Financial Structure FY2018
Pension Trust Funds Pension trust funds are used when governments manage pension plans. The sources of revenues in these funds are transfers from other funds, interest earnings and employee contributions.
(600) Employees Retirement Fund - This fund accounts for the Town’s defined benefit retirement program for General, Lifeguard, Police Officers and Firefighter employees.
(610) Other Post Employment Benefits (OPEB) Trust Fund - This fund was established
by Ordinance 9-06 to fund the portion of health care benefits paid by the Town for retirees.
Non-Expendable and Expendable Trust Funds These consist of resources received from non-Town sources and held by the Town as trustee to be expended or invested in accordance with the conditions of the trust. In a non-expendable trust, the government typically is only permitted to spend the investment earnings and not the assets. The Town does not have non-expendable and expendable trust funds at the present time. Agency Funds Trust funds typically involve some degree of financial management. Agency funds are used when the government plays a more limited role by just collecting funds on behalf of a third party. The Town does not have an Agency Fund at the present time.
50

Town of Palm Beach
Long Term Financial Plan


Forecast Summary FY2018
General Fund Long Term Financial Plan Forecast
Financial forecasts are the foundation of a long term financial plan. These forecasts provide the Mayor, Town Council and staff with information they need to more effectively determine future levels of service and methods of funding. This forecast of General Fund revenues and expenditures includes the FY17 budget and a 9 year forecast through FY26. This forecast was used to prepare the FY18 budget. It will be updated with FY18 budget amounts and used to prepare the FY19 budgets. Assumptions The forecast for the first 2 - 4 years is based upon recent trends and specific expectations. The forecast for the remaining years is less tactical and more mathematical, and is based primarily upon estimates by actuaries and long term inflation expectations. The major assumptions that were used to prepare the forecast are as follows:
FY18 FY19 FY20 FY21 FY22 FY23 FY24 FY25 FY26
Ad Valorem Tax Increase 3.25% 3.25% 3.25% 3.25% 3.25% 3.25% 3.25% 3.25% 3.25%
General Inflation 2.1% 2.1% 2.1% 2.1% 2.1% 2.1% 2.1% 2.1% 2.1%
Salaries & Wages 1.5% 2.9% 1.0% 2.0% 2.0% 3.3% 3.5% 3.5% 3.5%
Health Insurance 7.0% 6.5% 6.5% 6.5% 6.5% 6.5% 6.5% 6.5% 6.5%
Pension 8.9% 8.0% 8.6% 6.9% 2.3% 2.6% 2.4% 2.4% 2.4%
Other Employee Benefits 4.7% 4.4% 3.5% 4.0% 4.8% 5.2% 5.1% 5.2% 5.2%
Property Insurance 5.0% 5.0% 5.0% 5.0% 5.0% 5.0% 5.0% 5.0% 5.0%
Liability Insurance 5.0% 5.0% 5.0% 5.0% 5.0% 5.0% 5.0% 5.0% 5.0%
W/C Insurance 3.0% 3.0% 3.0% 3.0% 3.0% 3.0% 3.0% 3.0% 3.0%
Revenue forecasts are based upon historical trends and recent activity. To be conservative, the ad valorem tax increase is projected at 3.25% per year rather than estimate the increase in taxable value. Each revenue category forecast is described in greater detail later in this section. The assumption for inflation of 2.1% is based upon the forecast in the Livingston Survey issued by the Federal Reserve Bank of Philadelphia, this estimate for the rate of inflation has remained constant since the 2013 forecast. The salary and wage assumption is based upon the average annual increases for all employee groups and forecasted retirements. The health insurance forecast assumption is based upon input from our health consultant’s actuary. The pension forecast assumption was updated by the Town’s pension actuary. The other employee benefit assumptions have been calculated based upon anticipated retirements and other inflation factors and does not include health insurance. Property, Liability and Workmen’s Compensation insurance assumptions are based upon information received from our brokers regarding potential increases.
51

Forecast Summary FY2018
2017 Forecast The forecast charts shown on the following pages include a comparison the forecasts prepared in 2015 and 2016 to the current 2017 forecast. In recent years, staff and the Town Council have been able to make major reductions in expenditures and to slow future growth to sustainable levels. The 2017 forecast shows steady progress with meeting the Town’s needs and funding coastal projection and capital projects.
General Fund Revenue Forecast
The forecast for revenues is conservative and should allow for minor fluctuations in various revenue sources. The forecast details for each major revenue category are included in this analysis.
Property Tax Revenue Rather than using a complex formula anticipating taxable value and personal income growth, we forecast the increase in ad valorem revenues based upon a basic percentage increase estimate. The 2017 forecast includes the FY17 budget plus a 9 year forecast. Property tax revenues in FY17 increased by 5.01%. Over the past 5 years, taxable value has increased by 33% an average of 6.54% per year. We increased the forecast slightly since FY15, due to the recent trends in taxable value increases.
52

Forecast Summary FY2018
Non Ad Valorem Taxes Non ad valorem taxes include local option gas taxes, franchise fees and utility service taxes. The forecast for 2016 and 2017 has declined because recent revenue collections have not been as high as had been anticipated in recent forecasts. The forecast trend chart is shown below:
53

Forecast Summary FY2018
License and Permit Revenue License and permit revenue includes business licenses, building permit revenues and parking permits. FY15 was a record year for permit revenue and FY16 revenues remained at high levels, but did not meet the levels of FY15. The FY17 forecast shows a conservative revenue forecast for 2018 and beyond that more closely aligns with actual receipts. The forecast is lower in 2016 and growth in the near future is relatively flat.
Intergovernmental Revenue Intergovernmental revenue includes revenue received from Federal, State, County and local government sources. Revenues from the State of Florida include State revenue sharing, local government sales tax and alcoholic beverage licenses. Local revenues include County occupational license revenue, and the 911 reimbursement from Palm Beach County. Federal and State grants are also included in this category.
54

Forecast Summary FY2018
The forecast for intergovernmental revenues has remained flat based on revenues received from the State of Florida for sales tax and revenue sharing. The FY17 budget contains anticipated grant funds, but the forecast does not plan for any grant revenue. The forecast anticipates a small inflationary increase per year in the State revenues. Charges for Services Charges for services include public safety fees, solid waste fees, parking meter collections and other small fees such as copy charges and lien searches. The forecast for these revenues decreased in 2015 due to lower public safety revenues and solid waste collection revenues. The forecast for 2016 and 2017 reflects slight increases in these revenue sources.
55

Forecast Summary FY2018
Fines and Forfeitures Fine and Forfeiture revenue includes traffic violation fines and penalties, parking fines and penalties and code enforcement violation fines. Revenues from these sources have decreased since the 2016 forecast. Parking ticket fines and moving violation revenue have decreased and the 2017 forecast has been adjusted to reflect the recent actual activity. The downward trend in these revenues reflect improved parking compliance.
Investment Income We are forecasting investment returns will increase in FY18 from FY17 budget levels and gradually improve through the forecast period. Recent increases in rates over the long term should have a positive impact on revenues. In the short term certain bond funds may experience market losses. The Investment Advisory Committee and our investment consultants are monitoring the situation closely and will adjust the duration of the portfolios as required to mitigate the losses.
56

Forecast Summary FY2018
Miscellaneous and Transfers Miscellaneous revenue includes rents and royalties, the sale of fixed assets and other revenue. Transfers include transfers from the Recreation Enterprise Fund. The decrease in the 2016 and 2017 forecast is due to the termination of a lease for a cellular tower and anticipated decreases in the transfer from the Recreation Enterprise Fund. The Recreation Enterprise Fund transfer to the General Fund will decrease through 2020 and instead the funds will be directed to the Dock Replacement Fund to reduce the amount of borrowing for this project.
57

Forecast Summary FY2018
Total General Fund Expenditures The 2016 forecast reflects increases in pension costs and the transfer to the CIP fund. The 2017 forecast is slightly less than the 2016 forecast in total. Changes in the forecast by category are described in the balance of this section.
Salary and Wages The forecasted salary and wage increases are based upon the employee pay policies and replacements of retirees at lower salaries through the forecast period. The salary and wage assumption is based upon the average annual increases for all employee groups and forecasted retirements. Since the high in 2007 Town staffing has decreased by 52.36 FTEP. A combination of actions (changing pay policies, reducing staffing, etc.) has improved the salary forecast significantly. The 2016 forecast for salaries is lower than 2015 due to the retirement of 20 employees. There has been very little change in the 2017 forecast.
58

Forecast Summary FY2018
Pension Benefits The pension estimate is based upon the actuary’s estimates for pension costs.
The Town’s Retirement Board recommended a change in the investment assumption from 7.5% to 7.0% over a 5-year period. This change will require additional funding for the pension plan. The higher amounts of increase through 2021 are based on the .1% annual reductions to the investment assumption. The updated forecast also reflects changes in the wage assumption and the new mortality tables. The FY17 budget included the changes to the public safety
59
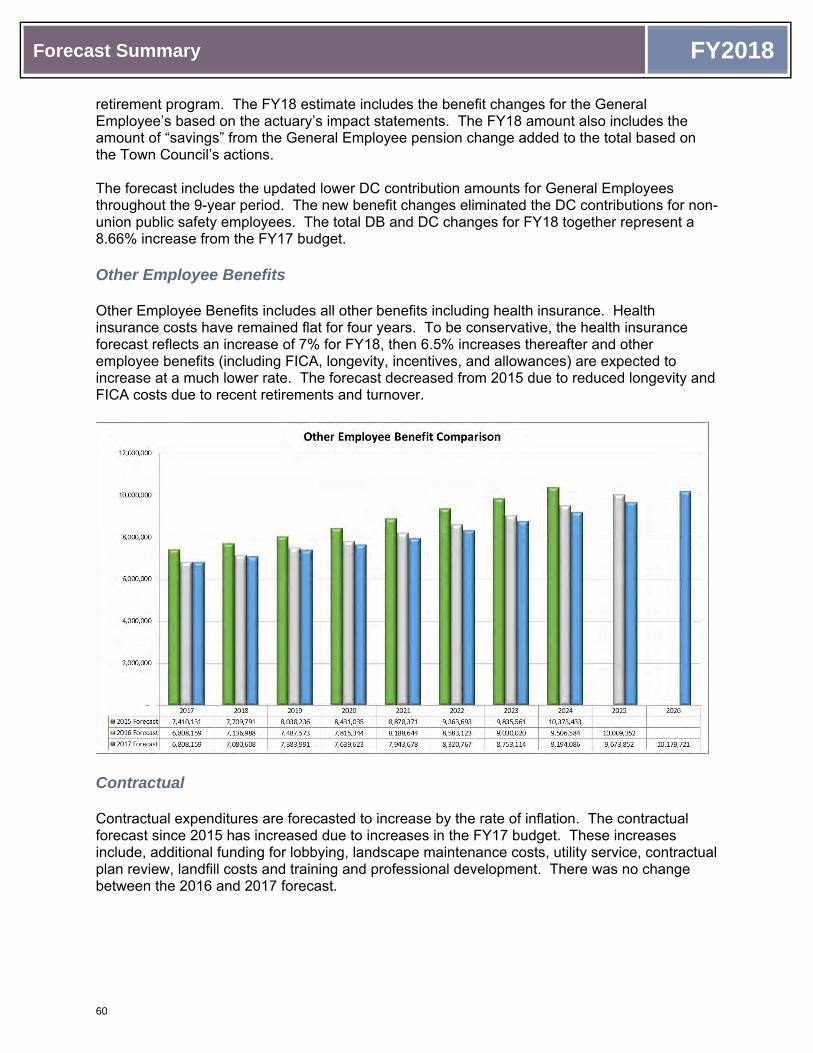
Forecast Summary FY2018
retirement program. The FY18 estimate includes the benefit changes for the General Employee’s based on the actuary’s impact statements. The FY18 amount also includes the amount of “savings” from the General Employee pension change added to the total based on the Town Council’s actions. The forecast includes the updated lower DC contribution amounts for General Employees throughout the 9-year period. The new benefit changes eliminated the DC contributions for non-union public safety employees. The total DB and DC changes for FY18 together represent a 8.66% increase from the FY17 budget. Other Employee Benefits Other Employee Benefits includes all other benefits including health insurance. Health insurance costs have remained flat for four years. To be conservative, the health insurance forecast reflects an increase of 7% for FY18, then 6.5% increases thereafter and other employee benefits (including FICA, longevity, incentives, and allowances) are expected to increase at a much lower rate. The forecast decreased from 2015 due to reduced longevity and FICA costs due to recent retirements and turnover.
Contractual Contractual expenditures are forecasted to increase by the rate of inflation. The contractual forecast since 2015 has increased due to increases in the FY17 budget. These increases include, additional funding for lobbying, landscape maintenance costs, utility service, contractual plan review, landfill costs and training and professional development. There was no change between the 2016 and 2017 forecast.
60

Forecast Summary FY2018
Commodities The commodity forecast is based upon the assumed rate of inflation. Commodity budgets include fuel, supplies, dues, software, some computer hardware and vehicle maintenance and uniforms. The 2016 forecast decreased based upon budget savings in these areas and there was no change in the 2017 forecast.
61

Forecast Summary FY2018
Equipment Replacement/Capital Outlay This category includes depreciation on Town vehicles and equipment that is charged to the departments and transferred to the Equipment Replacement Fund. It also includes purchases of new equipment that is not replacement equipment. The 2016 forecast increase is due to depreciation on new equipment and a specific increase in the estimated replacement value of 3 fire-rescue pumpers due to higher than anticipated increases in the cost of these vehicles. The 2017 forecast is less due to replacements made during the year less than the estimated replacement cost.
Transfers The Transfers category includes transfers to the Capital Improvement Program, Coastal Protection Fund, Debt Service Fund, Risk Insurance Fund and Retiree Health Insurance Trust. It also includes the annual contingency allocation.
The FY17 budget includes a transfer to the Capital Improvement Program of $2,290,200 for Capital projects. The increase of $1,330,200 is intended to begin to increase the transfer to build reserves for capital projects once the ACIP bond funds have been spent and to fund costs related to the underground utility project. In subsequent years the forecast assumes a 10% increase per year until 2023 then a 5% increase thereafter. The increase are in anticipation of the expenditure of all of the bond proceeds in 2018 and the need to increase funding in the Capital Improvement fund going forward to move toward pay-as-you-go funding for capital improvement projects.
The Town Council approved a 10 year $84 million Coastal Protection program in 2013. The first year funding in FY15 was approved at $4,777,000. The transfer increased to $8,015,220 due to increased beach renourishment project costs. In FY17, the transfer
62

Forecast Summary FY2018
was lowered to $7,265,000 due to the reduction in scope of some projects. The forecast for FY18 forward assumes a 3% increase per year in funding.
Debt service decreased in FY17 due to the refunding of the 2010A bonds at a lower
interest rate. The forecast includes the debt service on both the 2013 and 2016 bonds.
Risk insurance premium increases have been estimated as follows: Property Insurance 5% per year, Liability Insurance 5% per year, and Worker’s Compensation 3% per year throughout the forecast period. The 2017 forecast also included the increased stop loss claim reserve.
Retiree Health Insurance is based upon a forecast for Town Contributions prepared by
the Town’s actuary.
The General Fund contingency appropriation has been estimated to be 1.5% of the forecasted operating expenditures as required by Town policy. The General Fund contingency is funded through a transfer from fund balance rather than through operating revenues.
The Town’s contribution to the Four Arts Library is forecasted to increase by 3% per
year.
In FY17, an extraordinary transfer of $2,500,000 to the Retirement Fund was included in the budget. The transfer was funded from the Town’s unassigned fund balance. This transfer is not included in the forecast for future years. This will be an item for the Town Council to consider each year if reserves are available to fund a transfer
63
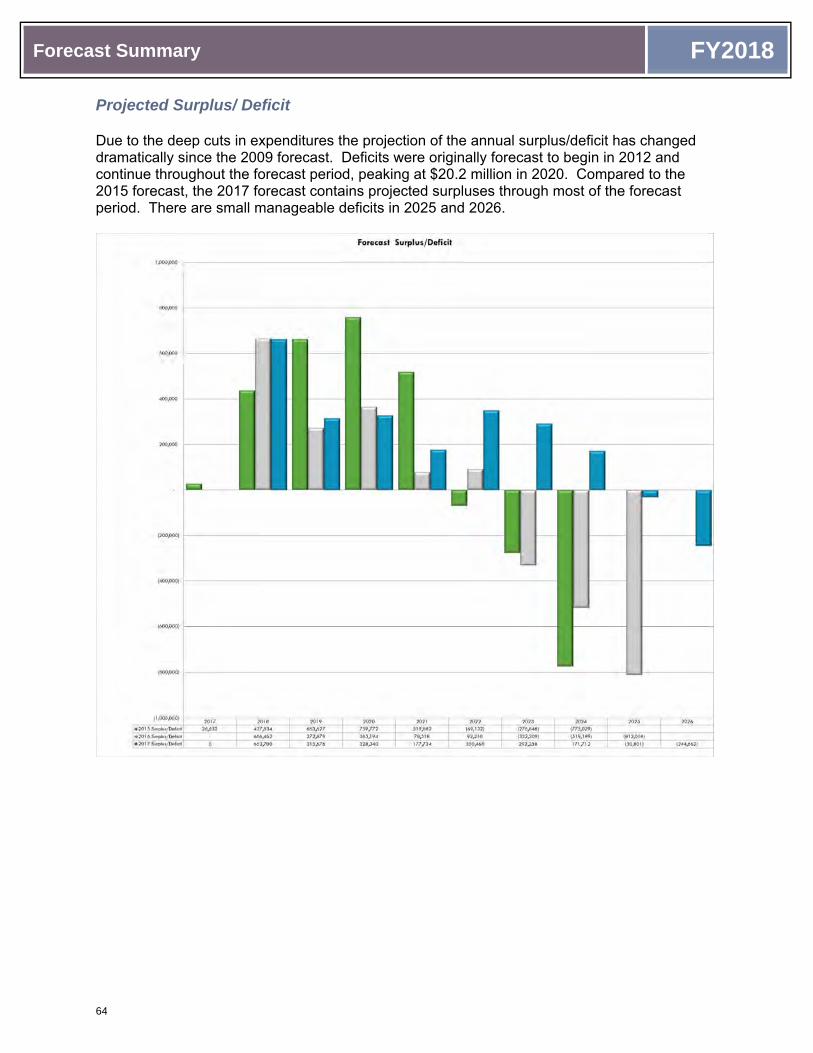
Forecast Summary FY2018
Projected Surplus/ Deficit Due to the deep cuts in expenditures the projection of the annual surplus/deficit has changed dramatically since the 2009 forecast. Deficits were originally forecast to begin in 2012 and continue throughout the forecast period, peaking at $20.2 million in 2020. Compared to the 2015 forecast, the 2017 forecast contains projected surpluses through most of the forecast period. There are small manageable deficits in 2025 and 2026.
64

Fund Budget Overview FY2018
Fund Budget Overview
65

Special Debt Capital Internal Trust &General Revenue Service Projects Enterprise Service Agency Totals
RevenuesAd Valorem Taxes $51,470,500 $0 $0 $0 $0 $0 $0 $51,470,500Non Ad Valorem Taxes 6,150,000 0 0 500,000 0 0 0 6,650,000Licenses and Permits 9,947,975 0 0 0 0 0 0 9,947,975Intergovernmental 1,185,450 0 0 7,200,000 0 0 0 8,385,450Charges for Services 3,943,650 0 0 0 6,627,400 8,911,975 0 19,483,025Fines and Forfeitures 1,138,800 0 0 0 0 0 0 1,138,800Contributions/Grants 0 0 0 5,000 6,571,154 0 11,260,070 17,836,224Gain/Loss on Investments 0 0 0 0 0 0 15,436,649 15,436,649Interest Earnings 581,858 6,000 0 377,676 14,000 286,162 1,700,000 2,965,696Miscellaneous 420,000 0 0 0 0 30,000 2,500 452,500Special Assessments 0 5,080,000 710,000 258,638 0 0 0 6,048,638Commercial Paper 0 14,450,000 0 0 0 0 0 14,450,000Interfund Transfers 585,000 13,880,000 6,916,632 12,148,324 0 12,750,000 5,719,016 51,998,972Subtotal 75,423,233 33,416,000 7,626,632 20,489,638 13,212,554 21,978,137 34,118,235 206,264,429Appropriations from Fund Balance 5,065,996 1,152,300 18,214 26,468,236 3,017,334 7,298,496 0 43,020,576Total Revenues $80,489,229 $34,568,300 $7,644,846 $46,957,874 $16,229,888 $29,276,633 $34,118,235 $249,285,005
ExpendituresSalaries and Wages $26,001,862 $118,500 $0 $169,540 $1,392,733 $207,095 $133,896 $28,023,626Employee Benefits 16,412,187 21,800 0 67,510 656,502 5,665,310 2,078,115 24,901,424Contractual 9,617,449 21,678,000 0 17,600 1,523,980 1,666,645 20,360,277 54,863,951Commodities 1,949,093 0 0 6,063 363,970 6,687 0 2,325,813Depreciation/Capital Outlay 2,459,607 0 0 41,926,623 11,341,137 2,980,896 0 58,708,263Debt Service 0 0 7,624,846 0 198,263 0 0 7,823,109Interfund Transfers 23,058,146 12,750,000 0 4,486,038 585,000 14,750,000 0 55,629,184Other 990,885 0 20,000 284,500 168,303 4,000,000 0 5,463,688Subtotal 80,489,229 34,568,300 7,644,846 46,957,874 16,229,888 29,276,633 22,572,288 237,739,058Transfer to Fund Balance/Retained Earnings 0 0 0 0 0 0 11,546,247 11,546,247Total Expenditures $80,489,229 $34,568,300 $7,644,846 $46,957,874 $16,229,888 $29,276,633 $34,118,535 $249,285,305
Financial RatiosSpecial Debt Capital Internal Trust &
General Revenue Service Projects Enterprise Service Agency TotalAd Valorem Taxes as percentage of total fund budget 63.95% 0.00% 0.00% 0.00% 0.00% 0.00% 0.00% 20.65%
Ad Valorem Taxes per capita (8,040 population) $6,402 $0 $0 $0 $0 $0 $0 $6,402
Total expenditures per capita (8,040 population) $10,011 $4,300 $951 $5,841 $2,019 $3,641 $4,244 $31,006
Personnel as a percentage of the total budget 32.30% 0.00% 0.00% 0.36% 8.58% 0.71% 0.39% 11.24%
Capital expenditures as percentage of total fund budget 3.06% 0.00% 0.00% 89.29% 69.88% 10.18% 0.00% 23.55%
Capital expenditures per capita (8,040 population) $306 $0 $0 $5,215 $1,411 $371 $0 $7,302
FY 18 Budget Summary by Fund Type, Revenues and Expenditures
66

Special Debt Capital Internal Trust &General Revenue Service Projects Enterprise Service Agency Totals
FY 18 Budget Summary by Fund Type, Revenues and Expenditures
Ad Valorem Taxes20.6% Sales and Use Taxes
2.7%
Licenses and Permits4.0%
Intergovernmental Revenue3.4%
Charges for Services7.8%
Fines and Forfeitures0.5%
Contributions7.2%
Gain/Loss on Investments
6.2%
Interest Earnings
1.2%Miscellaneous
0.2%
Special Assessments
2.4%
Commercial Paper5.8%
Interfund Transfers20.9%
Appropriations from Fund Balance17.3%
FY18 Budget by Revenue TypeAll Funds
Personnel11.2%
Employee Benefits10.0%
Contractual22.0%
Commodities0.9%
Capital Outlay23.6%
Debt Service3.1%
Interfund Transfers22.3%
Other2.2%
Transfer to Fund Balance/Retained Earnings
4.6%
FY18 Budget by Expenditure ClassificationAll Funds
67

Summary of Major Revenues by Fund TypeFY18 Budget
FY18 Budgetto FY2018
FY2015 FY2016 FY2017 FY2017 FY2018 FY17 Budget %Description Actual Actual Budget Projected Budget % Variance of Total
General FundAd Valorem Taxes $43,869,888 $47,882,187 $49,494,500 $50,195,981 $51,470,500 3.99% 63.95%Sales and Use Taxes 8,056,312 8,061,358 8,103,000 8,188,599 6,150,000 -24.10% 7.64%Licenses and Permits 10,657,677 10,096,672 7,303,500 8,240,833 9,947,975 36.21% 12.36%Intergovernmental Revenue 1,102,690 1,122,466 1,178,500 1,028,494 1,185,450 0.59% 1.47%Charges for Services 3,957,601 4,131,755 3,816,550 3,681,626 3,943,650 3.33% 4.90%Fines and Forfeitures 1,099,526 1,174,838 1,255,000 938,624 1,138,800 -9.26% 1.41%Interest Earnings 597,586 490,102 704,339 424,359 581,858 -17.39% 0.72%Miscellaneous 213,106 332,898 345,758 479,208 420,000 21.47% 0.52%Interfund Transfers 885,000 785,000 685,000 685,000 585,000 -14.60% 0.73%Subtotal 70,439,386 74,077,276 72,886,147 73,862,724 75,423,233 3.48% 93.71%Appropriations from Fund Balance 195,267 0 3,966,230 2,290,399 5,065,996 27.73% 6.29%Total General Fund $70,634,653 $74,077,276 $76,852,377 $76,153,123 $80,489,229 4.73% 100.00%
Special Revenue FundsInterest Earnings 0 0 6,000 16,531 6,000 0.00% 0.02%Special Assessments 0 0 0 0 5,080,000 100.00% 14.70%Donations 0 0 0 49,250 0 0.00% 0.00%Commercial Paper 0 0 0 0 14,450,000 100.00% 41.80%Interfund Transfers 0 2,530,250 760,200 1,027,241 13,880,000 1725.84% 40.15%Subtotal 0 2,530,250 766,200 1,093,022 33,416,000 4261.26% 96.67%Appropriations from Fund Balance 0 0 299,652 2,991,465 1,152,300 284.55% 3.33%Total Debt Service Funds $0 $2,530,250 $1,065,852 $4,084,487 $34,568,300 3143.26% 100.00%
Debt Service FundsInterest Earnings 100 0 999 0 0 -100.00% 0.00%Special Assessments 777,716 778,384 728,113 752,483 710,000 -2.49% 9.29%Bond Proceeds 0 58,432,064 0 0 0 0.00% 0.00%Interfund Transfers 7,036,813 7,200,725 7,115,933 7,114,433 6,916,632 -2.80% 90.47%Subtotal 7,814,629 66,411,173 7,845,045 7,866,916 7,626,632 -2.78% 99.76%Appropriations from Fund Balance 172,478 605,667 0 0 18,214 100.00% 0.24%Total Debt Service Funds $7,987,107 $67,016,840 $7,845,045 $7,866,916 $7,644,846 -2.55% 100.00%
Capital Projects FundsInterest Earnings 584,287 366,723 167,738 241,822 377,676 125.16% 0.80%Sales and Use Taxes 0 0 0 350,847 500,000 100.00% 1.06%Grants/Interlocal/Donations 557,912 3,115,073 800,000 42,001 7,200,000 800.00% 15.33%Special Assessment Revenue 229,988 238,544 247,342 231,827 258,638 4.57% 0.55%Loan Proceeds/Contributions 0 1,000,000 5,000 5,000 5,000 0.00% 0.01%Miscellaneous 9,370 8,399 0 27,016 0 0.00% 0.00%Interfund Transfers 15,940,037 9,368,393 9,555,200 9,555,200 12,148,324 27.14% 25.87%Subtotal 17,321,594 14,097,132 10,775,280 10,453,713 20,489,638 90.15% 43.63%Appropriations from Fund Balance 22,623,403 25,243,308 13,706,992 120,168 26,468,236 93.10% 56.37%Total Capital Projects Funds $39,944,997 $39,340,440 $24,482,272 $10,573,881 $46,957,874 91.80% 100.00%
Enterprise FundsCharges for Services $5,827,203 $6,096,133 $6,070,700 $6,330,921 $6,627,400 9.17% 40.83%Interest Earnings 17,024 65,492 13,700 40,651 14,000 2.19% 0.09%Grants/Interlocal/Donations 0 0 50,000 98,642 6,571,154 13042.31% 40.49%Interfund Transfers 0 0 0 0 0 0.00% 0.00%Miscellaneous 7,603 14,059 73,500 35,298 0 -100.00% 0.00%Subtotal 5,851,830 6,175,684 6,207,900 6,505,512 13,212,554 112.83% 81.41%Appropriations from Retained Erngs. 0 0 642,617 0 3,017,334 369.54% 18.59%Total Enterprise Funds $5,851,830 $6,175,684 $6,850,517 $6,505,512 $16,229,888 136.91% 100.00%
Internal Service FundsInterest Earnings $238,819 $451,493 $162,500 $238,000 $286,162 76.10% 0.98%Miscellaneous $1,137,065 $601,444 $30,000 $32,473 $30,000 0.00% 0.10%Interfund Transfers $0 $0 $0 $0 $12,750,000 100.00% 43.55%Charges for Services $8,667,668 $9,343,645 $8,950,870 $9,054,170 $8,911,975 -0.43% 30.44%Subtotal 10,043,552 10,396,582 9,143,370 9,324,643 21,978,137 140.37% 75.07%Appropriations from Retained Erngs. 0 0 5,753,043 0 7,298,496 26.86% 24.93%Total Internal Service Funds $10,043,552 $10,396,582 $14,896,413 $9,324,643 $29,276,633 96.53% 100.00%
68

Summary of Major Revenues by Fund TypeFY18 Budget
FY18 Budgetto FY2018
FY2015 FY2016 FY2017 FY2017 FY2018 FY17 Budget %Description Actual Actual Budget Projected Budget % Variance of Total
Trust & Agency FundsInterest Earnings 2,289,137 1,896,271 2,500,000 2,500,000 1,700,000 -32.00% 4.98%Gain/Loss on Investments -11,711,790 14,443,006 14,837,114 14,837,114 15,436,649 4.04% 45.24%Miscellaneous 130,564 95,807 82,500 82,500 2,500 -96.97% 0.01%Contributions 8,152,803 8,653,545 10,159,695 10,159,695 11,260,070 10.83% 33.00%Interfund Transfers 1,577,000 1,180,000 3,839,000 3,839,000 5,719,016 48.97% 16.76%Subtotal 437,714 26,268,629 31,418,309 31,418,309 34,118,235 8.59% 100.00%Appropriations from Fund Balance 26,236,582 0 0 0 0 0.00% 0.00%Total Trust & Agency Funds $26,674,296 $26,268,629 $31,418,309 $31,418,309 $34,118,235 8.59% 100.00%
All FundsAd Valorem Taxes $43,869,888 $47,882,187 $49,494,500 $50,195,981 $51,470,500 3.99% 20.65%Sales and Use Taxes 8,056,312 8,061,358 8,103,000 8,539,446 6,650,000 -17.93% 2.67%Licenses and Permits 10,657,677 10,096,672 7,303,500 8,240,833 9,947,975 36.21% 3.99%Intergovernmental Revenue 1,102,690 1,122,466 1,178,500 1,028,494 8,385,450 611.54% 3.36%Commercial Paper 0 0 0 0 14,450,000 100.00% 5.80%Charges for Services 18,452,472 19,571,533 18,838,120 19,066,717 19,483,025 3.42% 7.82%Fines and Forfeitures 1,099,526 1,174,838 1,255,000 938,624 1,138,800 -9.26% 0.46%Special Assessment Revenue 1,007,704 1,016,928 975,455 984,310 6,048,638 520.08% 2.43%Interest Earnings 3,726,953 3,270,081 3,555,276 3,461,363 2,965,696 -16.58% 1.19%Gain/(Loss) on Investments -11,711,790 14,443,006 14,837,114 14,837,114 15,436,649 0.00% 6.19%Miscellaneous 1,497,708 59,484,671 531,758 656,495 452,500 -14.90% 0.18%Interfund Transfers 25,438,850 21,064,368 21,955,333 22,220,874 51,998,972 136.84% 20.86%Contribution/Grants 8,710,715 12,768,618 11,014,695 10,354,588 17,836,224 61.93% 7.15%Approp. from Fund Bal/Ret Earngs 49,227,730 25,848,975 24,368,534 5,402,032 43,020,576 76.54% 17.26%Total All Funds $161,136,435 $225,805,701 $163,410,785 $145,926,871 $249,285,005 52.55% 100.00%
This table summarizes by fund type, the major revenue categories indicating category percentages of total fund revenues and percent of change from the prior year.
Ad Valorem Taxes, 20.6%
Sales and Use Taxes, 2.7%Licenses and Permits, 4.0%
Intergovernmental Revenue, 3.4%
Commercial Paper, 5.8%
Charges for Services, 7.8%
Fines and Forfeitures, 0.5%
Special Assessment Revenue, 2.4%
Interest Earnings, 1.2%
Gain/(Loss) on Investments, 6.2%
Miscellaneous, 0.2%
Interfund Transfers, 20.9%
Contribution/Grants, 7.2%
Approp. from Fund Bal/Ret Earngs, 17.3%
FY18 Budget by Revenue Type - All Funds
69

Summary of Expenditure Classifications by Fund TypeFY18 Budget
FY18 Budgetto FY2018
FY2015 FY2016 FY2017 FY2017 FY2018 FY17 Budget ofDescription Actual Actual Budget Projected Budget % Variance % of Total
General FundSalaries and Wages $23,478,696 $23,581,855 $24,737,579 $24,128,637 $26,001,862 5.11% 32.30%Employee Benefits 14,844,270 15,120,843 16,909,548 16,575,852 16,412,187 -2.94% 20.39%Contractual 10,064,496 10,810,912 9,432,209 11,488,978 9,617,449 1.96% 11.95%Commodities 1,518,113 1,471,130 1,810,844 1,844,787 1,949,093 7.63% 2.42%Capital Outlay+B81 75,497 372,384 399,307 474,810 2,459,607 515.97% 3.06%Interfund Transfers 18,477,000 17,840,832 22,277,340 18,710,969 23,058,146 3.50% 28.65%Other 2,176,581 2,802,168 1,285,550 2,929,090 990,885 -22.92% 1.23%Subtotal 70,634,653 72,000,124 76,852,377 76,153,123 80,489,229 4.73% 100.00%Transfer to Fund Balance 0 2,077,152 0 0 0 0.00% 0.00%Total General Fund $70,634,653 $74,077,276 $76,852,377 $76,153,123 $80,489,229 4.73% 100.00%
Special Revenue FundsSalaries and Wages $0 $0 $0 $22,933 $118,500 100.00% 0.34%Employee Benefits 0 0 0 5,482 21,800 100.00% 0.06%Contractual 0 693,339 1,065,852 4,056,072 21,678,000 1933.87% 62.71%Interfund Transfers 0 0 0 0 12,750,000 100.00% 36.88%Subtotal 0 693,339 1,065,852 4,084,487 34,568,300 3143.26% 100.00%Transfer to Fund Balance 0 1,836,911 0 0 0 0.00% 0.00%Total Debt Service Funds $0 $2,530,250 $1,065,852 $4,084,487 $34,568,300 3143.26% 100.00%
Debt Service FundsDebt Service $7,982,457 $7,976,404 $7,622,897 $7,109,860 $7,624,846 0.03% 99.74%Deposit to Escrow 0 58,630,491 0 0 0 0.00% 0.00%Other 4,650 409,945 16,500 9,286 20,000 21.21% 0.26%Interfund Transfers 0 0 109,825 0 0 -100.00% 0.00%Subtotal 7,987,107 67,016,840 7,749,222 7,119,146 7,644,846 -1.35% 100.00%Transfer to Fund Balance 0 0 95,823 747,770 0 -100.00% 0.00%Total Debt Service Funds $7,987,107 $67,016,840 $7,845,045 $7,866,916 $7,644,846 -2.55% 100.00%
Capital Projects FundsSalaries and Wages $101,029 $113,894 $142,278 $143,685 $169,540 19.16% 0.36%Employee Benefits 47,193 46,260 64,124 62,642 67,510 5.28% 0.14%Contractual 12,898 17,634 9,500 12,612 17,600 85.26% 0.04%Commodities 566 737 1,600 2,453 6,063 278.94% 0.01%Capital Outlay 38,823,698 38,430,752 22,424,557 8,860,876 41,926,623 86.97% 89.29%Interfund Transfers 734,613 731,163 1,491,613 1,491,613 4,486,038 200.75% 9.55%Other 0 0 348,600 0 284,500 -18.39% 0.61%Subtotal 39,719,997 39,340,440 24,482,272 10,573,881 46,957,874 91.80% 100.00%Transfer to Fund Balance 225,000 0 0 0 0 0.00% 0.00%Total Capital Projects Funds $39,944,997 $39,340,440 $24,482,272 $10,573,881 $46,957,874 91.80% 100.00%
Enterprise FundsSalaries and Wages $1,177,158 $1,253,137 $1,354,465 $1,276,005 $1,392,733 2.83% 8.58%Employee Benefits 523,960 580,345 636,317 620,710 656,502 3.17% 4.05%Contractual 1,363,785 1,560,741 1,845,389 1,490,525 1,523,980 -17.42% 9.39%Commodities 318,509 348,485 500,550 435,532 363,970 -27.29% 2.24%Capital Outlay 810,577 721,844 1,321,629 1,071,018 11,341,137 758.12% 69.88%Debt Service 202,200 204,100 185,967 185,967 198,263 6.61% 1.22%Interfund Transfers 885,000 785,000 685,000 685,000 585,000 -14.60% 3.60%Other 261,571 497,330 321,200 0 168,303 -47.60% 1.04%Subtotal 5,542,760 5,950,982 6,850,517 5,764,757 16,229,888 136.91% 100.00%Transfer to Retained Earnings 309,070 224,702 0 740,755 0 0.00% 0.00%Total Enterprise Funds $5,851,830 $6,175,684 $6,850,517 $6,505,512 $16,229,888 136.91% 100.00%
70

Summary of Expenditure Classifications by Fund TypeFY18 Budget
FY18 Budgetto FY2018
FY2015 FY2016 FY2017 FY2017 FY2018 FY17 Budget ofDescription Actual Actual Budget Projected Budget % Variance % of Total
Internal Service FundsSalaries and Wages $146,433 $168,691 $176,386 $168,382 $207,095 17.41% 0.71%Employee Benefits 4,432,127 4,520,295 5,351,911 4,612,124 5,665,310 5.86% 19.35%Contractual 1,629,278 1,556,693 1,724,591 1,845,309 1,666,645 -3.36% 5.69%Commodities 42,768 20,637 5,548 6,224 6,687 20.53% 0.02%Capital Outlay 1,447,945 1,472,612 2,137,977 2,462,980 2,980,896 39.43% 10.18%Interfund Transfers 119,922 242 1,500,000 0 14,750,000 883.33% 50.38%Other 0 0 4,000,000 0 4,000,000 0.00% 13.66%Subtotal 7,818,473 7,739,170 14,896,413 9,095,019 29,276,633 96.53% 100.00%Transfer to Retained Earnings 2,225,079 2,657,412 0 229,624 0 0.00% 0.00%Total Internal Sevice Funds $10,043,552 $10,396,582 $14,896,413 $9,324,643 $29,276,633 96.53% 100.00%
Trust & Agency FundsSalaries and Wages $94,253 $121,438 $129,584 $127,294 $133,896 3.33% 0.39%Employee Benefits 2,103,829 2,299,072 2,315,187 2,373,588 2,078,115 -10.24% 6.09%Contractual 24,476,214 18,829,846 19,627,577 18,612,443 20,359,977 3.73% 59.67%Subtotal 26,674,296 21,250,356 22,072,348 21,113,325 22,571,988 2.26% 66.16%Transfer to Fund Balance 0 5,018,273 9,345,961 10,304,984 11,546,247 23.54% 33.84%Total Trust & Agency Funds $26,674,296 $26,268,629 $31,418,309 $31,418,309 $34,118,235 8.59% 100.00%
Total: All FundsSalaries and Wages $24,997,569 $25,239,015 $26,540,292 $25,866,936 $28,023,626 5.59% 11.24%Employee Benefits $21,951,379 $22,566,815 $25,277,087 $24,250,398 $24,901,424 -1.49% 9.99%Contractual 37,546,671 33,469,165 33,705,118 37,505,939 54,863,651 62.78% 22.01%Commodities 1,879,956 1,840,989 2,318,542 2,288,996 2,325,813 0.31% 0.93%Capital Outlay 41,157,717 40,997,592 26,283,470 12,869,684 58,708,263 123.37% 23.55%Deposit to Escrow 0 58,630,491 0 0 0 0.00% 0.00%Debt Service 8,184,657 8,180,504 7,808,864 7,295,827 7,823,109 0.18% 3.14%Interfund Transfers 20,216,535 19,357,237 26,063,778 20,887,582 55,629,184 113.43% 22.32%Transfer to Fund Bal/Ret Earnings 2,759,149 11,814,450 9,441,784 12,023,133 11,546,247 22.29% 4.63%Other 2,442,802 3,709,443 5,971,850 2,938,376 5,463,688 -8.51% 2.19%Subtotal All Funds $161,136,435 $225,805,701 $163,410,785 $145,926,871 $249,285,005 52.55% 100.00%
Salaries and Wages11.2%
Employee Benefits10.0%
Contractual22.0%
Commodities0.9%
Capital Outlay23.6%
Deposit to Escrow
0.0%
Debt Service3.1%
Interfund Transfers22.3%
Transfer to Fund Bal/Ret Earnings
4.6%
Other2.2%
FY18 Budget by Expenditure ClassificationAll Funds
71

(This page intentionally left blank)
72

Town of Palm Beach
Reserve Analysis


Reserve Status FY2018
Town of Palm Beach Reserves The Town Council has adopted eighteen financial policies, fifteen of which address reserves. The reserve policies serve to safeguard the Town’s financial resources and ensure fiscal stability. The size of a municipality’s fund balance can affect its ability to withstand financial emergencies. Reserves can also be used to accumulate funds for capital purchases or capital projects without having to borrow. Unassigned Fund Balance - General Fund Pursuant to adopted policy, the unassigned fund balance for the General Fund is to be maintained at a minimum level of 25% of current year General Fund budgeted expenditures. This minimum level is to be maintained to protect the Town against economic downturns, temporary revenue shortfalls, unpredicted one-time expenditures, and for tax rate stabilization purposes. Twenty-five percent of the FY17 General Fund operating budget (General Fund budget less CIP, coastal and extraordinary retirement transfer) is $16,199,294. The FY16 ending fund balance was $21,615,082. The unassigned fund balance exceeds the minimum requirement by $5,415,788. The General Fund Undesignated Fund Balance has consistently exceeded the required minimum level of 25%. The chart details the General Fund Undesignated Fund Balance and the percent of budgeted expenditures the balance represents. In FY16, the Town Council authorized the transfer of $2,530,250 to begin to fund the underground utility project. In addition, contained in the FY17 budget is a extraordinary transfer of $2,500,000 to the Retirement Fund to begin to reduce the UAAL. The fund balance amount of $21,615,082 is net of these two transfers. Reserves - Risk Fund The total reserve balance for the Risk Fund was $8,458,781 as of September 30, 2016. Out of this reserve balance, the Town funds the Reserve for Catastrophic Exposures/Emergencies - Risk Fund in the amount of $2,500,000 and the Contingency Reserve for $500,000. The trend for the Risk Fund Reserve is shown in the table. In 2014 the Town Council approved a transfer of $2,000,000 from the reserves of the Risk Fund to the Coastal Protection Fund.
73

Reserve Status FY2018
Reserve for Catastrophic Exposures/Emergencies - Risk Fund The Reserve for Catastrophic Exposures/Emergencies for the Risk Fund is funded at a minimum of $2,500,000. This reserve was established to set aside emergency funds to protect the Town against the potential financial impacts large judgments in excess of insurance coverage and the financial impacts of response to and recovery from a man-made or natural emergency situation. In addition, the reserve can be used in response to increases in premium rates and/or loss fund increases. This reserve is funded with a budget appropriation from the Net Asset reserves of the Risk Fund. Recreation Enterprise Fund Reserves The Recreation Enterprise Fund reserve is to be maintained at a minimum level of 25% of budgeted revenues totaling $1,551,975 for FY17. The purpose of the reserve is to provide an adequate level of net assets for unanticipated financial impacts as well as to provide for one-time expenditures to improve the facilities. The Town’s enterprise fund includes the operations of the Town Docks, the Par 3 Golf Course, tennis activities and youth and adult recreation programs. At the end of FY16, the net asset balance for the Recreation Enterprise Fund (REF) was $4,999,782. Separate reserves have been set aside from this amount for the dock replacement, Par 3 Improvements, tennis improvements and equipment replacement. At the end of FY16, $3,356,781 had been set aside in the Dock Replacement Reserve. The Dock Replacement reserve was created to fund the replacement cost of the construction of the Town’s docks whenever it is determined they must be replaced. The replacement reserve is to be maintained at 100% of accumulated depreciation plus accumulated interest earned on the reserve. In FY16, the Town committed to lowering the transfer to the General Fund each year by $100,000 and add these funds each year to the Dock Replacement Reserve. The Par 3 Golf Course charges an additional $2 per round to fund a maintenance and improvement reserve. At the end of FY16, the balance is $388,132. In FY15, the Town established a Maintenance and Improvement fund for the Par 3 Clubhouse. This reserve is funded each year based on 50% of the net income from the operations of the Par 3 Golf Course. At the end of FY16, the balance is $327,485. In FY10, a maintenance and improvement fee was implemented for the Tennis program. This reserve at the end of FY16 is $53,852 and has been set aside for improvements to the tennis centers.
74

Reserve Status FY2018
The Recreation Enterprise Fund’s equipment replacement reserve allows for the purchase of capital equipment and is funded with accumulated replacement cost depreciation from Recreation Net Assets. The balance in the REF Equipment Replacement Fund for FY16 is $583,475. Equipment Replacement Fund The Town-wide Equipment Replacement Fund is intended to fund the replacement cost of existing equipment, vehicles and computers when they reach the end of their useful life. This reserve significantly reduces the budgetary fluctuations due to purchases of large pieces of equipment and ensures compliance with the fixed asset inventory and depreciation schedule required by GASB34. The balance in the Equipment Replacement Fund Reserve for year-end FY16 is $14,918,663. In FY13, the Town Council approved the use of up to $4,867,019 from this reserve for internal financing for small underground utility projects financed by special assessments. To date, a balance of $1,354,221 remains available. In FY14, the Town Council authorized a transfer of $2,858,913 in excess reserves to the coastal protection fund. For FY17, income including the depreciation transfer will total $2,414,133 and expenditures for capital equipment are budgeted at $2,135,219. Designation of General Fund Balance for Payment of Liability Related to Compensated Absences Leave Balances A Reserve for Compensated Absences reduces the budgetary fluctuations due to the payout of accrued leave time to employees when they leave Town service. This reserve is funded at a rate of 100% of the fiscal year end accrued leave balances. Funds are appropriated annually from this reserve based upon estimates of pay-outs of eligible accrued vacation, sick and compensatory time and the related payroll tax liability. The balance in the reserve as of September 30, 2016, was $3,061,180. The FY17 appropriation for the pay-out of eligible accrued vacation, sick and compensatory time from this reserve is $505,930. Health Insurance Reserve The balance of the reserve in the Health Fund at the end FY16 is $6,507,339. These reserves guard against any deficiencies in the Town’s self-insurance health fund for active employees’ insurance expenditures. The trend in the reserve balance is shown in the chart. Since FY13, the Town has maintained level funding of health insurance benefits due to good claims experience and the wellness program. These reserves have also provided cushion in case claims unexpectedly increase.
75

Reserve Status FY2018
Capital Improvement Fund For many years, the Town funded all of the capital infrastructure improvements through pay-as-you-go financing. In 2010, the Town issued the first of two bonds for capital improvements to accelerate many large scale capital improvement projects identified in the 20 year plan. Since 2012, the Capital Improvement Fund transfer from the General Fund was reduced to $1,000,000. In FY17, the transfer was increased to $2,290,200 to begin to build up the reserves for projects once the bond proceeds have been spent. Once the bond proceeds have been spent on the remaining projects, it is proposed to return to pay-as-you-go financing. OPEB (Other Post Employment Benefits) Trust The Town’s OPEB Trust Fund was established in 2007 to comply with GASB Statements 43 and 54, which required the establishment of a liability for actuarially determined costs of retiree health benefits. This fund’s investments are overseen by the Town’s Investment Advisory Committee. The net asset balance in this trust is $28,401,183 as of September 30, 2016. The actuarially determined transfer from the General Fund for the OPEB liability for FY17 is $1,339,000. The Town continues to be well ahead of other government agencies in funding this liability. Retirement Fund The Town provides pension benefits for General Employees, Lifeguards, Police Officers, and Firefighters. The funds were separately managed by 3 pension boards until the consolidation on April 1, 2012, into the Employee’s Retirement Fund. The Retirement Board oversees all of the Town’s pension assets and retirement programs. The net assets of the consolidated retirement fund at the end of FY16 were $194,010,680. The decline from FY14 to FY15 was due to investment losses. Contingency Reserves Contingency reserves were established for the General Fund, Capital Fund, Equipment Replacement Fund, Recreation Enterprise Fund, Risk Insurance Fund and Health Insurance Fund to provide for unanticipated unbudgeted expenditures of a nonrecurring nature. The amount of the General Fund Contingency has been funded at 1.5% of the FY17 operating budget. The Capital Fund Contingency is appropriated at 10% of the capital budget, while the
76
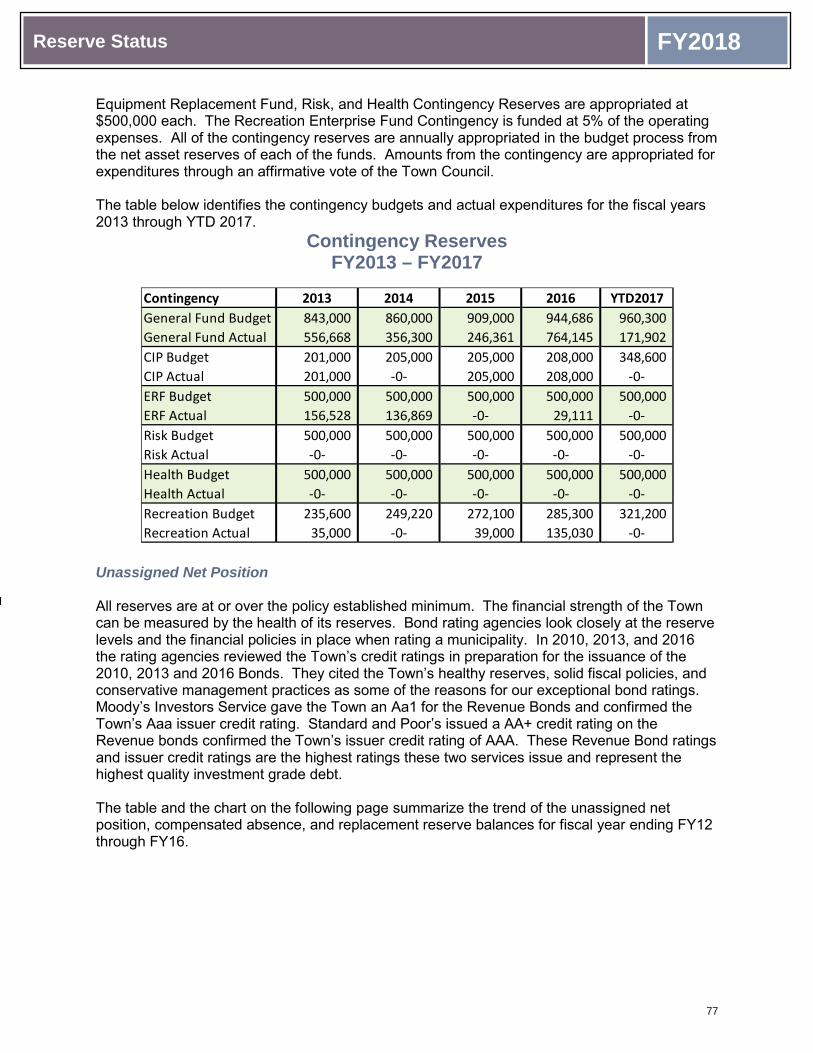
Reserve Status FY2018
Equipment Replacement Fund, Risk, and Health Contingency Reserves are appropriated at $500,000 each. The Recreation Enterprise Fund Contingency is funded at 5% of the operating expenses. All of the contingency reserves are annually appropriated in the budget process from the net asset reserves of each of the funds. Amounts from the contingency are appropriated for expenditures through an affirmative vote of the Town Council. The table below identifies the contingency budgets and actual expenditures for the fiscal years 2013 through YTD 2017.
Contingency Reserves FY2013 – FY2017
Unassigned Net Position All reserves are at or over the policy established minimum. The financial strength of the Town can be measured by the health of its reserves. Bond rating agencies look closely at the reserve levels and the financial policies in place when rating a municipality. In 2010, 2013, and 2016 the rating agencies reviewed the Town’s credit ratings in preparation for the issuance of the 2010, 2013 and 2016 Bonds. They cited the Town’s healthy reserves, solid fiscal policies, and conservative management practices as some of the reasons for our exceptional bond ratings. Moody’s Investors Service gave the Town an Aa1 for the Revenue Bonds and confirmed the Town’s Aaa issuer credit rating. Standard and Poor’s issued a AA+ credit rating on the Revenue bonds confirmed the Town’s issuer credit rating of AAA. These Revenue Bond ratings and issuer credit ratings are the highest ratings these two services issue and represent the highest quality investment grade debt. The table and the chart on the following page summarize the trend of the unassigned net position, compensated absence, and replacement reserve balances for fiscal year ending FY12 through FY16.
Contingency 2013 2014 2015 2016 YTD2017General Fund Budget 843,000 860,000 909,000 944,686 960,300 General Fund Actual 556,668 356,300 246,361 764,145 171,902 CIP Budget 201,000 205,000 205,000 208,000 348,600 CIP Actual 201,000 -0- 205,000 208,000 -0-ERF Budget 500,000 500,000 500,000 500,000 500,000 ERF Actual 156,528 136,869 -0- 29,111 -0-Risk Budget 500,000 500,000 500,000 500,000 500,000 Risk Actual -0- -0- -0- -0- -0-Health Budget 500,000 500,000 500,000 500,000 500,000 Health Actual -0- -0- -0- -0- -0-Recreation Budget 235,600 249,220 272,100 285,300 321,200 Recreation Actual 35,000 -0- 39,000 135,030 -0-
77

Reserve Status FY2018
Reserve Balances Fiscal Years 2012 – 2016
Fund 2012 2013 2014 2015 2016
General Fund 21,424,261 20,043,760 22,298,680 22,267,051 21,615,082
Compensated Absence (GF)
3,315,135 3,390,226 3,456,532 3,168,789 3,061,180
Equipment Replacement Fund
14,870,188 12,625,048 12,232,932 13,304,714 14,918,663
Recreation Enterprise Fund
707,381 486,466 1,025,665 179,645 169,291
Recreation ERF 397,132 472,319 472,319 584,638 583,475
Dock Replacement 2,395,723 2,551,321 2,715,680 2,880,038 3,356,781
Par 3 M&I Reserve 162,138 212,375 279,252 351,246 388,132
Tennis M&I reserve 23,867 31,075 38,459 46,320 53,852
Par 3 Clubhouse M&I 0 0 0 147,602 327,485
Capital Improvement 5,623,928 4,990,855 5,670,416 5,898,531 5,506,265
Health Fund 3,234,334 4,025,042 5,025,134 5,740,869 6,507,339
Risk Fund 7,990,553 6,625,018 7,297,409 8,071,236 8,458,781
Health - OPEB Trust 20,942,253 24,814,790 27,628,798 26,629,096 28,401,183
Pension Funds 187,286,530 210,469,896 216,001,372 190,764,490 194,010,680
Total 268,373,423 290,738,191 304,142,648 280,034,265 287,358,189
78

Town of Palm Beach
Capital Expenditures


Capital Expenditures FY2018
Capital Expenditures
The Town of Palm Beach defines a “capital expenditure as the cost(s) associated with the acquisition of land, improvements to land, buildings, vehicles, machinery, equipment, works of art, infrastructure and other tangible or intangible assets that are used in operations and that have an initial useful life extending beyond a single reporting period. Capital expenditures with the following minimum dollar threshold are recognized as depreciable as recommended by GFOA Best Practices:
• Infrastructure - $50,000• Computer Software - $25,000• Machinery, equipment, vehicles and office furniture - $2,500• Computers - $1,500
Capital expenditures are further categorized as “routine” and “non-routine.” Routine capital expenditures represent the cost of items that are purchased on an annual basis such as computer hardware, vehicles and various other types of equipment. Non routine capital expenditures represent the cost of items such as capital improvements projects that are not incurred on a regular basis.
The Town defines the term “capital improvement” as a major repair, renovation or replacement of infrastructure which has an estimated cost of $50,000 or greater and extends the useful life by at least five years or adds capacity/square footage to an existing facility. Capital improvements are accounted for in the Capital Funds section of the budget.
The purpose of the capital budget is to promote advanced planning by department directors and serves as a fiscal planning tool to forecast the demands on revenues and future borrowing needs. The capital improvements program is reviewed and updated annually. During the budget preparation process, departments provide the Public Works Director with updates on current projects, the projects scheduled for the next fiscal year and any changes that are requested from the previous five year plan. The plan is then presented to the Budget Review Committee for review prior to approval by Town Council. These changes include requests for new projects or modifications to projects already forecasted in the plan. Departments are required to give a description of the project, estimated costs and justification, funding resources and a statement of impact on the Town’s annual operating budget.
79

Capital Expenditures FY2018
FY2018 Town-wide Capital Expenditures
Department General Fund Equipment Replacement
Capital Funds Recreation Fund Total
Information Systems $317,093 $915,160 $0 $0 $1,232,253 Annual Depreciation 312,093 0 0 0 312,093 Major Computer Equip (>$1,500) 5,000 915,160 0 0 920,160Human Resources 4,377 7,000 0 0 11,377 Annual Depreciation 677 0 0 0 677 Titmus Machine/Vision Screener 3,700 0 0 0 3,700 ELI 280 12 Lead Resting ECG 0 7,000 0 0 7,000 Finance 3,854 0 0 0 3,854 Annual Depreciation 3,854 0 0 0 3,854Planning/Zoning/Building 104,568 27,500 0 0 132,068 Annual Depreciation 104,568 0 0 0 104,568 Ford Escape 0 20,500 0 0 20,500 Fujitsu Scanner 0 7,000 0 0 7,000Fire-Rescue 724,554 1,477,916 0 0 2,202,470 Annual Depreciation 617,854 0 0 0 617,854
(2) Pumpers 0 1,060,000 0 0 1,060,000 Medical Transport Unit 0 274,625 0 0 274,625 Battalion Commander Vehicle 3,900 45,275 0 0 49,175 Ford Interceptor SUV 0 32,436 0 0 32,436 Grant Equipment 90,000 0 0 0 90,000 Extrication Equipment 12,800 65,580 0 0 78,380 Police 605,534 120,880 0 0 726,414 Annual Depreciation 558,834 0 0 0 558,834 Townwide Camera System Buildout 40,000 0 0 0 40,000
(4) Patrol Vehicles 6,700 110,000 0 0 116,700 Data Card CP80 0 10,880 0 0 10,880Public Works 704,348 432,440 46,957,874 0 48,094,662 Annual Depreciation 680,683 0 0 0 680,683
(3) Isuzu NF 154/6 yd RL 15,565 287,640 0 0 303,205 Parking Kiosks 0 77,800 0 0 77,800 4 Wheel Drive Tractor 8,100 67,000 0 0 75,100 Pay-as-you-go Projects 0 0 9,091,454 0 9,091,454 Coastal Projects 0 0 19,919,275 0 19,919,275 Worth Avenue Assessment District 0 0 328,638 0 328,638 2013 Accelerated Projects 0 0 17,618,507 0 17,618,507Recreation Department 0 0 0 11,064,648 11,064,648 Annual Depreciation 0 0 0 1,049,626 1,049,626 Par 3 – (6) Greens Mowers 0 0 0 60,000 60,000 Tennis - Court Roller 0 0 0 9,000 9,000 Tennis - Service Maintenance Cart 0 0 0 15,000 15,000 Seaview Recreation Center 0 0 0 9,809,022 9,809,022
Town Docks 0 0 0 40,000 40,000
Par 3 Golf Course 0 0 0 62,000 62,000 Par 3 Clubhouse 0 0 0 20,000 20,000Total Capital Expenditures $2,464,328 $2,980,896 $46,957,874 $11,064,648 $63,467,746
80

General F und Revenue Expenditure Comparison FY2018
Town of Palm Beach, FloridaGeneral Fund Revenues and Expenditures
Budget ComparisonFiscal Years 2017 - 2018
Budget Budget FY17 vs. FY18 FY17 vs. FY18FY2017 FY2018 $ Difference % Change
RevenuesAd Valorem Taxes $49,494,500 $51,470,500 $1,976,000 3.99%Non Ad Valorem Taxes 5,903,000 6,150,000 $247,000 4.18%Licenses & Permits 9,503,500 9,947,975 $444,475 4.68%Intergovernmental 1,178,500 1,185,450 $6,950 0.59%Charges for Services 3,816,550 3,943,650 $127,100 3.33%Fines and Forfeitures 1,255,000 1,138,800 -$116,200 -9.26%Investment Earnings 704,339 581,858 -$122,481 -17.39%Miscellaneous Revenues 345,758 420,000 $74,242 21.47%Interfund Transfers 685,000 585,000 -$100,000 -14.60%Transfer From Fund Balance 3,966,230 5,065,996 $1,099,766 27.73% Total Revenues $76,852,377 $80,489,229 $3,636,852 4.73%
ExpendituresDepartmentLegislative $155,900 $157,500 $1,600 1.03%General Government 698,017 929,596 $231,579 33.18%Town Manager 781,929 798,492 $16,563 2.12%Town Clerk 351,507 358,385 $6,878 1.96%Advice and Litigation 561,000 578,788 $17,788 3.17%Human Resources 888,575 892,580 $4,005 0.45%Information Systems 2,460,413 2,599,005 $138,592 5.63%Finance 1,757,795 1,793,071 $35,276 2.01%Planning/Building/Zoning 4,316,599 4,333,309 $16,710 0.39%Library 325,250 335,008 $9,758 3.00%Fire-Rescue 12,161,865 13,319,134 $1,157,269 9.52%Police 14,742,293 14,908,617 $166,324 1.13%Emergency Management 46,300 61,004 $14,704 31.76%Public Works 15,323,669 15,710,717 $387,048 2.53%Contingency 960,300 655,877 -$304,423 -31.70%Transfer to Other Funds 18,820,965 18,299,130 -$521,835 -2.77%Extraordinary Transfer to Retirement Fund 2,500,000 4,759,016 $2,259,016 90.36% Total Expenditures $76,852,377 $80,489,229 $3,636,852 4.73%
Revenues Over/(Under) Expenditures $0 $0
81

(This page intentionally left blank)
82

General Fund Revenues FY2018
Ad Valorem Taxes$51,470,500
63.9%
General Use Tax6,150,000
7.6%
Licenses/Permits10,004,975
12.4%Intergovernmental
1,185,450 1.5%
Charges for Services3,943,650
4.9%
Fines and Forfeitures1,138,800
1.4%
Interest581,858 0.7%
Miscellaneous948,000 1.2%
Use of Fund Balance5,065,996
6.3%
Revenues by Type
Ad Valorem Taxes 51,470,500$ General Use Tax 6,150,000 Licenses/Permits 10,004,975 Intergovernmental 1,185,450 Charges for Services 3,943,650 Fines and Forfeitures 1,138,800 Interest 581,858 Miscellaneous 948,000 Use of Fund Balance 5,065,996
80,489,229$
83

General Fund Revenues FY2018
Acct # Title 2015 Actual 2016 Actual 2017
Budget 2017
Projected 2018
Budget %
Variance
% of Total
Budget 311.000 Ad Valorem Taxes311.100 Current Ad Valorem Taxes 43,860,760 47,681,212 49,494,500 50,080,658 51,470,500 3.99% 63.95%311.200 Back Taxes 9,128 200,975 - 115,323 - 0.00% 0.00%
43,869,888 47,882,187 49,494,500 50,195,981 51,470,500 3.99% 63.95%312.000 Sales, Use and Fuel Taxes312.410 1-6 Cents Local Opt Fuel Tax 224,355 230,764 225,000 220,403 230,000 2.22% 0.29%312.420 1-5 Cents Local Opt Fuel Tax 105,126 107,356 108,000 103,138 108,000 0.00% 0.13%
329,481 338,120 333,000 323,541 338,000 1.50% 0.42%314.000 Utility Services Taxes314.100 Electricity Utility 2,554,383 2,592,663 2,550,000 2,307,958 2,550,000 0.00% 3.17%314.200 Simplified Telecom Tax 1,074,774 982,674 1,100,000 854,081 985,000 -10.45% 1.22%314.300 Water Utility 1,663,154 1,700,644 1,650,000 1,842,141 1,820,000 10.30% 2.26%314.400 Gas Utility 255,299 299,322 260,000 377,881 435,000 67.31% 0.54%314.800 Propane Utility 11,050 15,916 10,000 21,017 22,000 120.00% 0.03%
5,558,660 5,591,219 5,570,000 5,403,078 5,812,000 4.34% 7.22%316.000 Business Tax Receipts316.000 Business Tax Receipts 659,635 679,915 672,000 1,190,023 705,600 5.00% 0.88%316.100 Business Tax Receipt Penalties 22,793 43,734 25,000 28,737 25,000 0.00% 0.03%
682,428 723,649 697,000 1,218,760 730,600 4.82% 0.91%322.000 Building Permits322.100 Building 6,754,745 5,780,693 4,100,000 4,270,480 4,200,000 2.44% 5.22%322.200 Electrical 575,422 674,734 425,000 477,024 425,000 0.00% 0.53%322.300 Plumbing 372,442 427,499 290,000 278,632 290,000 0.00% 0.36%322.400 Permit Processing 47,775 38,150 30,000 36,300 35,000 16.67% 0.04%322.410 Permit Penalty 121,606 241,547 43,000 92,063 85,000 97.67% 0.11%322.500 Except/Var. App. 172,361 219,059 162,500 207,429 186,800 14.95% 0.23%322.510 Consultants Fees - 4,825 - 26,161 - 0.00% 0.00%322.520 Special Plan Review Fee 520,950 499,950 370,000 348,800 430,000 16.22% 0.53%322.530 Reinspection Fees 2,325 3,825 2,500 5,400 6,500 160.00% 0.01%322.700 Special Detail - PZB - 80 - 160 - 0.00% 0.00%322.750 Abandonments 381 1,244 - - - 0.00% 0.00%322.800 Architectural Fees 174,010 148,010 140,000 160,030 150,000 7.14% 0.19%322.850 Landmarks Submittal 26,620 25,900 25,000 31,675 40,000 60.00% 0.05%322.900 Mechanical Permits 490,507 445,245 325,000 332,320 335,000 3.08% 0.42%322.905 Contractor Registration Fee 9,500 8,656 10,000 8,850 10,750 7.50% 0.01%322.910 Landscape Permit 10,731 13,378 10,000 14,758 44,000 340.00% 0.05%322.911 Advanced Irrigation 300 600 1,000 900 300 -70.00% 0.00%322.915 Miscellaneous Permit Fees - - - 4,500 2,025 100.00% 0.00%322.920 Building Permit Search Fee 35,200 27,800 30,000 31,650 40,500 35.00% 0.05%322.930 Dune Vegetation Fee - - 2,000 840 1,000 -50.00% 0.00%322.940 Permit Revision Fee 193,975 230,150 190,000 162,825 190,000 0.00% 0.24%
9,508,850 8,791,345 6,156,000 6,490,797 6,471,875 5.13% 8.04%323.000 Franchise Fees323.100 Electricity Franchise 1,999,420 1,939,949 2,000,000 1,583,967 1,950,000 -2.50% 2.42%323.400 Gas Franchise 168,751 192,070 200,000 338,156 325,000 62.50% 0.40%
2,168,171 2,132,019 2,200,000 1,922,123 2,275,000 3.41% 2.83%329.000 Other Licenses, Fees and Permits329.100 Right Of Way Permits 369,973 487,565 350,000 381,824 360,000 2.86% 0.45%329.200 Residential Parking Plans 70,000 74,840 87,500 90,230 93,500 6.86% 0.12%329.300 Arlington Plan 2,760 - - - - 0.00% 0.00%329.400 Taxi Permits 5,925 5,625 - 4,975 4,000 100.00% 0.00%329.420 Drone Permits - 50 - - - 0.00% 0.00%329.470 Flood Plain Management Permit Fee 16,800 12,679 12,000 9,608 12,000 0.00% 0.01%329.500 Newsrack Enclosure Admin Fee 940 920 1,000 620 1,000 0.00% 0.00%329.930 Charitable Solicitations Fee 40,030 43,880 50,000 40,075 50,000 0.00% 0.06%329.960 Char Solit Late Filing Fee 4,840 5,955 7,000 6,045 7,000 0.00% 0.01%
511,268 631,514 507,500 533,377 527,500 3.94% 0.66%331.000 Federal Grants331.220 Bullet Proof Vests Grant 4,212 2,566 5,000 - 19,000 280.00% 0.02%331.240 Fema Grant - Fire-Rescue 3,077 - - - - 0.00% 0.00%
7,289 2,566 5,000 - 19,000 280.00% 0.02%334.000 State Grants334.200 Grants State Of Florida - - - 1,388 48,750 100.00% 0.06%
- - - 1,388 48,750 100.00% 0.06%
84

General Fund Revenues FY2018
Acct # Title 2015 Actual 2016 Actual 2017
Budget 2017
Projected 2018
Budget %
Variance
% of Total
Budget 335.000 State Shared Revenues335.120 State Revenue Sharing 255,278 255,801 255,000 256,665 260,000 1.96% 0.32%335.150 Alcoholic Beverage Lic 22,708 24,107 22,000 23,635 25,000 13.64% 0.03%335.180 Local Govt. Sales Tax 631,987 647,792 670,000 586,150 670,000 0.00% 0.83%335.230 Fire Supplemental Compensation 29,293 30,198 30,000 25,211 30,000 0.00% 0.04%335.240 911 Equip Reimbursement 99,026 95,593 108,000 9,467 20,000 -81.48% 0.02%335.290 Seized Tag 2,667 200 3,000 50 200 -93.33% 0.00%335.490 Fuel Tax Refund 18,236 28,878 13,000 22,315 20,000 53.85% 0.02%
1,059,195 1,082,569 1,101,000 923,493 1,025,200 -6.88% 1.27%337.000 Grants From Other Local Units337.200 Ems Grant - Palm Beach County 21,165 13,132 52,500 - 77,500 47.62% 0.10%
21,165 13,132 52,500 - 77,500 47.62% 0.10%338.000 Shared Revenues-Other Local Units338.200 County Occ. Licenses 15,040 24,199 15,000 19,598 15,000 0.00% 0.02%338.600 $12.50 Citation Monies - - 5,000 - - -100.00% 0.00%
15,040 24,199 20,000 19,598 15,000 -25.00% 0.02%342.000 Public Safety342.100 Special Assignment Ot - Other 672,086 899,372 500,000 374,411 500,000 0.00% 0.62%342.120 Police Id Cards 20,295 16,704 17,500 37,960 17,500 0.00% 0.02%342.130 Burglar Alarm False Alarm Fees 79,719 55,756 70,000 50,253 60,000 -14.29% 0.07%342.140 Burglar Alarm Registration Fee 95,745 94,586 95,000 94,150 95,000 0.00% 0.12%342.150 Burglar Alarm - Penalties 7,200 5,836 5,000 3,524 5,000 0.00% 0.01%342.160 Burglar Alarm - Direct Connect 13,661 20,615 20,000 22,067 23,000 15.00% 0.03%342.170 Valet Parking Permit 11,100 13,675 10,000 8,750 10,000 0.00% 0.01%342.200 Tent Permits 21,074 14,298 20,000 19,282 20,000 0.00% 0.02%342.210 Special Detail-Fire 32,328 30,033 32,000 20,899 32,000 0.00% 0.04%342.220 Fire Prev Bonfires 3,300 3,000 3,300 - 3,300 0.00% 0.00%342.225 Fire Prev Fire Hydrant - 800 1,000 - 1,000 0.00% 0.00%342.230 Fire Prev Hot Work 67,511 61,675 60,000 62,719 60,000 0.00% 0.07%342.240 Fire Prev Public Assembly 2,500 4,585 1,500 2,325 4,500 200.00% 0.01%342.250 False Fire Alarms 14,377 13,398 15,000 20,956 20,000 33.33% 0.02%342.300 Fire Prev Fireworks 20,630 6,280 10,000 6,000 10,000 0.00% 0.01%342.500 Bldg. Insp. Fund Fees 12,696 11,264 10,000 8,308 10,000 0.00% 0.01%342.501 Radon Gas 12,597 11,212 10,000 7,718 10,000 0.00% 0.01%342.510 Fire Prev Technical Fire Insp 49,500 44,118 48,000 61,500 45,000 -6.25% 0.06%342.520 Fire Prev Annual Ins Fee 108,385 110,208 115,000 100,928 115,000 0.00% 0.14%342.600 Ems Transport Fees 466,386 419,881 400,000 448,705 430,000 7.50% 0.53%
1,711,090 1,837,296 1,443,300 1,350,455 1,471,300 1.94% 1.83%343.000 Physical Enviornment343.400 Special Solid Waste 10,040 9,500 10,000 10,115 10,000 0.00% 0.01%343.410 Solid Waste 895,065 893,115 995,000 973,832 1,024,850 3.00% 1.27%343.430 Comp. Garbage Collection Fee 258,268 256,693 275,000 261,169 283,250 3.00% 0.35%343.440 SWA Recycling Revenue 24,073 15,552 25,000 28,105 25,000 0.00% 0.03%343.920 Historic Speciman Tree Fee 4,641 4,641 5,000 3,978 5,000 0.00% 0.01%
1,192,087 1,179,501 1,310,000 1,277,199 1,348,100 2.91% 1.67%344.000 Transportation344.505 Prkg Meter Royal Palm Way Lot 9,939 9,331 10,500 8,360 10,000 -4.76% 0.01%344.515 Prkg Meter Ocean Front 570,636 600,866 575,000 518,369 575,000 0.00% 0.71%344.520 Prkg Meter Lake Front 28,019 41,587 31,000 46,821 47,000 51.61% 0.06%344.525 Prkg Meter Phipps Ocean Front 92,852 92,602 90,000 148,081 120,000 33.33% 0.15%344.530 Prkg Meter Peruvian 110,226 121,714 115,000 99,070 120,000 4.35% 0.15%344.540 Prkg Meter Bradley Place 7,805 9,334 9,000 5,523 7,500 -16.67% 0.01%344.560 Parking Meter Royal Palm Way 40,401 42,439 35,000 46,384 45,000 28.57% 0.06%344.599 Other Parking Placard Programs 155,495 159,858 160,000 169,383 160,000 0.00% 0.20%
1,015,373 1,077,731 1,025,500 1,041,991 1,084,500 5.75% 1.35%349.000 Other Charges for Services349.400 Certification Copy 1,027 1,027 500 826 500 0.00% 0.00%349.420 Misc Copies 2,890 3,623 4,000 2,730 4,000 0.00% 0.00%349.450 Lien Search Fee 35,005 32,515 33,000 35,025 35,000 6.06% 0.04%349.480 Microfiche/Scanned Documents 131 62 250 37 250 0.00% 0.00%
39,053 37,227 37,750 38,618 39,750 5.30% 0.05%
85

General Fund Revenues FY2018
Acct # Title 2015 Actual 2016 Actual 2017
Budget 2017
Projected 2018
Budget %
Variance
% of Total
Budget 351.000 Judgments and Fines351.100 Fines - Other Parking 617,897 672,944 725,000 480,357 652,500 -10.00% 0.81%351.110 Fines - Parking Meters 85,667 54,408 75,000 41,330 67,500 -10.00% 0.08%351.120 Row Parking Violation Fines 9,400 27,987 15,000 17,325 30,000 100.00% 0.04%351.150 Moving Violations 12,404 9,066 10,000 6,427 10,000 0.00% 0.01%351.300 Revenue/2nd $ Funding 1,864 376 2,000 - 2,000 0.00% 0.00%351.600 Boot Fees 21,700 22,750 26,000 13,650 20,000 -23.08% 0.02%351.800 Penalty - Other Parking 169,867 178,039 190,000 124,940 175,500 -7.63% 0.22%351.900 Penalty - Parking Meters 29,171 18,563 27,000 11,225 24,300 -10.00% 0.03%
947,970 984,133 1,070,000 695,254 981,800 -8.24% 1.22%354.000 Violations of Local Ordinances354.400 Code Compliance Fines 142,380 183,705 175,000 173,294 150,000 -14.29% 0.19%354.410 Code Compliance Admin Fee 9,175 7,000 10,000 4,950 7,000 -30.00% 0.01%
151,555 190,705 185,000 178,244 157,000 -15.14% 0.20%361.000 Interest and Other Earnings361.100 Interest - Checking - - - 43,701 5,000 100.00% 0.01%361.120 Fmivt Interest 104,401 43,093 279,339 33,942 106,858 -61.75% 0.13%361.121 SBOA Interest 95,248 - - - - 0.00% 0.00%361.130 PFM/TD Bank Interest Income 125,574 184,468 150,000 107,125 150,000 0.00% 0.19%361.140 Interest - Certificates of Deposit 246,192 216,269 250,000 250,712 300,000 20.00% 0.37%361.150 Investment Earnings/Ad Valorem 26,170 46,272 25,000 1,532 20,000 -20.00% 0.02%
597,585 490,102 704,339 437,012 581,858 -17.39% 0.72%362.000 Rents and Royalties362.120 Room Rental Dep - South Fire 79 79 - 52 - 0.00% 0.00%362.140 Rooftop Lease 57,520 37,840 36,000 34,840 36,000 0.00% 0.04%
57,599 37,919 36,000 34,892 36,000 0.00% 0.04%364.000 Disposition of Fixed Assets364.410 Surplus Furn & Equipment 2,172 - - - - 0.00% 0.00%
2,172 - - - - 0.00% 0.00%369.000 Other Miscellaneous Revenues369.500 State Highway Lighting Maint 76,551 78,846 95,000 95,454 95,000 0.00% 0.12%369.540 Rebate For Town Towing 2,631 3,323 2,000 1,780 2,500 25.00% 0.00%369.910 Credit Card Customer Surcharge 6,325 8,907 6,000 8,435 9,000 50.00% 0.01%369.950 DC Forfeiture Transfer from ICMA - 141,941 130,000 130,077 197,000 51.54% 0.24%369.990 Miscellaneous Revenue 22,958 12,127 19,758 205,011 23,500 18.94% 0.03%
108,465 245,144 252,758 440,757 327,000 29.37% 0.41%381.000 Interfund Transfer381.180 Use Of Fund Balance - - 3,966,230 3,966,230 5,065,996 27.73% 6.29%381.970 Interfd Transfer-Marina 885,000 785,000 685,000 685,000 585,000 -14.60% 0.73%
885,000 785,000 4,651,230 4,651,230 5,650,996 21.49% 7.02%70,439,384 74,077,277 76,852,377 77,177,788 80,489,229 4.73% 100.00%
86

Major Revenue Sources FY2018
MAJOR REVENUE SOURCES
PROPERTY TAX
General Description
Under State law, the assessment of all properties and the collection of all county, municipal and school board property taxes are consolidated in the offices of the property appraiser of each county and tax collector of each county. Municipalities are not permitted to levy property taxes at a rate of more than 10 mills for operating millage. There is no limitation as to rate or amount of ad valorem taxes levied for the purpose of paying debt service on general obligation bonds, pursuant to Florida Statues, but the Town, according to Section 7.01 of the Town Charter, cannot have a total indebtedness which exceeds an amount equal to five percent (5%) of the total assessed value of the taxable property within the Town's corporate limits. The laws of the State regulating tax assessment are designed to assure a consistent property valuation method statewide. The State Constitution does, however, permit different assessment standards for agricultural land, land used exclusively for noncommercial recreational purposes, tangible personal property held for sale as stock-in-trade and livestock.
Property Assessment Procedure
Municipal ad valorem taxes are levied based upon the assessed valuation of taxable real and tangible personal property located within the boundaries of the municipality. Property valuations are determined each year as of January 1 by the Property Appraiser. A tax roll is prepared by July 1 and each taxpayer whose property is subject to taxation is given notice of the assessment of such property. The property owner has the right to file an appeal with the Value Adjustment Board, which considers petitions relating to assessments and exemptions. The Value Adjustment Board certifies the assessment roll upon completion of the hearing of all appeals.
Exemptions
Every person who has the legal title or beneficial title in equity to real property in the State of Florida and who resides thereon and in good faith makes the same his or her permanent residence or the permanent residence of others legally or naturally dependent upon such person is entitled to an exemption from ad valorem taxation by counties of $25,000 for a property with an assessed value of up to $50,000. Beginning at $50,000 and continuing through an assessed value of $75,000 the additional benefit will increase with the increase in property value. A property with an assessed value of $75,000 or more will receive the full $50,000 exemption. Other exemptions from the ad valorem tax include property owned by certain permanently and totally disabled persons; active military personnel; disabled veterans; renewable energy source improvements; inventory; historic properties; property used by hospitals, nursing homes, homes for special services and property used by homes for the aged; educational property; property owned and used by labor organizations; community centers; governmental property; property owned by not-for-profit sewer and water companies; and the first $500.00 of property of every widow and widower.
87

Major Revenue Sources FY2018
Levy of Ad Valorem Taxes
The Town is required to establish a budget for each fiscal year. The Town is required to compute a proposed millage rate necessary to fund the tentative budget other than the portion of the budget to be funded from sources other than ad valorem taxes. After a procedure involving notice, hearings and public comment, the tentative budget and millage rate become final when approved by the Town Council. This procedure creates the tax roll which is then turned over to the Tax Collector on or about the first Monday in October.
Tax Collection Procedure
Upon receipt of the certified tax roll, the Tax Collector is required to mail to each taxpayer appearing on the assessment roll a tax notice stating, among other things, the amount of current taxes, including any ad valorem taxes due from the taxpayer. In general, each taxpayer is required to pay all taxes shown in the tax notice without preference in payment of any particular increment of the tax bill.
The Statutes relating to the enforcement of county ad valorem taxes (and thus municipal property taxes) provide that such taxes become due and payable on November 1 of the year in which assessed or as soon thereafter as the certified tax roll is received by the Tax Collector. If paid during November or the following three (3) months, the taxpayer is granted a discount which is equal to four percent (4%) in November and which decreases pro rata monthly to one percent (1%) in February. All taxes become delinquent on April 1 following the year in which they are assessed or immediately after sixty (60) days have expired from the mailing of the original tax notice, whichever is later, and the tax collector is required to collect taxes prior to the date of delinquency and to institute statutory procedures upon delinquency to collect assessed taxes.
Property Tax Reform
The State of Florida adopted property tax reform measures during FY07. Millage rate increases are limited to the rolled back rate (the rate that produces the same taxes as the prior year, exclusive of taxes from new construction) plus growth in personal income. Local governments are allowed to override the cap by extraordinary vote, either a 2/3 vote of the Council for up to a 10% increase over the rolled back rate, or a unanimous vote of the Council for an increase in excess of 10%. For FY18 the Town adopted a millage rate of 3.2037, which is 2.05% less than the FY17 rate of 3.2706. Since taxable value increased by 6.42%, the reduced millage rate resulted in an increase in taxes of $2,096,055 over FY17.
The chart on the following page identifies the FY17 TRIM options available to the Town.
88

Major Revenue Sources FY2018
Shared Revenue
Local Option Gas Tax
Local governments are authorized to impose a tax of 1 cent to 6 cents on every gallon of motor fuel and special fuel sold at the retail level. Local Option Gas Taxes are enacted by an inter-local agreement concerning the distribution of the tax proceeds is established between the local governments in the county.
The Town participates in two separate and distinct inter-local agreements relative to Local Option Gas Tax as follows:
a. In 1986, an inter-local agreement was signed which provided a distribution formula forthe six cent gas tax in effect of 1/3 of allsums collected to municipalities and 2/3 ofall sums collected to the county.
b. A second inter-local agreement was signedin August 1993 providing a distributionformula for an additional five cent gas taxwhich the state legislation authorized thecounty commission to levy and the countycommission approved on July 20, 1993.The approved distribution formula is 21%of all sums collected by the County fromthe State are distributed to municipalitiesand 79% of all sums collected are distributed to the County. The agreement is written toterminate at such time as the gas tax proceeds are no longer collected and distributed,with the distribution formula scheduled for review annually.
The Local Option Gas Tax budget for FY18 is based upon estimates provided by the State of Florida.
State Shared Revenue
Sharing of certain state revenues with cities and counties began in Florida at least as early as 1931. Financial rescue of the counties from their overwhelming road debts from the 1920's came principally through sharing of the state's motor fuel tax. Little sharing with cities occurred until the state cigarette tax collections were made available to them in 1949. The Florida Revenue Sharing Act of 1972 was a major attempt by the legislature to ensure an equitable distribution at a minimum level of revenue across counties and municipalities.
Taxable Value $16,911,518,815FY18 Millage Rate Options Millage Tax RevenueRollback Millage Rate 3.1018 $49,833,342Majority Maximum Millage Rate 3.2051 $51,492,9542/3 Vote Maximum Millage Rate 3.5256 $56,642,088FY17 Millage Rate 3.2706 $52,545,273Town Proposed Millage Rate 3.2037 $51,470,461
89

Major Revenue Sources FY2018
The current structure of the revenue sharing program has three revenue sources for municipalities: Cigarette tax, one-cent municipal gas tax and the state alternative fuel decal user’s fee. There are several criteria a local government must meet in order to qualify to receive funds. Governments must: Levy ad valorem taxes (excluding debt service and other special millage) that will produce the equivalent of three mills per dollar of assessed valuation or collect an equivalent amount of revenue from an occupational license tax, or a utility tax (or both) in combination with the ad valorem tax. Other requirements include annual audits of financial statements and certification of compliance with TRIM.
Funds for the above referenced revenue sources are collected in a trust and net of administrative cost, then are distributed monthly to qualified recipients based on an apportionment formula comprised of three factors: weighted population, sales tax, and relative ability to raise revenue. The State provides estimates each year for budgeting purposes.
Revenues have remained flat for the past few years. The budget for FY18 is based upon estimates provided by the State of Florida.
Half Cent Sales Tax
In 1982, the State authorized the Local Government Half Cent Sales Tax Program. The program includes three distributions of state sales tax revenue collected. The ordinary distribution to eligible county and municipal governments is possible due to the transfer of 8.814 percent of net sales tax proceeds to the Local Government Half-cent Sales Tax Clearing Trust Fund. The emergency and supplemental distributions are possible due to the transfer of .095% of net sales tax proceeds to the Trust Fund. The emergency and supplemental distributions are available to select counties that meet certain fiscal-related eligibility requirements.
Like the sales tax itself, the proceeds from the sales tax distributed to local governments are subject to cyclical variations based on the level of economic activity within the particular month. In 1987, the State expanded the base upon which the sales tax is levied by including several services formerly exempted. Effective February 1, 1988, the sales tax on goods was increased to 6%. The current rate in affect for Palm Beach County is 7%. The State provides estimates for budgeting purposes.
90

Major Revenue Sources FY2018
SHARED REVENUE COLLECTIONS
Fiscal Year Local Option Gas
Tax State Shared
Revenue Half Cent Sales
Tax Total
2018
(Budgeted) 338,000 260,000 670,000 1,268,000
2017
(Anticipated) 338,000 255,000 656,648 1,249,648
2016 338,120 255,801 647,792 1,241,713
2015 329,481 255,278 631,987 1,216,746
2014 310,290 251,252 597,433 1,158,975
2013 299,081 249,852 572,763 1,121,696
2012 301,240 231,764 546,021 1,079,025
2011 301,900 272,936 611,700 1,186,536
2010 321,669 250,051 603,022 1,174,742
2009 324,077 249,704 602,980 1,176,761
2008 337,785 256,460 675,694 1,269,939
ONE-CENT SALES TAX On November 8, 2016, the voters of Palm Beach County approved a 1-cent sales surtax for infrastructure throughout the County. The surtax began on January 1, 2017 and will end on December 31, 2026 or when $2.7 billion in revenue is collected, whichever is earlier. The proceeds are to be disbursed on a percentage basis as follows:
• School Board 50% - ($1,350,000,000) • Palm Beach County 30% - ($810,000,000) • Municipalities 20% - ($540,000,000)
The Town of Palm Beach is expected to receive distributions from the State for this tax over the ten year-period of approximately $5 million. The funds are to be used for infrastructure projects. The Town Council approved using $2.6 million of the revenues for the Town-wide undergrounding project. UTILITY TAX Pursuant to F.S.166.231, the Town levies a utility tax, or public service tax on the purchase of electricity, metered or bottled gas and water service. The Town levies this tax at the state allowed maximum of 10% for all services.
91

Major Revenue Sources FY2018
The Florida Legislature adopted the Communications Tax Simplification law that went into effect on October 1, 2001. This legislation combined the Telecommunications utility tax as well as the Telecommunications franchise fee and cable franchise fee into one tax rate on a broad base of services. The rate is 5.1% plus .12% (additional rate for not charging separate permit fees) totaling 5.22%. Collections from these taxes vary depending on utility usage. The water and electricity utility tax depends to a great extent on weather conditions. Fluctuations may be experienced from these revenue sources which are beyond the ability of the Town to predict or control. The budget for utility tax is based on historical trends. Recent revenue trends have been positive. Electricity, gas and water utility taxes have exceeded budget expectations.
FRANCHISE FEES Public utilities operating within the Town of Palm Beach must pay to the Town a franchise fee in return for the right to do business within the Town and for the right to use public rights-of-way. The table on the following page shows the two franchise agreements currently in effect. The budget for franchise fees is based upon historical trends. As mentioned under the Utility Tax section, the Communications Tax Simplification Law eliminated the franchise fees for telephone and cable companies and replaces it with a single rate on a broad base of telecommunication and cable services. The trend in franchise fee revenue is shown in the table on the following page.
Utility Tax
Fiscal Year Electricity Communications
Services Tax Water Gas Propane Total
2018
(Budgeted)
2,550,000
985,000
1,820,000
435,000
22,000
5,812,000
2017
(Anticipated)
2,451,942
929,453
1,817,814
432,467
24,152
5,655,828 2016 2,592,663 982,674 1,700,644 299,322 15,916 5,591,219
2015 2,554,383 1,074,774 1,663,154 255,299 11,050 5,558,660
2014 2,568,843 1,030,492 1,616,381 238,984 7,567 5,463,267
2013 2,362,068 1,149,952 1,336,302 246,874 3,519 5,098,715
2012 2,221,874 1,142,166 1,368,085 232,124 9,384 4,973,633
2011 2,172,820 1,178,518 1,287,923 248,209 5,186 4,892,656
2010 2,187,115 1,172,387 1,248,114 265,560 6,683 4,879,859
2009 2,049,223 1,206,636 1,098,824 243,777 9,628 4,608,088
2008 2,060,247 1,475,646 730,479 222,781 7,355 4,496,508
92

Major Revenue Sources FY2018
Business Tax Receipts
Any person engaging in or managing any business, occupation or profession, within the limits of the Town of Palm Beach must have a license and pay a Business Tax. All licenses must be secured at the time the business begins operation and are renewed thereafter each October 1. The fee for each license is based on the business in which the entity is engaged. This revenue source has trended downward. A fee increase was approved in FY16. During 2012, a change in state law was adopted that exempts real estate brokers from the tax. The increase in 2014 is due to the receipt of a significant amount of penalties for late payment. IN FY16 and in FY18 an increase in the tax amount was adopted.
Franchise Fees
Fiscal Year Electricity Gas Total
Provider and Florida Power Light
Florida Public Utilities
Effective Date 4/1/11 4/1/16
Term 30 years 25 years
Rate 5.9% 6%
2018
(Budget) 1,950,000 325,000 2,275,000
2017
(Anticipated) 1,900,000 325,000 2,225,000
2016 1,939,949 192,070 2,132,019
2015 1,999,420 168,751 2,168,171
2014 2,012,907 159,633 2,172,540
2013 1,872,920 163,145 2,036,065
2012 1,900,717 139,727 2,040,444
2011 1,884,726 144,218 2,028,945
2010 2,009,808 159,993 2,169,801
2009 2,225,166 229,066 2,454,232
2008 2,217,498 230,046 2,447,544
93

Major Revenue Sources FY2018
Building Permits Permits must be issued to any individual or business that performs construction work within the corporate limits of the Town of Palm Beach. Permits are issued for building, electrical, plumbing, and mechanical construction. The revenue from building permits fluctuates based upon current economic conditions and major construction projects. In FY08, building permit fees were lowered based upon a cost allocation study that was completed during FY07. Due to the downturn in the economy, FY09 and FY10 revenues were significantly lower than historical standards. From FY11 through FY16, revenue from these sources exceeded expectations. In FY17 another cost allocation study was completed and building permit fees were lowered. This revenue source is budgeted conservatively for FY18. Solid Waste Disposal Commercial establishments, including apartments, are charged for collection and disposal costs based upon the type of facility being serviced. Town Council, from time to time, will adjust the rate structure to cover anticipated costs. The Solid Waste Authority of Palm Beach County assesses commercial facilities for a portion of their disposal costs while the Town is responsible for the remaining cost. The Town is the sole provider of garbage service to its residents and commercial properties. Most commercial properties are serviced five times per week, except restaurants which are serviced seven times per week. The solid waste disposal charges for commercial properties are billed as a non-ad valorem assessment on the customer’s property tax bill. Public Safety Fees Public Safety Fees include special detail charges for police and fire-rescue services, alarm registration fees and false alarm fees, fire prevention fees and EMS transport fees. In FY09, special detail charges were increased. For FY12, an increase was approved for EMS transport fees and EMS billing was contracted out in FY13. Also in FY12, there was a significant increase in demand for police special detail services. For FY13, a decrease was approved to special detail fees. Special detail pay is no longer part of the final average
94

Major Revenue Sources FY2018
compensation calculation for employee pensions, so the cost for the Town to provide the service was reduced. A reduction in the fee from $90 per hour to $70 per hour was approved. Public safety fees have trended flat in recent years. For FY15, a direct connect alarm service was established for residential customers. The false alarm registration and fee schedule was modified in FY15. FY17 and the FY18 budget reflects a decrease in special assignment overtime due to a recent trend in requests for service. Parking Kiosk Fees The Town has parking kiosks in various commercial locations in Town. The revenue also includes parking placards that are issued for parking meters on the ocean and on the lake front and a few other select locations. The largest source of revenue from meters is from the ocean front meters at Mid-town beach. This revenue amounts to approximately 60% of the total parking meter revenue. In FY08 parking meter charges were increased from $1 per hour to $2 per hour. The increase for FY11 is due to the increase in parking meter charges from $2 to $5 per hour at the meters located at Mid-Town Beach and Phipps Ocean Park. The budget for FY18 is larger than FY17 budget due to higher than expected revenues during the year and due to the installation of new meters that accept only credit cards. Fines and Penalties Parking fines, penalties and code enforcement penalties make up a significant portion of this revenue source. Revenues from these sources have increased in recent years due to improved collection efforts. In addition to parking and code compliance fines, right of way parking violation fines, and moving violations are included in this category of revenues. The decline in FY10 is due to lower code enforcement fine collection. The increase in FY13 is due to an increase in parking ticket fines of between $50 and $60. The FY14 revenue reflects a large code enforcement violation collection. The budget for code enforcement for FY18 is conservative due to the volatile nature of this revenue source. During the season parking enforcement officers are being used to direct traffic when the President is in town and therefore 2017 and 2018 reflect a drop in revenue due to reduced enforcement.
95

Major Revenue Sources FY2018
Investment Income The Town’s Investment Advisory Committee oversees the investment of the Town’s surplus funds. For FY09, higher rates of return resulted in high returns in investment income. In 2009 the Investment Advisory Committee recommended hiring PFM asset management to manage a portion of the surplus funds. The current historically low rates have caused the decline in revenues. The FY18 budget was based upon current trends.
General Fund Revenue Trend Summary Total General Fund revenues have increased at an average annual rate of 1.74% since FY09. This trend is due to increases in ad valorem revenues, building permit revenues, fine revenue, and one time revenues from the sale of Town owned property, offset by declines from FY09 through FY12, that were mainly due to reductions in property taxes due to decreases in the Town’s taxable value and reductions in building permit income. The 10 year trend is shown in the chart below. For FY15 and FY16, revenues increased due to an increase in property taxes to begin to fund the annual requirement for the 10 year Coastal Protection Program. In FY18, the increase is due to fee increases, increased property taxes and improved franchise fee and utility tax revenues.
96

General Fund Expenditures FY2018
Salaries and Wages$26,001,862
32.3%
Employee Benefits17,372,187
21.6%
Contractual9,617,449
11.9%Commodities1,949,093
2.4%Capital Outlay
185,765 0.2%
Contingency655,877 0.8%
Depreciation2,273,842
2.8%
Other22,433,154
27.9%
Expenditures by Type
Salaries and Wages 26,001,862$ Employee Benefits 17,372,187 Contractual 9,617,449 Commodities 1,949,093 Capital Outlay 185,765 Contingency 655,877 Depreciation 2,273,842 Other 22,433,154
80,489,229$
97

General Fund Expenditures FY2018
General Government 10,868,264$ Public Safety 30,347,606 Physical Environment 12,843,306 Transportation 1,149,068 Culture and Recreation 2,222,839 Interfund Transfers 23,058,146
80,489,229$
98

General Fund Expenditures FY2018
Police 14,908,617 Legislative 157,500 Advice and Litigation 578,788 Public Works 15,710,717 General Government 929,596 Records Management 358,385 Information Systems 2,599,005 Fire-Rescue 13,319,134 Human Resources 892,580 Town Manager 798,492 Other 24,110,035 Planning, Zoning & Building 4,333,309 Finance 1,793,071
80,489,229$
99

General Fund Expenditures FY2018
ProgramFY2016Actual
FY2017Budget
FY2017Adjusted*
FY2017Projected
FY2018Budget
%Change
% of TotalGF Budget
LEGISLATIVE 111 161,890 155,900 155,900 145,677 157,500 1.03% 0.20%GENERAL GOVERNMENT 113 1,184,321 698,017 857,244 754,237 929,596 33.18% 1.15%TOWN MANAGER'S OFFICE 121 759,772 781,929 789,032 810,000 798,492 2.12% 0.99%ADVICE & LITIGATION 122 665,673 561,000 757,788 974,172 578,788 3.17% 0.72%INFORMATION SYSTEMS 125 2,256,531 2,460,413 2,724,187 2,418,039 2,599,005 5.63% 3.23%RECORDS MANAGEMENT 131 287,450 351,507 348,923 361,709 358,385 1.96% 0.45%HUMAN RESOURCES 123 740,362 888,575 895,993 745,545 892,580 0.45% 1.11%FINANCE
Financial Management 141 992,207 1,074,825 1,067,861 1,008,499 1,085,812 1.02% 1.35%Purchasing 144 619,408 682,970 678,833 673,245 707,259 3.56% 0.88%
1,611,615 1,757,795 1,746,694 1,681,744 1,793,071 2.01% 2.23%PLANNING/ZONING/BUILDING
Planning & Zoning 211 644,402 692,676 745,169 717,795 673,410 -2.78% 0.84%Permit Issuance 212 1,261,736 1,394,916 1,422,646 1,291,729 1,431,560 2.63% 1.78%Inspection/Compliance 213 1,278,208 1,440,329 1,581,451 1,284,112 1,427,808 -0.87% 1.77%Landmarks Preservation 214 173,129 167,520 198,839 171,870 169,488 1.17% 0.21%Fire Prevention 215 338,261 322,518 319,907 305,441 314,311 -2.54% 0.39%Code Enforcement 216 229,956 298,640 296,422 294,857 316,732 6.06% 0.39%
3,925,692 4,316,599 4,564,434 4,065,804 4,333,309 0.39% 5.38%LIBRARY SERVICES 321 315,777 325,250 350,250 350,250 335,008 3.00% 0.42%FIRE-RESCUE
Fire Administration 411 596,409 624,296 646,517 640,806 616,198 -1.30% 0.77%Operations 417 9,708,596 10,510,732 10,849,248 10,463,934 11,566,618 10.05% 14.37%Training 418 286,278 323,583 340,873 321,601 379,374 17.24% 0.47%Beach Rescue 419 645,916 703,254 699,063 668,073 756,944 7.63% 0.94%
11,237,199 12,161,865 12,535,701 12,094,414 13,319,134 9.52% 16.55%POLICE
Administrative Management 421 981,863 975,403 974,150 1,041,450 1,020,072 4.58% 1.27%Org Crime/Vice/Narcotics 422 676,359 827,018 827,060 740,628 775,146 -6.27% 0.96%Records Information Systems 423 185,760 194,383 193,599 191,887 204,719 5.32% 0.25%Training/Per/Pub Enf 424 278,526 276,263 274,353 226,137 280,460 1.52% 0.35%Communications 425 1,527,426 1,634,971 1,622,066 1,569,618 1,611,117 -1.46% 2.00%Crime Scene/Evidence 426 217,796 209,828 209,464 189,273 197,385 -5.93% 0.25%Patrol Services 428 8,519,954 8,933,676 9,077,412 9,058,843 9,146,556 2.38% 11.36%Criminal Investigation 429 1,084,282 1,047,262 1,047,262 1,138,793 1,029,775 -1.67% 1.28%Parking Control 430 509,791 643,489 671,438 617,577 643,387 -0.02% 0.80%
13,981,757 14,742,293 14,896,804 14,774,206 14,908,617 1.13% 18.52%PUBLIC WORKS
Administrative Management 511 981,237 1,006,495 999,471 1,084,023 1,025,426 1.88% 1.27%Street Repair/Maintenance 521 312,645 379,067 402,901 273,598 374,299 -1.26% 0.47%Traffic Control 523 232,998 275,840 318,719 292,037 298,086 8.06% 0.37%Streeet Lighting 524 442,550 473,274 536,796 491,405 476,683 0.72% 0.59%Storm Sewer Maintenance 531 698,863 885,943 883,607 805,193 896,296 1.17% 1.11%Sanitary Sewer Maintenance 532 1,170,533 1,548,803 1,549,079 1,334,611 1,556,397 0.49% 1.93%Sanitary Sewer Treatment 533 1,744,249 1,870,620 2,003,240 1,544,339 1,847,032 -1.26% 2.29%Residential Collection 541 844,265 880,665 877,607 889,594 926,108 5.16% 1.15%Commercial Collection 542 1,016,119 1,147,574 1,157,844 1,043,216 1,151,735 0.36% 1.43%Refuse Disposal 543 75,694 51,000 51,000 47,695 52,000 1.96% 0.06%Yard Trash Collection 544 2,101,070 1,993,534 2,047,091 1,983,844 2,051,892 2.93% 2.55%Recycling 545 295,801 362,079 359,958 339,473 370,667 2.37% 0.46%Beach Cleaning 546 90,849 105,461 105,371 92,531 114,834 8.89% 0.14%Parks 551 1,354,102 1,457,063 1,675,575 1,488,288 1,603,509 10.05% 1.99%Facilities Maintenance 554 947,839 1,105,123 1,241,757 1,105,862 1,172,364 6.08% 1.46%Parking Meter Maint & Collections 558 154,518 185,855 202,135 190,278 152,657 -17.86% 0.19%General Engineering Services 561 666,372 709,582 706,629 676,469 714,658 0.72% 0.89%Right of Way Inspections 565 113,521 135,065 134,781 115,662 194,165 43.76% 0.24%Equip Operations/Maintenance 571 628,621 750,626 756,348 666,092 731,909 -2.49% 0.91%Coastal Management 581 - - - - - 0.00% 0.00%
13,871,846 15,323,669 16,009,909 14,464,210 15,710,717 2.53% 19.52%TRANSFER TO OTHER FUNDS
Cap Impr Program (307/308/310/320) 611 1,030,000 2,290,200 2,290,200 2,290,200 2,118,024 -7.52% 2.63%Coastal Protection Fund (309) 611 8,015,220 7,265,000 7,265,000 7,265,000 7,410,300 2.00% 9.21%Townwide Underground Utilities 611 2,530,250 - 267,041 267,041 - Debt Service Fund (205) 612 6,265,462 6,088,728 6,088,728 6,088,728 5,982,331 -1.75% 7.43%Group Health Retirees (610) 621 1,180,000 1,339,000 1,339,000 1,339,000 960,000 -28.30% 1.19%Risk-W/C,Liab,Prop (501) 622 1,934,595 1,838,037 1,838,037 1,838,037 1,828,475 -0.52% 2.27%Extraordinary trsfr to Retirement (600) 624 - 2,500,000 2,800,000 2,500,000 4,759,016 90.36% 5.91%
20,955,527 21,320,965 21,888,006 21,588,006 23,058,146 8.15% 28.65%INVENTORY WRITE-OFF 680 32,890 - - - - 0.00% 0.00%EMERGENCY/DISASTER RESPONSE 710 11,822 46,300 56,618 22,293 61,004 31.76% 0.08%CONTINGENT APPROPRIATIONS 711 - 960,300 759,644 - 655,877 -31.70% 0.81%General Operating Fund (001) Total 51,044,597 55,531,412 57,449,121 53,662,300 57,431,083 3.42% 71.35%Transfers to Other Funds 20,955,527 21,320,965 21,888,006 21,588,006 23,058,146 8.15% 28.65%TOTAL GENERAL FUND 72,000,124 76,852,377 79,337,127 75,250,306 80,489,229 4.73% 100.00%*FY17 Adjusted includes FY17 adopted budget plus purchase orders written against the FY16 budget but spent against the FY17 budget.100

Legislative
101

Legislative FY2018
PROGRAM: LEGISLATIVE 111 Pursuant to the Town’s Charter, the Mayor and Town Council are elected at large by the electors of the Town. The Town Council enacts ordinances and resolutions, reviews and adopts the annual budget, and establishes policies and other measures which promote the general welfare of the Town and protect the health and safety of its citizens. Town Council members are elected for two-year terms, two in odd numbered years and three in even numbered years. The Mayor runs in odd numbered years for a two-year term and is not a voting member of the Council, but may vote to break a tie and may veto ordinances and resolutions, subject to Town Council override. Elected officials serve without pay. This program also includes funding allocations for lobbying services and Mayor and Town Council interaction with other government related agencies. These agencies include the Palm Beach County League of Cities, the Florida League of Cities, the Countywide Intergovernmental Coordination Program, and other local, State and Federal government organizations. Formal and informal interaction with other government representatives improves existing information exchange networks, and enables Town officials to provide better services to the community and protect the Town’s interests in Federal, State, and County legislative and administrative matters.
Contractual The proposed budget for contractual services includes costs related to general and Coastal Management Program lobbying. Commodities The proposed budget for commodities includes membership dues. Increase is associated with costs associated with hosting the annual meeting for the Palm Beach County League of Cities.
FY2015Actual
FY2016Actual
FY2017Budget
FY2017Adjusted*
FY2017Projected
FY2018Budget
%Change
Salaries and Wages - - - - - - 0.00%Employee Benefits - - - - - - 0.00%Contractual 137,414 149,719 143,100 143,100 130,150 143,100 0.00%Commodities 11,287 12,171 12,800 12,800 15,527 14,400 12.50%Capital Outlay - - - - - - 0.00%Depreciation - - - - - - 0.00%Other - - - - - - 0.00%TOTALS 148,701 161,890 155,900 155,900 145,677 157,500 1.03%
Expenditure Summary
*FY17 Adjusted includes FY17 adopted budget plus purchase orders w ritten against the FY16 budget but spent against the FY17 budget.
102
General Government
103
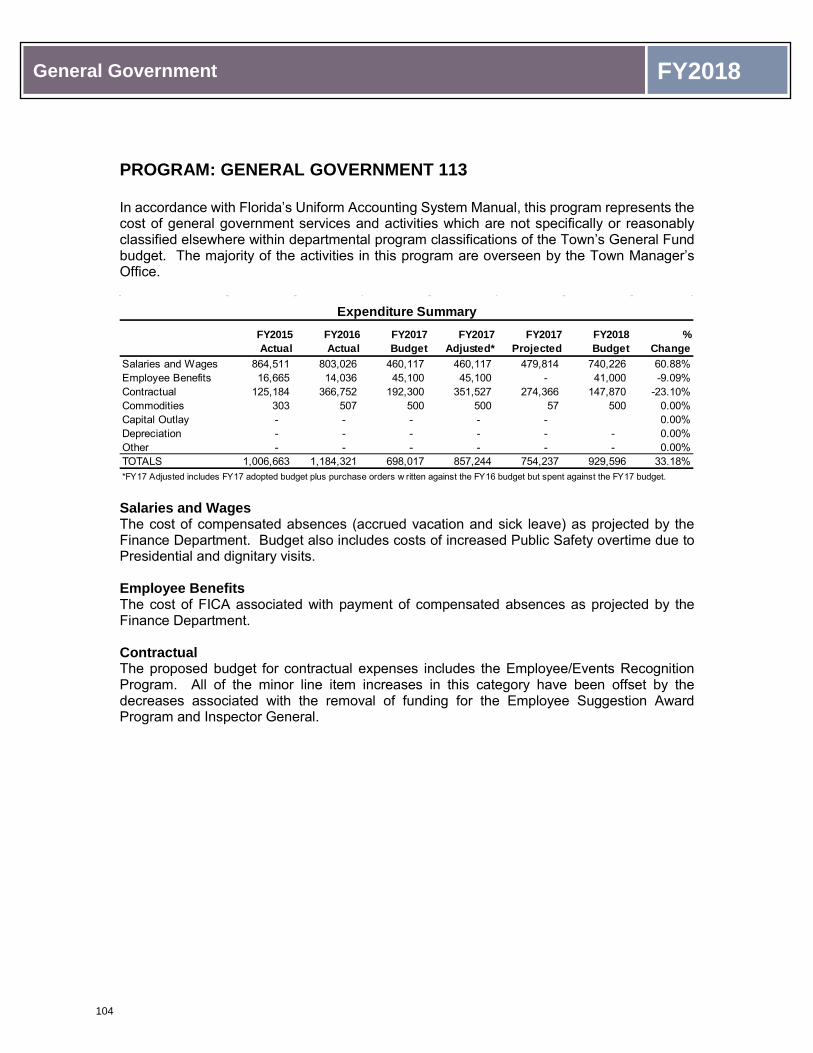
General Government FY2018
PROGRAM: GENERAL GOVERNMENT 113 In accordance with Florida’s Uniform Accounting System Manual, this program represents the cost of general government services and activities which are not specifically or reasonably classified elsewhere within departmental program classifications of the Town’s General Fund budget. The majority of the activities in this program are overseen by the Town Manager’s Office.
Salaries and Wages The cost of compensated absences (accrued vacation and sick leave) as projected by the Finance Department. Budget also includes costs of increased Public Safety overtime due to Presidential and dignitary visits. Employee Benefits The cost of FICA associated with payment of compensated absences as projected by the Finance Department. Contractual The proposed budget for contractual expenses includes the Employee/Events Recognition Program. All of the minor line item increases in this category have been offset by the decreases associated with the removal of funding for the Employee Suggestion Award Program and Inspector General.
FY2015Actual
FY2016Actual
FY2017Budget
FY2017Adjusted*
FY2017Projected
FY2018Budget
%Change
Salaries and Wages 864,511 803,026 460,117 460,117 479,814 740,226 60.88%Employee Benefits 16,665 14,036 45,100 45,100 - 41,000 -9.09%Contractual 125,184 366,752 192,300 351,527 274,366 147,870 -23.10%Commodities 303 507 500 500 57 500 0.00%Capital Outlay - - - - - 0.00%Depreciation - - - - - - 0.00%Other - - - - - - 0.00%TOTALS 1,006,663 1,184,321 698,017 857,244 754,237 929,596 33.18%
Expenditure Summary
*FY17 Adjusted includes FY17 adopted budget plus purchase orders w ritten against the FY16 budget but spent against the FY17 budget.
104

Town Manager
105
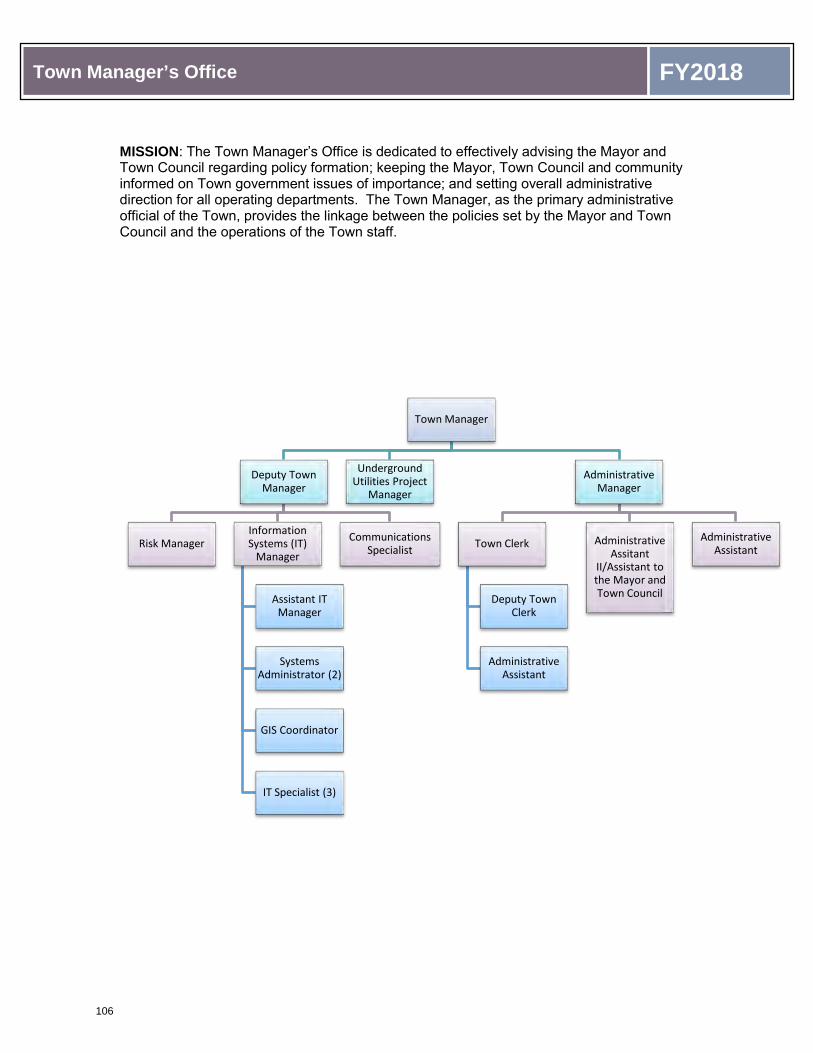
Town Manager’s Office FY2018
MISSION: The Town Manager’s Office is dedicated to effectively advising the Mayor and Town Council regarding policy formation; keeping the Mayor, Town Council and community informed on Town government issues of importance; and setting overall administrative direction for all operating departments. The Town Manager, as the primary administrative official of the Town, provides the linkage between the policies set by the Mayor and Town Council and the operations of the Town staff.
Town Manager
Deputy Town Manager
Risk ManagerInformation Systems (IT)
Manager
Assistant IT Manager
Systems Administrator (2)
GIS Coordinator
IT Specialist (3)
Communications Specialist
Underground Utilities Project
Manager
Administrative Manager
Town Clerk
Deputy Town Clerk
Administrative Assistant
Administrative Assitant
II/Assistant to the Mayor and Town Council
Administrative Assistant
106

Town Manager’s Office FY2018
Town Manager’s Office FY2018 Goals
Town Manager’s Office Goal #1
Develop a proposed General Fund budget for 2017/2018 that does not reduce service levels and is less than the Long Term Financial Plan (LTFP) General Fund assumptions for FY2018
Town Manager’s Office Goal #2
In conjunction with the Underground Utilities Task Force develop a recommended financing plan and the associated initial assessment for the Underground Utility Project. Hire the Underground Utilities Coordinator after the Town Council approves the project to facilitate better project area communications and monitoring of project milestones, budget and expenditures in conjunction with Public Works assigned staff project engineer.
Town Manager’s Office Goal #3
Develop and recommend a plan to improve enforcement of rules pertaining to construction related parking and related job site traffic impacts. Develop and implement a computer/software based traffic management tool to be used by staff to facilitate up-to-date data in the determination of ROW permit issuance to avoid conflicts in north/south roadway corridors, to facilitate the approval process, and notification to the public of pending road closures and detours. Develop a matrix listing “large” public and private construction projects, identifying traffic impacts on residents for each project and delineating if the project is anticipated to impact an arterial roadway. Based upon final matrix content ascertain feasibility of modifying schedule of Town controlled projects to minimize traffic impacts. Review data and ascertain need for construction moratorium on Fridays when POTUS comes to Town for large projects defined as any project generating more than 10 trips per day.
Town Manager’s Office Goal #4
Completed Master Plan for the Town Docks, with budget, projected revenues and expenses compared to existing budget, drawings, schedule for replacing docks with state-of-the-art facility, with no marina amenities, and identify grant funding sources and grant program funding amounts. Consider hiring marina expert to oversee process.
Town Manager’s Office Goal #5
If the new Recreation Center is approved, develop a financing plan for the Town’s share of the cost.
107

Town Manager’s Office FY2018
PROGRAM: ADMINISTRATIVE MANAGEMENT 121 Mission: Town Manager’s Office provides oversight and direction to all Town departments to promote continuous improvement of service delivery consistent with Town Council policy. Main Activities:
• Advise Mayor and Town Council and assist them in the adoption of sound policy decisions.
• Promote the Town’s vision/values. • Communicate clearly and continuously with residents, elected officials, staff, and
others both inside and outside the community. • Monitor and manage staff progress on Town programs and projects. • Deliver exceptional customer service to residents, elected officials, staff, and others
both inside and outside the community.
Salaries and Wages The salary budget is derived from the payroll data for the Full Time Equivalent Employees (FTE) listed in the table below. The budget includes pay for performance increases and the proposed increase in the ranges. One half of cost of Communications Specialist was added to this program but, that was mostly offset by one half of the cost of an Administrative Assistant being moved to the Risk Fund. Employee Benefits The employee benefit costs include FICA, health insurance, retirement costs, any paid incentives and allowances, and the performance bonus. The health insurance and retirement costs are based on an allocation of the total Town costs by FTE per program. Contractual The decrease in the proposed budget for contractual is due to the transfer of funds from travel/per diem account to a new training account in commodities. Additionally, funds that had been budgeted for scanning services have been reduced due to the fact that scanning has been transitioned to be accomplished in-house rather than being out-sourced. Commodities The proposed budget for commodities has increased due to the transfer of funds from travel/per diem to a new training account. Capital Outlay The cost attributed to capital outlay in fiscal year 2017 is the installation of cubicle furniture in the front office of the Town Manager’s office.
FY2015Actual
FY2016Actual
FY2017Budget
FY2017Adjusted*
FY2017Projected
FY2018Budget
%Change
Salaries and Wages 536,253 509,622 530,024 530,024 541,557 540,597 1.99%Employee Benefits 231,252 208,286 225,805 221,306 224,910 231,298 2.43%Contractual 7,414 34,603 16,700 28,302 29,954 16,297 -2.41%Commodities 6,562 7,261 9,400 9,400 8,143 10,300 9.57%Capital Outlay - - - - 5,436 - 0.00%Depreciation - - - - - - 0.00%Other - - - - - - 0.00%TOTALS 781,481 759,772 781,929 789,032 810,000 798,492 2.12%
Expenditure Summary
*FY17 Adjusted includes FY17 adopted budget plus purchase orders w ritten against the FY16 budget but spent against the FY17 budget.
108

Town Manager’s Office FY2018
Full Time Equivalent Employees FY2014 FY2015 FY2016 FY2017 FY2018Town Manager 1.000 1.000 1.000 1.000 1.000 Deputy Town Manager 1.000 1.000 1.000 1.000 1.000 Director of Recreation and Special Projects 0.100 0.100 - - - Communications Specialist - - - - 0.500 Executive Assistant 1.000 1.000 1.000 - - Administrative Manager - - - 1.000 1.000 Administrative Assistant II - - - 1.000 1.000 Administrative Assistant 2.000 2.000 2.000 1.000 0.500
5.100 5.100 5.000 5.000 5.000
109

(This page intentionally left blank)
110

Town Clerk
111

Town Clerk FY2018
PROGRAM: RECORDS MANAGEMENT 131
Mission: This division exists to provide reliable record keeping and efficient election management that meets the standards of the community.
Main Activities: The most important things we do to fulfill the mission are: • Take minutes and transcribe them in an accurate and timely fashion• Maintain official codes and documents• Coordinate and manage municipal elections• Process and issue various permits• Fulfill public records requests• Ensure record availability both electronically and by hard copy
FY2015Actual
FY2016Actual
FY2017Budget
FY2018Budget
Expenditures 349,843 287,450 351,507 358,385Revenues 44,870 49,835 57,000 57,000
-
50,000
100,000
150,000
200,000
250,000
300,000
350,000
400,000
Town Clerk
112

Town Clerk FY2018
Salaries and Wages The salary budget is derived from the payroll data for the Full Time Equivalent Employees (FTE) listed in the table below. The budget includes pay for performance increases and the proposed increase in the ranges.
Employee Benefits The employee benefit costs include FICA, health insurance, retirement costs, any paid incentives and allowances, and the performance bonus. The health insurance and retirement costs are based on an allocation of the total Town costs by FTE per program.
Contractual The decrease is due to lower costs associated with conducting a consolidated election, as well as due to the transfer of funds from travel/per diem account to a new training account in commodities.
Commodities The proposed budget for commodities has increased due to the transfer of funds from travel/per diem to a new training account.
Town Clerk Fiscal Year 2017 Accomplishments Conducted a successful 2017 municipal election
Provided records management and public records request training to all newemployees
FY2015Actual
FY2016Actual
FY2017Budget
FY2017Adjusted*
FY2017Projected
FY2018Budget
%Change
Salaries and Wages 218,187 168,179 181,342 181,342 187,566 187,344 3.31%Employee Benefits 79,468 79,916 103,515 100,931 100,953 108,807 5.11%Contractual 50,515 31,715 62,100 62,100 69,842 54,729 -11.87%Commodities 1,673 3,364 4,550 4,550 3,348 6,650 46.15%Capital Outlay - 4,276 - - - - 0.00%Depreciation - - - - - 855 100.00%Other - - - - - - 0.00%TOTALS 349,843 287,450 351,507 348,923 361,709 358,385 1.96%*FY16 Adjusted includes FY16 adopted budget plus purchase orders w ritten against the FY15 budget but spent against the FY16 budget.
Expenditure Summary
Full Time Equivalent Employees FY2014 FY2015 FY2016 FY2017 FY2018Town Clerk 1.000 1.000 1.000 1.000 1.000 Deputy Clerk - - 1.000 1.000 1.000 Document Management Coordinator 1.000 1.000 - - - Administrative Assistant 1.000 1.000 1.000 1.000 1.000
3.000 3.000 3.000 3.000 3.000
113

Town Clerk FY2018
Fiscal Year 2018 Goals and Performance Measures
Town Clerk Goal #1 – Recodification of the Code of Ordinances
Objectives: • To complete the recodification of the physical Code of Ordinances• To update and enhance the technical capabilities of the Town’s current web and
electronic versions of the Code
Performance Measures Effectiveness/Output Measures: Projected FY18
Physical Recodification Completed Town Council passes an ordinance adopting the new Code, which will then be printed and posted online
Incorporation and utilization of the included technical package
Enhanced accessibility, productivity and functionality of both the electronic and web versions of the new Code
Incorporation of the Town’s new website standards for the web version
Web version banner to match the Town’s new website
Town Clerk Goal #2 – Establish a Records Management Program
Objectives: • To establish a comprehensive Records Management Program in accordance
with F.S. 257.036(5)(b) and F.S. 119.021(2)(c)• To provide staff training• To work with the other departments to backscan and/or destroy eligible records
Performance Measures Effectiveness/Output Measures: Projected FY18
Records Management Policy adopted Program is approved and becomes a form Administrative Policy and Procedure
Staff training Records liaisons will be trained and the information will be disseminated to their respective departments
Enhanced use of Laserfiche All remaining departments will be brought online and customized work flows will be designed, as needed
Disposition of records that have met their retention period
Regular review of records and destructions will be scheduled
Town Clerk Productivity Measures
Effectiveness/Output Measures: Actual FY14
Actual FY15
Actual FY16
Actual FY17
Projected FY18
Public Records Requests 140 172 150 221 250 Meetings Attended & Minutes Taken 63 71 72 50 55 Charitable Solicitation Permits 151 130 125 118 125 All Other Permits 15 26 16 34 35 Board/Comm. Applications Processed 75 69 65 65 70
114

Advice and Litigation
115

Advice and Litigation FY2018
PROGRAM: ADVICE AND LITIGATION 122 The Town Attorney advises the Town’s elected officials and staff regarding legal matters concerning the Town of Palm Beach. The Town Attorney represents the Town in lawsuits, hearings, and other litigation matters and prepares contracts, deeds, ordinances, resolutions and other legal instruments for the Town. The Town Attorney, or his designee, attends Town Council, Architectural Commission, Code Enforcement Board, Landmarks Preservation Commission, Planning and Zoning Commission and other Town meetings to provide legal advice and direction regarding issues related to the deliberations of the Mayor, Town Council, Boards and Commissions. The Town Attorney is a contractual position serving at the pleasure of the Town Council. This program also includes funding for special counsel who advises and represents the Town in all collective bargaining, other labor related issues, and miscellaneous Town matters.
Contractual The proposed budget for contractual expenses includes litigation costs. Increase is associated with inflation costs for goods and services related to litigation.
FY2015Actual
FY2016Actual
FY2017Budget
FY2017Adjusted*
FY2017Projected
FY2018Budget
%Change
Salaries and Wages - - - - - - 0.00%Employee Benefits - - - - - - 0.00%Contractual 466,456 665,673 561,000 757,788 974,172 578,788 3.17%Commodities - - - - - - 0.00%Capital Outlay - - - - - - 0.00%Depreciation - - - - - - 0.00%Other - - - - - - 0.00%TOTALS 466,456 665,673 561,000 757,788 974,172 578,788 3.17%
Expenditure Summary
*FY17 Adjusted includes FY17 adopted budget plus purchase orders w ritten against the FY16 budget but spent against the FY17 budget.
116

Information Technology
117

Information Technology FY2018
PROGRAM: INFORMATION TECHNOLOGY 125
Mission: Provide a collaborative and cooperative enterprise approach in identifying, prioritizing, managing, supporting, partnering and successfully executing a service portfolio of digital initiatives and solutions aligning with town strategic goals and cross-functional vision through the use of industry standards, generally accepted principles and formal project management tools and techniques.
Main Activities: The most important things we do to fulfill the mission are: • Provide strategic direction and long-range planning for the development, deployment,
integration and operation of the foundational digital environment in support of evolving town-wide operations.
• Provide exceptional customer service and responsive remediation based on defined service levels.
• Establish and promote IT governance that includes IT Controls, Frameworks and Methodologies including Policies, Procedures (SOP), and Best Practices.
• Coordinate and direct services and solutions that ensure efficiency and effective use of digital resources.
• Provide and support digital solutions that support transparency and civic engagement. • Support collaboration of emerging digital resources among Town personnel and
residents. • Continuously evaluate the digital environment against emerging security threats and
provide annual security training. • Centralized systems support, service, programming and server high availability. • PC maintenance, upgrades, software compatibility. • Coordinate, regulate and educate regarding all computer, telephone and electronic
systems. • Coordinate the continued implementation of replacement computers and systems as
required. • Oversee GIS Systems Activities and assist Departments with the use of these systems
Salaries and Wages The salary budget is derived from the payroll data for the Full Time Equivalent Employees (FTE) listed in the table below. The budget includes pay for performance increases and the proposed increase in the ranges.
FY2015Actual
FY2016Actual
FY2017Budget
FY2017Adjusted*
FY2017Projected
FY2018Budget
%Change
Salaries and Wages 531,422 480,445 677,843 677,843 505,290 685,410 1.12%Employee Benefits 315,076 296,683 339,113 331,233 295,757 335,802 -0.98%Contractual 772,818 938,623 909,800 1,084,688 1,090,289 1,085,149 19.27%Commodities 130,726 114,908 156,800 156,800 91,483 179,164 14.26%Capital Outlay - 136,384 87,000 183,766 145,363 5,000 -94.25%Depreciation 247,800 289,488 289,857 289,857 289,857 308,480 6.42%Other - - - - - 0.00%TOTALS 1,997,842 2,256,531 2,460,413 2,724,187 2,418,039 2,599,005 5.63%
Expenditure Summary
*FY17 Adjusted includes FY17 adopted budget plus purchase orders w ritten against the FY16 budget but spent against the FY17 budget.
118

Information Technology FY2018
Employee Benefits The employee benefit costs include FICA, health insurance, retirement costs, any paid incentives and allowances, and the performance bonus. The health insurance and retirement costs are based on an allocation of the total Town costs by FTE per program. Contractual Increase is the result of additional consulting funds in support of new Microsoft Exchange managed support services, necessary network improvements, increased bandwidth, and new software maintenance expenses Commodities Increase is the result of transferring training funds from Travel and Per Diem under contractual category account to Training account under Commodities and additional staff development expenses. Capital Outlay Decrease is the result of the planned one-time purchase of Public Works work order management system in FY17.
Information Technology FY 2017 Accomplishments Completed deployment and migration from IBM Notes to Microsoft Exchange 2017,
SharePoint and Skype Completed comprehensive evaluation of cyber security posture through extensive
penetration testing and remediation Conducted mandatory cyber security training for all current and new town staff Increased security stack through the introduction of several additional layers of threat
protection Deployed new virtual sever environment with expanded capacity and migrated all
existing servers Conducted evaluation of failing data storage infrastructure and identified solution with
greater resiliency, redundancy and scalability. Deployed solution and initiated data migration process
Reorganized and centralized IT staff to allow for greater efficacy, cross-training and increased alignment with customer-centric engagement
Introduced formal project management framework, project tracking and engagement policy
Increased Internet bandwidth as a result of capacity limitations
Deployed next generation support tool for providing enhanced access and increased response time to end-users
Full Time Equivalent Employees FY2014 FY2015 FY2016 FY2017 FY2018Information Technology Manager 1.000 1.000 1.000 1.000 1.000 Assistant IT Manager - - - - 1.000 Systems Analyst 1.000 3.000 3.000 3.000 - Systems Administrator - - - - 2.000 GIS Coordinator 1.000 1.000 1.000 1.000 1.000 Information Technology Specialist 3.000 3.000 3.000 3.000 3.000
6.000 8.000 8.000 8.000 8.000
119

Information Technology FY2018
Fiscal Year 2018 Goals and Performance Measures Information Technology Goal #1 - Provide high availability network and Internet capacity, timely response to service requests, knowledgeable support and productive solutions Objectives:
• Track key performance indicators to minimize downtime, provide responsive customer service, and balance needs of daily operational issues and strategic initiatives
Performance Measures Effectiveness/Output Measures:
Actual FY14
Actual FY15
Actual FY16
Actual FY17
Projected FY18
Systems Availability 98% 98% 95% 98% 99.999%
Average Work Order Response time1 36 hours 40 Hours 6 Hours 4 Hours 1 Hours
Work Orders Completed 1,559 1,623 2,108 2,171 N/A
IS Staff Training (Hours) 200 300 399 274 300 *1 Reflects changes in calculation method starting FY 2016 Information Technology Goal #2 - Implement formal project management framework and controls for effectively managing and prioritizing town-wide projects and initiative. Objectives:
• Establish project database that tracks requested projects, allows for status updates, effective prioritization, and monitoring of ongoing strategic and operational initiatives
Performance Measures
Effectiveness/Output Measures:
Actual FY14
Actual FY15
Actual FY16
Actual FY17
Projected FY18
IT Projects Requested/Completed/Active2 N/A N/A N/A 61/22/39 N/A
GIS Projects Requested/Completed/Active2 N/A N/A N/A 55/30/25 N/A
*2 Category added as of mid-year FY17
120
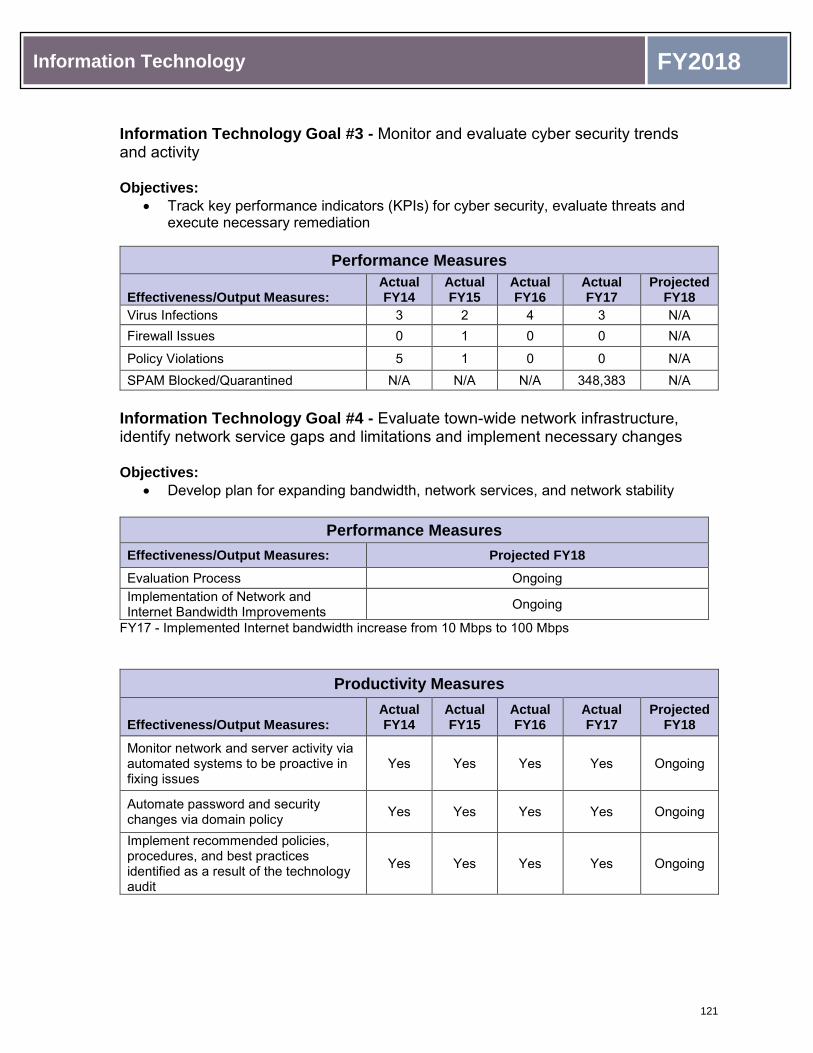
Information Technology FY2018
Information Technology Goal #3 - Monitor and evaluate cyber security trends and activity Objectives:
• Track key performance indicators (KPIs) for cyber security, evaluate threats and execute necessary remediation
Performance Measures Effectiveness/Output Measures:
Actual FY14
Actual FY15
Actual FY16
Actual FY17
Projected FY18
Virus Infections 3 2 4 3 N/A Firewall Issues 0 1 0 0 N/A
Policy Violations 5 1 0 0 N/A SPAM Blocked/Quarantined N/A N/A N/A 348,383 N/A
Information Technology Goal #4 - Evaluate town-wide network infrastructure, identify network service gaps and limitations and implement necessary changes Objectives:
• Develop plan for expanding bandwidth, network services, and network stability
Performance Measures Effectiveness/Output Measures: Projected FY18 Evaluation Process Ongoing Implementation of Network and Internet Bandwidth Improvements Ongoing
FY17 - Implemented Internet bandwidth increase from 10 Mbps to 100 Mbps
Productivity Measures
Effectiveness/Output Measures:
Actual FY14
Actual FY15
Actual FY16
Actual FY17
Projected FY18
Monitor network and server activity via automated systems to be proactive in fixing issues
Yes Yes Yes Yes Ongoing
Automate password and security changes via domain policy Yes Yes Yes Yes Ongoing
Implement recommended policies, procedures, and best practices identified as a result of the technology audit
Yes Yes Yes Yes Ongoing
121

(This page intentionally left blank)
122

Human Resources
123

Human Resources FY2018
Director
Assistant Director
Occupational Health Nurse
Town Physician (Contractual)
Office Assistant II (part-time)
HR Coordinator
HR Analyst HR Analyst
HR Specialist
124

Human Resources FY2018
Human Resources Department FY2018 Goals
Human Resources Department Goal #1: Manage the employee health insurance program in a manner that provides quality program resources in a legally compliant and fiscally responsible manner
OBJECTIVES: • Partner with Willis of Florida in order to evaluate the insurance program,
identify the most cost-effective deliverables from insurance vendors, and ensure quality health insurance options
• Build an employee wellness program focused on education in the top risk areas identified through employee participation in the annual wellness screenings
Human Resources Department Goal #2: Maintain a comprehensive training program that supports and develops staff competencies for their current roles and the roles they may serve in the future as leaders in the organization
OBJECTIVES: • Ensure employees and supervisors are provided training and continuing
education on all legal employment related matters • Evaluate recent and current training programs and ensure future offerings
align with job-related competencies
Human Resources Department Goal #3: Manage an efficient recruitment and on-boarding program that provides opportunities for the expedient selection and placement of quality applicants
OBJECTIVES: • Evaluate current recruitment processes and identify efficiencies to reduce
the turnaround time between job postings and job placement • Identify and implement enhancements to the applicant screening and
interview process in order to distinguish between good candidates and great candidates as future Town of Palm Beach employees
• Implement enhancements to the onboarding process to increase new hire engagement by increasing accessibility to policies, procedures, and training
125

Human Resources FY2018
Human Resources Department Goal #4: Provide retirement program education opportunities for all staff
OBJECTIVES: • Provide individual retirement education for all new hires that includes
explanation of the plan design and investment options for their desired retirement target
• Ensure all current and future employees have access to a wide variety of retirement education programs and resources, to include a retirement calculator that will assist employees in developing a retirement plan based on their target retirement goals
126

Human Resources FY2018
PROGRAM: HUMAN RESOURCES 123 Main Activities: The most important things we do to fulfill the Town’s mission are to provide cost effective and competitive compensation and benefit plans to employees; shield the Town from costly litigation related to employment issues; and provide support to employees, which enables them to serve the Town with pride.
Salaries and Wages The salary budget is derived from the payroll data for the Full Time Equivalent Employees (FTE) listed in the table below. The budget includes pay for performance increases and the proposed increase in the ranges. Employee Benefits The employee benefit costs include FICA, health insurance, retirement costs, any paid incentives and allowances, and the performance bonus. The health insurance and retirement costs are based on an allocation of the total Town costs by FTE per program. Contractual Per Finance, allocation of expenses associated with staff training was moved from contractual to commodities. Other changes in this section include fluctuations in recruiting expenses and implementation of a town-wide learning management system for training. Commodities Change in this area is due to a need to purchase new minor medical equipment for the Occupational Health Clinic to include an audiometer and spirometry machine (valued less than $5,000) used for pre-employment testing to ensure candidate ability to perform essential functions of the job. Capital Outlay Capital outlay includes the cost to replace outdated equipment in the Town’s Occupational Health Clinic. This includes new electrocardiogram (EKG) and vision screening equipment. Money from the equipment replacement fund is being used to cover 70% of the cost.
FY2015Actual
FY2016Actual
FY2017Budget
FY2017Adjusted*
FY2017Projected
FY2018Budget
%Change
Salaries and Wages 285,304 377,621 402,857 402,857 376,158 412,114 2.30%Employee Benefits 153,592 188,345 221,828 216,521 197,232 206,814 -6.77%Contractual 151,382 160,093 249,661 262,386 159,502 245,938 -1.49%Commodities 4,104 13,626 13,552 13,552 11,976 23,337 72.20%Capital Outlay - - - - - 3,700 100.00%Depreciation 677 677 677 677 677 677 0.00%Other - - - - - - 0.00%TOTALS 595,059 740,362 888,575 895,993 745,545 892,580 0.45%
Expenditure Summary
*FY17 Adjusted includes FY17 adopted budget plus purchase orders w ritten against the FY16 budget but spent against the FY17 budget.
127

Human Resources FY2018
Human Resources Fiscal Year 2017 Accomplishments
After maintaining level funding for the four straight fiscal years, there was a marginal increase of 4.5% for the Town’s employee health insurance program. This increase was distributed between an increase to employee contributions and health fund reserves.
Maintained level funding for the fifth consecutive fiscal year for the Town’s dental insurance program.
Provided assistance to employees and retirees during the open enrollment period; assisted employees with completion of the wellness activities; assisted employee and retirees with insurance changes; maintained greater than 90% participation in the Wellness Program for the fourth consecutive year.
Added on-site biometric screenings for employees during the open enrollment period; greater than 85% participation.
Completed a market analysis of the Flexible Spending benefit in order ensure the Town is effectively providing for the groups needs and is receiving the best possible savings.
Completed a market analysis of the Town’s long term disability benefit (LTD), identified a vendor that provides LTD along with two additional benefits, short-term disability and family medical leave administration; providing these services a lower cost. .
Introduced a new telemedicine benefit giving employees and eligible dependents 24/7/365 access to quality medical care through phone and video consults. All Teladoc doctors and pediatricians are U.S. board-certified and Florida licensed.
Increased resources available to supervisors to support the recruitment process and assist in selecting the best applicant such as Behavioral Based Interviewing training, qualified behavioral based interview question bank, and PI Worldwide training,
Ensured legally compliant recruitment program; reviewed and implemented Veteran’s Preference changes; updated Drug and Alcohol-free Workplace policy and procedures; required federal fingerprinting requirements for specific positions.
Full Time Equivalent Employees FY2014 FY2015 FY2016 FY2017 FY2018Director of Human Resources 0.776 0.776 0.776 0.776 0.776 Assistant Director 0.600 0.600 0.600 0.600 0.600 Occupational Health Nurse 1.000 1.000 0.500 0.500 0.500 Human Resources Analyst 0.900 0.900 1.900 1.800 1.800 HR Coordinator 0.350 0.350 0.350 0.350 0.350 HR Resource Specialist 0.375 0.630 0.625 0.625 0.625 Office Assistant II 0.375 0.375 0.375 0.375 0.375
4.376 4.631 5.126 5.026 5.026
128

Human Resources FY2018
Implemented and rolled out the new Insight recruitment on-line system which has been instrumental in providing candidates with real-time status updates regarding their applications for employment, creating process efficiencies while maintaining legal compliance, improving supervisory accessibility to recruitment activity, and reducing overall turnaround time of the recruitment process.
Facilitated and/or successfully responded to several employee relation matters including internal grievances, complaints, and a variety of employment related legal claims.
Distributed quarterly employee newsletter providing information regarding general human resources information, such as benefit and retirement information, for employees.
Created and distributed monthly supervisory newsletter providing information regarding maintaining legal compliance with employment laws, Town policies, and guidance for positive coaching and performance management of employees.
Created an e-Personnel Action Form for processing performance related payroll actions, using existing database resources versus manual entry to greatly improve overall accuracy of data and overall process efficiency.
Developed database driven reports and provided instant user accessibility for departments to track and self-monitor probationary periods and performance evaluation due dates.
Develop and distribute quarterly turnover reports and future known separation of employment data to Directors and Assistant Directors, and providing assistance as needed with the proactive recruitment of service essential positions.
Completed Town-wide audit of positions regarding compliance with the Fair Labor Standards Act ensure compliance to current and proposed regulation changes.
129

Human Resources FY2018
Fiscal Year 2018 Goals and Performance Measures Human Resources Goal #1 – Manage the employee health insurance and wellness program in a manner that provides quality program resources in a legally compliant and fiscally responsible manner
Performance Measures
Effectiveness/Output Measures:
Actual FY14
Actual FY15
Actual FY16
Actual FY17
Projected FY18
Total Fiscal Year End Health Insurance Plan Cost $5,583,113 $5,492,508 $5,773,975 $5,910,113 $6,560,054
% Change in Total Health Insurance Plan Cost 3.9% -1.6% 5.1% 2.4% 10.9%
Average annual insurance plan enrollment (employees and retirees)
446 439 433 440 434
Town Cost per employee/retiree per year based on total plan costs less employee/retiree contributions
$8,661 $8,099 $9,053 $9,278 $8,748
Number of benefit trainings offered to new employees 51 44 55 51 50
Number of Open Enrollment meetings held 8 8 8 2 2
Number of Open Enrollment and/or other benefit changes processed
846 681 265 297 522
Average number of days for claim issue resolution 1 1 1 1 1
Number of claim issues managed 96 118 83 87 98
Human Resources Goal #2 – Maintain a comprehensive training program that supports and develops staff competencies for their current roles and the roles they may serve in the future as leaders in the organization
Performance Measures
Effectiveness/Output Measures: Actual FY14
Actual FY15
Actual FY16
Actual FY17
Projected FY18
Number of workplace training classes offered (includes continuing education for Palm Beach County Commission on Ethics)
24 20 16 14 15
Workplace training attendees 230 130 425 256 325 Tuition reimbursement program participants 17 10 14 15 14
130

Human Resources FY2018
Human Resources Goal #3 – Manage an efficient recruitment and on-boarding program that provides opportunities for the expedient selection and placement of quality applicants
Performance Measures
Effectiveness/Output Measures: Actual FY14
Actual FY15
Actual FY16
Actual FY17
Projected FY18
Annual Turnover 11% 15% 14% 10% 13%
Number of advertised positions 44 50 49 54 50
Number of applications received 819 2,307 2,301 2,892 2,080 Number of pre-employment selection tests offered 324 247 251 301 280
Number of qualified applicants interviewed 345 473 749 553 530
Average number of calendar days from posting to offer 80 91 83 70 81
Total number of hires into budget approved positions:
Full-time Part-time
Part-time Partial Benefits Temporary
71
51 0 0 20
55
41 0 1 13
68
54 0 0
14
58
49 0 1 7
63
49 0 1 13
Number of orientation sessions held 8 7 8 7 8 Number of volunteer opportunities 12 11 10 11 0
Human Resources Goal #4 - Provide retirement program education opportunities for all staff
Performance Measures
Effectiveness/Output Measures: Actual FY14
Actual FY15
Actual FY16
Actual FY17
ProjectedFY18
Number of retirement education group meetings and webinars held 23 16 12 5 6
Number of one-on-one retirement counseling sessions held 329 109 99 85 98
131

Human Resources FY2018
Human Resources Productivity Measures
Effectiveness/Output Measures:
Actual FY14
Actual FY15
Actual FY16
Actual FY17
Projected FY18
Number of public record requests received and processed 107 51 105 161 106
Number of employment verifications received 40 27 94 119 70
Number of personnel action forms processed 344 482 607 507 485
Number of notary services provided 36 11 38 49 34
Number of non-town employment disclosures received 92 103 74 69 85
Number of acceptance of favors or gratuities disclosures received 71 104 72 107 89
Number of unemployment claims received 8 11 6 6 8
Savings from protested unemployment claims $18,738 $29,170 $10,475 $8,230 $16,653
Number of FMLA requests processed 36 70 70 41 54 Number of occupational clinic visits (non-workers compensation) 418 N/A 2151 3912 485
Number of Drug and Alcohol Free Workplace Tests Administered (includes pre-employment, DOT/random, and reasonable suspicion)
279 146 240 1822 227
1Clinic relaunch was 4/25/2016. Includes number of visits between 4/25/2016 and 9/30/2016 2Includes number of visits between 10/1/2016 and 6/14/2017.
132

Finance
133
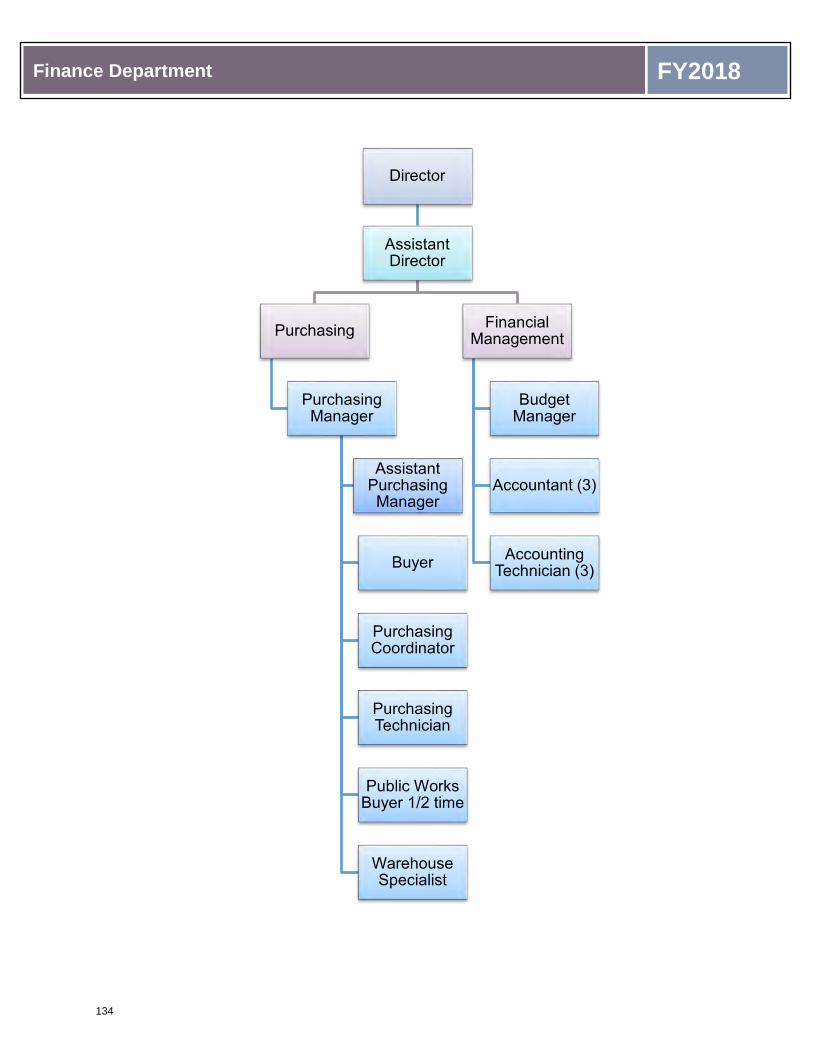
Finance Department FY2018
Director
Assistant Director
Financial Management
Budget Manager
Accountant (3)
Accounting Technician (3)
Purchasing
Purchasing Manager
Buyer
Purchasing Coordinator
Purchasing Technician
Public Works Buyer 1/2 time
Warehouse Specialist
Assistant Purchasing Manager
134

Finance Department FY2018
Finance Department FY2018 Goals
Finance Department Goal #1: Develop a General Fund budget for FY18 that does not reduce service levels and is less than the LTFP for FY18
OBJECTIVES: • Work with Town Manager and Directors to prepare a budget that meets the
Town Council Goal.
Finance Department Goal #2: Develop a financing plan for the Town-wide Underground Utilities project
OBJECTIVES: • Work with the UUTF, Consultants and the Town Council to prepare a cost
effective and comprehensive financing plan for the underground utilities project.
Finance Department Goal #3: Develop a financing plan for the Town’s share of the cost of the Recreation Center if approved
OBJECTIVES: • Work with town Manager, Financial Advisors, and staff to develop a low cost
financing plan for the Town’s share of the cost.
Finance Department Goal #4: Maximize Rate of Return on Investments While Applying the GFOA Best Practice Guidelines
OBJECTIVES: • The Town’s annualized rate of return exceeds that of the benchmark rate of
return for the investments.
Finance Department Goal #5: Provide Purchasing training to new Town employees and those desiring a refresher course
OBJECTIVES: • To provide staff training to as many employees that handle purchasing duties
within their departments as possible. • Provide basic purchasing training to all new employees.
135

Finance Department FY2018
DEPARTMENT: FINANCE Mission: The Finance Department is dedicated to providing the highest quality service through a commitment to excellence, integrity and teamwork. We serve the finance, purchasing and record management needs of the Town Council, citizens, Town Manager, Town employees and general public. We provide publications and information to inform citizens and other interested parties regarding the financial position and operations of the Town. We use Generally Accepted Accounting Principles and GFOA budgeting standards to assure that policy makers and the community are well informed and the Town remains fiscally strong. It is important to us to perform our duties efficiently effectively, reliably, and accurately. We take pride in serving our elected officials, our fellow employees and our community.
2015 Actual 2016 Actual 2017
Budget 2017
Projected 2018
Budget %
ChangeTaxi Permits 5,925 5,625 - 4,975 4,000 100.00%Newsrack Enclosure Admin Fee 940 920 1,000 620 1,000 0.00%Lien Search Fee 35,005 32,515 33,000 35,025 35,000 6.06%
41,870 39,060 34,000 40,620 40,000 17.65%
Revenue Summary
FY2015Actual
FY2016Actual
FY2017Budget
FY2017Adjusted*
FY2017Projected
FY2018Budget
%Change
Salaries and Wages 951,558 987,727 1,042,339 1,042,339 1,003,327 1,037,299 -0.48%Employee Benefits 440,881 474,361 532,302 518,775 521,467 585,898 10.07%Contractual 129,533 122,390 155,050 157,476 121,572 139,195 -10.23%Commodities 23,031 22,432 23,900 23,900 31,174 26,825 12.24%Capital Outlay - - - - - - 0.00%Depreciation 3,363 4,705 4,204 4,204 4,204 3,854 -8.33%Other - - - - - - 0.00%TOTALS 1,548,366 1,611,615 1,757,795 1,746,694 1,681,744 1,793,071 2.01%*FY17 Adjusted includes FY17 adopted budget plus purchase orders w ritten against the FY16 budget but spent against the FY17 budget.
Expenditure Summary
136

Finance Department FY2018
FY2015 FY2016 FY2017 FY2018 Total Full Time Equivalent Employees 18.641 18.563 15.563 15.563
FY2015Actual
FY2016Actual
FY2017Budget
FY2018Budget
Expenditures 1,548,366 1,611,615 1,757,795 1,793,071Revenues 41,870 39,060 34,000 40,000
- 200,000 400,000 600,000 800,000
1,000,000 1,200,000 1,400,000 1,600,000 1,800,000 2,000,000
Finance
Financial Management;
$1,085,812 ; 61%
Purchasing; $707,259 ; 39%
137

Finance Department FY2018
PROGRAM: FINANCIAL MANAGEMENT 141 Mission: This division exists to provide central accounting, fiscal control and professional advice and recommendations in the formation of sound fiscal policies to ensure long-term financial strength for the Town of Palm Beach. Main Activities: The most important things we do to fulfill the mission are:
• Advise the Town Council and Manager regarding financial matters • Develop and recommend administrative and Council fiscal policy • Provide internal checks and balances regarding financial control and purchasing
procedures • Develop and submit an annual budget that is reliable and balanced • Direct purchasing activities in an efficient effective manner
Salaries and Wages The salary budget is derived from the payroll data for the Full Time Equivalent Employees (FTE) listed in the table below. The budget includes pay for performance increases and the proposed increase in the ranges. Employee Benefits The employee benefit costs include FICA, health insurance, retirement costs, any paid incentives and allowances, and the performance bonus. The health insurance and retirement costs are based on an allocation of the total Town costs by FTE per program. Contractual The contractual decrease is mainly due to a decrease in bank service charges for online parking ticket payments that are now charged against the revenue to show a true picture of revenues for parking. Commodities The small increase reflects a minor increase in membership dues.
FY2015Actual
FY2016Actual
FY2017Budget
FY2017Adjusted*
FY2017Projected
FY2018Budget
%Change
Salaries and Wages 565,706 577,937 601,991 601,991 581,835 596,159 -0.97%Employee Benefits 267,149 286,262 312,320 303,752 306,191 342,639 9.71%Contractual 123,662 111,723 143,500 145,104 101,370 129,800 -9.55%Commodities 15,962 15,971 16,700 16,700 18,789 16,900 1.20%Capital Outlay - - - - - - 0.00%Depreciation - 314 314 314 314 314 0.00%Other - - - - - - 0.00%TOTALS 972,479 992,207 1,074,825 1,067,861 1,008,499 1,085,812 1.02%*FY17 Adjusted includes FY17 adopted budget plus purchase orders w ritten against the FY16 budget but spent against the FY17 budget.
Expenditure Summary
138

Finance Department FY2018
Finance Program Fiscal Year 2017 Accomplishments Produced a budget with a reduction in the millage rate of 2.05%
Implemented a Town-wide underground utility assessment
Worked with the Finance and Taxation committee to develop a cost effective modification to the Public Safety Pension Plan. Implemented on October 1, 2016
Awarded the Certificate of Achievement for Excellence in Financial Reporting for the 29th consecutive year by the Government Finance Officers Association of the United States and Canada
Awarded the Distinguished Budget Presentation Award for the 25th year by the Government Finance Officers Association of the United States and Canada
Developed a 10-year LTFP forecast. The forecast was used to develop the FY18 budget which was less than the LTFP forecast achieving the Town Council goal
Implemented a performance dashboard for the UUTF
Worked with Town auditors to Implement GASB 72
Full Time Equivalent Employees FY2014 FY2015 FY2016 FY2017 FY2018Finance Director 0.926 0.926 0.850 0.850 0.850 Assistant Finance Director 0.981 0.981 0.975 0.975 0.975 Accounting Supervisor 0.977 0.977 0.950 0.950 -Budget Manager - - - - 0.950 Accounting Assistant 3.000 3.000 2.000 2.000 -Accounting Technician 1.988 1.988 2.988 2.988 2.988 Accountant - - - - 2.800 Payroll Specialist 0.769 0.769 0.800 0.800 -
8.641 8.641 8.563 8.563 8.563
139
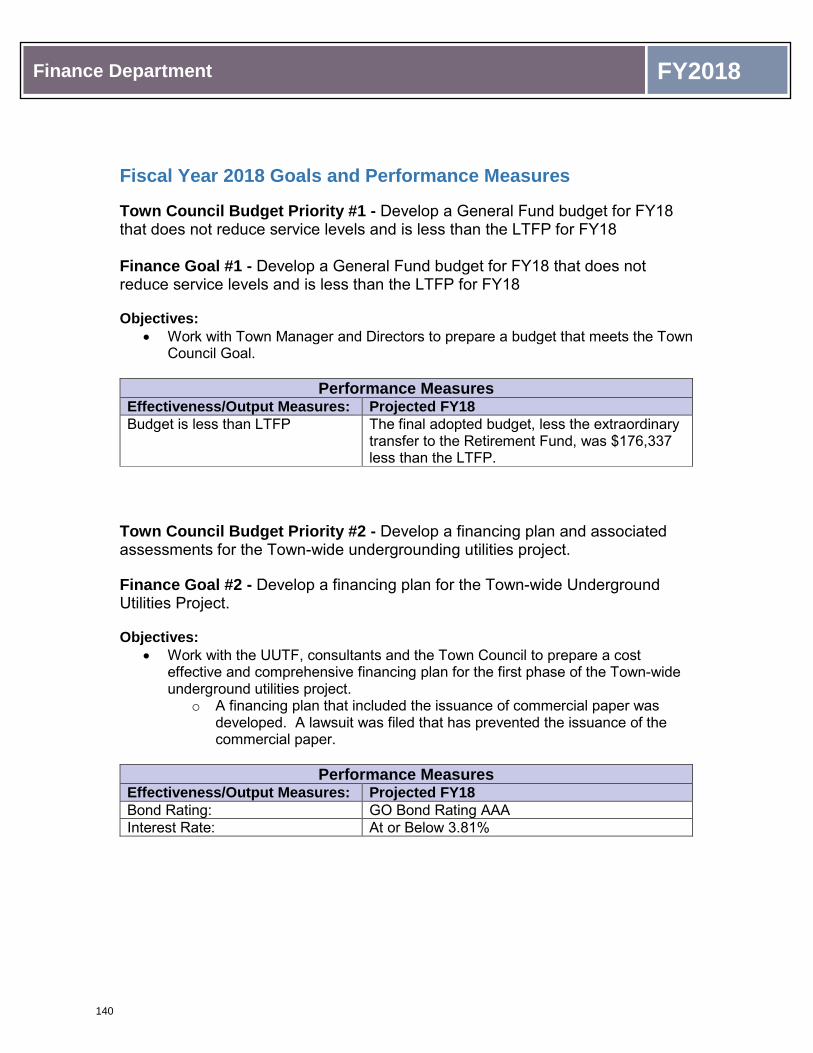
Finance Department FY2018
Fiscal Year 2018 Goals and Performance Measures Town Council Budget Priority #1 - Develop a General Fund budget for FY18 that does not reduce service levels and is less than the LTFP for FY18 Finance Goal #1 - Develop a General Fund budget for FY18 that does not reduce service levels and is less than the LTFP for FY18 Objectives:
• Work with Town Manager and Directors to prepare a budget that meets the Town Council Goal.
Performance Measures
Effectiveness/Output Measures: Projected FY18 Budget is less than LTFP The final adopted budget, less the extraordinary
transfer to the Retirement Fund, was $176,337 less than the LTFP.
Town Council Budget Priority #2 - Develop a financing plan and associated assessments for the Town-wide undergrounding utilities project.
Finance Goal #2 - Develop a financing plan for the Town-wide Underground Utilities Project. Objectives:
• Work with the UUTF, consultants and the Town Council to prepare a cost effective and comprehensive financing plan for the first phase of the Town-wide underground utilities project.
o A financing plan that included the issuance of commercial paper was developed. A lawsuit was filed that has prevented the issuance of the commercial paper.
Performance Measures
Effectiveness/Output Measures: Projected FY18 Bond Rating: GO Bond Rating AAA Interest Rate: At or Below 3.81%
140

Finance Department FY2018
Town Council Goal #5 - If the new Recreation Center is approved, develop a financing plan for the Town’s share of the cost. Finance Department Goal #3 - Develop a financing plan for the Town’s share of the cost of the Recreation Center if approved. Objectives:
• Work with Town Manager, Financial Advisors, and staff to develop a low-cost financing plan for the Town’s share of the cost.
Performance Measures
Effectiveness/Output Measures: Projected FY18 Bond Rating GO Bond Rating AAA or Revenue Bond rating of
AA+ Interest Rate Lowest Available
Finance Goal #4 - Maximize rate of return on investments while applying the GFOA Best Practice guidelines. Objectives:
• The Town’s annualized rate of return exceeds that of the benchmark rate of return for the investments.
Performance Measures
Effectiveness/Output Measures:
Actual FY14
Actual FY15
Actual FY16
Actual FY17
Projected FY18
Town’s annualized blended return .64% 1.40% 1.56% 0.79% 2.00% Town’s benchmark return .59% 1.44% 0.93% 0.48% 2.00%
Finance Productivity Measures
Effectiveness/Output Measures:
Actual FY14
Actual FY15
Actual FY16
Actual FY17
Projected FY18
Credit Rating – Issuer AAA AAA AAA AAA AAA Credit Rating – Revenue Bond AA+ AA+ AA+ AA+ AA+ Number of Management Letter Comments in audit 0 1 1 0 0
Parking Ticket Collection Rate 85.9% 87.6% 84% 88% 85%
141

Finance Department FY2018
PROGRAM: PURCHASING 144 Mission: The Purchasing Division provides professional procurement services to the Town Departments while ensuring compliance with County Ethics Commission, Inspector General, Florida State Statutes, and Town Purchasing Policies and Procedures. These services include purchase of supplies, equipment and services in an efficient, effective manner as well as managing the purchasing card program, the fixed asset inventory, central stores warehouse, and surplus property. Main activities: The most important things we do to fulfill the mission are:
• Develop and administer purchasing policies consistent with established policies and procedures and sound business practice.
• Continually seek to improve procurement and inventory processes while providing top quality service and products.
• Ensure delivery of critical purchases on time • Maintain positive vendor relationships • Evaluate warehouse stock to minimize long term storage and obsolete materials
Salaries and Wages The salary budget is derived from the payroll data for the Full Time Equivalent Employees (FTE) listed in the table below. The budget includes pay for performance increases and the proposed increase in the ranges. Employee Benefits The employee benefit costs include FICA, health insurance, retirement costs, any paid incentives and allowances, and the performance bonus. The health insurance and retirement costs are based on an allocation of the total Town costs by FTE per program. Contractual Decrease is due to hiring of full-time staff member in FY2017 Commodities Redesign workspace with technology
FY2015Actual
FY2016Actual
FY2017Budget
FY2017Adjusted*
FY2017Projected
FY2018Budget
%Change
Salaries and Wages 385,852 409,790 440,348 440,348 421,492 441,140 0.18%Employee Benefits 173,732 188,099 219,982 215,023 215,276 243,259 10.58%Contractual 5,871 10,667 11,550 12,372 20,202 9,395 -18.66%Commodities 7,069 6,461 7,200 7,200 12,385 9,925 37.85%Capital Outlay - - - - - - 0.00%Depreciation 3,363 4,391 3,890 3,890 3,890 3,540 -9.00%Other - - - - - - 0.00%TOTALS 575,887 619,408 682,970 678,833 673,245 707,259 3.56%*FY17 Adjusted includes FY17 adopted budget plus purchase orders w ritten against the FY16 budget but spent against the FY17 budget.
Expenditure Summary
142

Finance Department FY2018
Purchasing Fiscal Year 2017 Accomplishments During FY17, the Purchasing Manager retired and the Assistant Purchasing Manager left for
a promotional opportunity outside the Town of Palm Beach. Both a new Purchasing Manager and new Assistant Purchasing Manager were hired in late May.
Both new managers have completed extensive outreach to all operating departments and divisions with a goal of learning needs. Goal is to develop strategic sourcing opportunities with user departments input.
Began a series of training courses offered by Florida Atlantic University on best purchasing practices for departments. This will continue into FY18 with goal of improving efficiencies.
Conducted review of warehouse inventory with user departments with goal of eliminating parts no longer required to support Town activities. 388 line items of inventory were deleted.
Streamlined purchase order distribution process to have system automatically generate email purchase order to vendor thereby producing a cost savings to the Town, as well as promoting a significant efficiency to the Division.
Contracted with Public Surplus to auction obsolete fleet and equipment with goal of increasing surplus revenue by 20%. The Town had previously utilized the County Thrift Store for sale of equipment which only had a local Palm Beach County audience. Public Surplus will provide access to continents for sale of equipment.
Worked with provider of online services for posting of bids (ITB’s, RFP’s and RFQ’s) to electronically receive them vs. mailing the responses back to Town with goal of greater transparency.
Identified cost savings of $143,321 since both new positions started in May with goal of working towards greater cost savings in FY18.
Successfully completed Warehouse Physical Inventory. Developed and implemented annual evaluation of vendor performance as a metric for
contract renewal. Conducted review of existing Policy and Procedure Manual with goal of releasing new
manual in fall 2017. Promoted efficiency measure to benchmark review of other purchasing organizations with
goal of initiating best business models and cost savings. Goal for implementation is fall 2017.
Attended local NIGP Cooperative Meetings with goal of achieving best business modeling and use of local Cooperative Contracts.
Full Time Equivalent Employees FY2014 FY2015 FY2016 FY2017 FY2018Purchasing Manager 1.000 1.000 1.000 1.000 1.000 Assistant Purchasing Manager 1.000 1.000 1.000 1.000 1.000 Buyer 1.000 1.000 1.500 1.500 1.500 Purchasing Technician 1.000 1.000 1.000 1.000 1.000 Warehouse Coordinator 1.000 1.000 1.000 1.000 1.000 Purchasing Coordinator 1.000 1.000 1.000 1.000 1.000 Public Works Purchasing Coordinator 0.500 0.500 - - - Courier/Warehouse Assistant - 0.500 0.500 0.500 0.500
6.500 7.000 7.000 7.000 7.000
143

Finance Department FY2018
Fiscal Year 2018 Goals and Performance Measures Finance Department Goal #5 - Provide updated purchasing training to new Town employees and those desiring a refresher course.
Performance Measures Effectiveness/Output Measures: Actual FY17 Projected FY18
Number of employees trained 55 65
Purchasing Productivity Measures
Effectiveness/Output Measures:
Actual FY14
Actual FY15
Actual FY16
Actual FY17
Projected FY18
Purchase Orders Written 1,868 1,648 1,648 1,698 1,700
Bids, RFPs, RFQs 48 50 48 43 55
Quotations ($5,000 - $25,000) 143 135 103 79 100
Warehouse: Number of issues 2419 2622 2725 2,530 2,500 Dollars Spent Using Purchasing Cards $732,977 $812,746 $775,990 $734,971 $1,000,000
Cost Avoidance $238,812 $561,674 $326,868 $157,375 $300,000
144

Planning, Zoning, Building
145

Planning, Zoning and Building FY2018
Director
Assistant Director
Office Manager
Development Technicians (3)
Commission Clerk
Stormwater Management
EngineerZoning
Administrator
ZoningTechnician
Building Official
Combo Plan Review/Inspector (2)
Chief Building Inspector
Chief Plumbing/Mechanical/
Gas Inspector
Combo Inspector (2)
Planning Administrator
Records Manager
Development Geoprocessor
Records Custodian
(0.5)
Administrative Aide to Director
146

Planning, Zoning and Building FY2018
Planning, Zoning & Building Department FY2018 Goals
PZB Department Goal #1: Continue to Monitor Development in West Palm Beach and recommend strategies to address impacts to the Town.
OBJECTIVES: • Conduct periodic reviews of West Palm Beach development and provide
information to the Town Council regarding same. • Collect and review annual traffic counts to monitor impact on transportation. • Provide input to the City of West Palm Beach on planning and zoning
matters at the direction of the Town Council, with the intent of lessening or mitigating potential objectionable impacts of development on Town Levels of Service.
PZB Department Goal #2: Facilitate Digital Tracking of Applications/Reduce the Amount of Paper Processed/Generated Within the Department
OBJECTIVES: • Continue implementation of digital submission and tracking of Development
Review Applications, including tracking on the web. • Complete the conversion for processing all right-of-way (PW) permits to the
Eden permitting software system. This was completed for all 9 r-o-w permit types: construction, parking, work in r-o-w, dewatering, driveways, excavation, water/sewer service, deliveries, and other.
• Investigate potential application/scanning options that will streamline the flow of paperwork within the Department.
147

Planning, Zoning and Building FY2018
DEPARTMENT: PLANNING, ZONING AND BUILDING Mission: The Planning, Zoning and Building Department identifies, recommends and implements the vision of the community, as expressed through the policies of the Town Council, relative to the development, redevelopment and use of real property, to ensure the beauty, quality of life and character of the Town, and the health, safety and welfare of our residents, businesses and visitors, while providing the highest quality of service to our customers.
2015 Actual 2016 Actual 2017
Budget 2017
Projected 2018
Budget %
ChangeBusiness Tax Receipts 659,635 679,915 672,000 672,000 705,600 5.00%Business Tax Receipt Penalties 22,793 43,734 25,000 28,737 25,000 0.00%Building 6,754,745 5,780,693 4,100,000 4,270,480 4,200,000 2.44%Electrical 575,422 674,734 425,000 477,024 425,000 0.00%Plumbing 372,442 427,499 290,000 278,632 290,000 0.00%Permit Processing 47,775 38,150 30,000 36,300 35,000 16.67%Permit Penalty 121,606 241,547 43,000 92,063 85,000 97.67%Except/Var. App. 172,361 219,059 162,500 207,429 186,800 14.95%Consultants Fees - 4,825 - 26,161 - 0.00%Special Plan Review Fee 520,950 499,950 370,000 348,800 430,000 16.22%Reinspection Fees 2,325 3,825 2,500 5,400 6,500 160.00%Special Detail - PZB - 80 - 160 - 0.00%Abandonments 381 1,244 - - - 0.00%Architectural Fees 174,010 148,010 140,000 160,030 150,000 7.14%Landmarks Submittal 26,620 25,900 25,000 31,675 40,000 60.00%Mechanical Permits 490,507 445,245 325,000 332,320 335,000 3.08%Contractor Registration Fee 9,500 8,656 10,000 8,850 10,750 7.50%Landscape Permit 10,731 13,378 10,000 14,758 44,000 340.00%Advanced Irrigation 300 600 1,000 900 300 -70.00%Miscellaneous Permit Fees - - - 4,500 2,025 100.00%Building Permit Search Fee 35,200 27,800 30,000 31,650 40,500 35.00%Dune Vegetation Fee - - 2,000 840 1,000 -50.00%Permit Revision Fee 193,975 230,150 190,000 162,825 190,000 0.00%Right Of Way Permits 369,973 487,565 350,000 381,824 360,000 2.86%Flood Plain Mgmt Permit Fee 16,800 12,679 12,000 9,608 12,000 0.00%County Occ. Licenses 15,040 24,199 15,000 19,598 15,000 0.00%Tent Permits 21,074 14,298 20,000 19,282 20,000 0.00%Bldg. Insp. Fund Fees 12,696 11,264 10,000 8,308 10,000 0.00%Radon Gas 12,597 11,212 10,000 7,718 10,000 0.00%Certification Copy 1,027 1,027 500 826 500 0.00%Microfiche/Scanned Documents 131 62 250 37 250 0.00%Code Compliance Fines 142,380 183,705 175,000 173,294 150,000 -14.29%Code Compliance Admin Fee 9,175 7,000 10,000 4,950 7,000 -30.00%Credit Card Customer Surcharge 6,325 8,907 6,000 8,435 9,000 50.00%
10,798,496 10,276,912 7,461,750 7,825,414 7,796,225 4.48%
Revenue Summary
148

Planning, Zoning and Building FY2018
FY2015 FY2016 FY2017 FY2018 Full Time Equivalent Employees 27.250 28.250 28.250 28.250
FY2015Actual
FY2016Actual
FY2017Budget
FY2017Adjusted*
FY2017Projected
FY2018Budget
%Change
Salaries and Wages 1,989,767 1,940,578 2,100,251 2,100,251 2,032,265 2,111,721 0.55%Employee Benefits 916,917 962,820 1,080,701 1,058,321 1,054,046 1,097,873 1.59%Contractual 895,224 911,728 938,400 1,187,594 799,859 903,460 -3.72%Commodities 47,119 60,136 80,150 101,171 68,145 115,687 44.34%Capital Outlay - 12,781 7,000 7,000 - - -100.00%Depreciation 33,921 37,649 110,097 110,097 110,097 104,568 -5.02%Other - - - - - - 0.00%TOTALS 3,882,948 3,925,692 4,316,599 4,564,434 4,064,412 4,333,309 0.39%
Expenditure Summary
*FY17 Adjusted includes FY17 adopted budget plus purchase orders w ritten against the FY16 budget but spent against the FY17 budget.
FY2015Actual
FY2016Actual
FY2017Budget
FY2018Budget
Expenditures 3,882,948 3,925,692 4,316,599 4,349,563Revenues 10,798,496 10,276,912 7,461,750 7,796,225
-
2,000,000
4,000,000
6,000,000
8,000,000
10,000,000
12,000,000
14,000,000
Planning, Zoning & Building
Planning & Zoning; $673,410 ; 16%
Permit Issuance; $1,431,560 ; 33%
Inspection/Compliance; $1,427,808 ; 33%
Landmarks Preservation; $169,488 ; 4%
Fire Prevention; $314,311 ; 7%
Code Enforcement; $316,732 ; 7%
149

Planning, Zoning and Building FY2018
PROGRAM: PLANNING AND ZONING 211 Mission: This division exists to stabilize and preserve the aesthetic, historical and economic values of Palm Beach. Main Activities: The most important things we do to fulfill the mission are:
• Coordination and support of commissions • Conduct planning and zoning studies, and recommend changes where necessary • Develop, recommend, implement and enforce policies in a highly professional
manner • Maintain all maps and data contained in the Comprehensive Plan and Land
Development Regulations • Interpret zoning code, Comprehensive Plan and Land Development Regulations and
process applications • Keep citizens informed of policies and procedures and solicit input from citizens • Work continually to improve the efficiency and effectiveness of systems and staff
Salaries and Wages The salary budget is derived from the payroll data for the Full Time Equivalent Employees (FTE) listed in the table below. The budget includes pay for performance increases and the proposed increase in the ranges. Employee Benefits The employee benefit costs include FICA, health insurance, retirement costs, any paid incentives and allowances, and the performance bonus. The health insurance and retirement costs are based on an allocation of the total Town costs by FTE per program. Contractual Includes costs associated with legal services, general planning activities, periodic traffic counts and the final year of the review of the Comprehensive Plan required by the State under the Community Planning Act (F.S. 163.3164) Commodities Includes office and computer supplies and replacement costs, and continued software enhancements
FY2015Actual
FY2016Actual
FY2017Budget
FY2017Adjusted*
FY2017Projected
FY2018Budget
%Change
Salaries and Wages 339,066 321,706 347,721 347,721 345,444 344,276 -0.99%Employee Benefits 141,790 155,661 150,785 148,201 148,103 138,702 -8.01%Contractual 215,796 159,353 178,000 229,327 214,126 160,410 -9.88%Commodities 6,988 7,512 16,000 19,750 9,952 29,852 86.58%Capital Outlay - - - - - - 0.00%Depreciation 170 170 170 170 170 170 0.00%Other - - - - - - 0.00%TOTALS 703,810 644,402 692,676 745,169 717,795 673,410 -2.78%
Expenditure Summary
*FY17 Adjusted includes FY17 adopted budget plus purchase orders w ritten against the FY16 budget but spent against the FY17 budget.
150

Planning, Zoning and Building FY2018
Planning & Zoning Program Fiscal Year 2017 Accomplishments
All Development Review Applications placed on the Web for Public View
All Planning & Zoning Commission Meeting Backup placed on Web for Public View
All ARCOM Applications placed on the Web for Public View
All Landmarks Applications placed on the Web for Public View
Individualized Staff Reports Containing Information Collected From all Departments, are now Generated using Eden Software and Included in Monthly Town Council Book
The Town’s Comprehensive Plan was Updated and Approved by the Florida Department of Economic Development
Full Time Equivalent Employees FY2014 FY2015 FY2016 FY2017 FY2018Director 0.700 0.700 0.700 0.700 0.700 Assistant Director 0.350 0.350 0.350 0.350 0.350 Zoning Administrator 1.000 1.000 1.000 1.000 1.000 Zoning Technician - - 1.000 0.500 0.500 Development Review Specialist 0.500 0.500 - - - Administrative Assistant - - 0.500 - - Planning Administrator 0.400 0.400 0.400 0.400 0.400 Administrative Aide 0.500 0.500 0.500 0.500 0.500 Office Manager 0.120 0.120 0.120 0.120 0.120
3.570 3.570 4.570 3.570 3.570
151
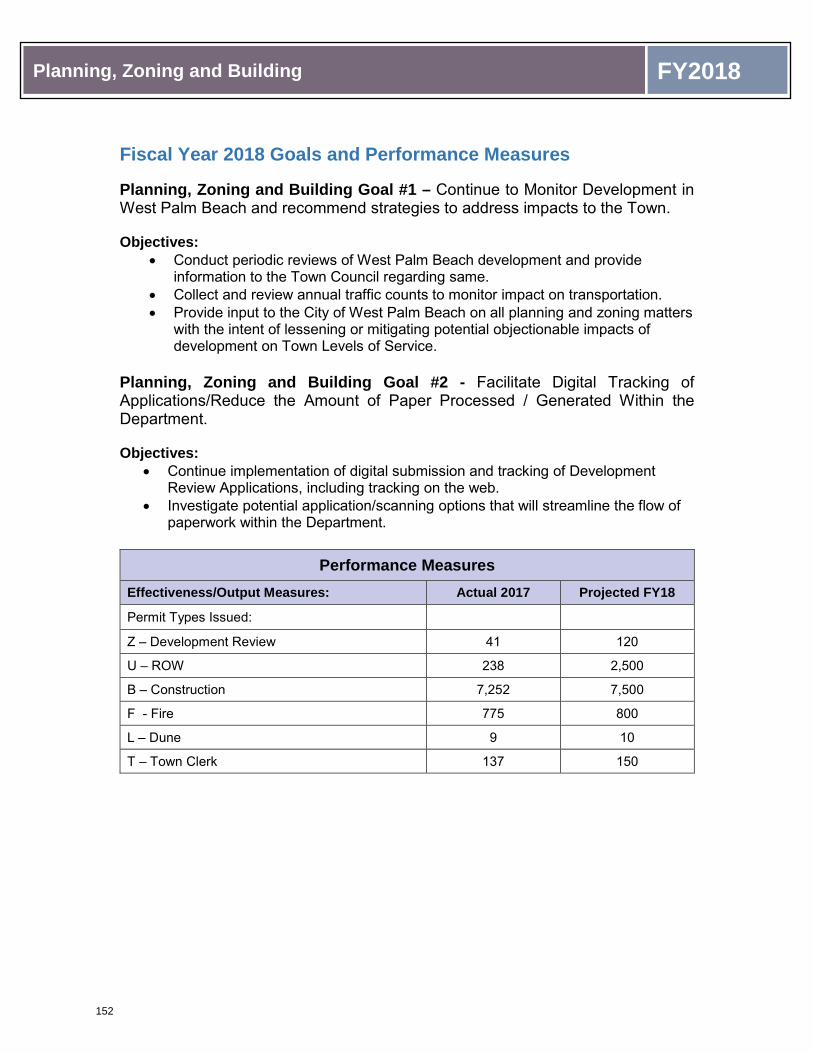
Planning, Zoning and Building FY2018
Fiscal Year 2018 Goals and Performance Measures
Planning, Zoning and Building Goal #1 – Continue to Monitor Development in West Palm Beach and recommend strategies to address impacts to the Town.
Objectives: • Conduct periodic reviews of West Palm Beach development and provide
information to the Town Council regarding same.• Collect and review annual traffic counts to monitor impact on transportation.• Provide input to the City of West Palm Beach on all planning and zoning matters
with the intent of lessening or mitigating potential objectionable impacts ofdevelopment on Town Levels of Service.
Planning, Zoning and Building Goal #2 - Facilitate Digital Tracking of Applications/Reduce the Amount of Paper Processed / Generated Within the Department.
Objectives: • Continue implementation of digital submission and tracking of Development
Review Applications, including tracking on the web.• Investigate potential application/scanning options that will streamline the flow of
paperwork within the Department.
Performance Measures Effectiveness/Output Measures: Actual 2017 Projected FY18
Permit Types Issued:
Z – Development Review 41 120
U – ROW 238 2,500
B – Construction 7,252 7,500
F - Fire 775 800
L – Dune 9 10
T – Town Clerk 137 150
152

Planning, Zoning and Building FY2018
Planning & Zoning Productivity Measures
Effectiveness/Output Measures: Actual FY14
Actual FY15
Actual FY16
Actual FY17
Projected FY18
Comprehensive Plan Amendments Processed 1 0 0 2 0
Zoning Amendments Processed 0 7 18 5 18 Development Review Applications Processed 112 68 75 80 85
ARCOM Applications Processed 190 180 142 169 156
ARCOM Staff Approvals Processed 314 389 410 417 421
153
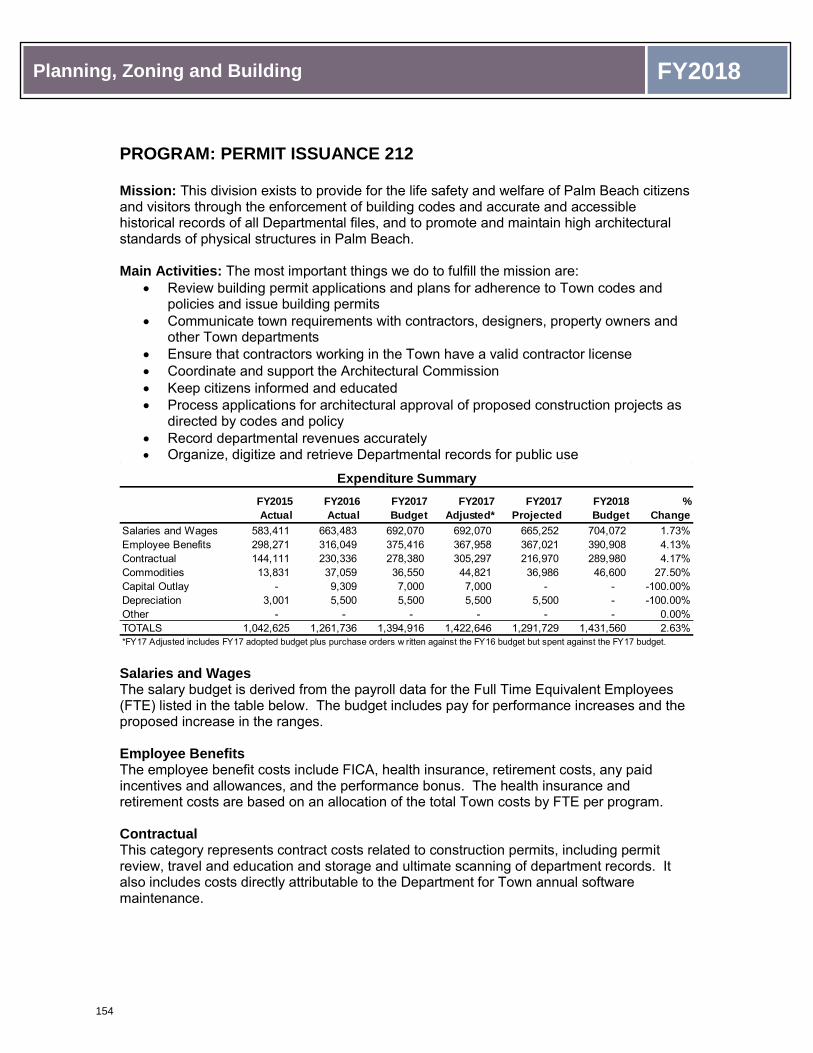
Planning, Zoning and Building FY2018
PROGRAM: PERMIT ISSUANCE 212
Mission: This division exists to provide for the life safety and welfare of Palm Beach citizens and visitors through the enforcement of building codes and accurate and accessible historical records of all Departmental files, and to promote and maintain high architectural standards of physical structures in Palm Beach.
Main Activities: The most important things we do to fulfill the mission are: • Review building permit applications and plans for adherence to Town codes and
policies and issue building permits• Communicate town requirements with contractors, designers, property owners and
other Town departments• Ensure that contractors working in the Town have a valid contractor license• Coordinate and support the Architectural Commission• Keep citizens informed and educated• Process applications for architectural approval of proposed construction projects as
directed by codes and policy• Record departmental revenues accurately• Organize, digitize and retrieve Departmental records for public use
Salaries and Wages The salary budget is derived from the payroll data for the Full Time Equivalent Employees (FTE) listed in the table below. The budget includes pay for performance increases and the proposed increase in the ranges.
Employee Benefits The employee benefit costs include FICA, health insurance, retirement costs, any paid incentives and allowances, and the performance bonus. The health insurance and retirement costs are based on an allocation of the total Town costs by FTE per program.
Contractual This category represents contract costs related to construction permits, including permit review, travel and education and storage and ultimate scanning of department records. It also includes costs directly attributable to the Department for Town annual software maintenance.
FY2015Actual
FY2016Actual
FY2017Budget
FY2017Adjusted*
FY2017Projected
FY2018Budget
%Change
Salaries and Wages 583,411 663,483 692,070 692,070 665,252 704,072 1.73%Employee Benefits 298,271 316,049 375,416 367,958 367,021 390,908 4.13%Contractual 144,111 230,336 278,380 305,297 216,970 289,980 4.17%Commodities 13,831 37,059 36,550 44,821 36,986 46,600 27.50%Capital Outlay - 9,309 7,000 7,000 - - -100.00%Depreciation 3,001 5,500 5,500 5,500 5,500 - -100.00%Other - - - - - - 0.00%TOTALS 1,042,625 1,261,736 1,394,916 1,422,646 1,291,729 1,431,560 2.63%
Expenditure Summary
*FY17 Adjusted includes FY17 adopted budget plus purchase orders w ritten against the FY16 budget but spent against the FY17 budget.
154
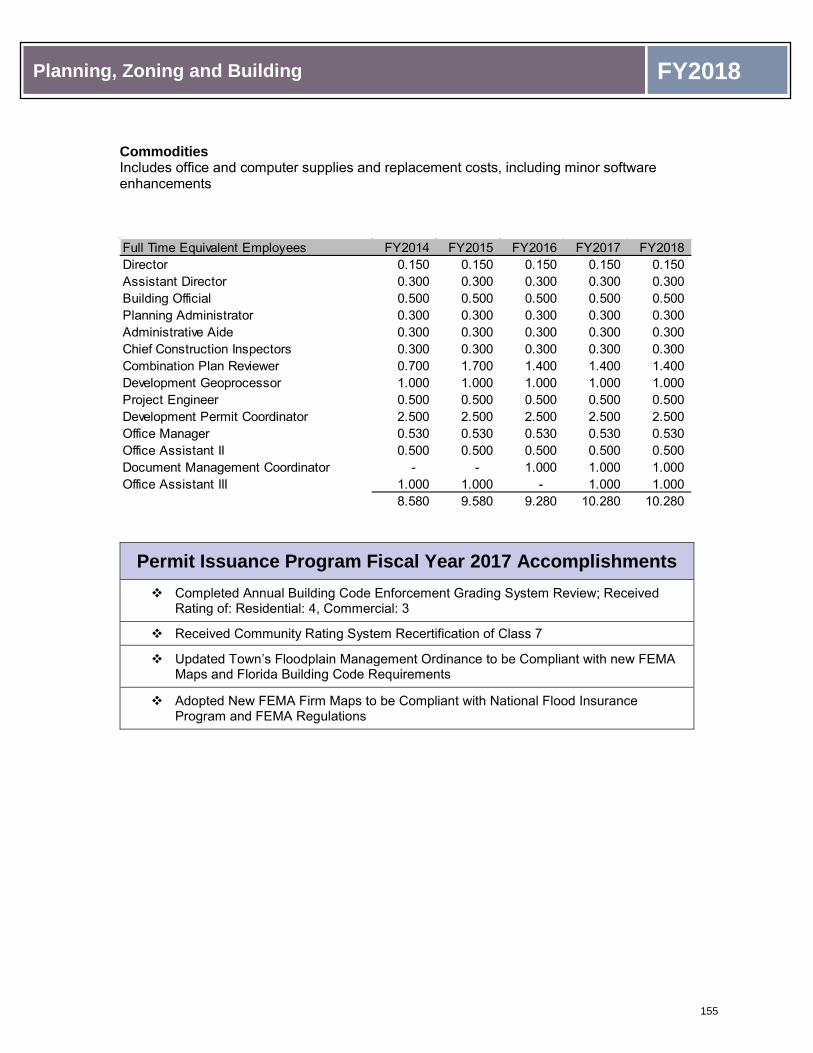
Planning, Zoning and Building FY2018
Commodities Includes office and computer supplies and replacement costs, including minor software enhancements
Permit Issuance Program Fiscal Year 2017 Accomplishments
Completed Annual Building Code Enforcement Grading System Review; Received Rating of: Residential: 4, Commercial: 3
Received Community Rating System Recertification of Class 7
Updated Town’s Floodplain Management Ordinance to be Compliant with new FEMA Maps and Florida Building Code Requirements
Adopted New FEMA Firm Maps to be Compliant with National Flood Insurance Program and FEMA Regulations
Full Time Equivalent Employees FY2014 FY2015 FY2016 FY2017 FY2018Director 0.150 0.150 0.150 0.150 0.150 Assistant Director 0.300 0.300 0.300 0.300 0.300 Building Official 0.500 0.500 0.500 0.500 0.500 Planning Administrator 0.300 0.300 0.300 0.300 0.300 Administrative Aide 0.300 0.300 0.300 0.300 0.300 Chief Construction Inspectors 0.300 0.300 0.300 0.300 0.300 Combination Plan Reviewer 0.700 1.700 1.400 1.400 1.400 Development Geoprocessor 1.000 1.000 1.000 1.000 1.000 Project Engineer 0.500 0.500 0.500 0.500 0.500 Development Permit Coordinator 2.500 2.500 2.500 2.500 2.500 Office Manager 0.530 0.530 0.530 0.530 0.530 Office Assistant II 0.500 0.500 0.500 0.500 0.500 Document Management Coordinator - - 1.000 1.000 1.000 Office Assistant III 1.000 1.000 - 1.000 1.000
8.580 9.580 9.280 10.280 10.280
155

Planning, Zoning and Building FY2018
Fiscal Year 2018 Goals and Performance Measures Planning, Zoning and Building Goal #2 – Facilitate Digital Tracking of Applications/Reduce the Amount of Paper Processed / Generated Within the Department. Objectives:
• Complete the conversion of transfer of all right-of-way (Public Works) permits to the permitting software system.
• Continue developing a digital submission and permit issuance program.
Performance Measures
Effectiveness/Output Measures: Projected FY18
# of R/W permits issued in Eden 145 Conversion in final stages; implementation anticipated 1/1/17
Complete the beta-testing of digital submission of applications
Initial implementation of digital submission and review of plans anticipated to commence 2/1/2017
Permit Issuance Productivity Measures Effectiveness/Output Measures:
Actual FY14
Actual FY15
Actual FY16
Actual FY17
Projected FY18
# of Construction Permits Issued 6,782 7,663 7,342 6,874 7,165
# of Revisions Processed/Issued 1,483 1,260 1,464 1,085 1,323
# of PW Permits Processed/Issued 1,032 1,036 1,090 854/238 1,400
# of Current Records Digitized 74,980 82,210 120,350 164,232 123,900
# of Archived Records Digitized 0 0 39,100 Combined above 37,000
# of Current Plans Digitized 11,820 12,400 32,450 23,523 30,850
# of Archived Plans Digitized 0 0 54,050 0 49,700 Avg # of Days to Scan Current Records 2.5 2 .5 .75 .75
# of Expedited Plan Pages Reviewed 5,094 7,631 7,220 4,978 6,230
156

Planning, Zoning and Building FY2018
PROGRAM: INSPECTION & COMPLIANCE 213 Mission: This division exists to provide protective services to the residents and businesses of the Town through professional and responsible enforcement of building codes and Town policies related to unimproved land, development, construction activities, and issuance of business tax receipts. Main Activities: The most important things we do to fulfill the mission are:
• Inspection of construction sites to ensure compliance with appropriate State and Town codes and land development regulations
• Issuance of permits for right of way parking and storm water improvements • Review of commercial operations for conformance to the zoning code and issuance
of business tax receipts
Salaries and Wages The salary budget is derived from the payroll data for the Full Time Equivalent Employees (FTE) listed in the table below. The budget includes pay for performance increases and the proposed increase in the ranges. Employee Benefits The employee benefit costs include FICA, health insurance, retirement costs, any paid incentives and allowances, and the performance bonus. The health insurance and retirement costs are based on an allocation of the total Town costs by FTE per program. Contractual This category represents contract costs related to construction permits, including permit inspections, travel and education and storage and scanning. Increases reflect the additional costs for contract inspections, caused by the increase in construction activities and the outsourcing of some permit-related public works inspections, to assist the department in maintaining its goal of completion on the same day, of all inspections scheduled by 6:00 am. Commodities Office and computer supplies and replacement costs and any necessary software enhancements
FY2015Actual
FY2016Actual
FY2017Budget
FY2017Adjusted*
FY2017Projected
FY2018Budget
%Change
Salaries and Wages 579,048 554,329 629,577 629,577 602,780 632,257 0.43%Employee Benefits 284,247 276,853 312,401 305,619 305,142 320,809 2.69%Contractual 403,688 410,817 385,000 523,904 266,733 354,200 -8.00%Commodities 16,939 7,434 15,600 24,600 11,706 22,820 46.28%Capital Outlay - 3,472 - - - - 0.00%Depreciation 22,347 25,303 97,751 97,751 97,751 97,722 -0.03%Other - - - - - - 0.00%TOTALS 1,306,269 1,278,208 1,440,329 1,581,451 1,284,112 1,427,808 -0.87%
Expenditure Summary
*FY17 Adjusted includes FY17 adopted budget plus purchase orders w ritten against the FY16 budget but spent against the FY17 budget.
157

Planning, Zoning and Building FY2018
Inspection and Compliance Program Fiscal Year 2017 Accomplishments
Initiated partial inspections Initiated same day reinspections
Recruited the assistance of building inspectors to watch for and report potential “Zika”sites and construction parking violations
Instituted on-site, immediate field inspection resulting on the behalf of inspectors (usingiPads)
Developed a conditional CO (Certificate of Occupancy) allowing early occupancy ofnew structures when warrantied
Inspection and Compliance Productivity Measures
Effectiveness/Output Measures: Actual FY14
Actual FY15
Actual FY16
Actual FY17
Projected FY18
# of Inspections Completed 22,925 23,041 23,713 23,759 23,509
# of Business Tax Receipts Issued 1,642 1,658 1,592 1,680 1,643
# of New Business Applications Processed 121 190 151 189 163
# of Records Requests Processed 2,720 2,840 1,329 5,046* 5,500
*1,000 walk ins600+ phone calls3,446 E-mail requests
Full Time Equivalent Employees FY2014 FY2015 FY2016 FY2017 FY2018Director 0.100 0.100 0.100 0.100 0.100 Assistant Director 0.300 0.300 0.300 0.300 0.300 Building Official 0.500 0.500 0.500 0.500 0.500 Administrative Aide 0.200 0.200 0.200 0.200 0.200 Chief Construction Inspectors 2.700 2.700 2.700 2.700 2.700 Combination Inspector 2.000 2.000 2.000 2.000 2.000 Combination Plan Reviewer 0.300 0.300 0.600 0.600 0.600 Administrative Assistant - - 0.500 - - Project Engineer 0.500 0.500 0.500 0.500 0.500 Development Review Specialist 0.500 0.500 - - - Development Permit Coordinator 0.500 0.500 0.500 0.500 0.500 Zoning Technician - - - 0.500 0.500
7.600 7.600 7.900 7.900 7.900
158

Planning, Zoning and Building FY2018
PROGRAM: LANDMARKS PRESERVATION 214
Mission: This division exists to serve the Town’s desire to maintain its rich history and quality of life by stabilizing and preserving the historic and economic value of significant physical structures and other property.
Main Activities: The most important things we do to fulfill the mission are: • Coordinate and support the Landmark Preservation Commission• Develop, recommend and enforce policies that serve historic preservation• Keep citizens informed and educated• Process Certificates of Appropriateness as directed by codes and policy• Discuss and entertain requests for possible designation of properties as historic• Maintain accurate records and files
Salaries and Wages The salary budget is derived from the payroll data for the Full Time Equivalent Employees (FTE) listed in the table below. The budget includes pay for performance increases and the proposed increase in the ranges.
Employee Benefits The employee benefit costs include FICA, health insurance, retirement costs, any paid incentives and allowances, and the performance bonus. The health insurance and retirement costs are based on an allocation of the total Town costs by FTE per program.
Contractual This category represents contracts costs related to construction permits, including permit review, travel and education, and storage and ultimate scanning of department records. It also includes costs directly attributable to the department for Town annual software maintenance.
Commodities Office and computer supplies and replacement costs, including minor software enhancements
FY2015Actual
FY2016Actual
FY2017Budget
FY2017Adjusted*
FY2017Projected
FY2018Budget
%Change
Salaries and Wages 61,800 63,503 62,873 62,873 64,985 63,837 1.53%Employee Benefits 24,863 28,957 31,147 30,420 30,877 32,101 3.06%Contractual 97,781 79,463 70,600 102,646 74,967 69,250 -1.91%Commodities 1,204 1,206 2,900 2,900 1,041 4,300 48.28%Capital Outlay - - - - - - 0.00%Depreciation - - - - - - 0.00%Other - - - - - - 0.00%TOTALS 185,648 173,129 167,520 198,839 171,870 169,488 1.17%
Expenditure Summary
*FY17 Adjusted includes FY17 adopted budget plus purchase orders w ritten against the FY16 budget but spent against the FY17 budget.
159
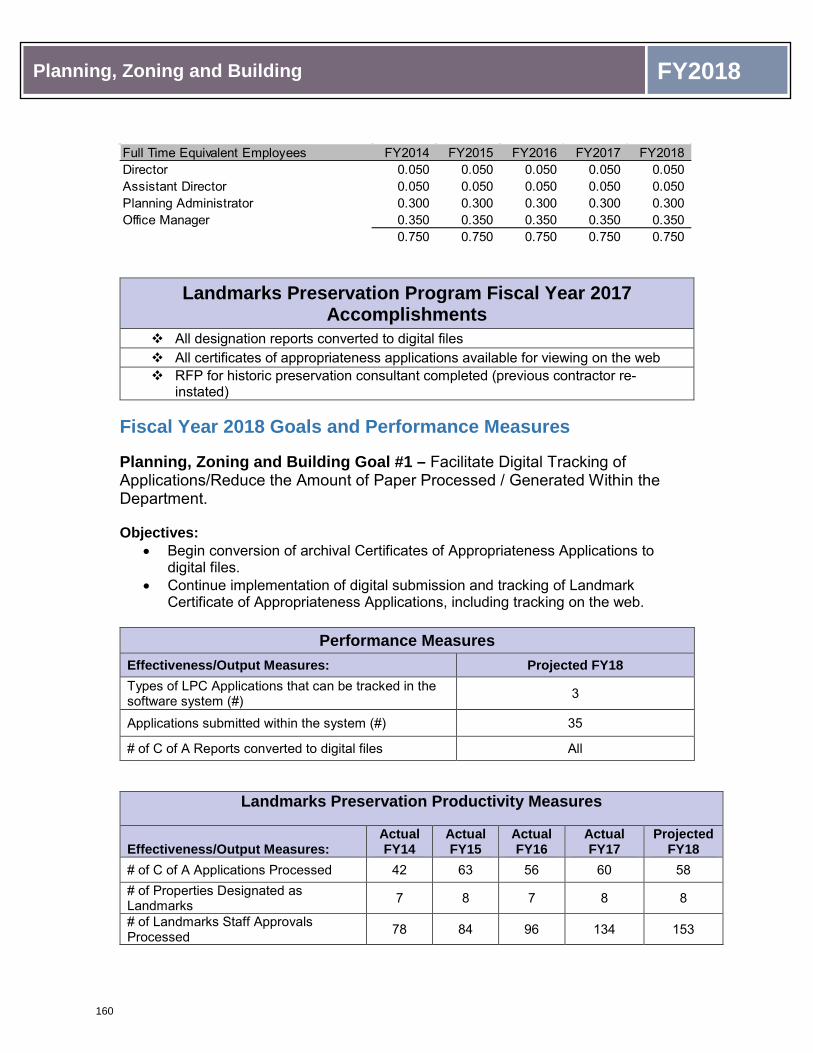
Planning, Zoning and Building FY2018
Landmarks Preservation Program Fiscal Year 2017 Accomplishments
All designation reports converted to digital files All certificates of appropriateness applications available for viewing on the web RFP for historic preservation consultant completed (previous contractor re-
instated)
Fiscal Year 2018 Goals and Performance Measures
Planning, Zoning and Building Goal #1 – Facilitate Digital Tracking of Applications/Reduce the Amount of Paper Processed / Generated Within the Department.
Objectives: • Begin conversion of archival Certificates of Appropriateness Applications to
digital files.• Continue implementation of digital submission and tracking of Landmark
Certificate of Appropriateness Applications, including tracking on the web.
Performance Measures Effectiveness/Output Measures: Projected FY18 Types of LPC Applications that can be tracked in the software system (#) 3
Applications submitted within the system (#) 35
# of C of A Reports converted to digital files All
Landmarks Preservation Productivity Measures
Effectiveness/Output Measures: Actual FY14
Actual FY15
Actual FY16
Actual FY17
Projected FY18
# of C of A Applications Processed 42 63 56 60 58 # of Properties Designated as Landmarks 7 8 7 8 8
# of Landmarks Staff Approvals Processed 78 84 96 134 153
Full Time Equivalent Employees FY2014 FY2015 FY2016 FY2017 FY2018Director 0.050 0.050 0.050 0.050 0.050 Assistant Director 0.050 0.050 0.050 0.050 0.050 Planning Administrator 0.300 0.300 0.300 0.300 0.300 Office Manager 0.350 0.350 0.350 0.350 0.350
0.750 0.750 0.750 0.750 0.750
160

Planning, Zoning and Building FY2018
PROGRAM: FIRE PREVENTION 215 (Program managed by Fire-Rescue)
Mission: This division exists to enforce Federal, State and local life safety codes to protect life and property to improve the community.
Main Activities: The most important things we do to fulfill the mission are: • Educate the community on life saving skills, fire prevention and community risk
reduction programs• Conduct annual fire safety inspections• Conduct community risk analysis• Create or revise ordinances to enhance fire prevention• Generate revenue through fire inspection and permit fees• Investigate all fires for cause and origin
Salaries and Wages The salary budget is derived from the payroll data for the Full Time Equivalent Employees (FTE) listed in the table below. The budget includes pay for performance increases and the proposed increase in the ranges.
Employee Benefits The employee benefit costs include FICA, health insurance, retirement costs, any paid incentives and allowances, and the performance bonus. The health insurance and retirement costs are based on an allocation of the total Town costs by FTE per program.
Contractual Contractual decreases resulted from moving a portion of community education to program 418, Training
Commodities Commodities increases due to training and registration fees that were moved from contractual to commodities. Additional increase resulted from a rise in subscription fees for required online publications.
FY2015Actual
FY2016Actual
FY2017Budget
FY2017Adjusted*
FY2017Projected
FY2018Budget
%Change
Salaries and Wages 273,587 223,353 205,980 205,980 192,686 199,162 -3.31%Employee Benefits 79,432 98,293 97,138 94,527 92,666 97,534 0.41%Contractual 15,545 13,702 16,100 16,100 16,678 13,100 -18.63%Commodities 2,545 2,913 3,300 3,300 3,411 4,515 36.82%Capital Outlay - - - - - - 0.00%Depreciation - - - - - - 0.00%Other - - - - - - 0.00%TOTALS 371,109 338,261 322,518 319,907 305,441 314,311 -2.54%
Expenditure Summary
*FY17 Adjusted includes FY17 adopted budget plus purchase orders w ritten against the FY16 budget but spent against the FY17 budget.
161
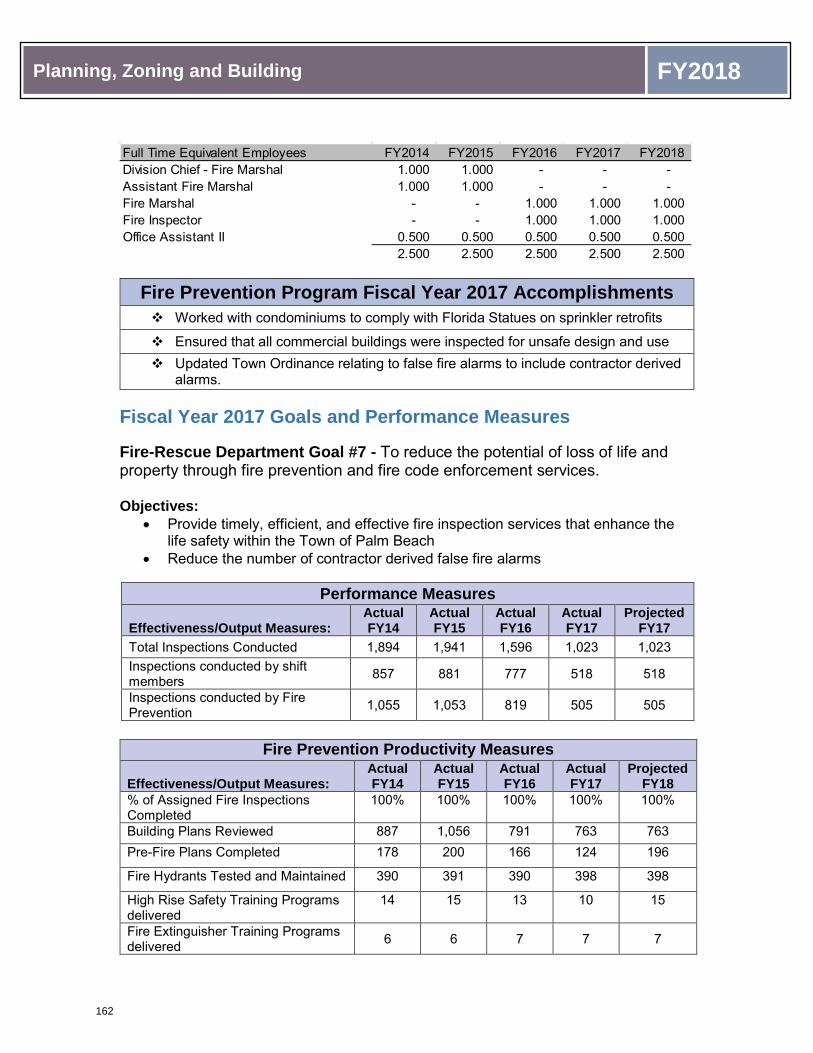
Planning, Zoning and Building FY2018
Fire Prevention Program Fiscal Year 2017 Accomplishments
Worked with condominiums to comply with Florida Statues on sprinkler retrofits
Ensured that all commercial buildings were inspected for unsafe design and use Updated Town Ordinance relating to false fire alarms to include contractor derived
alarms. Fiscal Year 2017 Goals and Performance Measures
Fire-Rescue Department Goal #7 - To reduce the potential of loss of life and property through fire prevention and fire code enforcement services.
Objectives:
• Provide timely, efficient, and effective fire inspection services that enhance the life safety within the Town of Palm Beach
• Reduce the number of contractor derived false fire alarms
Performance Measures Effectiveness/Output Measures:
Actual FY14
Actual FY15
Actual FY16
Actual FY17
Projected FY17
Total Inspections Conducted 1,894 1,941 1,596 1,023 1,023 Inspections conducted by shift members 857 881 777 518 518
Inspections conducted by Fire Prevention 1,055 1,053 819 505 505
Fire Prevention Productivity Measures
Effectiveness/Output Measures:
Actual FY14
Actual FY15
Actual FY16
Actual FY17
Projected FY18
% of Assigned Fire Inspections Completed
100% 100% 100% 100% 100%
Building Plans Reviewed 887 1,056 791 763 763 Pre-Fire Plans Completed 178 200 166 124 196
Fire Hydrants Tested and Maintained 390 391 390 398 398
High Rise Safety Training Programs delivered
14 15 13 10 15
Fire Extinguisher Training Programs delivered 6 6 7 7 7
Full Time Equivalent Employees FY2014 FY2015 FY2016 FY2017 FY2018Division Chief - Fire Marshal 1.000 1.000 - - - Assistant Fire Marshal 1.000 1.000 - - - Fire Marshal - - 1.000 1.000 1.000 Fire Inspector - - 1.000 1.000 1.000 Office Assistant II 0.500 0.500 0.500 0.500 0.500
2.500 2.500 2.500 2.500 2.500
162

Planning, Zoning and Building FY2018
PROGRAM: CODE ENFORCEMENT 216 (Program managed by Police)
Mission: The Code Enforcement Unit is responsible for the enforcement of codes and ordinances relating to quality of life, public safety and health, building and licensing, sanitation, nuisance, parks and recreation, trees and shrubs, and landmark preservation. The Code Enforcement Unit pro-actively conducts inspections and investigates code and ordinance violations, citing violators when necessary, and prosecuting violations either through the Town Code Enforcement Board or when applicable, the County Court system.
Main Activities: The most important things we do to fulfill the mission are: • Conduct inspections and investigate code and ordinance violations• Issue code enforcement citations to violators• Attend Code Enforcement Board meetings/hearings• Prepare and maintain correspondence and board meeting minutes
Salaries and Wages The salary budget is derived from the payroll data for the Full Time Equivalent Employees (FTE) listed in the table below. The budget includes pay for performance increases and the proposed increase in the ranges.
Employee Benefits The employee benefit costs include FICA, health insurance, retirement costs, any paid incentives and allowances, and the performance bonus. The health insurance and retirement costs are based on an allocation of the total Town costs by FTE per program.
Contractual Increase due to budgeting for legal advice and opinions and attendance at appropriate Code Board meetings.
Commodities Increase due to transfer of funding for registration fees for training/seminars from Contractual account.
FY2015Actual
FY2016Actual
FY2017Budget
FY2017Adjusted*
FY2017Projected
FY2018Budget
%Change
Salaries and Wages 152,855 114,204 162,030 162,030 161,118 168,117 3.76%Employee Benefits 88,314 87,007 113,814 111,596 110,237 117,819 3.52%Contractual 18,303 18,057 10,320 10,320 10,484 16,520 60.08%Commodities 5,612 4,012 5,800 5,800 6,342 7,600 31.03%Capital Outlay - - - - - - 0.00%Depreciation 8,403 6,676 6,676 6,676 6,676 6,676 0.00%Other - - - - - - 0.00%TOTALS 273,487 229,956 298,640 296,422 294,857 316,732 6.06%
Expenditure Summary
*FY17 Adjusted includes FY17 adopted budget plus purchase orders w ritten against the FY16 budget but spent against the FY17 budget.
163

Planning, Zoning and Building FY2018
Code Enforcement Program Fiscal Year 2017 Accomplishments
Trained staff to handle Right of Way Violations in order to assist the Planning,Zoning and Building Department
Code Enforcement Officers assist the Patrol Unit with traffic related issues duringPOTUS visits and during related demonstrations.
Code Enforcement Officer was State certified to conduct private, commercial andreligious institution security surveys.
Fiscal Year 2018 Goals and Performance Measures
Town Council Budget Priority #3 - Develop and recommend a plan to improve enforcement of rules pertaining to construction related parking and related job site traffic impacts. Develop and implement a computer/software based traffic management tool to be used by staff to facilitate up-to-date data in the determination of ROW permit issuance to avoid conflicts in north/south roadway corridors, to facilitate the approval process, and notification to the public of pending road closures and detours. Develop a matrix listing “large” public and private construction projects, identifying traffic impacts on residents for each project and delineating if the project is anticipated to impact an arterial roadway. Based upon final matrix content ascertain feasibility of modifying schedule of Town controlled projects to minimize traffic impacts. Review data and ascertain need for construction moratorium on Fridays when POTUS comes to Town for large projects defined as any project generating more than 10 trips per day.
Code Enforcement Goal #1 - Continue to train and educate staff on Right of Way violation rules and enforcement procedures.
Objectives: • Continue to assist Planning, Building and Zoning Department in the enforcement
of construction ROW permit violations and construction moratoriums• Continue to assist the Police Department in traffic related issues as they relate to
construction sites and ROW permit
Full Time Equivalent Employees FY2014 FY2015 FY2016 FY2017 FY2018Lead Code Compliance Officer II 1.000 1.000 - - - Code Compliance Officer I 1.000 1.000 2.000 2.000 2.000 Parking/Code Enforcement Manager 0.500 0.500 0.500 0.500 0.500 Parking/Code Enforcement Specialist 0.750 0.750 0.750 0.750 0.750
3.250 3.250 3.250 3.250 3.250
164

Planning, Zoning and Building FY2018
Code Enforcement Goal #2 - To minimize the impact of Zika in the Town of Palm Beach. Objective:
• Be proactive in identfying and obtaining voluntary compliance regarding stagnant bodies of water
Police Department Goal #3 – Maximize use of technology to further reduce crime and improve efficiency of police service in order to provide the highest level of protection to achieve exceptional quality of life for the community. Objective:
• Educate and promote public awareness of Town ordinances to achieve compliance, enhancing property values and the well-being of the community.
Performance Measures
Effectiveness/Output Measures:
Actual FY14
Actual FY15
Actual FY16
Actual FY17
Projected FY18
Code Violation Complaints 1,078 1,001 1,009 1,573 1,200
Code Violations Issued 174 143 250 223 200
Code Violation Cases Brought for CEB 76 96 78 65 78
165

(This page intentionally left blank)
166

Fire-Rescue
167

Tow
n of
Pal
m B
each
Fir
e R
escu
e Cur
rent
Org
aniz
atio
nal Cha
rt
Dire
ctor
of
Publ
ic S
afet
y
Depu
ty
Fire
Chi
ef
Assi
stan
t Fire
Ch
ief
Divi
sion
Chi
ef
Trai
ning
&
Safe
ty
Divi
sion
Chi
ef
EMS
Divi
sion
Chi
ef
Fire
Pr
even
tion
&
Life
Saf
ety
Assi
stan
t Fi
re
Mar
shal
Offi
ce
Assi
stan
t II
(0.5
)
Oce
an R
escu
eLi
fequ
ard
Supe
rvis
or
Life
quar
ds
(5)
Life
guar
ds -
PTN
B (8
)
Batt
alio
n Ch
ief C
Shi
ft
Com
pany
O
ffice
rs (7
)
Driv
er
Engi
neer
s (4
)
Fire
fight
er
Para
med
ics
(10 )
Batt
alio
n Ch
ief B
Shi
ft
Com
pany
O
ffice
rs (7
)
Driv
er
Engi
neer
s (4
)
Fire
fight
er
Para
med
ics
(10)
Batt
alio
n Ch
ief A
Sh
ift
Com
pany
O
ffice
rs (7
)
Driv
er
Engi
neer
s (4
)
Fire
fight
er
Para
med
ics
(10 )
Offi
ce
Man
ager Ad
min
istr
ativ
e Co
ordi
nato
r
168
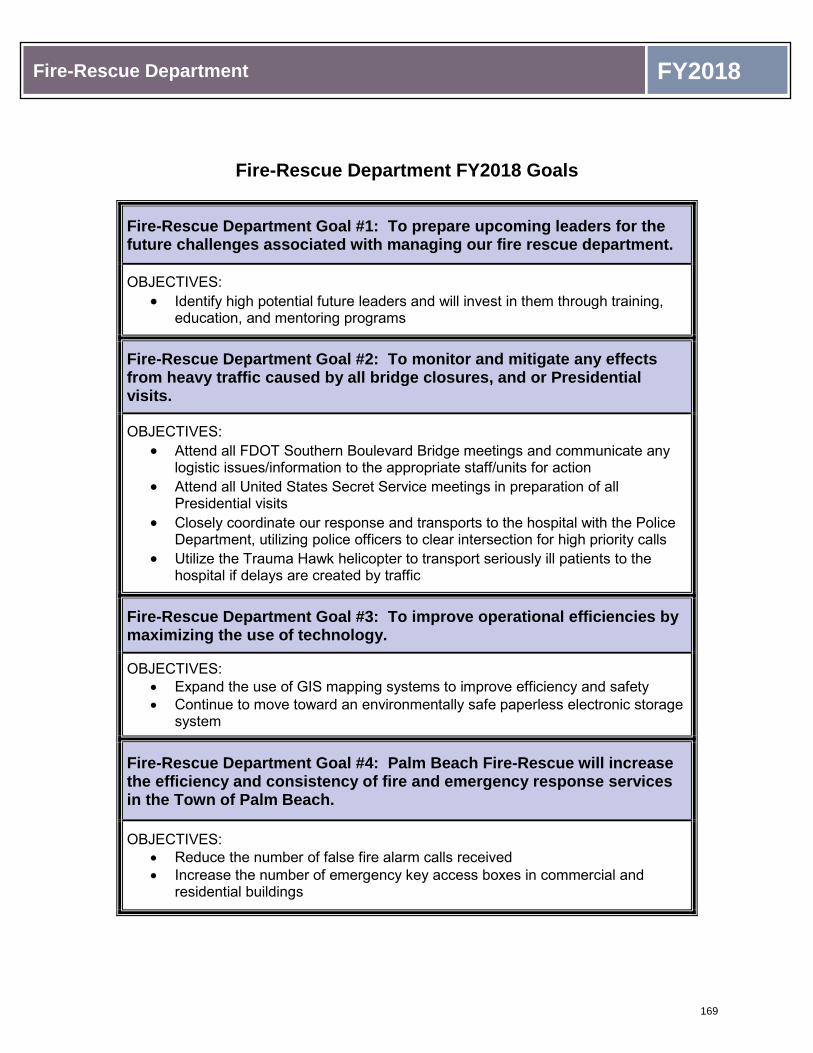
Fire-Rescue Department FY2018
Fire-Rescue Department FY2018 Goals
Fire-Rescue Department Goal #1: To prepare upcoming leaders for the future challenges associated with managing our fire rescue department.
OBJECTIVES: • Identify high potential future leaders and will invest in them through training,
education, and mentoring programs
Fire-Rescue Department Goal #2: To monitor and mitigate any effects from heavy traffic caused by all bridge closures, and or Presidential visits.
OBJECTIVES: • Attend all FDOT Southern Boulevard Bridge meetings and communicate any
logistic issues/information to the appropriate staff/units for action • Attend all United States Secret Service meetings in preparation of all
Presidential visits • Closely coordinate our response and transports to the hospital with the Police
Department, utilizing police officers to clear intersection for high priority calls • Utilize the Trauma Hawk helicopter to transport seriously ill patients to the
hospital if delays are created by traffic
Fire-Rescue Department Goal #3: To improve operational efficiencies by maximizing the use of technology.
OBJECTIVES: • Expand the use of GIS mapping systems to improve efficiency and safety • Continue to move toward an environmentally safe paperless electronic storage
system
Fire-Rescue Department Goal #4: Palm Beach Fire-Rescue will increase the efficiency and consistency of fire and emergency response services in the Town of Palm Beach.
OBJECTIVES: • Reduce the number of false fire alarm calls received • Increase the number of emergency key access boxes in commercial and
residential buildings
169

Fire-Rescue Department FY2018
Fire-Rescue Department Goal #5: To ensure the employees have the essential knowledge, skills, and abilities to deliver the high standard of care deserving of our community.
Objectives: • Recruit and train high caliber firefighter and ocean rescue candidates • Conduct realistic live fire training at a regional training facility • Conduct realistic fire and EMS simulation based training • Conduct nationally recognized EMS certification training programs for all
employees • Conduct continuous computer based training and achieve records compliance
through a certified centralized management process • Conduct specialized Fire Rescue communications training with Public Safety
telecommunicators
Fire-Rescue Department Goal #6: To provide quality community outreach programs to include Automatic External Defibrillator training, Hands-only CPR training, and severe bleeding control to the citizens of the Town of Palm Beach.
Objectives: • Encourage AED ownership within the community, provide AED training, and
track the AED maintenance requirements for AED owners to enhance the Town of Palm Beach Heart Safe AED program
• Encourage the citizens of the Town of Palm Beach and those who work here to be trained in CPR
• Place Stop the Bleed kits in all Town owned facilities equipped with an AED
Fire-Rescue Department Goal #7: To reduce the potential of loss of life and property through fire prevention and fire code enforcement services.
Objectives: • Provide timely, efficient, and effective fire inspection services that enhance the
life safety within the Town of Palm Beach • Reduce the number of contractor derived false fire alarms
Fire-Rescue Department Goal #8: To ensure the safety and security of residents and visitors using the Town’s Public Beaches.
Objectives: • Educate the public to potential beach and ocean hazards • Prevent beach and ocean drowning and injury incidents • Provide ocean rescue lifesaving for threatened parties
170

Fire-Rescue Department FY2018
DEPARTMENT: FIRE-RESCUE Mission: To provide for a high-quality of life for the residents and visitors to the Town of Palm Beach through the protection of life and property, provision of pre-hospital care for the sick and injured, and mitigation of man- made and natural emergencies. We will accomplish this through the effective and efficient delivery of emergency and non-emergency services.
2015 Actual 2016 Actual 2017
Budget 2017
Projected 2018
Budget %
ChangeFema Grant - Fire-Rescue 3,077 - - - - 0.00%State Grant - Public Safety - - - 1,388 48,750 100.00%Fire Supplemental Compensation 29,293 30,198 30,000 25,211 30,000 0.00%EMS Grant - Palm Beach County 21,165 13,132 52,500 - 77,500 47.62%Special Detail-Fire 32,328 30,033 32,000 20,899 32,000 0.00%Fire Prev Bonfires 3,300 3,000 3,300 - 3,300 0.00%Fire Prev Fire Hydrant - 800 1,000 - 1,000 0.00%Fire Prev Hot Work 67,511 61,675 60,000 62,719 60,000 0.00%Fire Prev Public Assembly 2,500 4,585 1,500 2,325 4,500 200.00%False Fire Alarms 14,377 13,398 15,000 20,956 20,000 33.33%Fire Prev Fireworks 20,630 6,280 10,000 6,000 10,000 0.00%Fire Prev Technical Fire Insp 49,500 44,118 48,000 61,500 45,000 -6.25%Fire Prev Annual Ins Fee 108,385 110,208 115,000 100,928 115,000 0.00%Ems Transport Fees 466,386 419,881 400,000 448,705 430,000 7.50%Room Rental Dep - South Fire 79 79 - 52 - 0.00%
818,531 737,387 768,300 750,683 877,050 14.15%
Revenue Summary
FY2015Actual
FY2016Actual
FY2017Budget
FY2017Adjusted*
FY2017Projected
FY2018Budget
%Change
Salaries and Wages 5,906,728 5,932,840 6,190,863 6,483,765 6,147,897 6,848,159 10.62%Employee Benefits 3,788,472 4,052,427 4,491,581 4,485,486 4,477,451 5,086,195 13.24%Contractual 302,919 373,396 433,760 491,920 483,995 420,963 -2.95%Commodities 246,091 207,270 243,160 248,955 238,062 239,263 -1.60%Capital Outlay 26,118 73,691 156,207 179,281 100,715 106,700 -31.69%Depreciation 540,992 597,575 646,294 646,294 646,294 617,854 -4.40%Other - - - - - - 0.00%TOTALS 10,811,320 11,237,199 12,161,865 12,535,701 12,094,414 13,319,134 9.52%
Expenditure Summary
*FY17 Adjusted includes FY17 adopted budget plus purchase orders w ritten against the FY16 budget but spent against the FY17 budget.
171

Fire-Rescue Department FY2018
FY2015 FY2016 FY2017 FY2018 Full Time Equivalent Employees 75.900 75.900 75.900 81.900
• +3.0 Lieutenant • +3.0 Firefighter
FY2015Actual
FY2016Actual
FY2017Budget
FY2018Budget
Expenditures 10,811,320 11,237,199 12,161,865 13,319,134Revenues 818,531 737,387 768,300 877,050
-
2,000,000
4,000,000
6,000,000
8,000,000
10,000,000
12,000,000
14,000,000
Fire-Rescue
Fire Administration, $616,198 , 4%
Operations, $11,566,618 , 87%
Training, $379,374 , 3% Ocean Rescue,
$756,944 , 6%
172

Fire-Rescue Department FY2018
PROGRAM: FIRE ADMINISTRATION 411 Mission: This division exists to oversee the Fire-Rescue department to ensure that the community is provided with the highest quality of life through the protection of life and property. Main Activities: The most important things we do to fulfill the mission are:
• Plan for the future to meet the needs of the community • Provide leadership and direction for personnel • Acquire resources to enable the department to function properly • Maintain adequate staffing level with trained and competent personnel • Develop and justify budget requests to meet future needs • Generate revenue through EMS transport billings
Salaries and Wages The salary budget is derived from the payroll data for the Full Time Equivalent Employees (FTE) listed in the table below. The budget includes pay for performance increases and the proposed increase in the ranges. Employee Benefits The employee benefit costs include FICA, health insurance, retirement costs, any paid incentives and allowances, and the performance bonus. The health insurance and retirement costs are based on an allocation of the total Town costs by FTE per program. Contractual The contractual decrease was due to a one time HIPPA audit conducted in FY2017 that was not repeated. Additional decrease due to a savings in copy machine and printing fees. Commodities The commodities decreases are due to the cancelation of annual membership fees for two separate associations.
FY2015Actual
FY2016Actual
FY2017Budget
FY2017Adjusted*
FY2017Projected
FY2018Budget
%Change
Salaries and Wages 366,482 380,013 382,576 382,576 384,798 389,085 1.70%Employee Benefits 184,231 113,065 117,474 116,025 117,095 122,359 4.16%Contractual 51,515 81,077 110,550 134,220 128,034 91,558 -17.18%Commodities 11,663 19,101 13,200 13,200 10,383 12,700 -3.79%Capital Outlay - - - - - - 0.00%Depreciation 4,481 3,153 496 496 496 496 0.00%Other - - - - - - 0.00%TOTALS 618,372 596,409 624,296 646,517 640,806 616,198 -1.30%
Expenditure Summary
*FY17 Adjusted includes FY17 adopted budget plus purchase orders w ritten against the FY16 budget but spent against the FY17 budget.
173

Fire-Rescue Department FY2018
Fire-Rescue Administration Program Fiscal Year 2017 Accomplishments
Worked with United States Secret Service and provided protection for Presidential visits
Mitigated any effects from heavy traffic caused by all bridge closures, and or Presidential visits
Conducted joint Public Safety training and issued equipment to effectively deal with active shooter and mass casualty incidents
Hired 14 new Firefighters, promoted 4 Driver/Engineers, and 5 Lieutenants Implemented new collective bargaining unit agreement Participated in the annual Town toy drive, school supply drive, and food drive as the
key collection points Town-wide Emergency operations were reviewed and adjusted to account for any contingency
due to the Flagler Memorial Bridge Project
Public Safety succession plan was developed and is in place
Expanded the Opticom Traffic Preemption System to include 100% of all signaled intersections with the Town of Palm Beach
Full Time Equivalent Employees FY2014 FY2015 FY2016 FY2017 FY2018Director of Public Safety 0.500 0.500 0.500 0.500 0.500 Deputy Fire Rescue Chief 1.000 1.000 1.000 1.000 1.000 Office Manager 1.000 1.000 1.000 1.000 1.000 Administrative Coordinator 1.000 1.000 1.000 1.000 1.000
3.500 3.500 3.500 3.500 3.500
174

Fire-Rescue Department FY2018
Fiscal Year 2018 Goals and Performance Measures Fire Rescue Department Goal #1 - To prepare upcoming leaders for the future challenges associated with managing our fire rescue department Objective:
• Identify high potential future leaders and will invest in them through training, education, and mentoring programs
Performance Measures
Effectiveness/Output Measures: Projected FY18
Leadership coaching was conducted for supervisory and non-supervisory personnel
Monitor the effectiveness of the coaching and continue to invest in the advancement of leadership skills for 100% of the supervisory and non-supervisory personnel
Mentoring program to identify and invest in the high potential future leaders of the organization
Continue the mentoring program to develop the high potential future leaders and identify potential future leaders
Fire-Rescue personnel attending college credit classes
Encourage those who intend to complete their degrees. Stimulate others to pursue higher education
Fire-Rescue Administration Productivity Measures
Effectiveness/Output Measures:
Actual FY14
Actual FY15
Actual FY16
Actual FY17
Projected FY18
Leadership training sessions 36 40 62 62 65
Future leaders mentored 15 16 21 20 25
College level class attendees 35 24 59 35 43
175

Fire-Rescue Department FY2018
PROGRAM: OPERATIONS 417 Mission: This division exists to protect life and property through fire protection and suppression, excellent pre-hospital care for sick and injured and mitigation of natural and man-made emergencies. Main Activities: The most important things we do to fulfill the mission are emergency response for:
• Fire protection and suppression • Advanced Life Support services and EMS transport • Hazardous condition response • Technical Rescue
Salaries and Wages The salary budget is derived from the payroll data for the Full Time Equivalent Employees (FTE) listed in the table below. The budget includes pay for performance increases and the proposed increase in the ranges. The budget is based on the adoption of the Fire Rescue union contract and the costs associated with the addition of 6 new positions for the revision of the Kelly Day benefit. In addition, the increase includes the cost to increase the wages over the contract term to date. Employee Benefits The employee benefit costs include FICA, health insurance, retirement costs, any paid incentives and allowances, and the performance bonus. The health insurance and retirement costs are based on an allocation of the total Town costs by FTE per program. Applicable benefit budgets were increased for the 6 additional positions discussed above. Contractual The contractual increase resulted from increased costs relating to vehicle repairs. Additional cost increase resulted from AED maintenance and repair fees. Commodities The commodities decrease resulted from state licensing fees that occur biennially. Additional decreases resulted from a reduction in fuel costs, and savings in medical supplies. Additionally, one time equipment purchases occurring in FY17 were not repeated in FY18.
FY2015Actual
FY2016Actual
FY2017Budget
FY2017Adjusted*
FY2017Projected
FY2018Budget
%Change
Salaries and Wages 5,072,218 5,077,924 5,294,707 5,587,609 5,277,299 5,900,294 11.44%Employee Benefits 3,247,185 3,616,649 4,038,380 4,037,925 4,031,480 4,548,616 12.63%Contractual 123,555 177,375 166,610 183,810 209,857 184,610 10.80%Commodities 222,743 180,665 221,660 227,455 210,915 211,583 -4.55%Capital Outlay 26,118 73,691 155,707 178,781 100,715 106,700 -31.47%Depreciation 524,794 582,292 633,668 633,668 633,668 614,815 -2.98%Other - - - - - - 0.00%TOTALS 9,216,613 9,708,596 10,510,732 10,849,248 10,463,934 11,566,618 10.05%
Expenditure Summary
*FY17 Adjusted includes FY17 adopted budget plus purchase orders w ritten against the FY16 budget but spent against the FY17 budget.
176

Fire-Rescue Department FY2018
Capital Outlay The capital outlay decrease resulted from one time balances not covered by the capital replacement fund for the purchase of self-contained breathing apparatus and Zoll Autopulse resuscitation equipment. Additional reductions resulted from the department completing the installation of the Opticom Preemption system town wide.
Operations Program Fiscal Year 2017 Accomplishments
Staff identified and conducted leadership training targeting potential personnel for future leadership positions.
Company Officers conducted pre-fire planning of local commercial properties to improve emergency response preparedness and effectiveness.
Participated in bi-monthly leadership training with leadership coach, as well as individual one-on-one mentoring sessions.
Full Time Equivalent Employees FY2014 FY2015 FY2016 FY2017 FY2018Assistant Fire-Rescue Chief 1.000 1.000 1.000 1.000 1.000 Battalian Chief 3.000 3.000 3.000 3.000 3.000 Division Chief - EMS Coordinator 1.000 1.000 1.000 1.000 1.000 Lieutenant / Paramedic 15.000 18.000 18.000 18.000 21.000 F/F, Driver/Engineer, Paramedic or EMT 15.000 12.000 12.000 12.000 12.000 Firefighter, Paramedic or EMT 27.000 27.000 27.000 27.000 30.000 Fleet Manager 0.200 0.200 0.200 0.200 0.200 Master Mechanic 0.200 0.200 0.200 0.200 0.200
62.400 62.400 62.400 62.400 68.400
177

Fire-Rescue Department FY2018
Fiscal Year 2018 Goals and Performance Measures Fire Rescue Department Goal #3 - To improve operational efficiencies by maximizing the use of technology. Objectives:
• Expand the use of GIS mapping systems to improve efficiency and safety • Continue to move toward an environmentally safe paperless electronic storage
system
Fire Rescue Department Goal #4 - Increase the efficiency and consistency of fire and emergency response services in the Town of Palm Beach Objectives:
• Reduce the number of false fire alarm calls received • Increase the number of emergency key access boxes in commercial and
residential buildings
Performance Measures
Effectiveness/Output Measures:
Actual FY14
Actual FY15
Actual FY16
Actual FY17
Projected FY18
False Fire alarm calls received. 555 393 398 485 390
Key Access Boxes in commercial and residential buildings
254 283 295 301 310
Response time (dispatched to arrival) for serious fire calls.
4.24 3.68 4.00 4.26 4.00
Response time (dispatched to arrival) for serious EMS calls.
3.26 3.85 4.37 4.16 3.90
Number of personnel assigned to the North Fire Station
4 4 5 5 5
Note: False alarm increase resulted from activations created during and post Hurricane Irma.
178

Fire-Rescue Department FY2018
Fire Rescue Department Goal #6 - To provide quality community outreach programs to include Automatic External Defibrillator training and Hands-only CPR training to the citizens of the Town of Palm Beach Objectives:
• Encourage AED ownership within the community, provide AED training, and track the AED maintenance requirements for AED owners to enhance the Town of Palm Beach AED program
• Encourage the citizens of the Town of Palm Beach and those who work here to be trained in CPR
Performance Measures Effectiveness/Output Measures: Projected FY18
Partnered with the Palm Beach Civic Association and Palm Beach Citizens Association to raise awareness of the benefits of AED ownership with residential and business owners within the Town.
Continue to raise the awareness of the benefits of AED ownership
Held an open house mass CPR training event at all of the fire stations. Public education personnel and crews continue to provide CPR training on an ongoing basis.
Continue to encourage the citizens, businesses, and employees of the Town of Palm Beach to be trained in CPR and the use of an AED
Fire-Rescue Training Productivity Measures
Effectiveness/Output Measures:
Actual FY14
Actual FY15
Actual FY16
Actual FY17
Projected FY18
Citizens trained in CPR/AED use 326 382 367 321 350
Police Officers / Dispatchers trained in CPR/AED 55 66 15 69 15
AEDs registered in Town 136 136 139 127 135
179

Fire-Rescue Department FY2018
PROGRAM: TRAINING 418 Mission: This division exists to provide fire and EMS training to all personnel to ensure state of the art, competent and safe operations to best serve the citizens of Palm Beach. Main Activities: The most important things we do to fulfill the mission are:
• Develop and deliver pertinent classroom and hands-on training for Fire, EMS, Haz Mat, Technical Rescue and all aspects for fire-rescue operations
• Seek opportunities for training that continually keep the department on the cutting edge of the fire-rescue field
Salaries and Wages The salary budget is derived from the payroll data for the Full Time Equivalent Employees (FTE) listed in the table below. The budget includes pay for performance increases and the proposed increase in the ranges. Employee Benefits The employee benefit costs include FICA, health insurance, retirement costs, any paid incentives and allowances, and the performance bonus. The health insurance and retirement costs are based on an allocation of the total Town costs by FTE per program. Contractual Contractual decreases due to EMS continuing education/certification requirements occurring biennially. Additional decreases resulted from moving training registration fees to commodities. Commodities Commodities increase due to training registration fees that were moved from contractual to commodities.
FY2015Actual
FY2016Actual
FY2017Budget
FY2017Adjusted*
FY2017Projected
FY2018Budget
%Change
Salaries and Wages 127,824 128,661 129,982 129,982 130,927 135,378 4.15%Employee Benefits 72,166 37,640 36,401 36,401 33,213 91,921 152.52%Contractual 127,849 114,531 153,400 170,690 144,346 141,595 -7.70%Commodities 2,972 5,446 3,800 3,800 13,115 10,480 175.79%Capital Outlay - - - - - - 0.00%Depreciation - - - - - - 0.00%Other - - - - - - 0.00%TOTALS 330,811 286,278 323,583 340,873 321,601 379,374 17.24%
Expenditure Summary
*FY17 Adjusted includes FY17 adopted budget plus purchase orders w ritten against the FY16 budget but spent against the FY17 budget.
Full Time Equivalent Employees FY2014 FY2015 FY2016 FY2017 FY2018Division Chief - Training/Safety 1.000 1.000 1.000 1.000 1.000
180

Fire-Rescue Department FY2018
Training Program Fiscal Year 2017 Accomplishments
Participated in 21 Live Fire Training drills
All personnel participated in monthly leadership/coaching webinars
Provided onboarding training for 14 new personnel
Conducted joint Police and Fire Department leadership training. Conducted monthly fire training drills using nationally standardized performance
criteria Provided in-house Driver/Engineer courses for department personnel Provided nationally recognized speakers to deliver leadership and mentoring
sessions Participated in training with mutual-aid partners
Fiscal Year 2018 Goals and Performance Measures Fire Rescue Department Goal #5 - To ensure the employees have the essential knowledge, skills, and abilities to deliver the high standard of care deserving of our community Objectives:
• Recruit and train high caliber firefighter and ocean rescue candidates. • Conduct realistic live fire training at a regional training facility. • Conduct realistic fire and EMS simulation based training. • Conduct nationally recognized EMS certification training programs for all
employees. • Conduct continuous computer based training and achieve records compliance
through a certified centralized management process. • Conduct specialized Fire Rescue communications training with Public Safety
telecommunicators.
Performance Measures
Effectiveness/Output Measures: Actual FY15
Actual FY16
Actual FY17
Projected FY18
Conducted firefighter/EMT/paramedic interviews to identify high caliber recruits (# of candidates)
90 160 43 50
Conducted live fire training at Palm Beach State College for 100% of shift personnel (# of sessions)
36 21 21 21
Utilized Target Safety online certification training program (# of hours) 18,389 23,048 34,723 35,000
EMS Simulations (# of sessions) 15 38 80 120 Fire Simulation training sessions conducted (# of sessions) 0 10 23 30
181

Fire-Rescue Department FY2018
PROGRAM: OCEAN RESCUE 419 Mission: This division exists to provide for the safety and security of beach patrons. Main Activities: The most important things we do to fulfill the mission are:
• Ensure that lifeguards maintain top physical conditioning • Participate in first-aid training programs, parking enforcement and local sea turtle
conservation program • Inform public of hazards through signs, condition boards, flags, beach report and
verbal • Continually train staff in environmental conditions and hazards, medical skills, and
rescue techniques • Take proactive measures to ensure the safety of swimmers
Salaries and Wages The salary budget is derived from the payroll data for the Full Time Equivalent Employees (FTE) listed in the table below. The budget includes pay for performance increases and the proposed increase in the ranges. Employee Benefits The employee benefit costs include FICA, health insurance, retirement costs, any paid incentives and allowances, and the performance bonus. The health insurance and retirement costs are based on an allocation of the total Town costs by FTE per program. Contractual Contractual accounts remained constant Commodities Commodities accounts remained constant
FY2015Actual
FY2016Actual
FY2017Budget
FY2017Adjusted*
FY2017Projected
FY2018Budget
%Change
Salaries and Wages 340,204 346,242 383,598 383,598 354,873 423,402 10.38%Employee Benefits 284,890 285,073 299,326 295,135 295,663 323,299 8.01%Contractual - 413 3,200 3,200 1,758 3,200 0.00%Commodities 8,713 2,058 4,500 4,500 3,649 4,500 0.00%Capital Outlay - - 500 500 - - -100.00%Depreciation 11,717 12,130 12,130 12,130 12,130 2,543 -79.04%Other - - - - - - 0.00%TOTALS 645,524 645,916 703,254 699,063 668,073 756,944 7.63%
Expenditure Summary
*FY17 Adjusted includes FY17 adopted budget plus purchase orders w ritten against the FY16 budget but spent against the FY17 budget.
182

Fire-Rescue Department FY2018
Ocean Rescue Program Fiscal Year 2017 Accomplishments
0 drownings on public beaches while life guards on duty Ocean Rescue competition team participated in the SE Regional Competition and
National Competition. Conducted comprehensive water rescue and survival training for all operations
level Fire Rescue personnel. Conducted swimming capabilities testing for Police Department as part of new
recruit qualifications evaluation.
Full Time Equivalent Employees FY2014 FY2015 FY2016 FY2017 FY2018Supervisor Lifeguard 1.000 1.000 1.000 1.000 1.000 Lifeguard On-Call 3.000 3.000 3.000 3.000 3.000 Lifeguard 5.000 5.000 5.000 5.000 5.000
9.000 9.000 9.000 9.000 9.000
183

Fire-Rescue Department FY2018
Fiscal Year 2018 Goals and Performance Measures
Fire Rescue Department Goal #5 - To ensure the employees have the essential knowledge, skills, and abilities to deliver the high standard of care deserving of our community Objective:
• Recruit and train high caliber ocean rescue candidates
Performance Measures
Effectiveness/Output Measures:
Actual FY14
Actual FY15
Actual FY16
Actual FY17
Projected FY18
Additional personnel hired to expand Ocean Rescue temporary/part time Lifeguard pool.
3 3 3 1 3
Fire Rescue Department Goal #8 - To ensure the safety and security of residents and visitors using the Town’s Public Beaches Objectives:
• Educate the public to potential beach and ocean hazards • Prevent beach and ocean drowning and injury incidents • Provide ocean rescue lifesaving for threatened parties
Performance Measures
Effectiveness/Output Measures: Actual FY14
Actual FY15
Actual FY16
Actual FY17
Projected FY18
New Informational signage / public educational interaction 4 6 7 7 7
Preventative safety measures implemented 4,199 4,300 4,650 4,490 4,550
Official hazardous conditions water training (Rip Current, Surf)
320 Hours
384 Hours
365 Hours
380 Hours
380 Hours
Fire-Rescue – Ocean Rescue Productivity Measures
Effectiveness/Output Measures: Actual FY14
Actual FY15
Actual FY16
Actual FY17
Projected FY18
Beach Attendance 494,000 489,999 496000 475,000 480,000
Ocean Rescues 25 30 49 55 50
Preventive Actions 4,001 4,300 4,348 4,123 4,123
184

Police
185

Aut
hori
zed
# 1
1 5 2 10 50 69 37 3
Posit
ion
Publ
ic S
afet
y D
irec
tor
Dep
uty
Chi
efC
apta
ins
Lie
uten
ant
Serg
eant
sPo
lice
Offi
cers
Tota
l Sw
orn
Tota
l Civ
ilain
:
Ful
l Tim
e
Par
t Tim
e
Staf
fing
Lev
el
PALM
BEA
CH
PO
LIC
E D
EPA
RTM
ENT
OR
GA
NIZ
ATI
ON
AL
CH
AR
TFY
18 B
UDG
ET
Publ
ic S
afet
y D
irec
tor
Prof
. Sta
ndar
ds L
t.A
dmin
istr
ativ
e A
ssis
tant
Dep
uty
Chi
ef
Maj
or
Polic
e Pl
anne
r
Cap
tain
Patr
ol T
eam
12
Serg
eant
s8
Off
icer
s
Mot
orcy
cle
Patr
ol3
Off
icer
s
BC
R O
ffice
rM
arin
ePat
rol
2 O
ffic
ers
Polic
e/Fi
re F
leet
Mai
nten
ance
1 Fl
eet M
gr/1
Mas
ter M
ech
Cap
tain
Patr
ol T
eam
22
Serg
eant
s8
Off
icer
s
Cap
tain
Patr
ol T
eam
32
Serg
eant
s8
Off
icer
s
Mot
orcy
cle
Patr
ol3
Off
icer
s
BC
R O
ffice
r
Cap
tain
Patr
ol T
eam
42
Serg
eant
s8
Off
icer
s
Cap
tain
Cri
min
al In
vest
.
Cri
me
Inte
llige
nce
Ana
lyst
Det
ectiv
e B
urea
u1
Serg
eant
4 D
etec
tives
OC
VA
N1
Serg
eant
4 D
etec
tives
Cri
me
Scen
e E
vide
nce
Uni
t1
Man
ager
2 P/
T Te
chni
cian
s
Polic
e/Fi
re C
omm
unic
atio
ns U
nit
Man
ager
Shift
11
Supe
rvis
or; 3
TC
Shift
21
Supe
rvis
or, 4
TC
,
Shift
31
Supe
rvis
or; 3
TC
1 R
elie
f TC
Part
-tim
e N
B T
CR
ecor
ds In
fo. S
ys.
2 R
ecor
ds A
ssis
t.
Tra
inin
g &
Com
m. R
elat
ions
Coo
rd.
TC
R2
Off
ice
Ass
ista
nt II
Cod
e/Pa
rkin
g E
nf. U
nit
1 M
anag
er; 1
Par
k/C
ode
Spec
ialis
t.
Cod
e E
nfor
cem
ent
2 C
ode
Enf.
Off
icer
Park
ing
Enf
orce
men
t1
Lead
Par
king
Enf
orce
men
t Off
.
6 Pa
rkin
g En
forc
emen
t Off
icer
s
186

Police Department FY2018
Palm Beach Police Department FY2018 Goals Police Department Goal #1: Monitor the allocation of resources to ensure the public’s safety, address traffic flow issues, and provide timely communications. OBJECTIVES:
• Use the Townwide Camera and Security system to mitigate construction and traffic issues impacting residents, the business community, and visitors
• Utilize Emergency Operations Plans and obtain specialized equipment to ensure the allocation of resources to allow sufficient traffic flow during rush hour and for all emergency vehicles
• Attend all FDOT Flagler and Southern Boulevard Bridge meetings and communicate any logistics issues/information to appropriate staff/units for action
• Participate in available grant initiatives directed at pedestrian, bicycle, and vehicular safety issues and conduct selective enforcements as a result of citizen or staff observations/concerns
• Provide relevant and timely updates to the community through appropriate social and news media outlets
Police Department Goal #2: Review FY2018 department budget and functions to achieve possible cost savings and revenue sources for future budgets.
OBJECTIVES: • Thoroughly review individual unit functions and budgets to accomplish cost
savings and maintain unit efficiencies without compromising services • Participate in available federal grant opportunities associated with POTUS
security in order to reimburse the Town for extraordinary overtime expenses
Police Department Goal #3: Maximize use of technology to further reduce crime and improve efficiency of police service in order to provide the highest level of protection to achieve exceptional quality of life for the community. OBJECTIVES:
• Route all emergency Priority 1 calls through dispatch within 60 seconds and maintain an average police officer response time of less than 4 minutes to these calls
• Engage the capabilities of the Town-wide Security System and continue to expand the system through private/public partnerships
• Expand Direct Connect users to improved alarm response to residents and the business community and reduce allocation of resources to false alarms
187

Police Department FY2018
• Obtain specialized equipment and training in order to effectively activate the Emergency Field Force (EFF) operations
• Educate and promote public awareness of Town ordinances to achieve compliance, enhancing property values and the well-being of the community.
Police Department Goal #4: Develop and maintain an organizational environment that is professionally rewarding, challenging and that promotes leadership succession to address the future challenges of the police department.
OBJECTIVES: • Recruit, train and maintain high caliber police candidates • Identify high potential future leaders and invest in them through training,
education and mentoring programs
Police Department Goal #5: Reduce the opportunity for criminals to commit crime and to apprehend those persons responsible when a crime has been committed.
OBJECTIVES: • Use innovative and pro-active measures to gather and analyze intelligence and
utilize the latest technology to develop and collect evidence at crime scenes • Investigate all cases to identify and arrest the offending party, recover property,
and bring investigations to successful conclusions above national average clearance rates
• Conduct programs and activities to achieve crime prevention awareness and inform the public of suspicious occurrences through social media and news releases
• Proactively enforce town ordinances, Florida State Statues, and traffic laws
Police Department Goal #6: Provide for the safe and efficient use of parking spaces for residents and business patrons.
OBJECTIVES: • Regulate the use of all parking in the Town of Palm Beach by enforcement of
all parking ordinances and regulations in order to create adequate turnover.
188

Police Department FY2018
DEPARTMENT: POLICE Mission: The Palm Beach Police Department is dedicated to:
• the prevention of crime and the protection of life and property; • the preservation of peace, order and safety; • the enforcement of laws and ordinances; and, • the safeguarding of constitutional guarantees
Through pro-active and creative means.
2015 Actual 2016 Actual 2017
Budget 2017
Projected 2018
Budget %
ChangeResidential Parking Plans 70,000 74,840 87,500 90,230 93,500 6.86%Bullet Proof Vests Grant 4,212 2,566 5,000 - 19,000 280.00%911 Equip Reimbursement 99,026 95,593 108,000 9,467 20,000 -81.48%Seized Tag 2,667 200 3,000 50 200 -93.33%$12.50 Citation Monies - - 5,000 - - -100.00%Special Assignment Ot - Other 672,086 899,372 500,000 374,411 500,000 0.00%Police Id Cards 20,295 16,704 17,500 37,960 17,500 0.00%Burglar Alarm False Alarm Fees 79,719 55,756 70,000 50,253 60,000 -14.29%Burglar Alarm Registration Fee 95,745 94,586 95,000 94,150 95,000 0.00%Burglar Alarm - Penalties 7,200 5,836 5,000 3,524 5,000 0.00%Burglar Alarm - Direct Connect 13,661 20,615 20,000 22,067 23,000 15.00%Valet Parking Permit 11,100 13,675 10,000 8,750 10,000 0.00%Fines - Other Parking 617,897 672,944 725,000 480,357 652,500 -10.00%Fines - Parking Meters 85,667 54,408 75,000 41,330 67,500 -10.00%Row Parking Violation Fines 9,400 27,987 15,000 17,325 30,000 100.00%Moving Violations 12,404 9,066 10,000 6,427 10,000 0.00%Revenue/2nd $ Funding 1,864 376 2,000 - 2,000 0.00%Boot Fees 21,700 22,750 26,000 13,650 20,000 -23.08%Penalty - Other Parking 169,867 178,039 190,000 124,940 175,500 -7.63%Penalty - Parking Meters 29,171 18,563 27,000 11,225 24,300 -10.00%Rebate For Town Towing 2,631 3,323 2,000 1,780 2,500 25.00%
2,026,312 2,267,199 1,998,000 1,387,896 1,827,500 -8.53%
Revenue Summary
FY2015Actual
FY2016Actual
FY2017Budget
FY2017Adjusted*
FY2017Projected
FY2018Budget
%Change
Salaries and Wages 7,380,579 7,617,017 7,773,213 7,773,213 7,702,969 7,917,545 1.86%Employee Benefits 4,679,700 4,947,354 5,525,163 5,501,921 5,465,013 5,562,595 0.68%Contractual 420,824 425,178 390,585 428,110 413,512 368,263 -5.72%Commodities 356,443 344,317 401,000 403,732 452,963 454,680 13.39%Capital Outlay 49,379 119,859 124,300 261,796 211,717 46,700 -62.43%Depreciation 416,859 528,032 528,032 528,032 528,032 558,834 5.83%Other - - - - - - 0.00%TOTALS 13,303,784 13,981,757 14,742,293 14,896,804 14,774,206 14,908,617 1.13%
Expenditure Summary
*FY17 Adjusted includes FY17 adopted budget plus purchase orders w ritten against the FY16 budget but spent against the FY17 budget.
189

Police Department FY2018
FY2014 FY2015 FY2016 FY2017 FY2018 Full Time Equivalent Employees 103.350 103.350 103.350 103.350 102.850
FY2015Actual
FY2016Actual
FY2017Budget
FY2018Budget
Expenditures 13,303,784 13,981,757 14,742,293 14,908,617Revenues 2,026,312 2,267,199 1,998,000 1,827,500
-
2,000,000
4,000,000
6,000,000
8,000,000
10,000,000
12,000,000
14,000,000
16,000,000
Police
Administrative Management;
$1,020,072 ; 7% Special Investigations; $775,146 ; 5%
Communications; $1,611,117 ; 11%
Patrol Services; $9,146,556 ; 61%
Criminal Investigations; $1,029,775 ; 7%
All Other; $1,325,951 ; 9%
190
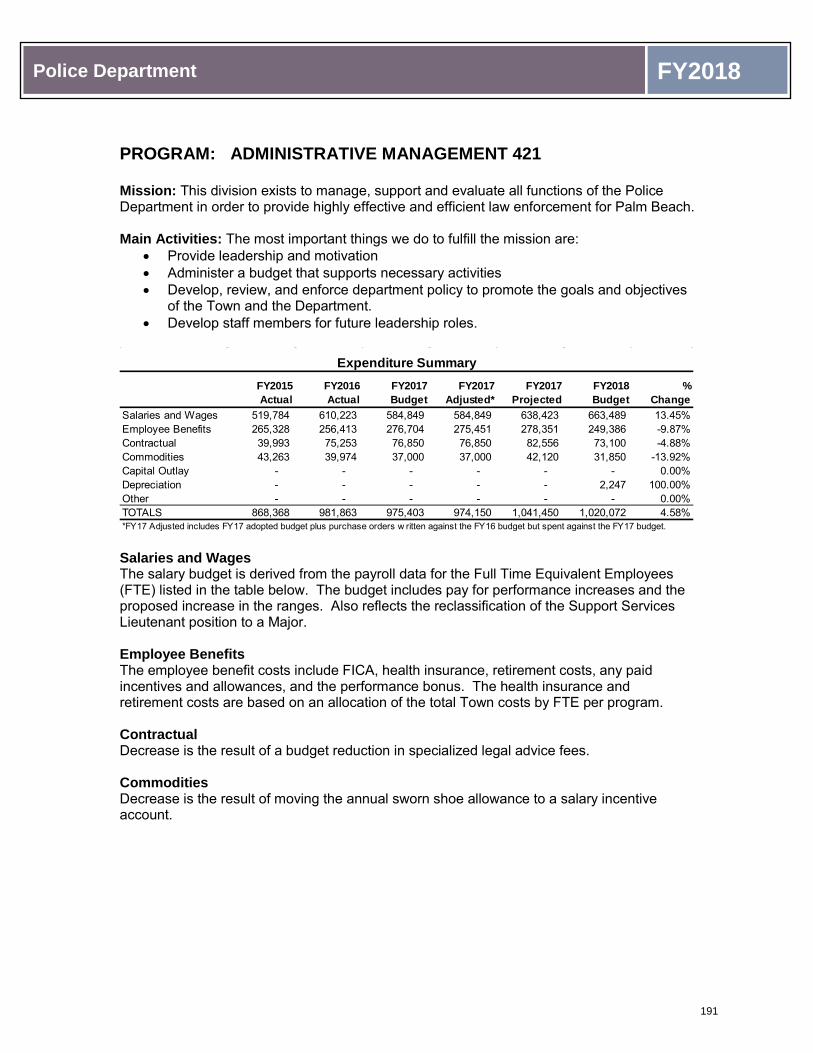
Police Department FY2018
PROGRAM: ADMINISTRATIVE MANAGEMENT 421 Mission: This division exists to manage, support and evaluate all functions of the Police Department in order to provide highly effective and efficient law enforcement for Palm Beach. Main Activities: The most important things we do to fulfill the mission are:
• Provide leadership and motivation • Administer a budget that supports necessary activities • Develop, review, and enforce department policy to promote the goals and objectives
of the Town and the Department. • Develop staff members for future leadership roles.
Salaries and Wages The salary budget is derived from the payroll data for the Full Time Equivalent Employees (FTE) listed in the table below. The budget includes pay for performance increases and the proposed increase in the ranges. Also reflects the reclassification of the Support Services Lieutenant position to a Major. Employee Benefits The employee benefit costs include FICA, health insurance, retirement costs, any paid incentives and allowances, and the performance bonus. The health insurance and retirement costs are based on an allocation of the total Town costs by FTE per program. Contractual Decrease is the result of a budget reduction in specialized legal advice fees. Commodities Decrease is the result of moving the annual sworn shoe allowance to a salary incentive account.
FY2015Actual
FY2016Actual
FY2017Budget
FY2017Adjusted*
FY2017Projected
FY2018Budget
%Change
Salaries and Wages 519,784 610,223 584,849 584,849 638,423 663,489 13.45%Employee Benefits 265,328 256,413 276,704 275,451 278,351 249,386 -9.87%Contractual 39,993 75,253 76,850 76,850 82,556 73,100 -4.88%Commodities 43,263 39,974 37,000 37,000 42,120 31,850 -13.92%Capital Outlay - - - - - - 0.00%Depreciation - - - - - 2,247 100.00%Other - - - - - - 0.00%TOTALS 868,368 981,863 975,403 974,150 1,041,450 1,020,072 4.58%
Expenditure Summary
*FY17 Adjusted includes FY17 adopted budget plus purchase orders w ritten against the FY16 budget but spent against the FY17 budget.
191

Police Department FY2018
Police Administration Program Fiscal Year 2017 Accomplishments
Digitized all police employee personnel files to Laserfiche
Provided numerous leadership training opportunities to Command Staff
Reorganized leaders to promote career growth through thoughtful transfers and promotions
Address the security needs and traffic issues related to POTUS and other high profile dignitary visits.
Full Time Equivalent Employees FY2014 FY2015 FY2016 FY2017 FY2018Director of Public Safety 0.500 0.500 0.500 0.500 0.500 Deputy Police Chief 1.000 1.000 1.000 1.000 1.000 Major - - - - 1.000 Lieutenant 2.000 2.000 2.000 2.000 1.000 Police Planner 1.000 1.000 1.000 1.000 1.000 Administrative Assistant 1.000 1.000 1.000 1.000 1.000
5.500 5.500 5.500 5.500 5.500
192

Police Department FY2018
Fiscal Year 2018 Goals and Performance Measures Police Department Goal #1 - Monitor the allocation of resources to ensure the public’s safety, address traffic flow issues, and provide timely communications. Objectives:
• Attend all FDOT Flagler and Southern Boulevard Bridge meetings and communicate any logistics issues/information to appropriate staff/units for action.
• Provide relevant and timely updates to the community through appropriate social and news media outlets.
Town Council Budget Priority #1 - Develop a General Fund budget for FY18 that does not reduce service levels and is less than the LTFP for FY18
Police Department Goal #2 - Review FY2018 department budget and functions to achieve possible cost savings and revenue sources for future budgets
Objectives:
• Thoroughly review individual unit functions and budgets to accomplish cost savings without comprising services.
• Participate in available federal grant opportunities associated with POTUS security in order to reimburse the Town for extraordinary overtime expenses.
Performance Measures
Effectiveness/Output Measures:
Actual FY14
Actual FY15
Actual FY16
Actual FY17
Projected FY18
Website Visitors 39,341 40,014 40,907 31,849 35,000
FDOT/Community Meetings Attended 18 40 36 30 35 Police Department Goal #3 – Maximize use of technology to further reduce crime and improve efficiency of police service in order to provide the highest level of protection to achieve exceptional quality of life for the community. Objectives:
• Engage the capabilities of the Townwide Security System and continue to expand the system through private/public partnerships.
• Educate and promote public awareness of Town ordinances to achieve compliance, enhancing property values and the well-being of the community.
Performance Measures
Effectiveness/Output Measures:
Actual FY14
Actual FY15
Actual FY16
Actual FY17
Projected FY18
Alerts via Townwide Security System 196 141 258 0* 250 Code Violations Issued 174 143 250 163 200
*System was non-operable during FY17
193

Police Department FY2018
Police Department Goal #4 - Develop and maintain an organizational environment that is professionally rewarding, challenging and that promotes leadership succession to address the future challenges of the police department. Objectives:
• Recruit and train high caliber police candidates. • Identify high potential future leaders and invest in them through training,
education and mentoring programs.
Performance Measures
Effectiveness/Output Measures:
Actual FY14
Actual FY15
Actual FY16
Actual FY17
Projected FY18
Applicants Interviewed 155 128 258 148 157
Applicants Completed FTO Training 13 8 4 0 0
Training Hours: Ext. and Internal 2,506 6,863 7,529.5 8,485 8,500
Police Department Goal #5 - Reduce the opportunity for criminals to commit crime and to apprehend those persons responsible when a crime has been committed. Objectives:
• Conduct programs and activities to achieve crime prevention awareness and inform the public of suspicious occurrences through social media and news releases.
Performance Measures
Effectiveness/Output Measures:
Actual FY14
Actual FY15
Actual FY16
Actual FY17
Projected FY18
News Releases/Media Alerts 12 80 76 20 50
Crime Prevention Programs/Events 40 40 32 12 20
194

Police Department FY2018
PROGRAM: ORGANIZED CRIME VICE AND NARCOTICS (OCVAN) 422 Mission: This division exists to minimize the impact of specialized criminal activity (drug enforcement, computer/internet, major financial, organized and vice) within the Town of Palm Beach. Main Activities: The most important things we do to fulfill the mission are:
• Interview potential targets and associates • Conduct surveillance • Make arrests, seize property and assets, establish confidential informants • Network with other agencies and intelligence groups • Analyze all intelligence to disseminate • Maintain intelligence files • Unmarked crime suppression activities and general support of patrol and
investigation • Reducing residential burglary through proactive strategic and tactical operations
Salaries and Wages The salary budget is derived from the payroll data for the Full Time Equivalent Employees (FTE) listed in the table below. The budget includes pay for performance increases and the proposed increase in the ranges. Employee Benefits The employee benefit costs include FICA, health insurance, retirement costs, any paid incentives and allowances, and the performance bonus. The health insurance and retirement costs are based on an allocation of the total Town costs by FTE per program. Contractual Decrease is the result of moving funds to a Commodities account to better track registration fees for training/seminar opportunities. Commodities Increase is the result of moving funds to track registration fees for training/seminar opportunities from a Contractual account and a slight increase in minor office equipment to purchase an undercover investigative device.
FY2015Actual
FY2016Actual
FY2017Budget
FY2017Adjusted*
FY2017Projected
FY2018Budget
%Change
Salaries and Wages 308,968 337,314 416,644 416,644 341,776 370,856 -10.99%Employee Benefits 284,439 301,108 370,399 370,399 361,034 356,393 -3.78%Contractual 22,222 20,518 19,300 19,342 16,441 17,980 -6.84%Commodities 10,304 9,744 13,000 13,000 13,702 18,300 40.77%Capital Outlay - - - - - - 0.00%Depreciation 3,732 7,675 7,675 7,675 7,675 11,617 51.36%Other - - - - - - 0.00%TOTALS 629,665 676,359 827,018 827,060 740,628 775,146 -6.27%
Expenditure Summary
*FY17 Adjusted includes FY17 adopted budget plus purchase orders w ritten against the FY16 budget but spent against the FY17 budget.
195

Police Department FY2018
OCVAN Program Fiscal Year 2017 Accomplishments
Participated in on-going joint investigations regarding the illegal sale of narcotics at locations in the county that originated in the Town by our undercover agents
After countless hours of surveillance around the public beach areas in Town, numerous undercover drug arrests were made
Fiscal Year 2018 Goals and Performance Measures
Police Department Goal #5 - Reduce the opportunity for criminals to commit crime and to apprehend those persons responsible when a crime has been committed. Objectives: • Use innovative and pro-active measures to gather and analyze intelligence and
utilize the latest technologies to develop and collect evidence at crime scenes • Investigate all cases to identify and arrest the offending party, recover property, and
bring investigations to successful conclusions above national average clearance rates
Performance Measures
Effectiveness/Output Measures:
Actual FY14
Actual FY15
Actual FY16
Actual FY17
Projected FY18
Total Cases Investigated 109 240 119 146 155
Total Intelligence Reports (Received) 76 71 92 79 85 Disseminated Intelligence Bulletins 45 55 103 80 90
OCVAN Productivity Measures
Effectiveness/Output Measures:
Actual FY14
Actual FY15
Actual FY16
Actual FY17
Projected FY18
Cases Investigated 109 240 119 146 155
Warrants Applied For 8 18 4 6 10
Arrest 17 29 20 13 17
Surveillance Hours 150 426 1,432* 389 500 *Surveillance tripled due to 3 months of midnights on burglary details
Full Time Equivalent Employees FY2014 FY2015 FY2016 FY2017 FY2018Sergeant 1.00 1.00 1.00 1.00 1.00 Officer 4.00 4.00 4.00 4.00 4.00
5.00 5.00 5.00 5.00 5.00
196

Police Department FY2018
PROGRAM: RECORDS INFORMATION SYSTEM UNIT 423 Mission: This division exists to provide a centralized collection point for all police activity records and disseminate the information in an accurate and meaningful way. Main Activities: The most important things we do to fulfill the mission are:
• Input all records and data into computer system • Destroy records in accordance with General Records Schedule for Local
Government Agencies and Law Enforcement Agencies • Provide the public and department with requested reports and records • Maintain an accurate inventory of police equipment and all police property
Salaries and Wages The salary budget is derived from the payroll data for the Full Time Equivalent Employees (FTE) listed in the table below. The budget includes pay for performance increases and the proposed increase in the ranges. Employee Benefits The employee benefit costs include FICA, health insurance, retirement costs, any paid incentives and allowances, and the performance bonus. The health insurance and retirement costs are based on an allocation of the total Town costs by FTE per program. Contractual: Slight decrease is the result of moving funds to a Commodities account to better track registration fees for training/seminar opportunities. Commodities Increase is the result of moving funds to track registration fees for training/seminar opportunities from a Contractual account.
FY2015Actual
FY2016Actual
FY2017Budget
FY2017Adjusted*
FY2017Projected
FY2018Budget
%Change
Salaries and Wages 115,606 119,327 120,775 120,775 121,600 120,796 0.02%Employee Benefits 58,953 54,200 58,351 57,567 57,687 64,166 9.97%Contractual 9,547 8,229 10,600 10,600 7,175 10,100 -4.72%Commodities 3,315 2,947 3,600 3,600 4,368 8,600 138.89%Capital Outlay - - - - - - 0.00%Depreciation 1,057 1,057 1,057 1,057 1,057 1,057 0.00%Other - - - - - - 0.00%TOTALS 188,478 185,760 194,383 193,599 191,887 204,719 5.32%
Expenditure Summary
*FY17 Adjusted includes FY17 adopted budget plus purchase orders w ritten against the FY16 budget but spent against the FY17 budget.
197

Police Department FY2018
Records Program Fiscal Year 2017 Accomplishments
The Records Unit along with assistance from the Armorer/Quartermaster, continued with the weapons inventory program. The Department received all new Tasers and device cartridges which were entered into the system by serial number. Each time a weapon is returned or issued the Quartermaster System is updated accordingly.
Several years of documents and arrests packets were scanned into the Records Management System (RMS) and destroyed in accordance with State Statute in our ongoing effort to go paperless.
Records Productivity Measures
Effectiveness/Output Measures:
Actual FY14
Actual FY15
Actual FY16
Actual FY17
Projected FY18
Incident Reports Received 1,149 1,496 1,557 1,237 1,350
Citations/Violations Processed 3,403 2,505 2,663 2,168 2,500
Public Records Request Processed 954 1,088 1,160 985 1,000
Full Time Equivalent Employees FY2014 FY2015 FY2016 FY2017 FY2018Records Information Systems Manager 1.000 1.000 1.000 1.000 - Communications Manager - - - - 0.500 Records Assistant I 1.000 1.000 1.000 1.000 2.000
2.000 2.000 2.000 2.000 2.500
198
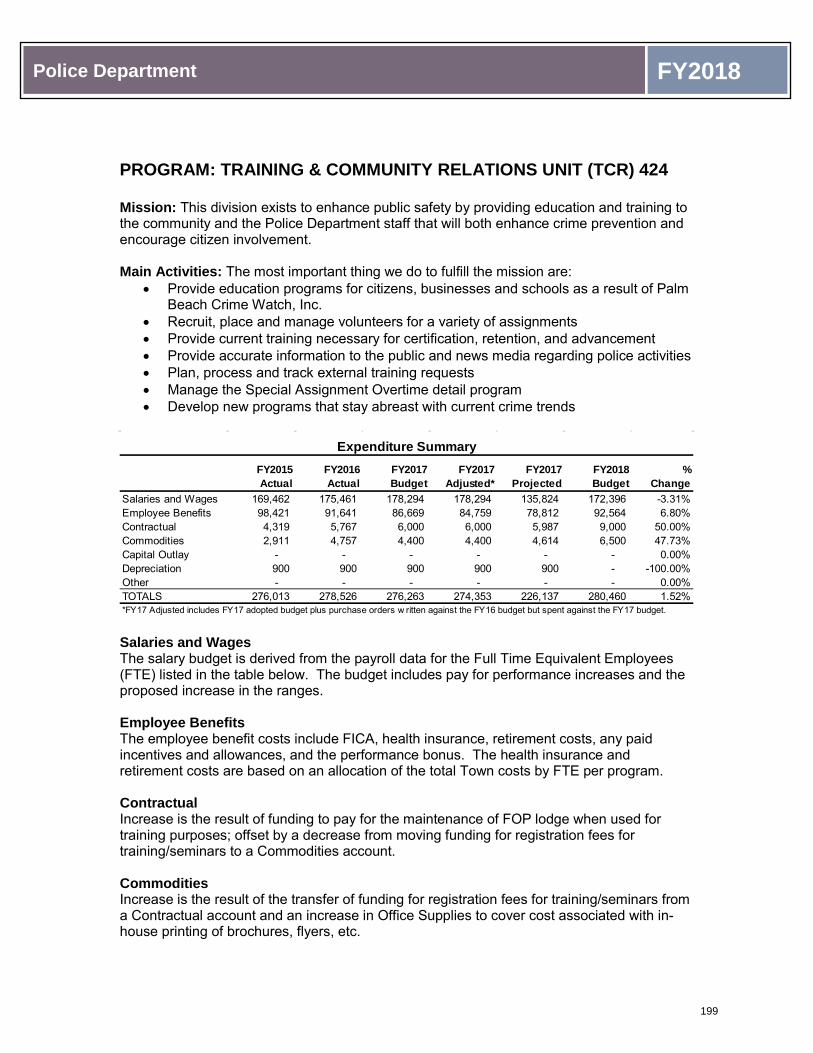
Police Department FY2018
PROGRAM: TRAINING & COMMUNITY RELATIONS UNIT (TCR) 424 Mission: This division exists to enhance public safety by providing education and training to the community and the Police Department staff that will both enhance crime prevention and encourage citizen involvement. Main Activities: The most important thing we do to fulfill the mission are:
• Provide education programs for citizens, businesses and schools as a result of Palm Beach Crime Watch, Inc.
• Recruit, place and manage volunteers for a variety of assignments • Provide current training necessary for certification, retention, and advancement • Provide accurate information to the public and news media regarding police activities • Plan, process and track external training requests • Manage the Special Assignment Overtime detail program • Develop new programs that stay abreast with current crime trends
Salaries and Wages The salary budget is derived from the payroll data for the Full Time Equivalent Employees (FTE) listed in the table below. The budget includes pay for performance increases and the proposed increase in the ranges. Employee Benefits The employee benefit costs include FICA, health insurance, retirement costs, any paid incentives and allowances, and the performance bonus. The health insurance and retirement costs are based on an allocation of the total Town costs by FTE per program. Contractual Increase is the result of funding to pay for the maintenance of FOP lodge when used for training purposes; offset by a decrease from moving funding for registration fees for training/seminars to a Commodities account. Commodities Increase is the result of the transfer of funding for registration fees for training/seminars from a Contractual account and an increase in Office Supplies to cover cost associated with in-house printing of brochures, flyers, etc.
FY2015Actual
FY2016Actual
FY2017Budget
FY2017Adjusted*
FY2017Projected
FY2018Budget
%Change
Salaries and Wages 169,462 175,461 178,294 178,294 135,824 172,396 -3.31%Employee Benefits 98,421 91,641 86,669 84,759 78,812 92,564 6.80%Contractual 4,319 5,767 6,000 6,000 5,987 9,000 50.00%Commodities 2,911 4,757 4,400 4,400 4,614 6,500 47.73%Capital Outlay - - - - - - 0.00%Depreciation 900 900 900 900 900 - -100.00%Other - - - - - - 0.00%TOTALS 276,013 278,526 276,263 274,353 226,137 280,460 1.52%
Expenditure Summary
*FY17 Adjusted includes FY17 adopted budget plus purchase orders w ritten against the FY16 budget but spent against the FY17 budget.
199

Police Department FY2018
Training and Community Relations Program Fiscal Year 2017 Accomplishments
Issued and trained all sworn personnel on the newly acquired Tasers systems.
Re-certified sworn personnel and successfully completed the FDLE audit on sworn staff training requirements.
Hosted numerous community relations and safety events to include Public Safety Open House, Hurricane Awareness, Mature Driving, and a Public Safety Day at the Rosarian Academy.
Fiscal Year 2018 Goals and Performance Measures Police Department Goal #1 - Monitor the allocation of resources to ensure the public’s safety, address traffic flow issues, and provide timely communications Objectives:
• Provide relevant and timely updates to the community through appropriate social and news media outlets.
• Use of the Townwide Camera and Security system to mitigate construction and traffic issues impacting residents, the business community, and visitors.
Performance Measures Effectiveness/Output Measures:
Actual FY14
Actual FY15
Actual FY16
Actual FY17
Projected FY18
Public E-blasts (via website) 5 11 10 12 15 News Releases/Bulletins to Website 12 35 76 42 50
Website Updates (i.e. pictures, forms, flyers, etc. 30 40 39 22 30
Full Time Equivalent Employees FY2014 FY2015 FY2016 FY2017 FY2018Training & Comm Relations Coor 1.000 1.000 1.000 1.000 1.000 Office Assistant II 2.000 2.000 2.000 2.000 2.000
3.000 3.000 3.000 3.000 3.000
200

Police Department FY2018
Police Department Goal #3 - Maximize use of technology to further reduce crime and improve efficiency of police service in order to provide the highest level of protection to achieve exceptional quality of life for the community Objectives:
• Educate and promote public awareness of Town ordinances to achieve compliance, enhancing property values and the well-being of the community
Performance Measures Effectiveness/Output Measures:
Actual FY14
Actual FY15
Actual FY16
Actual FY17
Projected FY18
Website Updates/Announcements 30 40 76 42 50
Website Hits 39,341 40,014 40,907 31,849 35,000
Police Department Goal #4 - Develop and maintain an organizational environment that is professionally rewarding, challenging and that promotes leadership succession to address the future challenges of the police department Objectives:
• Recruit and train high caliber police candidates. • Identify high potential future leaders and invest in them through training,
education and mentoring programs.
Performance Measures Effectiveness/Output Measures:
Actual FY14
Actual FY15
Actual FY16
Actual FY17
Projected FY18
Applications Received 387 316 336 329 342
Applicants Interviewed 155 128 197 148 157
Applicants Hired 25 11 9 9 13
Applicants Completed FTO Program 21 8 4 0 0
Number of Hours of Training Provided 2,506 6,863 7,529.5 8,485 8,500
201

Police Department FY2018
Police Department Goal #5 - Reduce the opportunity for criminals to commit crime and to apprehend those persons responsible when a crime has been committed. Objectives:
• Conduct programs and activities to achieve crime prevention awareness and inform the public of suspicious occurrences through social media and news releases.
• Proactively enforce town ordinances, Florida State Statues, and traffic laws.
Performance Measures Effectiveness/Output Measures:
Actual FY14
Actual FY15
Actual FY16
Actual FY17
Projected FY18
**Crime Prevention /Community Activities/Meetings/Programs 40 40 32 42 50
*Palm Beach Crime Watch Members 145 145 119 136 140 *Actual paid members **Meetings/Activities include Crime Watch Breakfast, various community association meetings, school programs, shred events, open house, National Night Out, etc.
202

Police Department FY2018
PROGRAM: COMMUNICATIONS UNIT 425 Mission: This division exists to enhance public safety by providing the community and field personnel with professional and rapid response to all calls for public safety assistance through effective training of personnel and continual evaluation of success and need. Main Activities: The most important things we do to fulfill the mission are:
• Receive emergency and non-emergency calls for service • Coordinate appropriate response of Public Safety services • Provide emergency medical instructions • Operate and control interoperable radio systems for police and fire rescue • Support field personnel by processing and relaying information
Salaries and Wages The salary budget is derived from the payroll data for the Full Time Equivalent Employees (FTE) listed in the table below. The budget includes pay for performance increases and the proposed increase in the ranges. Also includes the reclassification of the Lead Telecommunicator position to a Communications Manager due to assuming management of the Records Division, following the retirement of the Records Manager. Employee Benefits The employee benefit costs include FICA, health insurance, retirement costs, any paid incentives and allowances, and the performance bonus. The health insurance and retirement costs are based on an allocation of the total Town costs by FTE per program. Contractual A decrease in training/seminar registration fees, which were moved to a Commodities account; and a decrease in Other Equipment Maintenance due to some radio maintenance being covered by MPSCC; where offset by an increase in general radio/batteries maintenance cost due to the age of the current radios. Commodities Increase is the result of a transfer of funding for registration fees for training/seminars opportunities from a Contractual account.
FY2015Actual
FY2016Actual
FY2017Budget
FY2017Adjusted*
FY2017Projected
FY2018Budget
%Change
Salaries and Wages 847,547 852,355 906,055 906,055 878,264 907,645 0.18%Employee Benefits 477,646 504,721 567,151 554,246 534,414 534,820 -5.70%Contractual 154,609 124,207 120,585 120,585 114,888 117,575 -2.50%Commodities 10,753 12,213 7,250 7,250 8,122 9,250 27.59%Capital Outlay 9,705 - - - - - 0.00%Depreciation 27,383 33,930 33,930 33,930 33,930 41,827 23.27%Other - - - - - - 0.00%TOTALS 1,527,643 1,527,426 1,634,971 1,622,066 1,569,618 1,611,117 -1.46%
Expenditure Summary
*FY17 Adjusted includes FY17 adopted budget plus purchase orders w ritten against the FY16 budget but spent against the FY17 budget.
203

Police Department FY2018
Communications Program Fiscal Year 2017 Accomplishments Improved with staffing, scheduling, and supervisory position changes, including hiring
and successfully training two Telecommunciators to fill vacancies. Lowered average call dispatch time for Fire/Medical priority calls by an additional 3
seconds, representing a two-year total of 7 seconds. Recognized State of Florida Public Safety Telecommunicator Training Program,
certifying the Department through July 2019.
Fiscal Year 2018 Goals and Performance Measures
Police Department Goal #5 - Reduce the opportunity for criminals to commit crime and to apprehend those persons responsible when a crime has been committed
Objective: • Route all emergency Priority 1 calls through dispatch within 60 seconds and
maintain an average police officer response time of less than 4 minutes to thesecalls.
Performance Measures
Effectiveness/Output Measures: Actual FY14
Actual FY15
Actual FY16
Actual FY17
Projected FY18
Average Call Dispatch Time (Police) 1:11 1:01 1:18 1:14 1:10 Average Call Dispatch Time (Fire/Medical) 00:26 00:22 00:18 0:15 0.16
Communications Productivity Measures
Effectiveness/Output Measures: Actual FY14
Actual FY15
Actual FY16
Actual FY17
Projected FY18
Police Calls 44,695 49,950 45,164 48,264 47,500
Fire Calls/Medical Calls 2,475 2,572 2,389 2,630 2,500
Full Time Equivalent Employees FY2014 FY2015 FY2016 FY2017 FY2018Lead Telecommunications Supervisor 1.000 1.000 1.000 1.000 - Communications Manager - - - - 0.500 Telecommunications Supervisor 3.000 3.000 3.000 3.000 3.000 Telecommunicator 9.500 10.500 10.500 11.500 11.000 Call-Taker 1.000 1.000 1.000 - -
14.500 15.500 15.500 15.500 14.500
204

Police Department FY2018
PROGRAM: CRIME SCENE/EVIDENCE UNIT 426
Mission: This division exists to enhance public safety and assist the crime solving process through the forensic investigation of crime scenes.
Main Activities: The most important things we do to fulfill the mission are: • Collect, record and preserve physical evidence found at crime scenes• Prepare detailed investigative reports• Sketching and photography, as needed• Conduct laboratory analysis of forensic evidence• Examination and comparison of latent fingerprints• Preparation of cases for trial• Submission of evidence to appropriate forensic laboratories for analysis• Perform crime prevention services for the community to include fingerprinting and
identification cards
Salaries and Wages The salary budget is derived from the payroll data for the Full Time Equivalent Employees (FTE) listed in the table below. The budget includes pay for performance increases and the proposed increase in the ranges.
Employee Benefits The employee benefit costs include FICA, health insurance, retirement costs, any paid incentives and allowances, and the performance bonus. The health insurance and retirement costs are based on an allocation of the total Town costs by FTE per program.
Contractual Increase due to funding for DNA and Blood analysis via an outside source, as needed.
Commodities Increase is the result of a transfer of funding for registration fees for training/seminars opportunities from a Contractual account.
FY2015Actual
FY2016Actual
FY2017Budget
FY2017Adjusted*
FY2017Projected
FY2018Budget
%Change
Salaries and Wages 132,884 147,401 144,744 144,744 129,926 132,000 -8.80%Employee Benefits 31,407 30,949 44,634 44,270 44,113 41,158 -7.79%Contractual 10,569 17,644 6,950 6,950 3,222 9,400 35.25%Commodities 7,320 7,103 7,650 7,650 6,162 8,450 10.46%Capital Outlay - 8,849 - - - - 0.00%Depreciation 5,850 5,850 5,850 5,850 5,850 6,377 9.01%Other - - - - - - 0.00%TOTALS 188,030 217,796 209,828 209,464 189,273 197,385 -5.93%
Expenditure Summary
*FY17 Adjusted includes FY17 adopted budget plus purchase orders w ritten against the FY16 budget but spent against the FY17 budget.
205

Police Department FY2018
Crime Scene Program Fiscal Year 2017 Accomplishments Successful transition from a long tenure sworn CSEU manager to new civilian
manager
Hired a new highly qualified part-time CSEU Technician
Outsourced numerous DNA samples for analysis to successfully link 8 crimescenes in the Town.
Fiscal Year 2018 Goals and Performance Measures
Police Department Goal #5 - Reduce the opportunity for criminals to commit crime and to apprehend those persons responsible when a crime has been committed.
Objective: • Use innovative and pro-active measures to gather and analyze intelligence and
utilize the latest technology to develop and collect evidence at crime scenes
Performance Measures
Effectiveness/Output Measures: Actual FY14
Actual FY15
Actual FY16
Actual FY17
Projected FY18
Voluntary ID Cards 1,081 1,239 1,123 2,723 1,500
Crime Scenes Processed 50 52 100 100 90
Crime Scene Productivity Measures
Effectiveness/Output Measures: Actual FY14
Actual FY15
Actual FY16
Actual FY17
Projected FY18
Latent Print Comparisons 2,122 3,122 3,702 2,423 2,700
Fingerprint Identifications 39 58 40 31 35
Audio/Video/Photographic Evidence 747 808 988 652 700
Evidence Collected 1,333 1,702 3,034 2,143 2,500
Evidence Disposed Of 3,246 849 1,427 1,207 1,300
Full Time Equivalent Employees FY2014 FY2015 FY2016 FY2017 FY2018Crime Scene Evidence Manager 1.000 1.000 1.000 1.000 1.000 Crime Scene Technician II 1.000 1.000 1.000 1.000 1.000
2.000 2.000 2.000 2.000 2.000
206

Police Department FY2018
PROGRAM: PATROL 428 Mission: This division exists to protect life and property, prevent and suppress crime, preserve the public order and apprehend violators of laws and ordinances in order to create an environment where citizens feel safe and secure. Main Activities: The most important things we do to fulfill the mission are:
• Provide first level of law enforcement response • Use cruisers, motorcycles, bicycles, ATV’s, marine units and foot patrol as
appropriate to the situation • Provide special event security at high volume community affairs • Investigate suspicious persons and incidents to deter and detect criminal activity • Establish ‘omnipresence’ through frequent and conspicuous patrol throughout the
community • Resolve various types of problems and conflicts in order to preserve the peace • Enforce traffic regulations, investigate accidents and maintain an orderly flow of
traffic • Employ a proactive approach to deter and prevent crime
Salaries and Wages The salary budget is derived from the payroll data for the Full Time Equivalent Employees (FTE) listed in the table below. The budget includes pay for performance increases and the proposed increase in the ranges. Employee Benefits The employee benefit costs include FICA, health insurance, retirement costs, any paid incentives and allowances, and the performance bonus. The health insurance and retirement costs are based on an allocation of the total Town costs by FTE per program. Contractual Decrease is the result of a transfer of funding for registration fees for training/seminars to a Commodities account.
FY2015Actual
FY2016Actual
FY2017Budget
FY2017Adjusted*
FY2017Projected
FY2018Budget
%Change
Salaries and Wages 4,424,243 4,489,460 4,502,592 4,502,592 4,493,896 4,641,029 3.07%Employee Benefits 2,875,597 3,117,055 3,480,529 3,479,398 3,484,383 3,595,369 3.30%Contractual 144,047 134,237 115,000 152,483 153,749 101,500 -11.74%Commodities 252,967 245,348 302,800 305,532 342,126 334,730 10.54%Capital Outlay 39,674 102,399 101,300 205,952 153,234 46,700 -53.90%Depreciation 316,270 431,455 431,455 431,455 431,455 427,228 -0.98%Other - - - - - - 0.00%TOTALS 8,052,798 8,519,954 8,933,676 9,077,412 9,058,843 9,146,556 2.38%
Expenditure Summary
*FY17 Adjusted includes FY17 adopted budget plus purchase orders w ritten against the FY16 budget but spent against the FY17 budget.
207

Police Department FY2018
Commodities Increase is the result of a transfer of funding for registration fees for training/seminars from a Contractual account; funding for Stop Sticks and Radio Headsets for MPU as well as a substantial increase in sworn personnel uniforms expenses. Capital Outlay Increase represents funding for the purchase of a new police boat trailer.
Police Patrol Program Fiscal Year 2017 Accomplishments Developed a traffic mitigation plan that successfully increased the flow of traffic
during times of increased vehicular congestion.
Created the Emergency Field Force (EFF) unit and utilized teams during protests.
Developed coordinated efforts with USSS and PBSO to handle POTUS security, road-closures and other subsequent traffic issues.
Full Time Equivalent Employees FY2014 FY2015 FY2016 FY2017 FY2018Captain 4.000 4.000 4.000 4.000 4.000 Sergeant 8.000 8.000 8.000 8.000 8.000 Officer 42.000 42.000 42.000 42.000 42.000 Office Assistant II 1.000 - - - - Master Mechanic 0.800 0.800 0.800 0.800 0.800 Fleet Manager 0.800 0.800 0.800 0.800 0.800
56.600 55.600 55.600 55.600 55.600
208

Police Department FY2018
Fiscal Year 2018 Goals and Performance Measures Police Department Goal #1 - Monitor the allocation of resources to ensure the public’s safety, address traffic flow issues, and provide timely communications. Objectives:
• Use the Town-wide Camera and Security system to mitigate construction and traffic issues impacting residents, the business community, and visitors
• Utilize Emergency Operations Plans and other pro-active measures to allocate resources to allow sufficient traffic flow during rush hour and for all emergency vehicles
• Attend all FDOT Flagler Bridge meetings and communicate any logistics issues/information to appropriate staff/units for action
Performance Measures
Effectiveness/Output Measures:
Actual FY14
Actual FY15
Actual FY16
Actual FY17
Projected FY18
Alerts via Townwide Security System 196 141 258 0* 300 *System was non-operable during FY17. Police Department Goal #3 – Maximize use of technology to further reduce crime and improve efficiency of police service in order to provide the highest level of protection to achieve exceptional quality of life for the community. Objectives:
• Engage the capabilities of the Town-wide Security System and continue to expand the system through private/public partnerships
• Expand Direct Connect users to improved alarm response to residents and the business community and reduce allocation of resources to false alarms
• Educate and promote public awareness of Town ordinances to achieve compliance, enhancing property values and the well-being of the community
Performance Measures
Effectiveness/Output Measures: Actual FY14
Actual FY15
Actual FY16
Actual FY17
Projected FY18
Public E-blasts (via website) 5 11 10 12 15 News Releases/Bulletins to Website 12 35 76 42 50
209

Police Department FY2018
Police Department Goal #4 - Develop and maintain an organizational environment that is professionally rewarding, challenging and that promotes leadership succession to address the future challenges of the police department Objectives:
• Recruit and train high caliber police candidates • Identify high potential future leaders and invest in them through training,
education and mentoring programs
Performance Measures Effectiveness/Output Measures:
Actual FY14
Actual FY15
Actual FY16
Actual FY17
Projected FY18
Applications Received 259 316 336 329 342
Applicants Interviewed 101 128 197 148 157
Applicants Hired 16 8 9 9 13 Applicants Completed FTO Program 13 8 4 0 0 Number of Hours of Training Provided 216 6,863 7,529.5 8,485 8,500
Police Department Goal #5 - Reduce the opportunity for criminals to commit crime and to apprehend those persons responsible when a crime has been committed Objectives:
• Route all emergency Priority 1 calls through dispatch within 60 seconds and maintain an average police officer response time of less than 4 minutes to these calls.
• Use innovative and pro-active measures to gather and analyze intelligence and utilize the latest technologies to develop and collect evidence at crime scenes.
• Investigate all cases to identify and arrest the offending party, recover property, and bring investigations to successful conclusions above national average clearance rates
• Conduct programs and activities to achieve crime prevention awareness and inform the public of suspicious occurrences through social media and news releases.
210

Police Department FY2018
Performance Measures
Effectiveness/Output Measures:
Actual FY14
Actual FY15
Actual FY16
Actual FY17
Projected FY18
Police Calls 44,695 49,950 45,164 48,264 47,500
Patrol Response Time 4:06 5:27 3:56 4:38* 4:00
Arrest by Patrol Officers 1,700 1,368 1,861 1,719 1,800
Business Security Checks Hours 1,930 3,217 1,649 2,480 2,000
Closed House Checks 1,550 1,525 3,698 2,337 2,500
Field Interview Reports 475 356 517 431 500
Intelligence Reports 76 71 87 81 80 *Call Response Time effected by Hurricane Irma calls for service.
Police Patrol Productivity Measures Effectiveness/Output Measures:
Actual FY14
Actual FY15
Actual FY16
Actual FY17
Projected FY18
Foot Patrol Hours 1,500 1,649 1,649 1,633 1,700
Bicycle Patrol Hours 75 30 79 55.5 65
ATV Hours 50 23 25 40.5 35
Marine Patrol Hours 1,500 2,002 1,699 1,622 1,650
Selective Enforcement Hours 260 1,488 627 1,034 900
211
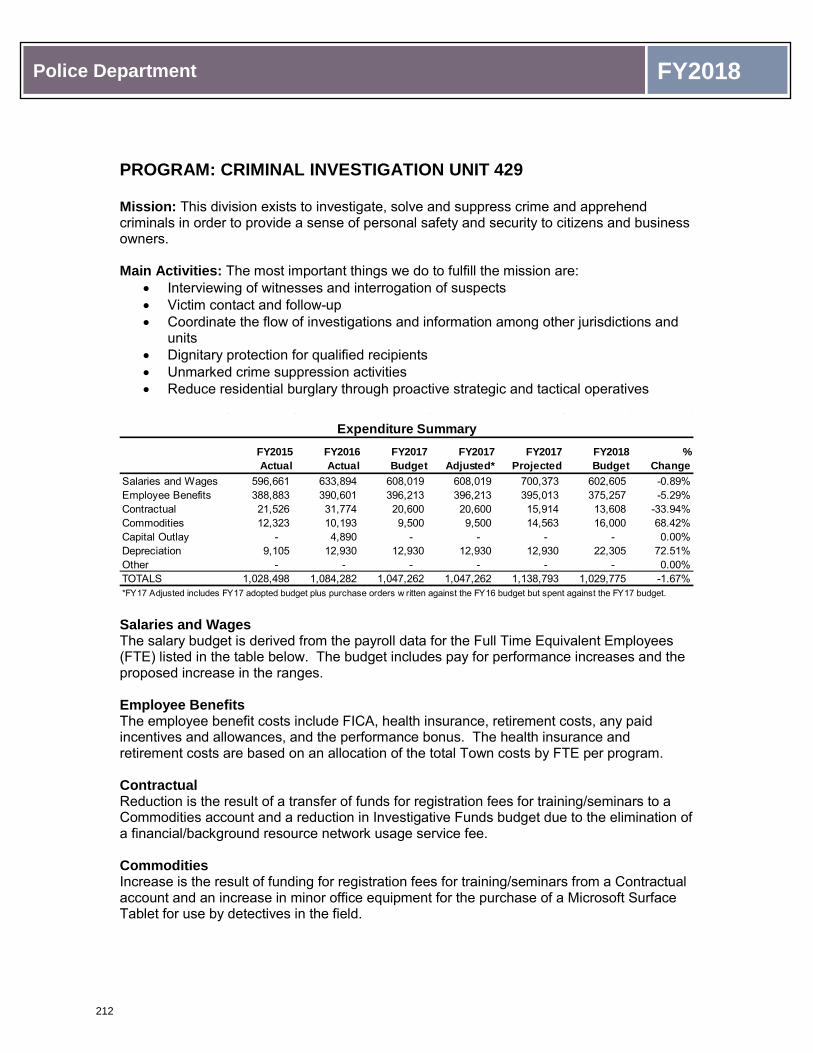
Police Department FY2018
PROGRAM: CRIMINAL INVESTIGATION UNIT 429 Mission: This division exists to investigate, solve and suppress crime and apprehend criminals in order to provide a sense of personal safety and security to citizens and business owners. Main Activities: The most important things we do to fulfill the mission are:
• Interviewing of witnesses and interrogation of suspects • Victim contact and follow-up • Coordinate the flow of investigations and information among other jurisdictions and
units • Dignitary protection for qualified recipients • Unmarked crime suppression activities • Reduce residential burglary through proactive strategic and tactical operatives
Salaries and Wages The salary budget is derived from the payroll data for the Full Time Equivalent Employees (FTE) listed in the table below. The budget includes pay for performance increases and the proposed increase in the ranges. Employee Benefits The employee benefit costs include FICA, health insurance, retirement costs, any paid incentives and allowances, and the performance bonus. The health insurance and retirement costs are based on an allocation of the total Town costs by FTE per program. Contractual Reduction is the result of a transfer of funds for registration fees for training/seminars to a Commodities account and a reduction in Investigative Funds budget due to the elimination of a financial/background resource network usage service fee. Commodities Increase is the result of funding for registration fees for training/seminars from a Contractual account and an increase in minor office equipment for the purchase of a Microsoft Surface Tablet for use by detectives in the field.
FY2015Actual
FY2016Actual
FY2017Budget
FY2017Adjusted*
FY2017Projected
FY2018Budget
%Change
Salaries and Wages 596,661 633,894 608,019 608,019 700,373 602,605 -0.89%Employee Benefits 388,883 390,601 396,213 396,213 395,013 375,257 -5.29%Contractual 21,526 31,774 20,600 20,600 15,914 13,608 -33.94%Commodities 12,323 10,193 9,500 9,500 14,563 16,000 68.42%Capital Outlay - 4,890 - - - - 0.00%Depreciation 9,105 12,930 12,930 12,930 12,930 22,305 72.51%Other - - - - - - 0.00%TOTALS 1,028,498 1,084,282 1,047,262 1,047,262 1,138,793 1,029,775 -1.67%
Expenditure Summary
*FY17 Adjusted includes FY17 adopted budget plus purchase orders w ritten against the FY16 budget but spent against the FY17 budget.
212

Police Department FY2018
Criminal Investigation Unit Program Fiscal Year 2017 Accomplishments
Maintained an exceptional Crime Uniform Clearance Rate over 50%, while the national average remains in the teens
Fiscal Year 2018 Goals and Performance Measures Police Department Goal #5 - Reduce the opportunity for criminals to commit crime and to apprehend those persons responsible when a crime has been committed. Objectives:
• Use innovative and pro-active measures to gather and analyze intelligence and utilize the latest technology to develop and collect evidence at crime scenes
• Investigate all cases to identify and arrest the offending party, recover property, and bring investigations to successful conclusions above national average clearance rates
• Conduct programs and activities to achieve crime prevention awareness and inform the public of suspicious occurrences through social media and news releases
Performance Measures
Effectiveness/Output Measures:
Actual FY14
Actual FY15
Actual FY16
Actual FY17
Projected FY18
Crimes Investigated 254 165 276 228 250
Investigative Clearance Rate (Part 1) 38% 51% 56% 51.25% 53%
Criminal Investigation Unit Productivity Measures Effectiveness/Output Measures:
Actual FY14
Actual FY15
Actual FY16
Actual FY17
Projected FY18
Investigative Hours 2,700 2,104 3,520 2,987.5 3,200
Surveillance Hours 208 123 251 417.5 350
Patrol Hours 479 613 425 1,054.5 750
Full Time Equivalent Employees FY2014 FY2015 FY2016 FY2017 FY2018Captain 1.000 1.000 1.000 1.000 1.000 Sergeant 1.000 1.000 1.000 1.000 1.000 Officer 4.000 4.000 4.000 4.000 4.000 Crime Intellegence Analyst 1.000 1.000 1.000 1.000 1.000
7.000 7.000 7.000 7.000 7.000
213

Police Department FY2018
PROGRAM: PARKING CONTROL UNIT 430 Mission: This division exists to provide for the efficient use of limited public parking availability through active enforcement of all parking ordinances, rules and regulations. Main Activities: The most important things we do to fulfill the mission are:
• Patrol parking areas on a regular basis to identify and ticket violators • Address inquiries and complaints from the public • Handle pedestrian and vehicular traffic at schools and major intersections • Apply vehicle immobilization device as necessary • Review construction plans for traffic hazards, traffic flow and parking for special
events as needed
Salaries and Wages The salary budget is derived from the payroll data for the Full Time Equivalent Employees (FTE) listed in the table below. The budget includes pay for performance increases and the proposed increase in the ranges. Employee Benefits The employee benefit costs include FICA, health insurance, retirement costs, any paid incentives and allowances, and the performance bonus. The health insurance and retirement costs are based on an allocation of the total Town costs by FTE per program. Contractual Increase in training for Community Service Aid training for Parking Enforcement Officers and a slight increase in data usage fees for LPR mobile devices. Commodities Increase due to the transfer of funding for registration fees for training/seminars from a Contractual account.
FY2015Actual
FY2016Actual
FY2017Budget
FY2017Adjusted*
FY2017Projected
FY2018Budget
%Change
Salaries and Wages 265,424 251,582 311,241 311,241 262,887 306,729 -1.45%Employee Benefits 199,026 200,666 244,513 239,618 231,206 253,482 3.67%Contractual 13,992 7,549 14,700 14,700 13,580 16,000 8.84%Commodities 13,287 12,038 15,800 15,800 17,186 21,000 32.91%Capital Outlay - 3,721 23,000 55,844 58,483 - -100.00%Depreciation 52,562 34,235 34,235 34,235 34,235 46,176 34.88%Other - - - - - - 0.00%TOTALS 544,291 509,791 643,489 671,438 617,577 643,387 -0.02%
Expenditure Summary
*FY17 Adjusted includes FY17 adopted budget plus purchase orders w ritten against the FY16 budget but spent against the FY17 budget.
214
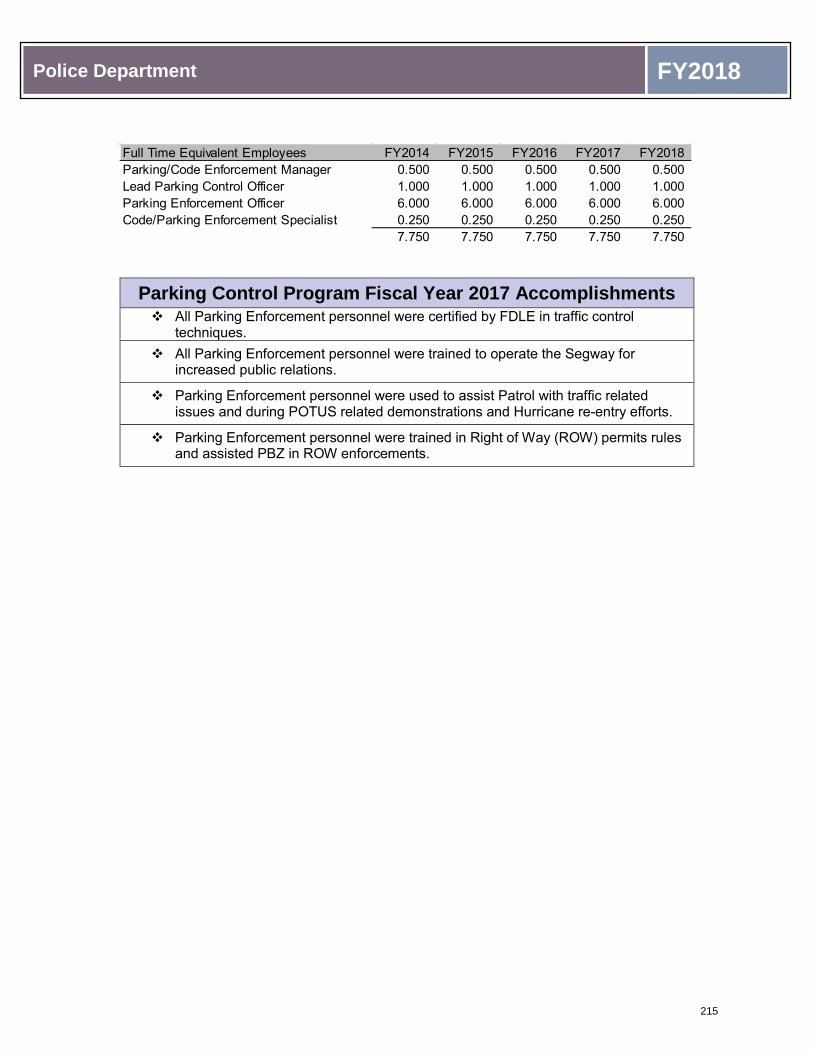
Police Department FY2018
Parking Control Program Fiscal Year 2017 Accomplishments All Parking Enforcement personnel were certified by FDLE in traffic control
techniques. All Parking Enforcement personnel were trained to operate the Segway for
increased public relations.
Parking Enforcement personnel were used to assist Patrol with traffic related issues and during POTUS related demonstrations and Hurricane re-entry efforts.
Parking Enforcement personnel were trained in Right of Way (ROW) permits rules and assisted PBZ in ROW enforcements.
Full Time Equivalent Employees FY2014 FY2015 FY2016 FY2017 FY2018Parking/Code Enforcement Manager 0.500 0.500 0.500 0.500 0.500 Lead Parking Control Officer 1.000 1.000 1.000 1.000 1.000 Parking Enforcement Officer 6.000 6.000 6.000 6.000 6.000 Code/Parking Enforcement Specialist 0.250 0.250 0.250 0.250 0.250
7.750 7.750 7.750 7.750 7.750
215

Police Department FY2018
Fiscal Year 2018 Goals and Performance Measures Town Council Budget Priority #3 - Develop and recommend a plan to improve enforcement of rules pertaining to construction related parking and related job site traffic impacts. Develop and implement a computer/software based traffic management tool to be used by staff to facilitate up-to-date data in the determination of ROW permit issuance to avoid conflicts in north/south roadway corridors, to facilitate the approval process, and notification to the public of pending road closures and detours. Develop a matrix listing “large” public and private construction projects, identifying traffic impacts on residents for each project and delineating if the project is anticipated to impact an arterial roadway. Based upon final matrix content ascertain feasibility of modifying schedule of Town controlled projects to minimize traffic impacts. Review data and ascertain need for construction moratorium on Fridays when POTUS comes to Town for large projects defined as any project generating more than 10 trips per day.
Police Department Goal #6 - Provide for the safe and efficient use of parking spaces for residents and business patrons. Objective:
• Regulate the use of all parking in the Town of Palm Beach by enforcement of all parking ordinances and regulations in order to create adequate turnover.
Performance Measures
Effectiveness/Output Measures: Actual FY14
Actual FY15
Actual FY16
Actual FY17
Projected FY18
Parking Tickets 14,900 10,214 15,998 10,901 13,000
Kiosk Tickets 1,450 1,294 1,006 799 1,000
Traffic Boots 64 36 69 40 50
Parking Control Productivity Measures
Effectiveness/Output Measures:
Actual FY14
Actual FY15
Actual FY16
Actual FY17
Projected FY18
Vehicle Patrol Hours 7,365 8,721 8,044 6,929.5 7,500
Revenues $964,500 $1,099,515 $1,091,737 $872,606.15 $1,000,000
Expenditures $647,772 $548,608 $505,877 $616,598 $643,387
216

Public Works
217

Public Works Department FY2018
Director
Assistant Director
Administrative Office Facilities Division
Electrical (Traffic/Street Light) Bureau
General Maintenance
Bureau
Paint and Signs Bureau
Parks/Streets Bureau
Street Maintenance
Bureau
Water Resources Division
Public Works Systems
Specialist
Storm Sewer Maintenance
Sanitary Sewer Maintenance
Sanitary Sewer Treatment
Services Division
Sanitation Bureau
Trash Bureau
Vehicle Maintenance
Bureau
Coastal Program Manager Town Engineer
Engineering Division
218

Public Works Department FY2018
Public Works Department FY2018 Goals
Public Works Goal #1: Continue to monitor FDOT’s Southern Boulevard Bridge Project and implement coordinated actions with other governmental authorities (State, County, City of West Palm Beach) to mitigate impacts of any short-term or long-term lane closures on the bridge
OBJECTIVES: • Attend periodic meetings with FDOT/contractor project teams • Coordinate negative traffic impacts with other Town departments as well as
affected resident/businesses, assist in developing mitigation strategies
Public Works Goal #2: Continue implementation of a long-term coastal protection plan
OBJECTIVES: • Continue pursuit of required Federal permits in accordance with BMA • Continue BMA and permit required monitoring • Construct shore protection projects in accordance with the 10-year long-term plan
Public Works Goal #3: Implement Year 4 of Phase 2 of Accelerated Capital Improvement Program OBJECTIVES:
• Continue Design and Construction of Phase 2 Projects • Move as many Pay-as-You-Go Capital Improvement Projects as possible to Phase
2 of ACIP
Public Works Goal #4: Right-of-Way Maintenance and Enforcement Ensuring all Town Right-of-Ways are Managed to Meet the Town’s Standards Applicable to Public Rights-of-Way and Easements within the Town of Palm Beach.
OBJECTIVES: • Continue to improve on compliance with the Right-of-Way Standards • Improve coordination of traffic impacts due to issuance of right-of-way permits.
Ensure only necessary number of parking permits are issued for each request. • Increase compliance of parking within the right-of-way • Increase compliance of right-of-way permitted use • Minimize north/south traffic disruptions caused by permitted work within the right-
of-way • Increase site inspections of right-of-way compliance
219

Public Works Department FY2018
Public Works Goal #5: Traffic Control - Provide all necessary traffic control devices and markings to ensure safe pedestrian and vehicle operation
OBJECTIVES: • Maintain proper signs and pavement markings to meet parking/traffic needs. • Operate/maintain traffic signals, including preventive maintenance and also
responding to urgent call outs in timely manner.
Public Works Goal #6: Storm Water Management - Protect the health, safety and property of residents and businesses to prevent or minimize flooding of the Town’s rights-of-way and adjacent private property
OBJECTIVES: • Operate and maintain the storm water collection and pumping systems in a manner
that reduces unexpected failures of the equipment, and respond to call-outs for reported flooding of streets and property
• Assist in rehabilitation or construction of ACIP projects related to storm water facilities
Public Works Goal #7: Sanitary Sewer - Protect the health and welfare of residents, businesses, general public and the environment to collect, transport and dispose of the Town’s sewage in an efficient and cost effective manner
OBJECTIVES: • Operate and maintain the sanitary sewer collection and pumping systems in a
manner that reduces unexpected failures of the equipment, and respond to call-outs for reported problems associated with clogs, backups, spills or equipment
• Assist in rehabilitation or construction of ACIP projects related to sanitary sewer facilities and infrastructure
Public Works Goal #8: Yard Trash Collection - Provide timely yard waste collection and disposal services, by providing the desired level of service in an efficient and cost effective manner
OBJECTIVES: • Continue to investigate and study alternative means of reducing the volume of
vegetative debris at these sites to prolong the useful life of the landfills • Continue consultant task to identify a suitable pilot program for waste reduction,
material processing and potential uses for final disposition • Develop long-term master plan for landfill use, closure and or long-term care • Maintain care and closure plans for the sale/lease of the Okeechobee Blvd site
220

Public Works Department FY2018
Public Works Goal #9: Commercial Recycling – Increase the total volume collected by providing education and guidance to commercial businesses and establishments
OBJECTIVES: • Use multiple methods of communication to obtain customer feedback to determine
the type and quantity of materials being recycled by commercial customers and implement appropriate procedures
• Continue to educate residents and businesses on the benefits of recycling, and strive to increase the amount of material being recycled
• Expand a Town of Palm Beach office recycling program specific to departmental operations
Public Works Goal #10: Landscape Maintenance - Maintain the landscaping and grounds of the Town in an efficient and cost effective manner, while striving to improve its appearance
OBJECTIVES: • Continue to improve irrigation systems Town-wide, and to standardize equipment
and materials. Implement low flow irrigation heads and smart irrigation upgrades or replacements in larger parks and medians as appropriate
Public Works Goal #11: Facility Maintenance - Maintain the buildings, structures, and facilities of the Town in an efficient, safe and cost effective manner for the general public and Town employees
OBJECTIVES: • Continue with identification and replacement of obsolete and inefficient HVAC
systems in all Town buildings • Identify and replace worn flooring systems throughout all Town facilities • Continue the systematic replacement of existing lighting with energy efficient LED
lighting • Begin replacement of old lavatory faucet systems with water saving systems
221

Public Works Department FY2018
Public Works Goal #12: Equipment Maintenance - Maintain the vehicles and equipment of the Town’s non-public-safety fleet in an efficient, safe and cost effective manner
OBJECTIVES: • Maintain high level of equipment availability and reduce downtime by performing
necessary and proactive preventive maintenance, and repairs as required • Acquire new vehicles and equipment through planning and budgeting from the
Equipment Replacement Fund, to provide newer and more efficient fleet that meets the requirements of the users
• Initiate and evaluate vehicle and equipment right sizing study • Evaluate PM intervals and adjust accordingly • Create equipment specific predictive maintenance tasks
222

Public Works Department FY2018
DEPARTMENT: PUBLIC WORKS Mission: The Public Works Department exists to create and maintain a safe, clean and aesthetically pleasing environment for all the citizens of Palm Beach. This efficient and cost effective environment is provided for the residents, businesses, visitors, and employees who utilize the Town facilities in our community. The Public Works Department applies both proven and innovative techniques and systems to provide for excellence in the operation, construction, maintenance and repair of the public buildings, structures and grounds to achieve this purpose. The continuous stewardship of the Town's infrastructure and coastal resources is achieved through the dedicated efforts of a diverse group of operational, administrative, engineering, and construction professionals.
2015 Actual 2016 Actual 2017
Budget 2017
Projected 2018
Budget %
ChangeSpecial Solid Waste 10,040 9,500 10,000 10,115 10,000 0.00%Solid Waste 895,065 893,115 995,000 973,832 1,024,850 3.00%Comp. Garbage Collection Fee 258,268 256,693 275,000 261,169 283,250 3.00%SWA Recycling Revenue 24,073 15,552 25,000 28,105 25,000 0.00%Historic Speciman Tree Fee 4,641 4,641 5,000 3,978 5,000 0.00%State Highway Lighting Maint 76,551 78,846 95,000 95,454 95,000 0.00%
1,268,638 1,258,347 1,405,000 1,372,653 1,443,100 2.71%
Revenue Summary
FY2015Actual
FY2016Actual
FY2017Budget
FY2017Adjusted*
FY2017Projected
FY2018Budget
%Change
Salaries and Wages 4,814,387 4,764,800 5,378,730 5,378,730 5,151,794 5,521,447 2.65%Employee Benefits 2,645,247 2,716,615 3,005,440 2,940,954 2,918,174 3,155,905 5.01%Contractual 4,731,174 4,685,441 5,334,053 6,020,972 4,833,678 5,453,293 2.24%Commodities 690,025 651,432 864,432 884,413 844,350 877,687 1.53%Capital Outlay - 25,393 24,800 68,626 - 23,665 -4.58%Depreciation 573,832 1,028,165 716,214 716,214 716,214 678,720 -5.24%Other - - - - - - 0.00%TOTALS 13,454,665 13,871,846 15,323,669 16,009,909 14,464,210 15,710,717 2.53%
Expenditure Summary
*FY17 Adjusted includes FY17 adopted budget plus purchase orders w ritten against the FY16 budget but spent against the FY17 budget.
223

Public Works Department FY2018
FY2015 FY2016 FY2017 FY2018 Full Time Equivalent Employees 87.540 89.040 88.068 88.635
Changes to FTEs:
• Reflects additional FTE approved for full-time ROW inspector (upgraded from part-time position)
FY2015Actual
FY2016Actual
FY2017Budget
FY2018Budget
Expenditures 13,454,665 13,871,846 15,323,669 15,710,745Revenues 1,268,638 1,258,347 1,405,000 1,443,100
-
2,000,000
4,000,000
6,000,000
8,000,000
10,000,000
12,000,000
14,000,000
16,000,000
18,000,000
Public Works
Administrative Management; $1,025,426 ; 6%
Transportation; $1,149,068 ; 7%
Sanitary/Storm Sewers; $4,299,725 ; 27%
Solid Waste Collection/Disposal; $4,667,236 ; 30%
Buildings and Grounds; $2,775,873 ; 18%
Equipment Operations; $731,909 ; 5%
Other; $1,061,480 ; 7%
224

Public Works Department FY2018
PROGRAM: ADMINISTRATIVE MANAGEMENT 511 Mission: This division exists to provide guidance, inspiration, resources and direction to the Public Works Department to ensure that the multiple functions we perform are both efficient through our commitment to continual improvement and effective in meeting the expectations of the citizens we serve. Main Activities: The most important things we do to fulfill the mission are:
• Provide oversight to all Public Works programs to ensure we maintain or improve levels of service and safety measures
• Implement the Town’s Capital Improvement Plan and the Comprehensive Coastal Management Plan.
• Manage all projects authorized by the Town Council. • Continually seek new and better ways to accomplish our mission.
Salaries and Wages The salary budget is derived from the payroll data for the Full Time Equivalent Employees (FTE) listed in the table below. The budget includes pay for performance increases and the proposed increase in the ranges. Employee Benefits The employee benefit costs include FICA, health insurance, retirement costs, any paid incentives and allowances, and the performance bonus. The health insurance and retirement costs are based on an allocation of the total Town costs by FTE per program. Contractual The decrease reflects the reduction associated with discontinued use of scanning services from PBC and use of in-house resources to more efficiently accomplish that work. Commodities This increase reflects the inclusion of training in this category (which had previously been in contractual)
FY2015Actual
FY2016Actual
FY2017Budget
FY2017Adjusted*
FY2017Projected
FY2018Budget
%Change
Salaries and Wages 601,403 636,712 633,840 633,840 614,361 632,240 -0.25%Employee Benefits 280,542 312,699 316,218 308,372 310,906 346,149 9.47%Contractual 15,362 20,563 43,000 43,822 143,150 31,600 -26.51%Commodities 10,602 7,026 9,200 9,200 11,369 11,200 21.74%Capital Outlay - - - - - - 0.00%Depreciation 4,237 4,237 4,237 4,237 4,237 4,237 0.00%Other - - - - - - 0.00%TOTALS 912,146 981,237 1,006,495 999,471 1,084,023 1,025,426 1.88%
Expenditure Summary
*FY17 Adjusted includes FY17 adopted budget plus purchase orders w ritten against the FY16 budget but spent against the FY17 budget.
225

Public Works Department FY2018
Full Time Equivalent Employees FY2014 FY2015 FY2016 FY2017 FY2018Public Works Director 1.000 1.000 1.000 1.000 1.000 Assistant Director 1.000 1.000 1.000 1.000 1.000 Buyer - - 0.500 0.500 0.500 Office Manager 1.000 1.000 1.000 1.000 1.000 Engineering Technical Support Specialist - - 1.000 - - Office Assistant II 4.000 4.000 4.000 4.000 4.000 Public Works Purchasing Coordinator 0.500 0.500 - - - Public Works Systems Specialist 1.000 1.000 1.000 1.000 1.000
8.500 8.500 9.500 8.500 8.500
226

Public Works Department FY2018
PROGRAM: STREET REPAIR & MAINTENANCE 521 Mission: This bureau exists to maintain, repair, and clean streets in order to provide a safe, smooth riding surface throughout the town and to assure that we have safe sidewalks, bikeways, and trail systems. Main Activities: The most important things we do to fulfill the mission are:
• Work to continually improve quality and efficiency • Inspect the condition of streets, sidewalks, and paths to prioritize maintenance,
repairs and replacement appropriately • Respond to emergencies and priorities in a timely fashion
Salaries and Wages The salary budget is derived from the payroll data for the Full Time Equivalent Employees (FTE) listed in the table below. The budget includes pay for performance increases and the proposed increase in the ranges. Employee Benefits The employee benefit costs include FICA, health insurance, retirement costs, any paid incentives and allowances, and the performance bonus. The health insurance and retirement costs are based on an allocation of the total Town costs by FTE per program. Contractual This decrease reflects a reduction in the pressure washing of sidewalks in commercial areas, based on revised ordinances requiring adjacent property owners to be responsible for that effort. Commodities This decrease reflects a reduction in the materials required for temporary cold-mix asphalt patching based on historical use and recent trends. Depreciation This increase reflects the revised depreciation required based on Equipment Replacement Fund acquisitions and the expected useful life and replacement cost of vehicles/equipment.
FY2015Actual
FY2016Actual
FY2017Budget
FY2017Adjusted*
FY2017Projected
FY2018Budget
%Change
Salaries and Wages 108,422 68,974 90,330 90,330 70,436 93,605 3.63%Employee Benefits 53,237 46,730 50,876 50,220 47,449 55,306 8.71%Contractual 141,598 171,107 194,272 218,762 126,581 179,855 -7.42%Commodities 9,215 9,100 26,855 26,855 12,398 24,365 -9.27%Capital Outlay - - - - - - 0.00%Depreciation 24,399 16,734 16,734 16,734 16,734 21,168 26.50%Other - - - - - - 0.00%TOTALS 336,871 312,645 379,067 402,901 273,598 374,299 -1.26%
Expenditure Summary
*FY17 Adjusted includes FY17 adopted budget plus purchase orders w ritten against the FY16 budget but spent against the FY17 budget.
227

Public Works Department FY2018
Street Repair and Maintenance Program Fiscal Year 2017 Accomplishments
Removed and replaced 125 square yards of sidewalk
Began the bike trail access asphalt rehabilitation project Fiscal Year 2018 Goals and Performance Measures
OBJECTIVES:
• Sweep all streets and clean out storm drainage inlets to keep roads clear • Respond in timely manner to roadway imperfections and repair as needed • Inspect and replace broken sidewalk as needed
Performance Measures
Effectiveness/Output Measures:
Actual FY14
Actual FY15
Actual FY16
Actual FY17
Projected FY18
Clean & Inspect Storm Inlets 1,640 1,640 1,640 1,640 1,640
Street Repair and Maintenance Productivity Measures
Effectiveness/Output Measures: Actual FY14
Actual FY15
Actual FY16
Actual FY17
Projected FY18
Inspect & Repair Sidewalks (sq. yds.) 250 160 182 125 130
Pot Holes Patched (sq. yds.) 75 100 168 102 111
Full Time Equivalent Employees FY2014 FY2015 FY2016 FY2017 FY2018Facilities Maintenance Division Manager 0.100 0.100 0.100 0.075 0.075 General Maitenance Supervisor - - - 0.075 0.085 Grounds Supervisor 0.135 0.134 0.135 0.080 0.080 Street & Sign Painter 0.008 0.008 0.008 0.008 0.008 Building Maintenance Worker - - - - 0.016 Equipment Operator I/Streets 1.310 1.310 1.310 0.705 - Equipment Operator II - - - 0.605 1.310 Irrigation and Spray Technician 0.010 0.010 0.010 0.010 0.010
1.563 1.562 1.563 1.558 1.584
228

Public Works Department FY2018
PROGRAM: TRAFFIC CONTROL 523 Mission: This bureau exists to provide and maintain traffic signals and control signs to ensure safe, well marked street systems. Main Activities: The most important things we do to fulfill the mission are:
• Preventive maintenance and inspection programs to proactively address issues • Repair/replace signals and signs as necessary on Town’s required level of service
plan • Install new signs as approved by the Town Manager, and upgrade/replace signs as
needed to be consistent with industry standards
Salaries and Wages The salary budget is derived from the payroll data for the Full Time Equivalent Employees (FTE) listed in the table below. The budget includes pay for performance increases and the proposed increase in the ranges. Employee Benefits The employee benefit costs include FICA, health insurance, retirement costs, any paid incentives and allowances, and the performance bonus. The health insurance and retirement costs are based on an allocation of the total Town costs by FTE per program. Contractual This increase reflects the incremental cost of services consistent with annual consumer price index adjustments. Commodities This increase reflects the replacement of some existing deteriorated sign posts with round aluminum posts consistent with typical roadway standards. Capital Outlay This decrease reflects that no major signal equipment purchases (spare parts for existing video detection systems) are anticipated in FY18. Depreciation This increase reflects the revised depreciation required based on Equipment Replacement Fund acquisitions and the expected useful life and replacement cost of vehicles/equipment.
FY2015Actual
FY2016Actual
FY2017Budget
FY2017Adjusted*
FY2017Projected
FY2018Budget
%Change
Salaries and Wages 99,046 113,156 116,588 116,588 135,378 140,108 20.17%Employee Benefits 48,814 57,481 52,182 51,235 52,319 60,403 15.75%Contractual 31,078 8,931 40,870 40,870 13,875 41,385 1.26%Commodities 42,805 49,708 48,978 48,978 86,743 50,881 3.89%Capital Outlay - - 13,500 57,326 - - -100.00%Depreciation 3,722 3,722 3,722 3,722 3,722 5,309 42.64%Other - - - - - - 0.00%TOTALS 225,465 232,998 275,840 318,719 292,037 298,086 8.06%
Expenditure Summary
*FY17 Adjusted includes FY17 adopted budget plus purchase orders w ritten against the FY16 budget but spent against the FY17 budget.
229

Public Works Department FY2018
Traffic Control Program Fiscal Year 2017 Accomplishments Continued removal and replacement of galvanized sign assemblies with aluminum
Continued removal and replacement of obsolete traffic control devices Fiscal Year 2018 Goals and Performance Measures Public Works Goal #5 - Provide all necessary traffic control devices and markings to ensure safe pedestrian and vehicle operation
OBJECTIVES:
• Maintain proper signs and pavement markings to meet parking/traffic needs • Operate/maintain traffic signals, including preventive maintenance and also
responding to urgent call outs in timely manner
Traffic Control Productivity Measures
Effectiveness/Output Measures: Actual FY14
Actual FY15
Actual FY16
Actual FY17
Projected FY18
Replace Traffic Control Signs 125 265 286 340 290
Traffic Signal Replacement (LED) 61 69 67 50 62
Curbs and Traffic Control Lines Painted
27,300 LF
27,300 LF
61,662 LF
34,870 LF
34,870 LF
Perform Preventative Maintenance in signalized intersections 52 52 52 52 52
Full Time Equivalent Employees FY2014 FY2015 FY2016 FY2017 FY2018Facilities Maintenance Division Manager 0.180 0.180 0.180 0.155 0.155 Electrician Supervisor 0.203 0.203 0.203 0.181 0.181 Grounds Supervisor 0.005 0.005 0.005 0.005 0.005 General Maintenance Supervisor 0.090 0.090 0.090 0.090 0.093 Industrial Electrician - - 0.528 0.528 0.350 SR Industrial Electrician 0.528 0.528 - - 0.175 Building Maintenance Worker 0.040 0.040 0.040 0.040 0.395 Street & Sign Painter 0.500 0.500 0.750 0.750 0.750
1.546 1.546 1.796 1.749 2.104
230

Public Works Department FY2018
PROGRAM: STREET LIGHTING 524 Mission: This bureau exists to maintain reliable, safe and effective street lighting systems that contribute to safe streets in the Town and protect endangered sea turtles from light intrusion during nesting season. Main Activities: The most important things we do to fulfill the mission are:
• Conduct preventive maintenance annually on the 1,251 street lights in Town. • Perform “locates” for underground wiring to minimize the likelihood of damage due to
digging. • Replacement of older poles on predetermined schedule for uniform lighting. • Conduct periodic inspections of street lights to ensure they are operating properly.
Salaries and Wages The salary budget is derived from the payroll data for the Full Time Equivalent Employees (FTE) listed in the table below. The budget includes pay for performance increases and the proposed increase in the ranges. Employee Benefits The employee benefit costs include FICA, health insurance, retirement costs, any paid incentives and allowances, and the performance bonus. The health insurance and retirement costs are based on an allocation of the total Town costs by FTE per program. Contractual This decrease reflects a minor reduction in the cost of street light pole painting required in FY18. Commodities This increase reflects the inclusion of training in this category (which had previously been in contractual)
FY2015Actual
FY2016Actual
FY2017Budget
FY2017Adjusted*
FY2017Projected
FY2018Budget
%Change
Salaries and Wages 98,282 111,310 70,566 70,566 151,812 76,500 8.41%Employee Benefits 35,904 38,283 35,577 34,692 39,171 36,445 2.44%Contractual 207,363 223,366 271,040 333,695 219,225 266,290 -1.75%Commodities 41,179 37,884 64,384 66,136 49,490 65,741 2.11%Capital Outlay - - - - - - 0.00%Depreciation 24,808 31,707 31,707 31,707 31,707 31,707 0.00%Other - - - - - - 0.00%TOTALS 407,536 442,550 473,274 536,796 491,405 476,683 0.72%
Expenditure Summary
*FY17 Adjusted includes FY17 adopted budget plus purchase orders w ritten against the FY16 budget but spent against the FY17 budget.
231

Public Works Department FY2018
Street Lighting Program Fiscal Year 2017 Accomplishments Painted 309 street lights
Street Lighting Productivity Measures
Effectiveness/Output Measures: Actual FY16
Actual FY17
Projected FY18
Bi-Monthly Street Light Surveying 6 7 6
Full Time Equivalent Employees FY2014 FY2015 FY2016 FY2017 FY2018Electrician Supervisor 0.360 0.360 0.360 0.200 0.200 Industrial Electrician - - 0.600 0.600 0.400 SR Industrial Electrician 0.600 0.600 - - 0.200 Facilities Maintenance Division Manager 0.100 0.100 0.100 0.150 0.150
1.060 1.060 1.060 0.950 0.950
232

Public Works Department FY2018
PROGRAM: STORM SEWER MAINTENANCE 531 Mission: This bureau exists to protect the health, safety and property of residents and businesses by effectively operating and maintaining the storm system. Main Activities: The most important things we do to fulfill the mission are:
• Perform highest level of preventive maintenance to provide 100% equipment readiness at all times
• Clean, inspect and repair storm water collection and pumping systems to keep them fully functional
• Respond quickly to rainfall and storm events • Evaluate and improve systems to meet or exceed design standards • Anticipate rainfall events in order to allocate proper resources • Track rainfall and storm duration for analysis and future planning
Salaries and Wages The salary budget is derived from the payroll data for the Full Time Equivalent Employees (FTE) listed in the table below. The budget includes pay for performance increases and the proposed increase in the ranges. Employee Benefits The employee benefit costs include FICA, health insurance, retirement costs, any paid incentives and allowances, and the performance bonus. The health insurance and retirement costs are based on an allocation of the total Town costs by FTE per program. Contractual This decrease reflects a reduction in the anticipated electricity charges based on historical trends. Commodities This increase reflects the anticipated fuel use for standby generators, equipment and vehicles based on recent trends. Depreciation This increase reflects the revised depreciation required based on Equipment Replacement Fund acquisitions and the expected useful life and replacement cost of vehicles/equipment.
FY2015Actual
FY2016Actual
FY2017Budget
FY2017Adjusted*
FY2017Projected
FY2018Budget
%Change
Salaries and Wages 293,890 262,661 342,658 342,658 363,608 362,208 5.71%Employee Benefits 163,022 163,238 192,949 188,213 188,138 200,003 3.66%Contractual 201,014 216,297 267,700 270,100 190,188 245,800 -8.18%Commodities 54,561 36,531 62,500 62,500 43,123 65,720 5.15%Capital Outlay - - - - - - 0.00%Depreciation 16,317 20,136 20,136 20,136 20,136 22,565 12.06%Other - - - - - - 0.00%TOTALS 728,804 698,863 885,943 883,607 805,193 896,296 1.17%
Expenditure Summary
*FY17 Adjusted includes FY17 adopted budget plus purchase orders w ritten against the FY16 budget but spent against the FY17 budget.
233

Public Works Department FY2018
Storm Sewer Maintenance Fiscal Year 2017 Accomplishments D-12 Pump Can #3 – remove and recondition the butterfly valve, install new pump can
(old one was corroded and leaking), reinstall old butterfly valve, install all new gaskets, then placed back into operation. This job would normally be completed by an outside contractor but we decided to do it in house and save the Town money.
Completed the replacement of four 26,000 gallon-per-minute MWI (Moving Water Industries) electric submersible pumps with more dependable and economical Flygt pumps at our D-12 Storm Water pump station on Everglade Avenue
Continued progress on the installation of storm basin placards, which promote pollution prevention by warning the public that illegal discharges of contaminants in the storm sewer system can result in environmental impacts to the intra-coastal waterway
Continued to deploy the Public Works Department Digital Inventory Atlas, which identifies all of the Town’s assets on a geographical mapping program, which allows end users to immediately quantify the attributes of all town-owned assets. This program will ultimately be linked to the Town’s financial and time-keeping software for speedy valuations and work order management.
Experienced NO instances of flooding or standing water resulting in damages to public or private properties
Ocean Outfall Abandonment Project was initiated
Full Time Equivalent Employees FY2014 FY2015 FY2016 FY2017 FY2018Building Maintenance Worker 0.022 0.023 0.022 0.022 0.022 Electrician II 0.561 0.560 - - - Electrician Supervisor 0.143 0.143 0.143 0.188 0.188 Equipment Operator II - - - 0.037 0.074 Equipment Operator I/Streets 0.074 0.074 0.074 0.037 - General Maintenance Supervisor 0.010 0.010 0.010 0.005 0.005 Industrial Electrician - - 0.561 0.546 0.364 SR Industrial Electrician - - - - 0.182 Irrigation and Spray Technician 0.010 0.010 0.010 0.010 0.010 Operations Supervisor 0.500 0.443 0.480 - - Grounds Supervisor 0.010 0.010 0.010 0.010 0.010 Grounds Technician - - - - 0.056 Utilities Maintenance Supervisor - - - 0.245 0.245 Water Resource Technician I 3.455 2.612 2.650 2.895 2.895 Water Resource Technician II 1.055 0.587 0.705 0.735 0.735 WRD Manager 0.400 0.600 0.600 0.600 0.600
6.240 5.072 5.265 5.330 5.386
234

Public Works Department FY2018
Fiscal Year 2018 Goals and Performance Measures
Public Works Goal #6 - Protect the health, safety and property of residents and businesses to prevent or minimize flooding of the Town’s rights-of-way and adjacent private property
OBJECTIVES:
• Operate and maintain the storm water collection and pumping systems in a manner that reduces unexpected failures of the equipment, and respond to call-outs for reported flooding of streets and property
• Assist in rehabilitation or construction of ACIP projects related to storm water facilities
Storm Water Maintenance Productivity Measures
Effectiveness/Output Measures: Actual FY14
Actual FY15
Actual FY16
Actual FY17
Projected FY18
Pump Station Inspections 988 754 962 728 858
Storm Pump Repairs 10 26 3 29 17
Manhole Basin Inspections 1,550 1,324 1,563 1,905 1,586
Mainline Cleaning (Feet) - - 5,330 4,963 5,147
235

Public Works Department FY2018
PROGRAM: SANITARY SEWER MAINTENANCE 532 Mission: This bureau exists to protect the health and well-being of residents, businesses and visitors by operating a sanitary sewer system that prevents sewage back-up, spillage or odor impact and is 100% reliable. Main Activities: The most important things we do to fulfill the mission are:
• Schedule and conduct proper preventive maintenance and repairs on all systems. • Troubleshoot and repair all mechanical problems in a timely manner. • Televise gravity lines and repair as necessary. • Closely monitor run time for pumps. • Reduce inflow and infiltration into systems to reduce treatment costs. • Emergency repairs, and electrical maintenance of storm and sewer pump station
controls, telemetry systems, and back-up generator systems. • Upgrade stations to improve efficiency.
Salaries and Wages The salary budget is derived from the payroll data for the Full Time Equivalent Employees (FTE) listed in the table below. The budget includes pay for performance increases and the proposed increase in the ranges. Employee Benefits The employee benefit costs include FICA, health insurance, retirement costs, any paid incentives and allowances, and the performance bonus. The health insurance and retirement costs are based on an allocation of the total Town costs by FTE per program. Contractual This decrease reflects a minor reduction in travel and training costs. Commodities This decrease reflects a reduction in anticipated fuel use for equipment and vehicles based on recent trends for this program. Also reduced are minor operating equipment purchases and supplies (due to purchases made in FY17).
FY2015Actual
FY2016Actual
FY2017Budget
FY2017Adjusted*
FY2017Projected
FY2018Budget
%Change
Salaries and Wages 562,881 516,270 743,667 743,667 597,445 766,504 3.07%Employee Benefits 355,919 376,079 445,353 434,996 421,832 462,765 3.91%Contractual 149,552 135,480 150,995 150,995 136,338 149,995 -0.66%Commodities 86,950 63,614 130,881 141,514 101,089 99,226 -24.19%Capital Outlay - - - - - - 0.00%Depreciation 62,654 79,090 77,907 77,907 77,907 77,907 0.00%Other - - - - - - 0.00%TOTALS 1,217,956 1,170,533 1,548,803 1,549,079 1,334,611 1,556,397 0.49%
Expenditure Summary
*FY17 Adjusted includes FY17 adopted budget plus purchase orders w ritten against the FY16 budget but spent against the FY17 budget.
236
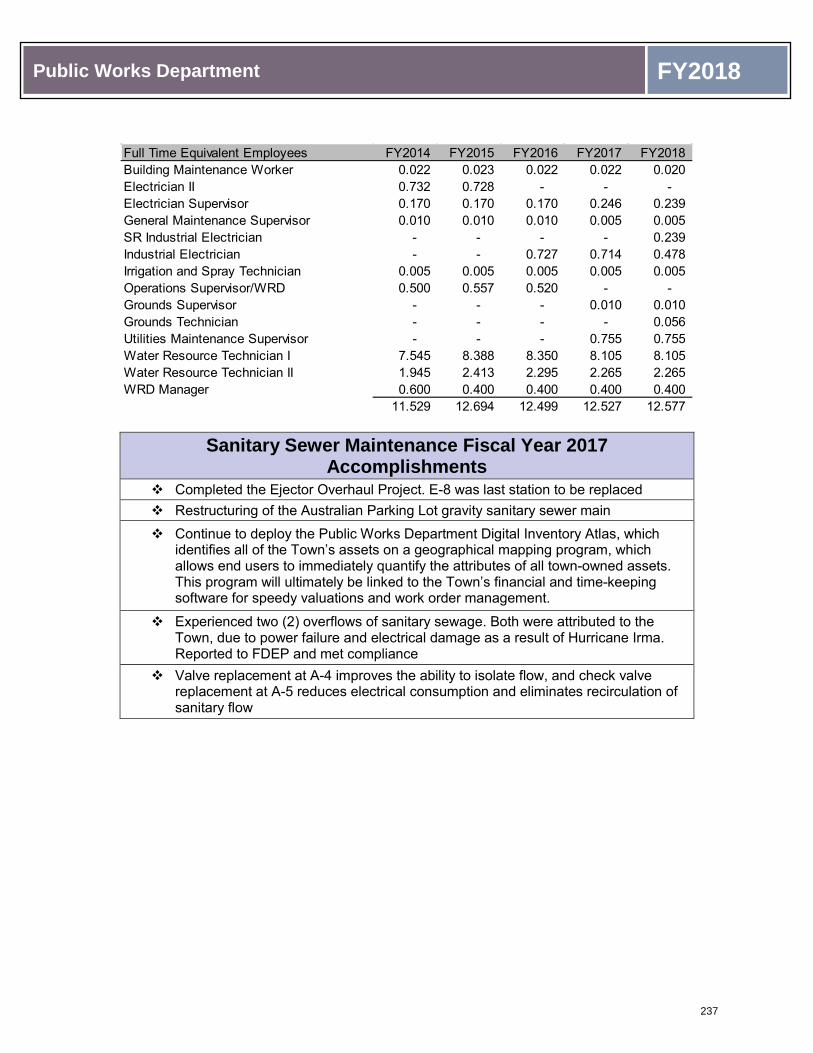
Public Works Department FY2018
Sanitary Sewer Maintenance Fiscal Year 2017 Accomplishments
Completed the Ejector Overhaul Project. E-8 was last station to be replaced Restructuring of the Australian Parking Lot gravity sanitary sewer main Continue to deploy the Public Works Department Digital Inventory Atlas, which
identifies all of the Town’s assets on a geographical mapping program, which allows end users to immediately quantify the attributes of all town-owned assets. This program will ultimately be linked to the Town’s financial and time-keeping software for speedy valuations and work order management.
Experienced two (2) overflows of sanitary sewage. Both were attributed to the Town, due to power failure and electrical damage as a result of Hurricane Irma. Reported to FDEP and met compliance
Valve replacement at A-4 improves the ability to isolate flow, and check valve replacement at A-5 reduces electrical consumption and eliminates recirculation of sanitary flow
Full Time Equivalent Employees FY2014 FY2015 FY2016 FY2017 FY2018Building Maintenance Worker 0.022 0.023 0.022 0.022 0.020 Electrician II 0.732 0.728 - - - Electrician Supervisor 0.170 0.170 0.170 0.246 0.239 General Maintenance Supervisor 0.010 0.010 0.010 0.005 0.005 SR Industrial Electrician - - - - 0.239 Industrial Electrician - - 0.727 0.714 0.478 Irrigation and Spray Technician 0.005 0.005 0.005 0.005 0.005 Operations Supervisor/WRD 0.500 0.557 0.520 - - Grounds Supervisor - - - 0.010 0.010 Grounds Technician - - - - 0.056 Utilities Maintenance Supervisor - - - 0.755 0.755 Water Resource Technician I 7.545 8.388 8.350 8.105 8.105 Water Resource Technician II 1.945 2.413 2.295 2.265 2.265 WRD Manager 0.600 0.400 0.400 0.400 0.400
11.529 12.694 12.499 12.527 12.577
237

Public Works Department FY2018
Fiscal Year 2018 Goals and Performance Measures Public Works Goal #7 - Protect the health and welfare of residents, businesses, general public and the environment to collect, transport and dispose of the Town’s sewage in an efficient and cost effective manner
OBJECTIVE:
• Operate and maintain the sanitary sewer collection and pumping systems in a manner that reduces unexpected failures of the equipment, and respond to call-outs for reported problems associated with clogs, backups, spills or equipment. Assist in rehabilitation or construction of ACIP projects related to sanitary sewer facilities and infrastructure.
Sanitary Sewer Maintenance Productivity Measures
Effectiveness/Output Measures: Actual FY14
Actual FY15
Actual FY16
Actual FY17
Projected FY18
Residential Service Calls 34 70 42 58 37
Mainline Cleaning (Feet) 212,120 126,533 132,051 169,830 160,134
Utility Locates 2,518 1,904 2,740 4,027 2,797
Televised Inspections (Feet) 4,596 2,890 2,185 350 2,505
Pump Station Inspections 2,627 2,443 2,496 2,496 2,516
Manhole Inspections/Repairs 280 307 314 339 310
238

Public Works Department FY2018
PROGRAM: SANITARY SEWAGE TREATMENT 533 This program reflects the costs of treating the Town’s sanitary sewage at the East Central Regional Water Reclamation Facility or to the East Central Regional Water Reclamation Facility (ECR).
Contractual This reflects the proposed sewage disposal costs at the ECR, along with chemical pre-treatment of effluent.
FY2015Actual
FY2016Actual
FY2017Budget
FY2017Adjusted*
FY2017Projected
FY2018Budget
%Change
Salaries and Wages - - - - - - 0.00%Employee Benefits - - - - - - 0.00%Contractual 1,773,868 1,744,249 1,870,620 2,003,240 1,544,339 1,847,032 -1.26%Commodities - - - - - - 0.00%Capital Outlay - - - - - - 0.00%Depreciation - - - - - - 0.00%Other - - - - - - 0.00%TOTALS 1,773,868 1,744,249 1,870,620 2,003,240 1,544,339 1,847,032 -1.26%
Expenditure Summary
*FY17 Adjusted includes FY17 adopted budget plus purchase orders w ritten against the FY16 budget but spent against the FY17 budget.
239

Public Works Department FY2018
PROGRAM: RESIDENTIAL COLLECTION 541 Mission: This bureau exists to promote the health of the community through the efficient and effective removal of residential garbage on a regular schedule prescribed by ordinance. Main Activities: The most important things we do to fulfill the mission are:
• Collect garbage four days per week and recyclable materials once per week. Minimize the impact of garbage odors, pest attraction and unpleasant appearance.
• Collect with the least disruption possible.
Salaries and Wages The salary budget is derived from the payroll data for the Full Time Equivalent Employees (FTE) listed in the table below. The budget includes pay for performance increases and the proposed increase in the ranges. Employee Benefits The employee benefit costs include FICA, health insurance, retirement costs, any paid incentives and allowances, and the performance bonus. The health insurance and retirement costs are based on an allocation of the total Town costs by FTE per program. Contractual No change Commodities This decreases reflects a very minor reduction in fuel costs based on recent trends. Depreciation This increase reflects the revised depreciation required based on Equipment Replacement Fund acquisitions and the expected useful life and replacement cost of vehicles/equipment.
FY2015Actual
FY2016Actual
FY2017Budget
FY2017Adjusted*
FY2017Projected
FY2018Budget
%Change
Salaries and Wages 489,436 456,934 467,635 467,635 484,864 489,824 4.74%Employee Benefits 347,296 266,136 285,874 280,572 287,551 302,112 5.68%Contractual 145 385 4,150 4,150 145 4,150 0.00%Commodities 41,212 32,420 46,335 48,579 40,363 45,633 -1.52%Capital Outlay - - - - - - 0.00%Depreciation 82,147 88,390 76,671 76,671 76,671 84,389 10.07%Other - - - - - - 0.00%TOTALS 960,236 844,265 880,665 877,607 889,594 926,108 5.16%
Expenditure Summary
*FY17 Adjusted includes FY17 adopted budget plus purchase orders w ritten against the FY16 budget but spent against the FY17 budget.
240
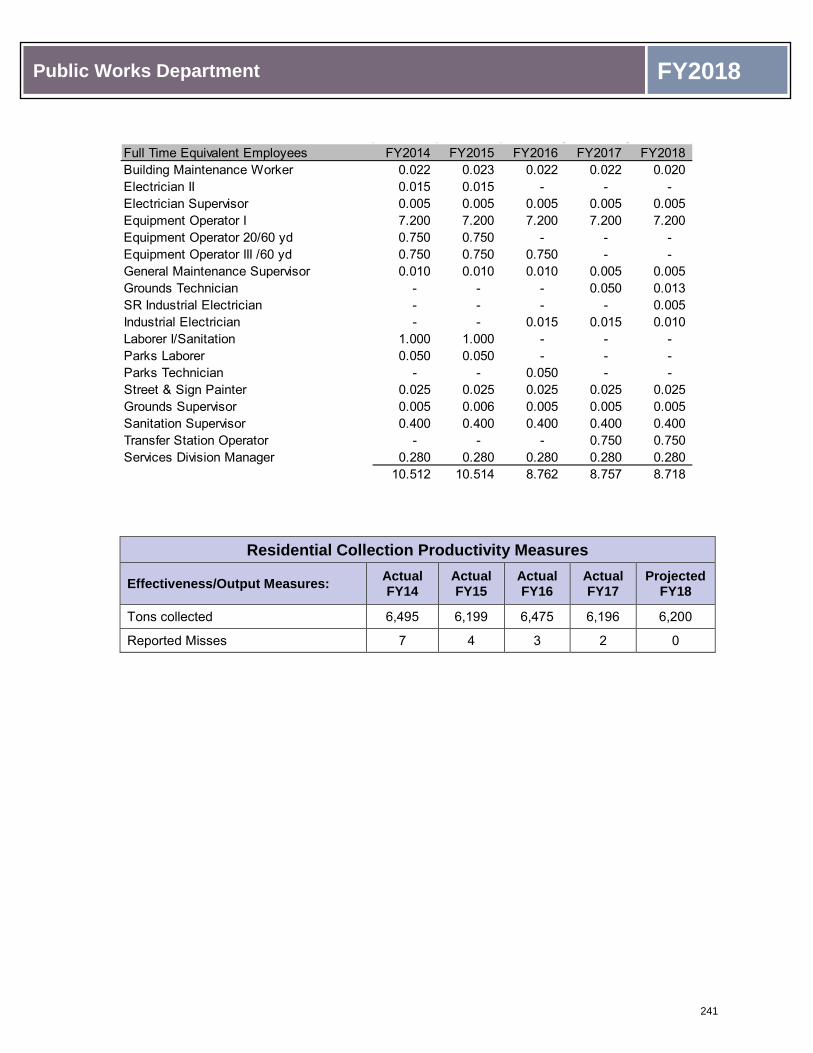
Public Works Department FY2018
Residential Collection Productivity Measures
Effectiveness/Output Measures: Actual FY14
Actual FY15
Actual FY16
Actual FY17
Projected FY18
Tons collected 6,495 6,199 6,475 6,196 6,200
Reported Misses 7 4 3 2 0
Full Time Equivalent Employees FY2014 FY2015 FY2016 FY2017 FY2018Building Maintenance Worker 0.022 0.023 0.022 0.022 0.020 Electrician II 0.015 0.015 - - - Electrician Supervisor 0.005 0.005 0.005 0.005 0.005 Equipment Operator I 7.200 7.200 7.200 7.200 7.200 Equipment Operator 20/60 yd 0.750 0.750 - - - Equipment Operator III /60 yd 0.750 0.750 0.750 - - General Maintenance Supervisor 0.010 0.010 0.010 0.005 0.005 Grounds Technician - - - 0.050 0.013 SR Industrial Electrician - - - - 0.005 Industrial Electrician - - 0.015 0.015 0.010 Laborer I/Sanitation 1.000 1.000 - - - Parks Laborer 0.050 0.050 - - - Parks Technician - - 0.050 - - Street & Sign Painter 0.025 0.025 0.025 0.025 0.025 Grounds Supervisor 0.005 0.006 0.005 0.005 0.005 Sanitation Supervisor 0.400 0.400 0.400 0.400 0.400 Transfer Station Operator - - - 0.750 0.750 Services Division Manager 0.280 0.280 0.280 0.280 0.280
10.512 10.514 8.762 8.757 8.718
241

Public Works Department FY2018
PROGRAM: COMMERCIAL COLLECTION 542 Mission: This bureau exists to serve the commercial and business garbage collection and disposal needs of the community. Main Activities: The most important things we do to fulfill the mission are:
• Steady, consistently excellent scheduled service without missing pickups • Maintain positive customer relationships with commercial customers
Salaries and Wages The salary budget is derived from the payroll data for the Full Time Equivalent Employees (FTE) listed in the table below. The budget includes pay for performance increases and the proposed increase in the ranges. Employee Benefits The employee benefit costs include FICA, health insurance, retirement costs, any paid incentives and allowances, and the performance bonus. The health insurance and retirement costs are based on an allocation of the total Town costs by FTE per program. Contractual This increase reflects the consumer price index adjustment allowed in the compacted garbage contract. Commodities: This increase reflects an adjustment for fuel use based on recent trends, and for the inclusion of training in this category (which had previously been in contractual). Depreciation This increase reflects the revised depreciation required based on Equipment Replacement Fund acquisitions and the expected useful life and replacement cost of vehicles/equipment.
FY2015Actual
FY2016Actual
FY2017Budget
FY2017Adjusted*
FY2017Projected
FY2018Budget
%Change
Salaries and Wages 402,882 443,194 467,808 467,808 423,384 464,065 -0.80%Employee Benefits 208,793 218,094 225,982 221,787 224,516 235,770 4.33%Contractual 255,415 248,878 299,737 314,202 255,699 305,099 1.79%Commodities 27,831 22,817 41,919 41,919 27,489 49,358 17.75%Capital Outlay - - - - - - 0.00%Depreciation 60,361 83,136 112,128 112,128 112,128 97,443 -13.10%Other - - - - - - 0.00%TOTALS 955,282 1,016,119 1,147,574 1,157,844 1,043,216 1,151,735 0.36%
Expenditure Summary
*FY17 Adjusted includes FY17 adopted budget plus purchase orders w ritten against the FY16 budget but spent against the FY17 budget.
242

Public Works Department FY2018
Commercial Collection Productivity Measures
Effectiveness/Output Measures: Actual FY14
Actual FY15
Actual FY16
Actual FY17
Projected FY18
Tons Collected 2,164 2,293 2,395 2,292 2,300
Reported Misses 4 1 2 0 0
Full Time Equivalent Employees FY2014 FY2015 FY2016 FY2017 FY2018Equipment Operator 20/60 yd 0.250 0.250 - - - Equipment Operator II 1.800 1.800 2.000 2.000 2.000 Equipment Operator III 20/60 yd 0.250 0.250 0.250 0.250 - Laborer I 3.000 3.000 4.000 4.000 4.000 Transfer Station Operator - - - - 0.250 Sanitation Supervisor 0.400 0.400 0.400 0.400 0.400 Services Division Manager 0.150 0.150 0.150 0.150 0.150
5.850 5.850 6.800 6.800 6.800
243

Public Works Department FY2018
PROGRAM: REFUSE DISPOSAL 543 Mission: This program exists to serve the community’s health and welfare by transporting residential and commercial garbage to the county solid waste authority for appropriate processing disposal. Main Activities: The most important things we do to fulfill the mission are:
• Operate transfer station to efficiently and effectively transport all residential and commercial garbage to the Solid Waste Authority for disposal
• Function as part of the team that collects garbage and delivers it to the transfer station to assure proper coordination and efficiency
Contractual Solid waste disposal fees payable to the Solid Waste Authority
FY2015Actual
FY2016Actual
FY2017Budget
FY2017Adjusted*
FY2017Projected
FY2018Budget
%Change
Salaries and Wages - - - - - - 0.00%Employee Benefits - - - - - - 0.00%Contractual 46,356 75,694 51,000 51,000 47,695 52,000 1.96%Commodities - - - - - - 0.00%Capital Outlay - - - - - - 0.00%Depreciation - - - - - - 0.00%Other - - - - - - 0.00%TOTALS 46,356 75,694 51,000 51,000 47,695 52,000 1.96%
Expenditure Summary
*FY17 Adjusted includes FY17 adopted budget plus purchase orders w ritten against the FY16 budget but spent against the FY17 budget.
244

Public Works Department FY2018
PROGRAM: YARD TRASH COLLECTION 544 Mission: This bureau exists to collect yard trash from streets, rights of way and off road ‘stash’ areas in a safe, timely, efficient and effective manner to keep the Town attractive and drainage inlets clear. Main Activities: The most important things we do to fulfill the mission are:
• Provide weekly curbside collection, transport and disposal of yard waste from all properties in the Town
• Perform our job with commitment to leaving the pickup site clean and free of waste residue
• Keep storm drains clear for proper drainage • Partner with other Public Works divisions to serve community drainage needs
Salaries and Wages The salary budget is derived from the payroll data for the Full Time Equivalent Employees (FTE) listed in the table below. The budget includes pay for performance increases and the proposed increase in the ranges. Employee Benefits The employee benefit costs include FICA, health insurance, retirement costs, any paid incentives and allowances, and the performance bonus. The health insurance and retirement costs are based on an allocation of the total Town costs by FTE per program. Contractual This decrease reflects a reduction in travel and training costs which are now shown in commodities. Commodities This increase reflects the inclusion of training in this category (which had previously been in contractual) and a minor increase in fuel use based on recent trends. Depreciation This increase reflects the revised depreciation required based on Equipment Replacement Fund acquisitions and the expected useful life and replacement cost of vehicles/equipment.
FY2015Actual
FY2016Actual
FY2017Budget
FY2017Adjusted*
FY2017Projected
FY2018Budget
%Change
Salaries and Wages 805,013 811,130 854,244 854,244 932,209 891,994 4.42%Employee Benefits 516,056 547,918 601,822 590,616 602,683 630,412 4.75%Contractual 135,372 124,781 215,380 280,143 153,989 210,995 -2.04%Commodities 97,475 79,643 124,670 124,670 97,545 129,450 3.83%Capital Outlay - - - - - - 0.00%Depreciation 126,911 537,598 197,418 197,418 197,418 189,041 -4.24%Other - - - - - - 0.00%TOTALS 1,680,827 2,101,070 1,993,534 2,047,091 1,983,844 2,051,892 2.93%
Expenditure Summary
*FY17 Adjusted includes FY17 adopted budget plus purchase orders w ritten against the FY16 budget but spent against the FY17 budget.
245

Public Works Department FY2018
Yard Trash Collection Fiscal Year 2017 Accomplishments Collection and landfill operations processed 144,217 cubic yards of debris generated
from residential and commercial establishments
Maintained permit compliance with all conditions per regulatory agencies
Collected and hauled 1319 loads for a total of 32,900 cubic yard of vegetative debris generated by Hurricane Irma
Fiscal Year 2018 Goals and Performance Measures
Public Works Goal #8 - Provide timely yard waste collection and disposal services, by providing the desired level of service in an efficient and cost effective manner
OBJECTIVES:
• Continue to investigate and study alternative means of reducing the volume of vegetative debris at these sites, to prolong the useful life of the landfills
• Continue consultant task to identify a suitable pilot program for waste reduction, material processing and potential uses for final disposition
• Develop long-term master plan for landfill use, closure and/or long-term care • Maintain care and closure plans for the sale/lease of the Okeechobee Blvd site
Yard Trash Collection Productivity Measures
Effectiveness/Output Measures: Actual FY14
Actual FY15
Actual FY16
Actual FY17
Projected FY18
CY collected and disposed of yard waste 159,920 161,040 159,210 144,217 155,000
Full Time Equivalent Employees FY2014 FY2015 FY2016 FY2017 FY2018Building Maintenance Worker 0.022 0.023 0.022 0.022 0.020 Crane Operator 3.000 3.000 3.000 3.000 3.000 Electrician Supervisor 0.005 0.005 0.005 0.005 0.005 Electrician II 0.015 0.015 - - - Equipment Operator I/Streets 0.116 0.116 0.116 0.058 - Equipment Operator I 9.000 9.000 9.000 9.000 9.000 Equipment Operator II - - - 0.058 0.116 General Maintenance Supervisor 0.010 0.010 0.010 0.005 0.005 SR Industrial Electrician - - - - 0.005 Industrial Electrician - - 0.015 0.015 0.010 Irrigation and Spray Technician 0.010 0.010 0.010 0.010 0.010 Laborer I 4.000 4.000 4.000 4.000 4.000 Landfill Operator 1.000 1.000 1.000 1.000 1.000 Services Division Manager 0.300 0.300 0.300 0.300 0.300 Street & Sign Painter 0.010 0.010 0.010 0.010 0.010 Grounds Supervisor 0.010 0.010 0.010 0.010 0.010 Trash Supervisor 0.900 0.900 0.900 0.900 0.900
18.398 18.399 18.398 18.393 18.391
246

Public Works Department FY2018
PROGRAM: RECYCLING 545 Mission: This bureau exists to provide recycling services for paper, plastic, and other recyclable materials accepted by the Solid Waste Authority for processing. These services are provided to the residents, businesses and visitors in an efficient, safe and courteous manner. Main Activities: The most important things we do to fulfill the mission are:
• Collect and dispose of recyclables on schedule • Demonstrate excellent customer service in all we do • Publicize and encourage participation in recycling programs
Salaries and Wages The salary budget is derived from the payroll data for the Full Time Equivalent Employees (FTE) listed in the table below. The budget includes pay for performance increases and the proposed increase in the ranges. Employee Benefits The employee benefit costs include FICA, health insurance, retirement costs, any paid incentives and allowances, and the performance bonus. The health insurance and retirement costs are based on an allocation of the total Town costs by FTE per program. Contractual This increase reflects the use of temporary seasonal labor to assist in collection of recycling materials. Commodities This increase reflects a minor increase in fuel use based on recent trends. Depreciation This increase reflects the revised depreciation required based on Equipment Replacement Fund acquisitions and the expected useful life and replacement cost of vehicles/equipment.
FY2015Actual
FY2016Actual
FY2017Budget
FY2017Adjusted*
FY2017Projected
FY2018Budget
%Change
Salaries and Wages 128,421 136,693 181,168 181,168 171,413 181,409 0.13%Employee Benefits 80,104 96,825 108,287 106,166 105,791 112,570 3.96%Contractual - - 5,000 5,000 - 16,600 232.00%Commodities 12,486 9,874 15,215 15,215 9,860 17,150 12.72%Capital Outlay - - - - - - 0.00%Depreciation 52,409 52,409 52,409 52,409 52,409 42,938 -18.07%Other - - - - - - 0.00%TOTALS 273,420 295,801 362,079 359,958 339,473 370,667 2.37%
Expenditure Summary
*FY17 Adjusted includes FY17 adopted budget plus purchase orders w ritten against the FY16 budget but spent against the FY17 budget.
247

Public Works Department FY2018
Recycling Fiscal Year 2017 Accomplishments Reduced contaminated recycling tons to SWA by 3.3 tons
Completed office recycling program in Public Works resulting in a reduction in the Governmental Assessment tons and associated fees
Fiscal Year 2018 Goals and Performance Measures
Public Works Goal #9 - Increase the total volume collected by providing education and guidance to commercial businesses and establishments OBJECTIVES:
• Use multiple methods of communication to obtain customer feedback to determine the type and quantity of materials being recycled by commercial customers and implement appropriate procedures
• Continue to educate residents and businesses on the benefits of recycling, and strive to increase the amount of material being recycled
• Expand a Town of Palm Beach office recycling program specific to departmental operations
Recycling Productivity Measures
Effectiveness/Output Measures: Actual FY14
Actual FY15
Actual FY16
Actual FY17
Projected FY18
Tons Collected 1,639 1,656 1,623 1,471 1,600
Full Time Equivalent Employees FY2014 FY2015 FY2016 FY2017 FY2018Equipment Operator 20 yd/60 yd - - 1.000 - - Equipment Operator I 1.800 1.800 1.800 1.800 1.800 Equipment Operator II 0.200 0.200 - 1.000 - Equipment Operator III - - - - 1.000 Sanitation Supervisor 0.200 0.200 0.200 0.200 0.200 Services Division Manager 0.170 0.170 0.170 0.170 0.170
2.370 2.370 3.170 3.170 3.170
248

Public Works Department FY2018
PROGRAM: BEACH CLEANING 546 Mission: This bureau exists to positively contribute to the quality of life in Palm Beach by keeping the public beaches clean, safe and attractive by removing litter and debris. Main Activities: The most important things we do to fulfill the mission are:
• Remove trash and litter from designated public beach areas as scheduled • Determine ways to be most efficient and effective in our work • Report and assist as applicable with the removal of any beach hazards
Salaries and Wages The salary budget is derived from the payroll data for the Full Time Equivalent Employees (FTE) listed in the table below. The budget includes pay for performance increases and the proposed increase in the ranges. Employee Benefits The employee benefit costs include FICA, health insurance, retirement costs, any paid incentives and allowances, and the performance bonus. The health insurance and retirement costs are based on an allocation of the total Town costs by FTE per program. Commodities This increase reflects a minor increase in fuel use based on recent trends. Depreciation This increase reflects the revised depreciation required based on Equipment Replacement Fund acquisitions and the expected useful life and replacement cost of vehicles/equipment.
FY2015Actual
FY2016Actual
FY2017Budget
FY2017Adjusted*
FY2017Projected
FY2018Budget
%Change
Salaries and Wages 49,313 51,154 60,243 60,243 53,114 54,879 -8.90%Employee Benefits 26,074 23,684 24,180 24,090 23,780 40,579 67.82%Contractual - - 3,500 3,500 - 3,500 0.00%Commodities 4,029 2,463 3,990 3,990 2,089 4,500 12.78%Capital Outlay - - - - - - 0.00%Depreciation 13,548 13,548 13,548 13,548 13,548 11,376 -16.03%Other - - - - - - 0.00%TOTALS 92,964 90,849 105,461 105,371 92,531 114,834 8.89%
Expenditure Summary
*FY17 Adjusted includes FY17 adopted budget plus purchase orders w ritten against the FY16 budget but spent against the FY17 budget.
249

Public Works Department FY2018
Beach Cleaning Productivity Measures
Effectiveness/Output Measures: Actual FY14
Actual FY15
Actual FY16
Actual FY17
Projected FY18
Beach Wrack Line Cleaned Weekly 52 52 52 52 52
Tons of Non-Bio Waste Collected 13.86 4.26 5.4 10.83 9.5
Full Time Equivalent Employees FY2014 FY2015 FY2016 FY2017 FY2018Equip Opr I / Beach Cleaner 1.000 1.000 1.000 1.000 - Equip Opr II / Beach Cleaner - - - - 1.000 Trash Supervisor 0.100 0.100 0.100 0.100 0.100
1.100 1.100 1.100 1.100 1.100
250
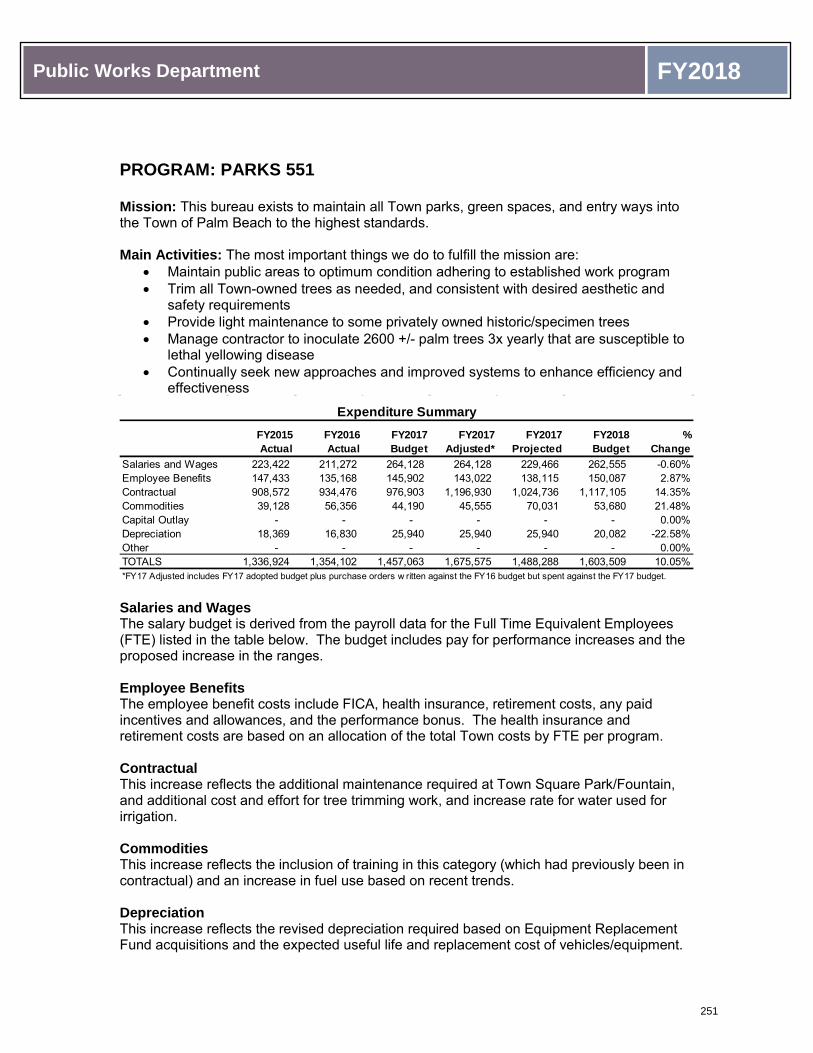
Public Works Department FY2018
PROGRAM: PARKS 551 Mission: This bureau exists to maintain all Town parks, green spaces, and entry ways into the Town of Palm Beach to the highest standards. Main Activities: The most important things we do to fulfill the mission are:
• Maintain public areas to optimum condition adhering to established work program • Trim all Town-owned trees as needed, and consistent with desired aesthetic and
safety requirements • Provide light maintenance to some privately owned historic/specimen trees • Manage contractor to inoculate 2600 +/- palm trees 3x yearly that are susceptible to
lethal yellowing disease • Continually seek new approaches and improved systems to enhance efficiency and
effectiveness
Salaries and Wages The salary budget is derived from the payroll data for the Full Time Equivalent Employees (FTE) listed in the table below. The budget includes pay for performance increases and the proposed increase in the ranges. Employee Benefits The employee benefit costs include FICA, health insurance, retirement costs, any paid incentives and allowances, and the performance bonus. The health insurance and retirement costs are based on an allocation of the total Town costs by FTE per program. Contractual This increase reflects the additional maintenance required at Town Square Park/Fountain, and additional cost and effort for tree trimming work, and increase rate for water used for irrigation. Commodities This increase reflects the inclusion of training in this category (which had previously been in contractual) and an increase in fuel use based on recent trends. Depreciation This increase reflects the revised depreciation required based on Equipment Replacement Fund acquisitions and the expected useful life and replacement cost of vehicles/equipment.
FY2015Actual
FY2016Actual
FY2017Budget
FY2017Adjusted*
FY2017Projected
FY2018Budget
%Change
Salaries and Wages 223,422 211,272 264,128 264,128 229,466 262,555 -0.60%Employee Benefits 147,433 135,168 145,902 143,022 138,115 150,087 2.87%Contractual 908,572 934,476 976,903 1,196,930 1,024,736 1,117,105 14.35%Commodities 39,128 56,356 44,190 45,555 70,031 53,680 21.48%Capital Outlay - - - - - - 0.00%Depreciation 18,369 16,830 25,940 25,940 25,940 20,082 -22.58%Other - - - - - - 0.00%TOTALS 1,336,924 1,354,102 1,457,063 1,675,575 1,488,288 1,603,509 10.05%
Expenditure Summary
*FY17 Adjusted includes FY17 adopted budget plus purchase orders w ritten against the FY16 budget but spent against the FY17 budget.
251

Public Works Department FY2018
Landscape Maintenance Fiscal Year 2017 Accomplishments Converted irrigation systems at Lakeside Park and Town Square to low flow type
Added decorative plantings on North County Road & Mid-Town Beach
Added Pannill pipes to Lakeside Park ficus trees for support Fiscal Year 2018 Goals and Performance Measures
Public Works Goal #10 - Maintain the landscaping and grounds of the Town in an efficient and cost effective manner, while striving to improve its appearance
OBJECTIVE:
• Continue to improve irrigation systems Town-wide, and to standardize equipment and materials. Implement low flow irrigation heads and smart irrigation upgrades or replacements in larger parks and medians as appropriate.
Landscape Maintenance Productivity Measures
Effectiveness/Output Measures: Actual FY14
Actual FY15
Actual FY16
Actual FY17
Projected FY18
Inspect Irrigation Systems (hours) 68 303 700 539 600
Inspect Historic Trees 101 100 100 100 100
Full Time Equivalent Employees FY2014 FY2015 FY2016 FY2017 FY2018Building Maintenance Worker 0.068 0.068 0.070 0.050 0.050 Electrician II 0.051 0.054 - - - Electrician Supervisor 0.011 0.011 0.011 0.011 0.011 Equipment Operator I/Streets 0.500 0.500 0.500 0.200 - Equipment Operator II - - - 0.300 0.500 Facilities Maintenance Division Manager 0.330 0.330 0.330 0.330 0.330 General Maintenance Supervisor 0.035 0.035 0.035 0.064 0.064 Grounds Technician - - - 0.925 0.850 SR Industrial Electrician - - - - 0.018 Industrial Electrician - - 0.054 0.054 0.036 Irrigation and Spray Technician 0.941 0.941 0.941 0.941 0.941 Parks Laborer 1.850 1.850 - 1.000 1.000 Parks Technician - - 1.925 - - Street & Sign Painter 0.013 0.013 0.013 0.013 0.013 Grounds Supervisor 0.809 0.808 0.809 0.844 0.844
4.608 4.610 4.688 4.732 4.657
252
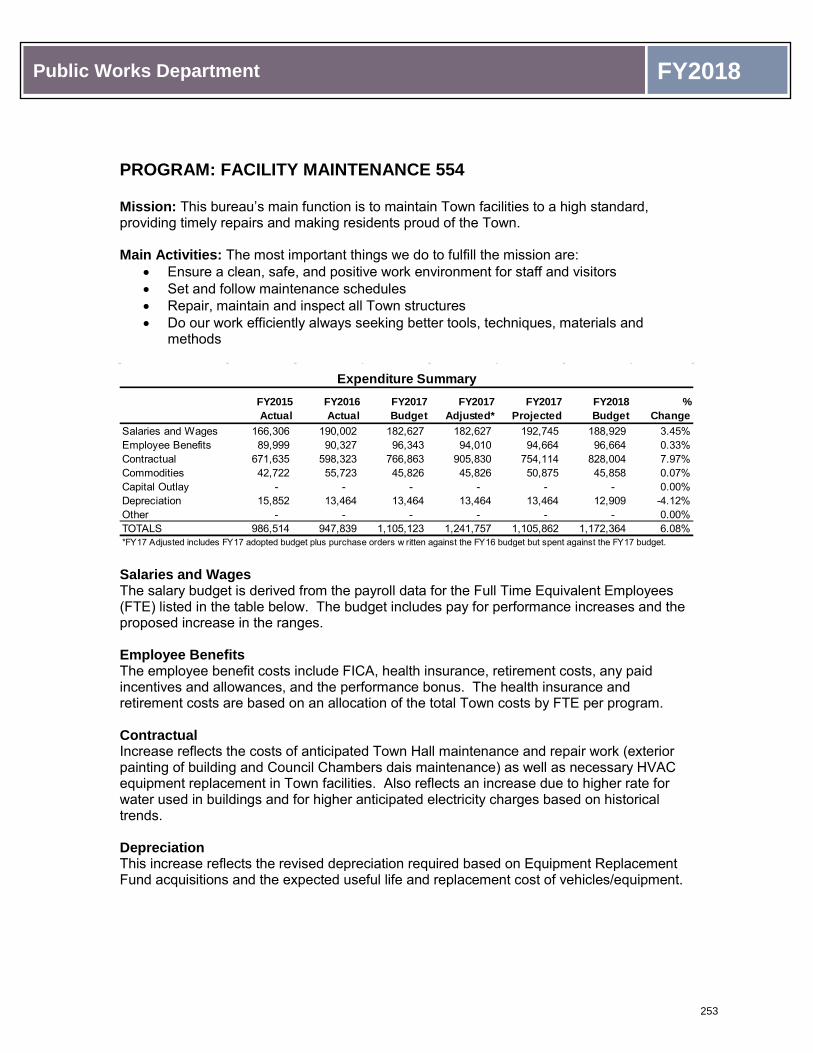
Public Works Department FY2018
PROGRAM: FACILITY MAINTENANCE 554 Mission: This bureau’s main function is to maintain Town facilities to a high standard, providing timely repairs and making residents proud of the Town. Main Activities: The most important things we do to fulfill the mission are:
• Ensure a clean, safe, and positive work environment for staff and visitors • Set and follow maintenance schedules • Repair, maintain and inspect all Town structures • Do our work efficiently always seeking better tools, techniques, materials and
methods
Salaries and Wages The salary budget is derived from the payroll data for the Full Time Equivalent Employees (FTE) listed in the table below. The budget includes pay for performance increases and the proposed increase in the ranges. Employee Benefits The employee benefit costs include FICA, health insurance, retirement costs, any paid incentives and allowances, and the performance bonus. The health insurance and retirement costs are based on an allocation of the total Town costs by FTE per program. Contractual Increase reflects the costs of anticipated Town Hall maintenance and repair work (exterior painting of building and Council Chambers dais maintenance) as well as necessary HVAC equipment replacement in Town facilities. Also reflects an increase due to higher rate for water used in buildings and for higher anticipated electricity charges based on historical trends. Depreciation This increase reflects the revised depreciation required based on Equipment Replacement Fund acquisitions and the expected useful life and replacement cost of vehicles/equipment.
FY2015Actual
FY2016Actual
FY2017Budget
FY2017Adjusted*
FY2017Projected
FY2018Budget
%Change
Salaries and Wages 166,306 190,002 182,627 182,627 192,745 188,929 3.45%Employee Benefits 89,999 90,327 96,343 94,010 94,664 96,664 0.33%Contractual 671,635 598,323 766,863 905,830 754,114 828,004 7.97%Commodities 42,722 55,723 45,826 45,826 50,875 45,858 0.07%Capital Outlay - - - - - - 0.00%Depreciation 15,852 13,464 13,464 13,464 13,464 12,909 -4.12%Other - - - - - - 0.00%TOTALS 986,514 947,839 1,105,123 1,241,757 1,105,862 1,172,364 6.08%
Expenditure Summary
*FY17 Adjusted includes FY17 adopted budget plus purchase orders w ritten against the FY16 budget but spent against the FY17 budget.
253

Public Works Department FY2018
Facility Maintenance Fiscal Year 2017 Accomplishments Conversion of existing lighting to LED in apparatus bays at all Fire Stations
New HVAC System installed at the Police Station
Multiple upgrades at South Fire Station conference room and restrooms Converted Vehicle Maintenance lighting and began conversion of office lighting at
Public Works to LED type Upgraded Town Clinic with new HVAC, flooring and HIPA Compliant Privacy
Measures Painted the Police Dept. facility, site wall, and lighting fixtures. Removed and
replaced all window glazing. Performed comprehensive flat roof maintenance & repair
Added new roll roofing material for extended roof life
Full Time Equivalent Employees FY2014 FY2015 FY2016 FY2017 FY2018Building Maintenance Worker 1.226 1.225 1.224 1.154 1.084 Electrician II 0.429 0.429 - - - Electrician Supervisor 0.080 0.080 0.080 0.141 0.148 Facility Maintenance Division Manager 0.250 0.250 0.250 0.250 0.250 General Maintenance Supervisor 0.645 0.643 0.643 0.637 0.600 SR Industrial Electrician - - - - 0.153 Industrial Electrician - - 0.431 0.459 0.306 Irrigation and Spray Technician 0.008 0.008 0.008 0.008 0.008 Parks Laborer 0.100 0.100 - - - Grounds Technician - - 0.025 0.025 0.025 Grounds Supervisor 0.010 0.010 0.010 0.020 0.020 Street & Sign Painter 0.418 0.418 0.168 0.168 0.168
3.166 3.163 2.839 2.862 2.762
254

Public Works Department FY2018
Fiscal Year 2018 Goals and Performance Measures Public Works Goal #11 - Maintain the buildings, structures, and facilities of the Town in an efficient, safe and cost effective manner for the general public and Town employees
OBJECTIVES:
• Continue with identification and replacement of obsolete and inefficient HVAC systems in all Town buildings
• Identify and replace worn flooring systems throughout all Town facilities • Continue the systematic replacement of existing lighting with energy efficient LED
lighting • Begin replacement of old lavatory faucet systems with water saving systems
Facility Maintenance Productivity Measures
Effectiveness/Output Measures: Actual FY15
Actual FY16
Actual FY17
Projected FY18
Scheduled Maintenance at all Town Buildings 387 302 340 350
Quarterly Inspections at all Town Buildings 52 26 22 52
255

Public Works Department FY2018
PROGRAM: METER MAINTENANCE AND COLLECTION 558 Mission: This bureau exists to provide revenue collection and maintenance of metered parking system in order to maximize revenue. Main Activities: The most important things we do to fulfill the mission are:
• Keep all meters reliable, accurate and in service through a regular maintenance program with the vendor
Salaries and Wages The salary budget is derived from the payroll data for the Full Time Equivalent Employees (FTE) listed in the table below. The budget includes pay for performance increases and the proposed increase in the ranges. Employee Benefits The employee benefit costs include FICA, health insurance, retirement costs, any paid incentives and allowances, and the performance bonus. The health insurance and retirement costs are based on an allocation of the total Town costs by FTE per program. Contractual At the time of budget submission, the Town still owned the old parking kiosks and this reflected continued service/maintenance on that old equipment. New kiosks were installed at the end of FY17 to expedite the planned replacement. This budgeted amount will cover the bank service charges anticipated due to credit card purchases at kiosks. Commodities This decrease reflects the fact that old kiosks were only to be maintained for a portion of FY18, but as noted above the new kiosks were installed at the end of FY17 to expedite the planned replacement. This budgeted amount will likely not be needed in FY18 due to lease/warranty/maintenance of new kiosks. Depreciation This decrease reflects that this was the last year of depreciation for old kiosks
FY2015Actual
FY2016Actual
FY2017Budget
FY2017Adjusted*
FY2017Projected
FY2018Budget
%Change
Salaries and Wages 29,415 14,363 26,722 26,722 16,165 19,360 -27.55%Employee Benefits 12,465 13,572 16,723 16,353 15,594 11,018 -34.11%Contractual 60,338 66,650 61,500 78,150 82,549 61,960 0.75%Commodities 20,501 15,610 36,587 36,587 31,647 29,313 -19.88%Capital Outlay - - - - - - 0.00%Depreciation 44,323 44,323 44,323 44,323 44,323 31,006 -30.05%Other - - - - - - 0.00%TOTALS 167,042 154,518 185,855 202,135 190,278 152,657 -17.86%
Expenditure Summary
*FY17 Adjusted includes FY17 adopted budget plus purchase orders w ritten against the FY16 budget but spent against the FY17 budget.
Full Time Equivalent Employees FY2014 FY2015 FY2016 FY2017 FY2018General Maintenance Supervisor 0.100 0.100 0.100 0.050 0.075 Building Maintenance Worker 0.400 0.400 0.400 0.490 0.261
0.500 0.500 0.500 0.540 0.336
256

Public Works Department FY2018
PROGRAM: GENERAL ENGINEERING SERVICES 561 Mission: This division exists to apply sound engineering and architectural principles to plan, budget, design, and build infrastructure that maximizes functionality and minimizes maintenance, repair and replacement costs. Main Activities: The most important things we do to fulfill the mission are:
• Prepare budget estimates for infrastructure projects. • Plan, design and oversee construction of public facilities. • Complete design, cost estimates, and construction of miscellaneous minor projects
not planned or budgeted elsewhere. • Coordinate with other entities to address engineering issues and address complaints. • Continually seek new and better ways to provide our services. • Conduct development review and contract administration.
Salaries and Wages The salary budget is derived from the payroll data for the Full Time Equivalent Employees (FTE) listed in the table below. The budget includes pay for performance increases and the proposed increase in the ranges. Employee Benefits The employee benefit costs include FICA, health insurance, retirement costs, any paid incentives and allowances, and the performance bonus. The health insurance and retirement costs are based on an allocation of the total Town costs by FTE per program. Contractual This decrease reflects a reduction for travel/training expenses that are now included in commodities. Commodities This increase reflects the inclusion of travel/training expenses that were formerly in contractual. Depreciation This increase reflects the revised depreciation required based on Equipment Replacement Fund acquisitions and the expected useful life and replacement cost of vehicles/equipment.
FY2015Actual
FY2016Actual
FY2017Budget
FY2017Adjusted*
FY2017Projected
FY2018Budget
%Change
Salaries and Wages 436,016 411,757 473,627 473,627 386,725 479,580 1.26%Employee Benefits 140,164 152,472 193,256 186,568 173,725 196,040 1.44%Contractual 80,364 80,500 19,600 23,335 91,344 16,600 -15.31%Commodities 8,385 8,369 9,000 9,000 10,576 12,000 33.33%Capital Outlay - - - - - - 0.00%Depreciation 12,750 13,274 14,099 14,099 14,099 10,438 -25.97%Other - - - - - - 0.00%TOTALS 677,679 666,372 709,582 706,629 676,469 714,658 0.72%
Expenditure Summary
*FY17 Adjusted includes FY17 adopted budget plus purchase orders w ritten against the FY16 budget but spent against the FY17 budget.
257

Public Works Department FY2018
Engineering Program Fiscal Year 2017 Accomplishments
Successful implementation of year 3 of ACIP Phase 2 Successful initiation of Town Wide Undergrounding Program including master plan
and design of first phase of construction
Full Time Equivalent Employees FY2014 FY2015 FY2016 FY2017 FY2018Senior Project Engineer 1.000 1.000 1.000 1.000 1.000 Engineer Tech Support Spec - - - 0.500 0.500 Project Engineer 2.000 2.000 2.000 2.000 2.000 Town Engineer 1.000 1.000 1.000 1.000 1.000
4.000 4.000 4.000 4.500 4.500
258

Public Works Department FY2018
Fiscal Year 2018 Goals and Performance Measures Public Works Goal #1 - Continue to monitor FDOT’s Southern Boulevard Bridge Project and implement coordinated actions with other governmental authorities (State, County, City of West Palm Beach) to mitigate impacts of any short-term or long-term lane closures on the bridge OBJECTIVES:
• Attend periodic meetings with FDOT/contractor project teams • Coordinate negative traffic impacts with other Town departments as well as
affected residents/businesses, assist in developing mitigation strategies Public Works Goal #3 - Implement Year 4 of Phase 2 of Accelerated Capital Improvement Program OBJECTIVES:
• Continue design and construction of Phase 2 Projects • Schedule construction based on Flagler Memorial Bridge re-opening
Performance Measures
Effectiveness/Output Measures: Actual FY16
Actual FY17
Projected FY18
Complete Phase I of ACIP ($) Million Completed $41,172,439 - -
Initiate Design Phase 2 (# of Projects) 15 9 11
Complete New Phase 2 Project (# of Projects) 20 5 7
Engineering Productivity Measures
Effectiveness/Output Measures: Actual FY15
Actual FY16
Actual FY17
Projected FY18
Projects on Budget (%) 100 100 100 100 Projects on Time (%) 100 100 100 100
Projects During Season 0 2 2 0
Injuries on Job-Site 2 0 0 0
Continuing Education (# /Person) 4 18 18 18
259

Public Works Department FY2018
PROGRAM: RIGHT OF WAY INSPECTIONS 565 Mission: This bureau exists to contribute to the well-being of the community by permitting, overseeing and inspecting work activities in the Town’s rights of way and easements to ensure quality work with minimal disruption. Main Activities: The most important things we do to fulfill the mission are:
• Adhere to all guidelines set by the Town • Issue permits in compliance with the Town’s ROW manual • Minimize inconvenience to the public • Make sure contractors restore to Town standards and regulate to that end • Provide permit and inspection service in a timely manner • Observe work activities to ensure compliance with permit conditions and ROW
manual regulations
Salaries and Wages The salary budget is derived from the payroll data for the Full Time Equivalent Employees (FTE) listed in the table below. The budget includes pay for performance increases and the proposed increase in the ranges. Employee Benefits The employee benefit costs include FICA, health insurance, retirement costs, any paid incentives and allowances, and the performance bonus. The health insurance and retirement costs are based on an allocation of the total Town costs by FTE per program. Contractual This decrease reflects a reduction for travel/training expenses that are now included in commodities. Commodities This increase reflects the inclusion of travel/training expenses that were formerly in contractual. Capital Outlay This increase reflects the acquisition of a new vehicle for the full-time ROW inspector position approved in the budget for FY18.
FY2015Actual
FY2016Actual
FY2017Budget
FY2017Adjusted*
FY2017Projected
FY2018Budget
%Change
Salaries and Wages 73,785 76,167 96,977 96,977 75,210 130,574 34.64%Employee Benefits 34,246 33,402 32,813 32,529 30,268 42,751 30.29%Contractual 461 395 900 900 7,099 700 -22.22%Commodities 482 333 1,650 1,650 360 1,850 12.12%Capital Outlay - - - - - 15,565 100.00%Depreciation 1,297 3,224 2,725 2,725 2,725 2,725 0.00%Other - - - - - - 0.00%TOTALS 110,271 113,521 135,065 134,781 115,662 194,165 43.76%
Expenditure Summary
*FY17 Adjusted includes FY17 adopted budget plus purchase orders w ritten against the FY16 budget but spent against the FY17 budget.
260

Public Works Department FY2018
Right of Way Inspections Fiscal Year 2017 Accomplishments
Successful revision of the 3 Strike Rule
Successful initiation of GIS tracking of all Right of Way Permits Fiscal Year 2018 Goals and Performance Measures Public Works Goal #4 - Right of way maintenance and enforcement ensure all Town rights of ways are managed to meet the Town’s standards applicable to public rights-of-way and easements within the Town of Palm Beach OBJECTIVES:
• Continue to improve on compliance with the right-of-way standards • Improve coordination of traffic impacts due to issuance of right-of-way permits.
Ensure only necessary number of parking permits are issued for each request. • Increase compliance of parking within the right-of-way • Increase compliance of right-of-way permitted use • Minimize north/south traffic disruptions caused by permitted work within the right-
of-way • Increase site inspections of right-of-way compliance
Performance Measures
Effectiveness/Output Measures: Actual FY16
Actual FY17
Projected FY18
% of Right of Way Permits issued captured in GIS Map N/A 85 100
Weekly Right of Way Inspections N/A 30 52
Monthly Review of Right of Way Permits and Road Impacts N/A 6 12
Full Time Equivalent Employees FY2014 FY2015 FY2016 FY2017 FY2018Right of Way Inspector I 0.500 0.500 0.500 0.500 1.000 Right of Way Inspector II 1.000 1.000 1.000 1.000 1.000
1.500 1.500 1.500 1.500 2.000
261

Public Works Department FY2018
PROGRAM: EQUIPMENT OPERATION & MAINTENANCE 571 Mission: This bureau exists to maintain the Town’s fleet of vehicles and equipment in top condition at the lowest operating cost. Main Activities: The most important things we do to fulfill the mission are:
• Schedule and perform preventive maintenance inspections for the Town’s vehicles and equipment
• Service and repair equipment to optimize operating time • Prepare specifications and plan for new vehicle purchases on a scheduled
replacement
Salaries and Wages The salary budget is derived from the payroll data for the Full Time Equivalent Employees (FTE) listed in the table below. The budget includes pay for performance increases and the proposed increase in the ranges. Employee Benefits The employee benefit costs include FICA, health insurance, retirement costs, any paid incentives and allowances, and the performance bonus. The health insurance and retirement costs are based on an allocation of the total Town costs by FTE per program. Contractual This decrease reflects the reduction in vehicle maintenance services associated with extended warranty costs for new acquisitions. Commodities This increase reflects the costs anticipated for maintenance and repair parts and supplies, based on recent cost and repair history. Costs for new emissions components associated with diesel exhaust systems are more complex and expensive than in the past. Capital Outlay This reduction reflects the purchase of only one new piece of shop equipment (AC refrigerant reclamation system). Depreciation This increase reflects the revised depreciation required based on Equipment Replacement Fund acquisitions and the expected useful life and replacement cost of vehicles/equipment.
FY2015Actual
FY2016Actual
FY2017Budget
FY2017Adjusted*
FY2017Projected
FY2018Budget
%Change
Salaries and Wages 246,454 253,051 305,902 305,902 253,459 287,113 -6.14%Employee Benefits 105,179 144,507 181,103 177,513 161,672 176,831 -2.36%Contractual 52,681 35,366 91,023 96,348 42,612 74,623 -18.02%Commodities 150,462 163,961 152,252 156,239 199,303 171,762 12.81%Capital Outlay - 25,393 11,300 11,300 - 8,100 -28.32%Depreciation 9,728 6,343 9,046 9,046 9,046 13,480 49.02%Other - - - - - - 0.00%TOTALS 564,504 628,621 750,626 756,348 666,092 731,909 -2.49%
Expenditure Summary
*FY17 Adjusted includes FY17 adopted budget plus purchase orders w ritten against the FY16 budget but spent against the FY17 budget.
262

Public Works Department FY2018
Equipment Operation and Maintenance Fiscal Year 2017 Accomplishments
Acquired $936,000 in new vehicles and equipment to replace older models
Designed and bid two new transfer compaction trailers for sanitation
Provided online Mitchell repair software and training for mechanics
Fiscal Year 2018 Goals and Performance Measures
Public Works Goal #12 - Maintain the vehicles and equipment of the Town’s non-public-safety fleet in an efficient, safe and cost effective manner
OBJECTIVES: • Maintain high level of equipment availability and reduce down-time by performing
necessary and proactive preventive maintenance, and repairs as required• Acquire new vehicles and equipment through planning and budgeting from the
Equipment Replacement Fund, to provide newer and more efficient fleet thatmeets the requirements of the users
• Initiate and evaluate vehicle and equipment right sizing study• Evaluate PM intervals and adjust accordingly• Create equipment specific predictive maintenance tasks
Equipment Operation and Maintenance Productivity Measures
Effectiveness/Output Measures: Actual FY14
Actual FY15
Actual FY16
Actual FY17
Projected FY18
Repairs 1,048 1,034 1,040 1,188 1,000 Preventive Maintenance Scheduled 1,302 1,355 1,353 1,043 1,100
Full Time Equivalent Employees FY2014 FY2015 FY2016 FY2017 FY2018Mechanic I 0.500 0.500 1.000 1.000 - Mechanic III 2.000 2.000 2.000 2.000 - Mechanic IV 1.000 1.000 1.000 1.000 - Fleet Mechanic - - - - 3.000 Fleet Mechanic Supervisor - - - - 1.000 Office Assistant II 1.000 1.000 1.000 1.000 1.000 Services Division Manager 0.100 0.100 0.100 0.100 0.100
4.600 4.600 5.100 5.100 5.100
263

(This page intentionally left blank)
264

Other
265

Other Programs FY2018
PROGRAM: LIBRARY SERVICES 321 The Town contracts with The Society of the Four Arts Library to provide library services to its residents. The library maintains exceptional collection of books, audio, and video tapes and periodicals on the arts. It also sponsors special events and activities for its patrons. This annual appropriation takes the place of, and is substantially less than, property taxes that would be levied upon the residents by the Palm Beach County Library District.
FY2015Actual
FY2016Actual
FY2017Budget
FY2017Adjusted*
FY2017Projected
FY2018Budget
%Change
Salaries and Wages - - - - - - 0.00%Employee Benefits - - - - - - 0.00%Contractual - - - - - - 0.00%Commodities - - - - - - 0.00%Capital Outlay - - - - - - 0.00%Depreciation - - - - - - 0.00%Other 306,580 315,777 325,250 350,250 350,250 335,008 3.00%TOTALS 306,580 315,777 325,250 350,250 350,250 335,008 3.00%
Expenditure Summary
*FY17 Adjusted includes FY17 adopted budget plus purchase orders w ritten against the FY16 budget but spent against the FY17 budget.
266

Other Programs FY2018
PROGRAMS: TRANSFERS 611 TO 625 The following are transfers made from the general fund into other funds within the Town.
FY2015Actual
FY2016Actual
FY2017Budget
FY2017Adjusted*
FY2017Projected
FY2018Budget
%Change
Capital Improvement Fund (307) 1,000,000 1,030,000 2,290,200 2,290,200 2,290,200 2,118,024 -7.52%Coastal Protection Fund (309) 11,377,000 8,015,220 7,265,000 7,265,000 7,265,000 7,410,300 2.00%Townwide Underground Utilities (122) - 2,530,250 - 267,041 267,041 - 0.00%Debt Service Fund (205) 6,100,000 6,265,462 6,088,728 6,088,728 6,088,728 5,982,331 -1.75%Extraordinary Transfer to Retirement (600) - - 2,500,000 2,800,000 2,500,000 4,759,016 90.36%Group Health Retirees (610) 1,577,000 1,180,000 1,339,000 1,339,000 1,339,000 960,000 -28.30%Retirement Fund for UAAL - - - - 300,000 - 0.00%Risk - W/C, Liab, Prop 1,925,362 1,934,595 1,838,037 1,838,037 1,838,037 1,828,475 -0.52%TOTALS 21,979,362 20,955,527 21,320,965 21,888,006 21,888,006 23,058,146 8.15%
Expenditure Summary
*FY17 Adjusted includes FY17 adopted budget plus purchase orders w ritten against the FY16 budget but spent against the FY17 budget.
267

Other Programs FY2018
PROGRAM: EMERGENCY MANAGEMENT 710 Mission: This division exists to ensure the Town is at an acceptable level of readiness for response to hazards affecting Palm Beach in accordance with the National Incident Management System (NIMS) guidelines. Main Activities: The most important things we do to fulfill the mission are:
• Conduct NIMS compliancy training to Town officials, employees, volunteers and contractors as needed
• Maximize coordination and cooperation for emergency response planning among the different departments through the Emergency Planning Team (EPT).
• Assist in the development and coordination of emergency plans for more effective response efforts as needed.
• Assist with any community outreach programs relating to public emergency preparations and awareness.
FY2015Actual
FY2016Actual
FY2017Budget
FY2017Adjusted*
FY2017Projected
FY2018Budget
%Change
Salaries and Wages - - - - - - 0.00%Employee Benefits - - - - - - 0.00%Contractual 834 11,006 45,700 56,018 14,996 60,404 32.18%Commodities 556 816 600 600 22 600 0.00%Capital Outlay - - - - 7,275 - 0.00%Depreciation - - - - - - 0.00%Other - - - - - - 0.00%TOTALS 1,390 11,822 46,300 56,618 22,293 61,004 31.76%
Expenditure Summary
*FY17 Adjusted includes FY17 adopted budget plus purchase orders w ritten against the FY16 budget but spent against the FY17 budget.
268

Other Programs FY2018
PROGRAM: CONTINGENT APPROPRIATIONS 711 This program contains the budget for the General Fund Contingency account. The budget for the General Fund Contingency Account is established at 1.5% of the proposed budget and is adjusted throughout the year by Town Council approved transfers. Appropriations are transferred out of this line item and into line items designated by Town Council. Expenditures are not reflected in this program, but in the program approved by Town Council, on a case by case basis. The Contingent Appropriations Program reflects expenditures which are not readily identifiable to a Program, and are not under the direction of any one Department.
FY2015Budget
FY2016Budget
FY2017Projected
FY2018Budget
%Change
Salaries and Wages - - - - 0.00%Employee Benefits - - - - 0.00%Contractual - - - - 0.00%Commodities - - - - 0.00%Capital Outlay - - - - 0.00%Depreciation - - - - 0.00%Other 909,000 944,686 960,300 655,877 -30.57%TOTALS 909,000 944,686 960,300 655,877 -30.57%Percent of Budget 1.5% 1.5% 1.5% 1.0%
Expenditure Summary
269

(This page intentionally left blank)
270

Town-wide Underground Utilities Fund FY2018
Town-Wide Underground Utilities Fund (122)
REVENUES Special Assessment Revenue Non Ad Valorem revenue collected for the Town-wide Undergrounding project via the Palm Beach County Tax Collector Commercial Paper Commercial Paper approved by Town Council on June 13, 2017 (Ord No 18-2017) Transfer from Equipment Replacement Fund Advance from Equipment Replacement Fund approved by Town Council on June 13, 2017 (Ord No 18-2017). This advance was necessary in order to award construction contracts prior to finalizing Commercial Paper financing. Donations Donation from the Palm Beach Civic Association for the Master Plan Peer Review. Transfer from the General Fund (001) Town’s prepayment of assessment for 37 parcels for “seed funds” to begin to finance the Town-wide Underground Utility Project, approved by Town Council on June 14, 2016 (Ord No 09-2016).
FY2015Actual
FY2016Actual
FY2017Budget
FY2017 Projected
FY2018Budget
%Change
RevenuesSpecial Assessment Revenue - - - - 5,080,000 100.00%Commercial Paper - - - - 20,000,000 100.00%Transfer from Equipment Replacement - - - 12,750,000 0.00%Donations - - - 49,250 - 0.00%Transfer from General Fund - 2,530,250 - 267,041 130,000 100.00%Transfer from CIP Fund (307) - - 760,200 760,200 1,000,000 31.54%Interest on Investments - - 6,000 16,500 6,000 0.00%TOTALS - 2,530,250 766,200 13,842,991 26,216,000 3321.56%ExpensesSalaries and Wages - - - 23,000 118,500 100.00%Employee Benefits - - - 5,500 21,800 100.00%Transfer to Equipment Replacement Fund - - - - 12,750,000 100.00%Carry Over Projects - - - - 12,488,000 100.00%Projects - 693,339 1,065,852 2,882,000 9,190,000 762.22%TOTALS - 693,339 1,065,852 2,910,500 34,568,300 3143.26%Total Revenues Over/(Under) Expenses - 1,836,911 (299,652) 10,932,491 (8,352,300) Beginning Fund Equity - - 1,836,911 1,836,911 12,769,402 ENDING NET ASSETS - 1,836,911 1,537,259 12,769,402 4,417,102
Revenue and Expense Summary
271

Town-wide Underground Utilities Fund FY2018
Transfer from the CIP (Pay As You Go) Fund (307) Transfer to cover costs for burying lines through City of Lake Worth, hiring project coordinator and augmenting the program to reduce assessments.
Interest on Investments Interest revenue is based upon the financial market conditions and funds available for investment
EXPENSES Salaries and Wages/Employee Benefits Salaries/Wages and Employee Benefits for the Underground Utility Project Manager and Communications Specialist
Transfer to Equipment Replacement Fund Repayment of advance made on June 13, 2017
Carry Over Projects Projected unexpended project balances, authorized in prior years
Projects Town-wide Underground Utility Project construction costs
Full Time Equivalent Employees FY2014 FY2015 FY2016 FY2017 FY2018Underground Utilities Project Manager - - - 1.000 1.000 Communications Specialist - - - - 0.250
- - - 1.000 1.250
272
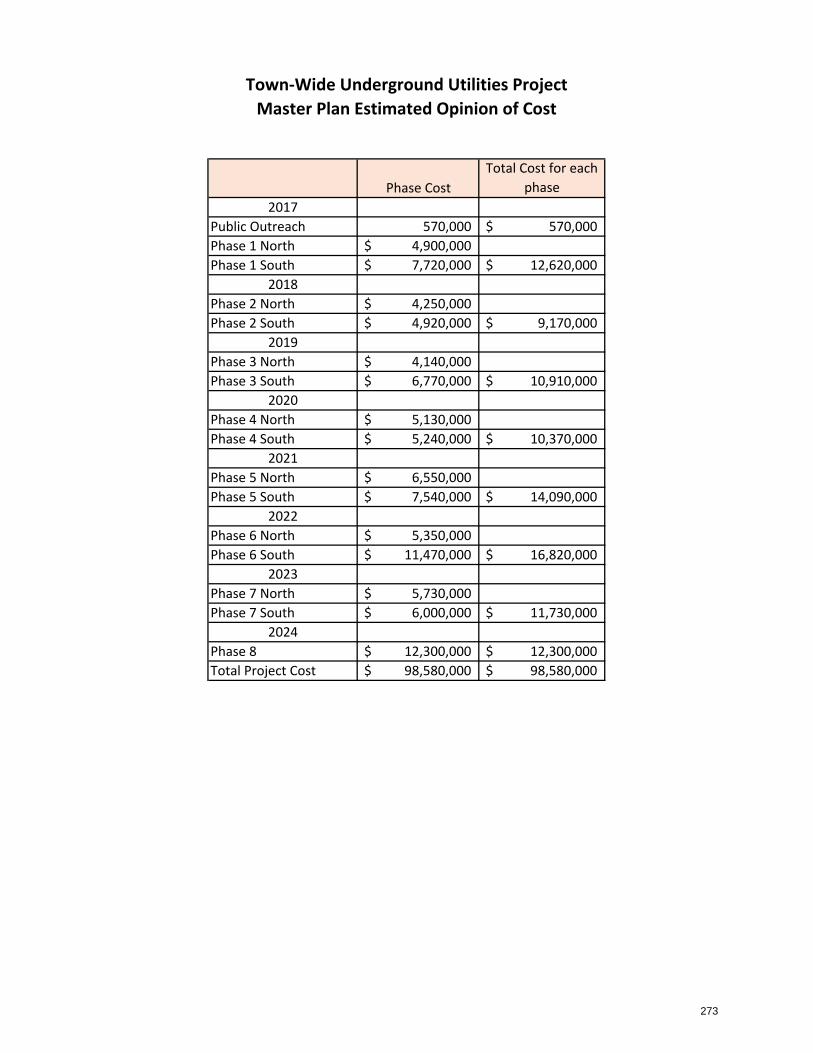
Phase Cost
Total Cost for each
phase
2017
Public Outreach 570,000 570,000$
Phase 1 North 4,900,000$
Phase 1 South 7,720,000$ 12,620,000$
2018
Phase 2 North 4,250,000$
Phase 2 South 4,920,000$ 9,170,000$
2019
Phase 3 North 4,140,000$
Phase 3 South 6,770,000$ 10,910,000$
2020
Phase 4 North 5,130,000$
Phase 4 South 5,240,000$ 10,370,000$
2021
Phase 5 North 6,550,000$
Phase 5 South 7,540,000$ 14,090,000$
2022
Phase 6 North 5,350,000$
Phase 6 South 11,470,000$ 16,820,000$
2023
Phase 7 North 5,730,000$
Phase 7 South 6,000,000$ 11,730,000$
2024
Phase 8 12,300,000$ 12,300,000$
Total Project Cost 98,580,000$ 98,580,000$
Town‐Wide Underground Utilities Project
Master Plan Estimated Opinion of Cost
273

(This page intentionally left blank)
274

Debt A dministration FY2018
General Obligation Bonds
General Obligation Bonds offer maximum security to investors through the pledge of the municipality’s full faith and credit, which for the Town of Palm Beach requires voter approval. At this time, no General Obligation Bonds are outstanding.
The voters approved a referendum on March 15, 2016 for the issuance of $90,000,000 in General Obligation Bonds for the Underground Utility Project. The Town will be issuing the General Obligation bonds in the future.
Revenue Bonds
In 2010 the Town issued 2010A Public Improvement Revenue and Refunding Bonds in the principal amount of $57,035,000, and 2010B Worth Avenue Commercial District Project bonds in the principal amount of $14,770,000.
The 2010A bonds refunded the 2003B bonds ($5,310,000), the 2008 Revenue Note ($10,000,000), and a 2009 Line of Credit ($600,000) which was issued for the Worth Avenue Project. The balance of the proceeds were to fund a portion of the Town’s Accelerated Capital Improvement Program totaling $41,232,000 and $1,740,844 was used to reimburse the Town for the Town’s portion of the Par 3 Golf Course Project.
The 2010B bonds were used to fund the Worth Avenue Commercial District streetscape project. The Town imposed a capital special assessment against real property in the Worth Avenue Commercial District to pay the costs of the Worth Avenue Projects. The assessments will be payable over a thirty year period. The assessments will be security for the 2010B bonds.
On January 1, 2012, the Town used excess funds remaining after completion of the Worth Avenue Project to redeem $1,485,000 of the 2010B Bonds.
On August 25, 2016, the Town issued bonds to refund the 2010A & 2010B bonds. This transaction produced gross savings of $8,900,539 over 23 years. The net present value savings is $6,895,965 or 13.35%. This savings reduced debt service for FY18 by $284,356.
In 2013, the Town issued Public Improvement Revenue Bonds in a par amount of $55,590,000. The proceeds of the bond will be used for the second phase of the Town’s Accelerated Capital Improvement Program ($44,997,957) groin rehabilitation and seawall replacement ($11,900,000) and the Town’s portion of the Par 3 Clubhouse project ($1,250,000).
All of these bonds are revenue obligations of the Town payable solely from and secured solely by the pledged revenues. Pledged revenues shall consist primarily of Non-Ad Valorem Revenues budgeted and appropriated annually by the Town for the purpose of paying debt service on the Bonds. The Town covenants that in each fiscal year while any bonds are outstanding, the total non-self-supporting debt service in any fiscal year of the Town will not exceed 50% of Non-Ad Valorem Revenues of the Town.
The Town has covenanted and agreed that it will not incur any indebtedness payable from or supported by a pledge of the Non-Ad Valorem Revenues unless the Town can show that following the incurrence of such additional indebtedness, (1) the total amount of Non-Ad Valorem Revenues (based upon the most recent Fiscal Year) will be greater than twice the
275

Debt A dministration FY2018
then maximum debt service and (2) the total amount of Non-Ad Valorem Revenues in each Fiscal Year in which Bonds are outstanding will be greater than 2.00 times the non self supporting debt in each such fiscal year.
As part of the preparation for the 2016 Refunding Revenue Bond, the Town’s issuer’s and Revenue Bond ratings were reviewed by both Moody’s and Standard & Poor’s. The Town’s conservative financial policies and strong management of its financial resources were recognized, and it resulted in Moody’s Investors Service issuing a rating of Aa1 for the 2013 Revenue bonds and an Aaa issuer’s rating. Standard and Poor’s issued a Revenue bond rating of AA+ and a AAA issuer’s rating. The ratings for both the Bond and issuer credit are the highest ratings these two rating services issue and represent the highest quality investment grade debt.
For perspective regarding the future debt obligations, a 10 year summary of debt service, outstanding debt, and debt per capita is provided below.
Debt Service Payments
Principal payments are due on January 1, and interest payments are due on January 1 and July 1 of each year. The annual debt service requirements for the outstanding revenue bonds through 2028 are shown below:
Fiscal Year
2016A Revenue
Bond ACIP-I
2016A Revenue Bond -Par 3
2016B Revenue
Bond Worth Ave
2013 Revenue
Bond ACIP - II
2013 Par 3
Revenue Bond
2013 Coastal
Revenue Bond
Total
2018 3,211,894 123,450 708,212 2,770,438 74,813 736,038 7,624,844
2019 3,215,494 120,650 708,762 2,774,313 78,688 735,038 7,632,944
2020 3,210,919 122,375 708,600 2,771,063 77,438 733,538 7,623,931
2021 3,173,544 118,625 722,912 2,770,688 76,188 731,538 7,593,494
2022 3,169,044 119,750 722,112 2,772,938 74,938 733,913 7,592,694
2023 3,171,294 115,750 721,012 2,772,688 78,563 735,538 7,594,844
2024 3,170,044 116,625 724,537 2,774,813 77,063 731,538 7,594,619
2025 3,179,919 112,375 722,687 2,774,188 75,563 731,913 7,596,644
2026 3,175,794 113,000 720,537 2,770,813 78,938 731,538 7,590,619
2027 3,172,794 113,375 713,888 2,774,438 77,188 735,288 7,586,969
2028 3,171,522 113,500 717,262 2,774,813 75,438 733,163 7,585,698
276

Debt Administration FY2018
Legal Debt Margin
The Town of Palm Beach has a 5% debt limit as a percent of assessed valuation per Section 7.01 of the Town Charter. The following is a computation of the Town of Palm Beach Legal Debt Margin:
Preliminary Assessed Valuation $16,911,518,815
Legal Debt Margin: Debt Limitation - 5% of assessed value $ 845,575,941
Debt Summary
Outstanding debt as of September 30, 2017:
General Fund Pledge Obligations: Non-Ad Valorem Revenue Bonds $111,635,000
Total Gross Debt (13.2% of capacity) $111,635,000
Debt Ratios Per Capita
Population 8,041
Taxable Value $16,911,518,815 $2,103,161
Total Gross Debt $111,635,000 $13,883
The chart below shows the ratio of total debt outstanding as a percent of taxable value.
277

Debt Administration FY2018
The chart below shows total debt service as a percentage of general fund expenditures.
Town of Palm Beach Principal Debt Outstanding
FY2018 - FY2027
Fiscal Year
Ending
2016A Revenue
Bond
2016B Revenue
Bond
2013 Revenue
Bond Total Debt
Outstanding
Debt Per Capita (8,041
Population)
2018 46,445,000 10,905,000 51,735,000 109,085,000 13,566
2019 45,190,000 10,858,000 50,640,000 106,415,000 13,234
2020 43,880,000 10,255,000 49,495,000 103,630,000 12,888
2021 42,545,000 9,900,000 48,295,000 100,740,000 12,528
2022 41,145,000 9,535,000 47,030,000 97,710,000 12,151
2023 39,675,000 9,160,000 45,695,000 94,530,000 11,756
2024 38,130,000 8,770,000 44,295,000 91,195,000 11,341
2025 36,500,000 8,370,000 42,825,000 87,695,000 10,906
2026 34,790,000 7,960,000 41,280,000 84,030,000 10,450
2027 32,995,000 7,540,000 39,650,000 80,185,000 9,972
278

Debt Administration FY2018
The chart below shows the total principal debt outstanding for FY18 through FY27.
The chart below shows total outstanding debt per capita for FY18 through FY27.
279

Debt Service Fund – 2016A and 2013 Revenue Bonds FY2018
Fund 205 - 2016A and 2013 Revenue Bonds
REVENUES Interest EarningsRepresents interest earned on reserves of fund
Transfer from Worth Avenue Revenue Bond Fund Refund cost of prorated interest due at closing
Transfer from General FundDebt service on 2016A/2013 Bond Issues
Transfer from Recreation FundDebt service on 2016A/2013 Bond Issues
Transfer from Coastal Fund Debt service on 2013 Bond Issue
EXPENDITURES Debt Service Interest/PrincipalRepresents the amount of interest/principal due on the 2016A and 2013 Revenue Bonds
Other Bond Expenses Represents amounts due for bond expenses
FY2015Actual
FY2016Actual
FY2017Budget
FY2017Adjusted
FY2017Projected
FY2018Budget
%Change
RevenuesInterest Earnings 100 - 999 999 - - -100.00%Transfer from 206 - Worth Avenue - - 109,825 109,825 108,325 - -100.00%Refunding Bond and premium 46,959,128 Transfer from General Fund 6,100,000 6,265,462 6,088,728 6,088,728 6,088,728 5,982,331 -1.75%Transfer from Recreation Fund 202,200 204,100 185,967 185,967 185,967 198,263 6.61%Transfer from Coastal Fund 734,613 731,163 731,413 731,413 731,413 736,038 0.63%TOTALS 7,036,913 54,159,853 7,116,932 7,116,932 7,114,433 6,916,632 -2.81%ExpensesDebt Service Interest 5,235,425 5,161,272 4,861,109 4,861,109 4,348,072 4,676,633 -3.79%Debt Service Principal 1,975,000 2,045,000 2,145,000 2,145,000 2,145,000 2,240,000 4.43%Other Expenses 4,190 933,773 15,000 15,000 6,828 15,000 0.00%TOTALS 7,214,615 8,140,045 7,021,109 7,021,109 6,499,900 6,931,633 -1.27%Total Revenues Over/(Under) Expenses (177,702) 46,019,808 95,823 95,823 614,533 (15,001) Transfer to Bond Escrow Agent (46,631,751) Beginning Fund Equity 1,745,086 1,567,384 955,441 955,441 955,441 1,569,974 ENDING NET ASSETS 1,567,384 955,441 1,051,264 1,051,264 1,569,974 1,554,973
Revenue and Expense Summary
280
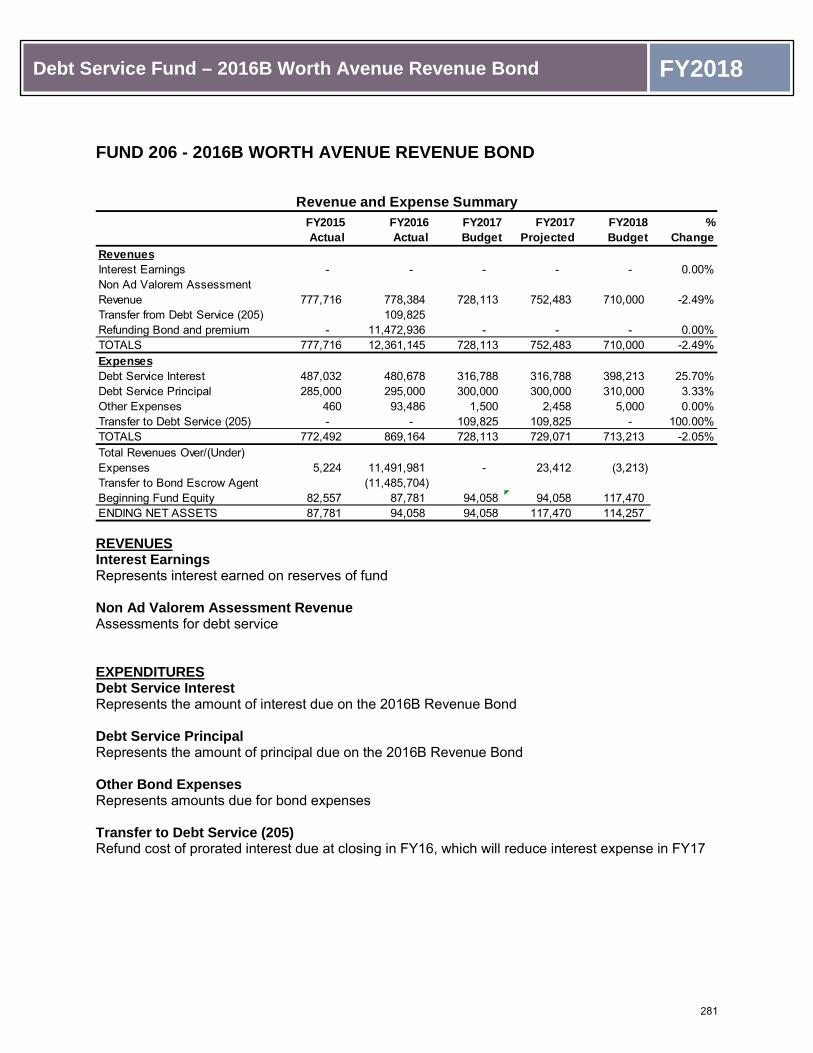
Debt Service Fund – 2016B Worth Avenue Revenue Bond FY2018
FUND 206 - 2016B WORTH AVENUE REVENUE BOND
REVENUES Interest Earnings Represents interest earned on reserves of fund
Non Ad Valorem Assessment Revenue Assessments for debt service
EXPENDITURES Debt Service Interest Represents the amount of interest due on the 2016B Revenue Bond
Debt Service Principal Represents the amount of principal due on the 2016B Revenue Bond
Other Bond Expenses Represents amounts due for bond expenses
Transfer to Debt Service (205) Refund cost of prorated interest due at closing in FY16, which will reduce interest expense in FY17
FY2015Actual
FY2016Actual
FY2017Budget
FY2017Projected
FY2018Budget
%Change
RevenuesInterest Earnings - - - - - 0.00%Non Ad Valorem Assessment Revenue 777,716 778,384 728,113 752,483 710,000 -2.49%Transfer from Debt Service (205) 109,825 Refunding Bond and premium - 11,472,936 - - - 0.00%TOTALS 777,716 12,361,145 728,113 752,483 710,000 -2.49%ExpensesDebt Service Interest 487,032 480,678 316,788 316,788 398,213 25.70%Debt Service Principal 285,000 295,000 300,000 300,000 310,000 3.33%Other Expenses 460 93,486 1,500 2,458 5,000 0.00%Transfer to Debt Service (205) - - 109,825 109,825 - 100.00%TOTALS 772,492 869,164 728,113 729,071 713,213 -2.05%Total Revenues Over/(Under) Expenses 5,224 11,491,981 - 23,412 (3,213) Transfer to Bond Escrow Agent (11,485,704) Beginning Fund Equity 82,557 87,781 94,058 94,058 117,470 ENDING NET ASSETS 87,781 94,058 94,058 117,470 114,257
Revenue and Expense Summary
281

(This page intentionally left blank)
282

Capital Funds FY2018
Capital Funds Introduction: The Capital Improvement Fund section includes accomplishments as well as summary schedules that reflect each projects with carry-over funds from prior years that will be utilized at some point in the future for a designated purpose.
Description of Funds: The Town accounts for five Capital Funds as described below:
1) Capital Improvement Program - Pay-as-you-go (307)This fund accounts for capital projects not covered by the remaining four capital funds. While the Capital Improvement Program encompasses a five year period, only the first year of the Program is adopted each year by the Town Council for funding and implementation. The out years of the Program are not a budget, but provide appropriate financial information for prudent budget and planning recommendations and assist the Town’s Elected Officials and Management Staff in the decision making process. Through budgetary action, the first year of the Program becomes the Capital Projects allocation which is funded from the General Operating Budget for the Town.
2) Comprehensive Coastal Management Plan (CCMP) (309)This fund accounts for coastal expenditures financed with proceeds from bond issues, transfers from other Town funds and grants. Coastal expenditures include beach restoration/renourishment through the placement of sand, construction of groin fields and environmental mitigation for beach stabilization in all or a portion of the beaches located in Town.
3) Worth Avenue Assessment District (311)This fund was initially established to account for the Worth Avenue Assessment District pre-construction costs. This fund currently accounts for maintenance costs associated with the district.
4) Accelerated Capital Improvement Fund 2013 Bond Issue (314)This fund was established as result of the 2013 bond issue to account for storm water, sanitary sewer, and other projects as outlined in the bond document.
283

Capital Expenditures FY2018
Impact of Capital Investments on Operating Budget
There are many features that distinguish the operating budget from the capital budget. The operating budget includes expenses that are generally of a recurring nature for all services and are appropriated for one year only, but do not result in major physical assets. From year to year, changes in the operating budget are expected to be fairly stable and represent incremental changes in the cost of doing business, in the growth of the community and in the types and levels of the services provided. Capital expenditures or the capital budget on the other hand include one-time costs for projects and may fluctuate widely from year to year.
The most obvious connection is the fact that the operating budget assumes the cost of maintaining and operating new facilities that are built under the capital budget. The operating budget impact estimates for capital projects are important for future planning and are included in budget projections used in the annual budget process. These costs or savings adjust the annual operating budget in the year the asset is complete and the asset is operational. Some capital improvements will actually decrease maintenance costs, such as replacement of vehicles and water lines or reconstruction of roads.
The following table reflects the impact of capital investments on the Town’s operating budget:
Project Salary/ Benefits
Supplies/ Contractual
Total Savings/
(Cost) Comments Stormwater Projects
D-9 Pump Station (6,688)$ (560)$ (7,248)$ Labor & Utilities SavingsD-4 Pump Station (4,460) (1,150) (5,610)$ Labor & Utilities SavingsD-3/D-4 Pump Stations Electrical Upgrade (5,004) 0 (5,004)$ Labor savings from decreased failuresD-8, D-14 & A-7 Pump Station Fuel Tank Replacement (1,115) 0 (1,115)$ Labor Savings from reduced corrosion controlD-10 Pump Station Improvements (2,259) (670) (2,929)$ Labor & Utilities SavingsD-12 Pump Replacement (13,377) 0 (13,377)$ Labor savings from decreased failuresD-15 (D-6 & D-7) Pump Station Rehabilitation (38,646) 31,949 (6,697)$ Labor & Utilities Savings
Sub Total Stormwater (71,549)$ 29,569$ (41,980)$
Sanitary ProjectsPump Stations A-5 & A-6 Improvements (4,460)$ 0 (4,460)$ Labor savings from decreased failuresPump Station A-7 Inline Booster Station (5,574) 0 (5,574)$ Labor savings from decreased failuresPump Stations A-42 &A-43 Improvements (4,460) 0 (4,460)$ Labor savings from decreased failuresPump Stations A-39 & A-41 Improvements (5,574) 0 (5,574)$ Labor savings from decreased failuresPump Stations A-39,41,42,43 Generators (11,148) 0 (11,148)$ Labor savings from decreased failuresPump Station S-2 Inline Booster Station (8,918) 700 (8,218)$ Labor & Utilities SavingsNorth Flagler Drive Force Main 1,300 0 1,300$ Additional ARV and Plug Valves to maintainEjector Pump Stations Upgrade (2,230) 0 (2,230)$ Labor savings from decreased failuresA-7 to Hammon Ave Force Main Replacement 278 0 278$ Additional ARV and Plug Valves to maintainE-6 Bradley Park to Tangier Avenue Force Main (2,079) 0 (2,079)$ Additional ARV and Plug Valves to maintainE-3, Garden Rd to Cherry Lane Force Main 278 0 278$ Additional ARV and Plug Valves to maintainA-42 to A-41 & Par 3 to A-39 Force Main 1,161 0 1,161$ Additional ARV and Plug Valves to maintainA-39 to A-7 Force Main Replacement 1,904 0 1,904$ Additional ARV and Plug Valves to maintain
Sub Total Sanitary (39,522)$ 700$ (38,822)$ Grand Total Savings/(Cost) (111,071)$ 30,269$ (80,802)$
Impact of Capital Investments on Operating BudgetAnnual Operating Savings/(Cost)
284

Capital Projects by Project Type and Fund FY2018
285

(This page intentionally left blank)
286286

Town of Palm Beach
Capital Improvement Fund (307)


N:\Finance\BUDGET\FY18\Capital\307 Payasyougo FY2018 5yr CIP plan PS rev 8_28_17 FINAL 11/20/2017
Pay-as-you-go Five Year Capital Improvement PlanFY2018 Budget
EXPENDITURES FY2017 Est. FY2018 FY2019 FY2020 FY2021 FY2022 FY2018-2022Item # Description Location Carry Over Estimated Estimated Estimated Estimated Estimated Total
Pavement Management 2,511,841$ 1,000,000$ 1,000,000$ 1,000,000$ 1,000,000$ 1,000,000$ 5,000,000$ 2 Town-Wide Following Undergrounding Phases -$ 1,000,000$ 1,000,000$ 1,000,000$ 1,000,000$ 1,000,000$ 5,000,000$
Drainage System 179,252$ -$ 1,280,000$ 1,415,000$ 1,300,000$ -$ 3,995,000$ 1 D-16 - design moved to ACIP Jungle Road ($80,000) -$ -$ 550,000$ -$ -$ -$ 550,000$ 2 D-18 - design moved to ACIP El Brillo Way ($75,000) -$ -$ 545,000$ -$ -$ -$ 545,000$ 3 D-17 Clarendon Avenue -$ -$ 50,000$ 340,000$ -$ -$ 390,000$ 4 D-2 Palmo Way -$ -$ 30,000$ 225,000$ -$ -$ 255,000$ 5 D-8 Country Club Road -$ -$ 105,000$ 750,000$ -$ -$ 855,000$ 6 D-12 Everglade Avenue -$ -$ -$ 100,000$ 730,000$ -$ 830,000$ 7 D-3 Tangier Avenue -$ -$ -$ -$ 290,000$ -$ 290,000$ 8 D-6 Royal Palm Way -$ -$ -$ -$ 140,000$ -$ 140,000$ 9 D-7 Australian Avenue -$ -$ -$ -$ 140,000$ -$ 140,000$
Sanitary Sewage System 1,404,562$ -$ 1,050,000$ 1,335,000$ 1,195,000$ 223,000$ 3,803,000$ 1 E-8 Island Road -$ -$ -$ -$ -$ -$ -$ 2 E-1 Mediterranean Road -$ -$ -$ -$ -$ 50,000$ 50,000$ 3 E-2 Mockingbird Trail -$ -$ -$ -$ -$ 50,000$ 50,000$ 4 G-9 - design and Constr.moved Flag Pole Beach ($40,000)($275,000) -$ -$ -$ -$ -$ -$ -$ 5 E-3 - design and constr moved t Garden Road (trail)($45,000)($325,000) -$ -$ -$ -$ -$ -$ -$ 6 A-4 - design moved to ACIP The Breakers ($55,000) -$ -$ 395,000$ -$ -$ -$ 395,000$ 7 A-5 - design moved to ACIP Royal Poinciana Way (S of S-2) -$ -$ 510,000$ -$ -$ -$ 510,000$ 8 A-6 Royal Palm Way/Intracoastal -$ -$ 115,000$ 820,000$ -$ -$ 935,000$ 9 E-6 Tangier Avenue -$ -$ 30,000$ 225,000$ -$ -$ 255,000$
10 E-5 Country Club Drive -$ -$ -$ 165,000$ -$ 20,000$ 185,000$ 11 A-7 Island Road/S County Road -$ -$ -$ 40,000$ 270,000$ -$ 310,000$ 12 A-41 Palm Beach Par 3 Golf Course -$ -$ -$ 25,000$ 185,000$ -$ 210,000$ 13 A-42 Bellaria Condominium -$ -$ -$ 30,000$ 200,000$ 48,000$ 278,000$ 14 A-43 Atriums of Palm Beach -$ -$ -$ 30,000$ 210,000$ -$ 240,000$ 15 A-39 Phipps Park -$ -$ -$ -$ 175,000$ -$ 175,000$ 16 S-2 Royal Poinciana Way (N of A-5) -$ -$ -$ -$ 155,000$ 55,000$ 210,000$
Town Buildings 575,082$ 1,020,000$ 505,000$ 725,000$ 910,000$ 930,000$ 4,090,000$ 1 Facilities Assessment 200,000$ 200,000$ 2 Public Works Facilty -A/C Chiller -$ 50,000$ -$ -$ -$ 80,000$ 130,000$ 3 Police Facility - ADA Bathrooms, Locker rooms -$ 200,000$ 325,000$ 285,000$ -$ 810,000$ 4 Bradley Park / Royal Poinciana Way Median -$ -$ 40,000$ -$ -$ -$ 40,000$ 5 Lakeside Park / Royal Palm Way Median -$ -$ 200,000$ -$ -$ -$ 200,000$ 6 Mid Town & Phipps Ocean Park Lifeguard Building -Restoration -$ 350,000$ -$ -$ -$ -$ 350,000$ 7 Central Fire Station - Bay Apron, Flat Roofs -$ -$ 20,000$ -$ 45,000$ -$ 65,000$ 8 North Fire Station - Interior Renovation, Roofs -$ 200,000$ -$ 50,000$ 440,000$ 445,000$ 1,135,000$ 9 South Fire Station - ADA Bathrooms, Locker rooms -$ 20,000$ 180,000$ -$ -$ 405,000$ 605,000$
10 Old Purchasing - Structural Repairs -$ -$ 65,000$ -$ -$ -$ 65,000$ 11 Public Works ADA Bathrooms, Locker rooms -$ -$ 350,000$ 140,000$ -$ 490,000$
Solid Waste / Vegetation Disposal 25,000$ 27,500$ 30,000$ 33,000$ -$ 115,500$ 1 Skees / Okeechobee Landfill Roadways/Reduction -$ 25,000$ 27,500$ 30,000$ 33,000$ -$ 115,500$
Coastal Structures / Lake Worth Lagoon 271,497$ -$ 180,000$ 200,000$ 220,000$ 245,000$ 845,000$ 1 Bulkheads -$ -$ 125,000$ 140,000$ 155,000$ 170,000$ 590,000$ 2 Seawalls Lakeside, Bradley -$ -$ 55,000$ 60,000$ 65,000$ 75,000$ 255,000$
Undergrounding Seed Money 19,720$ -$ -$ -$ -$ -$ -$
Water Main Improvements -$ 800,000$ 800,000$ 800,000$ 800,000$ 800,000$ 4,000,000$ $Capital Improvement Program Expenditures 4,961,954$ 2,845,000$ 4,842,500$ 5,505,000$ 5,458,000$ 3,198,000$ 21,848,500$ Year FY2018 FY2019 FY2020 FY2021 FY2022 Total
REVENUES FY2017 Est. FY2018 FY2019 FY2020 FY2021 FY2022Source Carry Over Estimated Estimated Estimated Estimated Estimated TotalGeneral Fund Transfer -$ 1,988,024$ 2,186,826$ 2,405,509$ 2,646,060$ 2,910,666$ 12,137,085$ Other -$ -$ -$ -$ -$ -$ -$ Interest -$ 56,976$ 67,000$ 67,000$ 67,000$ 67,000$ 324,976$ Reserve Transfer 4,961,954$ -$ -$ -$ -$ 4,961,954$ WPB Water Main Improvements -$ 800,000$ 800,000$ 800,000$ 800,000$ 800,000$ 4,000,000$ Capital Improvement Program Revenues 4,961,954$ 2,845,000$ 3,053,826$ 3,272,509$ 3,513,060$ 3,777,666$ 21,424,015$
NET COST FY2017 Est. FY2018 FY2019 FY2020 FY2021 FY2022(Surplus / (Deficit)) Carry Over Estimated Estimated Estimated Estimated Estimated TotalSub-Total - Net Cost -$ -$ (1,788,674)$ (2,232,491)$ (1,944,940)$ 579,666$ (424,485)$
Legend Source - Mock Roos:Engineering, Permitting and Admin DURING DESIGN (15%)Construction, Engineering and Admin DURING CONSTRUCTION (10%)EVERYTHING
287

Pay-as-you-go Capital Improvement Fund FY2018
PAY-AS-YOU-GO CAPITAL IMPROVEMENT FUND (307)
REVENUES Transfer from General Fund (001) Annual pay-as-you-go funding transferred from the General Fund to the Capital Fund
Transfer from Town Facilities Fund (310) Transfer from the Town Facilities Fund for projects relating to Town Facilities
Restricted - One Cent Surtax Voter approved surtax restricted for infrastructure projects
Interest on Investments The interest revenue is based upon the financial market conditions and funds available for investment
Interlocal Agreement Revenue from residents for Single Family Expulsor Station Assessments and the City of WPB for water projects
EXPENSES Projects A detailed schedule of projects can be found in this section
Carry Over Reserves: Projected unexpended project balances, authorized in prior years
FY2015Actual
FY2016Actual
FY2017Budget
FY2017Projected
FY2018Budget
%Change
RevenuesTransfer from General Fund (001) 1,000,000 1,030,000 2,290,200 2,290,200 1,988,024 -13.19%Transfer from Town Facilities Fund (310) 225,000 323,173 - - - 0.00%Restricted - One Cent Sur Tax - - - 350,847 500,000 100.00%Interest on Investments 54,005 51,026 66,600 21,044 56,976 -14.45%Interlocal Agreement 9,370 8,399 800,000 932,000 800,000 0.00%TOTALS 1,288,375 1,412,598 3,156,800 3,594,091 3,345,000 5.96%ExpensesProjects 1,264,741 1,596,397 7,115,111 662,726 2,845,000 -60.01%Carry Over Reserves 4,961,954 100.00%Restricted - One Cent Sur Tax - - - 350,847 - 0.00%Contingency - - 348,600 - 284,500 -18.39%Transfer to Underground Utility Fund (122) - - 760,200 760,200 1,000,000 31.54%TOTALS 1,264,741 1,596,397 8,223,911 1,773,773 9,091,454 10.55%Total Revenues Over/(Under) Expenses 23,634 (183,799) (5,067,111) 1,820,318 (5,746,454) Beginning Fund Equity 5,670,416 5,694,050 5,510,251 5,510,251 7,330,569 ENDING NET ASSETS 5,694,050 5,510,251 443,140 7,330,569 1,584,115
Revenue and Expense Summary
288

Pay-as-you-go Capital Improvement Fund FY2018
Restricted - One Cent Surtax Voter approved surtax restricted for infrastructure projects
Contingency 10% of current year projects per Town policy
Transfer to Underground Utility Fund (122) FY 2017 - Transfer to cover costs such as: burying lines through City of Lake Worth, hiring project coordinator, and augmenting the program to reduce assessments
FY2018 – Transfer of One Cent Surtax Revenue for FY2017 and FY2018 to the Town-wide Underground Utility Fund. Town Council authorized the transfer of $2.5 million of the estimated $5 million One Cent Surtax Revenue to be received from FY2017 – FY2026 to the Town –wide Underground Utility Fund during the FY2018 budget process.
289

(This page intentionally left blank)
290

Town of Palm Beach
Comprehensive Coastal Management Plan
Bond Proceeds Construction Fund (309)

Coastal Management Fund FY2018
COMPREHENSIVE COASTAL MANAGEMENT PROGRAM FY17 ACCOMPLISHMENTS & FY18 ACTION PLAN
SHORE PROTECTION BOARD On July 8, 2008, the Town Council created the Shore Protection Board (SPB) to “act in an advisory capacity to the Town Council and shall make recommendations to the Town Council on all matters relating to shore protection in the Town of Palm Beach.” On December 9, 2008, Town Council appointed seven (7) Board members who held their first meeting on December 17, 2008.
Coastal Management Work Plan
On February 11, 2009, the Town Council directed the Board “to accelerate its meetings, identify a contingency plan for Reach 7 and 8, and provide a long term plan of action (with options) for Town Council consideration in November 2009.” Per direction of the Town Council, the Shore Protection Board submitted a Coastal Management Work Plan on November 9, 2009, which the Town Council accepted as a “blue print” for future coastal management activities in the Town of Palm Beach.
During the 2010, 2011, and 2012 calendar years, the Board has continued an adaptive management approach to their 10-year Work Plan. As more information has become available, some items originally suggested for FY 2011, FY 2012, or FY 2013 were adjusted for future years.
The Board’s FY13 Coastal Management Program budget and 10-Year Plan was peer reviewed by Woods Hole Group between August 2012 and June 2013. Based on the recommendations from Woods Hole Group, an FY 2014 program budget and 10-year plan was developed and approved by Town Council for funding and implementation. In 2015, an FY 2016 program budget and 10-year plan update was performed by Town staff at the request of Town Council. This FY 2016 program is largely year three of the FY 2014 10-year plan with some revisions recommended from Woods Hole Group.
The current status of the Town’s Coastal Management Program is set forth below and the 10-year plan summary is presented at the end of this report.
COASTAL PROJECTS UPDATES Included as an element of the Comprehensive Coastal Management Plan, the Town’s shoreline was divided into eight (8) segments, or “reaches”. Each reach has a unique set of characteristics, based on upland uses, existing armoring, shoreline condition, shoreline orientation, and previous coastal management projects constructed, among others. The Board planned projects are specific for each reach. The information provided below has been separated and is consistent with the work currently being performed, or to be performed, within each reach.
291

Coastal Management Fund FY2018
Reach 1 (LAKE WORTH INLET TO ONONDAGA AVENUE) Current Action
Continue Inlet Maintenance Dredging; to include settling basin, harbor channel, and turning basins. Placement of all beach-compatible sand will be placed on the dry beach and within the permitted beach profile.
Town continues to work with the U.S. Army Corps of Engineers on the various Federally-participated inlet maintenance dredging activities.
Ensure operation and maintenance the Sand Transfer Plant.
2016 Townwide Physical Monitoring Report, dated February 2017
Reach 1
Reach 1 experienced a net shoreline increase of 94.4 feet since this monitoring period. This advancement primarily occurred throughout the reach and appears to be attributable to both sand discharge by the Sand Transfer Plant (STP) and direct beach placement of inlet maintenance material. Volumetric gains on the order of 61,552 cubic yards (to -26.2 feet NAVD) occurred over this time period, with the greatest gains occurring on the beach and in the nearshore zone.
Overall, this reach has exhibited a long term substantial net shoreline advance of 178.5 feet and volumetric gain (to -26.2 feet NAVD) of 736,450 cubic yards since 1990. This long-term advance in shoreline and volume is associated with discharge by the Sand Transfer Plant (STP) within this reach and direct placement of material from inlet maintenance operations.
FDEP Strategic Beach Management Plan, June 2015
Strategy: Bypass an average annual volume of 202,000 cubic yards of sand to the downdrift beaches through a combination of the operation of the sand transfer plant and beach placement of maintenance dredge material from the federally authorized navigation channel; place all beach compatible material dredged during channel maintenance on downdrift beaches in Reach 1, in an extended beach placement in Reach 2, and when feasible, at Mid-Town and Phipps Ocean Park projects; dredging placement should be limited to dry beach; extension of the discharge pipeline to discharge points located at the south jetty, and approximately 3,600 ft south of the south jetty; expand the settling basin; comply with the Palm Beach Island Beach Management Agreement (BMA), 2013; update the sediment budget and the inlet management plan.
Comprehensive Coastal Management Plan, 1998 Update
Reach 1 has been subjected to direct sand placement in recent years as a result of dredged sand disposal from the maintenance of Lake Worth Inlet. With the continued Sand Transfer Plant discharge of sand onto the north end of Palm Beach Island and placement of beach-quality maintenance dredge sand by the U.S. Corps of Engineers, two principal Lake Worth Inlet Management Plan objectives of sand bypassing across the Inlet and maintenance of the navigation channel are partially satisfied.
292

Coastal Management Fund FY2018
Reach 1 Related Shore Protection Board Recommended Actions, November 2009
Sand Transfer Plant, Phase I Construction - The rehabilitation of the mechanical and electrical systems with structural restoration of the plant itself.
The Town recently completed renovation of the 52-year-old sand bypassing plant. Although the structural and exterior restoration was not completed until May 2010, the mechanical components were all replaced in time for the plant to resume operations in late December 2009. The total cost of the project was approximately $2,200,000 Town staff was able to secure a $300,000 grant from the Florida Inland Navigation District, which brought the net Town cost down to approximately $1,900,000.
STATUS: Completed in April 2010.
Engineered Beach Designation - The SPB requested that the Town hire a consultant to prepare the necessary documentation to potentially qualify Reach 1 as an “Engineered Beach” as defined by FEMA.
STATUS: Report has been submitted to FEMA and the USACE following impacts associated with Hurricane Irma. Reach 1 will be included in the Hurricane Irma Project Worksheet for FEMA relief consideration.
Reach 2 (ONONDAGA AVENUE TO EL MIRASOL) Due to the extensive amount of hardbottom in Reach 2, is it unlikely that a JCP permit for beach restoration could be obtained. In lieu of a beach restoration project, Town staff has identified alternative projects that would introduce additional sand to Reach 2. The addition of a second discharge for the Sand Transfer Plant would dispose beach quality sand on the dry beach. The purpose of placing sand in Reach 2 is to continue the natural southerly flow of sand that has been interrupted by the channel and inlet jetties. The 3,500-foot pipeline extension south of the inlet may assist the Reach 2 beaches with modest accretion. Town staff is working with FDEP and USACE Civil Works staff to potentially expand the footprint of the Lake Worth Inlet’s maintenance dredging project into Reach 2.
Should the second discharge, or an expanded inlet maintenance placement area, create a small stable beach throughout Reach 2, a dune project may be considered to add high quality sand with vegetation to create a more natural beach and dune cross shore profile. Dune projects provide a line of defense from storms and benefit the Town’s entire coastal system.
Current Action
The Beach Management Agreement (BMA) was signed in September 2013. The BMA includes an expansion of the Mid-Town Beach Nourishment project taper into the southern portion of Reach 2. This project was constructed in 2015.
Physical and Biological Monitoring efforts have continued.
293
Coastal Management Fund FY2018
2016 Townwide Physical Monitoring Report, dated February 2017
Reach 2
Over this monitoring period, the Reach 2 shoreline receded an average of -0.3 feet. Both gains and losses occurred throughout the reach. In total, the reach lost a net volume of -45,046 cubic yards. Volumetric losses were most prominent from R-78 (Onondaga Road) through R-82 (Orange Grove Road) within the deeper portions of the profile (in depths from -13.1 to -26.5 feet).
Since 1990, the reach has exhibited a net shoreline advance of 47.6 feet, through this gain primarily occurs within the northernmost portion of the reach, between R-78 (Onondaga Avenue) and R-80 (Orange Grove Road). Overall, this reach has lost a net volume of -205,857 cubic yards since 1990 (net inclusive of material placed during this monitoring period). The central portion of Reach 2 exhibits the most significant net long-term loss of volume within the Town and this reach is the only reach that exhibits a net long-term volumetric loss.
FDEP Strategic Beach Management Plan, June 2015
Strategy: Maintain the Town’s restored projects through monitoring and nourishment using sand from offshore sources and upland sources; construct a feeder beach to reestablish littoral transport for Reach 2; and construct restoration projects in environmentally suited areas of Reach 5 and Reach 8. Comply with BMA (2013).
Comprehensive Coastal Management Plan, 1998 Update
Because of high erosion rates in Reach 2, supplemental sand placement must occur.
Reach 2 Related Shore Protection Board Recommended Actions, November 2009
Sand Transfer Plant, Phase II - Installation of a second discharge to be located in Reach 2, south of Reef Road.
STATUS: FDEP BMA signed by all applicable parties. State permit authorization for STP Phase II received with signed BMA. Federal permit authorization has not been received. The STP Phase II project is not expected to be moved forward for construction in the near future. Monitoring data will continue to be collected and analyzed to determine the necessity of the STP Phase II project. A sand forepassing project is planned from construction concurrently with the next Lake Worth Inlet Maintenance Dredging event with dry beach placement. The USACE anticipates the next dry beach placement project will occur in the winter of 2017. Monitoring the result of the sand forepassing project will determine the likely effectiveness of a second STP discharge.
294

Coastal Management Fund FY2018
Groin Analysis - Following the Groin Assessment performed, a Town consultant analyzed the functionality of the Town’s groin system. A revised plan to prioritize rehabilitation is to be developed for Town Council consideration.
STATUS: Report received in February 2015. Groin rehabilitation is included in the SPB's most recent 10-year plan. In September 2012, a peer review of a consultant proposed “Coastal Structures Plan” was performed. The recommendations from the peer review include the initiation of a Groin Rehabilitation Program as a long-term capital improvement project. Groin Rehabilitation for Reaches 2-6 is currently in the Federal permitting process.
Maintenance Dredge Sand Permitting, Placement Extension - Previous maintenance dredging events performed by the U.S. Corps of Engineers have been conducted under an agreement with the Town of Palm Beach to place sand on the dry beach at the incremental cost versus placing the sand in the nearshore. The dry beach placement has been restricted to Reach 1 and the northern portion of Reach 2. The SPB would like to expand the dry beach placement areas to include other sections of Town, such as the remainder of Reach 2.
STATUS: The USACE has received State permit authorization to renew their existing permit for inlet maintenance activities. Details of the renewal include the placement of sand further to the south into Reach 2 to approximately R-80. The next Lake Worth Inlet Maintenance Dredging project with dry beach placement is expected to include placement south to R-80. An EIS will likely need to be completed to extend the dry beach placement area beyond the current limits of placement near R-80.
Reach 3 (EL MIRASOL TO VIA BETHESDA) Current Action
Continued Physical Monitoring and implementation of BMA-required monitoring.
Continued evaluation and monitoring of existing coastal structures as requested by the SPB.
Beach Nourishment construction was completed in April 2015.
2016 Townwide Physical Monitoring Report, February 2017
Reaches 3 & 4
This segment comprises both the north and south segments of the Mid-Town Beach Renourishment Project. Over this monitoring period this reach has exhibited a net shoreline recession of -36.7 feet. Recession was most significant within the central portion of the area from R-95 (Via Bethesda) to R-100 (Via Marina). A maximum recession of -167 feet occurred at R-96 in the vicinity of Clarke Avenue. A portion of the recession observed is attributable to anticipated adjustment of the constructed beach profile from the 2015 Mid-Town nourishment project. The observed magnitude, however, is significantly greater than anticipated project related cross-shore adjustment.
This segment exhibited a net volumetric loss of 20,436 cubic yards. A prominent area of volumetric loss occurred between R-92 (Seminole Avenue) and R-98 (Chilean Avenue) within the area encompassing the Breakers Complex, Clarke Avenue, and the northern portions of the Mid-Town public beach. In total, the volumetric loss in the area was on the order of
295

Coastal Management Fund FY2018
132,578 cubic yards. These losses were largely balanced by significant gains to the immediate south within the southern portion of the Mid-Town shoreline segment. This behavior suggests a prominent shift in volume from the central portions of the reach to the immediate south over this monitoring period.
Since 1990, this shoreline segment has exhibited a net increase in volume of 1,278,561 cubic yards and an average advance in shoreline position of 54.7 feet due to direct sand placement. These significant gains are directly attributable to repeated renourishment efforts within this area. These gains occur throughout this shoreline segment including the areas of noted recession within this monitoring period.
FDEP Strategic Beach Management Plan, June 2015
Strategy: Maintain the Town’s restored projects through monitoring and nourishment using sand from offshore sources and upland sources.
Comprehensive Coastal Management Plan, 1998 Update
The management solution for Reach 3 is beach restoration to occur simultaneously with the renourishment of the Mid-Town project.
Reach 3 Related Shore Protection Board Recommended Actions, November 2009
Beach Nourishment Permitting - The permitting for the next beach project in Mid-Town is scheduled to begin in 2012, with expected construction in Winter of 2013/Spring of 2014.
STATUS: Construction was completed in April 2015.
Groin Analysis - Following the Groin Assessment performed, a Town consultant analyzed the functionality of the Town’s groin system. A plan to prioritize rehabilitation was developed for SPB consideration.
STATUS: Report received in February 2015. Groin rehabilitation is included in the SPB's most recent 10-year plan. In September 2012, a peer review of a consultant proposed “Coastal Structures Plan” was performed. The recommendations from the peer review include the initiation of a Groin Rehabilitation Program as a long-term capital improvement project. Groin Rehabilitation for Reaches 2-6 is currently in the Federal permitting process.
Reach 4 (VIA BETHESDA TO 270 FEET SOUTH OF BANYAN ROAD) Current Action
Continued Physical Monitoring and implementation of BMA-required monitoring.
Continued evaluation and monitoring of existing coastal structures as requested by the SPB.
Beach Nourishment construction was completed in April 2015.
296

Coastal Management Fund FY2018
2016 Townwide Physical Monitoring Report, February 2017
Reaches 3 & 4
This segment comprises both the north and south segments of the Mid-Town Beach Renourishment Project. Over this monitoring period this reach has exhibited a net shoreline recession of -36.7 feet. Recession was most significant within the central portion of the area from R-95 (Via Bethesda) to R-100 (Via Marina). A maximum recession of -167 feet occurred at R-96 in the vicinity of Clarke Avenue. A portion of the recession observed is attributable to anticipated adjustment of the constructed beach profile from the 2015 Mid-Town nourishment project. The observed magnitude, however, is significantly greater than anticipated project related cross-shore adjustment.
This segment exhibited a net volumetric loss of 20,436 cubic yards. A prominent area of volumetric loss occurred between R-92 (Seminole Avenue) and R-98 (Chilean Avenue) within the area encompassing the Breakers Complex, Clarke Avenue, and the northern portions of the Mid-Town public beach. In total, the volumetric loss in the area was on the order of 132,578 cubic yards. These losses were largely balanced by significant gains to the immediate south within the southern portion of the Mid-Town shoreline segment. This behavior suggests a prominent shift in volume from the central portions of the reach to the immediate south over this monitoring period.
Since 1990, this shoreline segment has exhibited a net increase in volume of 1,278,561 cubic yards and an average advance in shoreline position of 54.7 feet due to direct sand placement. These significant gains are directly attributable to repeated renourishment efforts within this area. These gains occur throughout this shoreline segment including the areas of noted recession within this monitoring period.
FDEP Strategic Beach Management Plan, June 2015
Strategy: Maintain the Town’s restored projects through monitoring and nourishment using sand from offshore sources and upland sources.
Comprehensive Coastal Management Plan, 1998 Update
The management solution is the renourishment of the Mid-Town project. The Mid-Town groin field should be inspected and maintained to support to the beachfill project.
Reach 4 Related Shore Protection Board Recommended Actions, November 2009
FEMA Dune/Beach Sand - To be conducted simultaneously with the FEMA project in Reach 7, the Mid-Town beach (Clarke Avenue Beach to the south end of the Municipal Beach) will receive sand appreciable to the losses attributed from Tropical Storm Fay.
The dune project will serve as an interim measure until the next Mid-Town renourishment project is constructed. The Shore Protection Board is requesting an appropriation in the
proposed FY 2011 coastal budget to begin the permitting effort for beach renourishment in Mid-Town.
STATUS: Construction was completed in January 2011.
297

Coastal Management Fund FY2018
Beach Nourishment Permitting - The permitting for the next beach project in Mid-Town began in 2012, with expected construction in late 2013/early 2014.
STATUS: Construction was completed in April 2015.
Reach 5 (270 FEET SOUTH OF BANYAN ROAD TO 170 FEET NORTH OF WIDENER’S CURVE) Reach 5 continues to benefit from repeated restorations of Reaches 3 and 4.
Current Action
Continued evaluation and monitoring of existing coastal structures as requested by the SPB.
Continue physical monitoring per BMA-requirement.
2016 Townwide Physical Monitoring Report, February 2017
Reach 5
Over the current monitoring period, Reach 5 has experienced a net average shoreline advance of 12.6 feet with gains occurring over most of the reach. The reach exhibited a net volumetric gain of 272,623 cubic yards with greater gains in the northern portion of the reach. Gains were most significant in the nearshore from MHW to a depth of 13.1 feet.
Long term, this area has experienced a net shoreline advance of 55.4 feet since 1990 and has gained approximately 842,927 cubic yards (above -26.2 feet NAVD) throughout the entire shoreline segment. Gains in shoreline position and volume are directly attributable to the movement of material into Reach 5 from the Mid-Town beach projects within Reaches 3 and 4. These net positive trends are likely to continue due to the availability of sand within theMid-Town segment to the immediate north. Lacking regular nourishment of the Mid-Townproject, this reach would likely revert to a net erosion/recession condition consistent withconditions present prior to the initiation of the beach nourishment program.
FDEP Strategic Beach Management Plan, June 2015
Strategy: Construct restoration projects in environmentally suited areas of Reach 5 and Reach 8. Comply with BMA (2013).
Comprehensive Coastal Management Plan, 1998 Update
Proposed improvements include beach fill and a groin field at the south terminus of the reach.
Reach 5 Related Shore Protection Board Recommended Actions, November 2009
Groin Analysis - Following the Groin Assessment performed, a Town consultant analyzed the functionality of the Town’s groin system. A plan to prioritize rehabilitation was developed for SPB consideration.
STATUS: Report received in February 2015. Groin rehabilitation is included in the SPB's most recent 10-year plan. In September 2012, a peer review of a consultant
298

Coastal Management Fund FY2018
proposed “Coastal Structures Plan” was performed. The recommendations from the peer review include the initiation of a Groin Rehabilitation Program as a long-term capital improvement project. Groin Rehabilitation for Reaches 2-6 is currently in the Federal permitting process.
Dune Restoration – The SPB recognizes that Reach 5 has maintained a healthy beach due to the sand moving down from Reaches 3 and 4. The SPB may recommend adding sand into the beach and dune system in Reach 5. Placement of sand in the form of dunes will create a line of defense for the beachfront owners to improve the storm protection to South Ocean Boulevard. This action will add more sand to naturally be added into the littoral drift during a storm event, eventually bringing sand into the Reach 6 area.
STATUS: Physical Monitoring is to continue, per BMA-requirement. No dune restoration projects are planned for Reach 5 per the most recent 10-Year Plan for the Coastal Management Program (for FY18).
Reach 6 (170 FEET NORTH OF WIDENER'S CURVE TO SLOAN'S CURVE) Current Action
Continued evaluation and monitoring of existing coastal structures as requested by the SPB.
Continue physical monitoring.
2016 Townwide Physical Monitoring Report, February 2017
Reach 6
Over the most recent monitoring period, Reach 6 exhibited a net shoreline advance of 3.8 feet with gains and losses occurring throughout the reach. Reach 6 exhibited a net gain (above -26.2 feet NAVD) of 4,197 cubic yards. Losses are only observed between R-113 and R-115. Since 1990, Reach 6 has exhibited a net shoreline advance of 49.4 feet and volumetric gain of 456,328 cubic yards (above -26.5 feet NAVD).
In general, Reach 6 has remained stable with a long-term trend of shoreline advance and volumetric gains. Much of this behavior can be attributed to the downdrift effect of the Mid-Town nourishment projects which have provided a sediment source to both Reaches 5 and 6. The monitoring data suggests that the functional limit of this beneficial downdrift effect occurs within Reach 6, in the vicinity of the FDOT revetment (between R-111 [Ocean View Road] and R-116 [Sloan’s Curve]). This trend will likely continue in the short to medium term due to thecontinued migration of sand form the 2015 Mid-Town Nourishment Project to the south.
FDEP Strategic Beach Management Plan, June 2015
Strategy: Maintain the Town’s restored projects through monitoring and nourishment using sand from offshore sources and upland sources; construct a feeder beach to reestablish littoral transport for Reach 2; and construct restoration projects in environmentally suited areas of Reach 5 and Reach 8. Comply with BMA (2013).
299

Coastal Management Fund FY2018
Comprehensive Coastal Management Plan, 1998 Update
Due to high longshore transport energies evident in this Reach, coupled with the large trough located between 70 and 350 feet from shore and the extensive hardbottom resources, direct placement of sand in this shoreline segment is not recommended.
Reach 6 Related Shore Protection Board Recommended Actions, November 2009
Groin Analysis - Following the Groin Assessment performed, a Town consultant analyzed the functionality of the Town’s groin system. A plan to prioritize rehabilitation was developed for SPB consideration.
STATUS: Report received in February 2015. Groin rehabilitation is included in the SPB's most recent 10-year plan. In September 2012, a peer review of a consultant proposed “Coastal Structures Plan” was performed. The recommendations from the peer review include the initiation of a Groin Rehabilitation Program as a long-term capital improvement project. Groin Rehabilitation for Reaches 2-6 is currently in the Federal permitting process.
Dune Restoration - Because of the limited amount of sand going into Reach 7 from Reach 6, the condition of the Reach 7 beaches is a SPB concern. With most of the Reach 6 shoreline consisting of nearshore hardbottom resources, a beach nourishment project is not practical. A thought to be considered by the SPB is to cover the revetment with sand, or place dune sand east of the revetment where the opportunity presents itself. Creating a more natural beach and dune profile in Reach 6 may provide a volume of sand during storm events to assist the north end of Reach 7 with storm recovery.
STATUS: Physical Monitoring is to continue, per BMA-requirement. No dune restoration projects are planned for Reach 6 per the most recent 10-Year Plan for the Coastal Management Program (for FY18).
Reach 7 (SLOAN'S CURVE TO THE LAKE WORTH MUNICIPAL PIER) The Shore Protection Board has made the Reach 7 beaches a top priority for additional coastal management activities.
Current Action
Continue Physical Monitoring per BMA-requirement. Construction of a FY 2014 Partial Beach Nourishment and Dune Restoration Project in Reach 7 was completed in 2015. Full beach nourishment in Reach 7 was completed in the spring of 2016.
2016 Townwide Physical Monitoring Report, February 2017
Reach 7
A major renourishment of the Phipps/Reach 7 area was completed during this monitoring period. This project encompassed all of Reach 7 and included the placement of 1,022,318 cubic yards of sand from a nearshore borrow source. This value does not include stockpiled sand that was utilized for dune construction in Reaches 3 and 8 as part of this nourishment effort.
300

Coastal Management Fund FY2018
Over this monitoring period, the Reach 7 shoreline experienced a net advancement of 119.0 feet with significant gains throughout the reach. Over this monitoring period, Reach 7 gained a net volume of 1,135,581 cubic yards with the greatest gains occurring in the vicinity of Phipps Ocean Park. This gain is attributable to the direct placement of material within the reach.
Since 1990, Reach 7 has exhibited a net average advance of 114.4 feet. The reach has exhibited a net volumetric gain of 1,641,614 cubic yards since 1990. Gains have occurred throughout the reach and are attributable to both the 2016 nourishment effort and a residual volume of sand remaining in the reach from the 2006 nourishment event.
FDEP Strategic Beach Management Plan, June 2015
Strategy: Maintain the Town’s restored projects through monitoring and nourishment using sand from offshore sources and upland sources; construct a feeder beach to reestablish littoral transport for Reach 2; and construct restoration projects in environmentally suited areas of Reach 5 and Reach 8. Comply with BMA (2013).
Comprehensive Coastal Management Plan, 1998 Update
Beach fill project and the construction of a groin field.
Reach 7 Related Shore Protection Board Recommended Actions, November 2009
FEMA Dune/Beach Sand - Constructed simultaneously with the FEMA project in Reach 4.
The dune project will serve as an interim measure until the next Phipps Ocean Park nourishment project is constructed.
STATUS: 2011 Dune Restoration Construction completed between January 2011 and March 2011. Physical and environmental monitoring continues to be conducted.
Beach Nourishment - The 2006 beach restoration project life interval was interrupted by the tropical systems in 2007 and 2008. The SPB recommends renourishment of the 2006 project.
STATUS: A full nourishment of Reach 7 was completed in April 2016.
Reach 8 (LAKE WORTH MUNICIPAL TO LA BONNE VIE CONDOMINIUM) Based on the Final Order by Administrative Law Judge Robert Meale, FDEP Secretary Michael Sole issued a denial of the Reach 8 beach restoration project in 2009.
Although the project was denied, the Town was able to secure the state cost-share funding until June 2011 through a grant amendment. The purpose of the time extension was to provide ample time to develop a revised project. A permit application for South End Palm Beach Restoration was submitted to the regulatory agencies in September 2010. With this project in the permitting phase, the Town will again seek a grant amendment to extend the life of the agreement through the anticipated construction.
A revised project was designed in an innovative stepped approach to strategically place sand and allow the natural movement of sand to help sustain a minimum beach profile in Reach 8. The Town has received positive feedback from the Surfrider Foundation regarding the revised project. The design and volume of the revised project is consistent with recommendations by
301

Coastal Management Fund FY2018
both Administrative Law Judge Robert Meale and the petitioners who opposed the Town in the previous Reach 8 beach project administrative hearing. (The Surfrider Foundation was the primary petitioner in that hearing.) The permit application for the revised proposed beach restoration project in Reach 8 was developed, and is currently on hold until receipt of the USACE-issued Record of Decision following publishing of the Federal-mandated EIS in 2016.
Current Action
2011 Dune Restoration Construction completed in March 2011 and project performance monitoring is being conducted.
South End Palm Beach Restoration, Permitting
Central Palm Beach County Comprehensive Erosion Control Project, Managed by Palm Beach County ERM, Environmental Impact Statement (EIS) in development.
Reach 8 has been designated as “Critically Eroded”, per FDEP.
2016 Townwide Physical Monitoring Report, February 2017
Reach 8
This reach exhibited a net volumetric gain of 117,507 cubic yards over this monitoring period with gains occurring everywhere except the southernmost portion of the reach (between R-133 [Atriums Condominium] and R-134 [La Bonne Vie Condominium]). Gains were most significant in the nearshore zone between MHW and a depth of 13.1 feet.
Since 1990, Reach 8 has exhibited a net average loss of -4.1 feet, though recession generally occurred at the north end of the reach and advancement was most prominent in the southern portions of the reach. Since 1990, the reach has exhibited a net gain of 105,175 cubic yards (to a depth of -26.2 feet NAVD). This net gain is attributable to the significant gains which occurred over this monitoring period and are likely attributable to migration of material into the reach from the 2016 Phipps/Reach 7 Nourishment Project.
FDEP Strategic Beach Management Plan, June 2015 Update
Strategy: Maintain the Town’s restored projects through monitoring and nourishment using sand from offshore sources and upland sources; construct a feeder beach to reestablish littoral transport for Reach 2; and construct restoration projects in environmentally suited areas of Reach 5 and Reach 8. Comply with BMA (2013).
Comprehensive Coastal Management Plan, 1998 Update
Beach fill project, and the construction of a groin field within the last 2,000 feet of Reach 8.
Reach 8 Related Shore Protection Board Recommended Actions, November 2009
FEMA Dune/Beach Sand - Constructed simultaneously with the FEMA project in Reach 4.
State and federal permitting has been underway and permits are expected to be received in time to construct a 25,000-cubic-yard dune project soon after November 1, 2010. Work needs to occur between November 1 and March 31 due to the sea turtle nesting season.
302

Coastal Management Fund FY2018
The dune project will serve as an interim measure until the potential Reach 8 beach restoration project is constructed.
STATUS: 2011 Dune Restoration Construction completed between January 2011 and March 2011. Physical and environmental monitoring continues to be conducted. Since 2011, dune restoration in Reach 8 has occurred in 2015 and 2016.
Beach Restoration - A small scale beach nourishment project in Reach 8.
STATUS: Permit application submitted in September 2010. In permitting. EIS was determined to be required by USACE for portions of the project south of the Lake Worth Pier. The Final EIS has been published. The Town is awaiting issuance of the Record of Decision from the USACE.
Critical Beach Erosion Designation - The entire Town shoreline is considered “critically eroded” by the state, except for portions of Reach 8 south of the Lake Worth pier. Attempts have been made by Town consultants to have all of Reach 8 included in the “critically eroded” designation. Each attempt has resulted in the state failing to recognize this area as “critically eroded”, although this designation is provided for beaches immediately north and south of the non-designation.
STATUS: During the BMA process, the FDEP designated Reach 8 as critically eroded.
TOWN-WIDE
Regional Monitoring
The Regional Monitoring program is ongoing and currently includes annual aerial cartographic photography used to monitor nearshore hardbottom, topographic and bathymetric surveys to monitor current sand movement throughout the Town, and a sediment budget analysis that provides long-term tracking of sand movement throughout the Town. As of September 2013, the BMA was signed and will serve as a regional approach to managing the shoreline along Palm Beach Island.
Additional monitoring activities in FY16 budget include:
- Biological monitoring related to the engineered beach projects in Reaches 3, 4, and 7
- Townwide sea turtle monitoring
- Annual tilling of the beaches within the nourishment areas
If necessary, escarpment reductions on engineered beaches during sea turtle nesting season
REVIEW OF SHORE PROTECTION BOARD RECOMMENDED COASTAL MANAGEMENT PLAN
Following receipt of the Shore Protection Board’s (SPB) FY 2013 Coastal Management Program Budget and 10-Year Forecast, the Town Council requested that the Board’s
303
Coastal Management Fund FY2018
recommendation be independently peer reviewed. Woods Hole Group, Inc. (WHG) performed the peer review and provided their results and recommendations to Town Council in June 2013. Following the WHG recommendations, Town Council adopted a 10-Year Forecast that extends through FY 2023.
304

Coastal Management Fund FY2018
COASTAL MANAGEMENT FUND (309)
REVENUES Transfer from General Fund (001) This line item represents money transferred from the General Fund for the Coastal Program.
Interest on Investments The interest revenue is based upon the financial market conditions and funds available for investments.
Grants/Local Revenue FDEP/Federal Government reimbursement for beach projects and Environmental Impact Statement (EIS) activities.
EXPENSES Projects Budget update for 10 year Coastal Management Plan.
Carry Over Projects Projected unexpended project balances, authorized in prior years.
Transfer to Debt Service Principal and Interest repayment on 2013 Debt Issue.
Transfer to ACIP (314) Transfer of unexpended 2013 bond proceeds to the ACIP fund.
FY2015Actual
FY2016Actual
FY2017Budget
FY2017Projected
FY2018Budget
%Change
RevenuesTransfer from General Fund (001) 11,377,000 8,015,220 7,265,000 7,265,000 7,410,300 2.00%Interest on Investments 329,203 157,317 81,038 72,666 270,000 233.18%Grants/Local Revenue 325,413 2,541,573 - 148,556 6,400,000 100.00%TOTALS 12,031,616 10,714,110 7,346,038 7,486,222 14,080,300 91.67%ExpensesProjects 25,241,942 20,244,384 2,407,000 470,985 2,171,000 -9.80%Carry Over Projects - - - - 14,003,911 100.00%Transfer to Debt Service 734,613 731,163 731,413 731,413 736,038 0.63%Transfer to ACIP (314) - - - - 2,750,000 100.00%Salaries and Wages - - 142,278 143,685 169,540 19.16%Employee Benefits - - 64,124 62,697 67,510 5.28%Contractual - - 9,500 13,495 15,213 60.14%Commodities - - 1,600 2,382 4,100 156.25%Capital Outlay - - 800 - 1,963 145.38%TOTALS 25,976,555 20,975,547 3,356,715 1,424,657 19,919,275 493.42%Total Revenues Over/(Under) Expenses (13,944,939) (10,261,437) 3,989,323 6,061,565 (5,838,975) Beginning Fund Equity 38,017,024 24,072,085 13,810,648 13,810,648 19,872,213 ENDING NET ASSETS 24,072,085 13,810,648 17,799,971 19,872,213 14,033,238
Revenue and Expense Summary
305

Coastal Management Fund FY2018
Salaries and Wages The salary budget is derived from the payroll data for the Full Time Equivalent Employees (FTE) listed in the table below. The budget includes pay for performance increases and the approved increase in the ranges.
Employee Benefits The employee benefit costs include FICA, health insurance, retirement costs, any paid incentives and allowances, and the performance bonus. It also include the Town-wide employee health insurance program.
Contractual Contractual items include legal/consulting fees, travel, telephone and equipment maintenance
Commodities Commodities items include office supplies, membership dues and training expenses
Capital Outlay Annual depreciation costs
Full Time Equivalent Employees FY2014 FY2015 FY2016 FY2017 FY2018Coastal Projects Coordinator - 1.000 1.000 1.000 1.000 Engineering Tech Support Spec - - - 0.500 0.500 Communications Specialist - - - - 0.250
- 1.000 1.000 1.500 1.750
306

Coastal Management Fund FY2018
Fiscal Year 2018 Goals and Performance Measures
Public Works Goal #2 - Continue implementation of a long-term coastal protection plan
OBJECTIVES: • Continue pursuit of required Federal permits in accordance with BMA• Continue BMA and permit required monitoring• Construct shore protection projects in accordance with the 10-year long
term plan
Performance Measures
Effectiveness/Output Measures: Actual FY14
Actual FY15
Actual FY16
Actual FY17
Projected FY18
Participate in cost allocation modeling to determine funding process N/A N/A N/A N/A N/A
Continue to pursue required permits in accordance with the BMA Ongoing Ongoing Ongoing Ongoing Ongoing
Coastal Management Productivity Measures
Effectiveness/Output Measures: Actual FY14
Actual FY15
Actual FY16
Actual FY17
Projected FY18
Lake Worth Inlet Management Plan (volume in cubic yards) 58,000 54,500 91,600 146,300 100,000
Regulatory Required Monitoring/Compliance (No. of Events) 5 7* 7* 5 5
*Additional monitoring events for Pre- and Post-construction. Mid-Town in FY 2015; Phipps in FY 2016.
307

Tow
n of
Pal
m B
each
10-
Year
Coa
stal
Man
agem
ent P
rogr
am
EXPE
ND
ITU
RES
Item
#Pr
ojec
t Nam
eFY
201
7 Ap
prov
edFY
201
8 Ap
prov
edFY
201
9 Es
timat
edFY
202
0 Es
timat
edFY
202
1 Es
timat
edFY
202
2 Es
timat
edFY
202
3 Es
timat
edFY
202
4 Es
timat
edFY
202
5 Es
timat
edFY
202
6 Es
timat
edFY
202
7 Es
timat
ed1
APPL
Y AN
D U
PDAT
E IS
LAN
DWID
E SE
DIM
ENT
TRAN
SPO
RT A
NAL
YSIS
21,0
00$
22,0
00$
22,0
00$
23,0
00$
24,0
00$
24,0
00$
25,0
00$
26,0
00$
27,0
00$
28,0
00$
29,0
00$
2AN
NU
AL S
EDIM
ENT
REPO
RT (B
MA
REQ
UIR
ED)
47,0
00$
48,0
00$
50,0
00$
51,0
00$
53,0
00$
54,0
00$
56,0
00$
58,0
00$
59,0
00$
60,0
00$
63,0
00$
3SE
AWAL
L/LL
OD
FUN
CTIO
N/N
ON
-STR
UCT
URA
L IN
VEN
TORY
ASS
ESSM
ENT
& A
NAL
YSIS
-$
-
$
116,
000
$
-
$
-$
-
$
-$
-
$
-$
14
3,00
0$
-$
4
SEAW
ALL/
LLO
D RE
HABI
LITA
TIO
N/R
EPLA
CEM
ENT
-$
-
$
1,00
0,00
0$
1,00
0,00
0$
1,00
0,00
0$
1,00
0,00
0$
1,00
0,00
0$
1,00
0,00
0$
1,00
0,00
0$
1,00
0,00
0$
1,00
0,00
0$
5G
ROIN
ASS
ESSM
ENT
-$
-
$
70,0
00$
-$
-
$
-$
-
$
-$
-
$
86,0
00$
-$
6
GRO
IN R
EHAB
ILIT
ATIO
N-
$
-$
50
0,00
0$
500,
000
$
50
0,00
0$
500,
000
$
50
0,00
0$
500,
000
$
50
0,00
0$
500,
000
$
50
0,00
0$
7FL
OO
DIN
G A
ND
SLR
ASSE
SSM
ENT
50,0
00$
-$
-
$
-$
-
$
-$
-
$
-$
-
$
-$
-
$
8CO
MM
UN
ICAT
ION
S25
,000
$
-
$
-$
-
$
-$
-
$
-$
-
$
-$
-
$
-$
9
DUN
E VE
GET
ATIO
N M
AIN
TEN
ANCE
10,0
00$
10,0
00$
10,0
00$
10,0
00$
10,0
00$
10,0
00$
10,0
00$
10,0
00$
10,0
00$
13,0
00$
13,0
00$
10RE
GIO
NAL
SAN
D N
EEDS
/SAN
D SE
ARCH
-$
-
$
-$
-
$
-$
72
5,00
0$
725,
000
$
-
$
-$
-
$
-$
11
GEN
ERAL
CO
ASTA
L EN
GIN
EERI
NG
52,0
00$
54,0
00$
55,0
00$
57,0
00$
58,0
00$
60,0
00$
62,0
00$
64,0
00$
66,0
00$
69,0
00$
70,0
00$
12PH
YSIC
AL M
ON
ITO
RIN
G (N
ON
-PRO
JECT
ARE
AS)
75,0
00$
77,0
00$
79,0
00$
82,0
00$
84,0
00$
86,0
00$
89,0
00$
92,0
00$
94,0
00$
97,0
00$
100,
000
$
13
BMA
SEA
TURT
LE N
ESTI
NG
MO
NIT
ORI
NG
200,
000
$
22
0,00
0$
220,
000
$
22
0,00
0$
220,
000
$
22
0,00
0$
242,
000
$
24
2,00
0$
242,
000
$
24
2,00
0$
242,
000
$
14
BMA
BIO
LOG
ICAL
MO
NIT
ORI
NG
206,
000
$
21
3,00
0$
219,
000
$
22
6,00
0$
232,
000
$
23
9,00
0$
246,
000
$
25
4,00
0$
261,
000
$
26
9,00
0$
277,
000
$
15
COAS
TAL
MAN
AGEM
ENT
PRO
GRA
M O
PERA
TIN
G E
XPEN
SES
218,
302
$
25
8,32
6$
263,
493
$
26
8,76
2$
274,
138
$
27
9,62
0$
285,
213
$
29
0,91
7$
296,
735
$
30
2,67
0$
232,
000
$
16
ANN
UAL
DEB
T SE
RVIC
E PA
YMEN
T73
1,41
3$
736,
038
$
73
5,03
8$
733,
038
$
73
3,53
8$
733,
913
$
73
5,53
8$
731,
538
$
73
1,91
3$
731,
538
$
73
1,53
8$
17SA
ND
TRAN
SFER
OPE
RATI
NG
-$
-
$
-$
-
$
-$
-
$
-$
-
$
-$
-
$
-$
18
MAI
NTE
NAN
CE D
REDG
ING
, SAN
D PL
ACEM
ENT
EXTE
NSI
ON
(EIS
)-
$
-$
-
$
-$
-
$
-$
-
$
-$
-
$
-$
-
$
19LW
I IM
P PH
YSIC
AL M
ON
ITO
RIN
G20
,000
$
21
,000
$
21
,000
$
22
,000
$
23
,000
$
23
,000
$
24
,000
$
25
,000
$
25
,000
$
26
,000
$
27
,000
$
20
BEAC
H TI
LLIN
G (R
EACH
ES 1
AN
D 2)
5,00
0$
5,
000
$
5,00
0$
5,
000
$
5,00
0$
5,
000
$
5,00
0$
5,
000
$
5,00
0$
6,
500
$
6,50
0$
21
ESCA
RPM
ENT
REM
OVA
L (R
EACH
ES 1
AN
D 2)
5,00
0$
5,
000
$
5,00
0$
5,
000
$
5,00
0$
5,
000
$
5,00
0$
5,
000
$
5,00
0$
6,
500
$
6,50
0$
22
N.O
CEAN
BLV
D. S
EAW
ALL
REPL
ACEM
ENT
-$
-
$
-$
-
$
-$
-
$
-$
-
$
-$
-
$
-$
23
SAN
D FO
REPA
SSIN
G-
$
600,
000
$
-
$
620,
000
$
-
$
660,
000
$
-
$
700,
000
$
-
$
742,
000
$
-
$
24M
ID-T
OW
N B
EACH
REN
OU
RISH
MEN
T CO
NST
RUCT
ION
-$
-
$
3,48
3,64
0$
-$
17
,850
,000
$
-
$
-$
-
$
-$
-
$
-$
25
MID
-TO
WN
BEA
CH R
ENO
URI
SHM
ENT
PERM
ITTI
NG
-$
-
$
100,
000
$
-
$
-$
-
$
-$
-
$
-$
-
$
-$
26
OBT
AIN
FED
ERAL
CO
ST-S
HARE
FO
R M
ID-T
OW
N-
$
500,
000
$
50
0,00
0$
500,
000
$
-
$
-$
-
$
-$
-
$
-$
-
$
27M
ID-T
OW
N P
HYSI
CAL
MO
NIT
ORI
NG
40,0
00$
41,0
00$
42,0
00$
43,0
00$
45,0
00$
46,0
00$
47,0
00$
49,0
00$
50,0
00$
51,5
00$
53,0
00$
28M
ID-T
OW
N M
ITIG
ATIO
N -
CORA
L N
URS
ERY/
TRAN
SPLA
NTA
TIO
N20
0,00
0$
200,
000
$
20
0,00
0$
200,
000
$
20
0,00
0$
200,
000
$
20
0,00
0$
-$
-
$
-$
-
$
29M
ID-T
OW
N M
ITIG
ATIO
N -
ARTI
FICI
AL R
EEF
CON
STRU
CTIO
N-
$
-$
-
$
-$
-
$
-$
-
$
-$
-
$
-$
-
$
30BE
ACH
TILL
ING
(MID
-TO
WN
)5,
000
$
5,00
0$
5,
000
$
5,00
0$
5,
000
$
5,00
0$
5,
000
$
5,00
0$
5,
000
$
6,50
0$
6,
500
$
31ES
CARP
MEN
T RE
MO
VAL
(MID
-TO
WN
)5,
000
$
5,00
0$
5,
000
$
5,00
0$
5,
000
$
5,00
0$
5,
000
$
5,00
0$
5,
000
$
6,50
0$
6,
500
$
32PH
IPPS
OCE
AN P
ARK/
REAC
H 7
BEAC
H N
OU
RISH
MEN
T CO
NST
RUCT
ION
-$
-
$
1,92
6,07
9$
-$
2,
300,
000
$
-
$
-$
21
,800
,000
$
-
$
-$
-
$
33PH
IPPS
PHY
SICA
L M
ON
ITO
RIN
G29
,000
$
30
,000
$
31
,000
$
32
,000
$
33
,000
$
34
,000
$
35
,000
$
36
,000
$
37
,000
$
38
,000
$
39
,000
$
34
BEAC
H TI
LLIN
G (R
EACH
7)
5,00
0$
5,
000
$
5,00
0$
5,
000
$
5,00
0$
5,
000
$
5,00
0$
5,
000
$
5,00
0$
6,
500
$
6,50
0$
35
ESCA
RPM
ENT
REM
OVA
L (R
EACH
7)
5,00
0$
5,
000
$
5,00
0$
5,
000
$
5,00
0$
5,
000
$
5,00
0$
5,
000
$
5,00
0$
6,
500
$
6,50
0$
36
REAC
H 8
EIS
-$
-
$
-$
-
$
-$
-
$
-$
-
$
-$
-
$
-$
37
SOU
TH E
ND
PALM
BEA
CH R
ESTO
RATI
ON
PER
MIT
TIN
G-
$
-$
-
$
-$
-
$
-$
-
$
-$
-
$
-$
-
$
38SO
UTH
EN
D PA
LM B
EACH
RES
TORA
TIO
N (I
NIT
IAL
CON
STRU
CTIO
N)
-$
-
$
-$
-
$
-$
-
$
-$
-
$
-$
-
$
-$
39
REAC
H 8
DUN
E RE
STO
RATI
ON
-$
-
$
-$
-
$
-$
-
$
-$
-
$
-$
-
$
-$
40
REAC
H 8
CON
STRU
CTIO
N A
CCES
S EA
SEM
ENT
AND
SITE
RES
TORA
TIO
N-
$
-$
-
$
-$
80
,000
$
-
$
-$
80
,000
$
-
$
-$
-
$
41RE
ACH
8 DU
NE/
BEAC
H CO
NST
RUCT
CO
NCU
RREN
TLY
WIT
H M
ID-T
OW
N O
R PH
IPPS
-$
-
$
-$
-
$
2,50
0,00
0$
-$
-
$
2,75
0,00
0$
-$
-
$
-$
42
REAC
H 8
BIO
LOG
ICAL
MO
NIT
ORI
NG
52,0
00$
54,0
00$
55,0
00$
57,0
00$
58,0
00$
60,0
00$
62,0
00$
64,0
00$
66,0
00$
68,0
00$
70,0
00$
43RE
ACH
8 PH
YSIC
AL M
ON
ITO
RIN
G29
,000
$
30
,000
$
31
,000
$
32
,000
$
33
,000
$
34
,000
$
35
,000
$
36
,000
$
37
,000
$
38
,000
$
39
,000
$
44
REAC
H 8
PRO
JECT
EN
GIN
EERI
NG
REP
ORT
11,0
00$
11,0
00$
11,0
00$
12,0
00$
12,0
00$
12,0
00$
13,0
00$
13,0
00$
14,0
00$
14,0
00$
15,0
00$
45BE
ACH
TILL
ING
(REA
CH 8
)5,
000
$
5,00
0$
5,
000
$
5,00
0$
5,
000
$
5,00
0$
5,
000
$
5,00
0$
5,
000
$
6,50
0$
6,
500
$
46ES
CARP
MEN
T RE
MO
VAL
(REA
CH 8
)5,
000
$
5,00
0$
5,
000
$
5,00
0$
5,
000
$
5,00
0$
5,
000
$
5,00
0$
5,
000
$
6,50
0$
6,
500
$
Tota
l2,
056,
715
$
3,
165,
364
$
9,
780,
250
$
4,
728,
800
$
26
,362
,676
$
5,
040,
533
$
4,
431,
751
$
28
,861
,455
$
3,
556,
648
$
4,
570,
708
$
3,
552,
538
$
308

Town of Palm Beach
Worth Avenue Assessment District (311)


Worth Avenue Maintenance Fund FY2018
WORTH AVENUE MAINTENANCE FUND (311)
REVENUES Special Assessment Revenue Non Ad Valorem Revenue collected from property owners for Worth Avenue special assessments.
Interest on Investments The interest revenue is based upon the financial market conditions and funds available for investment.
Donations/Miscellaneous Represents donations received for Worth Avenue maintenance.
EXPENSES Maintenance Costs Annual maintenance costs for Worth Avenue. Includes budget for a Living Wall Renovation Project, funded with reserves.
FY2015Actual
FY2016Actual
FY2017Budget
FY2017 Projected
FY2018Budget
%Change
RevenuesSpecial Assessment Revenue 229,988 238,544 247,342 231,827 258,638 4.57%Interest on Investments 376 972 700 2,455 700 0.00%Donations/Miscellaneous 10,000 10,000 5,000 5,000 5,000 0.00%TOTALS 240,364 249,516 253,042 239,282 264,338 4.46%ExpensesMaintenance Costs 204,257 220,277 274,782 260,336 328,638 19.60%TOTALS 204,257 220,277 274,782 260,336 328,638 19.60%Total Revenues Over/(Under) Expenses 36,107 29,239 (21,740) (21,054) (64,300) Beginning Fund Equity 310,533 346,640 375,879 375,879 354,825 ENDING NET ASSETS 346,640 375,879 354,139 354,825 290,525
Revenue and Expense Summary
309

(This page intentionally left blank)
310

Town of Palm Beach
Accelerated Capital Fund (314)


2013 Accelerated Capital Fund FY2018
2013 ACCELERATED CAPITAL FUND (314)
REVENUES Interest on Investments Interest revenue is based upon the financial market conditions and funds available for investment
Transfer from Coastal Transfer of unexpended 2013 Bond Funds, originally earmarked for groins/seawalls, from the Coastal Fund
Transfer from ACIP Phase I Transfer of unexpended 2010 Bond Funds
Donations/Grants Contributions and grants received for the Town Hall Historic Square District Project
EXPENSES Projects A detailed schedule of projects follows on the next page
Carry Over Projects Projected unexpended project balances, authorized in prior years
Transfers to Other Funds Transfer of bond proceeds to Coastal and Recreation Funds
FY2015Actual
FY2016Actual
FY2017Budget
FY2017Projected
FY2018Budget
%Change
RevenuesInterest on Investments 198,257 157,854 50,000 145,804 50,000 0.00%Transfer from Coastal 309 - - - - 2,750,000 100.00%Transfer from ACIP Phase I 3,486,049 - - - - 0.00%Donations/Grants 359,000 1,563,500 - - - 0.00%TOTALS 4,043,306 1,721,354 50,000 145,804 2,800,000 5500.00%ExpensesProjects 12,274,445 16,326,772 8,659,281 5,634,000 12,156,186 40.38%Carry Over Projects - - - - 5,462,321 100.00%Transfers to Other Funds 148,012 - - - - 0.00%TOTALS 12,422,457 16,326,772 8,659,281 5,634,000 17,618,507 103.46%Total Revenues Over/(Under) Expenses (8,379,151) (14,605,418) (8,609,281) (5,488,196) (14,818,507) Beginning Fund Equity 43,347,076 34,967,925 20,362,507 20,362,507 14,874,311 ENDING NET ASSETS 34,967,925 20,362,507 11,753,226 14,874,311 55,804
Revenue and Expense Summary
311

TOWN OF PALM BEACH
ACCELERATED CAPITAL IMPROVEMENT PROGRAM - 2013 BOND SERIES
MASTER LEDGER - SEPTEMBER 2017
Original 2013
Cost Estimate
Current
Project Budget
Amount Paid
to-date
Balance
Encumbered
Funds Not
Encumbered
1.3 WPB Shared Force Main Lining -$ 3,825,000$ 3,400,000$ -$ 425,000$
1.4 Australian Avenue Sanitary Sewer Modifications -$ 128,980$ 25,210$ 75,840$ 27,930$
1.6 G-1 Debris Transfer Station Sanitary Improvements -$ 260,000$ -$ -$ 260,000$
1.7 E-4 Sanitary Pump Station Improvements - Ridgeview Drive (Trail) (Construction) -$ 225,000$ -$ -$ 225,000$
1.8 E-1 Sanitary Pump Station Improvements - Mediterranean Road (Construction) -$ 270,000$ -$ -$ 270,000$
1.9 E-2 Sanitary Pump Station Improvements - Mockingbird Trail (Construction) -$ 305,000$ -$ -$ 305,000$
1.10 G-9 Sanitary Pump Station Improvements - Flag Pole Beach (Design) -$ 40,000$ -$ -$ 40,000$
1.11 E-3 Sanitary Pump Station Improvements - Garden Road (Trail) (Design) -$ 45,000$ -$ -$ 45,000$
1.12 A-4 the Breakers Sanitary Pump Station Improvements (Design) -$ 55,000$ -$ -$ 55,000$
1.13 A-5 Royal Poinciana Way (South of S-2) Sanitary Pump Station Improvements (Design) -$ 70,000$ -$ -$ 70,000$
5.1.1 North End Paving & Drainage (Onondaga Avenue) -$ 600,000$ 7,056$ 423,320$ 169,625$
5.6 Lake Trail Improvements from Royal Palm Way to Reef Road -$ 1,376,527$ 839,345$ 448,502$ 88,680$
5.7 La Puerta Way Drainage -$ 621,343$ 245,502$ 301,716$ 74,125$
5.10 Storm Drain Improvements Ibis Isle -$ 228,000$ 2,346$ 204,514$ 21,140$
5.11 D-16 Drainage Improvements - Jungle Road (Design) -$ 125,000$ -$ -$ 125,000$
5.12 D-18 Drainage Improvements - El Brillo Way (Design) -$ 124,000$ -$ -$ 124,000$
8.3 D-14 Four Art Plaza Pump Station Rehabilitation 5,065,000$ 5,065,000$ 223,619$ 671,443$ $ 4,169,938
9.3 400 Worth Avenue (Design and Construction) -$ 1,400,000$ -$ -$ $ 1,400,000
13 Ocean Outfall Abandonments 2,385,000$ 630,000$ 276,387$ 340,365$ 13,248$
17 Landfill/Facility Improvements 435,000$ 611,000$ 52,005$ 25,095$ 533,900$
21b ACIP Administration 625,000$ 600,000$ 288,846$ 231,304$ 79,850$
23 Mast Arm Replacements/Upgrades (Program) 2,362,500$ 320,314$ 132,670$ 15,452$ 172,192$
23.2 Clarke and Sunrise Mast Arms -$ 336,086$ 33,986$ -$ 302,100$
23.3 Pendleton and Cocoanut Row Mast Arms -$ 310,664$ 33,564$ -$ 277,100$
23.4 Seabreeze and Cocoanut Row Mast Arms -$ 562,867$ 60,767$ -$ 502,100$
23.5 Bradley Place Mast Arms -$ 346,569$ 54,469$ -$ 292,100$
26.3 Town Wide Street Light Replacements (Less Bradley & THS) -$ 2,873,000$ 2,202,719$ 388,915$ 281,366$
26.4 Street Lighting Upgrades - Bradley Place - Royal Poinciana Way to Wells Road -$ 309,000$ 29,298$ 260,594$ 19,108$
27 Street Lighting Upgrades - South Ocean/Sloan's To Lake 2,500,000$ 2,931,000$ 1,474,461$ 1,199,934$ 256,605$
28 General Engineering Services for ACIP Phase 2 -$ 20,000$ 19,046$ 954$ -$
29 Auditors Expenses -$ 25,000$ 9,500$ 246$ 15,254$
Sub-Total Phase 2 Projects 13,372,500$ 24,639,349$ 9,410,797$ 4,588,192$ 10,640,361$
1.1 E-6 Pump Station Improvements -$ -$ -$ -$ -$
5.1.2 North End Paving & Drainage (Monterey Rd & Orange Grove Rd) -$ 800,000$ -$ -$ -$
9.1 Midtown Drainage Improvements (D-6/D-7 Priority 1 Projects) -$ 940,000$ -$ -$ -$
9.2 Midtown Drainage Improvements (D-6/D-7 Priority 2 Projects) -$ 572,000$ -$ -$ -$
10 D-2 to D-9 Drainage Basin Interconnect - Construction 1,250,000$ 500,000$ -$ -$ -$
14 Coastal Structural Improvements 6,300,000$ 6,300,000$ -$ -$ -$
16 South/Central Fire Stations - Louver Doors 275,000$ -$ -$ -$ -$
20 ACIP Phasing Plan 27,500$ 27,500$ -$ -$ -$
24 Bradley Park Improvements (Fountain) 225,000$ 225,000$ -$ -$ -$
Sub-Total Deleted Projects 8,077,500$ 9,364,500$ -$ -$ -$
1 Sanitary Sewer Upgrades (Program) 2,000,000$ -$ -$ -$ -$
1.2 Sanitary Sewer Pump Station Improvement Assessment -$ 15,999$ 15,999$ -$ -$
1.5 E-8 Ejector Station Rehabilitation -$ 171,150$ 171,150$ -$ -$
2 North Flagler Drive Force Main 4,594,680$ 5,805,140$ 5,805,140$ -$ -$
3 E-3, Garden Rd to Cherry Ln, & E-2 Force Main Rehabilitation 956,418$ 1,254,703$ 1,254,703$ -$ -$
4 Sanitary Sewer Force Main Lining 2,540,000$ 3,113,511$ 3,113,511$ -$ -$
5 General Drainage/Curb & Gutter/Sidewalk ADA Improvements (Program) 7,584,000$ -$ -$ -$ -$
5.1 North End Paving & Drainage (Combined 5.1, 5.3, 5.5) -$ 2,417,686$ 2,248,536$ 122,718$ 46,432$
5.2 El Bravo Way, South Woods Rd, & La Puerta Way Drainage Improve. -$ 229,998$ 229,998$ -$ -$
5.4 Bradley Place - Royal Poinciana to Wells Improvements -$ 114,200$ 114,200$ -$ -$
5.8 Atlantic Avenue, Dunbar Road, Everglades Avenue, Southland Road Drainage
Improvements -$ 439,324$ 439,324$ -$ -$
5.9 North County Road Improvements (Wells to Miraflores) -$ 23,970$ 23,970$ -$ $ -
6 D-4/D-10 Pump Station Improvements (Construction) 5,883,000$ 8,531,117$ 8,068,050$ 11,913$ 451,155$
8 Stormwater Pump Station Rehabilitation (Program) 1,500,000$ -$ -$ -$ -$
8.1 Fuel Tank Replacements at D-8, D-14, and A-7 Pump Stations -$ 275,598$ 275,598$ -$ -$
8.2 Stormwater Pump Station Improvement Assessment -$ 22,000$ 22,000$ -$ -$
9 Midtown Drainage Improvements (combined 400 Block Worth Avenue & D-6 to D-7
Drainage Interconnects) - Design 625,000$ 59,963$ 59,963$ -$ -$
10 D-2 to D-9 Drainage Basin Interconnect - Design 1,250,000$ 86,629$ 86,629$ -$ -$
12 North Ocean Boulevard Seawall 5,600,000$ 6,083,683$ 6,083,683$ -$ -$
15 North Fire Station - Emergency Generator Replacement 215,000$ 218,864$ 218,864$ -$ -$
17.1 Public Works Maintenance Bay -$ 10,154$ 10,154$ -$ -$
18 Memorial Fountain Restoration 1,375,000$ 1,296,418$ 1,296,418$ -$ -$
19 Town Hall Square 4,325,000$ 4,691,724$ 4,030,638$ 401,706$ 259,379$
21a 21A CIP Administration 570,000$ 88,613$ 88,613$ -$ -$
23.1 Sunrise/Sunset and North County Mast Arms -$ 1,238,992$ 1,217,550$ 21,443$ -$
26 Street Lighting Improvements 1,750,000$ -$ -$ -$ -$
26.1 Town Hall Square Street Lighting Improvements -$ 235,894$ 235,894$ -$ -$
26.2 Southern Boulevard Bridge - Decorative Lighting Upgrades -$ 390,075$ 390,075$ -$ -$
30 Digital Utilities Atlas Update -$ 223,120$ 98,120$ 117,596$ 7,404$
Sub-Total Completed Projects 40,768,098$ 37,038,526$ 35,598,780$ 675,375$ 764,370$
CURRENT ACIP PROGRAM BUDGET 54,140,598$ 61,677,875$ 45,009,577$ 5,263,567$ 11,404,731$
2013 BOND SERIES 61,163,994$ 61,163,994$
CURRENT INTEREST -$
UNALLOCATED CONTINGENCY 7,023,396$ (513,881)$
Deleted Projects / Pay-GoDeleted Projects / Pay-GoDeleted Projects / Pay-GoDeleted Projects / Pay-Go
Program Project
Phase 2 ProjectsPhase 2 ProjectsPhase 2 ProjectsPhase 2 Projects
2013 Bond Series
Completed Construction ProjectsCompleted Construction ProjectsCompleted Construction ProjectsCompleted Construction Projects
Page 1 of 1 Updated through 9/30/2017312

PROJECT ENGINEER: J. Debrincat
CONSULTANT: Jacobs
CONTRACTOR: Lanzo Construction Co.
PROJECT LOCATION: Phase 2 Roebuck Road to East Central Regional Water Reclamation Facility
Source: City of West Palm Beach Public Utilities project website
Design
Procurement Phase 2
Pre-Construction
Construction Phase 1
Construction Phase 2
Construction is ongoing. Please refer to the City of West Palm
Beach Road Closures Webpages for more information. The
construction progress can be viewed under the City of West Palm
Beach Public Utilities website.
http://wpb.org/Departments/Public-Utilities/Capital-
Projects/Capital-Projects/48-Inch-PCCP-Force-Main-Renewal-(1)
Phase II construction is ongoing and anticipated to take
approximately nine (9) months to complete.
TOWN OF PALM BEACH ACCELERATED CAPITAL IMPROVEMENTS PROGRAM - PHASE 2
1.3 WEST PALM BEACH SHARED FORCE MAIN LINING
PROJECT DESCRIPTION: The Town of Palm Beach shares a 42”/48” sanitary sewer force main with the City of
West Palm Beach. This line is in desperate need of repair and the City of West Palm
Beach has undertaken the project and repairs will begin soon. This budget is for the
Town’s portion of the shared force main project, which is 22% of the total cost.
CURRENT ACTIVITIES WHAT'S COMING UP
Program Manager $425,000
- - $0
May 2016 Dec 2016 Spent to Date
Q2 2017 Q4 2017 $3,400,000
Remaining
- - $3,825,000
Q3 2016 Q1 2017 Amendments
SCHEDULE BUDGET
Begin Activity Activity Complete Current
Phase 2
Information as of 9/30/2017313

PROJECT ENGINEER: M. Roach
CONSULTANT: Mock Roos and Associates Inc.
CONTRACTOR: Hinterland Group, Inc.
PROJECT LOCATION: Australian Avenue
Design Previously Designed
Procurement/Council
Pre-Construction
Construction
Hold
TOWN OF PALM BEACH ACCELERATED CAPITAL IMPROVEMENTS PROGRAM - PHASE 2
1.4 AUSTRALIAN AVENUE SANITARY SEWER MODIFICATIONS
PROJECT DESCRIPTION: Modification of the gravity sewer pipe along Australian Avenue to correct a sag in the
pipe. The gravity sewer pipe is located in a heavily vegetative easement, which will
require the new pipe to be offset to reduce impacts to the landscape.
CURRENT ACTIVITIES WHAT'S COMING UP
Project is ongoing.Sewer modification has been completed. Contractor is
finalizing the parking lot modifications.
6/5/2017 10/31/2017 Spent to Date
SCHEDULE BUDGET
Begin Activity Activity Complete Current
1/9/2017 3/31/2017 Amendments
3/30/2017 4/30/2017 $0
Remaining
$128,980
Program Manager $103,770
5/10/2016 5/1/2017 $25,210
Information as of 9/30/2017314

PROJECT ENGINEER: J. Debrincat
CONSULTANT: Kimley-Horn and Associates
CONTRACTOR: TBD
PROJECT LOCATION: Pine Walk East of Cocoanut Row
Design
Procurement/Council
Pre-Construction
Construction
Hold
TOWN OF PALM BEACH ACCELERATED CAPITAL IMPROVEMENTS PROGRAM - PHASE 2
1.6 G-1 DEBRIS TRANSFER STATION SANITARY PUMP STATION IMPROVEMENTS (CONSTRUCTION)
PROJECT DESCRIPTION: This project was identified in the Townwide Wastewater Pump Station Condition Assessment
Report as requiring improvements. The improvements include upgrading the Pump Station to a
duplex station, constructing new wet well rails, valve vault and hatches. All of the electrical
equipment will be replaced with this project.
CURRENT ACTIVITIES WHAT'S COMING UP
Currently in design phase.
Assemble Bid package for procurement and present
construction award for approval to Town Council in February
2018.
SCHEDULE BUDGET
Begin Activity Activity Complete Current
3/17/2017 11/17/2017 $260,000
11/17/2017 2/13/2018 Amendments
2/26/2018 4/30/2018 $0
5/1/2018 9/7/2018 Spent to Date
$0
Remaining
Program Manager $260,000
WETWELL/DISCHARGE
Information as of 9/30/2017315

PROJECT ENGINEER: J. Debrincat
CONSULTANT: Kimley-Horn and Associates
CONTRACTOR: TBD
PROJECT LOCATION: Lake Trail and Ridgeview Drive
Design
Procurement/Council
Pre-Construction
Construction
Hold
TOWN OF PALM BEACH ACCELERATED CAPITAL IMPROVEMENTS PROGRAM - PHASE 2
1.7 E-4 SANITARY PUMP STATION IMPROVEMENTS (CONSTRUCTION)
PROJECT DESCRIPTION: This project was identified in the Townwide Wastewater Pump Station Condition Assessment
Report as requiring improvements. The improvements include upgrading the Pump Station to a
duplex station, constructing new wet well rails, valve vault and hatches. All of the electrical
equipment will be replaced with this project.
CURRENT ACTIVITIES WHAT'S COMING UP
Currently in design phase.
Assemble Bid package for procurement and present
construction award for approval to Town Council in February
2018.
SCHEDULE BUDGET
Begin Activity Activity Complete Current
3/17/2017 11/17/2017 $225,000
11/17/2017 2/13/2018 Amendments
2/26/2018 4/30/2018 $0
5/1/2018 9/7/2018 Spent to Date
$0
Remaining
Program Manager $225,000
PUMP IN WETWELL
Information as of 9/30/2017316

PROJECT ENGINEER: J. Debrincat
CONSULTANT: Kimley-Horn and Associates
CONTRACTOR: TBD
PROJECT LOCATION: Mediterranean Road and North Lake Way
Design
Procurement/Council
Pre-Construction
Construction
Hold
TOWN OF PALM BEACH ACCELERATED CAPITAL IMPROVEMENTS PROGRAM - PHASE 2
1.8 E-1 SANITARY PUMP STATION IMPROVMENTS (CONSTRUCTION)
PROJECT DESCRIPTION: This project was identified in the Townwide Wastewater Pump Station Condition Assessment
Report as requiring improvements. The improvements include upgrading the Pump Station to a
duplex station, constructing new wet well rails, valve vault and hatches. All of the electrical
equipment will be replaced with this project.
CURRENT ACTIVITIES WHAT'S COMING UP
Currently in design phase.
Assemble Bid package for procurement and present
construction award for approval to Town Council in February
2018.
SCHEDULE BUDGET
Begin Activity Activity Complete Current
3/17/2017 11/17/2017 $270,000
11/17/2017 2/13/2018 Amendments
2/26/2018 4/30/2018 $0
5/1/2018 9/7/2018 Spent to Date
$0
Remaining
Program Manager $270,000
PUMP IN WETWELL
Information as of 9/30/2017317

PROJECT ENGINEER: J. Debrincat
CONSULTANT: Kimley-Horn and Associates
CONTRACTOR: TBD
PROJECT LOCATION: North Lake Way
Design
Procurement/Council
Pre-Construction
Construction
Hold
TOWN OF PALM BEACH ACCELERATED CAPITAL IMPROVEMENTS PROGRAM - PHASE 2
1.9 E-2 SANITARY PUMP STATION IMPROVEMENTS (CONSTRUCTION)
PROJECT DESCRIPTION: This project was identified in the Townwide Wastewater Pump Station Condition Assessment
Report as requiring improvements. The improvements include upgrading the Pump Station to a
duplex station, constructing new wet well rails, valve vault and hatches. All of the electrical
equipment will be replaced with this project.
CURRENT ACTIVITIES WHAT'S COMING UP
Currently in design phase.
Assemble Bid package for procurement and present
construction award for approval to Town Council in February
2018.
SCHEDULE BUDGET
Begin Activity Activity Complete Current
3/17/2017 11/17/2017 $305,000
11/17/2017 2/13/2018 Amendments
2/26/2018 4/30/2018 $0
5/1/2018 9/7/2018 Spent to Date
$0
Remaining
Program Manager $305,000
VALVE VAULT
Information as of 9/30/2017318

PROJECT ENGINEER: J. Sanon
CONSULTANT: Kimley-Horn and Associates
CONTRACTOR: TBD
PROJECT LOCATION: South Ocean Boulevard at Chilean Avenue
Design
Procurement/Council
Pre-Construction
Construction
Hold $0
Remaining
Program Manager $40,000
11/1/2018 4/30/2019 $0
5/1/2019 10/1/2019 Spent to Date
11/27/2017 5/31/2018 $40,000
6/1/2018 10/30/2018 Amendments
Selecting consultant and presenting design proposal for approval at
the November Town Council meeting.Begin design phase.
SCHEDULE BUDGET
Begin Activity Activity Complete Current
TOWN OF PALM BEACH ACCELERATED CAPITAL IMPROVEMENTS PROGRAM - PHASE 2
1.10 G-9 SANITARY PUMP STATION IMPROVEMENTS (DESIGN)
PROJECT DESCRIPTION: The G-9 Pump Station Improvements project was identified in the Townwide Wastewater
Condition Assessment Report as requiring improvements. The improvements include
upgrading pumps to a more reliable duplex pump station. Also replace the piping and valves in
the wet well and valve vault, and upgrade the electrical panel.
CURRENT ACTIVITIES WHAT'S COMING UP
WETWELL
SITE VIEW
Information as of 9/30/2017319

PROJECT ENGINEER: J. Sanon
CONSULTANT: Kimley-Horn and Associates
CONTRACTOR: TBD
PROJECT LOCATION: Lake Trail South of Garden Road
Design
Procurement/Council
Pre-Construction
Construction
Hold $0
Remaining
Program Manager $45,000
11/1/2018 4/30/2019 $0
5/1/2019 10/1/2019 Spent to Date
11/27/2017 5/31/2018 $45,000
6/1/2018 10/30/2018 Amendments
Selecting consultant and presenting design proposal for approval at
the November Town Council meeting.Begin design phase.
SCHEDULE BUDGET
Begin Activity Activity Complete Current
TOWN OF PALM BEACH ACCELERATED CAPITAL IMPROVEMENTS PROGRAM - PHASE 2
1.11 E-3 SANITARY PUMP STATION IMPROVEMENTS (DESIGN)
PROJECT DESCRIPTION: The E-3 Pump Station Improvements project was identified in the Townwide Wastewater Pump
Station Condition Assessment Report as requiring improvements. The improvements include
replacing electric submersible pumps and pump rails. Add a sump pump, an odor control
system, new piping and valves, and replace the level control panel.
CURRENT ACTIVITIES WHAT'S COMING UP
Information as of 9/30/2017320

PROJECT ENGINEER: M. Roach
CONSULTANT: Kimley-Horn and Associates
CONTRACTOR: TBD
PROJECT LOCATION: Pine Walk East of South County Road
Design
Procurement/Council
Pre-Construction
Construction
Hold $0
Remaining
Program Manager $55,000
11/1/2018 4/30/2019 $0
5/1/2019 10/1/2019 Spent to Date
11/27/2017 5/31/2018 $55,000
6/1/2018 10/30/2018 Amendments
Selecting consultant and presenting design proposal for approval at
the November Town Council meeting.Begin design phase.
SCHEDULE BUDGET
Begin Activity Activity Complete Current
TOWN OF PALM BEACH ACCELERATED CAPITAL IMPROVEMENTS PROGRAM - PHASE 2
1.12 A-4 THE BREAKERS SANITARY PUMP STATION IMPROVEMENTS (DESIGN)
PROJECT DESCRIPTION: The A-4 Pump Station Improvements project was identified in the Townwide Wastewater
Condition Assessment Report as requiring improvements. The project is to replace the electric
submersible pumps and the pump rails. The scope also includes widening of the hatches with
double leaf stainless steel latches. The level control panel and the electrical service to the
station are to replaced.
CURRENT ACTIVITIES WHAT'S COMING UP
VALVE VAULT
Information as of 9/30/2017321

PROJECT ENGINEER: M. Roach
CONSULTANT: Kimley-Horn and Associates
CONTRACTOR: TBD
PROJECT LOCATION: Bradley Park
Design
Procurement/Council
Pre-Construction
Construction
Hold $0
Remaining
Program Manager $70,000
11/1/2018 4/30/2019 $0
5/1/2019 10/1/2019 Spent to Date
11/27/2017 5/31/2018 $70,000
6/1/2018 10/30/2018 Amendments
Selecting consultant and presenting design proposal for approval at
the November Town Council meeting.Begin design phase.
SCHEDULE BUDGET
Begin Activity Activity Complete Current
TOWN OF PALM BEACH ACCELERATED CAPITAL IMPROVEMENTS PROGRAM - PHASE 2
1.13 A-5 ROYAL POINCIANA WAY (SOUTH OF S-2) SANITARY PUMP STATION IMPROVEMENTS (DESIGN)
PROJECT DESCRIPTION: The A-45 Pump Station Improvements project was identified in the Townwide Wastewater
Condition Assessment Report as requiring improvements. The improvements include replacing
pumps number 1 and 2., Pump No. 2 discharge piping ; replacing the grating within the wet
well and replacing the level control panel. The Motor Control Center (MCC) will also be
replaced.
CURRENT ACTIVITIES WHAT'S COMING UP
PUMP IN BELOW GRADE DRY WELL
Information as of 9/30/2017322

PROJECT ENGINEER: J. Sanon
CONSULTANT: Chen Moore and Associates
CONTRACTOR: Johnson-Davis, Inc.
PROJECT LOCATION: Ridgeview Drive, Cherry Lane, and West Indies Drive.
Design
Procurement/Council
Pre-Construction
Construction
Hold
$169,150
Remaining
2/9/2016
2/9/2016 5/1/2016
5/1/2016 10/31/2016
Program Manager
8/1/2014 12/31/2014
Amendments
$0
Spent to Date
$2,248,536
11/1/2015
SCHEDULE BUDGET
Begin Activity Activity Complete
11/1/2014 8/30/2015
Current
$2,417,686
Project is complete.
TOWN OF PALM BEACH ACCELERATED CAPITAL IMPROVEMENTS PROGRAM - PHASE 2
5.1 NORTH END PAVING AND DRAINAGE IMPROVEMENTS
PROJECT DESCRIPTION:
CURRENT ACTIVITIES WHAT'S COMING UP
Drainage and pavement improvements to Ridgeview Drive, Cherry Lane, and West Indies Drive.
Improvements to these roadways include, roadway re-grading, restoration, curbs, new drainage
structures, and piping.
Cherry Ln. After Ridgeview Dr. After
W. Indies Dr. After
Information as of 9/30/2017323

PROJECT ENGINEER: J. Sanon
CONSULTANT: Kimley-Horn and Associates
CONTRACTOR: Burkhardt Construction, Inc.
PROJECT LOCATION: Onondaga Avenue between North Lake Way and North Ocean Boulevard
Design
Procurement/Council
Pre-Construction
Construction
Hold
CURRENT ACTIVITIES WHAT'S COMING UP
This project is included in the Townwide Undergrounding Phase 1 -
North.
Construction is scheduled in conjunction with the Townwide
Undergrounding Phase 1 - North and is currently ongoing.
TOWN OF PALM BEACH ACCELERATED CAPITAL IMPROVEMENTS PROGRAM - PHASE 2
5.1.1 NORTH END PAVING & DRAINAGE - ONONDAGA AVENUE
PROJECT DESCRIPTION: The purpose of this project is to correct pavement deficiencies which cause uneven
driving surfaces and ponding to occur. The improvements to correct these issues are
milling and resurfacing, some roadway reconstruction, drainage replacement and
additions, and curb work.
SCHEDULE BUDGET
Begin Activity Activity Complete Current
5/1/2017 6/5/2017 $0
6/5/2017 11/3/2017 Spent to Date
8/28/2014 2/28/2015 $600,000
2/1/2017 4/11/2017 Amendments
Program Manager $592,944
7/1/2016 2/1/2017 $7,056
Remaining
Information as of 9/30/2017324
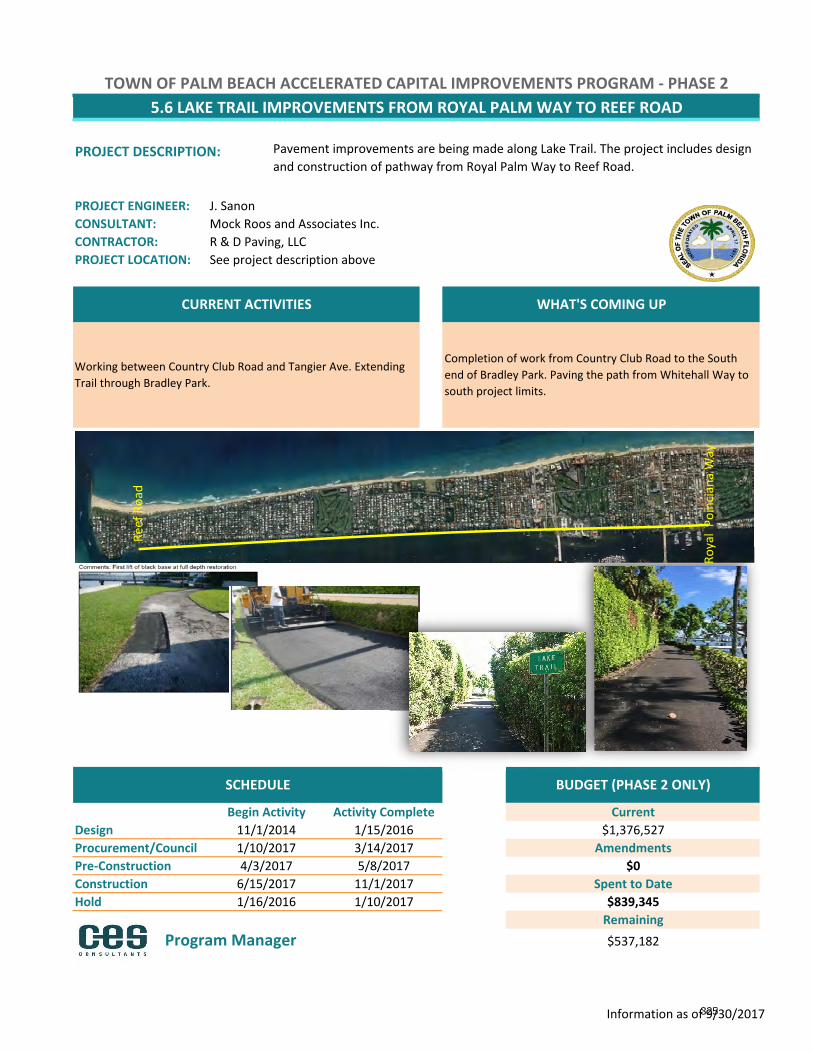
PROJECT ENGINEER: J. Sanon
CONSULTANT: Mock Roos and Associates Inc.
CONTRACTOR: R & D Paving, LLC
PROJECT LOCATION: See project description above
Design
Procurement/Council
Pre-Construction
Construction
Hold
$537,182
1/16/2016 1/10/2017
Amendments
$0
Spent to Date
$839,345
Remaining
1/10/2017 3/14/2017
4/3/2017 5/8/2017
6/15/2017 11/1/2017
Program Manager
SCHEDULE BUDGET (PHASE 2 ONLY)
Begin Activity Activity Complete
11/1/2014 1/15/2016
Current
$1,376,527
Working between Country Club Road and Tangier Ave. Extending
Trail through Bradley Park.
Completion of work from Country Club Road to the South
end of Bradley Park. Paving the path from Whitehall Way to
south project limits.
TOWN OF PALM BEACH ACCELERATED CAPITAL IMPROVEMENTS PROGRAM - PHASE 2
5.6 LAKE TRAIL IMPROVEMENTS FROM ROYAL PALM WAY TO REEF ROAD
PROJECT DESCRIPTION: Pavement improvements are being made along Lake Trail. The project includes design
and construction of pathway from Royal Palm Way to Reef Road.
WHAT'S COMING UPCURRENT ACTIVITIES
Re
ef
Ro
ad
Ro
yal
Po
inci
an
a W
ay
Information as of 9/30/2017325

PROJECT ENGINEER: P. Strayer
CONSULTANT: Kimley-Horn and Associates
CONTRACTOR: Danella Utility Construction
PROJECT LOCATION: La Puerta Way
Design
Procurement/Council
Pre-Construction
Construction
Hold
Activity Complete Current
TOWN OF PALM BEACH ACCELERATED CAPITAL IMPROVEMENTS PROGRAM - PHASE 2
5.7 LA PUERTA WAY DRAINAGE
PROJECT DESCRIPTION: In advance of the Town-wide Undergrounding of utilities, the residents on the block between
La Puerta Way and Nightingale Trail, including five properties at the southeast corner of
North Ocean Way and La Puerta Way, have expressed interest in undergrounding the utilities
in the area prior to the overall undergrounding program. New underground infrastructure
will be installed within the adjacent road rights of way to contain the utilities. Drainage
deficiencies are being addressed on La Puerta Way as part of the ACIP 2 Program. These
improvements consist of replacing existing, undersized catch basins as well as improvements
outlined in the Town’s previous D-10 Basin Stormwater Modeling Study dated February 23,
2006. Also, low points in the existing roadway will be remedied.
CURRENT ACTIVITIES WHAT'S COMING UP
Program Manager $375,840
- - $0
9/21/2016 11/1/2017 Spent to Date
4/1/2016 9/20/2016 $245,502
Remaining
10/15/2015 1/15/2016 $621,343
1/15/2016 3/15/2016 Amendments
Drainage improvements are complete. Curbing and regrading of roadway.
SCHEDULE BUDGET
Begin Activity
Information as of 9/30/2017326

PROJECT ENGINEER: M. Roach
CONSULTANT: Mock Roos Associates Inc.
CONTRACTOR: Whiting-Turner
PROJECT LOCATION: Ibis Isle
Design
Procurement/Council
Pre-Construction
Construction
Hold
Remaining
Program Manager $225,654
November 2018 December 2018 Spent to Date
$2,346
TBD TBD Amendments
TBD TBD $0
Drainage improvements incorporated into the Phase I - South
Undergrounding Utilities Project.The Phase I - South Undergrounding construction is ongoing.
TBD TBD $228,000
SCHEDULE BUDGET
Begin Activity Activity Complete Current
TOWN OF PALM BEACH ACCELERATED CAPITAL IMPROVEMENTS PROGRAM - PHASE 2
5.10 STORM DRAIN IMPROVEMENTS IBIS ISLE
PROJECT DESCRIPTION:
CURRENT ACTIVITIES WHAT'S COMING UP
This project is for regrading drainage deficiencies on Ibis Isle as part of the ACIP 2 Program.
Information as of 9/30/2017327

PROJECT ENGINEER: J. Sanon
CONSULTANT: Chen Moore and Associates
CONTRACTOR: TBD
PROJECT LOCATION: West end of Jungle Road
Design
Procurement/Council
Pre-Construction
Construction
Hold $0
Remaining
Program Manager $125,000
11/1/2018 4/30/2019 $0
5/1/2019 10/1/2019 Spent to Date
11/27/2017 5/31/2018 $125,000
6/1/2018 10/30/2018 Amendments
Selecting consultant and presenting design proposal for approval at
the November Town Council meeting.Begin design phase.
SCHEDULE BUDGET
Begin Activity Activity Complete Current
TOWN OF PALM BEACH ACCELERATED CAPITAL IMPROVEMENTS PROGRAM - PHASE 2
5.11 D-16 (JUNGLE ROAD) STORMWATER PUMP STATION IMPROVEMENTS (DESIGN)
PROJECT DESCRIPTION:
CURRENT ACTIVITIES WHAT'S COMING UP
This project was identified in the Townwide Stormwater Pump Station Condition Assessment
Report as requiring improvements. The improvements include replacing electric submersible
pumps, pump cans, and discharge pipes along with the electrical components.
PUMP STATION SCREENING
Information as of 9/30/2017328

PROJECT ENGINEER: J. Sanon
CONSULTANT: Chen Moore and Associates
CONTRACTOR: TBD
PROJECT LOCATION: West end of El Brillo Way
Design
Procurement/Council
Pre-Construction
Construction
Hold $0
Remaining
Program Manager $124,000
11/1/2018 4/30/2019 $0
5/1/2019 10/1/2019 Spent to Date
11/27/2017 5/31/2018 $124,000
6/1/2018 10/30/2018 Amendments
Selecting consultant and presenting design proposal for approval at
the November Town Council meeting.Begin design phase.
SCHEDULE BUDGET
Begin Activity Activity Complete Current
TOWN OF PALM BEACH ACCELERATED CAPITAL IMPROVEMENTS PROGRAM - PHASE 2
5.12 D-18 (EL BRILLO WAY) STORMWATER PUMP STATION IMPROVEMENTS (DESIGN)
PROJECT DESCRIPTION: This project was identified in the Townwide Stormwater Pump Station Condition Assessment
Report as requiring improvements. The improvements include replacing electric submersible
pumps, pump cans, and discharge pipes along with the electrical components.
CURRENT ACTIVITIES WHAT'S COMING UP
PUMP STATION SITE
Information as of 9/30/2017329

PROJECT ENGINEER: J. Sanon
CONSULTANT:
CONTRACTOR: Burkhardt Construction, Inc.
PROJECT LOCATION:
Design
Procurement/Council
Pre-Construction
Construction I
Construction II
TOWN OF PALM BEACH ACCELERATED CAPITAL IMPROVEMENTS PROGRAM - PHASE 2
The last phase of this project is to complete the lining of the D-4
outfall pipe. Currently out to bid.
1/15/2015
1/16/2015 4/30/2015
SCHEDULE BUDGET
Begin Activity Activity Complete
8/8/2014 9/12/2014
6. D-4/D-10 PUMP STATION IMPROVEMENTS - CONSTRUCTION
PROJECT DESCRIPTION: Replace hydraulically driven pumps with electric pumps at Pump Station D-4 & D-10;
upgrade electrical and mechanical systems to D-4 as well as Pump Station D-3, Ejector
Station E-6 and E-7. Correct any structural deficiencies.
CURRENT ACTIVITIES WHAT'S COMING UP
Kimley-Horn and Associates (Design),
Mock, Roos and Associates (Construction Phase)
$8,068,050
9/16/2014
Current
$8,531,117
Install liner and complete the project.
D-10 Pump Station (North Lake Way & Via Marila), D-4 Pump Station (North Lake Way
between, Via Tortuga & Miraflores Drive)
10/15/2017 2/28/2018
Amendments
$0
Spent to Date
$463,068
Remaining
5/1/2015 6/18/2016
Program Manager
Information as of 9/30/2017330

PROJECT ENGINEER: J. Sanon
CONSULTANT: Mock Roos and Associates Inc.
CONTRACTOR: TBD
PROJECT LOCATION: D-14 Pump Station (NW Corner of the 4 Arts Society Compound)
Assessment
Design
Procurement/Council
Pre-Construction
Construction
Program Manager $4,841,381
5/1/2018 11/30/2018 $223,619
Remaining
Completed $5,065,000
2/1/2017 11/1/2017 Amendments
12/1/2017 3/1/2018 $0
3/1/2018 5/1/2018 Spent to Date
SCHEDULE BUDGET
Begin Activity Activity Complete Current
CURRENT ACTIVITIES WHAT'S COMING UP
60% design is ongoing. Moving forward with Bid for upgrading transformer work.
TOWN OF PALM BEACH ACCELERATED CAPITAL IMPROVEMENTS PROGRAM - PHASE 2
8.3 D-14 PUMP STATION IMPROVEMENTS
PROJECT DESCRIPTION: The project was identified in the Townwide Wastewater Pump Station Condition
Assessment report as requiring improvements. The D-14 Stormwater Pump Station is
located alongside the Intracoastal Waterway in the Northwest corner of the Society of
the Four Arts parking lot. The station is nearing the end of its useful life and needs to be
rehabilitated. The improvements to this station will include the replacement of
mechanical and electrical equipment, and corrections to any structural deficiencies.
Information as of 9/30/2017331

PROJECT ENGINEER: J. Debrincat
CONSULTANT: Kimley-Horn and Associates
CONTRACTOR: TBD
PROJECT LOCATION: 400 Block Worth Avenue
Study
Design
Procurement/Council
Pre-Construction
Construction
Hold
Program Manager
$1,400,000
Summer 2019 Summer 2019 $0
Remaining
10/9/2018 1/7/2019 $0
1/14/2019 4/30/2019 Spent to Date
1/5/2016 5/20/2016 $1,400,000
2/5/2018 10/5/2018 Amendments
Initiating procurement of design consultant.Present design award for approval to Town Council in
November 2017.
SCHEDULE BUDGET
Begin Activity Activity Complete Current
TOWN OF PALM BEACH ACCELERATED CAPITAL IMPROVEMENTS PROGRAM - PHASE 2
9.3 400 WORTH AVENUE
PROJECT DESCRIPTION: This project was identified in the Mid-Town Drainage Basin Study as requiring drainage
improvements and roadway reconstruction. The limits of the improvements are
located within the 400 Block of Worth Avenue and include replacing curb inlets,
drainage pipe, manholes, sidewalks and curbing. The work also includes rebuilding the
existing roadway with proper slopes.
CURRENT ACTIVITIES WHAT'S COMING UP
Information as of 9/30/2017332

PROJECT ENGINEER: J. Sanon
CONSULTANT: A.D.A. Engineering, Inc.
CONTRACTOR: Johnson-Davis, Inc.
PROJECT LOCATION: Various locations through the Island
Design
Procurement/Council
Pre-Construction
Construction
Hold
SCHEDULE BUDGET
Final road restoration is completed. Roadway striping and project closeout.
TOWN OF PALM BEACH ACCELERATED CAPITAL IMPROVEMENTS PROGRAM - PHASE 2
13. OCEAN OUTFALL ABANDONMENTS
PROJECT DESCRIPTION:
CURRENT ACTIVITIES WHAT'S COMING UP
The Ocean Outfall Abandonment Project includes many private and public surface water
runoff outfalls and discharges within the Town. These outfalls direct stormwater onto the
beach and dune system. Stormwater discharges can cause scour and erosion of the
adjacent beach and dune system. Each outfall to be abandoned requires plans for
abandoning or eliminating the outfall; this includes redirecting the existing drainage
associated with that outfall to an alternate discharge.
10/28/2016
Current
$630,000
Program Manager
9/30/2017
Begin Activity Activity Complete
6/21/2016
$353,613
Amendments
$0
Spent to Date
$276,387
Remaining
10/28/2016 2/14/2017
2/15/2017
N/A N/A
5/1/2017
6/12/2017
Information as of 9/30/2017333

PROJECT ENGINEER: M. Roach
CONSULTANT: Chen Moore and Associates
CONTRACTOR: TBD
PROJECT LOCATION: Town-owned and operated landfills
Design
Procurement/Council
Pre-Construction
Construction
Hold
8/6/2016 6/22/2017
Current
$611,000
Consultant to finalize plans. Staff to discuss with County the Permit requirements.
SCHEDULE BUDGET
Begin Activity Activity Complete
TOWN OF PALM BEACH ACCELERATED CAPITAL IMPROVEMENTS PROGRAM - PHASE 2
17. LANDFILL/ FACILITY IMPROVEMENTS
PROJECT DESCRIPTION: Improvements to the Skees Road Landfill site includes the replacement of the existing
structure to meet the needs of staff and equipment. The building will contain a
restroom, small office, and secure storage for equipment.
CURRENT ACTIVITIES WHAT'S COMING UP
Program Manager $558,995
Amendments
$0
Spent to Date
$52,005
Remaining
7/20/2018 9/11/2018
9/12/2018 10/28/2018
10/29/2018 6/28/2019
Information as of 9/30/2017334

PROJECT ENGINEER: M. Roach
CONSULTANT: Kimley-Horn and Associates
CONTRACTOR: Burkhardt Construction, Inc.
PROJECT LOCATION: Town Hall Square
Design
Procurement/Council
Pre-Construction
Construction Ph II A
Construction Ph II B
Hold
10/5/2014
Current
Program Manager
10/1/2015
$4,691,724
$661,086
N/A N/A
Amendments
$0
Spent to Date
$4,030,638
Remaining
7/5/2015 9/30/2015
9/23/2015 10/1/2015
10/4/2015
5/1/2016 11/30/2016
1/31/2016
TOWN OF PALM BEACH ACCELERATED CAPITAL IMPROVEMENTS PROGRAM - PHASE 2
19. TOWN HALL SQUARE
PROJECT DESCRIPTION: Perform streetscape and infrastructure improvements on South County Road
between Chilean Avenue and Australian Avenue including installing new landscaping,
street lighting, parking improvements, tabby sidewalks and fountain restoration.
CURRENT ACTIVITIES WHAT'S COMING UP
SCHEDULE BUDGET
Begin Activity Activity Complete
Project is complete.
Before After
Information as of 9/30/2017335

PROJECT ENGINEER: M. Roach
CONSULTANT: Kimley-Horn and Associates
CONTRACTOR: American Lighting & Signalization, Inc.
PROJECT LOCATION:
Design
Procurement/Council
Pre-Construction
Construction
Hold
Remaining
Program Manager $21,443
Spent to Date
SCHEDULE BUDGET
Begin Activity Activity Complete Current
Project is complete. Finalizing documentation.
N/A N/A $1,217,550
6/23/2014 9/30/2016 $1,238,992
11/22/2015 2/9/2016 Amendments
2/15/2016 4/30/2016 $0
5/1/2016 11/30/2016
CURRENT ACTIVITIES WHAT'S COMING UP
Sunrise Avenue & Bradley Place, Sunrise Avenue & North County Road,
Sunset Avenue & North County Road
TOWN OF PALM BEACH ACCELERATED CAPITAL IMPROVEMENTS PROGRAM - PHASE 2
23.1 SUNRISE/SUNSET AND NORTH COUNTY MAST ARM REPLACEMENTS / UPGRADES
PROJECT DESCRIPTION: Replace existing traffic signal poles with a more decorative pole that meets the current wind
load standard. Work also includes the installation of pedestrian signal poles, upgrading curb
ramps to current ADA standards, and milling and resurfacing of intersections.
Sunrise Avenue After
Sunrise Avenue Before
Sunset Avenue After
Sunset Avenue Before
Information as of 9/30/2017336

PROJECT ENGINEER: M. Roach
CONSULTANT: Kimley-Horn and Associates
CONTRACTOR: TBD
PROJECT LOCATION:
Design
Procurement/Council
Pre-Construction
Construction
Hold
Remaining
Program Manager $302,100
5/1/2018 10/1/2018 Spent to Date
N/A N/A $33,986
4/1/2018 5/1/2018 $0
6/23/2014 12/30/2017 $336,086
1/8/2018 3/14/2018 Amendments
SCHEDULE BUDGET
Begin Activity Activity Complete Current
CURRENT ACTIVITIES
Consultant is working on finalizing plans.
WHAT'S COMING UP
Project is scheduled to be bid in January 2018. Present Bids
to February 2018 Town Council for award.
TOWN OF PALM BEACH ACCELERATED CAPITAL IMPROVEMENTS PROGRAM - PHASE 2
23.2 CLARKE AVENUE AND COCOANUT ROW MAST ARM REPLACEMENTS / UPGRADES
PROJECT DESCRIPTION: Replace existing traffic signal poles with a more decorative pole that meets the
current wind load standard. Work also includes the installation of pedestrian signal
poles, upgrading curb ramps to current ADA standards, and milling and resurfacing
of intersections.
Clarke Avenue and Cocoanut Row
Information as of 9/30/2017337

PROJECT ENGINEER: M. Roach
CONSULTANT: Kimley-Horn and Associates
CONTRACTOR: TBD
PROJECT LOCATION:
Design
Procurement/Council
Pre-Construction
Construction
Hold
Program Manager $277,100
5/1/2019 $0
N/A $33,564
Remaining
5/1/2019 10/1/2019 Spent to Date
N/A
4/1/2019
SCHEDULE BUDGET
Begin Activity Activity Complete Current
6/23/2014 12/30/2017 $310,664
1/9/2019 3/15/2019 Amendments
TOWN OF PALM BEACH ACCELERATED CAPITAL IMPROVEMENTS PROGRAM - PHASE 2
23.3 PENDLETON AVENUE AND COCOANUT ROW MAST ARM REPLACEMENTS / UPGRADES
PROJECT DESCRIPTION: Replace existing traffic signal poles with a more decorative pole that meets the
current wind load standard. Work also includes the installation of pedestrian
signal poles, upgrading curb ramps to current ADA standards, and milling and
resurfacing of intersections.
Pendleton Avenue and Cocoanut Row
CURRENT ACTIVITIES WHAT'S COMING UP
Consultant is working on finalizing plans. Construction is scheduled for the summer of 2019.
Information as of 9/30/2017338
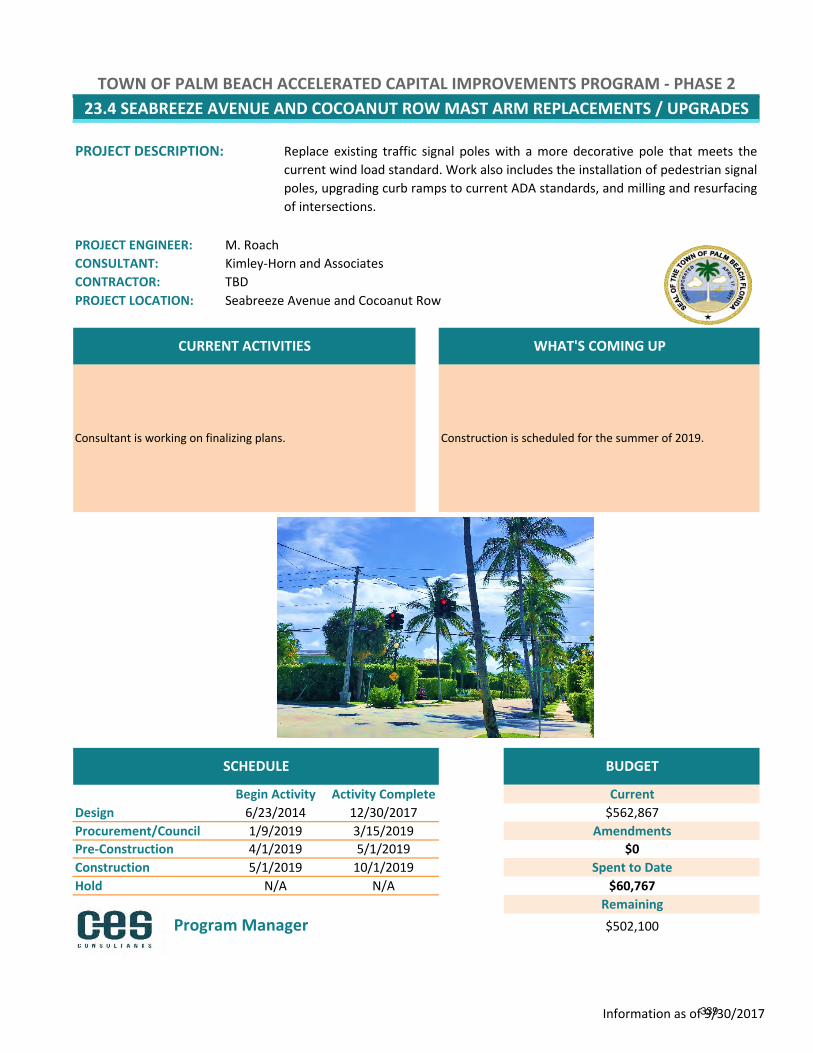
PROJECT ENGINEER: M. Roach
CONSULTANT: Kimley-Horn and Associates
CONTRACTOR: TBD
PROJECT LOCATION:
Design
Procurement/Council
Pre-Construction
Construction
Hold
Program Manager $502,100
5/1/2019 $0
N/A $60,767
Remaining
5/1/2019 10/1/2019 Spent to Date
N/A
4/1/2019
SCHEDULE BUDGET
Begin Activity Activity Complete Current
6/23/2014 12/30/2017 $562,867
1/9/2019 3/15/2019 Amendments
TOWN OF PALM BEACH ACCELERATED CAPITAL IMPROVEMENTS PROGRAM - PHASE 2
23.4 SEABREEZE AVENUE AND COCOANUT ROW MAST ARM REPLACEMENTS / UPGRADES
PROJECT DESCRIPTION: Replace existing traffic signal poles with a more decorative pole that meets the
current wind load standard. Work also includes the installation of pedestrian signal
poles, upgrading curb ramps to current ADA standards, and milling and resurfacing
of intersections.
Consultant is working on finalizing plans. Construction is scheduled for the summer of 2019.
Seabreeze Avenue and Cocoanut Row
CURRENT ACTIVITIES WHAT'S COMING UP
Information as of 9/30/2017339

PROJECT ENGINEER: M. Roach
CONSULTANT: Kimley-Horn and Associates
CONTRACTOR: TBD
PROJECT LOCATION:
Design
Procurement/Council
Pre-Construction
Construction
Hold
Program Manager $292,100
Replace existing traffic signal poles with a more decorative pole that meets the
current wind load standard. Work also includes the installation of pedestrian signal
poles, upgrading curb ramps to current ADA standards, and milling and resurfacing
of intersections.
5/1/2018 $0
N/A $54,469
Remaining
5/1/2018 10/1/2018 Spent to Date
N/A
SCHEDULE BUDGET
Begin Activity
4/1/2018
TOWN OF PALM BEACH ACCELERATED CAPITAL IMPROVEMENTS PROGRAM - PHASE 2
23.5 BRADLEY PLACE MAST ARM REPLACEMENTS / UPGRADES
PROJECT DESCRIPTION:
Current
6/23/2014 12/30/2016 $346,569
Bradley Place and Sunrise Avenue
CURRENT ACTIVITIES WHAT'S COMING UP
Plans are complete.Project is scheduled to be bid in January 2018. Present Bids to
February 2018 Town Council for award.
1/8/2018 3/14/2018
Activity Complete
Amendments
Information as of 9/30/2017340

PROJECT ENGINEER: M. Roach
CONSULTANT: Mock Roos and Associates Inc.
CONTRACTOR: PowerCore, Inc.
PROJECT LOCATION: Various locations through the Island
Design
Procurement/Council
Pre-Construction
Construction
Hold
TOWN OF PALM BEACH ACCELERATED CAPITAL IMPROVEMENTS PROGRAM - PHASE 2
26.3 TOWN WIDE STREET LIGHTING REPLACEMENTS (LESS BRADLEY & TOWN HALL SQUARE)
PROJECT DESCRIPTION: Replace existing aging street light poles and fixtures that do not meet new standards, and
were not replaced in the Phase 1 Street Lighting project.
Construction is ongoing.Contractor will finalize the light pole installation and start
restoration.
CURRENT ACTIVITIES WHAT'S COMING UP
SCHEDULE BUDGET
Begin Activity Activity Complete Current
4/12/2016 7/29/2016 $0
5/9/2016 10/25/2017 Spent to Date
10/1/2014 9/30/2015 $2,873,000
11/22/2015 2/9/2016 Amendments
Program Manager $670,281
N/A N/A $2,202,719
Remaining
Information as of 9/30/2017341

PROJECT ENGINEER: M. Roach
CONSULTANT: Mock Roos and Associates
CONTRACTOR: TBD
PROJECT LOCATION: Bradley Place from Royal Poinciana Way to Wells Road
Design
Procurement/Council
Pre-Construction
Construction
Hold
Program Manager $279,702
N/A N/A $29,298
Remaining
5/6/2016 12/22/2016 $309,000
12/18/2016 2/14/2017 Amendments
3/17/2017 6/30/2017 $0
5/1/2017 10/25/2017 Spent to Date
SCHEDULE BUDGET
Begin Activity Activity Complete Current
TOWN OF PALM BEACH ACCELERATED CAPITAL IMPROVEMENTS PROGRAM - PHASE 2
26.4 BRADLEY PLACE - ROYAL POINCIANA WAY TO WELLS ROAD STREET LIGHTING REPLACEMENTS
PROJECT DESCRIPTION: Replace existing aging street light poles and fixtures on Bradley Place between
Royal Poinciana Way and Wells Road.
CURRENT ACTIVITIES WHAT'S COMING UP
Construction started on May 1, as part of the Town-Wide Street
Light Improvements project.Construction is ongoing.
Information as of 9/30/2017342

PROJECT ENGINEER: M. Roach
CONSULTANT: Mock Roos and Associates
CONTRACTOR: TBD
PROJECT LOCATION: South Ocean Boulevard from Sloan's Curve to Lake Avenue
Design
Procurement/Council
Pre-Construction
Construction
Hold
TOWN OF PALM BEACH ACCELERATED CAPITAL IMPROVEMENTS PROGRAM - PHASE 2
27. STREET LIGHTING UPGRADES - SOUTH OCEAN BOULEVARD, SLOAN'S CURVE TO LAKE AVENUE
PROJECT DESCRIPTION: Replace the existing cobra head lighting system with decorative street light poles and
fixtures on South Ocean Blvd, from Sloan's Curve to Lake Avenue. A new underground
street light conduit and wire system will also be installed.
WHAT'S COMING UPCURRENT ACTIVITIES
Consultant is coordinating the design revision with FPL to be
paid for by the new Tariff. Construction will be coordinated as
part of the Townwide Undergrounding of Overhead Utilities
Phase I - South.
Town Council authorized staff to pursue FPL LED Tariff and revise
plans accordingly.
BUDGETSCHEDULE
Begin Activity Activity Complete
5/1/2018 11/3/2018
Current
$2,931,000
Amendments
$0
Spent to Date
5/6/2016 12/22/2016
1/8/2017 4/11/2017
4/11/2017 6/30/2017
$1,474,461
Remaining
$1,456,539
1/1/2015 10/17/2016
Program Manager
Information as of 9/30/2017343

(This page intentionally left blank)
344

Recreation Enterprise Fund
345

Recreation Enterprise Fund FY2018
346

Recreation Enterprise Fund FY2018
Recreation Enterprise Fund FY2018 Goals
Recreation Department Goal #1: Enhance quality of maintenance of the Par 3 Golf Course Clubhouse, greens and fairways
OBJECTIVES: Re-evaluate and implement enhanced best practices maintenance
procedures and create a plan for sustaining the improvements Improve training of staff in preventative maintenance tasks Ensure maintenance practices have a positive effect on the surrounding
environment while providing a superior golfing experience
Recreation Department Goal #2: Implement staff training opportunities focusing on customer service at all recreation facilities
OBJECTIVES: Assess and implement enhanced in-service and online employee trainings Conduct additional staff training for front line staff Continue to execute standard orientation for instructors and employees Provide additional direct supervision by the program and facility supervisors
Recreation Department Goal #3: Increase transient revenue at the Town Docks
OBJECTIVES: Creat a marina marketing plan, focusing on new clients, which will increase
awareness of transient boating opportunities Develop methods to improve transient customer experience to encourage
extension of stay Proactively maintain a safe and clean facility to ensure the quality of the patron
experience, while mooring at the Town Docks, is a positive experience
Recreation Department Goal #4: Increase participation and revenue at the Recreation Center and Tennis Centers
OBJECTIVES: Develop and implement marketing strategies for increasing participation Create new and/or enhanced youth and adult programs Develop additional program variety
347

Recreation Enterprise Fund FY2018
Recreation Department Goal #5: Develop a strategic plan for changes in Town Recreation programs, services, and facilities. Engage with patrons, parents, and community groups to incorporate feedback and ideas in programming services and facilities. Develop a public awareness plan for recreation programs. Prioritize recreation needs.
OBJECTIVES: Continue to formulate plan for the construction of the future Recreation
Center. Develop a course of action to ensure recreational opportunitiesremain available throughout the construction period, should the process beginthis fiscal year
Continue to solicit feedback from residents concerning programming andfacility development
Implement strategies, in conjunction with consultants, for the development ofthe Master Plan for the Town Docks and accessory structures
Increase awareness of program offerings utilizing diverse marketing methods
348

Recreation Enterprise Fund FY2018
RECREATION ENTERPRISE FUND - 403
The goal of the Recreation Department is to provide outstanding recreational opportunities, excellent customer service, and safe, well-maintained facilities at the Town Docks, Palm Beach Par 3 Golf Course, Seaview Park and Phipps Ocean Park Tennis Centers, and the Recreation Center.
FY2015Actual
FY2016Actual
FY2017Budget
FY2017Projected
FY2018Budget
%Change
RevenuesMarina 3,466,002 3,581,434 3,655,600 3,666,775 3,820,100 4.50%Par 3 1,855,642 1,978,101 1,929,600 2,113,398 2,222,300 15.17%Tennis 218,869 208,370 233,700 234,958 250,500 7.19%Recreation Center 303,158 338,104 326,400 354,216 334,500 2.48%Investment Earnings 8,159 64,271 12,600 58,184 14,000 11.11%Miscellaneous Revenue 5,404 5,404 - - - 0.00%TOTALS 5,857,234 6,175,684 6,157,900 6,427,531 6,641,400 7.85%ExpensesSalaries and Wages 1,177,158 1,253,137 1,354,465 1,243,611 1,392,733 2.83%Employee Benefits 523,960 580,345 636,317 618,126 656,502 3.17%Contractual 1,363,785 1,395,941 1,556,900 1,449,025 1,523,980 -2.11%Commodities 318,509 342,115 500,550 371,629 363,970 -27.29%Capital Outlay - 6,370 66,300 134,075 84,000 26.70%Other - - - - - 0.00%TOTALS 3,383,412 3,577,908 4,114,532 3,816,466 4,021,185 -2.27%Operating Revenues Over/(Under) Expenses 2,473,822 2,597,776 2,043,368 2,611,065 2,620,215 Donations - - - 98,642 6,571,154 Grant Revenue - - 50,000 - - Transfer from Reserves - - - - 3,263,868 Capital Expenses (75,565) (164,800) (588,489) (533,219) (10,207,511) Depreciation (735,012) (721,844) (955,329) (955,329) (1,049,626) Gain/(Loss) on disposal of fixed assets 4,168 - - - - Pension Expense-GASB 68 (265,739) - - - - Tranfer from 2013 Bond Fund - Transfer to General Fund (885,000) (785,000) (685,000) (685,000) (585,000) Transfer to Debt Service (202,200) (204,100) (185,967) (185,967) (198,263) Contingency - - (321,200) - (168,303)TOTAL REVENUES OVER/(UNDER) EXPENSES 314,474 722,032 (642,617) 350,192 246,534
Revenue and Expense Summary
349

Recreation Enterprise Fund FY2018
FY2015 FY2016 FY2017 FY2018 Full Time Equivalent Employees 26.043 27.546 25.297 24.232
Change in FTEs: Full-time employee modifications
o Reallocation of Public Works employees Decrease in various part-time and temporary positions
Authorized expenditures from the Par 3 Clubhouse and Par 3 Golf Course Maintenance and Improvement Fund:
Par 3 Clubhouse Maintenance and Improvement Fund - Total $28,000 Replace AC Air Condensers: $20,000 Paint and Stripe Parking Lot: $8,000
Par 3 Golf Course Maintenance and Improvement Fund – Total $62,000 Level 9 Black Tees: $50,000 Replace Synthetic Turf: $12,000
‐
1,000,000
2,000,000
3,000,000
4,000,000
5,000,000
6,000,000
7,000,000
FY2015Actual
FY2016Actual
FY2017Budget
FY2018Budget
Recreation Enterprise Fund
Operating Revenues Operating Expenditures
350

Recreation Enterprise Fund FY2018
PROGRAM: MARINA
Located at Lake Drive Park, the Town Marina has three main docks with a total of 83 slips. Slips are leased annually, monthly, or daily. The docks provide berthing for power and sail yachts up to 260’ in length.
The marina property offers a variety of amenities - three dock buildings, a waste oil collection site, electrical service panels for all vessels, fresh water, WiFi, cable TV and telephone services, Captain’s lounge and showers, sewage pump-out systems, and 24/7 security with surveillance cameras.
The Dockmaster is responsible for daily operations, supervision of employees (Town and contractual), slip assignments, safety, and the collection of revenues in accordance with established policies.
‐
500,000
1,000,000
1,500,000
2,000,000
2,500,000
3,000,000
3,500,000
4,000,000
4,500,000
FY2015Actual
FY2016Actual
FY2017Budget
FY2018Budget
Marina
Revenues Expenditures
351

Recreation Enterprise Fund FY2018
REVENUES Annual Leases This category represents revenue from vessels under an annual lease at the Town Docks.
Transient Rental This category represents revenue from transient vessels (those staying on a daily or monthly rate without a long-term lease).
Electricity Use of electricity by dock customers over the 100-amp service included in contracts.
Waiting List Application Fee This category represents the $100 application fee to be on the waiting list for annual or seasonal leases.
Ice Sales Bags of ice are available for purchase at the Town docks.
Sales Tax Commissions Discount received from the State of Florida for timely filing and payment of sales tax.
Miscellaneous Revenue This category represents funds to be requested through grant applications for dock improvements.
FY2015Actual
FY2016Actual
FY2017Budget
FY2017Adjusted*
FY2017Projected
FY2018Budget
%Change
RevenuesAnnual Leases 2,549,172 2,702,274 2,800,000 2,800,000 2,861,524 2,955,000 5.54%Seasonal Leases 271,935 179,009 185,000 185,000 218,761 194,300 5.03%Transient Rental 486,954 539,055 475,500 475,500 409,623 500,000 5.15%Electricity 144,442 155,390 140,000 140,000 169,021 165,000 17.86%Waiting List Applic Fee 3,600 3,000 3,000 3,000 3,000 3,200 6.67%Ice Sales 835 1,002 800 800 744 1,400 75.00%Interest on Dock Replacement Reserve 8,865 1,221 1,100 1,100 400 400 -63.64%Sales Tax Commissions 179 324 200 200 306 300 50.00%Miscellaneous Revenue 20 159 50,000 50,000 3,396 500 -99.00%TOTALS 3,466,002 3,581,434 3,655,600 3,655,600 3,666,775 3,820,100 4.50%ExpensesSalaries and Wages 159,835 157,347 165,353 165,353 145,068 169,698 2.63%Employee Benefits 53,563 71,986 78,394 78,394 72,919 76,498 -2.42%Contractual 687,882 675,321 777,100 783,397 672,985 713,550 -8.18%Commodities 9,180 7,080 10,550 10,550 9,292 13,700 29.86%Capital Outlay - - - - - - 0.00%Depreciation - - - - - - 0.00%Other - - - - - - 0.00%TOTALS 910,460 911,734 1,031,397 1,037,694 900,264 973,446 -5.62%Operating Revenues Over/(Under) Expenses 2,555,542 2,669,700 2,624,203 2,617,906 2,766,511 2,846,654
Revenue and Expense Summary
352
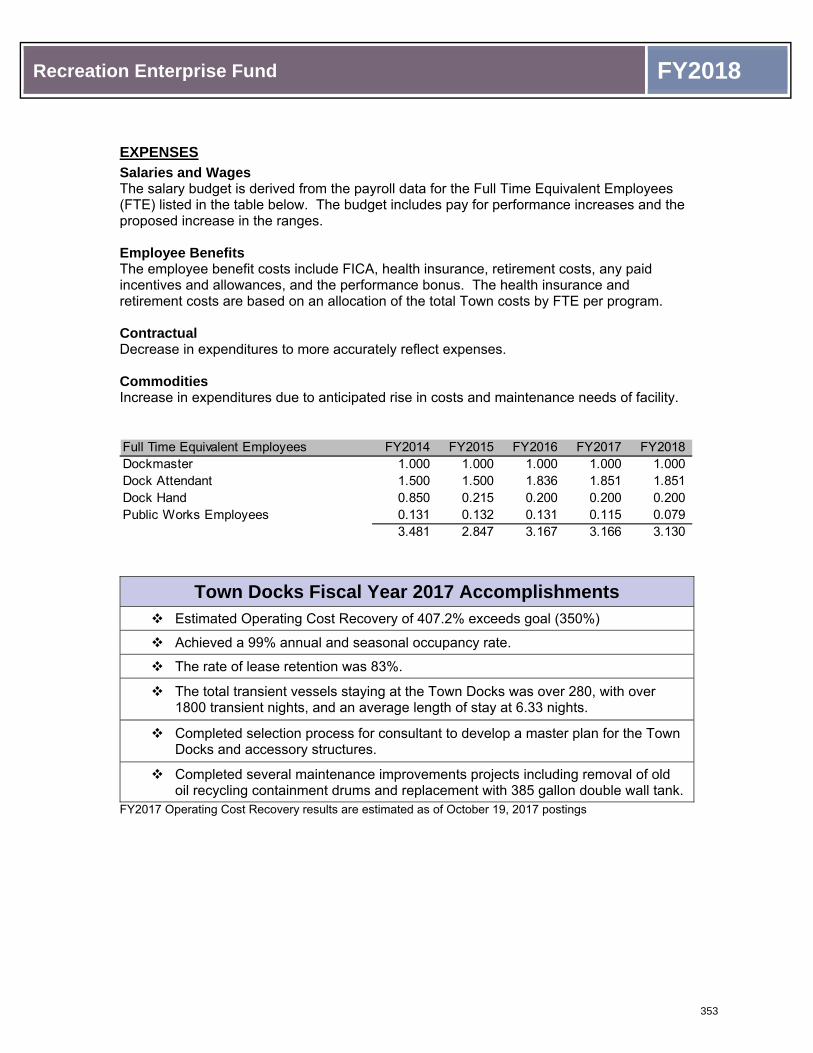
Recreation Enterprise Fund FY2018
EXPENSES Salaries and Wages The salary budget is derived from the payroll data for the Full Time Equivalent Employees (FTE) listed in the table below. The budget includes pay for performance increases and the proposed increase in the ranges.
Employee Benefits The employee benefit costs include FICA, health insurance, retirement costs, any paid incentives and allowances, and the performance bonus. The health insurance and retirement costs are based on an allocation of the total Town costs by FTE per program.
Contractual Decrease in expenditures to more accurately reflect expenses.
Commodities Increase in expenditures due to anticipated rise in costs and maintenance needs of facility.
Town Docks Fiscal Year 2017 Accomplishments Estimated Operating Cost Recovery of 407.2% exceeds goal (350%)
Achieved a 99% annual and seasonal occupancy rate.
The rate of lease retention was 83%.
The total transient vessels staying at the Town Docks was over 280, with over1800 transient nights, and an average length of stay at 6.33 nights.
Completed selection process for consultant to develop a master plan for the TownDocks and accessory structures.
Completed several maintenance improvements projects including removal of oldoil recycling containment drums and replacement with 385 gallon double wall tank.
FY2017 Operating Cost Recovery results are estimated as of October 19, 2017 postings
Full Time Equivalent Employees FY2014 FY2015 FY2016 FY2017 FY2018Dockmaster 1.000 1.000 1.000 1.000 1.000 Dock Attendant 1.500 1.500 1.836 1.851 1.851 Dock Hand 0.850 0.215 0.200 0.200 0.200 Public Works Employees 0.131 0.132 0.131 0.115 0.079
3.481 2.847 3.167 3.166 3.130
353

Recreation Enterprise Fund FY2018
Fiscal Year 2018 Goals and Performance Measures
Recreation Department Goal #2: Implement staff training opportunities focusing on customer service at all recreation facilities
Objectives: Assess and implement enhanced in-service and online employee trainings Conduct additional staff training for front line staff Continue to execute standard orientation for instructors and employees Provide additional direct supervision by the program and facility supervisors
Performance Measures Effectiveness/Output Measures: Projected FY18
Conduct customer service trainings Ongoing – with in-service and online training opportunities to be conducted
Conduct orientation for instructors and employees Ongoing
Provide more direct supervision by supervisors Ongoing
Recreation Department Goal #3: Increase transient revenue at the Town Docks
Objectives: Create a marina marketing plan, focusing on new clients, which will increase
awareness of transient boating opportunities Develop methods to improve transient customer experience to encourage
extension of stay Proactively maintain a safe and clean facility to ensure the quality of the patron
experience, while mooring at the Town Docks, is a positive experience
Performance Measures
Effectiveness/Output Measures: Actual FY14
Actual FY15
Actual FY16
Actual FY17
Projected FY18
Annual and Seasonal Occupancy 98% (81/83)
100% (83/83)
100% (83/83)
99% (82/83) NA
Annual Occupancy 84% (70)
87% (72)
90% (75)
93% (77/83)
100% (83/83)
Lease Retention 78% 83% 83% 83% 85%
Total Transient Vessels 385 356 367 288 370
Total Transient Nights 2,059 1,921 2,176 1,822 2,000
Transient Average Nights of Stay 5.35 5.40 5.93 6.33 6.00
354

Recreation Enterprise Fund FY2018
Recreation Department Goal #5: Develop a strategic plan for changes in Town Recreation programs, services, and facilities. Engage with patrons, parents, and community groups to incorporate feedback and ideas in programming services and facilities. Develop a public awareness plan for recreation programs. Prioritize recreation needs.
Objectives: • Continue to formulate plan for the construction of the future Recreation Center.
Develop a course of action to ensure recreational opportunities remain availablethroughout the construction period, should the process begin this fiscal year
• Continue to solicit feedback from residents concerning programming and facilitydevelopment
• Implement strategies, in conjunction with consultants, for the development of theMaster Plan for the Town Docks and accessory structures.
• Increase awareness of program offerings utilizing diverse marketing methods
Performance Measures Effectiveness/Output Measures: Projected FY18
Enhance social media presence Immediate and ongoing
Develop new and enhance existing marketing materials Ongoing
Increase the frequency of promotions and number of marketing outlets utilized to promote programs and facilities. Continuing
Develop project schedule for the completion of the Master Plan for the Town Docks. Ongoing
Town Docks Productivity Measures
Effectiveness/Output Measures: Actual FY14
Actual FY15
Actual FY16
Actual FY17
Projected FY18
Operating Cost Recovery 382% 379.7% 392.6% 407.2% 350.0% FY2017 Operating Cost Recovery results are estimated as of October 19, 2017 postings
355

Recreation Enterprise Fund FY2018
PROGRAM: GOLF COURSE
The Par 3 Golf Course is a scenic and challenging facility, featuring holes which range up to 211 yards. The new clubhouse, which opened in January 2014, offers a full-service pro shop and food and beverage services. There is a staff of qualified PGA instructors who conduct adult and junior clinics and private lessons. The Par 3 hosts outings, tournaments, and league play. The maintenance building is located on the west side of South Ocean Blvd.
The Golf Course Manager is responsible for daily supervision of the golf course with the assistance of the Superintendent and a variety of full, part-time and contractual labor service employees. The Manager also administers the golf instruction services contract.
The Golf Course has two reserves for maintenance and improvement. One is for the golf course and is funded via a small charge added to each round of play. The other reserve is for the clubhouse and is funded with one half of the profits of the golf course, annually.
‐
500,000
1,000,000
1,500,000
2,000,000
2,500,000
FY2015Actual
FY2016Actual
FY2017Budget
FY2018Budget
Golf Course
Revenues Expenditures
356
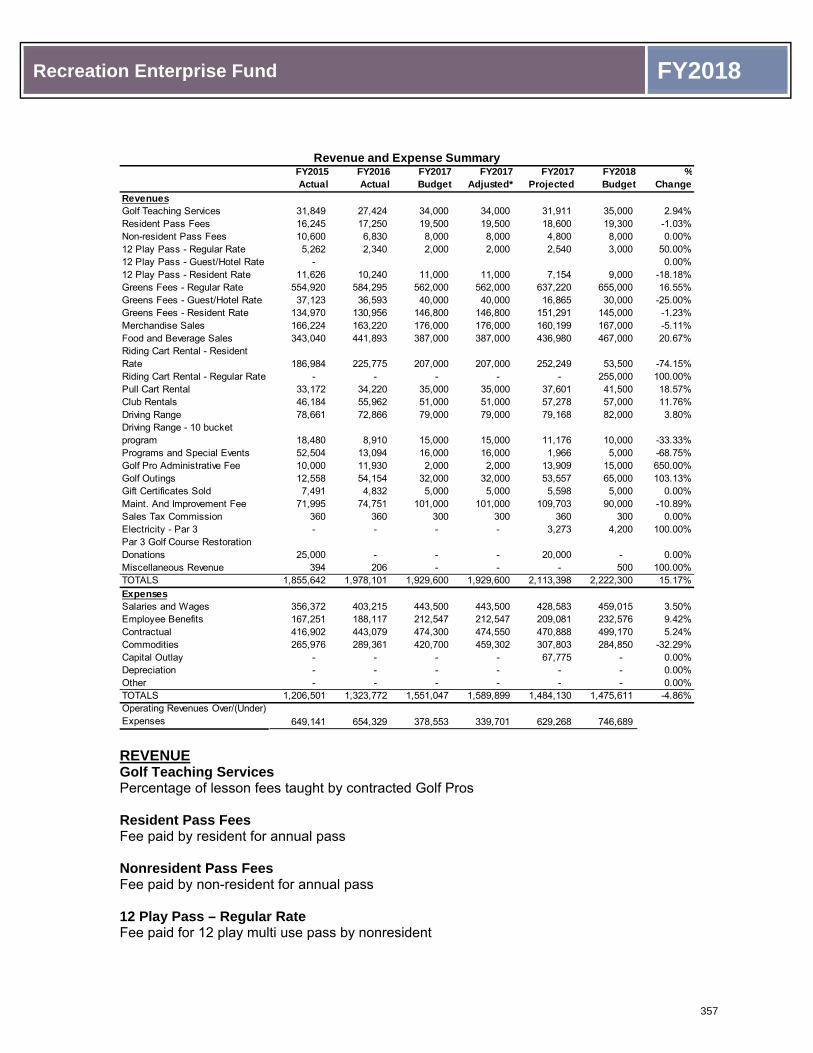
Recreation Enterprise Fund FY2018
REVENUE Golf Teaching Services Percentage of lesson fees taught by contracted Golf Pros
Resident Pass Fees Fee paid by resident for annual pass
Nonresident Pass Fees Fee paid by non-resident for annual pass
12 Play Pass – Regular Rate Fee paid for 12 play multi use pass by nonresident
FY2015Actual
FY2016Actual
FY2017Budget
FY2017Adjusted*
FY2017Projected
FY2018Budget
%Change
RevenuesGolf Teaching Services 31,849 27,424 34,000 34,000 31,911 35,000 2.94%Resident Pass Fees 16,245 17,250 19,500 19,500 18,600 19,300 -1.03%Non-resident Pass Fees 10,600 6,830 8,000 8,000 4,800 8,000 0.00%12 Play Pass - Regular Rate 5,262 2,340 2,000 2,000 2,540 3,000 50.00%12 Play Pass - Guest/Hotel Rate - 0.00%12 Play Pass - Resident Rate 11,626 10,240 11,000 11,000 7,154 9,000 -18.18%Greens Fees - Regular Rate 554,920 584,295 562,000 562,000 637,220 655,000 16.55%Greens Fees - Guest/Hotel Rate 37,123 36,593 40,000 40,000 16,865 30,000 -25.00%Greens Fees - Resident Rate 134,970 130,956 146,800 146,800 151,291 145,000 -1.23%Merchandise Sales 166,224 163,220 176,000 176,000 160,199 167,000 -5.11%Food and Beverage Sales 343,040 441,893 387,000 387,000 436,980 467,000 20.67%Riding Cart Rental - Resident Rate 186,984 225,775 207,000 207,000 252,249 53,500 -74.15%Riding Cart Rental - Regular Rate - - - - - 255,000 100.00%Pull Cart Rental 33,172 34,220 35,000 35,000 37,601 41,500 18.57%Club Rentals 46,184 55,962 51,000 51,000 57,278 57,000 11.76%Driving Range 78,661 72,866 79,000 79,000 79,168 82,000 3.80%Driving Range - 10 bucket program 18,480 8,910 15,000 15,000 11,176 10,000 -33.33%Programs and Special Events 52,504 13,094 16,000 16,000 1,966 5,000 -68.75%Golf Pro Administrative Fee 10,000 11,930 2,000 2,000 13,909 15,000 650.00%Golf Outings 12,558 54,154 32,000 32,000 53,557 65,000 103.13%Gift Certificates Sold 7,491 4,832 5,000 5,000 5,598 5,000 0.00%Maint. And Improvement Fee 71,995 74,751 101,000 101,000 109,703 90,000 -10.89%Sales Tax Commission 360 360 300 300 360 300 0.00%Electricity - Par 3 - - - - 3,273 4,200 100.00%Par 3 Golf Course Restoration Donations 25,000 - - - 20,000 - 0.00%Miscellaneous Revenue 394 206 - - - 500 100.00%TOTALS 1,855,642 1,978,101 1,929,600 1,929,600 2,113,398 2,222,300 15.17%ExpensesSalaries and Wages 356,372 403,215 443,500 443,500 428,583 459,015 3.50%Employee Benefits 167,251 188,117 212,547 212,547 209,081 232,576 9.42%Contractual 416,902 443,079 474,300 474,550 470,888 499,170 5.24%Commodities 265,976 289,361 420,700 459,302 307,803 284,850 -32.29%Capital Outlay - - - - 67,775 - 0.00%Depreciation - - - - - - 0.00%Other - - - - - - 0.00%TOTALS 1,206,501 1,323,772 1,551,047 1,589,899 1,484,130 1,475,611 -4.86%Operating Revenues Over/(Under) Expenses 649,141 654,329 378,553 339,701 629,268 746,689
Revenue and Expense Summary
357

Recreation Enterprise Fund FY2018
12 Play Pass – Guest/Hotel Rate Fee paid for 12 play multi use pass by guest of resident or guest at partner hotel
12 Play Pass – Resident Rate Fee paid for 12 play multi use pass by Palm Beach Resident
Greens Fees – Regular Rate Fee paid for daily play by non-residents
Greens Fees – Guest/Hotel Rate Fee paid for daily play by a guest of resident or guest of a partner hotel
Greens Fees – Resident Rate Fee paid for daily play by Palm Beach resident
Merchandise Sales This figure represents revenue for merchandise sales in the pro shop
Food and Beverage Sales This figure represents the agreement for a food and beverage contractor
Riding Cart Rental – Resident Rate Fee paid for rental of riding cart by Palm Beach resident
Riding Cart Rental – Regular Rate Fee paid for rental of riding cart by a non-resident
Pull Cart Rental Fee paid for rental of pull cart
Club Rentals Fee paid for use of Town owned rental clubs
Driving Range Fee paid for use of golf balls on driving range
Driving Range – 10 Bucket Program Fee paid for multi-use purchase of tokens for golf range usage
Programs and Special Events Rate category for special programs and activities
Golf Pro Administrative Fee Fee paid by Golf Pro as part of annual contract agreement
Golf Outings Revenue from pre-arranged golf outings
358

Recreation Enterprise Fund FY2018
Gift Certificates Sold This is a pass through account that is offset by an account for gift certificates redeemed. Actual revenue received is reported in accounts where it is spent (i.e. green fees)
Maintenance and Improvement Fee Fee paid per round of golf for maintenance and improvement fund for the golf course
Sales Tax Commission Discount received from the State of Florida for timely filing and payment of sales tax
EXPENSES Salaries and Wages The salary budget is derived from the payroll data for the Full Time Equivalent Employees (FTE) listed in the table below. The budget includes pay for performance increases and the proposed increase in the ranges.
Employee Benefits The employee benefit costs include FICA, health insurance, retirement costs, any paid incentives and allowances, and the performance bonus. The health insurance and retirement costs are based on an allocation of the total Town costs by FTE per program.
Contractual Increase in expenses due to higher reliance on contractual labor and rise in utility costs
Commodities Decrease due to the removal of expenses previously budgeted through the M&I fees to the Capital Improvement Program
Capital Outlay Decrease due to installation of weather screening on veranda of second floor of clubhouse during previous fiscal year
359

Recreation Enterprise Fund FY2018
Golf Course Fiscal Year 2017 Accomplishments Estimated Operating Cost Recovery of 142.1% exceeds goal (110%)
Maintenance projects completed included: renovation of the exterior of the oldclubhouse, replaced floors in the the new clubhouse, upgraded electrical service tothe new clubhouse and installed ceiling fans, replaced 500 single decoders in theirrigation system, box bladed and resurfaced the cart paths, replaced weatherscreening on the veranda of the clubhouse, renovation of 26 tees and replacementof the discharge pipe from the pump station.
Generated the most revenue in the Par 3’s history (more than $2,110,000)FY2017 Operating Cost Recovery results are estimated as of October 19, 2017 postings
Full Time Equivalent Employees FY2014 FY2015 FY2016 FY2017 FY2018Golf Manager 1.000 1.000 1.000 1.000 1.000 Golf Course Superintendent 1.000 1.000 1.000 1.000 1.000 Crew Forman/Irrigation Specialist - - 1.000 1.000 1.000 Golf Course Facility Supervisor 1.000 - - - - Golf Course Mechanic 1.000 1.000 1.000 1.000 1.000 Pro-Shop Assistant - 1.500 1.610 1.515 1.515 Maintenance Worker - - - - 1.000 Senior Golf Associate - 1.000 1.000 1.000 - Equipment Operator 0.450 0.500 0.500 0.250 0.250 Registration Clerk I / PAR 3 0.721 - - - - Golf Course Associate 0.259 1.110 1.257 1.002 0.850 Golf Course Attendant 1.220 0.750 0.750 0.461 - Public Works Employees 0.081 0.081 0.081 0.090 0.090
6.731 7.941 9.198 8.318 7.705
360

Recreation Enterprise Fund FY2018
Fiscal Year 2018 Goals and Performance Measures
Recreation Department Goal #1 - Enhance quality of maintenance of the Par 3 Golf Course Clubhouse, greens and fairways
Objectives: Re-evaluate and implement enhanced best practices maintenance procedures
and create a plan for sustaining the improvements Improve training of staff in preventative maintenance tasks Ensure maintenance practices have a positive effect on the surrounding
environment while providing a superior golfing experience
Performance Measures Effectiveness/Output Measures: Projected FY18 Re-evaluate current best practices maintenance Ongoing
Upgrade staff training on maintenance procedures
Conduct additional staff training focusing on maintenance procedures
Recreation Department Goal #2 - Implement staff training opportunities focusing on customer service at all recreation facilities
Objectives: Assess and implement enhanced in-service and online employee trainings Conduct additional staff training for front line staff Continue to execute standard orientation for instructors and employees Provide additional direct supervision by the program and facility supervisors
Performance Measures Effectiveness/Output Measures: Projected FY18
Conduct customer service trainings Ongoing – with in-service and online training opportunities to be conducted
Conduct orientation for instructors and employees Ongoing
Provide more direct supervision by supervisors Ongoing
361

Recreation Enterprise Fund FY2018
Recreation Department Goal #5 - Develop a strategic plan for changes in Town Recreation programs, services, and facilities. Engage with patrons, parents, and community groups to incorporate feedback and ideas in programming services and facilities. Develop a public awareness plan for recreation programs. Prioritize recreation needs.
Objectives: • Continue to formulate a plan for the construction of the future Recreation Center.
Develop a course of action to ensure recreational opportunities remain availablethroughout the construction period, should the process begin this fiscal year
• Continue to solicit feedback from residents concerning programming and facilitydevelopment
• Implement strategies, in conjunction with consultants, for the development of theMaster Plan for the Town Docks and accessory structures
• Increase awareness of program offerings utilizing diverse marketing methods
Performance Measures Effectiveness/Output Measures: Projected FY18
Enhance social media presence Immediate and ongoing Develop new and enhance existing marketing materials Ongoing
Increase the frequency of promotions and number of marketing outlets utilized to promote programs and facilities.
Continuing
Golf Course Productivity Measures
Effectiveness/Output Measures: Actual FY14
Actual FY15
Actual FY16
Actual FY17
Projected FY18
Total Lessons/Clinics Participation 2,163 2,227 1,695 1,528 1,550
Range Buckets Sold 16,473 17,139 15,450 11,678 12,000
Total Rounds of Golf 34,780 35,379 36,861 36,757 37,000
Tournaments/Outings Hosted 27 49 83 85 85
Resident/Nonresident Ratio 25/75 15/85 20/80 18/82 20/80
Operating Cost Recovery 126% 151.7% 149.4% 142.1% 110.0% FY2017 Operating Cost Recovery results are estimated as of October 19, 2017 postings
362

Recreation Enterprise Fund FY2018
PROGRAM: TENNIS
The Tennis program offers drop-in play, lessons, clinics, mixers, tournaments, special events, and league play for children and adults throughout the year. A total of thirteen (13) hydrogrid clay tennis courts are provided at the Seaview Park and Phipps Ocean Park Tennis Centers. A contractual Head Tennis Professional coordinates the teaching services at both facilities, as well as the retail concession for tennis equipment related merchandise. Assistant Tennis Instructors are hired and compensated by the Head Tennis Professional.
The tennis program is supervised by the Assistant Recreation Director. Daily operations are managed by the Facility Supervisor, with assistance from the Facility Assistant and part time and contractual labor staff. Recreation maintenance personnel provide routine and seasonal tennis court maintenance services.
‐
50,000
100,000
150,000
200,000
250,000
300,000
350,000
400,000
FY2015Actual
FY2016Actual
FY2017Budget
FY2018Budget
Tennis
Revenues Expenditures
363

Recreation Enterprise Fund FY2018
REVENUES Daily Tennis Court Fees All revenues related to daily court reservations at tennis facilities
Tennis Program Fees All revenues related to fees paid for a variety of tennis programs
Annual Pass Tennis Court Fees All revenues related to annual tennis facility passes
12 Play Pass This figure represents rate paid for 12 play multi use pass
Tennis Mixers Fee paid for participation in various tournaments and special events
Tennis Pro Admin Fees Fee paid by Tennis Pro as part of annual contract agreement
Tennis Teaching Services Fee paid to the Town for the use of the courts during lessons as part of Tennis pro contract
Facility Rental Fees All revenues related to fees paid for rental of tennis courts
FY2015Actual
FY2016Actual
FY2017Budget
FY2017Adjusted*
FY2017Projected
FY2018Budget
%Change
RevenuesDaily Tennis Court Fees 30,975 28,242 31,000 31,000 26,878 27,500 -11.29%Tennis Program Fee 2,115 1,154 1,800 1,800 347 1,200 -33.33%Annual Pass Tennis Court Fees 53,724 53,856 55,000 55,000 46,931 49,000 -10.91%12 Play Pass 32,627 33,639 35,500 35,500 38,843 42,000 18.31%Tennis Mixers 3,950 4,002 4,300 4,300 3,387 4,000 -6.98%Tennis Pro Admin. Fees 13,200 13,300 13,500 13,500 13,500 13,500 0.00%Tennis Teaching Services-Town Share 66,337 57,517 65,000 65,000 81,306 77,000 18.46%Town Share Tennis Merchandise Sales 3,693 2,416 - - 1,526 2,300 100.00%Facility Rental Fees 4,387 5,373 3,500 3,500 3,770 7,000 100.00%Maintenance & Improvement Fee 7,861 7,532 8,100 8,100 7,290 14,000 72.84%Merchandise Sales 1,339 16,000 16,000 11,180 13,000 -18.75%TOTALS 218,869 208,370 233,700 233,700 234,958 250,500 7.19%ExpensesSalaries and Wages 176,990 156,538 173,499 173,499 137,307 169,095 -2.54%Employee Benefits 92,460 86,236 93,861 93,861 91,247 94,677 0.87%Contractual 54,993 64,584 61,400 61,600 88,231 66,950 9.04%Commodities 17,122 14,102 31,400 31,400 21,579 28,100 -10.51%Capital Outlay - - - - - - 0.00%Depreciation - - - - - - 0.00%Other - - - - - - 0.00%TOTALS 341,565 321,460 360,160 360,360 338,364 358,822 -0.37%Operating Revenues Over/(Under) Expenses (122,696) (113,090) (126,460) (126,660) (103,406) (108,322)
Revenue and Expense Summary
364

Recreation Enterprise Fund FY2018
Maintenance and Improvement Fee Fee paid per court reservation for maintenance and improvement of the tennis facilities
Merchandise Sales Revenue from merchandise sales
EXPENSES Salaries and Wages The salary budget is derived from the payroll data for the Full Time Equivalent Employees (FTE) listed in the table below. The budget includes pay for performance increases and the proposed increase in the ranges.
Employee Benefits The employee benefit costs include FICA, health insurance, retirement costs, any paid incentives and allowances, and the performance bonus. The health insurance and retirement costs are based on an allocation of the total Town costs by FTE per program.
Contractual Increases in expenditures can be attributed to a higher reliance on contractual services.
Commodities Decreases in commodity costs are a result of maintenance tasks performed during previous fiscal year.
Tennis Fiscal Year 2017 Accomplishments Estimated Operating Cost Recovery of 64.8% exceeds goal (60%) Town revenue generated from teaching services increased by over 40% from
previous contractual calendar year. The purchase of 12 play passes have increased by approximately 15% from last
fiscal year. The Tennis Centers hosted seven (7) competitive men’s and women’s tennis
teams through the Palm Beach County Tennis League, two of which were withinthe senior division.
Revenue from merchandise sales increased by over 71%, after expensesFY2017 Operating Cost Recovery results are estimated as of October 19, 2017 postings
Full Time Equivalent Employees FY2014 FY2015 FY2016 FY2017 FY2018Assistant Director 0.250 0.250 0.250 0.250 0.250 Tennis Facility Supervisor 1.000 1.000 1.000 1.000 1.000 Maintenance Worker/Tennis 0.500 0.500 0.500 0.500 0.500 Tennis Facility Assistant 1.000 1.000 1.000 1.000 1.000 Tennis Attendant 2.249 1.755 1.559 1.257 1.208 Laborer 0.641 0.400 0.421 0.024 0.022 Public Works Employees 0.117 0.118 0.118 0.106 0.090
5.757 5.023 4.848 4.137 4.070
365

Recreation Enterprise Fund FY2018
Fiscal Year 2018 Goals and Performance Measures
Recreation Department Goal #2 - Implement staff training opportunities focusing on customer service at all recreation facilities.
Objectives: Assess and implement enhanced in-service and online employee trainings. Conduct additional staff training for front line staff Continue to execute standard orientation for instructors and employees Provide additional direct supervision by the program and facility supervisors
Performance Measures Effectiveness/Output Measures: Projected FY18
Conduct customer service trainings Ongoing – with in-service and online training opportunities to be conducted
Conduct orientation for instructors and employees Ongoing
Provide more direct supervision by supervisors Ongoing
Recreation Department Goal #4 - Increase participation and revenue at the Recreation Center and Tennis Centers
Objectives: Develop and implement marketing strategies for increasing participation Create new and/or enhanced youth and adult programs Develop additional program variety
Performance Measures
Effectiveness/Output Measures: Actual FY14
Actual FY15
Actual FY16
Actual FY17
Projected FY18
Lesson Participation 4,406 4,909 4,019 4,144 4,300
Clinic Participation 4,179 4,149 4,170 3,401 4,000 Daily Youth Participation 4,355 4,410 4,143 3,456 4,000 Daily Adult Participation 21,606 22,302 22,499 23,069 23,000
Performance Measures Effectiveness/Output Measures: Projected FY18 Develop and implement new programs to enhance program variety Ongoing
366

Recreation Enterprise Fund FY2018
Recreation Department Goal #5 - Develop a strategic plan for changes in Town Recreation programs, services, and facilities. Engage with patrons, parents, and community groups to incorporate feedback and ideas in programming services and facilities. Develop a public awareness plan for recreation programs. Prioritize recreation needs.
Objectives: • Continue to formulate plan for the construction of the future Recreation Center.
Develop a course of action to ensure recreational opportunities remain availablethroughout the construction period, should the process begin this fiscal year
• Continue to solicit feedback from residents concerning programming and facilitydevelopment
• Implement strategies, in conjunction with consultants, for the development of theMaster Plan for the Town Docks and accessory structures
• Increase awareness of program offerings utilizing diverse marketing methods
Performance Measures Effectiveness/Output Measures: Projected FY18
Enhance social media presence Immediate and ongoing
Develop new and re-imagine recreation marketing materials Ongoing
Increase the frequency of promotions and number of marketing outlets utilized to promote programs and facilities.
Continuing
Tennis Productivity Measures
Effectiveness/Output Measures: Actual FY14
Actual FY15
Actual FY16
Actual FY17
Projected FY18
Annual Passes Sold 154 127 125 107 115
Tournaments/Special Events 18 19 20 20 20
League Teams Hosted 8 7 7 7 7
Resident/Nonresident Ratio 64/36 65/35 61/39 60/40 63/37
Operating Cost Recovery 65% 64.0% 64.8% 69.4% 60.0% FY2017 Operating Cost Recovery results are estimated as of October 19, 2017 postings
367

Recreation Enterprise Fund FY2018
PROGRAM: RECREATION CENTER
The Recreation Center offers recreational programs to the residents and visitors of Palm Beach. Examples of adult programs offered include a variety of fitness/wellness, foreign languages, art, dancing, and technology offerings. Youth programs include athletics, arts & crafts, dance, self-defense, pre-school programs and a variety of other instructional/enrichment classes. In addition to these activities, an after school program and day camps are offered, along with special events. The Recreation Center program also manages the maintenance of the Seaview Park amenities. This includes the coordination, monitoring, and oversight of daily maintenance, preventative maintenance, and special projects.
The Recreation Center is managed by the Assistant Recreation Director. Daily operations are overseen by two Recreation Supervisors who supervise a variety of part-time and contractual staff in planning, implementing, and evaluating the maintenance, programs and events.
‐
100,000
200,000
300,000
400,000
500,000
600,000
700,000
FY2015Actual
FY2016Actual
FY2017Budget
FY2018Budget
Recreation Center
Revenues Expenditures
368

Recreation Enterprise Fund FY2018
REVENUES Youth Program Fees All revenues related to fees paid for a variety of youth programs
Facility Rental Fees All revenues related to fees paid for rental of rooms at Seaview Recreation Center
Adult Program Fees All revenues related to fees paid for a variety of adult programs
Promotional Merchandise All revenues related to sales of promotional merchandise
Seaview Park Concession Revenues from vending machines at Seaview Park
EXPENSES Salaries and Wages The salary budget is derived from the payroll data for the Full Time Equivalent Employees (FTE) listed in the table below. The budget includes pay for performance increases and the proposed increase in the ranges.
Employee Benefits The employee benefit costs include FICA, health insurance, retirement costs, any paid incentives and allowances, and the performance bonus. The health insurance and retirement costs are based on an allocation of the total Town costs by FTE per program.
Contractual Expenses are expected to remain static.
FY2015Actual
FY2016Actual
FY2017Budget
FY2017Adjusted*
FY2017Projected
FY2018Budget
%Change
RevenuesYouth Program Fees 276,767 308,670 295,500 295,500 329,390 306,000 3.55%Facility Rental Fees 840 700 1,500 1,500 448 500 -66.67%Adult Program Fees 24,083 27,344 27,000 27,000 23,063 26,000 -3.70%Promotional Merchandise 880 859 1,200 1,200 895 1,000 -16.67%Seaview Park Concession 588 531 1,200 1,200 420 1,000 -16.67%TOTALS 303,158 338,104 326,400 326,400 354,216 334,500 2.48%ExpensesSalaries and Wages 280,941 254,240 274,480 274,480 248,818 278,917 1.62%Employee Benefits 109,219 103,271 111,725 111,725 109,497 108,928 -2.50%Contractual 194,705 207,372 233,400 233,700 209,954 231,410 -0.85%Commodities 22,574 28,744 32,300 32,300 28,766 31,600 -2.17%Capital Outlay - - - - - - 0.00%Depreciation - - - - - - 0.00%Other - - - - - - 0.00%TOTALS 607,439 593,627 651,905 652,205 597,035 650,855 -0.16%Operating Revenues Over/(Under) Expenses (304,281) (255,523) (325,505) (325,805) (242,819) (316,355)
Revenue and Expense Summary
369

Recreation Enterprise Fund FY2018
Commodities A slight decrease in expenses is anticipated due to a minor reduction in program and building maintenance supplies.
Recreation Center Fiscal Year 2017 Accomplishments Estimated Operating Cost Recovery of 59.3% exceeds goal (50%) The plans for the new Recreation Center progressed through the development and
approval process. Offered over 216 programs, serviing over 16,000 participants.
FY2017 Operating Cost Recovery results are estimated as of October 19, 2017 postings
Full Time Equivalent Employees FY2014 FY2015 FY2016 FY2017 FY2018Assistant Director 0.250 0.250 0.250 0.250 0.250 Recreation Supervisor 2.000 2.000 2.000 2.000 2.000 Maintenance Worker/Tennis 0.500 0.500 0.500 0.500 0.500 Activity Leader 3.760 2.983 2.983 2.500 2.500 Laborer 0.550 0.490 0.490 0.440 0.061 Bus Driver 0.500 0.480 0.480 0.365 0.410 Public Works Employees 0.029 0.129 0.130 0.121 0.106
7.589 6.832 6.833 6.176 5.827
370

Recreation Enterprise Fund FY2018
Fiscal Year 2018 Goals and Performance Measures
Recreation Department Goal #2 - Implement staff training opportunities focusing on customer service at all recreation facilities
Objectives: Assess and implement enhanced in-service and online employee trainings. Conduct additional staff training for front line staff Continue to execute standard orientation for instructors and employees Provide additional direct supervision by the program and facility supervisors
Performance Measures Effectiveness/Output Measures: Projected FY18
Conduct customer service trainings Ongoing – with in-service and online training opportunities to be conducted
Conduct orientation for instructors and employees Ongoing
Provide more direct supervision by supervisors Ongoing
Recreation Department Goal #4 - Increase participation and revenue at the Recreation Center and Tennis Centers
Objectives: Develop and implement marketing strategies for increasing participation Create new and/or enhanced youth and adult programs Develop additional program variety
Recreation Center Productivitiy Measures
Effectiveness/Output Measures: Actual FY14
Actual FY15
Actual FY16
Actual FY17
Projected FY18
Family Special Events Participation 1,290 1,190 1,200 1,240 1,250 Youth Enrichment/Athletics Participation 3,480 3,541 3,610 4,208 4,300
Youth Camps/After School Participation 11,127 10,192 10,064 9,708 10,000
Adult Enrichment/Fitness Participation 1,922 1,599 1,575 1,760 1,900 Number of Unique Programs / Sessions Offered* 187 182 211 50/221 55/235
Resident /Nonresident Ratio – Youth 60/40 38/62 38/62 35/65 40/60
Resident /Nonresident Ratio - Adult 78/22 83/17 71/29 85/15 80/20
Operating Cost Recovery 56% 50% 56.9% 59.3% 50.0% *Changed in FY17 from Number of Programs Offered and Classes Held to Number of Unique ProgramsOffered and Number of Sessions Offered to better indicate the variety and scope of programs opportunities.
371

Recreation Enterprise Fund FY2018
Recreation Department Goal #5 - Develop a strategic plan for changes in Town Recreation programs, services, and facilities. Engage with patrons, parents, and community groups to incorporate feedback and ideas in programming services and facilities. Develop a public awareness plan for recreation programs. Prioritize recreation needs.
Objectives: • Continue to formulate plan for the construction of the future Recreation Center.
Develop a course of action to ensure recreational opportunities remain availablethroughout the construction period, should the process begin this fiscal year
• Continue to solicit feedback from residents concerning programming and facilitydevelopment
• Implement strategies, in conjunction with consultants, for the development of theMaster Plan for the Town Docks and accessory structures
• Increase awareness of program offerings utilizing diverse marketing methods
Performance Measures Effectiveness/Output Measures: Projected FY18
Enhance social media presence Immediate and ongoing
Develop new and re-imagine recreation marketing materials Ongoing
Increase the frequency of promotions and number of marketing outlets utilized to promote programs and facilities.
Continuing
372

Recreation Enterprise Fund FY2018
PROGRAM: ADMINISTRATION
Administrative management responsibilities include providing leadership and organizational management of all Recreation Department operations. The administrative management team is responsible for budget development and control, business plan modifications, department policies and procedures, action planning, record keeping, recruitment, training and development of staff, payroll processing, coordinating/processing work requests, requisitions and contracts. Administration duties also include complaint management and conflict resolution, risk management, enforcement of ordinances, rules and regulations at all Town recreation facilities, and the ongoing assessment and evaluation of Recreation Department facilities, programs and services offered to the community. Department administration is also responsible for the coordination, facilitation, and support of Recreation Advisory Commission meetings and its members. Administrative staff also coordinates communication with the Town Manager and the Mayor and Town Council. The administrative management team consists of the Director of Recreation, Assistant Recreation Director, Office Manager and Administrative Clerk.
Salaries and Wages The salary budget is derived from the payroll data for the Full Time Equivalent Employees (FTE) listed in the table below. The budget includes pay for performance increases and the proposed increase in the ranges.
Employee Benefits The employee benefit costs include FICA, health insurance, retirement costs, any paid incentives and allowances, and the performance bonus. The health insurance and retirement costs are based on an allocation of the total Town costs by FTE per program.
Contractual Increased expenditures due to the additional expense for software maintenance for the recreation registration solution.
Commodities Slight expenditure increase due to rise in commodity costs.
FY2015Actual
FY2016Actual
FY2017Budget
FY2017Adjusted*
FY2017Projected
FY2018Budget
%Change
Salaries and Wages 203,020 281,797 297,633 297,633 283,835 316,008 6.17%Employee Benefits 101,467 130,735 139,790 139,790 135,382 143,823 2.89%Contractual 9,303 5,585 10,700 10,700 6,967 12,900 20.56%Commodities 3,657 2,828 5,600 5,600 4,189 5,720 2.14%Capital Outlay - - - - - - 0.00%Depreciation - - - - - - 0.00%Other - - - - - - 0.00%TOTALS 317,447 420,945 453,723 453,723 430,373 478,451 5.45%
Expense Summary
Full Time Equivalent Employees FY2014 FY2015 FY2016 FY2017 FY2018Director of Recreation - - 1.000 1.000 1.000 Director of Recreation and Special Projects 0.900 0.900 - - - Assistant Director of Recreation 0.500 0.500 0.500 0.500 0.500 Office Assistant II 0.750 1.000 1.000 1.000 1.000 Office Manager 1.000 1.000 1.000 1.000 1.000
3.150 3.400 3.500 3.500 3.500
373

Recreation Enterprise Fund FY2018
PROGRAM: CAPITAL PROGRAM
This program accounts for the capital projects of the Recreation Enterprise Fund.
FY2015Actual
FY2016Actual
FY2017Budget
FY2017Adjusted*
FY2017Projected
FY2018Budget
%Change
RevenuesDonations - - - - 98,642 6,571,154 100.00%Grant Revenue - - 50,000 50,000 - - -100.00%Interest on Investments 8,159 64,271 12,600 12,600 58,184 14,000 11.11%Transfer from Reserves - - - - - 3,263,868 100.00%TOTALS 8,159 64,271 62,600 62,600 156,826 9,849,022 15633.26%ExpensesProjects 75,565 164,800 588,489 588,489 98,092 10,207,511 1634.53%TOTALS 75,565 164,800 588,489 588,489 98,092 10,207,511 1634.53%Revenues Over/(Under) Expenses (67,406) (100,529) (525,889) (525,889) 58,734 (358,489)
Revenue and Expense Summary
374

Recreation Five Year Capital Improvement Plan
FY2018 Budget
EXPENDITURES FY2018 FY2019 FY2020 FY2021
Item # Description Location Estimated Estimated Estimated Estimated
Recreation
Par 3 Golf Course 90,000$ 170,000$ 98,500$ 97,500$
1 Replace Synthetic Turf Driving Range 12,000$ ‐$ ‐$ ‐$
2 Replace AC Air Condensers Clubhouse 20,000$ ‐$ ‐$ ‐$
3 Refinish Limestone Front Steps Clubhouse ‐$ ‐$ ‐$ 7,000$
4 Refinish Restroom Floors Clubhouse ‐$ ‐$ ‐$ 7,000$
5 Replace Exterior High Hats Clubhouse ‐$ 10,000$ ‐$ ‐$
6 Resurface Parking Lot Clubhouse ‐$ ‐$ 15,000$ ‐$
7 Level 9 black tees Golf Course 50,000$ ‐$ 50,000$ 50,000$
8 Rebuild and Enlarge Putting Area Golf Course ‐$ 150,000$ ‐$ ‐$
9 Renovate Irrigation System Golf Course ‐$ ‐$ 33,500$ 33,500$
10 Replace Course Signage Golf Course ‐$ 10,000$ ‐$ ‐$
11 Paint exterior/interior Clubhouse ‐$ ‐$ ‐$ ‐$
12 Paint and Stripe Parking Lot Clubhouse 8,000$ ‐$ ‐$ ‐$
Docks 40,000$ ‐$ 11,450,000$ ‐$
1 Upgrade WiFi 40,000$ ‐$ ‐$ ‐$
2 Replace Dock Office Australian Dock ‐$ ‐$ 350,000$ ‐$
3 Replace Dock Building Brazilian Dock ‐$ ‐$ 100,000$ ‐$
4 Replace Docks ‐$ ‐$ 11,000,000$ ‐$
Tennis ‐$ 63,000$ ‐$ 9,000$
1 Resurface Courts Seaview ‐$ 50,000$ ‐$ ‐$
2 Resurface and Finish Wood Exteriors Phipps ‐$ 8,000$ ‐$ ‐$
3 Paint Exterior/Restroom Interiors Phipps ‐$ 5,000$ ‐$ ‐$
4 Replace Air Hamdlers & Condensers Phipps ‐$ ‐$ ‐$ 9,000$
Recreation Center 9,809,022$ 500,000$ ‐$ 25,000$
1 Recreation Center & Seaview Park 9,809,022$ 500,000$ ‐$ ‐$
2 Interior Painting ‐$ ‐$ 25,000$
Capital Improvement Program Expenditures 9,939,022$ 733,000$ 11,548,500$ 131,500$
REVENUES FY2018 FY2019 FY2020 FY2021
Source Estimated Estimated Estimated Estimated
Transfer from Reserves 3,237,868$ 500,000$ ‐$ ‐$
Mandel Foundation Grant 2,909,429$ ‐$ ‐$ ‐$
Friends of Recreation 3,661,725$ ‐$ ‐$ ‐$
M&I Reserve ‐ Par 3 Golf Course 62,000$ ‐$ ‐$
M&I Reserve ‐ Par 3 Clubhouse 28,000$ ‐$ ‐$
Financing ‐$ ‐$ 11,000,000$ ‐$
Reserves 26,000$ 219,000$ 534,500$ 117,500$
Interest 14,000$ 14,000$ 14,000$ 14,000$
Capital Improvement Program Revenues 9,939,022$ 733,000$ 11,548,500$ 131,500$
NET COST FY2018 FY2019 FY2020 FY2021
(Surplus / (Deficit)) Estimated Estimated Estimated Estimated
Sub‐Total ‐ Net Cost ‐$ ‐$ ‐$ ‐$
375

Recreation Enterprise Fund FY2018
PROGRAM: DEPRECIATION PROGRAM
The depreciation program was established to account for the depreciation expense for the fixed assets, buildings and other capital assets of the Recreation Enterprise Fund.
FY2015Actual
FY2016Actual
FY2017Budget
FY2017Projected
FY2018Budget
%Change
Depreciation 735,012 721,844 955,329 955,329 1,049,626 9.87%TOTALS 735,012 721,844 955,329 955,329 1,049,626 9.87%
Expense Summary
376

Recreation Enterprise Fund FY2018
PROGRAM: EQUIPMENT REPLACEMENT
The Equipment Replacement program was established to provide a means to replace equipment when the end of the useful life has been reached. Equipment is replaced when it is determined that due to its age, condition, operation and maintenance costs, obsolescence, and depreciation, it is no longer economical to keep. Annually, depreciation is budgeted based on the economic life and the replacement cost of the equipment utilized by the fund. These funds are set aside in a reserve to fund future purchases of equipment.
Depreciation for the fixed assets is calculated using the straight line method which takes the estimated replacement cost less anticipated salvage value divided by the expected useful life of the asset. The established asset value threshold for inclusion in the program is $2,500 for fixed assets.
FY2015Actual
FY2016Actual
FY2017Budget
FY2017Adjusted*
FY2017Projected
FY2018Budget
%Change
Capital Outlay - 6,370 66,300 66,300 47,914 84,000 26.70%TOTALS - 6,370 66,300 66,300 47,914 84,000 26.70%
Budgeted Purchases:6 Greens Mowers 60,000 Tennis Court Roller 9,000 Service Maintenance Cart 15,000
84,000
Expense Summary
377

(This page intentionally left blank)
378

Town of Palm Beach
Self Insurance – Risk (501)


Self Insurance Fund - Risk FY2018
PROGRAM: SELF INSURANCE FUND (RISK MANAGEMENT) 501
Mission: This division exists to provide a safe and healthy work environment for all employees, and to minimize the adverse effects of unexpected losses. Ensuring that a Comprehensive Risk Management Program is in place that best protects the interests of the Town and its employees.
Main Activities: The most important things we do to fulfill the mission are: • Identify exposures and address resolutions• Determine proper method for insurance coverage by analyzing options• Manage claims in a manner that serves both the interests of the claimant as well as
the Town• Apply a variety of approaches to control loss and improve personal safety through
the following:o Safety Training, committees, bulletins, manual and handbooko Periodic safety inspections of Town facilities and propertyo Conducting motor vehicle report checkso Create various manuals and procedures as needed
REVENUES Risk Funding This is the amount transferred from the general fund.
Miscellaneous Claim reimbursements received from insurance carriers.
FY2015Actual
FY2016Actual
FY2017Budget
FY2017Projected
FY2018Budget
%Change
RevenuesRisk Funding 1,925,362 1,934,595 1,838,037 1,838,037 1,828,475 -0.52%Miscellaneous Revenue 723,686 362,660 120,000 - 0.00%Interest on Investments 100,789 122,301 75,000 56,514 121,162 61.55%TOTALS 2,749,837 2,419,556 1,913,037 2,014,551 1,949,637 1.91%ExpensesSalaries and Wages 85,870 99,568 100,868 99,594 129,276 28.16%Employee Benefits 306,028 428,043 723,554 390,459 757,245 4.66%Contractual 1,572,167 1,499,003 1,582,201 1,776,021 1,558,532 -1.50%Commodities 2,704 2,638 3,262 3,444 4,584 40.53%Capital Outlay - 0.00%Depreciation 2,758 2,759 2,758 2,758 - -100.00%Transfer to Coastal (309) - 0.00%Other (Contingency) 6,482 - 3,000,000 - 3,000,000 0.00%TOTALS 1,976,009 2,032,011 5,412,643 2,272,276 5,449,637 0.68%Total Revenues Over/(Under) Expenses 773,828 387,545 (3,499,606) (257,725) (3,500,000) Beginning Net Assets 7,297,409 8,071,237 8,458,782 8,458,782 8,201,057 ENDING NET ASSETS 8,071,237 8,458,782 4,959,176 8,201,057 4,701,057
Revenue and Expense Summary
379

Self Insurance Fund - Risk FY2018
Interest on Investments The interest revenue is based upon the financial market conditions and funds available for investment.
EXPENSES Salaries and Wages The salary budget is derived from the payroll data for the Full Time Equivalent Employees (FTE) listed in the table below. The budget includes pay for performance increases and the proposed increase in the ranges.
Employee Benefits The employee benefit costs include FICA, health insurance, retirement costs, any paid incentives and allowances, and the performance bonus. The health insurance and retirement costs are based on an allocation of the total Town costs by FTE per program.
Contractual Slight decrease is due to a reduction in office expenditures and insurance costs.
Commodities Increase is due to Finance moving the training account.
Full Time Equivalent Employees FY2014 FY2015 FY2016 FY2017 FY2018Risk Manager 1.000 1.000 1.000 1.000 1.000 Administrative Assistant - - - - 0.500 Occupational Health Nurse - - 0.160 0.160 0.160
1.000 1.000 1.160 1.160 1.660
380

Self Insurance Fund - Risk FY2018
Fiscal Year 2018 Goals and Performance Measures
Self Insurance Risk Fund Goal #1 - Identify exposures in order to determine the type of coverage available to the Town.
Objectives: • Work with Insurance Agents to obtain the best coverages and premiums available
to the Town• Structure the insurance program to best protect the interests of the Town
Performance Measures Effectiveness/Output Measures:
Actual FY14
Actual FY15
Actual FY16
Actual FY17
Projected FY18
Annual insurance premiums $885,967 $944,051 $843,355 $803,262 $809,090
Total claims processed 80 151 155 214 150
Self Insurance Risk Fund Goal #2 - Provide a Safe Work Environment
Objective: • Conduct annual facility safety inspections
Performance Measures
Effectiveness/Output Measures: Actual FY14
Actual FY15
Actual FY16
Actual FY17
Projected FY18
Total number of safety violations found town-wide during the annual facility safety inspections
75 122 78 127 100
Safety Bulletins distributed 12 12 12 12 12
381

(This page intentionally left blank)
382

Town of Palm Beach
Self Insurance – Health (502)


Self Insurance Fund - Health FY2018
PROGRAM: SELF INSURANCE FUND (HEALTH BENEFIT) 502
This program provides for the management of the employee health insurance program. Responsibilities include: planning, organizing, implementing, and directing the self-insurance fund of the Town’s Health Insurance Program. This program also provides certain health insurance benefits for retired employees and their dependents in accordance with State and Federal regulations.
REVENUES Group Medical Group Medical includes Town and Employee contributions for health care expenses. Plan funding requirements are determined by experience and actuary analysis conducted by Willis of Florida.
Full Time Equivalent Employees FY2014 FY2015 FY2016 FY2017 FY2018Director of Human Resources 0.100 0.100 0.100 0.100 0.100 Assistant Director of Human Resources 0.200 0.200 0.200 0.200 0.200 Office Asst II/OHC 0.125 0.125 0.125 0.125 0.125 Occupational Health & Wellness Nurse - - 0.170 0.170 0.170 Human Resources Coordinator 0.320 0.320 0.320 0.320 0.320 Human Resource Analyst 0.050 0.050 0.050 0.100 0.100
0.795 0.795 0.965 1.015 1.015
FY2015Actual
FY2016Actual
FY2017Budget
FY2017Projected
FY2018Budget
%Change
RevenuesEmployer Contributions 3,949,628 3,949,050 3,961,200 3,961,200 3,961,200 0.00%Employee Contributions 853,423 850,634 845,700 833,935 1,018,296 20.41%Miscellaneous Revenue 124,652 109,918 - 77,459 - 0.00%Interest Income 32,806 77,293 45,000 34,534 45,000 0.00%TOTALS 4,960,509 4,986,895 4,851,900 4,907,128 5,024,496 3.56%ExpensesSalaries and Wages 60,564 69,123 75,518 68,360 77,819 3.05%Employee Benefits 4,126,095 4,092,251 4,628,357 4,233,923 4,908,065 6.04%Contractual 57,111 57,260 137,390 53,390 98,113 -28.59%Commodities 1,004 1,791 2,286 2,091 2,103 -8.01%Capital Outlay - - - - - 0.00%Depreciation - - - - - 0.00%Other (Contingency) - - 500,000 - 500,000 0.00%TOTALS 4,244,774 4,220,425 5,343,551 4,357,764 5,586,100 4.54%
Total Revenues Over/(Under) Expenses 715,735 766,470 (491,651) 549,364 (561,604) Beginning Net Assets 5,025,134 5,740,869 6,507,339 6,507,339 7,056,703 ENDING NET ASSETS 5,740,869 6,507,339 6,015,688 7,056,703 6,495,099
Revenue and Expense Summary
383

Self Insurance Fund - Health FY2018
Miscellaneous Revenue This amount consists of interest earnings.
Gain/(Loss) on Investments Gain/(loss) on investments represents revenue earned or investment losses on the investments in the trust.
EXPENSES Salaries and Wages The salary budget is derived from the payroll data for the Full Time Equivalent Employees (FTE) listed in the table below. The budget includes pay for performance increases and the proposed increase in the ranges.
Employee Benefits The employee benefit costs include FICA, health insurance, retirement costs, any paid incentives and allowances, and the performance bonus. It also include the Town-wide employee health insurance program.
Contractual Funding for telemedicine services previously budgeted under this section has been removed. The service was obtained through Florida Blue, the Town’s medical insurance vendor, at a lower cost to the Town.
Commodities The proposed budget for commodities includes the cost membership dues and nursing license cost for the Town Nurse. The nursing license renews every other year. FY18 is an off year.
384

Town of Palm Beach
Equipment Replacement Fund (320)


Equipment Replacement Fund FY2018
EQUIPMENT REPLACEMENT FUND (320)
This fund was established to provide a means to replace capital and computer equipment, excluding enterprise fund equipment, when the end of its useful life has been reached.
Equipment is replaced when it is determined that due to its age, condition, operation and maintenance costs, obsolescence, and depreciation, it is no longer economical to maintain. Depreciation is funded annually with a transfer from the various departments to the Equipment Replacement Fund based on the economic life and replacement cost of the equipment utilized by each department. The calculation for funding was modified in FY2006 to use replacement cost rather than original cost to insure sufficient funds are available when the asset is replaced.
Depreciation for fixed assets is calculated using the straight line method which takes replacement cost less anticipated salvage value divided by the expected useful life of the asset.
The established asset value threshold for inclusion in the Equipment Replacement Fund is: $2,500 for fixed assets, and $1,500 for computer assets.
Depreciation Charges by Department FY2018
Department Depreciation
Information Systems $308,480
Human Resources 677
Finance 4,706
Planning, Zoning and Building 104,568
Fire-Rescue 617,854
Police 558,837
Public Works 678,720
Risk Management 2,758
Total Depreciation $2,276,600
385
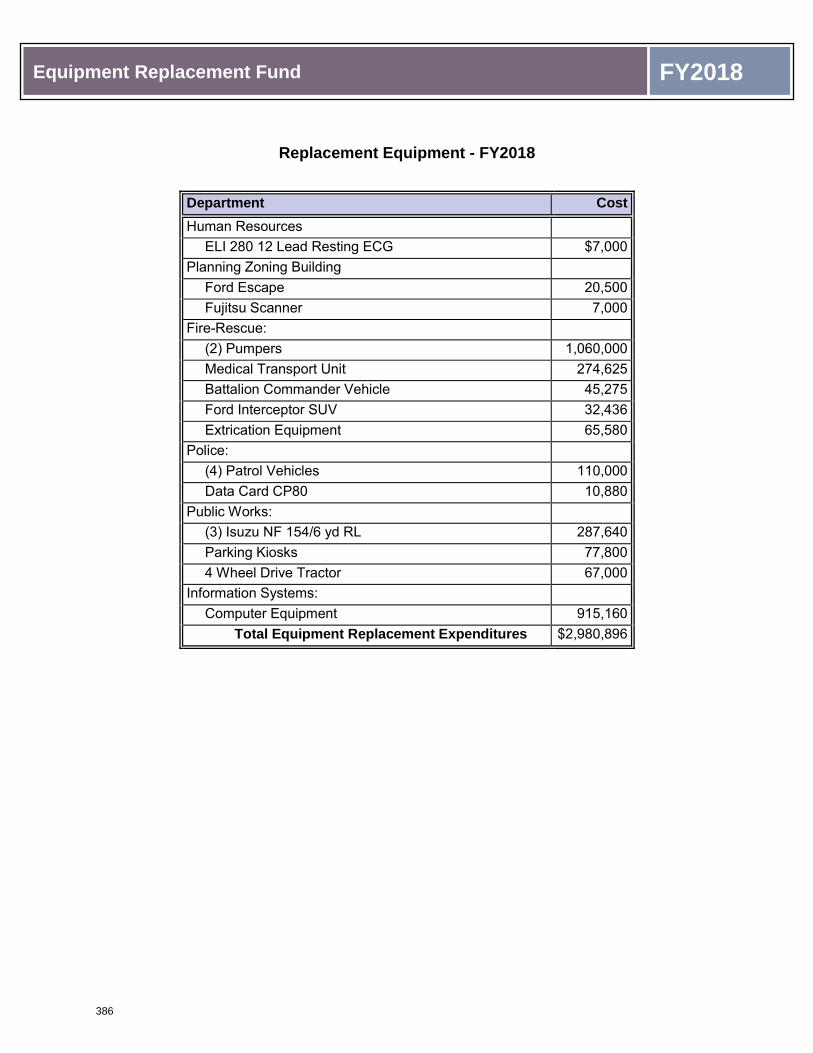
Equipment Replacement Fund FY2018
Replacement Equipment - FY2018
Department Cost Human Resources
ELI 280 12 Lead Resting ECG $7,000 Planning Zoning Building
Ford Escape 20,500 Fujitsu Scanner 7,000
Fire-Rescue: (2) Pumpers 1,060,000
Medical Transport Unit 274,625 Battalion Commander Vehicle 45,275 Ford Interceptor SUV 32,436 Extrication Equipment 65,580
Police: (4) Patrol Vehicles 110,000
Data Card CP80 10,880 Public Works:
(3) Isuzu NF 154/6 yd RL 287,640 Parking Kiosks 77,800 4 Wheel Drive Tractor 67,000
Information Systems: Computer Equipment 915,160
Total Equipment Replacement Expenditures $2,980,896
386

Equipment Replacement Fund FY2018
REVENUES Interest on Investments The interest revenue is based upon the financial market conditions and funds available for investment
Surplus Equipment Proceeds This revenue source represents the sale of surplus equipment
Advance Town-Wide Undergrounding Return to the Equipment Replacement Fund of the Advance to the Town-Wide Underground Fund
Transfer from General and Other Funds This transfer represents the depreciation expense charged to General Fund program budgets and transferred to the Equipment Replacement Fund on an annual basis
EXPENSES Transfer to Underground Utility Assessment Fund This transfer represents funding for the Internal Financing Plan approved by Town Council on August 14, 2012 for neighborhood projects
Contractual Moving services for auction
Advance to Town-Wide Undergrounding Transfer from the Equipment Replacement Fund to the Town-Wide Underground Fund
Capital Outlay – Equipment This represents the budget for the replacement of vehicles, machinery and office equipment
Capital Outlay – IS Equipment This represents the budget for the replacement of computer equipment
Contingency Contingency reserve
FY2015Actual
FY2016Actual
FY2017Budget
FY2017Projected
FY2018Budget
%Change
RevenuesInterest on Investments 135,001 146,385 86,000 100,000 120,000 39.53%Surplus Equipment Proceeds 138,908 16,636 30,000 30,000 30,000 0.00%Advance Town-Wide Undergrounding - - - - 12,750,000 100.00%Transfer from General and Other Funds 1,817,444 2,486,291 2,298,133 2,298,133 2,276,600 -0.94%TOTALS 2,091,353 2,649,312 2,414,133 2,428,133 15,176,600 528.66%ExpensesTransfer to Underground Utility Assessment Fund - - 1,500,000 1,500,000 2,000,000 33.33%Contractual - - 5,000 5,000 10,000 100.00%Advance to Town-Wide Undergrounding - - - - 12,750,000 100.00%Capital Outlay - Equipment 956,490 1,300,548 1,678,369 1,900,000 2,065,736 23.08%Capital Outlay - IS Equipment 212,825 186,186 456,850 150,000 915,160 100.32%TOTALS 1,169,315 1,486,734 3,640,219 3,555,000 17,740,896 387.36%Total Revenues Over/(Under) Expenses 922,038 1,162,578 (1,226,086) (1,126,867) (2,564,296) Contingency - - (500,000) - (500,000) Non Operating Rev/Exp (154,164) 367,207 - - - Beginning Investment in Capital Assets 9,898,819 9,594,911 9,510,747 9,510,747 9,700,000 Beginning Unrestricted Net Assets 12,232,932 13,304,714 14,918,663 14,918,663 14,918,663 ENDING NET ASSETS 22,899,625 24,429,410 22,703,324 23,302,543 21,554,367
Revenue and Expense Summary
387

(This page intentionally left blank)
388
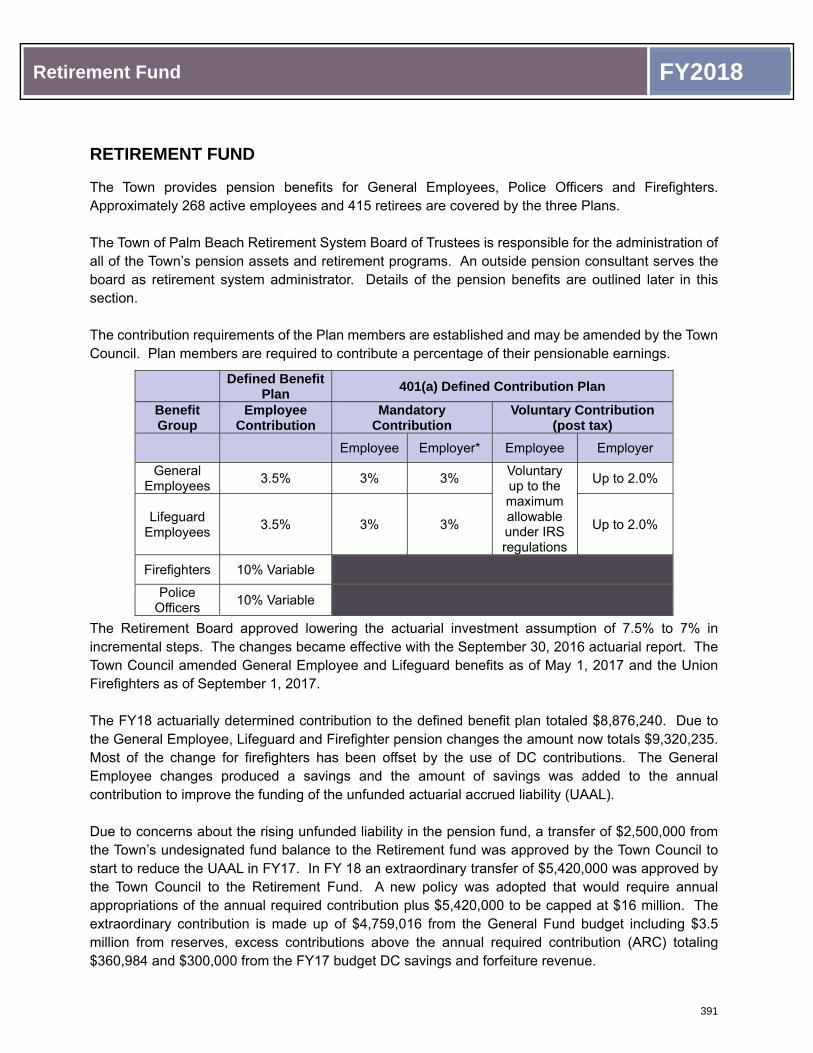
Retirement Fund FY2018
RETIREMENT FUND
The Town provides pension benefits for General Employees, Police Officers and Firefighters. Approximately 268 active employees and 415 retirees are covered by the three Plans.
The Town of Palm Beach Retirement System Board of Trustees is responsible for the administration of all of the Town’s pension assets and retirement programs. An outside pension consultant serves the board as retirement system administrator. Details of the pension benefits are outlined later in this section.
The contribution requirements of the Plan members are established and may be amended by the Town Council. Plan members are required to contribute a percentage of their pensionable earnings.
The Retirement Board approved lowering the actuarial investment assumption of 7.5% to 7% in incremental steps. The changes became effective with the September 30, 2016 actuarial report. The Town Council amended General Employee and Lifeguard benefits as of May 1, 2017 and the Union Firefighters as of September 1, 2017.
The FY18 actuarially determined contribution to the defined benefit plan totaled $8,876,240. Due to the General Employee, Lifeguard and Firefighter pension changes the amount now totals $9,320,235. Most of the change for firefighters has been offset by the use of DC contributions. The General Employee changes produced a savings and the amount of savings was added to the annual contribution to improve the funding of the unfunded actuarial accrued liability (UAAL).
Due to concerns about the rising unfunded liability in the pension fund, a transfer of $2,500,000 from the Town’s undesignated fund balance to the Retirement fund was approved by the Town Council to start to reduce the UAAL in FY17. In FY 18 an extraordinary transfer of $5,420,000 was approved by the Town Council to the Retirement Fund. A new policy was adopted that would require annual appropriations of the annual required contribution plus $5,420,000 to be capped at $16 million. The extraordinary contribution is made up of $4,759,016 from the General Fund budget including $3.5 million from reserves, excess contributions above the annual required contribution (ARC) totaling $360,984 and $300,000 from the FY17 budget DC savings and forfeiture revenue.
Defined Benefit Plan 401(a) Defined Contribution Plan
Benefit Group
Employee Contribution
Mandatory Contribution
Voluntary Contribution (post tax)
Employee Employer* Employee Employer
General Employees 3.5% 3% 3% Voluntary
up to the maximum allowable under IRS regulations
Up to 2.0%
Lifeguard Employees 3.5% 3% 3% Up to 2.0%
Firefighters 10% Variable
Police Officers 10% Variable
391
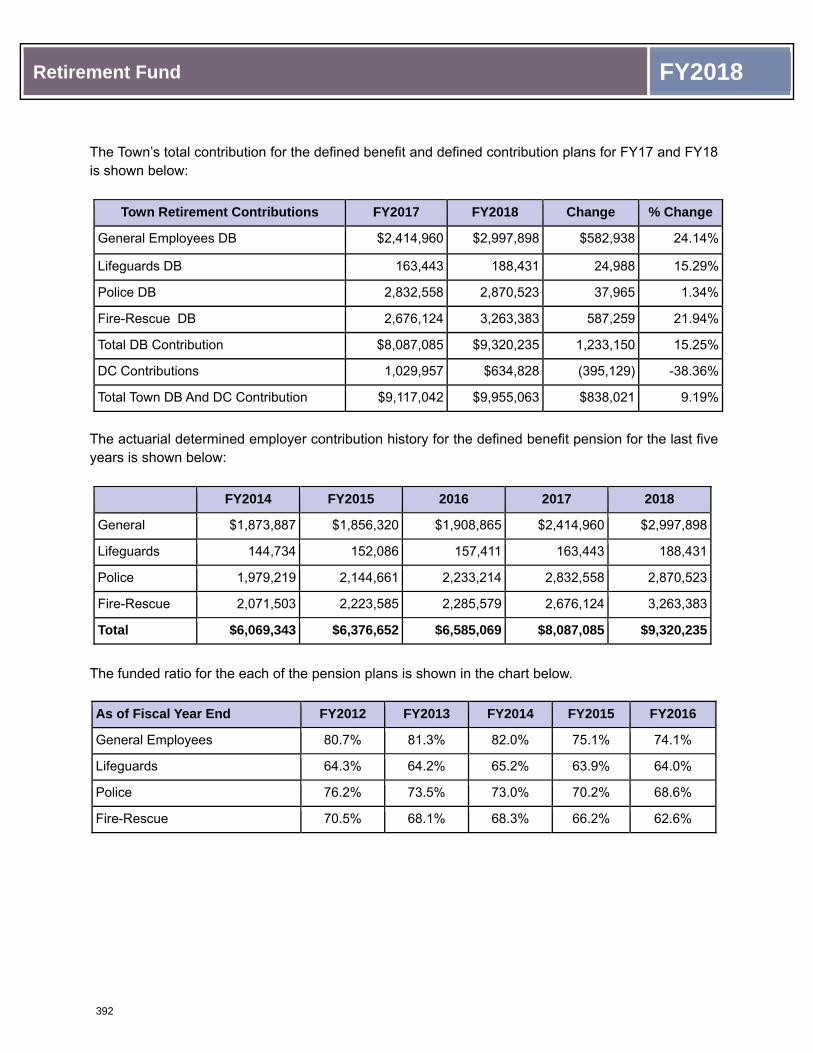
Retirement Fund FY2018
The Town’s total contribution for the defined benefit and defined contribution plans for FY17 and FY18 is shown below:
Town Retirement Contributions FY2017 FY2018 Change % Change
General Employees DB $2,414,960 $2,997,898 $582,938 24.14%
Lifeguards DB 163,443 188,431 24,988 15.29%
Police DB 2,832,558 2,870,523 37,965 1.34%
Fire-Rescue DB 2,676,124 3,263,383 587,259 21.94%
Total DB Contribution $8,087,085 $9,320,235 1,233,150 15.25%
DC Contributions 1,029,957 $634,828 (395,129) -38.36%
Total Town DB And DC Contribution $9,117,042 $9,955,063 $838,021 9.19%
The actuarial determined employer contribution history for the defined benefit pension for the last five years is shown below:
FY2014 FY2015 2016 2017 2018
General $1,873,887 $1,856,320 $1,908,865 $2,414,960 $2,997,898
Lifeguards 144,734 152,086 157,411 163,443 188,431
Police 1,979,219 2,144,661 2,233,214 2,832,558 2,870,523
Fire-Rescue 2,071,503 2,223,585 2,285,579 2,676,124 3,263,383
Total $6,069,343 $6,376,652 $6,585,069 $8,087,085 $9,320,235
The funded ratio for the each of the pension plans is shown in the chart below.
As of Fiscal Year End FY2012 FY2013 FY2014 FY2015 FY2016
General Employees 80.7% 81.3% 82.0% 75.1% 74.1%
Lifeguards 64.3% 64.2% 65.2% 63.9% 64.0%
Police 76.2% 73.5% 73.0% 70.2% 68.6%
Fire-Rescue 70.5% 68.1% 68.3% 66.2% 62.6%
392

Retirement Fund FY2018
Based on recent pension changes, the Town no longer provides a DC plan for public safety employees. For General Employees and Lifeguards, the new plan was modified and now the Town contributes a mandatory match of 3% and an optional match of 2% to the Defined Contribution (DC) plan. Total employer contributions to the DC plan per year are shown below:
The table below shows the breakdown in costs between Normal Cost and the amortization of the UAAL by benefit tier (Plan B and Legacy), for the plan as a whole and each employee group. A small number of grandfathered employees continue to accrue benefits under the legacy plan and their normal cost is included in the legacy plan below. The charts includes the General Employee benefit change, but was prepared prior to the recent union Firefighter benefit change.
FY2014 Actual
FY2015 Actual
FY2016 Actual
FY2017 Budget
FY2018 Budget
General $699,122 $756,792 $817,696 $923,990 $626,050
Lifeguards 10,943 12,410 14,850 13,357 8,778
Police 265,191 294,148 287,545 0 0
Fire-Rescue 174,650 154,893 153,963 92,610 0
Total $1,149,906 $1,218,243 $1,274,054 $1,029,957 $634,828
Total Plan General Ocean Rescue Police FirefightersParticipants 268 165 4 48 51Total PlanEmployer Normal Cost 7.39% 6.70% 6.92% 9.79% 7.07%Amortization of UAAL 41.29% 19.34% 97.62% 67.08% 78.99% Total 48.68% 26.04% 104.54% 76.87% 86.06%Town Contribution 9,055,557$ 2,881,982$ 181,145$ 2,870,523$ 3,121,907$
Plan B - Ongoing PlanEmployer Normal Cost 6.72% 5.80% 6.92% 9.11% 7.07%Amortization of UAAL 0.45% 0.44% 0.29% 0.51% 0.41% Total 7.17% 6.24% 7.21% 9.62% 7.48%Town Contribution 1,333,686$ 690,613$ 12,493$ 359,236$ 271,344$
Plan A - Legacy PlanEmployer Normal Cost 0.67% 0.90% 0.00% 0.68% 0.00%Amortization of UAAL 40.84% 18.90% 97.33% 66.57% 78.58% Total 41.51% 19.80% 97.33% 67.25% 78.58%Town Contribution 7,721,871$ 2,191,369$ 168,652$ 2,511,287$ 2,850,563$
Actuarially Determined Contribution Breakdown by Benefit Tier
Valuation Date: September 30, 2016
393
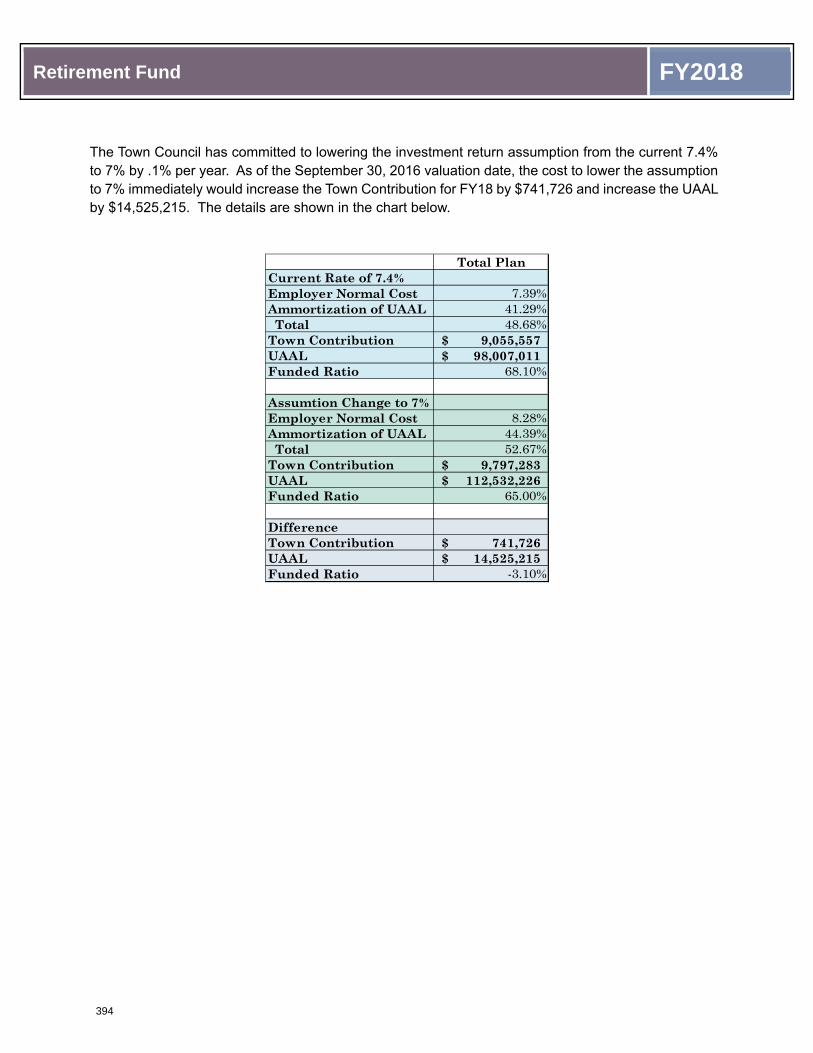
Retirement Fund FY2018
The Town Council has committed to lowering the investment return assumption from the current 7.4% to 7% by .1% per year. As of the September 30, 2016 valuation date, the cost to lower the assumption to 7% immediately would increase the Town Contribution for FY18 by $741,726 and increase the UAAL by $14,525,215. The details are shown in the chart below.
Total PlanCurrent Rate of 7.4%Employer Normal Cost 7.39%Ammortization of UAAL 41.29% Total 48.68%Town Contribution 9,055,557$ UAAL 98,007,011$ Funded Ratio 68.10%
Assumtion Change to 7%Employer Normal Cost 8.28%Ammortization of UAAL 44.39% Total 52.67%Town Contribution 9,797,283$ UAAL 112,532,226$ Funded Ratio 65.00%
DifferenceTown Contribution 741,726$ UAAL 14,525,215$ Funded Ratio -3.10%
394

Retirement Fund FY2018
UAAL and Employer Contribution Forecast A ten-year forecast of the Unfunded Actuarial Accrued Liability (UAAL) and Employer Contribution has been prepared by the actuary. The current assumptions include the reduction in investment return by .1% per year from 7.4% used in the September 30, 2016 Actuarial Valuation Report to 7.0% as of September 30, 2020 and the payroll growth assumption is assumed to decrease by .25% per year from 3.25% used in the September 30, 2016 report to 2.75% as of September 30, 2018. The impact of the General and Ocean Rescue benefit changes are included in the charts below.
This forecast was stress tested using an estimated actual return on the market value of assets of 5% per year and 3% per year. The results are shown on the following charts for UAAL and Employer Contribution.
395

Retirement Fund FY2018
Demographic Information The following charts depict the System membership (Active, Retired and Vested Terminated Members) for the past 10 years. The first chart shows the total membership for all three funds. It is followed by charts depicting the membership for each separate benefit group. Information is extracted from the September 30, 2016 Actuarial Report.
396

Retirement Fund FY2018
Summary of Defined Benefit Plan Provisions
Grandfathered Benefits: The benefits consist of the old defined benefit plan (Plan A - see below) including future accruals in Plan A for employees that were eligible to retire on or before May 1, 2012 (grandfather).
Plan A Benefits: The accrued benefits prior to May 1, 2012 in the old defined benefit plan (frozen benefits).
Plan B Benefits: The accrued benefits on and after May 1, 2012 in the new hybrid pension plan.
Normal Retirement: ELIGIBILITY Plan A a) General: 30 or more years of service, regardless of age; or age 55 with 10 or more
years of serviceb) Ocean Rescue: Age 50 with 10 or more years of service. Or 10 or more years of
service and age plus credited service totals 65 years or more.c) Police and Firefighters: 20 or more years of service, regardless of age; or, age 50 with
10 or more years of service; or, at least 10 years of service and age plus creditedservice totals 65 years or more.
d) Immediate vesting was granted to all employees who on May 1, 2012, were activecontributing plan participants.
Plan B General and Ocean Rescue: Age 62 with 10 or more years of service if employed or participating in DROP on May 1, 2017. If not employed or participating in DROP on May 1, 2017, retirement eligibility age is 65 with 10 or more years of service. Employees hired after May 1, 2017 are eligible to retire at age 62 with 10 or more years of service. Police and Firefighters: Age 56 with 10 or more years of service.
PENSION AMOUNT Plan A a) General: Average final compensation times the sum of a) 2.75% for service earned after
September 30, 1990, to a maximum of 82.5%, plus 2.35% for service earned on or beforeSeptember 30, 1990 for the first 30 years of service, plus, b) 1.0% for service in excess of30 years.
b) Ocean Rescue: Average final compensation times the sum of a) 2.85% for the first 25years of service with a maximum of 71.25%, plus, b) 1.0% for service in excess of 25years.
c) Police Officers and Firefighters: Average final compensation multiplied by the sum of a)3.5% per year of credited service to a maximum of 87.5 percent, plus, b) 2.0% per year ofcredited service, if any, in excess of 43.75 years.
Plan B General and Ocean Rescue: The normal form of pension is a pension payable for life. Also see Automatic Death Benefit. Average final compensation multiplied by 1.25% per year of credited service from May 1, 2012, through April 30, 2017 and multiplied by 1.70% per year after May 1, 2017.
397

Retirement Fund FY2018
Police and Firefighters: The normal form of pension is a pension payable for life. Also see Automatic Death Benefit. Average final compensation multiplied by 1.25% per year of credited service from May 1, 2012 through September 30, 2016. Average final compensation multiplied by 2.75% per year of credited service after October 1, 2016. Members can elect an optional survivorship benefit with an actuarial reduction in benefit.
Average Final Compensation: Plan A Average of the highest 2 consecutive years within the member’s last 5 years of credited service. Plan B Average annual compensation after April 30, 2012, is the average of the final 5 years of credited service.
DROP Retirement: Both Plan A and Plan B Eligibility - Same as Normal Retirement. Participation must be terminated within 5 years of DROP commencement. Pension Amount General and Ocean Rescue: 100% of member’s accrued benefit at the date of election to participate in DROP. Grandfathered General and Ocean Rescue employees: 98% of member’s accrued benefit at the date of election to participate in DROP Police and Firefighters: 100% of the member’s accrued benefit at the date of election to participate in DROP. The rate of return credit for the DROP and Share accounts is calculated based on a five year trailing average annual return of the plan, and applied to the DROP and Share balances at the end of each quarter on the average daily balance for the quarter.
Early Retirement (General Employees Only): ELIGIBILITY Plan A Age 50 with 10 or more years of credited service based on a monthly reduction from normal retirement date as explained below. Plan B Early retirement at age 60 with 10 or more years of credited service, based on a monthly reduction from normal retirement date as explained below. PENSION AMOUNT Plan A and Plan B Computed as a normal retirement benefit but reduced 6/10 of 1% (3/10 of 1% if service credit is 20 or more years) for each month early retirement precedes the member’s normal retirement date.
Deferred Retirement (Vested Termination Benefit): Both Plan A and Plan B Eligibility - 10 or more years of service (waived for frozen benefits). Pension begins upon meeting requirement for normal retirement. Contributions must be left on deposit in the System; failure to do so results in forfeiture of the vested benefit. Frozen accrued benefits as of April 30, 2012 are vested immediately. Pension Amount - Computed as for normal retirement, based upon Plan A frozen benefit, or Plan B service and average final compensation at time of termination.
398

Town of Palm Beach
Employees Retirement System (600)


Retirement Fund FY2018
PROGRAM: EMPLOYEES RETIREMENT FUND (600)
REVENUES Employer Contributions The employer contributions are actuarially determined for the hybrid pension plan.
Transfer from Prepaid Town Contributions Transfer to pay for a portion of the investment return assumption change from 8% to 7.5%.
Employee Contributions Employee contributions are calculated based on the eligible employee’s salary multiplied by a contribution rate.
Gain/(Loss) on Investments This line item reflects the estimated gains on the sale of equities. Projections reflect the 7.4% return assumption for the fund.
Interest on Investments The budgeted amount represents the anticipated interest to be earned on fixed income investments.
Transfer from General Fund Extraordinary transfer from General Fund Fund Balance to improve the unfunded status.
FY2015Actual
FY2016Actual
FY2017Budget
FY2017Projected
FY2018Budget
%Change
RevenuesEmployer Contributions 5,626,652 6,876,923 8,179,695 8,087,085 9,320,235 13.94%Transfer from Prepaid Town Contributions 750,000 - - - - 0.00%Employee Contibutions 591,047 541,133 750,000 963,708 755,000 0.67%Gain/(Loss) on Investments (10,314,333) 13,248,261 14,837,114 18,045,063 14,886,649 0.33%Miscellaneous 103,396 13,310 2,500 3,309 2,500 0.00%Interest on Investments 1,778,887 1,368,443 2,000,000 3,582,546 1,750,000 -12.50%Transfer from General Fund - 2,500,000 2,800,000 4,759,016 90.36%TOTALS (1,464,351) 22,048,070 28,269,309 33,481,711 31,473,400 11.33%ExpensesSalaries and Wages 32,572 51,772 52,247 51,803 52,910 1.27%Employee Benefits 21,341 25,804 28,009 27,364 29,558 5.53%Contractual 23,718,618 18,724,304 19,501,658 18,533,804 20,272,050 3.95%TOTALS 23,772,531 18,801,880 19,581,914 18,612,971 20,354,518 3.95%Total Revenues Over/(Under) Expenses (25,236,882) 3,246,190 8,687,395 14,868,740 11,118,882 Beginning Net Assets 216,001,372 190,764,490 194,010,680 194,010,680 208,879,420 ENDING NET ASSETS 190,764,490 194,010,680 202,698,075 208,879,420 219,998,302
Revenue and Expense Summary
399

Retirement Fund FY2018
EXPENSES Salaries and Wages The proposed budget for salaries and wages includes performance based merit pay increases.
Employee Benefits Employee benefit costs include the health insurance program and the hybrid pension plan for the FTEP assigned to this fund.
Contractual This line item reflects anticipated pension payments and operating costs.
Full Time Equivalent Employees FY2014 FY2015 FY2016 FY2017 FY2018Finance Director 0.0240 0.0240 0.1000 0.1000 0.1000 Assistant Finance Director 0.0190 0.0190 0.0250 0.0250 0.0250 Accounting Supervisor 0.0230 0.0230 0.0500 0.0500 - Budget Analyst - - - - 0.0500 Accounting Specialist II - - - - 0.2000 Accounting Specialist 0.0120 0.0120 0.0120 0.0120 0.0120 Director of Human Resources 0.0240 0.0240 0.0240 0.0240 0.0240 Human Resources Specialist 0.3750 0.3700 0.3750 0.3750 0.3750 Payroll Specialist 0.2310 0.2310 0.2000 0.2000 -
0.7080 0.7030 0.7860 0.7860 0.7860
400

Town of Palm Beach
Health Insurance Trust (610)


Health Insurance Trust Fund FY2018
PROGRAM: HEALTH INSURANCE TRUST (610)
The Town makes post-employment health care benefits available to retirees and funds a portion of the retiree health insurance benefits. In FY2007, the Town established a Health Insurance Trust for the funding of these benefits. The trust was established with an initial deposit of $16,000,000 transferred from the reserves from the Health Insurance Fund. The Town’s Investment Advisory Committee oversees the investment of the assets of this trust.
An actuarial valuation of the retiree health plan was conducted as of October 1, 2016. The Town’s biannual Actuarial Accrued Liability as of October 1, 2016 was determined to be $34,693,373. The annual budgeted contribution for FY2018 is $960,000.
The Town provides to the retirees self-insured HMO, POS and PPO medical plans administered by Florida Blue. The prescription drug plan is administered by CVS/Caremark.
Summary of Plan Provisions Eligibility Employee must terminate employment with the Town and be eligible to retire under the Town’s retirement system.
Plan Design Eligible retirees can choose from one of three Florida Blue plans: POS Blue Options, PPO Blue Choice, or Blue Care Open Access HMO. A summary of the significant plan provisions for the plan year that begins on January 1, 2017 are provided below:
Florida Blue POS Blue Options
In-Network Out-of-Network Deductible $1,000 Ind/$2,000 Family $2,000 Ind/$4,000 Family Coinsurance 20% 50% Out of Pocket Maximum $2,000 Ind/$4,000 Family $4,000 Ind/$6,000 Family Office Visit Copay $35 Copay+Ded+20% Coins Ded+50% Coins Prescription Drugs $100 Ded for Non-generic when generic available Retail Copayment Generic-$10, Preferred-$35, Non-Preferred-$40 Copay + 50%
of Cost Mail Order Copayment Generic-$20, Preferred-$70, Non-Preferred-$80 Copay + 50%
of Cost Lifetime Maximum Unlimited
401

Health Insurance Trust Fund FY2018
Florida Blue PPO Blue Choice
In-Network Out-of-Network Deductible $500 Ind/$1,500 Family $1,000 Ind/$3,000 Family Coinsurance 10% 30% Out of Pocket Maximum $1,500 Ind/$4,500 Family $3,000 Ind/$6,000 Family Office Visit Copay $25 Ded+30% Prescription Drugs $100 Ded for Non-generic when generic available Retail Copayment Generic-$10, Preferred-$30, Non-Preferred-$30 Copay + 50%
of Cost Mail Order Copayment Generic-$20, Preferred-$60, Non-Preferred-$60 Copay + 50%
of Cost Lifetime Maximum Unlimited
Florida Blue - Blue Care Open Access HMO
In-Network *Out-of-NetworkDeductible N/A Coinsurance N/A Out of Pocket Maximum $1,500 Individual, $3,000 Family Office Visit Copay $20 Inpatient Copay $500 per admission Emergency Room Copay $115 Prescription Drugs $100 Ded for Non-generic when generic available Retail Copayment Generic-$10, Preferred-$30, Non-Preferred-$30 Copay + 50%
of Cost Mail Order Copayment Generic-$20, Preferred-$60, Non-Preferred-$60 Copay + 50%
of Cost Lifetime Maximum Unlimited
* Out of network services are not covered under the HMO plan.
Discount Rate The actuarial analysis assumes a 7.5% annual discount rate.
Required Monthly Contributions Contribution amounts are determined by the medical plan chosen, the years of employment service, and the amount of pension earned according to the retiree sliding scale for insurance premiums. Contributions are required to both retiree and dependent coverage. The premium cost sharing between retirees and the Town ranges from 50% to the maximum charge allowable per state statute for the non-Medicare group.
402

Health Insurance Trust Fund FY2018
PROGRAM: HEALTH INSURANCE TRUST (610)
REVENUES Town Funding Town’s portion of retiree health care expenses; plan funding requirements are determined by experience and actuary analysis conducted by Willis of Florida
Retiree Funding The FY2018 projected budget for Retiree Funding is based on trending and actual contributions for FY2017
Medicare Reimbursements Medicare reimbursements are paid to the Town through the Retiree Drug Subsidy (RDS) program
Gain/(Loss) on Investments Gain/Loss on investments represents revenue earned or investment losses on the investments in the trust
EXPENSES Salaries and Wages The salary budget is derived from the payroll data for the Full Time Equivalent Employees (FTE) listed in the table below. The budget includes pay for performance increases and the proposed increase in the ranges.
Employee Benefits The employee benefit costs include FICA, health insurance, retirement costs, any paid incentives and allowances, and the performance bonus. The health insurance and retirement costs are based on an allocation of the total Town costs by FTE per program. This fund also accounts for the Town-wide retiree health insurance program.
FY2015Actual
FY2016Actual
FY2017Budget
FY2017Projected
FY2018Budget
%Change
RevenuesTown Funding 1,577,000 1,180,000 1,339,000 1,339,000 960,000 -28.30%Retiree Funding 1,185,104 1,235,489 1,230,000 1,260,410 1,184,835 -3.67%Medicare Reimbursement 74,260 82,497 80,000 14,286 - -100.00%Miscellaneous Revenue 2,310 - - 5 - 0.00%Gain/(Loss) on Investments (1,586,899) 1,725,040 500,000 784,159 500,000 0.00%TOTALS 1,251,775 4,223,026 3,149,000 3,397,860 2,644,835 -16.01%ExpensesSalaries and Wages 61,681 69,666 77,337 75,491 80,986 4.72%Employee Benefits 2,082,488 2,273,268 2,287,178 2,346,247 2,048,557 -10.43%Contractual 107,124 107,724 125,619 72,188 87,627 -30.24%Commodities 185 281 300 344 300 0.00%TOTALS 2,251,478 2,450,939 2,490,434 2,494,270 2,217,470 -10.96%Total Revenues Over/(Under) Expenses (999,703) 1,772,087 658,566 903,590 427,365 Beginning Net Assets 27,628,798 26,629,095 28,401,182 28,401,182 29,304,772 ENDING NET ASSETS 26,629,095 28,401,182 29,059,748 29,304,772 29,732,137
Revenue and Expense Summary
403

Health Insurance Trust Fund FY2018
Contractual Contractual services include Teledoc services. Teladoc provides 24/7/365 access to a national network of U.S. board-certified physicians who can resolve many medical issues via phone or online video consultation.
Commodities Office supplies.
Full Time Equivalent Employees FY2014 FY2015 FY2016 FY2017 FY2018Director of Human Resources 0.100 0.100 0.100 0.100 0.100 Finance Director 0.050 0.050 0.050 0.050 0.050 Assistant Director of Human Resources 0.200 0.200 0.200 0.200 0.200 Occupational Health Nurse - - 0.170 0.170 0.170 Human Resource Coordinator 0.330 0.330 0.330 0.330 0.330 Human Resource Analyst 0.050 0.050 0.050 0.100 0.100
0.730 0.730 0.900 0.950 0.950
404

405

406

407

(This page intentionally left blank)
408
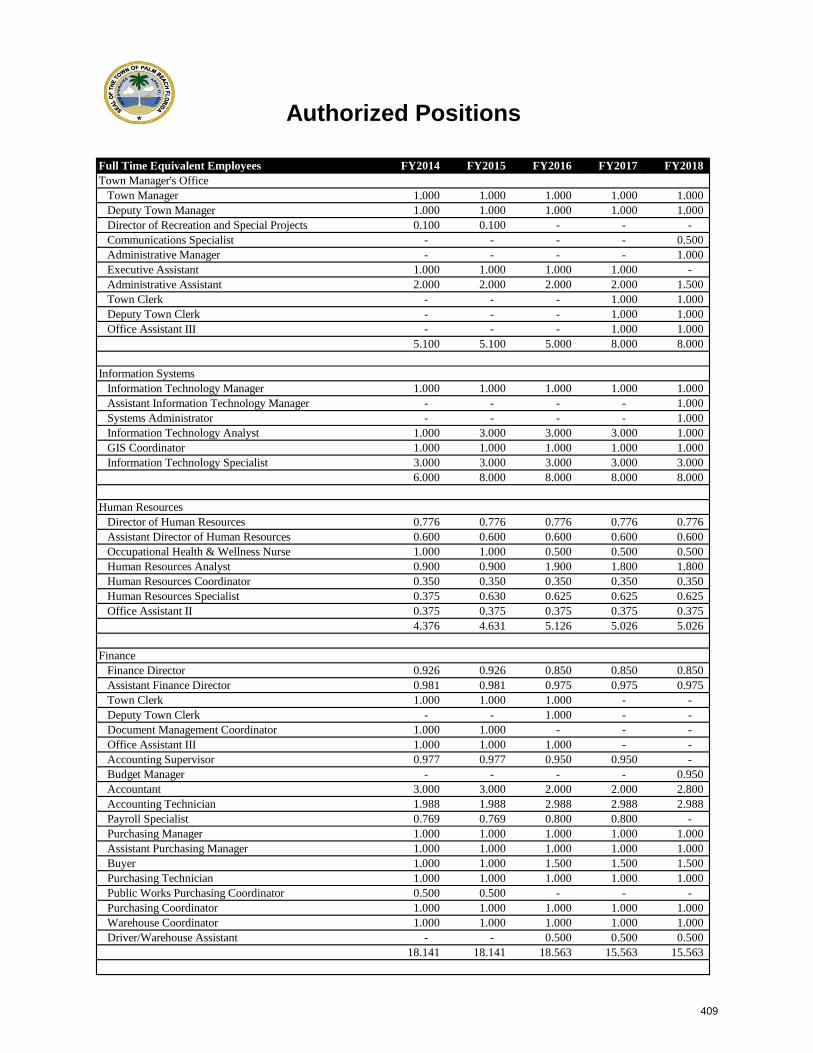
Full Time Equivalent Employees FY2014 FY2015 FY2016 FY2017 FY2018Town Manager's Office
Town Manager 1.000 1.000 1.000 1.000 1.000 Deputy Town Manager 1.000 1.000 1.000 1.000 1.000 Director of Recreation and Special Projects 0.100 0.100 - - - Communications Specialist - - - - 0.500 Administrative Manager - - - - 1.000 Executive Assistant 1.000 1.000 1.000 1.000 - Administrative Assistant 2.000 2.000 2.000 2.000 1.500 Town Clerk - - - 1.000 1.000 Deputy Town Clerk - - - 1.000 1.000 Office Assistant III - - - 1.000 1.000
5.100 5.100 5.000 8.000 8.000
Information SystemsInformation Technology Manager 1.000 1.000 1.000 1.000 1.000 Assistant Information Technology Manager - - - - 1.000 Systems Administrator - - - - 1.000 Information Technology Analyst 1.000 3.000 3.000 3.000 1.000 GIS Coordinator 1.000 1.000 1.000 1.000 1.000 Information Technology Specialist 3.000 3.000 3.000 3.000 3.000
6.000 8.000 8.000 8.000 8.000
Human ResourcesDirector of Human Resources 0.776 0.776 0.776 0.776 0.776 Assistant Director of Human Resources 0.600 0.600 0.600 0.600 0.600 Occupational Health & Wellness Nurse 1.000 1.000 0.500 0.500 0.500 Human Resources Analyst 0.900 0.900 1.900 1.800 1.800 Human Resources Coordinator 0.350 0.350 0.350 0.350 0.350 Human Resources Specialist 0.375 0.630 0.625 0.625 0.625 Office Assistant II 0.375 0.375 0.375 0.375 0.375
4.376 4.631 5.126 5.026 5.026
FinanceFinance Director 0.926 0.926 0.850 0.850 0.850 Assistant Finance Director 0.981 0.981 0.975 0.975 0.975 Town Clerk 1.000 1.000 1.000 - - Deputy Town Clerk - - 1.000 - - Document Management Coordinator 1.000 1.000 - - - Office Assistant III 1.000 1.000 1.000 - - Accounting Supervisor 0.977 0.977 0.950 0.950 - Budget Manager - - - - 0.950 Accountant 3.000 3.000 2.000 2.000 2.800 Accounting Technician 1.988 1.988 2.988 2.988 2.988 Payroll Specialist 0.769 0.769 0.800 0.800 - Purchasing Manager 1.000 1.000 1.000 1.000 1.000 Assistant Purchasing Manager 1.000 1.000 1.000 1.000 1.000 Buyer 1.000 1.000 1.500 1.500 1.500 Purchasing Technician 1.000 1.000 1.000 1.000 1.000 Public Works Purchasing Coordinator 0.500 0.500 - - - Purchasing Coordinator 1.000 1.000 1.000 1.000 1.000 Warehouse Coordinator 1.000 1.000 1.000 1.000 1.000 Driver/Warehouse Assistant - - 0.500 0.500 0.500
18.141 18.141 18.563 15.563 15.563
Authorized Positions
409

Full Time Equivalent Employees FY2014 FY2015 FY2016 FY2017 FY2018
Authorized Positions
Planning, Zoning and BuildingDirector Planning, Zoning and Building 1.000 1.000 1.000 1.000 1.000 Assistant Director PZB 1.000 1.000 1.000 1.000 1.000 Zoning Administrator 1.000 1.000 1.000 1.000 1.000 Zoning Technician - - 1.000 1.000 1.000 Administrative Aide 1.000 1.000 1.000 1.000 1.000 Planning Administrator 1.000 1.000 1.000 1.000 1.000 Commission Clerk - - 0.500 0.500 - Document Management Coordinator - - 1.000 1.000 1.000 Development Review Specialist 1.000 1.000 0.500 0.500 - Development Permit Coordinator 3.000 3.000 3.000 3.000 3.000 Building Official 1.000 1.000 1.000 1.000 1.000 Chief Construction Inspectors 3.000 3.000 3.000 3.000 3.000 Development Geoprocessor Technician 1.000 1.000 1.000 1.000 1.000 Office Assistant III 1.000 1.000 - - - Project Engineer 1.000 1.000 1.000 1.000 1.000 Combination Building Inspector 2.000 2.000 2.000 2.000 2.000 Parking/Code Enforcement Manager 0.500 0.500 0.500 0.500 0.500 Parking/Code Enforcement Specialist 0.750 0.750 0.750 0.750 0.750 Lead Code Compliance Officer II 1.000 1.000 - - - Code Compliance Officer I 1.000 1.000 2.000 2.000 2.000 Office Manager 1.000 1.000 1.000 1.000 1.000 Fire Marshal 1.000 1.000 1.000 1.000 1.000 Assistant Fire Marshal 1.000 1.000 - - - Fire Inspector - - 1.000 1.000 1.000 Combination Plan Reviewer 1.000 2.000 2.000 2.000 2.000 Office Assistant III - - - - 1.000 Office Assistant II 1.000 1.000 1.000 1.000 1.000
26.250 27.250 28.250 28.250 28.250
Fire-RescueDirector of Public Safety 0.500 0.500 0.500 0.500 0.500 Deputy Fire-Rescue Chief 1.000 1.000 1.000 1.000 1.000 Assistant Fire-Rescue Chief 1.000 1.000 1.000 1.000 1.000 Office Manager 1.000 1.000 1.000 1.000 1.000 Administrative Coordinator 1.000 1.000 1.000 1.000 1.000 Battalion Chief 3.000 3.000 3.000 3.000 3.000 Division Chief - EMS Coordinator 1.000 1.000 1.000 1.000 1.000 Lieutenant 15.000 18.000 18.000 18.000 21.000 Firefighter Driver/Engineer 15.000 12.000 12.000 12.000 12.000 Firefighter 27.000 27.000 27.000 27.000 30.000 Fleet Manager 0.200 0.200 0.200 0.200 0.200 Master Mechanic 0.200 0.200 0.200 0.200 0.200 Supervisor Lifeguard 1.000 1.000 1.000 1.000 1.000 Lifeguard 5.000 5.000 5.000 5.000 5.000 Lifeguard On-Call 3.000 3.000 3.000 3.000 3.000 Division Chief - Training and Safety 1.000 1.000 1.000 1.000 1.000
75.900 75.900 75.900 75.900 81.900
PoliceDirector of Public Safety 0.500 0.500 0.500 0.500 0.500 Deputy Police Chief 1.000 1.000 1.000 1.000 1.000 Major - - - - 1.000 Captain 5.000 5.000 5.000 5.000 5.000 Lieutenant 2.000 2.000 2.000 2.000 1.000 Sergeant 10.000 10.000 10.000 10.000 10.000
410

Full Time Equivalent Employees FY2014 FY2015 FY2016 FY2017 FY2018
Authorized Positions
Police Planner 1.000 1.000 1.000 1.000 1.000 Administrative Assistant 1.000 1.000 1.000 1.000 1.000 Office Assistant II 3.000 2.000 2.000 2.000 2.000 Police Officer 50.000 50.000 50.000 50.000 50.000 Records Information Systems Manager 1.000 1.000 1.000 1.000 - Records Assistant I 1.000 1.000 1.000 1.000 1.000 Training & Community Relations Coordinator 1.000 1.000 1.000 1.000 1.000 Communications Manager - - - - 1.000 Lead Telecommunications Supervisor 1.000 1.000 1.000 1.000 - Telecommunications Supervisor 3.000 3.000 3.000 3.000 3.000 Telecommunicator 9.500 10.500 10.500 10.500 11.000 Call-Taker 1.000 1.000 1.000 1.000 - Crime Scene Evidence Tech II 1.000 1.000 1.000 1.000 1.000 Master Mechanic 0.800 0.800 0.800 0.800 0.800 Crime Scene Evidence Manager 1.000 1.000 1.000 1.000 1.000 Lead Parking Enforcement Officer 1.000 1.000 1.000 1.000 1.000 Parking Enforcement Officer 6.000 6.000 6.000 6.000 6.000 Parking/Code Enforcement Manager 0.500 0.500 0.500 0.500 0.500 Parking/Code Enforcement Specialist 0.250 0.250 0.250 0.250 0.250 Fleet Manager 0.800 0.800 0.800 0.800 0.800 Crime Intelligence Analyst 1.000 1.000 1.000 1.000 1.000 Crime Prevention Specialist - - - - -
103.350 103.350 103.350 103.350 101.850
Public WorksDirector of Public Works 1.000 1.000 1.000 1.000 1.000 Assistant Director of Public Works 1.000 1.000 1.000 1.000 1.000 Office Assistant II 5.000 5.000 5.000 5.000 5.000 Buyer - - 0.500 0.500 0.500 Public Works Purchasing Coordinator 0.500 0.500 - - - Senior Project Engineer 1.000 1.000 1.000 1.000 1.000 Public Works System Specialist 1.000 1.000 1.000 1.000 1.000 Public Works Inspector 1.500 1.500 1.500 detailed detailed
Right of Way Inspector I 0.500 1.000 Right of Way Inspector II 1.000 1.000
Town Engineer 1.000 1.000 1.000 1.000 1.000 Coastal Coordinator 1.000 1.000 - - - Project Engineer 2.000 2.000 2.000 2.000 2.000 Engineering Technical Support Specialist - - 1.000 0.500 0.500 Managers
Office Manager 1.000 1.000 1.000 1.000 1.000 Facilities Maintenance Division Manager 0.960 0.960 0.960 0.960 0.960 Services Division Manager 1.000 1.000 1.000 1.000 1.000 Water Resources Division Manager 1.000 1.000 1.000 1.000 1.000
SupervisorsElectrician Supervisor 0.977 0.977 0.977 0.977 0.977 General Maintenance Supervisor 0.910 0.908 0.908 0.936 0.937 Maintenance Mechanic Unit Supervisor - - - - - Utilities Maintenance Supervisor 1.000 1.000 1.000 1.000 1.000 Grounds Supervisor 0.984 0.984 0.984 0.984 0.984 Supervisor/Sanitation 1.000 1.000 1.000 1.000 1.000 Supervisor/Trash 1.000 1.000 1.000 1.000 1.000
Senior Industrial Electrician - - - - 0.977 Electrician II 2.931 2.928 - - - Industrial Electrician - - 2.931 2.931 1.954 Mechanics
411

Full Time Equivalent Employees FY2014 FY2015 FY2016 FY2017 FY2018
Authorized Positions
Fleet Mechanic - - - - 3.000 Fleet Mechanic Supervisor - - - - 1.000 Mechanic I 0.500 0.500 1.000 1.000 - Mechanic II - - - - - Mechanic III 2.000 2.000 2.000 2.000 - Mechanic IV 1.000 1.000 1.000 1.000 -
Equipment OperatorsCrane Operator 3.000 3.000 3.000 3.000 3.000 Equipment Operator I 21.000 21.000 21.000 19.000 18.000 Equipment Operator II 2.000 2.000 2.000 4.000 5.000 Equipment Operator 20yd/60yd 1.000 1.000 1.000 - - Equipment Operator III 1.000 1.000 1.000 1.000 1.000 Irrigation and Spray Technician 0.984 0.984 0.984 0.984 0.984 Landfill Operator 1.000 1.000 1.000 1.000 1.000 Transfer Station Operator - - - 1.000 1.000 Wastewater Operator I - - - - - Wastewater Operator II - - - - - Water Resource Technician I 11.000 11.000 11.000 11.000 11.000 Water Resource Technician II 3.000 3.000 3.000 3.000 3.000 Grounds Technician - - - 1.000 1.000
LaborersParks Laborer 2.000 2.000 - - - Laborer I 8.000 8.000 8.000 8.000 8.000 Parks Laborer - - 2.000 1.000 1.000
Building Maintenance Worker 1.822 1.825 1.822 1.822 1.888 Street & Sign Painter 0.974 0.974 0.974 0.974 0.974
88.042 88.040 88.540 88.068 88.635
Townwide Underground UtilitiesUnderground Utilities Program Coordinator - - - - 1.000 Communications Specialist - - - - 0.250
- - - - 1.250
Coastal Management FundCoastal Program Manager - - 1.000 1.000 1.000 Communications Specialist - - - - 0.250 Engineering Tech Support Specialist - - - 0.500 0.500
- - 1.000 1.500 1.750
Recreation Enterprise FundDockmaster 1.000 1.000 1.000 1.000 1.000 Dock Attendant 1.500 1.500 1.836 1.851 1.851 Dock Hand 0.850 0.215 0.200 0.200 0.200 Office Manager 1.000 1.000 1.000 1.000 1.000 Office Assistant I 0.750 - - - - Office Assistant II - 1.000 1.000 1.000 1.000 Tennis Facilities Supervisor 1.000 1.000 1.000 1.000 1.000 Tennis Facilities Assistant 1.000 1.000 1.000 1.000 1.000 Tennis Attendant 2.249 1.755 1.559 1.257 1.257 Laborer - - 0.911 0.464 0.024 Laborer - Tennis 0.641 0.400 - - - Recreation Supervisor 2.000 2.000 2.000 2.000 2.000 Maintenance Worker 1.000 1.000 1.000 1.000 1.000 Laborer - Recreation 0.550 0.490 - - 0.440 Bus Driver 0.500 0.480 0.480 0.365 0.365 Activity Leader 3.760 2.983 2.983 2.500 2.500
412

Full Time Equivalent Employees FY2014 FY2015 FY2016 FY2017 FY2018
Authorized Positions
Director of Recreation and Special Projects 0.900 0.900 - - - Director of Recreation - - 1.000 1.000 1.000 Assistant Director of Recreation 1.000 1.000 1.000 1.000 1.000 Golf Manager 1.000 1.000 1.000 1.000 1.000 Golf Course Superintendent 1.000 1.000 1.000 1.000 1.000 Crew Forman/Irrigation Specialist - - 1.000 1.000 1.000 Pro-Shop Assistant - 1.000 1.000 1.000 1.000 Part-Time Pro-Shop Assistant - 0.500 0.610 0.515 0.515 Golf Course Facility Supervisor 1.000 - - - - Golf Course Mechanic 1.000 1.000 1.000 1.000 1.000 Equipment Operator 0.450 0.500 0.500 0.250 0.250 Registration Clerk I 0.721 - - - - Senior Golf Associate - 1.000 1.000 1.000 1.000 Golf Course Attendant 1.220 0.750 0.750 0.461 0.461 Golf Course Associate 0.259 1.110 1.257 1.002 1.002 Public Works Employees 0.358 0.460 0.460 0.432 0.365
26.708 26.043 27.546 25.297 25.230
Self Insurance Fund - RiskRisk Manager 1.000 1.000 1.000 1.000 1.000 Administrative Assistant - - - - 0.500 Occupational Health Nurse - - 0.160 0.160 0.160
1.000 1.000 1.160 1.160 1.660
Self Insurance Fund - HealthDirector of Human Resources 0.100 0.100 0.100 0.100 0.100 Assistant Director of Human Resources 0.200 0.200 0.200 0.200 0.200 Human Resources Coordinator 0.320 0.320 0.320 0.320 0.320 Human Resource Analyst 0.050 0.050 0.050 0.100 0.100 Occupational Health & Wellness Nurse - - 0.170 0.170 0.170 Office Assistant II 0.125 0.125 0.125 0.125 0.125
0.795 0.795 0.965 1.015 1.015
Retirement FundDirector of Human Resources 0.024 0.024 0.024 0.024 0.024 HR Specialist 0.375 0.370 0.375 0.375 0.375 Finance Director 0.024 0.024 0.100 0.100 0.100 Assistant Finance Director 0.019 0.019 0.025 0.025 0.025 Accounting Supervisor 0.023 0.023 0.050 0.050 - Budget Manager - - - - 0.050 Accountant - - - - 0.200 Payroll Specialist 0.231 0.231 0.200 0.200 - Accounting Technician 0.012 0.012 0.012 0.012 0.012
0.708 0.703 0.786 0.786 0.786
OPEB TrustDirector of Human Resources 0.100 0.100 0.100 0.100 0.100 Human Resource Analyst 0.050 0.050 0.050 0.100 0.100 Assistant Director of Human Resources 0.200 0.200 0.200 0.200 0.200 Human Resources Coordinator 0.330 0.330 0.330 0.330 0.330 Occupational Health & Wellness Nurse - - 0.170 0.170 0.170 Finance Director 0.050 0.050 0.050 0.050 0.050
0.730 0.730 0.900 0.950 0.950
Grand Total 357.100 359.683 365.086 362.865 369.865
413

Town of Palm BeachDonation Reserve Account Summary
Year Ended 9/30/16
Donation Account Balance at
9/30/16 Revenues Expenditures Encumbrances Balance at
9/30/17 Finance 44.97 - - - 44.97 Fire-Rescue 27,231.66 51,086.62 38,440.48 - 39,877.80 Fire Public Education 20,602.77 - 450.00 - 20,152.77 Co-Worker Recognition Program 2,195.69 45,802.00 31,136.43 - 16,861.26 Employee of the Year Award (1,750.00) 3,500.00 3,500.00 - (1,750.00) Town Scholarship Fund 3,000.00 - - - 3,000.00 Employee Wellness 75,000.00 51,000.00 - - 126,000.00 Police Department 165,496.80 138,660.80 72,440.42 94,501.14 137,216.04 DuPont Training 2,464.42 - - - 2,464.42 Police Scholarship Fund 1,000.00 - - - 1,000.00 Police Softball League 9,279.39 - 300.00 - 8,979.39 Crime Watch 6,927.97 84,738.93 86,076.68 50,000.00 (44,409.78) Community Camera & Security Ptrshp 25,000.00 - - - 25,000.00 Public Works Department 14,665.66 5,040.00 4,585.75 - 15,119.91 Town Beautification 45,992.89 - (3,181.00) 3,308.44 45,865.45 Tangier/N. County Road Improvement 2,415.36 - - - 2,415.36 S County Rd Beautification 1,958.08 - - - 1,958.08 MidTown Bathrooms 31,716.96 - - - 31,716.96 Drinking Fountain 2,500.00 - - - 2,500.00 LW Lagoon Dredging 644,495.72 777,413.26 34,627.73 60,532.75 1,326,748.50 Bradley Park Improvements - 2,021,868.00 1,076,302.15 945,565.85 -Planning, Zoning & Building 50.00 - - - 50.00 Recreation Department 10,881.52 59,541.98 51,257.15 - 19,166.35 PW - Safety Program 786.00 - 882.00 - (96.00)Employee Fitness Center 14,632.83 - 5,468.50 - 9,164.33 Undesignated Donations 6,537.99 - - - 6,537.99 Holiday Decorations 52,888.75 - - - 52,888.75 Employee Events 14,315.95 - - - 14,315.95 PB Towers ROW Maintenance - 2,000.00 - - 2,000.00
414

Town of Palm Beach
Financial Policies


Financial Policies FY2018
Town of Palm Beach, Florida
Subject Policy: Fund Balance
Approved: August 9, 2011
Update: July 12, 2012
Purpose: The Town hereby establishes and will maintain Fund Balance, as defined herein, in accordance with Governmental Accounting and Financial Standards Board Statement No. 54, Fund Balance Reporting and Governmental Fund Type Definitions. Fund Balance shall be composed of non-spendable, restricted, committed, assigned and unassigned amounts.
A Fund Balance Policy is adopted to establish a level of funding that protects against unanticipated events that would adversely affect the financial condition of the Town and jeopardize the continuation of necessary public services. The policy also is established to secure and maintain investment-grade credit ratings, meet seasonal shortfalls in cash flow, and guard against revenue shortfalls. Fund balance information is used to identify the available resources for tax stabilization or enhance the financial position of the Town, in accordance with policies established by the Town Council.
This Fund Balance Policy establishes:
a) Fund balance policy for the general fund;b) Reservations of fund balance for the general fund;c) The method of budgeting the amount of estimated unrestricted fund balance
available for appropriation during the annual budget adoption process (priorto the actual, audited fund balance being known); and
d) Establish a spending order of fund balances.
Fund Balance Policy:
1. Restricted Fund Balance –Amounts that can be spent only for specificpurposes stipulated by (a) external resource providers such as creditors (bydebt covenants), grantors, contributors, or laws or regulations of othergovernments; or (b) imposed by law through constitutional provisions orenabling legislation will be budgeted and reported in special revenue funds,
415

Financial Policies FY2018
capital project funds or debt service funds. There is no restricted fund balance in the General Fund.
2. Committed Fund Balance – Commitment of fund balance may be made forsuch purposes including, but not limited to, a) major maintenance and repairprojects; b) meeting future obligations resulting from a natural disaster; c)accumulating resources pursuant to stabilization arrangements; d)establishing reserves for disasters; and/or e) for setting aside amounts forspecific projects or purposes.
Commitment of fund balance may be made from time-to-time by ordinanceof the Town Council. Commitments may be changed or lifted only by theTown Council taking the same formal action that imposed the constraintoriginally (ordinance). The use of committed fund balances will beconsidered in conjunction with the annual budget adoption process or bybudget amendment approved by Ordinance of the Town Council during thefiscal year.
3. Assigned Fund Balance – Assignment of fund balance may be a) made for aspecific purpose that is narrower than the general purposes of thegovernment itself; and/or b) used to reflect the appropriation of a portion ofexisting unassigned fund balance to eliminate a projected deficit in thesubsequent year’s budget in an amount no greater than the projected excessof expected expenditures over expected revenues.
Assigned fund balance shall reflect management’s intended use of resourcesas set forth in the annual budget (and any amendments thereto). Assignedfund balance may or may not be appropriated for expenditure in thesubsequent year depending on the timing of the project/reserve for which itwas assigned.
4. Non-Spendable Fund Balance – Non-spendable fund balance is established toreport items that are not expected to be converted to cash such as inventoryand prepaid items; items not currently in cash form such as the long-termamount of loans and notes receivable; and, items legally or contractuallyrequired to be maintained intact.
5. Minimum Level of Unassigned Fund Balance – Unassigned fund balance is theresidual classification for the general fund and represents fund balance thathas not been restricted, committed or assigned to specific purposes withinthe general fund. The Town will maintain a minimum level of 25% of generalfund operating expenditures.
416

Financial Policies FY2018
If after the annual audit, prior committed or assigned fund balance causes the unassigned fund balance to fall below 25% of general fund operating expenditures, the Town Manager will so advise the Town Council in order for necessary action to be taken to restore the unassigned fund balance to 25% of General Fund operating expenditures.
The Town Manager will prepare and submit a plan to the Town Council, that may include expenditure reductions, revenue increases, use of non-recurring revenues, budget surpluses and excess resources in other funds to restore fund balance to the minimum level. The Town shall take action necessary to restore the unassigned fund balance to acceptable levels within two years.
When an expenditure is incurred for purposes for which both restricted and unrestricted (committed, assigned, or unassigned) amounts are available, it is the Town’s policy to reduce restricted amounts first. When an expenditure is incurred for purposes for which amounts in any of the unrestricted fund balance classifications could be used, it is the Town’s policy to reduce committed amounts first, followed by assigned amounts, then unassigned amounts.
Reservations of Fund Balance (General Fund)
Committed Fund Balance – There are no current commitments of fund balance in the General Fund.
Assigned Fund Balance
The Town Council hereby establishes the following assignment of fund balance in the General Fund:
a) East Central Regional Wastewater Treatment Facility Debt Service – Areserve equal to the Town’s portion of the future debt service on the 1993loan for the improvements to the East Central Regional WastewaterTreatment Facility. The reserve will be adjusted annually to reflect theoutstanding debt service.
b) Compensated Absence Reserve – To fund the value of accruedcompensated absences. The reserve includes accrued vacation, sick timeand compensatory time and related payroll tax liability. The reserve willbe adjusted annually during the year-end process and will be funded at arate of 100% of the fiscal year end accrued balance. The Town Councilwill annually give consideration to appropriate funds from this reservebased upon estimated pay-outs of eligible accrued vacation, sick andcompensatory time and the related payroll tax liability.
417
Financial Policies FY2018
c) Assignment to Subsequent Year’s Budget – The subsequent year’s budgetfund balance is assigned by the Town management as set forth in theannual budget (and any amendments thereto) to appropriate a portion ofexisting unassigned fund balance to eliminate projected deficit in thesubsequent year’s budget in an amount no greater than the projectedexcess of expected expenditures over expected revenues.
Budgeting
1. Appropriation of Unrestricted Fund Balance – The actual amount ofunrestricted fund balance (total of committed fund balance assigned fundbalance and unassigned fund balance) is not known until the completion ofthe annual audit which takes place within six months after the end of thefiscal year being audited. However, an estimate of unrestricted fund balance(also called estimated beginning fund balance) will be made and reportedduring the annual budget adoption process (June through September) whichis prior to the end of the fiscal year, September 30th.
2. Estimated Beginning Fund Balance – In order to achieve the most accurateestimate possible, the Finance Department shall project both Sources ofFunds (revenues, prior years unrestricted fund balances carried forward andother financing sources) and Uses of Funds (operating and non-operatingexpenditures), including accruals, for each governmental fund throughSeptember 30th of the current fiscal year. These projections will be shownfor each fund in the proposed and final budget documents. The differencebetween the estimated actual sources of funds and estimated actual uses offunds is the calculated estimated beginning fund balance for the subsequentfiscal year. If planned for use in the subsequent fiscal year, committed andassigned fund balance may be included in the estimated beginning fundbalance.
3. Estimated Ending Fund Balance – For the year being budgeted, a calculationof estimated ending fund balance shall be made. This calculation shall be thedifference between the budgeted sources of funds and the budgeted uses offunds as described above.
If after the annual audit, the actual general fund unassigned fund balance isgreater than 25% of operating expenditures in the general fund, the excessmay be used in one or a combination of the following ways:
a) Left in the general fund to earn interest and roll forward into thesubsequent year’s beginning fund balance;
418

Financial Policies FY2018
b) Appropriated by the Town Council for a one-time expenditure oropportunity that does not increase recurring operating costs; or
c) Temporary revenue shortfalls or unpredicted one-time expenditures dueto a severe economic downturn or other major event(s) affecting theGeneral Fund.
Spending Order of Fund Balances: The Town will use excess unassigned fund balance first before spending any of the unassigned fund balance below 25%.
Annual Review and Determination of Fund Balance Policy: Compliance with the provisions of this policy shall be reviewed as a part of the annual budget adoption process, and the estimated amounts of restricted, committed assigned, non-spendable and minimum level of unassigned fund balance shall be determined during this process. The Town Manager will report the preliminary status of fund balance in the annual budget.
Responsibility: It will be the responsibility of the Town Manager and the Finance Director to implement this policy.
Effective Date: This policy shall take effect immediately upon adoption and will be applied beginning with the preparation of the Town’s September 30, 2012 Comprehensive Annual Financial Report and adoption of the Town’s Fiscal Year 2012-2013 Budget.
Update: Update shall take effect immediately upon adoption and will be applied with the preparation of the Town’s September 30, 2013 Comprehensive Annual Financial Report.
419

Financial Policies FY2018
DEFINITIONS
Fund Balance – As defined by the Governmental Accounting, Auditing and Financial Reporting of the Government Finance Officers Association, fund balance is “The difference between assets and liabilities reported in a governmental fund.”
Non-Spendable Fund Balance – Amounts that are (a) not in a spendable form or (b) legally or contractually required to be maintained intact. “Not in spendableform” includes items that are not expected to be converted to cash (such asinventories and prepaid amounts) and items such as long-term amount of loans andnotes receivable, as well as property acquired for resale. The principal of apermanent fund is an example of an amount that is legally or contractually requiredto be maintained intact.
Restricted Fund Balance – Amounts that can be spent only for specific purposes stipulated by (a) external resource providers such as creditors (by debt covenants), grantors, contributors, or laws or regulations or other governments; or (b) imposed by law through constitutional provisions or enabling legislation.
Committed Fund Balance – Amounts that can be used only for the specific purposes determined by a formal action (ordinance or resolution) of the Town Council. Commitments may be changed of lifted only by the Town Council taking the same formal action (ordinance or resolution) that imposed the constraint originally. Resources accumulated pursuant to stabilization arrangements sometimes are reported in this category.
Assigned Fund Balance – Includes spendable fund balance amounts established by management of the Town that are intended to be used for specific purposes that are neither considered restricted or committed.
Unassigned Fund Balance - Unassigned fund balance is the residual classification for the general fund and represents fund balance that has not been assigned to other funds and that has not been restricted, committed or assigned to specific purposes within the general fund. Unassigned fund balance may also include negative balances for any governmental fund if expenditures exceed amounts restricted, committed, or assigned for those specific purposes.
Unrestricted Fund Balance – The total of committed fund balance, assigned fund balance and unassigned fund balance.
Reservations of Fund Balance – Reserves established by the Town Council or by Town Management.
420

Financial Policies FY2018
Town of Palm Beach, Florida
Subject Policy: Budgetary Control
Effective Date: October 1, 2001
Purpose: The purpose of this policy is to formalize the Town’s level of budgetary control, and to provide for the administrative realignments of funds by the Town Manager and Finance Director to deal with unexpected needs as long as service to the public is not negatively impacted.
Policy: It is the policy of the Town of Palm Beach that the budget be controlled at the program level within each department by the applicable department head. Budget amendment requests, transferring funds between programs will originate from the applicable department head and the Finance Director and shall be subject to the approval of the Town Manager. The Town Manager may authorize transfers between departments if the action is deemed necessary to meet the obligations of the Town.
Reserves and new revenues may not be appropriated through this process, interfund transfers may not be made, and total appropriations of the Town shall not be changed, without prior affirmative action of the Town Council.
Responsibility: It is the responsibility of the Finance Director, under the direction of the Town Manager, to implement this policy.
Approval Date: August 14, 2001
421
Financial Policies FY2018
Town of Palm Beach, Florida
Subject Policy: Designation of General Fund - Fund Balance for Payment of Liability Related to Compensated Absences Leave Balances
Effective Date: September 30, 2004
Purpose: The purpose of this policy is to designate a portion of the General Fund - Fund Balance to create a reserve to fund the value of accrued compensated absences. The reserve will significantly reduce the budgetary fluctuations due to the payout of accrued leave time to terminated or retired employees. The reserve will also fund Retirement Health Savings Plan contributions of vacation and sick time, and any expenditures relating to the plan.
Policy: It is the policy of the Town of Palm Beach to designate a portion of the Town’s General Fund - Unassigned Fund Balance as a reserve for funding the value of accrued compensated absences. The reserve includes accrued vacation, sick time and compensatory time and related payroll tax liability. The designation will be adjusted annually during the year end process and will be funded at a rate of 100% of the fiscal year end accrued balance. The Town Council will annually give consideration to appropriate funds from this reserve based upon estimates of pay- outs of eligible accrued vacation, sick and compensatory time and the related payroll tax liability. In addition, funds may be appropriated from this reserve for employees that elect to use their vacation or sick time as a contribution to the Retirement Health Savings Plan. The reserve fund will be increased or decreased annually based upon the fiscal year end accrued balance. The annual appropriation for estimated pay-outs will be shown in the General Government program of the General Fund budget.
Responsibility: It is the responsibility of the Town Manager and the Finance Director to advise the Town Council annually during the budget process of the amount to be appropriated from this fund. In addition, the full reserve value will be shown as a designation of General Fund - Fund Balance in the Comprehensive Annual Financial Report. The Town Council has the authority to annually appropriate funds during the budget process for this purpose.
Approval Date: August 10, 2004
422

Financial Policies FY2018
Town of Palm Beach, Florida
Subject Policy: Contingency Reserve - General Fund
Effective Date: October 1, 2001
Revised: October 1, 2005
Revised: October 1, 2007
Revised: October 1, 2017
Purpose: The purpose of this policy is to provide for a Contingency Reserve that will be appropriated annually for unanticipated expenditures of a nonrecurring nature and/or to meet unexpected increases in costs and provide a clear guideline restricting the use of the Contingency Reserve within the General Fund.
Policy: It is the policy of the Town of Palm Beach to annually appropriate a Contingency Reserve of 1% of the proposed General Fund budget from the Fund Balance of the General Fund, to address unexpected needs that occur throughout the year, subject to the formal affirmative vote of the Town Council. Examples of the use of this reserve may include:
1. Requests that could not be reasonably anticipated during the budget process for thecurrent year and without funding would result in a detriment to the Town;
2. Unfunded federal/state mandates that require immediate funding;
3. Expenses that are offset by unbudgeted revenues that cannot be appropriated in thecurrent year.
All requests will require a detailed justification to be submitted to the Town Manager, including a statement as to why it is in the Town’s best interests to provide the requested funding prior to the next budget cycle.
Responsibility: It is the responsibility of the Town Manager and/or Finance Director to advise the Town Council when it may be appropriate to draw down this reserve, identifying the need(s) being met and the reason(s) that the expenditures cannot or should not wait until the next budget cycle.
Original Approval Date: August 14, 2001
Revision Approved: July 12, 2005
Second Revision Approved: August 6, 2007
Third Revision Approved: September 12, 2017
423

Financial Policies FY2018
Town of Palm Beach, Florida
Subject Policy: Reserve for Encumbrances, Continuing Appropriations, and Prepaid Expenses
Effective Date: October 1, 2001
Purpose: In order to honor unpaid obligations, unfinished projects and prepaid expenses for the budget period, a reserve of fund balance will be established at the end of the fiscal year for encumbrances, continuing appropriations and prepaid expenses.
Policy: It is the policy of the Town of Palm Beach that at the end of every fiscal year a reserve will be established to designate fund balance in the amount equal to the Town’s unpaid obligations, unfinished projects and prepaid expenses that carry over from one fiscal year to into the next. Departments shall encumber funds with a purchase order or with written approval by the Town Manager in a memorandum making the request.
Responsibility: It is the responsibility of the Town Manager and the Finance Director to implement this policy.
Approval Date: August 14, 2001
424

Financial Policies FY2018
Town of Palm Beach, Florida
Subject Policy: Revenue Shortfall Plan
Effective Date: October 1, 2002
Purpose: To establish a plan to address financial conditions which could result in a net shortfall of revenues as compared to expenditures. The plan is divided into the following three components:
Indicators, which serve as warnings that potential budgetary impacts are increasing in probability. Indicators will be shown as a percentage reduction in revenues. The Town will monitor key revenue sources as well as inflation factors and national and state trends. Phases, which will serve to classify and communicate the severity of the situation, as well as identify the actions to be taken at the given phase.
Actions, which are the preplanned steps to be taken in order to prudently address and counteract the anticipated shortfall.
The recession plan and classification of the severity of the economic downturn, will be used in conjunction with the Town’s policy regarding the importance of maintaining the Unassigned Fund Balance reserves to address economic uncertainties.
The following is a summary of the phase classifications, indicators and the corresponding actions to be taken:
Phase 1 Alert: An anticipated net reduction in budgeted revenue vs. actual receipts of 1% up to 5%. The actions associated with this phase are as follows:
Actions: A. Delaying expenditures where reasonably possible, while maintaining the same
level of service.B. Departments shall monitor their individual budgets to ensure that only essential
expenditures are made to maintain service levels.C. Non-essential capital expenditures may be deferred.D. Hiring for vacant positions will be closely scrutinized and may result in delaying
the recruitment process and using temporary help where possible.
Phase 2 Minor: A reduction in total budgeted revenues vs. actual receipts in excess of 5% to 9%. The objective at this level is still to maintain the same level of service where possible. Actions associated with this level may be:
Actions: A. Intensifying the review process for large items such as contract services,
consulting services, and capital expenditures including capital improvements.B. Hiring to fill vacant positions only with special justification and authorization.C. Closely monitoring and reducing expenditures for travel and seminars.
425

Financial Policies FY2018
Phase 3 Moderate: A reduction in total budgeted revenues vs. actual receipts of 10% to 15% Initiating cuts of service levels by:
Actions: A. Deferring large expenditures.B. Deferring capital expenditures.C. Reducing CIP appropriations from the General Fund and deferring projects.D. Institute a hiring freeze.E. Eliminate expenditures for travel and seminars.F. Consider across the board departmental budget cuts.
Phase 4Major: A reduction in total budgeted revenues vs. actual receipts of 16% to 25%Implementation of major service cuts may include:
Actions:A. Reducing the temporary work force.B. Deferring merit wage increases.C. Further reducing capital expenditures.D. Preparing a strategy for reduction in work force.E. Instituting across the board departmental budget cuts.F. Draw on excess unassigned fund balance to compensate for lost revenue.
Phase 5Crisis: A reduction in total budgeted revenues vs. actual receipts of over 25%.Actions may include:
Actions:A. Implementing reduction in work force or other personnel cost reduction
strategies.B. Eliminate programs.C. Eliminate capital improvement projects.D. Draw on unassigned fund balance to compensate for lost revenue.
Responsibility: It is the responsibility of the Town Manager and the Finance Director to advise the Town Council of a revenue shortfall as soon as it is apparent based upon the established indicators. The Town Manager and Finance Director will recommend actions based upon the Phase classifications.
Approval Date: August 13, 2002
426

Financial Policies FY2018
Town of Palm Beach, Florida
Subject: Debt Management Policy
Effective Date: October 1, 2001
Purpose: To establish parameters and guidance for the issuance, management, monitoring, assessment and evaluation of all Debt Obligations (defined below) issued by the Town of Palm Beach.
Policy: It is the policy of the Town of Palm Beach:
(a) To periodically approve the issuance of Debt Obligations on behalf of the Town tofinance the construction or acquisition of infrastructure and other assets for thepurpose of meeting its governmental obligations to its residents;
(b) To approve the issuance of Debt Obligations to refund outstanding debt whenindicated by market conditions or management of Debt Obligations to refundoutstanding debt when indicated by market conditions or managementconsiderations;
(c) That such Debt Obligations are issued and administered in such a manner as toensure and sustain the long-term financial integrity of the Town, to achieve thehighest possible credit rating and to preserve and enhance the quality of life, safetyand welfare of its citizens;
(d) That such Debt Obligations shall not be issued or debt proceeds used to financecurrent operations of the Town except as provided herein;
(e) To minimize the impact of construction or acquisition of infrastructure and otherassets on the budget of the Town;
(f) That the Town will consider long-term financing for the acquisition, maintenance,replacement, or expansion of physical assets (including land) only if they have aneconomic/useful life of at least five years;
(g) That the Town will not issue debt for periods exceeding the useful life or averageuseful lives of the project or projects to be financed;
(h) That the Town normally will rely on internally generated funds and/or grants tofinance its capital needs. Debt will be issued for a capital project only in the caseof emergency, or when inclusion of a project in the Town’s pay-as-you-go Capitalprogram will preclude the construction of smaller necessary capital improvements;
(i) That the Town will keep outstanding debt within the limits prescribed by Section7.01 of the Town Charter.
Debt Obligations shall mean bonds, notes, letters and lines of credit, lease purchases, or other securities issued by the Town against a pledge of a specific revenue source or sources, the proceeds of which are used to fund a capital project providing a public benefit.
Responsibility: It is the responsibility of the Finance Director under the direction of the Town Manager, to implement this policy. Departments should submit requests to use debt obligations for financing and submit to the Town Manager for review and approval.
Approval Date: August 14, 2001
427

Financial Policies FY2018
Town of Palm Beach, Florida
Subject Policy: Contingency Reserve - Capital Fund
Effective Date: October 1, 2001
Purpose: The purpose of this policy is to provide for a Contingency Reserve that will be appropriated annually for unanticipated expenditures of a nonrecurring nature and/or to meet unexpected increases in costs and provide a clear guideline for the use of the Contingency Reserve within the Capital Fund.
Policy: It is the policy of the Town of Palm Beach to annually appropriate a Contingency Reserve of 10% of the proposed Capital budget to address unexpected needs that occur throughout the year, subject to the formal affirmative vote of the Town Council. Examples of the use of this reserve may include:
1. Requests that could not be reasonably anticipated during the budget process for thecurrent year and without funding would result in a detriment to the Town;
2. Expenses that are offset by unbudgeted revenues that cannot be appropriated in thecurrent year;
3. Unforeseen expenses that would be more cost effective to be completed with a currentproject;
4. Expenses in excess of the budgeted contingency for any budgeted capital improvementproject.
All requests will require a detailed justification to be submitted to the Town Manager, including a statement as to why it is in the Town’s best interests to provide the requested funding prior to the next budget cycle.
Responsibility: It is the responsibility of the Town Manager and/or Finance Director to advise the Town Council when it may be appropriate to draw down this reserve, identifying the need(s) being met and the reason(s) that the expenditures cannot or should not wait until the next budget cycle.
Approval Date: August 14, 2001
428
Financial Policies FY2018
Town of Palm Beach, Florida
Subject Policy: Contingency Reserve - Equipment Replacement Fund
Effective Date: October 1, 2007
Revised: October 1, 2009
Purpose: The purpose of this policy is to provide for a Contingency Reserve that will be appropriated annually for unanticipated expenditures of a nonrecurring nature and/or to meet unexpected increases in costs and provide a clear guideline for the use of the Contingency Reserve within the Equipment Replacement Fund.
Policy: It is the policy of the Town of Palm Beach to annually appropriate a Contingency Reserve of $500,000, or an amount deemed necessary and prudent by the Town Manager as indicated in his/her annual budget proposal, from the net assets of the fund to address unexpected needs that may occur throughout the year. Examples of the use of this reserve may include:
Requests that could not be reasonably anticipated during the budget process for the current year.
Expenditures to replace unbudgeted equipment purchases that has been damaged or has become inoperable prior to the end of the useful life.
All requests for expenditures from this reserve will require a detailed justification to be submitted to the Town Manager for his/her prior approval, and the subsequent approval of the Town Council.
Responsibility: It is the responsibility of the Town Manager and/or Finance Director to advise the Town Council annually or as necessary on the use of this contingency reserve.
Approval Date: August 6, 2007
Revision Approved: July 14, 20
429

Financial Policies FY2018
Town of Palm Beach, Florida
Subject Policy: Equipment Replacement Reserve
Effective Date: October 1, 2001
Revised: September 30, 2006
Purpose: The purpose of this policy is to create a reserve to fund the replacement cost of existing equipment, vehicles and computers when they reach the end of their useful lives. The reserve will significantly reduce the budgetary fluctuations due to the purchase of large costly pieces of equipment. The reserve also established the fixed asset inventory and depreciation schedule as required by GASB34.
Policy: It is the policy of the Town of Palm Beach to maintain a reserve for funding the replacement costs of existing equipment, vehicles, and computers when they reach the end of their useful lives. The fund is to be maintained at a rate of 100% of accumulated depreciation based upon the estimated replacement cost of the assets in the fund. Funds will be drawn from this reserve to purchase replacement equipment that has been fully depreciated and must be replaced. New purchases (non replacement items) shall be appropriated in the requesting department’s budget and added to the fixed asset listing when purchased. They will then be depreciated annually for replacement upon the end of the asset’s useful life. The fund will receive an annual appropriated transfer from the General Fund equal to the annual depreciation amount on the assets held in the fund. The annual depreciation amount will be allocated to each department as an appropriated expenditure based on the assets held by the department.
The proceeds, net of costs, from the sale of surplus equipment from the equipment replacement fund shall be deposited in the equipment replacement fund.
Requests for replacement of equipment should be made annually through the budget process and should coincide with the 5 year equipment replacement plan. All requests will be reviewed for approval by the Town Manager.
Excess reserves in the fund that have built up over time may be used to fund new purchases (non replacement items). Distribution of the excess reserves for new purchases shall be a decision of the Town Manager and the requesting department’s proportionate share of the funds assets will be a consideration in making distribution decisions.
Responsibility: It is the responsibility of the Town Manager and the Finance Director to advise the Town Council annually through the budget process of the items and dollar amount for each that will be purchased from the equipment replacement fund and to advise to the adequacy of the funding level of this reserve.
Approval Date: July 12, 2006
430

Financial Policies FY2018
Town of Palm Beach, Florida
Subject Policy: Contingency Reserve -Recreation Enterprise Fund - Capital Fund
Effective Date: October 1, 2005
Purpose: The purpose of this policy is to provide for a Contingency Reserve that will be appropriated annually for unanticipated expenditures of a nonrecurring nature and/or to meet unexpected increases in costs and provide a clear guideline for the use of the Contingency Reserve within the Recreation Enterprise Fund - Capital Fund.
Policy: It is the policy of the Town of Palm Beach to annually appropriate a Contingency Reserve of 5% of the proposed Recreation Enterprise Fund - Capital budget to address unexpected needs that occur throughout the year, subject to the formal affirmative vote of the Town Council. The contingency amount will be funded from the retained earnings of the Recreation Enterprise Fund - Capital Fund. Examples of the use of this reserve may include:
1. Requests that could not be reasonably anticipated during the budget process for thecurrent year and without funding would result in a detriment to the Town;
2. Expenses that are offset by unbudgeted revenues that cannot be appropriated in thecurrent year;
3. Unforeseen expenses that would be more cost effective to be completed with a currentproject;
4. Expenses in excess of the budgeted contingency for any budgeted capital improvementproject.
All requests will require a detailed justification to be submitted to the Town Manager, including a statement as to why it is in the Town’s best interests to provide the requested funding prior to the next budget cycle.
Responsibility: It is the responsibility of the Town Manager and/or Finance Director to advise the Town Council when it may be appropriate to draw down this reserve, identifying the need(s) being met and the reason(s) that the expenditures cannot or should not wait until the next budget cycle.
Approval Date: July 12, 2005
431

Financial Policies FY2018
Town of Palm Beach, Florida
Subject Policy: Contingency Reserve - Recreation Enterprise Fund
Effective Date: October 1, 2004
Purpose: The purpose of this policy is to provide for a Contingency Reserve that will be appropriated annually for unanticipated expenditures of a nonrecurring nature and provide a clear guideline restricting the use of the Contingency Reserve within the Recreation Enterprise Fund.
Policy: It is the policy of the Town of Palm Beach to annually appropriate a Contingency Reserve of 5% of the proposed Recreation Enterprise Fund operating expense budget to address unexpected needs that occur throughout the year, subject to the formal affirmative vote of the Town Council. Examples of the use of this reserve may include:
1. Requests that could not be reasonably anticipated during the budget process for thecurrent year and without funding would result in a detriment to the Town and/or theactivities of the fund and,
2. Expenses that are offset by unbudgeted revenues that cannot be appropriated in thecurrent year.
All requests will require a detailed justification to be submitted to the Town Manager, including a statement as to why it is in the Town’s best interests to provide the requested funding prior to the next budget cycle.
Responsibility: It is the responsibility of the Town Manager and/or Finance Director to advise the Town Council when it may be appropriate to draw down this reserve, identifying the need(s) being met and the reason(s) that the expenditures cannot or should not wait until the next budget cycle.
Approval Date: August 10, 2004
432

Financial Policies FY2018
Town of Palm Beach, Florida
Subject Policy: Dock Replacement Reserve – Recreation Enterprise Fund
Effective Date: October 1, 2002
Purpose: The purpose of this policy is to create a reserve to fund the replacement cost for the construction of the Town’s docks when each of the three docks (at Brazilian, Australian, and Peruvian Avenues) reaches the end of its useful life. The reserve will significantly reduce, if not eliminate, the need for borrowing funds to finance the re-building of the docks.
Policy: It is the policy of the Town of Palm Beach to maintain a reserve for funding the replacement costs of the Town docks. The reserve fund is to be maintained at a rate of 100% of accumulated depreciation. Funds will be drawn from this reserve for the construction of new docks whenever it is determined that they must be replaced. The reserve fund will be increased by an annual appropriation equal to the annual depreciation and any interest earned on the reserve will be allocated to the account. The depreciation will be calculated using the straight line method with an estimated useful life of 25 years from the construction date for each dock.
An account will be established with the initial transfer on October 1, 2002, of the accumulated depreciation through September 30, 2002, from available funds.
Responsibility: It is the responsibility of the Town Manager and the Finance Director to advise the Town Council as to the adequacy of the funding level of this reserve. The Town Manager and Finance Director will recommend an appropriation of funds from this reserve to the Town Council whenever it is necessary for construction of a replacement dock(s) is to take place.
Approval Date: August 13, 2002
433

Financial Policies FY2018
Town of Palm Beach, Florida
Subject Policy: Equipment Replacement Reserve - Recreation Enterprise Fund
Effective Date: October 1, 2005
Purpose: The purpose of this policy is to create a reserve within the Recreation Enterprise Fund to fund the replacement cost of existing equipment, vehicles and computers when they reach the end of their useful lives. The reserve will significantly reduce the budgetary fluctuations due to the purchase of large costly pieces of equipment. The reserve will also establish the fixed asset inventory and depreciation schedule as required by GASB34.
Policy: It is the policy of the Town of Palm Beach to maintain a reserve for funding the replacement costs of existing equipment, vehicles, and computers within the Recreation Enterprise Fund when they reach the end of their useful lives. The fund is to be maintained at a rate of 100% of accumulated depreciation based upon the estimated replacement cost of the assets in the fund. Funds will be drawn from this reserve to purchase replacement equipment that has been fully depreciated and must be replaced. New purchases (non replacement items) shall be appropriated in the requesting department’s budget and added to the fixed asset listing when purchased. They will then be depreciated annually for replacement upon the end of the asset’s useful life. The reserve fund will be increased by an annual appropriation equal to the annual depreciation. Any interest earned on the reserve will be allocated to the account. The annual depreciation amount will be allocated to each activity of the fund as an appropriated expense based on the assets held and used in the function of the activity.
The proceeds, net of costs, from the sale of surplus equipment from the Recreation Enterprise Fund shall be added to the reserve fund.
Requests for replacement of equipment should be made annually through the budget process and should coincide with the estimated useful life of the asset. All requests will be reviewed for approval by the Town Manager.
Excess reserves in the fund that have built up over time may be used to fund new purchases (non replacement items). Distribution of the excess reserves for new purchases shall be a decision of the Town Manager.
Responsibility: It is the responsibility of the Town Manager and the Finance Director to advise the Town Council annually through the budget process of the items and dollar amount for each asset that will be purchased from the equipment replacement fund and to advise to the adequacy of the funding level of this reserve.
Approval Date: July 12, 2005
434

Financia l Policies FY2018
Town of Palm Beach, Florida
Subject Policy: Recreation Enterprise Fund – Maintenance and Improvement Reserves
Effective Date: October 1, 2017
Purpose: The purpose of this policy is to create separate reserves within the Recreation Enterprise Fund to fund the costs of non-routine maintenance and improvement (M&I) projects at the Par 3 Golf Course, the Town Tennis Facilities and the Town Docks. These reserves will significantly reduce the budgetary fluctuations due to the varying costs of these projects.
Policy: It is the policy of the Town of Palm Beach to maintain reserves for funding maintenance and improvement projects at the Par 3 Golf Course, Tennis Facilities and Town Docks. Funds will be drawn from these reserves to fund the cost of non-routine maintenance and improvement projects.
The reserves will be funded as follows:
Par 3 Golf Course Clubhouse Maintenance and Improvement Reserve: The reserve will be funded on an annual basis with a transfer of 25% of the net income from the operations of the Par 3 Golf Course. (The net income will be calculated using revenues less the Par 3 Maintenance and Improvement income, less all operating expenses, debt service, and golf course equipment depreciation.)
Dock Replacement Contribution- Using the same calculation noted above for the Par 3 Golf Course Clubhouse Maintenance and Improvement Reserve, an additional 25% of the net income from the operations of the Par 3 Golf Course will be transferred to the Dock Replacement Reserve as an additional annual contribution over and above the Dock Replacement Reserve contribution.
Par 3 Golf Course Maintenance and Improvement Reserve: This reserve will be funded on an annual basis with the total fees collected from the M&I fee charged for each round of golf.
Tennis Facility Maintenance and Improvement Reserve: This reserve will be funded on an annual basis with the total fees collected from the M&I fee charged for each court fee (daily, annual, or 12 Play Pass).
Town Docks Maintenance and Improvement Reserve: This reserve will be funded on an annual basis with the total M&I fees collected from slip fee charges.
Requests for the use of these reserves should be made annually through the budget process, and approved by the Town Manager prior to Town Council consideration. In such a situation when the use of these reserves may be unexpectedly needed during the fiscal year, approval from the Town Council shall be required.
Responsibility: It is the responsibility of the Town Manager and the Director of Finance to advise the Town Council annually through the budget process of the projects and dollar amount of expenses charged to the reserves and to advise to the adequacy of the funding level of these reserves.
Original Approval Date: August 11, 2015
Revision Approved: November 14, 2017
435

Financial Policies FY2018
Town of Palm Beach, Florida
Subject Policy: Recreation Enterprise Fund Reserve
Effective Date: October 1, 2001
Purpose: The purpose of this policy is to establish an appropriate level of net assets in the Town’s enterprise fund. Adequate levels of net assets will provide for unanticipated financial impacts as well as provide for one-time expenditures to improve the facilities.
Policy: It is the policy of the Town of Palm Beach that the Town maintain minimum net asset levels equal to 25% of the proposed budgeted revenues. The percentage represents three months of revenue.
Responsibility: It is the responsibility of the Town Manager and the Finance Director to implement this policy. The Town Manager will report regarding the status of the net assets in the annual budget message and/or in the Comprehensive Annual Financial Report.
Approval Date: August 14, 2001
436

Financial Policies FY2018
Town of Palm Beach, Florida
Subject Policy: Contingency Reserve -Risk Fund
Effective Date: October 1, 2001
Purpose: The purpose of this policy is to provide for a Contingency Reserve that will be appropriated annually for unanticipated expenditures of a nonrecurring nature and/or to meet unexpected increases in costs and provide a clear guideline for the use of the Contingency Reserve within the Risk Fund.
Policy: It is the policy of the Town of Palm Beach to annually appropriate a Contingency Reserve of $500,000 to address unexpected needs that occur throughout the year, subject to the formal affirmative vote of the Town Council. Examples of the use of this reserve may include:
1. Uninsured losses of $500,000 or less or,
2. Rate increases which exceed forecasted, budgeted amounts.
All requests will require a detailed justification to be submitted to the Town Manager, including a statement as to why it is in the Town’s best interests to provide the requested funding prior to the next budget cycle.
Responsibility: It is the responsibility of the Town Manager and/or Finance Director to advise the Town Council when it may be appropriate to draw down this reserve, identifying the need(s) being met and the reason(s) that the expenditures cannot or should not wait until the next budget cycle.
Approval Date: August 14, 2001
437
Financial Policies FY2018
Town of Palm Beach, Florida
Subject Policy: Reserve for Catastrophic Exposures/Emergencies - Risk Fund
Effective Date: October 1, 2001
Revised: October 1, 2002
Purpose: The purpose of this policy is to set aside emergency reserves that will protect the Town of Palm Beach against the potentially disastrous financial impacts of response to and recovery from a man made or natural emergency situation.
Policy: It is the policy of the Town of Palm Beach to maintain a Reserve for Catastrophic Exposures/Emergencies within the Town’s Self Insurance - Risk Fund for events of such magnitude that they could not otherwise be covered by available budgeted funds. This reserve shall be used only for one or more of the following events:
1. Local disaster response and recovery costs resulting from a natural or man-madedisaster requiring Town expenditures not reimbursable from insurance carriers or theFederal and State governments;
2. Local disaster response and recovery costs resulting from a natural or man-madedisaster that are paid up-front to expedite effective emergency management prior toreimbursement by insurance carriers or the Federal and State governments, withreimbursements, if any, paid back to the reserve;
3. Large judgments in excess of insurance coverage, or uninsured claims not coveredby policies;
4. Budget stabilization purposes in response to increases in premium rates and/or lossfund increases.
The amount of the reserve will be maintained at a minimum level of $2,500,000, and may be adjusted annually based on market conditions, inflation rates, insured retention levels, and potential claims. This amount will be appropriated annually from Net Assets, in order to avoid amending the budget in case of an emergency.
Responsibility: It is the responsibility of the Town Manager and/or the Finance Director to advise the Town Council when it may be necessary to draw down this reserve, identifying the criterion which has been met. The Town Manager may draw down this reserve without Town Council approval if necessary to aid in the payment of local disaster response and recovery costs.
Approval Date: August 14, 2001
438

Financial Policies FY2018
Town of Palm Beach, Florida
Subject Policy: Contingency Reserve -Health Insurance Fund
Effective Date: October 1, 2003
Purpose: The purpose of this policy is to provide for a Contingency Reserve that will be appropriated annually for unanticipated expenditures of a nonrecurring nature and/or to meet unexpected increases in health insurance costs and claims exposure, and provide a clear guideline for the use of the Contingency Reserve within the Health Insurance Fund.
Policy: It is the policy of the Town of Palm Beach to annually appropriate a Contingency Reserve of $500,000, or an amount deemed necessary and prudent by the Town Manager as indicated in his/her annual budget proposal, from the Retained Earnings of the fund to address unexpected needs that may occur throughout the year. Examples of the use of this reserve may include:
1. A large volume of claims that exceed the forecasted, budgeted amounts;
2. Rate increases which exceed forecasted, budgeted amounts.
All requests for expenditures from this reserve will require a detailed justification to be submitted to the Town Manager for his/her prior approval.
Responsibility: It is the responsibility of the Town Manager and/or Finance Director to advise the Town Council annually or as necessary on the use of this contingency reserve.
Approval Date: August 12, 2003
439

FY2018Financial Policies
Town of Palm Beach, Florida
Subject Policy: Funding Policy for the Town of Palm Beach Retirement System
Effective Date: October 1, 2017
Purpose: The Mayor and Town Council along with the Retirement Board recognizes its fiduciary duty to set prudent funding policies that promote benefit security and intergenerational equity in compliance with all federal, state and local statutes, ordinances and regulations. This Funding Policy constitutes the Town’s intentions that the Retirement Systems benefit obligations be funded on a systematic and actuarially sound basis in accordance with State Statutes.
This Funding Policy is intended to guide the Town, the Board members, and the plan’s actuary in the discharge of their respective services to the Plan.
Policy: Each year the Town of Palm Beach will budget and contribute an amount equal to the Actuarially Determined Employer Contribution (ADEC). The contribution will be made to the Retirement Fund in quarterly installments throughout the fiscal year. The ADEC amount will be derived from the annual valuation report and determined based on the current actuarial assumptions in place each year that is adjusted by the Board and/or the Town Council.
In addition, the Town of Palm Beach will contribute additional funds over and above the ADEC during the first month of the fiscal year. These additional funds serve to reduce the Town’s Unfunded Actuarially Accrued Liability (UAAL) and will be reflected as receivable contributions in the actuarial valuation that is as of the September 30th immediately preceding the deposit date of the additional funds. The amount of $5,420,000 of additional funding will be paid annually until fully funded, unless reduced due to a maximum allowed under this policy and subject to said funds being budgeted annually. The total Town contribution (including the ADEC) shall be capped at $16 million (indexed after 2017 at 2.75% per annum).
It is the intent of this policy that the additional contribution will be budgeted and paid each year unless one of the following circumstances are met:
1. A force majeure, including a catastrophic storm or other unforeseen event that wouldprohibit the Town from meeting this obligation.
2. A financial circumstance such as a severe recession or other unforeseen financial eventthat would cause the Town to not be able to meet this obligation.
3. The Retirement Fund achieves the 100% actuarial funding objective.
Responsibility: It is the responsibility of the Town Manager and the Finance Director to, appropriate funds for this contribution in the Town’s annual budget process.
Approval Date: October 10, 2017
Reference Document: Refer to GRS Retirement Consulting Report dated August 31, 2017 for the basis of the minimum amount.
440

Index FY2018
2016A and 2013 Revenue Bonds (Fund 205) ..................................................................................... 280 2013 Accelerated Capital Projects Fund (Fund 314) .......................................................................... 281
AAccelerated Capital Improvement Program Budget Report .............................................................. 312 Accelerated Capital Improvement Program Project Fact Sheets ....................................................... 313 Accelerated Capital Projects Fund ...................................................................................................... 311 Administration, Fire‐Rescue (411) ...................................................................................................... 173 Administration, Recreation ................................................................................................................ 373 Administrative Management, Town Manager’s Office (121) ............................................................. 108 Administrative Management, Police Department (421) .................................................................... 191 Administrative Management, Public Works Department (511) ........................................................ 225 Advice and Litigation (122) ................................................................................................................. 116 Assessed Valuation and Millage Rate ................................................................................................... 29 Authorized Positions .......................................................................................................................... 409
BBeach Cleaning (546) .......................................................................................................................... 249 Bond – 2016A and 2013 Revenue Bonds ........................................................................................... 280 Bond – 2010B Worth Avenue Revenue Bond ..................................................................................... 281 Budget Award ......................................................................................................................................... v Budget Calendar ................................................................................................................................... 45 Budget Comparison – General Fund Revenues and Expenditures ....................................................... 81 Budget Message ..................................................................................................................................... 1 Budget Overview .................................................................................................................................. 65 Budget Preparation Process ................................................................................................................. 40 Budget Summary by Fund Type, Revenues and Expenditures ............................................................. 66
CCalendar – Budget ................................................................................................................................ 45 Capital Expenditures ............................................................................................................................. 79 Capital Funds ...................................................................................................................................... 283 Capital Improvement Pay‐as‐you‐go/Facilities Five Year Program .................................................... 287 Capital Improvement Pay‐as‐you‐go Fund ......................................................................................... 288 Capital Program – Recreation ............................................................................................................. 374 CCMP FY16 Accomplishments and FY17 Action Plan ......................................................................... 291 Coastal Management (581) ................................................................................................................ 305 Code Enforcement (216) .................................................................................................................... 163 Commercial Collection (542) .............................................................................................................. 242 Communications Unit (425) ............................................................................................................... 203 Comprehensive Coastal Management Project Fund .......................................................................... 305 Contingent Appropriations (711) ....................................................................................................... 269 Crime Scene/Evidence Unit (426) ....................................................................................................... 205 Criminal Investigation Unit (429) ....................................................................................................... 212
441

Index FY2018
DDebt Administration ........................................................................................................................... 275 Depreciation Program – Recreation ................................................................................................... 376 Demographics ....................................................................................................................................... 28 Donation Reserve Account Summary ................................................................................................. 414
EEmergency Management (710) .......................................................................................................... 268 Engineering – General Services (561) ................................................................................................. 257 Equipment Operation and Maintenance (571) .................................................................................. 262 Equipment Replacement – Recreation ............................................................................................... 377 Equipment Replacement Fund (Fund 320) ......................................................................................... 385 Expenditures – Capital .......................................................................................................................... 80 Expenditures – General Fund ............................................................................................................... 97 Expenditures – Summary of Expenditure Classifications by Fund Type ............................................... 70
FFacility Maintenance (554) ................................................................................................................. 253 Finance Department Organization Chart ........................................................................................... 134 Finance Department Revenue and Expenditure Summary ................................................................ 136 Financial Management (141) .............................................................................................................. 138 Financial Policies ........................................................................................................................... 35, 415 Financial Structure ................................................................................................................................ 46 Fire Administration (411) ................................................................................................................... 173 Fire Operations (417) ......................................................................................................................... 176 Fire Training (418) .............................................................................................................................. 180 Fire Prevention (215) .......................................................................................................................... 161 Fire‐Rescue Department Organization Chart ..................................................................................... 168 Fire‐Rescue Department Revenue and Expenditure Summary .......................................................... 171 Five Year Capital Improvement Pay‐as‐you‐go/Facilities Program .................................................... 287 Forecast – Long Term Financial Plan .................................................................................................... 51 Fund Budget Overview ......................................................................................................................... 65
GGeneral Engineering Services (561) .................................................................................................... 257 General Fund Expenditures .................................................................................................................. 97 General Fund Revenues ........................................................................................................................ 83 General Fund Revenues and Expenditures Budget Comparison .......................................................... 81 General Government (113) ................................................................................................................ 104 Glossary .............................................................................................................................................. 447 Golf Course ......................................................................................................................................... 356 Guide for Readers .................................................................................................................................. iii
442

Index FY2018
HHealth Benefit – Self Insurance Fund (Fund 502) ............................................................................... 383 Health Insurance Trust (Fund 610) ..................................................................................................... 401 History of Town .................................................................................................................................... 33 Human Resources (123) ..................................................................................................................... 117 Human Resources Organization Chart ............................................................................................... 127
IInformation Technology (125) ............................................................................................................ 118 Inspection and Compliance (213) ....................................................................................................... 144
LLandmarks Preservation (214) ........................................................................................................... 157 Landscape Maintenance (551) ........................................................................................................... 251 Legislative (111) .................................................................................................................................. 102 Library Services (321) ......................................................................................................................... 266 Long Term Financial Plan Forecast ....................................................................................................... 51
MMajor Revenue Sources ........................................................................................................................ 87 Major Revenues – Summary by Fund Type .......................................................................................... 68 Map of Town ........................................................................................................................................ 27 Marina ................................................................................................................................................ 351 Meter Maintenance and Collection (558) .......................................................................................... 256 Millage Rate and Assessed Valuation ................................................................................................... 29
OOcean Rescue (419) ............................................................................................................................ 182 Operations – Fire (417) ....................................................................................................................... 176 Organization Chart – Finance Department ........................................................................................ 134 Organization Chart – Fire‐Rescue Department .................................................................................. 168 Organization Chart – Human Resources ............................................................................................ 124 Organization Chart – Planning, Zoning and Building .......................................................................... 146 Organization Chart – Police Department ........................................................................................... 186 Organization Chart – Public Works Department ................................................................................ 218 Organization Chart – Recreation Enterprise Fund ............................................................................. 346 Organization Chart – Town Manager’s Office .................................................................................... 106 Organization Chart – Townwide ............................................................................................................. ii Organized Crime, Vice and Narcotics – OCVAN (422) ........................................................................ 195
443
Index FY2018
PParking Control Unit (430) .................................................................................................................. 214 Patrol (428) ......................................................................................................................................... 207 Pay‐as‐you‐go Capital Improvement Fund ......................................................................................... 288 Permit Issuance (212) ......................................................................................................................... 154 Planning and Zoning (211) .................................................................................................................. 150 Planning, Zoning and Building Organization Chart ............................................................................. 146 Planning, Zoning and Building Revenue and Expenditure Summary ................................................. 148 Police Administrative Management (421) .......................................................................................... 191 Police Department Organization Chart .............................................................................................. 186 Police Department Revenue and Expenditure Summary ................................................................... 189 Police Training and Community Relations Unit (424) ........................................................................ 199 Policies – Financial ........................................................................................................................ 35, 415 Positions Authorized .......................................................................................................................... 409 Public Works Administrative Management (511) .............................................................................. 225 Public Works Department Organization Chart ................................................................................... 218 Public Works Department Revenue and Expenditure Summary ....................................................... 223 Purchasing (144) ................................................................................................................................. 142
RReaders Guide ....................................................................................................................................... iii Records Information System Unit (423) ............................................................................................. 197 Records Management (131) ............................................................................................................... 112 Recreation Administration ................................................................................................................. 373 Recreation Center ............................................................................................................................... 368 Recreation Enterprise Fund Organization Chart ................................................................................ 346 Recreation Enterprise Fund Revenue and Expenditure Summary ..................................................... 349 Recycling (545) ................................................................................................................................... 247 Refuse Disposal (543) ......................................................................................................................... 244 Reserve Analysis ................................................................................................................................... 73 Residential Collection (541) ................................................................................................................ 240 Retirement Fund ................................................................................................................................. 391 Revenue and Expenditure Summary – Finance Department ............................................................. 136 Revenue and Expenditure Summary – Fire‐Rescue Department ....................................................... 171 Revenue and Expenditure Summary – Planning, Zoning and Building .............................................. 148 Revenue and Expenditure Summary – Police Department ................................................................ 189 Revenue and Expenditure Summary – Public Works Department .................................................... 223 Revenue and Expenditure Summary – Recreation Enterprise Fund .................................................. 349 Revenues – General Fund ..................................................................................................................... 83 Revenues – Major Sources ................................................................................................................... 87 Revenues – Summary of Major Revenues by Fund Type ..................................................................... 68 Right‐of‐Way Inspections (565) .......................................................................................................... 260 Risk Management – Self Insurance Fund (Fund 501) ......................................................................... 379
444

Index FY2018
SSanitary Sewage Treatment (533) ...................................................................................................... 239 Sanitary Sewer Maintenance (532) .................................................................................................... 236 Self Insurance Fund – Health Benefit (Fund 502) ............................................................................... 383 Self Insurance Fund – Risk Management (Fund 501) ......................................................................... 379 Shore Protection Board Coastal Management Program Budget ....................................................... 291 Strategic Planning and Key Results Measurement ............................................................................... 18 Storm Sewer Maintenance (531) ....................................................................................................... 233 Street Lighting (524) ........................................................................................................................... 231 Street Repair and Maintenance (521) ................................................................................................ 227 Summary of Expenditure Classifications by Fund Type ........................................................................ 70 Summary of Major Revenues by Fund Type......................................................................................... 68
TTennis ................................................................................................................................................. 363 Town History ........................................................................................................................................ 33 Town Manager’s Office Administrative Management (121) .............................................................. 108 Town Manager’s Office Organization Chart ....................................................................................... 106 Town of Palm Beach Organization Chart ................................................................................................ ii Town Overview/Demographics ............................................................................................................ 28 Town‐wide Underground Utilities Fund ............................................................................................. 271 Traffic Control (523) ........................................................................................................................... 229 Training – Fire‐Rescue (418) ............................................................................................................... 180 Training and Community Relations Unit – Police (424) ...................................................................... 199 Transfers to Other Funds (611 to 625) ............................................................................................... 267
WWorth Avenue Maintenance .............................................................................................................. 309
YYard Trash Collection (544) ................................................................................................................ 245
445

(This page intentionally left blank)
446

Glossary FY2018
The definition of terms listed are provided to assist the user in the understanding of terminology used throughout the text of the budget document. For your convenience and reading ease, the following is a list of acronyms that are used by the Town of Palm Beach.
ALS Advanced Life Support CAFR Comprehensive Annual Financial Report CDBG Community Development Block Grant CIP Capital Improvement Program EMS Emergency Medical Services FY Fiscal Year FTE Full-Time Equivalent GAAP Generally Accepted Accounting Principals
GASB Governmental Accounting Standards Board GIS Geographic Information System ICMA International City/County Management Associaition MDT Mobile Data Terminals OPEB Other Post Employment Benefits REF Recreation Enterprise Fund TRIM Truth in Millage
ACCOUNT NUMBER: A system of designating accounts, entries, invoices, vouchers, that quickly references certain required information.
ACCOUNTING PERIOD: A period at the end of which and for which financial statements are prepared. The Town’s accounting period is from October 1 through September 30.
ACCOUNTING PROCEDURES: All processes which discover, record, classify and summarize financial information to produce financial reports and provide internal control.
ACCOUNTING SYSTEM: The total structure of records and procedures which discover, record, classify, summarize, and report information on the financial position and results of operations of a government or any of its funds, fund types, balanced account groups, or organizational components.
ACCOUNTS PAYABLE: A liability account reflecting amounts on open accounts owing to private persons or organizations for goods and services received by a government.
ACCOUNTS RECEIVABLE: An asset account reflecting amounts owing on open accounts from private persons or organizations for goods and services provided by a government.
ACCRUAL BASIS: The basis of accounting under which transactions are recognized when they occur regardless of the timing of related cash flow.
ACTUARIAL: A person or methodology that makes determinations of required contributions to achieve future funding levels that addresses risk and time.
ACCUMULATED DEPRECIATION: Accumulated depreciation is the total depreciation taken for an asset since it was placed in service. Also known as life-to-date depreciation and depreciation reserve.
ACTIVITY CLASSIFICATION: A grouping of expenditures on the basis of specific lines of work performed by organizational units. For example: sewage treatment and disposal, solid waste collection, and street cleaning are activities performed in carrying out the function of sanitation and the segregation of the expenditures is made for each of these activities constitutes an activity classification.
AD VALOREM: A tax levied in proportion to value of the property against which it is levied.
ADOPTED BUDGET: The budget as it is approved by the Town Council prior to the beginning of each fiscal year.
AMENDED BUDGET: The amended budget is the working budget. It is the adopted budget that incorporates all operating transfers and approved budget amendments (changes in the budget total that are approved subsequent to initial adoption).
AMORTIZATION: (1) Gradual reduction, redemption or liquidation of the balance of account according to a specific schedule of times and amounts. (2) Provision for the
447

Glossary FY2018
extinguishment of a debt by means of a Debt Service Fund.
ANNUAL BUDGET: A plan for the coordination of resources and expenditures. The budget is the financial plan for the Town’s allocation of resources to provide services, accomplish the Town’s goals and objectives, and perform activities.
APPRAISE: To make an estimate of value, particularly of the value of property. If the property is valued for purposes of taxation, the less-inclusive term “assess” is substituted for this term.
APPROPRIATION: A legal authorization granted by a legislative body to make expenditures and to incur obligations for specific purposes. An appropriation is usually limited in amount and as to the time when it may be expended.
ASSESSED VALUATION: A valuation set upon real estate or other property by a government as a basis for levying taxes.
ASSESSMENT ROLL: In the case of real property, the official list containing the legal description of each parcel of property and its assessed valuation. The name and address of the last known owner are also usually shown. In the case of personal property, the assessment roll is the official list containing the name and address of the owner, a description of the personal property and its assessed value.
ASSETS: Resources owned or held by a government, which have monetary value.
AUDIT: A methodical examination of utilization of resources. It concludes in a written opinion of its findings. An audit is a test of management’s accounting system to determine the extent to which internal accounting controls are both available and being used.
AUTHORITY: A government or public agency created to perform a single function or a restricted group of related activities. Usually such units are financed from service charges, fees and tolls, but in some instances they also have taxing powers. An authority may be
completely independent of other governments or partially dependent upon other governments for its creation, its financing or the exercise of certain powers
AVAILABLE FUND BALANCE: This refers to the funds remaining from the prior year which are available for appropriation and expenditure in the current year.
BALANCED BUDGET: A budget in which planned funds available equal planned expenditures.
BEGINNING FUND BALANCE: The unexpended amount in a fund at fiscal year end, which is available for appropriation in the next fiscal year.
BENEFITS: Payments to which participants may be entitled under a pension plan, including pension benefits, death benefits, and benefits due on termination of employment.
BOND: A written promise to pay a specified sum of money, called the face value or principal amount, at a specified date or dates in the future, called the maturity date(s), together with periodic interest at a specified rate.
BOND RATING: An evaluation of credit worthiness performed by an independent rating service. The Town is one of only three municipalities in the State of Florida to maintain a AAA rating from both Moody’s and Standard & Poor’s.
BUDGET: A plan of financial operation embodying an estimate of proposed expenditures for a given period and the proposed means of financing them. Used without any modifier, the term usually indicates a financial plan for a single fiscal year. The term “budget” is used in two senses in practice. Sometimes it designates the financial plan presented to the appropriating body for adoption and sometimes the plan is finally approved by that body. It is either usually necessary to specify whether the budget under consideration is preliminary and tentative or whether it has been approved by the appropriating body.
448

Glossary FY2018
BUDGET AMENDMENT: The process by which unanticipated changes in revenue or expenditures are made a part of the budget, thereby amending it.
BUDGET CALENDAR: A schedule of key dates which the Town follows in the preparation, adoption and administration of the budget.
BUDGET MESSAGE: A general discussion of the proposed budget as presented in writing by the budget-making authority to the legislative body.
BUDGET TRANSFER: An action which changes budgeted amounts at the department, division, and/or object code level of control with offsetting increases and decreases in budgeted line items.
BUDGETARY BASIS: This refers to the basis of accounting used to estimate financing sources and uses in the budget. This generally takes one of three forms: GAAP, cash or modified accrual.
BUDGETARY CONTROL: The control or management of a government or enterprise in accordance with an approved budget for the purpose of keeping expenditures within the limitations of available appropriations and available revenues.
BUSINESS PLAN: A written document outlining how Town sources will be applied to achieve the objectives determined for the Leisure Services Enterprise Fund.
CAPITAL EQUIPMENT: Equipment with an expected life of more than one year and a value of more than $2,500 for vehicles and equipment and $1,500 for computer equipment.
CAPITAL LEASE: An agreement conveying the right to use property, plant or equipment usually for a stated period of time where the lessee assumes all the risks and rewards of ownership.
CAPITAL OUTLAYS: Expenditures which result in the acquisition or addition of fixed assets.
CAPITAL PROGRAM: A plan for capital expenditures to be incurred each year over a
fixed period of years to meet capital needs arising from the long-term work program. It sets forth each project or other contemplated expenditure in which the government is to have a part and specifies the full resources estimated to be available to finance the projected expenditures. The minimum threshold used to qualify a project for the Capital Improvement Program is $50,000.
CAPITAL PROJECT: Major construction, acquisition, or renovation activities which add value to a government’s physical assets or significantly increase their useful life; also called capital improvements.
CAPITAL PROJECT FUNDS: One or more governmental type of funds established to account for resources used for the acquisition of large capital improvements, other than those accounted for in proprietary or trust funds.
COMPREHENSIVE ANNUAL FINANCIAL REPORT (CAFR): This official annual report presents the status of the Town’s finances in a standardized format. The CAFR is organized by fund and contains two basic types of information: a balance sheet that compares assets with liabilities and fund balance; and an operating statement that compares revenues and expenditures.
CONTINGENCY: A budgeted reserve set-aside for possible emergencies, revenue shortfalls, or unforeseen expenditures not otherwise budgeted for.
CURRENT ASSETS: Those assets which are available or can be made readily available to finance current operations or to pay current liabilities. Those assets which will be used upon or converted into cash within one year. Some examples are cash, temporary investments and taxes receivable which will be collected within one year.
DEBT LIMIT: The maximum amount of gross or net debt which is legally permitted.
DEBT SERVICE: The payment of principal and interest on borrowed funds, such as bonds.
449

Glossary FY2018
DEBT SERVICE FUNDS: One or more funds established to account for revenues and expenditures used to repay the principal and interest on debt.
DEBT SERVICE REQUIREMENT: The amount of money required to pay the principal and interest on outstanding debt, serial maturities of principal for serial bonds and required contributions to accumulate monies for future retirement of term bonds.
DEFICIT: An excess of liabilities and reserves of a fund over its assets.
DEPARTMENT: A basic organizational unit of government that is functionally unique in its delivery of services.
DEPRECIATION: The decrease in value of physical assets due to use and the passage of time.
DESIGNATED FUND BALANCE: Funds that have been identified for a specific purpose. This differs from reserved funds, in that there is no legal requirement for funds that have been designated.
DISTINGUISHED BUDGET PRESENTATION PROGRAM: A voluntary program administered by the Government Finance Officers Association to encourage governments to publish efficiently organized and easily readable budget documents and to provide peer recognition and technical assistance to the fiscal officers preparing them.
ENCUMBRANCE: An amount of money committed for the payment of goods and services not yet received or pair for.
ENTERPRISE FUND: A self supporting fund designed to account for activities supported by user charges. Examples are: Water, Solid Waste, and Recreation funds.
EXPENDITURES: Decreases in net current financial resources. Expenditures include current operating expenses which require the current or future use of net current assets, debt service, and capital outlays.
EXPENSES: Decrease in net total assets. Expenses represent the total cost of operations during a period regardless of the timing of related expenditures.
FIDUCIARY FUNDS: Trust and/or agency funds used to account for assets held by the Town in a trustee capacity, or as an agent for individuals, private organizations, other governments, and/or other funds.
FISCAL YEAR: A 12-month period to which the annual operating budget applies and at the end of which a government determines its financial position and the results of its operations. By State Law, the fiscal year for the Town of Palm Beach, and all Florida local governments, is October 1 to September 30.
FIXED ASSETS: Assets of a long-term character which are intended to continue to be held or used, such as land, buildings, improvements other than buildings, and machinery and equipment.
FRANCHISE: A special privilege granted by a government regulating the continuing use of public property such as city streets and usually involving the elements of monopoly and regulation.
FULL FAITH AND CREDIT: A pledge if the general taxing power for the payment of debt obligations. Bonds carrying such pledges are referred to as general obligation bonds or full faith and credit bonds
FULL-TIME EQUIVALENT (FTE): Number of positions calculated on the basis that one FTE equates to a 40-hour workweek for twelve months. For example, two part-time positions working 20 hours for twelve months also equals one FTE.
FULL-TIME POSITION: A position which qualifies for full Town benefits, usually required ti work 40 hours per week. Full-time fire personnel work 50.4 hours per week and all part-time personnel working in excess of 30 hours per week are granted benefits as full-time employees.
450

Glossary FY2018
FUNCTIONAL CLASSIFICATION: Expenditures classification according to the principal purposes for which expenditures are made. Examples are public safety, general government, culture/recreation, etc.
FUND: A fiscal and accounting entity with a self-balancing set of accounts recording cash and other financial resources, together with all related liabilities and residual equities or balances, and changes therein, which are segregated for the purpose of carrying on specific activities or attaining certain objectives in accordance with special regulations, restrictions, or limitations.
FUND BALANCE: The fund equity of governmental funds. Changes in fund balances are the result of the difference of revenues to expenditures. When revenues exceed expenditures in a given period, fund balance increase and when expenditures exceed revenue, fund balance decreases.
FUND TYPE: In governmental accounting, all funds are classified into eight generic fund types; General, Special Revenue, Debt Service, Capital Projects, Special Assessment, Enterprise, Internal Service, and Trust and Agency.
GASB: Governmental Accounting Standards Board - an established national board, which governs financial reporting standards on state and local government levels throughout the United States of America, with its main headquarters in Chicago, IL.
GASB 34: Statement 34 of the Governmental Accounting Standards Board - Basic Financial Statements and Management’s Discussion and Analysis for State and Local Governments - establishes new financial reporting standards for state and local governments throughout the United States.
GENERAL FUND: A fund containing revenues such as property taxes not designated by law for a special purpose. Some of the departments that are part of the General Fund include Fire, Police, Public Works, Administration and Recreation.
GENERAL OBLIGATION BONDS: Bonds for the payment of which the full faith and credit of the issuing government are pledged.
GENERALLY ACCEPTED ACCOUNTING PRINCIPLES (GAAP): Uniform minimum standards of/and guidelines for financial accounting and reporting. They govern the form and content of the basic financial statement of an entity. GAAP encompasses the conventions, rules, and procedures necessary to define accepted accounting practices at a particular time. They include not only broad guidelines of general application, but also detailed practices and procedures. GAAP provides a standard to measure financial presentations. The primary authoritative statement of the application of GAAP to state and local governments are NCGA pronouncements. Every government should prepare and publish financial statements in conformity with GAAP. The objectives of government GAAP financial reports are different from and much broader than, the objective of business GAAP financial reports.
GEOGRAPHIC INFORMATION SYSTEM (GIS): A GIS is a specialized data management system designed for the entry, analyses, and display of data commonly found on maps. GIS integrates maps with a database and allows analyses to be performed using location relationships of map features to the database.
GOAL: A statement of broad direction, purpose or intent based on the needs of the community. A goal is general and timeless.
GOVERNMENTAL FUNDS: Governmental funds account for the activities of a typical state or local government’s operations (e.g. public safety, public health). Governmental funds can be further classified into four generic fund types - general fund, special revenue funds, capitalprojects funds, and debt service funds.
GRANTS: Contributions or gifts of cash or other assets from another government to be used or expended for a specific purpose, activity or facility.
HOMESTEAD EXEMPTION: Pursuant to the Florida State Constitution, the first $25,000 of assessed value of a home which the owner
451
Glossary FY2018
occupies as principal residence is exempt from the property tax.
INFLATION: A rise in price levels caused by an increase in available funds beyond the proportion of available goods.
INFRASTRUCTURE: Assets which are immovable and of value only to the governmental unit (e.g. sidewalks, gutters, bridges.)
INTERFUND TRANSFERS: The movement of moneys between the funds of a governmental entity.
INTERGOVERNMENTAL REVENUE: Revenue collected by one government and distributed (usually through some predetermined formula) to another level of government(s).
INTERLOCAL AGREEMENT: A written agreement between the Town and other units of government to share in similar services, projects, emergency assistance, support, funding, etc., to the mutual benefit of all parties.
INTERNAL SERVICE FUNDS: One or more funds that accounts for the goods and services provided by one department to another within government on a cost-reimbursement basis.
INVESTMENTS: Securities and real estate held for the production of revenues in the form of interest, dividends, rentals or lease payments. The term does not include fixed assets used in government operations.
LEVY: (Verb) To impose taxes, special assessments or service charges for the support of governmental activities. (Noun) The total amount of taxes, special assessments or service charges imposed by a government.
LIABILITIES: Debt or other legal obligations arising out of transactions in the past which must be liquidated, renewed, or refunded at some future date. This term does not include encumbrances.
MILL: A taxation unit equal to one dollar of tax obligation for every $1,000 of assessed valuation of property.
MILLAGE RATE: The tax rate applied to each thousand dollars of taxable assessed valuation which results in the tax levy. Example: A 4.0 millage rate applied to property with a taxable valuation of $500,000 would generate tax in the amount of $2,000.00 (4.0 x 500) of ad valorem revenue.
MISSION STATEMENT: The statement that identifies the particular purpose and function of a department.
MODIFIED ACCRUAL BASIS: The accrual basis of accounting adopted for the governmental fund type. In this basis of accounting, expenditures are recognized when the goods or services are received and revenues, such as taxes, are recognized when measurable and available to pay expenditures in the current accounting period.
NON-EXPENDABLE TRUST FUNDS: When a government uses a non-expendable trust fund, the principal must remain intact, but it can expend the earnings.
OBJECTIVE: A simply stated, readily measurable statement of the aim of expected accomplishment within the fiscal year. A good statement of objective should imply a specific standard of performance for a given program:
(a) An operational objective focuses on servicedelivery.
(b) A managerial objective focuses on thoseaspects of management that help staff achieveoperational objectives, i.e., staff training, workplan development, etc.
OBLIGATIONS: Amounts which a government may be required legally to meet out of its resources. They include not only actual liabilities, but also unliquidated encumbrances.
OPERATING BUDGET: Plans of current expenditures and the proposed means of financing them. The annual operating budget is the primary means by which most of the financing acquisition, spending and service delivery activities of a government are
452

Glossary FY2018
controlled. The use of an annual operating budget is required by law.
OPERATING COSTS: Expenses for such items such as expendable supplies, contractual services, and utilities.
ORDINANCE: A formal legislative enactment by the governing board of a municipality. If it is not in conflict with any higher form of law, such as a state statute or constitutional provision, it has the full force and effect of law within the boundaries of the municipality to which it applies.
OTHER COSTS: Costs which are not personnel, operating or capital in nature, such as debt service and transfers between funds.
OUTSIDE AGENCY: Governmental or not-for-profit entities that provide services to Town residents or to the Town under terms of a contract or agreement. Example: The Town of Palm Beach administers the financial and parking enforcement operations for Kreusler Park which is utilized by Town residents and visitors, but is owned by Palm Beach County.
PART-TIME: Part-time employees work less than 30 hours per week and are not entitled to full-time employee benefits.
PAY-AS-YOU-GO BASIS: A term used to describe the financial policy of a governmental unit which finances all of its capital outlays from current revenues rather than by long-term borrowing.
PENSION FUND: The pension funds account for the accumulation of resources to be used for retirement benefit payments to the Town’s employees.
PER CAPITA: A measurement of the proportion of some statistic to an individual resident determined by dividing the statistic by the current population.
PERFORMANCE BUDGET: A budget wherein expenditures are based primarily upon measurable performance of activities and work programs.
PERFORMANCE MEASURE: Data collected to determine how effective and/or efficient a program is in achieving its objectives.
PERSONAL SERVICES: A general category of operating expenses that includes salaries and wages, pensions, health insurance and other fringe benefits.
PERSONNEL COSTS: Costs directly associated with employees, including salaries and fringe benefits.
POST-EMPLOYMENT BENEFITS: A form of deferred compensation that includes heathcare and any type of post-employment benefit that is not an integral part of a pension plan.
PROGRAM: A distinct, clearly identifiable activity, function, cost center, or organizational unit which is budgeted as a sub-unit of a department. A program budget utilizes the separate programs as its basic component.
PROGRAM BUDGET: A budget with expenditures that are based primarily on programs of work. Each individual program is established as a separate cost center.
PROPERTY TAX: A tax levied on the assessed value of real property. This tax is also known as ad valorem tax.
PROPRIETARY FUND TYPES: Proprietary funds account for activities that are common in the private sector, which the government operates in a manner similar to their counterparts in the commercial world. The primary source of revenues for this fund type is user charges. Proprietary funds can by further classified into two fund types - enterprise funds and internal service funds.
PURCHASE ORDER: A document which authorizes the delivery of specified merchandise or the rendering of certain services.
RECLASSIFICATION: The moving of an existing position from one personnel classification (title) to another based upon the different performance of duties.
453

Glossary FY2018
REQUISITION: A written demand or request, usually from one department to the purchasing officer or to another department, for specified articles or services.
Reserves: a portion of the fund balance or retained earnings legally segregated for specific purposes.
RESERVE FOR CONTINGENCIES: An amount set aside that can subsequently be appropriated by the Town Council to meet unexpected needs.
RESOLUTION: A special or temporary order of a legislative body; an order of a legislative body requiring less legal formality than an ordinance or statute.
RETAINED EARNINGS: An equity account reflecting the accumulated earnings of an Enterprise or Internal Service Fund.
REVENUE BONDS: A particular kind of bond in which the revenue to pay back the bond and interest comes from the project that the borrowed money was used to create, expand, or improve. Pledged revenues may be derived from operation of the financed project, grants, and excise or other non-ad valorem taxes. Generally, no election is required prior to issuance or validation of such obligations.
REVENUES: Increases in governmental fund-type net current assets from other than expenditure refunds and residual equity transfers. Under NCGA Statement 1, general long-term debt proceeds and operating transfers-in are classified as “other financing sources” rather than revenues.
ROLLED BACK RATE: That tax rate which when applied to the current year’s adjusted taxable value, generates the same ad valorem tax revenue as the prior year.
SAVE OUR HOMES: Provisions in Florida Statutes, Section 193.155(1) limit the annual increase in the taxable value of a homesteaded property. Beginning in 1995, or the year after the property receives homestead exemption, an annual increase in assessment shall not exceed the lower of the following:
a. Three percent of the assessed value of theproperty for the prior year; orb. The percentage change in the Consumer PriceIndex (CPI) for all urban consumers, U.S. cityaverage, all items 1967 = 100 or successorreports* for the preceding calendar year asinitially reported by the U.S. Department ofLabor, Bureau of Labor Statistics.STATUTE: A written law enacted by a dulyorganized and constituted legislative body.
TAX RATE: The amount of tax stated in terms of a unit of a tax base. The State of Florida uses a mill as its tax rate. A mill is the rate applied to each thousand dollars of taxable appraised value. For example, 3.170 mills applied to property valued at $150,000 would generate taxes of $475.50 (3.170 x 150) of ad valorem revenue. In accordance with Florida Statute, 200.071, except as otherwise provided herein, no ad valorem tax millage shall be levied against real property and tangible personal property by counties in excess of 10 mills, except for voted levies.
TAX RATE LIMIT: The maximum rate at which a government may levy a tax. The limit may apply to taxes raised for a particular purpose, or to taxes imposed for all purposes, and may apply to a single government, to a class of governments or to all governments operating in a particular area. Overall tax rate limits usually restrict levies for all purposes and of all governments, state and local, having jurisdiction in a given area.
TAX ROLL: The official list showing the amount of taxes levied against each taxpayer or property. Frequently, the tax roll and the assessment roll are combined, but even in these cases the two can be distinguished.
TAXABLE VALUE: The assessed value of property minus the homestead exemption and any other exemptions which may be applicable.
TAXES: Compulsory charges levied by a government for the purpose of financing services performed for the common benefit. This term does not include specific charges made against particular persons or property for current or permanent benefits such as special assessments. Neither does the term include charges for service
454

Glossary FY2018
rendered only to those paying such charges as, for example, development fees.
TEMPORARY POSITION: A temporary position is filled for a specific period of time, is not permanent in nature, and does not qualify for regular town benefits.
TRANSFERS IN/OUT (INTER-FUND TRANSFERS): Amounts transferred from one fund to another to assist in financing the services of the recipient fund. Transfers do not constitute revenues or expenditures of the governmental unit. Thus, they are budgeted and accounted for separately from other revenues and expenditures as other financing sources or uses.
TRUST FUNDS: Funds used to account for assets held by a government in a trustee capacity for individuals, private organizations, other government and/or other funds.
TRUTH IN MILLAGE: The Florida Truth in Millage Act (TRIM) serves to formalize the property tax levying process by requiring a specific method of tax rate calculation, form of notice, public hearing requirements and advertisement specifications prior to the adoption of a budget tax rate.
The effect of TRIM is to inform taxpayers that their property taxes are changing (up or down), the cause (a change in the assessed value of their property and/or an increase in the proposed spending level) and how the proposed new tax rate compares to the rate that would generate the same property tax dollars as the current year (the “rolled back” rate).
UNENCUMBERED: The portion of an allotment not yet expended or encumbered.
UNDESIGNATED/UNRESERVED FUND BALANCE: Unrestricted funds available to be designated as a budget-funding source.
USEFUL LIFE: The period of time that a fixed asset is able to be used. This can refer to a budgeted period of time for an equipment class or the actual amount of time for a particular item.
USER CHARGES: The payment of a fee for direct receipt of a public service by the party benefitting from the service.
WORKLOAD INDICATORS: Statistical and historical measures of the services level provided or workload completed by each department within the Town.
455

(This page intentionally left blank)
456