MAHANADI OFFSHORE BASIN
14
MAHANADI OFFSHORE BASIN MAHANADI OFFSHORE BASIN 1. BASIN AREA : 260,000 Sq. Km. 1.1 BASIN LOCATION MAP : Refer Sedimentary Basin Map of India in Notice Inviting Offers (NIO) 2. EXISTING DATA BASE 2.1 SEISMIC DATA : 2D - 20723 LKM Vintage Type Data acquired by Quantum in LKM 1978 2D ONGC (Seiscom Delta) 3,178 1988-1990 2D ONGC (Western Geophysical), GECO 1,071 1996-1997 2D DGH (Western Atlas) 3,400 2001 2D DGH (Large) 3,112 2.2 OTHER SURVEYS : Gravity Magnetic Surveys along with seismic surveys. : Satellite Gravity Survey 2.3 Well Data : Number of Exploratory Wells : 11 Onland : 4, Offshore : 7 Hydrocarbon : oil & gas shows in a number of Discoveries / wells Shows 3. BLOCK ON OFFER : 1 Deep Water Block MN-DWN-2003/1 4. BASIN TYPE : Passive Continental Margin 5. PROVEN SEDIMENTARY SECTION : Age Range Thickness (Km) Early Cretaceous - Recent ~ 5
Transcript of MAHANADI OFFSHORE BASIN

MAHANADI OFFSHORE BASIN
MAHANADI OFFSHORE BASIN 1. BASIN AREA : 260,000 Sq. Km.
1.1 BASIN LOCATION MAP : Refer Sedimentary Basin Map of India in Notice Inviting Offers (NIO)
2. EXISTING DATA BASE
2.1 SEISMIC DATA : 2D - 20723 LKM
Vintage Type Data acquired by Quantum in LKM 1978 2D ONGC (Seiscom Delta) 3,178 1988-1990 2D ONGC (Western Geophysical),
GECO 1,071
1996-1997 2D DGH (Western Atlas) 3,400 2001 2D DGH (Large) 3,112
2.2 OTHER SURVEYS : Gravity Magnetic Surveys along with seismic surveys. : Satellite Gravity Survey 2.3 Well Data :
Number of Exploratory Wells : 11
Onland : 4, Offshore : 7 Hydrocarbon : oil & gas shows in a number of
Discoveries / wells Shows
3. BLOCK ON OFFER : 1 Deep Water Block
MN-DWN-2003/1
4. BASIN TYPE : Passive Continental Margin 5. PROVEN SEDIMENTARY SECTION :
Age Range Thickness (Km) Early Cretaceous - Recent ~ 5

MAHANADI OFFSHORE BASIN
5.1 GENERALISED STRATIGRAPHIC SEQUENCE
5.2 GEOLOGICAL CROSS SECTION
AGETHICK.
(m.)LITHO-LOGY
PLEI
ST-
REC
ENT
PLIO
CEN
EM
IOC
ENE
E-M
EOC
.PA
LEO
.LO
WER
CR
ET.
E AR
LY
CR
E TA
CE O
US
PRE-CAMB.
200-600
200-700
600-1700
200-400
50-600
0-500
25-850
SOURCE RES. SEAL OIL & GAS
2
1.TOC >1.5%VRo 0.7 – >1.30% KEROGEN TYPE II & III
2.TOC >1.5%VRo 0.6 – >1.30% KEROGEN TYPE II & III
NOTE: SOURCE ROCK DATA FROM MODEL STUDY
1
OLIGO. 100-200

MAHANADI OFFSHORE BASIN
6. PETROLEUM GEOLOGY :
EXPECTED RESERVOIRS : Late Cretaceous to Pliocene sandstones & Carbonates EXPECTED SOURCE ROCKS : Paleogene Shales EXPECTED CAP ROCKS : Intraformational shales
7. PROVEN / EXPECTED PLAY TYPES :
(i) Anticlinal & Fault related structures in Cretaceous
sequence (ii) Wedgeout of Paleocene-Eocene sediments (iii) Carbonate buildup in Eocene sequence (iv) Turbidite submarine fans in Miocene
8. INTERPRETATION REPORT – CONTENTS
PART-A 1. INTRODUCTION
2. STRUCTURAL AND GEOLOGICAL OVERVIEW
2.1. Tectonic history
2.2. Stratigraphy
3. DATA AVAILABILITY AND QUALITY
3.1. Seismic data
3.2. Well data
3.3. Seismic to well tie
3.4. Survey data information
4. EVENTS PICKED
4.1. Water Bottom
4.2. Top of Miocene
4.3. Top of Oligocene

MAHANADI OFFSHORE BASIN
4.4. Top of Eocene
4.5. Top of Palaeocene
4.6. Top of Cretaceous
4.7. Top of Basement
5. MAP GENERATION
5.1 Time to Depth Conversion
5.2. Mapping parameters
6. INTERPRETATION RESULTS
6.1. Water Bottom
6.2. Top of Miocene
6.3. Top of Oligocene
6.4. Top of Eocene
6.5. Top of Palaeocene
6.6. Top of Cretaceous
6.7. Top of Basement
7. HYDROCARBON POTENTIAL
7.1 Source potential
7.2. Play Types
SUMMARY AND RECOMMENDATIONS
ACKNOWLEDGEMENTS
Appendix A. Reference List
Appendix B. Well Chart
Appendix C. Lithology Encounterd in Wells
Appendix D. Line Listing
LIST OF FIGURES Figure 2.1.1. Regional tectonic elements of the .East Coast of India.
Figure 2.2.1. Tectonic evolution, basin fill and petroleum systems in
Mahanadi basin.
Figure 2.2.2. Mahanadi Basin Well Correlation
Figure 3.1.1. Seismic and Well Database.
Figure 3.1.2. Example of seismic data shot by LARGE.

MAHANADI OFFSHORE BASIN
Figure 3.1.3. Example of seismic data shot by Western Geophysical.
Figure 3.1.4. Comparison of seismic data from different surveys.
Figure 3.1.5. Example of seismic data shot in early surveys.
Figure 3.3.1. Seismic to well tie at well NEC-4 location (line EC-95111).
Figure 3.3.2. Seismic to well tie at well NEC-1 location (line EC-95131).
Figure 3.3.3. Seismic to well tie at well MND-5 location (line EC-95161).
Figure 4.2.1. Top of Miocene. Line EC-95201.
Figure 4.2.2. Top of Miocene. Line EC-01-03.
Figure 4.3.1. Top of Oligocene. Line EC-01-04.
Figure 4.3.2. Top of Oligocene. Line EC-95201.
Figure 4.4.1. Top of Eocene. Line EC-01-08.
Figure 4.4.2. Top of Eocene. Line EC-01-12.
Figure 4.5.1. Top of Palaeocene. Line EC-01-09.
Figure 4.5.2. Top of Palaeocene. Line EC-01-17.
Figure 4.5.3. Top of Palaeocene. Line EC-01-05.
Figure 4.5.4. Top of Palaeocene. Line EC-01-15.
Figure 4.5.5. Top of Palaeocene. Line EC-95211.
Figure 4.6.1. Top of Cretaceous. Line EC-01-11.
Figure 4.6.2. Top of Cretaceous. Line EC-95121.
Figure 4.7.1. Top of Basement. Line EC-01-33.
Figure 4.7.2. Top of Basement. Line EC-01-12.
Figure 5.1.1. Velocity data analysis for Pliocene sequence.
Figure 5.1.2. Velocity data analysis for Palaeocene sequence.
Figure 6.1.1. Water Bottom TWT Map.
Figure 6.1.2. Water Bottom Depth Map.
Figure 6.1.3. Pliocene to Recent Isopach Map.
Figure 6.2.1. Top of Miocene TWT Map.
Figure 6.2.2. Top of Miocene Depth Map.
Figure 6.2.3. Miocene Isopach Map.
Figure 6.3.1. Top of Oligocene TWT Map.
Figure 6.3.2. Top of Oligocene Depth Map.

MAHANADI OFFSHORE BASIN
Figure 6.3.3. Oligocene Isopach Map.
Figure 6.4.1. Top of Eocene TWT Map.
Figure 6.4.2. Top of Eocene Depth Map.
Figure 6.4.3. Eocene Isopach Map.
Figure 6.5.1. Top of Palaeocene TWT Map.
Figure 6.5.2. Top of Palaeocene Depth Map.
Figure 6.5.3. Palaeocene Isopach Map.
Figure 6.6.1. Top of Cretaceous TWT Map.
Figure 6.6.2. Top of Cretaceous Depth Map.
Figure 6.6.3. Tertiary Isopach Map.
Figure 7.1.1. Burial, thermal and maturation history of the sedimentary
section of the Mahanadi basin near pseudo-well MOD-
D11, MOD-D12.
Figure 7.1.2. Burial, thermal and maturation history of the sedimentary
section of the Mahanadi basin near pseudo-well MOD-
D13, MOD-D14.
Figure 7.1.3. Burial, thermal and maturation history of the sedimentary
section of the Mahanadi basin near pseudo-well MOD-
D15, well NEC-4.
Figure 7.1.4. Map of the estimated realization of hydrocarbon
potential for probable source rocks near Top of
Cretaceous.
Figure 7.1.5. Map of the estimated realization of hydrocarbon
potential for probable source rocks near Top of
Palaeocene.
Figure 7.1.6. Map of the estimated realization of hydrocarbon
potential for probable source rocks near Top of Eocene.
Figure 7.1.7. Map of the estimated realization of hydrocarbon
potential for probable source rocks near Top of
Oligocene.
MAHANADI OFFSHORE BASIN
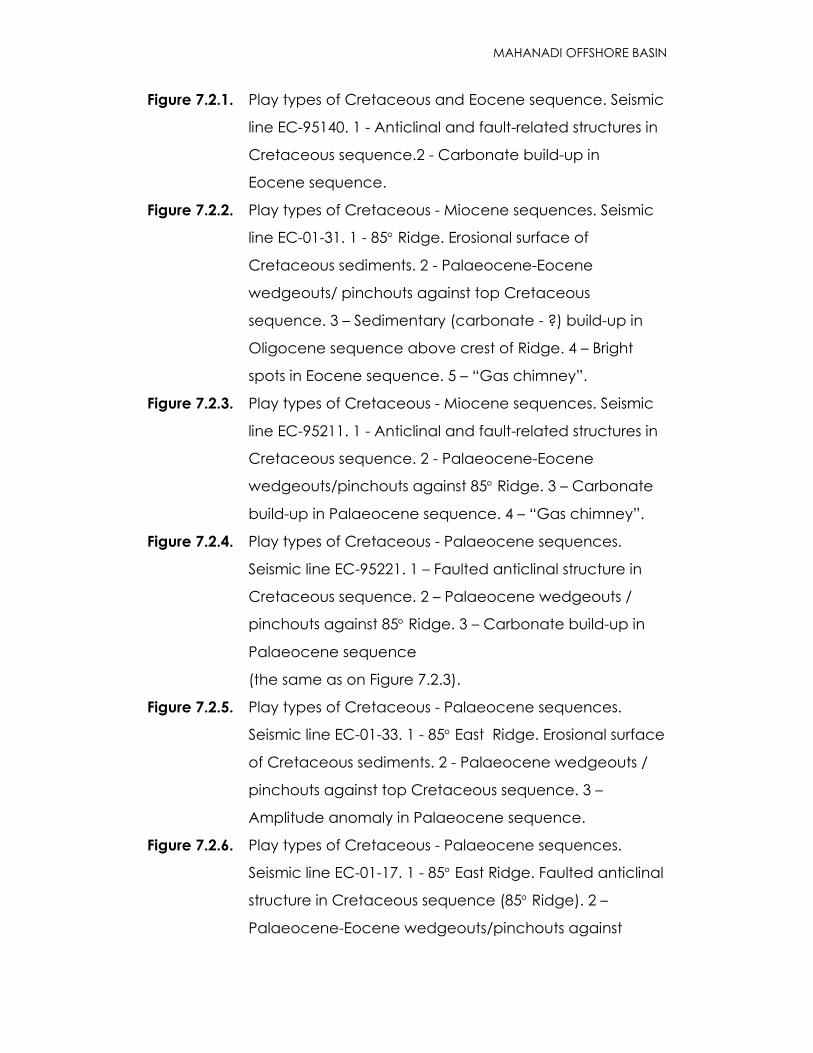
Figure 7.2.1. Play types of Cretaceous and Eocene sequence. Seismic
line EC-95140. 1 - Anticlinal and fault-related structures in
Cretaceous sequence.2 - Carbonate build-up in
Eocene sequence.
Figure 7.2.2. Play types of Cretaceous - Miocene sequences. Seismic
line EC-01-31. 1 - 85° Ridge. Erosional surface of
Cretaceous sediments. 2 - Palaeocene-Eocene
wedgeouts/ pinchouts against top Cretaceous
sequence. 3 – Sedimentary (carbonate - ?) build-up in
Oligocene sequence above crest of Ridge. 4 – Bright
spots in Eocene sequence. 5 – “Gas chimney”.
Figure 7.2.3. Play types of Cretaceous - Miocene sequences. Seismic
line EC-95211. 1 - Anticlinal and fault-related structures in
Cretaceous sequence. 2 - Palaeocene-Eocene
wedgeouts/pinchouts against 85° Ridge. 3 – Carbonate
build-up in Palaeocene sequence. 4 – “Gas chimney”.
Figure 7.2.4. Play types of Cretaceous - Palaeocene sequences.
Seismic line EC-95221. 1 – Faulted anticlinal structure in
Cretaceous sequence. 2 – Palaeocene wedgeouts /
pinchouts against 85° Ridge. 3 – Carbonate build-up in
Palaeocene sequence
(the same as on Figure 7.2.3).
Figure 7.2.5. Play types of Cretaceous - Palaeocene sequences.
Seismic line EC-01-33. 1 - 85° East Ridge. Erosional surface
of Cretaceous sediments. 2 - Palaeocene wedgeouts /
pinchouts against top Cretaceous sequence. 3 –
Amplitude anomaly in Palaeocene sequence.
Figure 7.2.6. Play types of Cretaceous - Palaeocene sequences.
Seismic line EC-01-17. 1 - 85° East Ridge. Faulted anticlinal
structure in Cretaceous sequence (85° Ridge). 2 –
Palaeocene-Eocene wedgeouts/pinchouts against

MAHANADI OFFSHORE BASIN
Ridge. 3 – Amplitude anomaly in Oligocene sequence
may represent carbonate reservoir. 4 – Miocene bright
spot related to Anticlinal structure formed over the ridge.
5 – “Possible Gas chemney”.
Figure 7.2.7. Seismic line EC-95140. 1 - Possible carbonate buildup in
Eocene sequence. 2 – Fault-related structural and
structural-tectonic plays in Oligocene-Pliocene
sequences.
Figure 7.2.8. Line EC 01-19. Amplitude anomaly in Top of Palaeocene
sequence related to carbonate buildups.
Figure 7.2.9. Seismic line EC-01-09. Anticlinal structure in Miocene
sequence.
Figure 7.2.10. Seismic line EC-95120. Canyons visible on the seismic
data occur in the mouth of the Ganges.
Figure 7.2.11. Seismic line EC-01-10. 1 - Canyons visible on the seismic
data occur in the mouth of the Ganges. 2 – Recent
Submarine fans rest on top of the channelised sequence.
Figure 7.2.12. Seismic line EC-01-06. Inner and mid fan lobes in
Pliocene-Recent sediments.
Figure 7.2.13. Seismic line EC-01-08. Inner and mid fan lobes in
Pliocene-Recent sediments.
Figure 7.2.14. Line EC-01-15. The turbidite fan system appear prevalent
from the start of the Miocene onwards. The older the Fan
system the more distal the resultant geometry.
Figure 7.2.15. Hydrocarbon prospects map.

MAHANADI OFFSHORE BASIN
PART – B
BLOCK ON OFFER LOCATION OF THE BLOCK

MAHANADI OFFSHORE BASIN
BLOCK : MN-DWN-2003/1
1. BLOCK AREA : 17,050 Sq. Km (approx.)
2. WATER DEPTH RANGE : 2000 m to > 2500 m
3. EXISTING DATA BASE
3.1 SEISMIC DATA : 2D - 1039 LKM
Vintage Data acquired by Quantum in LKM 2001 DGH 845 1997 DGH 194
SEISMIC COVERAGE MAP
3.2 OTHER SURVEYS : Satellite Gravity Surveys 3.3 WELL DATA Number of Exploratory Well - Nil
MN-DWN-2003/1

MAHANADI OFFSHORE BASIN
4. EXPECTED STRATIGRAPHIC SEQUENCE
5. DEPTH STRUCTURE MAP ON TOP OF CRETACEOUS
EC-9 5161
EC-95151
EC-01-08
EC-95160
EC-01-06
EC-01-04
EC-01-13
EC-01-02
0 10 Km
9000
8000
8500 9500
10000
1050
0
1100
0
11500
1200
0
9000
9500
1000
0
1050
0
11000
1150
09000
9500
8500
9500
10000
10500
11000 1150012000
9500
10000
11000
Scale
NORMAL FAULT
LEGEND
DEPTH CONTOUR
CONTOUR INTERVAL 500 M
13000 11500 10000 8500 7000 5000 1000 2500 100013000 11500 10000 8500 7000 5000 1000 2500 1000
DEPTH IN METERS
AGE LITHOLOGYDEPTH( M)
SOURCE RES. SEAL
1
1. TOC > 1.5%
Kerogen type – II & III
VRo - 0.7% - 1.3%
SORCE ROCK CHARACTERISTICS
R E
C E
N T
6000
4000
5000
3000
2000
1000
4200
6100
P L
I O
C E
N E
-M
I O
C E
N E
2400
8000
10000
7000
9000
6300OLIGOCENE
E
O
C
E
N
E
8800
CRET
ACEO
US
-P
ALA
EOEC
NE
LEGEND
Shale
Limestone
Fan deposits
Water
MN-DWN-2003/1

MAHANADI OFFSHORE BASIN
6. SOME OF THE INTERPRETED PLAY TYPES
A. Truncations and wedge-outs in Paleocene and structural highs in Eocene-Miocene sequences
B. Stacked mounds with crestal channels in Pliocene
Stacked mounds with crestal channels in Pliocene
EC-01-04TW
T IN
SEC
.
4.00
4.50
3.50
EC-01-04 EC-01-04
40002000 30002500 3500SP
WSW ENE
Glide SurfacesGlide Surfaces
Infill possibly sandyInfill possibly sandy
Paleocene truncations & wedge-outs and structural highs in Eocene-Miocene sequences
EC-01-04 EC-01-04
Truncation
SW NEEC-01-04
2200 2400 2600 2800 3000 3200 3400 3600 3800 4000 4200 4400 4600 4800
8.00
6.50
7.50
7.00
5.50
6.00
5.00
TWT
IN S
EC.
CRETACEOUS TOP PALAEOCENE TOP EOCENE TOP OLIGOCENE TOP
850 East Ridge
Structural High
Truncation
MN-DWN-2003/1
MAHANADI OFFSHORE BASIN
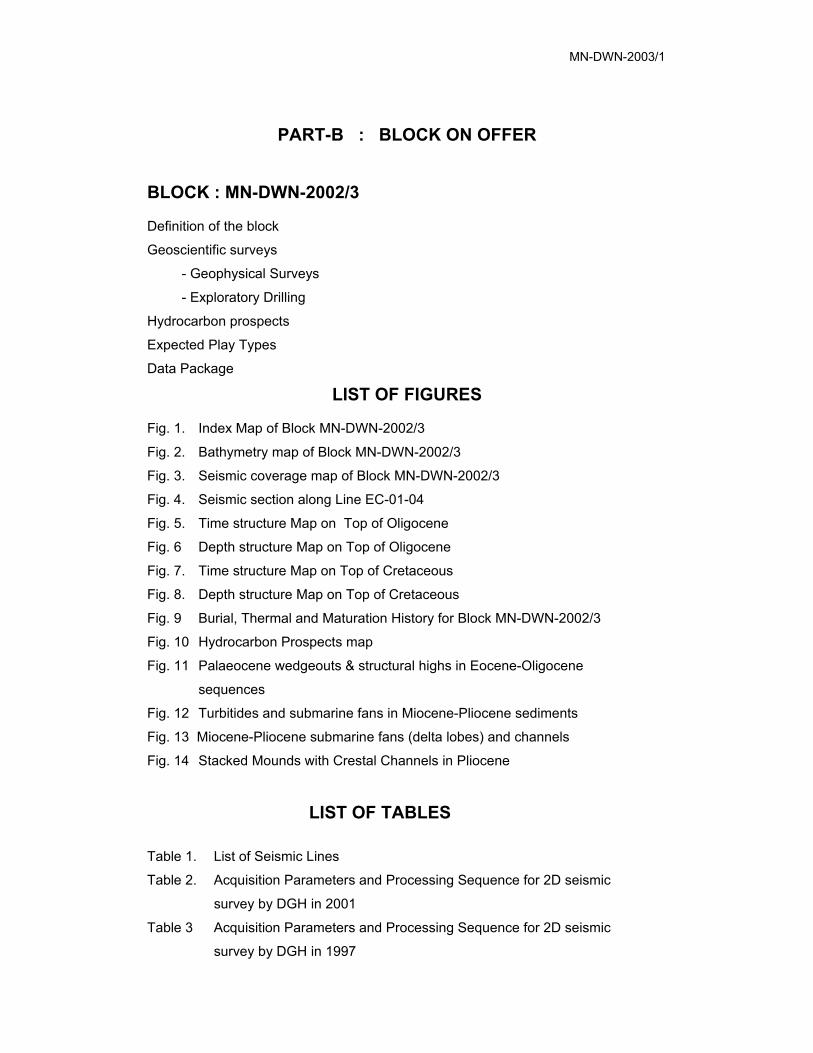
PART-B : BLOCK ON OFFER BLOCK : MN-DWN-2002/3 Definition of the block
Geoscientific surveys
- Geophysical Surveys
- Exploratory Drilling
Hydrocarbon prospects
Expected Play Types
Data Package
LIST OF FIGURES Fig. 1. Index Map of Block MN-DWN-2002/3
Fig. 2. Bathymetry map of Block MN-DWN-2002/3
Fig. 3. Seismic coverage map of Block MN-DWN-2002/3
Fig. 4. Seismic section along Line EC-01-04
Fig. 5. Time structure Map on Top of Oligocene
Fig. 6 Depth structure Map on Top of Oligocene
Fig. 7. Time structure Map on Top of Cretaceous
Fig. 8. Depth structure Map on Top of Cretaceous
Fig. 9 Burial, Thermal and Maturation History for Block MN-DWN-2002/3
Fig. 10 Hydrocarbon Prospects map
Fig. 11 Palaeocene wedgeouts & structural highs in Eocene-Oligocene
sequences
Fig. 12 Turbitides and submarine fans in Miocene-Pliocene sediments
Fig. 13 Miocene-Pliocene submarine fans (delta lobes) and channels
Fig. 14 Stacked Mounds with Crestal Channels in Pliocene
LIST OF TABLES Table 1. List of Seismic Lines
Table 2. Acquisition Parameters and Processing Sequence for 2D seismic
survey by DGH in 2001
Table 3 Acquisition Parameters and Processing Sequence for 2D seismic
survey by DGH in 1997
MN-DWN-2003/1

MAHANADI OFFSHORE BASIN
ANNEXURE
Annexure No. Description
I Contents of data package for the block MN-DWN-2003/1