Investigating relationships between albacore tuna (Thunnus alalunga) CPUE and prey distribution in...
10
Investigating relationships between albacore tuna (Thunnus alalunga) CPUE and prey distribution in the Bay of Biscay Ainhoa Lezama-Ochoa a, * , Guillermo Boyra a , Nicolas Goñi a , Haritz Arrizabalaga a , Arnaud Bertrand b a AZTI-Tecnalia, Marine Research Unit, Herrera Kaia Portualdea z/g, 20110 Pasaia, Basque Country, Spain b Institut de Recherche pour le développement (IRD), CRH, Avenue Jean Monnet, BP 171, 34203 Sète, Cedex, France article info Article history: Received 14 March 2008 Received in revised form 25 August 2009 Accepted 10 April 2010 Available online 28 April 2010 abstract The Bay of Biscay in the northeast Atlantic is an important feeding zone for juvenile albacore tuna (Thunnus alalunga) during their summer migration northwards. Spatial distribution and abundance of their potential prey [planktonic organisms, anchovy (Engraulis encrasicolus) and other small pel- agics] were investigated in the southeast Bay of Biscay during acoustic surveys in autumn from 2003 to 2005. The relationships between albacore tuna catch per unit of effort (CPUE), and prey abundance and sea surface temperature (SST) were studied at different spatiotemporal scales. We observed positive and significant correlations between albacore tuna CPUE and anchovy abun- dance and total prey abundance, at different spatial scales. However, in 2003, a year characterised by extreme temperatures compared to the other years of this study, the relationship between CPUE and prey abundance was much weaker. Instead, we found a significant negative correlation with SST. Ó 2010 Elsevier Ltd. All rights reserved. 1. Introduction Ecological systems exhibit heterogeneity over a broad range of scales, with marine organisms having an aggregated, patchy distri- bution on a wide variety of space and time scales from centimetres to thousands of kilometres (Wiebe, 1970; Steele, 1976; Haury et al., 1978; Mackas and Boyd, 1979; Mackas et al., 1985; Frontier, 1987; Russel et al., 1992; Davis et al., 1991; Bertrand et al., 2002b). Study- ing interactions between predator and prey implies choosing an appropriate space–time scale. This choice is difficult because pop- ulations and ecosystems cannot be described at a single scale (Le- vin, 1992). Processes at regional scales are more regular; its study being key to our understanding of trophic interactions among pop- ulations (Rose and Leggett, 1990). The relationships between tuna and their prey are generally studied at regional (1000s of km), meso (100s of km) and local (km) scales (Josse et al., 1998; Ber- trand, 1999; Bertrand et al., 2002b; Goñi et al., 2009). The range of tuna distribution is known to be limited mainly due to hydrolog- ical conditions (Sharp, 1978; Sund et al., 1981; Brill, 1994; Bard, 2001; Bertrand et al., 2002a,b); however, within areas of suitable abiotic conditions, tuna tend to be more abundant where prey are concentrated (Sund et al., 1981; Roger, 1994; Bertrand, 1999; Bertrand et al., 2002b). Every summer, albacore tuna (Thunnus alalunga) perform sea- sonal feeding migrations into the Bay of Biscay. This area consti- tutes a hot spot for juvenile tuna in search of prey and sustains a traditional seasonal fishery, targeting albacore tuna from June to October. Catches occur off the shelf (but adjacent to the shelf break) from the Cantabric Coast (Fig. 1) up to 48°N(Santiago, 2004). So far, no effort has been put into producing combined stud- ies of the spatial distribution of albacore tuna catches and their po- tential prey, predominantly small pelagic fish and euphausiids (Goñi, 2008). Since 2003, annual acoustic surveys are undertaken, in autumn, in the Bay of Biscay (JUVENA Program, Boyra and Uriarte, 2006; Boyra et al., 2006). Although these surveys are executed to assess the abundance of juvenile anchovy and are under constraints im- posed by management requirements, they partially overlap with the period and location of the albacore tuna baitboat and trolling fishing season in the Bay of Biscay. This makes JUVENA an impor- tant source of information, with acoustic data as a key tool, for the observation of the distribution and spatial–temporal structure of the pelagic community in the area. The aim of this study was to examine how the spatial distribu- tion and abundance of albacore tuna prey impact CPUE in the Bay of Biscay. Data come from the annual acoustic surveys (2003– 2005) and CPUE logbook records from commercial fisheries. We used the description of interannual variation in the patterns of spa- tial distribution of small pelagic fish and euphausiids abundance as an indicator of food availability for albacore tuna. The relationships between presence and abundance of prey and albacore tuna were examined at both regional (study area) and local (44, 56 and 111 km) scales. 0079-6611/$ - see front matter Ó 2010 Elsevier Ltd. All rights reserved. doi:10.1016/j.pocean.2010.04.006 * Corresponding author. Tel.: +34 943 004 800; fax: +34 943 004 801. E-mail address: [email protected] (A. Lezama-Ochoa). Progress in Oceanography 86 (2010) 105–114 Contents lists available at ScienceDirect Progress in Oceanography journal homepage: www.elsevier.com/locate/pocean
Transcript of Investigating relationships between albacore tuna (Thunnus alalunga) CPUE and prey distribution in...

Progress in Oceanography 86 (2010) 105–114
Contents lists available at ScienceDirect
Progress in Oceanography
journal homepage: www.elsevier .com/ locate /pocean
Investigating relationships between albacore tuna (Thunnus alalunga) CPUEand prey distribution in the Bay of Biscay
Ainhoa Lezama-Ochoa a,*, Guillermo Boyra a, Nicolas Goñi a, Haritz Arrizabalaga a, Arnaud Bertrand b
a AZTI-Tecnalia, Marine Research Unit, Herrera Kaia Portualdea z/g, 20110 Pasaia, Basque Country, Spainb Institut de Recherche pour le développement (IRD), CRH, Avenue Jean Monnet, BP 171, 34203 Sète, Cedex, France
a r t i c l e i n f o
Article history:Received 14 March 2008Received in revised form 25 August 2009Accepted 10 April 2010Available online 28 April 2010
0079-6611/$ - see front matter � 2010 Elsevier Ltd. Adoi:10.1016/j.pocean.2010.04.006
* Corresponding author. Tel.: +34 943 004 800; faxE-mail address: [email protected] (A. Lezama-O
a b s t r a c t
The Bay of Biscay in the northeast Atlantic is an important feeding zone for juvenile albacore tuna(Thunnus alalunga) during their summer migration northwards. Spatial distribution and abundanceof their potential prey [planktonic organisms, anchovy (Engraulis encrasicolus) and other small pel-agics] were investigated in the southeast Bay of Biscay during acoustic surveys in autumn from2003 to 2005. The relationships between albacore tuna catch per unit of effort (CPUE), and preyabundance and sea surface temperature (SST) were studied at different spatiotemporal scales.We observed positive and significant correlations between albacore tuna CPUE and anchovy abun-dance and total prey abundance, at different spatial scales. However, in 2003, a year characterisedby extreme temperatures compared to the other years of this study, the relationship between CPUEand prey abundance was much weaker. Instead, we found a significant negative correlation withSST.
� 2010 Elsevier Ltd. All rights reserved.
1. Introduction
Ecological systems exhibit heterogeneity over a broad range ofscales, with marine organisms having an aggregated, patchy distri-bution on a wide variety of space and time scales from centimetresto thousands of kilometres (Wiebe, 1970; Steele, 1976; Haury et al.,1978; Mackas and Boyd, 1979; Mackas et al., 1985; Frontier, 1987;Russel et al., 1992; Davis et al., 1991; Bertrand et al., 2002b). Study-ing interactions between predator and prey implies choosing anappropriate space–time scale. This choice is difficult because pop-ulations and ecosystems cannot be described at a single scale (Le-vin, 1992). Processes at regional scales are more regular; its studybeing key to our understanding of trophic interactions among pop-ulations (Rose and Leggett, 1990). The relationships between tunaand their prey are generally studied at regional (1000s of km),meso (100s of km) and local (km) scales (Josse et al., 1998; Ber-trand, 1999; Bertrand et al., 2002b; Goñi et al., 2009). The rangeof tuna distribution is known to be limited mainly due to hydrolog-ical conditions (Sharp, 1978; Sund et al., 1981; Brill, 1994; Bard,2001; Bertrand et al., 2002a,b); however, within areas of suitableabiotic conditions, tuna tend to be more abundant where preyare concentrated (Sund et al., 1981; Roger, 1994; Bertrand, 1999;Bertrand et al., 2002b).
Every summer, albacore tuna (Thunnus alalunga) perform sea-sonal feeding migrations into the Bay of Biscay. This area consti-
ll rights reserved.
: +34 943 004 801.choa).
tutes a hot spot for juvenile tuna in search of prey and sustains atraditional seasonal fishery, targeting albacore tuna from June toOctober. Catches occur off the shelf (but adjacent to the shelfbreak) from the Cantabric Coast (Fig. 1) up to 48�N (Santiago,2004). So far, no effort has been put into producing combined stud-ies of the spatial distribution of albacore tuna catches and their po-tential prey, predominantly small pelagic fish and euphausiids(Goñi, 2008).
Since 2003, annual acoustic surveys are undertaken, in autumn,in the Bay of Biscay (JUVENA Program, Boyra and Uriarte, 2006;Boyra et al., 2006). Although these surveys are executed to assessthe abundance of juvenile anchovy and are under constraints im-posed by management requirements, they partially overlap withthe period and location of the albacore tuna baitboat and trollingfishing season in the Bay of Biscay. This makes JUVENA an impor-tant source of information, with acoustic data as a key tool, for theobservation of the distribution and spatial–temporal structure ofthe pelagic community in the area.
The aim of this study was to examine how the spatial distribu-tion and abundance of albacore tuna prey impact CPUE in the Bayof Biscay. Data come from the annual acoustic surveys (2003–2005) and CPUE logbook records from commercial fisheries. Weused the description of interannual variation in the patterns of spa-tial distribution of small pelagic fish and euphausiids abundance asan indicator of food availability for albacore tuna. The relationshipsbetween presence and abundance of prey and albacore tuna wereexamined at both regional (study area) and local (44, 56 and111 km) scales.

Fig. 1. Overview of the study area and theoretical sampling design. The scheme shows vertical (V), horizontal (H) and diagonal (H) transects, perpendicular to the coastline.The dotted line represents the minimum area covered throughout all years of the study.
106 A. Lezama-Ochoa et al. / Progress in Oceanography 86 (2010) 105–114
2. Materials and methods
2.1. Data acquisition
2.1.1. Albacore CPUE dataDaily catch rates of albacore tuna were obtained from the log-
books distributed in albacore tuna baitboat and trolling fisheries.The logbooks provided the following information on a daily basis:name of vessel, date and location (latitude and longitude) of thefishing set, number of specimens captured according to commer-cial category, type of bait used and sea surface temperature (SST).
2.1.2. Acoustic surveysInformation on tuna prey abundance and distribution were ob-
tained from three acoustic surveys performed within the JUVENAprogram in the Bay of Biscay (Fig. 1) from 2003 to 2005 (Boyraand Uriarte, 2006; Boyra et al., 2006). These surveys lasted about25 days from late September to early October and were performedusing a 35-m commercial vessel. The sampling strategy was de-signed to monitor anchovy and other small pelagic fish, taking intoaccount information collected from the Spanish live-bait tuna fish-ery that traditionally target juvenile anchovy. During this season,juvenile anchovy are generally observed crossing the continentalshelf on their way to the coast from offshore waters (Uriarteet al., 2001).
The survey design was a combination of systematic and adap-tive schemes. The systematic scheme was based on cross-shelftransect lines from the coast (20 m bottom depth) to beyond theshelf break. Transects were parallel, regularly spaced and perpen-dicular to the coast with an inter-transect distance of 17.5 nauticalmiles (Fig. 1). Standard transects ranged 6–10 miles off the shelf.Transects were prolonged as long as fish were detected and then
stopped when more than 6 nautical miles were covered withoutencountering any fish schools. Such an adaptive scheme wasadopted to ensure the complete coverage of the extension area ofjuvenile anchovy.
Acoustic data were recorded with 38 and 120-kHz Simrad EY60split-beam, scientific echosounders (Kongsberg Simrad AS, Kongs-berg, Norway). The water column was sampled to depths of 200 m.Acoustic back-scattered energy by surface unit (sA, MacLennanet al., 2002) was recorded for each geo-referenced nautical mile(1852 m). Acoustic sampling was performed during daytime, whenjuvenile anchovy aggregate in schools (Uriarte et al., 2001) and canbe easily distinguished from zooplankton structures. The identifi-cation of organisms and population size structure was obtainedfrom net sampling and echo trace characteristics (Boyra and Uriar-te, 2006; Boyra et al., 2006). Zooplankton (mainly euphausiids)were sampled from purse-seine nets and in some cases zooplank-ton nets. Sampling was not systematic and we obtained only casualidentifications on purse-seine nets (grid-size 0.5–0.8 cm, suitablefor juvenile anchovy) or by vertical plankton haul, using a 150-lm PairoVET net (2-CalVET nets, Smith et al., 1985). Furthermore,sampling of plankton nets was only performed during the daytime,which is the period when euphausiids are distributed in mid-water. Finally, oceanographic data were collected from the watercolumn at 60 stations using a CTD profiler, but only SST was con-sidered in this work (Figs. 2–4).
2.2. Acoustic data processing
Acoustic records were processed using Movies+ software (Weillet al., 1993). Acoustic echoes were identified according to both bi-frequency analysis and information obtained from net sampling.Bi-frequency analysis uses the response of different targets as op-
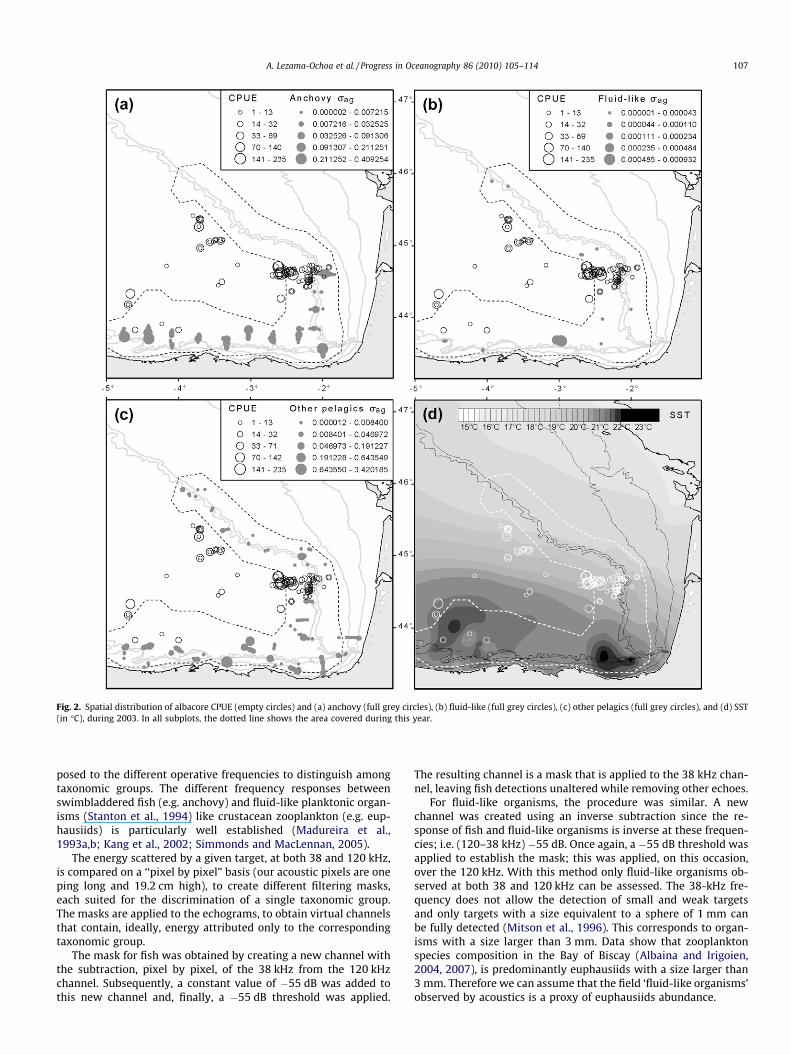
Fig. 2. Spatial distribution of albacore CPUE (empty circles) and (a) anchovy (full grey circles), (b) fluid-like (full grey circles), (c) other pelagics (full grey circles), and (d) SST(in �C), during 2003. In all subplots, the dotted line shows the area covered during this year.
A. Lezama-Ochoa et al. / Progress in Oceanography 86 (2010) 105–114 107
posed to the different operative frequencies to distinguish amongtaxonomic groups. The different frequency responses betweenswimbladdered fish (e.g. anchovy) and fluid-like planktonic organ-isms (Stanton et al., 1994) like crustacean zooplankton (e.g. eup-hausiids) is particularly well established (Madureira et al.,1993a,b; Kang et al., 2002; Simmonds and MacLennan, 2005).
The energy scattered by a given target, at both 38 and 120 kHz,is compared on a ‘‘pixel by pixel” basis (our acoustic pixels are oneping long and 19.2 cm high), to create different filtering masks,each suited for the discrimination of a single taxonomic group.The masks are applied to the echograms, to obtain virtual channelsthat contain, ideally, energy attributed only to the correspondingtaxonomic group.
The mask for fish was obtained by creating a new channel withthe subtraction, pixel by pixel, of the 38 kHz from the 120 kHzchannel. Subsequently, a constant value of �55 dB was added tothis new channel and, finally, a �55 dB threshold was applied.
The resulting channel is a mask that is applied to the 38 kHz chan-nel, leaving fish detections unaltered while removing other echoes.
For fluid-like organisms, the procedure was similar. A newchannel was created using an inverse subtraction since the re-sponse of fish and fluid-like organisms is inverse at these frequen-cies; i.e. (120–38 kHz) �55 dB. Once again, a �55 dB threshold wasapplied to establish the mask; this was applied, on this occasion,over the 120 kHz. With this method only fluid-like organisms ob-served at both 38 and 120 kHz can be assessed. The 38-kHz fre-quency does not allow the detection of small and weak targetsand only targets with a size equivalent to a sphere of 1 mm canbe fully detected (Mitson et al., 1996). This corresponds to organ-isms with a size larger than 3 mm. Data show that zooplanktonspecies composition in the Bay of Biscay (Albaina and Irigoien,2004, 2007), is predominantly euphausiids with a size larger than3 mm. Therefore we can assume that the field ‘fluid-like organisms’observed by acoustics is a proxy of euphausiids abundance.

Fig. 3. Spatial distribution of albacore CPUE (empty circles) and (a) anchovy (full grey circles), (b) fluid-like (full grey circles), (c) other pelagics (full grey circles), and (d) SST(in �C), during 2004. In all subplots, the dotted line shows the area covered during this year.
108 A. Lezama-Ochoa et al. / Progress in Oceanography 86 (2010) 105–114
Visual scrutinizing of the echograms by a human expert com-plemented the bi-frequency method used to distinguish amongtaxonomic groups along the echogram. Afterwards, the energyattributed to fish was further split into anchovy and ‘‘other pela-gics” using the information obtained from fishing hauls. Once theenergy was split into anchovy, other pelagics and fluid-like organ-isms, an automatic shoal detection routine was computed in Mov-ies+ (Weill et al., 1993; Diner et al., 2006). Here, isolated shoal-typeobjects were identified and extracted from the echograms; mea-suring up to 40 characteristics to describe each shoal (Petitgaset al., 2001). Thresholds were applied for minimum school objectlength (5 m), height (0.5 m) (Petitgas, 2003) and average density(between �80 and �50 dB for fluid-like organisms, and �60 to0 dB for fish). Extracted school objects with a length smaller thantwo beam widths at depth were rejected, since they are consideredto be too small to be characterised adequately (Diner, 2001; Dineret al., 2006). Shoal objects between the surface and 5 m depth werealso rejected to avoid the risk of confusion with echoes generated
by surface-related turbulence. Finally, the volume reverberationindex of the shoal (Sv, MacLennan et al., 2002) was computed forthree prey groups (anchovy, ‘‘other pelagics” and ‘‘fluid-like”).The relative abundance (within each prey group) of each shoal(rag, in m2) was estimated as: area � 10
Sv10 , with area being the area
of the vertical section of the shoal (Diner, 2001; Diner et al., 2006).
2.3. Data analysis
With the adaptive scheme we used, the area covered by acous-tic surveys was variable among years. Therefore we defined a dif-ferent study area for each year in order to perform spatialanalyses. The core of the study area was defined as the intersectionbetween the area covered by the JUVENA surveys and the spatialdistribution of the albacore tuna catches (generally off the conti-nental shelf). This area was limited by the bathymetry of 150 mon the coastal side and the end of the sampled transects offshore(Figs. 2–4). Consequently, only albacore tuna catches made within

Fig. 4. Spatial distribution of albacore CPUE (empty circles) and (a) anchovy (full grey circles), (b) fluid-like (full grey circles), (c) other pelagics (full grey circles), and (d) SST(in �C), during 2005. In all subplots, the dotted line shows the area covered during this year.
A. Lezama-Ochoa et al. / Progress in Oceanography 86 (2010) 105–114 109
the yearly JUVENA spatiotemporal window of coverage and preydetected in waters deeper than 150 m were considered for analy-ses. Likewise, in order to relate CPUE to prey abundance at a regio-nal scale, the relationship between overall prey abundance andalbacore tuna CPUE was analyzed during this time series, distin-guishing between CPUEs obtained inside and outside the JUVENAcoverage area (Table 1).
First, we performed interannual correlations (Pearson test) be-tween the albacore CPUE (inside and outside the JUVENA area)
Table 1Interannual variation of abundance (m2) for three groups of prey and its relationship withstudy.
Year Total CPUE CPUE inside CPUE outside Anchovy
2003 103 58 45 65.8582004 182 6 176 0.0012005 130 110 20 101.925
and abundance of prey (anchovy, other pelagics, fluid-like, and ‘‘to-tal prey”, i.e. the sum of the prey) in the study area. We then inves-tigated the relationships between albacore CPUE and prey atsmaller spatial scales (111, 56, and 44-km diameter). It was notpossible to accurately work at a smaller scale because of the in-ter-transect distance (32.4 km) and the rather low number of CPUEdata (Table 1). From a temporal point of view, we defined a timelag that increases together with the spatial grid; i.e. scale 1: 0.40degrees (44 km) – 6 days; scale 2: 0.50 degree (56 km) – 8 days;
CPUE (number of tuna/day) located inside and outside the area of study, for 3 years of
abundance Pelagics abundance Fluid-like plankton abundance
48.16 0.10116.58 4.94664.46 15.709

110 A. Lezama-Ochoa et al. / Progress in Oceanography 86 (2010) 105–114
and scale 3: 1 degree (111 km) – 10 days. In this case the centralpoint was the catch location, establishing areas of influence at dif-ferent ranges around them.
Previous to the analysis, prey acoustic estimates were con-verted into categorical variables. The high number of zeros, theskewed histogram and the few high values were solved by discret-ization in order to obtain more robust results. For instance, thecontinuous variable ‘‘Prey” (in m2) were turned into categoricalor discrete variables by the groupings: category1 = (Prey = 0); cat-egory 2 = (Prey > 0–1); and category 3 = (Prey > 1).
Data collected during the 3 years of sampling were used tomodel the CPUE as a function of SST and prey categories, usingGeneralized Linear Models (GLMs; Nelder and Wedderburn,1972). Analyses were performed using the ‘MASS” and ‘‘stats” li-braries in the R statistical software (v. 2.7.2., available from theComprehensive R Archive Network http://cran.r-project.org). Addi-tionally, other statistical methodologies (i.e. Kruskal–Wallis andChi-square test) were applied to these data, obtaining similar re-sults in all cases (not included in the manuscript).
The transformed abundance values, log10 (CPUE + 1), were usedto develop the GLMs. Two basic models were chosen:
Table 2Interannual correlations between tuna CPUE inside and outside the study area and theabundance of anchovies, other pelagics, fluid-like plankton and all prey combined.Signs [(+) or (�)] indicate the direction of the correlation.
CPUE inside CPUE outside
Anchovy (+) p = 0.1064, r2 = 0.9723 (�) p = 0.1316, r2 = 0.9579Pelagic (+) p = 0.1160, r2 = 0.9672 (�) p = 0.1220, r2 = 0.9637Fluid-like plankton (+) p = 0.5295, r2 = 0.4538 (�) p = 0.7675, r2 = 0.1276Total prey (+) p = 0.0562, r2 = 0.9922 (�) p = 0.1818, r2 = 0.9206
Fig. 5. Significant outputs of the Generalized Linear Model (CPUE � as.factor (anchovy) +years 2003 and 2005 separately.
CPUE � as.factor (anchovy) + as.factor (other pelagics) + as.factor(fluid-like) + SST; and CPUE � as.factor (total prey) + SST. Bothmodels were carried out in analysis for each individual year, aswell as, for the overall period 2003–2005.
GLMs were applied to identify the relationship among individ-ual prey factors, SST and the response variable, the CPUE. We ap-plied a stepwise elimination, based on the Akaike informationcriteria (AIC) following Venables and Ripley (2002), to determinewhich explanatory factors to include in each GLM. The use of aGLM prevents the bias associated with the back transformationof a linear model applied to log-transformed CPUE. CPUE beingcontinuous, positive and skewed, the use of GLM also allows con-sidering the role of variables with non-normal distributions andcontinuous variables and factors together (Stefansson, 1996).
3. Results
3.1. Spatial distribution of albacore tuna and prey
In 2003, most albacore tuna catches were located within thestandard JUVENA area (Fig. 2), mainly over the Cap Ferret Canyon(Fig. 1) with occasional events occurring on the western part ofthe Cantabrian shelf break. Anchovies (mainly juvenile) werefound distributed in monospecific schools along the shelf-breakover the southern part of the Bay of Biscay, between 43�400 and44�500N, and between 5� and 1�500W (Fig. 2a). The amount offluid-like plankton observed during this survey was very low withsparse patches dispersed over the area (Fig. 2b). Other pelagicswere distributed all along the shelf break, closer to the coast inthe Cantabrian Sea (Fig. 2c).
In 2004, the majority of albacore tuna catches occurred outsidethe JUVENA coverage area (more than 20 times the amount of
as.factor (other pelagics) + as.factor (fluid-like) + SST) at three different scales for the

A. Lezama-Ochoa et al. / Progress in Oceanography 86 (2010) 105–114 111
catches that took place inside the coverage area; Fig. 3 and Table 1).Inside the JUVENA coverage area, the catches were located over theshelf break at the edges of the Cap Breton Canyon (Fig. 1). Duringthis year, anchovy was only observed in a small area over the con-tinental shelf-break of the Cantabrian Sea (Fig. 3a); it was distrib-uted in surface isolated schools of juveniles. The distribution offluid-like plankton was similar to that of anchovies, but extendedmore toward the coast (Fig. 3b). Other pelagics were locatedmostly on the shelf, close to the Cantabrian and French coasts(Fig. 3c).
In 2005, most of the albacore tuna catches occurred inside theJUVENA area, off the shelf between Cap Breton and Cap Ferret Can-yons (Fig. 4). Anchovies (mainly juvenile) were extensively distrib-uted in surface schools, offshore, up to 45�300N and 4�W (Fig. 4a).Fluid-like plankton were mostly observed around Cap Ferret butalso near the Cap Breton Canyon (Fig. 4b). The remainder of theother pelagics were found scattered throughout the JUVENA cover-age area (Fig. 4c).
3.2. Abundance estimates and large-scale correlation
The overall estimates of relative abundance of prey within theJUVENA area provided different patterns for the three groups thatwere considered (Table 1). Fluid-like plankton showed a strong in-crease throughout the 3 years. The abundance of anchovies andother pelagics strongly decreased from 2003 to 2004 (anchovieswere virtually absent from the area in 2004) to reach the highestabundance in 2005. Correlation between CPUE and prey abundanceinside the JUVENA area was positive (but not significant) with allprey categories (Table 2). This correlation tends to significance(p = 0.056, r2 = 0.99) considering the total amount of prey. A sym-metric trend (negative correlation) was observed between CPUE
Fig. 6. Significant outputs of the Generalized Linear Model (CPUE � as.factor (totalprey) + SST) at three different scales for the years 2003 and 2005 separately.
outside the JUVENA area and prey abundance. Although these cor-relations are based on just 3 years, the trends are remarkablyconsistent.
3.3. Generalized linear models
GLMs could only be applied for 2003 and 2005 because of thelack of CPUE data inside the JUVENA area in 2004. GLMs basedon multiple explanatory variables were established and the partialeffect of each covariate was plotted and analyzed (Figs. 5–7 and Ta-bles 3 and 4). The categorical and regular fits indicate the effects ofeach individual variable on CPUE abundance distribution. Datawere analyzed at the three local spatial scales (111, 56, and 44-km diameter) (see Section 2.3) and only the final models selectedafter the stepwise process are presented.
3.3.1. Juvena 2003In 2003, SST had a significantly negative effect on CPUE on all
three scales, whatever the model (including prey categories or totalprey). The unique prey category was anchovy, which had a signif-icantly positive effect on CPUE on scale 2 (Tables 3 and 4 and Figs. 5and 6).
3.3.2. Juvena 2005In 2005, there was no significant effect of SST on CPUE. How-
ever, anchovy abundance had a significantly positive effect onCPUE on all three scales. Similar patterns were found for total preybut with the highest significance at scales 2 and 3. The uniquecovariate presenting a significant negative effect on CPUE wasthe prey category of other pelagics at scale 3 (Tables 3 and 4 andFigs. 5 and 6).
3.3.3. Juvena 2003–2005Our results for prey categories and total prey during the period
2003–2005, were the same as in those reported for 2005, althoughwith a higher level of significance. SST had a significant negative ef-fect on CPUE only at scale 3 but having a higher level of signifi-cance in the model that included prey categories compared tothe model with total prey (Tables 3 and 4 and Fig. 7).
4. Discussion
In this study, we found that at an interannual scale more alba-core tuna CPUE observations occurred inside the JUVENA areawhen prey were more abundant. However, negative correlationswere obtained between albacore tuna CPUE outside the JUVENAarea and the prey abundance inside the JUVENA area. These corre-lations were not significant but this may be because of the limitednumber of years considered in this study. Yet, due to the high r2
(always > 0.92, except in the case of fluid-like prey, Table 1) wepostulate that at an interannual-regional scale, tuna distribution,as inferred by CPUE, is driven by prey distribution. Our resultsare consistent with other studies that have focused on spatial dis-tribution of tuna at regional scales and that have also establishedpositive correlations with their prey (Sund et al., 1981; Bertrandet al., 2002b). Rose and Leggett (1990) reported that predators tendto congregate where prey is abundant, and mobile prey tends toavoid areas of high predator density. These authors showed thatat large scales, predator and prey densities are positivelycorrelated.
Analyses at smaller scales showed contrasting results. In 2003, ayear characterised by extremely high SST (Fontán et al., 2008; Goi-koetxea et al., 2009), the physical environmental conditions had agreater influence on albacore tuna CPUE than biotic variables. Thissuggests that under extreme environmental conditions, the rela-

Fig. 7. Significant outputs of the Generalized Linear Models at three different scales considering both years together (2003 and 2005): (a) CPUE � as.factor(anchovy) + as.factor (other pelagics) + as.factor (fluid-like) + SST; (b) CPUE � as.factor (total prey) + SST.
Table 3Results from multivariate-based GLMs (CPUE � as.factor (anchovy) + as.factor (other pelagics) + as.factor (fluid-like) + SST). For each model, the degrees of freedom (d.f.), thedeviance (Dev), the residual degrees of freedom (Resid. d.f.), the residual deviance (Resid. Dev), the F-value, and p-value are given. Signs [(+) or (�)] indicate the direction of thecorrelation.
Model d.f. Dev. Resid. d.f. Resid. Dev. F-Value p-Value
Scale 32003 NULL 57 13.352
SST 1 2.435 56 10.916 12.494 (�) 0.0008272005 NULL 109 32.882
Anchovy 2 2.28 107 30.602 4.158 (+) 0.01829Pelagic 2 1.805 105 28.796 3.291 (�) 0.04108
2003–2005 NULL 173 64.115Anchovy 2 7.48 171 56.636 14.104 (+) 2.165e�06Pelagic 1 8.087 170 48.549 30.498 (�) 1.241e�07SST 1 3.737 169 44.812 14.092 (�) 0.0002391
Scale 22003 NULL 57 13.351
Anchovy 1 1.004 56 12.348 5.881 (+) 0.01868SST 1 1.981 55 10.367 10.51 (�) 0.002019
2005 NULL 109 32.882Anchovy 2 2.234 107 30.648 3.899 (+) 0.02318
2003–2005 NULL 173 64.115Anchovy 2 4.623 171 59.492 6.644 (+) 0.001663
Scale 12003 NULL 57 13.352
SST 1 2.435 56 10.916 12.494 (�) 0.0008272005 NULL 109 32.882
Anchovy 2 1.794 107 31.088 3.087 (+) 0.049722003–2005 NULL 173 64.115
Anchovy 2 3.682 171 60.433 5.209 (+) 0.006365
112 A. Lezama-Ochoa et al. / Progress in Oceanography 86 (2010) 105–114
tive importance of physical and biotic constraints may be alteredand hence, physical constraints impact albacore tuna dynamicsmore dramatically than under non-extreme environmental condi-
tions. Moreover, our results also suggest that the relationship be-tween albacore tuna and their prey might be decoupled underextreme environmental situations, which would have important

Table 4Multivariate-based GLMs, (CPUE � as.factor (total prey) + SST). For each model, the degrees of freedom (d.f.), the deviance (Dev), the residual degrees of freedom (Resid. d.f.), theresidual deviance (Resid. Dev), the F-value and p-value are given. Signs [(+) or (�)] indicate the direction of the correlation.
Model d.f. Dev. Resid. d.f. Resid. Dev. F-Value p-Value
Scale 32003 NULL 57 13.352
SST 1 2.435 56 10.916 12.494 (�) 0.0008272005 NULL 109 32.882
Total prey 2 3.311 107 29.571 5.991 (+) 0.0034192003–2005 NULL 173 64.115
Total prey 2 9.748 171 54.367 15.818 (+) 5.01e�07SST 1 1.984 170 52.383 6.439 (�) 0.012060
Scale 22003 NULL 57 13.352
SST 1 3.659 55 9.233 21.798 (�) 1.99e�052005 NULL 109 32.882
Total prey 2 2.993 107 29.889 5.358 (+) 0.006062003–2005 NULL 173 64.115
Total prey 2 5.478 171 58.638 7.987 (+) 0.0004829
Scale 12003 NULL 57 13.352
SST 1 2.435 56 10.916 12.494 (�) 0.0008272005 NULL 109 32.882
Total prey 2 1.867 107 31.015 3.221 (+) 0.04382003–2005 NULL 173 64.115
Total prey 2 3.475 171 60.64 4.899 (+) 0.008526
A. Lezama-Ochoa et al. / Progress in Oceanography 86 (2010) 105–114 113
implications for the dynamics of the Bay of Biscay ecosystem. Infact, in a global climate-warming scenario, extremely warm sum-mers such as the one of 2003 (Fontán et al., 2008; Goikoetxeaet al., 2009) could be more frequent. Changes in SST could havean impact on both predator and prey spatial distributions, accord-ing to relative habitat preferences. This might affect their overlapand the degree of predation by albacore tuna on their prey. Differ-ent food availability encountered during feeding migrations intheir first years of life might influence the overall condition ofthe juvenile albacore tuna population. However, natural mortalityof prey populations would also be affected under varying degreesof predation pressure.
Albacore tuna CPUE were positively correlated with anchovyabundance and total prey abundance in 2005, and throughoutthe 3 years taken as a whole (Tables 3 and 4) suggesting thatanchovies constitute a key target for albacore tuna in the southernpart of the Bay of Biscay, at least during the study period. There areseveral possible explanations for this relationship. First, anchoviesare generally abundant in autumn in the study area (Boyra and Uri-arte, 2006; Boyra et al., 2006). Actually, albacore tuna approach thecontinental slope of the Bay of Biscay at the same time when alarge part of juvenile anchovy population is occupying the offshorepelagic area before migrating to shallow coastal waters (Koutsiko-poulos and Le Cann, 1996; Boyra and Uriarte, 2006; Boyra et al.,2006; Irigoien et al., 2007, 2008). Second, anchovies distributedin this area during this period are predominantly juveniles; an easyto catch prey compared to the larger and faster-moving speciesthat share the area (such as sardines Sardina pilchardus, spratsSprattus sprattus, mackerel Scomber scombrus and horse mackerelTrachurus trachurus). In addition, juvenile anchovies are usuallyfound in aggregations of dense schools that are attractive for tuna.Finally, they are more nutritious (Becker et al., 2007) and abundantthan fluid-like plankton, the other slow-swimming prey speciesavailable at this time; thus, they are ideal to meet the strong met-abolic demands of tuna (Sund et al., 1981; Graham and Laurs,1982). The concurrence of these factors may make anchovies anenergetically efficient prey for albacore tuna compared to other po-tential prey present within this area at this period. These resultsare supported by stomach-content analyses of albacore tuna(Goñi, 2008) that showed that anchovies were by far the most
important prey of tuna in the Bay of Biscay during this time period,accounting for more than 86% in wet weight.
Although we only considered 3 years of data and there was arather short survey period (25 days from late September to earlyOctober), our results are promising and should be investigated fur-ther. We recommend that the study period also be expanded to theother summer months when albacore tuna enter the Bay of Biscayto test whether the preference for anchovies is constant or re-stricted to the period when the juveniles form large schools. Thesurvey was designed to assess anchovy abundance and distributionand not to study the interaction between tuna CPUE and preyabundance; however, the use of acoustic data recorded by com-mercial tuna vessels operating in the Bay of Biscay could be anopportunity to complement scientific data (ICES, 2007).
Acknowledgements
This work was supported by the JUVENA project funded by theDepartment of Agriculture and Fisheries of the Basque Governmentand the Ministry of Agriculture, Fishery and Food (MAPA), of theSpanish Government and a Grant to AL. (Technological CentreFoundation). We would like to thank all the skippers that kindlyprovided their logbooks and the crews of the commercial fishingvessels that took part in the JUVENA cruises. We are also gratefulto the technical staff of AZTI (Carlota Perez, Iñaki Rico) for theirhelp in the data processing and analyses, especially to Udane Mar-tinez. I wish to thank Drs. M. Woillez and F. Dufour for their ad-vices during this work. We would also like to express ourgratitude to Dr. Xabier Irigoien and Andres Uriarte (AZTI) for theirinvaluable discussions. M. Kensington is thanked for revising theEnglish in this manuscript. This paper is contribution No. 462 fromAZTI-TECNALIA (Marine and Food Research).
References
Albaina, A., Irigoien, X., 2004. Relationships between frontal structures andzooplankton communities along a cross shelf transect in the Bay of Biscay(1995 to 2003). Marine Ecology Progress Series 284, 65–75.
Albaina, A., Irigoien, X., 2007. Fine scale zooplankton distribution in the Bay ofBiscay in spring 2004. Journal of Plankton Research 29, 851–870.

114 A. Lezama-Ochoa et al. / Progress in Oceanography 86 (2010) 105–114
Bard, F.X., 2001. Extension of the geographical and vertical habitat of albacore (T.Alalunga) in the North Atlantic. Possible consequences on true rate ofexploitation of this stock. ICCAT Collective Volume of Scientific Papers 52,1447–1456.
Becker, B.H., Peery, M.Z., Beissinger, S.R., 2007. Ocean climate and prey availabilityaffect the trophic level and reproductive success of the marbled murrelet, anendangered seabird. Marine Ecology Progress Series 329, 267–279.
Bertrand, A., 1999. Le système thon-environnement en Polynése Française:caractérisation de l’habitat pélagique, étude de la distribution et de lacapturabilité des thons, par méthodes acoustiques et halieutiques. Ph.D.Thesis, L’Ecole Nationale Supérieure Agronomique de Rennes, France, Nod’ordre: 99–31, No série: H43 (in French).
Bertrand, A., Bard, F.X., Josse, E., 2002a. Tuna food habits related to the micronektondistribution in French Polynesia. Marine Biology 149, 1023–1037.
Bertrand, A., Josse, E., Bach, P., Gros, P., Dagorn, L., 2002b. Hydrological and trophiccharacteristics of tuna habitat: consequences on tuna distribution and longlinecatchability. Canadian Journal of Fisheries and Aquatic Sciences 59, 1002–1013.
Boyra, G., Uriarte, A., 2006. Acoustic surveying of anchovy juveniles in the Bay ofBiscay: JUVENA 2005 survey results and 2003–2005 biomass estimates.Working Document to WDMHSA, Galway.
Boyra, G., Álvarez, P., Cotano, U., Arregi, I., Martínez, U., Uriarte, A., 2006. Spatialdistribution of anchovy juveniles in the Bay of Biscay. In: Álvarez, I., deCastro,M., Gómez-Gesteira, M., Lorenzo M.N., Prego R. (Eds.), X InternationalSymposium on Oceanography of the Bay of Biscay. Ourense: Aica Ediciones(Abstract).
Brill, R.W., 1994. A review of temperature and oxygen tolerance studies of tunaspertinent to fisheries oceanography, movement models and stocks assessments.Fisheries Oceanography 3, 204–216.
Davis, C.S., Flierl, G.R., Wiebe, P.H., 1991. Micropatchiness, turbulence andrecruitment in plankton. Journal of Marine Research 49, 109–151.
Diner, N., 2001. Correction on school geometry and density: approach based onacoustic image simulation. Aquatic Living Resources 14, 211–222.
Diner, N., Marchallot, C., Berger, L. 2006. Echo-integration by shoal using Movies+software Version 4.3. Ifremer, Brest, France.
Fontán, A., Valencia, V., Borja, Á., Goikoetxea, N., 2008. Oceano-meteorologicalconditions in the SE Bay of Biscay for the period 2001–2005. A comparison withthe last two decades. Journal of Marine Systems 72, 167–177.
Frontier, S., 1987. Applications of fractal theory to ecology. In: Legendre, P.,Legendre, L. (Eds.), Developments in Numerical Ecology. Springer-Verlag, Berlin,pp. 335–378.
Goikoetxea, N., Borja, A., Fontán, A., González, M., Valencia, V., 2009. Trends andanomalies in sea surface temperature, observed over the last 60 years, withinthe southeastern Bay of Biscay. Continental Shelf Research 29, 1060–1069.
Goñi, N., 2008. Habitat et écologie trophique du germon (Thunnus alalunga) dansl’Atlantique Nord-Est: variabilité, implications sur la dynamique de lapopulation. Thèse de doctorat, Université de Pau et des Pays de l’Adour,France (in French).
Goñi, N., Arregui, I., Lezama-Ochoa, A., Arrizabalaga, H., Moreno, G., 2009. Smallscale vertical behaviour of juvenile albacore in relation to their bioticenvironment in the Bay of Biscay. In: Nielsen, J.L., Arrizabalaga, H., Fragoso,N., Hobday, A., Lutcavage, M., Sibert, J. (Eds.), Tagging and Tracking of MarineAnimals with Electronic Devices. Reviews: Methods and Technologies in FishBiology and Fisheries, vol. 9. Springer Academic Publishers, Netherlands, pp.51–73.
Graham, J.B., Laurs, R.M., 1982. Metabolic Rate of the albacore tuna Thunnusalalunga. Marine Biology 72, 1–6.
Haury, L.R., McGowan, J.A., Wiebe, P.H., 1978. Patterns and processes in the time-space scales of plankton distributions. In: Steele, J.H. (Ed.), Spatial Pattern inPlankton Communities. Plenum Press, New York, US, pp. 277–327.
ICES, 2007. Collection of Acoustic Data from Fishing Vessels. ICES CooperativeResearch Report No. 287, 83 pp.
Irigoien, X., Fiksen, O., Cotano, U., Uriarte, A., Alvarez, P., Arrizabalaga, H., Boyra, G.,Santos, M., Sagarminaga, Y., Otheguy, P., Etxebester, E., Zarauz, L., Artetxe, I.,Mostos, L., 2007. Could Biscay Bay Anchovy recruit through a ‘‘Bakunian”loophole? Progress in Oceanography 74, 132–148.
Irigoien, X., Cotano, U., Boyra, G., Santos, M., Álvarez, P., Otheguy, P., Etxebeste, E.,Uriarte, A., Ferrer, L., Ibaibarriaga, L., 2008. From egg to juvenile in the Bay ofBiscay: spatial patterns of anchoy (Engraulis encrasicolus) recruitment in a non-upwelling region. Fisheries Oceanography 17, 446–462.
Josse, E., Bach, P., Dagorn, L., 1998. Simultaneous observations of tuna movementsand their prey by sonic tracking and acoustic surveys. Hydrobiologia 371 (372),61–69.
Kang, M., Furusawa, M., Miyashita, K., 2002. Effective and accurate use of differencein mean volume-backscattering strength to identify fish and plankton. ICESJournal of Marine Science 59, 794–804.
Koutsikopoulos, C., Le Cann, B., 1996. Physical processes and hydrological structuresrelated to the Bay of Biscay Anchovy. Scientia Marina 60, 9–19.
Levin, S.A., 1992. The problem of pattern and scale in ecology. Ecology 73, 1943–1967.
Mackas, D.L., Boyd, C.M., 1979. Spectral analysis of zooplankton spatialheterogeneity. Science 204, 62–64.
Mackas, D.L., Denman, K.L., Abbott, M.R., 1985. Plankton patchiness: biology in thephysical vernacular. Bulletin of Marine Science 37, 652–674.
MacLennan, D.N., Fernandes, P.G., Dalen, J., 2002. A consistent approach todefinitions and symbols in fisheries acoustics. ICES Journal of Marine Science59, 365–369.
Madureira, L.S.P., Everson, I., Murphy, E.J., 1993a. Interpretation of acoustic data attwo frequencies to discriminate between Antarctic krill (Euphausia superbaDana) and other scatterers. Journal of Plankton Research 15, 787–802.
Madureira, L.S.P., Ward, P., Atkinson, A., 1993b. Differences in backscatteringstrength determined at 120 and 38 kHz for three species of Antarcticmacroplankton. Marine Ecology Progress Series 93, 17–24.
Mitson, R., Simard, Y., Goss, C., 1996. Use of a two-frequency algorithm to determinesize and numbers of plankton in three widely spaced locations. ICES Journal ofMarine Science 53, 209–215.
Nelder, J.A., Wedderburn, R.W., 1972. Generalized linear models. Journal of theRoyal Statistical Society Series A 135, 370–384.
Petitgas, P., 2003. A method for the identification and characterization of clusters ofschools along the transect lines of fisheries-acoustic surveys. ICES Journal ofMarine Science 60, 872–884.
Petitgas, P., Reid, D., Carrera, P., Iglesias, M., Georgakarakos, S., Liorzou, B., Massé, J.,2001. On the relation between schools, clusters of schools and abundance inpelagic fish stocks. ICES Journal of Marine Science 58, 1150–1160.
Roger, C., 1994. The plankton of the tropical western Indian Ocean as a biomassindirectly supporting surface tunas (yellowfin, Thunnus albacares and skipjack,Katsuwonus pelamis). Environmental Biology of Fishes 39, 161–172.
Rose, G.A., Leggett, W.C., 1990. The importance of scale to predator–prey spatialcorrelations: an example of Atlantic Fishes. Ecology 71, 33–43.
Russel, R.W., Hunt Jr., G.L., Coyle, K.O., Cooney, R.T., 1992. Foraging in a fractalenvironment: spatial patterns in a marine predator–prey system. LandscapeEcology 7, 195–209.
Santiago, J., 2004. Dinámica de la población de atún blanco (Thunnus alalungaBonaterre, 1788) del Atlántico Norte. PhD. Thesis, Universidad del País Vasco,Bilbao, Spain (in Spanish).
Sharp, G.D., 1978. Behavioral and physiological properties of tunas and their effects onvulnerability to fishing gear. In: Sharp, G.D., Dizon, A.E. (Eds.), The PhysiologicalEcology of Tunas. Academic Press, Inc., San Diego, CA, pp. 397–449.
Simmonds, E.J., MacLennan, D.N., 2005. Fisheries Acoustics: Theory and Practice,second ed. Blackwell Science Ltd., Oxford, UK.
Smith, P.E., Flerx, W., Hewitt, R.H., 1985. The CalCOFI Vertical Egg Tow (CalVET) Net.In: Lasker, R. (Ed.), An Egg Production Method for Estimating Spawning Biomassof Pelagic Fish: Application to the Northern Anchovy, Engraulis Mordax. NOAATechnical Report NMFS 36, pp. 27–32.
Stanton, T.K., Wiebe, P.H., Chu, D., Goodman, L., 1994. Acoustic characterization anddiscrimination of marine zooplankton and turbulence. ICES Journal of MarineScience 51, 469–479.
Steele, J.H., 1976. Patchiness. In: Cushing, D.H., Walsh, J.J. (Eds.), The Ecology of theSeas. Blackwell Scientific Publications, Oxford, UK, pp. 98–115.
Stefansson, G., 1996. Analysis of groundfish survey abundance data: combining theGLM and delta approaches. ICES Journal of Marine Science 53, 577–588.
Sund, P.N., Blackburn, M., Williams, F., 1981. Tunas and environment in the PacificOcean: a review. Oceanography and Marine Biology: Annual Review 19, 443–512.
Uriarte, A., Sagarminaga, Y., Scalabrin, C., Valencia, V., Cermeño, P., DeMiguel, E,Gómez Sánchez, J.A., Jiménez, M., 2001. Ecology of anchovy juveniles in the Bayof Biscay 4 months after peak spawning: do they form part of the plankton. ICESCM W, 20.
Venables, W.N., Ripley, B.D., 2002. Modern Applied Statistics with S, fourth ed.Springer-Verlag, New York.
Weill, A., Scalabrin, C., Diner, N., 1993. MOVIES-B: an acoustic detection descriptionsoftware. Application to shoal species classification. Aquatic Living Resources 6,255–267.
Wiebe, P.H., 1970. Small scale spatial distribution in oceanic zooplankton.Limnology and Oceanography 15, 205–217.