
Age and growth of yellowfin tuna ( Thunnus albacares) in the western equatorial Atlantic, using...
14
Fisheries Research 69 (2004) 157–170 Age and growth of yellowfin tuna (Thunnus albacares) in the western equatorial Atlantic, using dorsal fin spines Rosangela Lessa ∗ , Paulo Duarte-Neto Universidade Federal Rural de Pernambuco (UFRPE), Departamento de Pesca, Laborat´ orio de Din ˆ amica de Popula¸ c˜ oes Marinhas (DIMAR), Dois Irm ˜ aos, Recife-PE, Brasil CEP 52171-900, Brazil Received 26 September 2003; received in revised form 19 April 2004; accepted 15 May 2004 Abstract Lengths of 6758 yellowfin tuna, Thunnus albacares (T. albacares), were measured (42–191 cm FL) from 1992 to 2000 off northeastern Brazil (0–12 ◦ S/30–41 ◦ W). Age and growth were estimated from seasonally formed bands on the first dorsal spines of 380 specimens (45–191cm FL) obtained from 1998 to 2000. Von Bertalanffy growth parameters were estimated from the observed length-at-age, from back-calculated lengths, and from a combination of back-calculated lengths and observed lengths. This last method was chosen for describing the species’ growth; parameters were L ∞ = 230.7 cm, K = 0.267, and t 0 = −0.081 year. Marginal increment ratio and spine edge characterization suggested the annual deposition of two bands. Mean MIR values increase from November to April and from June to September, whereas translucent edges predominate in May and October, when new band formation is supposed to start. Overall, spines showed one to six complete bands with a well-developed absorbed area. The estimated reading error (IAPE) between two examiners was 9% for the overall sample. Size at maturity corresponded to an age of 3.4 years and the oldest individual in the sample was 6.5 years (191 cm FL). Fish lengths (35,469), taken from the International Commission for the Conservation of Atlantic Tuna–ICCAT database and measured in the area 20 ◦ S–05 ◦ N from 1975 to 1994, were analyzed leading to results similar to those produced from reading spines. Comparisons with von Bertalanffy parameters from the literature indicated statistical differences among all growth curves, with exception of that presented for the northern Atlantic. Average fish lengths decreased from 1975 to 1994, and only 25% of individuals in landings were larger than the size at maturity. © 2004 Elsevier B.V. All rights reserved. Keywords: Yellowfin tuna; Thunnus albacares; Age and growth; Fin spines; Western Atlantic ∗ Corresponding author. Tel.: +55 81 33021509; fax: +55 81 33021501. E-mail address: [email protected] (R. Lessa). 1. Introduction The yellowfin tuna, Thunnus albacares (T. al- bacares), have been studied extensively due to their economic importance and abundance in the fisheries of the southern Atlantic Ocean. Most of the avail- able information comes from the eastern-southern 0165-7836/$ – see front matter © 2004 Elsevier B.V. All rights reserved. doi:10.1016/j.fishres.2004.05.007
-
Upload
independent -
Category
Documents
-
view
0 -
download
0
Transcript of Age and growth of yellowfin tuna ( Thunnus albacares) in the western equatorial Atlantic, using...
Fisheries Research 69 (2004) 157–170
Age and growth of yellowfin tuna (Thunnus albacares) in thewestern equatorial Atlantic, using dorsal fin spines
Rosangela Lessa∗, Paulo Duarte-Neto
Universidade Federal Rural de Pernambuco (UFRPE), Departamento de Pesca, Laborat´orio de Dinamica de Popula¸coesMarinhas (DIMAR), Dois Irm˜aos, Recife-PE, Brasil CEP 52171-900, Brazil
Received 26 September 2003; received in revised form 19 April 2004; accepted 15 May 2004
Abstract
Lengths of 6758 yellowfin tuna,Thunnus albacares(T. albacares), were measured (42–191 cm FL) from 1992 to 2000 offnortheastern Brazil (0–12◦S/30–41◦W). Age and growth were estimated from seasonally formed bands on the first dorsal spinesof 380 specimens (45–191 cm FL) obtained from 1998 to 2000. Von Bertalanffy growth parameters were estimated from theobserved length-at-age, from back-calculated lengths, and from a combination of back-calculated lengths and observed lengths.This last method was chosen for describing the species’ growth; parameters wereL∞ = 230.7 cm,K = 0.267, andt0 = −0.081year. Marginal increment ratio and spine edge characterization suggested the annual deposition of two bands. Mean MIR valuesincrease from November to April and from June to September, whereas translucent edges predominate in May and October,when new band formation is supposed to start. Overall, spines showed one to six complete bands with a well-developed absorbedarea. The estimated reading error (IAPE) between two examiners was 9% for the overall sample. Size at maturity correspondedt n from theI1 ertalanffyp ted for then rger thant©
K
f
heireriesail-hern
0
o an age of 3.4 years and the oldest individual in the sample was 6.5 years (191 cm FL). Fish lengths (35,469), takenternational Commission for the Conservation of Atlantic Tuna–ICCAT database and measured in the area 20◦S–05◦N from975 to 1994, were analyzed leading to results similar to those produced from reading spines. Comparisons with von Barameters from the literature indicated statistical differences among all growth curves, with exception of that presenorthern Atlantic. Average fish lengths decreased from 1975 to 1994, and only 25% of individuals in landings were la
he size at maturity.2004 Elsevier B.V. All rights reserved.
eywords: Yellowfin tuna;Thunnus albacares; Age and growth; Fin spines; Western Atlantic
∗ Corresponding author. Tel.: +55 81 33021509;ax: +55 81 33021501.
E-mail address:[email protected] (R. Lessa).
1. Introduction
The yellowfin tuna,Thunnus albacares(T. al-bacares), have been studied extensively due to teconomic importance and abundance in the fishof the southern Atlantic Ocean. Most of the avable information comes from the eastern-sout
165-7836/$ – see front matter © 2004 Elsevier B.V. All rights reserved.doi:10.1016/j.fishres.2004.05.007
158 R. Lessa, P. Duarte-Neto / Fisheries Research 69 (2004) 157–170
Atlantic and pertains to age and growth (Le Guen andSakagawa, 1973; Fonteneau, 1980; Myabe, 1983; Bard,1984; Draganick and Pelczarski, 1984; Manooch andHinkley, 1991), reproduction (Albaret, 1977; Capisanoand Fonteneau, 1991; Vieira, 1991), distribution andmigration (Stretta et al., 1990; Fonteneau, 1991), andstock structure (Bard and Scott, 1991).
Likewise, in the western southern Atlantic, wherethe yellowfin tuna have been exploited since the 1950s,studies have focused on reproduction (Zavala-Camin,1978), larvae distribution (Matsuura and Sato, 1981),feeding (Zavala-Camin, 1981) and abundance indexes(Travassos, 1999). Fish lengths and catch effort dataare reported annually by member countries to the In-ternational Commission for Conservation of AtlanticTuna (ICCAT), where periodic stock assessments arecarried out.
Based on data collected from longline, no repro-ductive activity has been observed in the area from0–10◦S/30–40◦W, and the catch is primarily com-posed of sub-adults or resting females (Lessa et al.,1993). This concurs with the information from south-ern Brazil (27–33◦S) where no reproductive activityhas been detected (Zavala-Camin, 1978). Similarly, atthe Sao Pedro–Sao Paulo Archipelago (0◦ 59′N/30◦0′W), no spawning activity has been observed betweenJanuary and April, based on specimens captured withhandlines. In a survey of pelagic fishes, conductedfrom 1992–1997, yellowfin tuna represented 40% ofthe catch in the equatorial Brazilian EEZ (Travassos,1 erem es,pe r,hA
omt d bya a,1 ;B ;D andH s-s singl ra ino ,1
According toBard and Scott (1991), this speciesconstitutes a single stock in the Atlantic, with adults mi-grating from east to west. This assumption, based ontag-recoveries, is widely accepted as the most likely.Mitochondrial DNA research (Scoles and Graves,1993) supports the global stock hypothesis, and dif-ferences in life histories (e.g. growth rates) amongyellowfin tuna between oceans may be attributedto varying environmental factors (Driggers et al.,1999).
This study was conducted as part of the RenewableResources Assessment Programme (REVIZEE) aimedat providing information on the Brazilian ExclusiveEconomic Zone (EEZ). Its purpose is to supplyinformation on age, growth and stock structure forT.albacarescaught in the equatorial western-southernAtlantic, using dorsal spines and length–frequencyanalysis. This information is needed to constructage-based models that can be used to manage thespecies.
2. Material and methods
A sample was collected in landings of commerciallongliners, research vessels, and from artisanal fisheriesbetween 1992 and 2000. Commercial and researchvessels were equipped with Japanese-style multifila-ment longlines (Suzuki et al., 1977), and operated inthe area between 0–2◦S/30–41◦W and around the SaoPa k offn all ngi ishba do
in-d erec zen,a l foru inel weret bovet ed inp saw.T 0.75
999), which is regarded as a feeding ground whigratory yellowfin, on their way to spawning sitrey on flying-fish,Cypselurus cyanopterus(Lessat al., 1999). Some juveniles (∼45 cm FL), howeveave been caught around the Sao Pedro–Sao Paulorchipelago by artisanal fisheries.Age and growth parameters for yellowfin tuna fr
he eastern-southern Atlantic have been estimatenalyzing length frequencies (Le Guen and Sakagaw973; Fonteneau, 1980), tag recoveries (Myabe, 1983ard, 1984) and calcified structures (Yang et al., 1969raganick and Pelczarski, 1984; Manoochinkley, 1991). Similarly, in the western Atlantic, aessments of age and growth were conducted uength–frequency analysis from Venezuela (Gaertnend Pagavino, 1991), and daily microstructurestoliths in the northern Atlantic (Driggers et al.999).
edro–Sao Paulo Archipelago (0◦59′N/30◦0′W). Thertisanal fleet used hand lines near the shelf breaortheastern Brazil (Fig. 1). While sampling artisan
andings, livers removed from most of the youndividuals (<60 cm FL) were examined to distinguetweenT. albacaresandThunnus obesus(T. obesus),ccording toCollette and Nauen (1983)criteria basen striations on the liver surface.
The spiniform rays of the first dorsal fin on 380ividuals, representative of full range of fish size wollected from 1998 to 2000 and were excised, frond stored in either 4% formaldehyde and alcohop to 6 months. After being air-dried for 24–48 h, sp
engths were measured (cm), and cross-sectionsaken between 5 and 30% of the spine length ahe condyle. These spine portions were embeddolyester resin and sectioned using a low-speedhe sections closest to the condyle, ranging from
R. Lessa, P. Duarte-Neto / Fisheries Research 69 (2004) 157–170 159
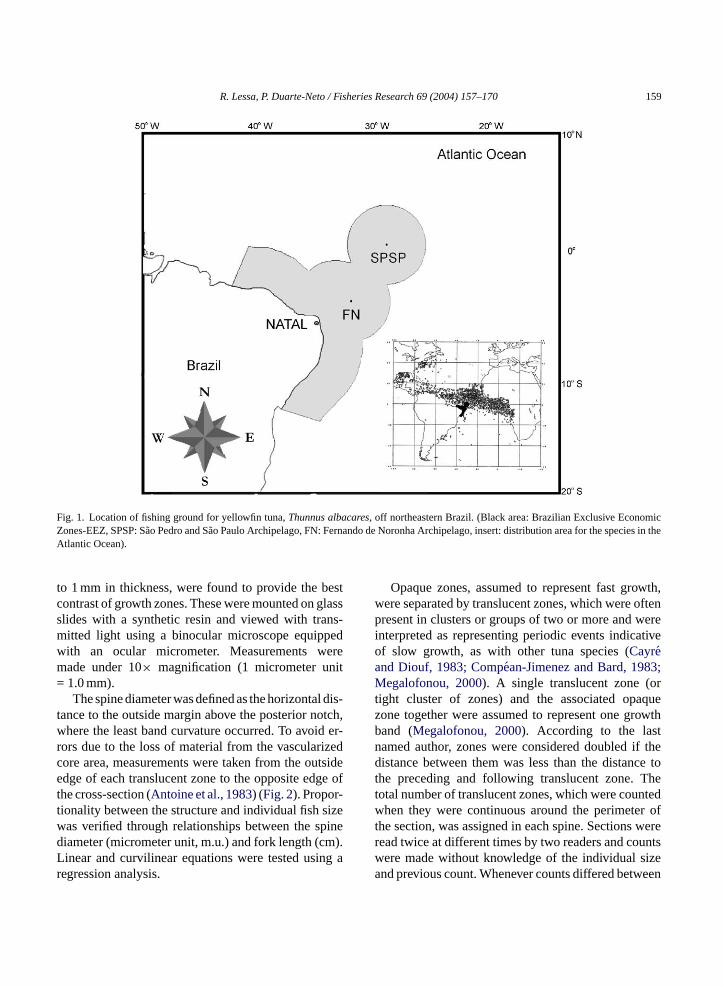
Fig. 1. Location of fishing ground for yellowfin tuna,Thunnus albacares, off northeastern Brazil. (Black area: Brazilian Exclusive EconomicZones-EEZ, SPSP: Sao Pedro and Sao Paulo Archipelago, FN: Fernando de Noronha Archipelago, insert: distribution area for the species in theAtlantic Ocean).
to 1 mm in thickness, were found to provide the bestcontrast of growth zones. These were mounted on glassslides with a synthetic resin and viewed with trans-mitted light using a binocular microscope equippedwith an ocular micrometer. Measurements weremade under 10× magnification (1 micrometer unit= 1.0 mm).
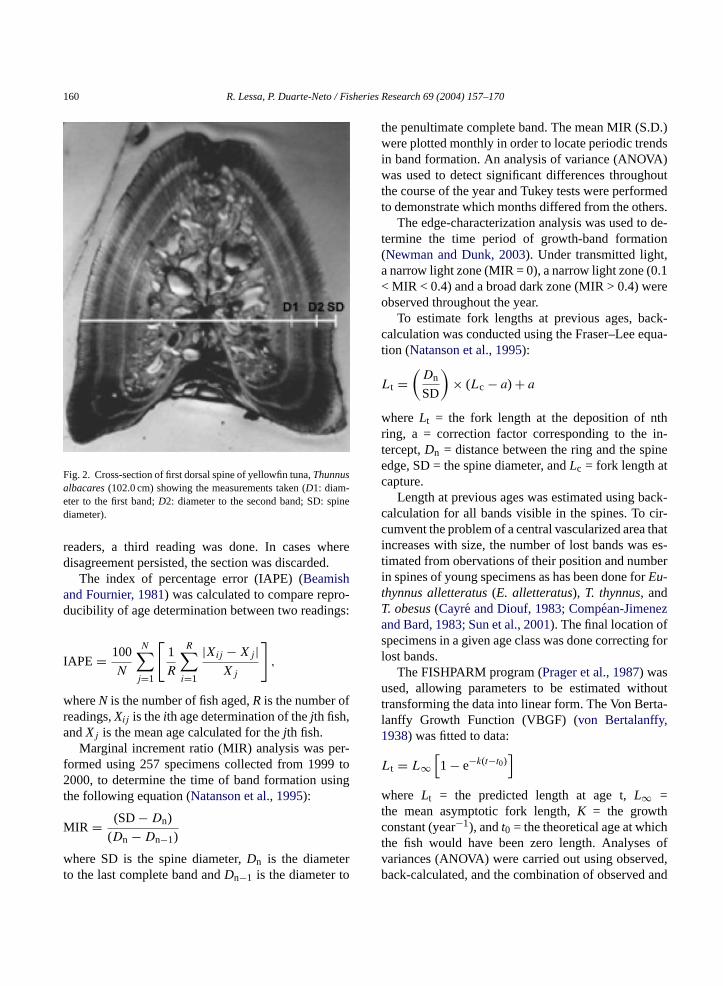
The spine diameter was defined as the horizontal dis-tance to the outside margin above the posterior notch,where the least band curvature occurred. To avoid er-rors due to the loss of material from the vascularizedcore area, measurements were taken from the outsideedge of each translucent zone to the opposite edge ofthe cross-section (Antoine et al., 1983) (Fig. 2). Propor-tionality between the structure and individual fish sizewas verified through relationships between the spinediameter (micrometer unit, m.u.) and fork length (cm).Linear and curvilinear equations were tested using aregression analysis.
Opaque zones, assumed to represent fast growth,were separated by translucent zones, which were oftenpresent in clusters or groups of two or more and wereinterpreted as representing periodic events indicativeof slow growth, as with other tuna species (Cayreand Diouf, 1983; Compean-Jimenez and Bard, 1983;Megalofonou, 2000). A single translucent zone (ortight cluster of zones) and the associated opaquezone together were assumed to represent one growthband (Megalofonou, 2000). According to the lastnamed author, zones were considered doubled if thedistance between them was less than the distance tothe preceding and following translucent zone. Thetotal number of translucent zones, which were countedwhen they were continuous around the perimeter ofthe section, was assigned in each spine. Sections wereread twice at different times by two readers and countswere made without knowledge of the individual sizeand previous count. Whenever counts differed between
160 R. Lessa, P. Duarte-Neto / Fisheries Research 69 (2004) 157–170
Fig. 2. Cross-section of first dorsal spine of yellowfin tuna,Thunnusalbacares(102.0 cm) showing the measurements taken (D1: diam-eter to the first band;D2: diameter to the second band; SD: spinediameter).
readers, a third reading was done. In cases wheredisagreement persisted, the section was discarded.
The index of percentage error (IAPE) (Beamishand Fournier, 1981) was calculated to compare repro-ducibility of age determination between two readings:
IAPE = 100
N
N∑j=1
[1
R
R∑i=1
|Xij − Xj|Xj
],
whereN is the number of fish aged,R is the number ofreadings,Xij is theith age determination of thejth fish,andXj is the mean age calculated for thejth fish.
Marginal increment ratio (MIR) analysis was per-formed using 257 specimens collected from 1999 to2000, to determine the time of band formation usingthe following equation (Natanson et al., 1995):
MIR = (SD− Dn)
(Dn − Dn−1)
where SD is the spine diameter,Dn is the diameterto the last complete band andDn−1 is the diameter to
the penultimate complete band. The mean MIR (S.D.)were plotted monthly in order to locate periodic trendsin band formation. An analysis of variance (ANOVA)was used to detect significant differences throughoutthe course of the year and Tukey tests were performedto demonstrate which months differed from the others.
The edge-characterization analysis was used to de-termine the time period of growth-band formation(Newman and Dunk, 2003). Under transmitted light,a narrow light zone (MIR = 0), a narrow light zone (0.1< MIR < 0.4) and a broad dark zone (MIR > 0.4) wereobserved throughout the year.
To estimate fork lengths at previous ages, back-calculation was conducted using the Fraser–Lee equa-tion (Natanson et al., 1995):
Lt =(
Dn
SD
)× (Lc − a) + a
whereLt = the fork length at the deposition of nthring, a = correction factor corresponding to the in-tercept,Dn = distance between the ring and the spineedge, SD = the spine diameter, andLc = fork length atcapture.
Length at previous ages was estimated using back-calculation for all bands visible in the spines. To cir-cumvent the problem of a central vascularized area thatincreases with size, the number of lost bands was es-timated from obervations of their position and numberin spines of young specimens as has been done forEu-tT za fs g forl
u houtt rta-l ,1
L
wtc cht s ofv ed,b and
hynnus alletteratus(E. alletteratus), T. thynnus, and. obesus(Cayre and Diouf, 1983; Compean-Jimenend Bard, 1983; Sun et al., 2001). The final location opecimens in a given age class was done correctinost bands.
The FISHPARM program (Prager et al., 1987) wassed, allowing parameters to be estimated wit
ransforming the data into linear form. The Von Beanffy Growth Function (VBGF) (von Bertalanffy938) was fitted to data:
t = L∞[1 − e−k(t−t0)
]here Lt = the predicted length at age t,L∞ =
he mean asymptotic fork length,K = the growthonstant (year−1), andt0 = the theoretical age at whihe fish would have been zero length. Analyseariances (ANOVA) were carried out using observack-calculated, and the combination of observed
R. Lessa, P. Duarte-Neto / Fisheries Research 69 (2004) 157–170 161
back-calculated lengths to detect the VBGF that bestfitted length-at-age data.
Using an age-length key based on 380 specimens,for which spines were read, the age composition of thesample was evaluated (Bartoo and Parker, 1983).
Length–frequency data of 35,469 specimens fromthe ICCAT database, collected from 1975 to 1994in the area between 05
◦N–20
◦S, were divided into
4 cm intervals. Lengths ranging from 60 to 190 cmFL were analyzed monthly in four samples, each withfive years. Length–frequency analyses (LFA) were con-ducted using the FAO-ICLARM Stock AssessmentTools (FISAT) program (Gayanilo et al., 1994), inwhich the automatic search option of the ELEFANroutine was employed. The initial value ofL∞ was170 cm FL that is lower than the maximal observedlength in the sample (step size± 0.05); the lowestKvalue used was 0.2 (step size± 0.005). The best combi-nations of parameters were those providing the highestRn goodness-of-fit index. Five-year length–frequencydistributions were compared using ANOVA.
Following procedures described byStequert et al.(1996), the growth pattern obtained in the presentstudy was graphically compared to several others avail-able in literature, generated through length–frequencyand hard-structure analyses (Yabuta et al., 1960; Yanget al., 1969; Manooch and Hinkley, 1991; Stequertet al., 1996; Driggers et al., 1999). Also, lengths-at-age were compared using bivariate Hotellings’T2 test(Cerrato, 1990).
F albacar l fleeto
3. Results
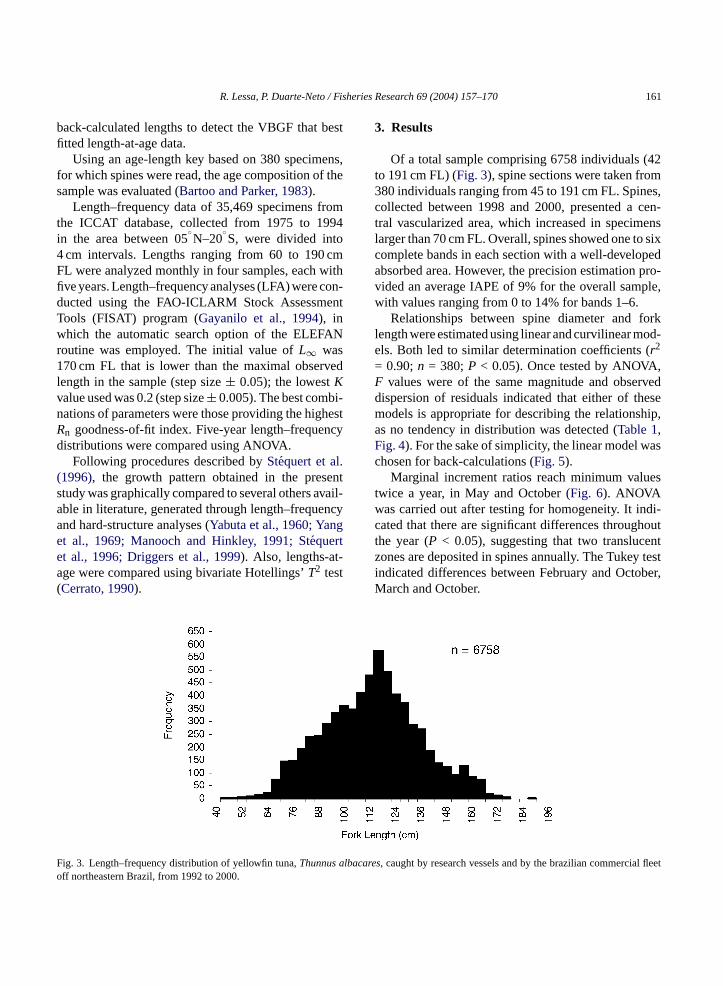
Of a total sample comprising 6758 individuals (42to 191 cm FL) (Fig. 3), spine sections were taken from380 individuals ranging from 45 to 191 cm FL. Spines,collected between 1998 and 2000, presented a cen-tral vascularized area, which increased in specimenslarger than 70 cm FL. Overall, spines showed one to sixcomplete bands in each section with a well-developedabsorbed area. However, the precision estimation pro-vided an average IAPE of 9% for the overall sample,with values ranging from 0 to 14% for bands 1–6.
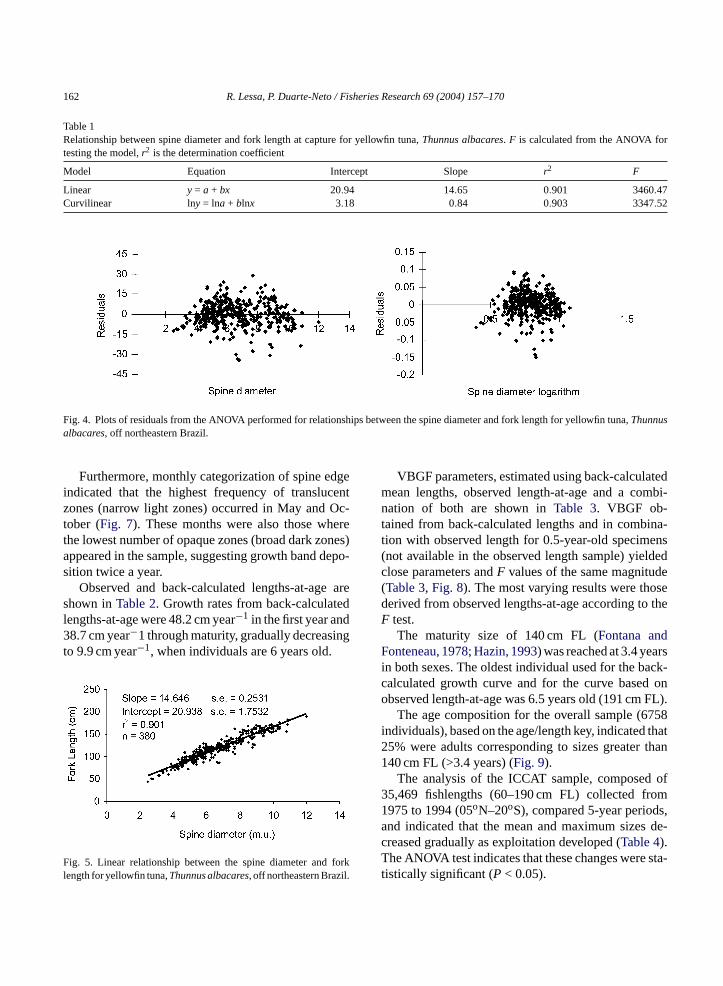
Relationships between spine diameter and forklength were estimated using linear and curvilinear mod-els. Both led to similar determination coefficients (r2
= 0.90;n = 380;P < 0.05). Once tested by ANOVA,F values were of the same magnitude and observeddispersion of residuals indicated that either of thesemodels is appropriate for describing the relationship,as no tendency in distribution was detected (Table 1,Fig. 4). For the sake of simplicity, the linear model waschosen for back-calculations (Fig. 5).
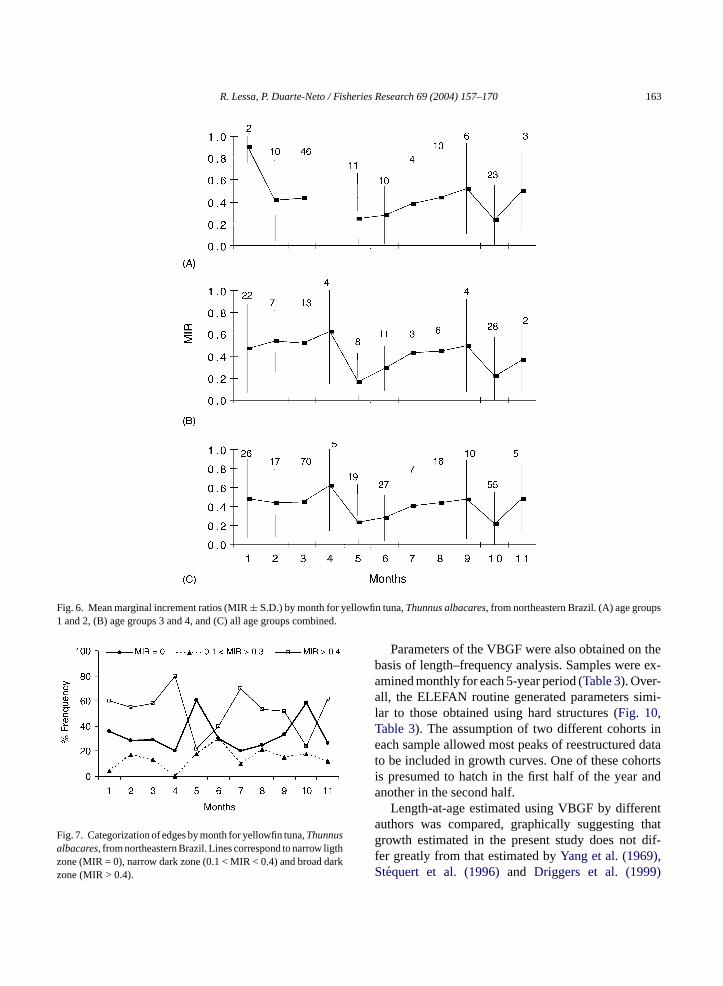
Marginal increment ratios reach minimum valuestwice a year, in May and October (Fig. 6). ANOVAwas carried out after testing for homogeneity. It indi-cated that there are significant differences throughoutthe year (P < 0.05), suggesting that two translucentzones are deposited in spines annually. The Tukey testindicated differences between February and October,March and October.
ig. 3. Length–frequency distribution of yellowfin tuna,Thunnusff northeastern Brazil, from 1992 to 2000.
es, caught by research vessels and by the brazilian commercia
162 R. Lessa, P. Duarte-Neto / Fisheries Research 69 (2004) 157–170
Table 1Relationship between spine diameter and fork length at capture for yellowfin tuna,Thunnus albacares. F is calculated from the ANOVA fortesting the model,r2 is the determination coefficient
Model Equation Intercept Slope r2 F
Linear y = a + bx 20.94 14.65 0.901 3460.47Curvilinear lny = lna + blnx 3.18 0.84 0.903 3347.52
Fig. 4. Plots of residuals from the ANOVA performed for relationships between the spine diameter and fork length for yellowfin tuna,Thunnusalbacares, off northeastern Brazil.
Furthermore, monthly categorization of spine edgeindicated that the highest frequency of translucentzones (narrow light zones) occurred in May and Oc-tober (Fig. 7). These months were also those wherethe lowest number of opaque zones (broad dark zones)appeared in the sample, suggesting growth band depo-sition twice a year.
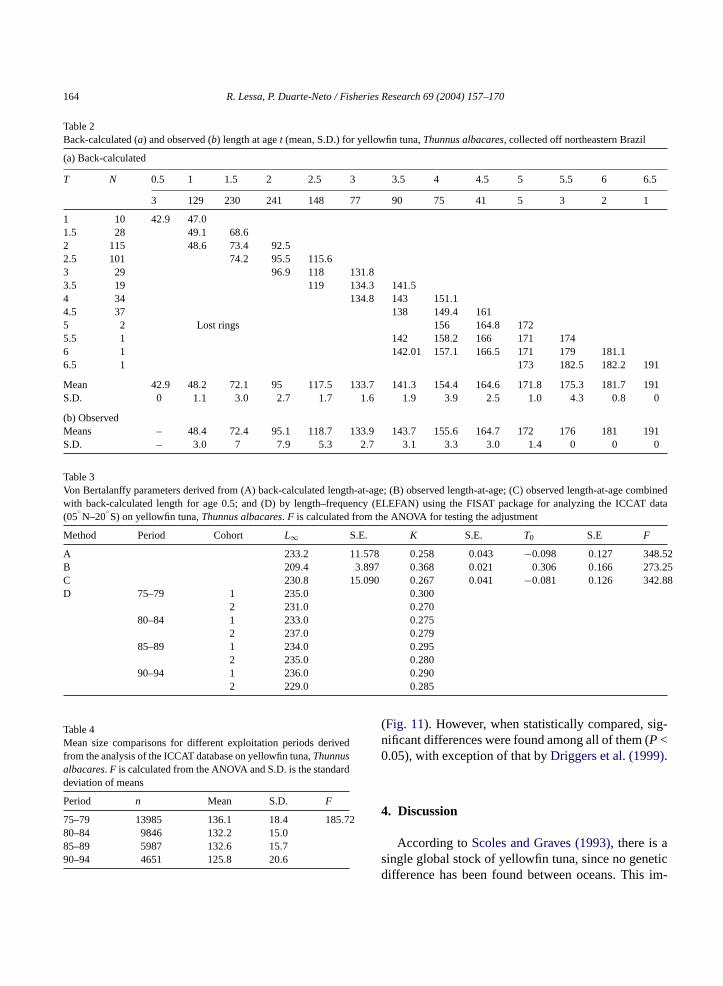
Observed and back-calculated lengths-at-age areshown inTable 2. Growth rates from back-calculatedlengths-at-age were 48.2 cm year−1 in the first year and38.7 cm year−1 through maturity, gradually decreasingto 9.9 cm year−1, when individuals are 6 years old.
Fig. 5. Linear relationship between the spine diameter and forklength for yellowfin tuna,Thunnusalbacares, off northeastern Brazil.
VBGF parameters, estimated using back-calculatedmean lengths, observed length-at-age and a combi-nation of both are shown inTable 3. VBGF ob-tained from back-calculated lengths and in combina-tion with observed length for 0.5-year-old specimens(not available in the observed length sample) yieldedclose parameters andF values of the same magnitude(Table 3, Fig. 8). The most varying results were thosederived from observed lengths-at-age according to theF test.
The maturity size of 140 cm FL (Fontana andFonteneau, 1978; Hazin, 1993) was reached at 3.4 yearsin both sexes. The oldest individual used for the back-calculated growth curve and for the curve based onobserved length-at-age was 6.5 years old (191 cm FL).
The age composition for the overall sample (6758individuals), based on the age/length key, indicated that25% were adults corresponding to sizes greater than140 cm FL (>3.4 years) (Fig. 9).
The analysis of the ICCAT sample, composed of35,469 fishlengths (60–190 cm FL) collected from1975 to 1994 (05oN–20oS), compared 5-year periods,and indicated that the mean and maximum sizes de-creased gradually as exploitation developed (Table 4).The ANOVA test indicates that these changes were sta-tistically significant (P < 0.05).
R. Lessa, P. Duarte-Neto / Fisheries Research 69 (2004) 157–170 163
Fig. 6. Mean marginal increment ratios (MIR± S.D.) by month for yellowfin tuna,Thunnus albacares, from northeastern Brazil. (A) age groups1 and 2, (B) age groups 3 and 4, and (C) all age groups combined.
Fig. 7. Categorization of edges by month for yellowfin tuna,Thunnusalbacares, from northeastern Brazil. Lines correspond to narrow ligthzone (MIR = 0), narrow dark zone (0.1 < MIR < 0.4) and broad darkzone (MIR > 0.4).
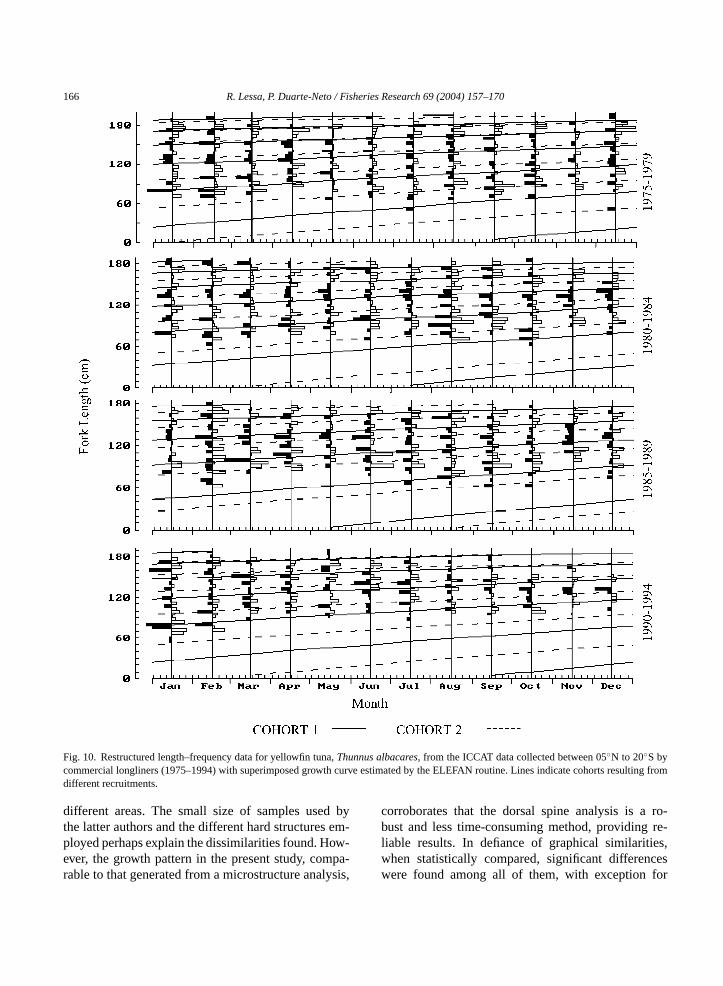
Parameters of the VBGF were also obtained on thebasis of length–frequency analysis. Samples were ex-amined monthly for each 5-year period (Table 3). Over-all, the ELEFAN routine generated parameters simi-lar to those obtained using hard structures (Fig. 10,Table 3). The assumption of two different cohorts ineach sample allowed most peaks of reestructured datato be included in growth curves. One of these cohortsis presumed to hatch in the first half of the year andanother in the second half.
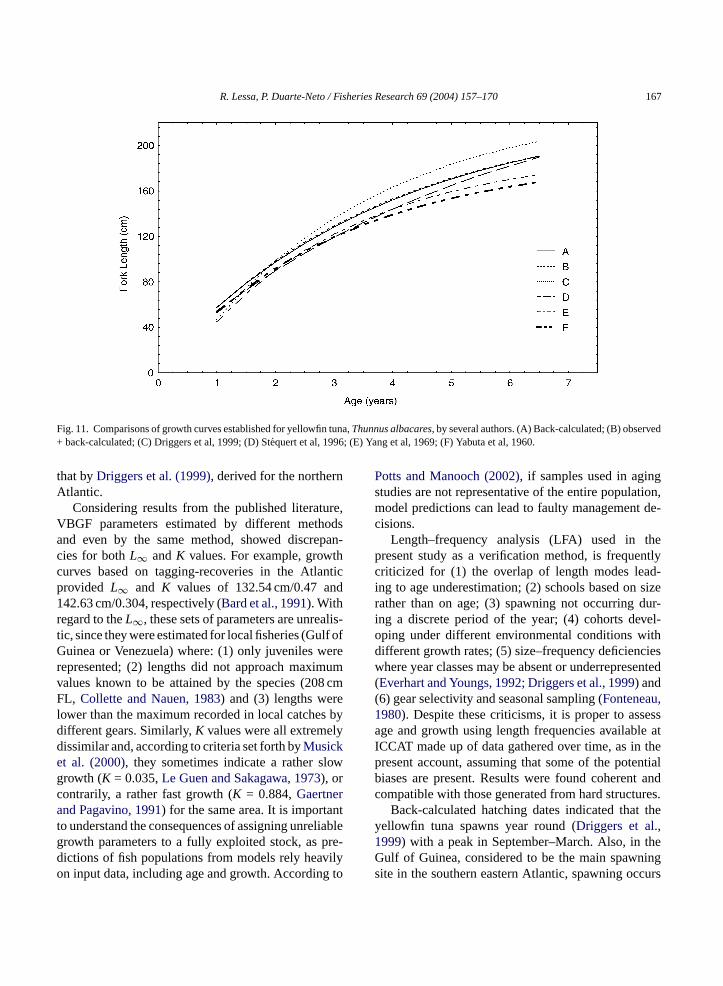
Length-at-age estimated using VBGF by differentauthors was compared, graphically suggesting thatgrowth estimated in the present study does not dif-fer greatly from that estimated byYang et al. (1969),Stequert et al. (1996)and Driggers et al. (1999)
164 R. Lessa, P. Duarte-Neto / Fisheries Research 69 (2004) 157–170
Table 2Back-calculated (a) and observed (b) length at aget (mean, S.D.) for yellowfin tuna,Thunnus albacares, collected off northeastern Brazil
(a) Back-calculated
T N 0.5 1 1.5 2 2.5 3 3.5 4 4.5 5 5.5 6 6.5
3 129 230 241 148 77 90 75 41 5 3 2 1
1 10 42.9 47.01.5 28 49.1 68.62 115 48.6 73.4 92.52.5 101 74.2 95.5 115.63 29 96.9 118 131.83.5 19 119 134.3 141.54 34 134.8 143 151.14.5 37 138 149.4 1615 2 Lost rings 156 164.8 1725.5 1 142 158.2 166 171 1746 1 142.01 157.1 166.5 171 179 181.16.5 1 173 182.5 182.2 191
Mean 42.9 48.2 72.1 95 117.5 133.7 141.3 154.4 164.6 171.8 175.3 181.7 191S.D. 0 1.1 3.0 2.7 1.7 1.6 1.9 3.9 2.5 1.0 4.3 0.8 0
(b) ObservedMeans – 48.4 72.4 95.1 118.7 133.9 143.7 155.6 164.7 172 176 181 191S.D. – 3.0 7 7.9 5.3 2.7 3.1 3.3 3.0 1.4 0 0 0
Table 3Von Bertalanffy parameters derived from (A) back-calculated length-at-age; (B) observed length-at-age; (C) observed length-at-age combinedwith back-calculated length for age 0.5; and (D) by length–frequency (ELEFAN) using the FISAT package for analyzing the ICCAT data(05
◦N–20
◦S) on yellowfin tuna,Thunnus albacares. F is calculated from the ANOVA for testing the adjustment
Method Period Cohort L∞ S.E. K S.E. T0 S.E F
A 233.2 11.578 0.258 0.043 −0.098 0.127 348.52B 209.4 3.897 0.368 0.021 0.306 0.166 273.25C 230.8 15.090 0.267 0.041 −0.081 0.126 342.88D 75–79 1 235.0 0.300
2 231.0 0.27080–84 1 233.0 0.275
2 237.0 0.27985–89 1 234.0 0.295
2 235.0 0.28090–94 1 236.0 0.290
2 229.0 0.285
Table 4Mean size comparisons for different exploitation periods derivedfrom the analysis of the ICCAT database on yellowfin tuna,Thunnusalbacares. F is calculated from the ANOVA and S.D. is the standarddeviation of means
Period n Mean S.D. F
75–79 13985 136.1 18.4 185.7280–84 9846 132.2 15.085–89 5987 132.6 15.790–94 4651 125.8 20.6
(Fig. 11). However, when statistically compared, sig-nificant differences were found among all of them (P<0.05), with exception of that byDriggers et al. (1999).
4. Discussion
According toScoles and Graves (1993), there is asingle global stock of yellowfin tuna, since no geneticdifference has been found between oceans. This im-

R. Lessa, P. Duarte-Neto / Fisheries Research 69 (2004) 157–170 165
Fig. 8. Von Bertalanffy growth curves generated from (a) mean back-calculated lengths; (b) observed length-at-age and (c) observed length-at-age combined with the back-calculated value for age 0.5 for both sexes of the yellowfin tuna,Thunnus albacares. Black dots are individuallength-at-age.
Fig. 9. Age composition of the overall sample of the yellowfin tuna,Thunnus albacares, collected off northeastern Brazil (1992–2000).
plies that it is reasonable to expect similar growth ratesin different areas, as stated byStequert et al. (1996). Ac-cordingly, after graphically comparing several curvesgenerated for different oceans, the latter authors con-cluded that there was an overall similarity, despite dif-ferences in parameters amongst all VBGF.
Graphical comparisons of the growth pattern inthe present study with those derived by different
authors led to similarities with that of the IndianOcean (Stequert et al., 1996) and the northern At-lantic Ocean (Driggers et al., 1999), both basedon otolith microstructure, despite distinct VBGF pa-rameters (Fig. 11). In contrast, other growth curvesgenerated for the Atlantic using hard structuressupplied the most varying results (Manooch andHinkley, 1991), suggesting different growth rates in
166 R. Lessa, P. Duarte-Neto / Fisheries Research 69 (2004) 157–170
Fig. 10. Restructured length–frequency data for yellowfin tuna,Thunnus albacares, from the ICCAT data collected between 05◦N to 20◦S bycommercial longliners (1975–1994) with superimposed growth curve estimated by the ELEFAN routine. Lines indicate cohorts resulting fromdifferent recruitments.
different areas. The small size of samples used bythe latter authors and the different hard structures em-ployed perhaps explain the dissimilarities found. How-ever, the growth pattern in the present study, compa-rable to that generated from a microstructure analysis,
corroborates that the dorsal spine analysis is a ro-bust and less time-consuming method, providing re-liable results. In defiance of graphical similarities,when statistically compared, significant differenceswere found among all of them, with exception for
R. Lessa, P. Duarte-Neto / Fisheries Research 69 (2004) 157–170 167
Fig. 11. Comparisons of growth curves established for yellowfin tuna,Thunnus albacares, by several authors. (A) Back-calculated; (B) observed+ back-calculated; (C) Driggers et al, 1999; (D) Stequert et al, 1996; (E) Yang et al, 1969; (F) Yabuta et al, 1960.
that byDriggers et al. (1999), derived for the northernAtlantic.
Considering results from the published literature,VBGF parameters estimated by different methodsand even by the same method, showed discrepan-cies for bothL∞ andK values. For example, growthcurves based on tagging-recoveries in the Atlanticprovided L∞ and K values of 132.54 cm/0.47 and142.63 cm/0.304, respectively (Bard et al., 1991). Withregard to theL∞, these sets of parameters are unrealis-tic, since they were estimated for local fisheries (Gulf ofGuinea or Venezuela) where: (1) only juveniles wererepresented; (2) lengths did not approach maximumvalues known to be attained by the species (208 cmFL, Collette and Nauen, 1983) and (3) lengths werelower than the maximum recorded in local catches bydifferent gears. Similarly,K values were all extremelydissimilar and, according to criteria set forth byMusicket al. (2000), they sometimes indicate a rather slowgrowth (K = 0.035,Le Guen and Sakagawa, 1973), orcontrarily, a rather fast growth (K = 0.884,Gaertnerand Pagavino, 1991) for the same area. It is importantto understand the consequences of assigning unreliablegrowth parameters to a fully exploited stock, as pre-dictions of fish populations from models rely heavilyon input data, including age and growth. According to
Potts and Manooch (2002), if samples used in agingstudies are not representative of the entire population,model predictions can lead to faulty management de-cisions.
Length–frequency analysis (LFA) used in thepresent study as a verification method, is frequentlycriticized for (1) the overlap of length modes lead-ing to age underestimation; (2) schools based on sizerather than on age; (3) spawning not occurring dur-ing a discrete period of the year; (4) cohorts devel-oping under different environmental conditions withdifferent growth rates; (5) size–frequency deficiencieswhere year classes may be absent or underrepresented(Everhart and Youngs, 1992; Driggers et al., 1999) and(6) gear selectivity and seasonal sampling (Fonteneau,1980). Despite these criticisms, it is proper to assessage and growth using length frequencies available atICCAT made up of data gathered over time, as in thepresent account, assuming that some of the potentialbiases are present. Results were found coherent andcompatible with those generated from hard structures.
Back-calculated hatching dates indicated that theyellowfin tuna spawns year round (Driggers et al.,1999) with a peak in September–March. Also, in theGulf of Guinea, considered to be the main spawningsite in the southern eastern Atlantic, spawning occurs
168 R. Lessa, P. Duarte-Neto / Fisheries Research 69 (2004) 157–170
within this period, from December to March (Albaret,1977; Capisano and Fonteneau, 1991). Juveniles stayin the Gulf until reaching 60–80 cm and then migratewestward where they grow to maturity, returning to theGulf of Guinea for spawning. At Cape Verde, a sec-ondary spawning ground, catches obtained from Juneto October are composed of juveniles around 50 cm(Vieira, 1991) or 1-year-old according to our estima-tions. It can therefore be speculated that the successfuluse of LFA in the present study may, in fact, mean thatindividuals produced in two spawning peaks at differ-ent halves of the year prevail in samples, leading theprogram to identify two cohorts.
The analysis of marginal increments, althoughshowing significant differences throughout the year,was statistically inconclusive in respect to two annualdeposition periods assumed to take place in May andOctober. However, the edge characterization analyzesclearly supported this assumption, showing two peaksof highest frequency of translucent zones in the samemonths. This is in accordance with the patterns of twoannual band depositions proposed byYang et al. (1969)using scales. These authors demonstrated that bandsare deposited in March/April and September/October.Translucent bands, formed in pairs on a yearly ba-sis, were also found forT. thynnusand T. alalunga(Compean-Jimenez and Bard, 1983; Gonzales-Garcesand Farina Perez, 1983, respectively) being related tomigrations.
Summing up, dorsal spines that are easier to collectd ara-ti tudyb LFAw wtha ters.H nsoV ndb rep-r
ingg d theS It isp aret ua-t iss s
et al., 1999), concurring with the peak of spawning forthe species.
Regarding mean sizes throughout the entire period(1975–1994), it is worth noting that mean lengths havedecreased significantly over time, indicating that fish-eries may be removing large individuals from the pop-ulation. The mean size in samples has decreased inthe whole area (Table 4) and is now below mean sizeat maturity. Similarly,Hazin (1993), analyzing datafrom northeastern Brazil, observed that the size of theyellowfin tuna has continuously decreased since the1950s, and in 1993, 90% of the catch were smallerthan 140 cm.
The pattern of exploitation developed forT. al-bacaresneeds to be based on accurate growth infor-mation because the stock is considered fully exploited.In this regard, development of responsible managementstrategies is required to prevent the yellowfin tuna stockfrom suffering the same fate as that of the bluefin tunaand swordfish (Driggers et al., 1999).
Acknowledgements
This study was funded by Ministerio do MeioAmbiente-MMA and Secretaria da Comissao Intermin-isterial para os Recursos do Mar-SECIRM in the scopeof Programa Nacional de Recursos Vivos–REVIZEEand Ecologia de Tunıdeos e Afins-ECOTUNA Project( rtePP x-t hea .Sc.K wo rt ind as-s iouss Con-sn
R
A -r.
uring landings and less time-consuming for prepion, are also suitable structures forT. albacaresage-ng. VBGF parameters generated in the current sy back-calculation, observed length-at-age, andere all considered appropriate for describing grond produced similar theoretical growth parameowever, accepting criticisms for LFA and limitatiof back-calculation procedures (Cailliet, 1990), theBGF derived from the combination of observed aack-calculated lengths for age 0.5 was chosen toesent growth for the species.
Although the Brazilian coast is not a spawnround, small specimens have been caught arounao Pedro–Sao Paulo Archipelago using handlines.ossible that young spawned in the Gulf of Guinea
ransported to this Archipelago by the southern Eqorial Current, which carries water westward andtronger in the fourth quarter of the year (Travasso
UFRPE/CEPENE/IBAMA). We are grateful to Noesca S.A., Programa Arquipelago de Sao Pedro e Saoaulo-(Ministerio da Marinha) and to Centro de E
ensao Pesqueira do Nordeste CEPENE/ IBAMA. Tuthors are indebted to Dr. Teodoro Vaske-Jr., Matia Freire and Fabio Higa. They also thank the cref N. Pq. Riobaldo and several students taking paata collection. Gratitude is owed to Dr. Paulo Travos as the ICCAT Statistics Representative. Varcolarships and Research grants were given byelho Nacional do desenvolvimento Cientıfico e Tec-ologico–CNPq.
eferences
lbaret, J.J., 1977. La reproduction de l’albacore (Thunnus albacares) dans le Golfe de Guinee. Cah. ORSTOM Ser. Oceanog18 (4), 389–419.
R. Lessa, P. Duarte-Neto / Fisheries Research 69 (2004) 157–170 169
Antoine, L., Mendoza, J., Cayre, P.M., 1983. Progress of age andgrowth assessment of Atlantic skipjack tuna,Euthynus pelamis,from dorsal fin spine. NOAA Tech. Rep. 8, 91–97.
Bard, F.X., 1984. Aspects de la croissance de l’albacore est Atlan-tique (Thunnus albacares) a partir de marquages. Coll. Vol. Sci.Pap. ICCAT 21, 108–114.
Bard, F.X., Scott, E.L., 1991. Sept traversees transatlantiquesd’albacores marques. Thons migrateurs ou sedentaires? Coll. Vol.Sci. Pap. ICCAT 36, 205–222, report of the yellowfin year pro-gram.
Bard, F.X., Chabanet, C., Caourder, N., 1991. Croissance du thonalbacore (Thunnus albacares) en Ocean Atlantique estimee parmarquages. Coll. Vol. Sci. Pap. ICCAT 36, 182–204, report ofthe yellowfin year program.
Bartoo, N.W., Parker, K.R., 1983. Reduction of bias generated byage-frequency estimation using von Bertalanffy growth equa-tion. In: Prince, E.D., Pulos, L.M. (Eds.), Proceedings of the In-ternational Workshop on Age Determination of Oceanic PelagicFishes: Tunas, Billfishes, and Sharks. NOAA Tech. Rep., pp.25–26.
Beamish, R.J., Fournier, D., 1981. A method for comparing the pre-cision of a set of age determinations. Can. J. Fish. Aquat. Sci. 38,982–983.
von Bertalanffy, L., 1938. A quantitative theory of organic growth.Human Biol. 10, 81–213.
Cailliet, G.M., 1990. Elasmobranch age determination and verifica-tion: an update review. In: Pratt, H.L., Gruber, S. H., Taniuchi,T. (Eds.), Elasmobranchs as Living Resources: Advances in theBiology, Ecology, Systematics and the Status of the Fisheries,NOAA Tech. Rep. 90, pp. 57–165.
Capisano, C., Fonteneau, A., 1991. Analise des frequences delongueur, du sex ratio, et des zones de reproduction de l’albacore,Thunnus albacares, de l’Atlantique. Coll. Vol. Sci. Pap. ICCAT36, 241–279, report of the yellowfin year Program.
Cayre, P., Diouf T., 1983. Estimating age and growth of little tunnysaldingsanicRep.
C par-an. J.
C ol. 2,oguedate.
C dor-
, Pu-p onshes
D eyeath-6–
Driggers III, W.B., Grego, J.M., Dean, J.M., 1999. Age and growth ofyellowfin tuna (Thunnus albacares) in the western north AtlanticOcean. Coll. Vol. Sci. Pap. ICCAT 123, 374–383.
Everhart, H.M., Youngs, W.D., 1992. Principles of Fishery Science,2nd ed. Cornell University Press, Ithaca, pp. 263.
Fontana, A., Fonteneau, A., 1978. Note sur les indices gonado-somatiques des albacores captures a la senne eta la palangre.Coll. Vol. Sci. Pap. ICCAT 7 (1), 67–72.
Fonteneau, A., 1980. Croissance de l’albacore (Thunnus albacares)de l’Atlantique Est. Coll. Vol. Sci. Pap. ICCAT 51, 152–167.
Fonteneau, A., 1991. La surexplotation du stock d’albacore en 1984:mythe ou realite? Coll. Vol. Sci. Pap. ICCAT 36 (1), 348–379.
Gaertner, D., Pagavino, M., 1991. Observations sur la croissance del’albacore (Thunnus albacares) dans l’ Atlantique Ouest. Coll.Vol. Sci. Pap. ICCAT 36, 479–505, report of the yellowfin yearProgram.
Gayanilo Jr., F.C., Sparre, P., Pauly, D., 1994. The FAO-ICLARMStock Assessment Tools FISAT User’s Guide. FAO Computer-ized Information Series Fisheries. No. 6. Rome. FAO., 186.
Gonzales-Garces, A. and Farina Perez A.C., 1983. Determining ageof young albacore (Thunnus alalunga) using dorsal spines. In:Prince, E.D., Pulos, L.M. (Eds.), Proceedings of the InternationalWorkshop on Age determination of Oceanic Pelagic Fishes: Tu-nas, Billfishes and Sharks, NOAA Tech. Rep. 8, 117–122.
Hazin, F.H.V., 1993. Fisheries Oceanographical Study on Tunas,Billfishes and Sharks in the Southwestern Equatorial AtlanticOcean, D.Sc. Thesis, Tokyo University of Fisheries, p. 286.
Le Guen, J.C., Sakagawa, G.T., 1973. Apparent growth of the yel-lowfin tuna from the eastern Atlantic Ocean. Fish. Bull. 85 (1),175–187.
Lessa, R.P., Coimbra, R., Hazin, F.H.V., Souza, R., 1993. Premieresetudes sur la reproduction du thon jauneThunnus albacaresdel’Atlantique equatorial sudouest. Coll. Vol. Sci. Pap. ICCAT 40(2), 126–136.
Lessa, R.P., Mafalda Jr., P.O., Advıncula, J.L., Luccezi, R., Bezerrabun-ast-
M finColl.ear
M com-(4),
M core.
M Ek-.S.,, Sala,.G.,us fishific
M esti-AT
(Euthynnus alleteratus) of the coast of Senegal using dorspines sections. In: Prince, E.D., Pulos, L.M. (Eds.), Proceeof the International Workshop on Age determination of OcePelagic Fishes: Tunas, Billfishes and Sharks, NOAA Tech.8, 105–110.
errato, R.M., 1990. Interpretable statistical test for growth comisons using parameters in the von Bertalanffy equation. CFish. Aquat. Sci. 47, 1416–1426.
ollette, B.B., Nauen, C.E., 1983. FAO Species catalogue, vScombrids of the world: an annotated and illustrated catalof tunas mackerels, bonitos and related species known toFAO Fish. Synop. 125, 137.
ompean-Jimenez, G., Bard, F.X., 1983. Growth increments onsal spines of eastern Atlantic bluefin tuna,Thunnus thynnusandtheir possible relation to migration patterns, In: Prince, E.D.los, L.M. (Eds.), Proceedings of the International WorkshoAge determination of Oceanic Pelagic Fishes: Tunas, Billfiand Sharks, NOAA Tech. Rep. 8, pp. 77–86.
raganick, B., Pelczarski, W., 1984. Growth and age of bigand yellowfin tuna in the central Atlantic as per data gered by R/V Wieczno. Coll. Vol. Sci. Pap. ICCAT 30, 9103.
Jr., R., Vaske Jr., Hellebrandt, T., 1999. Distribution and adance atIchthyoneustonat seamounts and islands off northeern Brazil. Arch. Fish. Mar. Res. 47 (2/3), 133–144.
anooch, C.S., J. Hinkley, A., 1991. Age and growth of yellowtuna from the eastern Atlantic using otoliths and vertebrae.Vol. Sci. Pap. ICCAT 36, 515–522, report of the yellowfin yprogram.
atsuura, Y., Sato, G., 1981. Distribution and abundance of sbrid larvae in southern brazilian waters. Bull. Mar. Sci. 31824–832.
egalofonou, P., 2000. Age and growth of Mediterranean albaJ. Fish. Biol. 57, 700–715.
usick, J.A., Harbin, M.M., Berkeley, S.A., Burgess, G.H.,lund, A.M., Findley, L., Gilmore, R.G., Golden, J.T., Ha, DHuntsman, G.R., McGovern, J.C., Parker, S.J., Poss, S.G.E., Schmidt, T.W., Sedberry, G.R., Weeks, H., Wright, S2000. Endangered species, marine estuarine, and diadromostocks at risk of extinction in North America exclusive of pacsalmonids. Fish 25 (11), 6–30.
yabe, N., 1983. On the growth of yellowfin and bigeye tunamated from the tagging results. Collective Vol. Sci. Pap. ICC20 (1), 117–122.

170 R. Lessa, P. Duarte-Neto / Fisheries Research 69 (2004) 157–170
Natanson, L.J., Casey, J.G., Kholer, N.E., 1995. Age and growth es-timates for the dusky sharkCarcharhinus obscurusin the westernnorth Atlantic Ocean. Fish Bull. 93, 116–126.
Newman, S.J., Dunk, I.J., 2003. Age validation, growth, mortality,and additional population parameters of the goldband snapper(Pristipomoidesmultidens) off the Kimberley coast of northwest-ern Australia. Fish Bull. 101 (1), 116–128.
Potts, J.C., Manooch, C.S., 2002. Estimated ages of red porgy (Pagruspagrus) from fishery-dependent and fishery-independent data anda comparison of growth parameters. Fish Bull. 100 (1), 81–89.
Prager, M.M., Saila, S.B., Reckseck, C.W., 1987. FISHPARM: amicrocomputer program for parameter estimation of non-linearmodels in fishery science, Tech. Rep. No. 87-10, Departmentof Oceanography, Old Dominium University, Norfolk, VA, pp.1–37.
Scoles, D.R., Graves, J.E., 1993. Genetic analysis of the populationof the population structure of yellowfin tuna (Thunnus albacares)from the Pacific Ocean. Fish. Bull. 91, 690–698.
Stequert, B., Panfili, J., Dean, J.M., 1996. Age and growth of yel-lowfin tuna (Thunnus albacares) from the western Indian Ocean,based on otolith microsctructure. Fish. Bull. 94, 124–134.
Stretta, M., Petit, M., Simier, M., 1990. Integration de teledetectionaerospatiale dans la base de donnees d’un systeme expert dediea la peche thoniere. Bull. Inst. Oceanog. 6, 199–207.
Sun, C., Huang, C., Yeh, S., 2001. Age and growth of the bigeye tuna(Thunnus obesus) in the western Pacific Ocean. Fish. Bull. 99,502–509.
Suzuki, Z., Warashima, Y., Kishida, M., 1977. The comparison ofcatches by regular and deep tuna longline gears in the westernand central equatorial Pacific. Bull. Far Seas Fish Res. Lab. 15,51–89.
Travassos, P.F., 1999. L’etude des relations thons-environnementdans l’Ocean Atlantique intertropical Ouest: Cas de l’albacore(Thunnus albacaresBonnaterre 1788), du Germon (Thun-nus alalungaBonnaterre 1758) et du thon obese (ThunnusobesusLowe 1839), D.Sc. Thesis, Universite de Paris VI,p. 253.
Travassos, P.F., Hazin, H.V., Zagaglia, J.R., Adivıncula, R., Schober,J., 1999. Thermohaline structure around seamounts and islandsoff north-eastern Brasil. Arch. Fish. Mar. Res. 47 (2/3), 211–222.
Vieira, M.H. Santa Rita., 1991. Saison de ponte et sex-ratio des al-bacores captures au Cap Vert. Coll. Vol. Sci. Pap. ICCAT 36,564–584.
Yabuta, Y., Yukinawa, M., Warashima, Y., 1960. Growth and age ofyellowfin tuna 2: age determination (scale method). Rep. NankaiReg. Fish. Res. Lab. 12, 63–74.
Yang, R.T., Nose, Y., Hiyama, Y., 1969. A comparative study on theage and growth of yellowfin tunas from the Pacific and AtlanticOceans. Bull. Far Seas Fish Res. Lab. 2, 1–20.
Zavala-Camin, L.A., 1978. Algunos aspectos sobre la estrutura pop-ulacional del rabil (Thunnus albacares) en el Sudeste y Surdel Brasil (1969–1977), con presentation de la hypotesis dela migracion semestral. Bol. Inst. Pesca. Sao Paulo 5 (1), 1–25.
Zavala-Camin, L.A., 1981. Habitos alimentares e distribuic¸ao dosatuns e afins (Osteichthyes teleostei) e suas relac¸oes ecologicascom outras especies pelagicas das regioes Sudeste e Sul do Brasil.D.Sc. Tese., Universidade de Sao Paulo, Instituto de Biociencias,237 p.