Heat transfer in transections of thermoregulating bigeye tuna (Thunnus obesus
11
3708 INTRODUCTION Tuna are highly specialized predatory fish with a unique assembly of anatomical, physiological and biochemical adaptations. Numerous studies have investigated these specializations such as fusiform body shape, thunniform swimming mode, capacity to conserve metabolic heat in red muscle, elevated metabolic and physiological rate functions, and a frequency-modulated cardiac output (Carey et al., 1984; Stevens and McLeese, 1984; Graham and Dickson, 2000; Lowe et al., 2000; Altringham and Shadwick, 2001; Brill and Bushnell, 2001; Gunn and Block, 2001; Katz et al., 2001; Sepulveda et al., 2003; Blank et al., 2004). In particular, the ability to conserve metabolically produced heat due to centralized red muscle and the presence of well-developed vascular countercurrent heat exchangers (also known as ‘retes’) has been thoroughly investigated (e.g. Carey et al., 1971; Mathieu-Costello et al., 1992; Block et al., 1993; Holland and Sibert, 1993; Dewar et al., 1994; Graham and Dickson, 2001; Korsmeyer and Dewar, 2001). Most attention has been focused on the heat exchangers associated with the red muscle fiber portions of the myotomes (herein referred to as ‘red muscle’). However, the white muscle fiber portions of the myotomes (herein referred to as ‘white muscle’) account for approximately 45–55% of total body mass (Graham et al., 1983; Freund, 1999) and the potential significance of the capacity of white muscle to produce and conserve heat remains largely unexplored. A growing body of evidence confirms the ability of tuna to modulate muscle temperature by physiological thermoregulation or by a combination of physiological adjustments and behavior. This allows these fishes to appropriately adjust rates of body temperature change in the face of rapid ambient temperature changes induced by their extensive daily vertical excursions (Dewar et al., 1994; Graham and Dickson, 2001; Malte et al., 2007). It has been demonstrated that free-ranging bigeye tuna can change their whole- body thermal conductivity (as expressed by heating and cooling rates) by a factor of 100–1000 during vertical excursions (Holland and Sibert, 1993; Musyl et al., 2003). Modeling these observations in a two-compartment lumped parameter model further defined the ability of bigeye tuna to maintain elevated red muscle temperatures through behavioral and physiological means (Malte et al., 2007). The simple non-dimensional model described by Malte and colleagues (Malte et al., 2007) did not, however, distinguish between the different tissues in the tuna (the red muscle temperature referred to is just an overall elevated body temperature). Hence the model cannot reveal where in the body the heat is produced or conserved. Carey and Teal (Carey and Teal, 1966) and Carey (Carey, 1973) confirmed the presence of an advanced countercurrent heat exchanger in red muscle when examining bigeye tuna, but they also describe, ‘...bands of alternate arteries and veins running into the light [i.e. white] muscle. These bands are widest and most numerous near the lateral vessels, where they may be 20 vessels The Journal of Experimental Biology 212, 3708-3718 Published by The Company of Biologists 2009 doi:10.1242/jeb.031427 Transectional heat transfer in thermoregulating bigeye tuna (Thunnus obesus) – a 2D heat flux model Jess Boye 1 , Michael Musyl 2 , Richard Brill 3, * and Hans Malte 1,† 1 Department of Zoophysiology, Institute of Biological Sciences, University of Aarhus, Denmark, 2 Joint Institute for Marine and Atmospheric Research, Pelagic Fisheries Research Program, University of Hawaii at Manoa, Honolulu, HI 96822, USA and 3 Cooperative Marine Education and Research Program, Northeast Fisheries Science Center, National Marine Fisheries Service, NOAA, Woods Hole, MA 02543, USA *Present address: Virginia Institute of Marine Science, Gloucester Point, VA 23062, USA † Author for correspondence ([email protected]) Accepted 6 August 2009 SUMMARY We developed a 2D heat flux model to elucidate routes and rates of heat transfer within bigeye tuna Thunnus obesus Lowe 1839 in both steady-state and time-dependent settings. In modeling the former situation, we adjusted the efficiencies of heat conservation in the red and the white muscle so as to make the output of the model agree as closely as possible with observed cross-sectional isotherms. In modeling the latter situation, we applied the heat exchanger efficiencies from the steady-state model to predict the distribution of temperature and heat fluxes in bigeye tuna during their extensive daily vertical excursions. The simulations yielded a close match to the data recorded in free-swimming fish and strongly point to the importance of the heat- producing and heat-conserving properties of the white muscle. The best correspondence between model output and observed data was obtained when the countercurrent heat exchangers in the blood flow pathways to the red and white muscle retained 99% and 96% (respectively) of the heat produced in these tissues. Our model confirms that the ability of bigeye tuna to maintain elevated muscle temperatures during their extensive daily vertical movements depends on their ability to rapidly modulate heating and cooling rates. This study shows that the differential cooling and heating rates could be fully accounted for by a mechanism where blood flow to the swimming muscles is either exclusively through the heat exchangers or completely shunted around them, depending on the ambient temperature relative to the body temperature. Our results therefore strongly suggest that such a mechanism is involved in the extensive physiological thermoregulatory abilities of endothermic bigeye tuna. Key words: 2D model, archival tag, endothermy, isotherm, mathematical modeling, partial differential equation, temperature gradient, vascular countercurrent heat exchanger, white muscle, tuna. THE JOURNAL OF EXPERIMENTAL BIOLOGY
-
Upload
independent -
Category
Documents
-
view
1 -
download
0
Transcript of Heat transfer in transections of thermoregulating bigeye tuna (Thunnus obesus

3708
INTRODUCTIONTuna are highly specialized predatory fish with a unique assemblyof anatomical, physiological and biochemical adaptations.Numerous studies have investigated these specializations such asfusiform body shape, thunniform swimming mode, capacity toconserve metabolic heat in red muscle, elevated metabolic andphysiological rate functions, and a frequency-modulated cardiacoutput (Carey et al., 1984; Stevens and McLeese, 1984; Grahamand Dickson, 2000; Lowe et al., 2000; Altringham and Shadwick,2001; Brill and Bushnell, 2001; Gunn and Block, 2001; Katz etal., 2001; Sepulveda et al., 2003; Blank et al., 2004). In particular,the ability to conserve metabolically produced heat due tocentralized red muscle and the presence of well-developed vascularcountercurrent heat exchangers (also known as ‘retes’) has beenthoroughly investigated (e.g. Carey et al., 1971; Mathieu-Costelloet al., 1992; Block et al., 1993; Holland and Sibert, 1993; Dewaret al., 1994; Graham and Dickson, 2001; Korsmeyer and Dewar,2001). Most attention has been focused on the heat exchangersassociated with the red muscle fiber portions of the myotomes(herein referred to as ‘red muscle’). However, the white musclefiber portions of the myotomes (herein referred to as ‘whitemuscle’) account for approximately 45–55% of total body mass(Graham et al., 1983; Freund, 1999) and the potential significanceof the capacity of white muscle to produce and conserve heatremains largely unexplored.
A growing body of evidence confirms the ability of tuna tomodulate muscle temperature by physiological thermoregulation orby a combination of physiological adjustments and behavior. Thisallows these fishes to appropriately adjust rates of body temperaturechange in the face of rapid ambient temperature changes inducedby their extensive daily vertical excursions (Dewar et al., 1994;Graham and Dickson, 2001; Malte et al., 2007). It has beendemonstrated that free-ranging bigeye tuna can change their whole-body thermal conductivity (as expressed by heating and coolingrates) by a factor of 100–1000 during vertical excursions (Hollandand Sibert, 1993; Musyl et al., 2003). Modeling these observationsin a two-compartment lumped parameter model further defined theability of bigeye tuna to maintain elevated red muscle temperaturesthrough behavioral and physiological means (Malte et al., 2007).The simple non-dimensional model described by Malte andcolleagues (Malte et al., 2007) did not, however, distinguish betweenthe different tissues in the tuna (the red muscle temperature referredto is just an overall elevated body temperature). Hence the modelcannot reveal where in the body the heat is produced or conserved.
Carey and Teal (Carey and Teal, 1966) and Carey (Carey, 1973)confirmed the presence of an advanced countercurrent heatexchanger in red muscle when examining bigeye tuna, but theyalso describe, ‘...bands of alternate arteries and veins running intothe light [i.e. white] muscle. These bands are widest and mostnumerous near the lateral vessels, where they may be 20 vessels
The Journal of Experimental Biology 212, 3708-3718Published by The Company of Biologists 2009doi:10.1242/jeb.031427
Transectional heat transfer in thermoregulating bigeye tuna (Thunnus obesus) – a 2D heat flux model
Jess Boye1, Michael Musyl2, Richard Brill3,* and Hans Malte1,†
1Department of Zoophysiology, Institute of Biological Sciences, University of Aarhus, Denmark, 2Joint Institute for Marine andAtmospheric Research, Pelagic Fisheries Research Program, University of Hawaii at Manoa, Honolulu, HI 96822, USA and
3Cooperative Marine Education and Research Program, Northeast Fisheries Science Center, National Marine Fisheries Service,NOAA, Woods Hole, MA 02543, USA
*Present address: Virginia Institute of Marine Science, Gloucester Point, VA 23062, USA†Author for correspondence ([email protected])
Accepted 6 August 2009
SUMMARYWe developed a 2D heat flux model to elucidate routes and rates of heat transfer within bigeye tuna Thunnus obesus Lowe 1839in both steady-state and time-dependent settings. In modeling the former situation, we adjusted the efficiencies of heatconservation in the red and the white muscle so as to make the output of the model agree as closely as possible with observedcross-sectional isotherms. In modeling the latter situation, we applied the heat exchanger efficiencies from the steady-state modelto predict the distribution of temperature and heat fluxes in bigeye tuna during their extensive daily vertical excursions. Thesimulations yielded a close match to the data recorded in free-swimming fish and strongly point to the importance of the heat-producing and heat-conserving properties of the white muscle. The best correspondence between model output and observeddata was obtained when the countercurrent heat exchangers in the blood flow pathways to the red and white muscle retained 99%and 96% (respectively) of the heat produced in these tissues. Our model confirms that the ability of bigeye tuna to maintainelevated muscle temperatures during their extensive daily vertical movements depends on their ability to rapidly modulate heatingand cooling rates. This study shows that the differential cooling and heating rates could be fully accounted for by a mechanismwhere blood flow to the swimming muscles is either exclusively through the heat exchangers or completely shunted around them,depending on the ambient temperature relative to the body temperature. Our results therefore strongly suggest that such amechanism is involved in the extensive physiological thermoregulatory abilities of endothermic bigeye tuna.
Key words: 2D model, archival tag, endothermy, isotherm, mathematical modeling, partial differential equation, temperature gradient, vascularcountercurrent heat exchanger, white muscle, tuna.
THE JOURNAL OF EXPERIMENTAL BIOLOGY

3709Modeling heat fluxes in bigeye tuna
wide, but decrease to triads of artery–vein–artery toward theventral and dorsal midlines’. The presence of a simplecountercurrent heat exchanger in the white muscle reported inthe early literature clearly provides evidence for the potential roleof the white muscle in heat conservation and thermoregulation.We therefore decided to investigate the heat flux in differentregions in the bigeye tuna. Because it is cumbersome to obtaindirect measurements of the body temperature of tuna in motion(Dewar et al., 1994; Holland and Sibert, 1993), and because noexperiment has so far elucidated the transectional heat fluxes ofany tuna, we decided to address these questions throughmathematical modeling of heat flux. The questions we specificallyaddressed were: (1) does the white muscle contribute to theconservation of heat? (2) If so, is this conservation evennoticeable? By developing a 2D model, we were able to simulatethe heat flux and accurately predict temperature measurementsmade in free-swimming tuna, thereby acquiring a more profoundunderstanding of the precise mechanisms responsible for thethermoregulatory abilities in this species. Our approach alsoenabled us to investigate a variety of features, including qualifyingand quantifying the significance of the white muscle with respectto heat transfer and thermoregulation. We also determined theroutes of heat loss, the possible extent of the modulation of heattransfer rates, and the role of body size.
MATERIALS AND METHODSTo explore the behavioral and physiological thermoregulatorycapacities of bigeye tuna, two different models and related sets ofdata were required. (1) A steady-state model simulating thetransectional heat flux through the tuna’s heat-producing tissues andheat-conserving modes. (2) A non-steady-state time-dependentmodel simulating the events associated with bigeye tuna’s dailyvertical movements. For the former we used data on isotherms ina cross-section of a bigeye tuna from Carey and Teal (Carey andTeal, 1966). For the latter we employed data on body temperature,water temperature and depth in free-ranging bigeye tuna from Musylet al. (Musyl et al., 2003). In brief, Carey and Teal (Carey and Teal,1966) caught bigeye tuna on long-line fishing gear during the winterof 1965–66 in the western North Atlantic and the eastern SouthPacific. Once on board, the fish were sedated and the gills wereperfused with sea water at low pressure while an irrigation systemkept the fish at sea water temperature. For the next 3h temperaturemeasurements were made with thermistors. These probes wereinserted into the muscle at a number of locations and isotherms weredrawn by hand. Musyl et al. (Musyl et al., 2003) captured 87 bigeyetuna by conventional long-line gear and by rod and reel near themain Hawaiian Islands from April 1998 to April 2001. On boardWildlife Computers (Redmond, WA, USA) archival tags wereimplanted through a 1–1.5cm incision into the peritoneal cavity andplaced approximately as illustrated by the black circle in Fig.1B.The tags sampled data on four channels every 60s: depth, light,internal and external temperature. Post-operationally the fish werereleased and the data were downloaded from the tags from recapturedtuna.
ModelingTo analyze the cross-sectional isotherms and the time-dependenttemperature changes, we developed a 2D heat flux model of a cross-section of a bigeye tuna. The model included the followingassumptions.(1) The thermal properties of tissues/organs (muscle, bone, gut, etc.)differ but are identical everywhere within any tissue/organ.
(2) The given cross-section is representative for the entire tuna [i.e.the tuna is ‘infinite’ in length (the z-coordinate) and does not altershape].(3) There is a non-directional, uniform convective heat transfer tothe environment by the blood. This heat transfer is modified by thepresence of vascular heat exchangers.(4) There is no significant thermal boundary layer and the skintemperature is uniform and everywhere equal to the ambient watertemperature.(5) The heat flux of the cross-section is symmetrical across thevertical axis of the tuna (i.e. the net heat flux across this symmetryline is zero).(6) All energy liberated in metabolism is eventually converted intoheat.Heat dissipation through the tuna (and thus through the cross-section)follows Fourier’s law of heat conduction. This results in a second-order partial differential equation:
The last term in Eqn 1 holds for the 2D homogeneous case withconstant thermal diffusivity. Inclusion of the metabolic heatproduced within the body of the tuna and the convective loss bythe blood, which is cooled in the gills, yields the following equation:
where Tp is temperature production, i.e. the rate of change intemperature due to heat production (°Cs–1, see Appendix), Tb isbody temperature at a given coordinate (°C), Tw is water temperature(°C), K/(cp) is thermal diffusivity (cm2s–1), K is thermal
∂Tb
∂t= ∇ ⋅ κ∇Tb( ) = κ
∂2Tb
∂x2+
∂2Tb
∂y2
⎛⎝⎜
⎞⎠⎟
. (1)
∂Tb
∂t= ∇ ⋅ κ∇Tb( ) + �Tp − ϕ Tb − Tw( ) 1− ε( ) , (2)
A B
Fig.1. The real cross-section of the bigeye tuna (A) and the modeledcross-section (B) showing the outline of the different domains: red muscle(purple), white muscle (red), gut (blue), rete (green), temperature sensor(black) and bone (cyan).
THE JOURNAL OF EXPERIMENTAL BIOLOGY
3710
conductivity (Js–1cm–1°C–1), is density (gcm–3), cp is specific heatcapacity (Jg–1°C–1), cp is the heat capacitance coefficient(Jcm–3°C–1), is heat exchanger efficiency (dimensionless),vb(blood/muscle) is the convective cooling rate constant (s–1), vbis specific blood flow (cm3
bloods–1cm–3muscle), t is time, � is the gradient
operator, �� is the divergence operator. A derivation of the equationand a more detailed account of the meaning of the operators andthe different terms are given in the Appendix.
Because second-order non-linear partial differential equations arevirtually impossible to solve analytically, this was accomplishedvia numerical analysis by the methods of finite elements using thecommercial software package FlexPDE® (PDE Solutions, Inc., CA,USA).
The steady-state modelAt a sea water temperature of 20°C (Tw), the 70kg bigeye tunapresented in Carey and Teal (Carey and Teal, 1966) had a bodytemperature (Tb) of 32°C in the center of the red muscle. The highestTb was found deep in the lateral muscle behind the pectoral fin,which is the thickest part of the fish. We developed a model topredict the isotherms of the cross-section of this fish.
We estimated body depth (the vertical distance, i.e. height of thefish in a transection at the thickest part of the body) relative to forklength and body mass by applying a geometric model of tuna bodyshape developed by Magnuson and Weininger (Magnuson andWeininger, 1978). We calculated fork length to be 144cm (basedon the relationship between body mass (M) and fork length (L) inbigeye tuna: M0.00961L3.18) and body depth to be 42.8cm. Oncethe scale was in place, the construction of the shape of the cross-
J. Boye and others
section was accomplished using a spline function. To account forall thermally conductive regions of the body, the respective domainswere implemented in the model (Fig.1) and boundary conditionswere specified. Each region was assigned a specific thermal property(Table1). In a highly vascularized tissue such as the red muscle thenatural convective fluctuations in the xy-coordinate direction dueto blood flow could be expected to increase the effective thermaldiffusivity, . However, experiments on tissue thermal conductivityperformed on rats indicated that the contribution of blood flow tothermal diffusivity is negligible (Song et al., 1999; Cheng et al.,2002).
The volume-specific heat production in muscle was determinedfrom the maximum oxygen consumption (VO2max), 2700mgO2kg–1h–1 (Bushnell and Brill, 1991; Dewar and Graham, 1994),assuming all the energy extracted from the oxygen is eventuallyconverted into metabolic heat (i.e. hpVO2�calorific coefficient ofO2). The maximum metabolic rate was selected in order to assessthe maximal heat production, thus setting the lower limit for theestimated heat exchanger efficiencies. The volume-specific heatproduction in the red and white muscle was calculated from theaverage heat production and the relative area contributions of thetwo types of muscle by assuming their ratio was equal to the ratioof capillarity in the respective tissues (5.3�2880mm–2/543mm–2)(from Mathieu-Costello et al., 1992). The specific blood flow in theconvective cooling rate constant was calculated from:
The oxygen-carrying capacity was set at 0.16ml O2cm–3blood (Malte
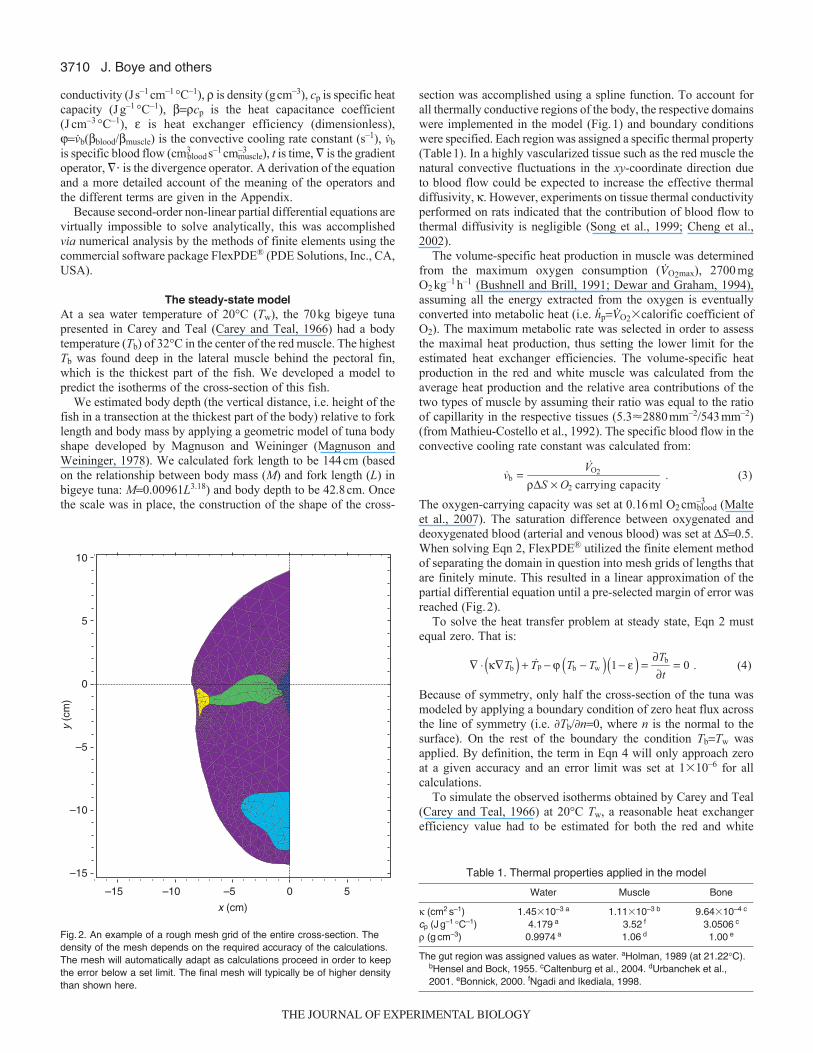
et al., 2007). The saturation difference between oxygenated anddeoxygenated blood (arterial and venous blood) was set at S0.5.When solving Eqn 2, FlexPDE® utilized the finite element methodof separating the domain in question into mesh grids of lengths thatare finitely minute. This resulted in a linear approximation of thepartial differential equation until a pre-selected margin of error wasreached (Fig.2).
To solve the heat transfer problem at steady state, Eqn 2 mustequal zero. That is:
Because of symmetry, only half the cross-section of the tuna wasmodeled by applying a boundary condition of zero heat flux acrossthe line of symmetry (i.e. �Tb/�n0, where n is the normal to thesurface). On the rest of the boundary the condition TbTw wasapplied. By definition, the term in Eqn 4 will only approach zeroat a given accuracy and an error limit was set at 1�10–6 for allcalculations.
To simulate the observed isotherms obtained by Carey and Teal(Carey and Teal, 1966) at 20°C Tw, a reasonable heat exchangerefficiency value had to be estimated for both the red and white
�vb =�VO2
ρΔS × O2 carrying capacity . (3)
∇ ⋅ κ∇Tb( ) + �Tp − ϕ Tb − Tw( ) 1− ε( ) =∂Tb
∂t= 0 . (4)
x (cm)
–15 –10 –5 0 5
y (c
m)
–15
–10
–5
0
5
10
Fig.2. An example of a rough mesh grid of the entire cross-section. Thedensity of the mesh depends on the required accuracy of the calculations.The mesh will automatically adapt as calculations proceed in order to keepthe error below a set limit. The final mesh will typically be of higher densitythan shown here.
Table 1. Thermal properties applied in the model
Water Muscle Bone
(cm2s–1) 1.45�10–3 a 1.11�10–3 b 9.64�10–4 c
cp (Jg–1°C–1) 4.179 a 3.52 f 3.0506 c
(gcm–3) 0.9974 a 1.06 d 1.00 e
The gut region was assigned values as water. aHolman, 1989 (at 21.22°C).bHensel and Bock, 1955. cCaltenburg et al., 2004. dUrbanchek et al.,2001. eBonnick, 2000. fNgadi and Ikediala, 1998.
THE JOURNAL OF EXPERIMENTAL BIOLOGY

3711Modeling heat fluxes in bigeye tuna
muscle. The estimated value was considered satisfactory if themodeled isotherms closely resembled the experimentally determinedisotherms.
The time-dependent modelBigeye tuna descend at dawn to depths of 300–500m and makeregular upward excursions into the warmer surface layer, then ascendat dusk to remain at the surface layer until the following dawn (Musylet al., 2003). The upward excursions are made in order to warm thebody rapidly. The fish then descends while retaining the newlygained heat. Fish 241 (from Musyl et al., 2003) was selected becauseit clearly demonstrated this vertical movement pattern characteristicof bigeye tuna (Fig.3).
The non-steady-state model was based on a modification of thesteady-state model. The time dependency relied on the fact that Tw(and therefore also Tb) varies in time as the tuna descends andascends, thus altering the model into a non-steady-state problem.The processed external (Tw) temperature data from the archival tagof Fish 241 were imported into the model and these were used inEqn 2 so that TwTw(t) during its solution. The shape of the 2Dcross-section of the bigeye tuna was set as identical to the steady-state model, but the dimensions were resized to fit the physicalproportions of Fish 241. The calculations on the new dimensionswere based on the formerly presented geometric model. Fish 241had a fork length of 79cm and a body mass of 10.3kg, yielding amodeled body depth and body mass of 23.5cm and 10.4kg,respectively. The model was designed to allow for scaling with theplacement of the internal organs preserved. A sensor region wasintroduced to the model to simulate the actual sensor position of
the archival tag. As in Musyl et al. (Musyl et al., 2003) it was placedin the visceral cavity (Figs1 and 2) and given an equivalentdimension.
An imitated shunt mechanism was implemented to allow foractive thermoregulation. The shunt mechanism was assumed todirect the blood flow either: (1) through the countercurrent heatexchangers (hence conserving metabolically produced heat) or (2)around the countercurrent heat exchangers (possibly by passing theblood through the dorsal aorta and post-cardinal vein). This is aplausible route of active thermoregulation in the bigeye tuna assuggested by Malte et al. (Malte et al., 2007). We chose to use onlythe simplest possible mode of thermoregulation: either all the bloodflow is through the exchanger or all the blood is bypassing theexchanger. This was achieved in the model by letting the efficiency() of the heat exchanger vary according to:
fit (1 – f) , (5)
where fit is the heat exchanger efficiency fitted from the steady-state model and f is the fraction of blood bypassing the rete. Theshunt fraction is then varied according to:
Thus in Eqn 5 attains a high value whenever Tw<Tb, and a lowvalue whenever Tw>Tb. The oxygen consumption was assumed tohave either of two values – a ‘resting’ and an active value (i.e. atwo-state diurnal metabolism). When in nocturnal swimming mode,the bigeye tuna display a reduced vertical swimming activity,
f =fhigh for Tw − Tb > 0
flow for Tw − Tb < 0
⎧⎨⎪
⎩⎪ . (6)
0
5
10
15
20
25
30
Tem
pera
ture
(°C
)
0 20 40 60 80 100
Tb sensor TwDay
600
500
400
300
200
100
0
Dep
th (
m)
0 20 40 60 80 100
Time (h)
A
B
Fig.3. A representative time segment of dailyexcursions of Fish 241. (A)Water (Tw) and sensor(Tb sensor) temperature records. (B)Thecharacteristic W-shaped vertical movement patternsof bigeye tuna during the daytime.
THE JOURNAL OF EXPERIMENTAL BIOLOGY
3712
therefore referred to here as ‘resting’. They swim in the horizontalplan, possibly to catch prey, while maintaining the minimum speedrequired to ram ventilate and avoid sinking. At dawn, the fish entersan active swimming mode, descending to greater depths and theneither feeding or swimming to the surface and down again,increasing its oxygen consumption. Calculations of the verticalswimming speed based on the depth data exhibited a clearconsistency with the assumption of low cruising mode at night withlow swimming speeds, and an active swimming mode during theday with high swimming speeds (Fig.3). Hence the shift in oxygenconsumption was modeled based on the day/night cycle, simply as:
where x is an array in which daytime is given the number 1 and 0is for night-time. VO2rest was set at a routine metabolic rate of 540mgO2kg–1h–1 (Freund, 1999). Thermal properties, heat production hpand the fitted heat-conserving efficiency (fit) for red and whitemuscle from the steady-state model were applied. The model wasconsidered satisfactory if it predicted values of Tb at the sensor regionthat intimately followed the Tb values recorded by the sensor tagand the adjusted parameter was now the shunt fraction (Eqn 5).
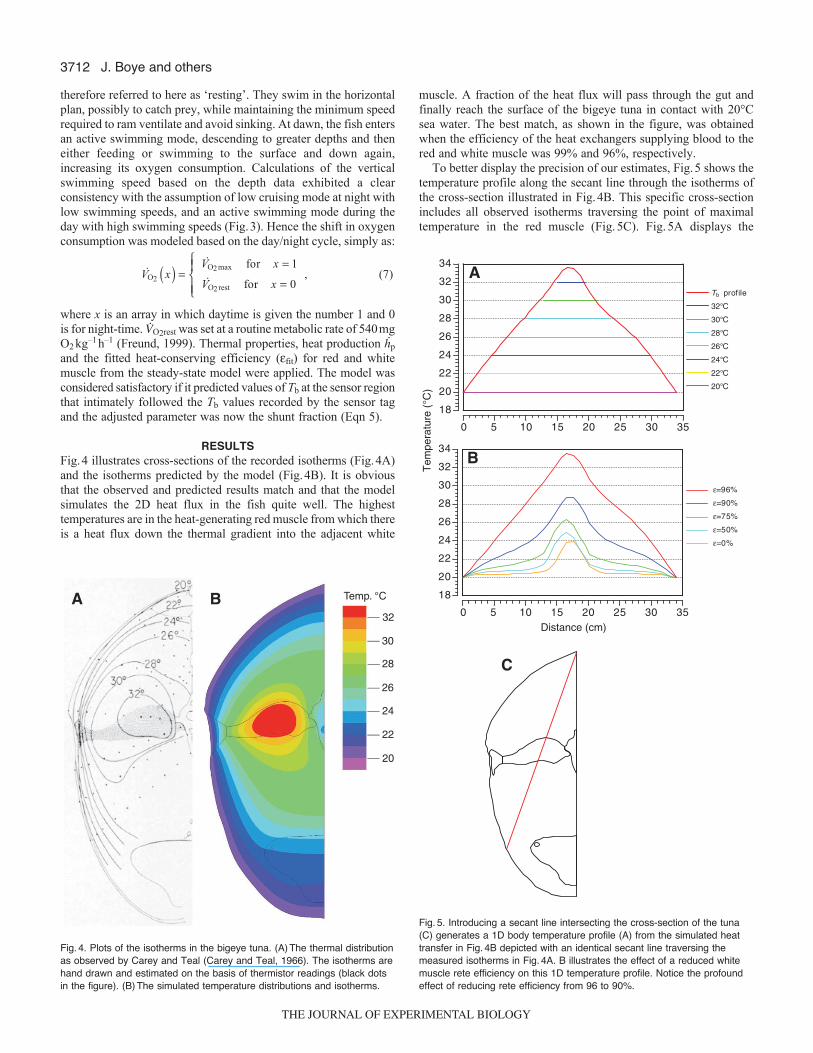
RESULTSFig.4 illustrates cross-sections of the recorded isotherms (Fig.4A)and the isotherms predicted by the model (Fig.4B). It is obviousthat the observed and predicted results match and that the modelsimulates the 2D heat flux in the fish quite well. The highesttemperatures are in the heat-generating red muscle from which thereis a heat flux down the thermal gradient into the adjacent white
�VO2 x( ) =�VO2max for x = 1
�VO2rest for x = 0, (7)
⎧⎨⎪
⎩⎪
J. Boye and others
muscle. A fraction of the heat flux will pass through the gut andfinally reach the surface of the bigeye tuna in contact with 20°Csea water. The best match, as shown in the figure, was obtainedwhen the efficiency of the heat exchangers supplying blood to thered and white muscle was 99% and 96%, respectively.
To better display the precision of our estimates, Fig.5 shows thetemperature profile along the secant line through the isotherms ofthe cross-section illustrated in Fig.4B. This specific cross-sectionincludes all observed isotherms traversing the point of maximaltemperature in the red muscle (Fig.5C). Fig.5A displays the
32
30
28
26
24
22
20
Temp. °CA B
Fig.4. Plots of the isotherms in the bigeye tuna. (A)The thermal distributionas observed by Carey and Teal (Carey and Teal, 1966). The isotherms arehand drawn and estimated on the basis of thermistor readings (black dotsin the figure). (B)The simulated temperature distributions and isotherms.
18
20
22
24
26
28
30
32
34
Tem
pera
ture
(°C
)0 5 10 15 20 25 30 35
Tb profile
32°C
30°C
28°C
26°C
24°C
22°C
20°C
A
18
20
22
24
26
28
30
32
34
0 5 10 15 20 25 30 35Distance (cm)
ε=96%
ε=90%
ε=75%
ε=50%
ε=0%
B
C
Fig.5. Introducing a secant line intersecting the cross-section of the tuna(C) generates a 1D body temperature profile (A) from the simulated heattransfer in Fig.4B depicted with an identical secant line traversing themeasured isotherms in Fig.4A. B illustrates the effect of a reduced whitemuscle rete efficiency on this 1D temperature profile. Notice the profoundeffect of reducing rete efficiency from 96 to 90%.
THE JOURNAL OF EXPERIMENTAL BIOLOGY

3713Modeling heat fluxes in bigeye tuna
smoothly fitting curvature of the predicted body temperature profileand the isotherms recorded by Carey and Teal (Carey and Teal,1966). This close fit was only achieved using the above-mentionedheat exchanger efficiencies. The deviations of the modeled Tb profileare not considerably different from the observed isotherms, whendisregarding the outlier at the 26°C isotherm. Fig.5B shows thesignificance of a high degree of heat conservation in the whitemuscle. It is clear that only at white96% is it possible to recreatethe observed isotherms (red being fixed at 99%), thus stressing theimportance of heat conservation in the white muscle. The impactof the high efficiency rete in the blood supply to the white musclecan be seen when comparing the 90% curve (blue) and 96% curve(red). The integrated area under the 96% curve is almost twice aslarge (235/1251.88) as the area under the 90% curve.
To further explore the consequence of an absence of a rete in theblood supply to the white muscle (white0%), we plotted thetemperature distribution in the 2D cross-section (Fig.6). Thetemperature distribution is very different from that in Fig.4B. Anyheat produced in the white muscle will rapidly be lost via theconvective blood flow resulting in ‘lumps’ of isotherms at theboundary of the red muscle. Even though the efficiency of the retein the red muscle is maintained at 99%, the warmest point is only26°C as opposed to 32°C in Fig.4. We thus conclude that the hightemperatures and isothermal distribution observed by Carey and Teal(Carey and Teal, 1966) require the presence of an effectivecountercurrent heat exchanger in the vascular system supplyingblood to white muscle.
To quantify the loss of heat across the surface of the fish, theheat flux vectors (Fig.7A) at the periphery were integrated (Fig.7B).This yielded a surface heat loss of 0.622Js–1cm–1 at a total heat
production of 1.886Js–1cm–1 (i.e. surface heat loss accounts forapproximately 33% of total heat production). Despite the relativelyhigh efficiencies of the vascular countercurrent heat exchanger(red99%, white96%), approximately two-thirds of the heatproduced is still lost via the gills. If red and white were 100%, allthe heat produced would have to be lost across the surface. Whentesting this notion in the model, we found a 99.6% surface heat loss,thus confirming the suitability of our methods.
The mass to heat loss relationship was modeled to determine thesignificance of body size. This was accomplished via the scalabilityof the modeled cross-section of the bigeye tuna. The relationshipbetween mass and surface heat loss:total heat production ratio is
26
24
23
22
21
25
Temp.°C
Fig.6. The modeled temperature distribution obtained when heatconservation in the white muscle is turned off (rete efficiency0). Note thesteep temperature gradient at the border between red and white muscle.Maximum red muscle temperature is 26°C, compared with 32°C in Fig.4.
Flux W cm–2
6.0
5.0
4.0
3.0
2.0
1.0
0
Scale=E–2
A
0
0.02
0.04
0.06
0.08
0.10
0.12
0.14
Nor
mal
flux
(W
cm
–2)
0 10 20 30 40 50
Distance (cm)
B
Fig.7. Heat loss across the surface of the fish represented as heat fluxvectors (A). The lengths of the flux vectors are normalized and theirmagnitudes are represented by color. Note that the net flux across thesymmetry line is zero. (B)The magnitude of the normal (perpendicular tothe surface) flux as a function of distance along the boundary from top tobottom. The area under this curve is the total heat loss per cm of depth.Note that the two sharp peaks are artifacts that arise in the numericalcalculations because of the sharp edges in the geometry here. They do notcontribute to the area under the curve.
THE JOURNAL OF EXPERIMENTAL BIOLOGY
3714
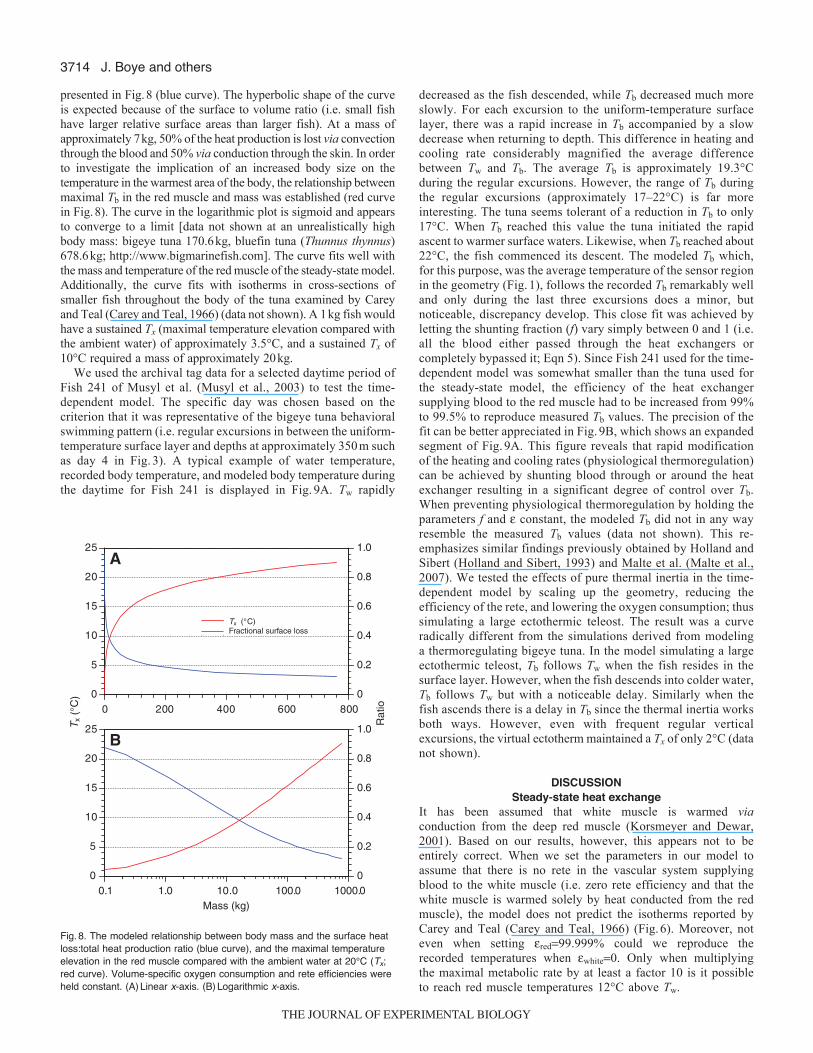
presented in Fig.8 (blue curve). The hyperbolic shape of the curveis expected because of the surface to volume ratio (i.e. small fishhave larger relative surface areas than larger fish). At a mass ofapproximately 7kg, 50% of the heat production is lost via convectionthrough the blood and 50% via conduction through the skin. In orderto investigate the implication of an increased body size on thetemperature in the warmest area of the body, the relationship betweenmaximal Tb in the red muscle and mass was established (red curvein Fig.8). The curve in the logarithmic plot is sigmoid and appearsto converge to a limit [data not shown at an unrealistically highbody mass: bigeye tuna 170.6kg, bluefin tuna (Thunnus thynnus)678.6kg; http://www.bigmarinefish.com]. The curve fits well withthe mass and temperature of the red muscle of the steady-state model.Additionally, the curve fits with isotherms in cross-sections ofsmaller fish throughout the body of the tuna examined by Careyand Teal (Carey and Teal, 1966) (data not shown). A 1kg fish wouldhave a sustained Tx (maximal temperature elevation compared withthe ambient water) of approximately 3.5°C, and a sustained Tx of10°C required a mass of approximately 20kg.
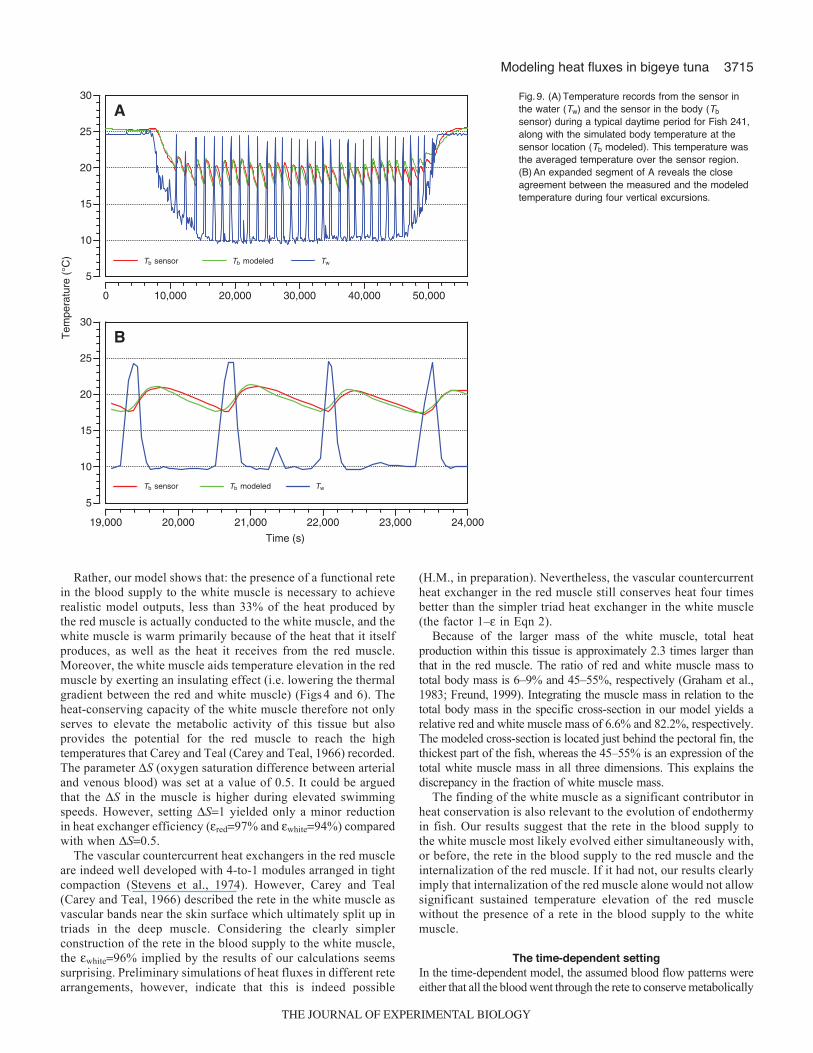
We used the archival tag data for a selected daytime period ofFish 241 of Musyl et al. (Musyl et al., 2003) to test the time-dependent model. The specific day was chosen based on thecriterion that it was representative of the bigeye tuna behavioralswimming pattern (i.e. regular excursions in between the uniform-temperature surface layer and depths at approximately 350m suchas day 4 in Fig.3). A typical example of water temperature,recorded body temperature, and modeled body temperature duringthe daytime for Fish 241 is displayed in Fig.9A. Tw rapidly
J. Boye and others
decreased as the fish descended, while Tb decreased much moreslowly. For each excursion to the uniform-temperature surfacelayer, there was a rapid increase in Tb accompanied by a slowdecrease when returning to depth. This difference in heating andcooling rate considerably magnified the average differencebetween Tw and Tb. The average Tb is approximately 19.3°Cduring the regular excursions. However, the range of Tb duringthe regular excursions (approximately 17–22°C) is far moreinteresting. The tuna seems tolerant of a reduction in Tb to only17°C. When Tb reached this value the tuna initiated the rapidascent to warmer surface waters. Likewise, when Tb reached about22°C, the fish commenced its descent. The modeled Tb which,for this purpose, was the average temperature of the sensor regionin the geometry (Fig.1), follows the recorded Tb remarkably welland only during the last three excursions does a minor, butnoticeable, discrepancy develop. This close fit was achieved byletting the shunting fraction (f) vary simply between 0 and 1 (i.e.all the blood either passed through the heat exchangers orcompletely bypassed it; Eqn 5). Since Fish 241 used for the time-dependent model was somewhat smaller than the tuna used forthe steady-state model, the efficiency of the heat exchangersupplying blood to the red muscle had to be increased from 99%to 99.5% to reproduce measured Tb values. The precision of thefit can be better appreciated in Fig.9B, which shows an expandedsegment of Fig.9A. This figure reveals that rapid modificationof the heating and cooling rates (physiological thermoregulation)can be achieved by shunting blood through or around the heatexchanger resulting in a significant degree of control over Tb.When preventing physiological thermoregulation by holding theparameters f and constant, the modeled Tb did not in any wayresemble the measured Tb values (data not shown). This re-emphasizes similar findings previously obtained by Holland andSibert (Holland and Sibert, 1993) and Malte et al. (Malte et al.,2007). We tested the effects of pure thermal inertia in the time-dependent model by scaling up the geometry, reducing theefficiency of the rete, and lowering the oxygen consumption; thussimulating a large ectothermic teleost. The result was a curveradically different from the simulations derived from modelinga thermoregulating bigeye tuna. In the model simulating a largeectothermic teleost, Tb follows Tw when the fish resides in thesurface layer. However, when the fish descends into colder water,Tb follows Tw but with a noticeable delay. Similarly when thefish ascends there is a delay in Tb since the thermal inertia worksboth ways. However, even with frequent regular verticalexcursions, the virtual ectotherm maintained a Tx of only 2°C (datanot shown).
DISCUSSIONSteady-state heat exchange
It has been assumed that white muscle is warmed viaconduction from the deep red muscle (Korsmeyer and Dewar,2001). Based on our results, however, this appears not to beentirely correct. When we set the parameters in our model toassume that there is no rete in the vascular system supplyingblood to the white muscle (i.e. zero rete efficiency and that thewhite muscle is warmed solely by heat conducted from the redmuscle), the model does not predict the isotherms reported byCarey and Teal (Carey and Teal, 1966) (Fig.6). Moreover, noteven when setting red99.999% could we reproduce therecorded temperatures when white0. Only when multiplyingthe maximal metabolic rate by at least a factor 10 is it possibleto reach red muscle temperatures 12°C above Tw.
0
5
10
15
20
25
0
0.2
0.4
0.6
0.8
1.0
0.1 1.0 10.0 100.0 1000.0Mass (kg)
0
5
10
15
20
25
Tx
(°C
) 0
0.2
0.4
0.6
0.8
1.0
Rat
io0 200 400 600 800
Tx (°C)Fractional surface loss
A
B
Fig.8. The modeled relationship between body mass and the surface heatloss:total heat production ratio (blue curve), and the maximal temperatureelevation in the red muscle compared with the ambient water at 20°C (Tx;red curve). Volume-specific oxygen consumption and rete efficiencies wereheld constant. (A)Linear x-axis. (B)Logarithmic x-axis.
THE JOURNAL OF EXPERIMENTAL BIOLOGY
3715Modeling heat fluxes in bigeye tuna
Rather, our model shows that: the presence of a functional retein the blood supply to the white muscle is necessary to achieverealistic model outputs, less than 33% of the heat produced bythe red muscle is actually conducted to the white muscle, and thewhite muscle is warm primarily because of the heat that it itselfproduces, as well as the heat it receives from the red muscle.Moreover, the white muscle aids temperature elevation in the redmuscle by exerting an insulating effect (i.e. lowering the thermalgradient between the red and white muscle) (Figs4 and 6). Theheat-conserving capacity of the white muscle therefore not onlyserves to elevate the metabolic activity of this tissue but alsoprovides the potential for the red muscle to reach the hightemperatures that Carey and Teal (Carey and Teal, 1966) recorded.The parameter S (oxygen saturation difference between arterialand venous blood) was set at a value of 0.5. It could be arguedthat the S in the muscle is higher during elevated swimmingspeeds. However, setting S1 yielded only a minor reductionin heat exchanger efficiency (red97% and white94%) comparedwith when S0.5.
The vascular countercurrent heat exchangers in the red muscleare indeed well developed with 4-to-1 modules arranged in tightcompaction (Stevens et al., 1974). However, Carey and Teal(Carey and Teal, 1966) described the rete in the white muscle asvascular bands near the skin surface which ultimately split up intriads in the deep muscle. Considering the clearly simplerconstruction of the rete in the blood supply to the white muscle,the white96% implied by the results of our calculations seemssurprising. Preliminary simulations of heat fluxes in different retearrangements, however, indicate that this is indeed possible
(H.M., in preparation). Nevertheless, the vascular countercurrentheat exchanger in the red muscle still conserves heat four timesbetter than the simpler triad heat exchanger in the white muscle(the factor 1– in Eqn 2).
Because of the larger mass of the white muscle, total heatproduction within this tissue is approximately 2.3 times larger thanthat in the red muscle. The ratio of red and white muscle mass tototal body mass is 6–9% and 45–55%, respectively (Graham et al.,1983; Freund, 1999). Integrating the muscle mass in relation to thetotal body mass in the specific cross-section in our model yields arelative red and white muscle mass of 6.6% and 82.2%, respectively.The modeled cross-section is located just behind the pectoral fin, thethickest part of the fish, whereas the 45–55% is an expression of thetotal white muscle mass in all three dimensions. This explains thediscrepancy in the fraction of white muscle mass.
The finding of the white muscle as a significant contributor inheat conservation is also relevant to the evolution of endothermyin fish. Our results suggest that the rete in the blood supply tothe white muscle most likely evolved either simultaneously with,or before, the rete in the blood supply to the red muscle and theinternalization of the red muscle. If it had not, our results clearlyimply that internalization of the red muscle alone would not allowsignificant sustained temperature elevation of the red musclewithout the presence of a rete in the blood supply to the whitemuscle.
The time-dependent settingIn the time-dependent model, the assumed blood flow patterns wereeither that all the blood went through the rete to conserve metabolically
5
10
15
20
25
30
Tem
pera
ture
(°C
)
0 10,000 20,000 30,000 40,000 50,000
TwTb modeledTb sensor
TwTb modeledTb sensor
A
5
10
15
20
25
30
19,000 20,000 21,000 22,000 23,000 24,000
Time (s)
B
Fig.9. (A)Temperature records from the sensor inthe water (Tw) and the sensor in the body (Tb
sensor) during a typical daytime period for Fish 241,along with the simulated body temperature at thesensor location (Tb modeled). This temperature wasthe averaged temperature over the sensor region.(B)An expanded segment of A reveals the closeagreement between the measured and the modeledtemperature during four vertical excursions.
THE JOURNAL OF EXPERIMENTAL BIOLOGY

3716
produced heat (when Tb>Tw) or all the blood bypassed the rete (whenTw>Tb). Likewise, the oxygen consumption (leading to heatproduction) was modeled in a simple two-state fashion: constant atmaximal metabolic rate during the daytime, and constant at routinemetabolic rate at night-time. In spite of this simple all-or-nonearrangement, our model reproduced the recorded body temperaturedata very well. The all-or-none shunting mechanism was previouslysuggested by Malte et al. (Malte et al., 2007). We may seem lessjustified in simplifying the modeled diurnal metabolism to a two-state oxygen consumption rate. However, analysis of the data of Fish241 revealed similar velocities of ascents and descents with a gradualincrease in swimming speed towards mid-point depth followed by agradual decrease (Malte et al., 2007). Holland and Sibert (Hollandand Sibert, 1993) made similar assumptions. Moreover, there wasonly a minor difference [<8% (Malte et al., 2007)] between coolingand heating rates in a lumped parameter model when oxygenconsumption was held constant, or when oxygen consumption wasvaried with vertical swimming speed during vertical excursions. Eventhough a simple all-or-none mode of regulation explains the presentdata well a more finely graded regulation can certainly not beexcluded. Testing and comparing different modes of regulationwould require more detailed knowledge of activity (not only verticalswimming velocity) and temperature data of better spatial andtemporal resolution than are available today.
The cooling and heating rate constants found in the lumpedparameter model during the vertical excursions were in the range0.02–0.04min–1 and 0.2–0.6min–1, respectively. When we estimatedthese from the modeled body temperature, we arrived at similar rates(data not shown). Therefore, the present model shows that thesecooling and heating rate constants can indeed be the result of anall-or-none shunting mechanism (e.g. diverting blood from the lateralheat exchangers to the dorsal aorta/post-cardinal vein and vice versa).
The time-dependent model predicted the recorded Tb very wellfor various fish on different days. However, in a few fish themetabolic heat production in the white muscle had to be multipliedby a factor of two to yield results that resembled the observed data.This may be because of significant anaerobic metabolism undercertain conditions. Tuna white muscle is known to have a largeanaerobic capacity with high glycogen stores and extraordinarilyhigh lactate dehydrogenase activity (Hulbert et al., 1979; Arthur etal., 1992; Dickson, 1995). The model only takes aerobic heatproduction into account and ignores heat production associated withanaerobic glycolysis thus missing the actual scope of white muscleheat production. Increasing white muscle heat production wouldimply a corresponding decrease in the necessary efficiency of thecountercurrent heat exchanger in the blood supply to the whitemuscle. However, this would only be temporary and, even then,modeling of all realistic scenarios still demonstrated the necessityof a white muscle rete efficiency of around 95%.
Effects of body massScaling the model tuna makes it apparent that body mass is a majorcontributor to elevated body temperature, thus supporting thesimilar findings of Malte and colleagues (Malte et al., 2007).Assuming Tw20°C, a constant volume-specific oxygenconsumption rate and high rete efficiencies as estimated from thepresent calculations, our model predicts that very large tuna wouldoverheat. Thus, in this setting, a 400kg tuna would reach a corebody temperature of approximately 40°C. This, like in allendotherms, stresses the importance of a mass-specific metabolicrate that decreases with size. At this point it is difficult to drawspecific conclusions with regard to the value of the exponent of the
J. Boye and others
metabolic rate–body mass relationship of tuna because of the limitedsize range for which there are data (Korsmeyer and Dewar, 2001).It is clear from Fig.8, however, that fractional surface heat lossdecreases as body size increases and the significance of heatexchanger efficiency in controlling heat loss increases. Thus, a size-dependent heat loss via this route could be achieved by a size-dependent diameter of the arterioles and venules comprising theheat exchangers. There may be an indication of this since Stevensand colleagues (Stevens et al., 1974) found the arteriole and venulediameters to be around 40 and 80mm in the (central) heat exchangerof a 1.9kg skipjack tuna whereas Carey and Teal (Carey and Teal,1966) reported values of around 100 and 200mm in the similarlyarranged (lateral) heat exchanger of a 70kg bigeye tuna. However,such anatomical data are too scarce to allow definitive conclusionsto be drawn. Apart from increasing the possible steady-state Tx, alarger body mass also will slow cooling rates and thus decrease thefrequency of vertical excursions.
In conclusion, we have shown that an effective vascularcountercurrent heat exchanger in the blood supply of both the redand white muscle is a prerequisite for endothermy in tuna.Furthermore, physiological thermoregulation, as expressed bydifferential cooling and heating rates, can be fully accounted for byshunting of blood either through or around vascular heat exchangersin an all-or-none fashion. Moreover, by adjusting the heat exchangerefficiencies obtained from steady-state modeling of a large bigeyetuna, we were able to predict the temperature variations recordedin a much smaller tuna performing daily vertical excursions. Thissuggests that the estimated heat exchanger efficiencies are fairlyconservative and that the higher body temperatures in largerindividuals are primarily due to a lower fractional surface heat lossand a greater thermal inertia.
Suggestions for future researchThis study points to the necessity for studies on heat conservationin white muscle. As a first step, it will be necessary to obtainquantitative anatomical data (i.e. vessel diameter and length aswell as interspacing of heat exchanger units) in vascular bandsand triads serving the white muscle. This will make it possible tomodel the maximum possible efficiency of most idealized retearrangements.
APPENDIXModel development
Eqn A1 is based on a heat balance on an infinitesimal element. Thatis, the heat generated within a unit volume of tissue, the heat flux(i.e. conduction) in all three coordinate directions, and the changein energy per unit time must balance:
where qx, qy and qz are the heat fluxes into the unit volume in thex-, y- and z-directions (respectively), qgen is the heat generated perunit time within the unit volume, qx+dx, qy+dy and qz+dz are the heatfluxes out of the unit volume in the x-, y- and z-directions(respectively) and dE/dt is the rate of change of energy content inthe unit volume.
These energy quantities are given as follows:
qx + qy + qz + qgen = qx+dx + qy+dy + qz+dz +dE
dt , (A1)
qx = − K dy dz∂T
∂x,
qx+dx = − K∂T
∂x+
∂∂x
K∂T
∂x
⎛⎝⎜
⎞⎠⎟
dx⎡
⎣⎢
⎤
⎦⎥dy dz , (A2)
THE JOURNAL OF EXPERIMENTAL BIOLOGY

3717Modeling heat fluxes in bigeye tuna
where K is the thermal conductivity of the material with the unitsJs–1cm–1°C–1, T is the temperature as a function of a given positionand time, hp is the volume-specific metabolic heat production inJs–1cm–3, is the density with the units gcm–3 and cp is the specificheat capacity with the units Jg–1°C–1.
Inserting Eqns A2–A6 into Eqn A1 yields:
With the assumption of uniformity in the z-direction, the differentialterm in the z-direction in Eqn A7 vanishes. We now introduce anon-directional, uniform, convective cooling term. This can bethought of as a uniform blood flow perpendicular to the xy-plane.This convective flow through the tissue is assumed to have a coolingpower at any point proportional to the temperature differencebetween that point and the surrounding water (Tb–Tw). Furthermoreit is assumed to be modified by the presence of a heat exchangerwith a factor (1–) where is the heat exchanger efficiency. Thisleads to:
By dividing through with cp (for muscle), and introducing thermaldiffusivity K/(cp) and temperature production Tphp/(cp) weget:
Finally, introducing the gradient (�) and the divergence (��)operators and defining a rate constant (dimension s–1) for convectivecooling vbb/m we arrive at:
This is the second-order partial differential equation at its finaledition, which is a key element in the models. For constant thermaldiffusivity, the first term on the right-hand side of Eqn A10 reducesto �2T where�2��� is the Laplace operator. This is the case insideevery homogeneous domain but not on its boundaries.
The last term (the convective term) is thus dependent on thedifference between Tb and Tw, and the efficiency of the heatexchanger. Tb will be depend on x and y as well as on time [i.e.TbTb(x,y,t)], whereas Tw may or may not depend on time but doesnot depend on x or y. The efficiency takes on values in the interval0–1 (i.e. a large results in a reduced convective loss). In otherwords, the final partial differential equation (Eqn A10) is anexpression for a 3D model modified into a 2D model taking into
∂T
∂t= ∇ ⋅ κ∇T( ) + �Tp + ϕ Tb − Tw( )(1 − ε ) . (A10)
∂T
∂t=
∂∂x
κ∂T
∂x
⎛⎝⎜
⎞⎠⎟
+∂∂y
κ∂T
∂y
⎛⎝⎜
⎞⎠⎟
+ �Tp + �vbβb
βm
(Tw − Tb )(1− ε ) . (A9)
ρcp∂T
∂t=
∂∂x
K∂T
∂x
⎛⎝⎜
⎞⎠⎟
+∂∂y
K∂T
∂y
⎛⎝⎜
⎞⎠⎟
+ �hp + �vbβb (Tw − Tb )(1 − ε ) . (A8)
ρcp∂T
∂t=
∂∂x
K∂T
∂x
⎛⎝⎜
⎞⎠⎟
+∂∂y
K∂T
∂y
⎛⎝⎜
⎞⎠⎟
+∂∂z
K∂T
∂z
⎛⎝⎜
⎞⎠⎟
+ �hp . (A7)
dE
dt= ρcp dx dy dz
∂T
∂t , (A6)
qgen = �hp dx dy dz , (A5)
qz = − K dx dy∂T
∂z,
qz+dz = − K∂T
∂z+
∂∂z
K∂T
∂z
⎛⎝⎜
⎞⎠⎟
dz⎡
⎣⎢
⎤
⎦⎥dx dy , (A4)
qy = − K dx dz∂T
∂y,
qy+dy = − K∂T
∂y+
∂∂y
K∂T
∂y
⎛⎝⎜
⎞⎠⎟
dy⎡
⎣⎢
⎤
⎦⎥dx dz , (A3)
account the z-dimension as a uniform convective blood flowperpendicular to the xy-plane.
LIST OF SYMBOLS AND ABBREVIATIONScp specific heat capacity (Jg–1°C–1)f shunting fractionhp volume-specific heat production (Js–1cm–3)K thermal conductivity (Js–1cm–1°C–1)L fork lengthM body massn normal to the surfaceS O2 saturationt timeTb body temperature at a given coordinate (°C)Tp temperature production, i.e. the rate of change in temperature
due to heat production (°Cs–1)Tw water temperature (°C)Tx maximal temperature elevation compared with the ambient
water (°C)vb specific blood flow (cm3
bloods–1cm–3muscle)
VO2max maximum oxygen consumption (mg O2kg–1h–1)VO2rest resting oxygen consumption (mg O2kg–1h–1)� gradient operator�� divergence operator�2 Laplace operator heat capacitance coefficient (cp in Jcm–3°C–1) heat exchanger efficiency (dimensionless) thermal diffusivity [K/(cp) in cm2s–1] density (gcm–3) convective cooling rate constant [(vb(blood/muscle) in s–1]
This work was supported by The Pelagic Fisheries Research Foundation (PFRP)and The Danish Natural Sciences Research Foundation (FNU).
REFERENCESAltringham, J. D. and Shadwick, R. E. (2001). Swimming and muscle function. In
Tuna: Physiology, Ecology And Evolution, Fish Physiology, vol. 19 (ed. B. A. Blockand E. D. Stevens), pp. 331-341. San Diego: Academic Press.
Arthur, P. G., West, T. G., Brill, R. W., Schulte, P. M. and Hochachka, P. W.(1992). Recovery metabolism of skipjack tuna (Katsuwonus pelamis) white muscle:Rapid and parallel changes in lactate and phosphocreatine after exercise. Can. J.Zool. 70, 1230-1239.
Blank, J. M., Morrissette, J. M., Landeira-Fernandez, A. M., Blackwell, S. B.,Williams, T. D. and Block, B. A. (2004). In situ cardiac performance of Pacificbluefin tuna hearts in response to acute temperature change. J. Exp. Biol. 207, 881-890.
Block, B. A., Finnerty, J. R., Stewart, A. F. R. and Kidd, J. (1993). Evolution ofendothermy in fish: mapping physiological traits on a molecular phylogeny. Science260, 210-214.
Bonnick, S. L. (2000). Osteoporosis, The Hand Book, third edition, 147 pp. Texas:Cooper Square Press.
Brill, R. W. and Bushnell, P. G. (2001). The cardiovascular system of tunas. In Tuna:Physiology, Ecology And Evolution, Fish Physiology, vol. 19 (ed. B. A. Block and E.D. Stevens), pp. 79-120. San Diego: Academic Press.
Bushnell, P. G. and Brill, R. W. (1991). Responses of swimming skipjack(Katsuwonus pelamis) and yellowfin (Thunnus albacares) tunas to acute hypoxia anda model of their cardiorespiratory function. Physiol. Zool. 64, 787-811.
Calttenburg, R., Cohen, J., Conner, S. and Coo, N. (2004). Thermal properties ofcancellous bone. J. Biomed. Mater. Res. 9, 169-182.
Carey, F. G. (1973). Fishes with warm bodies. Sci. Am. 228, 36-44.Carey, F. G. and Teal, J. M. (1966). Heat conservation in tuna fish muscle, Proc. Natl.
Acad. Sci. USA 56, 1464-1469.Carey, F. G., Teal, J. M., Kanwisher, J. W. and Lawson, K. D. (1971). Warm bodied
fish. Am. Zool. 11, 135-145.Carey, F. G., Teal, J. M., Kanwisher, J. W. and Stevens, E. D. (1984). Bluefin tuna
warm their viscera during digestion. J. Exp. Biol. 109, 1-20.Cheng, H. M. and Plewes, D. B. (2002). Tissue thermal conductivity by magnetic
resonance thermometry and focused ultrasound heating. J. Magn. Reson. Imaging16, 598-609.
Dewar, H. and Graham, J. B. (1994). Studies of tropical tuna swimming performancein a large water tunnel, I. Energetics. J. Exp. Biol. 192, 13-31.
Dewar, H., Graham, J. B. and Brill, R. W. (1994). Studies of tropical tuna swimmingperformance in a large water tunnel, II. Thermoregulation. J. Exp. Biol. 192, 33-44.
Dickson, K. A. (1995). Unique adaptations of the metabolic biochemistry of tunas andbillfishes for life in the pelagic environment. Environ. Biol. Fishes 42, 65-97.
Freund, E. V. (1999). Comparisons of metabolic and cardiac performance in scombridfishes: Insights into the evolution of endothermy. PhD dissertation, BiologicalSciences, Stanford University, Stanford, CA.
THE JOURNAL OF EXPERIMENTAL BIOLOGY
3718 J. Boye and others
Graham, J. B. and Dickson, K. A. (2000). The evolution of thunniform locomotion andheat conservation in scombrid fishes: new insights based on the morphology ofAllothunnus fallai. Zool. J. Linn. Soc. Lond. 129, 419-466.
Graham, J. B. and Dickson, K. A. (2001). Anatomical and physiologicalspecializations for endothermy. In Tuna: Physiology, Ecology And Evolution, FishPhysiology, vol. 19 (ed. B. A. Block and E. D. Stevens), pp. 121-165. San Diego:Academic Press.
Graham, J. B., Koehrn, F. J. and Dickson, K. A. (1983). Distribution and relativeproportions of red muscle in scombrid fishes: Consequences of body size andrelationships to locomotion and endothermy. Can. J. Zool. 61, 2087-2096.
Gunn, J. and Block, B. A. (2001). Advances in acoustic, archival and satellite taggingof tunas. In Tuna: Physiology, Ecology And Evolution, Fish Physiology, vol. 19 (ed. B.A. Block and E. D. Stevens), pp. 167-224. San Diego: Academic Press.
Hensel, H. and Bock, K. D. (1955). Durchblutung und Wärmeleitfährigkeit desmenschlichen Muskels. Phlügers Arch. 260, 361-367.
Holland, K. N. and Sibert, J. R. (1993). Physiological thermoregulation in bigeye tuna,Thunnus Obesus. Environ. Biol. Fishes 40, 319-327.
Holman, J. P. (1989). Heat Transfer. Singapore: McGraw-Hill.Hulbert, W. C., Guppy, M., Murphy, B. and Hochachka, P. W. (1979). Metabolic
sources of heat and power in tuna muscles. I. Muscle fine structure. J. Exp. Biol. 82,289-301.
Katz, S L., Syme, D. A. and Shadwick, R. E. (2001). High-speed swimming,Enhanced power in yellowfin tuna. Nature 410, 770-771.
Korsmeyer, K. E., and Dewar, H. (2001). Tuna metabolism and energetics. In Tuna:Physiology, Ecology and Evolution, Fish Physiology, vol. 19 (ed. B. A. Block and E.D. Stevens), pp. 35-78. San Diego: Academic Press.
Lowe, T. E., Brill, R. W. and Cousins, K. L. (2000). Blood oxygen-bindingcharacteristics of bigeye tuna (Thunnus obesus), a high-energy-demand teleost thatis tolerant to low ambient oxygen. Mar. Biol. 136, 1087-1098.
Magnuson, J. J. and Weininger, D. (1978). Estimation of minimum sustained speedand associated body drag of scombrids. In The Physiological Ecology of Tunas,Academic Press, New York.
Malte, H., Larsen, C., Musyl, M. and Brill, R. (2007). Differential heating and coolingrates in bigeye tuna (Thunnus obesus, Lowe): a model of non-steady-state heatexchange. J. Exp. Biol. 210, 2618-2626.
Mathieu-Costello, O., Agey, P. J., Logemann, R. B., Brill, R. W. and Hochachka,P. W. (1992). Capillary-fiber geometrical relationships in tuna red muscle. Can. J.Zool. 70, 1218-1229.
Musyl, M. K. Brill, R. W., Boggs, C. H., Curran, D. S., Kazama, K. K. and Ski, M. P.(2003). Vertical movements of bigeye tuna (Thunnus obesus) associated withislands, buoys, and seamounts near the main Hawaiian Islands from archival taggingdata. Fish. Oceanogr. 12, 152-169.
Ngadi, M. O. and Ikediala, J. N. (1998). Heat transfer properties of chicken-drummuscle. J. Sci. Food Agric. 78, 12-18.
Sepulveda, C. A., Dickson, K. A. and Graham, J. B. (2003). Swimming performancestudies on the eastern Pacific bonito (Sarda chiliensis), a close relative of the tunas(Family scombridae). I. Energetics. J. Exp. Biol. 206, 2739-2748.
Song, J., Xu, L. X., Lemons, D. E. and Weinbaum, S. (1999). Microvascular thermalequilibration in rat spinotrapezius muscle. Ann. Biomed. Eng. 27, 56-66.
Stevens, E. D. and McLeese, J. M. (1984). Why bluefin tuna have warm tummies:temperature effect on trypsin and chymotrypsin. Am. J. Physiol. 246, 487-494.
Stevens, E. D., Lam, H. M. and Kendall, J. (1974). Vascular anatomy of the counter-current heat exchanger of Skipjack Tuna. J. Exp. Biol. 61, 145-153.
Urbanchek, M. G., Picken, E. B., Kalliainen, L. K. and Kuzon, W., Jr (2001).Specific force deficit in skeletal muscles of old rats in partially explained by theexistence of denervated muscle fibers. J. Gerontol. A Biol. Sci. Med. Sci. 56, 292-297.
THE JOURNAL OF EXPERIMENTAL BIOLOGY