Oceanic dispersal in a sedentary reef shark ( Triaenodon obesus ): Genetic evidence for extensive...
13
ORIGINAL ARTICLE Oceanic dispersal in a sedentary reef shark (Triaenodon obesus): genetic evidence for extensive connectivity without a pelagic larval stage Nicholas M. Whitney 1 *, William D. Robbins 2,3 , Jennifer K. Schultz 1,4 , Brian W. Bowen 1 and Kim N. Holland 1 1 Hawaii Institute of Marine Biology and Zoology Department, University of Hawaii at Manoa, Honolulu, HI 96744, USA, 2 School of Marine and Tropical Biology, James Cook University, Townsville, Qld 4811, Australia, 3 Wildlife Marine, Perth, WA 6020, Australia, 4 Office of Protected Resources, National Marine Fisheries Service, Silver Spring, MD 20910, USA *Correspondence: Nicholas M. Whitney, Center for Shark Research, Mote Marine Laboratory, 1600 Ken Thompson Parkway, Sarasota, FL 34203, USA. E-mail: [email protected] ABSTRACT Aim Most reef fishes are site-attached, but can maintain a broad distribution through their highly dispersive larval stage. The whitetip reef shark (Triaenodon obesus) is site-attached, yet maintains the largest Indo-Pacific distribution of any reef shark while lacking the larval stage of bony (teleost) fishes. Here we use mitochondrial DNA (mtDNA) sequence data to evaluate the enigma of the sedentary reef shark that maintains a distribution across two-thirds of the planet. Location Tropical Pacific and Indian Oceans. Methods We analysed 1025 base pairs of the mtDNA control region in 310 individuals from 25 locations across the Indian and Pacific Oceans. Phylogeographic and population genetic analyses were used to reveal the dispersal and recent evolutionary history of the species. Results We resolved 15 mtDNA control region haplotypes, but two comprised 87% of the specimens and were detected at nearly every location. Similar to other sharks, genetic diversity was low (h = 0.550 ± 0.0254 and p = 0.00213 ± 0.00131). Spatial analyses of genetic variation demonstrated strong isolation across the Indo-Pacific Barrier and between western and central Pacific locations. Pairwise F ST comparisons indicated high connectivity among archipelagos of the central Pacific but isolation across short distances of contiguous habitat (Great Barrier Reef) and intermittent habitat (Hawaiian Archipelago). In the eastern Pacific only a single haplotype (the most common one in the central Pacific) was observed, indicating recent dispersal (or colonization) across the East Pacific Barrier. Main conclusions The shallow haplotype network indicates recent expansion of modern populations within the last half million years from a common ancestor. Based on the distribution of mtDNA diversity, this began with an Indo-West Pacific centre of origin, with subsequent dispersal to the Central Pacific and East Pacific. Genetic differences between Indian and Pacific Ocean populations are consistent with Pleistocene closures of the Indo-Pacific Barrier associated with glacial cycles. Pairwise population comparisons reveal weak but significant isolation by distance, and notably do not indicate the high coastal connectivity observed in other shark species. The finding of population structure among semi- contiguous habitats, but population connectivity among archipelagos, may indicate a previously unsuspected oceanic dispersal behaviour in whitetip reef sharks. Keywords Control region, dispersal, East Pacific Barrier, elasmobranch, Indo-Pacific Barrier, marine biogeography, marine fish, mtDNA, phylogeography. Journal of Biogeography (J. Biogeogr.) (2012) 39, 1144–1156 1144 http://wileyonlinelibrary.com/journal/jbi ª 2011 Blackwell Publishing Ltd doi:10.1111/j.1365-2699.2011.02660.x
-
Upload
independent -
Category
Documents
-
view
2 -
download
0
Transcript of Oceanic dispersal in a sedentary reef shark ( Triaenodon obesus ): Genetic evidence for extensive...
ORIGINALARTICLE
Oceanic dispersal in a sedentary reefshark (Triaenodon obesus): geneticevidence for extensive connectivitywithout a pelagic larval stage
Nicholas M. Whitney1*, William D. Robbins2,3, Jennifer K. Schultz1,4,
Brian W. Bowen1 and Kim N. Holland1
1Hawaii Institute of Marine Biology and
Zoology Department, University of Hawaii at
Manoa, Honolulu, HI 96744, USA, 2School of
Marine and Tropical Biology, James Cook
University, Townsville, Qld 4811, Australia,3Wildlife Marine, Perth, WA 6020, Australia,4Office of Protected Resources, National
Marine Fisheries Service, Silver Spring, MD
20910, USA
*Correspondence: Nicholas M. Whitney, Center
for Shark Research, Mote Marine Laboratory,
1600 Ken Thompson Parkway, Sarasota, FL
34203, USA.
E-mail: [email protected]
ABSTRACT
Aim Most reef fishes are site-attached, but can maintain a broad distribution
through their highly dispersive larval stage. The whitetip reef shark (Triaenodon
obesus) is site-attached, yet maintains the largest Indo-Pacific distribution of any
reef shark while lacking the larval stage of bony (teleost) fishes. Here we use
mitochondrial DNA (mtDNA) sequence data to evaluate the enigma of the
sedentary reef shark that maintains a distribution across two-thirds of the planet.
Location Tropical Pacific and Indian Oceans.
Methods We analysed 1025 base pairs of the mtDNA control region in 310
individuals from 25 locations across the Indian and Pacific Oceans.
Phylogeographic and population genetic analyses were used to reveal the
dispersal and recent evolutionary history of the species.
Results We resolved 15 mtDNA control region haplotypes, but two comprised
87% of the specimens and were detected at nearly every location. Similar to other
sharks, genetic diversity was low (h = 0.550 ± 0.0254 and p = 0.00213 ±
0.00131). Spatial analyses of genetic variation demonstrated strong isolation
across the Indo-Pacific Barrier and between western and central Pacific locations.
Pairwise FST comparisons indicated high connectivity among archipelagos of the
central Pacific but isolation across short distances of contiguous habitat (Great
Barrier Reef) and intermittent habitat (Hawaiian Archipelago). In the eastern
Pacific only a single haplotype (the most common one in the central Pacific) was
observed, indicating recent dispersal (or colonization) across the East Pacific
Barrier.
Main conclusions The shallow haplotype network indicates recent expansion of
modern populations within the last half million years from a common ancestor.
Based on the distribution of mtDNA diversity, this began with an Indo-West
Pacific centre of origin, with subsequent dispersal to the Central Pacific and East
Pacific. Genetic differences between Indian and Pacific Ocean populations are
consistent with Pleistocene closures of the Indo-Pacific Barrier associated with
glacial cycles. Pairwise population comparisons reveal weak but significant
isolation by distance, and notably do not indicate the high coastal connectivity
observed in other shark species. The finding of population structure among semi-
contiguous habitats, but population connectivity among archipelagos, may indicate
a previously unsuspected oceanic dispersal behaviour in whitetip reef sharks.
Keywords
Control region, dispersal, East Pacific Barrier, elasmobranch, Indo-Pacific
Barrier, marine biogeography, marine fish, mtDNA, phylogeography.
Journal of Biogeography (J. Biogeogr.) (2012) 39, 1144–1156
1144 http://wileyonlinelibrary.com/journal/jbi ª 2011 Blackwell Publishing Ltddoi:10.1111/j.1365-2699.2011.02660.x
INTRODUCTION
The dispersal of marine organisms, and the corresponding
impacts on species range and evolution, have been controver-
sial topics with few clear patterns identified to date (Bohonak,
1999; Cowen et al., 2006; Lester et al., 2007; Rocha et al.,
2007). Most attention has been focused on pelagic (oceanic)
larvae, providing little insight into the phylogeography of
elasmobranchs (sharks and rays), which lack a pelagic larval
stage. The relationship between dispersal ability and popula-
tion structure in sharks has been explored in relatively few
species, in part because of the difficulty in acquiring adequate
sample sizes and range-wide coverage (Heist, 1999, 2005).
Many large, pelagic sharks (e.g. the shortfin mako, Isurus
oxyrhincus; whale shark, Rhincodon typus; and white shark,
Carcharadon carcharias) undergo long oceanic movements
(Kohler et al., 1998, 1999; Eckert & Stewart, 2001; Bonfil et al.,
2005) with little genetic structure across much of their range
(Schrey & Heist, 2003; also Hoelzel et al., 2006; Castro et al.,
2007; Jorgensen et al., 2010; but see Chabot & Allen, 2009).
Coastal species, such as the scalloped hammerhead, Sphyrna
lewini (Duncan et al., 2006) and blacktip shark, Carcharhinus
limbatus (Keeney & Heist, 2006), exhibit connectivity along
coastlines but significant structure across oceanic barriers.
Similarly, lemon sharks (Negaprion brevirostris and Negaprion
acutidens) exhibit significant isolation by oceanic distance,
with the eastern Pacific Ocean serving as an impassable oceanic
barrier (Schultz et al., 2008). Although a few shark species have
shown genetic structure over relatively short distances, these
species have limited coastal ranges, which is consistent with
low vagility (Pacific angel shark, Squatina californica, and
leopard shark, Triakis semifasciata) and in some cases are
insular shelf species apparently isolated by deep channels or
strong regional currents (zebra shark, Stegostoma fasciatum;
Pacific angel shark, Squatina californica; and spot-tail shark,
Carcharhinus sorrah) (Gaida, 1997; Lewallen et al., 2007;
Dudgeon et al., 2009; Ovenden et al., 2009).
The whitetip reef shark, Triaenodon obesus (Ruppell, 1837),
represents a striking contrast between individual dispersal
ability and species distribution. Strongly attached to coral reef
habitat, these medium-sized (c. 1.8 m total length) sharks
remain motionless in caves, resting for hours during the day,
and emerging at night to feed on benthic prey amongst reef
holes and crevices (Randall, 1977; Nelson & Johnson, 1980).
The few studies of their movements indicate small daily home
ranges of c. 1 km2 (Nelson & Johnson, 1980), with maximum
dispersal distances of 9–24 km over several years (Nelson &
Johnson, 1980; Whitney et al., 2012). The site fidelity of
T. obesus is also recognized in traditional Hawaiian culture,
and may have given rise to the belief in ‘aumakua, the guardian
spirits of ancestors that abide near their descendants (Taylor,
1993). Although usually not directly targeted by commercial
fisheries, T. obesus populations may be highly vulnerable to
recreational fishing (Whitney et al., 2012), with populations
along the Great Barrier Reef declining at 7% year)1 (Robbins
et al., 2006).
Triaenodon obesus is the only requiem shark (family
Carcharinidae) that is both benthic and coastal, two additional
factors that are associated with limited dispersal and a small
species range (Musick et al., 2004). Despite the apparent lack
of movement, T. obesus is the most broadly distributed reef
shark, recorded in the Red Sea and Western Indian Ocean,
throughout the tropical Indo-Pacific, and into the Central and
Eastern Pacific Oceans, including some of the most isolated
island groups in the world (Randall, 1977; Compagno, 1984).
Paradoxically, this species exhibits a level of site-fidelity
comparable to that of many coral reef teleosts (bony fishes),
but has a distribution spanning nearly 70% of the Earth’s
circumference. The few teleost reef fishes that span this range
have highly dispersive oceanic larvae (Craig et al., 2007; Horne
et al., 2008), while the whitetip reef shark is viviparous, giving
birth to swimming progeny (Randall, 1977; Robbins, 2006a).
Herein, we present the phylogeography of the world’s most
broadly distributed reef shark. We use mitochondrial DNA
(mtDNA) analyses to reconcile the species’ broad distribution
with the well-documented site-fidelity. These data will also
illuminate the evolutionary history and patterns of dispersal,
and the impact of biogeographic barriers to gene flow in a
species that may be experiencing significant population
declines (Friedlander & Demartini, 2002; Robbins et al.,
2006; Heupel et al., 2009). To accomplish this goal, we sample
across most of the species’ range, and embed fine-scale
sampling in the Great Barrier Reef and the Hawaiian Archi-
pelago. The latter provides intermittent habitats along an
isolated transect of 2600 km, an excellent platform for testing
the limits of dispersal in a site-attached reef species.
MATERIALS AND METHODS
Sampling
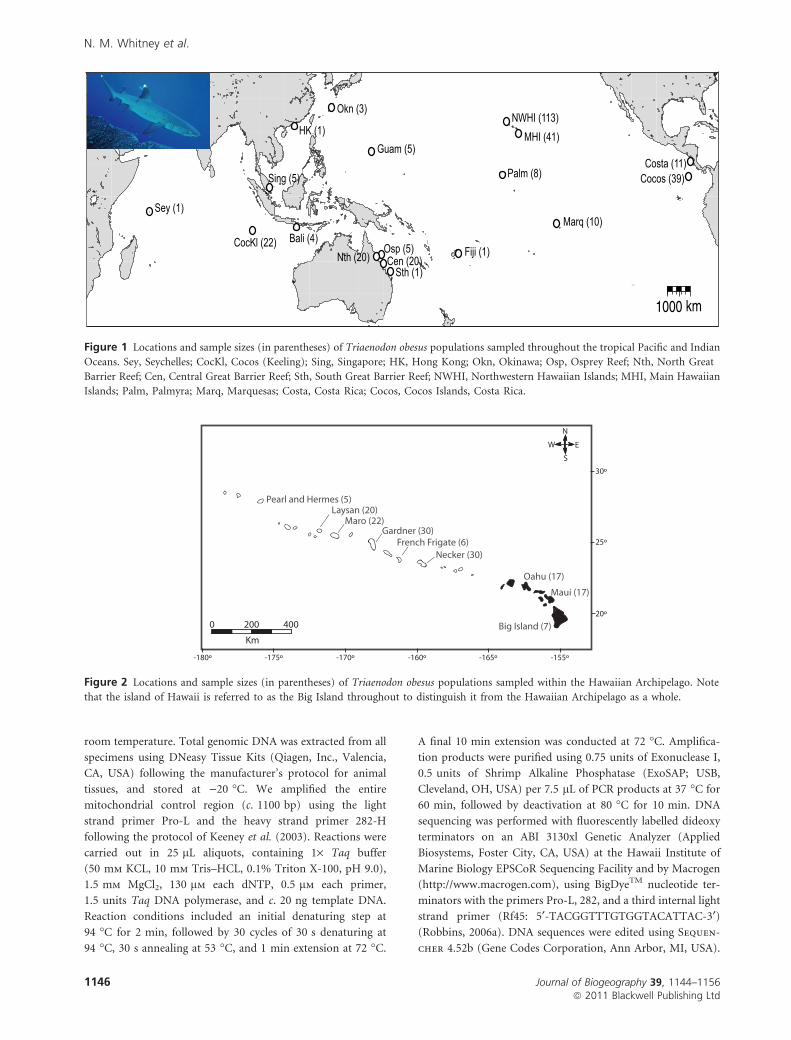
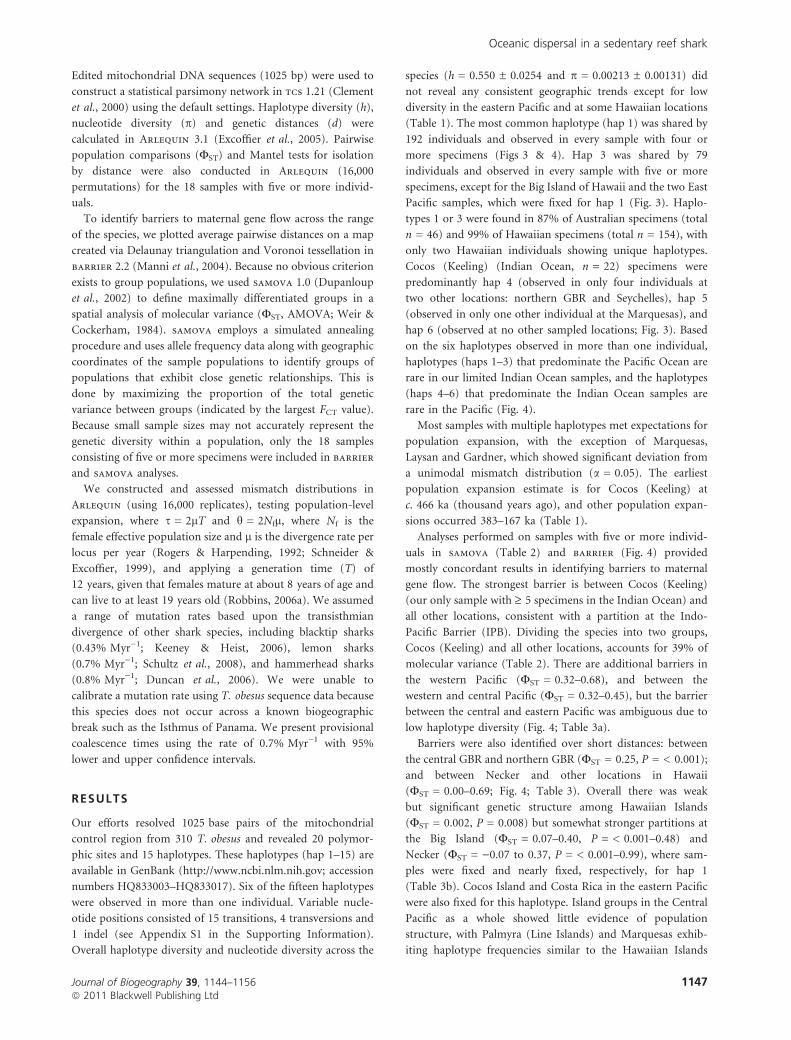
A total of 310 T. obesus specimens were collected between 2002
and 2008 from 25 locations across the tropical Indian and
Pacific Oceans (Fig. 1), including nine locations within the
Hawaiian Archipelago (Fig. 2) and three locations along the
Great Barrier Reef (GBR). Samples were obtained from free-
swimming animals using biopsy probes (Robbins, 2006b)
attached to an underwater speargun, or using livestock ear-
notchers to clip tissue from the fins of resting sharks. Samples
were also obtained from bycatch along the GBR, from lobster
(funnel) traps in the Northwestern Hawaiian Islands, and from
a few locally caught captive animals in public aquaria in Guam,
Hong Kong and Singapore. Additional specimens were
collected by hand, spear, or on hook and line in Okinawa,
Fiji, Osprey Reef, GBR and Palmyra. Note that the island of
Hawaii is referred to as the Big Island throughout so as to
distinguish it from the Hawaiian Archipelago.
Laboratory procedures and analysis
Tissue samples were preserved in 80–95% ethanol (EtOH) or
saturated NaCl solution (Seutin et al., 1991) and stored at
Oceanic dispersal in a sedentary reef shark
Journal of Biogeography 39, 1144–1156 1145ª 2011 Blackwell Publishing Ltd
room temperature. Total genomic DNA was extracted from all
specimens using DNeasy Tissue Kits (Qiagen, Inc., Valencia,
CA, USA) following the manufacturer’s protocol for animal
tissues, and stored at )20 �C. We amplified the entire
mitochondrial control region (c. 1100 bp) using the light
strand primer Pro-L and the heavy strand primer 282-H
following the protocol of Keeney et al. (2003). Reactions were
carried out in 25 lL aliquots, containing 1· Taq buffer
(50 mm KCL, 10 mm Tris–HCL, 0.1% Triton X-100, pH 9.0),
1.5 mm MgCl2, 130 lm each dNTP, 0.5 lm each primer,
1.5 units Taq DNA polymerase, and c. 20 ng template DNA.
Reaction conditions included an initial denaturing step at
94 �C for 2 min, followed by 30 cycles of 30 s denaturing at
94 �C, 30 s annealing at 53 �C, and 1 min extension at 72 �C.
A final 10 min extension was conducted at 72 �C. Amplifica-
tion products were purified using 0.75 units of Exonuclease I,
0.5 units of Shrimp Alkaline Phosphatase (ExoSAP; USB,
Cleveland, OH, USA) per 7.5 lL of PCR products at 37 �C for
60 min, followed by deactivation at 80 �C for 10 min. DNA
sequencing was performed with fluorescently labelled dideoxy
terminators on an ABI 3130xl Genetic Analyzer (Applied
Biosystems, Foster City, CA, USA) at the Hawaii Institute of
Marine Biology EPSCoR Sequencing Facility and by Macrogen
(http://www.macrogen.com), using BigDyeTM nucleotide ter-
minators with the primers Pro-L, 282, and a third internal light
strand primer (Rf45: 5¢-TACGGTTTGTGGTACATTAC-3¢)(Robbins, 2006a). DNA sequences were edited using Sequen-
cher 4.52b (Gene Codes Corporation, Ann Arbor, MI, USA).
1000 km
Bali (4)
MHI (41)
Cocos (39)Costa (11)
Fiji (1)
Guam (5)
Marq (10)
Okn (3)
Palm (8)
Sey (1)
Sing (5)
CocKl (22)Cen (20)Nth (20)Osp (5)
Sth (1)
NWHI (113)HK (1)
Figure 1 Locations and sample sizes (in parentheses) of Triaenodon obesus populations sampled throughout the tropical Pacific and Indian
Oceans. Sey, Seychelles; CocKl, Cocos (Keeling); Sing, Singapore; HK, Hong Kong; Okn, Okinawa; Osp, Osprey Reef; Nth, North Great
Barrier Reef; Cen, Central Great Barrier Reef; Sth, South Great Barrier Reef; NWHI, Northwestern Hawaiian Islands; MHI, Main Hawaiian
Islands; Palm, Palmyra; Marq, Marquesas; Costa, Costa Rica; Cocos, Cocos Islands, Costa Rica.
Pearl and Hermes (5)
Maro (22)Gardner (30)
French Frigate (6)Necker (30)
Oahu (17)
Maui (17)
Laysan (20)
Big Island (7)
Km
0 40020020º
25º
30º
-155º-170º -160º -165º-175º-180º
N
W E
S
Figure 2 Locations and sample sizes (in parentheses) of Triaenodon obesus populations sampled within the Hawaiian Archipelago. Note
that the island of Hawaii is referred to as the Big Island throughout to distinguish it from the Hawaiian Archipelago as a whole.
N. M. Whitney et al.
1146 Journal of Biogeography 39, 1144–1156ª 2011 Blackwell Publishing Ltd
Edited mitochondrial DNA sequences (1025 bp) were used to
construct a statistical parsimony network in tcs 1.21 (Clement
et al., 2000) using the default settings. Haplotype diversity (h),
nucleotide diversity (p) and genetic distances (d) were
calculated in Arlequin 3.1 (Excoffier et al., 2005). Pairwise
population comparisons (FST) and Mantel tests for isolation
by distance were also conducted in Arlequin (16,000
permutations) for the 18 samples with five or more individ-
uals.
To identify barriers to maternal gene flow across the range
of the species, we plotted average pairwise distances on a map
created via Delaunay triangulation and Voronoi tessellation in
barrier 2.2 (Manni et al., 2004). Because no obvious criterion
exists to group populations, we used samova 1.0 (Dupanloup
et al., 2002) to define maximally differentiated groups in a
spatial analysis of molecular variance (FST, AMOVA; Weir &
Cockerham, 1984). samova employs a simulated annealing
procedure and uses allele frequency data along with geographic
coordinates of the sample populations to identify groups of
populations that exhibit close genetic relationships. This is
done by maximizing the proportion of the total genetic
variance between groups (indicated by the largest FCT value).
Because small sample sizes may not accurately represent the
genetic diversity within a population, only the 18 samples
consisting of five or more specimens were included in barrier
and samova analyses.
We constructed and assessed mismatch distributions in
Arlequin (using 16,000 replicates), testing population-level
expansion, where s = 2lT and h = 2Nfl, where Nf is the
female effective population size and l is the divergence rate per
locus per year (Rogers & Harpending, 1992; Schneider &
Excoffier, 1999), and applying a generation time (T) of
12 years, given that females mature at about 8 years of age and
can live to at least 19 years old (Robbins, 2006a). We assumed
a range of mutation rates based upon the transisthmian
divergence of other shark species, including blacktip sharks
(0.43% Myr)1; Keeney & Heist, 2006), lemon sharks
(0.7% Myr)1; Schultz et al., 2008), and hammerhead sharks
(0.8% Myr)1; Duncan et al., 2006). We were unable to
calibrate a mutation rate using T. obesus sequence data because
this species does not occur across a known biogeographic
break such as the Isthmus of Panama. We present provisional
coalescence times using the rate of 0.7% Myr)1 with 95%
lower and upper confidence intervals.
RESULTS
Our efforts resolved 1025 base pairs of the mitochondrial
control region from 310 T. obesus and revealed 20 polymor-
phic sites and 15 haplotypes. These haplotypes (hap 1–15) are
available in GenBank (http://www.ncbi.nlm.nih.gov; accession
numbers HQ833003–HQ833017). Six of the fifteen haplotypes
were observed in more than one individual. Variable nucle-
otide positions consisted of 15 transitions, 4 transversions and
1 indel (see Appendix S1 in the Supporting Information).
Overall haplotype diversity and nucleotide diversity across the
species (h = 0.550 ± 0.0254 and p = 0.00213 ± 0.00131) did
not reveal any consistent geographic trends except for low
diversity in the eastern Pacific and at some Hawaiian locations
(Table 1). The most common haplotype (hap 1) was shared by
192 individuals and observed in every sample with four or
more specimens (Figs 3 & 4). Hap 3 was shared by 79
individuals and observed in every sample with five or more
specimens, except for the Big Island of Hawaii and the two East
Pacific samples, which were fixed for hap 1 (Fig. 3). Haplo-
types 1 or 3 were found in 87% of Australian specimens (total
n = 46) and 99% of Hawaiian specimens (total n = 154), with
only two Hawaiian individuals showing unique haplotypes.
Cocos (Keeling) (Indian Ocean, n = 22) specimens were
predominantly hap 4 (observed in only four individuals at
two other locations: northern GBR and Seychelles), hap 5
(observed in only one other individual at the Marquesas), and
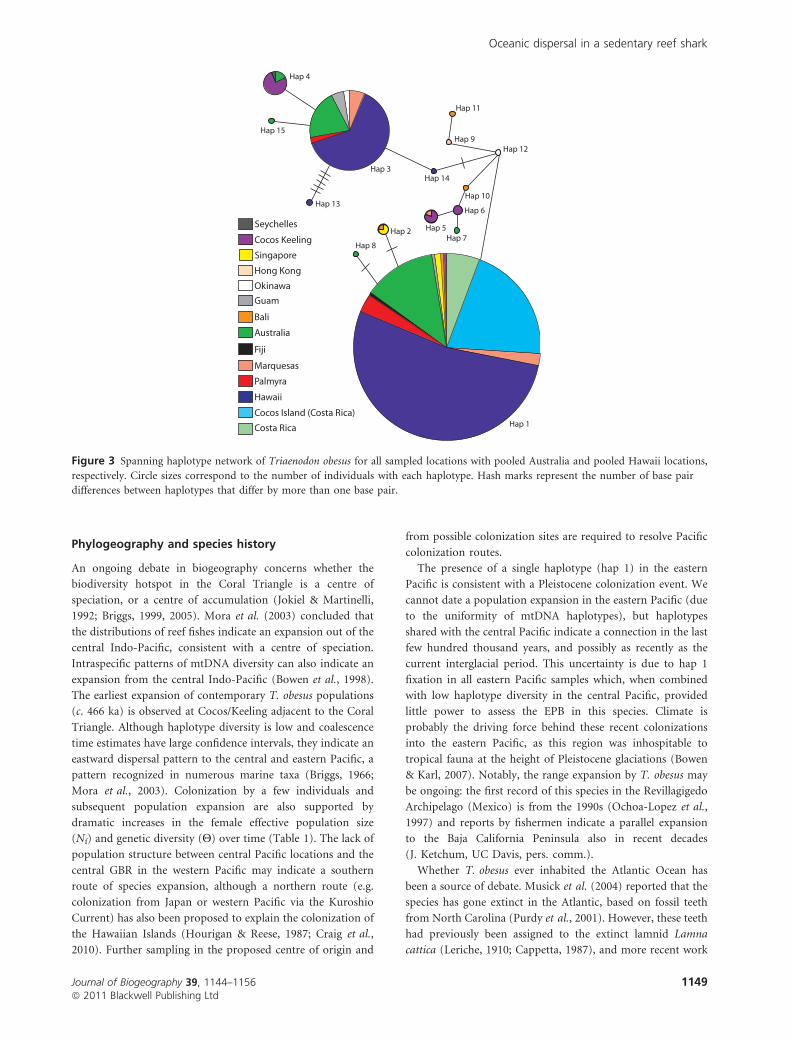
hap 6 (observed at no other sampled locations; Fig. 3). Based
on the six haplotypes observed in more than one individual,
haplotypes (haps 1–3) that predominate the Pacific Ocean are
rare in our limited Indian Ocean samples, and the haplotypes
(haps 4–6) that predominate the Indian Ocean samples are
rare in the Pacific (Fig. 4).
Most samples with multiple haplotypes met expectations for
population expansion, with the exception of Marquesas,
Laysan and Gardner, which showed significant deviation from
a unimodal mismatch distribution (a = 0.05). The earliest
population expansion estimate is for Cocos (Keeling) at
c. 466 ka (thousand years ago), and other population expan-
sions occurred 383–167 ka (Table 1).
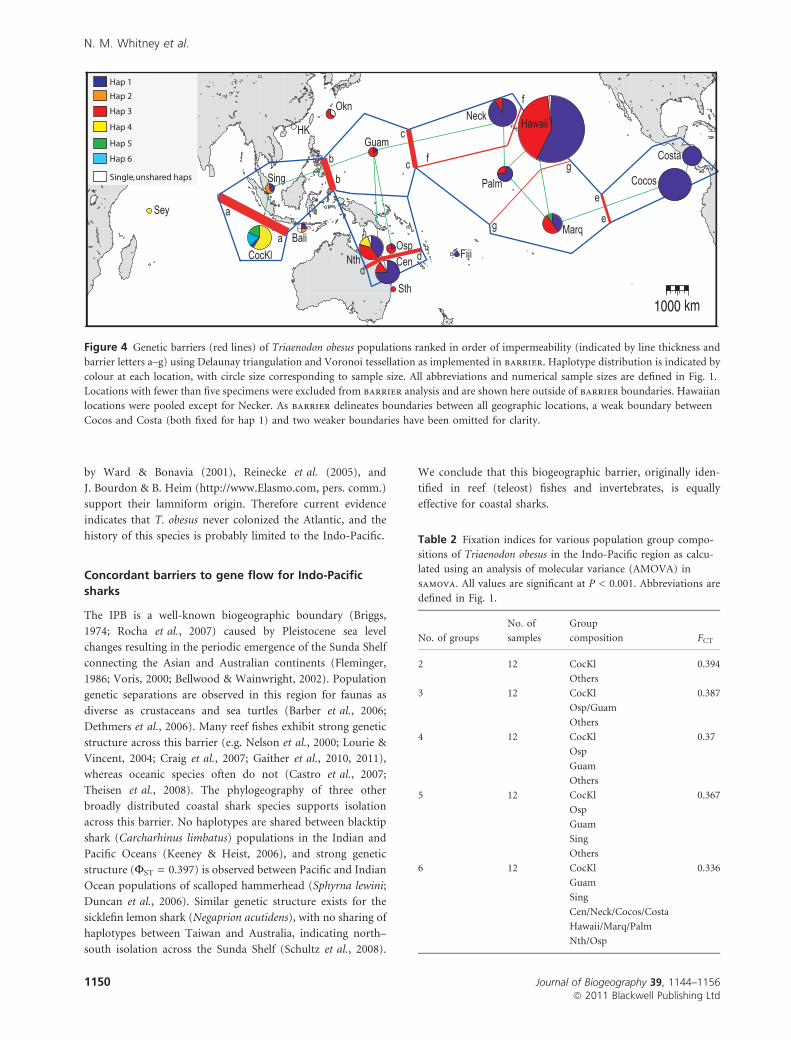
Analyses performed on samples with five or more individ-
uals in samova (Table 2) and barrier (Fig. 4) provided
mostly concordant results in identifying barriers to maternal
gene flow. The strongest barrier is between Cocos (Keeling)
(our only sample with ‡ 5 specimens in the Indian Ocean) and
all other locations, consistent with a partition at the Indo-
Pacific Barrier (IPB). Dividing the species into two groups,
Cocos (Keeling) and all other locations, accounts for 39% of
molecular variance (Table 2). There are additional barriers in
the western Pacific (FST = 0.32–0.68), and between the
western and central Pacific (FST = 0.32–0.45), but the barrier
between the central and eastern Pacific was ambiguous due to
low haplotype diversity (Fig. 4; Table 3a).
Barriers were also identified over short distances: between
the central GBR and northern GBR (FST = 0.25, P = < 0.001);
and between Necker and other locations in Hawaii
(FST = 0.00–0.69; Fig. 4; Table 3). Overall there was weak
but significant genetic structure among Hawaiian Islands
(FST = 0.002, P = 0.008) but somewhat stronger partitions at
the Big Island (FST = 0.07–0.40, P = < 0.001–0.48) and
Necker (FST = )0.07 to 0.37, P = < 0.001–0.99), where sam-
ples were fixed and nearly fixed, respectively, for hap 1
(Table 3b). Cocos Island and Costa Rica in the eastern Pacific
were also fixed for this haplotype. Island groups in the Central
Pacific as a whole showed little evidence of population
structure, with Palmyra (Line Islands) and Marquesas exhib-
iting haplotype frequencies similar to the Hawaiian Islands
Oceanic dispersal in a sedentary reef shark
Journal of Biogeography 39, 1144–1156 1147ª 2011 Blackwell Publishing Ltd
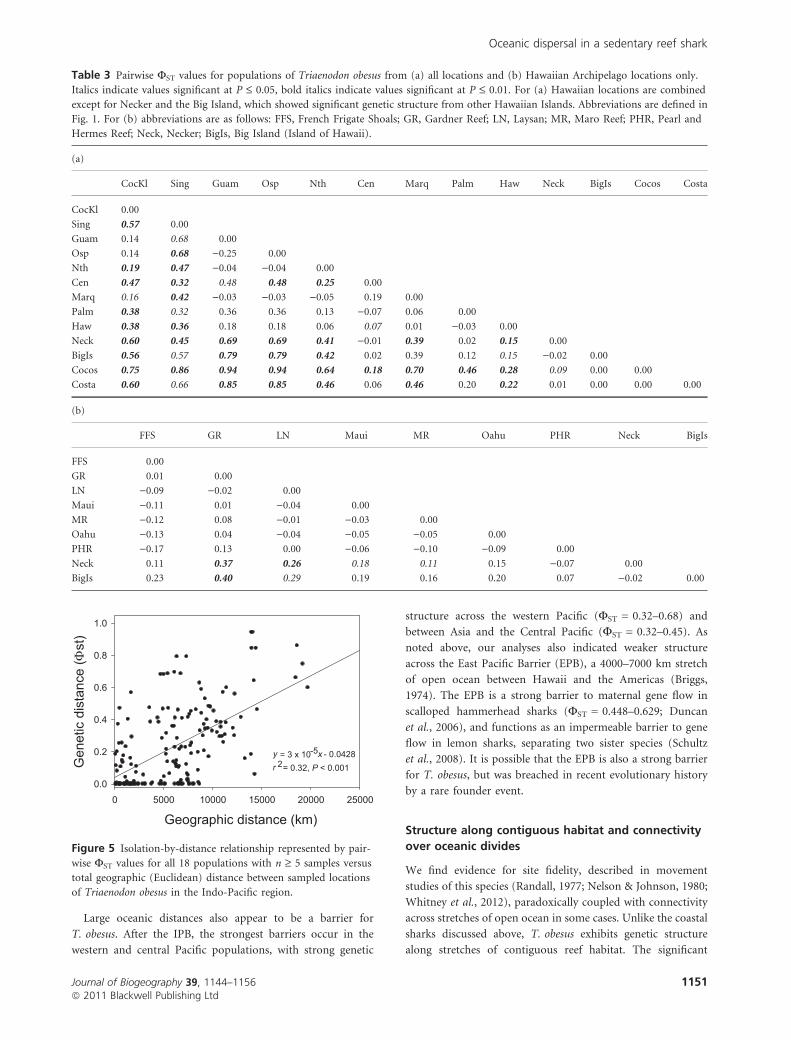
(FST = )0.03 to 0.01, N.S.; Table 3a). Overall we found weak
but significant support for isolation by distance (r2 = 0.32;
P < 0.001), with a broad range of pairwise genetic distances
frequently occurring in populations separated by < 10,000 km
(Fig. 5).
DISCUSSION
Population genetic analyses (on samples with n ‡ 5) of the
broadly distributed whitetip reef shark indicate that the
strongest barriers to maternal gene flow occur between the
Pacific and Indian Oceans. Secondary barriers are apparent
between reef habitats separated by more than a few thousand
kilometres of open ocean; however, these population-level
distinctions are based on frequency shifts in a few common
haplotypes, indicating that oceanic dispersal is not sufficient to
homogenize regional populations, but has occurred recently
and/or sporadically in this sedentary reef species.
Prior to dissecting these results, we note two limitations
based on sample sizes. Despite 7 years of sampling by
authors, and the generous contributions of those recognized
in acknowledgments, seven of our 15 locations are charac-
terized by fewer than five specimens. These small samples
(< 5 individuals) were not included in most analyses.
Although small samples are useful for resolving phylogeo-
graphic (and molecular evolutionary) patterns, they are less
useful for population genetic analyses (which depend on
accurately categorizing the distribution of haplotypes). For
the remaining sample sizes (5–39 individuals), we assume that
these samples accurately represent the genetic diversity within
populations. We feel that this is appropriate because of a
strong geographic signal: haps 1 and 3 predominate in the
Pacific, while haps 4–6 predominate in the Indian Ocean.
Because we base corresponding conclusions on the predom-
inance of different haplotypes, additional sampling is unlikely
to alter these results. Second, our characterization of the
Indian Ocean is limited to Cocos (Keeling) near the Coral
Triangle (n = 22) and Seychelles in the western equatorial
region (n = 1). More work is needed to examine biogeo-
graphic affiliations of the western Indian Ocean, although the
single individual from Seychelles had the most common
haplotype (hap 4) found at Cocos (Keeling). Other reef-
associated vertebrates have shown high connectivity across
the region between Cocos (Keeling) and Seychelles (Craig
et al., 2007; Horne et al., 2008; Gaither et al., 2010; Reece
et al., 2010), so a major evolutionary partition within
T. obesus seems unlikely across this region, but further
investigation is needed to confirm this.
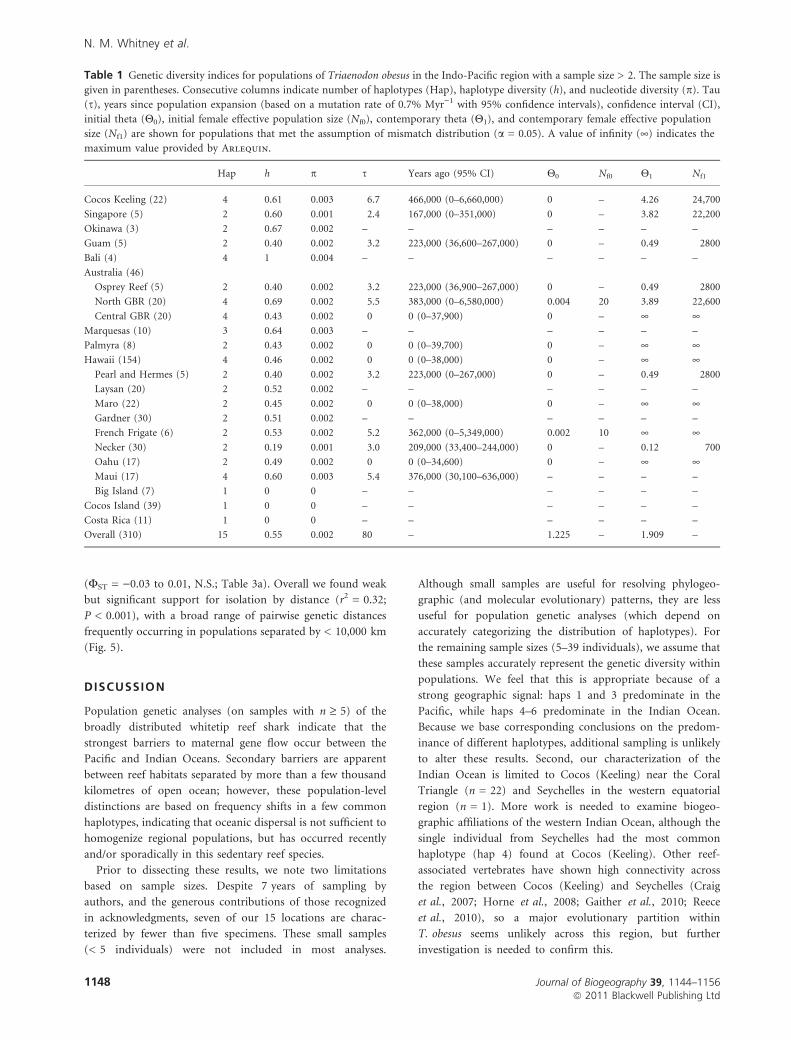
Table 1 Genetic diversity indices for populations of Triaenodon obesus in the Indo-Pacific region with a sample size > 2. The sample size is
given in parentheses. Consecutive columns indicate number of haplotypes (Hap), haplotype diversity (h), and nucleotide diversity (p). Tau
(s), years since population expansion (based on a mutation rate of 0.7% Myr)1 with 95% confidence intervals), confidence interval (CI),
initial theta (Q0), initial female effective population size (Nf0), contemporary theta (Q1), and contemporary female effective population
size (Nf1) are shown for populations that met the assumption of mismatch distribution (a = 0.05). A value of infinity (¥) indicates the
maximum value provided by Arlequin.
Hap h p s Years ago (95% CI) Q0 Nf0 Q1 Nf1
Cocos Keeling (22) 4 0.61 0.003 6.7 466,000 (0–6,660,000) 0 – 4.26 24,700
Singapore (5) 2 0.60 0.001 2.4 167,000 (0–351,000) 0 – 3.82 22,200
Okinawa (3) 2 0.67 0.002 – – – – – –
Guam (5) 2 0.40 0.002 3.2 223,000 (36,600–267,000) 0 – 0.49 2800
Bali (4) 4 1 0.004 – – – – – –
Australia (46)
Osprey Reef (5) 2 0.40 0.002 3.2 223,000 (36,900–267,000) 0 – 0.49 2800
North GBR (20) 4 0.69 0.002 5.5 383,000 (0–6,580,000) 0.004 20 3.89 22,600
Central GBR (20) 4 0.43 0.002 0 0 (0–37,900) 0 – ¥ ¥Marquesas (10) 3 0.64 0.003 – – – – – –
Palmyra (8) 2 0.43 0.002 0 0 (0–39,700) 0 – ¥ ¥Hawaii (154) 4 0.46 0.002 0 0 (0–38,000) 0 – ¥ ¥
Pearl and Hermes (5) 2 0.40 0.002 3.2 223,000 (0–267,000) 0 – 0.49 2800
Laysan (20) 2 0.52 0.002 – – – – – –
Maro (22) 2 0.45 0.002 0 0 (0–38,000) 0 – ¥ ¥Gardner (30) 2 0.51 0.002 – – – – – –
French Frigate (6) 2 0.53 0.002 5.2 362,000 (0–5,349,000) 0.002 10 ¥ ¥Necker (30) 2 0.19 0.001 3.0 209,000 (33,400–244,000) 0 – 0.12 700
Oahu (17) 2 0.49 0.002 0 0 (0–34,600) 0 – ¥ ¥Maui (17) 4 0.60 0.003 5.4 376,000 (30,100–636,000) – – – –
Big Island (7) 1 0 0 – – – – – –
Cocos Island (39) 1 0 0 – – – – – –
Costa Rica (11) 1 0 0 – – – – – –
Overall (310) 15 0.55 0.002 80 – 1.225 – 1.909 –
N. M. Whitney et al.
1148 Journal of Biogeography 39, 1144–1156ª 2011 Blackwell Publishing Ltd
Phylogeography and species history
An ongoing debate in biogeography concerns whether the
biodiversity hotspot in the Coral Triangle is a centre of
speciation, or a centre of accumulation (Jokiel & Martinelli,
1992; Briggs, 1999, 2005). Mora et al. (2003) concluded that
the distributions of reef fishes indicate an expansion out of the
central Indo-Pacific, consistent with a centre of speciation.
Intraspecific patterns of mtDNA diversity can also indicate an
expansion from the central Indo-Pacific (Bowen et al., 1998).
The earliest expansion of contemporary T. obesus populations
(c. 466 ka) is observed at Cocos/Keeling adjacent to the Coral
Triangle. Although haplotype diversity is low and coalescence
time estimates have large confidence intervals, they indicate an
eastward dispersal pattern to the central and eastern Pacific, a
pattern recognized in numerous marine taxa (Briggs, 1966;
Mora et al., 2003). Colonization by a few individuals and
subsequent population expansion are also supported by
dramatic increases in the female effective population size
(Nf) and genetic diversity (Q) over time (Table 1). The lack of
population structure between central Pacific locations and the
central GBR in the western Pacific may indicate a southern
route of species expansion, although a northern route (e.g.
colonization from Japan or western Pacific via the Kuroshio
Current) has also been proposed to explain the colonization of
the Hawaiian Islands (Hourigan & Reese, 1987; Craig et al.,
2010). Further sampling in the proposed centre of origin and
from possible colonization sites are required to resolve Pacific
colonization routes.
The presence of a single haplotype (hap 1) in the eastern
Pacific is consistent with a Pleistocene colonization event. We
cannot date a population expansion in the eastern Pacific (due
to the uniformity of mtDNA haplotypes), but haplotypes
shared with the central Pacific indicate a connection in the last
few hundred thousand years, and possibly as recently as the
current interglacial period. This uncertainty is due to hap 1
fixation in all eastern Pacific samples which, when combined
with low haplotype diversity in the central Pacific, provided
little power to assess the EPB in this species. Climate is
probably the driving force behind these recent colonizations
into the eastern Pacific, as this region was inhospitable to
tropical fauna at the height of Pleistocene glaciations (Bowen
& Karl, 2007). Notably, the range expansion by T. obesus may
be ongoing: the first record of this species in the Revillagigedo
Archipelago (Mexico) is from the 1990s (Ochoa-Lopez et al.,
1997) and reports by fishermen indicate a parallel expansion
to the Baja California Peninsula also in recent decades
(J. Ketchum, UC Davis, pers. comm.).
Whether T. obesus ever inhabited the Atlantic Ocean has
been a source of debate. Musick et al. (2004) reported that the
species has gone extinct in the Atlantic, based on fossil teeth
from North Carolina (Purdy et al., 2001). However, these teeth
had previously been assigned to the extinct lamnid Lamna
cattica (Leriche, 1910; Cappetta, 1987), and more recent work
Hap 1
Hap 3
Hap 4
Hap 15
Hap 13
Hap 2
Hap 8
Hap 11
Hap 9Hap 12
Hap 14
Hap 10
Hap 6
Hap 5Hap 7
Australia
Bali
Cocos Island (Costa Rica)
Cocos Keeling
Costa Rica
Fiji
Guam
Hawaii
Hong Kong
Marquesas
Okinawa
Palmyra
Seychelles
Singapore
Figure 3 Spanning haplotype network of Triaenodon obesus for all sampled locations with pooled Australia and pooled Hawaii locations,
respectively. Circle sizes correspond to the number of individuals with each haplotype. Hash marks represent the number of base pair
differences between haplotypes that differ by more than one base pair.
Oceanic dispersal in a sedentary reef shark
Journal of Biogeography 39, 1144–1156 1149ª 2011 Blackwell Publishing Ltd
by Ward & Bonavia (2001), Reinecke et al. (2005), and
J. Bourdon & B. Heim (http://www.Elasmo.com, pers. comm.)
support their lamniform origin. Therefore current evidence
indicates that T. obesus never colonized the Atlantic, and the
history of this species is probably limited to the Indo-Pacific.
Concordant barriers to gene flow for Indo-Pacific
sharks
The IPB is a well-known biogeographic boundary (Briggs,
1974; Rocha et al., 2007) caused by Pleistocene sea level
changes resulting in the periodic emergence of the Sunda Shelf
connecting the Asian and Australian continents (Fleminger,
1986; Voris, 2000; Bellwood & Wainwright, 2002). Population
genetic separations are observed in this region for faunas as
diverse as crustaceans and sea turtles (Barber et al., 2006;
Dethmers et al., 2006). Many reef fishes exhibit strong genetic
structure across this barrier (e.g. Nelson et al., 2000; Lourie &
Vincent, 2004; Craig et al., 2007; Gaither et al., 2010, 2011),
whereas oceanic species often do not (Castro et al., 2007;
Theisen et al., 2008). The phylogeography of three other
broadly distributed coastal shark species supports isolation
across this barrier. No haplotypes are shared between blacktip
shark (Carcharhinus limbatus) populations in the Indian and
Pacific Oceans (Keeney & Heist, 2006), and strong genetic
structure (FST = 0.397) is observed between Pacific and Indian
Ocean populations of scalloped hammerhead (Sphyrna lewini;
Duncan et al., 2006). Similar genetic structure exists for the
sicklefin lemon shark (Negaprion acutidens), with no sharing of
haplotypes between Taiwan and Australia, indicating north–
south isolation across the Sunda Shelf (Schultz et al., 2008).
We conclude that this biogeographic barrier, originally iden-
tified in reef (teleost) fishes and invertebrates, is equally
effective for coastal sharks.
Table 2 Fixation indices for various population group compo-
sitions of Triaenodon obesus in the Indo-Pacific region as calcu-
lated using an analysis of molecular variance (AMOVA) in
samova. All values are significant at P < 0.001. Abbreviations are
defined in Fig. 1.
No. of groups
No. of
samples
Group
composition FCT
2 12 CocKl 0.394
Others
3 12 CocKl 0.387
Osp/Guam
Others
4 12 CocKl 0.37
Osp
Guam
Others
5 12 CocKl 0.367
Osp
Guam
Sing
Others
6 12 CocKl 0.336
Guam
Sing
Cen/Neck/Cocos/Costa
Hawaii/Marq/Palm
Nth/Osp
1000 km
Palm CocosSing
Marq
Costa
CocKl CenOsp
Neck
Sth
Nth
Bali
Okn
Sey
HK
Fiji
Hap 1
Hap 3
Hap 2
Hap 4
Hap 5
Hap 6
Single, unshared haps
a
a
b
d
b
c
c
d
f
f
e
e
g
g
GuamHawaii
Figure 4 Genetic barriers (red lines) of Triaenodon obesus populations ranked in order of impermeability (indicated by line thickness and
barrier letters a–g) using Delaunay triangulation and Voronoi tessellation as implemented in barrier. Haplotype distribution is indicated by
colour at each location, with circle size corresponding to sample size. All abbreviations and numerical sample sizes are defined in Fig. 1.
Locations with fewer than five specimens were excluded from barrier analysis and are shown here outside of barrier boundaries. Hawaiian
locations were pooled except for Necker. As barrier delineates boundaries between all geographic locations, a weak boundary between
Cocos and Costa (both fixed for hap 1) and two weaker boundaries have been omitted for clarity.
N. M. Whitney et al.
1150 Journal of Biogeography 39, 1144–1156ª 2011 Blackwell Publishing Ltd
Large oceanic distances also appear to be a barrier for
T. obesus. After the IPB, the strongest barriers occur in the
western and central Pacific populations, with strong genetic
structure across the western Pacific (FST = 0.32–0.68) and
between Asia and the Central Pacific (FST = 0.32–0.45). As
noted above, our analyses also indicated weaker structure
across the East Pacific Barrier (EPB), a 4000–7000 km stretch
of open ocean between Hawaii and the Americas (Briggs,
1974). The EPB is a strong barrier to maternal gene flow in
scalloped hammerhead sharks (FST = 0.448–0.629; Duncan
et al., 2006), and functions as an impermeable barrier to gene
flow in lemon sharks, separating two sister species (Schultz
et al., 2008). It is possible that the EPB is also a strong barrier
for T. obesus, but was breached in recent evolutionary history
by a rare founder event.
Structure along contiguous habitat and connectivity
over oceanic divides
We find evidence for site fidelity, described in movement
studies of this species (Randall, 1977; Nelson & Johnson, 1980;
Whitney et al., 2012), paradoxically coupled with connectivity
across stretches of open ocean in some cases. Unlike the coastal
sharks discussed above, T. obesus exhibits genetic structure
along stretches of contiguous reef habitat. The significant
Table 3 Pairwise FST values for populations of Triaenodon obesus from (a) all locations and (b) Hawaiian Archipelago locations only.
Italics indicate values significant at P £ 0.05, bold italics indicate values significant at P £ 0.01. For (a) Hawaiian locations are combined
except for Necker and the Big Island, which showed significant genetic structure from other Hawaiian Islands. Abbreviations are defined in
Fig. 1. For (b) abbreviations are as follows: FFS, French Frigate Shoals; GR, Gardner Reef; LN, Laysan; MR, Maro Reef; PHR, Pearl and
Hermes Reef; Neck, Necker; BigIs, Big Island (Island of Hawaii).
(a)
CocKl Sing Guam Osp Nth Cen Marq Palm Haw Neck BigIs Cocos Costa
CocKl 0.00
Sing 0.57 0.00
Guam 0.14 0.68 0.00
Osp 0.14 0.68 )0.25 0.00
Nth 0.19 0.47 )0.04 )0.04 0.00
Cen 0.47 0.32 0.48 0.48 0.25 0.00
Marq 0.16 0.42 )0.03 )0.03 )0.05 0.19 0.00
Palm 0.38 0.32 0.36 0.36 0.13 )0.07 0.06 0.00
Haw 0.38 0.36 0.18 0.18 0.06 0.07 0.01 )0.03 0.00
Neck 0.60 0.45 0.69 0.69 0.41 )0.01 0.39 0.02 0.15 0.00
BigIs 0.56 0.57 0.79 0.79 0.42 0.02 0.39 0.12 0.15 )0.02 0.00
Cocos 0.75 0.86 0.94 0.94 0.64 0.18 0.70 0.46 0.28 0.09 0.00 0.00
Costa 0.60 0.66 0.85 0.85 0.46 0.06 0.46 0.20 0.22 0.01 0.00 0.00 0.00
(b)
FFS GR LN Maui MR Oahu PHR Neck BigIs
FFS 0.00
GR 0.01 0.00
LN )0.09 )0.02 0.00
Maui )0.11 0.01 )0.04 0.00
MR )0.12 0.08 )0.01 )0.03 0.00
Oahu )0.13 0.04 )0.04 )0.05 )0.05 0.00
PHR )0.17 0.13 0.00 )0.06 )0.10 )0.09 0.00
Neck 0.11 0.37 0.26 0.18 0.11 0.15 )0.07 0.00
BigIs 0.23 0.40 0.29 0.19 0.16 0.20 0.07 )0.02 0.00
0 5000 10000 15000 20000 250000.0
0.2
0.4
0.6
0.8
1.0
Geneticdistance(Φst)
Geographic distance (km)
= 3 x 10⁻⁵ - 0.04282= 0.32, P < 0.001y xr
Figure 5 Isolation-by-distance relationship represented by pair-
wise FST values for all 18 populations with n ‡ 5 samples versus
total geographic (Euclidean) distance between sampled locations
of Triaenodon obesus in the Indo-Pacific region.
Oceanic dispersal in a sedentary reef shark
Journal of Biogeography 39, 1144–1156 1151ª 2011 Blackwell Publishing Ltd
structure observed between the north and central GBR,
separated by < 550 km, represents unprecedented genetic
isolation in carcharhinid sharks.
The thorough survey of Hawaiian locations is motivated by
management concerns for the Papahanaumokuakea Marine
National Monument, 2000 km of uninhabited reef in the
Northwestern Hawaiian Islands. However, the Hawaiian
Archipelago also provides a linear array of islands that are
unparalleled for examining fine-scale population structure in
the sea (Ramon et al., 2008; Eble et al., 2009; Craig et al., 2010;
Toonen et al., 2011). For T. obesus the islands of Necker and
the Big Island show evidence of genetic isolation despite
homogeneity throughout the rest of the Hawaiian Archipelago.
The Big Island is the largest and youngest (c. 0.43 Ma; Clague
& Dalrymple, 1987; Carson & Clague, 1995) of the Hawaiian
Islands, and the fixation of hap 1 there may reflect a relatively
recent colonization compared to the other islands, or may
simply be a product of small sample size (n = 7). Necker,
however, is located near the centre of the sampled Hawaiian
locations and has a large sample size (n = 30) but still exhibits
near fixation for hap 1.
It remains unclear why Necker should be genetically isolated
when islands further apart show no significant differences, or
why there should be significant structure between North and
Central GBR populations. However, genetic differentiation is
based primarily on the ratio of just two haplotypes. Non-
random sampling could lead to the inclusion of related
individuals, but this seems unlikely given the small litter size of
this species (a mean of 2.2 pups; Robbins, 2006a). Conversely,
no structure was found between island groups in the Central
Pacific. Although sample sizes were low in some cases, all
populations were dominated by hap 1 and hap 3 in similar
ratios, indicating connectivity over thousands of kilometres of
open ocean.
Dispersal mechanisms and behaviour
We find weak (but significant) support for isolation by
distance, a relationship probably reduced by the strong genetic
structure over short stretches of continuous or intermittent
habitat, combined with less differentiation across some oceanic
divides. These seemingly contradictory findings may be
explained by a combination of behaviour and geography.
Individuals of Triaenodon obesus in Hawaii make periodic
movements of several kilometres (up to 24 km; Whitney et al.,
2012). Assuming similar movements throughout their species
range, a dispersing animal in an insular, shallow area (such as
the South China Sea) or an area of expansive available habitat
(such as the GBR) is likely to encounter suitable alternative
habitat over a much shorter distance than an individual
dispersing from an oceanic island. While the accumulation of
these short movements over time should diminish genetic
differences between areas such as the northern and central
GBR, such movements may be infrequent, centred around a
stable home range, or coupled with some degree of natal
homing for reproduction. High levels of site fidelity can
increase both the resource familiarity and foraging success of
marine animals (Bradshaw et al., 2004), so the long-term
ecological benefits of this may outweigh the advantages of
dispersal and genetic exchange.
Neither short movements nor natal homing are likely for
sharks dispersing from isolated oceanic islands, as these
movements would need to cover a much greater distance than
coastal dispersal before the animal reached suitable habitat.
However, density-dependent factors that serve as motivation
for dispersal may also be greater, potentially leading to
increased rates of dispersal from oceanic islands compared to
coastal habitats. For instance, shallow ledges and caves are rare
at isolated oceanic pinnacles such as Roca Partida (Revillagig-
edo Archipelago, Mexico, 386 km south-west of the Baja
Peninsula). Scarcity of these resting sites forces multiple
T. obesus to stack on top of each other and large muraenids in
the few ledges available (Whitney, 2009), and the inability to
find refuges may be a strong driver of dispersal from this and
other oceanic locations.
Such factors would be expected to have a similar effect on
other reef sharks such as Carcharhinus amblyrhynchos and
Carcharhinus melanopterus, which overlap with T. obesus
throughout much of their range and collectively form the three
most common reef sharks in the tropical Indo-Pacific (Comp-
agno, 1984). Triaenodon obesus is the only one of these species
to have crossed the EPB despite being the least suited to long
periods of continuous swimming (Randall, 1977), and shows no
evidence of the long (> 130 km) repeated trans-oceanic
movements observed in C. amblyrhynchos (Heupel et al.,
2010; C. Meyer, University of Hawaii, pers. comm.). A recent
analysis of sandbar shark (Carcharhinus plumbeus) phylogeog-
raphy presents an even more extreme contrast to T. obesus.
Carcharhinus plumbeus is a large coastal species known to
migrate several thousand kilometres, yet shows strong mtDNA
structure between Hawaii and Australia (Portnoy et al., 2010),
where we find little evidence of structure in T. obesus.
In evaluating the enigma of broad distribution coupled with
no drifting larval stage, two key findings indicate a solution.
First, whitetip reef sharks show population structure along
continuous or semi-continuous habitat, that other broadly
distributed reef sharks are known to transit (Heupel et al.,
2010; C. Meyer, pers. comm.). Second, whitetip reef sharks
show little or no structure across the central-western Pacific
Ocean, whereas other sharks do (Portnoy et al., 2010). That
this weak swimmer is more broadly distributed and exhibits
more connectivity over oceanic gaps than these other shark
species raises the possibility of an entirely different mechanism
of dispersal. Whereas C. melanopterus, C. amblyrhynchos and
C. plumbeus may disperse primarily via active migration,
perhaps T. obesus uses a form of passive or semi-passive
dispersal. Individuals could be driven offshore by storms or
surge (e.g. Heupel et al., 2003), and become associated with
drifting debris or flotsam (e.g. Thiel & Gutow, 2005). Their
low metabolic rate (Whitney et al., 2007) and ability to rest in
place and associate with structure (Randall, 1977) may allow
them to survive for much longer periods on the open ocean
N. M. Whitney et al.
1152 Journal of Biogeography 39, 1144–1156ª 2011 Blackwell Publishing Ltd
than either C. melanopterus or C. amblyrhynchos. Thus T. obe-
sus may have a unique suite of characteristics that paradox-
ically make the species ill-suited for controlled oceanic
migration, but well-suited for surviving lengthy bouts of
oceanic existence. Further surveys of species associated with
flotsam or translocation telemetry experiments would be
required to test this ‘poor swimmer, good drifter’ hypothesis.
CONCLUSIONS
The whitetip reef shark is a reef predator/scavenger with
famously sedentary behaviour, yet a paradoxically broad range.
Individuals will remain motionless for hours, and will return to
the same resting sites for years (Whitney et al., 2012). Indeed
the species name obesus is derived from the Latin word for fat or
plump, a moniker that aptly describes this sedentary behaviour
(Randall, 1977). What are we to conclude, then, about the
sedentary shark with closely related populations distributed
across half the planet? Clearly this species has a life-history
component that allows for occasional or episodic dispersal.
Significant structure is observed between locations on the
GBR, and between a minority of islands within the Hawaiian
Archipelago, consistent with the sedentary behaviour observed
in individuals of the species. However, these results are
contradicted by the companion finding of high connectivity
throughout most of the Hawaiian Islands and between
archipelagos of the Central Pacific. Individuals dispersing
across coastal areas may move a few dozen kilometres before
finding suitable habitat (Whitney et al., 2012), whereas those
dispersing from oceanic islands must move long distances
before finding suitable habitat. Lacking the standard ‘larval’
mechanism of dispersal, we propose that the sedentary
behaviour of the whitetip reef shark may be an asset for
passive dispersal. When dispersing across oceanic, oligotrophic
(low nutrient) waters, a resting stage with reduced metabolic
requirements could be an advantage, and may explain the
paradox of the sleepy shark with a vast range.
ACKNOWLEDGEMENTS
We are grateful to those who helped with sample collection,
particularly H. Whitney, M. Rivera, L. Schutt, M. Silver and
N. Silver, J. Trotta, D. Kushner, J. O’Malley, J. Mahon,
A. Schwanke, P. Fienne, S. Foulger, J. Young and V. Young,
R. Kosaki, C. Meyer, T. TinHan, M. Burns, J. Dale,
Y. Papastamatiou and numerous others. T.S. Daly-Engel,
J.D. DiBattista and J.A. Eble provided valuable comments on
earlier versions of the manuscript. We also thank D. Bellwood
and three anonymous referees for comments that greatly
improved the manuscript. B. Groark generously provided the
shark image used in Fig. 1. This project was funded by a
National Science Foundation (NSF) predoctoral fellowship to
N.M.W. and additional NSF funding to B.W.B. (OCE-0453167
and OCE-0929031), the University of Hawaii Sea Grant
Program (UNIHI-SEAGRANT-JC-04-42), Budweiser/National
Fish and Wildlife Conservation Scholarship program, Profes-
sional Association of Dive Instructors (PADI) Project AWARE,
American Museum of Natural History Lerner-Gray grant, the
University of Hawaii Arts and Sciences Advisory Council, and
the Pritzker Foundation. This work was also funded in part by
a grant/cooperative agreement from the National Oceanic and
Atmospheric Administration (NOAA), Project R/FM-16PD,
which is sponsored by the University of Hawaii Sea Grant
College Program, SOEST, under Institutional Grant No.
NA09OAR4170060 from NOAA Office of Sea Grant, Depart-
ment of Commerce. The views expressed herein are those of
the author(s) and do not necessarily reflect the views of NOAA
or any of its subagencies. Funding to W.D.R. was provided by
the Australian Academy of Science, the Australian Coral Reef
Society, the Great Barrier Reef Marine Park Authority and
CRC Reef. This is contribution no. 1472 from the Hawaii
Institute of Marine Biology, no. 8510 from the School of Ocean
and Earth Science and Technology and no. JC-04-42 from the
University of Hawaii Sea Grant Program.
REFERENCES
Barber, P.H., Erdmann, M.V. & Palumbi, S.R. (2006) Com-
parative phylogeography of three codistributed stomato-
pods: origins and timing of regional lineage diversification
in the Coral Triangle. Evolution, 60, 1825–1839.
Bellwood, D.R. & Wainwright, P.C. (2002) The history and
biogeography of fishes on coral reefs. Coral reef fishes:
dynamics and diversity in a complex ecosystem (ed. by P.F.
Sale), pp. 5–32. Academic Press, San Diego, CA.
Bohonak, A.J. (1999) Dispersal, gene flow, and population
structure. Quarterly Review of Biology, 74, 21–45.
Bonfil, R., Meyer, M., Scholl, M.C., Johnson, R., O’Brien, S.,
Oosthuizen, S., Swanson, S., Kotze, D. & Paterson, M.
(2005) Transoceanic migration, spatial dynamics, and
population linkages of white sharks. Science, 310, 100–103.
Bowen, B.W. & Karl, S.A. (2007) Population genetics and phy-
logeography of sea turtles. Molecular Ecology, 16, 4886–4907.
Bowen, B.W., Clark, A.M., Abreu-Grobois, F.A., Chaves, A.,
Reichart, H. & Ferl, R.J. (1998) Global phylogeography of
the ridley sea turtles (Lepidochelys spp.) inferred from
mitochondrial DNA sequences. Genetica, 101, 179–189.
Bradshaw, C.J.A., Hindell, M.A., Sumner, M.D. & Michael, K.J.
(2004) Loyalty pays: potential life history consequences of
fidelity to marine foraging regions by southern elephant
seals. Animal Behaviour, 68, 1349–1360.
Briggs, J.C. (1966) Zoogeography and evolution. Evolution, 20,
282–289.
Briggs, J.C. (1974) Marine zoogeography. McGraw-Hill, New
York.
Briggs, J.C. (1999) Coincident biogeographic patterns: Indo-
West Pacific Ocean. Evolution, 53, 326–335.
Briggs, J.C. (2005) The marine East Indies: diversity and spe-
ciation. Journal of Biogeography, 32, 1517–1522.
Cappetta, H. (1987) Chondrichthyes II: Mesozoic and Cenozoic
Elasmobranchii. Handbook of Paleoichthyology, Vol. 3B (ed.
by H.P. Schultze). Verlag, Munich.
Oceanic dispersal in a sedentary reef shark
Journal of Biogeography 39, 1144–1156 1153ª 2011 Blackwell Publishing Ltd
Carson, H.L. & Clague, D.A. (1995) Geology and biogeography
of the Hawaiian Islands. Hawaiian biogeography: evolution in
a hotspot archipelago (ed. by W. Wagner and V. Funk), pp.
14–29. Smithsonian Institution Press, Washington, DC.
Castro, A.L.F., Stewart, B.S., Wilson, S.G., Hueter, R.E., Mee-
kan, M.G., Motta, P.J., Bowen, B.W. & Karl, S.A. (2007)
Population genetic structure of Earth’s largest fish, the whale
shark (Rhincodon typus). Molecular Ecology, 16, 5183–5192.
Chabot, C.L. & Allen, L.G. (2009) Global population structure
of the tope (Galeorhinus galeus) inferred by mitochondrial
control region sequence data. Molecular Ecology, 18, 545–
552.
Clague, D.A. & Dalrymple, G.B. (1987) Tectonics, geochro-
nology and origin of the Hawaiian-Emperor volcanic chain.
Volcanism in Hawaii (ed. by R.W. Decker, T.L. Wright and
P.H. Stauffer), pp. 1–54. US Government Printing Office,
Washington, DC.
Clement, M., Posada, D. & Crandall, K.A. (2000) TCS: a
computer program to estimate gene genealogies. Molecular
Ecology, 9, 1657–1659.
Compagno, L.J.V. (1984) FAO species catalogue, Vol. 4. Sharks
of the world: an annotated and illustrated catalogue of shark
species known to date. FAO Fisheries Synopsis No. 125.
United Nations Development Programme/Food and Agri-
culture Organization of the United Nations, Rome.
Cowen, R., Paris, C. & Srinivasan, A. (2006) Scaling of con-
nectivity in marine populations. Science, 311, 522–527.
Craig, M.T., Eble, J.A., Bowen, B.W. & Robertson, D.R. (2007)
High genetic connectivity across the Indian and Pacific
Oceans in the reef fish Myripristis berndti (Holocentridae).
Marine Ecology Progress Series, 334, 245–254.
Craig, M.T., Eble, J.A. & Bowen, B.W. (2010) Origins, ages,
and populations histories: comparative phylogeography of
endemic Hawaiian butterflyfishes (genus Chaetodon). Jour-
nal of Biogeography, 37, 2125–2136.
Dethmers, K.E.M., Broderick, D., Moritz, C., FitzSimmons,
N.N., Limpus, C.J., Lavery, S., Whiting, S., Guinea, M.,
Prince, R.I.T. & Kennett, R. (2006) The genetic structure of
Australasian green turtles (Chelonia mydas): exploring the
geographical scale of genetic exchange. Molecular Ecology,
15, 3931–3946.
Dudgeon, C.L., Broderick, D. & Ovenden, J.R. (2009) IUCN
classification zones concord with, but underestimate, the
population genetic structure of the zebra shark Stegostoma
fasciatum in the Indo-West Pacific. Molecular Ecology, 18,
248–261.
Duncan, K.M., Martin, A.P., Bowen, B.W. & de Couet, H.G.
(2006) Global phylogeography of the scalloped hammerhead
shark (Sphyrna lewini). Molecular Ecology, 15, 2239–2251.
Dupanloup, I., Schneider, S. & Excoffier, L. (2002) A simulated
annealing approach to define the genetic structure of pop-
ulations. Molecular Ecology, 11, 2571–2581.
Eble, J.A., Toonen, R.J. & Bowen, B.W. (2009) Endemism and
dispersal: comparative phylogeography of three surgeon-
fishes across the Hawaiian Archipelago. Marine Biology, 156,
689–698.
Eckert, S.A. & Stewart, B.S. (2001) Telemetry and satellite
tracking of whale sharks, Rhincodon typus, in the Sea of
Cortez, Mexico, and the north Pacific Ocean. Environmental
Biology of Fishes, 60, 299–308.
Excoffier, L., Laval, G. & Schneider, S. (2005) Arlequin (ver-
sion 3.1): an integrated software package for population
genetics data analysis. Evolutionary Bioinformatics Online, 1,
47–50.
Fleminger, A. (1986) The Pleistocene equatorial barrier
between the Indian and Pacific Oceans and a likely cause for
Wallace’s line. UNESCO Technical Papers in Marine Science,
49, 84–97.
Friedlander, A.M. & Demartini, E.E. (2002) Contrasts in
density, size, and biomass of reef fishes between the north-
western and the main Hawaiian Islands: the effects of fishing
down apex predators. Marine Ecology Progress Series, 230,
253–265.
Gaida, I.H. (1997) Population structure of the Pacific angel
shark, Squatina californica (Squatiniformes: Squatinidae),
around the California Channel Islands. Copeia, 1997, 738–
744.
Gaither, M.R., Toonen, R.J., Robertson, D.R., Planes, S. &
Bowen, B.W. (2010) Genetic evaluation of marine biogeo-
graphical barriers: perspectives from two widespread Indo-
Pacific snappers (Lutjanus kasmira and Lutjanus fulvus).
Journal of Biogeography, 37, 133–147.
Gaither, M.R., Bowen, B.W., Bordenave, T.R., Rocha, L.A.,
Newman, S.J., Gomez, J.A., van Herwerden, L. & Craig,
M.T. (2011) Phylogeography of the reef fish Cephalopholis
argus (Epinephelidae) indicates Pleistocene isolation across
the Indo-Pacific Barrier with contemporary overlap in the
Coral Triangle. BMC Evolutionary Biology, 11, 189, doi:
10.1186/1471-2148-11-189.
Heist, E.J. (1999) A review of population genetics in sharks.
American Fisheries Society Symposium, 23, 139–146.
Heist, E.J. (2005) Genetics: stock identification. Management
techniques for elasmobranch fisheries (ed. by J.A. Musick and R.
Bonfil), pp. 62–75. FAO, Fishery Industries Division, Rome.
Heupel, M.R., Simpfendorfer, C.A. & Hueter, R.E. (2003)
Running before the storm: blacktip sharks respond to falling
barometric pressure associated with Tropical Storm Gabri-
elle. Journal of Fish Biology, 63, 1357–1363.
Heupel, M.R., Williams, A.J., Welch, D.J., Ballagh, A., Map-
stone, B.D., Carlos, G., Davies, C. & Simpfendorfer, C.A.
(2009) Effects of fishing on tropical reef associated shark
populations on the Great Barrier Reef. Fisheries Research, 95,
350–361.
Heupel, M.R., Simpfendorfer, C.A. & Fitzpatrick, R. (2010)
Large-scale movement and reef fidelity of grey reef sharks.
PLoS ONE, 5, 1–5.
Hoelzel, A.R., Shivji, M.S., Magnussen, J. & Francis, M.P.
(2006) Low worldwide genetic diversity in the basking shark
(Cetorhinus maximus). Biology Letters, 2, 639–642.
Horne, J.B., van Herwerden, L., Choat, J.H. & Robertson, D.R.
(2008) High population connectivity across the Indo-
Pacific: congruent lack of phylogeographic structure in three
N. M. Whitney et al.
1154 Journal of Biogeography 39, 1144–1156ª 2011 Blackwell Publishing Ltd
reef fish congeners. Molecular Phylogenetics and Evolution,
49, 629–638.
Hourigan, T.F. & Reese, E.S. (1987) Mid-ocean isolation and
the evolution of Hawaiian reef fishes. Trends in Ecology and
Evolution, 2, 187–191.
Jokiel, P. & Martinelli, F.J. (1992) The vortex model of coral
reef biogeography. Journal of Biogeography, 19, 449–458.
Jorgensen, S.J., Reeb, C.A., Chapple, T.K., Anderson, S., Perle,
C., Van Sommeran, S.R., Fritz-Cope, C., Brown, A.C.,
Klimley, A.P. & Block, B.A. (2010) Philopatry and migration
of Pacific white sharks. Proceedings of the Royal Society B:
Biological Sciences, 277, 679–688.
Keeney, D.B. & Heist, E.J. (2006) Worldwide phylogeography
of the blacktip shark (Carcharhinus limbatus) inferred from
mitochondrial DNA reveals isolation of Western Atlantic
populations coupled with recent Pacific dispersal. Molecular
Ecology, 15, 3669–3679.
Keeney, D.B., Heupel, M.R., Heuter, R.E. & Heist, E.J. (2003)
Genetic heterogeneity among blacktip shark, Carcharhinus
limbatus, continental nurseries along the U.S. Atlantic and
Gulf of Mexico. Marine Biology, 143, 1039–1046.
Kohler, N.E., Casey, J.G. & Turner, P.A. (1998) NMFS coop-
erative shark tagging program, 1962–93: an atlas of shark tag
and recapture data. Marine Fisheries Review, 60, 1–87.
Kohler, N.E., Natanson, L.J., Pratt, H.L.J., Turner, P.A. &
Briggs, R. (1999) The shark tagger – 1998 annual summary.
National Marine Fisheries Service, Narragansett, RI.
Leriche, M. (1910) Les poissons tertiaires de la belgique. III. Le
poissons oligocenes. Memoires du Musee Royal d’Histoire
Naturelle de Belgique, 3, 49–228.
Lester, S.E., Ruttenberg, B.I., Gaines, S.D. & Kinland, B.P.
(2007) The relationship between dispersal ability and geo-
graphic range size. Ecological Letters, 10, 745–758.
Lewallen, E.A., Anderson, T.W. & Bohonak, A.J. (2007)
Genetic structure of leopard shark (Triakis semifasciata)
populations in California waters. Marine Biology, 152,
599–609.
Lourie, S.A. & Vincent, A.C.J. (2004) A marine fish follows
Wallace’s Line: the phylogeography of the three-spot
seahorse (Hippocampus trimaculatus, Syngnathidae, Teleo-
stei) in Southeast Asia. Journal of Biogeography, 31, 1975–
1985.
Manni, F., Guerard, E. & Heyer, E. (2004) Geographic patterns
of (genetic, morphologic, linguistic) variation: how barriers
can be detected by Monmonier’s algorithm. Human Biology,
76, 173–190.
Mora, C., Chittaro, P.M., Sale, P.F., Kritzer, J.P. & Ludsin, S.A.
(2003) Patterns and processes in reef fish diversity. Nature,
421, 933–936.
Musick, J.A., Harbin, M.M. & Compagno, L.J.V. (2004)
Historical zoogeography of the Selachii. Biology of sharks and
their relatives (ed. by J.C. Carrier, J.A. Musick and M.R.
Heithaus), pp. 42–105. CRC Press, Boca Raton, FL.
Nelson, D.R. & Johnson, R.H. (1980) Behaviour of the reef
sharks of Rangiroa, French Polynesia. National Geographic
Society Research Report, 12, 479–499.
Nelson, J.S., Hoddell, R.J., Chou, L.M., Chan, W.K. & Phang,
V.P.E. (2000) Phylogeographic structure of false clownfish,
Amphiprion ocellaris, explained by sea level changes on the
Sunda shelf. Marine Biology, 137, 727–736.
Ochoa-Lopez, E., Villavicencio-Garayzar, C.J. & Ruiz-Gaytan,
A. (1997) First record of whitetip reef shark, Triaenodon
obesus in the west coast of Mexico (Revillagigedo Archi-
pelago). Revista de Biologia Tropical, 44/45, 687–688.
Ovenden, J.R., Kashiwagi, T., Broderick, D., Giles, J. & Salini, J.
(2009) The extent of population genetic subdivision differs
among four co-distributed shark species in the Indo-Aus-
tralian archipelago. BMC Evolutionary Biology, 9, 40.
Portnoy, D.S., McDowell, J., Heist, E.J., Musick, J.A. & Graves,
J.E. (2010) World phylogeography and male-mediated gene
flow in the sandbar shark, Carcharhinus plumbeus. Molecular
Ecology, 19, 1994–2010.
Purdy, R.W., Schneider, V.P., Applegate, S.P., Mclellan, J.H.,
Meyer, R.L. & Slaughter, B.H. (2001) The neogene sharks,
rays, and bony fishes from Lee Creek mine, Aurora, North
Carolina. Smithsonian Contributions to Paleobiology, 90, 71–
202.
Ramon, M.L., Nelson, P.A., Demartini, E.E., Walsh, W.J. &
Bernardi, G. (2008) Phylogeography, historical demography,
and the role of post-settlement ecology in two Hawaiian
damselfish species. Marine Biology, 153, 1207–1217.
Randall, J.E. (1977) Contribution to the biology of the whitetip
reef shark (Triaenodon obesus). Pacific Science, 31, 143–164.
Reece, J.S., Bowen, B.W., Joshi, K., Goz, V. & Larson, A. (2010)
Phylogeography of two moray eels indicates high dispersal
throughout the Indo-Pacific. Journal of Heredity, 101, 391–
402.
Reinecke, T., Moths, H., Grant, A. & Breikreutz, H. (2005) Die
Elasmobranchier des norddeutschen Chattiums, insbeson-
dere des Sternberger Gesteins (Eochattium, Oberes Oli-
gozan). Palaeontos, 8, 1–135.
Robbins, W.D. (2006a) Abundance, demography, and popula-
tion structure of the grey reef shark (Carcharhinus am-
blyrhynchos) and the whitetip reef sharks (Triaenodon
obesus) (fam. Carcharhinidae). PhD Thesis, James Cook
University, Townsville, Qld.
Robbins, W.D. (2006b) Evaluation of two underwater biopsy
probes for in situ collection of shark tissue samples. Marine
Ecology Progress Series, 310, 213–217.
Robbins, W.D., Hisano, M., Connolly, S.R. & Choat, J.H.
(2006) Ongoing collapse of coral-reef shark populations.
Current Biology, 16, 2314–2319.
Rocha, L.A., Craig, M.T. & Bowen, B.W. (2007) Phylogeog-
raphy and the conservation of coral reef fishes. Coral Reefs,
26, 501–512.
Rogers, A.R. & Harpending, H. (1992) Population growth
makes waves in the distribution of pairwise genetic differ-
ences. Molecular Biology and Evolution, 9, 552–569.
Schneider, S. & Excoffier, L. (1999) Estimation of demographic
parameters from the distribution of pairwise differences
when the mutation rates vary among sites: application to
human mitochondrial DNA. Genetics, 152, 1079–1089.
Oceanic dispersal in a sedentary reef shark
Journal of Biogeography 39, 1144–1156 1155ª 2011 Blackwell Publishing Ltd
Schrey, A.W. & Heist, E.J. (2003) Microsatellite analysis of
population structure in the shortfin mako (Isurus oxyrin-
chus). Canadian Journal of Fisheries and Aquatic Sciences, 60,
670–675.
Schultz, J.K., Feldheim, K.A., Gruber, S.H., Ashley, M.V.,
Mcgovern, T.M. & Bowen, B.W. (2008) Global phylogeo-
graphy and seascape genetics of the lemon sharks (genus
Negaprion). Molecular Ecology, 17, 5336–5348.
Seutin, G., White, B.N. & Boag, P.T. (1991) Preservation of
avian and blood tissue samples for DNA analyses. Canadian
Journal of Zoology, 69, 82–92.
Taylor, L.C. (1993) Sharks of Hawaii: their biology and cultural
significance. University of Hawaii Press, Honolulu, HI.
Theisen, T.C., Bowen, B.W., Lanier, W. & Baldwin, J.D. (2008)
High connectivity on a global scale in the pelagic wahoo,
Acanthocybium solandri (tuna family Scombridae). Molecu-
lar Ecology, 17, 4233–4247.
Thiel, M. & Gutow, M. (2005) The ecology of rafting in the
marine environment. II. The rafting organisms and com-
munity. Oceanography and Marine Biology: An Annual
Review, 43, 279–418.
Toonen, R.J., Andrews, K.R., Baums, I.B., Bird, C.E., Con-
cepcion, C.T., Daly-Engel, T.S., Eble, J.A., Faucci, A., Gai-
ther, M.R., Iacchei, M., Puritz, J.B., Schultz, J.K., Skillings,
D.J., Timmers, M. & Bowen, B.W. (2011) Defining
boundaries for applying ecosystem-based management: a
multispecies case study of marine connectivity across the
Hawaiian Archipelago. Journal of Marine Biology. Article ID
460173.
Voris, H.K. (2000) Maps of Pleistocene sea levels in Southeast
Asia: shorelines, river systems and time durations. Journal of
Biogeography, 27, 1153–1167.
Ward, D.J. & Bonavia, C.G. (2001) Additions to, and a review
of, the Miocene shark and ray fauna of Malta. Central
Mediterranean Naturalist, 3, 131–146.
Weir, B.S. & Cockerham, C.C. (1984) Estimating F-statistics
for the analysis of population structure. Evolution, 38, 1358–
1370.
Whitney, N.M. (2009) Movements, reproductive behaviour, and
phylogeography of the whitetip reef shark, Triaenodon obesus.
PhD Thesis, University of Hawaii at Manoa, Honolulu, HI.
Whitney, N.M., Papastamatiou, Y.P., Holland, K.N. & Lowe,
C.G. (2007) Use of an acceleration data logger to measure
diel activity patterns in captive whitetip reef sharks,
Triaenodon obesus. Aquatic Living Resources, 20, 299–305.
Whitney, N.M., Pyle, R.L., Holland, K.N. & Barcz, J.T. (2012)
Movements, philopatry, and reproductive seasonality in the
whitetip reef shark (Triaenodon obesus) from community-
based photo-identification. Environmental Biology of Fishes,
93, 121–136.
SUPPORTING INFORMATION
Additional Supporting Information may be found in the
online version of this article:
Appendix S1 Intra-specific polymorphic nucleotide posi-
tions of control region haplotypes in Triaenodon obesus.
As a service to our authors and readers, this journal provides
supporting information supplied by the authors. Such mate-
rials are peer-reviewed and may be re-organized for online
delivery, but are not copy-edited or typeset. Technical support
issues arising from supporting information (other than
missing files) should be addressed to the authors.
BIOSKETCH
Nicholas M. Whitney is a Staff Scientist in the Center for
Shark Research at Mote Marine Laboratory. The data
described here were collected as part of his PhD dissertation
at the University of Hawaii at Manoa and William D.
Robbins’ PhD dissertation at James Cook University,
Australia.
Author contributions: N.M.W. and W.D.R. conceived the
study, collected the samples, and performed the laboratory
work; J.K.S., W.D.R. and N.M.W. processed the data and
performed analyses; B.W.B. and K.N.H. guided the study
design, logistics, sampling strategy, and provided lab support;
N.M.W, W.D.R., K.N.H. and B.W.B. procured funding for the
study; N.M.W., J.K.S. and B.W.B. led the writing, which
received significant inputs from all authors.
Editor: David Bellwood
N. M. Whitney et al.
1156 Journal of Biogeography 39, 1144–1156ª 2011 Blackwell Publishing Ltd