Awareness of Physical Activity Levels and Sedentary Behaviour
116
Western University Western University Scholarship@Western Scholarship@Western Electronic Thesis and Dissertation Repository 3-7-2013 12:00 AM Awareness of Physical Activity Levels and Sedentary Behaviour: Awareness of Physical Activity Levels and Sedentary Behaviour: An Assessment of Awareness of Physical Activity Levels and An Assessment of Awareness of Physical Activity Levels and Sedentary Behaviour Among Parents and Children Sedentary Behaviour Among Parents and Children Tripat Simran Kaur Grewal, The University of Western Ontario Supervisor: Dr. Alan Salmoni, The University of Western Ontario A thesis submitted in partial fulfillment of the requirements for the Master of Arts degree in Kinesiology © Tripat Simran Kaur Grewal 2013 Follow this and additional works at: https://ir.lib.uwo.ca/etd Part of the Behavior and Behavior Mechanisms Commons, Kinesiology Commons, and the Public Health Education and Promotion Commons Recommended Citation Recommended Citation Grewal, Tripat Simran Kaur, "Awareness of Physical Activity Levels and Sedentary Behaviour: An Assessment of Awareness of Physical Activity Levels and Sedentary Behaviour Among Parents and Children" (2013). Electronic Thesis and Dissertation Repository. 1155. https://ir.lib.uwo.ca/etd/1155 This Dissertation/Thesis is brought to you for free and open access by Scholarship@Western. It has been accepted for inclusion in Electronic Thesis and Dissertation Repository by an authorized administrator of Scholarship@Western. For more information, please contact [email protected].
-
Upload
khangminh22 -
Category
Documents
-
view
0 -
download
0
Transcript of Awareness of Physical Activity Levels and Sedentary Behaviour

Western University Western University
Scholarship@Western Scholarship@Western
Electronic Thesis and Dissertation Repository
3-7-2013 12:00 AM
Awareness of Physical Activity Levels and Sedentary Behaviour: Awareness of Physical Activity Levels and Sedentary Behaviour:
An Assessment of Awareness of Physical Activity Levels and An Assessment of Awareness of Physical Activity Levels and
Sedentary Behaviour Among Parents and Children Sedentary Behaviour Among Parents and Children
Tripat Simran Kaur Grewal, The University of Western Ontario
Supervisor: Dr. Alan Salmoni, The University of Western Ontario
A thesis submitted in partial fulfillment of the requirements for the Master of Arts degree in
Kinesiology
© Tripat Simran Kaur Grewal 2013
Follow this and additional works at: https://ir.lib.uwo.ca/etd
Part of the Behavior and Behavior Mechanisms Commons, Kinesiology Commons, and the Public
Health Education and Promotion Commons
Recommended Citation Recommended Citation Grewal, Tripat Simran Kaur, "Awareness of Physical Activity Levels and Sedentary Behaviour: An Assessment of Awareness of Physical Activity Levels and Sedentary Behaviour Among Parents and Children" (2013). Electronic Thesis and Dissertation Repository. 1155. https://ir.lib.uwo.ca/etd/1155
This Dissertation/Thesis is brought to you for free and open access by Scholarship@Western. It has been accepted for inclusion in Electronic Thesis and Dissertation Repository by an authorized administrator of Scholarship@Western. For more information, please contact [email protected].

AWARENESS OF PHYSICAL ACTIVITY LEVELS AND SEDENTARY BEHAVIOUR: AN ASSESSMENT OF AWARENESS OF PHYSICAL ACTIVITY LEVELS AND
SEDENTARY BEHAVIOUR AMONG PARENTS AND CHILDREN
(Thesis format: Monograph)
by
Tripat Simran Kaur Grewal
Graduate Program in Kinesiology
A thesis submitted in partial fulfillment of the requirements for the degree of
Master of Arts
The School of Graduate and Postdoctoral Studies The University of Western Ontario
London, Ontario, Canada
© Tripat Simran Kaur Grewal, 2013

ii
Abstract
The purpose of this study was to assess awareness of physical activity and sedentary
behaviour among parents and children aged 10-13 years. Associations between awareness
and factors including age, BMI, gender, and obesity status were also examined. A total of 53
parent-child dyads participated in the study. Agreement between parent and child subjective
measures (self-report) and objectively measured physical activity was examined to determine
awareness. Most parents (87%) and children (83%) overestimated child moderate-vigorous
physical activity (MVPA) beyond 30 minutes/day. The majority of parents (87%) and
children (85%) also underestimated child sedentary behaviour by at least 3 hours/day. Older
children were more likely to overestimate physical activity and underestimate sedentary
behaviour than younger children. This study highlighted the lack of awareness among parents
and children regarding child physical activity and sedentary behaviour. Health promotion
efforts should focus on raising awareness levels among parents and children to initiate
behaviour change.
Keywords
Awareness, Parental awareness, child awareness, physical activity, sedentary behaviour,
parent-child concordance

iii
Acknowledgments
I would like to express my deep gratitude to my supervisor, Dr. Alan Salmoni, for his
tremendous support, encouragement and guidance throughout my journey as a Master’s
student. Thank you very much for your patience, valuable guidance, knowledge, and much
valued critique throughout this entire project. I could always count on you to keep me afloat
and your constant encouragement was much appreciated. I have not met another professor
who has been so willing and open to go to any lengths to help out his students!
I am also deeply indebted to my thesis committee members, Dr. Shauna Burke and Dr. Lynne
Zarbatany. Thank you very much for your constant support, feedback and invaluable
insights. I was lucky to have Dr. Burke and Dr. Zarbatany as my committee members, since
they were very generous with their time, suggestions and went out of their way to assist me
through this entire academic experience. I would also like to thank my examining committee,
Dr. Lynne Zarbatany, Dr. Harry Prapavessis and Dr. Earl Noble for their precious time and
valuable insights into the study.
This project could not have been possible without the tremendous dedication that I received
from administrators and teachers of Sunny View Middle School, Brampton and Khalsa
School, Malton. The response that I received from these schools was phenomenal and spoke
great volumes about how much physical activity is valued by the school authorities. Mr.
Gibson and Dr. Soni were very enthusiastic and supportive throughout the entire project and
ensured the smooth completion of the data collection process. I thank you once again for
your understanding, generosity and valuable insights on the project. I would also like to
extend my deepest gratitude to the parents and children who willingly agreed to participate in
the study.
I also had the great pleasure of having Paula van Wyk as a guide and friend during my stay at
London, Ontario. Paula was always so kind and willing to help; grad school would not have
been the same without Paula. I still remember all the pep talks we had in the office and I
must say those pulled me through. Thank you for being who you are! And, thanks for always
proofreading my work despite having an unbelievable workload of your own. I could always
count on you no matter what! I would also like to thank my best friends, Manpreet, Shivali,

iv
and Akash for always being there for me and making me laugh whenever I felt low! Your
love, friendship and support are invaluable. Gurman, Sukhi, Raj Aunty, Uncle and Dilpreet,
it is so nice to have you all as family. Your love and support is cherished by me.
Finally, I would like to thank the people that have stood by me through thick and thin no
matter where they are. Papa and Bibi, you are most precious grandparents and thank you for
always being there for me. Manpreet S. Dhalla, you are my rock and the love of my life.
There are no words to describe how much you mean to me. Thank you for all those times
when you didn’t care about your own exhaustion and went to great lengths to help me. The
little things that you do for me on daily basis speak volumes about your love for me. Thank
you for always believing in me and supporting me throughout. Peyaam Gurnoor Singh, you
are my most precious little boy and I love you to bits. Tejinder Veer Ji, you are the most
amazing and loving older brother. Thank you for always being there for me. Satti your
sarcasm is what keeps everything interesting and always manages to make us all laugh.
Thank you for your occasional words of encouragement. Out of all seriousness, I simply love
you. I have been blessed with best friends and confidantes in the disguise of my sisters
Simma, Anant, Atti, Jas and Harji. Simma Bhenji and Anant Bhenji, thank you for always
attending my panic calls, standing by my side and making me realize life is a fun ride. I love
you both for who you are. Jas, you have been my best friend and partner in crime since the
day you started talking. I can’t thank you enough for all the times that you have helped
proofread and listened to me talk about my thesis. You are very dear to my heart and thank
you for loving me so selflessly. Your encouragement and support is what gets me through
everything. Satti and Jas- I love you both for going to London with me all the time. Harji and
Atti, I can’t describe how much I love you both. I know I can always count on you. Harji,
thank you for always being there and being the most adorable baby sister. Mum and Daddy, I
love you both beyond words. You both are my inspiration and I wish you all the happiness in
life. All I have achieved till today is attributable to your hard work and love for me. Thank
you for always pushing me to pursue my dreams and loving me unconditionally. Your
support, love and faith in me have given me the courage to walk fearlessly out into the world.
To Mum & Dad in Florida, thank you for the constant love, understanding and support. Sona
Bhenji and Mandeep Veer Ji, I am so glad to you have you as siblings. Florida would not be
the same without you both! Thank you Dilnaam and Kalyaan, for always making me feel so

v
special and the most loved Chachi Ji. This project would not have been possible without any
of you! Above all, I bow in reverence to the Almighty, whose blessings have guided and
helped not only during this project but all my life.

vi
Table of Contents
Abstract ............................................................................................................................... ii
Acknowledgments.............................................................................................................. iii
Table of Contents ............................................................................................................... vi
List of Tables ..................................................................................................................... ix
List of Figures ..................................................................................................................... x
List of Appendices ............................................................................................................. xi
Chapter 1 ............................................................................................................................. 1
1 Introduction and Literature Review ............................................................................... 1
1.1 Awareness of Physical Activity levels among Children ......................................... 4
1.2 Awareness of Child Physical Activity levels among Parents ................................. 6
1.3 Discordance between Parent and Child levels of Awareness ............................... 10
1.4 Measures employed to assess Physical Activity and Sedentary Behaviours among
Children................................................................................................................. 10
1.4.1 Physical Activity ....................................................................................... 10
1.4.2 Sedentary Behaviours ............................................................................... 14
1.5 Purpose of the study .............................................................................................. 14
Chapter 2 ........................................................................................................................... 17
2 Method ......................................................................................................................... 17
2.1 Participant Characteristics .................................................................................... 17
2.2 Procedure .............................................................................................................. 17
2.3 Measures ............................................................................................................... 19
2.4 Statistical Analyses ............................................................................................... 21
Chapter 3 ........................................................................................................................... 24
3 Results .......................................................................................................................... 24
vii
3.1 Children’s Self-Reported Physical Activity Levels .............................................. 24
3.2 Children’s Objectively Measured (Actical) Physical Activity levels ................... 26
3.3 Difference between Child Self-Report and Objective Data .................................. 30
3.3.1 Child Over and Underestimation .............................................................. 30
3.4 Difference between Parent Report and Their Children’s Objective Physical
Activity Data ......................................................................................................... 38
3.4.1 Parent Over and Underestimation ............................................................. 39
3.5 Difference between Parent and Child Self-Reported Physical Activity ............... 47
3.6 Correlation between BMI, Age, and Physical Activity Levels ............................. 49
Chapter 4 ........................................................................................................................... 50
4 Discussion .................................................................................................................... 50
4.1 Child Awareness of Physical Activity and Sedentary Behaviour ......................... 51
4.2 Parent Awareness of Child Physical Activity and Sedentary Behaviour ............. 55
4.3 Discordance between Child and Parents’ Awareness of Child’s Physical Activity
and Sedentary Behaviour ...................................................................................... 57
4.4 Association between Gender, BMI, Age and Awareness (both Child and Parent)
............................................................................................................................... 58
4.4.1 Gender Differences ................................................................................... 58
4.4.2 Age ............................................................................................................ 59
4.4.3 BMI ........................................................................................................... 59
Chapter 5 ........................................................................................................................... 60
5 Conclusion ................................................................................................................... 60
5.1 Limitations of the Study........................................................................................ 61
5.2 Implications........................................................................................................... 62
References ......................................................................................................................... 66
Appendices ........................................................................................................................ 78
Curriculum Vitae ............................................................................................................ 103

viii
Curriculum Vitae ............................................................................................................ 104

ix
List of Tables
Table 1: Participant Characteristics ....................................................................................... 25
Table 2: Average daily minutes/hours of Physical activity and Inactivity measured by the
Actical Accelerometers ........................................................................................................... 27
Table 3: t –test results comparing Objectively measured Weekday vs. Weekend Physical
Activity and Sedentary Behaviour .......................................................................................... 28
Table 4: t –test results comparing Child Self-reported and Objectively measured Physical
Activity and Sedentary Behaviour .......................................................................................... 31
Table 5: t –test results comparing Parent-reported and Objectively measured Child Physical
Activity and Sedentary Behaviour .......................................................................................... 40
Table 6: t –test results comparing Child Self-reported and Parent-reported Child Physical
Activity and Sedentary Behaviour .......................................................................................... 48

x
List of Figures
Figure 1: Difference between Perceived Vigorous Activity (Child) versus Objectively
measured Vigorous Activity ................................................................................................... 32
Figure 2: Difference between Perceived Moderate Activity (Child) versus Objectively
measured Moderate Activity ................................................................................................... 35
Figure 3: Difference between Perceived MVPA (Child) versus Objectively measured MVPA
................................................................................................................................................. 36
Figure 4: Difference between Perceived Sedentary (both screen- and non-screen related
sedentary behaviours) Activity (Child) versus Objectively measured Sedentary Activity .... 37
Figure 5: Difference between Perceived Vigorous Activity (Parent) versus Objectively
measured Vigorous Activity ................................................................................................... 41
Figure 6: Difference between Perceived Moderate Activity (Parent) versus Objectively
measured Moderate Activity ................................................................................................... 43
Figure 7: Difference between Perceived MVPA (parent) versus Objectively measured
MVPA ..................................................................................................................................... 45
Figure 8: Difference between Perceived Sedentary Activity (both screen- and non-screen
related health behaviour) (Parent) versus Objectively measured Sedentary Activity ............ 46

xi
List of Appendices
Appendix A: Invitation Letter ................................................................................................ 78
Appendix B: Information Leaflet (Class Teacher) ................................................................ 81
Appendix C: Parent/Guardian Letter of Information ............................................................. 84
Appendix D: Child Assent Form ........................................................................................... 91
Appendix E: Modified SHAPES Questionnaire for Children ............................................... 93
Appendix F: Modified SHAPES Questionnaire for Parents .................................................. 98
Appendix G: Ethics Form .................................................................................................... 103

1
Chapter 1
1 Introduction and Literature Review
Inactivity has been identified as one of the four behavioural risk factors
influencing the global non-communicable disease (NCD) epidemic. According to a report
published by the World Health Organization (WHO), physical inactivity leads to 3.2
million deaths each year with a 20-30% increased risk of all-cause mortality in
individuals (Global Status Report, 2011). Lack of physical activity as a child can lead to
many diseases as an adult (Adamo, Prince, Tricco, Connor-Gorber & Tremblay, 2009).
As physical activity declines with age, it is important that habits associated to outdoor or
recreational sports are developed during early childhood (Corder et al., 2010). The
Canadian Physical Activity Guidelines, released by the Canadian Society for Exercise
Physiology (CSEP), for all healthy children (5-11 years) and youth (12-17 years)
recommend at least 60 minutes of moderate-to-vigorous physical activity (MVPA) daily
(Active Healthy Kids Canada, 2011). However, recent Canadian Health Measures Survey
(CHMS 2007-09) accelerometer data reveal that on average only 7% of Canadian
children and youth are meeting these guidelines. In addition, during the after school
period (from 3-6 p.m.), which is considered an important window of opportunity for
children and youth to engage in active play, 6-19 year olds in Canada are getting only 14
minutes (8%) of MVPA out of 180 minutes available (Active Healthy Kids Canada,
2011). In contrast, 107 minutes (92% of after school time) is being spent in either light
activity (e.g., walking less than 3.2 kilometers per hour, light play) or sedentary pursuits
(e.g., motorized transportation, sitting, reclining, standing) (Active Healthy Kids Canada,
2011). The rapid rise of screen-based sedentary behaviours (increased hours in front of a
TV or internet/computer use) is substantially contributing to inactive lifestyles in
Canadians consequently making physical inactivity a major health concern for Canada
(Sari, 2009).
Regular physical activity has consistently been linked to a range of physical and
mental health benefits (Active Healthy Kids Canada, 2011; Woods, Mutrie, & Scott,
2002). The positive relationship between physical activity and improved health outcomes

2
for children has been examined by several reviews in the past (Janssen & LeBlanc, 2010).
A US-based systematic review on health and behavioural outcomes associated with
regular physical activity supported the beneficial effects of physical activity for
overweight/obese and normal weight school-age youth (6-18 years). The evidence-based
data strongly supported physical activity-related health benefits on adiposity levels,
musculoskeletal health and several markers of cardiovascular health for overweight/obese
children. Positive outcomes of physical activity for normal weight children/youth
included beneficial effects on adiposity levels, on cardiovascular health markers and
fitness (e.g., lipoprotein levels, plasma lipids, blood pressure for normotensive youth, and
cardiovascular autonomic tone) and on psychological health predictors (e.g., anxiety,
depression, self-concept) (Strong et al., 2005). Janssen and LeBlanc (2010) also
conducted an extensive review on effects of physical activity primarily targeting 7 health
indicators: “high blood cholesterol, high blood pressure, the metabolic syndrome, obesity,
low bone density, depression, and injuries” (p. 1). The recommendations made by the
authors conformed to the new guidelines suggesting accumulation of at least 60 minutes
of MVPA daily and incorporation of muscle-bone strengthening activities for at least
three days of the week to achieve optimal health benefits in children and youth. Hence,
strong and consistent evidence links daily participation in physical activity to associated
health benefits. A dose-response relationship has been observed, such that increased
physical activity has been associated with improved health outcomes (Janssen &
LeBlanc, 2010; Active Healthy Kids Canada, 2011).
To date, public health agencies have focused extensively on physical activity, and
have paid minimal attention to the evidence suggesting sedentary behaviour as a distinct
health issue (Active Healthy Kids Canada, 2011). There is no doubt that lack of MVPA
has negative effects on health. However, researchers argue that sedentary behavior has
its own unique set of effects on health outcomes, including metabolism and physical
fitness. Hence, excessive sedentary behaviour, apart from lack of MVPA, should be
considered a separate construct with unique implications for health (Tremblay, Colley,
Saunders, Healy & Owen, 2010). Recent evidence suggests that increased time spent in
sedentary behaviours is associated with increased risk of metabolic dysfunction (which
includes a cluster of cardiovascular disease and Type 2 diabetes risk factors) and

3
cardiovascular disease, deleterious effects on bone and vascular health, unfavorable body
composition (increased adiposity, obesity), negative effects on psychosocial health (e.g.
decreased self-esteem, lower body satisfaction, behavioural problems), and poorer
school performance (Active Healthy Kids Canada, 2011; Tremblay et al., 2010). Similar
to physical activity, a dose-response relationship is observed linking greater sedentary
activity with greater adverse outcomes (Tremblay, et al., 2010). The new Canadian
Sedentary Behaviour Guidelines recognize two indicators of sedentary behaviours:
Screen-Based Sedentary Behaviours (e.g., TV, computer, smart phones) and Non-Screen
Sedentary Behaviours (e.g., motorized transport, doing school work/studying,
socializing) (Active Healthy Kids Canada, 2011). Canadian children spend an average of
8.6 hours per day (62% of their waking hours) engaging in various screen- and non-
screen based sedentary pursuits (CHMS, 2007-09). This is a cause of great concern given
the deleterious effects of increased sedentary behaviour on health outcomes (Active
Healthy Kids Canada, 2011). Considering children do fulfill the New Canadian Physical
Activity Guidelines (60 minutes MVPA/day), they still have 23 hours left in a day within
which the time allocated for sleeping, school, work or “free time” can vary widely
(Active Healthy Kids Canada, 2011). Targeting this “free time” may serve as an effective
strategy to encourage incidental movement and active play, and thus, limit excessive
sedentary behaviour (Active Healthy Kids Canada, 2011).
The abovementioned statistics on Canadian children’s levels of daily physical
activity and sedentary behaviour are alarming and highlight the need for children’s
physical activity and sedentary behaviour to change. However, health promotion
interventions aiming towards behavioural change “should be based on empirical
knowledge about present behaviour, behavioural determinants and mechanisms of
behavioural change” (Ronda, Van Assema, & Brug, 2001, p. 305). One such
mechanism/process of health-related behavioural change is explained by the Trans-
theoretical model. The Transtheoretical model (TTM), an integrative and comprehensive
model of behaviour change, has been applied to various health related behaviours
including exercise (Woods, et al., 2002; Ronda et al., 2001). One of the key organizing
concepts in the TTM is the construct of stages of change, which represents behaviour
change as a process rather than one single event (Cobb, 2011). According to the

4
aforementioned theory, an individual goes through different stages before actually
changing his/her health-related behavior. Initially, the individual is unaware or unwilling
to change, then slowly starting to recognize and considering the need for change, but still
does not change his/her behavior. Finally, the person takes action and makes the change,
sustaining the changed behavior (Cobb, 2011). In the context of a child’s physical
activity and a parent’s potential role, the stages are: (1) pre-contemplation- the
parent/child is unaware of the problem (too little physical activity) and therefore there is
no intention to change; (2) contemplation-the parent/child acknowledges the problem and
the need to change behaviour but still has not taken action; (3) preparation- the
parent/child have begun identifying ways to change health related behaviour; (4) action-
the parent/child is actively involved in changing sedentary behaviour (but for less than
six months); (5) maintenance- the parent/child sustains behaviour change for at least six
months so the changes eventually become routine (Sealy & Farmer, 2011).Therefore,
awareness has been identified as an independent correlate of behaviour change and
awareness of risk behaviour is supposed to be especially important to motivate movement
from pre-contemplation to contemplation of behaviour change (Ronda, et al., 2001;
Kremers, Dijkman, de Meij, Jurg, & Brug, 2008).
1.1 Awareness of Physical Activity levels among Children
To date, very few studies have investigated awareness of physical activity levels
among young children and adolescents. Kremers, Dijkman, de Meij, Jurg, and Brug
(2008) explored the awareness levels of Dutch school children aged 8-13 years and the
degree to which their physical activity was habitual. The authors also tested the potential
influence of factors such as “awareness” and habit strength” on determining exercise
behaviours. The majority of the study population (64%) was unaware of their physical
activity levels, and children who were aware of their own physical activity behaviour
were reported to be more physically active on an average of 20 minutes per day
compared to their unaware counterparts. Out of the total 64%, 23% consisted of under
estimators while 41% were over estimators. Thus, this study highlighted the importance
of awareness of physical activity behaviour on physical activity levels in children.
However, the study used self-reports to quantify physical activity, which provides a less

5
accurate outlook on child physical activity behaviour compared to objective measures. In
a more recent study, Corder et al. (2010) assessed physical activity level awareness
among British children aged 9-10 years and found a lack of awareness of physical
activity behaviour among inactive children. This study examined the agreement between
self-reported physical activity perception and an objective measure of physical activity.
Of the total 30.9% of children who were inactive, 40% overestimated their physical
activity levels and lacked awareness.
In this light, an accurate perception of behaviour (e.g., level of physical activity
and sedentary behaviour) should be a significant factor in the promotion of positive
change. Individuals who are unaware of their inadequate physical activity level have
less positive intention to increase their physical activity levels as compared to those who
perceive themselves as less physically active or inactive (Ronda, et al., 2001). An
accurate perception of health behaviour is associated with increased intention to change
health-risk behaviour compared to an inaccurate perception. Children unaware of their
own activity levels are less likely to introduce positive behavioural changes in their
lifestyle (Kremers, et al., 2008). Lack of awareness of physical activity among children
is likely to make them “less susceptible to educational programmes primarily based on
influencing attitudes, norms, self-efficacy or other cognitive factors, because they will not
perceive a need to change” (Kremers, et al., 2008, p. 483). This also explains the lack of
effectiveness of physical activity interventions since awareness of physical activity and
sedentary levels among the general population has received minimal attention (Corder et
al., 2010). Therefore, researchers argue that to effectively promote physical activity, such
health education programmes should primarily focus on raising awareness levels among
children (Kremers, et al., 2008). More importantly, children’s perceptions about a
particular behaviour should not be neglected when implementing programs to initiate
behaviour change and improve physical activity (Cottrell et al., 2012). Investigating
children’s perceptions about their own physical activity and sedentary behaviour may
lead to a better understanding of the target population and provide evidence-based
information to health providers and policy makers to develop interventions accordingly.
Findings from the study demonstrate that health providers and policy makers should
avoid focusing only on the parent as the audience for the health related behaviour change.

6
As children move from childhood to early adolescence, they tend to apply their own
perceptions and beliefs for various health-related behaviours (Cottrell et al., 2012).
Hence, incorporating children’s perceptions and reports may prove to be beneficial and
increase effectiveness of physical activity interventions (Cottrell et al., 2012).
1.2 Awareness of Child Physical Activity levels among Parents
Apart from child awareness, exploring other potential factors that influence child
physical activity and sedentary behaviour is crucial to overcome the large gap between
current health and national recommendations (Hennessy, Hughes, Goldberg, Hyatt and
Economos, 2010). One factor that has attracted considerable research attention in the past
is parents’ influence on children’s physical activity and sedentary behaviour (Trost &
Loprinzi, 2011; Jago, Fox, Page, Brockman, & Thompson, 2010). During childhood and
adolescence, family plays a critical role in modifying and encouraging the acquisition of
behaviours, including health-related behaviour (Hedwig, 2009; Ornelas, Perreira, &
Ayala, 2007). Children rely on their immediate family (especially their parents) to learn
positive behaviors and beliefs (Kirby, Levin, & Inchley, 2011). Hence, within the family
dynamics, parents are in a position to influence their child’s health-related behaviours
through several mechanisms (Cottrell et al., 2012). Parents influence their children
directly through specific parenting practices such as: providing a supportive and
nurturing environment; rewarding and praising healthy behaviour; incorporating physical
activity routine in family recreation time; providing transportation to sports events;
establishing acceptance and/or expectations for certain activities around the house;
restricting sedentary activities; encouraging active leisure choices; and making available
various sports equipment at home and the community (Ha, Abbot, Macdonald & Pang,
2009; Cottrell et al., 2012).
Furthermore, parents, being the primary caregivers of their children are often
viewed as their mentors and role models (Cottrell et al., 2012). They are generally seen as
the central agents of change in the promotion of healthy behaviours such as healthy
eating and activity in their children (Slater, Bowen, Corsini, Golley & Noakes, 2009).
Socialization theory emphasizes the active role of parents as role models for their

7
children helping them understand the norms regarding behaviour, and thus,
inactive/obese parents can downplay the importance of physical activity (Hedwig, 2009).
Also, young children rely on their role models’ perceptions to shape their own
perceptions about current and future lifestyles (Hedwig, 2009). As a result, parents as role
models can play an active role in encouraging children to acquire healthy behaviours
(such as regular exercise) and sustaining them or vice-versa (Hedwig, 2009).
The reviewed literature on role of parents in child physical activity suggests that
parents exert a widespread influence on a child’s health-related behaviours. Parents
serving as role models and central agents of change should have the ability to influence
change in certain health-risk behaviours such as physical inactivity and excessive
sedentary behaviour. However, previous research has indicated that most parents tend to
misperceive their children’s physical activity levels. Parents tend to think their children
are active enough, and thus, do not recognize the fact that their child’s activity levels may
not be meeting the recommended guidelines of daily physical activity required for
optimal health (Chiang, Molin, Byrd, & Crawford, 2009; Corder et al., 2011). Corder,
Crespo, van Slujis, Lopez, and Elder (2012) assessed parental awareness of child physical
activity over a period of 7 days. Results revealed that most parents (80%) lacked
awareness and tended to overestimate their children’s physical activity on more than one
measurement day. Although children only met the physical activity guidelines (i.e., 60
minutes/day of MVPA) on 43% of the days, parents overestimated their child’s physical
activity on 75% of the days when children were found to be inactive. Another study
conducted by Mota and Queiros (1996) compared parental perception and child self-
reported activity. The authors found that parents’ perceptions of their children’s activities
were contradictory to those reported by the children. Most parents believed their children
to be equally or more active than their peers and as active as they should be despite the
fact that more than half of the study population was not involved in athletic training and
regular after-school physical activity programmes. Children and youth involved in
organized sports or after school physical activity have been reported to accumulate 1,600
more daily steps compared to those who do not participate. However, this difference can
be easily covered by children engaging themselves in active play or unstructured physical
activity to accommodate for the extra 1,600 steps that children in organized sport

8
accumulate (Active Healthy Kids Canada, 2011). In the Mota and Querios (1996) study,
despite parents perceiving their children to be sufficiently active and as active as other
children, children were found to be only moderately active. Thus, the findings of the
study highlighted the disconnect between parent perception and reported child physical
activity. The findings of the study, however, need to be interpreted with caution since the
accuracy of parental perception/awareness was assessed based on subjective information
rather than objective measures of physical activity. As most health policies and
interventions rely on parental report of child physical activity, improved awareness
among parents is essential to accurate reporting of child inactivity. The lack of awareness
of child activity levels among parents may result in parental misperception and inactive
children “being overlooked or neglected in health promotion efforts as these commonly
target self-rated inactive populations” (van Slujis, Griffin, & van Poppel, 2007).
Chiang, Molin, Byrd, and Crawford (2009) also conducted a study on 407 parent-
child dyads to determine the accuracy of parent perceptions of child weight status, diet
and amount of physical activity engaged in by the child. Parents were asked to describe
their child’s weight status and also report on their perceptions of the child’s physical
activity and diet. In all, 76% of parents of overweight children viewed the child as
healthy weight rather than overweight, and nearly 90% of parents of obese children
viewed the child as healthy weight or only slightly overweight. With regards to physical
activity, 92% of the parents of overweight children and 82% of the parents of obese
children viewed their child as either very or fairly physically active. Of normal-weight
children, more than 95% of parents described their child to be as either very or fairly
physically active. Although, parental accuracy of child weight status was found to be
unrelated to their perceptions of the child being active versus inactive, an objective
physical activity measurement was not used to assess the accuracy of parental perception
of the child’s activity levels which may serve as a limitation.
Corder et al. (2010) assessed awareness of physical activity levels among British
school children aged 9-10 years and their parents. This study explored the agreement
between perceived (child and parent reported) physical activity and objectively measured
physical activity. A total of 80% of parents of inactive children lacked awareness of their

9
child’s activity levels and assumed their child to be sufficiently active. The study
conducted by Corder et al. utilized an objective measure of physical activity to classify
awareness levels among children and parents. Based on the British physical activity
recommendations, a threshold of an average of 60 minutes of MVPA per day was used to
derive a dichotomous MVPA variable classifying the child as active or inactive. The
subjective measure asked children to report perceived physical activity based on one of
the five categories (much more active, more active, about average, less active, or much
less active). Parental perception was also taken into account. Data were then grouped into
four physical activity awareness groups; realistic active, under estimator, realistic inactive
and over estimator. However, the categorization of the objective and subjective data
collectively into four physical activity groups of awareness seemed to place
overestimators only among inactive children. It might be a possibility that some children
only attaining the minimum threshold of 60 min/day perceived themselves to be much
more active than others in the same category reflecting on overestimation among those
active children, ultimately posing as a barrier to engage in more physical activity. The
data presented did not predict the extent to which children and parents misperceived their
child’s physical activity on daily basis. This may serve as a methodological limitation
since the subjective questions assessing awareness were not directly comparable to what
the accelerometer was measuring. Therefore, a study design comparing self-reported data
directly with the accelerometer data using the same units (e.g., minutes/day, kcal/day)
may provide a more accurate picture of physical activity awareness among parents and
children.
Despite the shortcomings of the previous studies, a consistent lack of parental
awareness of child physical activity and sedentary behaviour has been observed. Parents’
lack of awareness or misperception of their child’s physical activity levels may have
important implications. For instance, parental ignorance regarding the need for change
may act as a barrier to behaviour change in children rendering public health messages
concerning physical activity ineffective (van Slujis, et al., 2007). Parents may be less
likely to encourage their children to increase their activity levels and modify risk
behaviour if they wrongly presume their child to be sufficiently active (Corder et al.,
2011).

10
1.3 Discordance between Parent and Child levels of Awareness
Behavior change may also rely on the degree of discordance in perception
between a parent and child (Cobb, 2011).Therefore, examining the concordance between
parent and child awareness of the child’s physical activity and sedentary behaviour may
lead to a clearer understanding of family dynamics (Cobb, 2011). Given the important
role that the parents’ and child’s awareness of health risk behaviours play in the
acquisition of healthy behaviours in children, any discordance between the parent and
child’s levels of awareness may hinder progression through different stages of change.
The parent may be aware of the child’s health-risk behaviour and willing to change;
however, the child may be unaware and may not feel the need to change. The
disagreement between the parent’s and child’s perception of activity levels and sedentary
behavior may pose a barrier to health behaviour change in a family-based intervention
that targets the involvement of both the parent and the child.
1.4 Measures employed to assess Physical Activity and Sedentary Behaviours among Children
1.4.1 Physical Activity
Physical activity is considered a complex multi-dimensional behaviour, and thus,
difficult to assess because individuals are active in different ways and settings. Hence,
determining if one is exercising enough may be difficult to evaluate (van Sluijs, et al.,
2007). When determining how to measure level of physical activity, researchers and
practitioners should carefully consider “participant age, sample size, respondent burden,
type of physical activity data required (data output), time frame, method/delivery mode,
and measurement error and cost (instrument and administration)” (Loprinzi & Cardinal,
2011). A range of measures can be used to evaluate physical activity in children. These
include subjective measures such as questionnaires, proxy-report from parents, teachers
and objective measures such as heart rate, pedometers, accelerometry, and direct
observation (Loprinzi & Cardinal, 2011). To capture sedentary behaviour, data is

11
commonly acquired using self-report surveys, self-report diaries, parental reporting, and
direct observation.
Self-report. The most common and low-cost method of measuring PA in research
is via self-report. Self-report measures used to evaluate the physical activity behaviour of
children generally include self-reports (questionnaires), interview-administered recalls,
and diaries/logs. Self-report measures are widely used because they are cost-effective,
easy to administer (e.g., low participant burden, general acceptance), and tend to provide
information on the type, and context of physical activity (Loprinzi & Cardinal, 2011;
Adamo, et al., 2009). However, self-report methods are subject to limitations such as
misinterpretation of questions, response and recall bias. Children are thought to have
difficulty recalling their physical activity behaviour as they tend to engage in PA in
sporadic bouts with varied intensities (Loprinzi & Cardinal, 2011; Adamo, et al., 2009).
In addition, social desirability observed among children and adolescents may also affect
the validity of subjective measures. Previous literature evaluating psychometric
properties of self-report measures reported self-report measures to have reliability
coefficients ranging from 0.56 to 0.93 and validity coefficients within the range of 0.03 to
0.88 (Loprinzi & Cardinal, 2001). Validity was reported to improve with age of the child.
Therefore, children younger than age 10 should not be expected to provide usable recalls
of their physical activity. A study assessing reliability of several self-report measures by
Sallis, Buono, Roby, Micale, and Nelson (1993) found that a delay in recall proved to be
a significant factor influencing reliability. On the other hand, memory skills were not
reported to influence reliability of physical activity recall (PAR). Methods with shorter
interval between the activity and recall (e.g., previous day recall, 3-day PAR) can be
more reliable in young children compared to 7-d PAR. Sallis et al. (1996) also identified
that children aged 10-16 years can provide reasonably reliable and valid accounts of their
physical activity levels.
Proxy report. In children younger than 10, self-reports of physical activity
patterns may not be accurate or reliable, and thus, proxy reports by parents and teachers
have been considered as an alternative. Proxy reports have demonstrated moderate
correlation with activity monitor counts (r = 0.41-0.60) (Loprinzi & Cardinal, 2011). Past

12
research examining reliability and validity of proxy-reports have concluded that proxy-
reports provide an acceptable degree of accuracy in estimation of child physical activity
levels. However, previous studies assessing parental and child perception of physical
activity have found perceived weight status to play an important role in perceiving
activity levels in children. Findings from a study by Eckstein et al. (2006) suggest that
perception of weight status can interfere with the perception of PA and exercise
behaviours. Mathieu, Drapeau and Tremblay (2010) also concluded that misperception of
weight status interferes with the accurate assessment of eating habits and physical activity
levels among underweight, overweight and obese children. Most parents who
overestimate their child’s physical activity levels have been found to have children with a
lower fat mass index (Corder et al., 2011). Hence, parents who have children with a
lower fat mass index or favorable body composition may perceive their child as
sufficiently active and consequently see no need to encourage them to increase their
activity over current levels. Objective measurement of physical activity levels of these
children may serve as a promising strategy to provide feedback on actual physical
activity levels and improve awareness among parents and children. Although parental and
child perception of child’s weight status may serve as an important factor affecting the
accuracy of the awareness of a child’s activity levels, several factors such as parental
monitoring, and supervision may also account for lack of awareness among parents
(Hedwig, 2009).
Objective measures. Objective (direct) measures of physical activity are often
used to provide a more accurate picture of individual physical activity levels and to
validate subjective measures. Objective measures are perceived to remove the potential
issues of recall and response bias associated with subjective measures (Adamo, et al.,
2009). Such measures include heart rate monitoring, pedometers, accelerometers and
direct observation. While heart rating monitoring helps provide an objective (yet indirect)
measure of the frequency, duration and physical activity, there are several limitations of
this approach. First, heart rate response occurs after movement so there is a natural
delay. Secondly, there are other biological or environmental factors such as age, body
size, emotional stress, cardiorespiratory fitness, temperature and humidity which tend to
affect one’s heart rate. Finally, there is no universal definition for “resting heart rate”

13
which makes it difficult to benchmark physical activity (Loprinizi & Cardinal, 2011;
Rowlands & Eston, 2007).
The pedometer is another instrument often used to objectively measure physical
activity. By measuring the number of steps taken by a person, the pedometer can give a
measure of physical activity over a certain time period. However, the pedometer cannot
measure intensity (e.g. running vs. walking) or changes in energy expenditure (Rowlands
& Eston, 2007). Some utilize direction observation as another tool to measure physical
activity, where a trainer records the activity of a child during a certain period of time.
However, direction observation has various limitations: such as the time consuming
process of observer training and data coding, and also the potential issue of increase in
subject reactivity during data collection (Loprinzi & Cardinal, 2011; Rowlands & Eston,
2007).
Accelerometers are currently recognized as the optimal objective measure of
physical activity in children because they are small, lightweight, easily wearable (worn
above the waist), and provide information on frequency, intensity and duration of
physical activity. They work by recording the frequency and magnitude of acceleration
along three orthogonal planes (vertical, mediolateral, and anteroposterior) (Colley et al.,
2011; Rowlands & Eston, 2007). The unit of measure is an ‘accelerometer’ or ‘activity’
count, where the counts are aggregated over a specified time period or “epoch” (e.g., 1
second, 15 seconds, 30 seconds, 1 minute). The counts can be used to estimate either
energy expenditure or classify physical activity by intensity (sedentary, light, moderate,
vigorous) using prediction equations (Loprinzi & Cardinal, 2011; Rowlands & Eston,
2007). Several studies have been conducted to evaluate the validity of accelerometers
against other objective measures such as direct observation and indirect calorimetry. A
review of these studies found associations between accelerometers and direct observation
ranging from 0.38 to 0.87. When compared to indirect calorimetry, associations ranged
from 0.37 to 0.94 (Loprinzi & Cardinal, 2011). In terms of obtaining reliable estimates of
physical activity among children, a period of 4-9 days of monitoring was recommended
(Loprinzi & Cardinal, 2011).

14
1.4.2 Sedentary Behaviours
Sedentary behavior is often defined as time children spend engaging in passive
activities (e.g. watching TV, using the computer, or playing video games). However,
children are found to be physically inactive during many other activities, including
homework, motorized transport, and while “sitting and talking” with friends at school
(Loprinzi & Cardinal, 2011). Thus, an overall assessment of time spent in screen and
non-screen based sedentary behaviours is recommended to capture a complete picture of
child inactivity (Active Healthy Kids Canada, 2011). The usual methods to capture
sedentary activity include self-reports, proxy-reports, diaries/logs, and direct observation.
However, recent studies have reported accelerometers as a valuable method to capture
overall sedentary activity (Loprinzi & Cardinal, 2011)
1.5 Purpose of the study
There appear to be gaps in the literature pertaining to awareness of physical
activity/inactivity levels among parents and their children. No previous study has
investigated parent and child awareness of different intensities of physical activity with
directly comparable objective data. This may shed light on whether parents and children
are able to accurately classify child physical activity in different categories and if parents
tend to misperceive the intensity of physical activity accumulated by their child on a daily
basis. Since most public health messages convey a recommended dose of physical
activity in terms of type, duration, and intensity (e.g., the Canadian Physical Activity
Guidelines recommend 60 minutes of MVPA/day which constitutes engagement in
vigorous activity for at least 3 days of the week), it is imperative to examine physical
activity awareness among parents and children on the basis of duration and intensity. This
may shed light on how the guidelines are perceived by parents/children and the areas that
need to be improved when promoting parent and child awareness of physical activity.
Awareness of physical activity levels remains an under explored barrier to behaviour
change among children and parents. Previous studies of physical activity awareness have
presented several methodological constraints. Most studies have used self-reported
physical activity to assess awareness levels among parents and children and objective
measures have rarely been used. It is widely known that self-report is prone to response

15
bias, and thus, the use of an objective measure provides a more accurate, precise and
thorough assessment of the gap between perceived and true activity levels (Corder et al.,
2012). Also, no previous study has examined the concordance/discordance between
parent and child awareness of child physical activity levels and sedentary behaviour
irrespective of the obesity status of the child. Parent-child concordance may be an
important factor in predicting successful behaviour change among children. Finally,
despite considerable evidence suggesting sedentary behaviour to be seen as an
independent health issue, no previous study has assessed awareness of child sedentary
behaviours among parents and children. Physical activity levels have been shown to
steeply decline in young people, with ages 10-13 years thought to be a critical age at
which physical activity begins to diminish (Craggs, Corder, van Slujis, Griffin, 2011).
Sedentary behaviour also tends to become more common at this age (Springer, Kelder, &
Hoelscher, 2006). A number of studies have also shown that physical activity and
sedentary behaviour in children and adolescents aged 10-17 years is greatly influenced by
parental support, activity participation, encouragement, role modeling etc. (Kirby, Levin,
& Inchley, 2011; Springer, et al., 2006; Ornelas, Perreira, & Ayala, 2007; Heitzler,
Martin, Duke, & Huhman, 2006; Sallis, Prochaska, & Taylor, 2000). This highlights the
need to identify the factors, such as parent and child awareness of physical activity and
sedentary behaviour that contribute to children’s participation in regular physical activity
at this age.
The first objective of the study was to assess the differences between children’s
subjective assessment (i.e., self-report) of their PA/sedentary behaviour and the objective
measure derived from the accelerometer. A second objective was to assess the difference
between parents’ subjective assessment (i.e., self-report) of their child’s PA/sedentary
behaviour and the objective measure (i.e., accelerometer). A third objective was to
examine the disparity between parent and child subjective assessment (awareness) of
child’s physical activity and sedentary behaviour. Finally, the last objective was to
examine the association between the variables BMI, gender, age and subjective
assessment (both parent and child) of child’s physical activity and sedentary behaviour.
With regards to the first and second objective, it was hypothesized that there would be a
significant difference between the subjective assessments (both parent and child) of child

16
physical activity/sedentary behaviour and the objective measure (i.e. accelerometer).
Parents and children were expected to over report minutes spent engaged in physical
activity while under reporting time spent engaging in various sedentary behaviours. In
relation to disparity between parent and child’s subjective assessment, it was anticipated
that children and parents would differ on their subjective assessment scores. Finally, in
terms of the last objective, it was expected that child’s BMI, age and gender may be
related to the subjective assessment of the child’s physical activity and sedentary
behaviour.

17
Chapter 2
2 Method
The present study was based on a descriptive and cross-sectional research design.
Two self-report questionnaires (parent and child) were utilized to provide a subjective
measure of physical activity and sedentary behaviour. The self-report questionnaires were
designed to collect demographic data and assess parent and child awareness of the child’s
daily physical activity and sedentary behaviour. The present study also utilized an
accelerometer (i.e., the Actical) to provide an objective measure of the child’s physical
activity and inactivity levels (i.e., sleep hours and sedentary hours).
2.1 Participant Characteristics
A school-based sample of grade 5-8 students and their parents were recruited to
participate. Five schools in Brampton, Ontario were contacted for the study. Two schools
consented and were included in the study. The majority of the students in the
participating schools were South Asians with both Canadian born or immigrant parents.
Consent to participate and the ability to comprehend the questionnaires formed the
inclusion criteria for parent/guardians and children. The parent who was present with
their child throughout the day (e.g., in the morning, after school and the evening) was
encouraged to fill out the questionnaires. Since mothers were the ones most often present
during the day, a majority of the parent study sample was comprised of mothers. In
addition, children who did not satisfy the age criteria (i.e., younger than 10 years of age
or older than 13 years of age) and had a physical/mental disability were excluded from
the study.
2.2 Procedure
Recruitment and data collection took place during May and June 2012. Beginning
in May 2012, principals at selected schools were contacted with an invitation letter (see
Appendix A) and a detailed description of the study was provided. At the time of this
visit, teachers of Grades 5-8 were also provided with an information packet containing a
copy of the ethics approval and an information leaflet (see Appendix B, G) containing

18
details of the study. Once the school administration verbally agreed to participate, the
researcher visited the participating school(s) and introduced the study to all grade 6-8
students. Students were also provided with a similar information packet containing
Letters of Information for both parent and child, and consent forms (see Appendix C, D).
The researcher also asked the teacher to reinforce the message that a completed consent
form would be required to ensure participation in the study. Students were requested to
return signed consent forms to the school prior to the data collection. Only students with
a completed consent form on the day of data collection were included in the study.
On the first day of data collection, upon receiving the consent and assent forms,
the researcher obtained the anthropometry measurements. Children’s anthropometric data
were collected two days prior to handing out the accelerometers and was required for
descriptive purposes. Body weight and height was obtained with participants dressed in
light clothing. Participating students were also informed that they were required to fill out
questionnaires on Friday and Monday morning, with the researcher available for
assistance.
Following participation in the above mentioned data collection process, the
researcher informed the children about the day the Actical accelerometers were to be
distributed. The Actical (Mini Mitter Respironics, USA) is an “omnidirectional” tri-axial
accelerometer which measures and records movement in all directions, thus providing an
accurate measure of physical activity intensity. There are several advantages to using the
Actical since it is small, lightweight, water resistant, and has proved to be a reliable and
valid measure of physical activity in children and adolescents (Colley et al., 2011). On
the assigned day, the Actical accelerometers were initialized to begin recording data at a
specified time. Children were asked to wear the Actical over their right hip on an
elasticized belt. Written and verbal instructions were provided to each participant.
Children were asked to: (i) wear the Actical during waking hours (except during water
activities such as bathing and swimming) for a minimum of ten hours per day to obtain
valid data; (ii) remove the Actical before going to bed; and (iii) press a button located on
the back of the Actical each time the Actical was worn or removed. The accelerometer
data was collected over a period of four consecutive days: Thursday, Friday, Saturday,

19
and Sunday. Two weekend days and two weekdays were included to assess differences
between awareness levels on weekdays and weekends, since parents may be
accompanying their children on weekends compared to a regular school weekday. A
take-home packet (containing parent questionnaire and an activity monitor diary) was
also provided to each participating student. Participants were provided with an activity
monitor diary in the take-home packet to record the time the Actical was worn and to
provide information about any physical activity performed while the accelerometer was
not worn (e.g., swimming). Children were instructed to return the home packet along
with the Actical to school four days after the measurement day.
2.3 Measures
The SHAPES (School Health Action, Planning and Evaluation System) physical
activity module questionnaire was adapted to measure children’s and parental perception
of child physical activity (PA) and sedentary behaviour (Appendix E). This tool was
designed to be used for multiple large-scale school-based data collections. The SHAPES
physical activity module questionnaire was “designed to provide school stakeholders with
the evidence they need for guiding and evaluating school-based physical activity
interventions” (Wong, Leatherdale, & Manske, 2006, p. 1593). It also aimed to promote
effective knowledge exchange and evaluate environmental influences on behaviour
(Wong, et al., 2006). At present, SHAPES consists of two modules: the tobacco module
and the physical activity module. Both modules consist of a machine-readable
questionnaire designed to collect data regarding the specific health behaviour (tobacco
use and physical activity) from grade 6-12 students. In addition, it also includes a
computer generated feedback report for the participating schools and a school
administrator questionnaire collecting data about school-based programs and policies
related to these health-related behaviours (Wong, et al., 2006). Wong, Leatherdale and
Manske (2006) assessed the reliability and validity of the physical activity module of the
SHAPES questionnaire. There was moderate agreement (mean 0.57± 0.24) for the 1
week test-retest physical activity questionnaire in 2812 students in grades 9-12.The study
also examined criterion validity using seven days of self-reported MVPA vs.
accelerometer-measured data (MTI accelerometer) for students in grades 6-12, finding a

20
significant correlation (Spearman r =.44, p <.001). These results were comparable with
psychometric properties of similar self-report measures (Wong, et al., 2006).
The modified SHAPES Physical Activity questionnaire consisted of demographic
questions (age & sex), and two items requesting daily recall of moderate (MPA) and
vigorous (VPA) physical activity for four days, respectively. Children were required to
fill out the questionnaire on Friday [i.e., previous day recall] and Monday morning (i.e.,
3-day PAR). Since the study included weekend days, data collection was not possible
during the weekend; thus, children were asked to recall activities conducted on Friday,
Saturday and Sunday on Monday morning. To capture intensity, duration and frequency
of activity, “responses were provided by indicating the number of hours (0-4h) along with
15-min increments (0-45min)” for each type of activity performed each day (4-day
period) (Wong, et al., 2006, p. 1594). Similarly, two items were also included asking
about time spent in screen-based (e.g., watching television, playing video games) and
non-screen based sedentary activities (reading, homework etc.). The measure for parental
supervision was drawn from previous work of Hedwig (2009) who employed these
measures to study influence of parenting practices on physical inactivity. Children were
asked to report on the following items: if the parent/caregiver was present most or all of
time when he/she leaves for school in the morning, returns from school in the afternoon,
and goes to sleep at night (Hedwig, 2009).
Although the use of an objective measure may serve to validate self-reported
physical activity, the majority of the studies evaluating awareness of physical activity
have employed subjective measures to assess awareness. To date, the study conducted by
Corder et al. (2010) is the only study that used an accelerometer to assess awareness
among parents and children. However, the scores obtained from the subjective measure
capturing self-reported awareness were not directly comparable to what the accelerometer
was measuring. The respondents were asked to report how physically active the children
were on a scale ranging from “very active” to “not active” while the accelerometer
measured time spent in MVPA. In the current study, self-reported time spent in physical
activity and sedentary behaviour was directly compared against the time captured by the
accelerometer to classify awareness among parents and children.

21
Parents/primary caregivers responded to the same PA survey questions as the
target participant (their child) but they answered about the target participant (child) rather
than their own PA (Appendix F). They were requested to report the amount of physical
activity and sedentary behavior their child engaged in at the end of the day for 4 days.
Parents also reported hours of work (35 hours/week labeled as full time work status).
2.4 Statistical Analyses
Quantitative data collected from the modified parent and child SHAPES physical
activity questionnaire including the demographic information was entered into SPSS
(version 19.0). Descriptive statistics including means, percentages, and standard
deviations were calculated for all variables. Child body mass index (BMI) was calculated
as weight (kg) divided by height (m) squared and converted to an age and gender specific
standard BMI (BMI z-score) based on U.S. CDC 2000 growth charts. An online
calculator from the U.S. Department of Agriculture/Agricultural Research Service
Children’s Nutrition Research Center (USDA/ARS Children's Nutrition Research Center,
2007) was used to calculate the BMI z-score (Mandich, 2012). Based on the
abovementioned BMI calculation, children were categorized as normal (including both
underweight and healthy weight), overweight, or obese (indicating the obesity status of
the participants).
Self-reported (parent and child physical activity and sedentary behaviour
questionnaire) average daily time spent performing MPA and VPA were calculated by
summing the responses from each day from the respective questionnaire items and
dividing by number of valid days (minimum two out of four days). The amount of MPA
and VPA performed over the number of valid days were summed and divided by the total
number of valid days to calculate average daily time spent performing MVPA (Wong, et
al., 2006). The average daily time spent performing sedentary (screen and non-screen
based) behaviour was calculated similarly. For average weekend day and weekday
activity, scores for vigorous, moderate, MVPA, and sedentary activity on Saturday,
Sunday and Thursday and Friday were summed separately and divided by two. Only
children (n = 24) with all 4 days of subjective data were included in the weekday vs.
weekend data analysis.

22
With regards to the objective physical activity and sedentary data, data were collected via
15 second epochs. Accelerometers were programmed individually for each student based
on their personal information (e.g., sex, age, height and weight). A custom software
KineSoft version 3.3.62 (KineSoft, Saskatchewan, Canada) was utilized to analyze the
raw accelerometer data. A series of standardized outcome variables were obtained based
on the procedures followed by Gaston and Prapavessis (2012). Accelerometer data were
only included in the statistical analyses provided the accelerometer was worn by the
participating student for at least 10 hours/day (i.e., a valid day) (Colley et al., 2011).
Participants with a minimum of two or more than two days of valid accelerometer data
were included in the analyses. According to previous studies, 60 or more consecutive
minutes of zero-counts were considered as the time that the accelerometer was not worn
(non-wear time). Wear time was calculated by subtracting the non-wear time from 24
hours.
Similar to the procedures followed by Mandich (2012), the main variables
extracted from the accelerometer data were total activity time (i.e., minutes spent in
vigorous, moderate, and moderate-to-vigorous physical activity), and total inactivity time
(i.e., sleep [monitor off/non-wear time] & sedentary hours) for each of the 4 days and
separately for weekday and weekend days. Accelerometer variables used in the statistical
analyses were calculated using previously established cut points and equations. The cut
points and calibration equation developed by Puyau et al. (2004) for children and youth,
was used to estimate Activity Energy Expenditure (AEE) values [AEE (kcal/kg/min) =
0.0183 + 0.000010 (counts per minute)] and to classify activities as sedentary (<0.01
kcal/kg/min), moderate (≥0.04 and <0.10 kcal/kg/min) and vigorous (≥ 0.10 kcal/kg/min)
accordingly. To calculate the average daily time spent performing MPA, minutes spent
performing MPA were summed and divided by the number of valid days. The average
daily time spent performing sedentary, VPA and MVPA, respectively, were calculated
similarly. The percentage of children who adhered to the guidelines (i.e., accumulating 60
minutes of MVPA/day) for each day of the 4-day period was also calculated. Children
with four days of valid accelerometer data were included in the analyses to determine
adherence.

23
To determine the difference between children’s self-reported and objectively
measured physical activity and sedentary behaviour, a paired t-test was used. With
regards to examining differences between parent’s self-report and objectively measured
physical activity and sedentary behaviour, paired t-tests were employed. Differences in
self-reported physical activity and sedentary behaviours levels reported by parent and
child were examined using paired samples t-tests. Since there was a degree of
overestimation expected among most children and parents, participants were also
grouped into “gross” over or “gross” under-estimators based on their responses falling
above or below 1 SD (Standard Deviation). This was done to further explore the
characteristics of “gross” over- or under-estimators, i.e., if “gross” over- or under-
estimation was associated with the child’s obesity status and gender.
Finally, to examine the relationship between parent and child awareness levels of
child physical activity (inactivity), age, BMI, and gender, Pearson’s correlational
analysis, independent samples t-tests and one-way ANOVAs were run. Pearson
correlational analysis were run to examine any correlation between BMI, age and child
physical activity/inactivity levels (both objectively measured and awareness variables).
Independent samples t-tests were run to examine the difference between gender of the
child and awareness of physical activity and sedentary behaviour (both parent and child).
One-way ANOVA was run to examine differences among three levels of obesity for
objectively assessed activity (inactivity) levels and parent/child awareness levels. One
way ANOVA was also employed to examine differences among the four age groups (i.e.
10-, 11-, 12-, and 13-year olds) for objectively assessed physical activity and sedentary
behaviour.

24
Chapter 3
3 Results
Five schools in the Brampton Peel area were contacted. Two replied positively
and were scheduled into the study. The data collection took place during June and July,
2012. School A included participants (n = 32) from grades seven and eight. Seventy five
percent (75%; n = 24) of the participants in School A were South Asian by ethnicity and
the rest of the participants belonged to other ethnic communities. School B included
participants (n = 23) from grades five to eight. All of the participants of School B were
South Asian by ethnicity. Participant characteristics are summarized in Table 1. More
than half of the study sample was comprised of boys (n = 29, 54.7%) and 45.3% (n = 24)
were girls. The mean age of the participants was 12 years (SD = 0.94). In terms of body
composition, the mean BMI score was 21 and mean BMI z-score was 0.6 (SD = 1.3).
With regards to the parent sample characteristics, out of the entire participants only 10%
of the parent sample were fathers and the rest mothers. The average hours of work/day
reported by the parents was 6 hours (SD = 3.8).
3.1 Children’s Self-Reported Physical Activity Levels
Subjective measurement. A total of 29 boys and 24 girls completed the adapted
version of the SHAPES questionnaire. The adapted SHAPES questionnaire asked for
amount of time spent in vigorous and moderate activity separately. Participants were also
asked to report on time spent in both screen and non-screen based sedentary behaviours.
Overall, participants’ mean activity (vigorous and moderate) scores were 87.7
minutes/day (SD = 52) and 84.4 minutes/day (SD = 51.6). The mean for moderate-to-
vigorous physical activity (MVPA) was calculated as 172.2 minutes/day (SD = 89.6).
Participants’ mean sedentary behaviour was reported as 220 minutes/day (SD = 105). On
average, boys self -reported as significantly more active than girls when it came to
vigorous activity (M = 101.8 min/day [SD = 49.4] and 70.7 [SD = 51] respectively; t(51)
= 2.24, p = 0.02). On the other hand, girls self-reported engaging in moderate activity
more as compared to boys (M = 87.6 [SD = 50.32] and 81.8 [SD = 53.5]). The difference

25
Table 1: Participant Characteristics
N Minimum Maximum Mean S.D
Age (years) 53 10 13 12.08 +0.95
Sex
Male
Female
29 (54.7%)
24 (45.3%)
Grade
5
6
7
8
9
6
16
22
Height (cm) 53 139.00 178.00 157.64 +7.56
Weight (kg) 53 26.0 72.0 52.3 +11.9
BMIa 53 12.0 30.9 21 +3.81
BMI z-scoreb
53 -5.02 2 0.6 +1.32
Obesity Statusc
Normal
Overweight
Obese
53
28
10
15
Note. BMI = Body Mass Index; BMI-z = Standardized Body Mass Index score. aBMI =weight/height
2
bBMI z-score
cObesity Status Definitions determined by BMI percentile for child’s age: Obese- at or over 95
th percentile;
Overweight- between 85th and 95
th percentile; Normal- under 85
th percentile

26
however, was not significant. No significant gender differences were observed in self-
reported sedentary behaviour.
3.2 Children’s Objectively Measured (Actical) Physical Activity levels
Table 2 shows the data pertaining to objectively assessed physical activity and
sedentary (inactivity) levels. Children wore Actical accelerometers for an average of 13
hours (n = 53, SD = 0.9) per valid day, defined as 10 hours or more of Actical wear time.
In terms of weekday versus weekend physical activity and sedentary behaviour, only 24
participants had valid data. Weekday vs. Weekend Activity data are summarized in
Table 3. Only one child (1.8%) out of the entire sample (n = 24) accumulated 60 minutes
of MVPA on each day of the 4-day period.
Vigorous activity. Children spent an average of 2.85 minutes (SD = 4.04) per
day engaged in vigorous activity. Boys spent 3.48 minutes per day (SD = 5.02) engaged
in vigorous activity whereas girls spent 2.07 minutes per day (SD = 2.23); this difference
was not significant (t(51) = 1.27, p = 0.20). With regards to weekday versus weekend day
vigorous activity, children spent an average 2.34 (SD = 2.34) minutes on a weekday and
1.41 (SD = 1.64) minutes on the weekend; these differences proved to be significant
(t(23) = 2.22, p = 0.03).
Moderate activity. Children spent an average of nearly one hour/day (52.69
minutes, SD = 24.77) engaged in moderate activity. Boys spent slightly over an hour
(63.82 minutes, SD = 26.72) engaging in moderate intensity activity, whereas girls spent
39.24 minutes/day (SD = 13.14); this difference was significant (t(42) = 4.35, p = 0.001).
Levene’s test indicated unequal variances (F = 6.81, p = .012), so degrees of freedom
were adjusted from 42.3 to 42. Since Levene’s test indicated unequal variances, the Mann
Whitney U test was also run to examine significant gender differences. The results
obtained from the Mann Whitney test concluded that there was a statistically significant
difference between the moderate intensity activity accumulated by boys and girls (U =
137, p = .001). Boys engaged in more moderate activity compared to girls. In terms of
weekday versus weekend moderate activity, children (n = 24) spent an average of 55.04

27
Table 2: Average daily minutes/hours of Physical activity and Inactivity measured
by the Actical Accelerometers
Physical Activity Inactivity
N
Average
daily
wear
minutes
Average
daily
non-wear
minutes
Vigorous
minutes
Moderate
minutes
Moderate-
to-
vigorous
minutes
Sedentary
minutes
Sedentary
hours
Sleep
hours
Day 1
(Thurs)
51 756
(78)
684
(77)
4
(6)
61
(33)
65
(34)
527
(86)
8.7
(1.4)
11.4
(1.3)
Day 2
(Fri)
53 839
(96)
601
(95)
2
(6)
56
(29)
58
(30)
580
(93)
9.6
(1.6)
10
(1.6)
Day 3
(Sat)
36 771
(103)
668
(102)
2
(3)
38
(24)
40
(24)
560
(91)
9.3
(1.5)
11.1
(1.7)
Day 4
(Sun)
28 740
(89)
700
(87)
1
(2)
34
(20)
35
(21)
541
(90)
9
(1.5)
11.7
(1.4)
Daily
average
53 784
(57)
656
(57)
3
(4)
53
(25)
55
(26)
549
(63)
9.1
(1)
11
(0.9)
Weekday
average
24 801
(56)
639
(56)
2
(2)
55
(25)
57
(25)
571
(60)
9.5
(1)
10.6
(0.9)
Weekend
average
24 760
(66)
680
(66)
1
(1)
35
(18)
36
(18)
557
(72)
9.3
(1.2)
11.3
(1.1)
Note. Standard Deviations appear in the parentheses below means
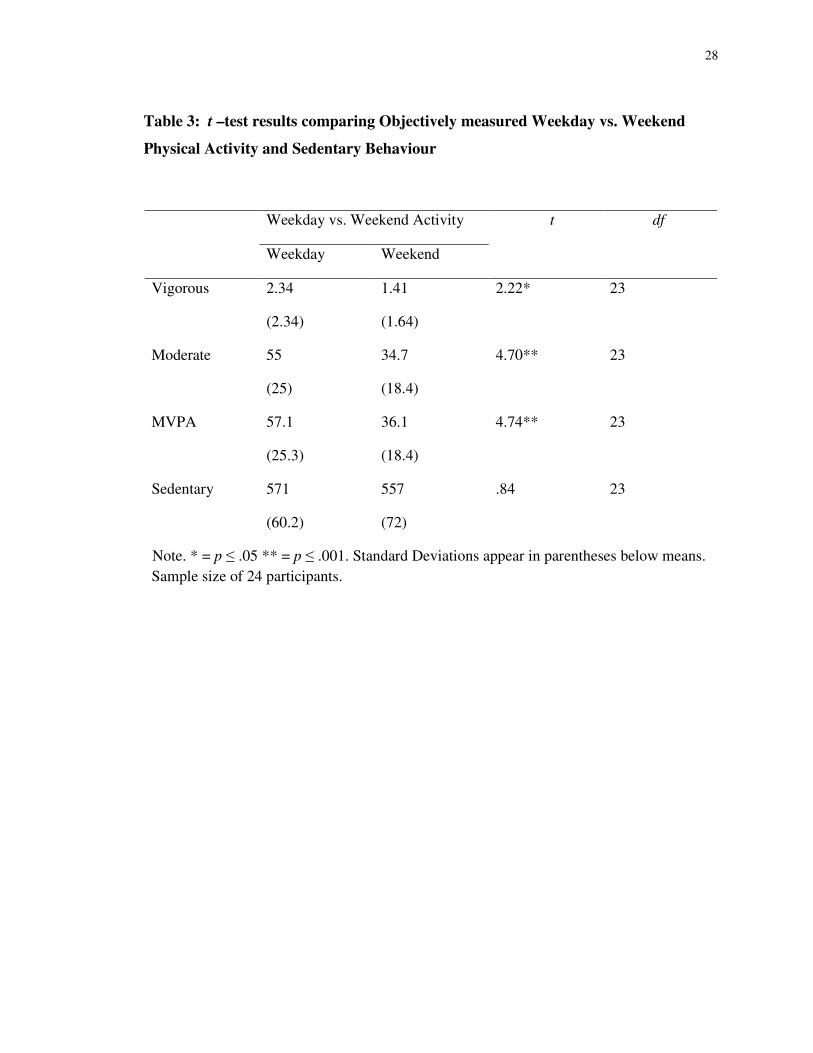
28
Table 3: t –test results comparing Objectively measured Weekday vs. Weekend
Physical Activity and Sedentary Behaviour
Weekday vs. Weekend Activity t df
Weekday Weekend
Vigorous 2.34
(2.34)
1.41
(1.64)
2.22* 23
Moderate 55
(25)
34.7
(18.4)
4.70** 23
MVPA 57.1
(25.3)
36.1
(18.4)
4.74** 23
Sedentary 571
(60.2)
557
(72)
.84 23
Note. * = p ≤ .05 ** = p ≤ .001. Standard Deviations appear in parentheses below means.
Sample size of 24 participants.

29
minutes (SD = 25.07) on a weekday compared to 34.73 minutes on a weekend day (SD =
18.36) and this difference was significant (t(23) = 2.22, p = 0.001).
Moderate-to-vigorous physical activity. Average daily time spent in MVPA was
calculated by summing the average daily time spent in VPA and MPA. Children spent an
average of nearly an hour (55.53 minutes, SD = 25.9) per day engaged in MVPA. Boys
spent 67.3 minutes (SD = 28) engaged in MVPA whereas girls spent 41.32 minutes/day
(SD = 13.4). These differences were significant (t(43) = 4.15, p = 0.001). Levene’s test
indicated unequal variances (F = 5.06, p = .029), so degrees of freedom were adjusted
from 42.9 to 43. The Mann Whitney U test was run to further examine gender differences
in accumulation of MVPA. The results of the test concluded significant differences
between boys and girls with regards to accumulation of MVPA (U = 131, p = .001).
Similar to moderate activity, boys engaged in more MVPA than girls (p = .001). Also,
significant differences (t(23) = 4.74, p = 0.001) between the amounts of MVPA children
engaged in on weekdays (57.12 minutes, SD = 25.32) versus weekend days (36.15
minutes, SD = 18.44) were observed.
Sedentary activity/Inactivity. Children spent an average of approximately 9
hours (548.68 minutes/day, SD = 63.05) engaged in “screen related behaviours”
(including watching TV/movies, playing video/computer games, surfing the internet) and
“non-screen related behaviours” (i.e., instant messaging talking on the phone,
reading/homework, motorized transport etc.). Boys spent 8.7 hours (527.09 minutes, SD
= 61.36) per day engaged in the above mentioned sedentary behaviours whereas girls
spent 9.57 hours (574.77 minutes, SD = 55.73) engaging in sedentary behaviours. Hence,
girls were more inactive/sedentary than boys and there was a significant difference (t(51)
= -2.93, p = 0.005). However, there was no significant difference between the amounts of
sedentary activity children engaged in on weekdays versus weekend days (t(24) = 0.84, p
= 0.40).

30
3.3 Difference between Child Self-Report and Objective Data
To explore the difference between child self-reported and objectively measured
(Actical) physical activity, a paired t-test was computed. Respondents were asked to
answer questions about the kind of physical activity and sedentary behaviour they
engaged in every day. On average, participants (children) reported a greater number of
minutes of vigorous activity (M = 87.73, SD= 52.09) compared to objectively measured
vigorous activity (M = 2.85, SD = 0.55, t(52) = 12.02, p < .001). Participants over
reported minutes of moderate activity (M = 84.47, SD = 51.7) compared to objectively
measured moderate activity (M = 52.7, SD = 24.8, t(52) = 4.30, p < .001). They also over
reported minutes of MVPA (M = 172, SD = 89.7) to objectively measured MVPA (M =
55.5, SD = 26, t(52) = 10, p < .001). Finally, the participants under-reported minutes of
sedentary activity (M = 220, SD = 105) to the Actical sedentary activity data (M = 549,
SD = 63, t(52) = -19.22, p < .001). Data are summarized in Table 4.
3.3.1 Child Over and Underestimation
Vigorous activity. When comparing the subjectively reported data to the
objective data directly, 98% (n = 52) of the children overestimated their vigorous activity.
The difference between the subjective and objective data was calculated to determine
over and under estimation by the respondents. On average, the children overestimated
(bias) daily vigorous activity by 84.9 minutes/day (SD = 51.4). To further explore the
characteristics of over- or under-estimators, participants were also grouped into “gross”
over or “gross” under-estimators based on their responses falling above or below 1 SD
(Figure 1). A graphical depiction of the data was generated by plotting awareness of
vigorous physical activity (i.e., perceived vigorous activity – accelerometer data) against
average vigorous activity recorded by the accelerometer. Out of the entire sample (n = 52,
98%) who overestimated vigorous activity to some extent, 11 children (21%)

31
Self-report vs. Actical Data t df
Child self-report
(min/day)
Objective data
(min/day)
Vigorous 87.73
(52.09)
2.85
(4.04)
12.02** 52
Moderate 84.4
(51.7)
52.7
(24.8)
4.30** 52
MVPA 172
(89.7)
55.5
(26)
10.09** 52
Sedentary 220
(105)
549
(63)
-19.22** 52
Note. ** = p ≤ .001. Standard Deviations appear in parentheses below means.
Table 4: t –test results comparing Child Self-reported and Objectively measured
Physical Activity and Sedentary Behaviour

32
Bias (x̄) (84.9)
x̄ -1σ (+33.5)
x̄ + 1σ (+136.6)
Figure 1: Difference between Perceived Vigorous Activity (Child) versus
Objectively measured Vigorous Activity
Difference between vigorous activity as perceived by the child (i.e., self-report data
minus accelerometer data) vs. average vigorous activity measured by accelerometer.
Values above 0 on the y-axis indicate over estimation of vigorous activity by the child
(i.e., self-reported values are higher than the accelerometer value). Dotted line, difference
between the two methods (bias); dashed line, +1 and -1 SD.

33
overestimated below 1 SD (33.5 minutes/day). These children were somewhat accurate
and did not overestimate vigorous activity by more than half an hour a day. Among these
11 children, eight were girls, thus, suggesting that girls provided a better estimate of
vigorous activity compared to boys. In terms of “gross” over estimators, a similar
percentage of children (n = 12, 22%) were seen to overestimate vigorous activity by at
least 136.6 minutes. Interestingly, the majority of these “gross” over estimators were
boys. Hence, boys perceived themselves engaging in more vigorous activity compared to
girls. No clear trends in “gross” overestimation and obesity status of the child were
observed. To further confirm the gender differences, an independent samples t-test was
run. There was a significant difference between the degree of overestimation of vigorous
activity among boys and girls. Boys over-estimated vigorous activity by 98.3 minutes as
compared to 68.6 minutes/day of overestimation observed in girls (t(51) = 2.16, p =
0.03). A one-way ANOVA was used to test the differences in overestimation of vigorous
activity among normal weight, overweight and obese children. There were no significant
differences observed among the three groups, F (2, 50) = 0.26, p = 0.77. Children
overestimated vigorous activity irrespective of their obesity status.
Moderate activity. Across the participant sample, 66% overestimated the
amount of moderate activity, while 34% of the children underreported these levels.
Seventy nine percent of girls (19/24) and 55% of boys (16/29) overestimated, and
conversely 21% of girls and 45% of boys underestimated. To examine gender
differences, an independent samples t-test was run. There was a significant difference
between the degree of overestimation of moderate activity among boys and girls. Girls
overestimated moderate activity by 48.4 min/day compared to 18 min/day of
overestimation observed among boys (t(51) = -2.11, p = 0.03). Most girls who
overestimated were normal weight (n = 15 out of 19), whereas among boys, 43% were
overweight (n = 7 out of 16) and 31% obese (n = 5 out of 16). However, results of the
one-way ANOVA found no significant differences in overestimation among the three
weight groups for both sexes, F (2, 50) = 0.81, p = 0.44).
On average, children overestimated their moderate activity by 31.7 minutes/day
(SD = 53.7). To further explore the characteristics of over- or under-estimators,
34
participants were also grouped into “gross” over or “gross” under-estimators based on
their responses falling above or below 1 SD (Figure 2). Many (22%) of the respondents
were “gross” over-estimators, or those that overestimated their moderate activity by more
than 85.4 minutes (more than one standard deviation from the overestimation mean of
31.7 minutes). Many (21%) of the respondents also grossly underestimated their
moderate activity (-22 less than one standard deviation from the overestimation mean of
31.7 minutes). Among these “gross” under-estimators (n = 18), 28% were girls and 72%
were boys. This was further confirmed by a significant t-test between moderate activity
reported by boys and girls. Girls overestimated minutes spent in moderate activity more
compared to boys (t(51) = -2.11, p = 0.03).
Moderate-to-vigorous physical activity. In terms of MVPA, a similar degree of
over/under-estimation was observed. The mean difference (bias) between self-report and
accelerometer was +116.6 min/day. Children were also grouped into “gross” over-or
under estimators based on their responses falling above or below 1 SD (Figure 3). Nine
children (17%) out of the entire sample (n = 53) overestimated their MVPA above 1 SD
(200.7 minutes) i.e. these children grossly overestimated their MVPA by at least 200
minutes. Majority (n = 6) of these children were boys. On the other hand, some children
(n = 9, 17%) overestimated below 1 SD (32.5 minutes/day). These children were slightly
more accurate and did not overestimate MVPA by more than half an hour a day.
However, no significant gender differences were observed with regards to overestimation
of MVPA (t(51) = -0.03, p = 0.97). With regards to obesity status, a one-way ANOVA
was run to examine the differences in overestimation of MVPA among the three groups.
No significant differences in overestimation of MVPA were observed among the three
weight groups, F (2, 50) = 0.50, p = 0.60).
Sedentary activity. On average, all children underestimated sedentary activity
by approximately 5 hours (-328.8.2 minutes, SD = 124.5). Such a large degree of
underestimation may be attributable to certain factors which will be explored in the
discussion section. The values above and below 1 SD were calculated to further explore
characteristics of children who tended to underestimate far less compared to others and
children who grossly underestimated their sedentary activity (Figure 4). Nine

35
Bias (x̄) (31.77)
x̄ + 1σ (+85.4)
x̄ - 1σ (-22)
Figure 2: Difference between Perceived Moderate Activity (Child) versus
Objectively measured Moderate Activity
Difference between moderate activity as perceived by the child (i.e., self-report data
minus accelerometer data) vs. average moderate activity measured by accelerometer.
Values above 0 on the y-axis indicates over estimation of moderate activity by child (i.e.,
self-reported values are higher than the accelerometer value). Dotted line, difference
between the two methods (bias); dashed line, +1 and -1 SD.

36
x̄ - 1σ (32.5)
Bias (x̄) (116.6)
x̄ + 1σ (+200.7)
Figure 3: Difference between Perceived MVPA (Child) versus Objectively
measured MVPA
Difference between MVPA as perceived by the child (i.e., self-report data minus
accelerometer data) vs. average MVPA measured by accelerometer. Values above 0 on
the y-axis indicates over estimation of MVPA by child (i.e., self-reported values are
higher than the accelerometer value). Dotted line, difference between the two methods
(bias); dashed line, +1 and -1 SD.

37
x̄ + 1σ (-204)
Bias (x̄) (-328.8)
x̄ - 1σ (-453.3)
Figure 4: Difference between Perceived Sedentary (both screen- and non-screen
related sedentary behaviours) Activity (Child) versus Objectively measured
Sedentary Activity
Difference between sedentary (screen- and non-screen related sedentary behaviours)
activity as perceived by the child (i.e., self-report data minus accelerometer data) vs.
average sedentary activity measured by accelerometer. Values above 0 on the y-axis
indicate over estimation of vigorous activity by the child (i.e., self-reported values are
higher than the accelerometer value). Dotted line, difference between the two methods
(bias); dashed line, +1 and -1 SD.

38
percent (n = 5) of the entire sample (n = 53) grossly underestimated below 1 SD (-453.3
min/day) i.e. these children underestimated their sedentary activity by at least seven
hours. Out of these five children, three were boys. No clear pattern of “gross”
underestimation was observed based on gender and obesity status. Also, 15% (n = 8) of
the entire sample, underestimated their sedentary activity above 1 SD (-204 min/day) i.e.
these children were slightly more accurate than the rest and did not underestimate their
sedentary activity beyond 3 hours/day. Among these eight children, six were boys, hence,
indicating that boys may be slightly more aware of their sedentary activity compared to
girls. No specific trend of overestimation based on obesity status was observed.
To further test the above assumptions an independent sample t-test was run to
examine gender differences in reporting of sedentary behaviour. A significant difference
in under estimation of screen-based sedentary behaviour was observed among boys and
girls. Girls underestimated screen-related sedentary behaviour by 456 minutes compared
to 351 minutes of underestimation observed among boys (t(51) = 4.35, p = 0.001).
However, no significant gender differences in underestimation of combined screen- and
non-screen related sedentary behaviours were observed (t(51) = 1.83, p = 0.07). A one-
way ANOVA was also run to examine differences in underestimation of sedentary
behaviours among normal weight, overweight and obese children. No significant
differences in underestimation of sedentary behaviours were observed among the three
groups, F (2, 50) = 1.22, p = 0.30.
3.4 Difference between Parent Report and Their Children’s Objective Physical Activity Data
To explore the difference between parent-reported physical activity of their
respective children and their child’s objectively measured Actical data, paired t-tests were
computed. Parents were asked to report the number of hours or minutes their child
engaged in vigorous, moderate, and sedentary behaviour (which included screen related
behaviours, chatting over the phone, instant messaging). On average, parents over
reported their child’s minutes of vigorous physical activity (M = 90.6, SD= 54.2)
compared to objectively measured vigorous activity (M = 2.85, SD = 4.04, t(52) = 11.91,
p < .001). Parents also over reported their child’s minutes of moderate physical activity

39
(M = 82.4, SD = 50.4) compared to the Actical measured moderate activity (M = 52.7, SD
= 24.8, t(52) = 4.61, p < .001). Finally, parent respondents over reported minutes of
MVPA (M = 173, SD = 93.4) compared to Actical MVPA data (M = 55.5, SD = 26, t(52)
= 10, p < .001). On average, parents also under reported minutes of sedentary activity (M
= 202.4, SD = 94) compared to objectively measured sedentary activity (M = 549, SD =
63, t(52) = -22.2, p < .001). The data are summarized in Table 5.
Overall, the parents significantly overestimated the time their children spent
engaging in vigorous and moderate activity. On the other hand, they significantly
underestimated their child’s sedentary activity. These results parallel the results seen
with the children’s self-reporting against objectively measured data. However, unlike the
children’s data, no significant gender differences (of the children) were observed between
parent self-reports and accelerometer data.
3.4.1 Parent Over and Underestimation
Vigorous activity. On average, all parents overestimated their child’s vigorous
activity levels. Almost all (96%) of the parent sample over reported their child’s vigorous
activity with a mean (bias) of 87.8 minutes/day (SD = 53.6). To further explore the
characteristics of over- or under-estimators, parents were also grouped into “gross” over
or “gross” under-estimators based on their responses falling above or below 1 SD (Figure
5). A graphical depiction of the data was generated by plotting parental awareness of
vigorous physical activity (i.e., perceived vigorous activity – accelerometer data) against
average vigorous activity recorded by the accelerometer. In the case of vigorous activity
reported by parents, the majority of the parents overestimated vigorous activity to some
extent. However, a few parents (n = 6, 11%) who overestimated below 1 SD (34.2
min/day) were a little more accurate than the rest of the sample i.e. these parents did not
overestimate beyond half an hour of vigorous activity. No clear pattern based on gender
and the obesity status of the child was observed. On the other hand, some parents (n = 9,
19%) greatly overestimated their child’s vigorous activity by more than 1 SD (141.4
min/day). Out of these nine parents, five had boys. To explore any difference in
overestimation of vigorous activity between parents who had girls or boys, an
independent samples t-test was run. No significant differences were observed in

40
Self-report vs. Actical Data t df
Parent self-report
(min/day)
Objective data
(min/day)
Vigorous 90.6
(54.2)
2.85
(4.04)
11.91** 52
Moderate 82.4
(50.4)
52.7
(24.8)
4.61** 52
MVPA 173
(93.4)
55.5
(26)
10.06** 52
Sedentary 202.4
(94)
549
(63)
-22.24** 52
Note. ** = p ≤ .001. Standard Deviations appear in parentheses below means.
Table 5: t –test results comparing Parent-reported and Objectively measured Child
Physical Activity and Sedentary Behaviour

41
Bias (x̄) (87.8)
x̄ + 1σ (141.4)
x̄ - 1σ (34.2)
Figure 5: Difference between Perceived Vigorous Activity (Parent) versus
Objectively measured Vigorous Activity
Difference between child vigorous activity as perceived by parent (i.e., self-report data
minus accelerometer data) vs. average vigorous activity measured by the accelerometer.
Values above 0 on the y-axis indicate over estimation of child vigorous activity by parent
(i.e., self-reported values are higher than accelerometer values). Solid line, average
difference between the two methods (Bias); dashed line, +1 and -1 SD.

42
overestimation of vigorous activity by the parent irrespective of the gender of the child
(t(51) = 1.18, p = 0.24). A one-way ANOVA was used to test the differences in
overestimation of vigorous activity among parents of normal weight, overweight and
obese children. There were no significant differences observed among the three groups, F
(2, 50) = 0.74, p = 0.48. All parents overestimated vigorous activity to a similar extent
irrespective of their child’s obesity status.
Moderate activity. Out of 53 parents, 72% (n = 38) of the sample overestimated
their children’s moderate activity levels. On average, parents overestimated with a mean
(bias) of 29.7 minutes/day (Figure 6). The rest of the sample (n = 15) underestimated
their children’s moderate activity levels. It was observed that 17% of the respondents
were “gross” over-estimators, or those that overestimated their moderate activity by more
than 76.7 minutes (more than one standard deviation from the overestimation mean of
29.7 minutes). In addition, 17% of the parent sample reported their child’s moderate
activity to be less than one standard deviation (-17.2 minutes) leading to underestimation
of moderate activity (Figure 6). No pattern of inaccurate estimation based on gender
(child) or obesity status emerged. To examine differences in over-reporting of moderate
activity among parents based on gender of the child, an independent samples t-test was
run. There was no significant (child) gender difference for the degree of overestimation
of moderate activity reported by parents (t(51) = -0.33, p = 0.73). A one-way ANOVA
was run to examine differences in overestimation of moderate activity among parents
with normal weight, overweight or obese children. No significant differences in
overestimation were observed among the three groups, F (2, 50) = 0.14, p = 0.87.
Moderate-to-vigorous physical activity. In terms of MVPA, the mean difference
(bias) between self-report and accelerometer data was +117.5 min/day. No significant
gender differences were observed between over- or under-reporting of MVPA. With
regards to MVPA overestimation beyond 1 SD, 17% (n = 9) of the parents overestimated
their child’s MVPA by more than 202.5 minutes/day. On the other hand, 13% (n = 7) of
parents overestimated their child’s MVPA below 1 SD (32.5 minutes/day). These parents
were more accurate than the rest of the parents, since they did not overestimate their

43
Bias (x̄) (29.7)
x̄ - 1σ (-17.2)
x̄ + 1σ (+76.6)
Figure 6: Difference between Perceived Moderate Activity (Parent) versus
Objectively measured Moderate Activity
Difference between the child’s moderate activity as perceived by the parent (i.e.,
self-report data minus accelerometer data) vs. average moderate activity measured by the
accelerometer. Values above 0 on the y-axis indicate over estimation of child moderate
activity by parent (i.e., self-reported values are higher than accelerometer values). Solid
line, average difference between the two methods (Bias); dashed line, +1 and -1 SD.

44
child’s MVPA beyond half an hour (32.5 minutes/day) (Figure 7). No pattern based on
gender or obesity status of the child was observed when parents’ responses were grouped
above or below 1 SD. To further explore any difference in overestimation of MVPA
between parents who had girls or boys, an independent samples t-test was run. No
significant (child) gender differences were observed in overestimation of MVPA by the
parent (t(51) = 0.55, p = 0.58). A one-way ANOVA was run to examine differences in
overestimation of MVPA among parents of normal weight, overweight or obese children.
No significant differences in overestimation were observed among the three groups, F (2,
50) = 0.55, p = 0.57.
Sedentary activity. Overall, the parent sample underestimated their child’s
sedentary activity. The mean difference between self-report and accelerometer was
approximately 5.76 hours/day. Similar to previous analyses, parents reporting sedentary
activity were also categorized as “gross” under estimators or somewhat accurate
estimators based on their responses falling above and below 1 SD (Figure 8). Out of the
entire sample 13% of the parents (n = 7) underestimated their child’s sedentary activity
above 1 SD (232.9 min/day) i.e. these parents were somewhat more accurate than the
entire sample and did not underestimate their children’s sedentary activity beyond 3.4
hours. On the other hand, 17% (n = 9) of the entire parent sample (n = 53) grossly
underestimated their child’s sedentary activity below 1 SD (453.3 min/day). These
parents underestimated their children’s physical activity by at least seven hours
(approximately). Among these parents who grossly underestimated their child’s sedentary
behaviour, seven parents had girls. Thus, parents of girls tended to underestimate their
child’s sedentary activity more compared to parents of boys. To test these assumptions,
an independent samples t-test was run to explore any difference in underestimation of
child sedentary behaviour between parents who had girls or boys. With regards to only
screen-related sedentary behaviour, parents of girls underestimated by 454 minutes/day
compared to 374 minutes/day of underestimation reported by parents of boys (t(51) =
3.28, p = 0.002). However, no significant differences in underestimation of combined
screen- and non-screen related sedentary behaviours were observed among parents of
both girls and boys (t(51) = 1.74, p = 0.08). A one-way ANOVA was also run to examine

45
Bias (x̄) (117.5)
x̄ + 1σ (+202.5)
x̄ - 1σ (32.5)
Figure 7: Difference between Perceived MVPA (parent) versus Objectively
measured MVPA
Difference between child MVPA as perceived by parent (i.e., self-report data minus
accelerometer data) vs. average MVPA measured by the accelerometer. Values above 0
on the y-axis indicate over estimation of child MVPA by parent (i.e., self-reported values
are higher than accelerometer values). Solid line, average difference between the two
methods (Bias); dashed line, +1 and -1 SD.

46
x̄ - 1σ (-453.3)
x̄ + 1σ (-232.9)
Bias (x̄) (-346.2)
Figure 8: Difference between Perceived Sedentary Activity (both screen- and non-
screen related health behaviour) (Parent) versus Objectively measured Sedentary
Activity
Difference between sedentary (screen- and non-screen related sedentary behaviours)
activity as perceived by parent (i.e., self-report data minus accelerometer data) vs.
average sedentary activity measured by accelerometer. Values above 0 on the y-axis
indicates over estimation of vigorous activity by parent (i.e., self-reported values are
higher than the accelerometer value). Dotted line, difference between the two methods
(bias); dashed line, +1 and -1 SD.

47
differences in underestimation of sedentary behaviours among parents of normal weight,
overweight and obese children. No significant differences in underestimation of
sedentary behaviours were observed among the three groups, F (2, 50) = 0.99, p = 0.37.
All parents underestimated their child’s sedentary behaviours to a similar degree
irrespective of the child’s weight status.
3.5 Difference between Parent and Child Self-Reported Physical Activity
To analyze the difference between the subjective reporting by both parent and
child, a series of paired t-test were run. Respondents were asked to “mark how many
minutes of HARD physical activity you did yesterday. This includes physical activity
during physical education class, after school, evenings and spare time”. The mean for the
parents was 87.8 minutes/day compared to 84.9 minutes/day reported by the children.
There were no significant differences in the self-report by children and parents for
vigorous activity (t(52) = -.51, p = .60) . The question concerning moderate activity
asked, “mark how many minutes of MODERATE physical activity you did yesterday.
This includes physical activity during physical education class, after school, evenings and
spare time”. On average, children reported 31.7 minutes compared to 29.7 minutes of
moderate activity reported by the parents. This difference was not statistically significant
(t(52) = .36, p > 0.05). Similarly, while both child (M = 118, SD = 84.8) and respective
parent (M = 119, SD = 84.7) overestimated MVPA, the differences were not significant
(t(52) = -.10, p > 0.05). In terms of sedentary activity, children underreported by
approximately 5.48 hours (-328.8 minutes, SD = 124.5) while parents also underreported
by approximately 5.76 hours (-346.2 minutes, SD = 113.2). These differences were not
significant (t(52) = 1.32, p > 0.05). These data are summarized in Table 6. It appears that
while both children and parents over report physical activity, the level of over-
/underreporting between the two groups does not differ.

48
Child subjective vs. Parent subjective t df
Child self-report
(min/day)
Parent self-report
(min/day)
Vigorous 84.9
(51.4)
87.8
(53.6)
-.52 52
Moderate 31.7
(53.7)
29.7
(46.9)
.36 52
MVPA 116.6
(84.1)
117.5
(85)
-.10 52
Sedentary -328.8
(124.5)
-346.2
(113.2)
1.47 52
Standard Deviations appear in parentheses below means.
Table 6: t –test results comparing Child Self-reported and Parent-reported Child
Physical Activity and Sedentary Behaviour

49
3.6 Correlation between BMI, Age, and Physical Activity Levels
Pearson correlation analyses were run to analyze any relationship between
variables such as BMI, age, weight and awareness of physical activity levels among
parents and children. Pearson correlations between BMI and child physical activity levels
were insignificant. There was no significant correlation between BMI and self-reported
(both parent and child) vigorous, moderate, MVPA and sedentary activity. Additionally,
no correlation was found between weight of the child and objectively measured or self-
reported (both parent and child) physical activity and sedentary levels.
With regard to correlations between age and physical activity levels in children,
several significant correlations were observed. There was a negative correlation between
age and objectively measured moderate activity, r = -.35, n = 53, p = .009. Similar to
moderate activity, there was a negative correlation between age and objectively measured
MVPA, r = -.33, n = 53, p = .01. In contrast, there was a positive correlation between
age and objectively measured sedentary activity, r = .45, n = 53, p = .001. Thus, as age
advanced, physical activity decreased and sedentary activity increased. In terms of the
correlation between age and self-reported physical activity levels (by both parent and
child), only child self-reported moderate and sedentary activity were correlated with age.
A positive correlation was found between age and self-reported moderate activity, r =
.30, n = 53, p = .02. In addition, a negative correlation was found between age and self-
reported sedentary activity by children, r = -.30, n = 53, p = .02.
In conclusion, BMI proved to be a non-significant factor in determining levels of
awareness in children and parents, however, the age of the child was correlated with
awareness of moderate and sedentary activity among children.

50
Chapter 4
4 Discussion
The purpose of this study was to assess awareness of physical activity and
sedentary levels among parents and their children. Both subjective and objective
measures were compared to examine the level of awareness among the participants. A
secondary purpose was to examine the difference between parent perception of their
children’s physical activity and sedentary behaviour and their children’s self-report. A
total of 53 parent-child dyads participated in the study.
Results were organized into four categories: child awareness of physical activity
and sedentary behaviour; parents’ awareness of their child’s physical activity and
sedentary behaviour; concordance between children’s and parents’ awareness of the
child’s physical activity and sedentary behaviour; and the relationship between gender,
BMI, age and awareness (both child and parent).
The objective data on levels of physical activity and sedentary behaviour were
found to be similar to other studies (Colley et al., 2011; Troiano, Berrigan, Dodd, Masse,
Tilert, & Mcdowell, 2007; Colley et al., 2011). Overall, boys were more active than girls,
and as age advanced, physical activity decreased and sedentary behaviour increased.
With regards to adherence to the current physical activity guidelines, only 1.8% of the
children in the present study met the guidelines (i.e. only one child in the entire sample
engaged in 60 minutes of MVPA/day on all four days of Actical wear time). In contrast,
the 2007-2009 Canadian Health Measures Survey reported 7% of the children adhering to
these guidelines. Thus, children in the current sample were far less active compared to the
nationally representative data. Also, consistent with prior research, children engaged in
more physical activity on the weekdays compared to the weekend (Garriguet & Colley,
2012; Trost et al., 2001).
The amount of time spent by children engaged in sedentary behaviours also
requires attention. Children spent an average of approximately 9 hours/day engaged in
sedentary pursuits. This finding was slightly more than the levels of sedentary time (8.6

51
hours) reported in the CHMS 2007-2009 survey (Colley et al., 2011). The objective data
then suggested that the present sample of children seemed consistent with other Canadian
data, showing far less than recommended levels of physical activity for children in this
age range. Also, the results of the present study are consistent with the previous studies
exploring physical activity levels of South Asians in Canada and United Kingdom
(Bryan, Tremblay, Perez, Ardern, & Katzmarzyk, 2006; Owen et al., 2009). One question
then might be whether children are actually aware of their activity levels.
4.1 Child Awareness of Physical Activity and Sedentary Behaviour
As hypothesized, there was a significant difference between child self-reported
and objectively measured physical activity and sedentary levels. Overall, children greatly
overestimated their levels of both vigorous and moderate activity and underestimated
their sedentary activity. These findings are consistent with the large body of evidence that
has been recently synthesized in a systematic review (Adamo et al., 2009). Children in
the present study seemed to be completely unaware of their level of vigorous activity, as
98% of the children overestimated their vigorous activity by an average of 84.9
minutes/day (compared to the objective data). Boys self-reported significantly more
vigorous activity than girls (i.e., boys tended to overestimate their vigorous activity
compared to girls). Several factors can help explain such large differences in reported
physical activity and accelerometer data. These factors may include participant
misinterpretation of type of activity and perceived level of exertion, problems with recall,
intensity of activity (e.g. vigorous) asked to report on, and social desirability bias (Adamo
et al., 2009; LeBlanc & Janssen, 2010). A recent systematic review by Adamo et al.
(2009) highlighted the discrepancies between self-reported and objective measures of
physical activity within the pediatric population. The authors observed percent mean
differences for data categorized as vigorous to be very high and ranging from 216% to
13,025%. Higher mean percent differences were particularly reported among studies that
categorized physical activity by intensity, with greater differences between self-report
and direct measures found when respondents were asked to report on higher levels of
intensity (e.g., vigorous activity). Elementary school children have also been seen to

52
have consistent difficulties in estimating intensity of physical activity (McKenna, Foster,
& Page, 2004). A qualitative study exploring recall of physical activity in children aged
8-16 years addressed how children tended to perceive and report daily physical activity.
The authors highlighted the difficulty that children faced while assessing intensity as well
as with recall of duration and frequency of physical activity. On prompting, participants
described moderate and vigorous activities based on individual symptoms. This outcome
may have an effect on reporting intensity of physical activity due to differences among
people in symptom reporting. It was seen that young people/children frequently used
words such as really, not really, a lot, or not a lot to describe intensity, thus implying that
“individuals often understand intensity through a single, relatively undifferentiated
concept” (McKenna, et al., 2004, p. 9).
Compared to vigorous activity, there was less but still a significant degree of
overestimation for moderate activity, as 66% of the children overestimated their level of
moderate activity by 31.7 minutes on average. There was a higher and significant degree
of overestimation among girls (79% out of the entire female sample) compared to boys
(55% of the entire male sample) regarding moderate activity. These results are consistent
with a study conducted on 54 middle school students using 24-hr recall and TriTrac
accelerometers (Cradock et al., 2003). The results revealed similar gender differences in
reporting of physical activity i.e., girls were more likely to overestimate moderate activity
than boys. Another recent study assessing the disagreement in physical activity assessed
by accelerometer and self-reports produced similar findings based on gender
(Slootmaker, Schuit, Chinapaw, Seidall, & Mechelen, 2009). Hence, public health
agencies need to address the lack of awareness among girls and boys regarding moderate
activity. Interestingly, there was also some degree of underreporting when it came to
moderate activity, as 34% of the total participants underreported moderate activity with
boys (45%) underreporting significantly more than girls (21%). Previous studies
reporting underestimation of self-reported physical activity compared to direct measures
have generally been with regards to moderate or light physical activity, whereas vigorous
physical activity has generally been substantially overestimated (Adamo et al., 2009;
Cradock et al., 2004). Since children can have an exaggerated perception of time and

53
exertion, misclassification of moderate activity as vigorous is thus, not an uncommon
phenomenon (Adamo et al., 2009).
In addition, analyzing how children and young adolescents acquire their physical
activity over the course of the day can help explain the lack of awareness or discrepancies
between self-reported and accelerometer data. Research has consistently documented that
children and young adolescent activity patterns are characterized by shorter more
explosive bouts of activity, and recalling/estimating the duration of these short bouts of
activity may lead to poor estimation (Adamo et al., 2009; LeBlanc & Janssen, 2010). For
example, children may recall a 40-minute session as one long bout of activity (e.g. hour
of school gym or soccer game) when those 40 minutes, in addition to activity, may
typically constitute listening to the instructor/coach, waiting for a turn to use a particular
gym item, watching others play, etc. Hence, some of the largest overestimates of exercise
duration have been reported to come from school gymnasia (Shephard, 2003). Since the
questionnaire employed in the present study described soccer as vigorous activity,
children may have assumed one gym session of soccer as 40 minutes of vigorous activity.
Some excerpts from the qualitative study exploring recall in children provided similar
insights. When asked to report on duration of physical activity during a karate class, one
participant initially reported 3-4 hours of activity and vaguely described the session to be
ages long. But on further prompting, the child explained the session lasted for 2 hours
and claimed to be continuously active for those two hours. When further asked if he/she
was active the whole time or sometimes had to wait and see demonstrations, the
participant reported sometimes sitting down and watching others as well as waiting for a
long time for his/her turn to come (McKenna, et al., 2004). Hence, children may
overestimate their time being physically active by assuming many short bouts of activity
as one longer bout (LeBlanc & Janssen, 2010). Thus, short bursts of activity are difficult
to report in questionnaires. Direct measures (such as accelerometers or heart rate
monitors) are able to accurately assess sporadic bouts of activity (Adamo et al., 2009).
Finally, social desirability bias may also overshadow the awareness of physical activity in
children. Children may over-report physical activity because of the natural inclination of
people to respond in a way that they perceive to be socially acceptable and desirable
(LeBlanc & Janssen, 2010). Klesges et al. (2007) found that children scoring high on a

54
social desirability measure over-reported their physical activity to a larger degree
(LeBlanc & Janssen, 2010).
Thus, the aforementioned factors mean that a large degree of overestimation by
children should be expected with regards to total physical activity (moderate-to-vigorous
activity). In this study, the mean percent difference between self-report and accelerometer
data for MVPA was 210%. These findings are consistent with previous studies
comparing self-report measures of MVPA to accelerometer data (Adamo et al., 2009;
LeBlanc & Janssen, 2010).
As expected, the level of sedentary activity by children in the present study was
greatly underestimated by both boys and girls. A similar study by Affuso and colleagues
(2011), investigated agreement between self-reported sedentary behaviours and an
objective measure (i.e. accelerometer) on a larger sample (n = 201) across six states in the
United States. Children were asked to report on time spent in sedentary activities which
included time spent watching TV/videos, using computers, playing video/computer
games, and talking on the phone. The results were consistent with the findings of the
present study, adolescents (irrespective of gender) underestimated minutes of sedentary
behaviour compared to the accelerometry data. . Several explanations could be provided
for the large degree of underestimation of sedentary behaviour observed in the present
study. Although the present study addressed both screen-based and two items of non-
screen based sedentary behaviours (i.e., homework and reading), other sedentary pursuits
such as time spent in motorized transport, at school, self-care were not taken into
account. Olds et al. (2010) conducted a study to examine non screen sedentary time
(NSST) in 9-16 year olds in Australia. Forty two percent of the total NSST comprised of
school activities, socializing 19%, self-care 16%, and passive transport 15%. Thus, the
present study may not have fully captured a complete picture of the sedentary time in the
children’s and parents’ self-report measure. However, since the data were collected over
a period of four days that included two weekend days, the potential effects of un-captured
sedentary school time should be mitigated. Interestingly, a similar degree of
underestimation of sedentary behaviour was observed during the weekends. Lastly, social
desirability and difficulty to recall has also been associated with underreporting of

55
sedentary behaviours in adolescent boys and girls (Jago, Baranowski, Baranowski,
Cullen, & Thompson, 2007; Klesges et al., 2004). In conclusion, children in the present
study greatly overestimated vigorous and moderate physical activity and underestimated
sedentary behaviour. Several factors such as inability to understand intensity, recall
duration and social desirability bias may have attributed to lack of awareness of physical
activity and sedentary behaviour among children.
4.2 Parent Awareness of Child Physical Activity and Sedentary Behaviour
Overall, parents also overestimated their children’s vigorous and moderate
physical activity and grossly underestimated sedentary behaviour. These findings are
consistent with previous studies examining parent reports of their children’s activity
levels in comparison to objective measures. Results of a study investigating parental
awareness of child physical activity among parents of 7-10 year old children revealed that
most parents (80%) lacked awareness and tended to overestimate their children’s physical
activity on more than one measurement day (Corder, et al., 2012). Statistics Canada also
reported overestimation of child physical activity by their parents in a nationally
representative sample. Parent reported data was compared to child accelerometer data.
On average, parents thought their child to be more active than the actual accelerometer
data by 40 min/day (Colley et al., 2012). However, in the present study the bias between
the parent-report of child activity levels compared to accelerometer was found to be more
than 40 minutes. The parents overestimated total activity (MVPA) by almost 120 minutes
in the current study. In another study examining parent perceptions of children’s weight,
nutrition, and activity levels similar results were found. Findings indicated parents greatly
overestimated the child’s physical activity level and the consumption of a healthy diet
and underestimated the child’s weight status (Jaballas, Clark-Ott, Clasen, Stolfi, &
Urban, 2011). Although, the overestimation of physical activity was also seen in the
present study, no relationship between degree of overestimation and weight or BMI was
found.
Several reasons can be provided to explain the lack of parental awareness of child
physical activity and sedentary behaviour. Firstly, parents may have been unable to

56
distinguish between different intensities of child physical activity. In the qualitative study
by Mckenna, et al. (2004), neither parents nor teachers could provide the details of
frequency, intensity and time with regards to child physical activity, thus questioning the
ability of parents to perceive child physical activity accurately. Parents in the current
study were not provided with hands-on training to be able to distinguish between varying
intensities. Although the questions explained the different intensities of physical activity,
they may not have been adequate. Bender, Brownson, Elliot, and Haire-Joshu (2005) also
noted that parents tended to perceive and place any type of activity in their child among
higher levels (moderate to hard), despite the fact that the child was engaged in light
physical activity as reported by the accelerometer. Secondly, parents may not have been
with their school-aged child throughout the day and therefore may be unaware of their
child’s activities (both physical and sedentary) during the day. Parents reportedly spend
more time on weekends with their children than on weekdays (The best start: supporting,
happy childhoods, 2010). Therefore, parents may be more aware of the activities of their
children on weekends compared to weekdays. In an attempt to rule out this possibility,
parental awareness levels were compared on weekdays and weekends. However, parents
still demonstrated a similar degree of overestimation, thus, displaying lack of awareness
of their child’s physical activity and sedentary pursuits.
As mentioned earlier, large overestimation of physical activity duration may
result from parents’ assumptions that their child is fully active for a 40 min session of
school gymnasium or another organized sport/activity, when the major part of the 30- or
40-minute gym session may have been spent listening to instructors or coaches, watching
others play, awaiting turn to play or awaiting turn to use a particular gym item.
Furthermore, the sporadic and short bouts of activity that constitute young children’s
physical activity may be difficult to predict and recall. Parents may have also filled out
the questionnaires several days after the time that the activity occurred, in order to
complete the assignment quickly. In conclusion, parents in the present study greatly
overestimated their child’s vigorous and moderate activity while underestimating
sedentary behaviour. Several factors such as difficulty in recall of duration and estimating
child physical activity intensity could have contributed to the lack of awareness of child
physical activity and sedentary behaviour.

57
4.3 Discordance between Child and Parents’ Awareness of Child’s Physical Activity and Sedentary Behaviour
In the present study, no significant differences were observed between the child’s
and parent’s awareness of child physical activity and sedentary behaviour. There was
agreement between the parents’ and child’s reports of the child’s physical activity and
sedentary behaviours. A study published in Statistics Canada also compared the child
reports of their physical activity and sedentary behaviour with those of their parents in
reference to weight of the child. The kappa scores indicated low to fair agreement
between the parent-child reports. Overweight or obese children reported more
participation in organized and leisure sports and less time engaged in sedentary activities
compared to their parents and normal weight counterparts. On the other hand, parent
reports were considered to be more accurate since significant associations were found
between parental report of child’s activities and child body weight (Sithole & Veugelers,
2008). However, in the present study, no significant difference was found between the
parent and child reports. Although both parent and child were inaccurate in estimating the
child’s physical activity and sedentary behaviours when compared to the accelerometer
data, the degree of over and under reporting amongst the parent and child dyad was not
significantly different. Also, no such association between weight and activity levels
reporting was found in the present sample. This could be attributed to the methodological
and sample population differences amongst the two studies. There is also a chance that
children filled out their parents’ questionnaire for the parent reporting. To control for the
above mentioned possibility sealed envelopes (containing the parent questionnaire) were
handed out and children were instructed to only allow their parents to open them. Also,
parents were instructed to return the questionnaires sealed in the envelopes provided
without sharing the answers with their children. To overcome this potential issue, a future
study might require reporting over the phone on a daily basis with both children and
parents separately. Further research needs to be done to examine and establish differences
between parent and child reports and to develop means of comparing parent and child
reports more efficiently.

58
4.4 Association between Gender, BMI, Age and Awareness (both Child and Parent)
4.4.1 Gender Differences
The results showed that boys engaged in more vigorous and moderate activity
than girls, whereas girls engaged in more sedentary behaviours than boys. These findings
are consistent with previous studies investigating gender differences in accumulation of
physical and sedentary activity in young children. A study on daily patterns of physical
activity among Canadians observed similar differences in accumulation of physical
activity among all age groups. Regardless of age group, boys were found to be more
active than girls (Garriguet & Colley, 2012). Several other studies have also identified
similar gender disparities in accumulation of physical activity (Colley, et al., 2011;
Hussey, Bell, Bennett, O’Dwyer, & Gormley, 2006; Sallis, Prochaska, & Taylor, 2000;
Troiana, et al., 2008).
In the current study, there were gender differences in levels of awareness of
physical activity and sedentary behaviour; boys were found to overestimate vigorous
activity more than girls, whereas girls tended to overestimate moderate and underestimate
sedentary behaviour more than boys. These findings were consistent with a study
investigating the agreement between the TriTrac-R3D monitors (TTM) and youth recall
of different intensities of physical activity (Cradock et al. 2003). No such association was
found among parents of both girls and boys in terms of gender differences in over or
under estimation of physical activity. The gender differences observed in over and under
reporting of physical activity and sedentary behaviour have important implications.
Health promotion efforts should be gender specific, perhaps separating female and male
students in health education classes so that female awareness and participation in physical
activity can be increased. Also, inclusion of physical activities that may be more
appealing to girls (e.g., dancing classes, gymnastics) may lead to increased participation.
Furthermore, parents should be made aware of the differences in female and male
physical activity reporting and activity levels. If parents are aware that females are less
active than the child believes, then parents can focus more on ensuring their female
children are more active and less sedentary when at home.

59
4.4.2 Age
Significant correlations were found between the child’s physical activity levels
and age. Sedentary behaviour was also seen to increase as age increased. A positive
correlation (r = .30) was found between overestimation of moderate activity and age.
Similarly, the older the child, the more likely he/she was to underestimate sedentary
activity (r = -.30). However, the current study was conducted on a narrow age range (10
to 13 years old). It is recommended that a broader age distribution be used in order to
fully understand the implications of age on child physical activity awareness.
4.4.3 BMI
In the present study, no significant association was found between degree of over
or under estimation and BMI. Corder et al. (2010) also examined the association between
biological factors such as fat mass index and awareness of physical activity in children
and their parents. The authors found no significant association between BMI and degree
of over or underestimation among children. However, parents of children with a low fat
mass index were more likely to overestimate child physical activity in the study by
Corder et al. (2010). In the present study, no such association between BMI and parental
awareness of their child’s physical activity and sedentary behaviour was observed.
Hence, the child’s BMI was not associated with levels of awareness among parents and
children. Parents and children lacked awareness irrespective of child’s BMI and obesity
status.

60
Chapter 5
5 Conclusion
Assessment of awareness of physical activity was considered important since
misperception of one’s physical activity may act as a barrier to behaviour change
interventions: it may lead to people not seeing the need to change and having a low
intention to change. In addition, individuals who perceive themselves to be sufficiently
active, may be “overlooked or neglected in health promotion efforts as these commonly
target self-rated inactive populations” (van Slujis, et al., 2007, p. 2). When considering
awareness of child physical activity, parents are observed as the central agents of change
in promotion of healthy behaviours, thus, lack of awareness among parents may act as a
barrier to such behaviour change (Corder et al., 2010).
The primary objective of this study was to assess awareness of physical activity
and sedentary behaviour among children and their parents by comparing subjective (i.e.,
self-report) and objective (i.e., accelerometer) measures. A secondary objective was to
compare differences among parent and child levels of awareness and examine biological
factors (i.e., gender, age, BMI) associated with levels of awareness in the study
population. In terms of the primary objective, the majority of the children and their
parents overestimated the child’s physical activity and therefore both lacked awareness of
the child’s daily physical activity. On the other hand, sedentary activity was greatly
underestimated by both parents and their children. Although children demonstrated
similar misperceptions of their activity levels and sedentary behavior, the lack of
awareness among parents is alarming since parents are viewed as the central agents of
change in health promotion efforts. Parents usually serve as a safety net for child health
related behaviours, such as determining what to eat, and encouraging physical activity.
However, if parents fail to recognize their child’s unhealthy behaviour as a problem, it is
highly unlikely that the parent will proactively attempt to change that behaviour.
Accurate parental perceptions and acknowledgment of unhealthy behaviour in children
(such as lack of physical activity, excessive sedentary lifestyle) serve as important factors
in determining the success of pediatric obesity interventions (Rhee, DeLago, Arscott-

61
Mills, Mehta, & Davis, 2005). Parents who incorrectly perceive their child to be healthy
and sufficiently active are likely to believe that obesity interventions or health promotion
interventions are targeted towards other audiences. Thus, lack of awareness among both
parents and their children may serve as a hindrance to health promotion strategies.
5.1 Limitations of the Study
Because this study aimed to include weekend activity, self-reporting had to be
recalled for the previous day and then, after three days of physical activity (i.e. previous
day recall for physical activity and sedentary behaviour on Friday, and 3-day physical
activity recall [for Friday, Saturday and Sunday] on Monday). A delay of more than 24
hours in recall duration may provide less accurate results (Sallis, et al., 1993). Thus, a
method to incorporate weekend activity while guaranteeing that reporting is done daily
would further enhance the results of this study. Similarly, the fact that activity was first
reported on Friday and then on Monday adds a degree of inconsistency in reporting
which may have skewed results (i.e. results on Friday may be more accurate than results
on Monday). However, this potential bias was ruled out since significant differences were
not observed between awareness levels reported on Friday morning compared to Monday
morning by both parents and children. Similar lack of awareness was observed between
Friday morning and Monday morning.
Another limitation is that the results cannot be generalized since the study sample
was comprised of mainly Canadian born South Asian children and immigrant parents (n
= 47, 88%). The results of the present study reflect on the physical activity and awareness
levels of Canadian born South Asian children and their parents, whereas, a study on more
diverse ethnic samples may reveal different results. It is a possibility that Canadian
children and parents of south Asian descent may lack awareness of child physical activity
and sedentary behaviour to a larger extent compared to study samples of other ethnicities.
For example, studies conducted on physical activity levels among different groups
(including South Asians) in UK and Canada have consistently demonstrated lower PA
levels among South Asians compared to the general population (Bryan, Tremblay, Perez,
Ardern, & Katzmarzyk, 2006; Owen et al., 2009). Past research on awareness levels has
been conducted primarily on white/Caucasian children and parents. Parents and children

62
in the current study lacked awareness to a larger extent compared to these previous
studies (Corder et al., 2010; Kremers et al., 2008; Ronda et al., 2001; van Slujis et al.,
2007). Since Canada is largely recognized as a multiethnic country, further research
exploring the effects of ethnicity and culture is required to effectively promote and
implement health-related programs (Kobayashi, Prus, & Lin, 2008). Strategies to
promote and increase physical activity should consider the effect of ethnicity and culture
on physical activity levels and related perceptions (Bryan, Tremblay, Perez, Ardern, &
Katzmarzyk, 2006; Owen et al., 2006; Tremblay, Bryan, Perez, Ardern & Katzmarzyk,
2006).
Lastly, time spent in light activity was not taken into account in the present study.
Children may have misclassified light activity as either moderate or vigorous activity. A
future study involving light activity may determine whether inclusion of light activity
may demonstrate increased levels of awareness among children and parents.
5.2 Implications
Several suggestions can be made to increase awareness of physical activity and
sedentary behaviour among children and their parents. With regards to improving PA
awareness, Bentley and colleagues (2012) advocate to incorporate knowledge and use of
tools to monitor PA in interventions. This may facilitate realistic perceptions among
parents and children, and thus promote awareness. Self-monitoring and personalized
feedback have been suggested as effective tools to increase levels of awareness (Bentley
et al., 2012). If children can be provided with constant feedback on their behaviour, such
as, employing an objective measure (e.g., pedometer), it may influence behaviour and
consequently, increase awareness (van Slujis et al., 2007). Pedometers are reported to
alter behaviour and increase PA levels and hence, may also be an effective strategy to
increase awareness (van Slujis et al., 2007).
In addition, several factors such as recall of duration and intensity need to be kept
in mind as these may hinder accurate reporting of a child’s physical activity. Recall of
duration of physical activity has shown to be enhanced by segmenting the day, allowing
activities to be reported in the context within which they have been performed (Ridley,

63
Olds, & Hill, 2008). This refers to the use of daily landmarks (i.e. school break for
weekdays, meal times for non-school days, play, and TV programs) which have been
shown to improve recall of physical activity among children (Ridley, et al., 2008;
McKenna, et al., 2004). Since children have also demonstrated consistent difficulty in
estimating intensity of their physical activity, the use of videos (e.g., videos of children
engaged in activities of varying intensities) has been reported to be effective in helping
children understand the concept of intensity (Ridley, et al., 2008). The use of a
computerized self-report questionnaire such as the Multimedia activity recall for children
and adolescents (MARCA) may assist children with improving recall and understanding
intensity, thus leading to increased awareness of their physical activity. In addition, the
use of heart rate monitors by children during gym sessions, after school physical activity
programs and active play may also provide children with a picture of the intensity at
which physical activity was performed.
In terms of improving parental awareness, parental education and involvement
may serve to increase awareness of child physical activity and sedentary behaviours.
Educating parents about the varying types and intensities of physical activity
accumulated by children should form an important component in a parenting PA
intervention. One way to achieve this could be by increasing parental self-participation in
child PA leading to increased awareness of the child’s physical activity accumulation.
For example, parents and children attending a gym session together could be instructed to
perform activities at varying intensities. If they are unable to differentiate among the
various intensities of physical activity, they should be educated regarding the different
intensities. The use of heart rate monitors may aid parents and children in identifying
activities performed at different intensities throughout the day. Heart rate monitors are
low-cost and have the ability to indirectly assess intensity, frequency and duration of
physical activity (Loprinzi & Cardinal, 2011). Thus, children can be encouraged to wear
heart rate monitors as part of the intervention to promote awareness among parents and
children. Heart rate monitors can provide parents and children with real time data at the
end of the day and therefore, improve overall awareness. This may also encourage both
parent and child to achieve recommended levels and more awareness of their physical
activity and sedentary behaviour. Also, as mentioned earlier, incorporating knowledge

64
(e.g. differentiating between types and intensities of physical activity accumulated by
children etc.) and tools to monitor PA may facilitate realistic perceptions among parents
and ultimately improve awareness (Bentley et al., 2012). Use of pedometers or an
objective measure providing feedback may also help parents quantify their child’s
physical activity and may prove to be an effective strategy to improve parental awareness
of their child’s physical activity and sedentary behaviour.
Lastly, more work needs to be done to promote awareness of excessive sedentary
behaviours among children and parents. Health promotion messages targeting child
physical activity should also incorporate information emphasizing the deleterious effects
of excessive sedentary behaviour on child health, distinct from the lack of MVPA.
Increased awareness of the deleterious effects of excessive sedentary behaviour among
parents and children may encourage them to adopt measures to reduce the time spent
being sedentary. Even if children attain the 60 minutes of MVPA/day, they are still left
with the rest of their “waking hours” to engage in other activities such as self-care,
homework, and leisure activities/free time. It is essential to target this “free time” and
ensure children do not partake in sedentary activity for prolonged periods of time.
However, to initiate such behaviour change, parents and children first need to be aware of
their child’s engagement in sedentary behaviour. Thus, public health promotion efforts
should also focus on promoting awareness of child sedentary behaviour among parents
and children.
Despite the cross-sectional findings and limitations of the present study, the
results offer new insights for future intervention research. To my knowledge, no previous
study has simultaneously assessed children’s awareness of their physical activity along
with their sedentary behaviour and parents’ awareness of their child’s physical activity
level and sedentary behaviour using directly comparable subjective and objective data.
Corder et al. (2010) assessed awareness of physical activity levels in a sample of British
school children and their parents. However, the subjective and the objective data were not
directly comparable and awareness of sedentary behaviour was not taken into account.
The present study highlighted the inability of parents and children to classify and report
activities based on intensities, and thus questioning how physical activity promotion

65
strategies may be perceived by both parents and children. For instance, a parent-oriented
TV commercial highlighting the current physical activity guidelines for children (i.e.,
accumulation of at least 60 minutes of MVPA each day, constituting vigorous intensity
activity at least 3 days per week) may not be accurately perceived since the results of this
study demonstrated that parents were unable to differentiate between intensities. In the
present study, parents greatly overestimated the accumulation of vigorous and moderate
intensity physical activity by their children and assumed their children to be more active
than they actually were. Also, parents drastically underestimated their children’s
engagement in sedentary behaviours. Parents demonstrated a consistent lack of awareness
of their child’s physical activity levels and sedentary behaviour irrespective of child
obesity status. Future research should focus on how to effectively measure (both physical
activity and sedentary behaviour) and increase awareness levels among parents and
children. Future work should assess the effect of feedback, parental participation and
education on awareness and behaviour and whether these are effective strategies to raise
awareness among parents and children. Further work also needs to be done to examine
the potential factors that may affect and improve levels of awareness.

66
References
Active Healthy Kids Canada. Active Healthy Kids Canada Report Card on Physical
Activity for Children and Youth. Toronto: Active Healthy Kids Canada, 2011.
Adamo, K. B., Prince, S. A., Tricco, A. C., Conner-Gorber, S., & Tremblay, M. (2009).
A comparison of indirect versus direct measures for assessing physical activity in
the pediatric population: A systematic review. International Journal of Pediatric
Obesity, 4, 2-27. doi: 10.1080/17477160802315010
Affuso, O., Stevens, J., Catellier, D., McMurray, R. G., Ward, D. S., Lytle, L., …Young,
D. R. (2011). Validity of self-reported leisure time sedentary behaviour in
adolescents. Journal of Negative Results in BioMedicine, 10(2). doi:
10.1186/1477-5751-10-2
Baxter, J., Gray, M., & Hayes, A. (2010). The best start: Supporting, happy childhoods
[Fact Sheet]. Retrieved from
http://www.aifs.gov.au/institute/pubs/factssheets/ssbrochure10/ssbrochure10.html
Bender, J. M., Brownson, R. C., Elliot, M. B., & Haire-Joshu, D. L. (2005). Children’s
physical activity: Using accelerometers to validate a parent proxy record.
Medicine & Science in Sports & Exercise, 37(8), 1409-13. doi:
10.1249/01.mss.0000174906.38722.2e
Bentley, G. F., Goodred, J. K., Jago, R., Sebire, S. J., Lucas, P. J., Fox, K. R., … Turner,
K. M. (2012). Parents’ views on child physical activity and their implications for

67
physical activity parenting interventions: a qualitative study. BMC Pediatrics, 12,
180. doi: 10.1186/1471-2431-12-180
Bryan, S. N., Tremblay, M. S., Perez, C. E., Ardern, C. I., & Katzmarzyk, P. T. (2006).
Physical activity and ethnicity: evidence from the Canadian Community Health
Survey. Canadian Journal of Public Health, 97(4), 271-76.
Chiang, E. S., Molin, A. J., Byrd, S. P., & Crawford, Y. J. (2009). Parent perceptions of
children’s weight status, nutrition and activity levels. ICAN: Infant, Child, &
Adolescent Nutrition, 1(4), 220-24. doi: 10.1177/1941406409341479
Cobb, J. E. (2011). Child and Parent Readiness to Change in a Clinical Sample of Obese
Youth (Doctoral dissertation, Georgia State University). Retrieved from
http://digitalarchive.gsu.edu/psych_diss/76
Colley, R. C., Connor Gorber, S., & Tremblay, M. S. (2010). Quality control and data
reduction procedures for accelerometry-derived measures of physical activity.
Health Reports (Statistics Canada, Catalogue 82-003), 21(1), 1-7.
Colley, R. C., Garriguet, D., Janssen, I., Craig, C. L., Clarke, J., & Tremblay, M. S.
(2011). Physical activity of Canadian children and youth: Accelerometer results
from the 2007 to 2009 Canadian Health Measures Survey. Health Reports
(Statistics Canada, Catalogue 82-003-XPE), 22(1), 1-7.
Colley, R. C., Wong, S. L., Garriguet, D., Janssen, I., Connor Garber, S., & Tremblay, M.
S. (2012). Physical activity, sedentary behaviour and sleep in Canadian children:

68
Parent-report versus direct measures and relative associations with health risk.
Health Reports (Statistics Canada, Catalogue 82-003-XPE), 23(2), 1-6.
Corder, K., Crespo, N. C., van Slujis, E. M. F., Lopez, N.V., & Elder, J. P. (2012).
Parent awareness of young children’s physical activity. Preventive Medicine,
55(3), 201-205. doi: 10.1016/j.ypmed.2012.06.021
Corder, K., van Slujis, E. M. F., McMinn, A. M., Ekelund, U., Cassidy, A., Griffin, S. J.
(2010). Perception versus reality: Awareness of physical activity levels of British
children. American Journal of Preventive Medicine, 38, 1-8. doi:
10.1016/j.amerpre.2009.08.025
Cottrell, L., Harris, C. V., Bradlyn, A., Gunel, E., Neal, W. A., Abildso, L., & Coffman,
J. W. (2012). Identifying the people and factors that influence children’s
intentions to make lifestyle changes. Health Promotion Practice, 13, 183-189.
Cradock, A. L., Wiecha, J. L., Peterson, K. E., Sobol, A. M., Colditz, G. A., &
Gortmaker, S. L. (2004). Youth recall and TriTrac accelerometer estimates of
physical activity levels. Medicine and Science in Sports and Exercise, 36(3), 525-
532.
Craggs, C., Corder, K., van Slujis., & Griffin, S. J. (2011). Determinants of change in
physical activity in children and adolescents. American Journal of Preventative
Medicine, 40(6), 645-658. doi: 10.1016/j.amepre.2011.02.025

69
Eckstein, K. C., Mikhail, L. M., Ariza, A. J., Thomson, J. S., Millard, S. C., & Binns, H.
J. (2006). Parents’ perceptions of their child’s weight and health. Pediatrics,
117(3), 681- 690.
Garriguet, D., & Colley, R. C. (2012). Daily patterns of physical activity among
Canadians. Health Reports (Statistics Canada, Catalogue 82-003-XPE), 23(2), 1-
6.
Gaston, A., & Prapavessis, H. (2012). Using a combined protection motivation theory
and health action process approach intervention to promote exercise during
pregnancy. Journal of Behavioural Medicine, Advance online publication. doi:
10.1007/s10865-012-9477-2
Ha, A., Abbott, R., Macdonald, D., & Pang, B. (2009). Comparison of perceived support
for physical activity and physical activity related practices of children and young
adolescents in Hong Kong and Australia. European Physical Education Review
2009, 15(2), 155-173.
Hedwig, L. (2009). The influence of parenting practices and behaviors in the relationship
between social disadvantage and physical inactivity risk in the transition to young
adulthood. Paper presented at the Population Association of America, Detroit, MI.
Abstract retrieved from
http://paa2009.princeton.edu/download.aspx?submissionId=90854
70
Heitzler, C. D., Martin, S. L., Duke, J., & Huhman, M. (2006). Correlates of physical
activity in a national sample of children aged 9-13 years. Preventative Medicine,
42(4), 254-260.
Hennessy, E., Hughes, S. O., Goldberg, J. P., Hyatt, R. R., & Economos, C. D. (2010).
Parent child interactions and objectively measured child physical activity: a cross-
sectional study. International Journal of Behavioral Nutrition and Physical
activity, 7, 71. doi: 10.1186/1479-5868-7-71
Hussey, J., Bell, C., Bennett, K., O’Dwyer, J., & Gormley, J. (2006). Relationship
between the intensity of physical activity, inactivity, cardiorespiratory fitness and
body composition in 7-10-year-old Dublin children. British Journal of Sports
Medicine, 41(5), 311-316. doi: 10.1136/bjsm.2006.032045
Jaballas, E., Clark-Ott, D., Clasen, C., Stolfi, A., & Urban, M. (2011). Parents’
perceptions of their children’s weight, eating habits, and physical activities at
home and school. Journal of Pediatric Health Care, 25(5), 294-301.
Jago, R., Baranowski, T., Baranowski, J. C., Cullen, K. W., & Thompson, D. I. (2007).
Social desirability is associated with some physical activity, psychosocial
variables and sedentary behaviour but not self-reported physical activity among
adolescent males. Health Education Research, 22(3), 438-439.
Jago, R., Fox, K. R., Page, A. S., Brockman, R., & Thompson, J. L. (2010). Parent and
child physical activity and sedentary time: Do active parents foster active
children? BMC Public Health, 10:194. doi: 10.1186/1471-2458-10-194

71
Janssen, I., & LeBlanc, A. G. (2010). Systematic review of the health benefits of physical
activity and fitness in school-aged children. International Journal of Behavioral
Nutrition and Physical activity, 7, 40. doi: 10.1186/1479-5868-7-40
Kirby, J., Levin, K. A., & Inchley, J. (2011). Parental and peer influences on physical
activity among Scottish adolescents: a longitudinal study. Journal of Physical
Activity and Health, 8(6), 785-793.
Klesges, L. M., Baranowski, T., Beech, B., Cullen, K., Murray, D. M., Rochon, J., &
Pratt, C. (2004). Social desirability bias in self-reported dietary, physical activity
and weight concerns measures in 8- to 10-year-old African-American girls: results
from the Girls Health Enrichment Multisite Studies (GEMS). Preventive
Medicine, 38(supplement), 78-87.
Kobayashi, K. M., Prus, S., & Lin, Z. (2008). Ethnic differences in self-rated and
functional health: does immigrant status matter? Ethnicity & Health, 13(2), 129-
147.
Kremers, S. P. J., Dijkman, M. A. M., de Meij, J. S. B., Jurg, M. E., & Brug, J. (2008).
Awareness and habit: important factors in physical activity in children. Health
Education, 108(6), 475-488. doi: 10.1108/09654280810910881
LeBlanc, A. G. W., & Janssen, I. (2010). Difference between self-reported and
Accelerometer measured moderate-to-vigorous physical activity in youth.
Pediatric Exercise Science, 22, 523-534.

72
Loprinzi, P. D., & Cardinal, B. J. (2011). Measuring children’s physical activity and
sedentary behaviours. Journal of Exercise Science and Fitness, 9(1), 15-23.
Mandich, G. E. (2012). Physical activity among Latino children in London, Ontario: An
assessment of physical activity levels, sedentary behaviours, and physical activity-
related barriers and facilitators (Master’s thesis). Retrieved from Electronic
Thesis and Dissertation Repository. Paper 512. http://ir.lib.uwo.ca/etd/512
Mathieu, M-E., Drapeau, V., & Tremblay, A. (2010). Parental misperception of their
child’s body weight status impedes the assessment of the child’s lifestyle
behaviors. International Journal of Pediatrics. 2010. doi:10.1155/2010/306703
McKenna, J., Foster, L., & Page, A. (2004). Exploring recall of physical activity in young
people using qualitative interviewing. Pediatric Exercise Science, 16(1), 5-14.
Mota, J., & Queiros, P. (1996). Children’s Behavior. Physical activity regarding parents’
perception vs. children’s activity. International Review for the Sociology of Sport,
31(2), 173-183. doi: 10.1177/101269029603100204
Olds, T. S., Maher, C. A., Ridely, K., & Kittel, D. M. (2010). Descriptive epidemiology
of screen and non-screen sedentary time in adolescents: a cross sectional study.
International Journal of Behavioral Nutrition and Physical Activity, 7 doi:
10.1186/1479-5868-7-92
Ornelas, I. J., Perreira, K. M., & Ayala, G. X. (2007). Parental influences on adolescent
physical activity: a longitudinal study. International Journal of Behavioral
Nutrition & Physical Activity, 4(3). doi: 10.1186/1479-5868-4-3

73
Owen, C. G., Nightingale, C. M., Rudnicka, A. R., Cook, D. G., Ekelund, U., &
Whincup, P. H. (2009). Ethnic and gender differences in physical activity levels
among 9-10-year-old children of white European, South Asian and African-
Caribbean origin: the child Heart Health Study in England (CHASE Study).
International Journal of Epidemiology, 39. 1082-93. doi: 10.1093/ije/dyp176
Puyau, M. R., Adolph, A. L., Vohra, F. A., Zakeri, I., & Butte, N. F. (2004). Prediction of
activity energy expenditure using accelerometers in children. Medicine & Science
in Sports & Exercise, 36(9), 1625-31.
Rhee, K. E., DeLago, C. W., Arscott-Mills, T., Mehta, S. D., & Davis, R. K. (2005).
Factors associated with parental readiness to make changes for overweight
children. Pediatrics, 116(1) 94-101. doi: 10.1542/peds.2004-2479
Ridley, K., Olds, T. S., & Hill, A. (2006). The Multimedia activity recall for children and
adolescents (MARCA): development and evaluation. International Journal of
Behavioral Nutrition and Physical Activity, 3(10). doi: 10.1186/1479-5868-3-10
Ronda, G., Van Assema, P., & Brug, J. (2001). Stages of change, psychological factors
and awareness of physical activity levels in the Netherlands. Health Promotion
International, 16(4), 305-314.
Rowlands, A. V., & Eston, R. G. (2007). The measurement and interpretation of
children’s physical activity. Journal of Sports Science and Medicine, 6(3). 270-
76.

74
Sallis, J. F., Buono, M. J., Roby, J. J., Micale, F. G., & Nelson, J. A. (1993). Seven-day
recall and other physical activity self-reports in children and adolescents.
Medicine & Science in Sports & Exercise, 25(1), 99-108.
Sallis, J. F., Prochaska, J. J., & Taylor, W. C. (2000). A review of correlates of physical
activity of children and adolescents. Medicine & Science in Sports & Exercise,
32(5), 963-975.
Sari, N. (2009). Physical inactivity and its impact on healthcare utilization. Health
Economics, 18(8), 885-901.
Sealy, Y. M., & Farmer, L. (2011). Parents’ Stage of Change for Diet and Physical
Activity: Influence on Childhood Obesity. Social Work in Health Care, 50(4),
274-291.
Shephard, R. J. (2003). Limits to the measurement of habitual physical activity by
questionnaires. British Journal of Sports Medicine, 37(3), 197-206,
doi:10.1136/bjsm.37.3.197
Sithole, F., & Veugelers, P. J. (2008). Parents and child reports of children’s activity.
Health Reports (Statistics Canada, Catalogue 82-003-XPE), 19(3), 1-5
Slater, A., Bowen, J., Corsini, N., Gardner, C., Golley, R., & Noakes, M. (2009).
Understanding parent concerns about children’s diet, activity, and weight status:
an important step towards effective obesity prevention interventions. Public
Health Nutrition, 13(8), 1221–1228. doi:10.1017/S1368980009992096

75
Slootmaker, S. M., Schuit, A. J., Chinapaw, M. J.M., Seidall. J. C., & van Mechelen, W.
(2009). Disagreement in physical activity assessed by accelerometer and self-
report in subgroups of age, gender, education and weight status. International
Journal of Behavioural Nutrition and Physical Activity, 6(17). doi: 10.1186/1479-
5868-6-17
Spencer, L., Adams, T. B., Malone, S., Roy, L., & Yost, E. (2006). Applying the
transtheoretical model to exercise: A systematic and comprehensive review of the
literature. Health promotion practice, 7, 428.
Springer, A. E., Kelder, S. H., & Hoelscher, D. M. (2006). Social support, physical
activity and sedentary behaviour among 6th
-grade girls: a cross sectional study.
International Journal of Behavioral Nutrition and Physical Activity, 3:8, doi:
10.1186/1479-5868-3-8
Strong, W. B., Malina, R. M., Blimkie, C. J. R., Daniels, S. R., Dishman, R. K., Gutin,
B., Hergenroeder, A. C., . . . Trudeau, F. (2005). Evidence based physical activity
for school-age youth. The Journal of Pediatrics, 146(6), 732-737.
Tremblay, M. S., Bryan, S. N., Perez, C. E., Ardern, C. I., & Katzmarzyk, P. T. (2006).
Physical Activity and Immigration Status: Evidence from the Canadian
Community Health Survey Canadian Journal of Public Health, 97(4), 277-82.
Tremblay, M. S., Colley, R. C., Saunders, T. J., Healy, G. N., & Owen, N. (2010).
Physiological and health implications of a sedentary lifestyle. Applied Physiology,
Nutrition, and Metabolism, 35(6), 725-740. doi: 10.1139/H10-079

76
Troiano, R. P., Berrigan, D., Dodd, K. W., Masse, L. C., Tilert, T., & McDowell, M.
(2008). Physical activity in the United States measured by accelerometer.
Medicine and Science in Sports and Exercise, 40(1), 181-188.
Trost, S. G., & Loprinzi, P. D. (2011). Parental influences on physical activity behaviour
in children and adolescents : A brief review. American Journal of Lifestyle
Medicine, 5(2), 171-181.
Trost, S. G., Kerr, L. M., Ward, D. S., & Pate, R. R. (2001). Physical activity and
determinants of physical activity in obese and non-obese children. International
Journal of Obesity and Related Metabolic Disorders, 25(6), 822-829.
doi:10.1038/sj.ijo.0801621
van Slujis, E. M. F., Griffin, S. J., & van Poppel, M. N. M. (2007). A cross-sectional
study of awareness of physical activity: associations with personal, behavioral and
psychosocial factors. International Journal of Behavioral Nutrition and Physical
Activity. 4 (53). doi: 10.1186/1479-5868-4-53
Woods, C., Mutrie, N., & Scott, M. (2002). Physical activity intervention: a
Transtheoretical Model-based intervention designed to help sedentary young
adults become active. Health Education Research, 17(4), 451-460. doi:
10.1093/her/17.4.451
Wong, S. L., Leatherdale, S. T., & Manske, S. R. (2006). Reliability and validity of a
school based physical activity questionnaire. Medicine & Science in Sports &
Exercise, 38(9) 1593-1600. doi: 10.1249/01.mss.0000227539.58916.35

77
World Health Organization. (2011). Global Status Report on non-communicable diseases.
Retrieved from http://www.who.int/nmh/publications/ncd_report2010/en/

78
Appendices
Appendix A: Invitation Letter
Awareness of child physical activity levels and sedentary behaviour among parents
and children
Your school is being invited to participate in a research study conducted by Master’s
Student Tripat Grewal from the School of Kinesiology at the Western University. If you
have any questions or concerns about the research, please feel free to contact Dr. Alan
Salmoni or Tripat Grewal.
Purpose of the study
The purpose of the study is to:
* assess awareness of child physical activity levels and sedentary behaviour (e.g.,
watching TV/movies, playing video/computer games, surfing the internet, reading and
homework etc.) among parents and their children aged 10-13 years.
* investigate any difference between parent and child reports of child’s physical activity
levels and sedentary behaviour.
Procedures
Participation in this study involves a questionnaire to be filled by both the parents and
grades 6-7 students (10-13 years) enrolled in your school. Involvement also requests a
physiological measure and physical activity measure of the student.
Questionnaire
The questionnaire for the child will take place via 2 sessions conducted in the classroom
at times when the administration decides are convenient and will take approximately 15-
20 minutes. The investigator will be available at all times to answer any questions that the
students may have pertaining to the questionnaires. Students will also be provided with a
take-home packet (containing Actical accelerometer, parent questionnaire and activity
monitor diary) during the first visit by the investigator.

79
Physiological Measure
This will take approximately 5-10 minutes to complete and will be taken on the first day
of data collection at the school. This involves a non-invasive Body Mass Index (BMI)
calculation, which is based on the height and weight of the student. The measurements
will be taken in a private location in the school away from the sight of other students.
Physical Activity
To obtain a physical activity and energy expenditure measures, an Actical® (a small,
lightweight, water resistant accelerometer worn on the right hip) will be worn by the
students included in the study for a period of 4 days (i.e., for a minimum of ten hours per
day). The student will be asked to keep an activity monitor diary at home (provided by
the researcher) whereby the whereby the type of activity child engaged in should be
recorded.
Feedback from the study
You may request the general findings of this research after the study is complete. If you
have any concerns, please feel free to contact the researchers above.
Potential risks and discomforts
There are no known or anticipated risks associated with participation in this study.
Benefits
Potential benefits of participating in this study are increased awareness regarding
physical activity among children aged 10-13 years of age and may also provide an insight
into the health culture of your school.
Compensation for participation
There is no compensation for participating in this study.
Confidentiality
All information that is obtained in connection with this study will remain confidential.
All information obtained will be kept in a locked cabinet in the investigator’s office and
will be destroyed once the study is completed.

80
Participation and withdrawal
Participation in this study is voluntary. The students may refuse to answer any questions
they do not want to answer or can withdraw from the study at any time.
If you would like your school to be participate in this study, please contact the
researchers above. We would like to arrange a meeting to further explain the nature of
the study.

81
Appendix B: Information Leaflet (Class Teacher)
Awareness of child physical activity levels and sedentary behaviour among parents
and children
Your school has agreed to participate in a research study conducted by Master’s Student
Tripat Grewal from the School of Kinesiology at the Western University. If you have any
questions or concerns about the research, please feel free to contact Dr. Alan Salmoni or
Tripat Grewal.
Purpose of the study
The purpose of the study is to:
* assess awareness of child physical activity levels and sedentary behaviour (e.g.,
watching TV/movies, playing video/computer games, surfing the internet, reading and
homework etc.) among parents and their children aged 10-13 years.
* investigate any difference between parent and child reports of child’s physical activity
levels and sedentary behaviour.
Procedures
Participation in this study involves a questionnaire to be filled by both the parents and
grades 6/7 students (10-13 years) enrolled in your class. Involvement also requests a
physiological measure and physical activity measure of the student. A week before the
data collection, the researcher will provide the students of your class a take-home pack
containing a leaflet for themselves and their parent/guardians, and a consent form. A few
days prior to the data collection, you are requested to reinforce the message to your
students that they will not be able to participate without completed consent.
Questionnaire
The questionnaire for the child will take place via 2 sessions conducted in the classroom
at times when the administration decides are convenient and will take approximately 15-
20 minutes. The researcher will be available at all times to answer any questions that the
students may have pertaining to the questionnaires. Students will also be provided with a

82
take-home packet (containing Actical accelerometer, parent questionnaire and activity
monitor diary) during the first visit by the researcher.
Physiological Measure
This will take approximately 5-10 minutes to complete and will be taken on the first day
of data collection at the school. This involves a non-invasive Body Mass Index (BMI)
calculation, which is based on the height and weight of the student. The measurements
will be taken in a private location in the school away from the sight of other students.
Physical Activity
To obtain a physical activity and energy expenditure measures, an Actical® (a small,
lightweight, water resistant accelerometer worn on the right hip) will be worn by the
students included in the study for a period of 4 days (i.e., for a minimum of ten hours per
day). The student will be asked to keep an activity monitor diary at home (provided by
the researcher) whereby the time when the accelerometer was worn and taken off should
be recorded.
Feedback from the study
The school administration may request the general findings of this research after the
study is complete. If you have any concerns, please feel free to contact the researchers
above.
Potential risks and discomforts
There are no known or anticipated risks associated with participation in this study.
Benefits
Potential benefits of participating in this study are increased awareness regarding
physical activity among children aged 10-13 years of age and may also provide an insight
into the health culture of your school.
Compensation for participation
There is no compensation for participating in this study.
83
Confidentiality
All information that is obtained in connection with this study will remain confidential.
All information obtained will be kept in a locked cabinet in the researcher’s office and
will be destroyed once the study is completed.
Participation and withdrawal
Participation in this study is voluntary. The students may refuse to answer any questions
they do not want to answer or can withdraw from the study at any time.
Thank you for your time and consideration!

84
Appendix C: Parent/Guardian Letter of Information
Awareness of child physical activity levels and sedentary behaviour among parents
and children
My colleagues and I, at the Western University, are writing to request permission for
your child’s participation in a research study that we are conducting on the awareness of
child physical activity levels and sedentary behaviour among parents and children.
Purpose of the study
The purpose of the study is to:
* assess awareness of child physical activity levels and sedentary behaviour (e.g.,
watching TV/movies, playing video/computer games, surfing the internet, reading and
homework etc.) among parents and their children aged 10-13 years.
* investigate any difference between parent and child reports of child’s physical activity
levels and sedentary behaviour.
Procedures
Participation in this study involves a questionnaire by both the parent and child.
Involvement also requests a physiological measure and physical activity measure of the
child.
Questionnaire
The questionnaire for the child will take place via 2 sessions conducted in the classroom
at times your child’s teacher decides are convenient and will take approximately 15-20
minutes. The investigator will be available at all times to answer any questions that your
child may have pertaining to the questionnaires. You will be asked to complete your
version of the questionnaire on Thursday and Sunday night regarding the child's activities
on Thursday and collectively for Friday, Saturday and Sunday. The questionnaire will
request that you and your child each report on the physical activities and inactivity of the
child. We will also ask your child to report on parental supervision.

85
Physiological Measure
This will take approximately 5-10 minutes to complete and will be taken on the first day
of data collection at the school. This involves a non-invasive Body Mass Index (BMI)
calculation, which is based on the height and weight of the student. The measurements
will be taken in a private location in the school away from the sight of other students.
Physical Activity
To obtain a physical activity and energy expenditure measures for your child, an
Actical® (a small, lightweight, water resistant accelerometer worn on the right hip) will
be worn by your child for a period of 4 days (i.e., for a minimum of ten hours per day).
You may also be contacted via the telephone routinely for physical activity measurements
(i.e., to ask your child to wear the Actical®) for a period of 4 days. Your child will be
asked to keep an activity monitor diary at home (provided by the researcher) whereby the
type of activity your child engaged in should be recorded by the child. These logs will
take approximately 2-3 minutes to complete each day. This log will be utilized for
validating the collected physical activity data and the child will be requested to return the
log at the last day of data collection.
Feedback from the study
You may request the general findings of this research after the study is complete. If you
have any concerns, please feel free to contact the researchers above.
Potential risks and discomforts
There are no known or anticipated risks associated with participation in this study.
Benefits
Potential benefits of participating in this study are increased awareness regarding
physical activity among children aged 10-13 years of age.
Compensation for participation
There is no compensation for participating in this study.

86
Confidentiality
All information that is obtained in connection with this study will remain confidential.
All information obtained will be kept in a locked cabinet in the investigator’s office and
will be destroyed once the study is completed. Representatives of The University of
Western Ontario Health Sciences Research Ethics Board may contact you or require
access to your study-related records to monitor the conduct of the research.
Participation and withdrawal
Participation in this study is voluntary. You and your child may refuse to answer any
questions you or they do not want to answer or withdraw from the study at any time.
Rights of subjects
If you have any questions or concerns about the research, please feel free to contact Dr.
Alan Salmoni or Tripat Grewal.
If you have questions regarding your rights as a research subject, contact the Office of
Research Ethics at Western University.
Thank you for your consideration. Please fill out the attached form and have your son or
daughter return it to his or her teacher.

87
Parent/Guardian Consent Form
Awareness of child physical activity levels and sedentary behaviour among parents and
children
I, __________________________ have read the Letter of Information, have had the
nature of the study explained to me and I agree to allow my child __________________
to participate. All questions have been answered to my satisfaction.
My signature below also confirms my agreement and consent to participate in this study.
Parent or Legal Guardian Name (please print clearly): ____________________________
____________________________ _______________________
Parent or Legal Guardian Signature Date
Participant’s (Child’s) Name (please print clearly): ______________________________
____________________________ _______________________
Participant’s (Child’s) Signature Date
OR I do not wish to have my child _____________________________ participate
Name of child
____________________ ___________________________ ___/___/___
Person obtaining consent Name Date
(Signature)

88

89

90

91
Appendix D: Child Assent Form
Awareness of child physical activity levels and sedentary behaviour among parents
and children
Purpose of the Study
We would like to invite you to participate in a study in which you will tell us the time
you spend in physical activities and being inactive during the day.
What will happen once you sign up for this study?
• I will measure your weight and height.
• You will be asked to wear an Actical® which is a way for researchers to see how
much energy your body uses each day. You will need to wear the Actical®
(which is a small, light, and waterproof) on your right hip for at least ten hours a
day (for 4 days straight).
• You will also be asked to fill out a questionnaire on two weekdays (Friday and
Monday morning) asking you about your physical activity and inactivity on
Thursday and collectively on Friday, Saturday and Sunday. You will also be
asked about when your parent is home. This will take about 5-10 minutes to
complete.
Confidentiality
I want you to know that I will not be telling your parents or any other kids what you
answer. I will keep your answers private and not tell anyone.
Participation
You can ask questions at any time, now or later. Your mom and/or dad have said it is
okay for you to wear the Actical® and tell me about your physical activities. Do you
think you want to do this? You won’t get into trouble if you say “no”. If you don’t want
to be in the study, just say so, and even if you say yes now, you can still change your
mind later. You don’t have to answer any questions that you do not want to answer. It is
entirely up to you. Would you like to be a part of this study?
Yes No (If no, please do not sign below)
92
I understand what I am being asked to do to be in this study, and I agree to be in this
study.
_______________________ ____________________
Signature Date
____________________ _________________________ ___/___/___
Person obtaining consent Name Date
(Signature)

93
CHILD QUESTIONNAIRE
We are interested to know what you do on a regular day. There are no right or wrong
answers-this is not a test. Please answer all the questions as honestly and accurately as
you can-this is very important.
1. NAME ______________________________
2. What grade are you in? ______________________________
3. How old are you? ______________________________
4. Are you a Girl or a Boy? ______________________________
DAY 1 (to be filled out in class on Friday):
PLEASE FILL OUT THE QUESTIONS BELOW:
� Mark how many minutes of HARD physical activity you did yesterday
(THURSDAY). This includes physical activity during physical education class,
after school, evenings and spare time.
HARD physical activities are running, team sports (like hockey, football), fast dancing, jump rope
and any other physical activities that increase your heart rate and make you breathe hard or
sweat.
For example: if you did 45 minutes of hard activity yesterday, you will need to fill in the 0 hour
circle and the 45 minute circle, as shown below:
THURSDAY
Hours
0 1 2 3 4
Minutes
0 15 30 45
Hours
0 1 2 3 4
Minutes
0 15 30 45
Appendix E: Modified SHAPES Questionnaire for Children

94
� Mark how many minutes of MODERATE physical activity you did yesterday
(THURSDAY). This includes physical activity during physical education class,
after school, evenings and spare time.
MODERATE physical activities are lower intensity activities such as walking, leisure biking, and
recreational swimming.
For example: if you did 1 hour and 15 minutes of moderate activity yesterday, you will need to
fill in the 1 hour circle and the 15 minute circle, as shown below:
THURSDAY
� Mark how much time you spent watching TV/movies, playing video/computer
games, surfing the internet, instant messaging or talking on the phone
yesterday (THURSDAY).
For example: if you spent 3 hours doing these activities yesterday, you would need to fill in the 3
hour circle, as shown below:
THURSD
AY
� How much time did you spend doing homework and reading (including reading
books, magazines and newspapers) yesterday?
________________________________________________________________________
____
� Which parent is present with you most of the time during the day?
Hours
0 1 2 3 4
Minutes
0 15 30 45
Hours
0 1 2 3 4
Minutes
0 15 30 45
0 1 2 3 4 5 6 7 8 9
0 1 2 3 4 5 6 7 8 9

95
� Is that parent/guardian present most or all of the time when you:
Leave for school Yes No
Return from school in the afternoon Yes No
Go to sleep at night Yes No
______________________________________________________________________________
_______
DAY 2 (TO BE FILLED OUT ON MONDAY MORNING):
� Mark how many minutes of HARD physical activity you did in the past 3 days
i.e. FRIDAY, SATURDAY & SUNDAY. This includes physical activity during
physical education class, after school, evenings and spare time.
HARD physical activities are running, team sports (like hockey, football), fast dancing, jump rope
and any other physical activities that increase your heart rate and make you breathe hard or
sweat.
For example: if you did 45 minutes of hard activity yesterday, you will need to fill in the 0 hour
circle and the 45 minute circle, as shown below:
FRIDAY
SATURDAY
SUNDAY
Hours
0 1 2 3 4
Minutes
0 15 30 45
Hours
0 1 2 3 4
Minutes
0 15 30 45
Hours
0 1 2 3 4
Minutes
0 15 30 45
Hours
0 1 2 3 4
Minutes
0 15 30 45

96
� Mark how many minutes of MODERATE physical activity you did in the past 3
days i.e. FRIDAY, SATURDAY & SUNDAY. This includes physical activity during
physical education class, after school, evenings and spare time.
MODERATE physical activities are lower intensity activities such as walking, leisure biking, and
recreational swimming.
For example: if you did 1 hour and 15 minutes of moderate activity yesterday, you will need to
fill in the 1 hour circle and the 15 minute circle, as shown below:
FRIDAY
SATURDAY
SUNDAY
� Mark how much time you spent watching TV/movies, playing video/computer
games, surfing the internet, instant messaging or talking on the phone in the
past 3 days i.e. FRIDAY, SATURDAY & SUNDAY.
For example: if you spent 3 hours doing these activities yesterday, you would need to fill in the 3
hour circle, as shown below:
Hours
0 1 2 3 4
Minutes
0 15 30 45
Hours
0 1 2 3 4
Minutes
0 15 30 45
Hours
0 1 2 3 4
Minutes
0 15 30 45
Hours
0 1 2 3 4
Minutes
0 15 30 45
0 1 2 3 4 5 6 7 8 9
97
FRIDAY
SATURDAY
SUNDAY
� How much time did you spend doing homework and reading (including reading books,
magazines and newspapers) in the past 3 days i.e. FRIDAY, SATURDAY & SUNDAY?
____________________________________________________________________________
Thank you very much for your participation ☺☺☺☺
0 1 2 3 4 5 6 7 8 9
0 1 2 3 4 5 6 7 8 9
0 1 2 3 4 5 6 7 8 9
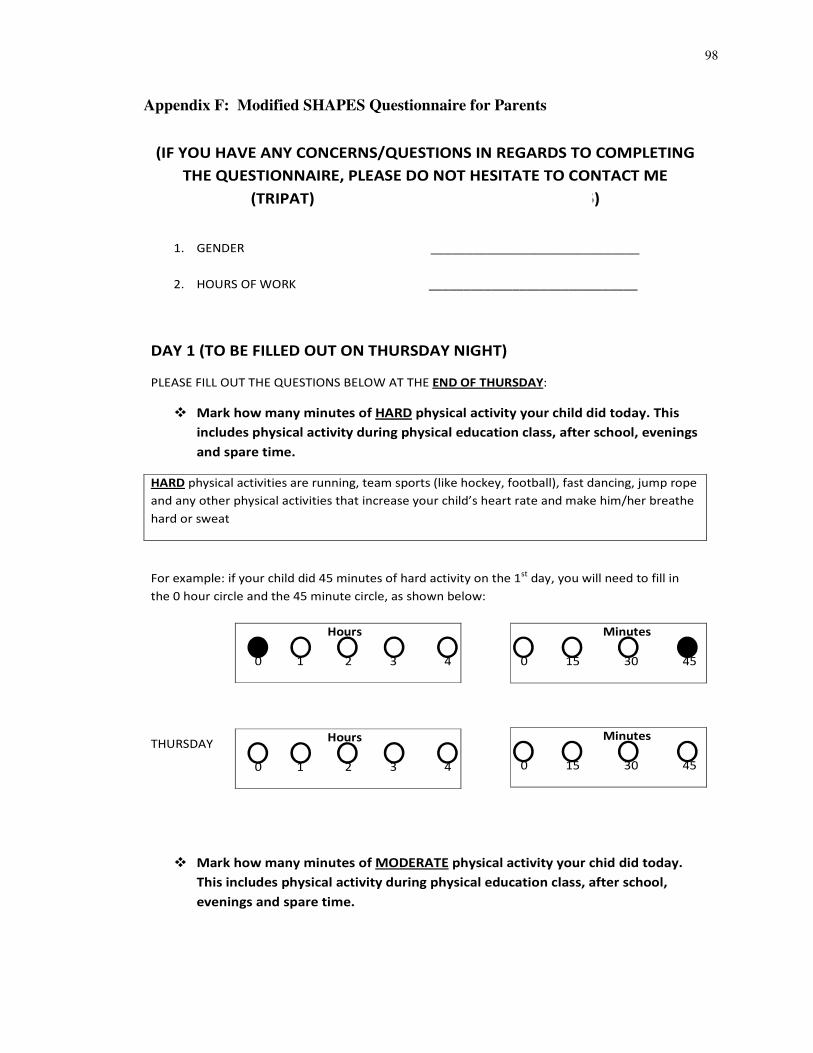
98
Appendix F: Modified SHAPES Questionnaire for Parents
(IF YOU HAVE ANY CONCERNS/QUESTIONS IN REGARDS TO COMPLETING
THE QUESTIONNAIRE, PLEASE DO NOT HESITATE TO CONTACT ME
(TRIPAT) AT (1)519-476-9533 OR 905-793-6065)
1. GENDER ______________________________
2. HOURS OF WORK ______________________________
DAY 1 (TO BE FILLED OUT ON THURSDAY NIGHT)
PLEASE FILL OUT THE QUESTIONS BELOW AT THE END OF THURSDAY:
� Mark how many minutes of HARD physical activity your child did today. This
includes physical activity during physical education class, after school, evenings
and spare time.
HARD physical activities are running, team sports (like hockey, football), fast dancing, jump rope
and any other physical activities that increase your child’s heart rate and make him/her breathe
hard or sweat
For example: if your child did 45 minutes of hard activity on the 1st
day, you will need to fill in
the 0 hour circle and the 45 minute circle, as shown below:
THURSDAY
� Mark how many minutes of MODERATE physical activity your chid did today.
This includes physical activity during physical education class, after school,
evenings and spare time.
Hours
0 1 2 3 4
Minutes
0 15 30 45
Hours
0 1 2 3 4
Minutes
0 15 30 45

99
MODERATE physical activities are lower intensity activities such as walking, leisure biking, and
recreational swimming.
For example: if your child did 1 hour and 15 minutes of hard activity on the 1st
day, you will
need to fill in the 1 hour circle and the 15 minute circle, as shown below:
THURSDAY
� Mark how much time your child spent watching TV/movies, playing
video/computer games, surfing the internet, instant messaging or talking on
the phone today.
For example: if your child spent 3 hours doing these activities on the 1st
day (i.e., Thursday), you
would need to fill in the 3 hour circle, as shown below:
THURSD
AY
How much time did your child spend doing homework and reading (including reading
books, magazines and newspapers) today? ____________________________
Hours
0 1 2 3 4
Minutes
0 15 30 45
Hours
0 1 2 3 4
Minutes
0 15 30 45
0 1 2 3 4 5 6 7 8 9
0 1 2 3 4 5 6 7 8 9

100
� Mark how many minutes of HARD physical activity your child did in the past 3
days i.e. FRIDAY, SATURDAY, & SUNDAY. This includes physical activity during
physical education class, after school, evenings and spare time.
HARD physical activities are running, team sports (like hockey, football), fast dancing, jump rope
and any other physical activities that increase your child’s heart rate and make him/her breathe
hard or sweat
For example: if your child did 45 minutes of hard activity on the yesterday, you will need to fill in
the 0 hour circle and the 45 minute circle, as shown below:
FRIDAY
SATURDAY
SUNDAY
� Mark how many minutes of MODERATE physical activity your chid did in the
past 3 days i.e., FRIDAY, SATURDAY & SUNDAY. This includes physical activity
during physical education class, after school, evenings and spare time.
MODERATE physical activities are lower intensity activities such as walking, leisure biking, and
recreational swimming.
Hours
0 1 2 3 4
Minutes
0 15 30 45
Hours
0 1 2 3 4
Minutes
0 15 30 45
Hours
0 1 2 3 4
Minutes
0 15 30 45
Hours
0 1 2 3 4
Minutes
0 15 30 45
DAY 2 (TO BE FILLED OUT ON SUNDAY NIGHT)

101
For example: if your child did 1 hour and 15 minutes of hard activity on the yesterday, you will
need to fill in the 1 hour circle and the 15 minute circle, as shown below:
FRIDAY
SATURDAY
SUNDAY
� Mark how much time your child spent watching TV/movies, playing
video/computer games, surfing the internet, instant messaging or talking on
the phone in the past three day i.e. FRIDAY, SATURDAY & SUNDAY.
For example: if your child spent 3 hours doing these activities on the yesterday, you would need
to fill in the 3 hour circle, as shown below:
FRIDAY
SATURD
AY
Hours
0 1 2 3 4
Minutes
0 15 30 45
Hours
0 1 2 3 4
Minutes
0 15 30 45
Hours
0 1 2 3 4
Minutes
0 15 30 45
Hours
0 1 2 3 4
Minutes
0 15 30 45
0 1 2 3 4 5 6 7 8 9
0 1 2 3 4 5 6 7 8 9
0 1 2 3 4 5 6 7 8 9

102
SUNDAY
� How much time did your child spend doing homework and reading (including reading
books, magazines and newspapers) in the past 3 days i.e., FRIDAY, SATURDAY &
SUNDAY?
________________________________________________________________________
� Did you have trouble with English while completing this questionnaire? If yes, what
was the trouble you face?
{IF YOU HAVE ANY CONCERNS/QUESTIONS IN REGARDS TO COMPLETING THE
QUESTIONNAIRE, PLEASE DO NOT HESITATE TO CONTACT ME (TRIPAT) AT (1)5194769533 OR
905-793-6065}
Thank you very much for your participation ☺☺☺☺
0 1 2 3 4 5 6 7 8 9

103
Appendix G: Ethics Form
Curriculum Vitae
Name: Tripat Simran Grewal
Post-secondary Lyallpur Khalsa College
Education and Affiliated to Guru Nanak Dev University
Degrees: Amritsar, Punjab, India
2005-2010 B.P.T
Honours and Western Graduate Research Scholarship (WGRS)
Awards: 2011-2012
Related Work Teaching Assistant
Experience The University of Western Ontario
2011-2012
Research Assistant
Kids Can-Bike Course Evaluation
2011-2012
Summer Internship
‘NSTEP Eat, Walk, Live with Nutrition! Ignition!
2011-2012

104
Curriculum Vitae
Name: Tripat Simran Grewal
Post-secondary Lyallpur Khalsa College
Education and Affiliated to Guru Nanak Dev University
Degrees: Amritsar, Punjab, India
2005-2010 B.P.T
Honours and Western Graduate Research Scholarship (WGRS)
Awards: 2011-2012
Related Work Teaching Assistant
Experience The University of Western Ontario
2011-2012
Research Assistant
Kids Can-Bike Course Evaluation
2011-2012
Summer Internship
‘NSTEP Eat, Walk, Live with Nutrition! Ignition!
2011-2012