FOOD HABITS AND ENVIRONMENTAL AWARENESS ...
59
The akademy of health, care and welfare FOOD HABITS AND ENVIRONMENTAL AWARENESS AMONG ADOLESCENTS IN VÄSTERÅS A study of neighborhoods with different socioeconomic status based on the NESLA study ANI HAKOPIAN Public health science Advanced level 30 hp Magister in public health Degree project in public health FHA043 Supervisor: Katarina Bälter Examiner: Peter Larm Seminar date: 30/5-2018 Grade date: 18/6-2018
-
Upload
khangminh22 -
Category
Documents
-
view
0 -
download
0
Transcript of FOOD HABITS AND ENVIRONMENTAL AWARENESS ...

The akademy of health, care and welfare
FOOD HABITS AND ENVIRONMENTAL AWARENESS AMONG ADOLESCENTS IN VÄSTERÅS A study of neighborhoods with different socioeconomic status based on the NESLA study
ANI HAKOPIAN
Public health science Advanced level 30 hp Magister in public health Degree project in public health FHA043
Supervisor: Katarina Bälter Examiner: Peter Larm Seminar date: 30/5-2018 Grade date: 18/6-2018

SAMMANFATTNING
Människor med hög socioekonomisk status har bättre matvanor och är mer miljömedvetna jämfört med de individer med låg socioekonomisk status, vilket bland annat beror på högre utbildningsnivå och inkomst. För att etablera goda matvanor krävs att det finns goda förutsättningar, till exempel är tillgången till mataffärer med ett stort utbud av färskvaror associerat med hälsosamma matvanor och frånvaron av bra mataffärer påverkar framför allt utsatta grupper i samhället. Syftet med den här studien är att beskriva matvanor och miljömedvetenheten bland ungdomar och undersöka om det finns skillnader i matvanor, miljömedvetenhet och förutsättningar för goda matvanor mellan ungdomar som bor i stadsdelar med olika socioekonomisk status i Västerås. Studien har en kvantitativ ansats med en tvärsnittsdesign. Sekundära data har använts från studien Neighborhood, sustainable lifestyle and health among adolescents (NESLA), som genomfördes år 2017 på ungdomar från andra och tredje året på gymnasiet.
Resultatet visar att ungdomar konsumerar frukt och grönsaker för sällan och konsumerar läsk, godis och chips för ofta. Majoriteten av ungdomarna äter på en snabbmatsrestaurang minst en gång i veckan. Nästan hälften av ungdomarna äter frukost varje dag och majoriteten av ungdomarna äter lunch i skolan varje dag. De flesta ungdomar är miljömedvetna, då majoriteten är oroliga för miljö- och klimatförändringar och tror att det är möjligt att påverka miljön genom egna livsstilsval. Det finns en signifikant korrelation mellan hög miljömedvetenhet och ohälsosamma matvanor. Det finns inga signifikanta skillnader mellan ungdomar från stadsdelar med olika socioekonomisk status och matvanor. Det finns inte heller någon skillnad mellan ungdomar från olika stadsdelar och huruvida de är oroliga för miljöförändringar, men för huruvida ungdomarna tror att de kan påverka miljön genom livsstilen. Ungdomar som bor i stadsdelar med låg socioekonomisk status rapporterar att de har bättre förutsättningar för hälsosamma matvanor jämfört med ungdomar från stadsdelar med medelhög och hög socioekonomiska status. För att diskutera resultatet har den ekologiska modellen använts som teoretiskt perspektiv.
Nyckelord: Ekologiska modellen, förutsättningar för goda matvanor, matvanor, miljömedvetenhet, NESLA, socioekonomisk status på stadsdelsnivå

ABSTRACT
Individuals with high socioeconomic status have better food habits and are more environmentally aware, due to higher education level and income. To establish healthy food habits, it requires that there are good prerequisites such as food stores with a wide range of fresh food since it is associated with healthy food habits of an individual and absence of good food stores is mainly affecting disadvantaged groups. The aim of this study is to describe food habits and environmental awareness among adolescents in Västerås and investigate if there are differences regarding food habits, environmental awareness and prerequisites for healthy food habits between adolescents living in neighborhoods with different socioeconomic status. The study is a quantitative study with a cross-sectional study design. Secondary data was used from the study Neighborhood, sustainable lifestyle and health among adolescents (NESLA), which was conducted in autumn of 2017 on adolescents from year two and three in high school.
The result shows that the adolescents’ have a low consumption of fruits and vegetables and a high consumption of candy, chips, other snacks and soda. The majority of the adolescents’ eats at a fast food restaurant at least once a week. Almost half of the adolescents’ eats breakfast every day and the majority eats lunch at school every day a regular week. Most of the adolescents are environmentally aware, since they are worried about environmental issues and climate changes and believe that their lifestyle choices can affect the environment. A significant correlation between high environmental awareness and unhealthy food habits is found. There is no statistically significant difference between neighborhood-level socioeconomic status and food habits, and for being worried about environmental issues and climate changes. Significant differences are found between adolescents from neighborhoods with different socioeconomic status and believing in that lifestyle choices affects the environment. Adolescents living in low socioeconomic status neighborhoods reported that they have greater prerequisites for healthy food habits compared to middle-high and high socioeconomic status neighborhoods. The ecological model was used as a theoretical perspective to discuss the results.
Keywords: Ecological model, environmental awareness, food habits, Neighborhood-level socioeconomic status, NESLA study, prerequisites for healthy food habits

CONTENT
1 INTRODUCTION ............................................................................................................... 1
2 BACKGROUND ................................................................................................................. 2
2.1 Health .......................................................................................................................... 2
2.2 Agenda 2030 ............................................................................................................... 2
2.3 Public health goal ....................................................................................................... 3
2.4 Socioeconomic status ............................................................................................... 3
2.4.1 Neighborhood socioeconomic status .................................................................. 4
2.5 Food habits ................................................................................................................. 5
2.5.1 Food habits and socioeconomic status .............................................................. 5
2.6 Prerequisites for healthy food habits ....................................................................... 6
2.6.1 Prerequisites for healthy food habits on neighborhood-level .............................. 7
2.7 Environmental awareness ......................................................................................... 7
2.7.1 Environmental awareness and socioeconomic status ........................................ 8
2.7.2 Environmental awareness and food habits ......................................................... 8
2.8 The ecological model as theoretical framework ..................................................... 9
2.9 Formulation of issue ................................................................................................ 10
3 AIM .................................................................................................................................. 11
3.1 Research questions ................................................................................................. 11
4 METHOD ......................................................................................................................... 11
4.1 Study design ............................................................................................................. 12
4.2 Neighborhood, sustainable lifestyle and health among adolescents ................. 12
4.3 Selection ................................................................................................................... 13
4.3.1 Loss .................................................................................................................. 13
4.4 Description of variables ........................................................................................... 14
4.4.1 Food habits ....................................................................................................... 14
4.4.2 Environmental awareness ................................................................................ 15
4.4.3 Neighborhood-level socioeconomic status ....................................................... 16

4.4.4 Prerequisite for healthy food habits .................................................................. 18
4.5 Analytic method ....................................................................................................... 18
4.5.1 Food habits ....................................................................................................... 18
4.5.2 Environmental awareness ................................................................................ 18
4.5.3 Correlation between environmental awareness and food habits ...................... 19
4.5.4 Differences in food habits and environmental awareness among neighborhood-level socioeconomic status ............................................................................... 19
4.5.5 Differences in prerequisites by neighborhood-level socioeconomic status ...... 20
4.6 Quality criteria .......................................................................................................... 20
4.6.1 Validity .............................................................................................................. 20
4.6.2 Reliability .......................................................................................................... 21
4.6.3 Generalizability ................................................................................................. 21
4.6.4 Replicability ...................................................................................................... 21
4.7 Ethical aspects ......................................................................................................... 21
5 RESULTS ........................................................................................................................ 23
5.1 Food habits ............................................................................................................... 23
5.2 Environmental awareness ....................................................................................... 24
5.3 Correlation between environmental awareness and food habits ........................ 25
5.4 Differences in food habits and environmental awareness among neighborhood-level socioeconomic status .................................................................................... 25
5.5 Differences between prerequisites for healthy food habits and neighborhood-level socioeconomic status .................................................................................... 27
6 DISCUSSION ................................................................................................................... 28
6.1 Result discussion ..................................................................................................... 28
6.1.1 Food habits ....................................................................................................... 28
6.1.2 Environmental awareness ................................................................................ 30
6.1.3 Correlation between environmental awareness and food habits ...................... 31
6.1.4 Differences in food habits and environmental awareness among neighborhood-level socioeconomic status ............................................................................... 32
6.1.5 Differences in prerequisite for healthy food habits by neighborhood-level socioeconomic status ....................................................................................... 33
6.2 Method discussion ................................................................................................... 34

6.2.1 Study design ..................................................................................................... 34
6.2.2 Selection and loss ............................................................................................ 35
6.2.3 Variables ........................................................................................................... 36
6.2.4 Analyze methods .............................................................................................. 37
6.2.5 Quality criteria ................................................................................................... 38
6.2.6 Ethical considerations ....................................................................................... 39
7 CONCLUSION ................................................................................................................. 40
7.1 Practical application ................................................................................................ 40
7.2 Future studies ........................................................................................................... 41
8 ACKNOWLEDGEMENT .................................................................................................. 41
REFERENCES ....................................................................................................................... 42
APPENDIX 1; QUESTIONNAIRE
APPENDIX 2; INFORMATION LETTER

1
1 INTRODUCTION
In general, the health of the Swedish population has developed in a positive direction the last decades, they live longer and are healthier. However, there are still systematic differences between socioeconomic groups regarding lifestyle habits. The differences between socioeconomic groups have become larger and in some cases, they are unchanged. Viewed from an international perspective, Sweden is equal, but there are clear social differences in health. The health differences are mainly affected by different conditions in living habits. Some conditions concern the social system and other conditions are described as factors in the environment people live in. Vulnerable groups are more socially excluded due to low education-level and low income, which causes less opportunity to influence conditions that is negative for the health.
Working with public health issues concerns improving the health of population, but also to promote equal health, i.e. to attenuate differences within the population. Sweden has a public health goal and one of the target areas concerns creating social and economic safety. Another target is to create safe and good growth conditions. Children and youths are a priority group in the public health goal since they are not able to affect their environment and are sensitive to external factors, such as friends’ food habits, peer pressure and growth conditions.
Individuals with low socioeconomic status have unhealthier habits and consume more fast food than individuals with high socioeconomic status. Children’s habits reflect their parents’ habits, and these tend to persist into adulthood. Poor food habits are not always a choice, but can be an effect of social exclusions and are created by factors at multiple levels. Parents’ awareness about environmental issues affects the children as well and is associated with the level of socioeconomic status. For instance, previous research suggests that families with low education may not have enough knowledge about the impact food have on the environmental changes and perceive that they do not have enough money to have make changes in their habits.
The personal motive for choice of subject is an interest in food habits and environmental issues. The authors’ bachelor thesis concerned climate impact and nutritional content from different food habits. This degree project is concerning the same subjects but with another dimension.
2
2 BACKGROUND
2.1 Health Health was defined by the World Health Organization (WHO) in 1948 as a state of complete mental, social and physical well-being. Every human has a fundamental right to enjoy the highest attainable standard of health no matter of religion, political belief, ethnicity, economic and social conditions (WHO, 1948). A good level of health among all people will lead to an economically and social productive life for the individual as well as for the society. Working with public health aims at improving health and the quality of life by promoting health and prevent diseases. Health promotion implies working with all determinants of health, not only the factors related to individual lifestyle, but also factors such as social status, employment, income, education and access to health services. These different factors in combination have an impact on health and create different living conditions (WHO, 1998).
2.2 Agenda 2030 The United Nations (UN) have developed 17 goals and 169 targets for a sustainable development, called Agenda 2030. The goals comprise of three dimensions of sustainable development: social, economic and ecological aspects (UN, 2015). Sweden has a delegation called the delegation of Agenda 2030 who are working with developing an action plan in order to enable the implementation of Agenda 2030 (Agenda 2030-delegationen, 2018).
This study will concern three of the goals in Agenda 2030: goal number three, ten and 13. The third goal is about ensuring health and promote wellbeing for all people at all ages. The tenth goal is about reducing inequalities between and within counties. Goal number 13 is about combating climate changes and its impact, which may be achieved by improving education and increasing public awareness about climate changes (UN, 2015).
The third goal is relevant for this study since the study concern prerequisites for healthy food habits, which is an important factor for promoting wellbeing among all people, and in this case among adolescents. Moreover, this study is related to the tenth goal since all groups of people should have the same prerequisites for healthy food habits no matter of education level, income and employment. This study will study differences in food habits between different socioeconomic status groups which is important to identify in order to reduce inequalities and to improve health among all people. Goal number 13 highlights the importance of reducing the climate changes which is a goal associated to this study since the environmental awareness is being studied among adolescents. Adolescents are the future, thus, it is an important group to focus on in terms of the environmental work.

3
2.3 Public health goal In addition to the health-related goals of Agenda 2030, the government in Sweden has developed a public health goal with eleven targets about health areas that are considered as important. The overall aim is to create equal social conditions for a good health for the whole population. This study will concern four of the targets. The first target is that all people should have the same opportunity to participate and influence the society. Individuals who perceive their ability to affect their living conditions low are in greater extent more socially excluded, which are associated with a negative health. People need to feel that they can make choices about, for instance, health care. The second target is that all people should have the same economic and social conditions. Employment enable people to support the family and reduces exclusion. The third target is about providing safe growth conditions for children and youths. Parents have the main responsibility of their children and their habits influences their children health, but the relationship to friends, the environment in the residential area, the school, leisure and how the society is build, has an impact as well. The last target is about food habits. Many of the most common diseases, such as type 2 diabetes, cancer and heart diseases, can be prevented by good food habits (Prop. 2007/08:110).
This study will concern prerequisites for healthy food habits among different socioeconomic status groups which are an essential part of the public health goal since the aim is to create equal condition among the Swedish population (Prop. 2007/08:110). Inequalities is often indicating that people have different access to recourses (Statens Offentliga Utredning [SOU], 2017). In order to reduce inequalities, equal prerequisites for healthy food habits are important among different socioeconomic status groups. Since this study aims to investigate food habits among adolescents, as are the public health goal, this study is important because healthy food habits contribute to a good health development for the population (Prop. 2007/08:110). There is no target that concerns climate changes, which can be questioned since working with climate changes is one of the goals in Agenda 2030. Further, since Sweden are included in the United Nations (UN) and all countries that are included have an agreement since 2015 to reduce the climate emission until 2050 and keep the global warming below two degrees (Regeringskansliet, 2016). One effect of the climate changes is that the earth is heating up and are consequently affecting animals, the nature and the humans, mainly people living in low income countries (World Wildlife Fund, 2017).
2.4 Socioeconomic status There are different definitions of socioeconomic status which implies that there is not a united definition (Byrsjö & Brage, 2003; Carlsson, Holzmann, Ärnlöv, Wändell, Gasevic, Sundqvist & Sundqvist, 2017; Sariaslan, Larsson, D´Onofrio, Långström, Fazel & Lichtenstein, 2015). In public health, socioeconomic status is usually defined as the level of education, profession and income (Mattisson, 2016; Rostila & Toivanen, 2012). In some contexts, the wealth of the family is also used as a measure, such as number of people per square meter household, number of computers and cars in the family (Mattisson, 2016). This study defines socioeconomic status based on education level, disposable income, single

4
parent household and unemployment. The definition is a combination of two socioeconomic status index from two different studies (Sariaslan et al., 2015; Sariaslan, Långström, D`Onofrio, Hallqvist, Franck & Lichtenstein, 2013).
Education has been used as an indicator for socioeconomic status for a long time, and measure the level of knowledge of a person (Galobardes, Shaw, Lawlor, Lynch & Smith, 2006). According to The National Board of Health and Welfare and The Public Health Institute (2013) education-level is divided into three groups: upper secondary, secondary and post-secondary education (Socialstyrelsen & Statens folkhälsoinstitut, 2013). Parents’ education-level usually affect their children, such as the child´s own choice of education. Knowledge trough education may affect the ability to receive information about health and the ability to get access to appropriate healthcare services (Galobardes et al., 2006). Education may affect the income-level, since many well payed jobs with high status require education (Socialstyrelsen & Statens folkhälsoinstitut, 2013). Employment reflects a social status and gives certain privileges due to higher status. Income influences health since a high level of income increases the opportunity to buy material recourses such as healthy food and the opportunity to participate in recreational activities. High income may promote self-esteem, which in turn contributes to other benefits like feeling secure in participating in the society (Galobardes et al., 2006).
Disposable income is the total of the all income recourses minus taxes, which reflects how much of the income that can be used for saving and consumption. According to Statistics Sweden the median disposable income is the highest among couples without children in the household, while the median income is the lowest among single women with children (Statistiska centralbyrån, 2016). Single parent household is used as an indicator for socioeconomic status since they are one of the economically vulnerable groups. Single parent household is defined as a family with a parent without a partner, caring for one or more children younger than 19 years. Single parent households have lower living standard, income (Families Commission, 2010) and are more likely to be unemployed (Collings, Jenkin, Carter & Signal, 2014). Depending on the level of income, education, employment and family relationship, this may affect the choice of neighborhood.
2.4.1 Neighborhood socioeconomic status
Socially vulnerable areas are described by The Swedish National Council for Crime Prevention as areas with high criminality and low safety as compared to other urban areas (Brottsförebygganderådet, 2017). According to Rosvall (2014), there are differences in living habits, lifestyle and health among neighborhoods. The differences depend on differences in education level, employment, mean income, number of immigrants and refugees (Rosvall, 2014). In general, individuals living in neighborhoods with high education level, have better living habits and food habits compared to individuals living in neighborhoods with low education level (Burström, Burström & Corman, 2014; Ecob & Macintyre, 2000). A study with socioeconomic status on neighborhood level, conducted in Australia, found that there are differences in consumption of fruit and vegetables between affluence and disadvantaged neighborhoods. The differences increased when controlling for household income (Turrell,

5
Blakely, Patterson & Oldenburg, 2004). Another cross-sectional study in Australia found an association between disadvantaged neighborhoods and vegetable intake. However, the fruit and vegetable consumption was not explained by the availability and price in stores (Thornton, Crawford & Ball, 2011). In a study by Dubowitz et al. (2008) the results indicate on differences in fruit and vegetable consumption among Afro-Americans and Caucasian people. However, the differences increased when controlling for neighborhood socioeconomic status, which imply that the differences in diet intake can be explained by the neighborhood (Dubowitz et al., 2008). None of these studies is conducted in Sweden which means that the results may not be comparable with the population in Sweden.
2.5 Food habits The Nordic Nutrition Recommendations (NNR) are dietary guidelines based on scientific evidence for the population in the Nordic countries (NNR, 2012). The food habits during adolescence have long-term effects, since habits created during adolescence tend to persist throughout life (Vereecken, Inchley, Subramanian, Hublet & Maes, 2005). Healthy food habits are described as a diet rich in berries, vegetables, fruits, whole grains, nuts, vegetables oils, fish, seafood and lean dairy products (NNR, 2012). WHO have listed a low consumption of fruit and vegetables as the tenth biggest risk factor for diseases. The groups that consume the least of fruit and vegetables are individuals between 16 and 29 years old (Folkhälsomyndigheten, 2016). Despite the vast evidence about healthy food habits, the Western diet consists mainly of processed meat, red meat and food with large amounts of sugar and fat (NNR, 2012). Food from fast food restaurants usually contains more sugar and fat, which is why fast food should be avoided. People eating frequently at fast food restaurants have a higher energy intake per day (Socialstyrelsen, 2009). Healthy food habits are also about having regular meal habits and not skip breakfast, lunch and dinner, since the risk of unhealthy habits is higher if missing a meal (Rodrigues, Luiz, Monteiro, Ferreira, Goncalves-Silva & Pereira, 2017). Food habits in this study will be measured by evaluating breakfast and lunch habits, and by unhealthy food items (soda, chips, candy and fast food) and healthy food items (fruit and vegetables) and study if there are differences between different socioeconomic groups.
2.5.1 Food habits and socioeconomic status
Adolescents with high socioeconomic status consume breakfast more frequently as compared to adolescents with low socioeconomic status (Rodrigues et al., 2017). The European cohort study HELENA by Müller et al. (2013) shows that only 26 percent of the adolescents participate in school lunch whereas the rest eats lunch elsewhere or exclude lunch. Eating elsewhere from school is therefore risk factor for consuming energy dense food (Müller et al., 2013). Individuals who exclude lunch tend to eat more snacks, drink fuzzy drinks and have higher calorie intake during a day as compared to individuals who eat lunch (Golley, Pearce & Nelson, 2009).

6
Food habits differs among socioeconomic groups. For instance, there are differences in food habits depending on education level. Individuals with three years of secondary school education, eats four times more vegetables then individuals with less than secondary school education. There are also differences in fruit consumption, but the differences are small (Folkhälsomyndigheten, 2016). High education level is also related to high consumption of meat, beer, wine and liquor. Parents’ level of education is associated with their children’s food habits. Children with parents who has a short education tend to drink more juice and fizzy drinks (Mattisson, 2016). The study by Mattisson (2016) is a cross-sectional study with a low response rate, which may not be representative for the whole population. The HUNT-study by Nilsen, Krokstad, Holmen and Westin (2009) shows that education is the strongest predictor for good food habits, and that especially the mother’s education level has a strong impact on the family’s behaviors (Nilsen et al., 2009). The HUNT-study is a large study conducted in Norway, with 8817 adolescents between 13 and 19 years. The aim of the study was to investigate associations between the adolescents’ dietary habits and parental socioeconomic status. The study uses three different variables to measure socioeconomic status and have used them separately, which could be a strength since each factor shows a different aspect of socioeconomic status.
Inequalities indicate, that people have different access to resources (SOU, 2017) and having access to products that increases the opportunity to establish healthy food habits that could reduce differences in food habits between socioeconomic status groups.
2.6 Prerequisites for healthy food habits Food habits are influenced by a wide variety of factors. In order to make changes in dietary behaviors in a population, actions at multiple levels in the society are required. One of the levels are individual lifestyle factors which are personal behaviors affecting the health. All individuals are different and have different motivation and attitudes towards food. Individuals with high motivation can more easily avoid purchasing snacks in stores and drive through a fast food restaurant, as compared with an individual with low motivation (Glanz & Mullis, 1988). The social and economic environment also affects lifestyle habits. Social influences during adolescence have a large impact on the nutritional intake, such as social learning from parents or other role models and peer pressure from other adolescents. The fiscal policies influence the price on food, which influence the consumer’s food choices in the grocery stores. Low taxes on healthy products and high taxes on unhealthy products have potential to promote health in a population (Dahlgren & Whitehead, 2007).
The social and community network is also vital for health and well-being. The social network influence the social behavior, social support and access to resources (Dalgren & Whitehead, 2007). The eating behaviors of an individual, i.e. portion size and choice of food products, are influenced by the social context. If friends have healthy food habits, it may influence the food choices for an individual (Chan, Prendergast, Grønhøj & Bech-Larsen, 2009). If the public sector serve unhealthy food, it affects the health for the consumer (Weil, 2005). Sweden is one of few countries in the world serving free lunch in schools. This implies that the schools

7
in Sweden has a great opportunity to affect the students’ food habits (Livsmedelsverket, 2017). According the school law, the food that is served in schools must be nutritional adequate, i.e., be in line with nutritional guidelines (SFS 2010:800). If the local community only provide unhealthy fast food and the nearby store has a small supply of fruit and vegetables but a big supply of snacks, it will affect the prerequisites for good food habits for the population (McLeroy, Bibeau, Steckler & Glanz, 1988).
Socioeconomic, cultural and environmental conditions are factors in the community that affects the individual indirectly. Politics, for example has, significant power of the public health, since politicians can affect public behaviors with policies and taxes (McLeroy et al., 1988). An example of this is the public health goal that aims to create prerequisites for a good health for the whole population (Prop. 2007/08:110), which indicate that all people should have the same prerequisites to establish healthy food habits no matter of socioeconomic status.
2.6.1 Prerequisites for healthy food habits on neighborhood-level
An individual’s food choices are affected by ecological determinants, such as accessibility and availability of food stores. Previous research shows a correlation between food retail accessibility in the neighborhood and negative health (Morland, Dietz Riux & Steve, 2006; Larson, Story & Nelson, 2009). This includes neighborhoods without a supermarket and neighborhoods with several fast food restaurants. Low access to good supermarkets is mainly affecting disadvantaged groups, since they are less likely to travel longer distances to purchase healthy food compared to affluent groups. Groups with low socioeconomic status is more likely to eat more energy-dense food with low nutrition if it is accessible and inexpensive (Drewnowski & Specter, 2004). In a study by Smoyer-Tomic et al. (2008), conducted in Canada, showed that supermarkets are not absent in neighborhoods with low socioeconomic status, however the stores in low socioeconomic status neighborhoods are rather larger which require a greater range of food.
2.7 Environmental awareness
Environmental awareness is defined by Takala (1991) as “…a general concept. It includes: perception and understanding of threats, changes, and the options available” (p. 591). Adolescents are an important group to educate in environmental changes and the seriousness of environmental changes, without giving them feelings of helplessness (Ojala, 2006). The environmental awareness usually starts to grow when children are between nine and ten years old. Still there is a big knowledge gap among high school students about factors, such as chemicals and meat consumption, that is harmful for the environment. Results from a study conducted by Sevencan, Yavuz and Vaizoğlu (2017) showed that adolescents in high school are mostly worried about environmental pollution, however they do not have enough information about contamination from foods that contains pesticides.

8
According to Chawla and Cushing (2007) some researcher who are examining within environmental awareness agree that there are three factors that influence the intention to take action. These are; socioeconomic status, knowledge/attitudes and gender. A hypothesis some researchers have is that if people have enough knowledge about the environment, they will be responsible in their actions. The hypothesis has been criticized by other researchers who argues that the actions are much more complex than just environmental knowledge alone. People need to believe in their competence and the ability to achieve goals together with other people in the society. Chawla and Cushing (2007) conclude that people whom act due to their knowledge will depend on the resources the action will cost. Thus, adolescents in disadvantaged communities might prioritize to save money (Chawla & Cushing, 2007).
2.7.1 Environmental awareness and socioeconomic status
The results in the study by Dutt and Kumari (2015) and another study by Özden (2008) shows that parents with high socioeconomic status have resources such as time and knowledge to inform their children about environmental concerns, while parents with low socioeconomic status in general, may not have enough money or time to ensure environmental sustainability in the household. Parents with high socioeconomic status have more knowledge about environmental issues due to a higher education-level (Dutt & Kumari, 2015; Özden, 2008). Furthermore, parents with higher level of education tend to influent their children to have greater environmental concern, specially the mother’s education level is associated with boys’ concern (Hampel, Boldero & Holdsworth, 1996).
2.7.2 Environmental awareness and food habits
All food items have an impact on the climate, but some have more impact than other (Stehfes, Bouwman, Vuuren, Elzen, Eickhout & Kabat, 2009). The food consumption of the Swedish population contributes to 25 percent of the total greenhouse gas emissions (Wirsenius, Hedenus & Mohlin, 2011). Animal products, such as meat and dairy, contributes to 75 percent of the emissions from the food sector (Cederberg, Hedenus, Wirsenius & Sonesson, 2013). Plant-based food are more climate friendly compared to meat and dairy products (Fogelberg, 2008). Not all people are aware about the fact that food production and consumption has an impact on the environment. Some people believe that changing their diet would not have an impact on the environment. Others are aware of the association between food and climate changes but chose to make other changes such as recycling and drive less. A study by Macdiarmid, Douglas and Campbell (2015) found that significant barriers for changing their food habits was knowing about what to replace meat with, however some was not enough convinced that reducing their meat consumption would be beneficial. The study by Macdiarmid et al. (2015) is a qualitative study, which implies that the results may not be representative for the whole population, but explains how people are thinking about the relationship between food habits and environmental awareness. Another study by Campbell, Macdiarmid and Douglas (2016) found that even after receiving information about the association between meat and environmental impact, the adolescents was still unwilling to change their meat consumption.

9
2.8 The ecological model as theoretical framework In this study, the ecological model will be used to explain food behaviors of the adolescents and the external factors influencing behaviors. The framework is linked to the different subjects in the background but will be explained in this part. Two different sources of the ecological model are used in this study. The first one is the original model developed by Bronfenbrenner (1979). The second one is defines by Story, Neumark-Sztainer and French (2002), but is created from the original ecological model. Bronfenbrenner divide the model into four levels: microsystems, mesosystems, exosystems and macrosystems. The microsystem refers to the individual and places the individual act and participate in, such as school, work, friends and family. This level is the closest to the individual and have the largest impact on health behaviors. However, the microsystem is influenced by an interaction from the outer levels. The relationships in the microsystem, for example between the parents and the teachers forms the mesosystem. The exosystem is the larger social system and impacts the individual positive or negative even though the individual does not directly act in this system. Important factors in the exosystem is media and parents’ workplace schedules. The system most distal to the individual is the macrosystem and include factors such as cultures in the society, the economic and political system in the country. The principle in the ecological model is that environment and behaviors are reciprocal, which means that the environment shapes and forces to some behaviors, but people can change and create their environment (Bronfenbrenner, 1979).
The ecological model by Story et al. (2002) was developed specifically to understand eating behaviors of adolescents. The four levels are named: individual influences (intrapersonal), social environmental influences (interpersonal), physical environmental influences (community settings) and macrosystem influences (societal). The individual factors influencing eating behaviors includes psychosocial-, biological-, behavioral- and lifestyle factors such as knowledge, attitudes, beliefs, hunger, cost, meal patterns and time. The social environment and the interpersonal relationships, which includes family, friends and peer networks, has a strong impact on the adolescents’ eating behaviors and food choices. The physical environmental refers to schools, restaurants, convenience stores and fast food outlets, which affect the prerequisites for healthy food habits. The macrossystem has an indirect impact by determining the food behaviors. Factors counted in the macrosystem are social and cultural norms, media, advertising, laws and policies that decides pricing of food products (Story et al., 2002).
The ecological model will be used to understand and explain the adolescents’ food habits. The ecological model is a model explaining the complexity of behaviors and so is prerequisites for healthy food habits. Prerequisites for healthy food habits is affected of factors in different levels and thereby the ecological model will be used to explain how prerequisites can differ. The model will also be used to explain why some adolescents are more environmentally aware and potential factors in the community creating differences.

10
2.9 Formulation of issue This study will investigate the adolescents self-reported food habits, environmental awareness and prerequisites for healthy food habits and if they differ by neighborhood-level socioeconomic status. Previous studies have investigated the prerequisites for good food habits in the community, however, the adolescents self-reported opportunities to establish healthy food habits are not well understood. Mostly there are models and theories explaining what affects the food habits an individual have.
Most of the research in environmental awareness is on adults and not much exist for adolescents, which makes environmental awareness important to conduct more research on. Some research exists regarding food habits linked to socioeconomic status (Rodrigues et al., 2017; Mattisson, 2016; Milsen et al., 2009). However, food habits among adolescents associated to their neighborhood require more research. Most studies in neighborhood food environment is conducted in USA and Britain (Turrell et al., 2004), which makes it important to conduct more research in Sweden. According to Rostila (2012) there is only a few studies describing differences between food habits and socioeconomic status among young people in Sweden. Large population based studies on food habits among adolescents has not been carried out the last years in Sweden. Prerequisites for good food habits, food habits, environmental awareness and socioeconomic status are often studied separately and on adults, which makes this study in Sweden with adolescents as the study population important.

11
3 AIM
The aim of the study is to describe what food habits and environmental awareness the adolescents in Västerås have and investigate the association between environmental awareness and food habits and to examine whether neighborhood socioeconomic status is associated with food habits, environmental awareness and prerequisites for healthy food habits.
3.1 Research questions 1. How are the food habits (breakfast and lunch habits and consumption of healthy and
unhealthy food items) of adolescents in Västerås?
2. What is the level of environmental awareness among adolescents in Västerås?
3. Is there a correlation between environmental awareness and food habits among adolescents in Västerås?
4. Are there differences regarding food habits and environmental awareness between adolescents living in neighborhoods with varying socioeconomic status in Västerås?
5. Is there a difference in perceived access to the prerequisites for healthy food habits between adolescents living in neighborhood in Västerås with different socioeconomic status?
4 METHOD
Quantitative analysis were used because frequencies, differences and correlations are studied. In addition, the data is numeric, which require quantitative analysis. The study has a deductive approach since it is characterized by hypothesis. The research questions in this study can be compared with a hypothesis that is being tested which is characterized by a deductive approach. The hypothesis can either be confirmed or rejected (Patel & Davidsson, 2011).

12
4.1 Study design Quantitative studies can be either observational or experimental. Observational studies imply that the researcher measure a phenomenon without manipulating the participants. In an experimental design, the researcher alters an exposure or a behavior (Bonita, Beaglehole & Kjellström, 2010). This study is based on observational data since no variable was changed. Common observational studies are cohort, case-control and cross-sectional studies. For this study, the cross-sectional design was used since the data was collected at one time point, and from a large number of responders to estimate differences and more than one case is being searched, which is common in a cross-sectional study according to Bonita et al. (2010). Data that were used in this study were obtained from the pilot cross-sectional study Neighborhood, sustainable lifestyle and health among adolescents, shorted as NESLA. The reason secondary data was used is because of the large sample size, which would not be feasible to collect in a limited time span. Furthermore, secondary data were used since the NESLA study included measurements that can answer the aim of this study.
4.2 Neighborhood, sustainable lifestyle and health among adolescents Neighborhood, sustainable lifestyle and health among adolescents (NESLA) is a pilot study anchored in Agenda 2030 and aims to investigate if the conditions for a sustainable lifestyle and good health differs between socioeconomic status groups in a middle-sized town in the south of Sweden. The initiative and the funding comes from Samhällskontraktet which is a collaboration between Mälardalen University, Region Västmanland, Västerås city, Eskilstuna city and Council Sörmland (Dnr 2017/244a). Data was collected during the autumn of 2017 from six high schools in Västerås city and during an event, called “Science @ mdh”, were all students from Västerås and Eskilstuna was invited. All principals at upper secondary schools in Västerås (n=21) were invited by e-mail to participate in the NESLA study. Six schools accepted the invitation. Two research assistants were responsible for the data collection in Västerås. They distributed the questionnaire to all classes in second and third year on the six upper secondary school and gave the participants verbal information about the study. In conjunction with the event Science @ mdh all teachers that signed up their classes were invited to participate. Those teachers that accepted the invitation got a web questionnaire to distribute to the adolescents (T, Sjunnestrand, personal communication, 2 March 2018). The questionnaire included questions about neighborhood, food habits, leisure time, environmental awareness, school, societal participation, safety and the families’ socioeconomic status (Appendix 1).

13
4.3 Selection The population consist of adolescents in Västerås. The target for this study is youths from year two and three in high school, aged from 16 to 19. The sampling method used in NESLA study was voluntary sampling since the schools volunteered to participate. A voluntary sampling is one of the main types of non-probability sampling methods. A voluntary sample implies that the individuals volunteer to participate in the study (Olsson & Sörensen, 2011). The participants from Eskilstuna will not be included in this study, since some of the analysis will be based on an index of socioeconomic status on neighborhood-level, which is based on aggregated data from Västerås stad. A total of 554 students participated in the NESLA study, 132 of them are from Eskilstuna or from other cities and 422 from Västerås. A total of 157 adolescents answered the web questionnaire during the event and the rest of the participants filled in the paper format in the high schools in Västerås (n=397). The total selection for the present study is 422 adolescents from Västerås, where 59 percent (n=229) of the participants were girls, 39 percent (n=154) were boys and 2 percent (n=9) did not identify them as girls or boys.
4.3.1 Loss
The external loss for this study is unknown. The intern loss from the different questions is described in the table below (Table 1).
Table 1. Intern loss for each survey question.
Survey question Variable Internal loss Total answers
1. Where in Västerås do you live?
Neighborhoods 89 33
2. Is there food stores with a wide range of fresh food in the neighborhood?
Prerequisites 21 401
3. How often do you eat breakfast a regular week?
Food habits 5 417
4. How often do you eat lunch at school?
Food habits 5 417
5, How often do you eat fruit, vegetables, soda, candy, chips and fast food?
Food habits, matrix
question
5-8 414-417
13. Are you worried about climate changes?
Environmental awareness
21 401
14. Do you believe in that your lifestyle choices affects the environment?
Environmental awareness
20 402

14
4.4 Description of variables Based on the aim of this study, specific survey questions from the NESLA study were chosen (Table 2). The original numbers of the survey questions are kept to clarify its location in the questionnaire (Appendix 1). The questionnaire comprises of 34 questions, and seven of them will be used in this study. Question number three and four is from Liv och Hälsa Ung 2012 which is a survey conducted by the Council Västmanland for several years. Liv och Hälsa Ung is a study conducted on children and youths in Västmanland with the aim to raise awareness about the needs of youths (Landstinget Västmanland, 2012).
Table 2. Research questions and related survey question.
Research question Survey question
1. Food habits 3-5
2. Environmental awareness 13-14
3. Correlation environmental awareness and food habits
5 (food-index), 13-14
4. Differences in food habits and environmental awareness among neighborhood-level SES
Index (SES), 5 (food-index), 13-14
5. Differences in prerequisites for healthy food habits among neighborhood-level SES
2, index (SES)
4.4.1 Food habits
Food habits are assessed by three survey questions: “How often do you eat breakfast a regular week?” with the response options (1) every day, (2) 4-6 days, (3) 1-3 days, (4) more rarely/never. “How often do you eat lunch in school a regular week?” and the response options were (1) 5 days, (2) 3-4 days, (3) 1-2 days, (4) more rarely/never. The last question is a matrix question: “How often do you use to...” and the response options were more than once a day, as good as daily, a few times a week, once a week and more rarely or never. The questions were about (1) fruit and vegetable consumption, (2) soda and (3) candy, chips and other snacks, and eating at (4) fast food restaurants, such as hamburger restaurant, pizzeria and hot dog stand. All three questions were categorical which implies that the variable follows an ordinal scale. An ordinal scale refers to that the answer alternatives is categorical with a ranking, which makes it possible to determine of an individual eats lunch more often than another individual. However, it is not possible to tell the size of the differences between the individuals (Ejlertsson, 2012).

15
An index was created for the matrix question since all the questions were measuring food habits. According to Olsson and Sörensen (2011) an index is created when there are several questions measuring the same variable. By creating an index the data is being reduced. The matrix question contained four questions and each question had five answer alternatives (Table 3). The created index implied that the participants could get a score between four and 20. Four indicates unhealthy food habits whereas higher scores indicate healthier food habits. The first matrix question about fruit and vegetable consumption was the only positive habit. The other questions about the habits were negative if having them often, such as soda and chips consumption. The response option for the question about fruit and vegetable had to be turned to reduce the risk of misinterpretation (Table 3). The other questions were kept as they were. The new food-index variable became a continuous variable, which implies that the variable accepts all values in a certain range and obtain a measurement process (Ejlertsson, 2012).
Table 3. Shows how the matrix question about fruit and vegetables was turned from (1) as positive to (1) as negative. Number in the parentheses shows how the response options were coded.
Response options
Original question
(1) More than once a day
(2) As good as daily
(3) A few times a week
(4) Once a week
(5) More rarely or never
Turned question
(1) More rarely or never
(2) Once a week
(3) A few times a week
(4) As good as daily
(5) More than once a day
4.4.2 Environmental awareness
Environmental awareness is measured by the survey questions “Are you worried about environmental impact and climate change?” and “Do you think you can influence environmental and climate issues through your lifestyle?”. The response options for the first question was very worried, quite worried, not worried at all, do not know and for the other question was yes a lot, yes partially, no not at all, do not know. The response alternative do not know was dichotomizes as not worried since it was concerned that if an individual is worried about environmental issues and think that they can affect the environment by lifestyle choices, the person would probable answer that they are worried and believe in the effect of the lifestyle instead of answering do not know. The two questions were dichotomized from categorical variables on an ordinal scale to only two answer alternatives (Table 4).

16
Table 4. How survey questions 13 and 14 were dichotomized.
Survey question Answer alternatives Dichotomized variable
13. Are you worried about environmental impact and climate changes?
1. Very worried
2. Quite worried
3. Not worried at all
4. Do not know
} 1. Worried
} 2. Not worried
14. Do you think you can influence environmental and climate issues through your lifestyle?
1. Yes, a lot
2. Yes, partially
3. No not at all
4. Do not know
} 1. Yes
} 2. No
4.4.3 Neighborhood-level socioeconomic status
Information about the neighborhoods is measured by the survey question “Where in Västerås do you live? If you live in more than one neighborhood, chose the neighborhood where you are the most. If your area is not one of the alternatives, chose the neighborhood closest to yours”. The neighborhood areas are in the survey categorized according to key code level 2 (NYKO 2), which is 22 categorizations (Appendix 1). NYKO is a term used by the government to define small areas within neighborhoods. Depending on level of the NYKO, the areas are bigger or divided into smaller areas. The division enables reporting statistics within a municipality (Statistiska centralbyrån, 2010).
Information about socioeconomic status on a neighborhood-level was given from Västerås stad and is from year 2016. Four variables were used to measure socioeconomic status: education, disposable income, single parent household and unemployment (Sariaslan et al., 2015; Sariaslan et al., 2013) (Table 5). The variables from different neighborhood is on NYKO 3 level which indicates that the division into the neighborhoods in the questionnaire and the variables on socioeconomic status were on different levels. The NYKO 3 level neighborhoods are divided into smaller areas compared to the NYKO 2 level. In NYKO 3, the areas are for example divided into north, west, south and east Bäckby, while in the NYKO 2 level the area is only named Bäckby. To match the different levels, the areas from the NYKO 3 level were put together according the areas in the questionnaire, which were at NYKO 2 level.
Each neighborhood, for each socioeconomic status variable was controlled for the amount of individuals living in the neighborhood, or else the data would show that those neighborhoods with high population, are the ones with the highest income. Disposable income was divided into five income-levels: 1-119 900 crowns per year, 120 000-239 900 crowns, 240 000-359 900 crowns, 360 000-479 900 crowns and 480 000 crowns and higher. For every neighborhood, the data showed how many individuals had a disposable income at that level. For example, the data showed that 101 people living in a neighborhood called Vallby in Västerås had an income between 1 and 119 900 Swedish crowns per year. For every level, the
17
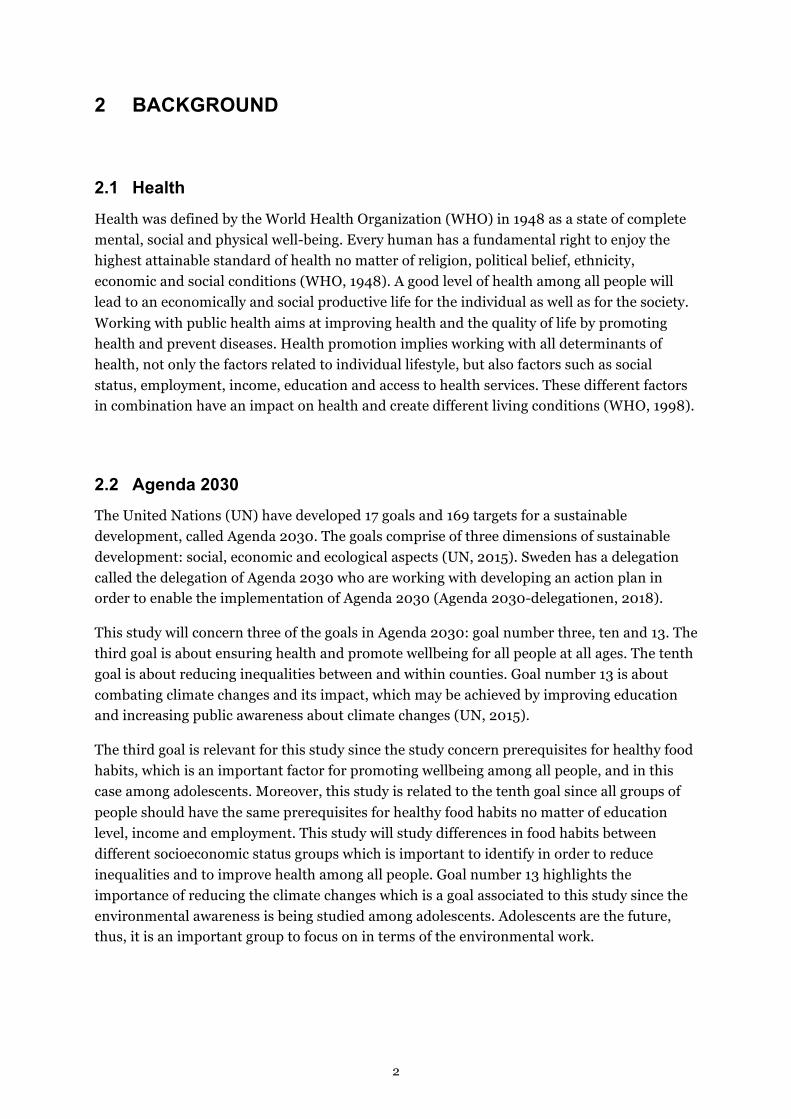
mean income per person and year was counted. For education, upper secondary school and secondary school was calculated with the proportion having a certain degree of education. Single parent household was shown in proportion for every neighborhood. Unemployment was measured by the total percent of both unemployment and/or in a program with activity support.
Tertiles were generated for each of the four variables. Tertiles describe a specific categorization where the data is split into three categorize (1, 2 and 3) with 33.3 percent in each category, this was made for the four variables. The firs variable, low income, received 1 point for being in the lowest tertile, middle-high income received 2 point and high income received 3 points for being in the highest tertile. For the other three variables: education level, single parent household and unemployment, the opposite scoring was applied; 1 point for being in the highest tertile and three point for being in the lowest tertile. Each neighborhood then had values for four variables, with a potential value of one to three for each variable. When added together, each neighborhood then had a final score ranging from four to twelve points, whereas four was the lowest and twelve the highest (Table 5).
To create a manageable number of groups from this rang of score, an index was created with three groups measuring socioeconomic status. Group one consisted neighborhoods that had
Table 5. Description of the variables included in the socioeconomic status index and the scoring criteria of the tertiles (T) on each variable. Demonstrates the total scores of the defined groups in the index of socioeconomic status.
Variable Description Scoring criteria
Positive scoring
Disposable income
Negative scoring
Income recourses minus taxes, which reflects how much of the income can be used for saving and consumption.
T1 = 1 point (low) T2 = 2 points (middle) T3 = 3 points (high)
Education level Percent without secondary school education.
T1 =3 points (low) T2 = 2 points (middle) T3 = 1 point (high)
Single parent household Proportion of single parent household with one or more children between 0 and 19 years old living in the household.
T1 =3 points (low) T2 = 2 points (middle) T3 = 1 point (high)
Unemployment Unemployed and/or in program with activity support
T1 =3 points (low) T2 = 2 points (middle) T3 = 1 point (high)
Index socioeconomic status Group 1 = low affluence Group 2 = middle affluence Group 3 = high affluence
Total score: 4-6 points 7-9 points 10-12 points

18
4-6 total points, group two consisted neighborhoods that had 7-9 total points and groups three contained neighborhoods that had 10-12 total points. More points imply a higher income, lower levels of poor education, low levels of single parent household and unemployment, that is more affluent neighborhoods (Table 5). There were seven neighborhoods in the first group, nine neighborhoods in the second group and six neighborhoods in the third group. The index became a categorical variable on ordinal scale, since there us a ranking between the three different groups.
4.4.4 Prerequisite for healthy food habits
To measure prerequisites for healthy food habits the survey question “Is there one or several supermarkets with a wide range of fresh food, such as fruit, milk and bread, where you live?” was used. The answer alternatives were yes, no and do not know, which sorts the prerequisite for healthy food habits to a categorical variable on a nominal scale since the answers is non-numeric (Ejlertsson, 2012). The response option do not know was counted as missing values since it was not relevant and thus taken away. Only 17 of the respondents had answered do not know. The variable became a dichotomized variable with only two response options, yes and no.
4.5 Analytic method The data was analyzed using the statistical program IBM Statistical Package Social Science version 22 (SPSS). For all analysis, a significance level of 0,05 was used. A p-value of 0,05 means that any differences between the groups has not occurred by chance with a probability at 95 percent (Ejlertsson, 2012). Two variables types will be mentioned in this study depending on their measurement properties: depended and independent variable. According to Bryman (2016) the dependent variable is affected by another variable, while the independent variables affect the dependent variable.
4.5.1 Food habits
The first research question about the adolescents’ food habits is presented in frequencies in text and percent by descriptive analysis in a figure.
4.5.2 Environmental awareness
The second research question was answered with the dichotomized environmental awareness variable. The question is presented in frequencies in text and percent by descriptive analysis in a figure.

19
4.5.3 Correlation between environmental awareness and food habits
To evaluate if there is a correlation between environmental awareness and healthy food habits, Spearman’s rank correlation was used. Spearman´s can be used when at least one of the variables is categorical and the data is not normally distributed. The strength in the correlation is showed within a range between -1 ≤ rs ≤ 1 (Ejlertsson, 2012). When the value is 0, there is no correlation. A value of 0,3, positive or negative, it is considered as a low correlation, when the value is 0,5 is it is considered as median, 0,8 is high correlation and 1 is a perfect correlation. A positive correlation means that both variables have a high value or a low value. If the environmental awareness is high, the food habits are healthy and vice versa. A negative correlation means that one of the variables have a high value and the other variable has a low value (Szklo & Nieto, 2014). Spearman’s was used since one of the variables is categorical, which is environmental awareness and there is no dependent or independent variable. The food-index created of the matrix question was used as a measure of food habits and the two dichotomized questions about environmental awareness was used. The result is presented by rho, p-value and number (n).
4.5.4 Differences in food habits and environmental awareness among neighborhood-level socioeconomic status
The third research question was answered by two different analytic methods. One Way analysis of variance (ANOVA) was used to examine if there are differences in food habits depending on neighborhood-level socioeconomic status. The food-index was used to measure food habits and the index-SES was used to measure neighborhood-level socioeconomic status. According to Ejlertsson (2012) ANOVA is a non-parametric test that requires the outcome variable to be normally distributed. ANOVA is used to examine the effect of an independent variable on a dependent and continues variable and to examine differences in means between three or more groups. To use ANOVA the data should be normally distributed (Keller & Kelvin, 2013). The dependent variable for this question is food habits and the independent is neighborhood-level socioeconomic status. The result is presented by mean values, standard deviation (SD), f-value and p-value in a table.
The other part of research question four is to evaluate differences in environmental awareness and neighborhood-level socioeconomic status. A Person´s chi-Squared Test (x2) was used since both variables is categorical. The dependent variable is environmental awareness and neighborhood-level socioeconomic status is considered as the independent variable. According to Ejlertsson (2012) a chi-square test is used to measure differences between two or more groups. The chi-square test will either accept or reject the null hypothesis, which is shown by the significance level of the p-value. The null hypothesis assumes that there are no significant differences between the groups, and a value of p <0,05, means that the null hypothesis will be rejected since the test shows that there is a difference in environmental awareness between neighborhoods (Ejlertsson, 2012). The chi-square test between three groups gives an overall x2 value and p-value for all groups, which means that pairwise analyses is required. The results of the chi-squared test are presented with an overall x2 and p-value in a table for all groups. The x2, df (degree of freedom) and p-values from the pairwise analysis is presented in a table with three socioeconomic status groups for the

20
variable “believing in affecting the environment by lifestyle” since the overall chi-square test showed significant differences. A figure is created for environmental awareness showing the percentage of different socioeconomic status groups.
4.5.5 Differences in prerequisites by neighborhood-level socioeconomic status
To evaluate differences between perceived access to the prerequisite for healthy food habits and neighborhood-level socioeconomic status, chi-square test was used since both variables were categorical. The results of the chi-squared test are presented by percent and an overall x2 and p-value in a table and pairwise analysis is shown by x2, df and p-values in a table between three socioeconomic status groups since the overall chi-square test showed significant differences.
4.6 Quality criteria Within quantitative research there are some aspects to measure the quality of the study. According to Bryman (2016) there are four criteria’s which are: validity, reliability, generalizability and possibility to replication.
4.6.1 Validity
Validity determines if a method really measures what is intended to measure. Validity can be tested by different ways: face validity, criterion validity and construct validity. Face validity is when experts in the field are judging if the measure seems to reflect the concept. Criterion validity assesses if a test reflects a certain ability. The criterion validity is often divided into two: concurrent and predictive validity. Concurrent validity measures how well a concept is related with another instrument that is used to measure the same concept. Predictive validity is when the researcher uses a future criterion instead of a current criterion. Construct validity concerns how well an instrument measures the concept that is supposed to be measured, which can be tested through a factor analysis. The construct validity is also divides into two: convergent and discriminant validity. Convergent validity refers to how well two types of constructions that is related theoretically are in fact related, while the discriminant validity refers to that there should not be any relationship between the two measurements (Olsson & Sörensen, 2011). This study will only measure the validity by using face validity.
Some of the questions used in this study is taken from Liv och Hälsa Ung 2012, while some of the questions is formulated by researchers from the NESLA study. The questions that are formulated by the researchers from NELSA are not tested for validity, but the researcher have agreed that the questions reflects the concept. It is unknown if the questions from Liv och Hälsa Ung is validated, however the face validity is high since many researchers is involved in the survey and the questions have been used several times.

21
4.6.2 Reliability
Reliability refers to the accuracy of the methods used in the study i.e., that repeated measurements generate similar results. There are three types of reliability: stability, internal reliability and inter-observer consistency. The stability of a method refers to whether a measurement generate the same results of tested repeated times. The stability can be tested by a test-retest method and the test should give a high correlation between the two observation sessions. Internal reliability is used when having multiple-indicator measures and where each respondent´s answer to each question is aggregated to a total score, that is, an index or a scale is created. To ensure that the different questions are correlated to each other a split-half method or by Cronbach´s alpha can be conducted. Inter-observer consistency refers to that there should be an agreement between different researcher (Olsson & Sörensen, 2011). The methods used in the NESLA study are not tested which makes is difficult to ensure the stability. The index of socioeconomic status is partly from the definition by Sariaslan et al. (2015) and partly from Sariaslan et al. (2013), however the two definitions is highly correlated (r =.93; 95 % CI: 0.93-0.93). The food-index is not tested neither with a split-half method or trough Cronbach´s alpha.
4.6.3 Generalizability
Within quantitative research, researchers strive to be able to generalize their results from the study participants to the general population. High degree of generalizability can be ensured by a random selected sample from the population and a large sample size (Bryman, 2016). The degree of generalizability in the NESLA study is assumed to be low. A large number of schools in Västerås did not participate in the study which makes it less generalizable. A total of 422 students participated in this study, however, the total number of students in high schools in Västerås is unknown which makes it impossible to say if the sample size is this study is enough to generalize the results to the general population. The internal loss on the question about neighborhoods is considerable, and the variability of which neighborhoods the participating high schools are placed in is unknown, which makes the questions about socioeconomic status on neighborhood-level less generalizable to other high schools.
4.6.4 Replicability
The replicability of a study refers to whether the study is describing to the extend so that it can be replicated by another researcher (Bryman, 2016). The present study will describe the methods as detailed as possible to ensure replicability.
4.7 Ethical aspects According to the Swedish Science Council (2017) all research with sensitive personal data requires ethical approval, which is a way to protect the individual. In order to receive ethical approval from an ethical board it requires that the researchers have considered four ethical aspects stated in Codex. The four aspects are information, consent, utilization and

22
confidentiality (Vetenskapsrådet, 2017). The information requirement implies that all study participants are entitled to take part of a detailed description of the study, including potential risks to participate. The consent requirement stat that all participant must express consent to participate (SFS 2003:460). The utilization requirement state that data may only be used for the aim of the research. The confidentiality requirement implies that all data collected in the study must be protected from unauthorized persons (Vetenskapsrådet, 2017).
The NESLA study was approved by the Regional Ethical Review Board in Uppsala. The research assistants were responsible for the data collection from high schools in Västerås and were the ones giving the participants both written and verbal information about the study, which were given at the time the participants answered the questionnaire (Appendix 1 & 2). The information contained background, the aim of the study and advantages with participating. Furthermore, the participants were given the information by filling in the questionnaire, they left their consent to participate in the study. The teachers were responsible for the web questionnaire at the event Science @ mdh. Data from the web questionnaires was transferred to digital format and saved as Excel files. The files were coded, and only the research group had access to the code key. The paper questionnaires were stored in a locked cabinet at Mälardalens University. All collected data will be used for the scientific purpose only.

23
5 RESULTS
The results are presented by the five research questions in this study.
5.1 Food habits Of the adolescents in the study, 195 (47 %) reported that they eat breakfast every day a regular week, 78 (19 %) adolescents reported that they eat breakfast 4-6 days a week, 80 (19 %) of adolescents eat breakfast 1-3 days and 64 (15 %) of the adolescents consume breakfast more rarely or never (Figure 1).
Figure 1. Demonstrate the proportion (in %) of individuals who eats breakfast a regular week.
The majority, which is 270 adolescents, reported that they eat lunch at school every day (65 %), 24 adolescents (30 %) eat lunch 3-4 days a week, 17 adolescents (4 %) eat lunch 1-2 days and 6 adolescents (1 %) eat lunch more rarely or never (Figure 2).
Figure 2. Demonstrate the proportion (in %) of individuals who eats lunch at school a regular week.
24
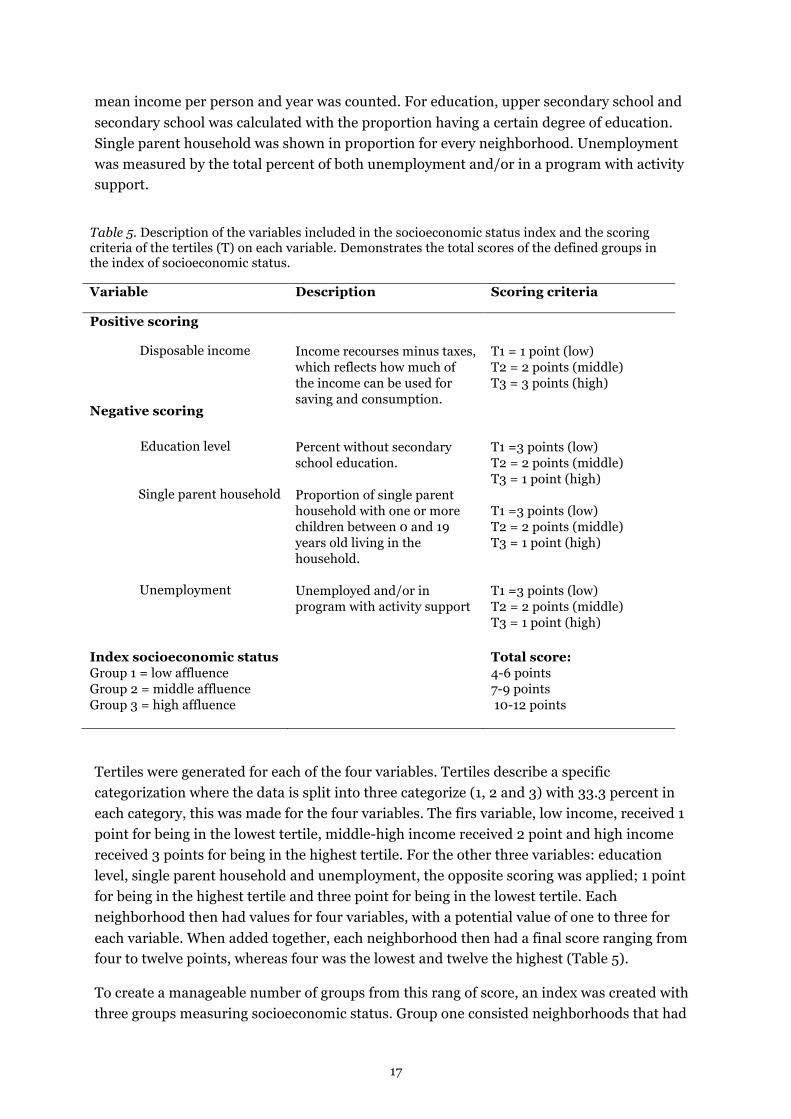
The majority of the adolescents in the study reported that they eat fruit and vegetables as good as daily and more than once a day (56 %). Most of the adolescents reported that they drink soda, eat candy, chips and other snacks several times a regular week. The majority of the adolescents reported that they eat at a fast food restaurant every week (Table 6).
Table 6. The amount of individuals and percentage (%) consuming fruit, vegetables, soda, candy, chips, other snacks and eating at a fast food restaurant a regular week.
More than once a day
As good as daily
A few times a week
Once a week More rarely/never
Fruit, vegetables
106 (25) 129 (31) 130 (31) 32 (8) 30 (5)
Soda 16 (4) 30 (7) 165 (40) 109 (26) 94 (23)
Candy, chips, other sweets
8 (2) 29 (7) 210 (51) 121 (29) 48 (11)
Fast food restaurants
7 (2) 18 (4) 98 (24) 162 (39) 130 (31)
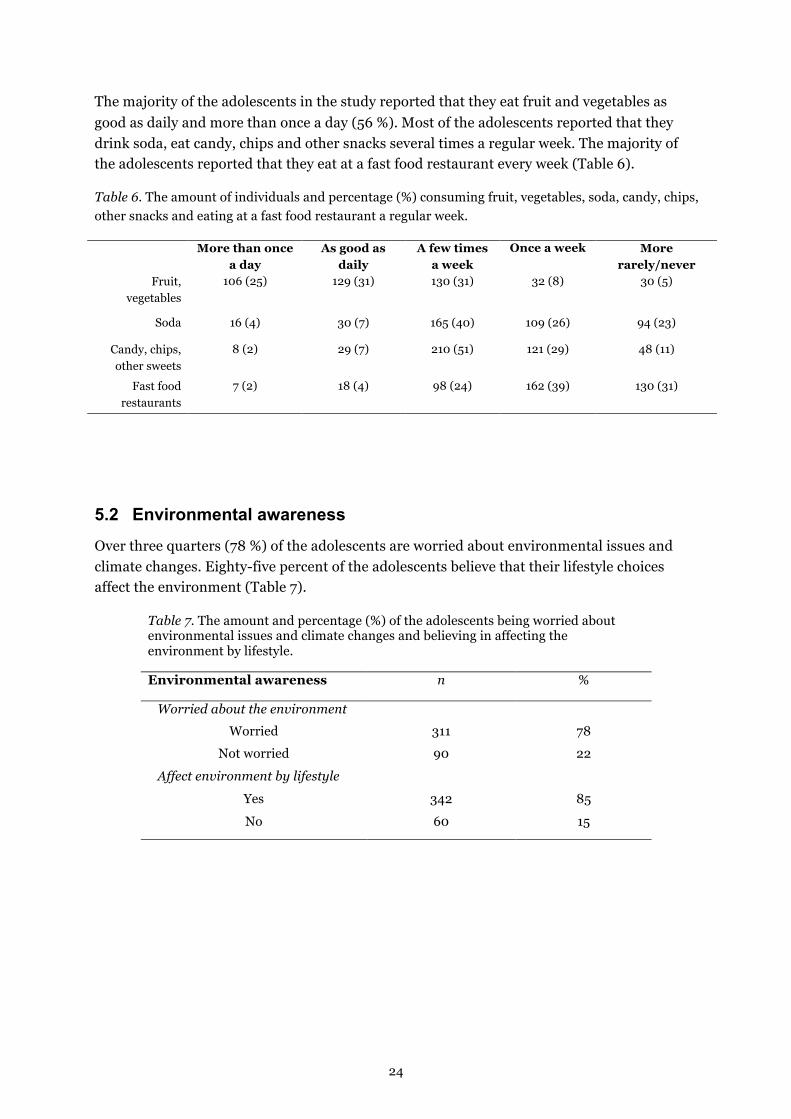
5.2 Environmental awareness Over three quarters (78 %) of the adolescents are worried about environmental issues and climate changes. Eighty-five percent of the adolescents believe that their lifestyle choices affect the environment (Table 7).
Table 7. The amount and percentage (%) of the adolescents being worried about environmental issues and climate changes and believing in affecting the environment by lifestyle.
Environmental awareness n %
Worried about the environment Worried 311 78
Not worried 90 22
Affect environment by lifestyle
Yes 342 85
No 60 15

25
5.3 Correlation between environmental awareness and food habits Being worried about environmental issues and climate changes was statistically significantly correlation with lower intake of fruit and vegetables and high intake of candy, chips, soda and fast food among adolescents (rho=-0.252, n=413, p=<0.05).
High belief in that lifestyle choices affect the environment was statistically significantly correlated with lower intake of fruits and vegetables and high intake of candy, chips, soda and fast food among adolescents (rho=-0.246, n=413, p=<0.05).
5.4 Differences in food habits and environmental awareness among neighborhood-level socioeconomic status
Adolescents living in neighborhoods with high socioeconomic status shows a slightly higher mean value on the food index compared to middle-high and low socioeconomic status neighborhoods, however the differences are not significant. No difference was found among adolescents in different neighborhoods regarding if they are worried about environmental issues and climate changes. A statistically significant difference was found regarding the adolescents that believe that their lifestyle choices affect the environment and neighborhood socioeconomic status (Table 8). Pairwise comparisons are presented in table 9 and the proportions for the different socioeconomic status groups are shown in figure 3.
Table 8. Differences in food habits and environmental awareness by low, middle and high socioeconomic status on neighborhood-level.
Neighborhood-level socioeconomic status
Low Middle High Statistical analysis
Meana (SD) Mean (SD) Mean (SD) Fb Pc
Food habits, index 14.3 (2.7) 14.4 (2.6) 14.8 (2.7) 0.805 nsd
Environmental awareness
x2 e P f
Worried about the environment
--- --- --- 1.546 ns
Affect the environment by lifestyle
--- --- --- 8.669 <0.05
a Means and SD from ANOVA. b F-value from ANOVA. c p-value from ANOVA. d ns= not significant. e x2 from chi-square test. f P-value from chi-square test. df = 2 for ANOVA and chi-square.

26
Pairwise comparisons between socioeconomic status groups shows that there are significant differences between middle and high groups and low and high socioeconomic status groups, concerning the belief in that lifestyle choices can affect the environment (Table 9).
Table 9. Pairwise comparisons between socioeconomic status groups and belief in that lifestyle choices affect the environment.
Socioeconomic status groups X2 df p
Low-middle 0.241 1 ns*
Middle-high 6.630 1 <0.05
Low-high 8.214 1 <0.05
*ns= not significant.
A small trend is shown for adolescents living in neighborhoods with high socioeconomic status and being worried about the environmental issues and climate changes (81 %, n=79) compared to adolescents from middle-high (75 %, n=102) and low socioeconomic status neighborhoods (75 %, n=70) (Figure 3). The differences are not significant (table 8). The significant differences between neighborhood-level socioeconomic status and the belief that lifestyle choices can affect the environment, shows that adolescents from affluent neighborhoods have the highest belief in that the lifestyle choices can affects the environment (n=91) and adolescents living in low socioeconomic status neighborhoods have the lowest belief (n=75) (Figure 3).
Figure 3. Differences in percent for environmental awareness among low, middle and high socioeconomic status on neighborhood-level.
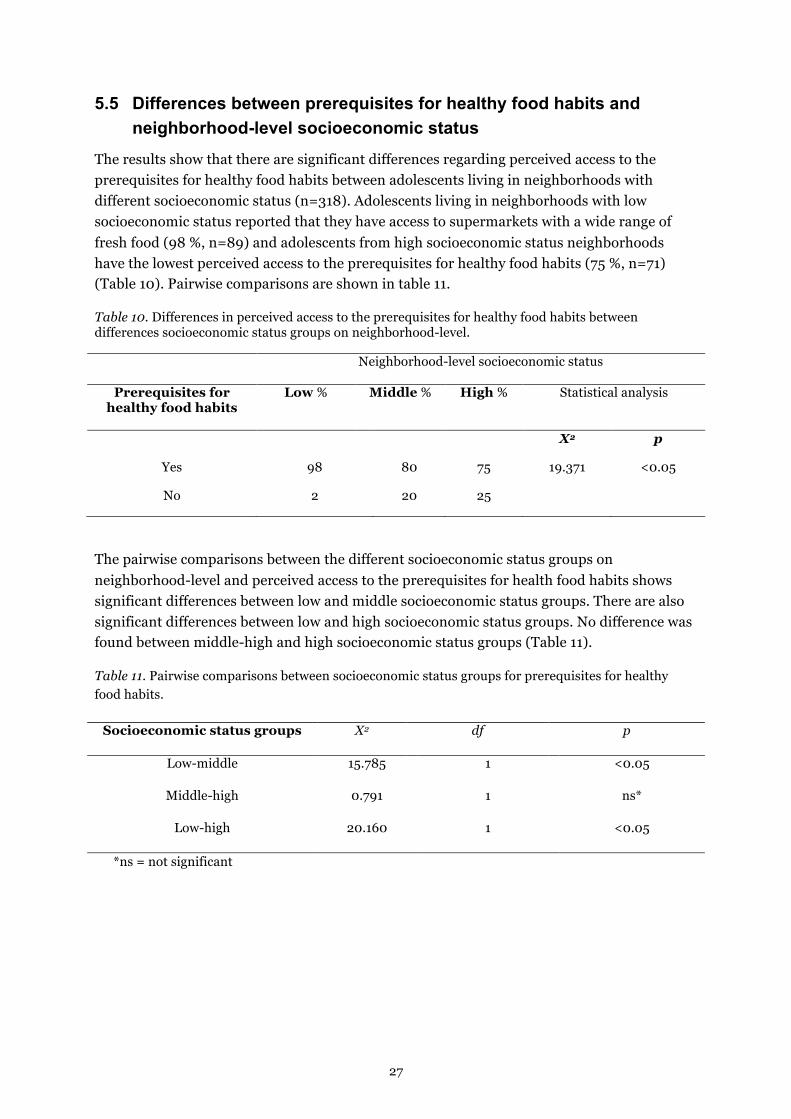
27
5.5 Differences between prerequisites for healthy food habits and neighborhood-level socioeconomic status
The results show that there are significant differences regarding perceived access to the prerequisites for healthy food habits between adolescents living in neighborhoods with different socioeconomic status (n=318). Adolescents living in neighborhoods with low socioeconomic status reported that they have access to supermarkets with a wide range of fresh food (98 %, n=89) and adolescents from high socioeconomic status neighborhoods have the lowest perceived access to the prerequisites for healthy food habits (75 %, n=71) (Table 10). Pairwise comparisons are shown in table 11.
Table 10. Differences in perceived access to the prerequisites for healthy food habits between differences socioeconomic status groups on neighborhood-level.
Neighborhood-level socioeconomic status
Prerequisites for healthy food habits
Low % Middle % High % Statistical analysis
X2 p
Yes 98 80 75 19.371 <0.05
No 2 20 25
The pairwise comparisons between the different socioeconomic status groups on neighborhood-level and perceived access to the prerequisites for health food habits shows significant differences between low and middle socioeconomic status groups. There are also significant differences between low and high socioeconomic status groups. No difference was found between middle-high and high socioeconomic status groups (Table 11).
Table 11. Pairwise comparisons between socioeconomic status groups for prerequisites for healthy food habits.
Socioeconomic status groups X2 df p
Low-middle 15.785 1 <0.05
Middle-high 0.791 1 ns*
Low-high 20.160 1 <0.05
*ns = not significant

28
6 DISCUSSION
The aim of the study was to describe food habits and environmental awareness among adolescents in Västerås and evaluate if there are differences and correlations regarding food habits, environmental awareness and prerequisites for healthy food habits between adolescents living in neighborhoods with different socioeconomic status. The aim is specified into five research questions. Almost half of the adolescents reported that they eat breakfast every day a regular week and the majority eat lunch at school five days a regular week. The majority reported that they eat fruit and vegetables as good as daily and more than once a day. The adolescents self-reported food habits showed that they drink soda, eat candy, chips and other sweets several times a week. The majority of the adolescents eat at a fast food restaurant every week. Most of the adolescents are worried about environmental issues and climate changes and believe that their lifestyle choices affect the environment. A negative correlation was found between environmental awareness and food habits. There are no differences in food habits between different socioeconomic status groups on neighborhood-level. No difference was found between adolescents living in neighborhood with different socioeconomic status and being worried about environmental issues and climate changes. Statistically significant difference was found between believing in that lifestyle choices can affect the environment and neighborhood socioeconomic status. Adolescents from high socioeconomic status neighborhoods answered that they had the highest belief and adolescents from low neighborhood-level socioeconomic status had the lowest belief. Adolescents living in low socioeconomic status neighborhoods perceived that they have the highest access to healthy food habits.
6.1 Result discussion
6.1.1 Food habits
According to Rodrigues et al. (2017) healthy food habits is partly about eating breakfast and lunch every day. The results from this study shows that adolescents in Västerås have relative good food habits since the majority of the adolescents reported that they eat breakfast most days of the week and 65 percent eat lunch every day at school a regular week. The European study HELENA by Müller et al. (2013) on more than 3000 adolescents between 13 and 18 years old, shows that only 26 percent of the adolescents eat lunch at school, which is much less than the participants in this study showing that the majority of the adolescents eats lunch. The results from this study may differ from the HELENA study since the participants are from different countries (Greece, Germany, Belgium, France, Spain, Italy, Hungary and Austria) and none of the participating countries serves lunch at school (Livsmedelsverket, 2017). Hence, there are differences in prerequisites to establish good food habits between Swedish adolescents and adolescents from other European countries. A higher proportion of the adolescents reported that they eat lunch (65 %) compared to the proportion reporting that they eat breakfast (47 %). The difference could depend on that breakfast is not served at high schools in Sweden which may imply a greater resistance to make breakfast in the

29
morning. This can be explained by the ecological model that implies that time is one of the individual factors influencing the eating habits (Story et al., 2002). When having a time to fit the adolescents may not prioritize breakfast. The parent’s workplace schedule is also a factor affecting the adolescents food habits according to Bronfenbrenner (1979). If the parents´ is not home in the morning before school, this may also be a resistance for the adolescents to make breakfast. It could also depend on that the adolescents are tired in the morning or not hungry.
The results also indicate that 25 percent of the adolescents eats fruit and vegetables more than once a day, 31 percent consume fruit and vegetables as good as daily, 31 percent eats fruit and vegetables a few times a week and 5 percent of the adolescents eats it more rarely. This indicate that the adolescents from this study have a relative low frequency of fruits and vegetables a regular week, however, the amount of the consumption of fruit and vegetables is not measured. That makes it impossible to say anything about if they reach the NNR of 500 grams fruit and vegetables per day (NNR, 2012). To reach the recommendation of 500 grams each day, it would probably require that the adolescents eat fruit and vegetables more than once a day, which could imply that it is a maximum of 25 percent of the adolescents that eat enough fruit and vegetables each day.
The Swedish National Food Agency has conducted a nationwide food survey on more than 3000 youths from the fifth and eighth grade in primary school and year two in secondary school, named Riksmaten ungdom 2016-17. The results shows that a majority of the adolescents do not reach the recommended intake of fruit and vegetables on 500 gram per day. The average intake among adolescents was only half the recommended, 250 grams (Livsmedelsverket, 2018). Based on the finding in this study, it is likely that the participants in this study eat according to the national average (Livsmedelsverket, 2018). The results from Riksmaten 2010-11 on adults from the age of 18 in Sweden, shows that only six percent eats fruits and vegetables more than once a day, 33 percent as good as daily, and 20 percent eats it a few times a week (Livsmedelsverket, 2012). That implies that the adolescents in this study has slightly higher consumption of fruits and vegetables compared to the average adult which is good since a recent study by Vereecken et al. (2005) shows that habits created during adolescents, tend to persist throughout life or get improved. This may be a sign that the younger generation is more aware of their food habits, which has potential to reflect the future public health of the adults.
Half of the participants in this study eats candy, chips and other snacks a few times a week and almost 40 percent consume soda a few times a week, which is a high frequency. The results are in line with the results from Riksmaten 2016-17 among adolescents which shows that the almost 17 percent of the total energy intake comes from soda, snacks and candy (Livsmedelsverket, 2018). This could imply that the adolescents are not eating enough lunch at school, so they consume snacks instead to be satisfied (Golley et al., 2009). According to the ecological model, hunger is one of the individual factors that contributes to the processes of making food choices (Story et al. 2002). Another important factor that influences food habits are the social network, such as peer pressure from friends in school. If the friends have unhealthy food habits and skip lunch, it may impact the food choices for an individual since they do not want to be different from the other friends in the group (Chan et al., 2009). The

30
physical environment such as the school cafeteria and convenience stores affects the food habits as well (Story et al., 2002). If the school cafeteria contains a wide range of candy and chips instead of fruit and vegetables, it makes it more difficult for the adolescents to choose the healthier options. If the schools are close to a kiosk or similar the high frequency of unhealthy snacks among the adolescents in this study may be explained.
The majority of the adolescents from this study reported that they are eating on a fast food restaurant every week which indicates unhealthy food habits since previous research has shown that fast food contains more sugar and fat (Socialstyrelsen, 2009). This could be explained by the ecological model that implies that the physical environment has an impact on food habits (Story et al., 2002). If there are available fast food restaurants close to the school the chance to visit the restaurant is higher. Motivation is another factor affecting the food habits (Story et al., 2002). Glanz and Mullis (1988) has conducted a study were the results shows that individuals with high motivation to apply healthy food habits, can more easily pass through a fast food restaurant, as compared with a person with low motivation. The adolescents may also get affected by their friend’s food habits due to peer pressure (Chan et al., 2009). If all friends chose to eat on a fast food restaurant instead of the served food at school, it could implicate that the adolescents chose to eat there as well.
6.1.2 Environmental awareness
The results from the second research question shows that the majority (78 %) of the adolescents are worried about environmental and climate changes and believe in affecting the environment by lifestyle (85 %). According to Ojala (2006) it is important to enlighten adolescents about the seriousness of environmental and climate changes since it would result into to positive actions, however it is important to not give them the feeling of helplessness. The adolescents in this study seems to be enlightened since they are worried, but still have hope to make changes since the adolescents reported that they have a high belief in affecting the environment by their lifestyle. If they act in line with their beliefs is not studied. However, this is interesting from a societal perspective, since this shows that the adolescents are willing to do make a change, this should be taken in advantage of the society by focusing on this age-group in terms of environmental work. The findings in this study is in line with a research overview by the Swedish Environmental Protecting Agency, showing that the majority of the youths in Nordic countries are worried about the environmental issues and climate changes. Sixty-eighth percent of the adolescents between eleven and fifteen years are worried about the environmental and climate changes and believe that the earth will go under due to that (Naturvårdsverket, 2017).
Media is one of the factors affecting individual behavior according to the ecological model (Bronfenbrenner, 1979). The high level of concern about the environment among adolescents could be explained by information movements from the Swedish Environmental Protecting Agency or Greenpeace and by media showing natural disasters more frequently, showing that environmental changes is not far away from Sweden. A research overview by Naturvårdsverket (2017), about sustainable consumption, shows that there is a correlation between media raising awareness about environmental issues and the adolescents level of

31
involvement in environmental changes, which may explain the high frequency of environmental awareness among the adolescents in this study. A study by Sevencan et al. (2017) shows that media is the most important information source among adolescents from secondary school about environmental changes. The second most important was school. Media and school is two sources that probably all participants in this study have access to.
6.1.3 Correlation between environmental awareness and food habits
The Spearman´s rank correlation suggested that there is a negative correlation between “to worry about environmental issues and climate changes” and food habits. This imply that the individuals who reported that they worry about the environment have worse food habits than those who reported that they do not worry. This could be interpreted as those who are worried about the environment eats less fruit and vegetables, drink more soda, eats more candy and chips and eats at fast food restaurants more often. The results also showed a negative correlation between the belief in that lifestyle choices can affect the environment and food habits which indicates that even though that the adolescents believe in affecting the environment by lifestyle they have unhealthy food habits. Environmental awareness is the independent variables in this study, but according to Ejlertsson (2012) the depended and independent variable can always be discussed. If assuming that food habits is the dependent variables instead, the correlations could be interpreted as those adolescents who have healthy food habits, are the once who are less worried about environmental issues and climate changes.
Being too worried about environmental issues may have the opposite effect, so instead of acting, the adolescents end up doing nothing about it. Previous research by Campbell et al. (2016) showed that even after that adolescents had received information about the association between food consumption and environmental impact, they were still unwilling to changes their food habits. Many adolescents have enough knowledge about sustainable lifestyle and want to make a difference, but Naturvårdsverket (2017) found in a research overview that there is a gap between knowledge and action. This is against the ecological model saying that attitudes and beliefs are individual factors affecting behaviors. However, the ecological is a complex model showing that there are several factors affecting the individual behaviors and the behaviors cannot be explained by one factor (Story et al., 2002). Adolescents are in a state of dependence, since they go to school were the school determines what food to serve and most of the adolescents may not do the food shop for the household. This could make it difficult for them to act in line with their beliefs and make good environmental decisions. The possibility for adolescents to make good decisions is thereby dependent of the schools’ and parents’ decisions.
Products measuring food habits in this study; candy, chips, soda, fruits and vegetables, is not the products with the highest climate impact since meat and dairy products have the highest climate impact (Cederberg et al., 2013). These could be interpreted as, those adolescents believing in that lifestyle choices affect the environment and those who are worried about environmental issues and climate changes, chose to eat less meat and replace it with candy,

32
chips and other snacks which has lower greenhouse gas emissions according to Sjörs, Raposo, Sjölander, Bälter, Hedenus and Bälter (2016).
6.1.4 Differences in food habits and environmental awareness among neighborhood-level socioeconomic status
The analysis in this study showed no significant differences between adolescents living in neighborhoods with different socioeconomic status and food habits. Adolescents from low socioeconomic status neighborhoods had a mean value of 14.3 on the food index and high socioeconomic status neighborhoods had 14.8, which is a small difference. A value between 14 and 15 is relative high, since the food index score had a value between four and 20, whereas 20 was the highest score. Research question one in this study, showing descriptive analysis of the adolescents’ food habits, indicated that the adolescents has unhealthy food habits. This may imply that the food index has curtain deficiencies. However, it could also depend on that the variation of the high schools in unknown. The six participating high schools in this study may be placed only in higher socioeconomic status neighborhoods or in low socioeconomic status neighborhoods, which makes it difficult to measure differences.
These findings are not consistent with recent studies showing that adolescents who have parents with low socioeconomic status groups have lower consumption of fruit and vegetables and drink more soda compared to adolescents in families with high socioeconomic status (Folkhälsomyndigheten, 2016; Mattisson, 2016; Nilsen et al., 2009; Livsmedelsverket, 2018). The different results from this study compared to other studies may be influenced by the fact that Sweden has less inequalities in health compared to other wealthy countries (SOU, 2017) such as Norway were the HUNT-study is conducted. The results from the HUNT-study also show differences in food habits among adolescents with different socioeconomic status (Nielsen et al., 2009). So even if the parents’ education and income level has an impact on their children’s food habits according to the ecological model (Story et al., 2002), the differences may not be big enough to be significant since Sweden has less inequalities. However, there are still differences between disadvantaged groups and affluent groups in Sweden, which indicate that the survey questions are inadequate or that the study population should be larger.
The ecological model implies that the state is an important factor of food behaviors (Story et al., 2002). The government in Sweden decides the prices of the food products and sets taxes, which has an indirect impact on the Swedish populations food habits. No significant differences may indicate that the government in Sweden has created good structures were all people can afford healthy food. Fruits and vegetables may not be as expensive as in other countries, so all people afford to eat this type of food in Sweden. Meat, wine and liquor is products usually more expansive and is shown in a study by Mattisson (2016) that people with higher education consume those types of products more often. However, the frequency of those products is not measured in this study.
The results shows a small trend towards adolescents living in high socioeconomic status neighborhoods reported that they are more worried about environmental and climate changes (81 %) compared to low and middle-high socioeconomic status neighborhoods (75

33
%). However, the differences were not significant. Significant differences were found for believing in that it is possible to affect the environment by lifestyle. Even then, those adolescents living in high socioeconomic status neighborhoods, reported that they have the highest belief in that lifestyle choices affect the environment (94 %) and adolescents from low socioeconomic status have the lowest belief (80 %). These results are consistent with recent studies showing that families with high socioeconomic status have more knowledge about environmental issues (Hampel et al., 1996; Dutt & Kumari, 2015; Özden, 2008).
The results can be explained by the ecological model by Bronfenbrenner (1979) saying that parents have an impact on their children. High socioeconomic status in this study implies adolescents with parents having high education- and high disposable income, which affects the adolescents as well. The parents with high socioeconomic status have knowledge about how to live more sustainable (Dutt & Kumari, 2015), which may lead to the adolescents have an increased belief in affecting the environment by making own sustainable decisions. Since adolescents with highly educated parents has knowledge about environmental issues, may also imply that those adolescents are more informed about different environmental issues and thus they are more worried. No significant differences were found for neighborhood socioeconomic status and being worried about environmental changes could depend on, as mentioned earlier, that the adolescents get the same information about environmental issues mostly from media and school (Sevencan et al., 2017). Differences regarding the belief in that lifestyle choices can affect the environment may depend on the adolescents from different socioeconomic status groups, may be more or less receptive to the same information from media.
6.1.5 Differences in prerequisite for healthy food habits by neighborhood-level socioeconomic status
The results indicate differences in prerequisites for healthy food habits between different socioeconomic status neighborhoods. The differences are found between low and middle-highs, and low and high socioeconomic status neighborhoods. Adolescents from low socioeconomic status neighborhoods had the highest perceived access to the prerequisites for healthy food habits (92.7 %) while adolescents living in high socioeconomic status neighborhoods have the lowest perceived access (73.2 %). The results are in line with a recent study by Smoyer-Tomic et al. (2008) showing that low socioeconomic status neighborhoods have greater access to large supermarkets with a wide range of fresh food. High socioeconomic status neighborhoods in Sweden may be located more outside the center, which contributes to that those people living there only have smaller supermarkets or no stores at all and thereby must drive outside the local area to purchase food.
These results are positive for disadvantage groups since they are more likely to purchase unhealthy food if it is available (Drewnowski & Specter, 2004). If the results would show the opposite, i.e., that high socioeconomic status neighborhoods have greater prerequisites to good stores, the inequalities between the groups would probably increase. However, prerequisites for healthy food habits is more than just the wide range of fresh food in the

34
supermarkets. Even if the opportunity to establish healthy food habits are good, the economic circumstances may influence the opportunity.
As shown in research question three, there was no significant differences between food habits and neighborhood socioeconomic status. Previous research by Folkhälsomyndigheten (2016) has shown that low socioeconomic status is associated with unhealthy food habits. This could be interpreted as even if an adolescent has a low socioeconomic status, having good access to supermarkets with a wide range of fresh food could reduce the inequality in food habits between different socioeconomic status groups. This can also be explained by the ecological model saying that grocery stores affect the prerequisites for good food habits and how the food habits of an individual turn out to be (Story et al., 2002). Since the prerequisites for healthy food habits are high among low socioeconomic status neighborhoods, the food habits may be healthier as well. However, the interaction between these three variables is not investigated.
Available stores are one of the environment conditions in the community affecting the individual indirectly (Story et al., 2002) since the individual cannot affect what the stores sell and if there are any available stores in the neighborhood. Inequality is often indicating that people have different access to resources and the ability to influence in changes in the society, subsequently, inequality. Inequality in health is due to structural conditions, which means that the state has the main responsibility to work with inequalities (SOU, 2017). This imply that the state or the local stores have made it easier for people in low socioeconomic status neighborhoods to establish healthy food habits.
6.2 Method discussion The benefit to have conduct a quantitative study is that a large number of participants could participate in the study and made it possible to evaluate correlations and differences between groups (Olsson & Sörensen, 2011). Unlike the quantitative method, the qualitative research is about understanding people and explain it in words (Bryman, 2016), which is why qualitative methods was not an option for this study. By using a questionnaire, the study is more objective since the researcher cannot do subjective interpretations in the data collection or manipulate any variables (Bryman, 2016).
6.2.1 Study design
This study is a cross-sectional study and was chosen since none of the other observational study designs were possible to conduct. Cohort studies are studies where a group of healthy people is chosen from the population. Some variables of interest are being measured and then the group is followed during a time to measure what the individuals developing a disease have been exposed to (Bonita et al., 2010). A cohort study was not possible to conduct because of the limited time. A case-control study means that a group with a disease is compares with a group without the disease. Possible risk factors are compared between the groups, with makes it possible to measure if the disease is developed because of the risk

35
factor (Bonita et al., 2010). Since no disease is of interest in this study, the case-control study design was not chosen.
Cross-sectional study design was chosen although no conclusions about causality can been drawn since data is only collected once from the participants (Bonita et al., 2010). The results in this study is showing a negative correlation between environmental awareness and food habits, however by a cross-section study design it is not possible to say that the dependent variables are getting affected by the independent variable and vice versa. In this study, it is not possible to say that adolescents are less environmentally aware since they have good food habits or that they have good food habits since they are less environmentally aware, however the first option seems more reasonable. In a cross-sectional study the risk for confounding is quite high since is not possible to match participants with different characters. Controlling for confounders require a random sample, limitations with certain characteristics among the study participants and matching variables between two comparable groups (Bonita et al., 2010). This study has not randomly picked participants and do not have any chosen characteristics and matching factors, which indicates that there may by confounding factors in the results. However, in the analyze section it is possible to control for confounders even in cross-sectional studies, which require that the participants have been asked about potential risk factors for a certain outcome. It can be controlled by stratifing and statistical modeling (Bonita et al., 2010). None of the analyze methods used in this study can control for confounders, which implies that the conclusions drawn from the analysis may have been affected and does not reflect reality.
The risk for memory bias among the participants answering questions is high in cross-sectional studies (Bontia et al., 2010). Especially questions that involves food habits is hard to remember correctly. It is different for different individuals how well they estimate the amount they have been eating. A trend has been seen among people having a low consumption during a day, since they are overestimating their consumption and vice versa with people having a high food consumption during a day (Callmer, Hagman, Haraldsdóttir, Løken, Seppänen & Trygg, 1986).
6.2.2 Selection and loss
The participants from Eskilstuna had to be excluded from this study, since the neighborhood-level socioeconomic status index was based on NYKO-3 level data in Västerås. This contributed to less participants participating in the study. The majority of the participants in this study were girls which can conduct to twisted results since previous studies has shown that girls have better food habits than boys (Prattala, Paalanen, Grinberga, Helasoja, Kasmel & Petkeviciene, 2007) and girls are in general more environmentally aware (Campbell et al., 2016).
The voluntary sample only consisted of six schools, which mean that the vast majorities of schools in Västerås did not accept the invitation to participate in the study. However, the reason that the majority of the high schools did not participate may depend on that high schools in Västerås are saturated with questionnaires, since Liv och Hälsa Ung is a large study conducted among students in second year of high school.

36
The low amount of voluntary schools could imply that there is no variation in were the high schools are placed in Västerås. This can affect the results since this study is evaluating socioeconomic status differences, which require a variation of high schools from different neighborhoods. Furthermore, the intern loss on the question about neighborhoods was high (n=89) which may depend on that there was no response option called “other” for those adolescents living in other cities but go to school in Västerås. The question about neighborhoods in the questionnaire gave an option to choose the neighborhood closest to the own neighborhood, if the own neighborhood was not one of the options. If not knowing which neighborhood to choose instead could have led to not answering the question or that the adolescents has chosen a neighborhood which has higher socioeconomic status compared to the actual neighborhood or vice versa. This imply that the question had 20 percent loss, which could be considered as high in this study with the size of the selection.
A disadvantage with a voluntary sample is that people who have a strong interest in the main topic, are the once that apply for participating in the study. The risk with only having people interested of the subject is that the selection may systematically differ from the population (Olsson & Sörensen, 2011). However, this may not be the case for this study, since the school principal have accepted the invitation for all classes on the high school, which implies that even adolescents’ without an interest in the main topics may have answered the questionnaire voluntary.
The selection method could also be considered as a total survey since all high schools in Västerås were invited to participate. However, only six of 21 schools accepted the invitation, which implies that the study cannot be considered as a total survey. Still all individuals in the population had the same chance of being selected as a sample member.
6.2.3 Variables
Prerequisites for healthy food habits was measured by survey question “Is there one or several supermarkets with a wide range of fresh food, such as fruit, milk and bread, where you live?”. This question does not say anything about the range of unhealthy items in the store. Prerequisites for healthy food habits is more complex than just rang of fresh food in the supermarket. Other question about prerequisites for healthy food habits is required. The question about prerequisites contained three response options: yes, no and do not know. The response alternatives do not know was counted as missing value since it does not say anything about the real value. It does not tell if there are good fresh food or not, which is why it could not be put together with the other response options.
Environmental awareness was measured by two survey questions asking for if the adolescents are worried about environmental issues and climate changes and if they believe in that lifestyle choices affect the environment. This is two questions asking for environmental issues in general and not any specific environmental areas such as environmental changes from food habits. This implies that correlations between self-reported food habits among adolescents and environmental awareness can give twisted correlations, since environmental awareness is not only about food consumption. However good food

37
habits are a part of the environmental changes. This implies that a question specifically asking for environmental changes due to food habits is required.
Environmental awareness was dichotomized from four response alternatives to worried and not worried for being worried about environmental changes and yes and no for believing in affecting the environment by lifestyle. The response alternative do not know was dichotomized to not worried since it was considered that if a person is worried about the environment and think that they can affect the environment by lifestyle, the person would probably answer that they are worried and believe in the effect of the lifestyle instead of answering do not know. However, it was only 40 adolescents answering do not know if they are worried, and 29 on if they believe in affecting the environment by lifestyle, which may have not affect the results significantly.
The disposable income was counted by mean values for every income level since it was unknown who much every individual earned per year. The only information Västerås stad gave, was the number of individuals having a disposable income between an interval of one to 120 000 crowns, etcetera. Counting mean values of the numbers can give wrong distribution if the people living in a neighborhood have lower or higher mean value than counted.
6.2.4 Analyze methods
One-way ANOVA, chi-square and Spearman´s rank correlation have been conducted to answer the research questions. Research question three was answered by ANOVA for the continuous variables and chi-square for the categorical variables. ANOVA require that the data is normally distributed (Keller & Kelvin, 2013), but the distribution is not tested for the variables in this study, which implies that the results may have been affected. When the distribution of the variables is unknown, Kruskal-Wallies can be used instead, which is a non-parametric equivalent to ANOVA and the results is presented in median instead of means (Keller & Kelvin, 2013). ANOVA was used since mean values were in interest and ANOVA is used in studies with more participants compered to Kruskal Wallies used for fewer participants. Another requirement ANOVA has is that there should not be any homogeneity of variance between the groups, which was not found (Levene test=0.069, p=0.934) for socioeconomic status groups. If there was a homogeneity between the groups, Kruskal Wallies is more appropriate.
Chi-square test does show if there are differences between the groups, but not the strength on the differences (Keller & Kelvin, 2013). Requirement for chi-square is that the number of participants should be over 30 and not less than five participants in each group (Ejlertsson, 2012), this implies that the requirements are achieved, which also applies for research question four using chi-square as well.
Research question five was answered by Spearman´s rank correlation which was chosen since one of the variables was categorical. If both variables were continuous, Pearson correlation could be used instead. According to Merrill (2013), the limitation with Spearman´s is that it is not possible to control for confounders, which indicates that there could be another factor that is explaining the correlation between environmental awareness

38
and food habits. A multiple regression analyze can be used to test for associations and confounders since several independent variables can be analyzed at the same time (Ejlertsson, 2012). However, to use a multiple regression analyze the dependent and independent variables should be numeric, which is not the case for the two variables used in this question. A categorical variable could be treated as numeric in a multiple regression if the independent variable is dichotomized (Ejlertsson, 2012), but Spearman´s was chosen anyway.
6.2.5 Quality criteria
This study has only taken the face validity into account and not the other two validities, which can indicate on systematic bias since the measurements is not tested and the results may reflect something else. The two questions measuring environmental awareness is in line with the definition of environmental awareness by Takala (1991) saying that it is about understanding threats, changes and options available. Which could be interpreted as the two questions is measuring environmental awareness as intended to measure.
Food habits and socioeconomic status was measured by creating an index. According to Olsson and Sörensen (2011) an index it is beneficial for the reliability, instead of having every question separately. The validity is also increasing, however, it requires that the merged questions have the same aspect of the variable. An index can also be negative since the detailed information disappear (Olsson & Sörensen, 2011). Deciding which questions to be merged can be decided by the researcher, by a factor analyses or by having a theory behind it (Olsson & Sörensen, 2011). The questions creating the food-index is decided by the author, but since a matrix question was created of the four questions the researchers creating the survey question have also decided that they are measuring the same thing. The index of socioeconomic status contains four variables of neighborhood deprivation from two different sources, however the definitions are highly correlated (Sariaslan et al., 2013; Sariaslan et al., 2015), which increases the reliability of the socioeconomic status index.
The generalization decreases since only six high schools did participate out of 21 high schools in Västerås. The number of students who did not participate is unknown, which makes it difficult to say if the 422 participants from this study is generalizable to the rest of the population. The variation of schools is unknown, and thereby it is not feasible to know if the participating schools differ from the other schools. The internal loss on the question about neighborhoods, which was used to create the socioeconomic status index, was high (n=89). The high loss on neighborhoods decreased the generalization to adolescents living in other neighborhoods with similar level of socioeconomic status. However, all schools in Västerås got an invitation, which implies that all students had the same opportunity to participate, which increases the possibility to get higher representable results according to Creswell (2013). Anyway, the choice of a voluntary sampling decreases the opportunity to generalize the results since the risk for systematic bias is high (Olsson & Sörensen, 2011). The results cannot either be generalized to students in the first year in high school since there is nothing saying that adolescents from the first year are eating the same or thinking the same as

39
students in second- and third year. Since the validity in this study is low, generalization is negatively impacted as well.
The possibility to replicate the study is considered as high, since the method is extensively described, no subjective interpretations is made in the study and no manipulation of the variables has occurred.
6.2.6 Ethical considerations
The four ethical principles are considered before, during and after the NESLA study, which increases the quality of the study according to Bryman (2016). Since the data in this study is secondary data, the ethical process has not been possible to influence. The data from the NESLA study has been stored in a looked file so no one outside the research group have had access to data, and the author had access to the file. In the file, which was given from the NESLA study, information considered as sensitive information about participants existed. Personal identity number was not included, but name and address was included. Since that author is a part of the research group, no ethical principles were broken.
The information requirement was considered since the participant got both oral and written information about the study. The participants gave approval by answering the questionnaire. In the application, it is mentioned that a participation does not mean any risks, however some questions about the health, person number, address and name can be considered as sensitive information. The participants had the choice not answer questions. The benefits of participating were bigger than the risk, since the advantage is that the results from the study can contribute to concrete actions from politician which aim to improve the life situation and an increased knowledge about the youth’s conditions for a sustainable lifestyle (Dnr 2017/244a). The utilization and confidentially requirements have been considered by data only being presented in group level, which implies that individuals cannot be identified. Data has only been used for this aim of the study and have not been used for anything else.
Research assistants from the research group were responsible for the data collection from in Västerås. This could be beneficial since the adolescents were able to ask questions about the questionnaire and the anonymity increases since the research assistants did not have a personal relationship to the adolescents. The teachers were responsible for handing out the web questionnaire at the event Science @ mdh, which implies that those adolescents did not have the opportunity to ask questions about the survey questions. This should not affect the adolescent’s answers since the teachers received information about the importance of anonymity.

40
7 CONCLUSION
• Almost half of the adolescents in this study reported that they eat breakfast every day (47 %) and the majority (65 %) reported that they eat lunch every day at school a regular week. The majority of the adolescents reported that they eat fruits and vegetables as good as daily, however to reach the Nordic nutrition recommendations of 500 grams per day, it requires that the adolescents eats fruit and vegetables more than once a day. Half of the adolescents consume soda, candy and chips or other snacks several times a regular week. The majority (69 %) of the adolescents are eating at a fast food restaurant every week.
• Seventy-eight percent of the adolescents in Västerås are worried about the environmental issues and climate changes and 85 percent believe that the lifestyle choices affect the environment which could be interpreted as the majority of the adolescents are enlightened about environmental issues.
• A statistically significant correlation was found between having a high belief in that lifestyle choices affect the environment and unhealthy food habits. Statistically significant correlation was also found between being worried about environmental issues and climate changes and unhealthy food habits. The correlation between environmental awareness and food habits is uncertain since the survey question on environmental awareness is about the environmental in general and not about food habits specifically.
• No significant differences were found between food habits and neighborhood-level socioeconomic status, which could depend on that the food index measuring the food habits has curtain deficiencies. Significant differences were found regarding the belief in that lifestyle choices affect the environment between adolescents living in neighborhoods with different socioeconomic status, but not for whether the adolescents are worried about environmental issues and climate changes.
• Adolescents living in low socioeconomic status neighborhoods reported that they have a higher perceived access to the prerequisite for healthy food habits compared adolescents living in middle-high and high socioeconomic status neighborhoods.
7.1 Practical application This study will hopefully stimulate to new studies among adolescents in Sweden which is considered necessary since the number of studies about food habits, environmental awareness and prerequisites for healthy food habits among adolescents conducted in Sweden is low. Hopefully new interventions will also be carried out when the results reach to politicians from the participating organizations in Samhällskontraktet. This would be beneficial for adolescents in Västerås since healthy food habits have positive health effects. It would also be beneficial for the society since the health of the adolescents can for example affect social costs. Environmental awareness is also an important factor to work with, since

41
personal choices in the everyday life affect the environment which in turn affect all the people on earth. The adolescents are the future and an important target group to work with regarding environmental work.
This study contributes to knowledge about the adolescents’ food habits that is needed to develop effective interventions and projects among adolescents. Based on the results from this study, effective interventions are required to decrease the consumption of soda, chips and candy among the adolescents. A priority group could be groups with lower socioeconomic status which can contribute to reduce social inequalities and improve the public health.
7.2 Future studies This study showed that there are differences in prerequisites for healthy food habits depending on which neighborhood the adolescents lived in. Future studies regarding what adolescents consider as good prerequisites and what they consider as barriers for establishing healthy food habits is necessary, to satisfy their needs. This knowledge could also be important in public health to decrease inequalities between different socioeconomic status groups and to customize neighborhoods based on their experiences. Furthermore, it would be interesting to analyze if there are interactions between the prerequisites for healthy food habits, how the actual food habits are and neighborhood-level socioeconomic status. Will the adolescents’ food habits be improved if living in a neighborhood with good prerequisites for healthy food habits? The results of this study showed that adolescents in Västerås are environmentally aware, however it would be interesting to study if the adolescents act in line with their knowledge. Which factors are considered as barriers to act more environmentally friendly.
No confounders were controlled in this study, in a further study it is in interest to use analyze methods with the possibility to verify confounders.
8 ACKNOWLEDGEMENT
The author would like to thank:
Tove Sjunnestrand with inputs on the content and for sharing valuable information about the NESLA study. Katarina Bälter for sharing data from the NESLA study. Steven Doerstling for helping to create the socioeconomic status index and thanks to Västerås stad for sharing information about different neighborhoods. Last of all I want to thank Annika Tillander for helping with the analysis.

42
REFERENCES Agenda 2030-delegationen. (2018). Delegationen. Retrieved 2018-04-30, from
https://agenda2030delegationen.se/delegationen/
Bonita, R., Beaglehole, R., & Kjellström, T. (2010). Grundläggande epidemiologi (2nd ed.). Lund: Studentlitteratur.
Bronfenbrenner, U. (1979). The Ecology of Human Development. Experiments by Natur and Design. London: Harvard University Press.
Brottsförebyggande rådet. (2017). Utveckling i socialt utsatta områden i urban miljö. Analys utifrån Nationella trygghetsundersökningen (Report 2017/7). Stockholm: Brottsförebyggande rådet.
Bryman, A. (2016). Social Research Methods (5th ed.). London: Oxford University Press.
Burström, B., Burström, K., & Corman, D. (2014). Livsvillkor, levnadsvanor och hälsa i Stockholms län. Öppna jämförelser 2014 (Report 2014:3). Stockholm: Stockholms läns landsting.
Byrsjö, J., & Brage, H. N. (2003). Socioekonomiska skillnader i Östergötland. En klusteranalys på nyckelområden (Report 2000:3). Linköping: Folkhälsovetenskapligt Centrum.
Callmer, E., Hagman, U., Haraldsdóttir, J., Løken, E. B., Seppänen, R., & Trygg, K. (1986). Standardisering av 24-timmarsintervju. Vår föda, 38(4), 201–298.
Campbell, J., Macdiarmid, J. I., & Douglas, F. (2016). Young people’s perception of the environmental impact of food and their willingness to eat less meat for the sake of the environment: a qualitative study. Proceedings of the Nutrition Society, 75, 224-225. doi:10.1917/S0029665116002391
Carlsson, A. C., Holzmann L. X. M. J., Ärnlöv, J., Wändell, P., Gasevic, D., Sundquist, J., & Sundquist, K. (2017). Neighborhood socioeconomic status at the age of 40 years and ischemic stroke before the age of 50 years: A nationwide cohort study from Sweden. International Journal of Stroke, 12(8), 815–826. doi:10.1177/1747493017702663
Cederberg, C., Hedenus, F., Wirsenius, S., & Sonesson, U. (2013). Trends in greenhouse gas
emissions from consumption and production of animal food products – implications for long-term climate targets. Cambridge University Press, 7(2), 330-340. doi:10.1017/S1751731112001498
Chan, K., Prendergast, G., Grønhøj, A., & Bech-Larsen, T. (2009). Communicating healthy
eating to adolescents. Journal of Consumer Marketing, 26(1), 6-14. doi:10.1108/07363760910927000
Chawla, L., & Cushing, D. F. (2007). Education for strategic environmental behavior.
Environmental Education Research, 13(4), 437-452. doi:10.1080/13504620701581539
Collings, S., Jenkin, G., Carter, K., & Signal, L. (2014). Gender differences in the mental
health of single parents: New Zealand evidence from a household panel survey. Social Psychiatry and Psychiatric Epidemiology, 49(5), 811-21. doi:10.1007(s00127-013-0796-6

43
Creswell, J. W. (2013). Research Design. Qualitative, Quantitative, and Mixed Methods Approaches (4th ed.). Thousand Oaks: SAGE Publications.
Dahlgren, G., & Whitehead, M. (2007). European strategies for tackling social inequalities
in health. Leveling up Part 2. Köpenhamn: World Health Organisation. Dnr 2017/244a: Beslut och yttrande avseende Förutsättningar för en hållbar livsstil och hos
barn och ungdomar. Regionala prövningsnämnden Uppsala.
Drewnowski, A., & Specter, S. E. (2004). Poverty and obesity: The role of Energy density and Energy costs. American Journal of Clinical Nutrition, 79(1), 6–11. doi:10.1093/ajcn/79.1.6
Dubowitz, T., Melonie H., Chloe, B., Lurie, N., Finch, B. K., Basurto-Dávila, R., … Escarce, J. (2008). Neighborhood socioeconomic status and fruit and vegetable intake among whites, balcks, and Mexican Americans in the United States, The American Journal of Clinical Nutrition, 87(6), 1883-1891. doi:10.1093/ajcn/87.6.1883
Dutt, K., & Kumari, P. (2015). Relationship between socio-economic status and academic achivement towards environmental consciousness. Indian Journal of Positive Psychology, 6(4), 426-428.
Ecob, R., & Macintyre, S. (2000). Small area variations in health related behaviours; do these depend on the behavior itself, its measurement, or on personal characteristics? Health and Place, 6(4), 261-274. doi:10.1016/S1353-8292(00)00008-3
Families Commission. (2010). Economic wellbeing of sole-parent families (Issues paper 03). Wellington: Families Commission.
Fogelberg, C. L. (2008). På väg mot miljöanpassade kostråd. Vetenskapligt underlag inför miljökonsekvensanalysen av Livsmedelsverkets kostråd (Report 9/2008). Uppsala: Livsmedelsverket.
Folkhälsomyndigheten. (2016). Folkhälsan i Sverige 2016. Årlig rapportering. Stockholm: Folkhälsomyndigheten.
Ejlertsson, G. (2012). Statistik för hälsovetenskaperna (2nd ed.). Lund: Studentlitteratur.
Galobardes, B., Shaw, M., Lawlor, D. A., Lynch, J. W., & Smith, G. D. (2006). Indicators of socioeconomic position (part 1). Journal of Epidemiology & Community Health, 60(1), 7-12. doi:10.1136/jech.2004.023531
Glanz, K., & Mullis, M. R. (1988). Environmental Interventions to Promote Healthy Eating: A Review of Models, Programs, and Evidence. Health Education Quarterly, 15(4), 395-415. Retrieved from http://journals.sagepub.com/doi/pdf/10.1177/109019818801500403
Golley, R., Pearce, J., & Nelson, M. (2009). Children´s lunchtime food choices following the introduction of food-based standards for school meals: Observations from six primary schools in Sheffield. Public Health Nutrition, 14(2), 271-278. doi: 10.1017/S1368980010002120
Hampel, B., Boldero, J., & Holdsworth, R. (1996). Gender patterns in environmental consciousness among adolescents. Journal of sociology, 32(1), 59-71.
Keller, S. P., & Kelvin, E. A. (2013). Munro´s statistical methods for health care research (6th
ed.). New York: Wolters Kluwer.

44
Landstinget Västmanland. (2012). Liv och Hälsa Ung 2012. Västerås: Landstinget Västmanland.
Larson, N., Story, M., & Nelson, M. (2009). Neighborhood Environments Disparities in
Access to Healthy Food in the US. American Journal of Preventive Medicine, 36(1), 74-81. doi: 10.1016/j.amepre.2008.09.025
Livsmedelsverket. (2012). Riksmaten – vuxna 2010-11. Livsmedels- och näringsintag bland
vuxna i Sverige. Uppsala: Livsmedelsverket. Livsmedelsverket. (2017). Fakta om offentliga måltider. Retrived 2018-02-23, from
https://www.livsmedelsverket.se/matvanor-halsa--miljo/maltider-i-vard-skola-och-omsorg/om-offentliga-maltider/fakta-om-offentliga-maltider
Livsmedelsverket. (2018). Riksmaten ungdom 2016–17. Livsmedelskonsumtionen bland
ungdomar i Sverige (Rapport 14:2018). Uppsala: Livsmedelsverket. Macdiarmid, J. I., Douglas, F., & Campbell, J. (2015). Eating like there´s no tomorrow:
Public awareness of the environmental impact of food and reluctance to eat less meat as part of a sustainable diet. Elsvier, 96(2016), 487–493. doi:10.1016/j.appet.2015.10.011
Mattisson, I. (2016). Socioekonomiska skillnader i matvanor i Sverige (Rapport 9/2016).
Uppsala: Livsmedelsverket. McLeroy, K. R., Bibeau, D., Steckler, A., & Glanz, K. (1988). An ecological perspective on
health promotion programs. Health Education Quarterly, 15(4), 351-377. Retrieved from http://journals.sagepub.com/doi/pdf/10.1177/109019818801500401
Morland, K., Dietz Riux, A. V., & Steve, W. (2006). Supermarkets, Other Food Stores, and Obesity: The Atherosclerosis Risk in Communities Study. American Journal pf Preventive Medicine, 30(4), 333–339. doi:10.1916/j.amepre.2005.11.003
Müller, K., Libuda, L., Diethelm, K., Huybrechts, I., Moreno, L. A., Manios, Y… Kerting, M.
(2013). Lunch at school, at home or elsewhere. Where do adolescents usually get it and what do they eat? Results of the HELENA Study. Appetite, 71, 332-339. doi:10.1016/j.appet.2013.09.002
Naturvårdsverket. (2017). Ungas förutsättningar för hållbar konsumtion (Rapport 6750).
Stockholm: Naturvårdsverket. Nilsen, S. M., Krokstad, S., Holmen, T. L., & Westin, S. (2009). Adolescent´s health-related
dietary patterns by parental socio-economic position, The Nord-Trøndelag Health Study (HUNT). European Journal of Public Health, 20(3), 299-305. doi:10.10937eurpub137
Nordic Nutrition Recommendations [NNR]. (2012). Bakgrund, principer och användning.
Nordiska näringsrekommendationer 2012 – rekommendationer om näring och fysisk aktivitet. Köpenhamn: Nordiska Ministerrådet.
Ojala, M. (2006). Adolescents´ Worries about Environmental Risks: Subjective Well-being, Values, and Existential Dimensions. Journal of Youth Studies, 8(3), 331–347. doi:10.1080/13676260500251934
Olsson, H., & Sörensen, S. (2011). Kvalitativa och kvantitativa perspektiv. Forskningsprocessen (3rd ed.). Stockholm: Liber.

45
Patel, R., & Davidsson, B. (2011). Forskningsmetodikens grunder. Lund: Studentlitteratur.
Prop. 2007/08:110. En förnyad folkhälsopolitik. Available: http://www.regeringen.se/contentassets/e6210d374d4642328badd71f64ca9846/en-fornyad-folkhalsopolitik-prop.-200708110
Regeringskansliet. (2016). Klimatavtal klubbat i Paris. Retrieved 2018-06-01, from http://www.regeringen.se/pressmeddelanden/2015/12/klimatavtal-klubbat-i-paris/
Rodrigues, P. R., Luiz, R. R., Monteiro, L. S., Ferreira, M. G., Goncalves-Silva, R. M., & Pereira, R. A. (2017). Adolescents’ unhealthy eating habits are associated with meal skipping. Nutrition, 42, 114-1200. doi:10.1016/j.nut.2017.03.011
Rostila, M. (2012). Sociala nätverk, socialt kapital och ojämlikheter i hälsa. I M. Rostila, & S. Toivanen (edit.), Den orättvisa hälsan. Om socioekonomiska skillnader i hälsa och livslängd (p. 182–200). Stockholm: Liber.
Rostila, M., & Toivanen, S. (2012). Den orättvisa hälsan. I M. Rostila, & S. Toivanen (edi.), Den orättvisa hälsan. Om socioekonomiska skillnader i hälsa och livslängd (p. 13–26). Stockholm: Liber.
Rosvall, M. (2014). Livsvillkor, levnadsvanor och hälsa i Malmö (5/2014). Lund: Socialmedicinsk tidskrift.
Sariaslan, A., Larsson, H., D’Onofrio, B., Långström, N., Fazel, S., & Lichtenstein, P. (2015). Does Population Density and Neighborhood Deprivation Predict Schizophrenia? A Nationwide Swedish Family-Based Study of 2.4 Million Individuals. Schizophrenia Bulletin, 41(2), 494–502. doi: 10.1093/schbul/sbu105
Sariaslan, A., Långström, N., D’Onofrio, B., Hallqvist, J., Franck, J., & Lichtenstein, P.
(2013). The impact of neighborhood deprivation on adolescent violent criminality and substance misuse: a longitudinal, quasi-experimental study of the total Swedish population. International journal of epidemiology, 42(4), 1057-1066. doi:10.1093/ije/dyt066
Sevencan, F., Yavuz, C., & Vaizoğlu, A. I. (2017). Environmental consciousness of students
from secondary and high schools in Bodrum, Turkey. Environmental Science and Pollution Research, 24(3), 3045–3053. doi:10.1007/s11356-016-7969-2
SFS 2003:460. Lag (2003:460) om etikprövning av forskning som avser människor.
Stockholm: Utbildningsdepartementet.
SFS 2010:800. Skollag. Stockholm: Utbildningsdepartement.
Sjörs, C., Raposo, S. E., Sjölander, A., Bälter, O., Hedenus, F., & Bälter, K. (2016), Diet-related greenhouse gas emissions assessed by a food frequency questionnaire and validated using 7-day weighed food records. Environmental Health: A Global Access Science Source, 15(15), 1-9. doi:10.1186/s12940-016-0110-7
Smoyer-Tomic, K. E., Spence, J. C., Raine, K. D., Amrhein, C., Cameron, N., Yasenovskiy, V., … Healy, J. (2008). The association between neighborhood socioeconomic status and exposure to supermarkets and fast food outlets. Health and Place, 14(4), 740-754. doi:10.1016/j.healthplace.2007.12.001
Socialstyrelsen. (2009). Folkhälsorapport 2009. Västerås: Edita Västra Aros.

46
Socialstyrelsen & Statens folkhälsoinstitut. (2013). Folkhälsan i Sverige. Årsrapport 2013 (2013-2-26). Stockholm: Socialstyrelsen.
Statistiska centralbyrån. (2010). NYKO-delområde. Stockholm: Statistiska centralbyrån.
Statistiska centralbyrån. (2016). Disponibel inkomst per konsumtionsenhet för hushåll 20–64 år efter hushållstyp 2015. Stockholm: Statistiska centralbyrån.
Stehfest, E., Bouwman, L., Van Vuuren, D., Den Elzen, M., Eickhout, B., & Kabat, P. (2009). Climate benefits of changing diet. Climatic Change, 95(1-2), 83-102. doi:10.1007/s10584-008-9534-6
Story, M., Neumark-Sztainer, D., & French, S. (2002). Individual and environmental influences on adolescent eating behaviors. American Dietetic Association. Journal of the American Dietetic Association, 102(3), 40-51. doi:10.1016/S0002-8223(02)90421-9
Szklo, M., & Nieto, F. J. (2014). Epidemiology. Beyond the Basics (3rd ed.). Burlington: Jones
& Bartlett Learning. Takala, M. (1991). Environmental Awareness and Human Activity. International Journal of
Psychology, 26(5), 585-597. doi:10.1080/00207599108247146 Thornton, L., Crawford, D., & Ball, K. (2011). Who is eating where? Findings from the
SocioEconomic Status and Activity in Women (SESAW) study. Public Health Nutrition, 14(3), 523-531. doi:10.1017/S1368980010003022
Turrell, G., Blakely, T., Patterson, C., & Oldenburg, B. (2004). A multilevel analysis of
socioeconomic (small area) differences in household food purchasing behavior. Journal of Epidemiology and Community Health, 58(3), 208-215. doi: 10.1136/jech.2003.011031
United Nations [UN]. (2015). Transforming our world: the 2030 Agenda for Sustainable
Development (A/RES/70/1. Retrieved 2018-02-06, from http://www.un.org/ga/search/view_doc.asp?symbol=A/RES/70/1&Lang=E
Vereecken, C., Inchley, J., Subramanian, S., Hublet, A., & Maes, L. (2005). The relative influence of individual and contextual socio-economic status on consumption of fruit and soft drinks among adolescents in Europe. European Journal of Public Health, 15(3), 224-232. doi:10.1093/eurpub/cki005
Vetenskapsrådet. (2017). God forskningsed. Stockholm: Vetenskapsrådet.
Weil, A. (2005). Nutrition and health. Explore: The Journal of Science and Healing, 1(1), 65-66. doi:10.1016/j.explore.2004.10.012
Wirsenius, S., Hedenus, F., & Mohlin, K. (2011). Greenhouse gas taxes on animal food products: Rationale, tax scheme and climate mitigation effects. Climatic Change, 108(1), 159-184. doi:10.1007/s10584-010-9971-x
World Health Organization [WHO]. (1948). Official records of the World Health Organization. Retrieved 2018-02-01, from http://apps.who.int/iris/bitstream/10665/85573/1/Official_record2_eng.pdf
World Health Organization [WHO]. (1998). Health Promotion Glossary. Geneva: WHO.

47
Worlds Wildlife Fund. (2017). Vad är klimatförändringar. Retrieved 2018-06-01, from http://www.wwf.se/wwfs-arbete/klimat/vad-ar-klimatforandringarna/1124260-vad-ar-klimatforandringarna
Özden, M. (2008). Environmental Awareness and Attitudes of Student Teachers: An Empirical Research. International Research in Geographical and Environmental Education, 17(1), 40-55. doi: 10.26167/irgee227.0

1
APPENDIX 1; QUESTIONNAIRE

2

3

1
APPENDIX 2; INFORMATION LETTER

2

Box 883, 721 23 Västerås Tfn: 021-10 13 00 Box 325, 631 05 Eskilstuna Tfn: 016-15 36 00
E-post: [email protected] Webb: www.mdh.se