Supporting configurability in a mixed-media environment for design students

1
MEDIA HABITS OF SCHOOL STUDENTS
2010-2011
A Report
Submitted by
Dr. Anubhuti Yadav
Central Institute of Educational Technology
National Council of Educational Research & Technology

2
CONTENTS
1. Introduction
2. Methodology
3. Physical activities and students
4. Media at Home
5. Mobile Phones and Students
6. Print Media and Students
7. TV and Students
8. Cinema and Students
9. Video games and students
10. Music and Students
11. Computers and Students
12. Media Rules
13. Students’ take on Media content
14. Key Findings

3
1. INTRODUCTION
Most of the students’ lives are abounded with media messages oozing from newspapers, magazines, TV,
Radio and from the new media. This continuous flow of messages in their life from various directions
leaves them perplexed and anguished many a times. Students who are inundated with such vast
information most of the time are unable to extract the information which are good for them and thrust
aside the one which are not relevant for them. This increased exposure to the media is associated with
the problems like increasing obesity, body dissatisfaction, aggressive behavior and many more amongst
students. If we look at the current media scenario and space allotted for children in it, we can easily say
that the children of today are watching the programmes meant for Adults. The reality shows, the soap
operas, the highly sensualized news stories are definitely not meant for children but they anyhow are
watching them with great interest.
Not consuming age appropriate media content creates problem not only for children but parents and
teachers are also often disillusioned with the peculiar situations they come across while interacting with
today’s generation which are often termed as ‘The New Kid’ by psychologists. Children these days are
often accused, by the psychiatrists, of growing up too fast. They are tagged as KGOY- Kids Grow Up
Young. Dr. Samir Pareekh, a leading psychiatrist, feel the reason for this phenomenon can be attributed
to the fact that the younger generation has more access to answers to their queries with different forms
of media .
The media industry in India is growing at a very rapid pace. According to FICCI-KPMG Indian Media and
Entertainment Industry Report 2011 “Hitting the High Notes” the Indian media and entertainment
industry grew from INR 587 billion in 2009 to INR 652 billion in 2010, registering an overall growth of 11
percent. The industry which includes TV, Radio Print, cinema and gaming has somehow in the race to
grow exponentially disregarded the educational and entertainment needs of a very vast population i.e.
children.

4
KIDS’ GENRE OF TV PROGRAMMES
If the kids genre of channels are compared with other countries than the India has least number of kids
channels. According to KPMG analysis out of total only 3 percent of channels are kids’ channels ( 17).
0%
2%
4%
6%
8%
10%
12%
14%
16% South Korea (38)
Singapore (11)
Malaysia (12)
Indonesia (9)
Hong Kong( 14)
UK (32)
USA (36)
India (17)
In country which has 550 TV channels, 77,600 newspaper types in multiple language, 595 movie
releases ( including hindi, regional and hollywood releases) and so many FM channels have we ever
wondered what space have we given in a such a wide canvas to our children and how children are
dealing with such a wide variety of information. Keeping this in view a survey was conducted to find out
what kind of media messages are students consuming and how. This activity was the first activity for the
students of media club which were established to initiate media discourse in schools. The idea was to
initiate discussion on their media habits. What sort of media messages they are consuming, how much
they are consuming, when they are consuming and where they are consuming were some of the
questions which media club students tried to find answers to.
OBJECTIVES
To track Media habits of school students
To find out the time spent by students on various media
To find out their favorite media products
To find out how and where they access media content
To identify various types of Media Rules formed in their family
To find out their expectations from media content

5
2. METHODOLOGY
Four hundred students from Delhi were interviewed for the survey. The schools which participated in
the survey had established Media Clubs in their schools. As first activity of the club the students with the
help of their teachers conducted this survey. The questionnaire was given to the teachers when they
came for the orientation programme organized at CIET NCERT. The idea was to track the media habits of
students over a period of one week. Students of age group 8-18 participated in the survey. These
students were from both private and public schools.
PROFILE OF THE PARTICIPANTS
AGE
FAMILY STRUCTURE
Students of age group 8-18 were considered
for the survey. For the students of eight years
it was suggested that the help of their parents
may be sought as they would not be able to
handle the questionnaire for seven days.
Though very little in number, getting
information from them was very important as
this is the stage when students start making
their choices regarding the media content.
Twenty five percent students were from the
age group 11 to 13. Maximum number of
students 71% was from the age group 14 to
18 as the choice for media club was offered
from the class VIII onwards. Most of the
media club students preferred to study the
their own peers. Most of the students
interviewed belonged to nuclear family. The
population for the study was the school
students from age group 8-18 hailing from
Delhi. Out of all schools the schools which run
media clubs were chosen for study. The
Schools participated in the survey were
Navodaya school Lodhi Road, Kendriya
Vidyalaya, Manav sthali, DPS Rohini, Navy
Children School, Happy School, St. Paul
School, Dr. Radhakrishnan School

6
3. PHYSICAL ACTIVITIES & STUDENTS
There are many problems like increasing obesity amongst students, body dissatisfaction, violence
amongst students which are often discussed by the teachers and parents. Most of the time while
discussing the problem, the blame falls on the Media and its content. Media is being criticized a lot for
causing obesity, body dissatisfaction and increased violence amongst children. Whereas these problems
have roots in their life style; what they eat and how physically active they are. Hence students were
asked to record how much time they spent in exercising, playing sports, dancing running etc for seven
days.
Involvement in the physical
activities which involve running
exercising, playing outdoor is
almost consistent throughout
the week. The trend more or
large remains the same.
Twenty seven percent students
spend 30min-1hr in physical
activities followed by 25
percent who spend more than
three hours in physical
activities. 24% spend from 5-30
minutes in physical activities.
Five percent spend more than
three hours whereas eight
percent students said that they
were not involved in any of the
physical activities

7
4. MEDIA FACILITIES AT HOME
Regarding availability of various media gadgets at home most of the students have TV at home ( 98%)
out of which 88% had cable connection. This is followed by computer 81 percent of students have
computer at home and seventy two percent had internet connection. Seventy nine percent have radio
while 81% and 69 percent students have DVD player and CD player respectively. Sixty three percent of
the students own video game player. The figures point out that the students are surrounded with
various gadgets and they have easy access to them as they are available to them at their own place.
MEDIA FACILITIES IN BED ROOM
Though most of the students have access to media at home, they were also asked about its presence in
their bedroom. Sixty two percent of the students have computer in their rooms while fifty three percent
students have TV in their bedroom and forty percent have radio. Other technologies though not in large
number as compared to TV, Radio and computer have entered into the private space of the students.

8
MEDIA DEVICES OWNED BY STUDENTS
There used to be a time when most of the media devices were shared by the family. The trend is no
longer the same. Now each member has his or her own device. When asked about the ownership of
various devices, fifty percent of the students said that they had their personal MP3, forty nine percent
have mobile, thirty percent have Video Game player, twenty two percent have their personal laptop and
ten percent have their own Walkman whereas twenty two percent of students did not have any
personal media devices.

9
5. MOBILE PHONES & STUDENTS
Almost all the students now a day have access to mobile. Forty nine percent of the students interviewed
have their own personal mobile phones whereas other do have access to them as their parents own
them. When asked the purpose for which the mobile phones are used sixty four percent of the students
said that they used mobile phone primarily to make call, forty five percent used it for messaging, twenty
five percent used it for playing games, twenty three percent use it for listening music, eleven percent for
clicking photographs and for taking video and nine percent also used it to access internet. Students were
asked to write three most important functions of cell 0phones on the basis of their usage.

10
When asked how often they do activities like messaging, taking pictures, taking videos, listening music,
playing games, connecting to internet, visit social networking sites, watching Tv and watching video
Mobile for taking picture
Mobile for taking Video
Mobile for listening music
Mobile for playing games
Mobile for Internet
USE OF MOBILE PHONES
Students are using mobile phones for various purposes. The
frequency of using it for various reasons varies. Most often
students use the mobile phones for listening music and
playing games. Sometimes they use it to take pictures but
they rarely take videos. Most of the students say that
mobiles are never used for accessing internet, visit social
networking sites and to watch TV shows and videos.

11
Mobile for social networking
Mobile for TV Shows
Mobile for Videos
MESSAGES PER DAY
When asked how many messages do they send previous day, most of them around thirty nine said that
did not sent any message followed by fifteen percent of respondents who said that they sent less than
ten messages in a day. There were students who sent messages ranging from 10-50 and also more than
50 but very few in numbers.

12
RULES REGARDING MOBILE PHONES
When asked about the parental rules and regulations regarding mobiles, thirty eight percent of the
students said yes there are rules laid out by their parents regarding usage of mobiles whereas forty
seven percent said there are no rules followed in their family regarding the usage of mobiles.
When asked the types of rules which are followed following were their responses:
Control in time
Call only with permission
No use during study and examination
Not allowed to internet
Control on earphones
How strict are parents with control
When asked how often do your parents make sure you follow the rules they have about using a cell
phone thirty three percent of the students said most of the time and they are quite strict with the rules.
Whereas twenty two percent of them said that they do not bother much in making us follow those rules.

13
STUDENTS AND MOBILE PHONES
1. Sixty four percent of the students said that they used mobile phone primarily to make calls, forty
five percent used it for messaging, twenty five percent used it for playing games, twenty three
for listening music, eleven percent for clicking photographs and for taking video and nine
percent also used it to access internet. Students were asked to write three most important
functions of cell phones on the basis of their usage
2. Students are using mobile phones for various purposes. The frequency of using it for various
reasons varies. Most often students use the mobile phones for listening music and playing
games. Sometimes they use it to take pictures but they rarely take videos. Most of the students
said that mobiles are never used for accessing internet, visit social networking sites and to
watch TV shows and videos.
3. When asked how many messages do they send previous day, most of them around thirty nine
said that did not sent any message followed by fifteen percent of respondents who said that
they sent less than ten messages in a day. There were students who sent messages ranging from
10-50 and also more than 50 but those students are very few in numbers.
4. When asked about the parental rules and regulations regarding mobiles, thirty eight percent of
the students said yes there are rules laid out by their parents regarding usage of mobiles
whereas forty seven percent said there are no rules followed in their family regarding the usage
of mobiles. When asked the types of rules which are formed, following were the responses
a. Control in time
b. Call only with permission
c. No use during study and examination
d. Not allowed to internet
e. Control on earphones
5. When asked how often do your parents make sure you follow the rules they have about using a
cell phone thirty three percent of the students said most of the time and they are quite strict
with the rules. Whereas twenty two percent of them said that they do not bother much in
making us follow those rules.

14
6. PRINT MEDIA & STUDENTS
Print Media includes books, newspapers and magazines.
For the survey also the print media was divided into three
major categories for the students so that they could
record their reading habits for each category. They were
magazines, Newspapers and books. Time devoted to
reading books and Magazines is quite low amongst the
students. While majority of them i.e. 38.1 percent spend
5-30 minutes in reading magazine. Thirty percent of them
said that they do not read magazines. While eleven
percent read from 30 min-1hour, only two percent of
them read from 1 to 3 hours. The readers who read from
1-3 hours is quite less. This may be due to the time taken
by other media or may be after studies they are left with
very less interest and motivation to read. When asked
about their favorite magazine the Brunch, Hindustan
Times supplement came first, followed by Readers Digest
and India Today. Of the younger lot champak and twinkle
is their favorite. Students also like niche magazines like
Top gear, auto car and Digit.

15
NEWSPAPERS AND STUDENTS
For any educated adult starting day
with a newspaper is a norm. Students
too are not far behind. Reading
newspaper is an important activity for
them and this includes flipping pages
to see visuals surfing it to read only
news headlines and serious reading.
Around seventy-five percent of
students do read newspaper.
Majority of the students (55.5) read
newspaper from 5-30 minutes every
day. Nineteen percent of them read
from 30 min to I hour. Just two
percent read it for longer duration i.e.
more than an hour. Eleven percent of
the students do not read newspaper
at all. Average newspaper reading
time for the students is from 5-30
minutes. When asked about their
favorite newspaper Time of India
came first followed by Hindustan
Times, Navabharat Times, Hindu, Mail
Today and Indian Express. Their
favorite newspaper supplements are
Delhi Times, HT city, Hello Delhi and
Education Times.

16
BOOKS & STUDENTS
Books are our best friends
conforming to the quote sixty percent
of the students said that they do read
books. On an average forty five
percent of students spend 1-3 hours
in reading books. These books include
both their school textbooks as well as
other books. Sixteen percent of
students spend 4-6 hrs in reading
books. Four percent spend around 7-
9 hrs and just one percent reads 10-
12 hrs a day. Strangely a big number,
around twenty two percent said that
they did not read any book in the past
seven days. The reason for this could
be that this questionnaire was given
to them during their summer holidays
and they might be travelling or
enjoying and the reading might have
taken a backseat during that time.

17
FAVORITE BOOKS
Students were asked to give the list of their favorite books . Following is the list of books which we came
across:
3 Mistakes Of My Life, 5 Points Someone, Champ, Agatha Christie, Harry Potter, The Diary Of A Wimpy
Kid, Akbar & Birbal, Tenali Raman, Short Stories Of Sai Baba, Alchemist, The Brurne Series, Alex Rider,
Beehive, A Pact With The Sun, Brida, Ps I Luv You, Chanda Mama, Lot Pot, Panchtantra, Atlas, Da Vinci
Code, Eclipse, Nancy Drew, Goose Bumps, Famous5, Double Twist, Matilda, Sherlock Homes, Eagle Of
the Ninth ,Lord of the Rings, Encyclopedia, Young Scientist, Pride & Prejudice, Princes Diaries, Nosy
Neighbour, Prisoner Of Zenda, Hounds Of Baskerville, Quanhoe, Nicholas Nickley, Count Of Monte
Cristo, Rage Of Angles, Kite Runner, Key Of Success, Ps I Luv U, Naughtiest Girl In School Robinhood,
Robinson Crusoe,80 Days Around the World, Rotten School, Alice In Wonderland, Tintin,Twilight Saga,
Change Of Heart, Third Twin, Super Freekonomics, Secret7,Penguin Ghost Stories, The Host, The
Princess Diaries, Eldest, Alan Rider,7 Secrets Of Sucessful Lives, Charlie & Chocolate Factory, Phantom Of
Manhattan, Runway Jury, Feluda Adventure, Garfield, Roald Dahl's Books, Darke & Jorsh, Hardy Boys,
Mills & Boons, Malbry Tower, Angels & Demons, Science Time, Wizard Of Oz, Harry Potter, Duke & I,
Broken Rhapsody, Discovery Of Truth, Echoes Of House, Jane Eyre, Kane and Able, The Wonder, The
Secret, Harry Potter, To Kill A Mocking Bird, Horrible Series, Animorphs, Sherlock Holmes, Jungle Book,
Kafka On The Shore, My Sister's Keeper ,Animal Farm, If Tomorrow Comes, Kite Runner, Vironica
Decides To Die, Little Women,Famous5,Hardy Boys, Lost Symbol, Harry Potter, Rid Pyramid, Sleepover,
Amar Chitra Katha, Chicken Soup, Narnia, RK Narayan, Premchand, Naughtiest Girl, Shadow Spell, Ninth
Chamber
While the books Harry Potter, Diary of a Wimpy Kid, Hardy Boys, Nancy Drew by foreign authors were
quite popular amongst Indian authors the recent bestsellers by the Chetan Bhagat were quite popular
amongst students. In addition Champak, lotpot, Tintin, and the books by RK Narayan and Premchand
were students’ favourite.
When asked how often they get involved in other activities like using computer, watching TV, playing
video games, sending message or listening music twelve percent of them said they often do all these
activities while reading, whereas twenty four percent said sometime they do things simultaneously,
whereas twenty percent rarely get involved in other activities and thirty five percent said they never do
such activities while reading.

18
STUDENTS & PRINT MEDIA
Time devoted to reading books and Magazines is quite low amongst the students. While
majority of them i.e. 38.1 percent spend 5-30 minutes in reading magazine. Thirty percent of
them said that they do not read magazines. While eleven percent read from 30 min-1hour, only
two percent of them read from 1 to 3 hours. The readers who read from 1-3 hours is quite less.
When asked about their favorite magazine the Brunch, Hindustan Times supplement came first,
followed by Readers Digest and India Today. Of the younger lot champak and twinkle is their
favorite. Students also like niche magazines like Top gear, auto car and Digit.
Seventy-five percent of students do read newspaper. Majority of the students (55.5) read
newspaper from 5-30 minutes every day. Nineteen percent of them read from 30 min to I hour.
Just two percent read it for longer duration i.e. more than an hour. Eleven percent of the
students do not read newspaper at all. Average newspaper reading time for the students is
from 5-30 minutes.
When asked about their favorite newspaper Time of India came first followed by Hindustan
Times, Navabharat Times, Hindu, Mail Today and Indian Express. Their favorite newspaper
supplements are Delhi Times, HT city, Hello Delhi and Education Times.
On an average forty five percent of students spend 1-3 hours in reading books. These books
include both their school textbooks as well as other books. Sixteen percent of students spend 4-
6 hrs in reading books. Four percent spend around 7-9 hrs and just one percent reads 10-12 hrs
a day. Strangely, a big number around twenty two percent said that they did not read any book
in the past seven days. The reason for this could be that this questionnaire was given to them
during their summer holidays and they might be travelling or enjoying and the reading might
have taken a backseat during that time.
While the books Harry Potter, Diary of a Wimpy Kid, hardy boys, Nancy Drew by foreign authors
were quite popular amongst Indian authors the recent bestsellers by the Chetan Bhagat were
quite popular amongst students. In addition Champak, lotpot, Tintin, and the books by RK
Narayan and Premchand were students’ favorite.
When asked how often they get involved in other activities like using computer, watching TV,
playing video games, sending message or listening music twelve percent of them saud they
often do all these activities while reading, whereas twenty-four percent said sometime they do
things simultaneously, whereas twenty percent rarely get involved in other activities and thirty
five percent said they never do such activities while reading

19
7. TV AND STUDENTS
Television offer wide variety of content. Reality shows,
soap operas, news, songs game shows etc entertains
students a lot regardless of the fact whether they were
made for them or not. The Television industry in India
according to FICCI-KPMG report 20100 is growing
tremendously. The industry according to TAM (Television
Audience Measurement) data added 100 million viewers
in 2010 to reach 600 million viewers and crossed 550
channels from 460 in 2009.The average time spent
watching TV is 2.55 hrs per day. According to this study in
which the respondents are from Delhi and are school
going students, 34% of students spend 1 to 3 hours on TV,
29% spend30 min to 1 hr, 16% watch TV for 5 to 30
minutes. Around 20 percent watch more than 6 hours and
around five percent say they do not watch TV at all.

20
FAVORITE TV PROGRAMMES
When asked about their three favorite programs, the list which came out was big but very clearly
indicates the genre of programmes students are interested in. Four genres of programme are their
favourite as most of the their favourite programmes fall in these genre. Programmes based on
Adventure ( this includes both reality shows and also the fiction), cartoon Shows, Reality Shows ( songs,
comedy, dance) soap operas . Looking at the list of their favourite programmes Man Vs Wild, a discovery
channel programme based on a story of an adventurer Bear Grylls who make it back to the civilization
from some of the most uninhabited parts of the world stand out as their favourite programme followed
by CID, a Sony TV programme which is based on crime and the CIDs role in solving those crimes. Other
than these two programmes which most of the students like, following are the other programmes based
on adventure which the students like:
ADVENTURE
Destroyed in seconds: A discovery channel programme in which the host Ron Pitts shares with the
audience most shocking destructions captured on the film.
Crime Patrol: A crime series on Sony which features crime and how police fight against these crimes.
Fear factor- Khatron Ke Khiladi: is a stunt/dare reality shows which is aired on colors.
MTV Roadies : This is the programmes in which participants were given bikes to travel on pre decided
route. Each episode consists of number of tasks or challenges which they have to perform.
Castle: is a police procedural TV series airs on Star World.
CARTOON SHOWS
Cartoon always work with children especially the younger lot. Students in the age category 8-10 liked
cartoon a lot. The cartoon shows which students watch are Ben 10 ( a story of ten year old Ben
Tennyson who finds a device out in the woods called ominitrix, which allows him to turn into ten
different aliens species. With this power he fights crime and evil aliens), Shin chan ( This is a story of a
boy Shin chan who is growing up in Tokyo and how his rude behavior and mannerism scandalize his
parents and teachers), Tom & Jerry( an animated series which revolves around the rivalry between a cat
and a mouse. Phineas and Ferb is a comedy musical series of a brother and sister and their continuous
arguments and Oggy and cockroaches is French animated comedy series, Ninja hatori

21
REALITY SHOWS
Other than show based on adventure which were discussed in the adventure category, the reality show
based on songs, dance and comedy were their favorite. The chakdhoom dhoom a dance reality show on
colors, Just dance on Star plus and X factor a singing reality show on sony was liked by many of the
students.
SOAP OPERAS
Students like soap operas which are based on comedy. Tarak Mehta ka ulta chasma followed by how I
met your mother, friends & two and a half men on star world were their favourite programmes.Other
serials which they are watching are saural simar ka, is pyar ko kya nam doon, navya, chandragupta.
Other Media Engagements along with TV watching
Tv on when not in use
Watching while eating
When asked whether they get
involved with other activities while
watching TV, forty percent say they
do get engaged with other media
while watching TV. Sixteen percent
said most of the time they were
either using computer, radio, sending
messages etc while they were
watching TV whereas 26 percent do
these activities some of the time and
14 percent a little of time. When
asked if not in use, whether your TV
remains on majority of them said
never, eighteen percent said little
time, thirteen percent some of the
time and five percent said most of the
time. When asked whether they
watch TV while having their food 73%
said yes and twenty said NO.

22
TV & STUDENTS
34% of students spend 1 to 3 hours on TV, 29% spend30 min to 1 hr, 16% watch TV for 5 to 30
minutes. Around 20 percent watch more than 6 hours and around five percent say they do not
watch TV at all.
When asked about their three favorite programs, the list which came out was big but very
clearly indicates the genre of programmes students are interested in. Four genres of
programme are their favourite as most of the their favourite programmes fall in those
categories.
o Adventure ( this includes both reality shows and also the fiction)
o Cartoon Shows,
o Reality Shows ( songs, comedy, dance)
o Soap operas
Adventure: Looking at the list of their favourite programmes Man Vs Wild, stood out as their
favourite programme followed by CID, a Sony TV programme .Other programmes based on
adventure which the students like are Destroyed in seconds, Crime Patrol, Fear factor- khatron
Ke Khiladi, MTV Roadies, Castle: is a police procedural TV series airs on Star World
Cartoons: Students in the age category 8-10 like cartoon a lot. The cartoon shows which
students watch are Ben 10 Shin chan Tom & Jerry Phineas and Ferb, Oggy and cockroaches and
Ninja hatori. Most of the cartoon shows liked by the students are produced outside India. Except
for the language ( As there are dubbed in Hindi and English) everything else dished out from
those serial are foreign to Indian children and Indian culture. Whether it is their dress, behavior,
body language or props in the set are quite different from the Indian context.
Reality Shows: Other than show based on adventures which were discussed in the adventure
category, the reality show based on songs, dance and comedy were their favorite. The :
chakdhoom dhoom a dance reality show on colors, Just dance on Star plus and X factor a
singing reality show on sony was liked by many of the students.
Soap Operas: Students like soap operas which are based on comedy. Tarak Mehta ka ulta
chasma followed by how I met your mother, friends & Two and a half men on star world were
their favourite programmes.
Other serials which they are watching are saural simar ka, is pyar ko kya nam doon, navya,
chandragopta.

23
When asked whether they get involved with other activities while watching TV, forty percent say
they do get engaged with other media while watching TV. Sixteen percent said most of the time
they are either using computer, radio, sending messages etc while they are watching TV/ where
26 percent do these activities some of the time. When asked if not in use , whether their TV was
on majority of them said never, eighteen percent said little time, thirteen percent some of the
time and five percent said most of the time.
When asked whether they watch TV while having their food 73% said yes and twenty said NO.

24
8. STUDENTS & CINEMA
Cinema in India is the most important source of entertainment for adults and for kids too. Indian cinema
has completed 100 glorious year of its existence last year. It has been entertaining and educating the
masses since then. The industry offers such wide variety of content that it satiates the entertainment
needs of almost all age groups. Though there is lot of criticism on lack of good cinema in kids genre but
still there are number of movies that takes care of the interests of younger generation. To get maximum
revenue, working on particular age group does not make sense hence most of the movie are made
keeping in view the wider age group.
Movies watched in a week
When asked how many movies they watch in a theatre in a week thirty five percent said one followed by
five percent of students who watch 2 movies in a week four percent watch 3 or movies. Nearly half of
them i.e. 49 % say they do not watch even a single movie in a week. When asked about their favourite
movies majority of them report 3 idiots as their favourite movie followed by Harry Potter. Unlike books
for which their inclination is towards foreign author for movies they prefer to watch film produced in
India. Though they have some favorites, when it comes to English movies but hindi movies outweighs
the foreign ones. English movies which appeared in their responses were Narnia, Titanic, Kungfu Panda,
Inception, God father, Gladiator, Transformer, 10 commandments, Never break down, Step 2 & 3, Caste
Away and Twilight Gaga. Amongst Hindi Films other than their favourite 3 idiots films they like tare
zameen par, Delhi Belly, Ready, Wanted, Jindagi na milegi Dobara, Jab we met and Golmal series.

25
9. VIDEO GAMES & STUDENTS
Video games are the latest craze
amongst students. Though at present
not many students own it but the
trend is catching up fast. Average
time in playing video games is
relatively low if compared with other
media. While tracking their media
consumption habit vis a vis video
games thirty four percent say they do
not play video games. Strangely but
thirty four percent did not respond to
the question. Out of remaining thirty
two percent who play video games,
thirteen percent spend 5-30 min on
playing video games. Eight percent
spend 1-3 hours and eight percent
spend 30 minutes to one hour.

26
Playing video games without its ownership
Engagemnet in other media activities while playing video games
For those who do not own Video games 18% of them still play the games by visiting game parlors and at
their friends place. Playing video games are quite engrossing hence out of those who play video games
44 % did not do any other activity while paying games. 36% do get involve with other activities while
playing video game.
FAVORITE VIDEO GAMES
Students do like playing video games. If we look at list of video games liked by them undoubtedly the
action genre is their favourite. The GTA is their favourite series of game in which players take on the role
of criminal who rises through the ranks of organized crime through the course of the game. The player is
given various missions by kingpins and major idols in the city underworld which must be completed to
progress through storyline. Assassinations and other crimes are regular feature of these games. Other
than this other games which are liked by the students are:
Burnout: Game based on care race
The Prince of Persia: Games set in Persia featuring a prince who is adept at acrobatic
Contra: Game in which player takes control of an armed commando who fight against all sort of
extraterrestrial monsters and other kinds of menaces.
Battlefield : Series of games usually focus on large, online multiplayer battles, with emphasis on piloting
a number of vehicles as well as team-based infantry combat. Playing in squads has also become a major
element of games in the series
The Teenage Mutant Ninja Turtles (abbreviated as TMNT and simplified as Ninja Turtles) are a team of
four teenage anthropomorphic turtles, who battle petty criminals and alien invaders
God of War is an action-adventure video game

27
Road Rash: Game based on motorcycle-racing in which the player participates in violent illegal street
races
Sniper:- A sniper is a action game
Angry Birds: is a strategy puzzle video game developed by Finnish computer game developer Rovio
Mobile. Inspired primarily by a sketch of stylized wingless birds,In the game, players use a slingshot to
launch birds at pigs stationed on or within various structures, with the intent of destroying all the pigs
on the playing field.
Pac-Man is an arcade game . In this player controls Pac-Man through a maze, eating pac-dots or pellets.
When all dots are eaten, Pac-Man is taken to the next stage
Need for Speed: Racing video game
Call of Duty shooting video game.
Counter-Strike: Action game including terrorist and antiterrorist.
Forza : is a racing video game.
Crysis 2: is a first-person shooter video game . Crysis 2 is a first-person shooter.
Transformers : Action based video game
Underworld: it’s a action game played by a team.
Halo is a shooting game
StarCraft : Wings of Liberty is a military science fiction real-time strategy video game.
DIRT- racing game .
Circus The game in which the player controls a seesaw and clown in order to destroy all of the targets in
the level.
Games other than action/revenge
Alpha Zones is a video game by Hudson Soft that was released for the TurboGrafx-16 .
Street cricket it’s a cricket game between two teams.
Bubbles Its just a game playing with soap’s water
Rock Band is a series of music video games .
STUDENTS AND VIDEO GAMES
28
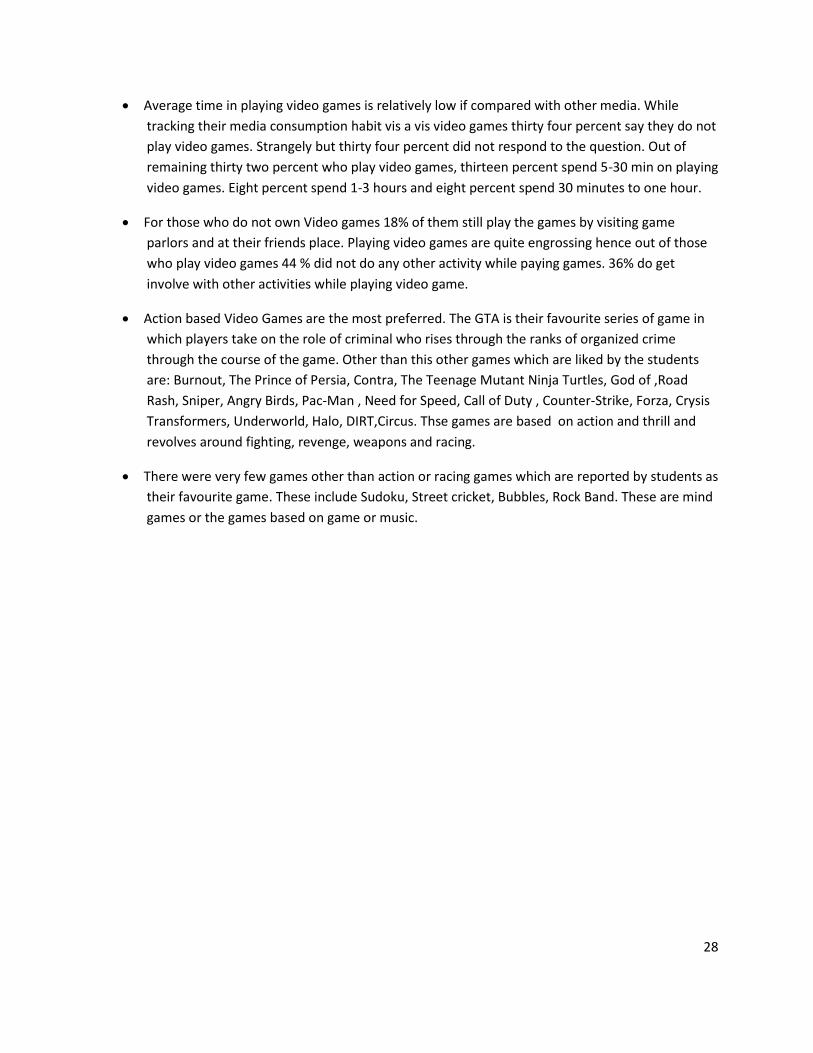
Average time in playing video games is relatively low if compared with other media. While
tracking their media consumption habit vis a vis video games thirty four percent say they do not
play video games. Strangely but thirty four percent did not respond to the question. Out of
remaining thirty two percent who play video games, thirteen percent spend 5-30 min on playing
video games. Eight percent spend 1-3 hours and eight percent spend 30 minutes to one hour.
For those who do not own Video games 18% of them still play the games by visiting game
parlors and at their friends place. Playing video games are quite engrossing hence out of those
who play video games 44 % did not do any other activity while paying games. 36% do get
involve with other activities while playing video game.
Action based Video Games are the most preferred. The GTA is their favourite series of game in
which players take on the role of criminal who rises through the ranks of organized crime
through the course of the game. Other than this other games which are liked by the students
are: Burnout, The Prince of Persia, Contra, The Teenage Mutant Ninja Turtles, God of ,Road
Rash, Sniper, Angry Birds, Pac-Man , Need for Speed, Call of Duty , Counter-Strike, Forza, Crysis
Transformers, Underworld, Halo, DIRT,Circus. Thse games are based on action and thrill and
revolves around fighting, revenge, weapons and racing.
There were very few games other than action or racing games which are reported by students as
their favourite game. These include Sudoku, Street cricket, Bubbles, Rock Band. These are mind
games or the games based on game or music.

29
10. MUSIC IN THE LIVES OF STUDENTS
Thirty six percent students report
they spend 5-30 minutes in listening
music. Twenty three percent spend
30 min to I hour , twelve percent
spend 1 to 3 hrs while about five
percent spend more than 3 hrs.
Around 11 % do not listen to the
music at all.
30
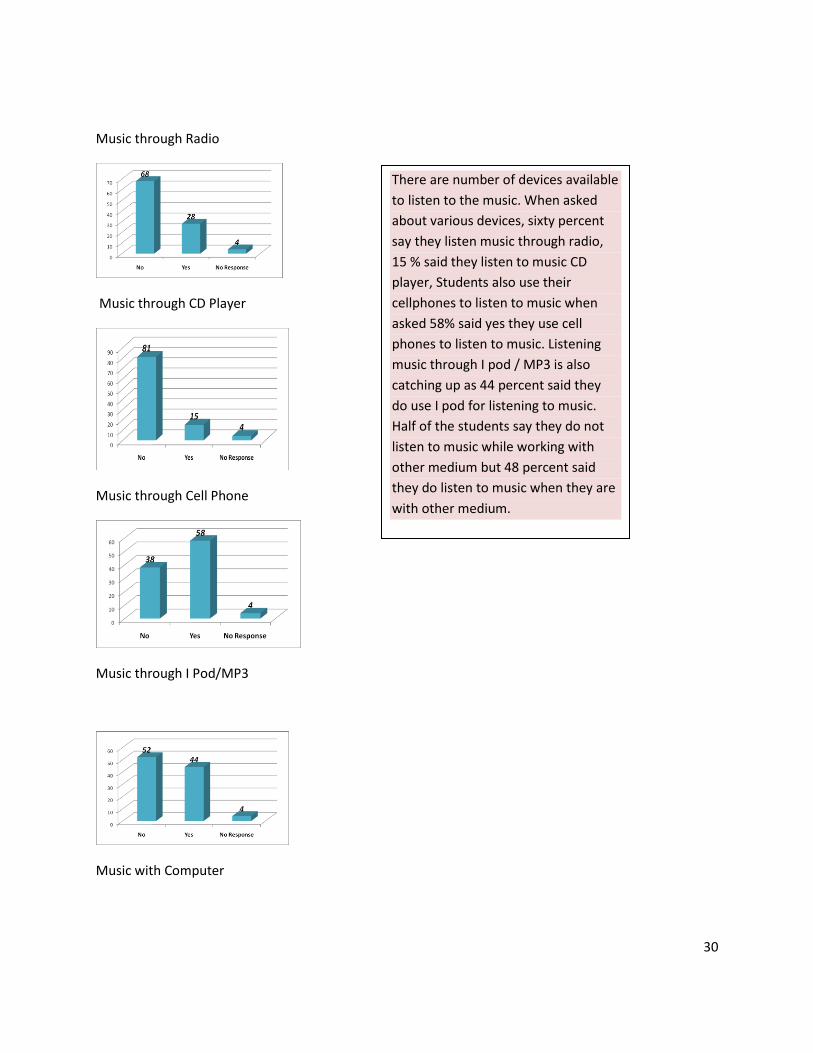
Music through Radio
Music through CD Player
Music through Cell Phone
Music through I Pod/MP3
Music with Computer
There are number of devices available
to listen to the music. When asked
about various devices, sixty percent
say they listen music through radio,
15 % said they listen to music CD
player, Students also use their
cellphones to listen to music when
asked 58% said yes they use cell
phones to listen to music. Listening
music through I pod / MP3 is also
catching up as 44 percent said they
do use I pod for listening to music.
Half of the students say they do not
listen to music while working with
other medium but 48 percent said
they do listen to music when they are
with other medium.

31
11. Computer & Students
Out of all, 63% students use
computer wheras 30 percent do not
use it at all. Regarding the time spent
on computer 25% of students who
use computers use it for 30 min – I hr
22% use it for 5-30 minutes, 11% use
it for 1-3 hrs, 6 % use it more than 3
hrs whereas twenty two percent do
not use computer at all. Forty nine
percent of students have internet at
home whereas 34% do not have
internet facility at home. Regarding
the internet facility available in school
92 % said they do not have access to
internet at school and only one
percent said they do have internet
facility at school.The students who do
not have internet access at home and
also at school were asked whether
they access internet at any other
place than home and school, 84
percent say no while 9 percent said
yes they use internet at cyber café or
at friends place.

32
Internet at Home Internet at School
Internet from other Internet nowhere
PURPOSE OF USING COMPUTER
Students use computers for various purposes which includes doing homework, playing games,
Messaging, emailing, reading newpaper and magazines online, doing graphics which includes photo
editing, social networking , visiting various websites to watch or upload video. Out of all these activities
according to the usage they spend most of the time on doing school work, followed by social networking
and playing games.
ACTIVITY WITH COMPUTE USE
When asked about their engagement
with other media while working on
computer thirty 35 % say they do not
get engaged with other media while
the remaining 57 % do get involved
with other medium .

33
Media & Homework
Activities on Internet
Out of those who access internet 68% of them downloaded music from internet 58% watched video on
you tube or Google tube, 56% visited social networking site, 51% created their profile on social
networking site, 52 percent used it for chatting, 55% got information from internet on health issue that
affect them or their relative, 41% watched video on the internet from a computer, 40 % read a blog,
20% posted a video to a site like youtube, 14 percent of them tried their hand in writing a blog, 17. 5
listened to radio through internet. The internet is mainly used by the students to download music
followed by watching video, visiting social networking site, chatting, getting information on health issue.
Students were asked while doing their
homework how often do they use computer,
watch TV, read, play games text message or
listen to music 34% said they never use the
above mentioned medium while doing their
homework. 32 % say that they do but very little
time 10 % use it sometime but 14% get involved
with various media most of the time

34
12. MEDIA RULES
When asked about the rules at home related to media which includes time spent with
particular medium, types of programme to be watched, specific time for media consumption
etc more than fifty percent that is 53 % say no media rules are formed by their parents .
Despite the fact that there is lot of concern over the kind of media consumption 53% parents
do not have any rules regarding that at their place whereas 42 % said that they follow a kind of
rule at their home which mainly includes restriction on the time spent on TV and computer and
on certain type of programmes. Out of those 42 % who do have media rules at home 21
percent said that though the rules exist but they are not followed at all 13 % follow very little ,
25 % follow those rules some of the time only 12 % households follow the media rules strictly.
Media Rules at home
Following Media Rules

35
13. STUDENTS & THEIR TAKE ON MEDIA CONTENT
When asked whether they are satisfied with the kind of content that appears in Newspaper, Magazines,
Radio and Television , majority of them seems to be satisfied with the content 48 percent said they are
satisfied, 38 percent were somewhat satisfied as they have reservations regarding some of the
programmes, very few 6 percent said that they are not at all satisfied with the content.
They were also asked what they would like to see in Newspapers, Magazines, TV, Radio and Video
games following were their responses:
Newspaper
When asked what kind of content they would like to see in newspapers Students emphasized that there
should be more variety of information. They want to see more of sports news, latest technology and the
issues concerning young people like new games for children, academic news, news related to health
comic strips and dedicated section for students. Students also pointed out that that there should be less
coverage of negative news, murder and crime and suggest the newspaper should carry more of a
positive stories.
Magazines
In magazines students want to see more of technology related magazine which should cover stories like
new gadgets and their review. They also want to see specialized magazines on education which should
have information related to career, new books, general knowledge etc. They pointed out that there
should be less advertisement and more articles in the magazines. They wanted to have mire information
on health and lifestyle.
Television
Students want to watch programmes based on general knowledge. They said they would like to watch
more programmes like KBC and man vs wild. They also want to watch more quiz shows. Some even
suggested a new channel dedicated to general awareness. They also want to have more coverage of

36
educational issues and even suggested the programmes based on annual functions should also be there
on TV. They also want to atch programmes based on horror and stunts. Comedy is the genre which is
like by almost all the students and they would like to have more comedy shows. They also suggested
that the programmes should be of short duration and carry less advertisements.
Radio
On Radio they would like to listen more of a song and less commercials. In songs they want to listen to
the latest movie songs and latest albums.
Video games
Though most of the video games are about action and thrill, students want more of such games which
are based on action, adventure, race. Besidesa these they also want to have video games based on
mathematics and other subjects which ould help them to increase their knowledge while playing.

37
KEY FINDINGS
• Contrary to the belief that the students spend less time in physical activities now a days it was
through the study discovered that except eight percent of the students rest all get involved in physical
activities which involve running exercising, playing outdoor etc. The time spent in outdoor activities
more or large remains the same throughout the week with twenty seven percent students spending
30min-1hr followed by 25 percent who spend more than three hours in physical activities. Twenty four
percent spend from 5-30 minutes in physical activities. Five percent spend more than three hours.
• Most of the students students have TV at home ( 98%) out of which 88% had cable connection.
This is followed by computer as 81 percent of students have computer at home and seventy two percent
had internet connection. Seventy nine percent have radio while 81% and 69 percent students have DVD
player and CD player respectively. Sixty three percent of the students own video game player.
• Sixty two percent of the students have computer in their rooms while fifty three percent
students have TV in their bedroom and forty percent have radio. Other technologies though not in large
number as compared to TV, Radio and computer have also entered into the private space of the
students.
• Fifty percent of the students have their personal MP3, forty nine percent have mobile, thirty
percent have Video Game player, twenty two percent have their personal laptop and ten percent have
their own Walkman whereas twenty two percent of students do not have any personal media devices.
• Sixty four percent of the students used mobile phone primarily to make calls, forty five percent
used it for messaging, twenty five percent used it for playing games, twenty three for listening music,
eleven percent for clicking photographs and for taking video and nine percent also used it to access
internet.
• Students are using mobile phones for various purposes. The frequency of using it for various
reasons varies. Most often students use the mobile phones for listening music and playing games.
Sometimes they use it to take pictures but they rarely take videos. Most of the students said that
mobiles are never used for accessing internet, visit social networking sites and to watch TV shows and
videos.
• Thirty nine percent did not sent any message followed by fifteen percent of respondents who
said that they sent less than ten messages in a day. There were students who sent messages ranging
from 10-50 and also more than 50 but those students are very few in numbers.

38
• According to thirty eight percent of the students there are rules in place regarding usage of
mobiles whereas forty seven percent said there are no rules followed in their family regarding the usage
of mobiles. The rules include Control in time, Call only with permission, No use during study and
examination, Not allowed to access internet, Control on earphones. Though the rules were in place in
many households but only thirty three percent of thr huseholds strictly follow the rules.
• Time devoted to reading books and Magazines is quite low amongst the students. While
majority of them i.e. 38.1 percent spend 5-30 minutes in reading magazine. Thirty percent of them said
that they do not read magazines. While eleven percent read from 30 min-1hour, only two percent of
them read from 1 to 3 hours. The readers who read from 1-3 hours is quite less.
• Brunch, Hindustan Times supplement was their favourite magazine, followed by Readers Digest
and India Today. Of the younger lot champak and twinkle is their favorite. Students also like niche
magazines like Top gear, auto car and Digit.
• Seventy-five percent of students read newspaper. Majority of the students (55.5) read
newspaper from 5-30 minutes every day. Nineteen percent of them read from 30 min to I hour. Just two
percent read it for longer duration i.e. more than an hour. Eleven percent of the students do not read
newspaper at all. Average newspaper reading time for the students is from 5-30 minutes.
• Time of India is their favorite newspaper came followed by Hindustan Times, Navabharat Times,
Hindu, Mail Today and Indian Express. Their favorite newspaper supplements are Delhi Times, HT city,
Hello Delhi and Education Times.
• On an average forty five percent of students spend 1-3 hours in reading books. These books
include both their school textbooks as well as other books. Sixteen percent of students spend 4-6 hrs in
reading books. Four percent spend around 7-9 hrs and just one percent reads 10-12 hrs a day. Strangely,
a big number around twenty two percent said that they did not read any book in the past seven days.
• While the books Harry Potter, Diary of a Wimpy Kid, hardy boys, Nancy Drew by foreign authors
were quite popular amongst Indian authors the recent bestsellers by the Chetan Bhagat were quite
popular amongst students. In addition Champak, lotpot, Tintin, and the books by RK Narayan and
Premchand were students’ favorite.
• 34% of students spend 1 to 3 hours on TV, 29% spend30 min to 1 hr, 16% watch TV for 5 to 30
minutes. Around 20 percent watch more than 6 hours and around five percent do not watch TV at all.
• Students like the programmes which fall in the four major categories:Adventure ( this includes
both reality shows and also the fiction), Cartoon Shows, Reality Shows ( songs, comedy, dance) Soap
operas. Man Vs Wild, stood out as their favourite programme followed by CID, a Sony TV programme .
Students in the age category 8-10 like cartoon a lot. The cartoon shows which students watch are Ben 10
Shin chan Tom & Jerry Phineas and Ferb, Oggy and cockroaches and Students like soap operas which

39
are based on comedy. Tarak Mehta ka ulta chasma followed by how I met your mother, friends & Two
and a half men on star world were their favourite programmes.
• 73% students watch TV while having their food.
• 49 % say they do not watch even a single movie in a week thirty five percent atched I movie and
five percent of students watch two mivies in a week . 3 idiots was their favourite movie followed by
Harry Potter. Unlike books for which their inclination is towards foreign author for movies they prefer to
watch film produced in India. Though they have some favorites, when it comes to English movies but
hindi movies outweighs the foreign ones.
• Average time in playing video games is relatively low if compared with other media. While
tracking their media consumption habit vis a vis video games thirty four percent say they do not play
video games. Strangely but thirty four percent did not respond to the question. Out of remaining thirty
two percent who play video games, thirteen percent spend 5-30 min on playing video games. Eight
percent spend 1-3 hours and eight percent spend 30 minutes to one hour.
• For those who do not own Video games 18% of them still play the games by visiting game
parlors and at their friends place. Playing video games are quite engrossing hence out of those who play
video games 44 % did not do any other activity while paying games. 36% do get involve with other
activities while playing video game.
• Action based Video Games are the most preferred. The GTA is their favourite series of game
which is based on crime. Other than this other games which are liked by the students are: Burnout, The
Prince of Persia, Contra, The Teenage Mutant Ninja Turtles, God of ,Road Rash, Sniper, Angry Birds, Pac-
Man , Need for Speed, Call of Duty , Counter-Strike, Forza, Crysis Transformers, Underworld, Halo,
DIRT,Circus. These games are based on action and thrill and revolves around fighting, revenge, weapons
and racing.
• Thirty six percent students report they spend 5-30 minutes in listening music. Twenty three
percent spend 30 min to I hour , twelve percent spend 1 to 3 hrs while about five percent spend more
than 3 hrs. Around 11 % do not listen to the music at all. There are number of devices available to listen
to the music. When asked about various devices, sixty percent say they listen music through radio, 15 %
said they listen to music CD player, Students also use their cellphones to listen to music when asked 58%
said yes they use cell phones to listen to music. Listening music through I pod / MP3 is also catching up
as 44 percent said they do use I pod for listening to music. Half of the students say they do not listen to
music while working with other medium but 48 percent said they do listen to music when they are with
other medium.
• Out of all, 63% students use computer whereas 30 % do not use it at all. Regarding the time
spent on computer 25% of students who use computers use it for 30 min – I hr 22% use it for 5-30
minutes, 11% use it for 1-3 hrs, 6 % use it more than 3 hrs whereas twenty two percent do not use
computer at all.

40
• Forty nine percent of students have internet at home whereas 34% do not have internet facility
at home. Regarding the internet facility available in school 92 % said they do not have access to internet
at school and only one percent said they do have internet facility at school.The students who do not
have internet access at home and also at school were asked whether they access internet at any other
place than home and school, 84 percent say no while 9 percent said yes they use internet at cyber café
or at friends place.
• Students use computers for various purposes which includes doing homework, playing games,
Messaging, emailing, reading newspaper and magazines online, doing graphics which includes photo
editing, social networking , visiting various websites to watch or upload video. Out of all these activities
according to the usage they spend most of the time on doing school work, followed by social networking
and playing games.
• When asked about their engagement with other media while working on computer thirty 35 %
say they do not get engaged with other media while the remaining 57 % do get involved with other
medium
• Out of those who access internet 68% of them downloaded music from internet 58% watched
video on you tube or Google tube, 56% visited social networking site, 51% created their profile on social
networking site, 52 percent used it for chatting, 55% got information from internet on health issue that
affect them or their relative, 41% watched video on the internet from a computer, 40 % read a blog,
20% posted a video to a site like youtube, 14 percent of them tried their hand in writing a blog, 17. 5
listened to radio through internet. The internet is mainly used by the students to download music
followed by watching video, visiting social networking site, chatting, getting information on health issue.
• Despite the fact that there is lot of concern over the kind of media consumption 53% parents do
not have any media rules whereas 42 % follow a kind of rule at their home which mainly includes
restriction on the time spent on TV and computer and on certain type of programmes. Out of those 42
% who do have media rules at home 21 percent said that though the rules exist but they are not
followed at all 13 % follow very little , 25 % follow those rules some of the time only 12 % households
follow the media rules strictly.
• Majority of them seems to be satisfied with the content in Newspaper, Magazines, Radio and
Television with 48 percent being satisfied, 38 percent being somewhat satisfied as they have some
reservations regarding some of the programmes. Only six percent of students are not at all satisfied with
the content.
• When asked what kind of content they would like to see in newspapers students emphasized
that there should be more variety of information. They want to see more of sports news, information on

41
latest technology and the issues concerning young people like new games for children, academic news,
news related to health, comic strips and dedicated section for students. Students also pointed out that
that there should be less coverage of negative news, murder and crime and suggest the newspaper
should carry more of a positive story.
• In magazines students want to see more of technology related magazine which should cover
stories like new gadgets and their review. They also want to see specialized magazines on education
which should have information related to career, new books, general knowledge etc. They pointed out
that there should be less advertisement and more articles in the magazines. They wanted to have more
information on health and lifestyle.
• Students want to watch programmes based on general knowledge. They said they would like to
watch more programmes like KBC and Man vs Wild. They also want to watch more quiz shows. Some
even suggested a new channel dedicated to general awareness. They also want to have more coverage
of educational issues and even suggested the programmes based on annual functions should also be
there on TV. They also want to watch programmes based on horror and stunts. Comedy is the genre
which is like by almost all the students and they would like to have more comedy shows. They also
suggested that the programmes should be of short duration and carry fewer advertisements.
• On Radio they would like to listen more of a song and less commercials. In songs they want to
listen to the latest movie songs and latest albums.
• Though most of the video games are about action and thrill, students want more of such games
which are based on action, adventure, race. Besides these they also want to have video games based on
mathematics and other subjects which could help them to increase their knowledge while playing.

42
Copyright © 2022 FDOKUMEN