Consumer Choices and Habits Related to Coffee ...
21
International Journal of Environmental Research and Public Health Article Consumer Choices and Habits Related to Coffee Consumption by Poles Ewa Czarniecka-Skubina 1, * , Marlena Pielak 1 , Piotr Salek 1 , Renata Korzeniowska-Ginter 2 and Tomasz Owczarek 3 Citation: Czarniecka-Skubina, E.; Pielak, M.; Salek, P.; Korzeniowska-Ginter, R.; Owczarek, T. Consumer Choices and Habits Related to Coffee Consumption by Poles. Int. J. Environ. Res. Public Health 2021, 18, 3948. https:// doi.org/10.3390/ijerph18083948 Academic Editor: Paul B. Tchounwou Received: 26 February 2021 Accepted: 7 April 2021 Published: 9 April 2021 Publisher’s Note: MDPI stays neutral with regard to jurisdictional claims in published maps and institutional affil- iations. Copyright: © 2021 by the authors. Licensee MDPI, Basel, Switzerland. This article is an open access article distributed under the terms and conditions of the Creative Commons Attribution (CC BY) license (https:// creativecommons.org/licenses/by/ 4.0/). 1 Department of Food Gastronomy and Food Hygiene, Institute of Human Nutrition Sciences, Warsaw University of Life Sciences (WULS), Str. Nowoursynowska 166, 02-787 Warsaw, Poland; [email protected] (M.P.); [email protected] (P.S.) 2 Department of Quality Management, Gdynia Maritime University, Str. Morska 81-87, 81-225 Gdynia, Poland; [email protected] 3 Department of Management and Economics, Gdynia Maritime University, Str. Morska 81-87, 81-225 Gdynia, Poland; [email protected] * Correspondence: [email protected]; Tel.: +48-(22)-593-7063 Abstract: Coffee is one of the most popular drinks consumed in the world, also in Poland. In the literature, much attention is paid to the influence of coffee on human health, especially daily intake of caffeine, and also purchasing consumer behavior. There is a lack of research devoted to consumer choices and habits in relation to coffee consumption and brewing method. Therefore, the aim of this study is to describe the characteristics of coffee consumers and present their segmentation based on consumer choices and habits towards coffee consumption. The study was performed using the computer-assisted web interviewing (CAWI) method on a group of 1500 adults respondents in Poland reporting the consumption of coffee. We collected information about consumer choices and habits related to coffee consumption, including brewing method, place of consuming coffee, and factors determining coffee choices. Using cluster analysis, we identified three main groups of coffee consumers. There are “Neutral coffee drinkers”, “Ad hoc coffee drinkers”, and “Non-specific coffee drinkers”. The respondents in the study are not coffee gourmets; they like and consume coffee, but these are often changing choices. To conclude, it can be stated that the Polish coffee consumer prefers conventional methods of brewing coffee (like a “traditionalist”) but is open to novelties and new sensory experiences. Based on study results it is possible to know the coffee drinking habits in Poland. Keywords: coffee; consumer habits; coffee brewing; Poles 1. Introduction Coffee is the second most traded commodity in the world. In 2017–2018, the global production of coffee beans from around 60 countries reached approximately 9513 million tones, and achieved USD 200 billion annually [1,2]. In 2018–2019, the consumption of coffee beans was over 165 million 60-kg packages [3]. It is estimated that 500 billion cups of coffee are consumed every day [4]. According to available sources, the highest coffee consumption in Europe is in Scandinavia at approximately 10 kg of coffee per capita per year. In Finland is 12 kg per capita per year; in Norway, 9.9 kg; in Iceland, 9 kg; in Denmark, 8.7 kg, and in Sweden, 8.2 kg. In other European countries, coffee consumption is lower, in Netherlands—8.4 kg, Switzerland—7.9 kg, Belgium—6.8 kg, and Luxembourg—6.5 kg [1]. In Poland, coffee consumption is an average of 2.2–3 kg per capita per year [5]. Many studies [6–11] concentrate on the effects of coffee on the body and health, es- pecially disease risk, and daily intake of caffeine with coffee [12–14]. Coffee, apart from the unique, characteristic taste and aroma, contains caffeine, and several antioxidants, including chlorogenic acid, lignan, melanoids, cafestrol, trigonelline, and kahweol, which Int. J. Environ. Res. Public Health 2021, 18, 3948. https://doi.org/10.3390/ijerph18083948 https://www.mdpi.com/journal/ijerph
-
Upload
khangminh22 -
Category
Documents
-
view
0 -
download
0
Transcript of Consumer Choices and Habits Related to Coffee ...
International Journal of
Environmental Research
and Public Health
Article
Consumer Choices and Habits Related to Coffee Consumptionby Poles
Ewa Czarniecka-Skubina 1,* , Marlena Pielak 1, Piotr Sałek 1 , Renata Korzeniowska-Ginter 2
and Tomasz Owczarek 3
�����������������
Citation: Czarniecka-Skubina, E.;
Pielak, M.; Sałek, P.;
Korzeniowska-Ginter, R.; Owczarek,
T. Consumer Choices and Habits
Related to Coffee Consumption by
Poles. Int. J. Environ. Res. Public
Health 2021, 18, 3948. https://
doi.org/10.3390/ijerph18083948
Academic Editor: Paul B. Tchounwou
Received: 26 February 2021
Accepted: 7 April 2021
Published: 9 April 2021
Publisher’s Note: MDPI stays neutral
with regard to jurisdictional claims in
published maps and institutional affil-
iations.
Copyright: © 2021 by the authors.
Licensee MDPI, Basel, Switzerland.
This article is an open access article
distributed under the terms and
conditions of the Creative Commons
Attribution (CC BY) license (https://
creativecommons.org/licenses/by/
4.0/).
1 Department of Food Gastronomy and Food Hygiene, Institute of Human Nutrition Sciences,Warsaw University of Life Sciences (WULS), Str. Nowoursynowska 166, 02-787 Warsaw, Poland;[email protected] (M.P.); [email protected] (P.S.)
2 Department of Quality Management, Gdynia Maritime University, Str. Morska 81-87, 81-225 Gdynia, Poland;[email protected]
3 Department of Management and Economics, Gdynia Maritime University, Str. Morska 81-87,81-225 Gdynia, Poland; [email protected]
* Correspondence: [email protected]; Tel.: +48-(22)-593-7063
Abstract: Coffee is one of the most popular drinks consumed in the world, also in Poland. In theliterature, much attention is paid to the influence of coffee on human health, especially daily intakeof caffeine, and also purchasing consumer behavior. There is a lack of research devoted to consumerchoices and habits in relation to coffee consumption and brewing method. Therefore, the aim of thisstudy is to describe the characteristics of coffee consumers and present their segmentation basedon consumer choices and habits towards coffee consumption. The study was performed usingthe computer-assisted web interviewing (CAWI) method on a group of 1500 adults respondentsin Poland reporting the consumption of coffee. We collected information about consumer choicesand habits related to coffee consumption, including brewing method, place of consuming coffee,and factors determining coffee choices. Using cluster analysis, we identified three main groups ofcoffee consumers. There are “Neutral coffee drinkers”, “Ad hoc coffee drinkers”, and “Non-specificcoffee drinkers”. The respondents in the study are not coffee gourmets; they like and consume coffee,but these are often changing choices. To conclude, it can be stated that the Polish coffee consumerprefers conventional methods of brewing coffee (like a “traditionalist”) but is open to novelties andnew sensory experiences. Based on study results it is possible to know the coffee drinking habitsin Poland.
Keywords: coffee; consumer habits; coffee brewing; Poles
1. Introduction
Coffee is the second most traded commodity in the world. In 2017–2018, the globalproduction of coffee beans from around 60 countries reached approximately 9513 milliontones, and achieved USD 200 billion annually [1,2]. In 2018–2019, the consumption ofcoffee beans was over 165 million 60-kg packages [3]. It is estimated that 500 billion cupsof coffee are consumed every day [4]. According to available sources, the highest coffeeconsumption in Europe is in Scandinavia at approximately 10 kg of coffee per capita peryear. In Finland is 12 kg per capita per year; in Norway, 9.9 kg; in Iceland, 9 kg; in Denmark,8.7 kg, and in Sweden, 8.2 kg. In other European countries, coffee consumption is lower, inNetherlands—8.4 kg, Switzerland—7.9 kg, Belgium—6.8 kg, and Luxembourg—6.5 kg [1].In Poland, coffee consumption is an average of 2.2–3 kg per capita per year [5].
Many studies [6–11] concentrate on the effects of coffee on the body and health, es-pecially disease risk, and daily intake of caffeine with coffee [12–14]. Coffee, apart fromthe unique, characteristic taste and aroma, contains caffeine, and several antioxidants,including chlorogenic acid, lignan, melanoids, cafestrol, trigonelline, and kahweol, which
Int. J. Environ. Res. Public Health 2021, 18, 3948. https://doi.org/10.3390/ijerph18083948 https://www.mdpi.com/journal/ijerph
Int. J. Environ. Res. Public Health 2021, 18, 3948 2 of 21
may show a protective effect at the cellular level. The ingredients contained in the cof-fee infusion are responsible for many beneficial processes that take place in the humanbody [14–34]. Excessive, long-term consumption of caffeine (above 500–600 mg daily) maylead to addiction and many negative symptoms from the body but also show that coffeebecomes a risk factor for various diseases while consume above five number of cups perday [35–43].
Many studies [44–49] focus on the coffee markets, including purchasing consumerbehavior and quantified consumption, as well as sustainable development and ethical con-sumption in line with the principles of fair trade. Few data [47,50–55] concern consumptionmotives, consumer behavior, and preferences as to the method of coffee brewing or aspectsrelated to the proper preparation of the infusion. Coffee is considered a high-quality food.In the minds of consumers, consumption of coffee is more and more often equated withpleasure and positive experiences and is related to lifestyle and social status. Various stud-ies confirm that drinking a cup of coffee is associated with a personal moment of pleasurefor the consumer [56–58], and characterize coffee as: pleasure, health, and sustainabledevelopment [59].
The mentioned previous studies concern on habits, changes in consumer behaviorand preferences related to coffee, marketing aspects, and also related to the impact onhealth, without addressing “technological” issues connected with preparing and consumecoffee infusions. The topic of coffee research is related to the cultural and geographiccontext in which it is conducted [52–55,60]. In Western economies, a lot of emphasis isplaced on issues of sustainable development, including fair trade. In Asia, an importantaspect is mainly the behavior and preferences of consumers in relation to café brands orconsumption of coffee products [61]. Consumer habits related to choose the coffee brewmethods are also changing with technological development. Studies among Europeanconsumers [62] indicate that they use different coffee preparation methods. Italians, Swiss,and Portuguese use espresso machines: fully automated, capsule, and drip coffee maker.While Germans mainly use a filter coffee makers to brew coffee. In turn, in the South Africafoodservice market espresso based coffee dominate [63].
Coffee drinking habits, methods of coffee infusion, coffee amount consumed, andadditive use in coffee are differentiated between countries and population [57,64–69].Although much research on coffee has been published, there is still a lack of researchrelated to the technological practices of coffee preparation. The available results do notcover the topic in such a comprehensive way as our research, and they refer to the topicin a different context. This study fills this research gap. Coffee is one of the most populardrinks in Poland. Over 80% of adult Poles consume coffee regularly and 60% of adultPoles drink it every day [70,71]. Its price is relatively low, from USD 1.65 (PLN 6.09) per250 g in 2010, rising to about USD 1.86 (PLN 7.54) for 250 g in 2019 [72]. Drinking coffee isbecoming a lifestyle. It is also encouraged by the changing coffee market in Poland, wherethere is an increasing prevalence of cafe chains. The largest coffee shop chains, such asTchibo, McCafé, Starbucks, and Costa Coffee, are increasing the number of their outlets allover Europe, including in Poland [1].
The Polish coffee market is worth about PLN 6 billion per year, of which about halfis household expenditure [73], which indicates buying coffee by consumers for homepreparation. Polish consumers buy coffee beans more often (30% of households). At thesame time, their interest in instant coffee is decreasing—in 2014–2019 by 13% in terms ofvalue and by 14% in terms of quantity. This is likely due to the increase in the purchasingof domestic coffee machines. In terms of the sale of coffee machines in the first half of 2020,Poles became the fourth market in Europe in terms of value, after Germany, France, andthe Netherlands. A significant proportion (60.8%) of the coffee machines purchased inPoland are automatic machines, which in 2020 accounted for 92% of the value of the wholecoffee machine market [74]. The consequence of this was an increase in the coffee beansegment by 28.4% [75]. The market for coffee capsule machines, and thus the demand forcoffee capsules, is also growing [76]. The COVID-19 pandemic may also have contributed
Int. J. Environ. Res. Public Health 2021, 18, 3948 3 of 21
to the increase in the sales of automatic coffee machines, and thus the increase of demandfor coffee beans in 2020.
Therefore, this research aimed to analyze Polish consumer habits towards coffeeconsumption and their choices connected with coffee, as well as factors influence on choosekind, brand, and method of preparation of the coffee infusion. The second aim of thisstudy was to identify, describe, and compare consumer segments based on differences inindividual choices and habits related to coffee consumption.
2. Materials and Methods2.1. Questionnaire
The questionnaire structure is presented in Table 1. The questionnaire consists of twoparts, of which the first part consists of 14 questions relating to coffee consumption andconsumer habits with coffee. The questions concern consumer preferences, decisive factorsfor purchasing, the frequency of coffee consumption, and the method of preparing coffeeinfusions. The second part of the questionnaire relates to the respondent’s sociodemo-graphic details—gender, age, education, dwelling place. The questionnaire was designedbased on the literature. Questions in questionnaire were based on previous studies: Q1,Q2, Q4, Q12, Q13, Q14 [50]; Q1, Q3, Q5, Q6, Q14 [51]; Q6, Q11, Q12, Q13 [77]; Q2, Q11 [78];Q1, Q13 [79]; and Q7, Q8, Q9, Q10 [80,81].
Table 1. Questionnaire structure.
Question Answer Options
Q1. How often do you drink coffee (one cup of coffee)?Choose the answer that suits you the best (only one
option).
(1) once a day; (2) twice a day; (3) three or four times a day; (4) threeor four times a week; (5) once a week; (6) three times a month; (7)
once a month; (8) never (if respondents choose this answer, they endthe questionnaire)
Q2. What kind of coffee do you like usually drink?
(1) roasted coffee beans; (2) grain coffee (from cereals); (3)decaffeinated coffee; (4) ground roasted coffee (coffee powder); (5)
flavored coffee; (6) instant coffee; (7) low-acid coffee; (8) coffeebeverages
Q3. What brands of coffee do you choose most often? Please list: Nescafe, Tchibo, Jacobs, Segafredo, Lavazza, MK Café,Maxwell House, Pedros, Woseba, Astra, other (please specify)
Q4. How do you drink your coffee? (1) black, unsweetened; (2) with sugar; (3) with sugar substitutes(sweetener); (4) with milk; (5) with cream; (6) other (please specify)
Q5. Is the method of preparation of the coffee infusionimportant to you? (1) yes; (2) no; (3) sometimes
Q6. How do you brew your coffee?
(1) in a drip coffee maker; (2) flooded with boiling water in a cup orglass; (3) in a French press coffee maker; (4) cold brew method; (5) in
a pressure coffee machine; (6) in a moka pot; (7) percolator coffeemaker; (8) AeroPress coffee maker; (9) I don’t brew coffee
Q7. How long do you brew your coffee? (1) <3 min; (2) 3 min; (3) 4 min; (4) 5 min; (5) 6 min; (6) I do not payattention to the brewing time
Q8. What type of water do you use to prepare theinfusion?
(1) tap water from the mains water supply; (2) filtered water; (3)oligocene water; (4) mineral water still
Q9. How many spoons of coffee do you use for brewing(per cup)?
(1) “more or less”; (2) according to the recommendations on the coffeepackage; (3) other; (4) 1–1.5 teaspoons; (5) 2–2.5 teaspoons;
(6) 3–4 teaspoons; (7) 5 teaspoons or more; (8) a measuring cup for acoffee machine, capsules.
Q10. At what temperature do you brew your coffee? (1) 100 ◦C; (2) 93 ◦C; (3) 98 ◦C; (4) I don’t pay attention to it
Int. J. Environ. Res. Public Health 2021, 18, 3948 4 of 21
Table 1. Cont.
Question Answer Options
Q11. What kind of coffee drink do you prefer?
(1) Americano—a type of coffee drink prepared by diluting anespresso with hot water; (2) espresso—strong coffee brewed in anespresso machine, served in a small cup; (3) cappuccino—espresso
with hot, strongly frothed milk (with a fluffy foam); (4) iced coffee; (5)latte—espresso with a lot of hot, gently frothed milk or lattemacchiato—hot milk, espresso, and a fluffy foam; (6) caffé
mocha—espresso served with hot milk and dark or milk chocolate;(7)other (please specify)
Q12. What do you appreciate the most about the quality ofcoffee you drink? (1) color; (2) flavor; (3) aroma; (4) appearance; (5) coffee strength
Q13. When I buy coffee, I usually take into consideration:13.1: Price; 13.2: Quality; 13.3: Brand;
13.4: Packaging (attractiveness, information);13.5: Friends’ opinions;
13.6: Presentation on a shelf in a store;13.7: Promotion; 13.8: Habits; 13.9: Advertisement; 13.10:
Flavor (taste and aroma); 13.11: Convenience; 13.12:Health reasons; 13.13: Others (please specify)
Choose a comment for each statement (Likert scale):(1) Definitely do not agree;
(2) Do not agree;(3) I tend to disagree;
(4) Undecided;(5) I tend to agree;
(6) Agree;(7) Definitely agree
Q14. Where do you drink your coffee? Choose theanswers that suits you the best.
(1) at home; (2) in canteens; (3) in a café; (4) at friends’, familymembers’ homes; (5) at work
Sociodemographic data:Gender:
Choose the right answer:(1): women; (2): men;
Age: (1): 18–25 years old; (2): 26–30 years old; (3): 31–40 years old;(4):41–50 years old; (5): 51–65 years old
Education: (1): vocational or primary school; (2): secondary school;(3): higher education (university);
Dwelling place:
(1): city over 100,000 inhabitants;(2): city between 50,000–100,000 inhabitants;(3): city between 10,000–50,000 inhabitants;
(4): city below 10,000 inhabitants and village;
The questionnaire was assessed by determining its repeatability. The reliability of thequestionnaire was validated using its internal consistency. Cronbach’s alpha test was usedto measure internal consistency and reliability. Cronbach alpha coefficient was above 0.74,which indicated acceptable internal consistency. Therefore, the questionnaire and scaleused is valid.
2.2. Data Collection
The Computer-Assisted Web-based Interviewing (CAWI) method was used to collectall data. The survey was conducted on a group of 1500 adult respondents in Poland thatreported the consumption of coffee.
Inclusion criteria of respondents for study were as follows:
1. Each respondent in age between 18 to 65 years old of who agreed to participate in thesurvey was invited to complete the questionnaire.
2. Everyone consuming the coffee.
The exclusion criterion of respondents was people who do not consume coffee.This paper were designed as a study with a convenience sampling.The respondents completed an online questionnaire. A link to the questionnaire in
Polish language Google Forms format was sent via Facebook, WhatsApp®, e-mail, andstudents forum. A questionnaire provided on a webpage increases the sense of anonymityand gives an opportunity to participate in the study at a time convenient for the respondent,and in time of pandemic COVID-19 was very useful.
Int. J. Environ. Res. Public Health 2021, 18, 3948 5 of 21
The questionnaire was validated by means of a pilot study with 20 people. All prob-lems were identified, for example, unintelligible questions and questionnaire construction,as well as the lack of response request, which can lead to omitted answer for some questions.Then the questionnaire was completed and amended.
It was estimated on a pilot test that it would take each participant around 10–12 min tocomplete the form. Each adult respondent who agreed to take part in the study was invitedto fill in the questionnaire. The respondents were free to participate in the research. Becausethe research was non-invasive and the details of the participants remained undisclosed,the research does not fall within the remit of the Helsinki Declaration.
2.3. Characteristics of Respondents
The characteristics of the respondents are presented in Table 2. The study involvedmainly women, with secondary or higher education, living in different types of dwellingplaces. The respondents were in the range of 18–65 years old, who had access to a computer,the Internet, and had computer literacy skills.
Table 2. Characteristics of the surveyed sample of respondents.
Population Features Group Number ofRespondents (n)
Percentage ofRespondents (%)
Total – 1500 100.0
Genderwomen 1049 69.9
men 451 30.1
Age
18–25 years old 435 29.026–30 years old 239 15.931–40 years old 258 17.241–50 years old 312 20.851–65 years old 256 17.1
Education
vocational or primaryschool 165 11.0
secondary school 605 40.3higher education
(university) 730 48.7
Dwelling place
city over 100,000inhabitants 646 43.1
city between50,000–100,000
inhabitants)212 14.1
city between10,000–50,000
inhabitants396 26.4
city below 10,000inhabitants and
village246 16.4
2.4. Data Analysis
The statistical analysis of the results was performed using Statistica software (version13.3 PL; StatSoft Inc., StatSoft, Krakow, Poland). The ANOVA test was used. Significanceof differences between the values was determined at a significance level of p < 0.05.
A multi-dimensional cluster analysis calculation was performed to coffee consumerclassifications. Segmentation was performed using the hierarchical (connectivity-based)clustering. Specifically, the agglomeration clustering method and k-means clusteringmethod were used. The analysis was aimed at creating groups of respondents with ahomogeneous approach to the purchase and consumption of coffee.
The measure of similarity used in cluster analysis is the distance in a multidimensionalcoordinate system. This distance can be defined in many different ways. All the variables
Int. J. Environ. Res. Public Health 2021, 18, 3948 6 of 21
are therefore categorical, most on the nominal scale and some on the ordinal scale. For thisreason, the analysis uses a measure called percent discrepancy, which is the quotient of thenumber of dimensions with inconsistent values and the number of all dimensions. Whenstudying distances between clusters of multiple elements, it is also necessary to establish amethod for calculating the distances of clusters. The analysis used the complete linkagemethod, also known as the farthest neighborhood method. The distance between clustersis the distance of the farthest elements of both clusters. After separating the clusters, itwas examined whether they really differentiate the studied group. For this purpose, theAnalysis of Variance (ANOVA) test with the significance level p < 0.05 was used. For allclusters, the means and medians were calculated for all variables [82,83].
The analysis consisted of three stages. In the first stage, the system of variables (ques-tions) was reduced. Using the agglomeration method, variables with similar values werecombined into clusters, and then all questions were removed from this cluster, leaving onerepresentative. This allows to eliminate from the study questions that are highly correlatedand carry the same information, without losing overall information. In the second stage,clusters of cases (respondents) were built using the agglomeration method. The purpose ofthis stage is to determine the optimal number of clusters. Due to the extremely difficultinterpretation of the obtained results, it was decided to create as few reasonable clusters aspossible. In the third stage, the elements were finally assigned to clusters using the k-meansclustering method and the properties of the obtained communities were analyzed. Due tothe large number of numerical values, the article does not present detailed values of themeasures and test statistics used, but only the conclusions obtained from them, confirmedby graphs.
3. Results3.1. Type of Coffee Consumed by Respondents
Respondents primarily choose instant coffee (50.9% of respondents), ground roastedcoffee (45.9%), and roasted coffee beans (37%). A significant percentage of respondentsalso choose grain coffee (17.7%), coffee beverages (13.1%), and flavored coffee (11.5%). Fewpeople reported a consumption of decaffeinated coffee (7.7%) or low-acid coffee (1.3%).
The choice of the type of coffee correlated with age, education, and dwelling place(p < 0.05). Roasted coffee beans were significantly more often chosen by people aged18–25 years, with higher education, and living in cities with above 100,000 inhabitants,while ground roasted coffee was chosen by people aged 31–40 years. Young people(18–25 years of age) significantly more often drink flavored coffee and coffee beverages thanothers group of consumer. People aged 25–30 years and inhabitants of rural areas consumedgrain coffee significantly more often. In turn off, people aged 51–65, with secondaryeducation, and living in cities up to 100,000 inhabitants more often drink instant coffee.
Among the coffee brands, the respondents most often chose Jacobs (44% of indications),Nescafe (36.8%), Tchibo (30.9%), MKCafe (34.9%), and Lavazza (28.4%). Less frequentlymentioned were Maxwell House (8.7%), Prima (8.1%), Segafredo (6.8%), and Pedro’s (6.1%).Other brands were mentioned by less than 1% of the respondents. The large variety ofcoffee brands on the market means that everyone will find something for themselves, andthe choice of the brand depends on consumer preferences.
3.2. The Frequency and Place of Coffee Consumption
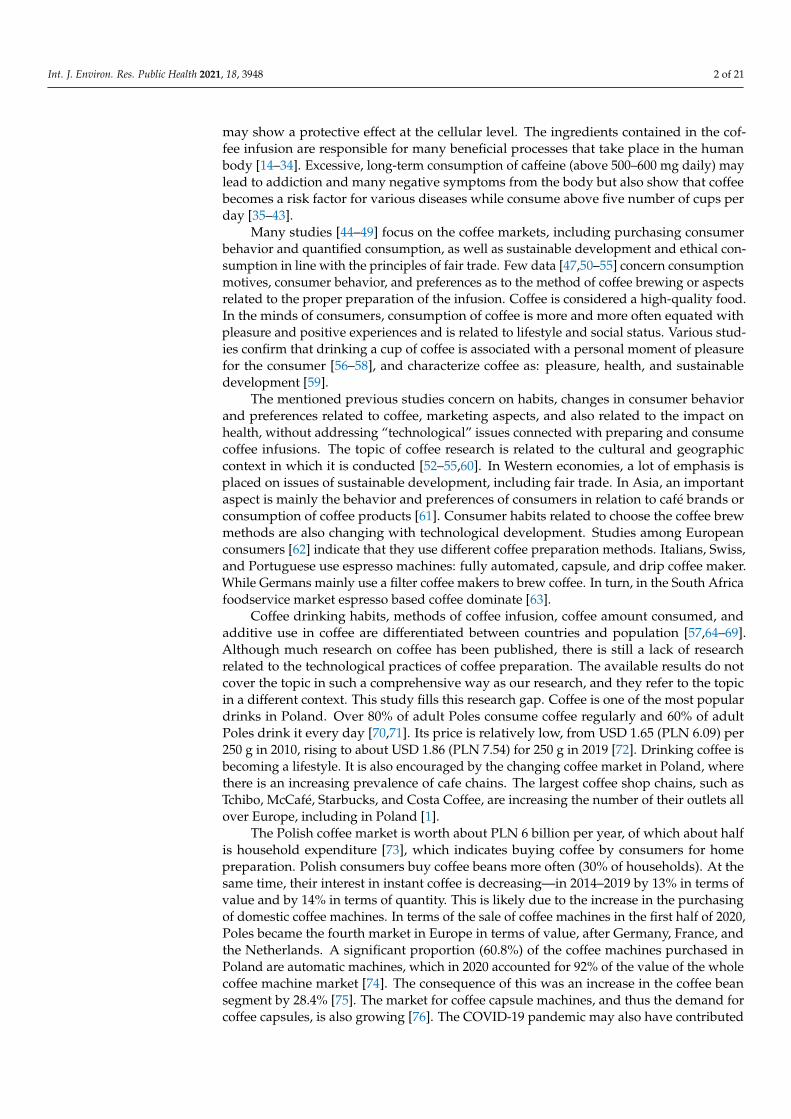
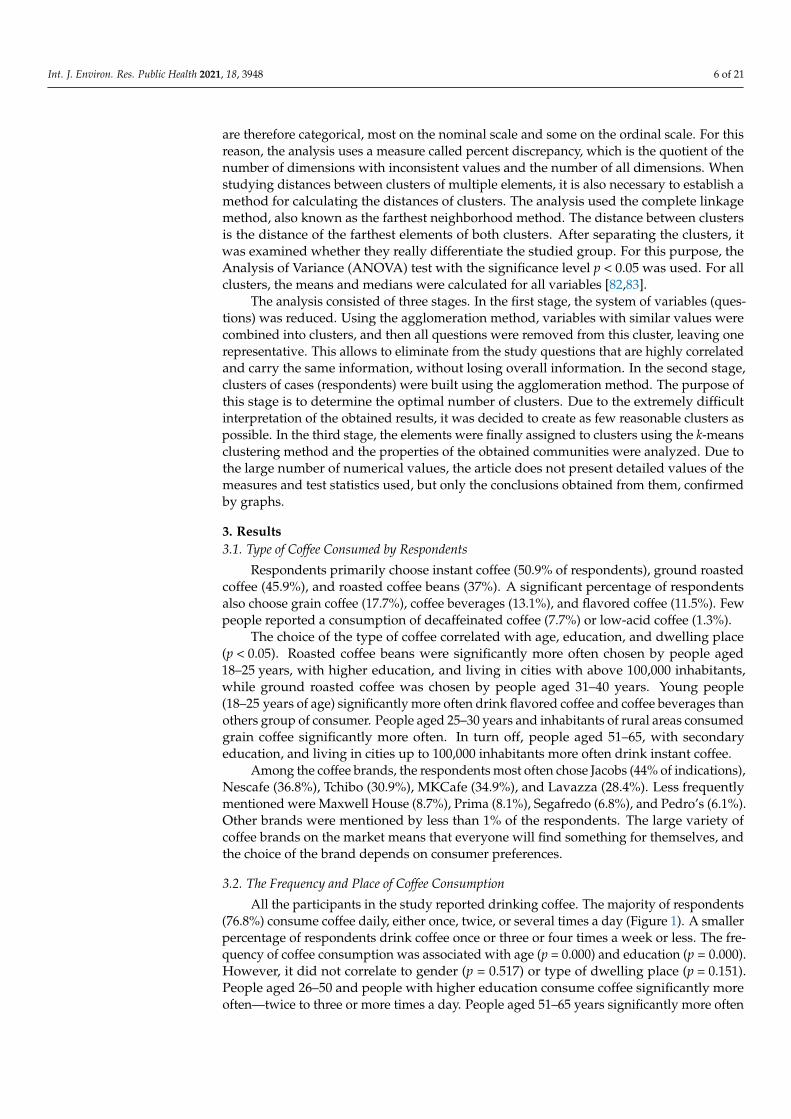
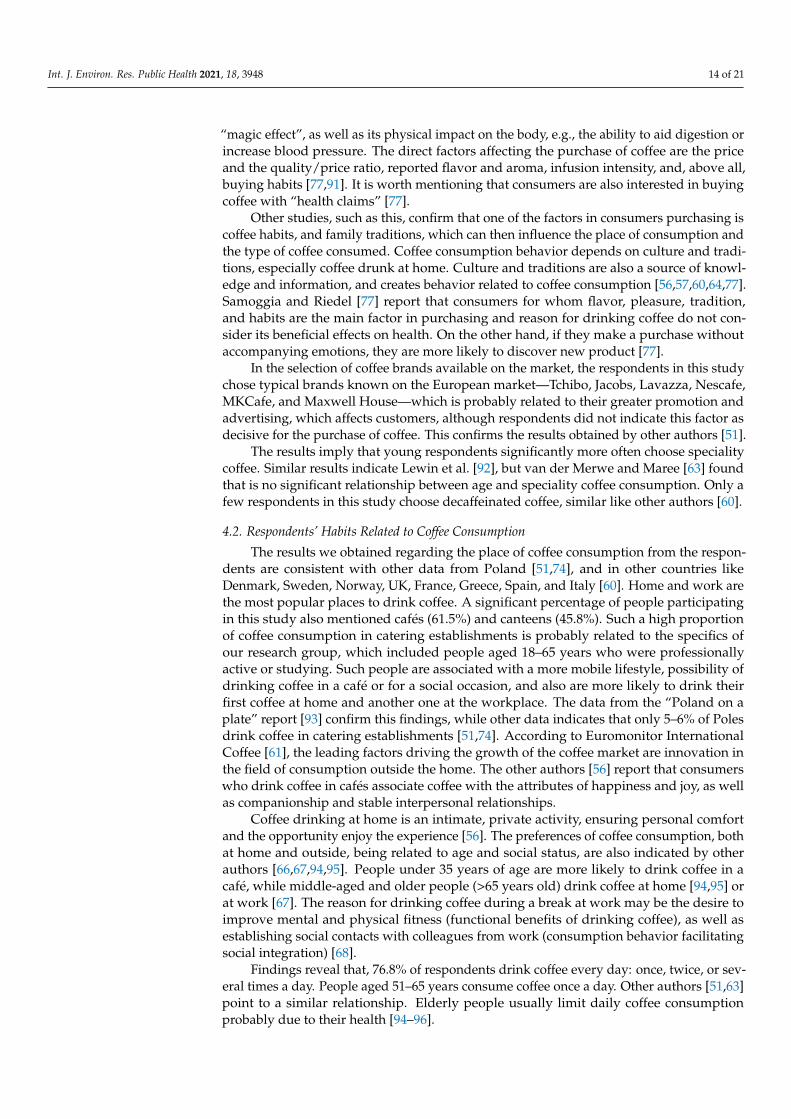
All the participants in the study reported drinking coffee. The majority of respondents(76.8%) consume coffee daily, either once, twice, or several times a day (Figure 1). A smallerpercentage of respondents drink coffee once or three or four times a week or less. The fre-quency of coffee consumption was associated with age (p = 0.000) and education (p = 0.000).However, it did not correlate to gender (p = 0.517) or type of dwelling place (p = 0.151).People aged 26–50 and people with higher education consume coffee significantly moreoften—twice to three or more times a day. People aged 51–65 years significantly more often
Int. J. Environ. Res. Public Health 2021, 18, 3948 7 of 21
reported coffee consumption once a day, and people aged 18–25 years significantly moreoften declared coffee consumption once a week or rarely.
Int. J. Environ. Res. Public Health 2021, 18, x FOR PEER REVIEW 7 of 20
Figure 1. Frequency of consumption coffee by respondents.
The respondents most often drink coffee at home (95.5%) and at work (79.7%), Table 3. The choice of place to drink coffee mainly correlated with gender, age, and dwelling place. In the canteen, coffee was consumed significantly more often by people aged 18–30 years old and living in large cities above 100,000 inhabitants. Women, people aged 18–30 years, with higher education, living in big cities, significantly more often chosen other catering establishments (cafés) to consume coffee. Young people up to 30 years, women and people with higher education significantly more often drink coffee at work and with friends.
Table 3. Places of respondents drink coffee.
Place Response p-Value *
Number Percentage Gender Age Education Dwelling Place
at home 1432 95.5 NS NS NS 0.024 in canteens 687 45.8 NS 0.000 NS 0.000
in a café 922 61.5 0.006 0.000 0.0006 0.000 at friends’, family members’
homes 994 66.3 0.039 0.000 NS NS
at work 1196 79.7 NS 0.002 0.000 NS * NS—no significant, p < 0.05
3.3. Factors Affecting Coffee Purchasing The most important factors (Table 4) affecting the purchasing of coffee included qual-
ity and flavor (taste and aroma) of the coffee, as well as habits of consumers (median 5.5–6). Less important factors for the respondents are coffee price, brand, friends’ opinions, and the features of coffee such as origin, acidity, strength, or degree of roasted (median 5). The least important factors for the respondents were packaging, presentation on the shelf in the store, promotion, advertising, convenience, and coffee health aspects (median 4). The smallest differentiation of respondents’ assessments was obtained in the Conven-ience and Promotion factors. These factors were assessed as insignificant. Respondents do not pay attention to these factors. While the greatest differentiation of ratings was ob-tained for the Flavor (taste and aroma) factor. Respondents also assessed this factor as important from the point of view of purchasing coffee. For many people, this factor is extremely important, but some respondents do not pay much attention to it.
0 5 10 15 20 25 30
once a day
twice a day
three or four times a day
three or four times a week
once a week
three times a month
once a month
Percentage of respondents [%]
Freq
uenc
y of
con
sum
ptio
n a
cup
of c
offe
e
Figure 1. Frequency of consumption coffee by respondents.
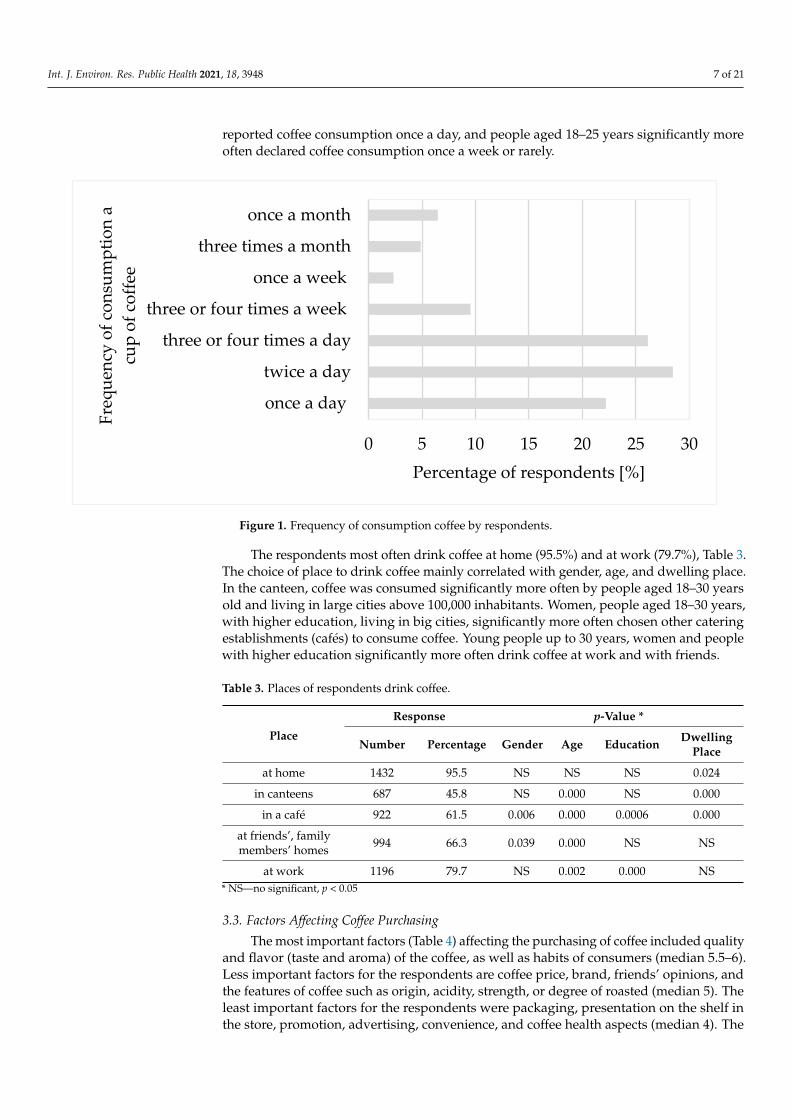
The respondents most often drink coffee at home (95.5%) and at work (79.7%), Table 3.The choice of place to drink coffee mainly correlated with gender, age, and dwelling place.In the canteen, coffee was consumed significantly more often by people aged 18–30 yearsold and living in large cities above 100,000 inhabitants. Women, people aged 18–30 years,with higher education, living in big cities, significantly more often chosen other cateringestablishments (cafés) to consume coffee. Young people up to 30 years, women and peoplewith higher education significantly more often drink coffee at work and with friends.
Table 3. Places of respondents drink coffee.
Place
Response p-Value *
Number Percentage Gender Age Education DwellingPlace
at home 1432 95.5 NS NS NS 0.024
in canteens 687 45.8 NS 0.000 NS 0.000
in a café 922 61.5 0.006 0.000 0.0006 0.000
at friends’, familymembers’ homes 994 66.3 0.039 0.000 NS NS
at work 1196 79.7 NS 0.002 0.000 NS* NS—no significant, p < 0.05
3.3. Factors Affecting Coffee Purchasing
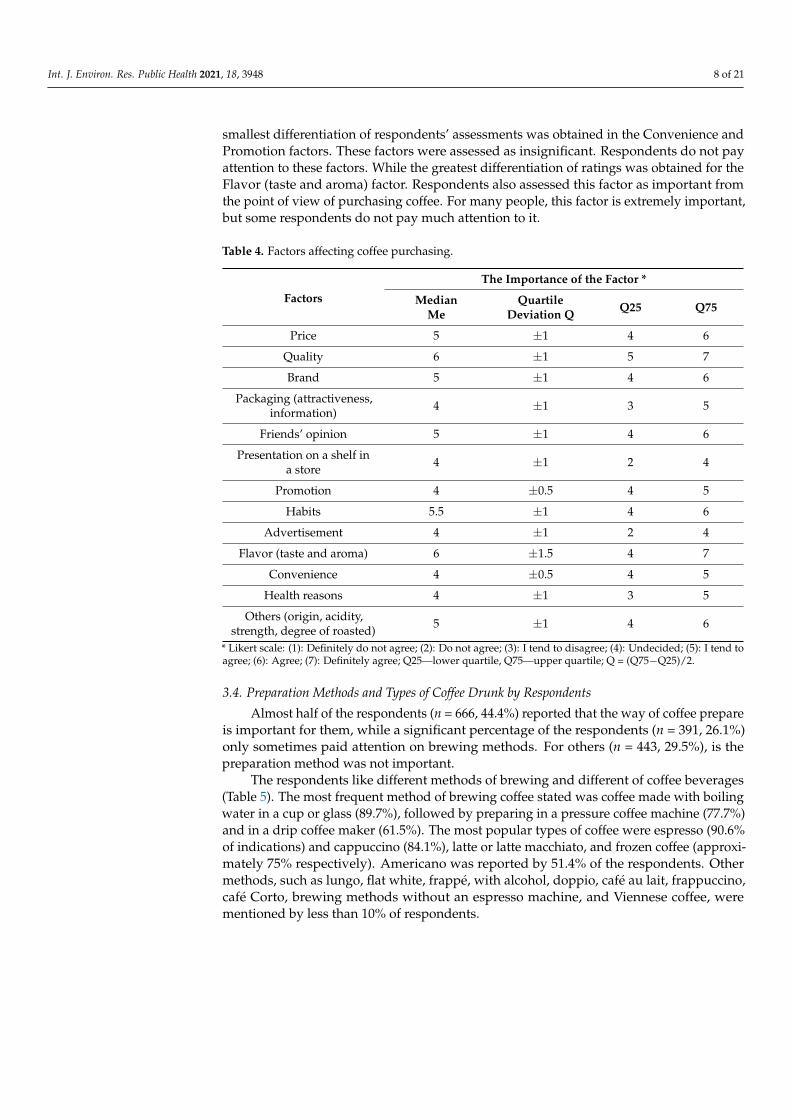
The most important factors (Table 4) affecting the purchasing of coffee included qualityand flavor (taste and aroma) of the coffee, as well as habits of consumers (median 5.5–6).Less important factors for the respondents are coffee price, brand, friends’ opinions, andthe features of coffee such as origin, acidity, strength, or degree of roasted (median 5). Theleast important factors for the respondents were packaging, presentation on the shelf inthe store, promotion, advertising, convenience, and coffee health aspects (median 4). The
Int. J. Environ. Res. Public Health 2021, 18, 3948 8 of 21
smallest differentiation of respondents’ assessments was obtained in the Convenience andPromotion factors. These factors were assessed as insignificant. Respondents do not payattention to these factors. While the greatest differentiation of ratings was obtained for theFlavor (taste and aroma) factor. Respondents also assessed this factor as important fromthe point of view of purchasing coffee. For many people, this factor is extremely important,but some respondents do not pay much attention to it.
Table 4. Factors affecting coffee purchasing.
Factors
The Importance of the Factor *
MedianMe
QuartileDeviation Q Q25 Q75
Price 5 ±1 4 6
Quality 6 ±1 5 7
Brand 5 ±1 4 6
Packaging (attractiveness,information) 4 ±1 3 5
Friends’ opinion 5 ±1 4 6
Presentation on a shelf ina store 4 ±1 2 4
Promotion 4 ±0.5 4 5
Habits 5.5 ±1 4 6
Advertisement 4 ±1 2 4
Flavor (taste and aroma) 6 ±1.5 4 7
Convenience 4 ±0.5 4 5
Health reasons 4 ±1 3 5
Others (origin, acidity,strength, degree of roasted) 5 ±1 4 6
* Likert scale: (1): Definitely do not agree; (2): Do not agree; (3): I tend to disagree; (4): Undecided; (5): I tend toagree; (6): Agree; (7): Definitely agree; Q25—lower quartile, Q75—upper quartile; Q = (Q75−Q25)/2.
3.4. Preparation Methods and Types of Coffee Drunk by Respondents
Almost half of the respondents (n = 666, 44.4%) reported that the way of coffee prepareis important for them, while a significant percentage of the respondents (n = 391, 26.1%)only sometimes paid attention on brewing methods. For others (n = 443, 29.5%), is thepreparation method was not important.
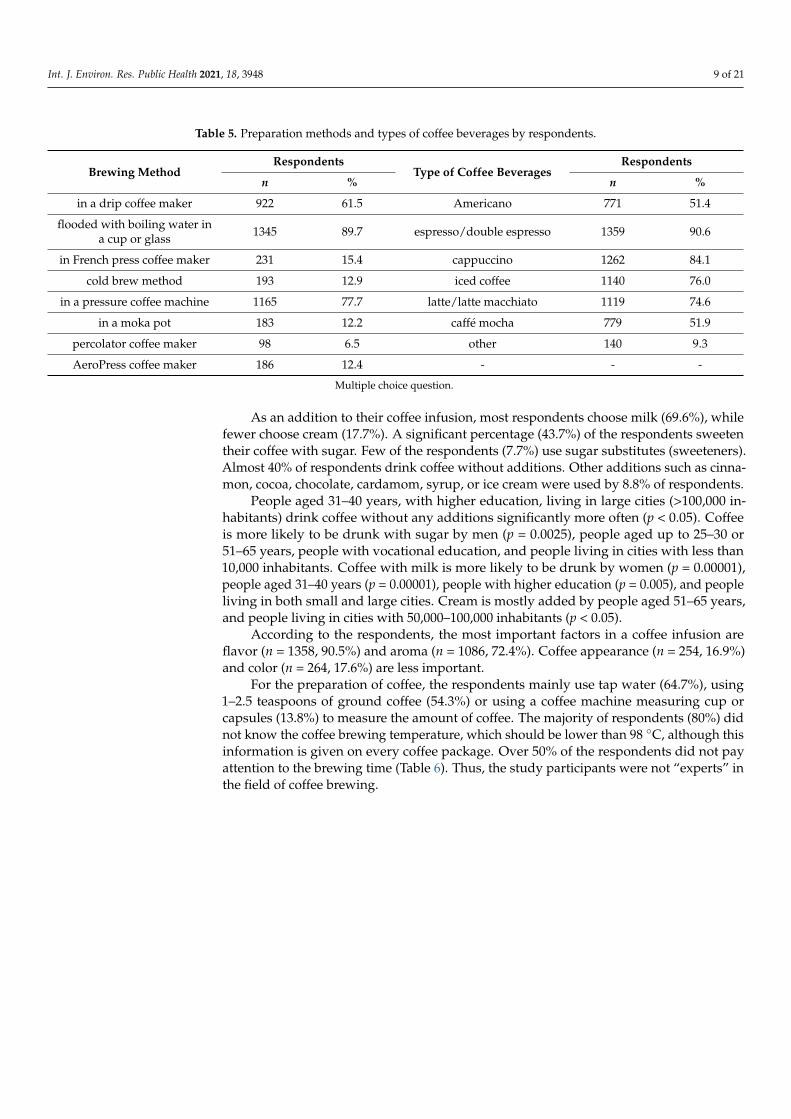
The respondents like different methods of brewing and different of coffee beverages(Table 5). The most frequent method of brewing coffee stated was coffee made with boilingwater in a cup or glass (89.7%), followed by preparing in a pressure coffee machine (77.7%)and in a drip coffee maker (61.5%). The most popular types of coffee were espresso (90.6%of indications) and cappuccino (84.1%), latte or latte macchiato, and frozen coffee (approxi-mately 75% respectively). Americano was reported by 51.4% of the respondents. Othermethods, such as lungo, flat white, frappé, with alcohol, doppio, café au lait, frappuccino,café Corto, brewing methods without an espresso machine, and Viennese coffee, werementioned by less than 10% of respondents.
Int. J. Environ. Res. Public Health 2021, 18, 3948 9 of 21
Table 5. Preparation methods and types of coffee beverages by respondents.
Brewing MethodRespondents
Type of Coffee BeveragesRespondents
n % n %
in a drip coffee maker 922 61.5 Americano 771 51.4
flooded with boiling water ina cup or glass 1345 89.7 espresso/double espresso 1359 90.6
in French press coffee maker 231 15.4 cappuccino 1262 84.1
cold brew method 193 12.9 iced coffee 1140 76.0
in a pressure coffee machine 1165 77.7 latte/latte macchiato 1119 74.6
in a moka pot 183 12.2 caffé mocha 779 51.9
percolator coffee maker 98 6.5 other 140 9.3
AeroPress coffee maker 186 12.4 - - -
Multiple choice question.
As an addition to their coffee infusion, most respondents choose milk (69.6%), whilefewer choose cream (17.7%). A significant percentage (43.7%) of the respondents sweetentheir coffee with sugar. Few of the respondents (7.7%) use sugar substitutes (sweeteners).Almost 40% of respondents drink coffee without additions. Other additions such as cinna-mon, cocoa, chocolate, cardamom, syrup, or ice cream were used by 8.8% of respondents.
People aged 31–40 years, with higher education, living in large cities (>100,000 in-habitants) drink coffee without any additions significantly more often (p < 0.05). Coffeeis more likely to be drunk with sugar by men (p = 0.0025), people aged up to 25–30 or51–65 years, people with vocational education, and people living in cities with less than10,000 inhabitants. Coffee with milk is more likely to be drunk by women (p = 0.00001),people aged 31–40 years (p = 0.00001), people with higher education (p = 0.005), and peopleliving in both small and large cities. Cream is mostly added by people aged 51–65 years,and people living in cities with 50,000–100,000 inhabitants (p < 0.05).
According to the respondents, the most important factors in a coffee infusion areflavor (n = 1358, 90.5%) and aroma (n = 1086, 72.4%). Coffee appearance (n = 254, 16.9%)and color (n = 264, 17.6%) are less important.
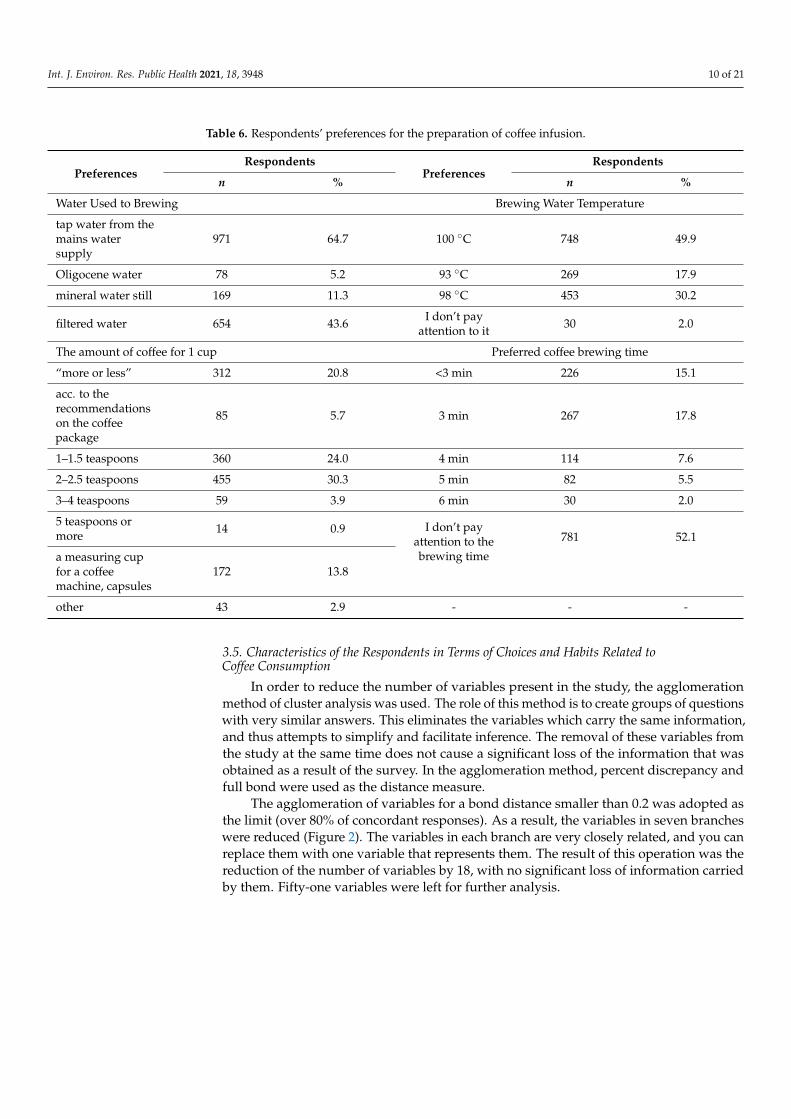
For the preparation of coffee, the respondents mainly use tap water (64.7%), using1–2.5 teaspoons of ground coffee (54.3%) or using a coffee machine measuring cup orcapsules (13.8%) to measure the amount of coffee. The majority of respondents (80%) didnot know the coffee brewing temperature, which should be lower than 98 ◦C, although thisinformation is given on every coffee package. Over 50% of the respondents did not payattention to the brewing time (Table 6). Thus, the study participants were not “experts” inthe field of coffee brewing.
Int. J. Environ. Res. Public Health 2021, 18, 3948 10 of 21
Table 6. Respondents’ preferences for the preparation of coffee infusion.
PreferencesRespondents
PreferencesRespondents
n % n %
Water Used to Brewing Brewing Water Temperature
tap water from themains watersupply
971 64.7 100 ◦C 748 49.9
Oligocene water 78 5.2 93 ◦C 269 17.9
mineral water still 169 11.3 98 ◦C 453 30.2
filtered water 654 43.6 I don’t payattention to it 30 2.0
The amount of coffee for 1 cup Preferred coffee brewing time
“more or less” 312 20.8 <3 min 226 15.1
acc. to therecommendationson the coffeepackage
85 5.7 3 min 267 17.8
1–1.5 teaspoons 360 24.0 4 min 114 7.6
2–2.5 teaspoons 455 30.3 5 min 82 5.5
3–4 teaspoons 59 3.9 6 min 30 2.0
5 teaspoons ormore 14 0.9 I don’t pay
attention to thebrewing time
781 52.1
a measuring cupfor a coffeemachine, capsules
172 13.8
other 43 2.9 - - -
3.5. Characteristics of the Respondents in Terms of Choices and Habits Related toCoffee Consumption
In order to reduce the number of variables present in the study, the agglomerationmethod of cluster analysis was used. The role of this method is to create groups of questionswith very similar answers. This eliminates the variables which carry the same information,and thus attempts to simplify and facilitate inference. The removal of these variables fromthe study at the same time does not cause a significant loss of the information that wasobtained as a result of the survey. In the agglomeration method, percent discrepancy andfull bond were used as the distance measure.
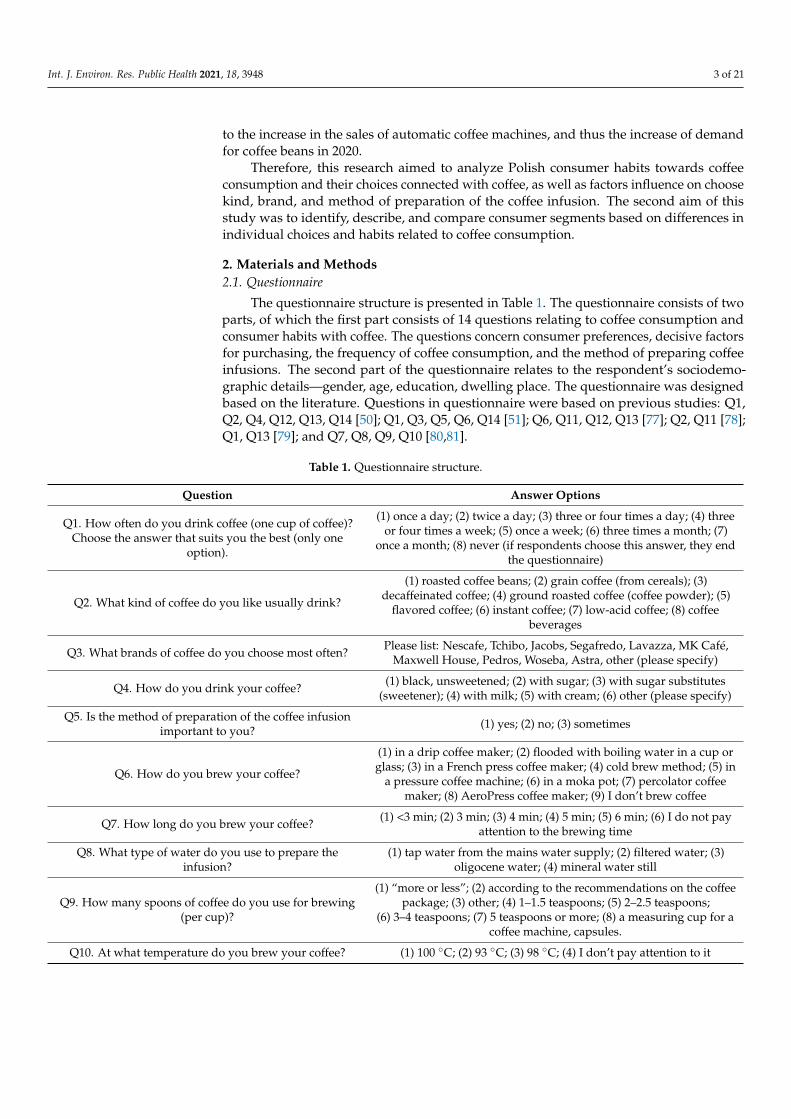
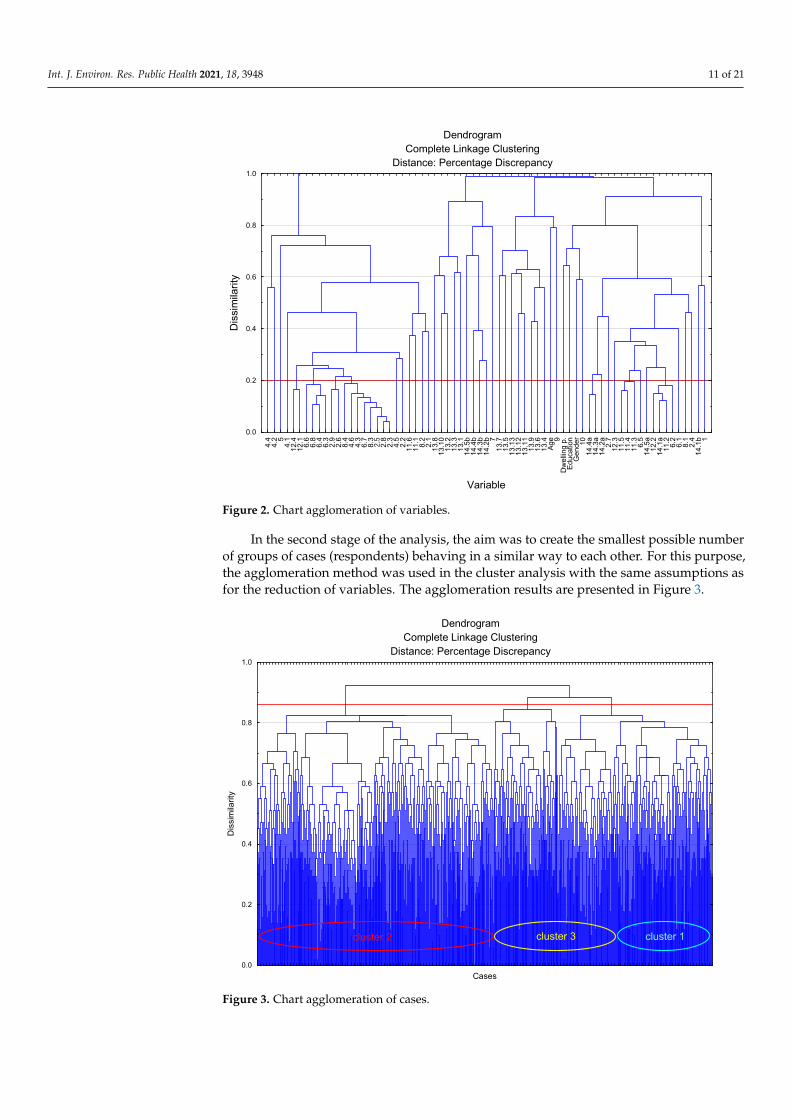
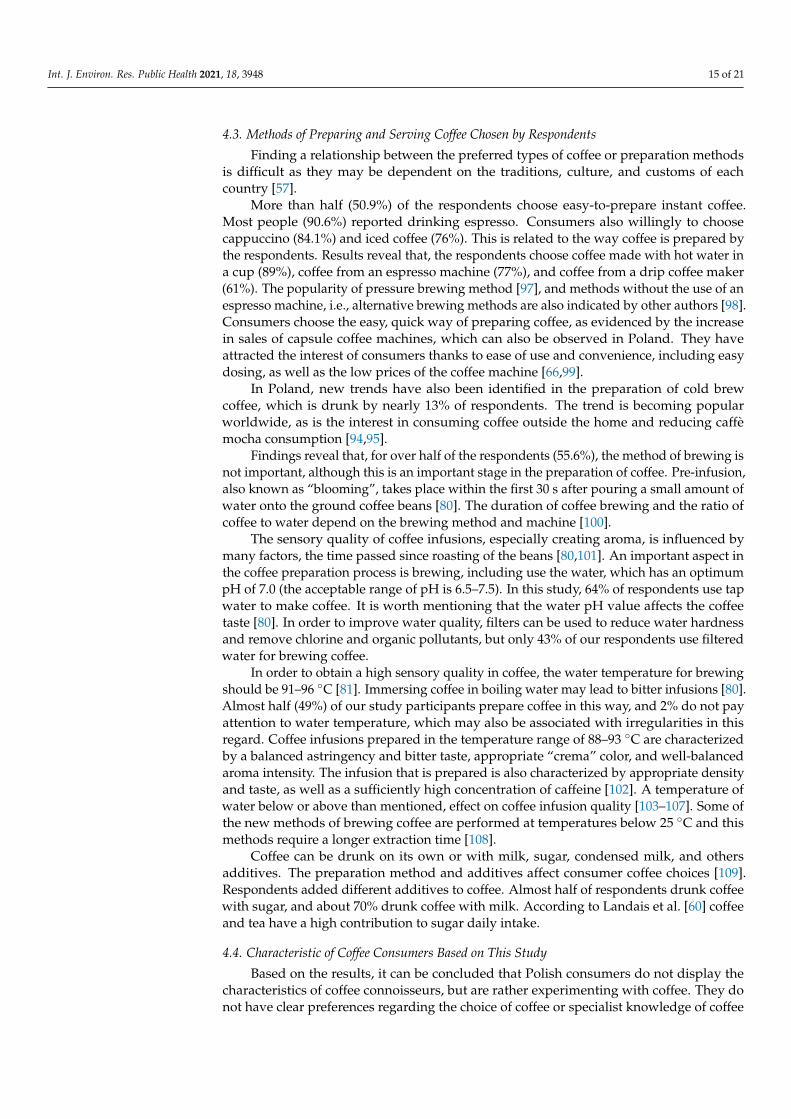
The agglomeration of variables for a bond distance smaller than 0.2 was adopted asthe limit (over 80% of concordant responses). As a result, the variables in seven brancheswere reduced (Figure 2). The variables in each branch are very closely related, and you canreplace them with one variable that represents them. The result of this operation was thereduction of the number of variables by 18, with no significant loss of information carriedby them. Fifty-one variables were left for further analysis.
Int. J. Environ. Res. Public Health 2021, 18, 3948 11 of 21
Int. J. Environ. Res. Public Health 2021, 18, x FOR PEER REVIEW 10 of 20
The agglomeration of variables for a bond distance smaller than 0.2 was adopted as the limit (over 80% of concordant responses). As a result, the variables in seven branches were reduced (Figure 2). The variables in each branch are very closely related, and you can replace them with one variable that represents them. The result of this operation was the reduction of the number of variables by 18, with no significant loss of information carried by them. Fifty-one variables were left for further analysis.
DendrogramComplete Linkage Clustering
Distance: Percentage Discrepancy
4.4
4.2 5
4.1
12.4
12.1 6.6
6.8
6.4
6.3
2.9
2.6
8.4
4.6
4.3
6.7
8.3
2.5
2.8
2.3
4.5
2.2
11.6
11.1 8.2
2.1
13.8
13.1
013
.213
.313
.114
.5b
14.4
b14
.3b
14.2
b 713
.713
.513
.13
13.1
213
.11
13.9
13.6
13.4
Age 9
Dw
ellin
g p.
Educ
atio
nG
ende
r10
14.4
a14
.3a
14.2
a2.
712
.311
.511
.411
.3 6.5
14.5
a12
.214
.1a
11.2 6.2
6.1
8.1
2.4
14.1
b 1
Variable
0.0
0.2
0.4
0.6
0.8
1.0
Dis
sim
ilarit
y
Figure 2. Chart agglomeration of variables.
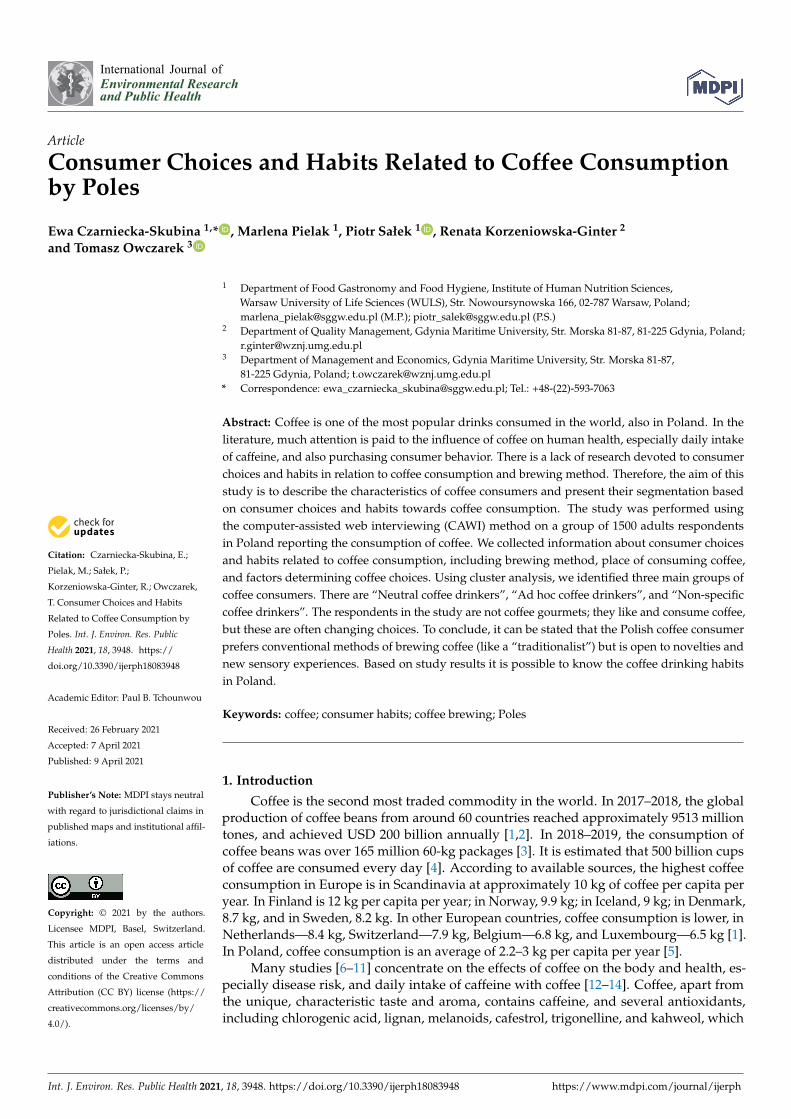
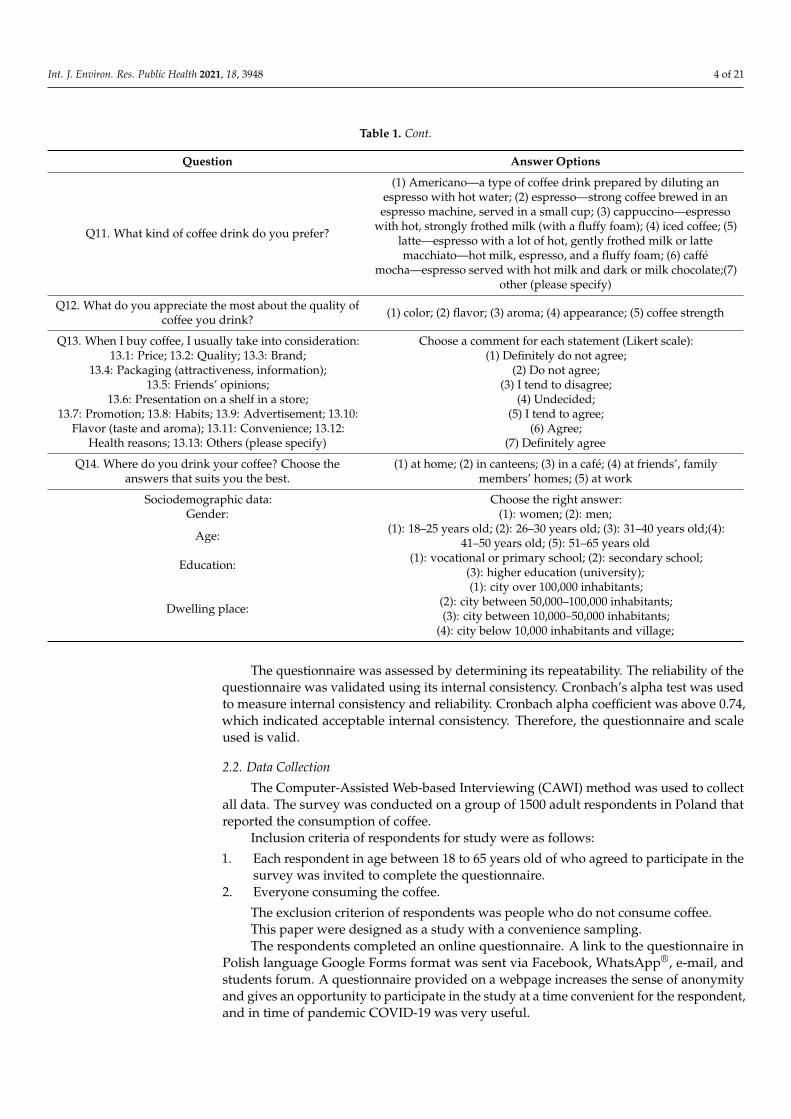
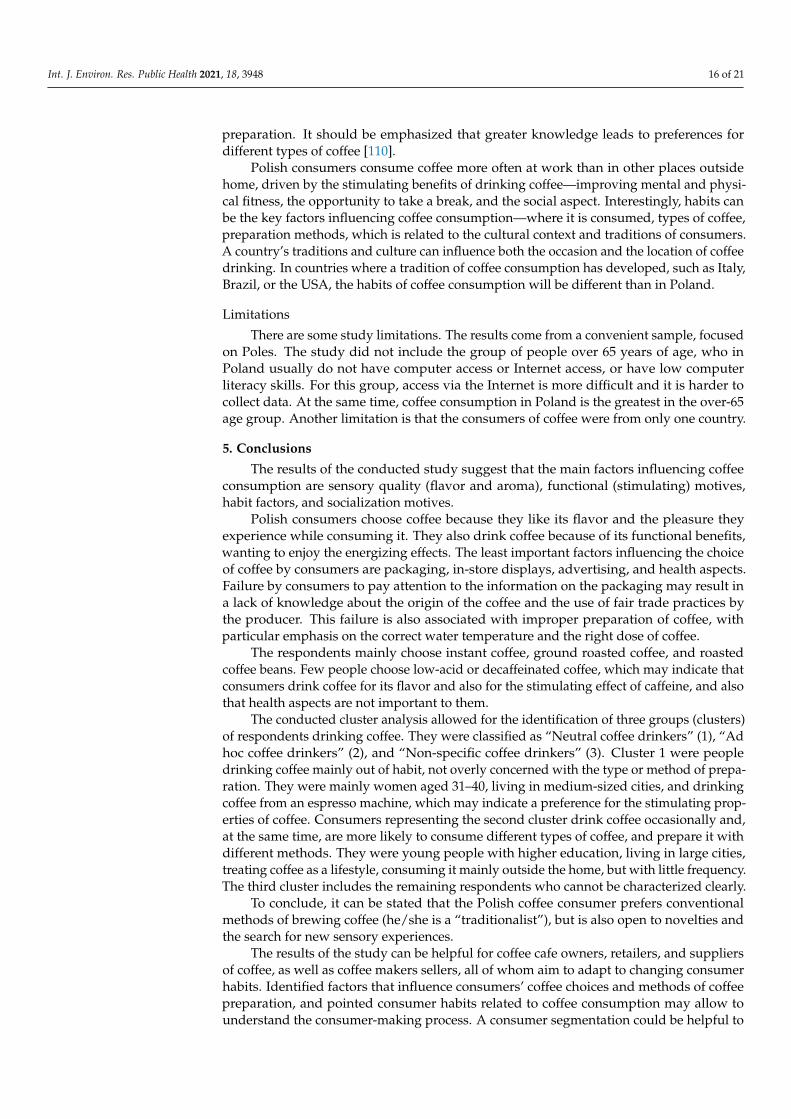
In the second stage of the analysis, the aim was to create the smallest possible number of groups of cases (respondents) behaving in a similar way to each other. For this purpose, the agglomeration method was used in the cluster analysis with the same assumptions as for the reduction of variables. The agglomeration results are presented in Figure 3.
In the agglomeration, the binding distance of 0.86 was assumed as the cut-off level (the red line in the diagram). The adopted cut-off value made it possible to distinguish three groups of respondents. The confirmation of the validity of the selection of such a cut-off level is the bond distance diagram. The distance of the mates for which the plot becomes the most vertical is taken as the cut-off level. This indicates large distances be-tween successive agglomerations and suggests the emergence of natural case groups.
Figure 2. Chart agglomeration of variables.
In the second stage of the analysis, the aim was to create the smallest possible numberof groups of cases (respondents) behaving in a similar way to each other. For this purpose,the agglomeration method was used in the cluster analysis with the same assumptions asfor the reduction of variables. The agglomeration results are presented in Figure 3.
Int. J. Environ. Res. Public Health 2021, 18, x FOR PEER REVIEW 11 of 20
DendrogramComplete Linkage Clustering
Distance: Percentage Discrepancy
Cases0.0
0.2
0.4
0.6
0.8
1.0
Dis
sim
ilarit
y
cluster 1cluster 2 cluster 3
Figure 3. Chart agglomeration of cases.
The agglomeration method made it possible to determine the optimal number of re-spondent groups. However, for the precise assignment of individual cases to each of the three groups, further analysis of these groups was performed using the k-means method of cluster analysis. The clusters of the following numbers were obtained: clusters of 1–295 cases, clusters of 2–709 cases, and clusters of 3–496 cases. The results of the analysis of variance performed for all the variables confirm the validity of the division performed. For almost all variables (except two), the proposed division significantly differentiates the community in a statistically significant manner. In other words, the mean values of almost all variables are significantly different in the three proposed groups of respondents. The values of these averages and the relations between them are shown in Figure 4.
Due to the fact that the variables are not quantitative, the obtained mean results can-not be interpreted in terms of their value, but are only an indication of the relationship between the mean values. They make it possible to assess how often the values of variables appear in one cluster compared to another cluster.
On the basis of the diagram of means, it can be concluded that for Questions 1 to 12.4, the respondents in all groups gave similar, but statistically significantly different, an-swers. It can be seen that the means for Cluster 2 usually have the highest values, and the means for Cluster 3 have the lowest values. Much larger differences are visible in the case of the answers to Questions 13 and 14.
Based on the cluster analysis, the profiles of preferences of coffee consumers were determined. Three profiles were identified: 1. “Neutral coffee drinkers”—Cluster 1, 2. “Ad hoc coffee drinkers”—Cluster 2, 3. “Non-specific coffee drinkers”—Cluster 3.
Figure 3. Chart agglomeration of cases.
Int. J. Environ. Res. Public Health 2021, 18, 3948 12 of 21
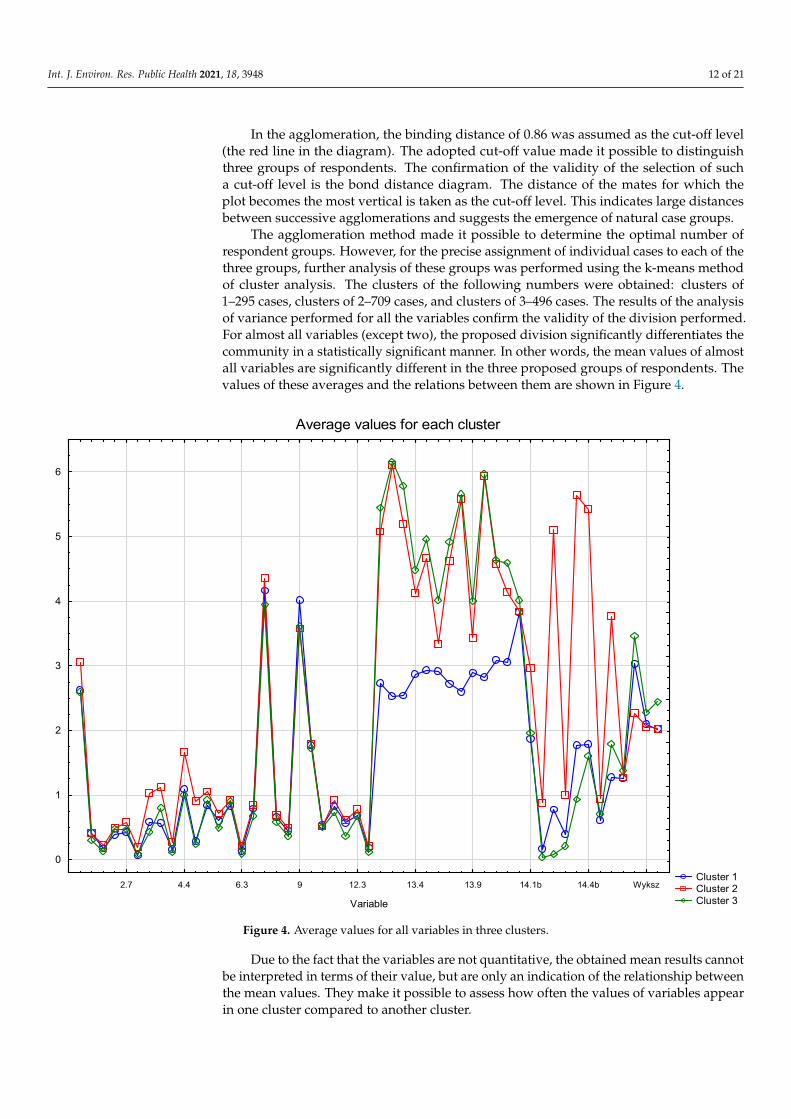
In the agglomeration, the binding distance of 0.86 was assumed as the cut-off level(the red line in the diagram). The adopted cut-off value made it possible to distinguishthree groups of respondents. The confirmation of the validity of the selection of sucha cut-off level is the bond distance diagram. The distance of the mates for which theplot becomes the most vertical is taken as the cut-off level. This indicates large distancesbetween successive agglomerations and suggests the emergence of natural case groups.
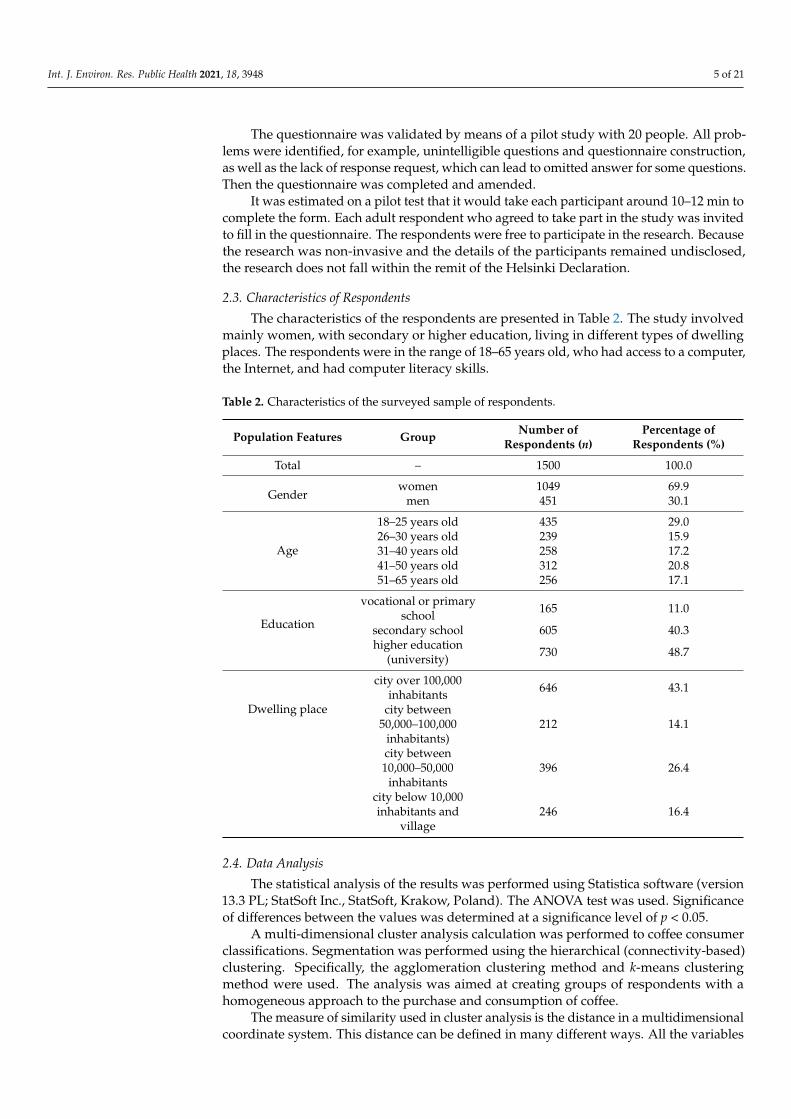
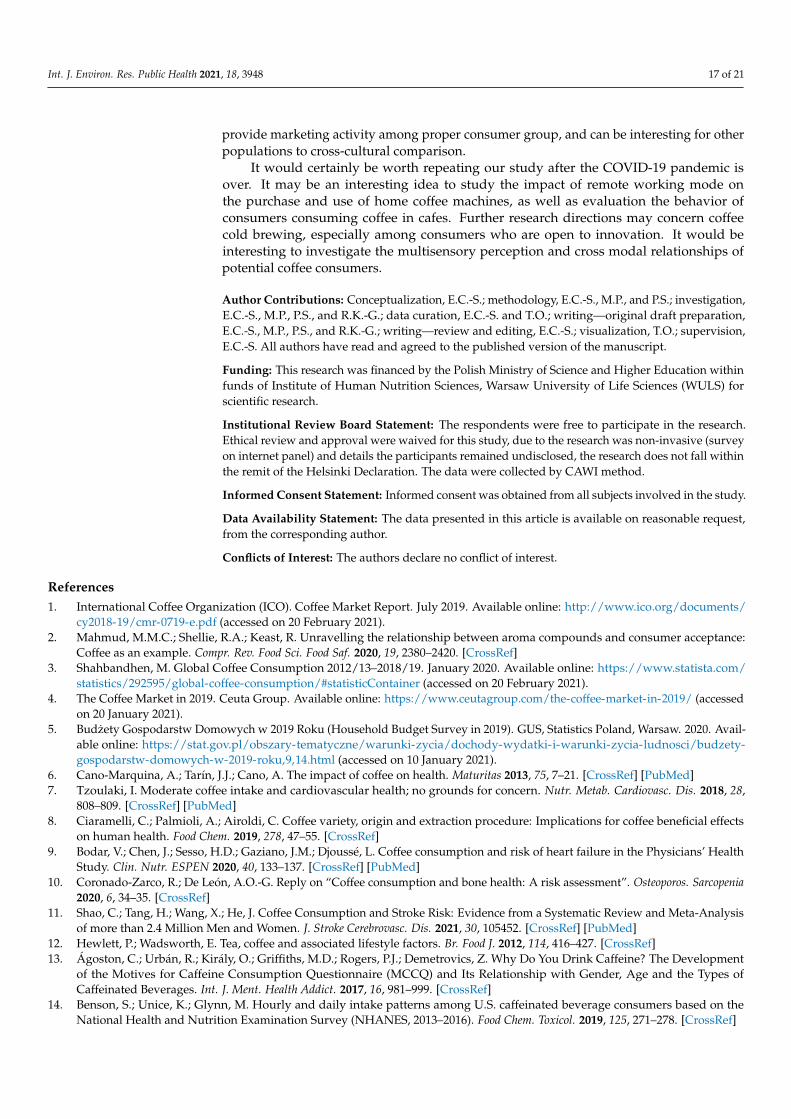
The agglomeration method made it possible to determine the optimal number ofrespondent groups. However, for the precise assignment of individual cases to each of thethree groups, further analysis of these groups was performed using the k-means methodof cluster analysis. The clusters of the following numbers were obtained: clusters of1–295 cases, clusters of 2–709 cases, and clusters of 3–496 cases. The results of the analysisof variance performed for all the variables confirm the validity of the division performed.For almost all variables (except two), the proposed division significantly differentiates thecommunity in a statistically significant manner. In other words, the mean values of almostall variables are significantly different in the three proposed groups of respondents. Thevalues of these averages and the relations between them are shown in Figure 4.
Int. J. Environ. Res. Public Health 2021, 18, x FOR PEER REVIEW 12 of 20
Average values for each cluster
Cluster 1 Cluster 2 Cluster 3
2.7 4.4 6.3 9 12.3 13.4 13.9 14.1b 14.4b Wyksz
Variable
0
1
2
3
4
5
6
Figure 4. Average values for all variables in three clusters.
When buying coffee, the respondents belonging to Cluster 1 (n = 295) were clearly less influenced than others by the factors indicated in Question 13. Taking into account that in the case of the remaining questions their average answers were usually between the answers of the other respondents, they can be characterized as people with a neutral or even indifferent attitude towards coffee. They can be characterized as “coffee drinkers” of habit: they like to drink coffee, but they do not mind what type. Representatives of this group are women, people aged 31–40 years, people with higher education, and people living in cities of 50,000–100,000 inhabitants. When buying coffee, these consumers do not pay attention to the information on the packaging, the opinions of friends, presentation on the shelf, or advertising. They drink the strongest coffee and often drink coffee from an espresso machine; quite often they drink coffee outside the home, with friends, and in canteens.
The respondents from Cluster 2 (n = 709) behaved differently. Their answers to ques-tions from the group of 14 questions indicate a much lower frequency of coffee consump-tion than others. Coffee is drunk outside the home much more often than other people. Most of the questions (except Question 13) were answered on average with the highest value. It can be stated that they drink coffee sporadically and at the same time are more likely to consume different types of coffee and prepared in more different ways than oth-ers. This would indicate a randomness in coffee consumption: they drink coffee, but with-out preferences to brewing method and type of coffee. They are young consumers, not connoisseurs, who drink coffee as part of their lifestyle. This group is mainly represented by women, people aged 25–30 years, people with higher education, and people living in large cities (over 100,000 inhabitants).
Cluster 3 (n = 496) respondents constitute the rest of the respondents and cannot be characterized in any unequivocal way. The average representative of Cluster 3 are women, people aged 41–50, people with secondary education, and people living in cities with an average size of 10–50,000 inhabitants. When buying coffee, they take into account factors similar to the ones considered by Cluster 2 consumers, and they take them into account to an average extent. However, these consumers rarely drink coffee outside their homes.
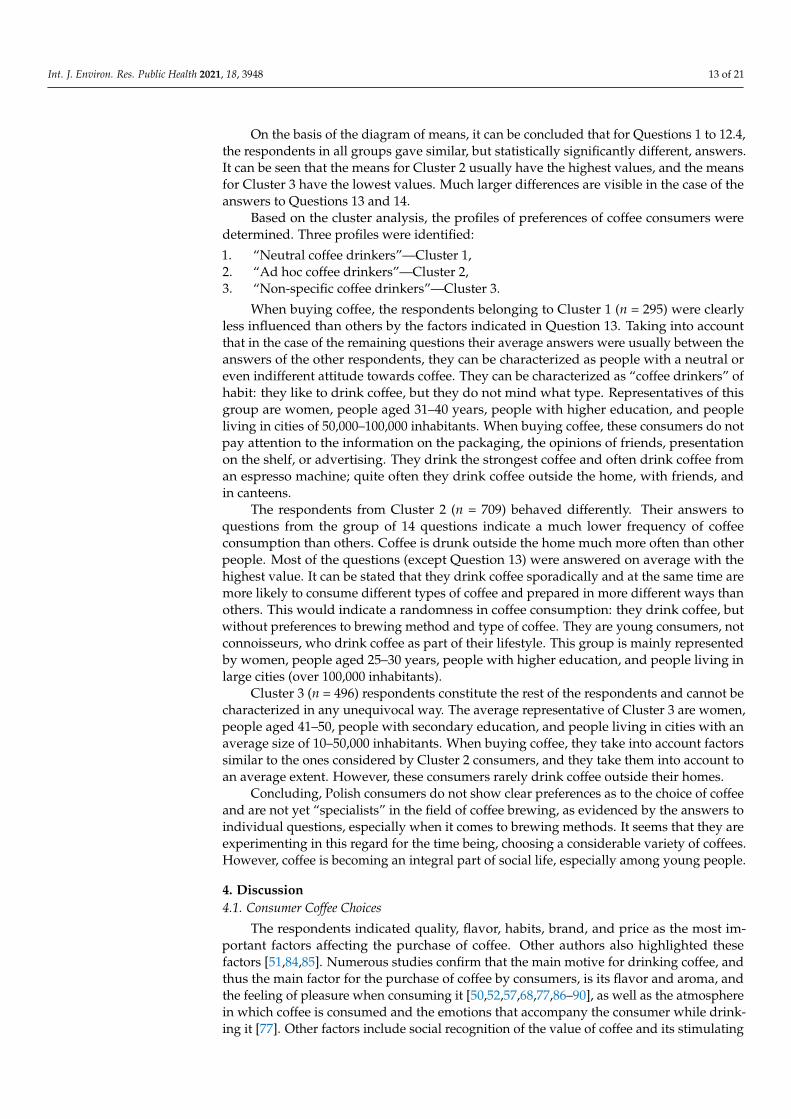
Figure 4. Average values for all variables in three clusters.
Due to the fact that the variables are not quantitative, the obtained mean results cannotbe interpreted in terms of their value, but are only an indication of the relationship betweenthe mean values. They make it possible to assess how often the values of variables appearin one cluster compared to another cluster.
Int. J. Environ. Res. Public Health 2021, 18, 3948 13 of 21
On the basis of the diagram of means, it can be concluded that for Questions 1 to 12.4,the respondents in all groups gave similar, but statistically significantly different, answers.It can be seen that the means for Cluster 2 usually have the highest values, and the meansfor Cluster 3 have the lowest values. Much larger differences are visible in the case of theanswers to Questions 13 and 14.
Based on the cluster analysis, the profiles of preferences of coffee consumers weredetermined. Three profiles were identified:
1. “Neutral coffee drinkers”—Cluster 1,2. “Ad hoc coffee drinkers”—Cluster 2,3. “Non-specific coffee drinkers”—Cluster 3.
When buying coffee, the respondents belonging to Cluster 1 (n = 295) were clearlyless influenced than others by the factors indicated in Question 13. Taking into accountthat in the case of the remaining questions their average answers were usually between theanswers of the other respondents, they can be characterized as people with a neutral oreven indifferent attitude towards coffee. They can be characterized as “coffee drinkers” ofhabit: they like to drink coffee, but they do not mind what type. Representatives of thisgroup are women, people aged 31–40 years, people with higher education, and peopleliving in cities of 50,000–100,000 inhabitants. When buying coffee, these consumers do notpay attention to the information on the packaging, the opinions of friends, presentationon the shelf, or advertising. They drink the strongest coffee and often drink coffee froman espresso machine; quite often they drink coffee outside the home, with friends, andin canteens.
The respondents from Cluster 2 (n = 709) behaved differently. Their answers toquestions from the group of 14 questions indicate a much lower frequency of coffeeconsumption than others. Coffee is drunk outside the home much more often than otherpeople. Most of the questions (except Question 13) were answered on average with thehighest value. It can be stated that they drink coffee sporadically and at the same time aremore likely to consume different types of coffee and prepared in more different ways thanothers. This would indicate a randomness in coffee consumption: they drink coffee, butwithout preferences to brewing method and type of coffee. They are young consumers, notconnoisseurs, who drink coffee as part of their lifestyle. This group is mainly representedby women, people aged 25–30 years, people with higher education, and people living inlarge cities (over 100,000 inhabitants).
Cluster 3 (n = 496) respondents constitute the rest of the respondents and cannot becharacterized in any unequivocal way. The average representative of Cluster 3 are women,people aged 41–50, people with secondary education, and people living in cities with anaverage size of 10–50,000 inhabitants. When buying coffee, they take into account factorssimilar to the ones considered by Cluster 2 consumers, and they take them into account toan average extent. However, these consumers rarely drink coffee outside their homes.
Concluding, Polish consumers do not show clear preferences as to the choice of coffeeand are not yet “specialists” in the field of coffee brewing, as evidenced by the answers toindividual questions, especially when it comes to brewing methods. It seems that they areexperimenting in this regard for the time being, choosing a considerable variety of coffees.However, coffee is becoming an integral part of social life, especially among young people.
4. Discussion4.1. Consumer Coffee Choices
The respondents indicated quality, flavor, habits, brand, and price as the most im-portant factors affecting the purchase of coffee. Other authors also highlighted thesefactors [51,84,85]. Numerous studies confirm that the main motive for drinking coffee, andthus the main factor for the purchase of coffee by consumers, is its flavor and aroma, andthe feeling of pleasure when consuming it [50,52,57,68,77,86–90], as well as the atmospherein which coffee is consumed and the emotions that accompany the consumer while drink-ing it [77]. Other factors include social recognition of the value of coffee and its stimulating
Int. J. Environ. Res. Public Health 2021, 18, 3948 14 of 21
“magic effect”, as well as its physical impact on the body, e.g., the ability to aid digestion orincrease blood pressure. The direct factors affecting the purchase of coffee are the priceand the quality/price ratio, reported flavor and aroma, infusion intensity, and, above all,buying habits [77,91]. It is worth mentioning that consumers are also interested in buyingcoffee with “health claims” [77].
Other studies, such as this, confirm that one of the factors in consumers purchasing iscoffee habits, and family traditions, which can then influence the place of consumption andthe type of coffee consumed. Coffee consumption behavior depends on culture and tradi-tions, especially coffee drunk at home. Culture and traditions are also a source of knowl-edge and information, and creates behavior related to coffee consumption [56,57,60,64,77].Samoggia and Riedel [77] report that consumers for whom flavor, pleasure, tradition,and habits are the main factor in purchasing and reason for drinking coffee do not con-sider its beneficial effects on health. On the other hand, if they make a purchase withoutaccompanying emotions, they are more likely to discover new product [77].
In the selection of coffee brands available on the market, the respondents in this studychose typical brands known on the European market—Tchibo, Jacobs, Lavazza, Nescafe,MKCafe, and Maxwell House—which is probably related to their greater promotion andadvertising, which affects customers, although respondents did not indicate this factor asdecisive for the purchase of coffee. This confirms the results obtained by other authors [51].
The results imply that young respondents significantly more often choose specialitycoffee. Similar results indicate Lewin et al. [92], but van der Merwe and Maree [63] foundthat is no significant relationship between age and speciality coffee consumption. Only afew respondents in this study choose decaffeinated coffee, similar like other authors [60].
4.2. Respondents’ Habits Related to Coffee Consumption
The results we obtained regarding the place of coffee consumption from the respon-dents are consistent with other data from Poland [51,74], and in other countries likeDenmark, Sweden, Norway, UK, France, Greece, Spain, and Italy [60]. Home and work arethe most popular places to drink coffee. A significant percentage of people participatingin this study also mentioned cafés (61.5%) and canteens (45.8%). Such a high proportionof coffee consumption in catering establishments is probably related to the specifics ofour research group, which included people aged 18–65 years who were professionallyactive or studying. Such people are associated with a more mobile lifestyle, possibility ofdrinking coffee in a café or for a social occasion, and also are more likely to drink theirfirst coffee at home and another one at the workplace. The data from the “Poland on aplate” report [93] confirm this findings, while other data indicates that only 5–6% of Polesdrink coffee in catering establishments [51,74]. According to Euromonitor InternationalCoffee [61], the leading factors driving the growth of the coffee market are innovation inthe field of consumption outside the home. The other authors [56] report that consumerswho drink coffee in cafés associate coffee with the attributes of happiness and joy, as wellas companionship and stable interpersonal relationships.
Coffee drinking at home is an intimate, private activity, ensuring personal comfortand the opportunity enjoy the experience [56]. The preferences of coffee consumption, bothat home and outside, being related to age and social status, are also indicated by otherauthors [66,67,94,95]. People under 35 years of age are more likely to drink coffee in acafé, while middle-aged and older people (>65 years old) drink coffee at home [94,95] orat work [67]. The reason for drinking coffee during a break at work may be the desire toimprove mental and physical fitness (functional benefits of drinking coffee), as well asestablishing social contacts with colleagues from work (consumption behavior facilitatingsocial integration) [68].
Findings reveal that, 76.8% of respondents drink coffee every day: once, twice, or sev-eral times a day. People aged 51–65 years consume coffee once a day. Other authors [51,63]point to a similar relationship. Elderly people usually limit daily coffee consumptionprobably due to their health [94–96].
Int. J. Environ. Res. Public Health 2021, 18, 3948 15 of 21
4.3. Methods of Preparing and Serving Coffee Chosen by Respondents
Finding a relationship between the preferred types of coffee or preparation methodsis difficult as they may be dependent on the traditions, culture, and customs of eachcountry [57].
More than half (50.9%) of the respondents choose easy-to-prepare instant coffee.Most people (90.6%) reported drinking espresso. Consumers also willingly to choosecappuccino (84.1%) and iced coffee (76%). This is related to the way coffee is prepared bythe respondents. Results reveal that, the respondents choose coffee made with hot water ina cup (89%), coffee from an espresso machine (77%), and coffee from a drip coffee maker(61%). The popularity of pressure brewing method [97], and methods without the use of anespresso machine, i.e., alternative brewing methods are also indicated by other authors [98].Consumers choose the easy, quick way of preparing coffee, as evidenced by the increasein sales of capsule coffee machines, which can also be observed in Poland. They haveattracted the interest of consumers thanks to ease of use and convenience, including easydosing, as well as the low prices of the coffee machine [66,99].
In Poland, new trends have also been identified in the preparation of cold brewcoffee, which is drunk by nearly 13% of respondents. The trend is becoming popularworldwide, as is the interest in consuming coffee outside the home and reducing caffèmocha consumption [94,95].
Findings reveal that, for over half of the respondents (55.6%), the method of brewing isnot important, although this is an important stage in the preparation of coffee. Pre-infusion,also known as “blooming”, takes place within the first 30 s after pouring a small amount ofwater onto the ground coffee beans [80]. The duration of coffee brewing and the ratio ofcoffee to water depend on the brewing method and machine [100].
The sensory quality of coffee infusions, especially creating aroma, is influenced bymany factors, the time passed since roasting of the beans [80,101]. An important aspect inthe coffee preparation process is brewing, including use the water, which has an optimumpH of 7.0 (the acceptable range of pH is 6.5–7.5). In this study, 64% of respondents use tapwater to make coffee. It is worth mentioning that the water pH value affects the coffeetaste [80]. In order to improve water quality, filters can be used to reduce water hardnessand remove chlorine and organic pollutants, but only 43% of our respondents use filteredwater for brewing coffee.
In order to obtain a high sensory quality in coffee, the water temperature for brewingshould be 91–96 ◦C [81]. Immersing coffee in boiling water may lead to bitter infusions [80].Almost half (49%) of our study participants prepare coffee in this way, and 2% do not payattention to water temperature, which may also be associated with irregularities in thisregard. Coffee infusions prepared in the temperature range of 88–93 ◦C are characterizedby a balanced astringency and bitter taste, appropriate “crema” color, and well-balancedaroma intensity. The infusion that is prepared is also characterized by appropriate densityand taste, as well as a sufficiently high concentration of caffeine [102]. A temperature ofwater below or above than mentioned, effect on coffee infusion quality [103–107]. Some ofthe new methods of brewing coffee are performed at temperatures below 25 ◦C and thismethods require a longer extraction time [108].
Coffee can be drunk on its own or with milk, sugar, condensed milk, and othersadditives. The preparation method and additives affect consumer coffee choices [109].Respondents added different additives to coffee. Almost half of respondents drunk coffeewith sugar, and about 70% drunk coffee with milk. According to Landais et al. [60] coffeeand tea have a high contribution to sugar daily intake.
4.4. Characteristic of Coffee Consumers Based on This Study
Based on the results, it can be concluded that Polish consumers do not display thecharacteristics of coffee connoisseurs, but are rather experimenting with coffee. They donot have clear preferences regarding the choice of coffee or specialist knowledge of coffee
Int. J. Environ. Res. Public Health 2021, 18, 3948 16 of 21
preparation. It should be emphasized that greater knowledge leads to preferences fordifferent types of coffee [110].
Polish consumers consume coffee more often at work than in other places outsidehome, driven by the stimulating benefits of drinking coffee—improving mental and physi-cal fitness, the opportunity to take a break, and the social aspect. Interestingly, habits canbe the key factors influencing coffee consumption—where it is consumed, types of coffee,preparation methods, which is related to the cultural context and traditions of consumers.A country’s traditions and culture can influence both the occasion and the location of coffeedrinking. In countries where a tradition of coffee consumption has developed, such as Italy,Brazil, or the USA, the habits of coffee consumption will be different than in Poland.
Limitations
There are some study limitations. The results come from a convenient sample, focusedon Poles. The study did not include the group of people over 65 years of age, who inPoland usually do not have computer access or Internet access, or have low computerliteracy skills. For this group, access via the Internet is more difficult and it is harder tocollect data. At the same time, coffee consumption in Poland is the greatest in the over-65age group. Another limitation is that the consumers of coffee were from only one country.
5. Conclusions
The results of the conducted study suggest that the main factors influencing coffeeconsumption are sensory quality (flavor and aroma), functional (stimulating) motives,habit factors, and socialization motives.
Polish consumers choose coffee because they like its flavor and the pleasure theyexperience while consuming it. They also drink coffee because of its functional benefits,wanting to enjoy the energizing effects. The least important factors influencing the choiceof coffee by consumers are packaging, in-store displays, advertising, and health aspects.Failure by consumers to pay attention to the information on the packaging may result ina lack of knowledge about the origin of the coffee and the use of fair trade practices bythe producer. This failure is also associated with improper preparation of coffee, withparticular emphasis on the correct water temperature and the right dose of coffee.
The respondents mainly choose instant coffee, ground roasted coffee, and roastedcoffee beans. Few people choose low-acid or decaffeinated coffee, which may indicate thatconsumers drink coffee for its flavor and also for the stimulating effect of caffeine, and alsothat health aspects are not important to them.
The conducted cluster analysis allowed for the identification of three groups (clusters)of respondents drinking coffee. They were classified as “Neutral coffee drinkers” (1), “Adhoc coffee drinkers” (2), and “Non-specific coffee drinkers” (3). Cluster 1 were peopledrinking coffee mainly out of habit, not overly concerned with the type or method of prepa-ration. They were mainly women aged 31–40, living in medium-sized cities, and drinkingcoffee from an espresso machine, which may indicate a preference for the stimulating prop-erties of coffee. Consumers representing the second cluster drink coffee occasionally and,at the same time, are more likely to consume different types of coffee, and prepare it withdifferent methods. They were young people with higher education, living in large cities,treating coffee as a lifestyle, consuming it mainly outside the home, but with little frequency.The third cluster includes the remaining respondents who cannot be characterized clearly.
To conclude, it can be stated that the Polish coffee consumer prefers conventionalmethods of brewing coffee (he/she is a “traditionalist”), but is also open to novelties andthe search for new sensory experiences.
The results of the study can be helpful for coffee cafe owners, retailers, and suppliersof coffee, as well as coffee makers sellers, all of whom aim to adapt to changing consumerhabits. Identified factors that influence consumers’ coffee choices and methods of coffeepreparation, and pointed consumer habits related to coffee consumption may allow tounderstand the consumer-making process. A consumer segmentation could be helpful to
Int. J. Environ. Res. Public Health 2021, 18, 3948 17 of 21
provide marketing activity among proper consumer group, and can be interesting for otherpopulations to cross-cultural comparison.
It would certainly be worth repeating our study after the COVID-19 pandemic isover. It may be an interesting idea to study the impact of remote working mode onthe purchase and use of home coffee machines, as well as evaluation the behavior ofconsumers consuming coffee in cafes. Further research directions may concern coffeecold brewing, especially among consumers who are open to innovation. It would beinteresting to investigate the multisensory perception and cross modal relationships ofpotential coffee consumers.
Author Contributions: Conceptualization, E.C.-S.; methodology, E.C.-S., M.P., and P.S.; investigation,E.C.-S., M.P., P.S., and R.K.-G.; data curation, E.C.-S. and T.O.; writing—original draft preparation,E.C.-S., M.P., P.S., and R.K.-G.; writing—review and editing, E.C.-S.; visualization, T.O.; supervision,E.C.-S. All authors have read and agreed to the published version of the manuscript.
Funding: This research was financed by the Polish Ministry of Science and Higher Education withinfunds of Institute of Human Nutrition Sciences, Warsaw University of Life Sciences (WULS) forscientific research.
Institutional Review Board Statement: The respondents were free to participate in the research.Ethical review and approval were waived for this study, due to the research was non-invasive (surveyon internet panel) and details the participants remained undisclosed, the research does not fall withinthe remit of the Helsinki Declaration. The data were collected by CAWI method.
Informed Consent Statement: Informed consent was obtained from all subjects involved in the study.
Data Availability Statement: The data presented in this article is available on reasonable request,from the corresponding author.
Conflicts of Interest: The authors declare no conflict of interest.
References1. International Coffee Organization (ICO). Coffee Market Report. July 2019. Available online: http://www.ico.org/documents/
cy2018-19/cmr-0719-e.pdf (accessed on 20 February 2021).2. Mahmud, M.M.C.; Shellie, R.A.; Keast, R. Unravelling the relationship between aroma compounds and consumer acceptance:
Coffee as an example. Compr. Rev. Food Sci. Food Saf. 2020, 19, 2380–2420. [CrossRef]3. Shahbandhen, M. Global Coffee Consumption 2012/13–2018/19. January 2020. Available online: https://www.statista.com/
statistics/292595/global-coffee-consumption/#statisticContainer (accessed on 20 February 2021).4. The Coffee Market in 2019. Ceuta Group. Available online: https://www.ceutagroup.com/the-coffee-market-in-2019/ (accessed
on 20 January 2021).5. Budzety Gospodarstw Domowych w 2019 Roku (Household Budget Survey in 2019). GUS, Statistics Poland, Warsaw. 2020. Avail-
able online: https://stat.gov.pl/obszary-tematyczne/warunki-zycia/dochody-wydatki-i-warunki-zycia-ludnosci/budzety-gospodarstw-domowych-w-2019-roku,9,14.html (accessed on 10 January 2021).
6. Cano-Marquina, A.; Tarín, J.J.; Cano, A. The impact of coffee on health. Maturitas 2013, 75, 7–21. [CrossRef] [PubMed]7. Tzoulaki, I. Moderate coffee intake and cardiovascular health; no grounds for concern. Nutr. Metab. Cardiovasc. Dis. 2018, 28,
808–809. [CrossRef] [PubMed]8. Ciaramelli, C.; Palmioli, A.; Airoldi, C. Coffee variety, origin and extraction procedure: Implications for coffee beneficial effects
on human health. Food Chem. 2019, 278, 47–55. [CrossRef]9. Bodar, V.; Chen, J.; Sesso, H.D.; Gaziano, J.M.; Djoussé, L. Coffee consumption and risk of heart failure in the Physicians’ Health
Study. Clin. Nutr. ESPEN 2020, 40, 133–137. [CrossRef] [PubMed]10. Coronado-Zarco, R.; De León, A.O.-G. Reply on “Coffee consumption and bone health: A risk assessment”. Osteoporos. Sarcopenia
2020, 6, 34–35. [CrossRef]11. Shao, C.; Tang, H.; Wang, X.; He, J. Coffee Consumption and Stroke Risk: Evidence from a Systematic Review and Meta-Analysis
of more than 2.4 Million Men and Women. J. Stroke Cerebrovasc. Dis. 2021, 30, 105452. [CrossRef] [PubMed]12. Hewlett, P.; Wadsworth, E. Tea, coffee and associated lifestyle factors. Br. Food J. 2012, 114, 416–427. [CrossRef]13. Ágoston, C.; Urbán, R.; Király, O.; Griffiths, M.D.; Rogers, P.J.; Demetrovics, Z. Why Do You Drink Caffeine? The Development
of the Motives for Caffeine Consumption Questionnaire (MCCQ) and Its Relationship with Gender, Age and the Types ofCaffeinated Beverages. Int. J. Ment. Health Addict. 2017, 16, 981–999. [CrossRef]
14. Benson, S.; Unice, K.; Glynn, M. Hourly and daily intake patterns among U.S. caffeinated beverage consumers based on theNational Health and Nutrition Examination Survey (NHANES, 2013–2016). Food Chem. Toxicol. 2019, 125, 271–278. [CrossRef]
Int. J. Environ. Res. Public Health 2021, 18, 3948 18 of 21
15. Poole, R.; Kennedy, O.J.; Roderick, P.; Fallowfield, J.A.; Hayes, P.C.; Parkes, J. Coffee consumption and health: Umbrella review ofmeta-analyses of multiple health outcomes. BMJ 2017, 359, j5024. [CrossRef] [PubMed]
16. Yamaguchi, T.; Chikama, A.; Mori, K.; Watanabe, T.; Shioya, Y.; Katsuragi, Y.; Tokimitsu, I. Hydroxyhydroquinone-free coffee: Adouble-blind, randomized controlled dose–response study of blood pressure. Nutr. Metab. Cardiovasc. Dis. 2008, 18, 408–414.[CrossRef] [PubMed]
17. Frost-Meyer, N.J.; Logomarsino, J.V. Impact of coffee components on inflammatory markers: A review. J. Funct. Foods 2012, 4,819–830. [CrossRef]
18. Vignoli, J.; Bassoli, D.; Benassi, M. Antioxidant activity, polyphenols, caffeine and melanoidins in soluble coffee: The influence ofprocessing conditions and raw material. Food Chem. 2011, 124, 863–868. [CrossRef]
19. Buscemi, S.; Batsis, J.A.; Arcoleo, G.; Verga, S. Coffee and endothelial function: A battle between caffeine and antioxidants? Eur. J.Clin. Nutr. 2010, 64, 1242–1243. [CrossRef] [PubMed]
20. Moreira, A.S.P.; Nunes, F.; Domingues, M.R.; Coimbra, M.A. Coffee melanoidins: Structures, mechanisms of formation andpotential health impacts. Food Funct. 2012, 3, 903–915. [CrossRef]
21. Natella, F.; Scaccini, C. Role of coffee in modulation of diabetes risk. Nutr. Rev. 2012, 70, 207–217. [CrossRef]22. Van Dam, R. Coffee and type 2 diabetes: From beans to beta-cells. Nutr. Metab. Cardiovasc. Dis. 2006, 16, 69–77. [CrossRef]23. Yanagimoto, K.; Ochi, H.; Lee, K.-G.; Shibamoto, T. Antioxidative Activities of Fractions Obtained from Brewed Coffee. J. Agric.
Food Chem. 2004, 52, 592–596. [CrossRef] [PubMed]24. Ale-Agha, N.; Goy, C.; Jakobs, P.; Spyridopoulos, I.; Gonnissen, S.; Dyballa-Rukes, N.; Aufenvenne, K.; von Ameln, F.; Zurek,
M.; Spannbrucker, T.; et al. CDKN1B/p27 is localized in mitochondria and improves respiration-dependent processes in thecardiovascular system—New mode of action for caffeine. PLoS Biol. 2018, 16, e2004408. [CrossRef]
25. Williams, C.J.; Fargnoli, J.L.; Hwang, J.J.; Van Dam, R.M.; Blackburn, G.L.; Hu, F.B.; Mantzoros, C.S. Coffee consumption isassociated with higher plasma adiponectin concentrations in women with or without type 2 diabetes: A prospective cohort study.Diabetes Care 2008, 31, 504–507. [CrossRef]
26. Imatoh, T.; Tanihara, S.; Miyazaki, M.; Momose, Y.; Uryu, Y.; Une, H. Coffee consumption but not green tea consumption isassociated with adiponectin levels in Japanese males. Eur. J. Nutr. 2010, 50, 279–284. [CrossRef] [PubMed]
27. Na Kim, A.; Cho, H.J.; Youn, J.; Jin, T.; Kang, M.; Sung, J.; Lee, J.E. Coffee Consumption, Genetic Polymorphisms, and the Risk ofType 2 Diabetes Mellitus: A Pooled Analysis of Four Prospective Cohort Studies. Int. J. Environ. Res. Public Health 2020, 17, 5379.[CrossRef] [PubMed]
28. Koloverou, E.; Panagiotakos, D.B.; Pitsavos, C.; Chrysohoou, C.; Georgousopoulou, E.N.; Laskaris, A.; Stefanadis, C. Theevaluation of inflammatory and oxidative stress biomarkers on coffee-diabetes association: Results from the 10-year follow-up ofthe ATTICA Study (2002–2012). Eur. J. Clin. Nutr. 2015, 69, 1220–1225. [CrossRef] [PubMed]
29. Bloomer, R.J.; Trepanowski, J.F.; Farney, T.M. Influence of Acute Coffee Consumption on Postprandial Oxidative Stress. Nutr.Metab. Insights 2013, 6. [CrossRef] [PubMed]
30. Boontaganon, P.; Jéhanno, E.; Savage, G.P. Total, soluble and insoluble oxalate content of bran and bran products. J. Food Agric.Environ. 2009, 7, 204–206. [CrossRef]
31. Yukawa, G.S.; Mune, M.; Otani, H.; Tone, Y.; Liang, X.M.; Iwahashi, H.; Sakamoto, W. Effects of coffee consumption on ox-idativesusceptibility of low-density lipoproteins and serum lipids levels in humans. Biochemistry 2004, 69, 70–74. [CrossRef] [PubMed]
32. Holmes, R.P.; Goodman, H.O.; Assimos, D.G. Contribution of dietary oxalate to urinary oxalate excretion. Kidney Int. 2001, 59,270–276. [CrossRef]
33. Muroyama, K.; Murosaki, S.; Yamamotoi, Y.; Odaka, H.; Chung, H.C.; Miyoshi, M. Anti-Obesity Effects of a Mixture of Thiamin,Arginine, Caffeine, and Citric Acid in Non-Insulin Dependent Diabetic KK Mice. J. Nutr. Sci. Vitaminol. 2003, 49, 56–63. [CrossRef]
34. Greenberg, J.A.; Owen, D.R.; Geliebter, A. Decaffeinated Coffee and Glucose Metabolism in Young Men. Diabetes Care 2009, 33,278–280. [CrossRef]
35. Jarosz, M.; Wierzejewska, R.; Mojska, H.; Swiderska, K.; Siuba, M. Zawartosc kofeiny w produktach spozywczych (CaffeineContent in Foodstuffs). Bromatol. Chem. Toksykol. 2009, 3, 776–781.
36. Ribeiro-Alves, M.A.; Trugo, L.C.; Donangelo, C.M. Use of Oral Contraceptives Blunts the Calciuric Effect of Caffeine in YoungAdult Women. J. Nutr. 2003, 133, 393–398. [CrossRef] [PubMed]
37. Votavová, L.; Voldrich, M.; Ševcík, R.; Cížková, H.; Mlejnecká, J.; Stolar, M.; Fleišman, T. Changes of Antioxidant Capacity ofRobusta Coffee during Roasting. Czech J. Food Sci. 2009, 27, S49–S52. [CrossRef]
38. Strandhagen, E.; Landaas, S.; Thelle, D.S. Folic acid and supplement decreases the homocysteine increasing effect on filteredcoffee. A randomized placebo-controlled study. Eur. J. Clin. Nutr. 2003, 57, 1411–1417. [CrossRef] [PubMed]
39. Je, Y.; Giovannucci, E. Coffee consumption and total mortality: A meta-analysis of twenty prospective cohort studies. Br. J. Nutr.2013, 111, 1162–1173. [CrossRef] [PubMed]
40. Grosso, G.; Micek, A.; Godos, J.; Sciacca, S.; Pajak, A.; Martínez-González, M.A.; Giovannucci, E.L.; Galvano, F. Coffee con-sumption and risk of all-cause, cardiovascular, and cancer mortality in smokers and non-smokers: A dose-response me-ta-analysis.Eur. J. Epidemiol. 2016, 31, 1191–1205. [CrossRef] [PubMed]
41. Park, S.Y.; Freedman, N.D.; Haiman, C.A.; Le Marchand, L.; Wilkens, L.R.; Setiawan, V.W. Association of coffee consumption withtotal and cause-specific mortality among nonwhite populations. Ann. Intern. Med. 2017, 167, 228–235. [CrossRef] [PubMed]
Int. J. Environ. Res. Public Health 2021, 18, 3948 19 of 21
42. Loftfield, E.; Cornelis, M.C.; Caporaso, N.; Yu, K.; Sinha, R.; Freedman, N. Association of coffee drinking with mortality bygenetic variation in caffeine metabolism: Findings from the UK biobank. JAMA Intern. Med. 2018, 178, 1086–1097. [CrossRef]
43. Abe, S.K.; Saito, E.; Sawada, N.; Tsugane, S.; Ito, H.; Lin, Y.; Tamakoshi, A.; Sado, J.; Kitamura, Y.; Sugawara, Y.; et al. Coffeeconsumption and mortality in Japanese men and women: A pooled analysis of eight population-based cohort studies in Japan(Japan Cohort Consortium). Prev. Med. 2019, 123, 270–277. [CrossRef] [PubMed]
44. Wróblewski, Ł.; Maciejewski, G.; Mokrysz, S. Consumer preferences on the coffee market in developing Central EuropeanCountries: On the example of Poland. Preprints 2018. [CrossRef]
45. Andorfer, V.A.; Liebe, U. Do information, price, or morals influence ethical consumption? A natural field experiment andcustomer survey on the purchase of Fair Trade coffee. Soc. Sci. Res. 2015, 52, 330–350. [CrossRef] [PubMed]
46. Bissinger, K.; Leufkens, D. Ethical food labels in consumer preferences. Br. Food J. 2017, 119, 1801–1814. [CrossRef]47. Samoggia, A.; Riedel, B. Coffee consumption and purchasing behavior review: Insights for further research. Appetite 2018, 129,
70–81. [CrossRef] [PubMed]48. Basu, A.K.; Hicks, R.L. Label performance and the willingness to pay for Fair Trade coffee: A cross-national perspectives. Int. J.
Consum. Stud. 2008, 32, 470–478. [CrossRef]49. Arnot, C.; Boxall, P.C.; Cash, S.B. Do Ethical Consumers Care About Price? A Revealed Preference Analysis of Fair Trade Coffee
Purchases. Can. J. Agric. Econ. Can. D’agroeconomie 2006, 54, 555–565. [CrossRef]50. Sandu, C. Study regarding the rationale of coffee consumption according to gender and age groups. Rom. J. Exp. Appl. Psychol.
2013, 4, 18–23.51. Bartkowicz, J. Wybrane zachowania konsumentów na rynku kawy naturalnej (The Selected Behaviours of Consumers in the
Market for Natural Coffee). Handel Wewnetrzny 2015, 2, 45–57.52. Labbe, D.; Ferrage, A.; Rytz, A.; Pace, J.; Martin, N. Pleasantness, emotions and perceptions induced by coffee beverage experience
depend on the consumption motivation (hedonic or utilitarian). Food Qual. Prefer. 2015, 44, 56–61. [CrossRef]53. Kim, S.-E.; Lee, S.M.; Kim, K.-O. Consumer acceptability of coffee as affected by situational conditions and involvement. Food
Qual. Prefer. 2016, 52, 124–132. [CrossRef]54. Giacalone, D.; Degn, T.K.; Yang, N.; Liu, C.; Fisk, I.; Münchow, M. Common roasting defects in coffee: Aroma composition,
sensory characterization and consumer perception. Food Qual. Prefer. 2019, 71, 463–474. [CrossRef]55. Spence, C. Do men and women really live in different taste worlds? Food Qual. Prefer. 2019, 73, 38–45. [CrossRef]56. Richelieu, A.; Korai, B. The consumption experience of Tim Hortons’ coffee fans. Qual. Mark. Res. Int. J. 2014, 17,
192–208. [CrossRef]57. Sousa, A.G.; Machado, L.M.M.; da Silva, E.F.; da Costa, T.H.M. Personal characteristics of coffee consumers and non-consumers,
reasons and preferences for foods eaten with coffee among adults from the Federal District, Brazil. Food Sci. Technol. 2016, 36,432–438. [CrossRef]
58. Harith, Z.T.; Ting, C.H.; Zakaria, N.N.A. Coffee packaging: Consumer perception on appearance, branding and pricing. Int. FoodRes. J. 2014, 21, 849–853.
59. International Coffee Organisation (ICO). Global Coffee Forum, Milan. 2015. Available online: http://www.ico.org/global-coffee-forum.asp (accessed on 20 February 2021).
60. Landais, E.; Moskal, A.; Mullee, A.; Nicolas, G.; Gunter, M.J.; Huybrechts, I.; Overvad, K.; Roswall, N.; Affret, A.; Fagherazzi, G.;et al. Coffee and Tea Consumption and the Contribution of Their Added Ingredients to Total Energy and Nutrient Intakes in 10European Countries: Benchmark Data from the Late 1990s. Nutrients 2018, 10, 725. [CrossRef] [PubMed]
61. Euromonitor International. Coffee in 2018: The New Era of Coffee Everywhere; Euromonitor International: London, UK, 2018;Available online: https://www.euromonitor.com/coffee-in-2018-the-new-era-of-coffee-everywhere/report (accessed on20 February 2021).
62. Brommer, E.; Stratmann, B.; Quack, D. Environmental impacts of different methods of coffee preparation. Int. J. Consum. Stud.2011, 35, 212–220. [CrossRef]
63. Van Der Merwe, K.; Maree, T. The behavioural intentions of specialty coffee consumers in South Africa. Int. J. Consum. Stud. 2016,40, 501–508. [CrossRef]
64. Aguirre, J. Culture, health, gender and coffee drinking: A Costa Rican perspective. Br. Food J. 2016, 118, 150–163. [CrossRef]65. Bookman, S. Branded Cosmopolitanisms: ‘Global’ Coffee Brands and the Co-creation of ‘Cosmopolitan Cool’. Cult. Sociol. 2012,
7, 56–72. [CrossRef]66. Lanfranchi, M.; Giannetto, C.; Dimitrova, V. Evolutionary aspects of coffee consumers’ buying habits: Results of a sample survey.
Bulg. J. Agric. Sci. 2016, 22, 705–712. [CrossRef]67. Lee, K.H.; Bonn, M.A.; Cho, M. Consumer motives for purchasing organic coffee. Int. J. Contemp. Hosp. Manag. 2015, 27,
1157–1180. [CrossRef]68. Spinelli, S.; Dinnella, C.; Masi, C.; Zoboli, G.P.; Prescott, J.; Monteleone, E. Investigating preferred coffee consumption contexts
using open-ended questions. Food Qual. Prefer. 2017, 61, 63–73. [CrossRef]69. Samoggia, A.; Del Prete, M.; Argenti, C. Functional Needs, Emotions, and Perceptions of Coffee Consumers and Non-Consumers.
Sustainability 2020, 12, 5694. [CrossRef]70. Matysiak, R. Rynek kawy i preferencje nabywcze jej konsumentów. Rocz. Nauk. Stow. Ekon. Rol. Agrobiz. 2005, 7, 108–112.
Int. J. Environ. Res. Public Health 2021, 18, 3948 20 of 21
71. Centrum Badania Opinii Społecznej (CBOS). Komunikat z Badan. Jak Zdrowo OdzYwiaja Sie Polacy? Nr 106/2019. 2019.Available online: https://www.cbos.pl/SPISKOM.POL/2019/K_106_19.PDF (accessed on 20 January 2021).
72. Borek, D.; Głowacka-Smolis, K.; Gustyn, J.; Kozera, A.; Kozłowska, J.; Marikin, M.; Morytz-Balska, E.; Rybak-Nguyen, E.; Safader,M.; Waker, R.; et al. Statistical Yearbook of the Republic of Poland; GUS: Warsaw, Poland, 2020.
73. Raport GfK Polonia. Rzeczpospolita. 28 February 2020. Available online: https://www.portalspozywczy.pl/napoje/wiadomosci/polacy-ruszyli-po-ekspresy-kawa-rozpuszczalna-traci-rynek,181492.html (accessed on 19 February 2021).
74. Raport GfK Polonia/Informacja Prasowa. 3 December 2020. Available online: https://www.gfk.com/pl/insighty/polski-rynek-kawy-rosnie-nawet-w-czasie-pandemii?hsLang=pl (accessed on 20 January 2021).
75. Portalspozywczy.pl/Informacja Prasowa. 3 November 2020, pp. 1–2. Available online: https://www.portalspozywczy.pl/napoje/wiadomosci/wydatki-gospodarstw-domowych-na-kawe-w-pierwszym-polroczu-br-wyniosly-1-54-mld-zl,191380.html (ac-cessed on 20 January 2021).
76. Drewnowska, B. Espresso Nie Tylko z Kawiarni. Rzeczpospolita 2013. Available online: http://www.ekonomia.rp.pl/artykul/1073749.html?print=tak&p=0 (accessed on 20 October 2020).
77. Samoggia, A.; Riedel, B. Consumers’ Perceptions of Coffee Health Benefits and Motives for Coffee Consumption and Purchasing.Nutrients 2019, 11, 653. [CrossRef]
78. Rowe, K. Caffeine Intake, Influences and Experiences: The Development of CaffCo—A New Zeland Caffeine ConsumptionHabits Questionnaire. Master’s Thesis, Massey University, Albany, New Zealand, 2015.
79. Huang, Y.F.; Dang, H.S. An Empirical Analysis on Purchase Intention on Coffee Beverage in Taiwan. Eur. J. Bus. Manag. 2014, 6,182–196.
80. Grabon, I. Kawa. Instrukcja Obsługi Najpopularniejszego Napoju Na Swiecie; Otwarte: Kraków, Poland, 2020.81. Kingston, L. How to Make Coffee: The Science behind the Bean; The Ivy Press: Brighton, UK, 2017.82. Stanisz, A. Przystepny Kurs Statystyki z Zastosowaniem Statistica Pl Na Przykładach z Medycyny. Tom 3. Analizy Wielowymiarowe;
Statsoft Polska: Kraków, Poland, 2007.83. Aczel, A.D. Statystyka w Zarzadzaniu; PWN: Warszawa, Poland, 2000.84. Juszczyk, M. Zastosowanie badan marketingowych do analizy konsumentów (The Use of Marketing Research in the Analysis of
Customers’ Behaviors). Zeszyty Naukowe Uniwersytetu Szczecinskiego. Ekon. Probl. Usług 2011, 72, 63–72.85. Koniewski, M. Swiadomosci Marki a Lojalnosc Konsumentów. PMR Research February 2012. Available online: www-research-
prm.com (accessed on 20 February 2021).86. Tumanan, M.A.R.; Lansangan, J.R.G. More than just a cuppa coffee: A multi-dimensional approach towards analyzing the factors
that define place attachment. Int. J. Hosp. Manag. 2012, 31, 529–534. [CrossRef]87. Smith Maguire, J.; Hu, D. Not a simple coffee shop: Local, global and glocal dimensions of the consumption of Starbucks in
China. J. Study Race Nation Cult. 2013, 19, 670–684. [CrossRef]88. Bhumiratana, N.; Adhikari, K.; Chambers, E. The development of an emotion lexicon for the coffee drinking experience. Food Res.
Int. 2014, 61, 83–92. [CrossRef]89. Kim, S.-H.; Lee, S.A. Promoting customers’ involvement with service brands: Evidence from coffee shop customers. J. Serv. Mark.
2017, 31, 733–744. [CrossRef]90. Fenko, A.; de Vries, R.; van Rompay, T. How Strong Is Your Coffee? The Influence of Visual Metaphors and Textual Claims on
Consumers’ Flavor Perception and Product Evaluation. Front. Psychol. 2018, 9, 53. [CrossRef] [PubMed]91. Santoso, I. The Analysis of The Role of Instant Coffee Price and Quality in Consumer Preference and Purchasing Decision, in
Malang, Using Partial Least Square Method. Wacana J. Sos. Hum. 2017, 20, 9–14. [CrossRef]92. Lewin, B.; Giovannucci, D.; Varangis, P. Coffee Markets: New Paradigms in Global Supply and Demand. SSRN Electron. J. 2004,
3, 1–133. [CrossRef]93. Polska Na Talerzu 2019 (“Poland on a Plate 2019”). Raport MAKRO Cash & Carry, IQS. 2019. Available online:
https://mediamakro.pl/pr/460369/tradycyjnapolska-kuchnia-wciaz-kroluje-na-naszych-talerzach-najnowsze (accessedon 19 February 2021).
94. National Coffee Drinking Trends. 2017. Available online: https://www.ncausa.org/Industry-Resources/Market-Research/NCDT (accessed on 20 August 2020).
95. National Coffee Association of USA: New York, NY, USA. 2017. Available online: https://www.ncausa.org/convention2017(accessed on 23 January 2021).
96. Institute for Scientific Information on Coffee (ISIC). Roundtable Report. The Good Things in Life: Coffee as Part of a Healthy Diet andLifestyle; ISIC: Worcestershire, UK, 2016. Available online: https://www.coffeeandhealth.org/wp-content/uploads/2016/03/Roundtable-report_Coffee-as-part-of-a-healthy-diet.pdf (accessed on 20 February 2021).
97. Moroney, K.M.; Lee, W.T.; O’Brien, S.B.; Suijver, F.; Marra, J. Coffee extraction kinetics in a well-mixed system. J. Math. Ind. 2016,7, 1–19. [CrossRef]
98. Wozniczko, M.; Orłowski, D. Profesja baristy i specyfika jego pracy w branzy kawiarnianej na rynku Horeca w Polsce (Baristicprofession and specification of its work in the coffee industry on the HORECA market in Poland). Zesz. Nauk. Tur. Rekreac. 2019,23, 185–202.
99. Gandia, R.M.; Sugano, J.Y.; Boas, L.H.D.B.V.; Mesquita, D.L. Beverage capsule consumption: A laddering study. Br. Food J. 2018,120, 1250–1263. [CrossRef]
Int. J. Environ. Res. Public Health 2021, 18, 3948 21 of 21
100. Voilley, A.; Sauvageot, F.; Simatos, D.; Wojcik, G. Influence of some processing conditions on the quality of coffee brew. J. FoodProcess. Preserv. 1981, 5, 135–143. [CrossRef]
101. Cardelli, C.; Labuza, T. Application of Weibull Hazard Analysis to the Determination of the Shelf Life of Roasted and GroundCoffee. LWT 2001, 34, 273–278. [CrossRef]
102. Salamanca, C.A.; Fiol, N.; González, C.; Saez, M.; Villaescusa, I. Extraction of espresso coffee by using gradient of temperature.Effect on physicochemical and sensorial characteristics of espresso. Food Chem. 2017, 214, 622–630. [CrossRef] [PubMed]
103. Sánchez-López, J.A.; Wellinger, M.; Gloess, A.N.; Zimmermann, R.; Yeretzian, C. Extraction kinetics of coffee aroma com-poundsusing a semi-automatic machine: On-line analysis by PTR-ToF-MS. Int. J. Mass Spectrom. 2016, 401, 22–30. [CrossRef]
104. Andueza, S.; Maeztu, L.; Lucía, P.; Ibañez, C.; Paz de Peña, M.; Concepción, C. Influence of extraction temperature on the finalquality of espresso coffee. J. Sci. Food Agric. 2003, 83, 240–248. [CrossRef]
105. Flament, I. Coffee Flavor Chemistry; John Wiley and Sons Inc.: New York, NY, USA, 2002.106. Caporaso, N.; Genovese, A.; Canela, M.D.; Civitella, A.; Sacchi, R. Neapolitan coffee brew chemical analysis in comparison to
espresso, moka and American brews. Food Res. Int. 2014, 61, 152–160. [CrossRef]107. La Pera, L.; Liberatore, A.; Avellone, G.; Fanara, S.; Dugo, G.; Agozzino, P. Analysis of furan in coffee of different prove-nance
by head-space solid phase microextraction gas chromatography-mass spectrometry: Effect of brewing procedures. Food Addit.Contam. 2009, 26, 786–792. [CrossRef] [PubMed]
108. Fuller, M.; Rao, N.Z. The Effect of Time, Roasting Temperature, and Grind Size on Caffeine and Chlorogenic Acid Concentrationsin Cold Brew Coffee. Sci. Rep. 2017, 7, 1–9. [CrossRef]
109. Kulapichitr, F.; Borompichaichartkul, C.; Suppavorasatit, I.; Cadwallader, K.R. Impact of drying process on chemical compositionand key aroma components of Arabica coffee. Food Chem. 2019, 291, 49–58. [CrossRef] [PubMed]
110. Quintão, R.T.; Brito, E.P.Z.; Belk, R.W. The taste transformation ritual in the specialty coffee market. Rev. Adm. Empresas 2017, 57,483–494. [CrossRef]