Annual migrations, diving behavior, and thermal biology of Atlantic bluefin tuna, Thunnus thynnus ,...
18
RESEARCH ARTICLE Annual migrations, diving behavior, and thermal biology of Atlantic bluefin tuna, Thunnus thynnus, on their Gulf of Mexico breeding grounds Steven L. H. Teo Andre Boustany Heidi Dewar Michael J. W. Stokesbury Kevin C. Weng Shana Beemer Andrew C. Seitz Charles J. Farwell Eric D. Prince Barbara A. Block Received: 9 February 2006 / Accepted: 6 July 2006 / Published online: 17 October 2006 Ó Springer-Verlag 2006 Abstract Electronic tags were used to examine the biology of Atlantic bluefin tuna (Thunnus thynnus L.) on their breeding grounds in the Gulf of Mexico (GOM). The hypothesis that movement patterns, div- ing behavior, and thermal biology change during dif- ferent stages of the breeding migration was tested. Mature Atlantic bluefin tuna tagged in the western Atlantic and the GOM, were on their breeding grounds from February to June for an average of 39 ± 11 days. The bluefin tuna experienced significantly warmer mean sea surface temperatures (SSTs) within the GOM (26.4 ± 1.6°C) than outside the GOM (20.2 ± 1.9°C). As the bluefin tuna entered and exited the GOM, the fish dove to daily maximum depths of 568 ± 50 and 580 ± 144 m, respectively, and exhibited directed movement paths to and from the localized breeding areas. During the putative breeding phase, the bluefin tuna had significantly shallower daily max- imum depths (203 ± 76 m), and exhibited shallow oscillatory dives during the night. The movement paths of the bluefin tuna during the breeding phase were significantly more residential and sinuous. The heat transfer coefficients (K) were calculated for a bluefin tuna in the GOM using the recorded ambient and body temperatures. The K for this fish increased rapidly at the high ambient temperatures encountered in the GOM, and was significantly higher at night in the breeding phase when the fish was exhibiting shallow oscillatory dives. This suggests that the fish were behaviorally and physiologically thermoregulating in the Gulf of Mexico. This study demonstrates that the movement patterns, diving behavior, and thermal biology of Atlantic bluefin tuna change significantly at different stages of the breeding migration and can be used to define spawning location and timing. Introduction Atlantic bluefin tuna (Thunnus thynnus) have attracted the attention of scientists with their migratory ability, large body size, and endothermic physiology (Mather et al. 1995; Block and Stevens 2001; Graham and Dickson 2004). This species can grow to a length >300 cm, and attain a mass of 680 kg (Magnuson et al. 1994). Atlantic bluefin tuna make rapid, ocean basin- Communicated by J.P. Grassle, New Brunswick. Electronic supplementary material Supplementary material is available in the online version of this article at http://dx.doi.org/ 10.1007/s00227-006-0447-5 and is accessible for authorized users. S. L. H. Teo A. Boustany H. Dewar K. C. Weng S. Beemer B. A. Block (&) Tuna Research and Conservation Center, Hopkins Marine Station, Stanford University, 120 Oceanview Boulevard, Pacific Grove, CA 93950, USA e-mail: [email protected] M. J. W. Stokesbury Biology Department, Dalhousie University, 1344 Oxford Street, Halifax, CanadaNS B3H 4J1 A. C. Seitz C. J. Farwell Monterey Bay Aquarium, 886 Cannery Row, Monterey, CA 93940, USA E. D. Prince Southeast Fisheries Science Center, National Marine Fisheries Service, 75 Virginia Beach Drive, Miami, FL 33149, USA Mar Biol (2007) 151:1–18 DOI 10.1007/s00227-006-0447-5 123
Transcript of Annual migrations, diving behavior, and thermal biology of Atlantic bluefin tuna, Thunnus thynnus ,...

RESEARCH ARTICLE
Annual migrations, diving behavior, and thermal biologyof Atlantic bluefin tuna, Thunnus thynnus, on their Gulfof Mexico breeding grounds
Steven L. H. Teo Æ Andre Boustany Æ Heidi Dewar Æ Michael J. W. Stokesbury ÆKevin C. Weng Æ Shana Beemer Æ Andrew C. Seitz Æ Charles J. Farwell ÆEric D. Prince Æ Barbara A. Block
Received: 9 February 2006 / Accepted: 6 July 2006 / Published online: 17 October 2006� Springer-Verlag 2006
Abstract Electronic tags were used to examine the
biology of Atlantic bluefin tuna (Thunnus thynnus L.)
on their breeding grounds in the Gulf of Mexico
(GOM). The hypothesis that movement patterns, div-
ing behavior, and thermal biology change during dif-
ferent stages of the breeding migration was tested.
Mature Atlantic bluefin tuna tagged in the western
Atlantic and the GOM, were on their breeding grounds
from February to June for an average of 39 ± 11 days.
The bluefin tuna experienced significantly warmer
mean sea surface temperatures (SSTs) within the
GOM (26.4 ± 1.6�C) than outside the GOM
(20.2 ± 1.9�C). As the bluefin tuna entered and exited
the GOM, the fish dove to daily maximum depths of
568 ± 50 and 580 ± 144 m, respectively, and exhibited
directed movement paths to and from the localized
breeding areas. During the putative breeding phase,
the bluefin tuna had significantly shallower daily max-
imum depths (203 ± 76 m), and exhibited shallow
oscillatory dives during the night. The movement paths
of the bluefin tuna during the breeding phase were
significantly more residential and sinuous. The heat
transfer coefficients (K) were calculated for a bluefin
tuna in the GOM using the recorded ambient and body
temperatures. The K for this fish increased rapidly at
the high ambient temperatures encountered in the
GOM, and was significantly higher at night in the
breeding phase when the fish was exhibiting shallow
oscillatory dives. This suggests that the fish were
behaviorally and physiologically thermoregulating in
the Gulf of Mexico. This study demonstrates that the
movement patterns, diving behavior, and thermal
biology of Atlantic bluefin tuna change significantly at
different stages of the breeding migration and can be
used to define spawning location and timing.
Introduction
Atlantic bluefin tuna (Thunnus thynnus) have attracted
the attention of scientists with their migratory ability,
large body size, and endothermic physiology (Mather
et al. 1995; Block and Stevens 2001; Graham and
Dickson 2004). This species can grow to a length
>300 cm, and attain a mass of 680 kg (Magnuson et al.
1994). Atlantic bluefin tuna make rapid, ocean basin-
Communicated by J.P. Grassle, New Brunswick.
Electronic supplementary material Supplementary material isavailable in the online version of this article at http://dx.doi.org/10.1007/s00227-006-0447-5 and is accessible for authorized users.
S. L. H. Teo � A. Boustany � H. Dewar �K. C. Weng � S. Beemer � B. A. Block (&)Tuna Research and Conservation Center,Hopkins Marine Station, Stanford University,120 Oceanview Boulevard, Pacific Grove,CA 93950, USAe-mail: [email protected]
M. J. W. StokesburyBiology Department, Dalhousie University,1344 Oxford Street, Halifax, CanadaNS B3H 4J1
A. C. Seitz � C. J. FarwellMonterey Bay Aquarium, 886 Cannery Row,Monterey, CA 93940, USA
E. D. PrinceSoutheast Fisheries Science Center,National Marine Fisheries Service,75 Virginia Beach Drive, Miami,FL 33149, USA
Mar Biol (2007) 151:1–18
DOI 10.1007/s00227-006-0447-5
123

scale migrations, ranging from cool subpolar foraging
grounds to discrete breeding grounds in warm, sub-
tropical waters during the spawning season (Mather
et al. 1995; Block et al. 2005). The endothermic phys-
iology of the Atlantic bluefin tuna is thought to allow
the species to expand their thermal niche and pene-
trate into the cold ambient temperatures on their for-
aging grounds (Carey and Lawson 1973; Neill and
Stevens 1974; Block and Finnerty 1994; Block et al.
2001; Graham and Dickson 2004). The use of elec-
tronic tags has greatly improved our understanding of
bluefin tuna biology on their foraging grounds (e.g.,
Carey and Lawson 1973; Neill and Stevens 1974; Block
et al. 2001, 2005; Gunn and Block 2001; Kitagawa et al.
2004; Stokesbury et al. 2004; Wilson et al. 2005).
However, our understanding of their biology during
their reproductive period remains relatively poor
(Schaefer 2001). In this study, we use electronic tags to
examine the biology of the Atlantic bluefin tuna on
their breeding grounds in the Gulf of Mexico (GOM).
Atlantic bluefin tuna are known to spawn in two
main regions and periods—the GOM from April to
June and the Mediterranean Sea from June to August
(Magnuson et al. 1994; Mather et al. 1995; Schaefer
2001). In addition, some of the western Atlantic bluefin
tuna are likely to spawn in the Florida Straits and
Bahamas area (Baglin 1982; Clay 1991; Block et al.
2001). Electronic tagging studies have shown that
bluefin tuna tagged in the western Atlantic migrate to
the two major spawning grounds in the GOM and the
Mediterranean Sea during their respective breeding
seasons (Block et al. 2001, 2005; Stokesbury et al.
2004). The bluefin tuna that spawn in the GOM are
associated with feeding aggregations in North Caro-
lina, mid-Atlantic Bight, and New England waters
during winter and spring (Stokesbury et al. 2004; Block
et al. 2005). These fish tend to migrate to their
spawning grounds in the GOM from February to June,
and exit the GOM by the end of June (Block et al.
2005). During summer and autumn, the bluefin tuna
expand their range and can be found in feeding
aggregations in the North Atlantic Ocean, ranging
from New England waters in the western Atlantic to
the Flemish Cap area in the central Atlantic, and the
eastern Atlantic (Block et al. 2005).
The International Commission for the Conserva-
tion of Atlantic Tunas (ICCAT, http://www.iccat.es)
currently manages the Atlantic bluefin tuna as two
distinct stocks. ICCAT assumes the western Atlantic
spawners form a distinct stock from the eastern
Atlantic spawners, which spawn in the Mediterranean
Sea, and that there is limited mixing between the two
stocks across the 45�W meridian (Fromentin and
Powers 2005). However, electronic tagging studies
have recently shown that the two stocks are distinct
during the breeding periods but mix across the 45�W
meridian on their foraging grounds (Block et al.
2005). The western stock of Atlantic bluefin tuna has
suffered a >80% decline in spawning stock biomass
since 1970 and a 20-year rebuilding plan was enacted
in the early 1980s (Magnuson et al. 1994). However,
recent assessments indicate that the western stock has
continued to decline (ICCAT 2005, p. 81–88). One
likely factor contributing to the decline of the western
stock is the incidental catch of breeding fish by pe-
lagic longline fisheries operating in the GOM (Block
et al. 2005). There is currently no directed fishery for
this species in the GOM but observer and logbook
data from the National Marine Fisheries Service and
scientific longlining data indicate that there is sub-
stantial bycatch of Atlantic bluefin tuna in the GOM
during the breeding season (Block et al. 2005).
The warm ambient temperatures on their breeding
grounds in the GOM potentially present a distinct
physiological challenge to these large, endothermic fish
(Sharp and Vlymen 1978; Blank et al. 2004; Block et al.
2005; Kitagawa et al. 2006). Electronic tagging studies
have shown that Atlantic bluefin tuna can experience
very warm water temperatures (as high as 29.8�C) on
their breeding grounds in the GOM (Block et al. 2001,
2005). Due to the bluefin tuna’s ability to conserve
heat, Sharp and Vlymen (1978) hypothesized that the
fish may be vulnerable to overheating in warm waters,
especially during bouts of intense activity. In a series of
laboratory experiments, Blank et al. (2004) have shown
that Pacific bluefin tuna cardiac function is extremely
temperature sensitive and studies at the cellular level
indicate an acute sensitivity to calcium uptake in
Atlantic and Pacific bluefin tunas (Landeira-Fernandez
et al. 2004; P.C. Castilho, A.M. Landeira-Fernandez,
and B.A. Block, unpublished data). At high tempera-
tures > 30�C, bluefin hearts have a reduced calcium
uptake capacity. This suggests that cardiac output is
reduced at high temperatures. Body temperatures as
high as 30.7�C have been recorded by electronic tags
inside the peritoneal cavity of Atlantic bluefin tuna in
the GOM (Block et al. 2001). If the giant Atlantic
bluefin tuna are unable to change their rate of heat
transfer and diving behavior in response to warm
ambient temperatures, the fish spawning in the GOM
during June may become more vulnerable to over-
heating and hypoxia.
In this study, we used electronic tags to compare the
movement patterns, diving behavior, and thermal
biology during different phases of the Atlantic bluefin
tuna’s breeding migration into the GOM. As the
2 Mar Biol (2007) 151:1–18
123
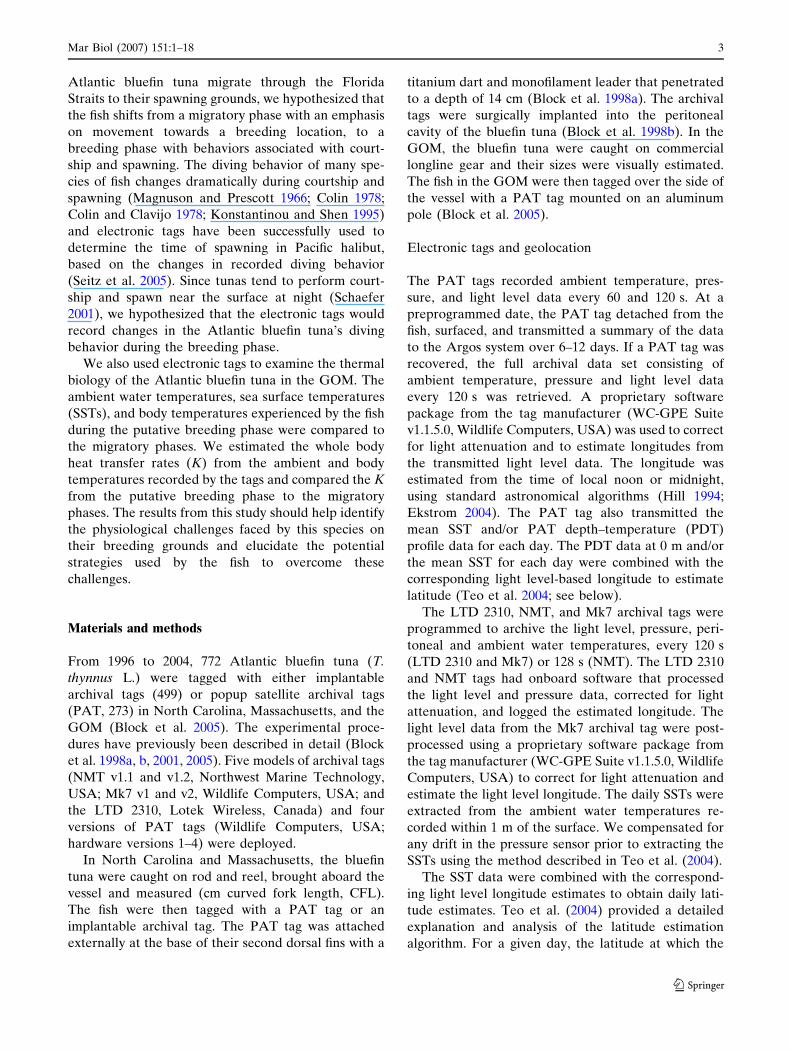
Atlantic bluefin tuna migrate through the Florida
Straits to their spawning grounds, we hypothesized that
the fish shifts from a migratory phase with an emphasis
on movement towards a breeding location, to a
breeding phase with behaviors associated with court-
ship and spawning. The diving behavior of many spe-
cies of fish changes dramatically during courtship and
spawning (Magnuson and Prescott 1966; Colin 1978;
Colin and Clavijo 1978; Konstantinou and Shen 1995)
and electronic tags have been successfully used to
determine the time of spawning in Pacific halibut,
based on the changes in recorded diving behavior
(Seitz et al. 2005). Since tunas tend to perform court-
ship and spawn near the surface at night (Schaefer
2001), we hypothesized that the electronic tags would
record changes in the Atlantic bluefin tuna’s diving
behavior during the breeding phase.
We also used electronic tags to examine the thermal
biology of the Atlantic bluefin tuna in the GOM. The
ambient water temperatures, sea surface temperatures
(SSTs), and body temperatures experienced by the fish
during the putative breeding phase were compared to
the migratory phases. We estimated the whole body
heat transfer rates (K) from the ambient and body
temperatures recorded by the tags and compared the K
from the putative breeding phase to the migratory
phases. The results from this study should help identify
the physiological challenges faced by this species on
their breeding grounds and elucidate the potential
strategies used by the fish to overcome these
challenges.
Materials and methods
From 1996 to 2004, 772 Atlantic bluefin tuna (T.
thynnus L.) were tagged with either implantable
archival tags (499) or popup satellite archival tags
(PAT, 273) in North Carolina, Massachusetts, and the
GOM (Block et al. 2005). The experimental proce-
dures have previously been described in detail (Block
et al. 1998a, b, 2001, 2005). Five models of archival tags
(NMT v1.1 and v1.2, Northwest Marine Technology,
USA; Mk7 v1 and v2, Wildlife Computers, USA; and
the LTD 2310, Lotek Wireless, Canada) and four
versions of PAT tags (Wildlife Computers, USA;
hardware versions 1–4) were deployed.
In North Carolina and Massachusetts, the bluefin
tuna were caught on rod and reel, brought aboard the
vessel and measured (cm curved fork length, CFL).
The fish were then tagged with a PAT tag or an
implantable archival tag. The PAT tag was attached
externally at the base of their second dorsal fins with a
titanium dart and monofilament leader that penetrated
to a depth of 14 cm (Block et al. 1998a). The archival
tags were surgically implanted into the peritoneal
cavity of the bluefin tuna (Block et al. 1998b). In the
GOM, the bluefin tuna were caught on commercial
longline gear and their sizes were visually estimated.
The fish in the GOM were then tagged over the side of
the vessel with a PAT tag mounted on an aluminum
pole (Block et al. 2005).
Electronic tags and geolocation
The PAT tags recorded ambient temperature, pres-
sure, and light level data every 60 and 120 s. At a
preprogrammed date, the PAT tag detached from the
fish, surfaced, and transmitted a summary of the data
to the Argos system over 6–12 days. If a PAT tag was
recovered, the full archival data set consisting of
ambient temperature, pressure and light level data
every 120 s was retrieved. A proprietary software
package from the tag manufacturer (WC-GPE Suite
v1.1.5.0, Wildlife Computers, USA) was used to correct
for light attenuation and to estimate longitudes from
the transmitted light level data. The longitude was
estimated from the time of local noon or midnight,
using standard astronomical algorithms (Hill 1994;
Ekstrom 2004). The PAT tag also transmitted the
mean SST and/or PAT depth–temperature (PDT)
profile data for each day. The PDT data at 0 m and/or
the mean SST for each day were combined with the
corresponding light level-based longitude to estimate
latitude (Teo et al. 2004; see below).
The LTD 2310, NMT, and Mk7 archival tags were
programmed to archive the light level, pressure, peri-
toneal and ambient water temperatures, every 120 s
(LTD 2310 and Mk7) or 128 s (NMT). The LTD 2310
and NMT tags had onboard software that processed
the light level and pressure data, corrected for light
attenuation, and logged the estimated longitude. The
light level data from the Mk7 archival tag were post-
processed using a proprietary software package from
the tag manufacturer (WC-GPE Suite v1.1.5.0, Wildlife
Computers, USA) to correct for light attenuation and
estimate the light level longitude. The daily SSTs were
extracted from the ambient water temperatures re-
corded within 1 m of the surface. We compensated for
any drift in the pressure sensor prior to extracting the
SSTs using the method described in Teo et al. (2004).
The SST data were combined with the correspond-
ing light level longitude estimates to obtain daily lati-
tude estimates. Teo et al. (2004) provided a detailed
explanation and analysis of the latitude estimation
algorithm. For a given day, the latitude at which the
Mar Biol (2007) 151:1–18 3
123
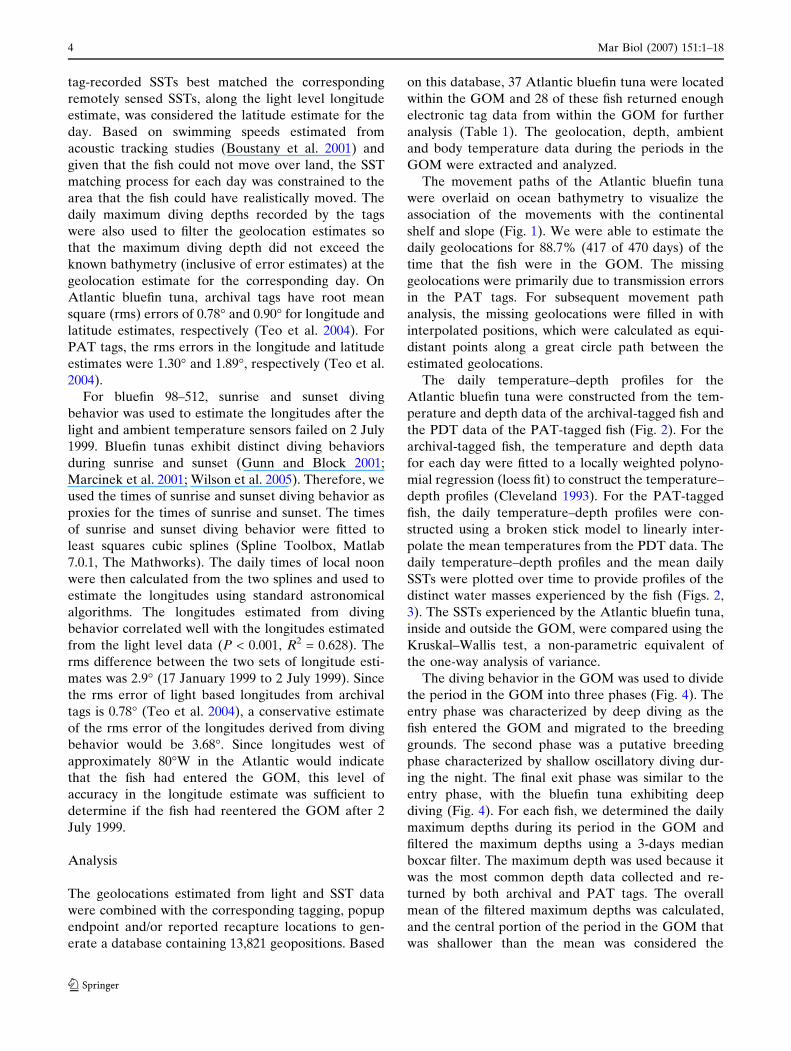
tag-recorded SSTs best matched the corresponding
remotely sensed SSTs, along the light level longitude
estimate, was considered the latitude estimate for the
day. Based on swimming speeds estimated from
acoustic tracking studies (Boustany et al. 2001) and
given that the fish could not move over land, the SST
matching process for each day was constrained to the
area that the fish could have realistically moved. The
daily maximum diving depths recorded by the tags
were also used to filter the geolocation estimates so
that the maximum diving depth did not exceed the
known bathymetry (inclusive of error estimates) at the
geolocation estimate for the corresponding day. On
Atlantic bluefin tuna, archival tags have root mean
square (rms) errors of 0.78� and 0.90� for longitude and
latitude estimates, respectively (Teo et al. 2004). For
PAT tags, the rms errors in the longitude and latitude
estimates were 1.30� and 1.89�, respectively (Teo et al.
2004).
For bluefin 98–512, sunrise and sunset diving
behavior was used to estimate the longitudes after the
light and ambient temperature sensors failed on 2 July
1999. Bluefin tunas exhibit distinct diving behaviors
during sunrise and sunset (Gunn and Block 2001;
Marcinek et al. 2001; Wilson et al. 2005). Therefore, we
used the times of sunrise and sunset diving behavior as
proxies for the times of sunrise and sunset. The times
of sunrise and sunset diving behavior were fitted to
least squares cubic splines (Spline Toolbox, Matlab
7.0.1, The Mathworks). The daily times of local noon
were then calculated from the two splines and used to
estimate the longitudes using standard astronomical
algorithms. The longitudes estimated from diving
behavior correlated well with the longitudes estimated
from the light level data (P < 0.001, R2 = 0.628). The
rms difference between the two sets of longitude esti-
mates was 2.9� (17 January 1999 to 2 July 1999). Since
the rms error of light based longitudes from archival
tags is 0.78� (Teo et al. 2004), a conservative estimate
of the rms error of the longitudes derived from diving
behavior would be 3.68�. Since longitudes west of
approximately 80�W in the Atlantic would indicate
that the fish had entered the GOM, this level of
accuracy in the longitude estimate was sufficient to
determine if the fish had reentered the GOM after 2
July 1999.
Analysis
The geolocations estimated from light and SST data
were combined with the corresponding tagging, popup
endpoint and/or reported recapture locations to gen-
erate a database containing 13,821 geopositions. Based
on this database, 37 Atlantic bluefin tuna were located
within the GOM and 28 of these fish returned enough
electronic tag data from within the GOM for further
analysis (Table 1). The geolocation, depth, ambient
and body temperature data during the periods in the
GOM were extracted and analyzed.
The movement paths of the Atlantic bluefin tuna
were overlaid on ocean bathymetry to visualize the
association of the movements with the continental
shelf and slope (Fig. 1). We were able to estimate the
daily geolocations for 88.7% (417 of 470 days) of the
time that the fish were in the GOM. The missing
geolocations were primarily due to transmission errors
in the PAT tags. For subsequent movement path
analysis, the missing geolocations were filled in with
interpolated positions, which were calculated as equi-
distant points along a great circle path between the
estimated geolocations.
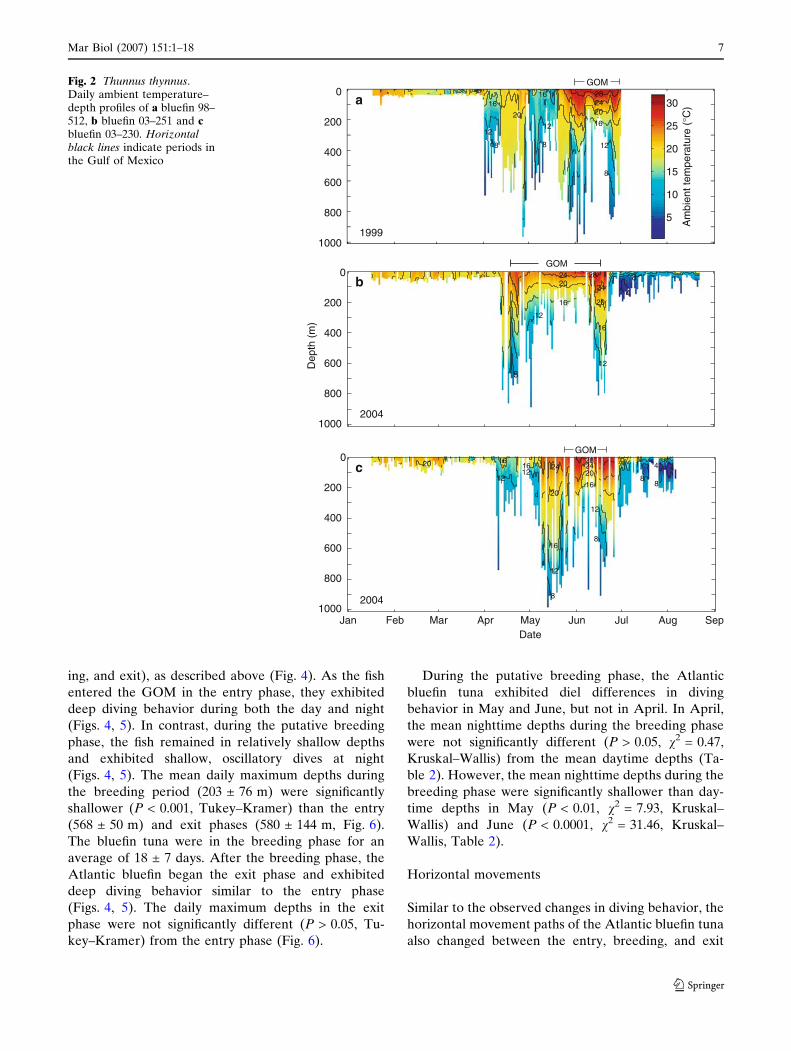
The daily temperature–depth profiles for the
Atlantic bluefin tuna were constructed from the tem-
perature and depth data of the archival-tagged fish and
the PDT data of the PAT-tagged fish (Fig. 2). For the
archival-tagged fish, the temperature and depth data
for each day were fitted to a locally weighted polyno-
mial regression (loess fit) to construct the temperature–
depth profiles (Cleveland 1993). For the PAT-tagged
fish, the daily temperature–depth profiles were con-
structed using a broken stick model to linearly inter-
polate the mean temperatures from the PDT data. The
daily temperature–depth profiles and the mean daily
SSTs were plotted over time to provide profiles of the
distinct water masses experienced by the fish (Figs. 2,
3). The SSTs experienced by the Atlantic bluefin tuna,
inside and outside the GOM, were compared using the
Kruskal–Wallis test, a non-parametric equivalent of
the one-way analysis of variance.
The diving behavior in the GOM was used to divide
the period in the GOM into three phases (Fig. 4). The
entry phase was characterized by deep diving as the
fish entered the GOM and migrated to the breeding
grounds. The second phase was a putative breeding
phase characterized by shallow oscillatory diving dur-
ing the night. The final exit phase was similar to the
entry phase, with the bluefin tuna exhibiting deep
diving (Fig. 4). For each fish, we determined the daily
maximum depths during its period in the GOM and
filtered the maximum depths using a 3-days median
boxcar filter. The maximum depth was used because it
was the most common depth data collected and re-
turned by both archival and PAT tags. The overall
mean of the filtered maximum depths was calculated,
and the central portion of the period in the GOM that
was shallower than the mean was considered the
4 Mar Biol (2007) 151:1–18
123
breeding phase. Subsequently, the diving behavior
from the three phases was visually examined to ensure
that the algorithm performed adequately. The unfil-
tered maximum daily depths for the three GOM pha-
ses of each fish were compared using the Kruskal–
Wallis test, combined with post hoc Tukey–Kramer
multi-comparison tests.
Two measures were used to determine if there was
significant site residency or directed movement during
these three putative phases in the GOM. The mean
squared distance (MSD) from the center of activity is a
measure of the dispersion of the locations, with a low
MSD indicating high site residency (Schoener 1981;
Spencer et al. 1990). The center of activity was calcu-
lated as the mean of the geolocations and the MSD of
the geolocations from the center of activity was then
calculated. The linearity index (LI) is a measure of the
linearity of the movement path (Spencer et al. 1990).
The LI was calculated as the linear distance between
the endpoints divided by the path distance. A LI
approaching one would indicate directed, linear
movement while a low LI would indicate a sinuous
path. For each fish, the MSD and LI scores within a 5-
days boxcar window were calculated and the mean
MSD and LI score for each phase and fish were then
calculated. The mean MSD and LI scores for the three
phases were compared using the Kruskal–Wallis test,
combined with post hoc Tukey–Kramer tests.
The SST, depth, ambient and body temperature data
from the entry and exit phases were compared with the
putative breeding phase. The SST data from all tags
were separated into the three phases in the GOM and
compared using the Kruskal–Wallis test, combined
with post hoc Tukey–Kramer tests. We also used the
data from archival and recovered PAT tags to detect
diel differences in the diving behavior and temperature
during the three phases. The transmitted data from
PAT tags were not used because the data were not
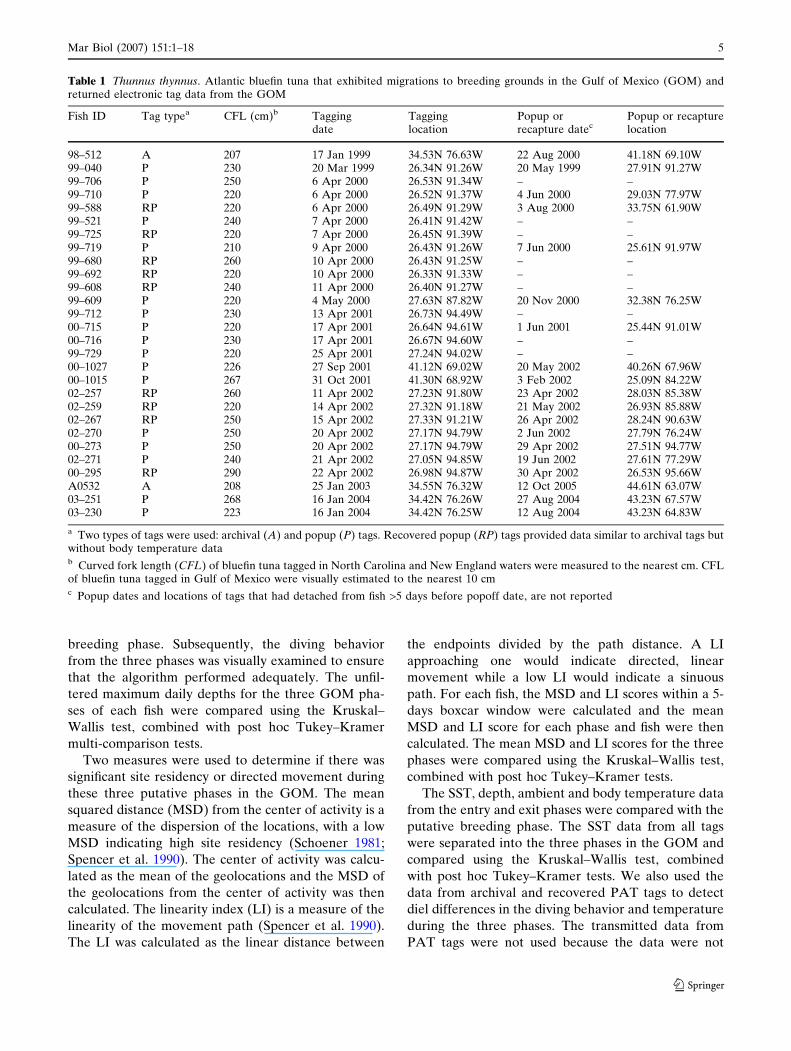
Table 1 Thunnus thynnus. Atlantic bluefin tuna that exhibited migrations to breeding grounds in the Gulf of Mexico (GOM) andreturned electronic tag data from the GOM
Fish ID Tag typea CFL (cm)b Taggingdate
Tagginglocation
Popup orrecapture datec
Popup or recapturelocation
98–512 A 207 17 Jan 1999 34.53N 76.63W 22 Aug 2000 41.18N 69.10W99–040 P 230 20 Mar 1999 26.34N 91.26W 20 May 1999 27.91N 91.27W99–706 P 250 6 Apr 2000 26.53N 91.34W – –99–710 P 220 6 Apr 2000 26.52N 91.37W 4 Jun 2000 29.03N 77.97W99–588 RP 220 6 Apr 2000 26.49N 91.29W 3 Aug 2000 33.75N 61.90W99–521 P 240 7 Apr 2000 26.41N 91.42W – –99–725 RP 220 7 Apr 2000 26.45N 91.39W – –99–719 P 210 9 Apr 2000 26.43N 91.26W 7 Jun 2000 25.61N 91.97W99–680 RP 260 10 Apr 2000 26.43N 91.25W – –99–692 RP 220 10 Apr 2000 26.33N 91.33W – –99–608 RP 240 11 Apr 2000 26.40N 91.27W – –99–609 P 220 4 May 2000 27.63N 87.82W 20 Nov 2000 32.38N 76.25W99–712 P 230 13 Apr 2001 26.73N 94.49W – –00–715 P 220 17 Apr 2001 26.64N 94.61W 1 Jun 2001 25.44N 91.01W00–716 P 230 17 Apr 2001 26.67N 94.60W – –99–729 P 220 25 Apr 2001 27.24N 94.02W – –00–1027 P 226 27 Sep 2001 41.12N 69.02W 20 May 2002 40.26N 67.96W00–1015 P 267 31 Oct 2001 41.30N 68.92W 3 Feb 2002 25.09N 84.22W02–257 RP 260 11 Apr 2002 27.23N 91.80W 23 Apr 2002 28.03N 85.38W02–259 RP 220 14 Apr 2002 27.32N 91.18W 21 May 2002 26.93N 85.88W02–267 RP 250 15 Apr 2002 27.33N 91.21W 26 Apr 2002 28.24N 90.63W02–270 P 250 20 Apr 2002 27.17N 94.79W 2 Jun 2002 27.79N 76.24W00–273 P 250 20 Apr 2002 27.17N 94.79W 29 Apr 2002 27.51N 94.77W02–271 P 240 21 Apr 2002 27.05N 94.85W 19 Jun 2002 27.61N 77.29W00–295 RP 290 22 Apr 2002 26.98N 94.87W 30 Apr 2002 26.53N 95.66WA0532 A 208 25 Jan 2003 34.55N 76.32W 12 Oct 2005 44.61N 63.07W03–251 P 268 16 Jan 2004 34.42N 76.26W 27 Aug 2004 43.23N 67.57W03–230 P 223 16 Jan 2004 34.42N 76.25W 12 Aug 2004 43.23N 64.83W
a Two types of tags were used: archival (A) and popup (P) tags. Recovered popup (RP) tags provided data similar to archival tags butwithout body temperature datab Curved fork length (CFL) of bluefin tuna tagged in North Carolina and New England waters were measured to the nearest cm. CFLof bluefin tuna tagged in Gulf of Mexico were visually estimated to the nearest 10 cmc Popup dates and locations of tags that had detached from fish >5 days before popoff date, are not reported
Mar Biol (2007) 151:1–18 5
123

separated into day and night. The depth, ambient and
body temperature data from the day and night of the
three phases were compared using the Kruskal–Wallis
test, combined with post hoc Tukey–Kramer tests. In
addition, the mean day and night depths during the
breeding phase were related to the mean SST, using
robust linear regression.
The whole body heat transfer coefficient (K) of
Atlantic bluefin tuna during their period in the GOM
was examined in relation to body temperature (Tb)
and ambient water temperature (Ta). The tag data
from the GOM were first divided into hourly periods.
For each period, we assumed that the whole body heat
transfer of the tuna was in non-steady state conditions,
where the rate of change of the body temperature,
dTb/dt, can be described by
d Tb
dt¼ K Tb� Tað Þ þ d TbMET
dt;
where t is the time interval and dTbMET/dt is the rate
of change in the body temperature due to metabolic
heat production (Neill and Stevens 1974; Holland et al.
1992; Dewar et al. 1994). We used an optimization
approach to estimate K and dTbMET/dt for each period
(Neill and Stevens 1974; Holland et al. 1992). The Tb
for each period was modeled using the above equation
and we used non-linear least-squares optimization
(Levenberg–Marquardt method, Dennis 1977) to esti-
mate the K and dTbMET/dt that would provide the
smallest sum of squares between the observed and
modeled Tb (Optimization Toolbox, Matlab 7.0.1, The
Mathworks). The estimated K values were examined in
relation to the corresponding mean Tb and Ta. In
addition, the K values from the breeding phase were
compared with the entry and exit phases using the
Kruskal–Wallis test, combined with post hoc Tukey–
Kramer tests. All statistical tests in this study were
performed with the Statistics Toolbox in Matlab 7.0.1
(The Mathworks). Unless stated otherwise, all errors in
this paper are reported as one SD.
Results
The movements of three representative Atlantic blue-
fin tuna (T. thynnus) that exhibited breeding migra-
tions to the GOM are presented (Fig. 1). The bluefin
tuna that entered the GOM during the breeding season
were associated with feeding aggregations in North
Carolina, mid-Atlantic Bight, and New England waters
(Fig. 1). The fish entered the GOM from early Feb-
ruary to early June and left the GOM by the end of
June, staying in the GOM for an average of
39 ± 11 days. The bluefin tuna experienced the
warmest sustained ambient temperatures of each track
during the period in the GOM (Fig. 2). The SSTs
experienced by the fish inside the GOM (26.4 ± 1.6�C)
were significantly warmer (P < 0.0001, v2 = 19.9,
Kruskal–Wallis) than outside the GOM (20.2 ± 1.9�C,
Fig. 3).
Diving behavior
The diving behavior of the Atlantic bluefin tuna in the
GOM was delineated into three phases (entry, breed-
a
b
Fig. 1 Thunnus thynnus. Tracks of three Atlantic bluefin tunathat were tagged off North Carolina and migrated to the Gulf ofMexico in the spawning season. a Track of bluefin 98–512,archival tagged on 17 January 1999. Light level and ambienttemperature sensors failed on 2 July 1999. b Tracks of bluefins03–251 (circles) and 03–230 (triangles), both tagged with PATtags off North Carolina on 16 January 2004
6 Mar Biol (2007) 151:1–18
123
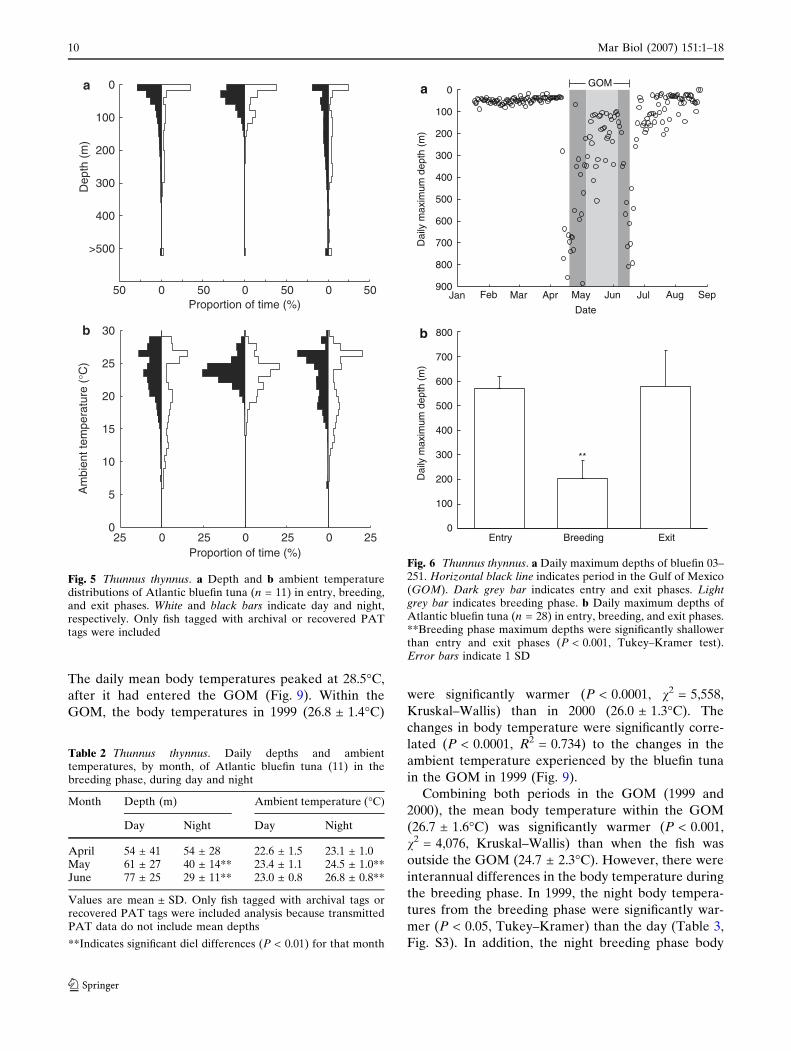
ing, and exit), as described above (Fig. 4). As the fish
entered the GOM in the entry phase, they exhibited
deep diving behavior during both the day and night
(Figs. 4, 5). In contrast, during the putative breeding
phase, the fish remained in relatively shallow depths
and exhibited shallow, oscillatory dives at night
(Figs. 4, 5). The mean daily maximum depths during
the breeding period (203 ± 76 m) were significantly
shallower (P < 0.001, Tukey–Kramer) than the entry
(568 ± 50 m) and exit phases (580 ± 144 m, Fig. 6).
The bluefin tuna were in the breeding phase for an
average of 18 ± 7 days. After the breeding phase, the
Atlantic bluefin began the exit phase and exhibited
deep diving behavior similar to the entry phase
(Figs. 4, 5). The daily maximum depths in the exit
phase were not significantly different (P > 0.05, Tu-
key–Kramer) from the entry phase (Fig. 6).
During the putative breeding phase, the Atlantic
bluefin tuna exhibited diel differences in diving
behavior in May and June, but not in April. In April,
the mean nighttime depths during the breeding phase
were not significantly different (P > 0.05, v2 = 0.47,
Kruskal–Wallis) from the mean daytime depths (Ta-
ble 2). However, the mean nighttime depths during the
breeding phase were significantly shallower than day-
time depths in May (P < 0.01, v2 = 7.93, Kruskal–
Wallis) and June (P < 0.0001, v2 = 31.46, Kruskal–
Wallis, Table 2).
Horizontal movements
Similar to the observed changes in diving behavior, the
horizontal movement paths of the Atlantic bluefin tuna
also changed between the entry, breeding, and exit
0
200
400
600
800
10001999
282420
16
12
12
16
20
12
16
8
8 8
30
25
20
15
10
5 Am
bien
t tem
pera
ture
(°C
)
0
200
400
600
800
1000
2420
16
12
28
24
20
16
12
4
8
8
2004
Jan Feb Mar SepAugJulApr May Jun
0
200
400
600
800
1000
282420
1612
16
12
8
1612
24
20
16
12
8
4
8
4
8
20
2004
Dep
th (
m)
Date
c
b
aGOM
GOM
GOM
Fig. 2 Thunnus thynnus.Daily ambient temperature–depth profiles of a bluefin 98–512, b bluefin 03–251 and cbluefin 03–230. Horizontalblack lines indicate periods inthe Gulf of Mexico
Mar Biol (2007) 151:1–18 7
123
phases. The MSD scores during the entry (3.45 ± 2.01 ·104 km2) and exit (5.17 ± 2.00 · 104 km2) phases were
significantly higher (P < 0.05, Tukey–Kramer) than the
MSD scores in the putative breeding phase (0.60 ±
0.41 · 104 km2, Fig. 7), indicating that the fish were
significantly more residential during the breeding phase.
Similarly, the LI scores during the deep diving entry
(0.841 ± 0.074) and exit (0.905 ± 0.044) phases were
significantly higher (P < 0.05, Tukey–Kramer) than the
LI scores in the putative breeding phase (0.565 ± 0.131,
Fig. S1), indicating that the movement paths were signifi-
cantly more linear during the entry and exit phases.
Ambient temperatures
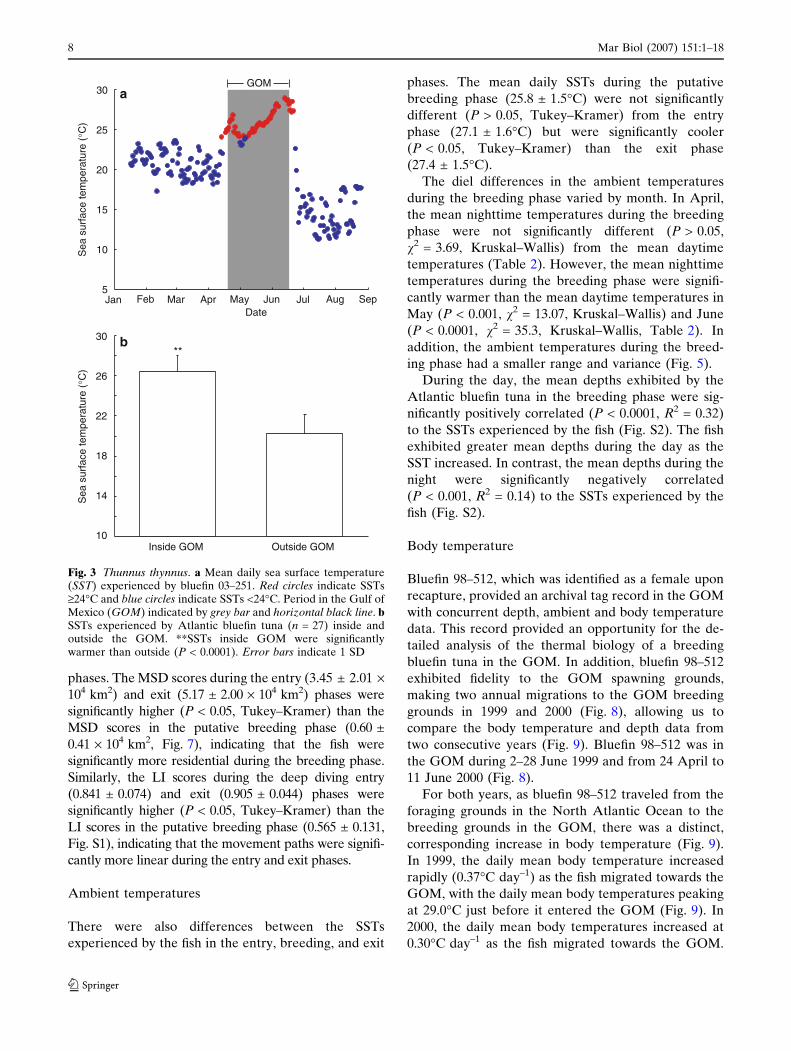
There were also differences between the SSTs
experienced by the fish in the entry, breeding, and exit
phases. The mean daily SSTs during the putative
breeding phase (25.8 ± 1.5�C) were not significantly
different (P > 0.05, Tukey–Kramer) from the entry
phase (27.1 ± 1.6�C) but were significantly cooler
(P < 0.05, Tukey–Kramer) than the exit phase
(27.4 ± 1.5�C).
The diel differences in the ambient temperatures
during the breeding phase varied by month. In April,
the mean nighttime temperatures during the breeding
phase were not significantly different (P > 0.05,
v2 = 3.69, Kruskal–Wallis) from the mean daytime
temperatures (Table 2). However, the mean nighttime
temperatures during the breeding phase were signifi-
cantly warmer than the mean daytime temperatures in
May (P < 0.001, v2 = 13.07, Kruskal–Wallis) and June
(P < 0.0001, v2 = 35.3, Kruskal–Wallis, Table 2). In
addition, the ambient temperatures during the breed-
ing phase had a smaller range and variance (Fig. 5).
During the day, the mean depths exhibited by the
Atlantic bluefin tuna in the breeding phase were sig-
nificantly positively correlated (P < 0.0001, R2 = 0.32)
to the SSTs experienced by the fish (Fig. S2). The fish
exhibited greater mean depths during the day as the
SST increased. In contrast, the mean depths during the
night were significantly negatively correlated
(P < 0.001, R2 = 0.14) to the SSTs experienced by the
fish (Fig. S2).
Body temperature
Bluefin 98–512, which was identified as a female upon
recapture, provided an archival tag record in the GOM
with concurrent depth, ambient and body temperature
data. This record provided an opportunity for the de-
tailed analysis of the thermal biology of a breeding
bluefin tuna in the GOM. In addition, bluefin 98–512
exhibited fidelity to the GOM spawning grounds,
making two annual migrations to the GOM breeding
grounds in 1999 and 2000 (Fig. 8), allowing us to
compare the body temperature and depth data from
two consecutive years (Fig. 9). Bluefin 98–512 was in
the GOM during 2–28 June 1999 and from 24 April to
11 June 2000 (Fig. 8).
For both years, as bluefin 98–512 traveled from the
foraging grounds in the North Atlantic Ocean to the
breeding grounds in the GOM, there was a distinct,
corresponding increase in body temperature (Fig. 9).
In 1999, the daily mean body temperature increased
rapidly (0.37�C day–1) as the fish migrated towards the
GOM, with the daily mean body temperatures peaking
at 29.0�C just before it entered the GOM (Fig. 9). In
2000, the daily mean body temperatures increased at
0.30�C day–1 as the fish migrated towards the GOM.
Sea
sur
face
tem
pera
ture
(°C
)30
25
20
15
10
5Jan Feb Mar Apr May Jun Jul Aug Sep
Date
GOMa
30
26
22
18
14
10Inside GOM Outside GOM
Sea
sur
face
tem
pera
ture
(°C
)
**b
Fig. 3 Thunnus thynnus. a Mean daily sea surface temperature(SST) experienced by bluefin 03–251. Red circles indicate SSTs‡24�C and blue circles indicate SSTs <24�C. Period in the Gulf ofMexico (GOM) indicated by grey bar and horizontal black line. bSSTs experienced by Atlantic bluefin tuna (n = 27) inside andoutside the GOM. **SSTs inside GOM were significantlywarmer than outside (P < 0.0001). Error bars indicate 1 SD
8 Mar Biol (2007) 151:1–18
123

1000
800
600
400
200
0
22-Jun-99 23-Jun-99 24-Jun-99 25-Jun-99 26-Jun-99 27-Jun-99 28-Jun-99 29-Jun-99
40
30
20
10
0
1000
800
600
400
200
0
15-Jun-99 16-Jun-99 17-Jun-99 18-Jun-99 19-Jun-99 21-Jun-99 22-Jun-99
40
30
20
10
0
1000
800
600
400
200
0
8-Jun-99 9-Jun-99 10-Jun-99 11-Jun-99 12-Jun-99 13-Jun-99 14-Jun-99 15-Jun-99
40
30
20
10
0
1000
800
600
400
200
0
1-Jun-99 2-Jun-99 3-Jun-99 4-Jun-99 5-Jun-99 6-Jun-99 7-Jun-99 8-Jun-99
40
30
20
10
0
Date (EST)
Dep
th (
m)
Temperature (°C
)Entry
Breeding
Breeding
Exit20-Jun-99
Fig. 4 Thunnus thynnus. Depth (black), ambient temperature (blue) and body temperature (red) of bluefin 98–512 in June 1999 (insideGOM). Vertical grey bars indicate nighttime. Horizontal black lines indicate entry, breeding, and exit phases
Mar Biol (2007) 151:1–18 9
123
The daily mean body temperatures peaked at 28.5�C,
after it had entered the GOM (Fig. 9). Within the
GOM, the body temperatures in 1999 (26.8 ± 1.4�C)
were significantly warmer (P < 0.0001, v2 = 5,558,
Kruskal–Wallis) than in 2000 (26.0 ± 1.3�C). The
changes in body temperature were significantly corre-
lated (P < 0.0001, R2 = 0.734) to the changes in the
ambient temperature experienced by the bluefin tuna
in the GOM in 1999 (Fig. 9).
Combining both periods in the GOM (1999 and
2000), the mean body temperature within the GOM
(26.7 ± 1.6�C) was significantly warmer (P < 0.001,
v2 = 4,076, Kruskal–Wallis) than when the fish was
outside the GOM (24.7 ± 2.3�C). However, there were
interannual differences in the body temperature during
the breeding phase. In 1999, the night body tempera-
tures from the breeding phase were significantly war-
mer (P < 0.05, Tukey–Kramer) than the day (Table 3,
Fig. S3). In addition, the night breeding phase body
0
100
200
300
400
>500
Dep
th (
m)
0 0 050 5050 50Proportion of time (%)
a
30
25
20
15
10
5
0
Am
bien
t tem
pera
ture
(°C
)
0 0 025 2525 25Proportion of time (%)
b
Fig. 5 Thunnus thynnus. a Depth and b ambient temperaturedistributions of Atlantic bluefin tuna (n = 11) in entry, breeding,and exit phases. White and black bars indicate day and night,respectively. Only fish tagged with archival or recovered PATtags were included
GOM
Jan Feb Mar Apr May Jun Jul Aug Sep
Date
Dai
ly m
axim
um d
epth
(m
)
0
100
200
300
400
500
600
700
800
900
a
Entry Breeding Exit
Dai
ly m
axim
um d
epth
(m
)
800
700
600
500
400
300
200
100
0
b
**
Fig. 6 Thunnus thynnus. a Daily maximum depths of bluefin 03–251. Horizontal black line indicates period in the Gulf of Mexico(GOM). Dark grey bar indicates entry and exit phases. Lightgrey bar indicates breeding phase. b Daily maximum depths ofAtlantic bluefin tuna (n = 28) in entry, breeding, and exit phases.**Breeding phase maximum depths were significantly shallowerthan entry and exit phases (P < 0.001, Tukey–Kramer test).Error bars indicate 1 SD
Table 2 Thunnus thynnus. Daily depths and ambienttemperatures, by month, of Atlantic bluefin tuna (11) in thebreeding phase, during day and night
Month Depth (m) Ambient temperature (�C)
Day Night Day Night
April 54 ± 41 54 ± 28 22.6 ± 1.5 23.1 ± 1.0May 61 ± 27 40 ± 14** 23.4 ± 1.1 24.5 ± 1.0**June 77 ± 25 29 ± 11** 23.0 ± 0.8 26.8 ± 0.8**
Values are mean ± SD. Only fish tagged with archival tags orrecovered PAT tags were included analysis because transmittedPAT data do not include mean depths
**Indicates significant diel differences (P < 0.01) for that month
10 Mar Biol (2007) 151:1–18
123

temperatures were also significantly warmer (P < 0.05,
Tukey–Kramer) than both the day and night body
temperatures from the entry and exit phases (Table 3).
In contrast, the night body temperatures during the
breeding phase in 2000 were not significantly different
(P > 0.05, Tukey–Kramer) from the day (Table 3, Fig.
S3). However, both the day and night body tempera-
tures during the breeding phase in 2000 were signifi-
cantly warmer (P < 0.05, Tukey–Kramer) than the day
and night body temperatures from the entry and exit
phases (Table 3).
There were large diel differences in the whole body
heat transfer coefficient, K, of bluefin 98–512 during
the breeding phase in 1999. These diel differences were
most likely related to changes in the diving behavior of
the fish during the putative breeding phase, which re-
sulted in the fish experiencing warmer ambient and
body temperatures. During the breeding phase, the K
was significantly higher at night (P < 0.001, Tukey–
Kramer) than the day (Fig. 10; Table 3). There were
no significant diel differences in the K during the entry
and exit phases (P > 0.05, Tukey–Kramer, Table 3).
During the night of the breeding phase, bluefin 98–512
spent 29% of its time in the mixed layer (10 m,
Fig. 10), which resulted in the fish experiencing sig-
nificantly warmer ambient temperatures (P < 0.05,
Tukey–Kramer, Table 3). The warmer ambient tem-
peratures would in turn result in higher K values be-
cause K changed in relation to changing ambient and
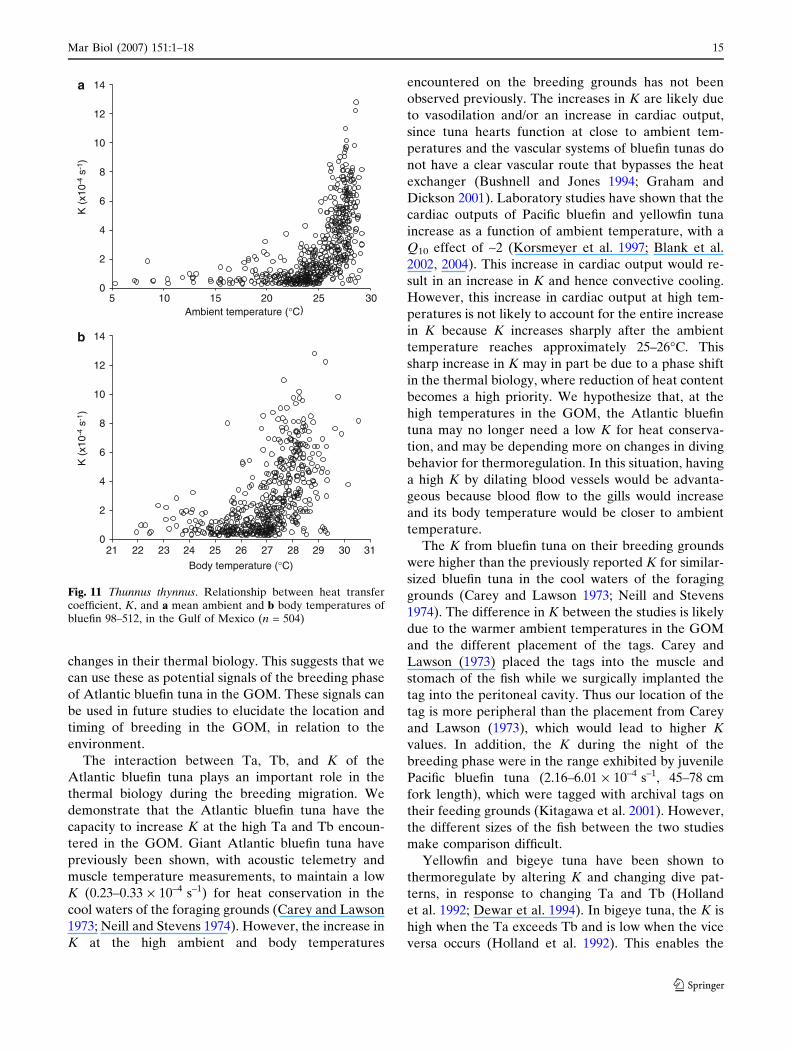
body temperatures (Fig. 11). The K of bluefin 98–512
was small at low ambient and body temperatures but
increased rapidly at high temperatures (Fig. 11).
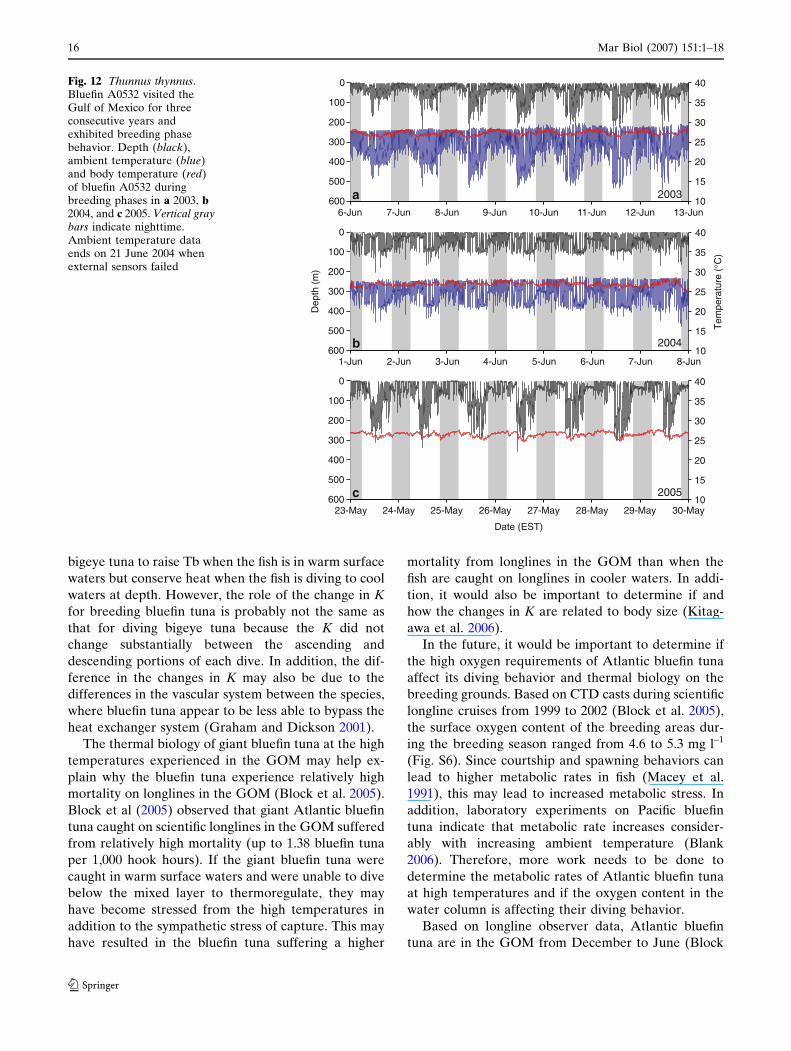
Bluefin tuna A0532 also exhibited fidelity to the
GOM spawning grounds, making three annual
migrations to the GOM breeding grounds from 2003
to 2005 (Fig. S4). This allowed us to compare the
ambient and body temperature, and depth data from
three consecutive years (Fig. 12). The depth and
thermal patterns of bluefin A0532 appeared similar to
bluefin 98–512. For all three years, the body temper-
atures during the breeding phases were significantly
warmer (2003, 27.1 ± 0.7�C, P < 0.05; 2004,
26.7 ± 0.6�C, P < 0.05; 2005, 26.5 ± 0.5�C, P < 0.05;
Tukey–Kramer) than the entry and exit phases. This
was likely related to the shallow diving and warm
ambient temperatures during the breeding phase (Fig.
S5). Bluefin A0532 also exhibited similar shallow
oscillatory diving during breeding phase nights for all
three years (Fig. 12).
9
8
7
6
5
4
3
2
1
0Jan Feb Mar Apr May Jun Jul Aug Sep
Date
Mea
n sq
uare
d di
stan
ce (
x104
km
2 )GOMa
b
Entry Breeding Exit
Mea
n sq
uare
d di
stan
ce (
x104
km
2 )
8
7
6
5
4
3
2
1
0
*
Fig. 7 Thunnus thynnus. a Mean squared distances (MSDs) ofbluefin 03–251. Horizontal black line indicates period in Gulf ofMexico (GOM). Dark grey bar indicates entry and exit phases.Light grey bar indicates breeding phase. b MSDs of Atlanticbluefin tuna (n = 14) during the entry, breeding, and exit phases.*Breeding phase MSDs were significantly lower than entry andexit phases (P < 0.05, Tukey–Kramer test). Error bars indicate 1SD
95Longitude (°W)
90 70758085 65
Jan 99
Mar 99
May 99
Jul 99
Sep 99
Nov 99
Jan 00
Mar 00
Jul 00
Sep 00
DeploymentLongitude from lightLongitude from divingRecovery
Dat
e
May 00
Fig. 8 Thunnus thynnus. Longitude estimates of bluefin 98–512from light level data (red circles, 17 January 1999–2 July 1999),and from sunrise and sunset diving behavior (blue diamonds, 3July 1999–21 August 2000). Horizontal grey bars indicate rootmean square errors of longitude estimates
Mar Biol (2007) 151:1–18 11
123

Discussion
We used electronic tags to discern the distinct diving
behaviors, horizontal movements, and thermal biology
of Atlantic bluefin tuna (T. thynnus) on their breeding
grounds in the GOM and defined the entry, breeding,
and exit phases from the electronic tag data.
The entry and exit phases were characterized by
deep diving and rapid, directed movement paths into
and out of the GOM. The deep diving during the entry
and exit phases most likely represents an attempt to
thermoregulate or reduce the energetic cost of swim-
ming against the Loop Current. The deep diving would
allow the fish to avoid the Loop Current, which is very
warm and rapidly advects out of the GOM. Impor-
tantly, the reduced cost of locomotion from deep div-
ing would only apply to the entry phase because it
would likely be energetically cheaper to swim within
the Loop Current during the exit phase. Therefore, the
deep diving in the exit phase suggests that this behavior
is, at least in part, an attempt to avoid the warm surface
waters and thermoregulate. However, we cannot rule
32
28
24
20
16
12
8
4J F M A M J J A S O N D J F M A M J J A S
1999
Am
bien
t tem
pera
ture
(°C
)
b
Date
J F M A M J J A S O N D J F M A M J J A S
1999
0
200
400
600
800
1000
Dep
th (
m)
2000
c
34
30
24
20
16
12J F M A M J J A S O N D J F M A M J J A S
1999 2000
Bod
y te
mpe
ratu
re (
°C)
a
Fig. 9 Thunnus thynnus. Daily mean a body temperature, bambient temperature and c depth of bluefin 98–512 (archivaltag). Grey areas indicate daily range of temperatures and depths(minimum to maximum). Vertical dashed lines indicate periods in
the Gulf of Mexico. Arrows indicate peak of body temperaturesrecorded on breeding migrations from the North Atlantic intothe GOM. Ambient temperature data ends on 2 July 1999 whenexternal sensors failed
12 Mar Biol (2007) 151:1–18
123

out other possible explanations like avoidance of pre-
dators near the surface or foraging for prey, such as
squid in the deep ocean.
The Atlantic bluefin tuna exhibited directed move-
ment paths with high MSD and LI scores during the
entry and exit phases but switched to highly sinuous
movement paths with low MSD and LI scores during
the breeding phase. These changes in the MSD and LI
scores indicate that the bluefin tuna exhibited rela-
tively linear, directed movement paths during the entry
and exit phases but were relatively resident during the
breeding phase. This is consistent with the fish exhib-
iting periods of rapid migration to and from the
spawning areas but becoming relatively resident once
they reach the spawning area (Prince et al. 2005). The
bluefin tuna may be using environmental cues such as
water temperature and clarity to determine the timing
and location of spawning. However, more work needs
to be done to determine what these cues are and how
the bluefin tuna respond to these environmental sig-
nals.
The breeding phase is sandwiched between the entry
and exit phases and can be identified from distinctive
changes in the diving behavior, horizontal movements,
and thermal biology. Since we did not directly observe
the release of eggs and sperm into the water by the
tagged bluefin tuna, we do not have direct proof that
the fish were spawning during the breeding phase.
However, the gonads of bluefin tuna that were caught
on longlines in the same season and area, were exam-
ined using histological techniques and identified to be
in spawning condition (Block et al. 2005). In addition,
relatively high concentrations of bluefin tuna larvae
have been caught in the same region at the same time
of year (Richards et al. 1989; Tsuji et al. 1995; Nishida
et al. 1998). We also show that the Atlantic bluefin tuna
changed their diving behavior and movement paths
during the breeding phase, which we hypothesize to be
indicative of courtship and/or spawning behavior.
During the night in the breeding phase, the bluefin
tuna exhibited shallow diving behavior, which was
accompanied by frequent visits to the surface. This
behavior, which may be courtship or spawning behav-
ior, is in concordance with estimates of spawning times
for other species of tunas in the wild (McPherson 1991;
Nikaido et al. 1991; Schaefer 1996, 1998) and captive
populations of spawning Pacific bluefin tunas (S. Ma-
suma, Japan Sea Farming Association, personal com-
munication) and yellowfin tuna (Schaefer 2001). The
shallow diving during the breeding phase is not likely
due to the fish being restricted by the bathymetry of
the location because the breeding phase locations were
primarily on the continental slopes of the northern
GOM (Teo 2006). In addition, acoustic tracking of
Pacific bluefin tuna indicate that the fish exhibit similar
diving behavior on their breeding grounds in the East
China Sea (NRIFSF 2002; Kitagawa et al. 2006).
The changes in diving behavior during the breeding
phase were accompanied by changes in their thermal
biology. Due to the shallower diving in the breeding
phase, the fish experienced warmer ambient and body
temperature distributions. The shallow diving behavior
was more pronounced at night, leading to substantially
warmer night ambient and body temperatures (Table
3). The high ambient temperatures in the night led to a
fivefold increase in the heat transfer coefficient, K, as
compared to the day because K increases rapidly at
high temperatures. The fish exhibited distinct changes
in their diving behavior and horizontal movements
during the breeding phase, and experience distinct
Table 3 Thunnus thynnus. Mean depths, ambient water temperatures (Ta), body temperatures (Tb), and whole body heat transfercoefficients (K) of bluefin 98–512 during night and day of entry, breeding, and exit phases in the Gulf of Mexico
Entry Breeding Exit
Day Night Day Night Day Night
1999Depth (m) 147 ± 184 114 ± 127 84 ± 72 31 ± 25* 224 ± 158 119 ± 110Ta (�C) 23.7 ± 5.5 25.1 ± 4.2 23.5 ± 3.6 27.3 ± 1.8* 18.8 ± 5.5 23.2 ± 4.5Tb (�C) 26.8 ± 1.7 26.7 ± 1.3 27.1 ± 0.7 27.9 ± 0.5* 25.0 ± 1.2 25.6 ± 1.0K (10–4 s–1) 2.3 ± 2.4 2.5 ± 2.3 0.98 ± 1.3 5.4 ± 2.7* 0.7 ± 0.63 0.7 ± 0.8
2000b
Depth (m) 190 ± 129 103 ± 121 68 ± 104 44 ± 81* 194 ± 129 93 ± 103Tb (�C) 25.0 ± 0.8 25.2 ± 0.7 26.6 ± 1.2a 26.5 ± 1.2a 25.4 ± 1.4 26.2 ± 1.0
a Indicates Tb during day and night of breeding period in 2000 were significantly different (P < 0.05, Tukey-Kramer) from other fourperiodsb Only body temperature and depth data were available in 2000 because external sensors for bluefin 98–512 failed on 2 July 1999
*Indicates mean depth, Ta, Tb, and K during the night of breeding period were significantly different (P < 0.05, Tukey–Kramer) fromother five periods
Mar Biol (2007) 151:1–18 13
123

0
50
100
150
200
Dep
th (
m)
30
26
22
18
Am
bien
t tem
pera
ture
(°C
)
30
29
28
27
26
Bod
y te
mpe
ratu
re (
°C)
10
8
6
4
2
006:00 12:00 18:00 00:00 06:00
17 Jun 1999 18 Jun 1999
K (
x10-
4 s-
1 )0
50
100
150
200
Dep
th (
m)
15 20 25 30Ambient
temperature (°C)
a
b
c
d
e
Time
Fig. 10 Thunnus thynnus. Time-series of bluefin 98–512 during a24 h period (17–18 June 1999) in the breeding phase, a depth andb, ambient temperature, c correspondence of modeled (green) tomeasured body temperature (red). Grey bars indicate nighttime.
d Hourly heat transfer coefficient (K). White and black barsindicate day and night, respectively. e Temperature profile ofwater mass. Black line indicate best loess fit line
14 Mar Biol (2007) 151:1–18
123
changes in their thermal biology. This suggests that we
can use these as potential signals of the breeding phase
of Atlantic bluefin tuna in the GOM. These signals can
be used in future studies to elucidate the location and
timing of breeding in the GOM, in relation to the
environment.
The interaction between Ta, Tb, and K of the
Atlantic bluefin tuna plays an important role in the
thermal biology during the breeding migration. We
demonstrate that the Atlantic bluefin tuna have the
capacity to increase K at the high Ta and Tb encoun-
tered in the GOM. Giant Atlantic bluefin tuna have
previously been shown, with acoustic telemetry and
muscle temperature measurements, to maintain a low
K (0.23–0.33 · 10–4 s–1) for heat conservation in the
cool waters of the foraging grounds (Carey and Lawson
1973; Neill and Stevens 1974). However, the increase in
K at the high ambient and body temperatures
encountered on the breeding grounds has not been
observed previously. The increases in K are likely due
to vasodilation and/or an increase in cardiac output,
since tuna hearts function at close to ambient tem-
peratures and the vascular systems of bluefin tunas do
not have a clear vascular route that bypasses the heat
exchanger (Bushnell and Jones 1994; Graham and
Dickson 2001). Laboratory studies have shown that the
cardiac outputs of Pacific bluefin and yellowfin tuna
increase as a function of ambient temperature, with a
Q10 effect of ~2 (Korsmeyer et al. 1997; Blank et al.
2002, 2004). This increase in cardiac output would re-
sult in an increase in K and hence convective cooling.
However, this increase in cardiac output at high tem-
peratures is not likely to account for the entire increase
in K because K increases sharply after the ambient
temperature reaches approximately 25–26�C. This
sharp increase in K may in part be due to a phase shift
in the thermal biology, where reduction of heat content
becomes a high priority. We hypothesize that, at the
high temperatures in the GOM, the Atlantic bluefin
tuna may no longer need a low K for heat conserva-
tion, and may be depending more on changes in diving
behavior for thermoregulation. In this situation, having
a high K by dilating blood vessels would be advanta-
geous because blood flow to the gills would increase
and its body temperature would be closer to ambient
temperature.
The K from bluefin tuna on their breeding grounds
were higher than the previously reported K for similar-
sized bluefin tuna in the cool waters of the foraging
grounds (Carey and Lawson 1973; Neill and Stevens
1974). The difference in K between the studies is likely
due to the warmer ambient temperatures in the GOM
and the different placement of the tags. Carey and
Lawson (1973) placed the tags into the muscle and
stomach of the fish while we surgically implanted the
tag into the peritoneal cavity. Thus our location of the
tag is more peripheral than the placement from Carey
and Lawson (1973), which would lead to higher K
values. In addition, the K during the night of the
breeding phase were in the range exhibited by juvenile
Pacific bluefin tuna (2.16–6.01 · 10–4 s–1, 45–78 cm
fork length), which were tagged with archival tags on
their feeding grounds (Kitagawa et al. 2001). However,
the different sizes of the fish between the two studies
make comparison difficult.
Yellowfin and bigeye tuna have been shown to
thermoregulate by altering K and changing dive pat-
terns, in response to changing Ta and Tb (Holland
et al. 1992; Dewar et al. 1994). In bigeye tuna, the K is
high when the Ta exceeds Tb and is low when the vice
versa occurs (Holland et al. 1992). This enables the
14
12
10
8
6
4
2
05 10 15 20 25 30
K (
x10-
4 s-
1 )
Ambient temperature (°C)
a
14
12
10
8
6
4
2
0
K (
x10-
4 s-
1 )
21 22 23 24 25 26 27 28 29 3130
Body temperature (°C)
b
Fig. 11 Thunnus thynnus. Relationship between heat transfercoefficient, K, and a mean ambient and b body temperatures ofbluefin 98–512, in the Gulf of Mexico (n = 504)
Mar Biol (2007) 151:1–18 15
123
bigeye tuna to raise Tb when the fish is in warm surface
waters but conserve heat when the fish is diving to cool
waters at depth. However, the role of the change in K
for breeding bluefin tuna is probably not the same as
that for diving bigeye tuna because the K did not
change substantially between the ascending and
descending portions of each dive. In addition, the dif-
ference in the changes in K may also be due to the
differences in the vascular system between the species,
where bluefin tuna appear to be less able to bypass the
heat exchanger system (Graham and Dickson 2001).
The thermal biology of giant bluefin tuna at the high
temperatures experienced in the GOM may help ex-
plain why the bluefin tuna experience relatively high
mortality on longlines in the GOM (Block et al. 2005).
Block et al (2005) observed that giant Atlantic bluefin
tuna caught on scientific longlines in the GOM suffered
from relatively high mortality (up to 1.38 bluefin tuna
per 1,000 hook hours). If the giant bluefin tuna were
caught in warm surface waters and were unable to dive
below the mixed layer to thermoregulate, they may
have become stressed from the high temperatures in
addition to the sympathetic stress of capture. This may
have resulted in the bluefin tuna suffering a higher
mortality from longlines in the GOM than when the
fish are caught on longlines in cooler waters. In addi-
tion, it would also be important to determine if and
how the changes in K are related to body size (Kitag-
awa et al. 2006).
In the future, it would be important to determine if
the high oxygen requirements of Atlantic bluefin tuna
affect its diving behavior and thermal biology on the
breeding grounds. Based on CTD casts during scientific
longline cruises from 1999 to 2002 (Block et al. 2005),
the surface oxygen content of the breeding areas dur-
ing the breeding season ranged from 4.6 to 5.3 mg l–1
(Fig. S6). Since courtship and spawning behaviors can
lead to higher metabolic rates in fish (Macey et al.
1991), this may lead to increased metabolic stress. In
addition, laboratory experiments on Pacific bluefin
tuna indicate that metabolic rate increases consider-
ably with increasing ambient temperature (Blank
2006). Therefore, more work needs to be done to
determine the metabolic rates of Atlantic bluefin tuna
at high temperatures and if the oxygen content in the
water column is affecting their diving behavior.
Based on longline observer data, Atlantic bluefin
tuna are in the GOM from December to June (Block
6-Jun 7-Jun 8-Jun 9-Jun 10-Jun 11-Jun 12-Jun 13-Jun
0
100
200
300
400
500
600
40
35
30
25
20
15
102003a
1-Jun 2-Jun 3-Jun 4-Jun 5-Jun 6-Jun 7-Jun 8-Jun
40
35
30
25
20
15
10
Tem
pera
ture
(°C
)
0
100
200
300
400
500
600
Dep
th (
m)
2004b
40
35
30
25
20
15
10
Date (EST)
23-May 24-May 25-May 26-May 27-May 28-May 29-May 30-May
0
100
200
300
400
500
6002005c
Fig. 12 Thunnus thynnus.Bluefin A0532 visited theGulf of Mexico for threeconsecutive years andexhibited breeding phasebehavior. Depth (black),ambient temperature (blue)and body temperature (red)of bluefin A0532 duringbreeding phases in a 2003, b2004, and c 2005. Vertical graybars indicate nighttime.Ambient temperature dataends on 21 June 2004 whenexternal sensors failed
16 Mar Biol (2007) 151:1–18
123

et al. 2005; Teo 2006). In this study, most of the bluefin
tuna entered the GOM in April–June. One fish entered
the GOM in February but the tag did not return any
GOM data for analysis. It would therefore be impor-
tant, in the future, to obtain data from bluefin tuna that
enter the GOM in the winter months to see if their
biology and body size is different from the fish exam-
ined in this study. The bluefin tuna occupying the
GOM during the spawning season are extremely large
in body size, with the mean size of electronically tagged
bluefin tuna entering the GOM being 241 ± 28 cm
CFL (Block et al. 2005). The size frequency distribu-
tion of bluefin tuna caught by the U.S. pelagic longline
fleet in the GOM have also been reported previously to
be very large, with a mode of 251–300 kg (Nemerson
et al. 2000). This suggests that the median age to sexual
maturity for the western stock of Atlantic bluefin tuna
is closer to 11–12 year than the 8 year (assumed first
age to maturity) currently being used in ICCAT
assessment models. The use of electronic tagging data
to examine the biology of breeding Atlantic bluefin
tuna has provided managers with new information on
the areas of aggregation, the timing of breeding and
the size of fish at spawning. These data will improve
our understanding of the spawning bluefin tuna in the
western Atlantic and should be used to ensure their
future.
Acknowledgments This study could not have been conductedwithout the dedication and perseverance of the Tag-A-Giant(TAG) scientific team. We thank the captains and crews of the F/Vs Calcutta, Bullfrog, Raptor, Tightline, Leslie Anne, 40Something, Allison, Last Deal, and Shearwater. We also thank T.Williams, T. Sippel, R. Schallert, G. Shillinger, and numerousothers, for long hours at sea to help generate the data set. TheNational Marine Fisheries Service (NMFS) assisted us greatly intag recapture. The manuscript was improved by helpful com-ments from J. Blank and two anonymous reviewers. Funding forthis study was provided by the NOAA, NSF, Packard Founda-tion, Monterey Bay Aquarium Foundation, Disney ConservationFund, and the Pew Marine Conservation Fellows Program.
References
Baglin REJ (1982) Reproductive biology of western Atlanticbluefin tuna (Thunnus thynnus). Fish Bull 80:121–134
Blank JM (2006) Comparative studies of metabolic and cardiacphysiology in tunas. PhD thesis, Biological Sciences, Stan-ford University
Blank JM, Morrissette JM, Davie PS, Block BA (2002) Effects oftemperature, epinephrine and Ca2+ on the hearts ofyellowfin tuna (Thunnus albacares). J Exp Biol 205:1881–1888
Blank JM, Morrissette JM, Landeira-Fernandez AM, BlackwellSB, Williams TD, Block BA (2004) In situ cardiac perfor-mance of Pacific bluefin tuna hearts in response to acutetemperature change. J Exp Biol 207:881–890
Block BA, Finnerty JR (1994) Endothermy in fishes: a phylo-genetic analysis of constraints, predispositions, and selectionpressures. Environ Biol Fish 40:283–302
Block BA, Stevens ED (2001) Tunas: physiology, ecology, andevolution. Academic, San Diego
Block BA, Dewar H, Farwell C, Prince ED (1998a) A newsatellite technology for tracking the movements of Atlanticbluefin tuna. Proc Natl Acad Sci USA 95:9384–9389
Block BA, Dewar H, Williams T, Prince ED, Farwell C, Fudge D(1998b) Archival tagging of Atlantic bluefin tuna (Thunnusthynnus thynnus). Mar Technol Soc J 32:37–46
Block BA, Dewar H, Blackwell SB, Williams TD, Prince ED,Farwell CJ, Boustany A, Teo SLH, Seitz A, Walli A, FudgeD (2001) Migratory movements, depth preferences, andthermal biology of Atlantic bluefin tuna. Science 293:1310–1314
Block BA, Teo SLH, Walli A, Boustany A, Stokesbury MJW,Farwell CJ, Weng KC, Dewar H, Williams TD (2005)Electronic tagging and population structure of Atlanticbluefin tuna. Nature 434:1121–1127
Boustany A, Marcinek DJ, Keen JE, Dewar H, Block BA (2001)Movements and temperature preference of Atlantic bluefintuna (Thunnus thynnus) off North Carolina: a comparison ofacoustic, archival and pop-up satellite tagging. In: Sibert JR,Nielsen JL (eds) Electronic tagging and tracking in marinefishes. Kluwer, Dordrecht, pp 89–108
Bushnell PG, Jones DR (1994) Cardiovascular and respiratoryphysiology of tuna: adaptations for support of exceptionallyhigh metabolic rates. Environ Biol Fish 40:303–318
Carey FG, Lawson KD (1973) Temperature regulation in freeswimming bluefin tuna. Comp Biochem Physiol A 44:375–392
Clay D (1991) Atlantic bluefin tuna (Thunnus thynnus thynnusL.): a review. IATTC Spec Rep 7:89–180
Cleveland WS (1993) Visualizing data. Hobart Press, SummitColin PL (1978) Daily and summer–winter variation in mass
spawning of the striped parrotfish, Scarus croicensis. FishBull 76:117–124
Colin PL, Clavijo IE (1978) Mass spawning by the spottedgoatfish Pseudupeneus maculatus Pisces Mullidae. Bull MarSci 28:780–782
Dennis JE (1977) Non-linear least squares and equations. In:Jacobs D (ed) The state of the art in numerical analysis.Academic, New York, pp 269–312
Dewar H, Graham JB, Brill RW (1994) Studies of tropical tunaswimming performance in a large water tunnel.2. Thermo-regulation. J Exp Biol 192:33–44
Ekstrom PA (2004) An advance in geolocation by light. In: NaitoY (eds) Memoirs of the National Institue of Polar Research,Special Issue. National Institute of Polar Research, Tokyo,pp 210–226
Fromentin JM, Powers JE (2005) Atlantic bluefin tuna: popula-tion dynamics, ecology, fisheries and management. Fish Fish6:281–306
Graham JB, Dickson KA (2001) Anatomical and physiologicalspecializations for endothermy. In: Block BA, Stevens ED(eds) Tuna: physiology, ecology, and evolution. Academic,San Diego, pp 121–165
Graham JB, Dickson KA (2004) Tuna comparative physiology. JExp Biol 207:4015–4024
Gunn JS, Block BA (2001) Advances in acoustic, archival andsatellite tagging of tunas. In: Block BA, Stevens ED (eds)Tunas: physiology, ecology, and evolution. Academic, SanDiego, pp 167–224
Hill RD (1994) Theory of geolocation by light levels. In: LeBoeuf BJ, Laws RM (eds) Elephant seals: population
Mar Biol (2007) 151:1–18 17
123

ecology, behavior, and physiology. University of CaliforniaPress, Berkeley, pp 227–236
Holland KN, Brill RW, Chang RKC, Sibert JR, Fournier DA(1992) Physiological and behavioural thermoregulation inbigeye tuna (Thunnus obesus). Nature 358:410–412
ICCAT (2005) Report of the Standing Committee on Researchand Statistics, 2004–2005. ICCAT, Madrid, Spain
Kitagawa T, Nakata H, Kimura S, Tsuji S (2001) Thermocon-servation mechanisms inferred from peritoneal cavity tem-perature in free-swimming Pacific bluefin tuna Thunnusthynnus orientalis. Mar Ecol Prog Ser 220:253–263
Kitagawa T, Kimura S, Nakata H, Yamada H (2004) Divingbehavior of immature, feeding Pacific bluefin tuna (Thunnusthynnus orientalis) in relation to season and area: the EastChina Sea and the Kuroshio–Oyashio transition region. FishOceanogr 13:161–180
Kitagawa T, Kimura S, Nakata H, Yamada H (2006) Thermaladaptation of Pacific bluefin tuna, Thunnus orientalis, totemperate waters. Fish Sci 72:149–156
Konstantinou H, Shen DC (1995) The social and reproductivebehavior of the eyed flounder, Bothus ocellatus, with noteson the spawning of Bothus lunatus and Bothus ellipticus.Environ Biol Fish 44:311–324
Korsmeyer KE, Lai NC, Shadwick RE, Graham JB (1997) Heartrate and stroke volume contributions to cardiac output inswimming yellowfin tuna: response to exercise and temper-ature. J Exp Biol 20:1975–1986
Landeira-Fernandez AM, Morrissette JM, Blank JM, Block BA(2004) Temperature dependence of the Ca2+ – ATPase(SERCA2) in the ventricles of tuna and mackerel. Am JPhysiol 286:R398–404
Macey DJ, Clarke LM, Potter IC (1991) Basal oxygen consump-tion, ventilatory frequency and heart rate during theprotracted spawning run of the southern hemisphere lam-prey Geotria australis. J Comp Physiol B 161:525–531
Magnuson JJ, Prescott JH (1966) Courtship, locomotion, feed-ing, and miscellaneous behaviour of Pacific bonito (Sardachiliensis). Anim Behav 14:54–67
Magnuson JJ, Block BA, Deriso RB, Gold JR, Grant WS, QuinnTJ II, Saila SB, Shapiro L, Stevens ED (1994) An assess-ment of Atlantic bluefin tuna. National Academy Press,Washington
Marcinek DJ, Blackwell SB, Dewar H, Freund EV, Farwell C,Dau D, Seitz AC, Block BA (2001) Depth and muscletemperature of Pacific bluefin tuna examined with acousticand pop-up satellite tags. Mar Biol 138:869–885
Mather FJ, Mason JM Jr, Jones AC (1995) Historical document:life history and fisheries of Atlantic bluefin tuna. NOAATechnical Memorandum NMFS-SEFSC-370. NOAA, Miami
McPherson GR (1991) Reproductive biology of yellowfin tuna inthe eastern Australian Fishing Zone, with special referenceto the northwestern Coral Sea. Aust J Mar Freshw Res42:465–478
Neill WH, Stevens ED (1974) Thermal inertia versus thermo-regulation in warm turtles and tunas. Science 184:1008–1010
Nemerson D, Berkeley S, Safina C (2000) Spawning site fidelityin Atlantic bluefin tuna, Thunnus thynnus: the use of size-frequency analysis to test for the presence of migrant eastAtlantic bluefin tuna on Gulf of Mexico spawning grounds.Fish Bull 98:118–126
Nikaido H, Miyabe N, Ueyanagi S (1991) Spawning time andfrequency of bigeye tuna, Thunnus obesus. Bull Far SeasFish Res Lab (Shimizu) 28:47–74
Nishida T, Tsuji S, Segawa K (1998) Spatial data analyses ofAtlantic bluefin tuna larval surveys in the 1994 ICCATBYP. Coll Vol Sci Pap ICCAT 48:107–110
NRIFSF (2002) Report on the 2002 research cruise of the R/VShoyo Maru. National Research Institue of Far SeasFisheries, Shimizu, Japan
Prince ED, Cowen RK, Orbesen ES, Luthy SA, Llopiz JK,Richardson DE, Serafy JE (2005) Movements and spawningof white marlin (Tetrapturus albidus) and blue marlin(Makaira nigricans) off Punta Cana, Domincan Republic.Fish Bull 103:659–669
Richards WJ, Leming T, McGowan MF, Lamkin JT, Kelley-Fraga S (1989) Distribution of fish larvae in relation tohydrographic features of the Loop Current boundary in theGulf of Mexico. In: Blaxter JHS, Gamble JC, vonWesternhagen H (eds) The early life history of fish: the3rd ICES Symposium, Bergen, 3–5 October 1988. ICES,Copenhagen
Schaefer KM (1996) Spawning time, frequency, and batchfecundity of yellowfin tuna, Thunnus albacares, near Clipp-erton Atoll in the eastern Pacific Ocean. Fish Bull 94:98–112
Schaefer KM (1998) Reproductive biology of yellowfin tuna(Thunnus albacares) in the Eastern Pacific Ocean. Inter-AmTrop Tuna Comm Bull 21:205–272
Schaefer KM (2001) Reproductive biology of tunas. In: BlockBA, Stevens ED (eds) Tunas: physiology, ecology, andevolution. Academic, San Diego, pp 225–270
Schoener TW (1981) An empirically based estimate of homerange. Theor Popul Biol 20:281–325
Seitz AC, Norcross BL, Wilson D, Nielsen JL (2005) Identifyingspawning behaviour in Pacific halibut, Hippoglossus stenol-epis, using electronic tags. Environ Biol Fish 73:445–451
Sharp GD, Vlymen WJ (1978) The relation between heatgeneration, conservation, and the swimming energetics oftunas. In: Sharp GD, Dizon AE (eds) The physiologicalecology of tunas. Academic, San Diego, pp 213–232
Spencer SR, Cameron GN, Swihart RK (1990) Operationallydefining home range: temporal dependence exhibited byhispid cotton rats. Ecology 71:1817–1822
Stokesbury MJW, Teo SLH, Seitz A, O’Dor RK, Block BA(2004) Movement of Atlantic bluefin tuna (Thunnus thyn-nus) as determined by satellite tagging experiments initiatedoff New England. Can J Fish Aquat Sci 61:1976–1987
Teo SLH (2006) The biology and oceanography of Atlanticbluefin tuna on their breeding grounds. PhD Thesis,Biological Sciences, Stanford University
Teo SLH, Boustany A, Blackwell S, Walli A, Weng KC, BlockBA (2004) Validation of geolocation estimates based onlight level and sea surface temperature from electronic tags.Mar Ecol Prog Ser 283:81–98
Tsuji S, Segawa K, Hiroe Y, Uosaki K, Itoh T (1995) Atlanticbluefin tuna larval survey by the R/V Shoyo-Maru in 1994.Coll Vol Sci Pap ICCAT 44:398–401
Wilson SG, Lutcavage ME, Brill RW, Genovese MP, CooperAB, Everly AW (2005) Movements of bluefin tuna (Thun-nus thynnus) in the northwestern Atlantic Ocean recordedby pop-up satellite archival tags. Mar Biol 146:409–423
18 Mar Biol (2007) 151:1–18
123