
Reproductive status and body condition of Atlantic bluefin tuna in the Gulf of Maine, 2000–2002

ORIGINAL PAPER
Spike dives of juvenile southern bluefin tuna(Thunnus maccoyii): a navigational role?
Jay Willis & John Phillips & Rachel Muheim &
Francisco Javier Diego-Rasilla & Alistair J. Hobday
Received: 26 April 2009 /Revised: 21 June 2009 /Accepted: 22 June 2009# Springer-Verlag 2009
Abstract Tunas make sharp descents and ascents arounddawn and dusk called spike dives. We examine spike divesof 21 southern bluefin tuna (Thunnus maccoyii) implantedwith archival tags in the Great Australian Bight. Using anew way to categorize this behavior, we show that spikedives are similar among all the fish in the study. The diveprofiles are mirror images at dawn and dusk and areprecisely timed with respect to sunrise and sunset. Weanalyze the possible reasons for spike dives, consideringthe timing of spike dives, the characteristic dive profile, and
the tuna's magnetic habitat. In addition, we presentanatomical evidence for elaboration of the pineal organ,which is light mediated and has been implicated innavigation in other vertebrates. The new evidence presentedhere leads us to suspect that spike dives represent a surveyrelated to navigation.
Keywords Migration . Pineal gland . Compass .
Magnetic navigation . Polarized light . Archival tags
Introduction
Archival tag data from tuna often show distinctly shapedascents and descents at dawn and dusk known as spikedives. Precise light data at these times are helpful inestimating the fish's latitude and longitude, and so changesin light intensity caused by spike diving is often considereda nuisance (Welch and Eveson 1999; Teo et al. 2004). Spikediving is mentioned (rarely) in the scientific literature but iscommon among large pelagic predatory fish such as tuna(Gunn and Block 2001). Explanations that have beenproposed for spike diving by tuna include (1) locating thebase of the mixed layer, (2) surveying prey fields, (3)performing a geomagnetic survey for navigation, and (4)undertaking a general environmental survey of the watercolumn (Gunn and Block 2001).
In this study, we provide a description of spike dives,examine the behavior in the context of the sensorycapabilities and physical environment of tuna, and considera number of alternative explanations for spike dives. Weuse depth data from archival tags deployed on juvenilesouthern bluefin tuna (SBT, Thunnus maccoyii) to provide amore rigorous characterization of spike dives in place ofwhat has been, until now, anecdotal reporting about the
Communicated by W. Wiltschko
J. Willis :A. J. HobdayCSIRO Marine & Atmospheric Research,Castray Esplanade,Hobart, Tasmania 7000, Australia
J. Willis :A. J. HobdaySchool of Zoology and QMS, University of Tasmania,Hobart, Australia
J. Willis (*)HR Wallingford Ltd.,Howbery Park,Wallingford, Oxfordshire OX10 8BA, UKe-mail: [email protected]
J. PhillipsDepartment of Biological Sciences,Virginia Polytechnic Institute and State University,Blacksburg, VA, USA
R. MuheimDepartment of Animal Ecology, Lund University,Lund, Sweden
F. J. Diego-RasillaDepartamento de Biología Animal, Universidad de Salamanca,Salamanca, Spain
Behav Ecol SociobiolDOI 10.1007/s00265-009-0818-2

timing and frequency of this behavior. The tuna used in thisstudy were tagged and recovered in the Great AustralianBight. Presentation of spatial movements derived from thelight data has been partly published elsewhere (Bestley etal. 2008). All the tuna in this study were migratory andperformed long range movements during the time they weretagged. The round trip journeys, which were not explicableby ocean current advection, ranged between 5,000 and16,000 km. These annual cyclical journeys are thought tobe motivated by the feeding ecology of juvenile SBT(Bestley et al. 2008).
Our analysis shows that spike dives are a distinct andhabitual behavior for juvenile SBT with a precise associa-tion with dawn and dusk. The shape and timing inrelationship to the physical environment led us to suggesta number of new hypotheses about the navigational systemof juvenile tuna that we hope will lead to productiveavenues for future research. Navigational ability is criticalto the life cycle of various tuna species (Bakun and Broad2003). Tuna undertake migrations over thousands of kilo-meters (Sharp and Dizon 1978; Gunn and Block 2001) andcan return to locations with fidelity of less than 10 km(Klimley and Holloway 1999; Ohta and Kakuma 2005).Adult SBT travel over 8,000 km from Southern Oceanfeeding grounds to return to their only known spawningground south of Indonesia (Davis and Farley 2001;Patterson et al. 2008). As a consequence, sensory mecha-nisms and behavioral strategies that increase the accuracyof long-distance movements should be strongly favored bynatural selection. Both the characteristic shape of spikedives and their precise timing with respect to uniquepatterns and changes of light near sunrise and sunset leadus to ask if the explanation for this behavior lies in navi-gation. Tuna have well-developed eyes. Tuna also have apineal window, which allows sunlight to illuminate part ofthe surface of the brain through a hole in their skull. In allspecies of tuna, the pineal apparatus penetrates the skullthrough an oval window between the eyes (Sharp andDizon 1978). Cells on the outer surface of the pineal glandare similar to retinal photoreceptors (Murphy 1971). Thepineal instrument, which is remarkably elaborated in tuna(and for which there is no other explanation of function), isrelated to navigation in other vertebrates (Deutschlander etal. 1999). Since both sensory organs are light mediated, wediscuss both the pineal and the eyes with respect to abehavioral explanation of spike dives.
Since spike diving may not be related to navigation butto some other purpose such as hunting, we also investigatethis possible explanation. Organisms that form the deepscattering layer (DSL) undergo diurnal vertical migrationaround dawn and dusk (Burd & Lee 1951), as do the largeranimals that feed on the DSL and may be target prey itemsfor tuna (Dagorn et al. 2000; Onsrud et al. 2004; Schaefer
and Fuller 2003). The DSL and its diurnal verticalmigration is a worldwide phenomenon, and observationsduring a solar eclipse have shown that the verticalmovement is light mediated (Kampa 1974). The DSLranges in depth during the day from 100 to 500 m andmoves toward the surface during the night. We considerwhether tracking the movement of the DSL might providean alternative explanation for the characteristic pattern ofspike diving in juvenile SBT.
Materials and methods
We used data from 20 archival tags (type MK7, WildlifeComputers, Redmond, USA, http://www.wildlifecomputers.com) that recorded light, external temperature, depth, andinternal temperature every 4 min. All tags were surgicallyimplanted into SBT in the Great Australian Bight (GAB)between 1998 and 2002 and were recovered as part of thejuvenile SBT monitoring program (Davis 2002). The fishwere at liberty for between 135 and 494 days and ranged insize from 71 to 110 cm [length to caudal fork (LCF) atrelease]. Fish grow up to 30 cm in length per year at this age(Laslett et al. 2002); however, size was only known at thetime of release for the majority of fish. Therefore release sizewas used, without correction, in the analysis. We estimateddawn and dusk from the tag's raw light trace, when the lightintensity was at 50% of the difference between maximumand minimum light level recorded during each 24-h period.The tunas' positions, calculated using the archival tag lighttrace, ranged from the southern Indian Ocean to the TasmanSea with an accuracy of about 1º latitude or longitude(Bestley et al. 2008). Analysis was conducted usingprograms written in Matlab (http://www.mathworks.com).
One additional tag (type MK9, Wildlife Computers,Redmond, USA, http://www.wildlifecomputers.com) sampledat an interval of 20 s. This tag was deployed December 19th2005 (32.67° S, 133.17° W) in a juvenile SBT (LCF, 96 cm)released in the GAB, which was at liberty for 65 days. Thistag was used to test if sampling frequency of 4 min for theset of 20 tags accurately described the vertical components ofspike dives. We tested this by sub-sampling the 20 s tag in all(12) variations of 4 min intervals and comparing the resultsto each other and to the full 20 s dataset.
Initial exploration of dive characteristics—definitionof a spike dive
Spike dives were initially defined as the deepest point in thedepth record within a 16-min period around the times ofdawn and dusk (defined from the 50% light thresholdexplained above). The 16-min interval was approximatelythe minimum duration of the characteristically shaped dive
Behav Ecol Sociobiol

profile. For initial exploration, we extracted all the depthrecords for two arbitrarily chosen fish (Table 1, fish 55 and56, over 394 and 305 days at liberty) for the period arounddawn/dusk, then aligned and averaged these for all days atliberty in order to compare mean spike dive profiles.
Timing of spike dives and sun elevation
For each daily estimated geographic location derived fromthe light data, we determined the elevation of the sun fromthe NASA sun elevation model (http://ecco2.jpl.nasa.gov/data1/matlab/air_sea/sunrise.m) at the time of the spike andcalculated the time of the spike in relation to the time ofsunset and sunrise for the estimated position.
Hypotheses and statistical tests
The hypotheses tested with respect to the 20 tags, whichsampled depth at 4-min intervals were as follows:
& H1: Dawn spike ascent rates are indistinguishable fromascent or descent rates at other times selected randomlyfor each fish.
& H2: Dusk spike descent rates are indistinguishable fromascent or descent rates at other times selected randomlyfor each fish.
& H3: Dawn spike ascent rates are indistinguishable frominverted dusk spike descent rates for each fish.
Dives were not classified as “spike” or “no spike,” andthus, all dawns and dusks were treated similarly for all fish.Data from dawns and dusks were not included if the calculatedday length was illogical or other corruption of the data wassuspected (i.e. during times when tuna were caught andtransported in cages and thus unable to move naturally).
We used two sample Student's t tests to test the hypothesesthat one group of dive statistics was indistinguishable fromanother. The use of t tests is appropriate given the intentionto demonstrate, in a robust way, broad simple relation-ships about spike dives and their similarities withoutobfuscation by complex statistical treatment (Murtaugh2007). Hypotheses were rejected at a confidence level of95% (α=0.05). For comparison with dives not madearound dawn and dusk, we used randomly selected timesduring the day and treated them in a similar way to timesthat had been identified as dawn or dusk by the 50% light
Table 1 Hypotheses tests based on the frequency distribution of ascent or descent rates of spike dives for 20 southern bluefin tuna (Thunnusmaccoyii) that were tagged in the Great Australian Bight with archival tags
Fishnumber
DateReleased
Releaselatitude °S.
Releaselongitude °E
Days atliberty
LengthLCF (cm)
H1 H2 H3 Mean dawn spikeascent rate (m/4min)
Mean dusk spikedescent rate (m/4min)
55 3-Jan-98 32.18 132.6 394 97 R R R 78.28 -94.57
56 26-Jan-98 33.11 132 305 90 R R NR 75.67 -84.39
57 26-Jan-98 33.28 131.43 388 98 R R R 62.57 -81.17
58 17-Feb-00 33.57 132.15 241 99 R R NR 72.27 -72.20
59 26-Jan-98 33.28 131.43 225 100 R R R 73.21 -89.49
60 3-Jan-98 32.8 132.6 446 98 R R R 56.45 -68.55
61 1-Mar-99 33.3 131.48 232 110 R R NR 79.39 -76.94
62 17-Feb-00 33.57 132.15 299 99 R R R 63.33 -76.67
63 17-Feb-00 33.57 132.15 286 104 R R NR 67.56 -68.45
64 26-Jan-98 33.28 131.43 208 98 R R NR 64.65 -68.47
65 3-Jan-98 32.8 132.6 330 93 R R NR 73.20 -70.07
66 3-Jan-98 32.8 132.6 336 96 R R NR 66.83 -78.21
70 14-Feb-01 34.08 123.45 334 72 R R NR 51.97 -56.61
71 14-Feb-01 34.08 132.45 418 71 R R NR 37.30 -39.81
72 17-Feb-00 33.57 132.15 369 99 R R NR 64.42 -60.59
73 17-Feb-00 33.57 132.15 406 106 R R NR 65.88 -73.42
75 1-Mar-99 33.3 131.48 135 102 R R NR 80.58 -78.89
76 26-Jan-98 33.12 132 494 97 R R NR 63.69 -73.61
78 21-Feb-02 32.63 132.62 330 87 R R NR 48.48 -48.19
79 19-Feb-02 33.62 132.32 275 105 R R NR 72.24 -68.50
Hypotheses tests: H1—dawn spike ascent rates are indistinguishable from other times selected randomly; H2—dusk spike descent rates areindistinguishable from other times selected randomly; H3—dawn spike ascents are indistinguishable from inverted dusk spike descents for this fish
R rejected at α=0.05, NR not rejected
Behav Ecol Sociobiol

threshold described above; that is, we identified themaximum rate of ascent or descent within a 16-mininterval around a randomly selected time.
Maximum ascent and descent rates may be related tomaximum sustained swimming speed. Generally, as the fishis swimming in a three-dimensional space, we are unable toinfer swimming speed from only depth and time data;however, the maximum rate may indicate a criticalswimming speed. We made a comparison of dawn anddusk spike dive ascent or descent rates between eachunique pair of fish (20 fish=190 unique fish–fish compar-isons for dawn and dusk) to determine if maximum ascentor descent rate was correlated with fish size. We calculateda ratio of rejected hypotheses to non-rejected hypothesesfor each set of t tests for a given size-difference interval anddetermined correlation by linear regression analysis.
Visualization of the pineal apparatus
We made a magnetic resonance imaging (MRI) scan of thehead of an albacore tuna (Thunnus alalunga LCF 100 cm)
to visualize the pineal apparatus using a human medicalscanner. This similar species was used instead of SBT, as agood quality SBT specimen was not available when accessto the MRI equipment was permitted. The head had beenfrozen immediately after death and was thawed to roomtemperature for the scan.
Results
Spike dive characteristics
Spike dives are evident in archival tag depth time series(Fig. 1). The characteristic components include a near-surface visit immediately preceding or following the steepside of the dive. There is considerable variability in thedepth of spike dives recorded in these data (50–605 m), butthe characteristic shape remains consistent and lasted from15 min to 1 h. Figure 1b shows a day with spike dives of upto 400 m in depth, more than double the depth of any otheractivity during the day, while Fig. 1c shows the converse,
0 50 100 150 200 250 300 350-100
0
100
200
300
0 50 100 150 200 250 300 350-400
-200
0
200
400
0 50 100 150 200 250 300 350-400
-200
0
200
400
Night
Light
Depth
0 50 100 150 200 250 300 350-300
-200
-100
0
100
200
300
Dep
th (
m),
Lig
ht (
units
)
A B
C D
Time (4 min intervals)Time (4 min intervals)
Time (4 min intervals)Time (4 min intervals)
Fig. 1 Spike dives (circled). a Depth and light for southern bluefintuna (Thunnus maccoyii) number 57 on 7 July 1998 in the GreatAustralian Bight (approximate position—33° S, 133° W). The tunawas fitted with an archival tag, which sampled every 4 min and hadbeen at liberty for 163 days. Typical spike dives occur when the lightdecreases at dusk and increases at dawn. b Very prominent spike
dives, fish number 79, 138 days at liberty (6 July 2002). cCharacteristic shape spike dives among activity at greater depth inboth day and night, fish number 58, 202 days at liberty (5 August2000). d Spikes apparently truncated by sea floor at 70 m with tips16 min wide, fish number 55, after 21 days at liberty (23 January1998)
Behav Ecol Sociobiol

spike dives, which are characteristic in shape but much lessprominent than other activity during the day and night.Sometimes, the spikes appear truncated (Fig. 1d), and itappears that depth truncation is due to the sea floor(because there are no other dives deeper than the base ofthe truncated spikes in the 24-h period); however, theremainder of the characteristic spike dive profile is retained.
Exploratory analysis of the two arbitrarily selected tagsshows that mean dawn spike dives are mirror images of themean dusk spike dives (Fig. 2). The depth of the meanspikes and their characteristic shape are similar between thetwo fish. This analysis shows that maximum rate of ascentor descent around dawn and dusk is a good indicator ofboth the magnitude of spike dive and the characteristicsequence of spike dive components and was used through-out the remaining analysis as a single datum to characterizeand identify a spike dive.
Spike dive characteristics inferred from coarse temporalscale tags
The total number of dives identified from 6,451 total dayswas 5,072 at dawn (76.3% of days) and 5,495 at dusk(85.2%), for a total of 10,567 dives (Table 1). Themaximum dawn ascent rate was 386 m in 4 min(96.5 m min−1), and the maximum dusk spike dive descentwas 605 m in 4 min (151 m min−1). Maximum duskdescent rate was greater than maximum dawn ascent rate in18 out of 20 fish. The two groups of maxima dawn to dusk
were significantly different from each other (paired t test;t38=4.28, p<0.001).
Spike dive characteristics inferred from fine temporalscale tag
Spike dives for an archival tag recording depth at 20-sintervals were extracted using the same method as for the4-min tags. Maximum dawn spike dive ascent rate was84 m in 20-s interval (4.38 body lengths per second,252 m min−1), and the maximum dusk descent rate was66.5 m in 20 s (3.46 body lengths per second,199.5 m min−1). The mean of the dawn spike ascent rateswas 90 m min−1±145 m min−1 (mean±1 SD), and the meanof dusk descent rates was 112.5±100 m min−1. Mean dawnand dusk dives were mirror images of each other (Fig. 3)and are different from dives at points chosen randomly andtreated in the same way as those at dawn and dusk (Fig. 4).Re-sampling the 20 s tag to replicate a 4-min tag (12 pointre-sampling) showed that the mean difference in determin-ing the maximum depth using 12 re-samples was 11.7%±9.5% (mean±1 SD), n=130 spike dives, and the meandifference in determination of maximum ascent or descentrate in one measurement interval using 12 re-samples was5.58%±3.7% (mean±1 SD), n=130 spike dives. Thus, thecomponents of spike dives were sampled relatively accu-rately with a 4-min sampling interval, and so, the larger4-min tag data set is suitable for describing the behaviors inthe subsequent sections. The mean speed of ascent ordescent is more accurately determined with the 20-s tag;
Dep
th (
m)
Minutes around spike position
Fig. 2 Qualitative comparison of mean spike dives between dawn anddusk and between fish. Mean depth around all spike dives for southernbluefin tuna numbers 55 and 56, over 394 and 305 days. Spikeposition calculated as deepest point within 16 min of the time of 50%light from archival tag data. The mirror image of the dusk profile isshown for direct comparison and is similar in shape to the dawnprofile. The mean position (±1 standard deviation) of sunrise or sunsetrelative to all spikes is shown as blue vertical lines
-32 -28 -24 -20 -16 -12 -8 -4 0 4 8 12 16 20 24-100
-90
-80
-70
-60
-50
-40
-30
-20
-10
0
Minutes around time of spike
Dep
th (
m)
Dawn
Dusk (inverted)
Fig. 3 Mean and one standard deviation of depth around spike divesfor southern bluefin tuna number 1,046 for 65 days at liberty with a20-s sampling tag. The dusk profile has been inverted laterally forcomparison with dawn. The graph shows that the mean dawn divesare a mirror image of the mean dusk and of a similar depth andgradient. Treatments of points randomly chosen for dusk and dawnshow no spike profiles
Behav Ecol Sociobiol

however, the relative ascent and descent rates within onemeasurement interval are well sampled by the 4-min tag.
Frequency distribution of dive gradients
Frequency density plots of maximum rate of ascent ordescent during dawn and inverted dusk spike dives and thatof dives within a 16-min interval around randomly chosentimes, for one fish over 305 days, shows similarity betweenspike dives and differentiation between spike dives anddives at randomly selected times (Fig. 4). In both cases, thefrequency distributions are better fitted with a logisticprobability distribution function (PDF) rather than a normalPDF as determined by least log likelihood (dfittool.m,http://www.mathworks.com). This indicates that the groupsof gradients are more tightly constrained around one ormore values than if they were normally randomly distrib-uted. Nevertheless, the distributions were not significantlydifferent from normally distributed (Jarque-Bera test, jbtest.m http://www.mathworks.com); therefore, it is acceptableto compare distributions using a t test. This pattern of
frequency distributions was similar for all fish in the studyjustifying the use of two sample t tests for statisticalcomparison of spike dive data.
Timing of spike dives and sun elevation
Spike dives are offset by about 30 min on the dark side ofsunrise or sunset, which corresponds to a sun elevation ofabout −6º at both times of the day (Table 2); that is, thehighest rate of ascent (immediately following the deepestpoint of the spike dive) of dawn spike dives occursapproximately 30 minutes before sunrise, and the highestrate of descent (immediately before reaching the deepestpoint of the spike dive) of the dusk dive occurs approxi-mately 30 min after sunset. A plot of relative frequency ofdepth data less than 20 m (Fig. 5) demonstrates that there isa maximum between the main depth change and thecalculated position of sunrise or sunset; this suggests thatthe fish were more often closer to the surface during thisperiod than at other times during the characteristic spikedive pattern.
Hypothesis tests and correlation to length
The distributions of both dawn and dusk dives weresignificantly different from those of dives chosen at randomtimes (Table 1). In 15 of 20 cases (75%), the dusk diveswere indistinguishable from the mirror image dawn divesfor the same fish (Table 1).
The differences in mean ascent or descent rate for dawndives and dusk dives were positively and significantlycorrelated to the differences in fish size using linearregression (dusk, R2=0.36, p=0.005; dawn, R2=0.53, p<0.001; Fig. 6). Descent rates are slightly higher than theascent rates, but the difference is not statistically significant(paired t test, t38=1.45, p=0.15). The more similar the fishare in length, the more similar are their maximum rates ofascent or descent (Fig. 7), indicating that the speed ofascent/descent may be constrained by fish size.
MRI scan and physiological examination
The MRI scan shows the whole pineal apparatus in situ(Fig. 8). Physiological examination of the tuna (Thunnus
-300 -200 -100 0 100 200 300 400 5000
0.002
0.004
0.006
0.008
0.01
0.012
0.014
Gradient of dive m/4 min
Fre
quen
cy d
ensi
ty
Logistic fit spike duskLogistic fit spike dawnLogistic fit random 2Logistic fit random 1
Fig. 4 Frequency density function of distribution of ascent anddescent rates of spike dives and dives treated in the same way using arandom time rather than dawn and dusk. Fish number 56, over305 days. Dawn dives have been inverted to be sign similar to thedusk dives. The distributions show best fit (using maximum loglikelihood) to the logistic probability density function (solid lines).Dusk and dawn spike ascent and descent rates are indistinguishablefrom the mirror image of the other
Mean sunelevation atspike (deg)
SD sunelevation atspike (deg)
N forelevation
Mean offset(min)
SD offset(min)
N foroffset
Sunrises −5.9 2.5 4,763 30.9 12.6 4,773
Sunsets −6.2 2.5 4,589 32.3 13.2 4,849
All −6.1 2.5 9,352 31.6 13 9,622
Table 2 Difference in timebetween the spike dive (mid-interval of steepest gradient) andthe time of sunrise or sunset forthe estimated location (offset)and estimated elevation of sun atsame point
Behav Ecol Sociobiol

albacares LCF 1 m) head used in the MRI scan confirmedthe presence of a cartilaginous tube connecting the semi-spherical pineal gland anterior to the brain to a translucentwindow in the skin on the surface of the head. Dissection of
20 SBT heads in the field to expose the pineal apparatusshowed that light passes through the structure (Willis,personal observation), whereas detectable levels do not passthrough the surrounding bone, muscle, and other tissue(Murphy 1971). The cartilaginous tube that carries light
-48-40-32-24-16 -8 0 8 16 24 32 40 480
0.1
0.2
0.3
0.4
0.5
0.6
0.7
0.8
0.9Dawn
-48-40-32-24-16 -8 0 8 16 24 32 40 480
0.1
0.2
0.3
0.4
0.5
0.6
0.7
0.8
0.9Dusk
Sunrise Sunset
Civil twilight
Minutes around spike timeMinutes around spike time
Pro
port
ion
of d
epth
dat
a be
twee
n 0
and
20 m
Pro
port
ion
of d
epth
dat
a be
twee
n 0
and
20 m
Fig. 5 Proportion of depth dataless than 20 m below the surfacearound the times of spike diveposition for southern bluefintuna (Thunnus macoyii) in study.The mean values are shown asthicker red line, and the meanestimated position of sunrise andsunset for all the fish in relationto spike dive is shown as verti-cal blue lines (with dashed linesat 1 SD). The similarity of themean patterns of all fish be-tween dawn and dusk is evidentas is the maximum in frequencyof shallow data around the peri-od between the spike (sun ele-vation about -6º) and point of 0°sun elevation (sunrise and sun-set). This period is called civiltwilight and is uniquely suitablefor sensing geographic compassdirection using the patterns ofpolarization of sunlight near thesurface of the ocean
70 75 80 85 90 95 100 105 11030
40
50
60
70
80
90
100
R2 = 0.52665, p = 0.00029261
R2 = 0.35918, p = 0.0052273
Length at release (cm)
Mea
n sp
ike
dive
gra
dien
t (m
/4 m
in)
R2=0.36, p=0.005
R2=0.53, p=0.0003
Fig. 6 Mean spike dive rates of ascent and descent plotted againstLCF at release for 20 southern bluefin tuna released in the GreatAustralian Bight between 1998 and 2002. Each point represents themean and thus weight of roughly 300 data (Table 1). Black symbolsrepresent dusk spike dives (descent), red symbols represent dawn(ascent). The graph shows that the mean rates of ascent and descent ofboth the spike types are similarly positively correlated to the length ofthe fish at release and suggests that downward speed is greater thanupward speed, although the difference is not statistically significant
0-5 5-10 10-15 15-20 20-25 25-30 30-35
0
0.1
0.2
0.3
0.4
0.5
0.6
0.7
0.8
0.9
1
n = 132
n = 106
n = 52
n = 22n = 10
n = 38n = 14
R2 = 0.93, p < 0.001
Difference in length (cm)
Pro
port
ion
of t
-te
sts
indi
catin
g si
mila
rity
betw
een
pairs
Fig. 7 Proportion of tests suggesting that spike dive ascent anddescent rates are similar between pairs of fish plotted against thedifference in length between the pair. Thus, fish that are moresimilar in length are more likely to have indistinguishable spikeascent or descent rates. Twenty fish morning and evening=380unique cross-correlations
Behav Ecol Sociobiol

from the translucent window to the pineal gland isvertically aligned when the fish is swimming upward atan angle of about 35° from vertical.
Discussion
Spike dives
This study shows that juvenile SBT exhibit spike divesaround dawn and dusk on a majority of days. Spike diveshave a characteristic shape that lasts from 16 min to over anhour. Dawn and dusk spike dives exhibited by individualfish during a 24-h period are mirror images. The deepestportion of the dives and the most rapid change in depth areprecisely timed with respect to sunrise and sunset. Spikedives occur at times when sun elevations are nearlyidentical (−6º): 30 min before sunrise and 30 min aftersunset (times of sun elevation between 0 and −6º are calledcivil twilight.) The maximum rate of ascent or descentduring spike dives is directly proportional to the length ofthe fish. Larger fish swim faster (Magnuson 1973),suggesting that the rate of vertical change during spikedives is related to maximum sustained swimming speed.The differences in descent and ascent rates may be due toslight negative buoyancy, hypothesized for tuna (Magnuson1973). The maximum vertical change during a spike divecan be over four lengths per seocnd for a 1-m SBT, whichis on the high side of suspected maximum sustainedswimming speeds for tuna but well within the hypothe-
sized burst speed capabilities (Block and Stevens 2001;Korsmeyer et al. 1996).
Spike diving and navigation
There are two “steps” required for true navigation: a mapstep to determine the position and a compass step todetermine the direction toward the desired goal (Griffin1952). The map step of long distance navigation requires a“gradient map,” involving a geophysical factor or factors(e.g., geomagnetic field intensity, Freake et al. (2006) orconcentration gradient in a chemical cue, Wallraff (1996)),which exhibits regular variation over a large spatial scale.The compass step may involve multiple celestial (star, sun,and polarized light) and geomagnetic cues (e.g., fish, Quinn1980; amphibians, Adler 1976; Deutschlander et al. 1999;birds, Wiltschko and Wiltschko 2005) that may be“calibrated” with respect to a common reference system(Muheim et al. 2006; and see below). The geomagneticfield may be involved in both the map (Freake et al. 2006)and compass steps (Wiltschko and Wiltschko 2005) and bemediated by biophysically and anatomically distinct senso-ry mechanisms; for example, a light-dependent (photore-ceptor-based) magnetic compass and a non-light-dependent(magnetite-based) magnetic map detector (Wiltschko andWiltschko 2005; Freake et al. 2006).
Spike diving occurs close to dawn and dusk and maythus be associated with the acquisition of light-based cuesfor orientation or navigation; spike diving also involvestime spent at considerable depth in darkness and may be
A
C
D
B
Fig. 8 MRI scan of juvenilealbacore tuna head (Thunnusalalunga; length to caudal finfork 1 m). The pineal apparatuscan be seen in the top of thehead, which allows light througha translucent lens (a) to illumi-nate the semi-spherical pinealgland (b) anterior to the brain(c). A nervous connection (d)can also be seen running anteri-or to this gland, this connects tothe ethmoid region (which is notvisible on this section) wherethe highest concentration ofsingle-domain magnetite hasbeen identified (Walker et al.1984). The pineal gland hasbeen enlarged in the inset(which for scale is approxi-mately 3 cm2): Its shape is closeto semi-circular on the illumi-nated face
Behav Ecol Sociobiol
used to acquire light-independent navigational information.Together, these cues could then provide the basis for mapinformation and/or be used to calibrate multiple compasses,both of which are critical for long-distance migrants. We donot have a complete answer to present here; rather, wediscuss the behavior in relation to the various environmen-tal cues that are available to the tuna around the time anddepths of these dives, in the hope that new hypotheses maybe developed that can be tested in the field.
Distinct sensory modalities for deep and shallow partof spike dive
The time of the shallowest portion of the spike dives coincideswith civil twilight, which is the time of day best suited for thedetection of celestial polarization patterns by marine animals(Novales Flamarique and Hawryshyn 1997; Waterman 2006).At sunrise and sunset both the band of maximum polariza-tion (BMP) and the e-vector of polarization are verticallyaligned on the horizon, and the spectral composition of thelight has a relatively high proportion of frequencies in theultraviolet (UV) (Cronin and Shashar 2001 and see Fig. 7b inNovales Flamarique and Hawryshyn 1997). In the ocean, theintensity of polarization decreases rapidly in the first fewmeters of water (Waterman 2006). Consequently, polarizedlight patterns can only be detected just under the surface(Waterman 2006). Sensitivity to polarized light has not beenstudied in tuna but has been demonstrated in many groups offish, where it is mediated by photoreceptors in the retina(Hawryshyn et al. 1990). The size and complexity of thepineal apparatus revealed by the MRI scan may also suggest arole in a light-dependent sensory process, since it (like theretina) receives light, including polarized light. In view of itsrole in navigation in other vertebrates (Deutschlander et al.1999; Rivas 1953; Adler 1976), the behavior of the tunaduring the shallow portion of spike dives at precisely firstand last light could therefore also be related to the operationof the pineal.
Polarized light patterns at dawn and dusk have beenshown to be important for the calibration between multiplecompass systems, for example, in migratory birds (Muheimet al. 2006). Averaging the intersection of the BMP with thehorizon at sunrise and sunset provides an estimate ofgeographic (rotational) north that is independent of latitudeand time of year (Muheim et al. 2006). As a result of theconsistent higher frequency of movement close to thesurface during civil twilight (Fig. 5), we suggest that tuna,may use polarized light cues in a similar way to birds toobtain true geographic reference information and calibrateone or more other compasses (magnetic or otherwise).
The rapid ascent that precedes the shallow portion of thedive at sunrise and the rapid descent that follows theshallow portion of the dive at sunset could provide tuna
with a direct vertical profile of one or more environmentalvariables. Alternatively, these rapid depth changes couldreflect the close association of times that are best suited forobtaining one type of sensory information at depth (e.g.,map information) and another type of sensory informationat the surface (e.g., polarized light-based compass orcompass calibration information). Both the pineal organand ethmoid magnetoreceptors, which have been implicatedin the magnetic map and compass behavior of othervertebrates, are relatively highly developed in tuna (Fig. 7and see Wiltschko and Wiltschko 2005; Rivas 1953; Walkeret al. 1984; Deutschlander et al. 1999). Yellowfin tuna (T.albacares) are capable of responding to magnetic stimuli(Walker 1984), but we have no information about the use ofmagnetic cues during compass orientation or true naviga-tion. Nevertheless, considering the highly developed tunamagnetoreceptors and other examples of aquatic vertebratesusing the magnetic field for navigation (Quinn 1980;Kalmijn 1982; Walker 1984; Phillips et al. 2002; Freakeet al. 2006), we wonder whether the deeper elements ofspike diving may be related to magnetic navigation.
The geomagnetic field in marine environments
The magnetic field in marine environments differs from thatin terrestrial environments in three ways: (1) Ocean swells,tides, waves and currents produce localized changes in themagnetic field (Lilley et al. 2001, 2004); (2) normalfluctuations of the Earth's magnetic field, called the quietdaily variation, are present but can be amplified by thecoastal effect (Lilley et al. 2001); (3) sea floor magneticanomalies cause intensity variations of around 100 nT andare often predictably horizontally aligned, and their wide-scale gridded pattern has been suggested also as a potentialaid to navigation (Walker et al. 2002).
Sea floor anomalies are spatial anomalies often associ-ated with sea mounts, islands, continental shelf edge, andother bathymetric features, which are of great importance tojuvenile SBT feeding ecology and movement behavior(Willis and Hobday 2007). Vertical movements mayprovide the tuna with useful information about the typeand direction of these features. The other main sources oftemporal and spatial magnetic anomalies unique to marineenvironments are briefly discussed with respect to theirpotential impact on spike diving behavior.
Ocean currents typically cause local magnetic variationsof around 100 nT (Lilley et al. 2001); this may be importantas the underlying total magnetic intensity gradient varies by1–10 nT/km. North–south velocity profiles of oceancurrents can be calculated directly from a vertical magne-tometer profile in the ocean (Lilley et al. 2001; Fig. 12). Inthe ocean, the greatest water velocity is usually in the upper500 m caused by wind-driven surface currents; consequent-
Behav Ecol Sociobiol
ly, this is the area with the highest level of local magneticfield variation. Water movements in the deep layer (>500 min depth) are usually orders of magnitude slower and thusproduce negligible magnetic fields locally (NASA, http://www.oceanmotion.org). Thus, a tuna could more accuratelymeasure the main field at depths approaching 500 mwithout surface current noise, or a swift vertical profile toor from the depth where the gradient leveled off couldprovide information about the direction and strength of thesurface current. To take advantage of this information, thetuna would need to be able to detect small changes inmagnetic intensity of the order of 1–10 nT.
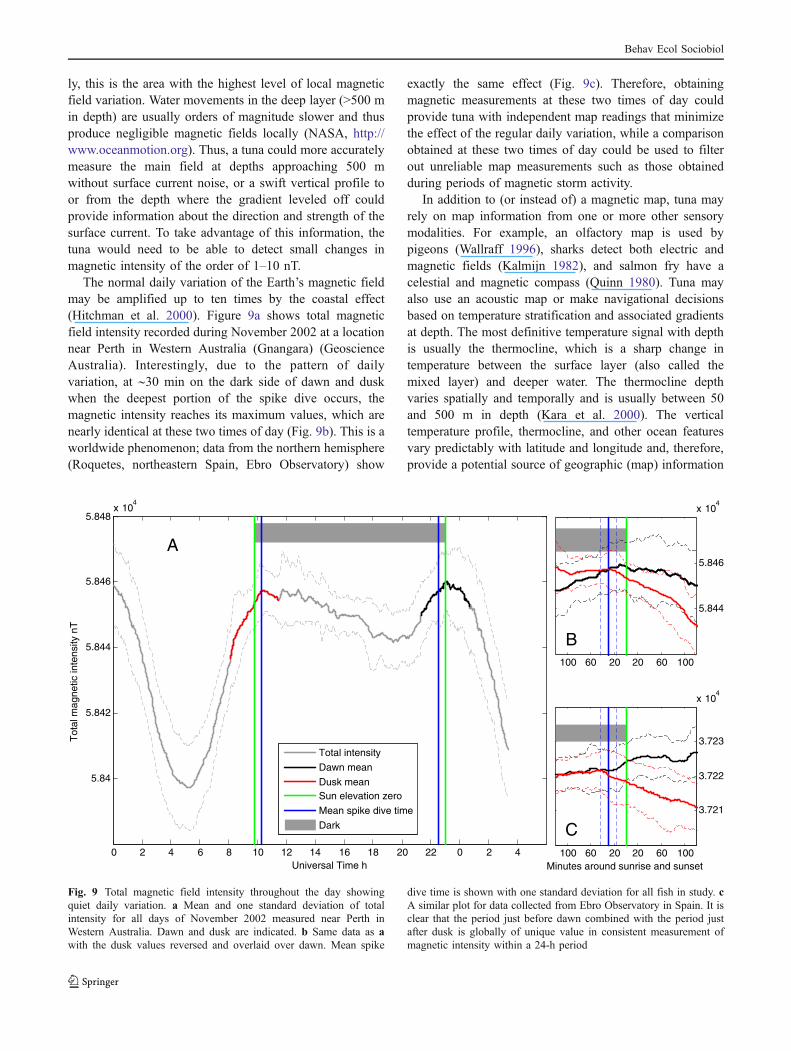
The normal daily variation of the Earth’s magnetic fieldmay be amplified up to ten times by the coastal effect(Hitchman et al. 2000). Figure 9a shows total magneticfield intensity recorded during November 2002 at a locationnear Perth in Western Australia (Gnangara) (GeoscienceAustralia). Interestingly, due to the pattern of dailyvariation, at ∼30 min on the dark side of dawn and duskwhen the deepest portion of the spike dive occurs, themagnetic intensity reaches its maximum values, which arenearly identical at these two times of day (Fig. 9b). This is aworldwide phenomenon; data from the northern hemisphere(Roquetes, northeastern Spain, Ebro Observatory) show
exactly the same effect (Fig. 9c). Therefore, obtainingmagnetic measurements at these two times of day couldprovide tuna with independent map readings that minimizethe effect of the regular daily variation, while a comparisonobtained at these two times of day could be used to filterout unreliable map measurements such as those obtainedduring periods of magnetic storm activity.
In addition to (or instead of) a magnetic map, tuna mayrely on map information from one or more other sensorymodalities. For example, an olfactory map is used bypigeons (Wallraff 1996), sharks detect both electric andmagnetic fields (Kalmijn 1982), and salmon fry have acelestial and magnetic compass (Quinn 1980). Tuna mayalso use an acoustic map or make navigational decisionsbased on temperature stratification and associated gradientsat depth. The most definitive temperature signal with depthis usually the thermocline, which is a sharp change intemperature between the surface layer (also called themixed layer) and deeper water. The thermocline depthvaries spatially and temporally and is usually between 50and 500 m in depth (Kara et al. 2000). The verticaltemperature profile, thermocline, and other ocean featuresvary predictably with latitude and longitude and, therefore,provide a potential source of geographic (map) information
100 60 20 20 60 100
5.844
5.846
x 104
100 60 20 20 60 100
3.721
3.722
3.723
x 104
Minutes around sunrise and sunset0 2 4 6 8 10 12 14 16 18 20 22 0 2 4
5.84
5.842
5.844
5.846
5.848x 10
4
Universal Time h
Tot
al m
agne
tic in
tens
ity n
T
Total intensity
Dawn mean
Dusk meanSun elevation zero
Mean spike dive time
Dark
A
B
C
Fig. 9 Total magnetic field intensity throughout the day showingquiet daily variation. a Mean and one standard deviation of totalintensity for all days of November 2002 measured near Perth inWestern Australia. Dawn and dusk are indicated. b Same data as awith the dusk values reversed and overlaid over dawn. Mean spike
dive time is shown with one standard deviation for all fish in study. cA similar plot for data collected from Ebro Observatory in Spain. It isclear that the period just before dawn combined with the period justafter dusk is globally of unique value in consistent measurement ofmagnetic intensity within a 24-h period
Behav Ecol Sociobiol
used for navigation that could be measured during the rapidascent/descent portion of the spike dives.
Alternative explanations for spike diving
If spike diving is not related to navigation, it may havesome other purpose, such as hunting. A closely relatedspecies of tuna (Thunnus obesus) has been observedfollowing the vertical migration of the DSL (Josse et al.1998); in this case there was no spike dive. The timing andprofile of DSL migrations, as revealed by sonar, aresimilar to the gradual ascent/descent phase of the spikedive (Onsrud et al. 2004; Fig. 2). The gradual ascent anddescent on the dark side of dawn and dusk may beevidence that tuna regularly follow the migration of theDSL but suspend this behavior to initiate spike dives atprecise times of day. Thus, the sudden move toward oraway from the DSL, from or to the surface, at precisetimes on the dark side of sunrise and sunset remainsunexplained by this hunting hypothesis, especially sincethe tuna regularly move deeper before and after the spike,in daylight and darkness, so the deepest point of the spikeappears not to represent a thermal or visual limit to thetuna following the DSL.
Acknowledgments Thanks to Tom Polacheck, John Gunn, NaomiClear, Thor Carter, Clive Stanley and other scientists who undertookthe tagging program as part of the SBT juvenile recruitmentmonitoring program, funded in part by the Australian FisheriesResearch and Development Corporation. Review by Stephen Roberts,Paige Eveson, Talbot Waterman, Michael Winklhofer, and GeoffArnold improved the manuscript. Thanks to Scott Cooper and JasonHartog at CSIRO CMAR Pelagic Fisheries who administered the tagdatabase, Gerald McInerney and the staff at the Royal Hobart Hospitalwho were most generous in providing the MRI scan, and Karen Evansand Jessica Farley for use of the tuna head. We used data collected atEbro and Gnangara observatories. We thank Universitat Ramon Llull,CSIC and Geoscience Australia for supporting its operation andIntermagnet for promoting high standards of magnetic observatorypractice (http://www.intermagnet.org). JBP was supported by NSFIOB06-47188. No tuna were killed or harmed specifically for thisstudy. All tagging or other sampling programs from which samples ordata were used complied with the current laws of the country in whichthe experiments were performed and under ethics permits stated in therelevant references. This manuscript was improved after submissionby the comments of several anonymous reviewers and the editor.
References
Adler K (1976) Extraocular photoreception in amphibians. PhotochemPhotobiol 23:275–298
Bakun A, Broad K (2003) Environmental ‘loopholes’ and fishpopulation dynamics: comparative pattern recognition with focuson El Nino effects in the Pacific. Fish Oceanogr 12:458–473
Bestley S, Patterson TA, Hindell MA, Gunn JS (2008) Feedingecology of wild migratory tunas revealed by archival tag records
of visceral warming. J Anim Ecol. doi:10.1111/j.1365-2656.2008.01437.x
Block BA, Stevens ED (2001) Tuna: physiology, ecology, andevolution. Academic, San Diego
Burd AC, Lee AJ (1951) The sonic scattering layer in the sea. Nature167:624–626
Cronin TW, Shashar N (2001) The linearly polarized light field inclear, tropical marine waters : spatial and temporal variation oflight intensity, degree of polarization and e-vector angle. J ExpBiol 204:2461–2467
Dagorn L, Bach P, Josse E (2000) Movement patterns of large bigeyetuna (Thunnus obesus) in the open ocean, determined usingultrasonic telemetry. Mar Biol 136(2):361–371
Davis T (2002) Southern bluefin tuna recruitment monitoring program—final report. CSIRO Marine and Atmospheric Research, Hobart
Davis TLO, Farley JH (2001) Size distribution of southern bluefintuna (Thunnus maccoyii) by depth on their spawning ground.Fish Bull 99:381–386
Deutschlander ME, Borland SC, Phillips JB (1999) Extraocularmagnetic compass in newts. Nature 400:324–325
Freake MJ, Muheim R, Phillips JB (2006) Magnetic maps in animals:a theory comes of age? Q Rev Biol 81:327–347
Griffin DR (1952) Bird navigation. Biol Rev Camb Philos Soc27:359–393
Gunn J, Block B (2001) Advances in acoustic, archival and satellitetagging of tunas. In: Block BA, Stevens ED (eds) Tuna:physiology, ecology, and evolution. Academic, San Diego, pp167–244
Hawryshyn CW, Arnold MG, Bowering E, Cole RL (1990) Spatialorientation of rainbow-trout to plane-polarized light—the ontogenyof e-vector discrimination and spectral sensitivity characteristics. JComp Physiol A 166:565–574
Hitchman AP, Milligan PR, Lilley FEM, White A, Heinson GS (2000)The total-field geomagnetic coast effect: The CICADA97 linefrom deep Tasman Sea to inland New South Wales. ExplorGeophys 31:052–057
Josse E, Bach P, Dagorn L (1998) Simultaneous observations of tunamovements and their prey by sonic tracking and acousticsurveys. Hydrobiologia 371(372):61–69
Kalmijn AJ (1982) Electric and magnetic field detection in elasmo-branch fishes. Science 318:916–918
Kampa EM (1974) Observations of a sonic-scattering layer during thetotal solar eclipse, 30 June, 1973. Deep-Sea Res 22:417–423
Kara AB, Rochford PA, Hurlburt HE (2000) An optimal definitionfor ocean mixed layer depth. J Geophys Res 105(C7):16803–16821
Klimley AP, Holloway CF (1999) School fidelity and homingsynchronicity of yellowfin tuna, Thunnus albacares. Mar Biol133:307–317
Korsmeyer KE, Dewar H, Lai NC, Graham JB (1996) Tuna aerobicswimming performance: physiological and environmental limitsbased on oxygen supply and demand. Comp Biochem Phys B113:45–56
Laslett GM, Eveson JP, Polacheck T (2002) A flexible maximumlikelihood approach for fitting growth curves to tag-recapturedata. Can J Fish Aquat Sci 59(6):976–986
Lilley FME, White A, Heinson GS (2001) Earth's magnetic field:ocean current contributions to vertical profiles in deep oceans.Geophys J Int 147:163–175
Lilley FEM, Hitchman AP, Milligan PR, Pedersen T (2004) Sea-surface observations of the magnetic signals of ocean swells.Geophys J Int 159:565–572
Magnuson JJ (1973) Comparative study of adaptations for continuousswimming and hydrostatic equilibrium of scombroid and xiploidfishes. Fish Bull 71:337–356
Behav Ecol Sociobiol

Muheim R, Phillips JB, Akesson S (2006) Polarized light cuesunderlie compass calibration in migratory songbirds. Science313:837–839
Murphy RC (1971) The structure of the pineal organ of the bluefintuna (Thunnus thynnus). J Morph 138:1–16
Murtaugh PA (2007) Simplicity and complexity in ecological dataanalysis. Ecology 88:56–62
Novales Flamarique I, Hawryshyn CW (1997) Is the use ofunderwater polarized light by fish restricted to crepuscular timeperiods? Vision Res 37:975–989
Ohta I, Kakuma S (2005) Periodic behavior and residence time ofyellowfin and bigeye tuna associated with fish aggregatingdevices around Okinawa Islands, as identified with automatedlistening stations. Mar Biol 146:581–594
Onsrud MSR, Kaartvedt S, Rostad A, Klevjer TA (2004) Verticaldistribution and feeding patterns in fish foraging on the krillMeganyctiphanes norvegica. ICES J Mar Sci 61:1278–1290
Patterson TA, Evans K, Carter TI, Gunn J (2008) Movement andbehaviour of large southern bluefin tuna (Thunnus maccoyii) inthe Australian region determined using pop-up satellite archivaltags. Fish Oceanogr 17(5):352–367
Phillips JB, Borland SC, Freake MJ, Brassart J, Kirschvink JL (2002)‘Fixed-axis’ magnetic orientation by an amphibian: non-shoreward-directed compass orientation, misdirected homing orpositioning a magnetite-based map detector in a consistentalignment relative to the magnetic field? J Exp Biol 205:3903–3914
Quinn TP (1980) Evidence of celestial and magnetic compassorientation in lake migrating sockeye salmon fry. J Comp Physiol137A:243–248
Rivas L (1953) The pineal apparatus of tunas and related scombridfishes as a possible light receptor controlling phototactic move-ments. Bull Mar Sci 3:168–180
Schaefer KM, Fuller DW (2003) Movements, behavior, and habitatselection of bigeye tuna (Thunnus obsesus) in the easternequatorial Pacific, ascertained through archival tags. Fish Bull100(4):765–788
Sharp GD, Dizon AE (1978) The physiological ecology of tunas.Academic, New York
Teo SLH, Boustany A, Blackwell S, Walli A, Weng KC, Block BA(2004) Validation of geolocation estimates based on light leveland sea surface temperature from electronic tags. Mar Ecol ProgSer 283:81–98
Walker MM (1984) Learned magnetic field discrimination inyellowfin tuna, Thunnus albacares. J Comp Physiol 155:673–679
Walker MM, Kirschvink JL, Chang SR, Dizon AE (1984) A candidatemagnetic sense organ in the yellowfin tuna, Thunnus albacares.Science 224(4650):751–753
Walker MM, Dennis TE, Kirschvink JL (2002) The magnetic senseand its use in long-distance navigation by animals. Curr OpinNeurobiol 12:735–744
Wallraff HG (1996) Seven theses on pigeon homing deduced fromempirical findings. J Exp Biol 199:105–111
Waterman TH (2006) Reviving a neglected celestial underwaterpolarization compass for aquatic animals. Biol Rev 81:111–115
Welch DW, Eveson JP (1999) An assessment of light-based geo-position estimates from archival tags. Can J Fish Aquat Sci 56(7):1317–1327
Willis J, Hobday AJ (2007) Influence of upwelling on movement ofsouthern bluefin tuna (Thunnus maccoyii) in the Great AustralianBight. Mar Freshwater Res 58:699–708
Wiltschko W, Wiltschko R (2005) Magnetic orientation and magneto-reception in birds and other animals. J Comp Physiol A 191:675–693
Behav Ecol Sociobiol
Copyright © 2022 FDOKUMEN