Naviz : Website Navigational Behavior Visualizer
14
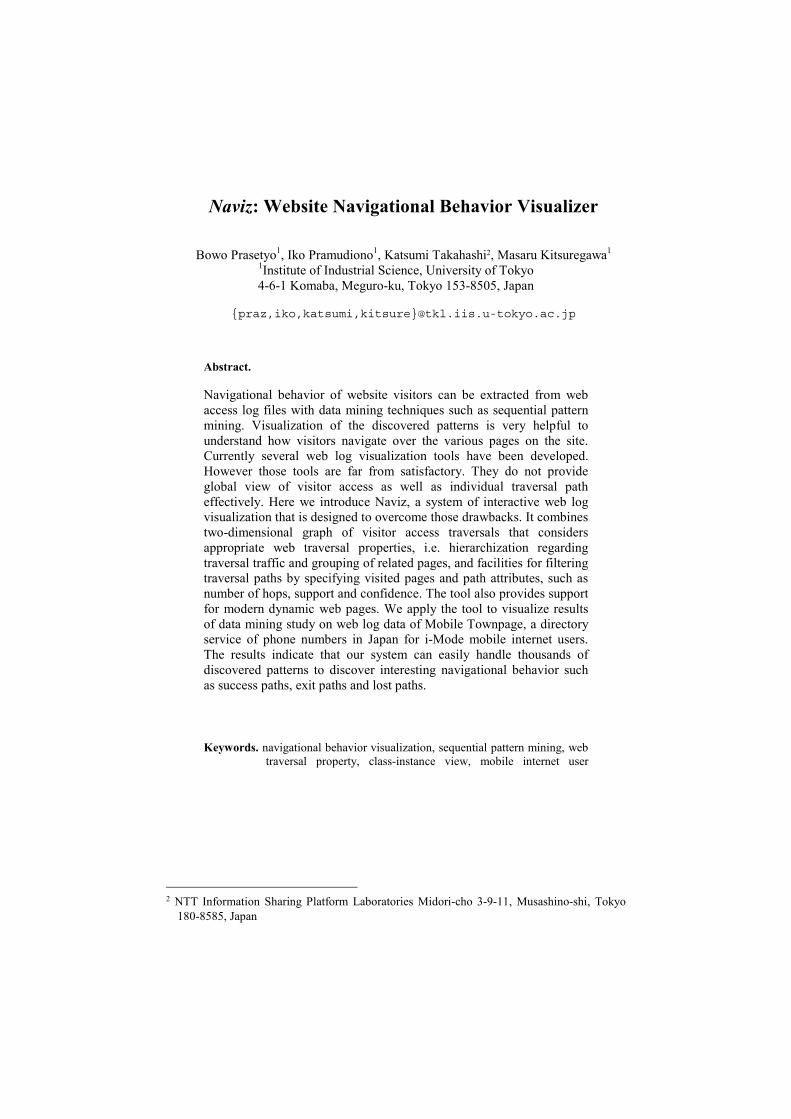
Naviz: Website Navigational Behavior Visualizer Bowo Prasetyo 1 , Iko Pramudiono 1 , Katsumi Takahashi 2 , Masaru Kitsuregawa 1 1 Institute of Industrial Science, University of Tokyo 4-6-1 Komaba, Meguro-ku, Tokyo 153-8505, Japan {praz,iko,katsumi,kitsure}@tkl.iis.u-tokyo.ac.jp Abstract. Navigational behavior of website visitors can be extracted from web access log files with data mining techniques such as sequential pattern mining. Visualization of the discovered patterns is very helpful to understand how visitors navigate over the various pages on the site. Currently several web log visualization tools have been developed. However those tools are far from satisfactory. They do not provide global view of visitor access as well as individual traversal path effectively. Here we introduce Naviz, a system of interactive web log visualization that is designed to overcome those drawbacks. It combines two-dimensional graph of visitor access traversals that considers appropriate web traversal properties, i.e. hierarchization regarding traversal traffic and grouping of related pages, and facilities for filtering traversal paths by specifying visited pages and path attributes, such as number of hops, support and confidence. The tool also provides support for modern dynamic web pages. We apply the tool to visualize results of data mining study on web log data of Mobile Townpage, a directory service of phone numbers in Japan for i-Mode mobile internet users. The results indicate that our system can easily handle thousands of discovered patterns to discover interesting navigational behavior such as success paths, exit paths and lost paths. Keywords. navigational behavior visualization, sequential pattern mining, web traversal property, class-instance view, mobile internet user 2 NTT Information Sharing Platform Laboratories Midori-cho 3-9-11, Musashino-shi, Tokyo 180-8585, Japan
-
Upload
independent -
Category
Documents
-
view
0 -
download
0
Transcript of Naviz : Website Navigational Behavior Visualizer
Naviz: Website Navigational Behavior Visualizer
Bowo Prasetyo1, Iko Pramudiono1, Katsumi Takahashi2, Masaru Kitsuregawa1 1Institute of Industrial Science, University of Tokyo 4-6-1 Komaba, Meguro-ku, Tokyo 153-8505, Japan
{praz,iko,katsumi,kitsure}@tkl.iis.u-tokyo.ac.jp
Abstract. Navigational behavior of website visitors can be extracted from web access log files with data mining techniques such as sequential pattern mining. Visualization of the discovered patterns is very helpful to understand how visitors navigate over the various pages on the site. Currently several web log visualization tools have been developed. However those tools are far from satisfactory. They do not provide global view of visitor access as well as individual traversal path effectively. Here we introduce Naviz, a system of interactive web log visualization that is designed to overcome those drawbacks. It combines two-dimensional graph of visitor access traversals that considers appropriate web traversal properties, i.e. hierarchization regarding traversal traffic and grouping of related pages, and facilities for filtering traversal paths by specifying visited pages and path attributes, such as number of hops, support and confidence. The tool also provides support for modern dynamic web pages. We apply the tool to visualize results of data mining study on web log data of Mobile Townpage, a directory service of phone numbers in Japan for i-Mode mobile internet users. The results indicate that our system can easily handle thousands of discovered patterns to discover interesting navigational behavior such as success paths, exit paths and lost paths.
Keywords. navigational behavior visualization, sequential pattern mining, web traversal property, class-instance view, mobile internet user
2 NTT Information Sharing Platform Laboratories Midori-cho 3-9-11, Musashino-shi, Tokyo
180-8585, Japan

1. Introduction
Website developers, designers, and maintainers are having difficulties to analyze the efficiency of their website. Two of the major problems with current web log analysis are difficulty to understand what visitors are trying to do on a website and how they are doing it. This requires analysis of the visitor navigational behavior on the website, which gives webmasters know how to improve structure of the hyperlinks as well as the content of the documents in the website. Some data mining techniques to discover navigational patterns have been proposed. However due to the large number of discovered patterns, effective method to visualize the results is needed. Towards this end, we develop a Java JApplet based navigational behavior visualization tool (running on almost all modern browsers support Java 2 plugin), called Naviz.
Web log visualization firstly should give understanding of global view of visitor access. To achieve this goal, it is important to consider about inherent web traversal topology, i.e. WWW visitor access traversals are intrinsically directed cyclic graphs. This can be thought of as a hypermedia-like structure, with nodes represent pages and edges represent traversals between pages. We found that it is very helpful to introduce two appropriate web traversal properties below when visualizing web log access: 1. Hierarchical structure regarding traversal traffic, i.e. more traversed edges are
placed at the higher level and less traversed edges at the lower level position. This would give an intuitive description of visitors that are traversing over the site, which enter from top of the graph and then exit to bottom.
2. Grouping of related pages, for example, pages that have high degree of transitional probability among them are better to be placed together near to each other. This pages grouping would be useful for webmasters to easily find what pages are related each other. Another important factor regarding web log visualization is the nature of modern
web pages. Today HTML pages are often dynamic pages that automatically created and destroyed whenever needed. A dynamic page can be thought of as a page class, which will create different instances for every access depending on input parameters. Dynamic page brings information for example by retrieving data from the back-end database. Hence, the different access to the same page may bring different information. This kind of page requires different visualization technique comparing to traditional static HTML pages. Class-instance view technique, i.e. a technique to visualize dynamic page either as a node of representative class or as many nodes of its instances, is one of the solutions for this problem. A class of dynamic page can be expanded to show information of some of its instances, and instances can be merged back to a class to simplify the global view.
The other difficulty is how to visualize individual traversal path while keeping the global view of navigational behavior. We use the shortest unit of traversal paths, that is traversal path between two consecutive page classes, as the underlying unit to draw traversal diagram. Such path can be treated as the edge of directed graph.
By interactively visualizing the traversal paths, webmasters should be able to reveal what their visitors are trying to do and how they are doing it. For those purposes, Naviz uses several strategies to form effective traversal diagram and to visualize traversal paths. These include considerations of web traversal property,

class-instance view, traversal path filtering by specifying visited pages and path attributes such as hop number, navigational behavior comparison and interactive environment. Naviz try to take into account the appropriate web traversal properties by hierarchization and pages grouping. For website which contains modern dynamic pages, class-instance view can greatly simplify the graph layout while still provide the information needed. Naviz utilizes particular attribute on web log data to do navigational behavior comparison: i.e day behavior vs. night behavior. Traversal paths can be filtered by specifying visited pages and number of hops (path length). Furthermore Naviz utilizes the interactive environment to provide more capabilities to explore navigational behavior from the data.
We use Naviz to visualize results from data mining study on web log data of Mobile Townpage, i-Mode version of NTT i-Townpage, a directory service of phone numbers in Japan. As far as we know, this is the first experiment to visualize navigational behavior of mobile phone users. Due to the limited display and communication ability of mobile phones, a web site for mobile phone has to be carefully designed so that the visitors can reach their goal with least clicks. Using Naviz we discover some interesting visitor behavior such as success paths, exit paths and lost paths, which are useful for webmasters to get the idea how to improve structure of the hyperlinks as well as the content of the documents in the website.
The rest of the paper is organized as follows. Chapter 2 will overview about related works such as currently available web log analysis visualizers. In chapter 3 we will introduce Naviz, website navigational behavior visualizer, which combines the power of log miner and intuitive-looking of aesthetic graph. Our experiment on NTT i-Townpage served on i-Mode will be discussed in chapter 4, while chapter 5 will give the conclusion and future works regarding Naviz development.
2. Related Works
Pitkow et. al. in 1994 proposed WebViz [4] as a tool for web log analysis and provides graphical view of website’s local documents and access patterns. By incorporating the Web-Path paradigm [4], i.e. establishment of relationship between documents in database and web access log, into an interactive tool, webmasters can see the documents in their website as well as the hyperlinks travelled (represented visually as links) by visitors. WebViz also enables webmasters to filter the access log by domain names or DSN numbers, directory names, and start and stop times, and play back the events in the access log. The drawback of WebViz is that it was designed to visualize the statistical property of the data only (i.e. frequency and recency information), it can not handle sequential patterns (i.e. has no related data mining tools). It displayed web log access in two-dimensional directed graph, but without enough considerations about appropriate web traversal properties. Also WebViz did not visualize modern dynamic page effectively.
In 1998, Spiliopoulou et. al. presented Web Utilization Miner [5], WUM as a mining system for the discovery of interesting navigation patterns. One of the most important features of WUM is that using WUM’s mining language MINT, human expert can dynamically specify the interestingness criteria for navigation patterns.
This includes specification of criteria of statistical, structural and textual nature. To discover the navigation patterns satisfying the expert’s criteria, WUM exploits Aggregation Service that extracts information on web access log and retains aggregated statistical information. Although WUM provides an integrated and robust environment to do web log analysis job, but since it focuses mainly on data mining and its mining language, it lacks aesthetic visualization of the data as well as considerations of appropriate web traversal properties and dynamic page.
Cugini et. al. in 1999 proposed VISVIP [6], a tool which allows web site developers and usability engineers to visualize the paths taken through the site. The graphical layout of the web site can be dynamically customized and simplified, and which subjects paths to view can be dynamically selected. VISVIP also provide an animated representation of traversal along the path through the web site. The time spent on each page visit can be represented using the third dimension of the 3D display. VISVIP gives good visualization regarding paths taken through the site, but it has drawbacks such as it needs client customization to instrument a web site so as to record the activity of a subject navigating the site. As almost currently available visualizations, VISVIP also did not consider appropriate web traversal properties as well as dynamic page.
The recent work done by Hong et. al. in 2001, proposed WebQuilt [7] as a web logging and visualization system that helps web design teams run usability tests and analyze the collected data. To overcome many of the problems with server-side and client-side logging, WebQuilt uses a proxy to log the activity. It aggregates logged usage traces and visualize in a zooming interface that shows the web pages viewed. Also it shows the most common paths taken through the website for a given task, as well as the optimal path for that task. WebQuilt as well as almost currently available visualizations, also has drawbacks that it did not consider appropriate web traversal properties and dynamic page.
The most recent work in visual mining of web log data has been done by Zhao et. al. in 2001 [8]. They proposed a technique to track the behavior of discovered rules over the time, and then based on it they try to predict the future behavior of the rules. First, the support or confidence value of rules is plotted against the time; this will show the rule behavior over the time. Using the similarity function based on time behavior of support or confidence value, rules will be clustered to the “similar rule” groups. The trend of “similar rule” group in turn will be used to predict the future behavior of individual rule that belongs to the group. The idea to use support or confidence time behavior for clustering the discovered rules is very interesting.
3. Naviz: Navigational Behavior Visualizer
3.1 Known problems in previous works
Agrawal et. al. [1] in 1995 has given the basic of sequential pattern data mining, which later also widely used to discover traversal paths from web log data. But finding interesting knowledge from the discovered patterns is not an easy task. Since
the number of discovered patterns is generally large, and there is no metric that well represents their “usefulness”. Thus visualization tool is needed to help human users to interpret them.
On the other hand, construction of an effective visualization is a challenging task. As stated in works of Mukherjea et. al [2]. there are various problems involved: i.e. the navigational views are two or three dimensional projections of generally multidimensional hypermedia networks; even if such a view is developed, the resulting structure would be very complex for any non trivial hypermedia system; as the size of the underlying information space increases, it becomes very difficult to fit the whole information structure on a screen; and yet the user should be able to get an idea of not only the structure but the actual contents of the nodes and links just by looking at the navigational views.
As mentioned in the previous chapter, the drawbacks of current visualization tools includes lack of capability to handle sequential pattern, lack of aesthetic visualization, necessity of client-side customization and the common drawbacks are that most of them do not consider about modern dynamic page and appropriate web traversal properties as described in introduction, i.e. hierarchical structure regarding traversal traffic; and related pages grouping. Naviz was designed to overcome these drawbacks by combining two-dimensional graph of traversal diagram that considers appropriate web traversal properties as well as modern dynamic web pages, and facilities for visualize interesting traversal paths by specifying certain visited pages and path attributes such as number of hops, support and confidence. It combines the power of sequential pattern mining tools and intuitive-looking of graph drawing tools, to create interactive visualization of traversal paths, in an aesthetic layout of graph. Since it uses log miner and graph layout producer separately from visualization part, Naviz may easily adapt to the latest technology of this two methods whenever its newer version is available, while we can continue to explore the future development of its visualization part.
3.2 Traversal Diagram
First we will explain the notation page class and instance we use here. A page class is an abstraction of web pages that offers the same navigational functions in the web traversal topology. Instance is a member of page class that has certain semantics. Instance membership is user defined. Usually an instance is defined by parameters of its page class, however we can ignore some parameters so that an instance may include some different representations of web access logs. For example, logs often include visitor ID as a CGI parameter. But user can define logs with certain CGI parameters as an instance although they have different visitor ID, since this CGI parameter does not affect the semantics of the instance. The page class is a generalization of the web page definition so far since a static web page can be seen as a page class with a single instance.
To represent navigational behavior we use traversal path, a sequence of page classes traversed by visitors. Following association rule, we define some parameters to assess the strength of the traversal path:
1. Support of a traversal path A B is the percentage of sessions that contain the sequence of A B against the total number of sessions.
2. Users of a traversal path A B is the percentage of visitors that traversed between A B against the total number of visitors.
3. The confidence of a traversal path is the probability of a visitor to visit the last page in the sequence of traversal path. For example the confidence of traversal path A B C D is the probability of a visitor to visit page D after he/she visited pages A B C consecutively. It can be obtained by dividing the number of sessions that contain sequence A B C D by the number of sessions that contain page A B C. When the sequence only contains two page classes A B, the confidence can also be interpreted as page transition probability from A to B. We use GSP algorithm [1] to derive traversal paths from web access logs. Note
that Naviz is not limited to this algorithm only. We also add the capability to set constraints such as deriving only the traversal paths of visitor with certain attributes. For example we filter web logs whose accesses between 6:00 until 18:00 to extract traversal paths of daytime visitors.
To acquire a global view of navigational behavior, we need to draw all traversal paths above certain parameter thresholds. As mentioned before, we also have to be able to draw directed cyclic graphs, hierarchical structure and nodes grouping. We use the shortest traversal paths with a pair of page classes as the underlying unit of drawing since they also convey the relationships between two adjacent page classes. We draw traversal diagram as a directed graph with page classes as the nodes and the traversal paths between any pair of page classes as the weighted edges.
Gansner et. al. in their paper [3] in 1993, described a four-pass algorithm for drawing directed graphs. The first pass assigns discrete ranks to nodes. In a top to bottom drawing, ranks determine Y coordinates. Edges that span more than one rank are broken into chains of “virtual” nodes and unit-length edges. The second pass orders nodes within ranks to minimize crossings. The third pass sets X coordinates of nodes to keep edges short. The last pass routes edge splines. Furthermore, as secondary role in the algorithm, Gansner et. al. propose the next aesthetic principles: 1) expose hierarchical structure in the graph, 2) avoid visual anomalies that do not convey information about the underlying graph, 3) keep edges short, and 4) favor symmetry and balance. This algorithm is proven to be able to draw graph layout very well and very fast, while still maintaining the aesthetic principles. Furthermore, this algorithm satisfies the requirements of appropriate website traversal properties that are needed by Naviz to draw traversal diagram.
3.3 System Overview
Naviz was designed to visualize traversal paths discovered from data mining on web log file. Naviz was developed as a Java JApplet program, which run on almost modern browsers with Java 2 plugin installed. It combines a separated log miner that utilize the traversal path mining [1], and a graph layout producer called Graphviz [9], an open source graph drawing software from AT&T that implemented algorithm in [3].
As showed in Fig. 1 Naviz is a three-tier client-server application, consists of:
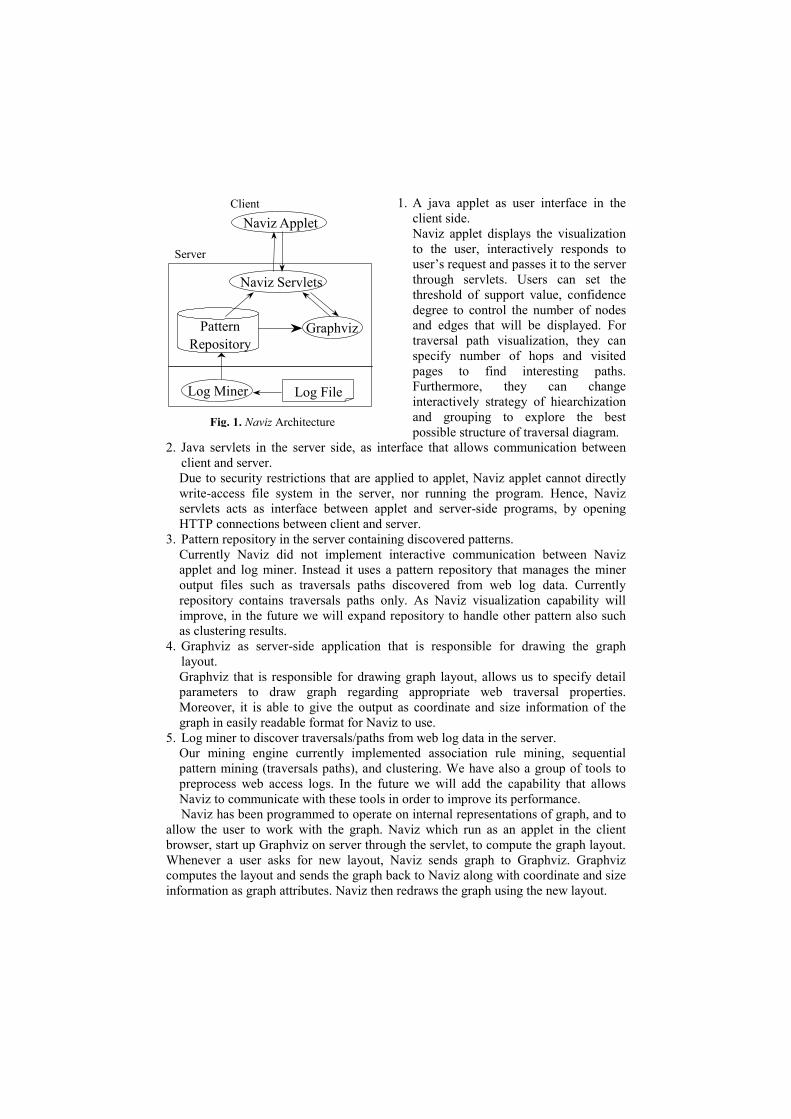
1. A java applet as user interface in the client side. Naviz applet displays the visualization to the user, interactively responds to user’s request and passes it to the server through servlets. Users can set the threshold of support value, confidence degree to control the number of nodes and edges that will be displayed. For traversal path visualization, they can specify number of hops and visited pages to find interesting paths. Furthermore, they can change interactively strategy of hiearchization and grouping to explore the best possible structure of traversal diagram.
terface that allows communication between
2. Java servlets in the server side, as inclient and server.Naviz Applet
Naviz Servlets
GraphvizPattern Repository
Client
Server
Log Miner Log File
Fig. 1. Naviz Architecture
Due to security restrictions that are applied to applet, Naviz applet cannot directly write-access file system in the server, nor running the program. Hence, Naviz servlets acts as interface between applet and server-side programs, by opening HTTP connections between client and server.
3. Pattern repository in the server containing discovered patterns. Currently Naviz did not implement interactive communication between Naviz applet and log miner. Instead it uses a pattern repository that manages the miner output files such as traversals paths discovered from web log data. Currently repository contains traversals paths only. As Naviz visualization capability will improve, in the future we will expand repository to handle other pattern also such as clustering results.
4. Graphviz as server-side application that is responsible for drawing the graph layout. Graphviz that is responsible for drawing graph layout, allows us to specify detail parameters to draw graph regarding appropriate web traversal properties. Moreover, it is able to give the output as coordinate and size information of the graph in easily readable format for Naviz to use.
5. Log miner to discover traversals/paths from web log data in the server. Our mining engine currently implemented association rule mining, sequential pattern mining (traversals paths), and clustering. We have also a group of tools to preprocess web access logs. In the future we will add the capability that allows Naviz to communicate with these tools in order to improve its performance. Naviz has been programmed to operate on internal representations of graph, and to
allow the user to work with the graph. Naviz which run as an applet in the client browser, start up Graphviz on server through the servlet, to compute the graph layout. Whenever a user asks for new layout, Naviz sends graph to Graphviz. Graphviz computes the layout and sends the graph back to Naviz along with coordinate and size information as graph attributes. Naviz then redraws the graph using the new layout.

3.4 Features
Using Naviz webmasters can analyze web log data to discover navigational behavior of their visitors. From our experiment Naviz can discover knowledge about 1) the traversal diagram of visitor traversals on the site, 2) how many visitors are visiting which page, 3) how high is transition probability between two pages, 4) which pages are related each other, 5) how many number of hops are needed to reach certain page, 6) which path drove the most visitors to exit from site, 7) which path drove the most visitors to successfully find their goal, 8) are there visitors who were being lost in website etc.
Naviz has two operation modes, i.e. traversal diagram mode and traversal path mode. In traversal diagram mode Naviz displays traversal diagram that describes global visitor traversals on the entire site. It is a two-dimensional graph which nodes represent pages and edges represent traversals between pages. Thickness of edge represents support value of traversal and color of edge (ranges from blue to red) represents confidence degree (low to high). To form traversal diagram Naviz take into account considerations about appropriate web traversal properties and modern dynamic page, which will be explained below.
In traversal path mode, Naviz displays traversal path on top of traversal diagram, in such a manner that only one path is showed at one time. Which paths are showed can be filtered by specifying the pages that are visited and optionally by the number of hops required to reach those pages. Found paths are then displayed in traversal diagram one after another and can be ordered by support, confidence, or number of hops.
Naviz uses several strategies to form effective view of traversal diagram and traversal paths: 1. Consideration of appropriate web traversal properties.
− Hierarchization Default strategy of node placing in hierarchical position is that more traversed edges are placed in upper level position and less traversed ones in lower level. This would intuitively describe visitor traversals on a website from top to bottom of graph and give better understanding of the traversal diagram. This strategy can be changed interactively, i.e. higher confidence edges in upper level and lower confidence edges in lower level, although it may not suitable to visualize the traversal diagram. Moreover, graph orientation can be changed either vertically or horizontally.
− Grouping In visualizing the traversal diagram, it is often useful to group pages that related each other. This is done by give weight to indicate the importance of edges, such as more important edge will have shorter length. By default Naviz binds weight to confidence degree of edges, such that pages with high degree of transition probability will be grouped together. It can be changed interactively to be support value, so pages with heavy traffic of traversal among them will be grouped together.
2. Class-instance view Class-instance view is a technique to visualize a dynamic page either as a node of representative class or as many nodes of its instances. Modern dynamic page is a

class that has many instances. Every instance will bring different information on different access. Visualization of this kind of dynamic pages requires different technique from those of traditional static pages. By class-instance view technique, a class of dynamic page can be expanded to show information of some of instances it may have, and they can be merged back to a class to simplify the global view.
3. Navigational behavior comparison Web log data contains the information about various attributes of the visitor visit such as time, place etc. Utilizing this information Naviz can display the same traversal diagram of two different attributes in two different windows side by side. This is useful particularly to compare the visitor behavior of the same website regarding the different attribute, i.e. day behavior vs. night behavior, Tokyo people behavior vs. Osaka people behavior, in which Tokyo represents east of Japan while Osaka represents west of Japan.
4. Traversal path filtering Traversal paths is visualized over the underlying traversal diagram in such a manner that only one path will be showed in one time. As we slide path number slide bar, the corresponding path is showed. For traversal path visualizations, Naviz implements two filtering mechanisms i.e. filtering by number of hops (path length) and by visited pages. − The number of displayed paths will decrease/increase correspondingly as we
specify the number of hops. − We can choose which pages are visited, and find the paths of visitors that
traverse over those pages. There is no limit in the number of pages to choose. In general there are four cases to find the path: • Find paths that begin exactly at first chosen page, traverse over consecutive
chosen pages and finish exactly at last chosen page. • Find paths that begin exactly at first chosen page, traverse over consecutive
chosen pages and finish at any page. • Find paths that begin at any page, traverse over consecutive chosen pages and
finish exactly at last chosen page. • Find paths that begin at any page, traverse over consecutive chosen pages and
finish at any page. 5. Interactive environment.
Furthermore Naviz utilizes the interactive environment to provide more capabilities to explore navigational behavior from the data. Layout of the traversal diagram, strategy of hierarchization, grouping, and filtering all can be changed interactively to select the best structure representing the web log data. Users use mouse to point to a particular node/edge and Naviz will show detail explanations about the node/edge below the graph such as page’s title and url, edge’s support value and confidence degree etc. Clicking on the node will either bring the corresponding page in the browser (in traversal diagram mode), or selecting the pages for path searching (in traversal path mode).
4. Visualization of NTT i-Townpage served on i-Mode
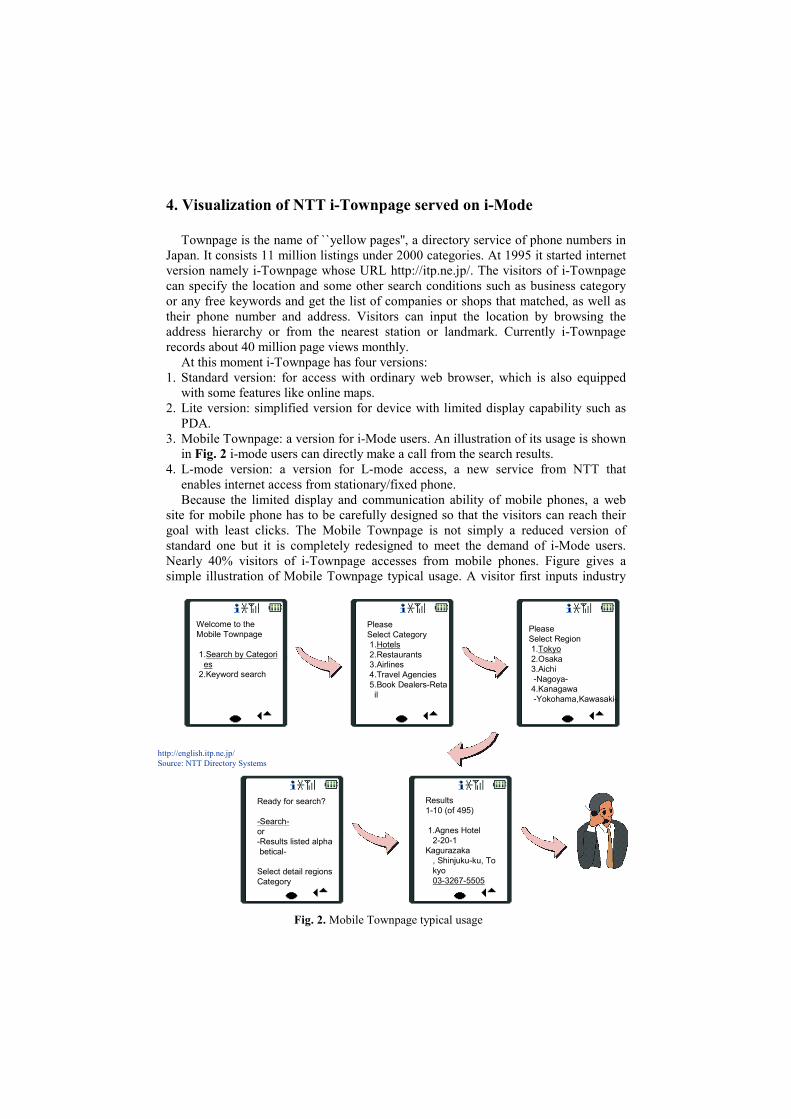
Townpage is the name of ``yellow pages'', a directory service of phone numbers in Japan. It consists 11 million listings under 2000 categories. At 1995 it started internet version namely i-Townpage whose URL http://itp.ne.jp/. The visitors of i-Townpage can specify the location and some other search conditions such as business category or any free keywords and get the list of companies or shops that matched, as well as their phone number and address. Visitors can input the location by browsing the address hierarchy or from the nearest station or landmark. Currently i-Townpage records about 40 million page views monthly.
At this moment i-Townpage has four versions: 1. Standard version: for access with ordinary web browser, which is also equipped
with some features like online maps. 2. Lite version: simplified version for device with limited display capability such as
PDA. 3. Mobile Townpage: a version for i-Mode users. An illustration of its usage is shown
in Fig. 2 i-mode users can directly make a call from the search results. 4. L-mode version: a version for L-mode access, a new service from NTT that
enables internet access from stationary/fixed phone. Because the limited display and communication ability of mobile phones, a web
site for mobile phone has to be carefully designed so that the visitors can reach their goal with least clicks. The Mobile Townpage is not simply a reduced version of standard one but it is completely redesigned to meet the demand of i-Mode users. Nearly 40% visitors of i-Townpage accesses from mobile phones. Figure gives a simple illustration of Mobile Townpage typical usage. A visitor first inputs industry
Welcome to theMobile Townpage
1.Search by Categori es 2.Keyword search
PleaseSelect Category 1.Hotels 2.Restaurants 3.Airlines 4.Travel Agencies 5.Book Dealers-Reta il
Results1-10 (of 495)
1.Agnes Hotel 2-20-1Kagurazaka , Shinjuku-ku, To kyo 03-3267-5505
PleaseSelect Region 1.Tokyo 2.Osaka 3.Aichi -Nagoya- 4.Kanagawa -Yokohama,Kawasaki-
Ready for search?
-Search-or-Results listed alpha betical-
Select detail regionsCategory
http://english.itp.ne.jp/Source: NTT Directory Systems
Fig. 2. Mobile Townpage typical usage

category by choosing from prearranged “Category List” or entering free keywords in “Input Form”. Then he/she decides the location. Afterward he/she can begin the
Fig. 3. Traversal diagram of visitor behavior of NTT Mobile Townpage.
search or browse more detailed location, and then get the “Search Result”. Data mining performed on the web log data of Mobile Townpage site from 1 to 7
May 2000 with size of 15 GB, using minimum support threshold of 0.1% resulted a set of traversal paths containing 1116 traversal between two pages and 4595 traversal paths among many pages (greater than two). Fig. 3 is the visualization result of traversal path between two pages by Naviz on traversal diagram mode, it gives the global view of visitor traversal on the entire site of Mobile Townpage. Here, we set minimum-maximum support to 0.7%-100% and minimum-maximum confidence to 0%-100%. The “Start” and “End” are not actual pages belong to the site, they are actually another sites placed somewhere on the internet, and indicate the entry and exit door to and from the site. The important pages include “Top” as the site’s top page, “Category List” as visitors choose their search here, “Input Form” where visitors fill in the free keyword, and “Search Result” which indicates that visitors found the answer and thus reached their goal.
In traversal diagram mode, Naviz considers appropriate web traversal properties to form view, so that we can think of visitors came into the site from top of the graph and went out from the bottom. We can see the most traversed edges, the thick ones, that are connecting pages “Top” “Region List” “Prefecture List” “Local Top” etc. are placed in the upper position of the graph. While the less traversed edges that are connecting “City Menu 1” ”City Menu 2”, Station Menu 1” ”Station Menu 2” etc. are placed in the lower position of the graph. Naviz also allows us to find related
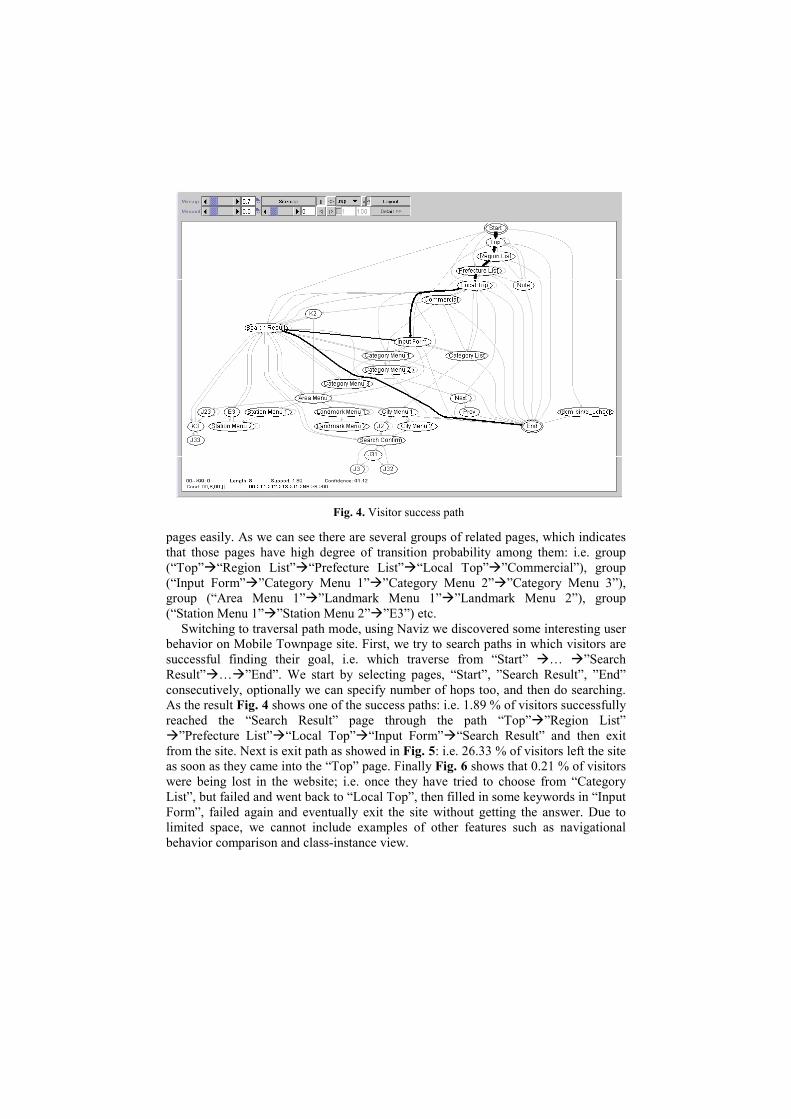
pages easily. As we can see there are several groups of related pages, which indicates that those pages have high degree of transition probability among them: i.e. group
Fig. 4. Visitor success path
(“Top” “Region List” “Prefecture List” “Local Top” ”Commercial”), group (“Input Form” ”Category Menu 1” ”Category Menu 2” ”Category Menu 3”), group (“Area Menu 1” ”Landmark Menu 1” ”Landmark Menu 2”), group (“Station Menu 1” ”Station Menu 2” ”E3”) etc.
Switching to traversal path mode, using Naviz we discovered some interesting user behavior on Mobile Townpage site. First, we try to search paths in which visitors are successful finding their goal, i.e. which traverse from “Start” … ”Search Result” … ”End”. We start by selecting pages, “Start”, ”Search Result”, ”End” consecutively, optionally we can specify number of hops too, and then do searching. As the result Fig. 4 shows one of the success paths: i.e. 1.89 % of visitors successfully reached the “Search Result” page through the path “Top” ”Region List”
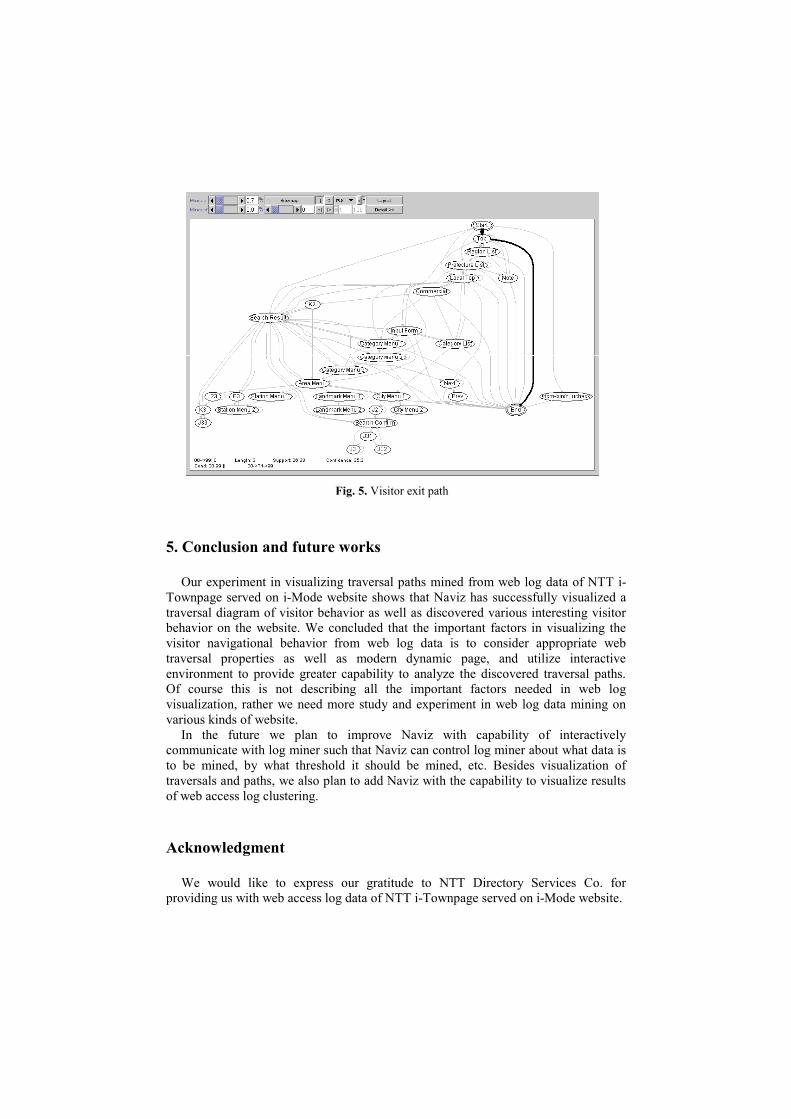
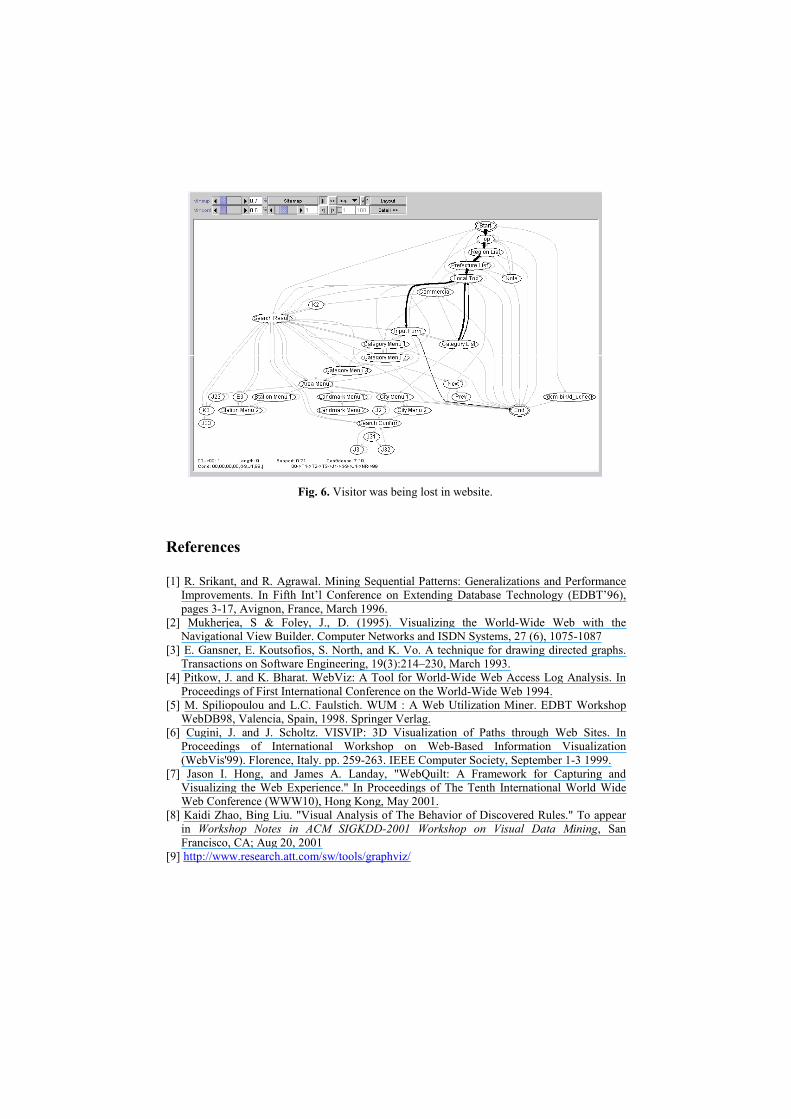
”Prefecture List” “Local Top” “Input Form” “Search Result” and then exit from the site. Next is exit path as showed in Fig. 5: i.e. 26.33 % of visitors left the site as soon as they came into the “Top” page. Finally Fig. 6 shows that 0.21 % of visitors were being lost in the website; i.e. once they have tried to choose from “Category List”, but failed and went back to “Local Top”, then filled in some keywords in “Input Form”, failed again and eventually exit the site without getting the answer. Due to limited space, we cannot include examples of other features such as navigational behavior comparison and class-instance view.
5. C
OTowtravbehvisitravenvOf visuvar
Icomto travof w
Ac
Wpro
onclusion and future works
Fig. 5. Visitor exit path
ur experiment in visualizing traversal paths mined from web log data of NTT i-npage served on i-Mode website shows that Naviz has successfully visualized a
ersal diagram of visitor behavior as well as discovered various interesting visitor avior on the website. We concluded that the important factors in visualizing the tor navigational behavior from web log data is to consider appropriate web ersal properties as well as modern dynamic page, and utilize interactive ironment to provide greater capability to analyze the discovered traversal paths. course this is not describing all the important factors needed in web log alization, rather we need more study and experiment in web log data mining on
ious kinds of website. n the future we plan to improve Naviz with capability of interactively municate with log miner such that Naviz can control log miner about what data is
be mined, by what threshold it should be mined, etc. Besides visualization of ersals and paths, we also plan to add Naviz with the capability to visualize results eb access log clustering.
knowledgment
e would like to express our gratitude to NTT Directory Services Co. for viding us with web access log data of NTT i-Townpage served on i-Mode website.
Re
[1] Ip
[2] N
[3] T
[4] P
[5] W
[6] P(
[7] VW
[8] iF
[9]
Fig. 6. Visitor was being lost in website.
ferences
R. Srikant, and R. Agrawal. Mining Sequential Patterns: Generalizations and Performance mprovements. In Fifth Int’l Conference on Extending Database Technology (EDBT’96), ages 3-17, Avignon, France, March 1996. Mukherjea, S & Foley, J., D. (1995). Visualizing the World-Wide Web with the avigational View Builder. Computer Networks and ISDN Systems, 27 (6), 1075-1087
E. Gansner, E. Koutsofios, S. North, and K. Vo. A technique for drawing directed graphs. ransactions on Software Engineering, 19(3):214–230, March 1993.
Pitkow, J. and K. Bharat. WebViz: A Tool for World-Wide Web Access Log Analysis. In roceedings of First International Conference on the World-Wide Web 1994.
M. Spiliopoulou and L.C. Faulstich. WUM : A Web Utilization Miner. EDBT Workshop ebDB98, Valencia, Spain, 1998. Springer Verlag.
Cugini, J. and J. Scholtz. VISVIP: 3D Visualization of Paths through Web Sites. In roceedings of International Workshop on Web-Based Information Visualization WebVis'99). Florence, Italy. pp. 259-263. IEEE Computer Society, September 1-3 1999. Jason I. Hong, and James A. Landay, "WebQuilt: A Framework for Capturing and isualizing the Web Experience." In Proceedings of The Tenth International World Wide eb Conference (WWW10), Hong Kong, May 2001.
Kaidi Zhao, Bing Liu. "Visual Analysis of The Behavior of Discovered Rules." To appear n Workshop Notes in ACM SIGKDD-2001 Workshop on Visual Data Mining, San rancisco, CA; Aug 20, 2001
http://www.research.att.com/sw/tools/graphviz/