INTER-AMERICAN TROPICAL TUNA COMMISSION - IATTC
104
ERRATA The figure on page 8 is incorrect; it should be the following: In Table A-4b (page 37), the landings reported for Mexico are incorrect; they should be the following: YFT SKJ BET PBF ALB BKJ BZX TUN Total % Landings–Descargas MEX 95,360 33,061 1,471 8,548 107 417 7 57 139,028 24.7
-
Upload
khangminh22 -
Category
Documents
-
view
4 -
download
0
Transcript of INTER-AMERICAN TROPICAL TUNA COMMISSION - IATTC

ERRATA
The figure on page 8 is incorrect; it should be the following:
In Table A-4b (page 37), the landings reported for Mexico are incorrect; they should be the following:
YFT SKJ BET PBF ALB BKJ BZX TUN Total % Landings–Descargas MEX 95,360 33,061 1,471 8,548 107 417 7 57 139,028 24.7

INTER-AMERICAN TROPICAL TUNA COMMISSION COMISIÓN INTERAMERICANA DEL ATÚN TROPICAL
73RD MEETING LANZAROTE (SPAIN)
20-24 JUNE 2005
DOCUMENT IATTC-73-04
TUNAS AND BILLFISHES IN THE EASTERN PACIFIC OCEAN IN 2004 A. The fishery for tunas and billfishes in the eastern Pacific Ocean ........................................... 1 B. Yellowfin tuna ...................................................................................................................... 54 C. Skipjack tuna......................................................................................................................... 63 D. Bigeye tuna ........................................................................................................................... 67 E. Pacific bluefin tuna ............................................................................................................... 77 F. Albacore tuna ........................................................................................................................ 79 G. Swordfish .............................................................................................................................. 82 H. Blue marlin............................................................................................................................ 84 I. Striped marlin........................................................................................................................ 86 J. Ecosystem considerations ..................................................................................................... 88
INTRODUCTION
This report provides a summary of the fishery for tunas in the eastern Pacific Ocean (EPO), an assessment of the stocks of tunas and billfishes that are exploited in the fishery, and an evaluation of the pelagic ecosystem in the EPO.
The report is based on data available to the IATTC staff in March 2005. In Section E (Pacific bluefin tuna), and the three sections on billfishes (G, H, I), only the catch information and/or figures have been updated from IATTC Fishery Status Report 2, published in 2004.
All weights of catches and discards are in metric tons (t). The following abbreviations are used:
Species: ALB Albacore tuna (Thunnus alalunga) BET Bigeye tuna (Thunnus obesus) BIL Unidentified billfishes BKJ Black skipjack (Euthynnus lineatus) BLM Black marlin (Makaira indica) BUM Blue marlin (Makaira nigricans) BZX Bonito (Sarda spp.) CGX Carangids DOX Dorados MLS Striped marlin (Tetrapturus audax) MZZ Unidentified marine fishes PBF Pacific bluefin tuna (Thunnus orientalis) SFA Indo-Pacific sailfish (Istiophorus
platypterus) SKJ Skipjack tuna (Katsuwonus pelamis) SKX Unidentified elasmobranchs SSP Shortbill spearfish (Tetrapturus
angustirostris)
SWO Swordfish (Xiphias gladius) TUN Unidentified tunas YFT Yellowfin tuna (Thunnus albacares)
Fishing gears: FX Unknown HAR Harpoon GO Gillnet LL Longline LP Pole-and-line LT Troll PS Purse seine RO Recreational TX Trawl

Flags: BLZ Belize BOL Bolivia CHN People’s Republic of China COL Colombia CRI Costa Rica ECU Ecuador ESP Spain GTM Guatemala HND Honduras JPN Japan KOR Republic of Korea MEX Mexico NIC Nicaragua PAN Panama PER Peru PYF French Polynesia SLV El Salvador TWN Chinese Taipei USA United States of America VEN Venezuela VUT Vanuatu
Set types: DEL Dolphin NOA Unassociated school OBJ Floating object FLT: Flotsam FAD: Fish-aggregating device
Ocean areas: EPO Eastern Pacific Ocean WCPO Western and Central Pacific Ocean
Miscellaneous: AMSY Average maximum sustainable yield OTR Other UNK Unknown

A. THE FISHERY FOR TUNAS AND BILLFISHES IN THE EASTERN PACIFIC OCEAN
1. Catches and landings of tunas, billfishes, and associated species ........................................................ 1 1.1. Catches by species ........................................................................................................................... 2 1.2. Distribution of catches of tunas ....................................................................................................... 5 1.3. Size compositions of the catches of tunas........................................................................................ 5 1.4. Catches of scombrids, by flag and gear ........................................................................................... 7 1.5. Landings by purse-seine and pole-and-line vessels ......................................................................... 7 1.6. Purse-seine catches per cubic meter of well volume ....................................................................... 7 2. Effort .................................................................................................................................................... 8 2.1. Purse seine ....................................................................................................................................... 8 2.2. Longline ........................................................................................................................................... 8 3. The fleet ............................................................................................................................................... 8 3.1. The purse-seine and pole-and-line fleet ........................................................................................... 8 3.2. Other fleets of the EPO.................................................................................................................. 10 This section summarizes the fisheries for species covered by the IATTC Convention (tunas and other fish caught by tuna-fishing vessels) in the eastern Pacific Ocean (EPO). The most important of these are the scombrids (Family Scombridae), which include tunas, bonitos and mackerels. The principal species of tunas caught are yellowfin, skipjack, and bigeye, with lesser catches of Pacific bluefin and albacore tunas; other scombrids, such as black skipjack, bonito, wahoo, and frigate and bullet tunas, are also caught.
This report also covers other species caught by tuna-fishing vessels in the EPO: swordfish and billfishes (marlins and sailfish) carangids, (yellowtail, rainbow runner, jack mackerel, and other mackerels), dorado, elasmobranchs (sharks, rays, and skates), and other marine fishes.
Most of the catches are made by the purse-seine and longline fleets; the pole-and-line fleet and various artisanal and recreational fisheries account for a small percentage of the total catches.
The most complete data are available for the purse-seine and pole-and-line fisheries (surface fisheries); data for the longline, artisanal and recreational fisheries are less complete.
The IATTC Regional Vessel Register contains details of vessels authorized to fish for tunas in the EPO. The IATTC has detailed records of most of purse-seine or pole-and-line vessels that fish for yellowfin, skipjack, bigeye, and/or Pacific bluefin tuna in the EPO. The Register is incomplete for small vessels, and for some fleets contains records for large (>24 m) longline vessels that fish in other areas or in any ocean.
Purse-seine vessels are grouped into six size classes, by carrying capacity in cubic meters (m3) of well volume, as follows:
Class 1 2 3 4 5 6 Volume (m3) <53 53-106 107-212 213-319 320-425 >425
The data in this report are derived from several sources, including vessel logbooks, observer data, unloading records, export and import records, samples of landings, reports from governments and other entities, and published reports.
In the tables, 0: effort or catch < 1t; blank: no data collected; *: data missing or not available.
1. CATCHES AND LANDINGS OF TUNAS, BILLFISHES, AND ASSOCIATED SPECIES
Estimates of the catches and landings of tunas, mainly yellowfin, skipjack, bigeye, and Pacific bluefin, by the purse-seine and pole-and-line fleet of the EPO come from several sources, including logbooks kept by the fishermen, data recorded by observers aboard the vessels, unloading data provided by canneries and other processors, export and import records, and estimates derived from the species composition sampling program. Estimating the total catch for a fishery is difficult, for various reasons. Some fish are discarded at sea, and data for some gear types are often incomplete. Data for fish discarded at sea by Class-6 purse-
IATTC-73-04 Tunas and billfishes in the EPO 1

seine vessels have been collected by observers since 1993. This information allows for better estimation of the total amounts of fish caught by the purse-seine fleet. Estimates of the total amount of the catch that is landed (hereafter referred to as retained catch) are based principally on data from unloadings. Beginning in this report, the unloading data for purse-seine and pole-and-line vessels have been adjusted, based on the species composition estimates for yellowfin, skipjack, and bigeye tunas. The species composition sampling program, described in Section 1.3.1, began in 2000, so the catch data for 2000-2004 are adjusted based on estimates obtained for each year, by flag. The catch data for the previous years were adjusted by applying the average ratio by species from the 2000-2004 estimates, by flag, and summing over all flags. This has tended to increase the recorded catches of bigeye and decrease those of yellowfin and/or skipjack. These adjustments are all preliminary, and may be improved in the future. All the purse-seine and pole-and-line data for 2004 are preliminary.
Data on the retained catches of most of the larger longline vessels are obtained from the governments of the nations that fish for tunas in the EPO. Longline vessels, particularly the larger ones, direct their effort primarily at bigeye, yellowfin, albacore, or swordfish. Data from smaller longliners, artisanal vessels, and other gears that fish for tunas, billfishes, and sharks in the EPO were gathered either directly from the governments, from logbooks, or from reports published by the governments. Data for the western and central Pacific Ocean (WCPO) were provided by the Ocean Fisheries Programme of the Secretariat of the Pacific Community (SPC). All longline data and data for other gears for 2003 and 2004 are preliminary.
The data from all of the above sources are compiled in a database by IATTC staff and summarized in this report. In recent years, the IATTC staff has put effort towards summarizing the catches of tunas, billfishes, and other species caught by other gear types such as trollers, harpooners, gillnetters, and recreational vessels. The estimated total catches from all sources mentioned above of yellowfin, skipjack, and bigeye in the entire Pacific Ocean are shown in Table A-1, and are discussed further in the sections below.
Estimates of the annual retained and discarded catches of tunas and other species taken by tuna-fishing vessels in the EPO during 1975-2004 are shown in Table A-2. The catches of scombrids by all gears during 2000-2004 are broken down by gear and flag in Tables A-3a-e, and the purse-seine and pole-and-line catches of scombrids during 2003-2004 are summarized by flag in Tables A-4a-b. There were no restrictions on fishing for tunas in the EPO during 1988-1997, but catches of most species have been affected by restrictions on fishing during some or all of the last six months of 1998-2004. Furthermore, regulations placed on purse-seine vessels directing their effort at tunas associated with dolphins have affected the way these vessels operate, especially since the late 1980s, as discussed further in Section 3.
Catches have also been affected by climate perturbations, such as the major El Niño events that occurred during 1982-1983 and 1997-1998. These events made the fish less vulnerable to capture by purse seiners due to the greater depth of the thermocline, but had no apparent detrimental effect on the longline catches. Yellowfin recruitments tend to be larger after an El Niño event. The effects of El Niño events and other environmental conditions on the fisheries of the EPO are discussed further in Section J.5, Physical environment.
1.1. Catches by species
1.1.1. Yellowfin tuna
The annual catches of yellowfin during 1975-2004 are shown in Table A-1 and Figure B-1. Overall, catches in both the EPO and WCPO have increased during this period. In the EPO, the El Niño of 1982-1983 led to a reduction in catches in those years, whereas catches in the WCPO were not affected. Although the El Niño of 1997-1998 was greater in scope, it did not have the same effect on yellowfin catches. In the WCPO, catches of yellowfin reached 350 thousand metric tons (t) in 1990, peaked at 466 thousand t in 1998, and remained high through 2003 (2004 data for the WCPO are not yet available). Catches throughout the Pacific Ocean were high during 2001-2003. In the EPO, the catch of yellowfin in 2002, 440 thousand t, was the greatest on record, but in 2004 catches decreased substantially.
IATTC-73-04 Tunas and billfishes in the EPO 2

The average annual retained catch of yellowfin in the EPO by purse-seine and pole-and-line vessels during 1989-2003 was 276 thousand (t) (range: 212 to 413 thousand t). The preliminary estimate of the retained catch of yellowfin in 2004, 270 thousand t, was 29% less than in 2003, and 2% less than the average for 1989-2003. The average amount of yellowfin discarded at sea during 1993-2004 was about 2% of the total purse-seine catch (retained catch plus discards) of yellowfin (range: 1 to 3%) (Table A-2a).
The annual retained catches of yellowfin from the EPO by longliners during 1975-2004 are shown in Table A-2a. During 1989-2003 they remained relatively stable, averaging about 22 thousand t (range: 11 to 35 thousand t), or about 7% of the total retained catches of yellowfin. Yellowfin are also caught by recreational vessels, as incidental catch by gillnetters, and by artisanal fisheries. Estimates of these catches are shown in Table A-2a, under “Other gears” (OTR); during 1989-2003 they averaged about 2 thousand t.
Further information on yellowfin tuna is presented in Section B of this report.
1.1.2. Skipjack tuna
The annual catches of skipjack during 1975-2004 are shown in Table A-1 and Figure C-1. The catches in the WCPO have increased substantially, and account for a much greater proportion of the total catch of skipjack in the Pacific Ocean than the EPO. The greatest reported catch in the WCPO, 1.3 million t, occurred in 1998, while the greatest reported catch in the EPO, 296 thousand t, occurred in 2003.
During 1989-2003 the annual retained catch of skipjack from the EPO by purse-seine and pole-and-line vessels averaged 138 thousand t (range 64 to 276 thousand t). The preliminary estimate of the retained catch of skipjack in 2004, 197 thousand t, is 43% greater than the average for 1989-2003, but 28% less than the catch in 2003. The average amount of skipjack discarded at sea during 1993-2004 was about 11% of the total catch of skipjack (range: 7 to 19%) (Table A-2a).
Small amounts of skipjack are caught with longlines and other gears (Table A-2a).
Further information on skipjack tuna is presented in Section C of this report.
1.1.3. Bigeye tuna
The annual catches of bigeye during 1975-2004 are shown in Table A-1 and Figure D-1. Overall, catches in both the EPO and WCPO have increased, but with many fluctuations. Catches in the EPO reached 100 thousand t in 1986, and have fluctuated between about 70 and 125 thousand t since, with the greatest reported catch in 2000. In the WCPO catches of bigeye increased to over 85 thousand t during the late 1970s, decreased in the 1980s, then increased, with smaller fluctuations, until 1999, when catches reached over 110 thousand t. The greatest reported catch of bigeye in the WCPO, about 115 thousand t, occurred in 2002.
Prior to 1994, the average annual retained catch of bigeye taken by purse-seine vessels in the EPO was about 9 thousand t (range 1 to 22 thousand t). Following the development of fish-aggregating devices (FADs), placed in the water by fishermen to aggregate tunas, the annual retained catches of bigeye increased from 35 thousand t in 1994 to 44 to 64 thousand t during 1995-1999, to a record high of 94 thousand t in 2000. A preliminary estimate of the retained catch in the EPO in 2004 is 67 thousand t (Table A-2a). The average amount of bigeye discarded at sea during 1993-2004 was about 5% of the purse-seine catch of bigeye (range: 1 to 9%). Small amounts of bigeye are caught by pole-and-line vessels, as shown in Table A-2a.
During 1975-1993, prior to the increased use of FADs and the resulting greater catches of bigeye by purse-seine vessels, the longline fisheries accounted for about 88%, on average, of the retained catches of this species from the EPO. During 1994-2003 the annual retained catches of bigeye by the longline fisheries ranged from about 36 to 73 thousand t (average: 56 thousand t), or an average of 48% of the total catch of bigeye in the EPO (Table A-2a).
IATTC-73-04 Tunas and billfishes in the EPO 3

Small amounts of bigeye are caught by other gears, as shown in Table A-2a.
Further information on bigeye tuna is presented in Section D of this report.
1.1.4. Bluefin tuna
Table A-5 and Figure E-1 show the catches of Pacific bluefin in the entire Pacific Ocean, by flag and gear. The data are taken from the International Scientific Committee for the North Pacific (ISC), and are reported by fishing nation or entity, regardless of the area of the Pacific Ocean in which the fish were caught.
Table A-2a shows the catches of Pacific bluefin in the EPO during 1974-2004, by gear. During 1989-2003 the annual retained catch of bluefin from the EPO by purse-seine and pole-and-line vessels averaged 2 thousand t (range 400 t to 8 thousand t). The preliminary estimate of the retained catch of bluefin in 2004, 9 thousand t, is four times the average for 1989-2003. Small amounts of bluefin are discarded at sea by purse-seine vessels (Table A-2a).
Further information on Pacific bluefin tuna is presented in Section E of this report.
1.1.5. Albacore tuna
Tables A-6a-b and Figures F-1a-b show the catches of albacore in the entire Pacific Ocean, by gear, and area (north and south of the equator (table and figure), and east and west of 150°W (table only)), and Table A-2a shows the catches of albacore in the EPO, by gear. A significant portion of the albacore catch is taken by trollers, included under “Other gears” (OTR) in Table A-2a. The catches are compiled from IATTC data for the EPO and from SPC data for the WCPO.
Further information on albacore tuna is presented in Section F of this report.
1.1.6. Other tunas and tuna-like species
While yellowfin, skipjack, and bigeye tunas comprise the most significant portion of the retained catches of the purse-seine and pole-and-line fleet in the EPO, other scombrids such as black skipjack, bonito, wahoo, and frigate and bullet tunas, contribute to the overall harvest in this area. The estimated annual retained and discarded catches of these species during 1975-2004 are presented in Table A-2a. Catches reported in the unidentified tunas category (TUN) in Table A-2a contain some catches reported by species (frigate or bullet tunas, wahoo) along with the unidentified tunas. The total retained catch of these other scombrid species by these fisheries was about 1 thousand t in 2004, which is less than the 1989-2003 annual average retained catch of about 4 thousand t (range: 1 to 15 thousand t).
Black skipjack are also caught by other gears in the EPO, mostly by coastal artisanal fisheries. Bonitos are also caught by artisanal fisheries, and have been reported as catch by longline vessels in some years.
1.1.7. Swordfish and billfishes
Catch data for swordfish and billfishes (blue marlin, black marlin, striped marlin, shortbill spearfish, and sailfish) are shown in Table A-2b and in Figures G-1, H-1 and I-1.
Swordfish are fished in the EPO with longline gear (coastal, offshore, and distant water), gillnets, harpoons, and occasionally with recreational gear and by artisanal vessels. The average annual longline catch of swordfish during 1989-2003 was 9 thousand t, but during 2001-2003 was over 15 thousand t. It is not clear whether this is due to increasing effort towards swordfish.
Billfishes are caught with longline, recreational gear, and by artisanal vessels. The average annual longline catch of blue marlin and striped marlin during 1989-2003 was about 5 thousand and 3 thousand t, respectively. Smaller amounts of other billfishes are taken by longline.
Unfortunately, little information is available on the recreational catches of swordfish and billfishes, but they are believed to be substantially less than the commercial catches for all species.
IATTC-73-04 Tunas and billfishes in the EPO 4

Small amounts of swordfish and billfishes are caught by purse seiners, but are considered discarded, although some fish may be landed but not reported. These data are also included in Table A-2b.
Further information on swordfish, blue marlin, and striped marlin is presented in Sections G-I of this report.
1.1.8. Other species
Catches and discards of carangids (yellowtail, rainbow runner, jack mackerel, and other mackerels), dorado, elasmobranchs (sharks, rays, and skates), and other marine fishes caught in the EPO are shown in Table A-2c.
Dorado are unloaded mainly in ports in Central America. Although the catches are greater than 10 thousand t in some years, the gear types used are often not reported.
1.2. Distribution of catches of tunas
1.2.1. Purse-seine catches
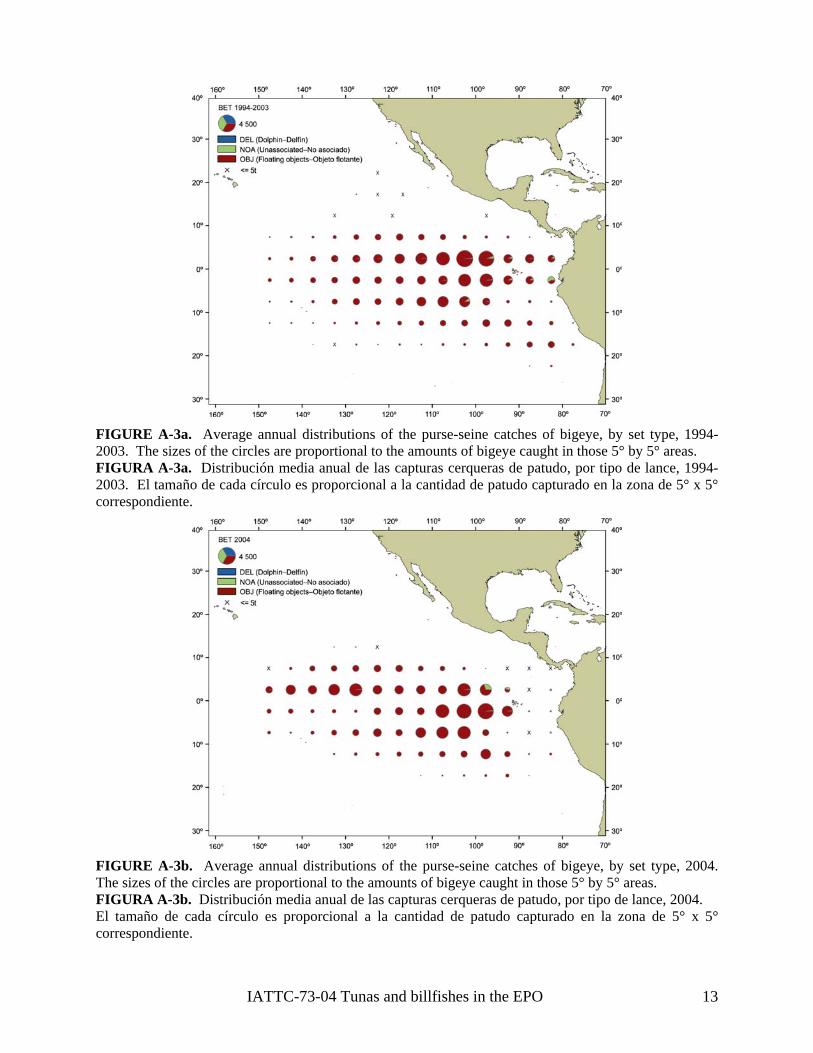
The average annual distributions of the catches of yellowfin, skipjack, and bigeye, by set type, for purse-seine and pole-and-line vessels in the EPO during 1989-2003 (1994-2003 for bigeye), are shown in Figures A-1a, A-2a, and A-3a, and preliminary estimates for 2004 are shown in Figures A-1b, A-2b, and A-3b. The catches of yellowfin were significantly less in the northern areas off Mexico and Central America in 2004. The distribution of the skipjack catches in 2004 were similar to those of 1989-2003, although the catches in the nearshore areas off Mexico were greater, possibly due to changes in fishing strategy due to the poor yellowfin fishing. Bigeye are not often caught north of about 7°N. The distribution of the catches of bigeye during 2004 indicated a reduction in the catches in the nearshore areas off South America. With the development of the fishery for tunas associated with FADs, described above, the relative importance of the nearshore areas has decreased, while that of the offshore areas has increased.
1.2.2. Longline catches
Data on the spatial and temporal distributions of catches by distant-water longline fleets of China, Chinese Taipei, French Polynesia, Japan, Korea, Spain, the United States, and Vanuatu are held in databases of the IATTC. Bigeye and yellowfin tunas make up the majority of the catches by most of these vessels. The distribution of the catches of bigeye and yellowfin tunas in the Pacific Ocean by the Japanese longline fleet during 1999-2003 is shown in Figure A-4.
1.3. Size compositions of the catches of tunas
1.3.1. Purse-seine, pole-and-line, and recreational fisheries
Length-frequency samples are the basic source of data used for estimating the size and age compositions of the various species of fish in the landings. This information is necessary to obtain age-structured estimates of the population for various purposes, including the integrated modeling that the staff has employed during the last several years. The results of such studies have been described in several IATTC Bulletins, in all of its Annual Reports since that for 1954, and in its Stock Assessment Reports.
Length-frequency samples of yellowfin, skipjack, bigeye, Pacific bluefin, and, occasionally, black skipjack from the catches of purse-seine, pole-and-line, and recreational vessels in the EPO are collected by IATTC personnel at ports of landing in Ecuador, Mexico, Panama, the USA, and Venezuela. The catches of yellowfin and skipjack were first sampled in 1954, bluefin in 1973, and bigeye in 1975. Sampling has continued to the present.
The methods for sampling the catches of tunas are described in the IATTC Annual Report for 2000 and in IATTC Stock Assessment Report 4. Briefly, the fish in a well of a purse-seine or pole-and-line vessel are selected for sampling only if all the fish in the well were caught during the same calendar month, in the same type of set (floating-object, unassociated school, or dolphin), and in the same sampling area. These
IATTC-73-04 Tunas and billfishes in the EPO 5

data are then categorized by fishery (Figure A-5), based on the staff’s most recent stock assessments.
Data for fish caught during the 1999-2004 period are presented in this report. Two sets of length-frequency histograms are presented for each species, except bluefin; the first shows the data by stratum (gear type, set type, and area) for 2004, and the second shows the combined data for each year of the 1999–2004 period. For bluefin, the histograms show the 1999-2004 catches by commercial and recreational gear combined. Samples from 496 wells (including 10 from recreational vessels) were taken during 2004. Only a small amount of catch was recorded from pole-and-line vessels in 2004, and only one sample was taken from these vessels.
There are ten yellowfin surface fisheries defined for stock assessments: four associated with floating-objects, two unassociated school, three associated with dolphins, and one pole-and-line (Figure A-5). The last fishery includes all 13 sampling areas. Of the 496 wells sampled, 379 contained yellowfin. The estimated size compositions of the fish caught during 2004 are shown in Figure A-6a. The majority of the yellowfin catch was taken by sets on schools associated with dolphins. The larger yellowfin (>100 cm) were caught mostly during the first half of 2004, while those <100 cm were caught mostly during the second half of that year. However, a mode of smaller yellowfin (<60 cm) was evident in the Southern unassociated fishery during the second quarter. These smaller fish were also present in the Northern unassociated fishery and in all of the floating-object fisheries. Small amounts of yellowfin were caught in the floating-object fisheries throughout the year. The catches by pole-and-line vessels were negligible.
The estimated size compositions of the yellowfin caught by all fisheries combined during 1999-2004 are shown in Figure A-6b. The average weights of the yellowfin caught in 2004 were the lowest since 1999. The majority of yellowfin >10 kg in weight were caught during the first half of 2004. The mode between 80 and 100 cm was the most prevalent size group during all of the quarters except the second.
There are eight skipjack fisheries defined for stock assessments: four associated with floating-objects, two unassociated school, one associated with dolphins, and one pole-and-line (Figure A-5). The last two fisheries include all 13 sampling areas. Of the 496 wells sampled, 328 contained skipjack. The estimated size compositions of the fish caught during 2004 are shown in Figure A-7a. The majority of the skipjack catch during the first half of 2004 was taken in unassociated and floating-object sets in the Southern area. During the second quarter, however, the catches of skipjack increased in the Northern area. During the third quarter, the majority of skipjack were caught in the Northern area, although the catches increased in the Equatorial floating-object fishery as well. The catches of skipjack in latter fishery continued to increase during the fourth quarter, and fish were also caught again in the two Southern fisheries. The three modes of fish evident in the Northern unassociated fishery were caught in three different quarters: the largest fish in the third quarter, the smallest fish in the fourth quarter, and the medium-sized fish in the second quarter. The skipjack caught in the fishery for schools associated with dolphins were taken mostly during the second quarter. Negligible amounts of skipjack were caught by pole-and-line vessels.
The estimated size compositions of the skipjack caught by all fisheries combined during 1999-2004 are shown in Figure A-7b. The smaller fish (40 to 50 cm) were caught primarily during the first and fourth quarters of 2004, and the larger ones (>55 cm) primarily during the second quarter that year.
There are seven bigeye surface fisheries defined for stock assessments: four associated with floating-objects, one unassociated school, one associated with dolphins, and one pole-and-line (Figure A-5). The last three fisheries include all 13 sampling areas. Of the 496 wells sampled, 118 contained bigeye. The estimated size compositions of the fish caught during 2004 are shown in Figure A-8a. In 2000 the majority of the catch was taken in floating-object sets in the Equatorial area, whereas from 2001 to 2003 the majority of the bigeye catch was taken in sets on floating objects in the Southern area. In 2004 nearly equal amounts of bigeye were taken in the Northern, Equatorial, and Southern floating-object fisheries. Negligible amounts of bigeye were caught in sets on unassociated schools, in floating-object sets in the Inshore area, and in sets on schools associated with dolphins. There were no recorded catches of bigeye by pole-and-line vessels.
IATTC-73-04 Tunas and billfishes in the EPO 6

The estimated size compositions of the bigeye caught by all fisheries combined during 1999-2004 are shown in Figure A-8b. The average weight of the fish was greatest in 2000, when the greatest catch of bigeye was taken. Since 2002 the average weights of bigeye have been fairly constant. The smaller bigeye (40-60 cm) were caught mainly during the latter half of 2004, while the majority of the larger fish were caught during the fourth quarter.
Pacific bluefin are caught by purse-seine and recreational gear off California and Baja California from about 23°N to 35°N, with most of the catch being taken during May through October. During 2004 bluefin were caught between 26°N and 31°N from May through August. The majority of the catches of bluefin by both commercial and recreational vessels were taken during July and August. In the past, commercial and recreational catches have been reported separately. In 2004, however, only 10 samples were taken from recreational vessels and only 14 from commercial vessels (from the total of 496 samples for 2004), making it infeasible to estimate the catches and size compositions separately. Therefore, the commercial and recreational catches of bluefin were combined for each year of the 1999-2004 period. The estimated size compositions are shown in Figure A-9. The commercial catch (8,548 t) of bluefin far exceeded the recreational catch (53 t), but the estimate for the latter is very preliminary.
Black skipjack are caught incidentally by fishermen who direct their effort toward yellowfin, skipjack, and bigeye tuna. The demand for this species is low, so most of the catch is discarded at sea, but small amounts, mixed with the more desirable species, are sometimes retained. Because only one sample of black skipjack was taken from the 496 wells sampled during 2004, length-frequency histograms for this species are not presented in this report.
1.3.2. Longline fishery
The estimated size compositions of the catches of yellowfin and bigeye by the Japanese longline fishery in the EPO during 1999-2003 are shown in Figures A-10 and A-11. The average weights of both yellowfin and bigeye taken by that fishery have remained about the same throughout its existence. Additional information on the size compositions of those fish is available in IATTC Bulletins describing the Japanese longline fishery.
1.4. Catches of scombrids, by flag and gear
The annual retained catches of scombrids in the EPO during 2000-2004, by flag and gear, are shown in Tables A-3a-e. These tables include all of the known catches of tunas compiled from records gathered from governments, fish-processing companies, logbooks, and import-export records. Similar information on scombrids prior to 2000, and historic data for tunas, billfishes, sharks, mackerels, dorados, and miscellaneous fishes will be available on the IATTC website (www.iattc.org). The purse-seine and pole-and-line catches of scombrids in 2003 and 2004, by flag, are summarized in Tables A-4a-b (top panels).
1.5. Landings by purse-seine and pole-and-line vessels
The landings are fish unloaded from fishing vessels during a calendar year, regardless of the year of catch. The country of landing is that in which the fish were unloaded or, in the case of transshipments, the country that received the transshipped fish. Preliminary landings data for 2003 and 2004 (Tables A-4a-b, lower panels) indicate that, of the 563 thousand t of tunas landed in 2004, 49% was landed in Ecuador and 25% in Mexico. Other countries with significant landings of tunas caught in the EPO included Colombia (11%), and Costa Rica and Venezuela (4% each). It is important to note that, when final information is available, the landings currently assigned to various countries may change due to exports from storage facilities to processors in other nations.
1.6. Purse-seine catches per cubic meter of well volume
The total retained catch per cubic meter of well volume (C/m3) for the purse-seine vessels that fish for tunas in the EPO are presented in Table A-7 for the EPO and for all ocean fishing areas from which those vessels harvested fish, by vessel size group, area, and species, for 2000-2004. To provide more detail in this index than would be available if the IATTC's historical six classes of vessel capacity classification
IATTC-73-04 Tunas and billfishes in the EPO 7

were used, the vessels are assigned to eight size groups. Yellowfin, skipjack, and bigeye contribute the most to the C/m3 for the larger vessels, while other species of tuna, such as black skipjack, make up an important part of the C/m3 of the smaller vessels in many years.
Purse-seine catches of tunas, by species and set
type, 1987-2004
2. EFFORT
2.1. Purse seine
Tunas are caught by purse-seine vessels in three types of schools, associated with dolphins, associated with floating objects, such as flotsam or FADs, and associated only with other fish (unassociated schools). Estimates of the numbers of purse-seine sets of each type in the EPO during the 1987-2004 period, and the retained catches of these sets, are shown in Table A-8 and in the figure on this page. The estimates for Class-1 to -5 vessels were calculated from logbook data in the IATTC statistical data base, and those for Class-6 vessels were calculated from the observer data bases of the IATTC, Ecuador, the European Union, Mexico, the United States, and Venezuela. The greatest numbers of sets on schools associated with floating objects and on unassociated schools of tuna were made from the mid-1970s to the early 1980s. Despite opposition to fishing for tunas associated with dolphins and the refusal of U.S. canners to accept tunas caught during trips during which sets were made on dolphin-associated fish, the numbers of sets made on fish associated with dolphins decreased only moderately during the mid-1990s, and in 2003 were the greatest recorded.
There are two types of floating objects, flotsam and FADs. The occurrence of the former is unplanned from the point of view of the fishermen, whereas the latter are constructed by fishermen specifically for the purpose of attracting fish. FADs have been in use for about ten years, and their relative importance has increased during this period, while that of flotsam has decreased, as shown by the data in Table A-9.
2.2. Longline
The reported annual effort, in total number of hooks, regardless of the target species, and catches of the predominant tuna species by longline vessels in the EPO are shown in Table A-10. Data for China, Chinese Taipei, French Polynesia, Japan, the Republic of Korea (1987-2003 only), and the United States are representative of total catch and effort, whereas those of Mexico, Panama, the Republic of Korea (1975-1986), and Vanuatu were compiled from logbook data, and do not represent the totals.
3. THE FLEET
3.1. The purse-seine and pole-and-line fleet
The IATTC maintains detailed records of gear, flag, and fish-carrying capacity for most of the vessels that fish with purse-seine or pole-and-line gear for yellowfin, skipjack, bigeye, and/or Pacific bluefin tuna in the EPO. The fleet described here includes purse-seine and pole-and-line vessels that have fished all or part of the year in the EPO for these four species.
Historically the owner's or builder's estimates of carrying capacities of individual vessels, in tons of fish, were used until landing records indicated that revision of these estimates was required. The vessels were
IATTC-73-04 Tunas and billfishes in the EPO 8

grouped, by carrying capacity, originally in short tons and later in metric tons, into six size classes.
Carrying capacity, in cubic meters of well volume, of the
purse-seine and pole-and-line fleets in the EPO, 1961-2004
For the past several years the IATTC has used well volume, in cubic meters (m3), instead of weight, in metric tons, to measure the carrying capacities of the vessels. Since a well can be loaded with different densities of fish, measuring carrying capacity in weight is subjective, as a load of fish packed into a well at a higher density weighs more than a load of fish packed at a lower density. Using volume as a measure of capacity eliminates this problem.
The IATTC staff began collecting capacity data by volume in 1999, but has not yet obtained this information for all vessels. For vessels for which reliable information on well volume is not available, the estimated capacity in metric tons was converted to cubic meters.
Until about 1960 fishing for tunas in the EPO was dominated by pole-and-line vessels operating in coastal regions and in the vicinity of offshore islands and banks. During the late 1950s and early 1960s most of the larger pole-and-line vessels were converted to purse seiners, and by 1961 the EPO surface fleet was dominated by these vessels. From 1961 to 2004 the number of pole-and-line vessels decreased from 93 to 3, and their total well volume from about 11 thousand to about 3 hundred cubic meters (m3). During the same period the number of purse seiners increased from 125 to 215, and their total well volume from about 32 thousand to about 206 thousand m3, an average of about 958 m3 per vessel. An earlier peak in numbers and total well volume of purse seiners occurred from the mid-1970s to the early 1980s, when the number of vessels reached 282 and the total well volume about 195 thousand m3, an average of about 693 m3 per vessel (Table A-11; figure on this page).
The catch rates in the EPO were low during 1978-1981 due to concentration of fishing effort on small fish, and the situation was exacerbated by a major El Niño event, which began in mid-1982 and persisted until late 1983 and made the fish less vulnerable to capture. The total well volume then declined as vessels were deactivated or left the EPO to fish in other areas, primarily the western Pacific Ocean, and in 1984 it reached its lowest level since 1971, about 125 thousand m3. In early 1990 the U.S. tuna-canning industry adopted a policy of not purchasing tunas caught during trips during which sets on tunas associated with dolphins were made. This caused many U.S.-flag vessels to leave the EPO, with a consequent reduction in the fleet to about 119 thousand m3 in 1992. With increases in participation of vessels of other nations in the fishery, the total well volume has increased steadily since 1992, and in 2004 was 206 thousand m3.
The 2003 and preliminary 2004 data for numbers and total well volumes of purse seiners and pole-and-line vessels that fished for tunas in the EPO are shown in Tables A-12a-b. The fleet was dominated by vessels operating under the Mexican and Ecuadorian flags during 2004. The Mexican fleet had about 25% of the total well volume during 2004, Ecuador about 24%, Venezuela and Panama about 15 and 13%, respectively, and Colombia, Spain, and the USA about 4% each.
Class-6 vessels made up about 91% of the total well volume of the purse-seine fleet operating in the EPO during 2004. The cumulative capacity at sea during 2004 is compared to those of the previous four years in the figure on the next page.
The monthly average, minimum, and maximum total well volumes at sea (VAS), in thousands of cubic meters, of purse-seine and pole-and-line vessels that fished for tunas in the EPO during 1994-2003, and
IATTC-73-04 Tunas and billfishes in the EPO 9

the 2004 values, are shown in Table A-13. The monthly values are averages of the VAS estimated at weekly intervals by the IATTC staff. The fishery was regulated during some or all of the last four months of 1998-2004, so the VAS values for September-December 2004 are not comparable to the average VAS values for those months of 1994-2003. The VAS values for 2004 exceeded the maximum VAS values for 1994-2003 for every month. The average VAS values for 1994-2003 and 2004 were 96 thousand m3 (58% of total capacity) and 129 thousand m3 (63% of total capacity), respectively.
Cumulative capacity of the purse-seine and pole-and-line fleet at sea, by month, 1999-2004
3.2. Other fleets of the EPO
Information on other types of vessels that fish for tunas in the EPO is available on the IATTC’s Regional Vessel Register, on the IATTC website. The Register is incomplete for small vessels, and for some fleets contains records for large (>24 m) longline vessels that fish in other areas or in any ocean.
IATTC-73-04 Tunas and billfishes in the EPO 10
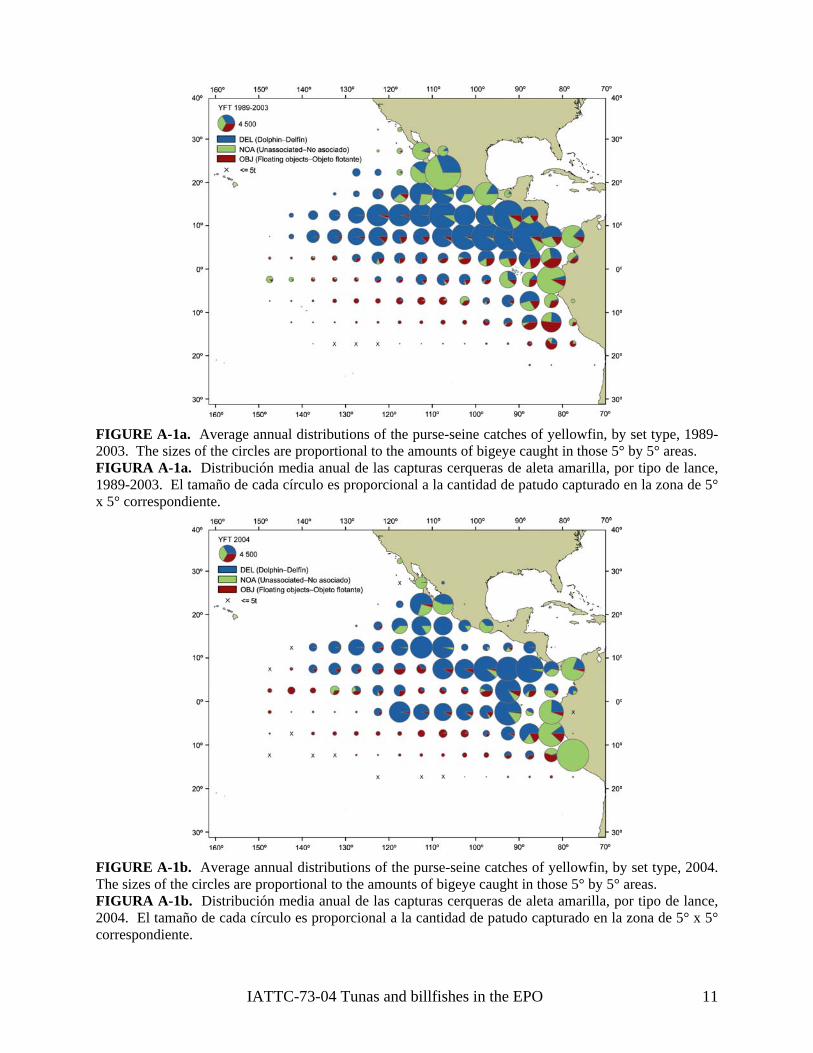
FIGURE A-1a. Average annual distributions of the purse-seine catches of yellowfin, by set type, 1989-2003. The sizes of the circles are proportional to the amounts of bigeye caught in those 5° by 5° areas. FIGURA A-1a. Distribución media anual de las capturas cerqueras de aleta amarilla, por tipo de lance, 1989-2003. El tamaño de cada círculo es proporcional a la cantidad de patudo capturado en la zona de 5° x 5° correspondiente.
FIGURE A-1b. Average annual distributions of the purse-seine catches of yellowfin, by set type, 2004. The sizes of the circles are proportional to the amounts of bigeye caught in those 5° by 5° areas. FIGURA A-1b. Distribución media anual de las capturas cerqueras de aleta amarilla, por tipo de lance, 2004. El tamaño de cada círculo es proporcional a la cantidad de patudo capturado en la zona de 5° x 5° correspondiente.
IATTC-73-04 Tunas and billfishes in the EPO 11

FIGURE A-2a. Average annual distributions of the purse-seine catches of skipjack, by set type, 1989-2003. The sizes of the circles are proportional to the amounts of bigeye caught in those 5° by 5° areas. FIGURA A-2a. Distribución media anual de las capturas cerqueras de barrilete, por tipo de lance, 1989-2003. El tamaño de cada círculo es proporcional a la cantidad de patudo capturado en la zona de 5° x 5° correspondiente.
FIGURE A-2b. Average annual distributions of the purse-seine catches of skipjack, by set type, 2004. The sizes of the circles are proportional to the amounts of bigeye caught in those 5° by 5° areas. FIGURA A-2b. Distribución media anual de las capturas cerqueras de barrilete, por tipo de lance, 2004. El tamaño de cada círculo es proporcional a la cantidad de patudo capturado en la zona de 5° x 5° correspondiente.
IATTC-73-04 Tunas and billfishes in the EPO 12
IATTC-73-04 Tunas and billfishes in the EPO 13
FIGURE A-3a. Average annual distributions of the purse-seine catches of bigeye, by set type, 1994-2003. The sizes of the circles are proportional to the amounts of bigeye caught in those 5° by 5° areas. FIGURA A-3a. Distribución media anual de las capturas cerqueras de patudo, por tipo de lance, 1994-2003. El tamaño de cada círculo es proporcional a la cantidad de patudo capturado en la zona de 5° x 5° correspondiente.
FIGURE A-3b. Average annual distributions of the purse-seine catches of bigeye, by set type, 2004. The sizes of the circles are proportional to the amounts of bigeye caught in those 5° by 5° areas. FIGURA A-3b. Distribución media anual de las capturas cerqueras de patudo, por tipo de lance, 2004. El tamaño de cada círculo es proporcional a la cantidad de patudo capturado en la zona de 5° x 5° correspondiente.

IATTC-73-04 Tunas and billfishes in the EPO 14
FIGURE A-4. Distribution of the catches of bigeye and yellowfin tunas in the Pacific Ocean, in metric tons, by the Japanese longline fleet, 1999-2003. The sizes of the circles are proportional to the amounts of bigeye caught in those 5° by 5° areas. FIGURA A-4. Distribución de las capturas de atunes patudo y aleta amarilla en el Océano Pacifico, en toneladas métricas, por la flota palangrera japonesa , 1999−2003. El tamaño de cada círculo es proporcional a la cantidad de patudo capturado en la zona de 5° x 5° correspondiente.

FIGURE A-5. The fisheries defined by the IATTC staff for stock assessment of yellowfin, skipjack, and bigeye in the EPO. The thin lines indicate the boundaries of the 13 length-frequency sampling areas, and the bold lines the boundaries of the fisheries. FIGURA A-5. Las pesquerías definidas por el personal de la CIAT para la evaluación de las poblaciones de atún aleta amarilla, barrilete, y patudo en el OPO. Las líneas delgadas indican los límites de las 13 zonas de muestreo de frecuencia de tallas, y las líneas gruesas los límites de las pesquerías.
IATTC-73-04 Tunas and billfishes in the EPO 15

FIGURE A-6a. Estimated size compositions of the yellowfin caught in each fishery of the EPO during 2004. The average weights of the fish in the samples are given at the tops of the panels. FIGURA A-6a. Composición por tallas estimada del aleta amarilla capturado en cada pesquería del OPO en 2004. En cada recuadro se detalla el peso promedio de los peces en las muestras.
IATTC-73-04 Tunas and billfishes in the EPO 16

FIGURE A-6b. Estimated size compositions of the yellowfin caught in the EPO during 1999-2004. The average weights of the fish in the samples are given at the tops of the panels. FIGURA A-6b. Composición por tallas estimada del aleta amarilla capturado en el OPO durante 1999-2004. En cada recuadro se detalla el peso promedio de los peces en las muestras.
IATTC-73-04 Tunas and billfishes in the EPO 17

FIGURE A-7a. Estimated size compositions of the skipjack caught in each fishery of the EPO during 2004. The average weights of the fish in the samples are given at the tops of the panels. FIGURA A-7a. Composición por tallas estimada del barrilete capturado en cada pesquería del OPO en 2004. En cada recuadro se detalla el peso promedio de los peces en las muestras.
IATTC-73-04 Tunas and billfishes in the EPO 18

FIGURE A-7b. Estimated size compositions of the skipjack caught in the EPO during 1999-2004. The average weights of the fish in the samples are given at the tops of the panels. FIGURA A-7b. Composición por tallas estimada del barrilete capturado en el OPO durante 1999-2004. En cada recuadro se detalla el peso promedio de los peces en las muestras.
IATTC-73-04 Tunas and billfishes in the EPO 19

FIGURE A-8a. Estimated size compositions of the bigeye caught in each fishery of the EPO during 2004. The average weights of the fish in the samples are given at the tops of the panels. FIGURA A-8a. Composición por tallas estimada del patudo capturado en cada pesquería del OPO en 2004. En cada recuadro se detalla el peso promedio de los peces en las muestras.
IATTC-73-04 Tunas and billfishes in the EPO 20

FIGURE A-8b. Estimated size compositions of the bigeye caught in the EPO during 1999-2004. The average weights of the fish in the samples are given at the tops of the panels. FIGURA A-8b. Composición por tallas estimada para el patudo capturado en el OPO durante 1999-2004. En cada recuadro se detalla el peso promedio de los peces en las muestras.
IATTC-73-04 Tunas and billfishes in the EPO 21

FIGURE A-9. Estimated catches of Pacific bluefin by purse-seine and recreational gear in the EPO during 1999-2004. The values at the tops of the panels are the average weights. FIGURA A-9. Captura estimada de aleta azul del Pacífico por buques cerqueros y deportivos en el OPO durante 1999-2004. El valor en cada recuadro representa el peso promedio.
IATTC-73-04 Tunas and billfishes in the EPO 22

FIGURE A-11. Estimated size compositions of the catch of bigeye tuna by the Japanese longline fishery in the EPO, 1999-2003. FIGURA A-11. Composición por tallas estimada de la captura de atún patudo por la pesquería palangrera japonesa en el OPO, 1999-2003.
FIGURE A-10. Estimated size compositions of the catch of yellowfin tuna by the Japanese longline fishery in the EPO, 1999-2003. FIGURA A-10. Composición por tallas estimada de la captura de atún aleta amarilla por la pesquería palangrera japonesa en el OPO, 1999-2003.
IATTC-73-04 Tunas and billfishes in the EPO 23

TABLE A-1. Annual catches of yellowfin, skipjack, and bigeye, by all types of gear combined, in the Pacific Ocean, 1975-2004. The EPO totals include discards from the purse-seine fishery. TABLA A-1. Capturas anuales de aleta amarilla, barrilete, y patudo, por todas las artes combinadas, en el Océano Pacífico, 1975-2004. Los totales del OPO incluyen descartes de la pesquería de cerco.
YFT SKJ BET Total EPO WCPO Total EPO WCPO Total EPO WCPO Total EPO WCPO Total
1975 199,866 132,232 332,098 134,733 288,980 423,713 48,344 60,386 108,730 382,943 481,598 864,5411976 234,371 145,415 379,786 136,926 357,899 494,825 71,585 73,386 144,971 442,883 576,700 1,019,5831977 199,382 176,798 376,180 94,111 404,101 498,212 85,251 73,48 58,734 378,744 654,382 1,033,1263 11978 173,996 174,505 348,501 179,675 450,473 630,148 89,198 58,12 7,318 442,869 683,098 1,125,9670 141979 187,1 194,150 381,287 141,504 411,304 552,808 67,533 65,862 133,395 396,174 671,316 1,067,49037 1980 158,848 210,075 368,923 138,109 458,419 596,528 86,403 62,592 148,995 383,360 731,086 1,114,4461981 178,517 225,309 403,826 126,003 438,178 564,181 68,340 53,069 121,409 372,860 716,556 1,089,4161982 127,536 219,440 346,976 104,669 491,105 595,774 60,346 58,734 119,080 292,551 769,279 1,061,8301983 100,011 253,870 353,881 62,149 1 745,970 64,754 59,5 4,339 226,914 997,276 1,683,82 85 12 224,1901984 149,478 248,656 398,134 63,612 8 819,150 55,273 63,6 8,917 268,364 1,067,838 1,755,53 44 11 336,2021985 226,0 256,131 482,165 52,002 599,785 651,787 72,404 68,519 140,923 350,440 924,435 1,274,87534 1986 286,150 244,546 530,696 67,748 756,846 824,594 105,119 63,339 168,458 459,017 1,064,731 1,523,7481987 286,359 301,922 588,281 66,465 685,890 752,355 101,313 80,738 182,051 454,137 1,068,550 1,522,6871988 296,634 259,468 556,102 92,126 841,675 933,801 74,304 68,035 142,339 463,064 1,169,178 1,632,2421989 299,737 313,402 613,139 98,931 818,241 917,172 72,994 75,268 148,262 471,662 1,206,911 1,678,5731990 302,283 350,930 653,213 77,120 4 968,364 104,806 91,719 196,525 09 1,333,893 1891,24 484,2 ,818,1021991 266,089 391,316 657,405 65,895 1,186,987 109,116 77,577 186,693 99 1,589,985 21,121,092 441,0 ,031,0841992 253,7 03,466 657,177 87,354 1,011,401 1,098,755 92,000 92,708 184,708 433,065 1,507,575 1,940,64011 41993 256,674 389,554 646,228 100,521 907,534 1,008,055 82,834 80,687 163,521 440,030 1,377,775 1,817,8051994 248,314 402,831 651,145 84,526 1,004,300 1,088,826 109,346 90,485 199,831 442,187 1,497,616 1,939,8031995 244,601 374,430 619,031 150,667 1,050,337 1,201,004 108,208 81,847 190,055 503,476 1,506,614 2,010,0901996 266,463 316,667 583,130 132,931 1,026,792 1,159,723 114,704 80,565 195,269 514,099 1,424,024 1,938,1231997 278,264 449,039 727,303 188,497 972,985 1,161,482 122,346 102,057 224,403 589,107 1,524,081 2,113,1881998 280,140 465,642 745,782 165,467 1,301,054 1,466,521 93,946 104,746 198,692 539,553 1,871,442 2,410,9951999 304,600 430,775 735,375 291,954 1,154,102 1,446,056 93,279 113,852 207,131 689,833 1,698,729 2,388,5622000 288,965 431,346 720,311 231,806 1,476,809 147,463 106,955 254,418 34 1,783,304 21,245,003 668,2 ,451,5382001 423,3 28,238 851,598 157,665 1,134,772 1,292,437 131,114 102,939 234,053 712,139 1,665,949 2,378,08860 42002 440,1 403,390 843,546 165,802 1,277,431 1,443,233 131,027 114,685 245,712 736,986 1,795,506 2,532,49256 2003 409,760 456,947 866,707 296,287 1,252,738 1,549,025 114,656 95,991 210,647 820,703 1,805,676 2,626,3792004 276,597 * 276,597 213,855 * 213,855 108,290 * 108,290 598,743 * 598,743
IATTC-73-04 Tunas and billfishes in the EPO 24

TABLE A-2a. Estimated retained catches, by gear type, and estimated discards (purse-seine only), of scombrids, in metric tons, in the EPO, 1975-2004. The purse-seine and pole-and-line data for yellowfin, skipjack, and bigeye tunas have been adjusted to the species composition estimate and are preliminary. Data for 2003-2004 are preliminary. TABLA A-2a. Estimaciones de las capturas retenidas, por arte de pesca, y de los descartes (red de cerco únicamente), de escómbridos, en toneladas métri el OPO, 1975-2004. Los datos de los atunes aleta amarilla, barrilete, y patudo de las pesquerías cerquera y cañera fueron ajustados a la estimación de composición por especie, y son preliminares. Los datos de 2003-2004 son preliminares.
Yellowfin—Aleta amarilla (YFT)
Skipjack—Barrilete (SKJ)
Bigeye—Patudo (BET)
cas, en
PS PS PS Ret. Dis. LP LL OTR Total Ret. Dis. LP LL OTR Total Ret. Dis. LP LL OTR Total
1975 183,029 5,630 10,640 568 199,866 120,358 13,848 94 433 134,733 6,574 36 41,733 0 48,3441976 215,106 3,280 15,632 353 234,371 11,256 130 583 136,926 17,214 75 54,290 585124,958 7 71,1977 184,922 1,841 12,355 263 199,382 7,521 112 1,872 94,111 11,162 2 74,086 85,25184,606 01978 3,887 10,188 1,120 173,996 172,293 6,048 61 1,273 179,675 18,539 0 70,659 0 89,198158,800 1979 170,648 4,790 11,473 225 187,137 133,695 6,345 33 1,430 141,504 12,097 0 55,435 1 67,5331980 143,042 1,480 13,477 849 158,848 130,912 5,226 26 1,945 138,109 21,939 0 64,335 130 86,4031981 168,235 1,477 7,999 805 178,517 119,165 5,906 20 911 126,003 14,922 0 53,416 2 68,3401982 114,754 1,538 10,961 283 127,536 100,498 3,760 28 383 104,669 6,939 42 53,365 0 60,3461983 83,928 4,007 10,894 1,182 100,011 56,851 4,387 28 883 62,149 4,575 39 60,043 97 64,7541984 135,785 2,991 10,345 357 149,478 59,859 2,884 32 838 63,612 8,860 2 46,394 17 55,2731985 211,460 1,069 13,198 308 226,034 50,829 946 44 182 52,002 6,056 2 66,325 21 72,4041986 260,512 2,537 22,807 293 286,150 1,921 57 135 67,748 2,685 0 102,425 11965,635 9 105,1987 5,107 18,911 335 286,359 64,019 2,233 38 176 66,465 1,177 0 100,121 16 101,313262,007 1988 3,723 14,659 958 296,634 87,113 4,325 26 663 92,126 1,535 5 72,758 6 74,304277,293 1989 277,995 4,145 17,032 564 299,737 94,935 2,941 28 1,027 98,931 2,031 0 70,963 0 72,9941990 263,251 2,675 34,634 1,724 302,283 74,370 824 41 1,885 77,120 5,920 0 98,871 15 104,8061991 231,257 2,856 30,729 1,247 266,089 62,229 1,717 33 1,916 65,895 4,870 31 104,194 21 109,1161992 228,121 3,789 18,526 3,276 253,711 84,283 1,956 24 1,091 87,354 7,179 0 84,800 21 92,0001993 219,494 4,722 4,950 23,808 3,700 256,674 83,829 10,588 3,772 62 2,271 100,521 9,657 645 0 72,473 59 82,8341994 208,409 4,757 3,625 29,545 1,978 248,314 70,127 10,360 3,240 69 730 84,526 34,900 2,280 0 71,359 808 109,3461995 215,434 5,275 1,268 20,054 2,570 244,601 1 16,378 5,253 75 1,917 150,667 45,319 0 58,256 1, 20827,045 3,251 381 108,1996 238,606 6,314 3,761 16,426 1,356 266,463 24,837 2,555 51 1,512 132,931 61,312 0 46,957103,976 5,689 746 114,7041997 244,878 5,516 4,418 21,448 2,004 278,264 153,456 31,558 3,260 102 121 188,497 64,270 5,482 0 52,571 23 122,3461998 253,959 4,718 5,084 14,196 2,183 280,140 140,631 22,856 1,684 88 208 165,467 44,128 2,853 0 46,347 617 93,9461999 281,920 6,638 1,783 10,642 3,617 304,600 261,564 26,851 2,044 109 1,385 291,954 51,158 5,176 0 36,405 541 93,2792000 254,988 6,796 2,386 22,766 2,029 288,965 205,240 26,256 236 68 5 231,806 94,083 5,600 0 47,511 269 147,4632001 382,402 7,486 3,785 28,482 1,205 423,360 143,948 11,964 570 1,182 1 157,665 61,259 1,111 0 68,697 47 131,1142002 412,285 3,707 954 22,437 773 440,156 153,633 11,461 496 212 0 165,802 57,412 807 0 72,778 30 131,0272003 380,523 4,497 478 22,192 2,071 409,760 275,089 20,106 416 441 235 296,287 54,103 1,640 0 58,892 21 114,6562004 268,356 2,853 1,905 2,041 1,442 276,597 16,420 481 26 17 213,855 66,944 0 39,729196,911 1,612 6 108,290
IATTC-73-04 Tunas and billfishes in the EPO 25

TABLE A-2a. (continued) TABLA A-2a. (continuación)
azul del Pacífico (PBF)
Albacore—Albacore (ALB)
Black skipjack—Barrilete negro (BSJ)
Pacific bluefin—Aleta
PS PS PS Ret. Dis. LP LL OTR Total Ret. Dis. LP LL OTR Total Ret. Dis. LP LL OTR Total
1975 9,498 83 49 1 9,631 0 3,332 1,369 19,706 24,407 437 74 5111976 10,620 22 59 3 10,704 271 3,456 2,506 16,975 23,208 1,497 29 1,5261977 5,446 10 57 34 5,547 15 1,960 10,578 11,471 24,024 1,445 12 1 1,4581978 5,387 4 37 10 5,439 157 1,577 11,939 17,436 31,109 2,167 3 2,1701979 6,102 5 40 20 6,167 179 5,583 5,043 10,953 30 366148 1,336 1,1980 2,909 0 13 30 2,952 194 407 5,319 5,649 11,569 3,653 28 3,680 1981 1,086 0 14 9 1,109 99 608 7,275 12,301 20,282 1,907 3 1,911 1982 3,145 0 15 11 3,171 355 198 8,407 3,562 12,522 1,338 0 1,3381983 836 0 10 35 881 7 449 7,433 7,840 15,730 1,222 0 13 1,2361984 839 0 10 68 917 3,910 1,441 6,712 9,794 21,857 663 0 3 6661985 3,996 0 3 113 4,111 42 877 7,268 6,654 14,840 289 0 7 2961986 5,040 0 5 66 5,111 47 86 6,450 4,701 11,284 577 0 18 5951987 980 0 15 55 1,050 1 320 9,994 2,661 12,976 562 0 2 5641988 1,380 0 19 51 1,450 271 9,934 5,549 15,771 956 0 3 26717 11 1,1989 1,102 5 6 124 1,238 21 6,784 2,695 9,501 0 8031 803 1990 61 14 93 1,599 39 170 6,536 4,105 10,850 787 0 4 7911,430 1991 419 0 5 94 519 0 834 7,894 2,754 11,482 421 0 25 446 1992 1,928 0 20 118 2,066 0 255 17,081 5,740 23,076 104 0 3 1071993 580 0 0 19 331 930 0 0 1 11,194 4,410 15,605 104 4,116 0 31 4,2501994 969 0 0 12 121 1,102 0 0 85 10,390 10,075 20,550 188 853 0 40 1,0801995 630 0 0 25 264 919 0 0 465 6,184 7,386 14,035 202 1,448 0 1,6501996 8,223 0 0 19 79 8,322 11 0 72 7,631 8,398 16,112 704 2,304 0 12 3,0201997 2,608 3 2 14 260 2,887 1 0 59 9,678 7,532 17,270 101 2,512 0 11 2,6241998 1,772 0 0 94 507 2,373 0 81 12,635 12,966 25,724 490 39 40542 1,876 2,1999 2,553 54 5 151 553 3,316 0 227 11,632 14,494 26,400 171 0 3,59547 3,424 2000 61 51 374 4,204 71 0 86 9,663 13,387 23,207 294 1,877 0 2,1703,718 0 2001 891 3 0 148 390 1,432 3 0 18 19,410 13,679 33,111 2,258 1,162 0 3,4202002 1,708 6 1 8 358 2,081 31 0 0 14,837 14,406 29,274 1,459 1,764 8 3,2312003 3,233 0 0 49 741 4,023 34 0 0 21,186 22,900 44,121 433 1,332 6 1,7712004 8,548 19 0 11 53 8,631 106 0 0 11,509 7,676 19,291 848 351 0 1,200
IATTC-73-04 Tunas and billfishes in the EPO 26

TABLE A-2a. (continued) TABLA A-2a. nuación)
Bonito (BZX)
Unidentified tunas—Atunes no identificados (TUN)
Scombrids—Escómbridos TOTAL
(conti
PS PS PS Ret. Dis. LP LL OTR Total Ret. Dis. LP LL OTR Total Ret. Dis. LP LL OTR Total
1975 16,828 11 145 16,984 0 0 7,670 7,670 336,725 23,015 53,886 28,523 442,1471976 4,325 44 286 4,655 97 0 4,981 5,078 374,088 18,161 72,616 23,189 488,0541977 10,983 292 2,875 14,150 0 5,782 5,804 298,601 638 97,188 22 72622 11, ,299 429,1978 4,801 35 2,419 7,255 0 6,677 6,867 362,333 11,555 92,885190 28,935 495,7081979 3 2,658 4,462 559 0 3,016 3,575 326,386 11,354 72,565 12,393 422,6971,801 1980 6,089 36 2,727 8,852 441 0 836 1,277 309,179 7,176 83,170 12,166 411,6911981 5,690 27 4,609 10,326 214 3 1,109 1,326 311,319 8,025 68,723 19,746 407,8141982 2,122 0 6,776 8,898 51 0 382 433 229,203 5,537 72,775 11,397 318,9121983 3,827 2 7,291 11,120 81 0 4,711 4,792 151,326 8,884 78,410 22,053 260,6721984 3,514 0 7,291 10,805 6 0 2,524 2,530 213,437 7,318 63,493 20,892 305,1391985 3,599 5 7,869 11,473 18 0 678 696 276,291 2,898 86,837 15,831 381,8571986 232 258 1,889 2,379 177 4 986 1,166 334,905 4,805 131,744 8,098 479,5521987 3,205 121 1,772 5,098 0 2,043 2,524 332,432 781 129,078 7 350481 7, ,059 476,1988 739 947 10,497 258 0 2,939 3,197 377,363 9,062 97,397 11,424 495,2468,811 1989 818 465 12,561 469 0 627 1,095 388,613 7,930 94,814 5,502 496,85911,278 1990 13,641 215 371 14,227 393 0 692 1,085 359,830 3,946 140,096 8,889 512,7611991 1,207 82 242 1,531 4 0 1 192 197 300,407 5,520 142,856 6,491 455,2741992 977 0 318 1,295 133 0 2 1,071 1,207 322,725 6,000 120,453 11,638 460,8161993 599 12 1 436 1,048 13 2,288 0 2 4,082 6,385 314,275 22,370 8,724 107,559 15,320 468,2481994 8,331 147 362 185 9,025 10 1,337 0 1 464 1,812 322,934 19,734 7,312 111,375 14,401 475,7561995 7,929 55 81 54 8,119 12 1,394 0 1 1,004 2,411 396,571 27,800 7,067 84,596 14,576 530,6101996 647 1 7 16 671 ,756 0 2 1,038 2,832 413,515 4 395 71,087 13 05537 1 0,900 6, ,158 545,1997 1,097 4 8 34 1,143 4,580 0 1 1,437 6,092 466,484 7,748 83,81374 49,655 11,422 619,1221998 7 588 1,929 15 2,294 0 2 18,158 20,469 442,367 34,601 6,896 73,363 35,227 592,4541,330 4 1999 1,719 0 0 24 369 2,112 29 3,470 0 2,107 4,279 9,885 599,161 45,613 4,059 61,071 25,237 735,1422000 636 0 0 75 56 767 190 2,175 0 1,986 1,468 5,819 559,220 42,703 2,769 82,121 17,588 704,4012001 17 0 0 34 19 70 206 2,495 0 2,322 1 5,024 590,985 24,220 4,373 120,276 15,341 755,1952002 0 0 0 42 1 43 576 2,785 0 2,791 0 6,152 627,105 20,530 1,459 113,105 15,568 777,7682003 0 0 0 * 25 25 81 2,086 0 24 0 2,191 713,496 29,661 900 102,784 25,993 872,8352004 15 47 0 * * 62 267 2,783 0 3,054 * 6,105 541,996 24,085 2,387 56,370 9,194 634,031
IATTC-73-04 Tunas and billfishes in the EPO 27

TABLE A-2b. Estimated retained catches, by gear type, and estimated purse-seine discards, of billfishes, in metric tons, in the EPO, 1975-2004. Data for 2003-2004 are preliminary. PS dis = purse-seine discards. TABLA A-2b. Estimaciones de las capturas retenidas, por arte de pesca, y de los descartes (red de cerco únicamente), de peces picudos, en toneladas métricas, en el OPO, 2000. Los datos de 2003-2004 son preliminares. PS dis = descartes de la pesca de cerco.
Swordfish—Pez espada (SWO)
Blue marlin—Marlín azul (BUM)
Black marlin—Marlín negro (BLM)
Striped marlin—Marlín rayado (MLS)
PS dis. LL OTR Total PS dis. LL OTR Total PS dis. LL OTR Total PS dis. LL OTR Total 1975 864 3,185 2,200 2,200 388 388 5390 5,3902,3211976 9 363 3,852 3,240 3,240 253 253 6432 6,432 3,481977 4,298 788 5,086 3,016 3,016 621 621 3145 3,1451978 4,103 2,205 6,308 3,570 3,570 417 417 2495 2,4951979 2,658 614 3,272 4,528 4,528 332 332 4137 4,1371980 3,746 1,107 4,853 4,016 4,016 335 335 4827 4,8271981 3,070 1,134 4,204 4,476 4,476 247 247 4876 4,8761982 2,604 1,551 4,155 4,745 4,745 213 213 4711 4,7111983 3,221 2,338 5,559 4, 4,451 240 24 4280 280451 0 4,1984 2,705 3,336 6,041 5, 5,197 248 24 2662 662197 8 2,1985 7 3,768 5,635 3,588 3,588 180 180 1510 1,510 1,861986 2,887 3,294 6,181 5,255 5,255 297 297 2617 2,6171987 4,140 3,740 7,880 7,227 7,227 358 358 5520 5,5201988 4,322 5,642 9,964 5,649 5,649 288 288 3682 3,6821989 4,514 6,072 10,586 5,392 5,392 193 193 3416 3,4161990 5,807 5,066 10,873 5,540 5,540 223 223 3260 3,2601991 17 10,564 4,385 14,966 69 6,462 257 6,788 58 246 304 76 2805 188 3,0691992 4 9,793 4,294 14,091 52 6, 201 6,679 95 228 32 9 2907 123426 3 6 147 3,1993 6 6,167 4,434 10,607 56 6, 292 6,627 64 217 28 5 3332 610279 1 3 243 3,1994 3 3,849 8,815 75 8,609 418 9,102 118 256 374 34 3126 270 3,4304,9631995 6 4,466 3,003 7,475 83 6,944 344 7,371 82 158 240 21 2943 306 3,2701996 2 6,756 2,801 9,559 84 3,396 200 3,680 90 99 189 22 2981 237 3,2401997 6 9,508 2,854 12,368 134 5,468 340 5,942 124 153 277 26 4201 272 4,4991998 2 9,326 3,713 13,041 138 4,477 580 5,195 113 168 281 18 3277 281 3,5761999 3 7,374 2,161 9,538 190 3,010 680 3,880 138 94 232 31 2287 334 2,6522000 3 9,474 2,790 12,267 135 3,028 606 3,769 103 105 208 17 1747 190 1,9542001 4 15,756 2,615 18,375 149 3, 643 4,346 114 123 23 18 1693 2 985554 7 74 1,2002 1 16,293 2,600 18,894 185 2 350 3,326 115 77 19 0 1953 146,791 2 6 133 2,2003 6 394 15,298 150 2,835 876 3,861 123 69 192 29 1759 133 1,92114,8982004 3 1,916 45 1,964 328 416 73 817 123 4 127 20 214 33 267
IATTC-73-04 Tunas and billfishes in the EPO 28
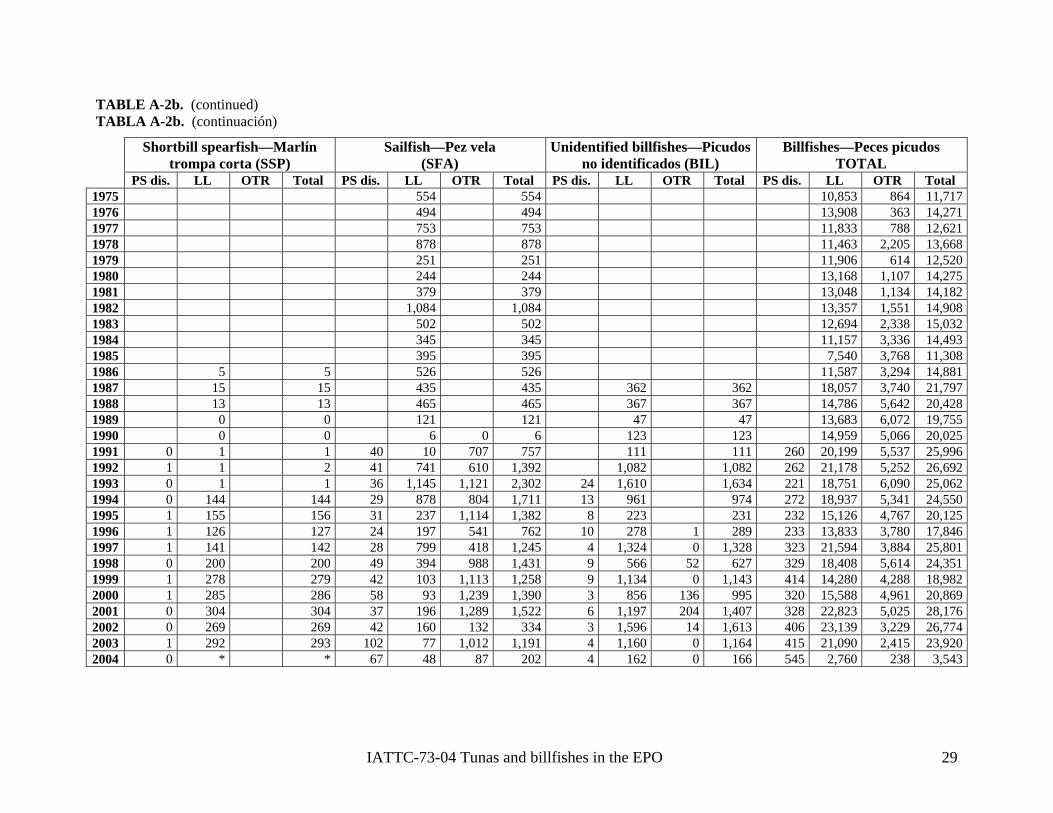
TABLE A-2b. (continued) TABLA A-2b. (continuación)
Shortbill spearfish—Marlín trompa corta (SSP)
Sailfish—Pez vela (SFA)
Unidentified billfishes—Picudos no identificados (BIL)
Billfishes—Peces picudos TOTAL
PS dis. LL OTR Total PS dis. LL OTR Total PS dis. LL OTR Total PS dis. LL OTR Total 1975 554 554 10,853 864 11,7171976 494 494 13,908 363 14,2711977 753 753 11,833 788 12,6211978 878 878 11,463 2,205 13,6681979 251 251 11,906 614 12,5201980 244 244 13,168 1,107 14,2751981 379 379 13,048 1,134 14,1821982 1, 1,084 13,357 1,5 908084 51 14,1983 502 12,694 2, 5,032502 338 11984 345 345 11,157 3,336 14,4931985 395 395 7,540 3,768 11,3081986 5 5 526 526 11,587 3,294 14,8811987 15 15 435 435 362 362 18,057 3,740 21,7971988 13 13 465 465 367 367 14,786 5,642 20,4281989 0 0 121 121 47 47 13,683 6,072 19,7551990 0 0 6 0 6 123 123 14,959 5,066 20,0251991 0 1 1 40 10 707 757 111 111 260 20,199 5,537 25,9961992 1 1 2 41 610 1,392 1,082 1,08 2 21,178 5, 692741 2 26 252 26,1993 1 36 1,145 1,121 2,302 24 1,610 1,634 221 18,751 6,090 25,0620 1 1994 4 144 29 878 804 1,711 13 961 974 272 18,937 5,341 24,5500 141995 1 155 156 31 237 1,114 1,382 8 223 231 232 15,126 4,767 20,1251996 1 126 127 24 197 541 762 10 278 1 289 233 13,833 3,780 17,8461997 1 141 142 28 799 418 1,245 4 1,324 0 1,328 323 21,594 3,884 25,8011998 0 200 200 49 394 988 1,431 9 566 52 627 329 18,408 5,614 24,3511999 1 278 279 42 103 1,113 1,258 9 1,134 0 1,143 414 14,280 4,288 18,9822000 1 285 286 58 93 1,239 1,390 3 856 136 995 320 15,588 4,961 20,8692001 0 304 304 37 ,289 1,522 6 1,197 204 1,40 8 22,823 5, 176196 1 7 32 025 28,2002 0 269 42 160 132 334 3 1,596 14 1,613 406 23,139 3,229 26,7742692003 2 293 102 77 1,012 1,191 4 1,160 0 1,164 415 21,090 2,415 23,9201 292004 0 * * 67 48 87 202 4 162 0 166 545 2,760 238 3,543
IATTC-73-04 Tunas and billfishes in the EPO 29

IATTC-73-04 Tunas and billfishes in the EPO 30
E A-2c. Estimated retained catches, by gear type, and estimated purse-seine discards, of other species, in metric tons, in the EPO, 1975-2004.-2004 are preliminary.
A A-2c. Estimaciones de las capturas retenidas, por arte de pesca, y de los descartes (red de cerco únicamente), de otras especies, en toneladas Los datos de 2003-2004 son preliminares.
—Carán
gidos no identificados (CGX)
Dorado (Coryphaena spp.) (DOX)
Unidentified elasmobranchs—Elasmobranquios no identificados
(SKX)
Unidentified marine fishes—Peces marinos no identificados (MZZ)
PS PS PS PS Ret. Dis. LP LL OTR Total Ret. Dis. LP LL OTR Total Ret. Dis. LP LL OTR Total Ret. Dis. LP LL OTR Total
1975 99 0 99 54 15 382 451 23 4 137 164 78 3 81 1976 483 0 483 124 9 963 1,096 307 10 141 458 291 3 294 1977 1,099 0 1,099 167 0 827 994 233 0 35 9 0 429 268 421978 238 239 87 0 738 825 145 0 390 535 148 0 148 1 1979 81 81 124 0 927 1,051 7 0 17 1,290 1,314 478 0 478 0 1980 224 2 226 124 0 1,001 1,125 16 0 7 859 882 301 0 301 1981 111 17 128 410 0 628 1,038 49 0 120 1,211 1,380 201 3 204 1982 122 0 122 274 0 980 1,254 22 30 215 863 1,130 284 0 284 1983 1,240 0 1,240 88 0 3,374 3,462 34 0 85 694 813 267 1 268 1984 413 0 413 103 0 202 305 47 0 6 1,039 1,092 415 0 3 418 1985 317 4 321 93 0 108 201 27 0 13 481 521 78 0 78 1986 188 19 207 632 0 1,828 2,460 29 0 1 1,979 2, 1 0 91 009 91987 566 571 271 0 4,272 4,543 96 0 87 1,019 1,202 210 0 489 699 5 1988 825 826 69 0 1,560 1,629 1 0 23 1,041 1,065 141 0 359 500 1 1989 60 2 62 210 0 1,680 1,890 29 0 66 1,025 1,120 237 0 134 371 1990 234 0 1 235 63 0 1,491 1,554 0 0 1 1,096 1,097 240 0 260 14 514 1991 116 0 0 116 57 0 7 613 677 1 6 74 1,346 1,427 463 1 430 894 1992 116 0 0 116 69 0 37 708 814 0 0 311 1,190 1,501 445 0 177 622 1993 17 73 0 3 93 36 909 0 17 724 1,686 24 438 0 219 918 1,599 223 481 2 130 836 1994 7 48 0 16 71 279 1,634 0 46 3,459 5,418 113 258 0 892 1,315 2,578 10 384 0 131 525 1995 11 58 0 9 78 110 1,592 0 2,127 3,868 20 182 0 554 1,077 1, 0 606 0 809 39 833 2031996 55 230 0 57 342 119 1,902 0 183 2,247 3 256 0 520 2,151 2, 5 397 0 848 43 930 4451997 2 179 39 220 36 1,899 0 564 9,411 11,910 22 250 0 531 2,360 3,163 14 531 0 808 1,353 0 1998 57 214 0 4 275 15 1,293 0 39 11,656 13,003 6 489 0 686 4,483 5,664 65 1,150 0 1,313 2,528 1999 35 260 1 296 75 1,758 0 2,333 5,111 9,277 0 372 0 4,289 2,145 6,806 86 1,033 0 953 2,072 2000 57 160 0 217 109 2,152 0 3,550 1,041 6,852 3 327 0 5,809 405 6,544 1 379 0 1,348 1,728 2001 0 199 0 199 148 2,664 0 4,722 11,357 18,891 0 246 0 8,847 117 9,210 0 328 0 1,518 1,846 2002 0 161 0 161 45 2,298 0 3,915 4,208 10,466 0 285 0 4,901 102 5,288 0 283 0 1,745 2,028 2003 0 134 0 134 23 1,420 0 4,133 6,102 0 409 0 1,045 14 1 0 301 0 4, 4,312 526 ,468 0112004 0 213 0 213 80 2,274 0 39 13 2,406 0 248 0 3,326 0 3,574 0 425 0 * 425
TABLData for 2003TABLmétricas, en el OPO, 2000.
Unidentified Carangidae
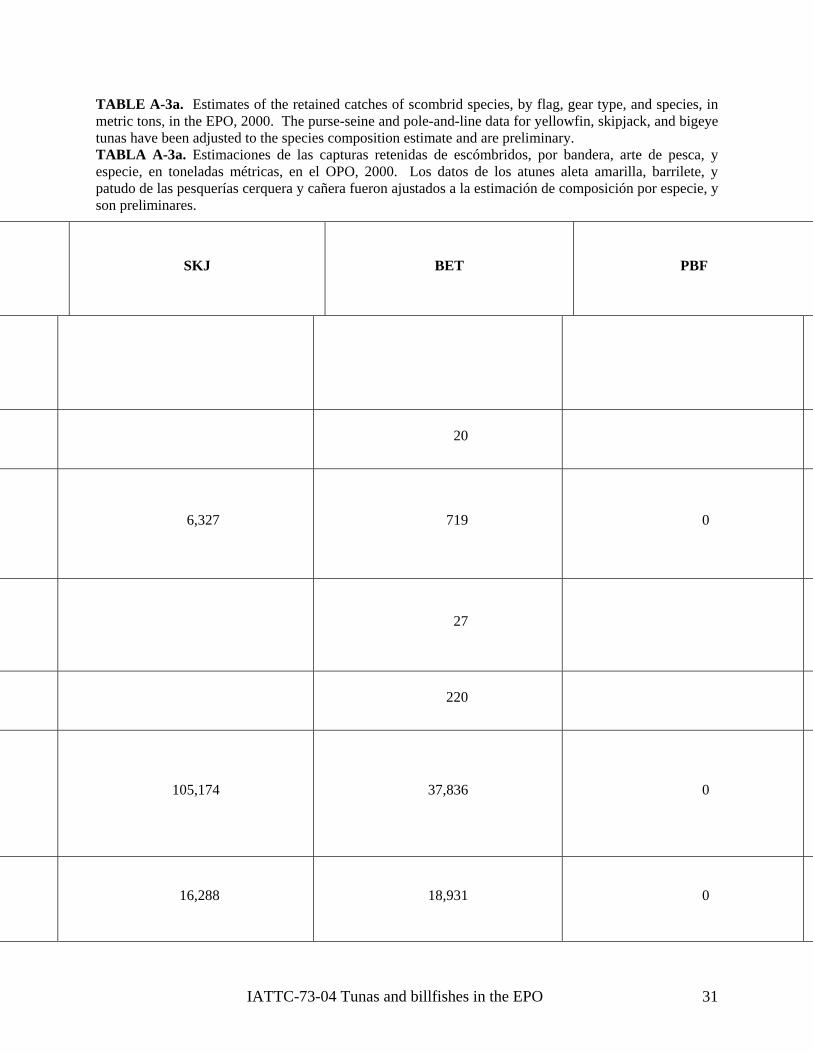
TABLE A-3a. Estimates of the retained catches of scombrid species, by flag, gear type, and species, in metric tons, in the EPO, 2000. The purse-seine and pole-and-line data for yellowfin, skipjack, and bigeye tunas have been adjusted to the species com mate and are preliminary. TABLA A-3a. Estimac s capturas retenidas de escómbridos, por bandera, arte de pesca, y especie, en toneladas métricas, en el OPO, 2000. Los datos de los atunes aleta amarilla, barrilete, y patudo de las pesquerías cerquera y cañera fueron ajustados a la estimación de composición por especie, y son preliminares.
SKJ BET PBF
position estiiones de la
20
6,327 719 0
27
220
105,174 37,836 0
16,288 18,931 0
IATTC-73-04 Tunas and billfishes in the EPO 31

23 28,746 2
6 13,280 2
47 42
183 0 61
16,928 1 3,025
14
12,647 6,294 0
IATTC-73-04 Tunas and billfishes in the EPO 32

39 653
0 1,916 1
2 30
0 90 4
10,117 3,827 693
5 344
5,144 252 0
2,754
11,618 7,723 0
IATTC-73-04 Tunas and billfishes in the EPO 33

11
53
20,997 18,501 0
1. This category is used to avoid revealing the operations of individual vessels or companies—Se usa esta categoría para no revelar información sobre las actividades de buques o empresas individuales.
2 Includes Nicaragua and El Salvador—Incluye Nicaragua y El Salvador. 3. Includes Ecuador and United States—Incluye Ecuador y Estados Unidos. 4. Includes Belize, Bolivia, Guatemala, Honduras, Nicaragua and unknown—Incluye Belice, Bolivia, Guatemala, Honduras,
Nicaragua y desconocido.
IATTC-73-04 Tunas and billfishes in the EPO 34

Tmetric tons, in the EPO, 2001. The ptunas have been adjusted to the species cTABL
IATTC-73-04 Tunas and billfishes in the EPO 35
ABLE A-3b. Estimates of the retained catches of scombrid species, by flag, gear type, and species, inurse-seine and pole-and-line data for yellowfin, skipjack, and bigeye
omposition estimate and are preliminary. A A-3b. Estimaciones de las capturas retenidas de escómbridos, por bandera, arte de pesca, y
especie, en toneladas métricas, en el OPO, 2001. Los datos de los atunes aleta amarilla, barrilete, y patudo de las pesquerías cerquera y cañera fueron ajustados a la estimación de composición por especie, y son preliminares.
2001 YFT SKJ BET PBF ALB BKJ BZX TUN Total BLZ LL 1,833 1,080 1,987 131 4,854 9,885 CAN LT 4,600 4,600 CHL FX 66 5 5 19 95 CHN LL 942 2,639 1,581 5,162 COL PS 24,662 2,250 287 0 0 79 0 27,278 0 CRI FX 1,133 28 0 1,161 ECU FX 14 1 15 PS 55,268 67,617 25,485 0 0 2,101 0 203 150,674 ESP PS 10,878 21,531 7,881 0 0 0 0 0 40,290 GTM LL 8 34 2,321 2,363 JPN LL 14,804 28 38,048 2 1,889 54,771 KOR LL 5,230 29 12,576 10 355 18,200 MEX LL 40 1 41 LP 3,785 570 0 0 18 0 0 0 4,373 PS 126,096 9,778 14 863 0 0 17 0 136,768 PAN LL 732 26 80 28 866 PS 11,772 6,175 2,525 0 0 0 0 0 20,472 PYF LL 846 14 684 3,542 5,086 TWN LL 3,928 3 9,285 0 6,811 20,027 USA GO 5 1 34 0 0 40 LL 29 1 118 5 56 1 210 LT 7,439 7,439 PS 5,230 3,69 3,399 3 0 12,419 9 28 60 0 RO 356 1,635 1,991 VEN PS 106,777 3,274 3 0 0 0 0 0 110,054 VUT LL 13 3,277 294 3,584 PS 10,246 7,267 5,692 0 0 0 0 0 23,205 OTR1 LL2 77 3 80 PS3 31,472 22,355 15,974 0 0 18 0 3 69,823
P
1.P This category is used to avoid revealing the operations of individual vessels or companies—Se usa esta categoría para no revelar información sobre las actividades de buques o empresas individuales.
P
2P Includes Nicaragua and El Salvador—Incluye Nicaragua y El Salvador.
P
3.P Includes Belize, Bolivia, China, El Salvador, Guatemala, Honduras, Nicaragua and unknown—Incluye Belice, Bolivia, China, El Salvador, Guatemala, Honduras, Nicaragua, y desconocido.

Tmetric tons, in the EPO, 2002 .The purtunas have been adjusted to the species cTABLespecie, en patudo son prelim
IATTC-73-04 Tunas and billfishes in the EPO 36
ABLE A-3c. Estimates of the retained catches of scombrid species, by flag, gear type, and species, in se-seine and pole-and-line data for yellowfin, skipjack, and bigeye
omposition estimate and are preliminary. A A-3c. Estimaciones de las capturas retenidas de escómbridos, por bandera, arte de pesca, y
toneladas métricas, en el OPO, 2002. Los datos de los atunes aleta amarilla, barrilete, y de las pesquerías cerquera y cañera fueron ajustados a la estimación de composición por especie, y
inares.
2002 YFT SKJ BET PBF ALB BKJ BZX TUN Total CAN LT 4,753 4,753 CHL FX 15 7 40 0 62 CHN LL 1,457 7,614 1,327 10,398 COL PS 31,1 2,357 25 0 0 0 0 284 16 50 33,8CRI FX 756 18 0 774 ECU FX 5 5 PS 37,314 75,701 27,542 0 0 877 0 84 141,518 ESP PS 5,465 21,646 5,919 0 0 0 0 0 33,030 JPN LL 8,518 64 34,141 2 2,622 45,347 KOR LL 3,626 44 10,358 1 341 14,370 MEX LL 27 5 32 LP 954 496 0 1 0 8 0 0 1,459 PS 151,213 7,206 0 1,708 28 358 0 0 160,513 PAN LL 761 49 2 4 816 PS 19,514 7,955 2,739 0 0 5 0 0 30,213 PYF LL 278 27 388 2,545 3,238 TWN LL 7,360 27 17,253 0 7,096 31,736 USA GO 1 7 1 0 9 LL 5 1 20 0 1 27 LT 7,256 7,256 PS 6,639 3,723 3,918 0 3 214 0 194 14,691 RO 351 7 8 2,35 2,70VEN PS 119, 4,252 708 0 0 0 0 0 124,473 433 VUT LL 290 2,995 902 4,187 PS 5,197 6,876 2,448 0 0 0 0 0 14,521 OTR1 LL2 115 7 42 2,790 2,954 PS3 36,319 23,918 14,114 0 0 5 0 14 74,370
P
1.P This category is used to avoid revealing the operations of individual vessels or companies—Se usa esta categoría para no revelar información sobre las actividades de buques o empresas individuales.
P
2P Includes El Salvador, Guatemala, Honduras, and Nicaragua—Incluye Nicaragua y El Salvador.
P
3. PIncludes Belize, Bolivia, El Salvador, Guatemala, Honduras, Nicaragua, Peru, and unknown—Incluye Belice, Bolivia, El Salvador, Guatemala, Honduras, Nicaragua, Perú, y desconocido .

IATTC-73-04 Tunas and billfishes in the EPO 37
TABLE A-3d. Preliminary estimates of the retained catches of scombrid species, by flag, gear type, and species, in metric tons, in the EPO, 2003. The purse-seine and pole-and-line data for yellowfin, skipjack, and bigeye tunas have been adjusted to the species composition estimate and are preliminary. TABLA A-3d. Estimaciones preliminares de las capturas retenidas de escómbridos, por bandera, arte de pesca, y especie, en toneladas métricas, en el OPO, 2003. Los datos de los atunes aleta amarilla, barrilete, y patudo de las pesquerías cerquera y cañera fueron ajustados a la estimación de composición por especie, y son preliminares.
2003 YFT SKJ BET PBF ALB BKJ BZX TUN Total CAN LT 6,295 6,295 CHL FX 73 14 1 24 112 CHN LL 2,739 10,066 1,743 14,548 COL PS 22,6 4,767 0 0 0 0 0 293 312 7,772 CRI FX 1, 0 01 401 1,4ECU FX 93 93 LL 148 293 441 PS 35,991 142,216 21,977 0 0 61 0 38 200,283 ESP LL 58 58 PS 4,726 25,152 6,395 0 0 0 0 0 36,273 JPN LL 9,800 52 25,194 3 2,303 37,352 KOR LL 4,911 25 10,272 343 15,551 MEX LL 381 46 427 LP 478 416 0 0 0 6 0 0 900 PS 164,284 13,063 2 3,211 29 193 0 0 180,782 PAN LL 24 24 PS 27,530 14,480 5,392 0 0 3 0 10 47,415 TWN LL 3,477 71 12,016 12,663 28,227 USA GO 2 6 4 1 13 LL 28 2 30 LT 14,392 14,392 PS 993 6,430 3,32 22 163 25 10,962 6 3 0 RO 597 140 737 2,21 3,687 1 2 VEN PS 86,778 13,887 1,09 0 0 0 0 101,763 8 0 VUT LL 699 1,258 4,133 6,090 VUT PS 3,591 17,143 6,970 0 0 13 0 0 27,717 OTR1 LL2 37 37 PS3 33,936 37,952 8,630 0 2 0 0 8 80,528
P
1.P This category is used to avoid revealing the operations of individual vessels or companies—Se usa esta categoría para no revelar información sobre las actividades de buques o empresas individuales.
P
2P Includes Honduras and Nicaragua—Incluye Honduras y Nicaragua.
P
3. Includes Belize, Bolivia, El Salvador, Guatemala, Honduras, Peru, and unknown—Incluye Belice, Bolivia, El Salvador, Guatemala, Honduras, Perú, y desconocido.

TABLE A-3e. Preliminary estimates of the retained catches of scombrid species, by flag, gear type, and species, in metric tons, in the EPO, 2004. The purse-seine and pole-and-line data for yellowfin, skipjack, and bigeye tunas have been adjusted to the species composition estimate and are preliminary. TABLA A-3e. Estimaciones preliminares de las capturas retenidas de escómbridos, por bandera, arte de pesca, y especie, en toneladas métricas, en el OPO, 2004. Los datos de los atunes aleta amarilla, barrilete, y patudo de las pesquerías cerquera y cañera fueron ajustados a la estimación de composición por especie, y son preliminares.
2004 YFT SKJ BET PBF ALB BKJ BZX TUN Total BLZ LL 190 26 120 296 632 CAN LT 7,676 7,676 CHN LL 2,602 2,602 CRI FX 390 2 0 392 ECU PS 40,542 87,643 30,852 0 0 62 7 17 159,123 ESP LL 5 5 PS 3,913 14,901 6,577 0 0 0 0 0 25,391 JPN LL 18,458 18,458 KOR LL 10,729 10,729 MEX LL 27 11 38 LP 1,905 481 0 0 0 0 0 0 2,386 PS 87,334 26,380 98 8,548 106 418 8 57 122,949 PAN LL 3,054 3,054 PS 30,904 18,392 13,202 0 0 25 0 2 62,525 TWN LL 1,824 7,384 9,988 19,196 USA PS 1,977 4,745 4,027 0 0 296 0 178 11,223 RO 1,052 17 4 53 1,126 VEN PS 56,128 13,827 986 0 0 47 0 1 70,989 VUT LL 431 1,225 1,656 PS 1,760 7,205 5,137 0 0 0 0 0 14,102 OTR1 PS2 45,797 23,818 6,066 0 0 1 0 13 75,695
1 This category is used to avoid revealing the operations of individual vessels or companies—Se usa esta categoría para no revelar información sobre las actividades de buques o empresas individuales.
2 Includes Bolivia, El Salvador, Guatemala, Honduras, Nicaragua, Peru, and unknown—Incluye Bolivia, El Salvador, Guatemala, Honduras, Nicaragua, Perú, y desconocido.
IATTC-73-04 Tunas and billfishes in the EPO 38

IATTC-73-04 Tunas and billfishes in the EPO 39
E A-4a. Preliminary estimates of the retained catches and landings, in metric tons, of tunas caught by purse-seine and pole-and-line vessels spec and location where processed (lower panel). The purse-seine and pole-and-line data
for yellowfin, skipjack, and bigeye tunas have been adjusted to the species composition estimate and are preliminary. TABLA A-4a. Estimaciones preliminares de las capturas retenidas y descargas de atún capturado por buques cerqueros y cañeros en el OPO en 2003, por espe bandera del buque (panel superior) y localidad donde fue procesado (panel inferior), en toneladas métricas. Los datos de los atunes aleta amarilla, barrilete, y patudo de las pesquerías cerquera y cañera fueron ajustados a la estimación de composición por especie, y son preliminares.
YFT SKJ BET PBF ALB BKJ BZX TUN Total %
ies and vessel flag (upper panel)
cie y
Retained catches – Capturas retenidas COL 22,693 4,767 312 0 0 0 0 0 27,772 3.9 ECU 35,991 142,216 21,977 0 0 61 0 38 200,283 28.0 ESP 4,726 25,152 6,395 0 0 0 0 0 36,273 5.1 MEX 164,762 13,479 2 3,211 29 199 0 0 181,682 25.4 PAN 27,530 14,480 5,392 0 0 3 0 10 47,415 6.6 USA 993 6,430 3,32 22 3 163 0 25 10,962 1.5 6 VEN 86,778 13,887 1,098 0 0 0 0 0 101,763 14.2 VUT 3,591 17,143 6,970 0 0 13 0 0 27,717 3.9 OTR1 33,936 37,952 8,630 0 2 0 0 8 80,528 11.3 Total 381,000 275,506 54,102 3,233 34 439 0 81 714,395 Landings–Descargas COL 58,319 10,131 2,119 0 0 2 0 0 70,571 10.2 CRI 34,717 3,139 802 0 0 0 0 0 38,657 5.6 ECU 72,653 199,795 39,790 0 2 66 0 56 312,362 45.3 ESP 26,991 14,137 4,130 0 0 0 0 10 45,267 6.6 MEX 152,952 13,174 2 3,017 28 208 0 5 169,386 24.6 USA 666 1,95 2 163 0 25 3,753 0.5 6 111 830 VEN 21,811 5,591 97 0 0 0 0 0 27,499 4.0 OTR2 10,199 9,588 1,406 122 0 0 0 0 21,315 3.1
P
1 Includes Belize, Bolivia, El Salvador, Guatemala, Honduras, Peru, and unidentified. This category is used to avoid revealing the operations of individual vessels or companies. P
1 Incluye Belice, Bolivia, El Salvador, Guatemala, Honduras, no identificados. Se usa esta categoría para no revelar información sobre las actividades de buques o empresas indivi
P
2 Includes El Salv atamala, Italy, Panama, Peru, Singapore, Thailand, and unidentified. This category is used to avoid revealing the operations of individual vessels or companies.
P
2 Incluye El Salvador, Guatamala, Italia, Panamá, Perú, Singapur, Tailandia, y no identificados. Se usa esta categoría para no revelar información sobre las actividades de buques o empresas individuales.
Total 378,307 257,511 48,456 3,969 32 439 0 96 688,810
Perú, yduales. ador, Gu
TABLin the EPO in 2003, by

TABLE A-4b Preliminary estimates of the retained catches and landings, in metric tons, of tunas caught by purse-seine, pole-and-line, and recreational ve n the EPO in 2004, by species and vessel flag (upper panel) and location where processed (lower panel). The purse-seine and pole-and-line data for yellowfin, skipjack, and bigeye tunas have been adjusted to the species composition estimate and are preliminary. TABLA A-4b. Estimaciones preliminares de las capturas retenidas y descargas de atún capturado con buques cerqueros, cañeros y deportivos en el OPO en 2004, por especie y bandera del buque (panel superior) y localidad donde fue procesado (panel inferior), en toneladas métricas. Los datos de los atunes aleta amarilla, barrilete, y patudo de las pesquerías cerquera y cañera fueron ajustados a la estimación de composición por especie, y son preliminares.
YFT SKJ BET PBF ALB BKJ BZX TUN Total %
ssels i
Retained catches – Capturas retenidas ECU 40,542 87,643 30,852 0 0 62 7 17 159,123 29.2 ESP 3,913 14,901 0 0 0 0 0 25,391 4.7 6,577 MEX 89,239 26,861 8,548 106 418 8 57 125,335 23.0 98 PAN 30,904 18,392 13,202 0 0 25 0 2 62,525 11.5 USA 1,977 4,745 4,027 0 0 296 0 178 11,223 2.1 VEN 56,128 13,827 986 0 0 47 0 1 70,989 13.0 VUT 1,760 7,205 5,137 0 0 0 0 0 14,102 2.6 OTR1 45,797 23,818 6,066 0 0 1 0 13 75,695 13.9 Total 70,260 197,392 66,945 8,548 106 849 15 268 544,383 2 Landings–Descargas COL 47,356 10,600 2,019 0 0 0 0 0 59,975 10.6 CRI 15,710 3,819 1,798 0 0 41 0 3 21,371 3.8 ECU 75,833 139,535 59,045 0 0 86 7 20 274,527 48.7 MEX 75,833 139,535 59,045 0 0 86 7 20 274,527 48.7 VEN 22,127 2,601 0 0 0 45 0 0 24,773 4.4 OTR2 28,699 12,215 2,209 53 0 259 0 187 43,622 7.7 Total 285,086 201,831 66,542 8,601 107 848 14 267 563,296
1 Includes, Bolivia, Colombia, El Salvador, Guatemala, Honduras, Nicaragua, and unidentified. This category is used to avoid revealing the operations of individual vessels or companies.
1 Incluye, Bolivia, Colombia, El Salvador, Guatemala, Honduras, N agua, y no identificados. Se usa esta categoría para no revelar información sobre las actividades de buques o empresas indi s.
2 Includes El Salvador, Guatemala, Panama, Peru, Spain, United States,and unidentified. This category is used to avoid revealing the operations of individual vessels or companies.
2 Incluye El Salvador, España, Guatemala, Panamá, Perú, Estados Unidos, y no identificados. Se usa esta categoría para no revelar información sobre las actividades de buques o empresas individuales.
icarviduale
IATTC-73-04 Tunas and billfishes in the EPO 40

IATTC-73-04 Tunas and billfishes in the EPO 41
TABLE A-5. Annual retained catches of Pacific bluefin tuna, by gear type and flag, in metric tons. Source: Report of the Third Meeting of the Pacific Bluefin Tuna Working Group. FPN: pound net (trap); GND: drift gillnet; for other gear codes, see code tables. TABLA A-5. Capturas retenidas anuales de atún aleta azul del Pacífico, por arte de pesca y bandera, en toneladas métricas. Fuente: Informe de la Tercera Reunión del Grupo de Trabajo sobre el Atún Aleta Azul del Pacífico. FPN: almadraba; GND: red de transmalle de deriva; otros códigos de arte, ver tablas de códi
Western Pacific flags—Banderas del Pacífico occidental Eastern Pacific flags—Banderas del Pacífico oriental gos.
JPN KOR1 TWN USA2 MEXPBF PS LL LT LP FPN GND OTR PS TX LL PS
Sub-total PL PS LL LT GND OTR RO PS
Sub-total
Total
1975 4308 1558 1908 1401 2408 676 69 12328 9583 38 2145 11766 240941976 1964 520 1833 1082 3207 1085 15 9705 10646 23 1968 12637 223421977 3960 71 70 2256 2419 884 28 13330 5473 21 2186 7680 210102 301978 8878 1049 6328 1154 2827 2030 68 22334 5396 5 545 5946 282801979 12266 1223 5158 1250 5021 1541 75 26534 6118 12 213 6343 328771980 10414 1170 2323 1392 2701 1479 63 19542 2938 8 582 3528 230691981 23219 796 2456 754 2130 2130 15 179 31679 0 868 0 10 4 1 6 218 1107 327861982 17584 88 79 1777 1644 1577 3 31 176 25151 0 2566 0 0 1 1 7 502 3077 282280 141983 13272 707 2606 356 962 807 30 13 157 18911 6 754 0 0 3 0 21 218 1002 199131984 4217 360 2722 587 2475 532 25 4 471 11395 4 674 0 0 5 1 31 166 881 122761985 3820 496 2904 1817 2678 728 37 1 210 12691 3 3320 0 0 6 1 55 676 4061 167521986 7138 249 2714 1086 2885 316 13 344 70 14815 1 4851 0 0 15 0 7 189 5063 198781987 7962 346 1352 1565 2085 258 3 365 14026 0 861 0 0 2 0 21 119 1003 150289 81988 3243 24 14 907 864 371 3 32 108 197 7680 5 923 0 0 4 0 4 447 1383 90631 171989 5423 44 93 754 823 173 4 71 205 259 9745 8 1046 0 0 3 0 70 57 1184 109290 151990 2678 396 1756 536 768 256 19 132 189 149 6879 62 1380 0 0 9 94 40 50 1635 85141991 8410 285 3015 286 1734 236 26 265 342 14599 0 410 2 0 3 5 57 9 486 150851992 6313 573 1331 166 1227 888 2 288 464 73 11325 1 1928 38 0 8 81 93 0 2149 134741993 5678 857 895 231 978 159 3 40 471 1 9313 4 580 42 0 32 25 114 0 797 101101994 6917 113 83 314 1149 126 3 50 559 13139 1 906 30 0 28 101 24 65 1155 142948 281995 15975 76 17 396 1835 110 12 821 335 23670 0 689 29 0 19 0 166 11 914 245849 341996 6675 978 2331 437 1106 67 8 102 956 12661 0 4639 25 2 43 0 30 3700 8439 210991997 11122 1383 1476 243 756 109 9 1054 1814 17965 1 2240 26 1 57 0 90 367 2782 207471998 4375 1260 1640 269 821 91 8 188 1910 10562 3 1771 54 172 40 1 213 1 2255 128171999 13439 1155 1548 256 1082 59 355 2 3089 21239 2 184 54 20 19 2 397 2369 3047 242856 62000 14020 100 44 398 1229 51 314 794 0 2780 22536 12 692 19 1 30 0 220 3025 3999 265365 192001 6728 1004 551 666 1371 100 37 995 10 1839 14301 1 149 6 7 34 0 226 863 1286 15587 12002 8007 615 982 517 887 212 83 674 1 1523 13501 2 50 2 2 7 0 348 1714 2125 13333
1 Catch statistics for Korea were derived from Japanese import statistics, 1982-1999 (minimum estimates.—Las estadísticas de captura de Corea fueron derivadas de estadísticas de importación japonesas, 1982-1999 (estimaciones mínimas). 2 Catch statistics for United States were categorized into co rcial fishing and sport fishing during 1975-1980.—Las est ísticas de captura de Estados Unidos fueron categorizadas en pesca comercial y pesca deportiva du te 1975-1980.
mmeran
ad
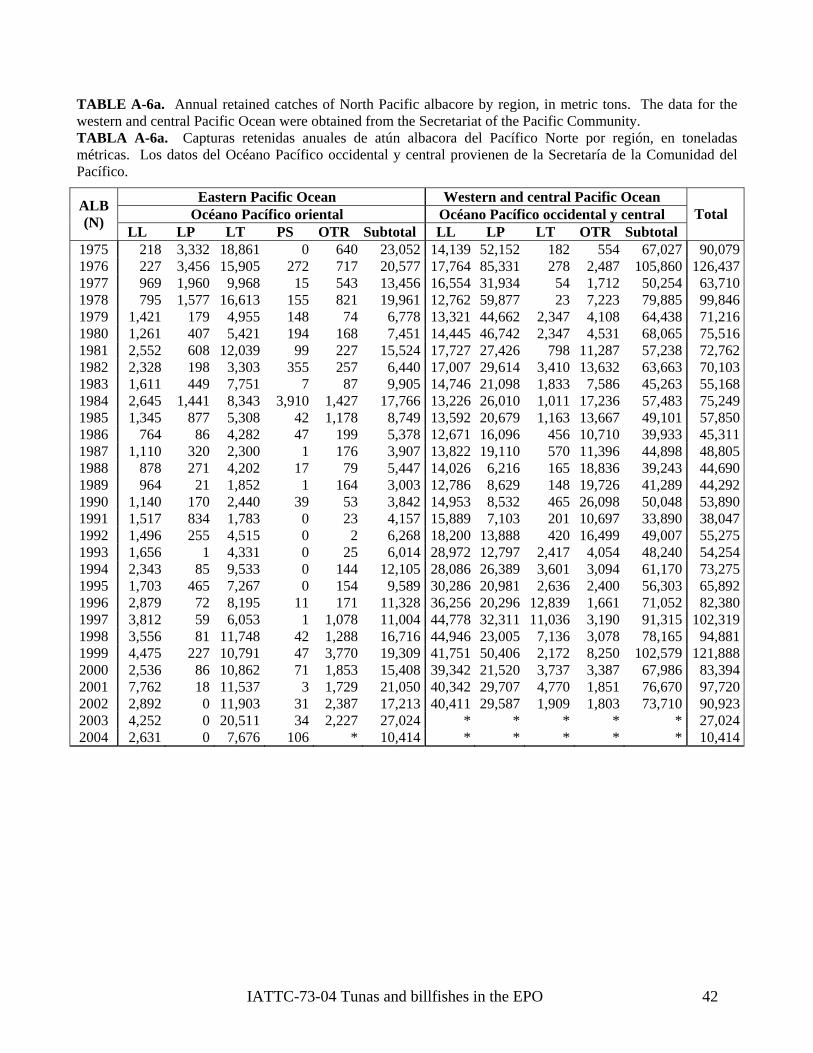
TABLE A-6a. Annual retained catches of North Pacific albacore by region, in metric tons. The data for the western and central Pacific Ocean were obtained from the Secretariat of the Pacific Community. TABLA A-6a. Capturas retenidas anuales de atún albacora del Pacífico Norte por región, en toneladas métricas. Los datos del Océano Pacífico occidental y central provienen de la Secretaría de la Comunidad del Pacífico.
Eastern Pacific Ocean Western and central Pacific Ocean Océano Pacífico oriental Océano Pacífico occidental y central ALB
(N) LL LP LT PS OTR Subtotal LL LP LT OTR Subtotal Total
1975 218 3,332 18,861 0 640 23,052 14,139 52,152 182 554 67,027 90,0791976 227 3,456 15,905 272 717 20,577 17,764 85,331 278 2,487 105,860 126,4371977 969 1,960 9,968 15 543 13,456 16,554 31,934 54 1,712 50,254 63,7101978 795 7 16,61 155 82 19,961 12 59,877 3 7,223 ,885 8461,57 3 1 ,762 2 79 99,1979 1,421 179 4,955 148 74 6,778 13,321 44,662 2,347 4,108 64,438 71,2161980 1,261 407 5,421 194 168 7,451 14,445 46,742 2,347 4,531 68,065 75,5161981 2,552 608 12,039 99 227 15,524 17,727 27,426 798 11,287 57,238 72,7621982 2,328 198 3,303 355 257 6,440 17,007 29,614 3,410 13,632 63,663 70,1031983 1,611 449 7,751 7 87 9,905 14,746 21,098 1,833 7,586 45,263 55,1681984 2,645 1,441 8,343 3,910 1,427 17,766 13,226 26,010 1,011 17,236 57,483 75,2491985 1,345 877 5,308 42 1,178 8,749 13,592 20,679 1,163 13,667 49,101 57,8501986 764 86 4,282 47 199 5,378 12,671 16,096 456 10,710 39,933 45,3111987 1,110 320 2,300 1 176 3,907 13,822 19,110 570 11,396 44,898 48,8051988 878 271 4,202 17 79 5,447 14,026 6,216 165 18,836 39,243 44,6901989 964 21 1,852 1 164 3,003 12,786 8,629 148 19,726 41,289 44,2921990 1,140 170 2,440 39 53 3,842 14,953 8,532 465 26,098 50,048 53,8901991 1,517 834 1,783 0 23 4,157 15,889 7,103 201 10,697 33,890 38,0471992 1,496 255 4,515 0 2 6,268 18,200 13,888 420 16,499 49,007 55,2751993 1,656 1 4,331 0 25 6,014 28,972 12,797 2,417 4,054 48,240 54,2541994 2,343 85 9,533 0 144 12,105 28,086 26,389 3,601 3,094 61,170 73,2751995 1,703 465 7,267 0 154 9,589 30,286 20,981 2,636 2,400 56,303 65,8921996 2,879 72 8,195 11 171 11,328 36,256 20,296 12,839 1,661 71,052 82,3801997 3,812 59 6,05 1 1,07 11,004 44 32,311 11 6 3,190 ,315 3193 8 ,778 ,03 91 102,1998 3,556 81 11,748 42 1,28 16,716 44 23,005 7 6 3,078 ,165 8818 ,946 ,13 78 94,1999 4,475 227 10,791 47 3,770 19,309 41,751 50,406 2,172 8,250 102,579 121,8882000 2,536 86 10,862 71 1,853 15,408 39,342 21,520 3,737 3,387 67,986 83,3942001 7,762 18 11,537 3 1,729 21,050 40,342 29,707 4,770 1,851 76,670 97,7202002 2,892 0 11,903 31 2,387 17,213 40,411 29,587 1,909 1,803 73,710 90,9232003 4,252 0 20,511 34 2,227 27,024 * * * * * 27,0242004 2,631 0 7,676 106 * 10,414 * * * * * 10,414
IATTC-73-04 Tunas and billfishes in the EPO 42

TABLE A-6b. Annual retained catches of South Pacific albacore by region, in metric tons. The data for the western and central Pacific Ocean were obtained from the Secretariat of the Pacific Community. TABLA A-6b. Capturas retenidas anuales de atún albacora del Pacífico Norte por región, en toneladas métricas. Los datos del Océano Pacífico occidental y central provienen de la Secretaría de la Comunidad del Pacífico.
Eastern Pacific Ocean Western and central Pacific Ocean Océano Pacífico oriental Océano Pacífico occidental y central ALB
(S) LL LT Subtotal LL LP LT OTR Subtotal
Total
1975 4,130 * 4,130 24,899 100 646 0 25,645 29,775 1976 2,009 * 2,009 22,221 100 25 0 22,346 24,355 1977 4,343 * 4,343 26,375 100 621 0 27,096 31,439 1978 12,282 * 12,282 26,825 100 86 0 28,611 40,893 1,61979 8,397 * 8,397 25,546 100 814 0 26,460 34,857 1980 4,910 * 4,910 28,689 101 1,468 0 30,258 35,168 1981 4,908 * 4,908 29,162 0 2,085 5 31,252 36,160 1982 5,458 * 5,458 24,095 1 2,434 6 26,536 31,994 1983 7,590 * 7,590 20,663 0 744 39 21,446 29,036 1984 5,010 * 5,010 17,776 2 2,773 1,589 22,140 27,150 1985 6,073 * 6,073 24,502 0 3,253 1,937 29,692 35,765 1986 5,769 74 5,843 29,069 0 1,929 1,946 32,944 38,787 1987 6,378 188 6,566 18,970 9 1,946 930 21,855 28,421 1988 9,813 1,282 11,096 23,124 0 3,014 5,283 31,421 42,517 1989 5,659 593 6,252 16,589 0 7,777 21,968 46,334 52,586 1990 5,871 1,336 7,207 17,368 245 5,639 7,538 30,790 37,997 1991 6,753 795 7,548 18,489 14 7,010 1,489 27,002 34,550 1992 6,039 1,205 7,244 14,593 11 5,373 65 20,042 27,286 1993 16,223 35 16,258 19,937 74 4,261 70 24,342 40,600 1994 9,793 415 10,207 25,172 67 6,749 89 32,077 42,284 1995 7,646 2 7,648 21,053 139 7,706 104 29,002 36,650 1996 3,940 94 4,033 18,263 30 7,137 156 25,586 29,619 1997 5,14 460 5,605 24,180 21 4,070 133 28,404 34,009 5 1998 9,395 10 405 28,714 36 81 85 34,916 44,321 9, 6,01999 5,844 75 5,919 29,681 138 3,063 74 32,956 38,875 2000 7,947 724 8,671 32,792 102 4,793 139 37,826 46,497 2001 10,381 501 10,883 39,207 37 4,859 199 44,302 55,185 2002 11,513 106 11,619 36,417 7 4,227 150 40,801 52,420 2003 12,812 176 12,989 * * * * * 12,989 2004 9,913 * 9,913 * * * * * 9,913
IATTC-73-04 Tunas and billfishes in the EPO 43

IATTC-73-04 Tunas and billfishes in the EPO 44
ubic meter of well volume for the EPO purse-seine fleet, by species and vessel capacity group, in the EPO and in all SKJ, BET, PBF, ALB, BZX, BKJ, OTR (see code tables).
TABLA A-7. Capturas por metro cúbico de volumen de bodega de la flota cerquera del OPO, por especie y clase de arqueo, en el OPO y en todas las áreas oceánicas de pesca. EPO = OPO; All = YFT, SKJ, BET, PBF, ALB, BZX, BKJ, OTR (ver tablas de códigos).
Well volume—Volumen de bodega (m3)
TABLE A-7. Catches per cocean fishing areas. All = YFT,
<401 401-800 801-1100 1101-1300 1301-1500 1501-1800 1801-2100 >2100 Total
Species —
Especie EPO All EPO All EPO All EPO All EPO All EPO All EPO All EPO All EPO All 1999 YFT 3.1 3.1 1.3 1.3 1.0 1.1 1.8 1.9 1.2 1.2 2.1 2.1 0.5 0.6 0.5 0.5 1.5 1.5
SKJ 1.8 1.8 1.9 1.9 1.7 1.7 0.8 0.8 1.3 1.3 1.0 1.1 1.6 1.7 2.2 2.5 1.3 1.4 BET 0.1 0.1 0.2 0.2 0.2 0.2 0.1 0.1 0.2 0.2 0.2 0.2 0.4 0.4 0.8 0.8 0.2 0.2 All 5.3 5.3 3.5 3.5 3.0 3.0 2.7 2.8 2.7 2.7 3.3 3.3 2.4 2.7 3.5 3.8 3.1 3.2
2000 YFT 1.8 1.8 0.8 0.8 0.9 0.9 2.1 2.1 1.3 1.3 1.7 1.7 0.5 0.6 0.4 0.4 1.4 1.4 SKJ 2.5 2.5 1.4 1. 1.6 0.5 0.5 0.9 1.0 0.7 0.7 1.0 1.3 1.1 1.2 1.0 1.1 4 1.6 BET 0.1 0.1 0.3 0. 0.5 0.1 0.1 0.3 0.3 0.2 0.2 0.7 0.8 1.3 1.3 0.3 0.4 3 0.5 All 4.5 4.5 2.5 2.6 3.0 3.0 2.7 2.7 2.6 2.7 2.6 2.7 2.1 2.6 2.8 3.0 2.7 2.9
2001 YFT 2.3 2.3 1.2 1.2 1.2 1.2 2.4 2.4 1.8 1.8 2.3 2.3 0.5 0.5 0.4 0.4 1.6 1.7 SKJ 1.2 1.2 0.9 0.9 0.7 0.7 0.2 0.2 0.5 0.5 0.3 0.3 0.9 0.9 0.7 0.7 0.6 0.6 BET 0.0 0.0 0.2 0.2 0.2 0.2 0.1 0.1 0.2 0.2 0.1 0.1 0.4 0.4 0.2 0.2 0.2 0.2 All 3.7 3.7 2.3 2.3 2.1 2.1 2.7 2.7 2.7 2.7 2.7 2.8 1.7 1.7 1.3 1.3 2.4 2.4
2002 YFT 1.6 1.6 1.4 1.4 0.8 0.8 2.3 2.3 2.2 2.2 1.5 1.5 0.2 0.2 0.2 0.2 1.5 1.5 SKJ 1.3 1.3 1.0 1.0 0.7 0.7 0.2 0.2 0.5 0.5 0.2 0.2 0.7 0.7 0.5 0.5 0.5 0.6 BET 0.0 0.0 0.1 0.1 0.1 0.1 0.1 0.1 0.2 0.2 0.1 0.1 0.3 0.3 0.1 0.1 0.1 0.1 All 3.2 3.2 2.5 2.5 1.7 1.7 2.7 2.7 3.0 3.0 1.7 1.8 1.2 1.2 0.7 0.8 2.2 2.2
2003 YFT 1.7 1.7 1.5 1.5 1.0 1.0 2.4 2.4 1.7 1.7 1.9 1.9 0.3 0.3 0.5 0.5 1.6 1.6 SKJ 2.9 2.9 2.0 2.0 1.4 1.4 0.5 0.5 0.7 0.7 0.4 0.4 1.0 1.1 0.8 1.0 1.0 1.0 BET 0.1 0.1 0.2 0.2 0.2 0.2 0.1 0.1 0.1 0.1 0.1 0.1 0.3 0.3 0.2 0.3 0.1 0.2 All 4.9 4.9 3.7 3.7 2.7 2.7 3.0 3.0 2.5 2.5 2.4 2.4 1.6 1.6 1.6 1.8 2.7 2.8
2004 YFT 1.0 1.0 0.8 0.8 0.7 0.7 1.4 1.4 1.3 1.3 0.8 0.8 0.3 0.3 0.3 0.4 1.0 1.0 SKJ 6 1.6 1.1 1.1 0.4 0.4 0.5 0.5 0.3 0.3 0.4 0.4 0.3 0.5 0.6 1. 0.9 0.9 0.6 BET 0.1 0.1 0.1 0.1 0.1 0.1 0.1 0.1 0.1 0.1 0.1 0.1 0.2 0.3 0.1 0.1 0.2 0.2 All 2.9 2.9 2.1 2.1 2.0 2.0 1.9 1.9 1.9 1.9 1.2 1.2 0.8 0.9 0.8 1.1 1.7 1.7

TABLE A-8. Es ted numbers o ts, by set type and vessel size s, and estimated retained catches, in metric tons, of yellowfin, skipjack, and bige una in the EPO, by purse-seine vessels. The data for 2004 are preliminary. The data for yellowfin, skipjack, and bigeye tunas have been adjusted to the species composition estimate and are preliminary. TABLA A-8. Números estimados de lances, por tipo de lance y clase de arqueo de los buques, y capturas retenidas estimadas, en toneladas métricas, de atunes aleta amarilla, barrilete, y patudo en el OPO. Los datos de 2004 son preliminares. Los datos de los atunes aleta amarilla, barrilete, y patudo fueron ajustados a la estimación de composición por especie, y son preliminares.
Number of sets—Número de lances Retained cat a retenida
tima f se clasye t
ch—CapturClass—Clase
1-5 6 Total YFT SKJ BET
DEL Sets on fish associated with dolphins Lances sobre peces asociados con delfines
1987 57 13,286 13,343 187,608 517 32 1988 49 11,160 11,209 153,936 5,392 37 1989 33 12,827 12,860 191,660 1,729 26 1990 31 10,997 11,028 173,893 1,351 0 1991 0 9,661 9,661 155,283 1,332 0 1992 26 10,398 10,424 165,647 1,262 0 1993 34 6,953 6,987 111,219 582 51 1994 5 7,804 7,809 125,486 1,096 1 1995 0 7,185 7,185 133,180 2,561 1 1996 7,472 7,486 138,595 1,753 7 14 51997 43 8,977 9,020 152,308 8,154 0 1998 0 10,645 10,645 154,734 4,982 5 1999 0 8,648 8,648 143,297 1,693 5 2000 0 9,235 9,235 146,592 398 15 2001 0 9,823 9,823 231,844 1,674 6 2002 0 12,446 12,446 301,570 3,164 1 2003 0 13,839 13,839 258,367 13,082 1 2004 0 11,783 11,783 176,172 10,901 3
OBJ Sets on fish associated with floating objects Lances sobre peces asociados con objetos flotantes
1987 1,322 1,813 3,135 27,447 34,722 767 1988 823 2,281 3,104 25,210 38,616 809 1989 974 2,339 3,313 28,383 84 1,527 44,61990 719 2,558 3,277 35,526 35,572 3,994 1991 819 2,165 2,984 25,501 39,049 2,747 1992 868 1,763 2,631 15,010 49,144 2,048 1993 493 2,063 2,556 19,304 53,079 6,125 1994 668 2,770 3,438 20,842 51,121 33,960 1995 707 3,521 4,228 21,097 80,049 41,964 1996 1,230 4,007 5,237 27,820 69,737 58,367 1997 1,699 5,653 7,352 30,051 116,792 62,703 1998 1,198 5,481 6,679 26,328 110,326 41,911 1999 630 4,620 5,250 43,052 181,650 49,326 2000 494 3,916 4,410 43,155 121,203 91,815 2001 697 5,744 6,441 69,292 123,142 60,480 2002 778 5,781 6,559 37,783 116,875 55,891 2003 750 5,497 6,247 31,831 182,921 52,314 2004 557 5,083 5,640 27,721 116,524 65,478
IATTC-73-04 Tunas and billfishes in the EPO 45

TABLE A-8. (continueTABLA A-8 (continuac )
Number of sets—Número de lances Retained catch—Captura retenida
d) ión
Class—Clase 1-5 6 Total YFT SKJ BET
NOA Sets on unassociated schools Lances sobre cardúmenes no asociados
1987 1,823 3,981 5,804 46,951 28,779 377 1988 4,147 7,536 83 47 43, 689 11,6 98,1 105 1989 2,955 5,878 8,833 52 48, 477 57,9 521 1990 3,683 5,397 9,080 53,832 37,447 1,926 1991 3,571 3,612 7,183 50,473 21,848 2,123 1992 4,010 4,079 8,089 47,463 33,876 5,130 1993 5,739 6,267 12,006 88,971 30,169 3,481 1994 5,440 5,064 10,504 62,081 17,910 938 1995 6,120 4,782 10,902 61,158 44,436 3,354 1996 5,807 5,118 10,925 72,191 32,486 2,888 1997 5,334 4,693 10,027 62,519 28,509 1,567 1998 5,700 4,631 10,331 72,897 25,323 2,213 1999 5,632 6,143 11,775 95,571 78,222 1,827 2000 6,119 5,482 11,601 65,240 83,639 2,254 2001 4,481 3,030 7,511 81,267 19,131 774 2002 5,008 3,409 8,417 72,931 33,594 1,519 2003 7,825 5,781 13,606 90,325 79,086 1,788 2004 5,050 5,083 10,133 64,463 69,486 1,463
ALL Sets on all types of schools Lances sobre todos tipos de cardumen
1987 3,202 19,080 22,282 262,007 64,019 1,177 1988 5,019 20,977 25,996 277,293 87,113 1,535 1989 3,962 21,044 25,006 277,995 94,935 2,031 1990 4,433 18,952 23,385 263,251 74,370 5,920 1991 4,390 15,438 19,828 231,257 62,229 4,870 1992 4,904 16,240 21,144 228,121 84,283 7,179 1993 6,266 15,283 21,549 219,494 83,829 9,657 1994 6,113 15,638 21,751 208,409 70,127 34,900 1995 6,827 15,488 22,315 2 127, 19 15,434 045 45,31996 7,051 16,597 23,648 238,606 103,976 61,312 1997 7,076 19,323 26,399 244,878 153,456 64,270 1998 6,898 20,757 27,655 253,959 140,631 44,128 1999 6,262 19,411 25,673 281,920 261,564 51,158 2000 6,613 18,633 25,246 254,988 205,240 94,083 2001 5,178 18,597 23,775 382,402 143,948 61,259 2002 5,786 21,636 27,422 412,285 153,633 57,412 2003 8,575 25,117 33,692 380,523 275,089 54,103 2004 5,607 21,949 27,556 268,356 196,911 66,944
IATTC-73-04 Tunas and billfishes in the EPO 46

TABLE A-9 ypes of floatin jects on which made. The 2004 data are preliminary. TABLA A-9 Tipos de objet lotantes sobre que se hicieron lances. Los datos de 2004 son preliminares.
Flotsam Naturales
FADs Plantados
Unknown Desconocido
. T.
g obos f
sets were los
OBJ No. % No. % No. %
Total
1992 1,087 61.7 556 0.32 120 0.07 1,763 1993 1,138 55.2 825 0.40 100 0.05 2,063 1994 773 27.9 1,899 0.69 8 0.04 2,770 9 1995 729 20.7 2,704 0.77 3,521 88 0.02 1996 537 13.4 3,447 0.86 23 0.01 4,007 1997 832 14.7 4,768 0.84 52 0.01 5,652 1998 752 13.7 4,627 0.84 102 0.02 5,481 1999 833 18.0 3,758 0.81 29 0.01 4,620 2000 488 12.5 3,381 0.86 47 0.01 3,916 2001 567 9.9 5,076 0.88 100 0.02 5,743 2002 756 13.1 4,953 0.86 66 0.01 5,775 2003 713 13.0 4,744 0.86 40 0.01 5,497 2004 601 11.8 4442 0.87 40 0.01 5,083
IATTC-73-04 Tunas and billfishes in the EPO 47
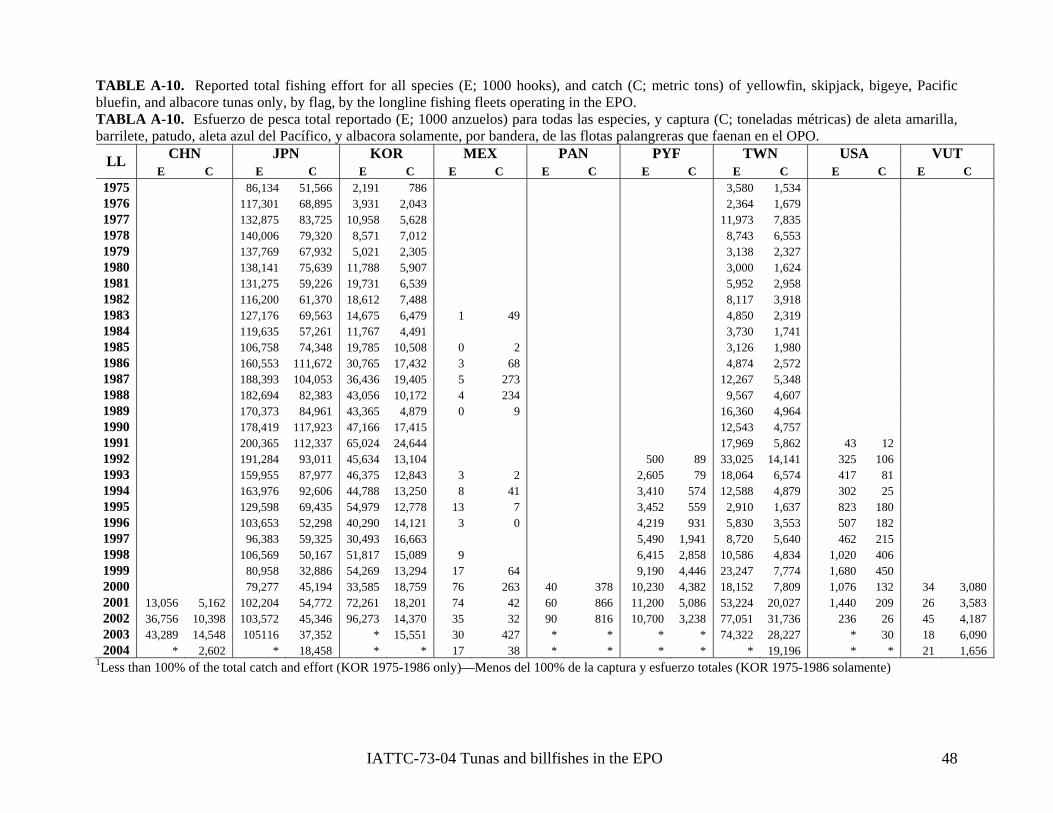
IATTC-73-04 Tunas and billfishes in the EPO 48
E A-10. Reported total fishing effort for all species (E; 1000 hooks), and catch (C; metric tons) of yellowfin, skipjack, bigeye, Pacific albacore tunas only, by flag, by the longline fishing fleets operating in the EPO.
A A-10. Esfuerzo de pesca total reportado (E; 1000 anzuelos) para todas las especies, y captura (C; toneladas métricas) de aleta amarilla, ente, por bandera, de las flotas palangreras que faenan en el OPO.
CHN JPN KOR MEX PAN PYF TWN USA VUT LL E C E C E C E C E C E C E C E C E C
1975 86,134 51,566 2,191 786 3,580 1,534 197 117,301 68,895 31 2,043 2,364 1,67 6 3,9 9 1 132,875 83,725 10,958 5,628 11,973 7,835 977 1978 140,006 79,320 8,571 7,012 8,743 6,553 1979 137,769 67,932 5,021 2,305 3,138 2,327 1980 138,141 75,639 11,788 5,907 3,000 1,624 1981 131,275 59,226 19,731 6,539 5,952 2,958 1982 116,200 61,370 18,612 7,488 8,117 3,918 19 127,176 69,563 75 6,479 1 49 4,850 2,31 83 14,6 9 1 119,635 57,261 11,767 4,491 3,730 1,741 984 1985 106,758 74,348 19,785 10,508 0 2 3,126 1,980 1986 160,553 111,672 30,765 17,432 3 68 4,874 2,572 1987 188,393 104,053 36,436 19,405 5 273 12,267 5,348 1988 182,694 82,383 43,056 10,172 4 234 9,567 4,607 1989 170,373 84,961 43,365 4,879 0 9 16,360 4,964 199 178,419 117,923 66 17,415 12,543 4,757 0 47,1 1991 200,365 112,337 65,024 24,644 17,969 5,862 43 12 1992 191,284 93,011 45,634 13,104 500 89 33,025 14,141 325 106 1993 159,955 87,977 46,375 12,843 3 2 2,605 79 18,064 6,574 417 81 1994 163,976 92,606 44,788 13,250 8 41 3,410 574 12,588 4,879 302 25 1995 129,598 69,435 54,979 12,778 13 7 3,452 559 2,910 1,637 823 180 1996 103,653 52,298 40,290 14,121 3 0 4,219 931 5,830 3,553 507 182 1997 96,383 59,325 16,663 5,490 1,941 8,720 5,640 462 215 30,493 1998 106,569 50,167 51,817 15,089 9 6,415 2,858 10,586 4,834 1,020 406 1999 80,958 32,886 54,269 13,294 17 64 9,190 4,446 23,247 7,774 1,680 450 2000 79,277 45,194 33,585 18,759 76 263 40 378 10,230 4,382 18,152 7,809 1,076 132 34 3,080 2001 13,056 5,162 102,204 54,772 72,261 18,201 74 42 60 866 11,200 5,086 53,224 20,027 1,440 209 26 3,583 2002 36,756 10,398 103,572 45,346 96,273 14,370 35 32 90 816 10,700 3,238 77,051 31,736 236 26 45 4,187 2003 43,289 14,548 105116 37,352 * 15,551 30 427 * * * * 74,322 28,227 * 30 18 6,090 2004 * 2,602 * 18,458 * * 17 38 * * * * * 19,196 * * 2 ,656 1 1
P
1Less than 100% of the total catch and effort (KOR 1975-1986 only)—Menos del 100% de la captura y esfuerzo totales (KOR 1975-1986 solamente)
TABLbluefin, andTABLbarrilete, patudo, aleta azul del Pacífico, y albacora solam

TABLE A-11. Num and well volu , in cubic mete the EPO tuna fleet, 1975-2004. The data for 2004 are preliminary. TABLA A-11. Número y volumen de bodega, en metros cúbicos, de buques cerqueros y cañeros de la flota atunera del OPO, 1975-2004. Los datos de 2004 son preliminares.
PS LP
bers mes rs, of purse-seine and pole-and line vessels of
Vol. (m3) No. Vol. (m3)
174,016 111 8,055
187,512 137 8,471
189,967 116 6,780
192,259 118 6,736
195,494 50 4,341
196,476 50 4,186
196,484 41 3,308
178,234 40 3,016
149,404 60 3,940
121,650 40 3,245
137,814 25 2,574
131,806 17 2,060
152,351 29 2,376
156,636 36 3,274
141,956 30 3,135
143,946 23 2,044
124,501 19 1,629
117,017 19 1,612
118,730 15 1,543
122,214 20 1,725
124,096 20 1,784
132,731 17 1,639
146,533 23 2,105
161,560 22 2,217
180,652 14 1,656
180,625 13 1,311
189,865 10 1,259
200,075 6 925
IATTC-73-04 Tunas and billfishes in the EPO 49

202,706 3 338
206,028 3 338
IATTC-73-04 Tunas and billfishes in the EPO 50

TAantothTAy bu“Tba
BLE-linel foreforBLAñeroue etal gdera
Flag
A-12a. Estimates of the numbers and well volumes, in cubic meters, of purse-seine and pole-d vessels that fished in the EPO in 2003 by flag, gear, and size class. Each vessel is included in the ta each flag under which it fished during the year, but is included only once in the "Grand total"; er e the grand total may not equal the sums of the individual flags.
A-12a. Estimaciones del número y volumen de bodega, en metros cúbicos, de buques cerqueros ca s q r bandera, arte de pesca, y clase de arqueo. Se incluye cada q n los totales de cada bandera bajo la cual pescó durante el año, pero solamente una vez en el o eneral”; por consiguiente, los totales generales no equivalen necesariamente a las sumas de las n s individuales.
Gear Size class—Clase de arqueo Well Volume
ue pescaron en el OPO en 2003, po
Bandera Arte 1 2 3 4 5 6 Total Volumen
de bodega Number—Número m3
BLZ PS - - 1 - - 1 2 695 BOL PS - - 2 1 - 7 10 7,910 COL PS - - 1 1 2 5 9 7,259 ECU PS - 5 11 12 9 37 74 48,415 ESP PS - - - - - 5 5 12,177
GTM PS - - - - - 3 3 5,700 HND PS - - - - - 2 2 1,798 MEX PS - - 3 6 11 38 58 50,633
LP - 1 2 - - - 3 338 PAN PS - - - 1 - 13 14 17,909 PER PS - - - - - 2 2 2,018 SLV PS - - - - - 3 3 5,377 USA PS - - 2 - - 6 8 8,665 VEN PS - - - - - 25 25 32,699 VUT PS - - - - - 6 6 7,449 UNK PS - - - - - 1 1 1,864
PS - 5 19 21 21 148 214 GraTot
nd totaal gene LP - 1 2 - - - 3 l—
ral PS + LP - 6 21 21 21 148 217 Well volume—Volumen de bodega (m3)
PS - 551 3,552 5,825 9,328 183,450 202,706 GraTot
nd totaal gene LP - 101 237 - - - 338 l—
ral PS + LP - 652 3,789 5,825 9,328 183,450 203,044 - : none—ninguno
IATTC-73-04 Tunas and billfishes in the EPO 51

TABLE A-12b. Estimates of the numbers and well volumes, in cubic meters, of purse-seine (PS) and pole-and-line vessels that fished in the EPO in 2004 by flag, gear, and size class. Each vessel is included in the total for each flag under which it fished during the year, but is included only once in the "Grand total"; therefore the grand total may not equal the sums of the individual flags. TABLA A-12b. Estimaciones del número y volumen de bodega, en metros cúbicos, de buques cerqueros (PS) y cañeros (LP) que pescaron en el OPO en 2004, por bandera, arte de pesca, y clase de arqueo. Se incluye cada buque en los totales de cada bandera bajo la cual pescó durante el año, pero solamente una vez en el “Total general”; por consiguiente, los totales generales no equivalen necesariamente a las sumas de las banderas individuales.
Flag Gear Size class—Clase de arqueo Well Volume
Bandera Arte 1 2 3 4 5 6 Total Volumen
de bodega Number—Número m3
BOL PS - - 2 1 - 5 8 6,412 COL PS - - - 1 1 6 8 8,318 ECU PS - 4 8 13 10 39 74 49,128 ESP PS - - - - - 4 4 8,859
GTM PS - - - - - 2 2 3,415 HND PS - - - - - 3 3 2,810 MEX PS - - 2 7 11 39 59 52,443
LP - 1 2 - - - 3 338 NIC PS - - - - - 3 3 3,926 PAN PS - - - 2 1 19 22 27,411 SLV PS - - - - - 3 3 5,377 USA PS - - 1 - - 6 7 8,178 VEN PS - - - - - 23 23 29,961 VUT PS - - - - - 4 4 5,082 UNK PS - - 2 - - - 2 360
PS - 4 13 24 22 152 215 LP - 1 2 - - - 3 Grand total—
Total general PS + LP - 5 15 24 22 152 218 Well volume—Volumen de bodega (m3)
PS - 383 2,294 6,712 9,727 186,912 206,028 LP - 101 237 - - - 338 Grand total—
Total general PS + LP - 484 2,531 6,712 9,727 186,912 206,366 - : none—ninguno
IATTC-73-04 Tunas and billfishes in the EPO 52

TABLE A-13. Minimum, maximum, and average values, in thousands of metric tons, for monthly capacities of purse seiners and pole-and-line vessels at sea in the EPO during l994-2003, and the 2004 values. TABLA A-13. Valores mínimos, máximos, y medios, en miles de toneladas métricas, de la capacidad mensual de buques cerqueros y cañeros en el mar en el OPO durante 1994-2003, y los valores de 2004.
1994-2003 Month Mes Min Max Ave-Prom 2004
1 67.0 121.6 92.1 121.4 2 67.9 138.7 99.4 144.1 3 66.0 123.8 95.6 149.8 4 64.2 139.1 99.8 143.0 5 65.3 130.0 96.3 135.4 6 66.8 115.9 97.2 144.7 7 69.3 128.2 100.2 153.5 8 65.1 140.2 100.5 116.9 9 64.2 137.7 100.9 111.9
10 60.1 145.6 100.8 145.2 11 60.0 145.0 96.9 129.6 12 33.1 116.4 72.2 56.3
Ave-Prom 62.4 131.9 96.0 129.3
IATTC-73-04 Tunas and billfishes in the EPO 53

B. YELLOWFIN TUNA
An age-structured, catch-at-length analysis (A-SCALA) was used to assess yellowfin tuna in the eastern Pacific Ocean (EPO). The analysis method is described in IATTC Bulletin, Vol. 22, No. 5, and readers are referred to that report for technical details. The stock assessment details are available on the IATTC web site, www.iattc.org.
The assessment reported here is based on the assumption that there is a single stock of yellowfin tuna in the EPO, which is consistent with the management of the stock. Yellowfin are distributed across the Pacific Ocean, but the bulk of the catch is made to the east and west. Purse-seine catches of yellowfin tuna are lower close to the 150ºW EPO boundary (Figure A-1). The movements of tagged yellowfin tuna are generally over hundreds, rather than thousands, of kilometers, and exchange between the eastern and western Pacific Ocean appears to be limited. This is consistent with longline catch per unit of effort (CPUE) trends differing among areas. It is likely that there is a continuous stock throughout the Pacific Ocean, with exchange of individuals at a local level, although there is some genetic evidence for local isolation. Movement rates between the EPO and the western Pacific could not be estimated with currently available tagging data.
The stock assessment requires a substantial amount of information. This includes data on retained catch, discards, fishing effort, and the size compositions of the catches from several different fisheries. Assumptions have been made about processes such as growth, recruitment, movement, natural mortality, fishing mortality, and stock structure. The assessment for 2005 differs from the 2004 assessment in the following ways. Catch and length-frequency data for the purse-seine and pole-and-line (surface) fisheries have been updated to include new data for 2004 and revised data for 2000-2003. Effort data for the surface fisheries have been updated to include new data for 2004 and revised data for 1975-2003. Catch data for the Japanese longline fisheries have been updated for 1999-2002, and new data for 2003 have been added. Catch data for the longline fisheries of Chinese Taipei have been updated to include new data for 2002. Catch data for the longline fisheries of the People’s Republic of China have been updated to include new data for 2003 and revised data for 2001 and 2002. Longline catch-at-length data for 2001-2002 have been updated, and new data for 2003 added. Longline effort data have been standardized via a generalized linear model standardization of CPUE rather than a neural network, using data for 1975-2003. The growth model likelihood has been adjusted to account for sampling at length rather than assuming random sampling. The catches are shown in Figure B-1.
Significant levels of fishing mortality have been observed in the yellowfin tuna fishery in the EPO (Figure B-2). These levels are highest for middle-aged yellowfin. Both recruitment (Figure B-3) and exploitation have had substantial impacts on the yellowfin biomass trajectory (Figure B-4). Most of the yellowfin catch is taken by catching schools associated with dolphins, and accordingly this method has the greatest impact on the yellowfin tuna population (Figure B-4), although it has almost the lowest impact per weight captured of all fishing methods. It appears that the yellowfin population has experienced two different productivity regimes (1975-1983 and 1984-2004), with greater recruitment during the second regime. The two recruitment regimes (Figure B-3) correspond to two regimes in biomass (Figure B-4), the high-recruitment regime corresponding to greater biomasses. The spawning biomass ratio (the ratio of the current spawning biomass to that for the unfished stock; SBR) of yellowfin in the EPO was below the level capable of supporting the average maximum sustainable yields (AMSYs) during the low-recruitment regime, but close to that level during the high-recruitment regime (Figure B-5). The two different productivity regimes may support two different levels of AMSY and associated SBRs, and the AMSY reported here is an average for the 1975-2004 period. The current SBR is below the SBR level at AMSY (Figure B-5). However, there is substantial uncertainty in the most recent estimate of SBR, and there is a moderate probability that the current SBR is above the level that would support the AMSY. The effort levels are estimated to be above those capable of supporting the AMSY (based on the recent (2002-2003) distribution of effort among the different fisheries). Because of the flat yield curve, the recent effort levels are estimated to produce, under average conditions, catch that is only
IATTC-73-04 Tunas and billfishes in the EPO 54

sligindi6). hadandrem
AMof svari
Theincrpop
Thethatthe the poleThecapcalcfishcatc
The
h ess than AMSY. Future projections under the current effort levels and average recruitment c hat the population will remain at approximately the same level over the next 5 years (Figure B- T e simulations were carried out using the average recruitment for the 1975-2004 period. If they b carried out using the average recruitment for the 1984-2004 period, the projected trend in SBR c es would have been m re positive. Both t e purse-seine and longline catches are expected to a
S as been stable during the assessment period (Figure B-7). This suggests that the overall pattern e vity has not varied a great deal through time. However, the overall level of fishing effort has e th respect to the AMSY multiplier.
ysis indicates that strong cohorts entered the fishery in 1998-2000, and that these cohorts e the population biomass during 1999-2000. However, they have now moved through the u n, so the biomass decreased during 2001-2004.
o ll average weights of yellowfin tuna that are caught have consistently been much less than those w d maximise the AMSY, indicating that, from the yield-per-recruit standpoint, the yellowfin in E are not harvested at the optimal size. There is substantial variability in the average weights of y fin taken by the different fisheries, however. In general, the floating-object, unassociated, and - lin n do the dolphin-associated and longline fisheries. l ine yellowfin associated with dolphins tu lder, larger yellowfin than do the coastal and northern dolphin-associated fisheries. The AMSY u ns indicate that the yield levels could be increased if the fishing effort were diverted to the e that catch larger yellowfin and, vice versa, would be diminished if fishing effort were diverted to h smaller fish. Any such changes would also affect the SBR levels in a similar way.
c ervation measures imposed in 2004 under Resolution C-04-09
tly late theseenatchin close
Y hlectid wi
analasedlatio
veraoul
PO ellowand-onglre olatiories ing
ons
o hto 2004 levels (Figure B-6).
e fisheries capture younger, smaller fish tha fisheries and the purse-seine sets in the southern area on
are predicted to result in slightly e mass and SBR than would otherwise have been the case. However, it is likely that the stock is w AMSY level.
e vity analysis was carried out to estimate the effect of a stock-recruitment relationship. The l est that the model with a stock-recruitment relationship fits the data slightly better than the ut this result could also be explained by the regime shift, since spawning biomass is low n e ow recruitment and high during the high recruitment. The results from the analysis - ent relationship are more pessimistic, suggesting that the effort level is greater than
w duce the AMSY (Table B-1); however, the yield at this effort level is still only 6% t SY. The biomass is estimated to have been less than the biomass that would produce the S odeling period, except for most of the 2000-2002 period.
a ent results are very similar to those from the previous assessments. The major differences ur ected, in the most recent years. The current assessment, and those for 2002, 2003 and 2004, c t the biomass increased in 2000, whereas the earlier assessments indicated a decline. In it R and the SBR corresponding to the AMSY have increased compared to the 2004 assessment
hanges in estimates of growth and recent age-specific fishing mortality.
results are similar to those of the previous five assessments, except that SBR at AMSY is er than in these assessments.
b
re is uncertainty about recent and future recruitment and biomass levels.
estimate of current SBR is less than that required to produce AMSY but its confidence vals encompass the AMSY.
recent fishing mortality rates are 20% above those required to produce AMSY.
highbelo
A sresubaseduriwiththatlessAM
Theoccindiaddbecau
Summ
1
2
3
4
5
r bio the
nsitits suggcase, bg the pa stockhich w
han AMY for most of the m
ssessm, as expate thaion, SBse of c
ary
. Thehigh
. The
. The
. Theinter
. The
riod lrecrould o
ofuitm pr
iomass is estimated to have declined very slightly in 2004.
IATTC-73-04 Tunas and billfishes in the EPO 55

6. Increasing the average weight of the yellowfin caught could substantially increase AMSY.
7. There have been two different productivity regimes, and the levels of AMSY and the biomass required to produce AMSY may differ between the regimes.
8. The results are more pessimistic if a stock-recruitment relationship is assumed.
FIGURE B-1. Total catches (retained catches plus discards) for the purse-seine fisheries, and retained catches for the pole-and-line fishery and longline fisheries, of yellowfin tuna in the eastern Pacific Ocean, 1975-2004, used in the stock assessment. Purse-seine catches for 1975-1992 are based on unloading data. Longline catches for 1975-2003 are those reported to the IATTC by governments, and those for 2004 are predicted by the model based on 2003 effort levels and estimates of the biomass vulnerable to longlining in 2004. FIGURA B-1. Capturas totales (capturas retenidas más descartes) de las pesquerías de cerco, y capturas retenidas de las pesquerías cañera y palangreras, de atún aleta amarilla en el Océano Pacífico oriental, 1975-2004, usadas en la evaluación de la población. Las capturas cerqueras de 1975-1992 se basan en datos de descargas. Las capturas palangreras de 1975-2003 son las que reportaron los gobiernos a la CIAT, y las de 2004 son predichas por el modelo con base en el nivel de esfuerzo de 2003 y estimaciones de la biomasa vulnerable a los palangres en 2004.
IATTC-73-04 Tunas and billfishes in the EPO 56

FIGURE B-2. Time series of average total annual fishing mortality of yellowfin tuna that have been recruited to the fisheries of the EPO. Each panel illustrates an average of four annual fishing mortality vectors that affected the fish of the age range indicated in the title of each panel. For example, the trend illustrated in the upper-left panel is an average of the fishing mortalities that affected fish that were 2-5 quarters old. FIGURA B-2. Series de tiempo de la mortalidad por pesca trimestral total media de atún aleta amarilla reclutado a las pesquerías del OPO. Cada recuadro ilustra un promedio de cuatro vectores trimestrales de mortalidad por pesca que afectaron los peces de la edad indicada en el título de cada recuadro. Por ejemplo, la tendencia ilustrada en el recuadro superior izquierdo es un promedio de las mortalidades por pesca que afe a los peces de entre 2 y 5 trimestres de edad. ctaron
FIGURE B-3. Estimated recruitment of yellowfin tuna to the fisheries of the EPO. The estimates are scaled so that the average recruitment is equal to 1.0. The bold line illustrates the maximum likelihood estimates of recruitment, and the shaded area indicates the approximate 95% confidence intervals around those estimaFIGURA B lutamiento estimado de atún aleta amarilla a las pesquerías del OPO. Se escalan las estimaciones para que el reclutamiento medio equivalga a 1,0. La línea gruesa ilustra las estimaciones de probabilidad máxima del reclutamiento, y el área sombreada indica los intervalos de confianza de 95% aproximados de esas estimaciones.
tes. -3. Rec
IATTC-73-04 Tunas and billfishes in the EPO 57

FIGURE B-4. mass trajectory of a simulated popula of yellowfin tuna that was not exploited during 1975-2004 (dashed line) and that predicted by the stock assessment model (solid line). The different colored areas between the two lines represent the portion of the fishery impact attributed to each fishing method. FIGURA B-4. Trayectoria de la biomasa de una población simulada de atún aleta amarilla no explotada durante 1975-2004 (línea de trazos) y la que predice el modelo de evaluación (línea sólida). Las áreas coloreadas entre las dos líneas represantan la porción del impacto de la pesca atribuida a cada método de pesca.
Bio tion
IATTC-73-04 Tunas and billfishes in the EPO 58

FIGURE B-5. Spawning biomass ratios (SBRs) for 1975-2004 and SBRs projected during 2005-2010 for yellowfi the EPO by the likelihood profile approximation method. The dashed horizontal line (at 0.44) identifies SBRAMSY. The shaded area represents the 95% confidence limits of the estimates. The estimates after 2005 (the large dot) indicate the SBR predicted to occur if effort continues at the average of that observed in 2004, catchability (with effort deviates) continues at the average for 2002 and 2003, and average environmental conditions occur during the next 10 years. FIGURA B-5. Cocientes de biomasa reproductora (SBR) para 1975-2004 y SBR proyectados durante 2005-2010 para el atún aleta amarilla en el OPO por el método de aproximación de perfil de verosimilitud. La línea de trazos horizontal (en 0.44) identifica SBRRPMS. El área sombreada representa los límites de confianza de 95% de las estimaciones. Las estimaciones a partir de 2005 (el punto grande) señalan el SBR predicho si el esfuerzo continúa en el nivel promedio de 2004, la capturabilidad (con desvíos de esfuerzo) continúa en el promedio de 2002 y 2003, y ocurren condiciones ambientales medias en los 10 próximos años.
n tuna in
IATTC-73-04 Tunas and billfishes in the EPO 59

FIGURE B-6. Catches of yellowfin tuna during 1975-2004 and simulated catches of yellowfin tuna during 2005-2009 taken by the purse-seine and pole-and-line fleets (upper panel) and the longline fleet (lower panel), using the likelihood profile method. The shaded area represents the 95% confidence limits of the estimates. FIGURA B-6. Capturas de atún aleta amarilla durante 1975-2004 y capturas simuladas de aleta amarilla durante 2005-2009 por las flotas de cerco y de caña (recuadro superior) y la flota palangrera (recuadro inferior), usando el método de aproximación de perfil de verosimilitud. El área sombreada representa los intervalos de confianza de 95% estimades de las estimaciones.
IATTC-73-04 Tunas and billfishes in the EPO 60

FIG B AMS pper pa , 1975 04, and he c e (incr se or ductio in the effort req red to uc SY (lower panel), estimat separa y for each yea sing av e-spe ish ortal r that y FIG B RM cuadro eri 75-2004, y o (aum nto o ducció del esfuerzo nec p roducir RMSP cuadro i erior timado por separado para cada año, usando la mo alidad esca pr
URE -7. Y (u nel) -20 t hang ea re n)ui prod e the AM ed tel r u the erage agcific f ing m ity fo ear.URA -7. SP (re sup or), 19 cambi e re n)
esario ara p el (re nf ), esrt por p omedio por edad de ese año.
IATTC-73-04 Tunas and billfishes in the EPO 61

TABLE B-1. Estimates of the AMSY and its associated quantities for the base case assessment and the sensitivity analysis including a stock-recruitment relationship with a steepness (h) of 0.7.5. All analyses
s the estimated total catch in 2004. TABL . Esti y el análisi nsibili e inc na r po n- m on c n ( .75. Todos los análisis se basan en la mo alidad por pesca e y 2003. B 05, BRMSP, y
are based on average fishing mortality for 2002 and 2003. B2005, BAMSY, and B0 are the biomass of yellowfin 1.5+ years old at the start of 2005, at AMSY, and without fishing, respectively, and S2005, SAMSY, and S0 are the female spawning biomass at the start of 2005, at AMSY, and without fishing, respectively. C2004 i
A B-1s de se
maciones del dad qu
RMSPluye u
sus valores asocielación
ados para larecluta
evaluaiento c
ción del caso una in
base yh) de 0blació linació
rt m dia de 2002 20 BB la bio e amari e edad 1.5+ años al principio de 2005, en RMSP, y sin pesca, respectivamente, y S M S0 s iomasa re rod de hem a cipio 2005 n RMS , y a, respectivam . C cap tal est a en 2004.
Base case h 0.75
0 sonmasa d aleta lla d2005, SR SP, y on la b p uctora br s al prin de , e P sin pesc
ente 2004 es la tura to imad
Caso base =
A –R ) 284, 7 6,77MSY MSP (t 70 30 5 B –BR ) 8 1,276S R ) 4 10,141 B
AMSY MSP (t 419,59 53 AMSY—S MSP (t 8,14
0.B /B0AMSY —BB SP/B0 4 0.36 RM 3S S0 –SR 0 4 0.45 C M 04/R 4 0.97B AMSY /BRMSP 9 0.72 S AM SRM 7 0.71 F 3 0.67
AMSY/A
MSP/S 0.42004/
BSY—C20 MSP 1.0
0
2005//S
–B2005S /
.80.82005 SY – 2005 SP
multiplier—Multiplicador de F 0.8
IATTC-73-04 Tunas and billfishes in the EPO 62

C. SKIPJACK TUNA
An age-structured catch-at-length analysis (A-SCALA) is used to assess skipjack tuna in the eastern Pacific Ocean (EPO). The analysis method is described in IATTC Bulletin, Vol. 22, No. 5, and readers are referred to that report for technical details. This method was used for the most recent assessment of skipjack tuna conducted in 2004, which included data up to and including 2003.
The stock assessment requires a substantial amount of information. Data on retained catch, discards, fishing effort, and the size com ions ca i f s en The catches used in the assess re p d i re ev u s ing ses such as growth, recruitment, movement, natural mortali , f ortalit , and stock structure have also be e. e assess t is still considered preliminary because (1) it is not known whether catch per da sh for eine fishe e na to nce, ( it is ssible at a po rge k th ulnerable to the heries, d (3) stock structure in rela sh in the EPO and in the western and central Pacific is unc tain. H ever, sults fr m sensitivity es for sse ent are mo e consistent than those of previous years.
The recruit t o the EPO is highl riable (Figure C-2). Fishing mo (F e C st b the sam or less ta se estimates of fishing m timates from tagging data. Biomass fluctuates in response to variations in both recruitment and exploitation (Figure C-4) stim s of a lu ss are ra rm ion abunda ce in t catch d ta for a obje eries an e nic selectivity mption but th trends b re no
The analysis indicates that a group of relative str horts not as strong the fishery in 2002- nd that these cohorts incr ches during 2003. T is an atio at t r cru are ch ma lead lowe om d cat er tim lo tment limited information, and are therefore ve rt
There is considerable variation in sp wning mass ra o (ratio f the spawning biomass to that for the unfished stock; SBR) for skipjack tuna in the EPO (F u 03 the SBR was a el (about 0.61). Estim r ximu ustaina yi AMS and ld-per-recruit ind cate th ximu lds ar ieved w h in fi ortalit because the critical weight is less than the average weigh rui o the fishery. oweve this uncer of un tie th tes ral ity and growth. Estimaweights given to th ation about abundance i ta for the floa ct fisheries and the monotonic selectivity assu n.
positment a
of theresente
tches of several dn Figu
fferenteral ass
isheriemption
have be regard
analyzed. procesC-1. S
ty ishing m yen mad Th meny of fi ing purse-s ri s is proportio l abunda 2) po th there ispulation of la skipjac at is inv fis an tion to fi
er ow re o analys this a ssm r
men f skipjack tuna to the fisheries in-3) is
y vartality igur e imated to e about e than the rate of natural mor lity. The
ortality are supported by es. E ate bso te bioma
mode the flo
tely sensitive to weights given to the info at about n he an effort dating- ct fish d th monoto assu , e in iomass a
t.
ly ong coeased the biomass and cat
(but as those of 1998) entered 2003, a here
indic n th the mos, t
ecent reates
itments average, whia
y to r bi asses anches. H
eowev hese es of w recrui re based on
ry unc ain.
a bio ti oig re C-5). In 20 at high lev
ates based on ave age ma m s ble eld ( Y) yiei at ma m yie e ach it finite shing m y
t at rec of na
tment t H r, tes of SBR are not sensitive to
is tain because certain s in e estima tu mortal
e inform n the catch and effort da ting-objemptio
IATTC-73-04 Tunas and billfishes in the EPO 63

FI C Total catches (retained catches plus discards) th se-se fis s on floating objects and unassociated schools, and for ishe mbin , of ack tu in astern Pacific Ocean, 1975-2004, used in the stock assessment. Purse-seine catches are based on unloading daFI Capturas tot tura nidas s es) d s pesquerías c re objetos flotantes y cardúmenes no asocia de las má erías bin n el ico l, 1 4, usadas en la evaluación de la población. as c ras as se en os d ga
GURE -1. fore
e purski
inen
heriethe other f ries co d pj a e
ta. erGURA C-1. ales (cap s rete má descart
s pese la de co sob
dos, y de qu com adas, de atún barrilete eOcéanobasan
Pac dat
íf orientae descar
975-200s.
L aptu cerquer
IATTC-73-04 Tunas and billfishes in the EPO 64

FIGUREscaled soestimateare drawthere areFIGURAestimacireclutamdibujan represen
C-2. E that the
s of recrun at the s 12 estim C-2. R
ones paraiento de las leyendta el tiem
PO.sti d recruit e are av e recruitment is equal to 1.0. The solid line illustrates the mitm nd the shaded area the 95% confidence intervals. The labels on the ti axis tart of ear, but, since the assessment model represents time o l sis, ates of
e en s d a b ete a la las qu miento medio equivalga a 1,0. La línea sólida ilustra i i s de proba ad máxima, y el área som da los intervalos de confianza de 95%. Se as en je de tiempo al principio de cada año, pero, ya que el modelo de evaluación
po p
mateeragent, a
ment of skipjack tuna to the fisheries of the E Tax
n
las
he imu
a m
est
stimm-likelihood
onth
escmac
ates
me y ba
alanone
each y recami recluta
bilid el e me
ruitmto e
ent fotima
r eacho de
yeartún
. clute el
arril s pesquerías del OPO. Se
brea
eclor ses, hay 12 estimaciones de r utamiento para cada año.
nartand ntha dtoradaad
FIGUREfisheriesaffected upper paFIGURreclutadmortalidejemploafectaro
C-3. T of the Efish of thnel is an a
A C-3. Sero a las pesqad por pesca, la tendencian a los peces
im h c e the PO a e t that e a n ca th le p e e verage of the fishing mortalities that affected fish that were 9-20 mo
ies de tiempo de la mortalidad por pesca mensual total medi b te s e
que d r ilu d e
de entre 9 y 20 meses de edad.
e seri. E
ge ra
es och ge
f apanindi
veel
rag illted
e tust in
otarat
l mes e tit
onan
thlav
of
y fiserageach
ing of pan
m12el.
ort m Fo
alitonr e
y othlxam
f sy f
kiishle,
pjacing the
k tu mo tre
relityilluss old.e at
es m rec
es po
ruitvectrat
ún ensuuadrr pe
d toors d in th
arrileales do. Posca qu
uería deafeada
l OPcta e
Oron
n el r
. lo
e
Cas cu
dapecadro supe
rees
cua de
dro ilustra un prom larior es
edin e
o dl t
e ítu m
12lo dor
vece c
tali eda indicada
medio de las e
str un pro
IATTC-73-04 Tunas and billfishes in the EPO 65

not
me
da m
FIGUREduring 1areas betFIGURAdurante sombreapesca.
C-4. Biom975-2004ween the C-4. Tra
1975-200das entre
a o exploited (d a cted e st tw e fishery impact attributed a i g thod.
yectoria de la biomasa de una población simulada de atún barrilete no explotada 4 (línea de trazos) y la que predic modelo de evaluación (línea sólida). Las áreas las i a a étodo de
ss td l
nes show the portions of th
s lí
rajine)
ectorynd
o tha
f at p
siredi
mulated p by th
pulatioock
n as
of ses
skism
pjaen
ck t model (solid line). The shaded
tuna
to e
atr
that
ch f
buid
was
shin
a c
asheo li
e el ddo neas represantan la porción el impacto de la pesca
a in th limit
BR) eprese
FIGUREfrom theestimateFIGURbarrileteintervale
C-5. Estim monotonic s. A C-5. Ser en el OPOs de confian
ated time series of spawning biomass ratios (SBR i n e EPO, selectivity assessment. The shaded area represents the 95% confidence s of the
i de o de atún , de la d nta los za de 95% de las estimaciones.
s) for sk
eproda som
pjack
uctobrea
tu
ra (Sda r
es tie ev
mpal
o uac
estión
im d
adae s
s dele
e cti
los cvida
cie mo
nteno
s dtón
e ica
bio.
maEl
sa ráre
IATTC-73-04 Tunas and billfishes in the EPO 66

D.
Th
e b y
aj t is c , se h tu ld per h im s y MSY).
uc d h-at-length analysis, A-SCALA, was used t se bige a c ea PO). The analysis method is described in IATTC Bulletin, Vol. 22, No. 5, an ae d t at ort for technical details. The stock ass s are available on th b w tt
BIGEYE T
re have
UNA
een substantial changes in the bigeye tuna fishery in recent yethe
ar ex
s (pa
Figns
urion
e D of
-1 th
). e F
IniA
tiallD fThe
ax
e ed ree IA
, theheryFAD
um
sternders TTC
msinfissu
AnPaarwe
ority ofe 1993ery captainable
age-strific Ocreferre site,
he bthe presield
turen (Eo thw.ia
igeye catch was made caught by longline vessels. With ur
sm (A
-seer
inebig
fisheryey
has taken an increasing co h
m yie
ponent of the bigeye catch.e a
e mall e, and as therefore reduced the recruit and t verag
catc o as ss ye tuna in th
repc.org
essment detailw .
g d u across the Pacific Ocean, but the bulk of the catch is r c e bigeye tuna are substantially lower close to the 150ºW EPO boundary ( r -
e more continuous, but show lower levels between 160ºW 0º (Figure A-4). a ow large movements (95% of tagged bigeye moved less than 1000 m ),
or n icates little exc D . si longline catch per unit of effort (CPUE) trends differing among areas. It is likely is n l a m w e m ses of a on a Pacific-wide basis. In addition, analyses have shown that the results are insensitive to the ct of the analysis. Currently, there are not enough tagging data to provide adequate f mo
uts i ss e ch and length-freq ta e purse-seine and pole-and-line v ated to include new data for 2004 and revised data for 2000-2003. Effoei pole-and-line fisher75 onthly reporti, p sional 2004 catch data for Japan and the Republic of Korea and partial catch dns at ata for the Japanese longline fisheries have been updated for 1999 203 atch data for the longline fisheries of Chinese Taipei have been updated or atch data for the in e data for 2003 and revised data for 2001 and 2002. Lon e catch-at-le00 ved d zation of CPUE have been updated to include data for 2002, and raw w se
ty ly ui ent rela.
b im m hing m th s a ire a e fie s
imecruinot operlow-ost recent recruitm certain, due to the fact that recently-recruited b
BiPu3); lBigecurrThisthatleveconsbigespatestim
Sevstudfishthe dataasseothedatanewupdfor habieffo
A sasse
Thebigeold incrcatc
Theestibigea pe200
eye arese-seineonglinye tun
ent inf is con
there l. Theistent ye tunial stru
ates o
eral inpies haveries hapurse-s for 19ssmentr natio for 20 data fated to2001-2tat-basrt data
ensitivissment
re haveye tunhas incease inh bigey
re are sevmates of rye, were riod of be2. The m
istribatch
catcdo
matiostenta cossessith th
ure
ted s of
made in the east and west.Figu
ilesure
at a
aly
rt datd revme ofata fo and to incave bngth statiscatch
hip in
that calf y-3). eries
-4). Ftch slowe2001igeye
e A
and-2)
loca
a for ised the
r the new lude een
data tical and
the
atch ears The that
irst, mall d by and are
he not
s are sh
and 18
indwith
hange between the eastern and western Pacific Ocean (Fig
tinen
uout r
s ep
stoort
cked
thhe
roure
gh is
ou co
t tnd
heuc
Pated
ci a
fics i
Of t
ceahe
n,re
wwe
ithre
ex a
chsin
angl
gee
ofsto
inck
div in
id th
uae EPO, to be
ls
anagement of the stock. Its results are consistent with results of other an
vemen
nto thi
t b
s a
etwe
es
en
sm
the
ent
ea
d
ste
iffer fro
rn and w
m that
este
for 2003. New results fr
rn Pacific.
om recent age and growthbeen incorporated. Cat
e bene -200rovi. C ad 20clud2 ha stanere u
ana
een n thaseverag in as
eral
uency da for then
and 3
updies have beenof
updated fo
to lon
igli
nclude new dne
ata for 20ov
04 the
an ti. M ng catch data r the fishery pr ided, at
ch d. C
-200ded02. C
new longline fisheries of the People’s Republ
glinic of China h
e bardid t
een updated and new data for 2003 added. Longline effort data based on
o e
w
xt
as p
end
e
th
rfo
e t
rm
im
ed
e series to the second quarter
th
of 200
s
4.
k-sis at investigated including a toc recr tm tions
portant changes in the a ounts of fis ortality caused by e fisheriee E
d sP
ubsO. tan
Otia
n ally
ve si
ragnc
e, te 19
he9
fi3, a
shin
ngd t
mhat
ort of
ali old
ty e
of r fi
bigsh
ey ha
e s i
lesncr
s thea
ansed s
aboulightly
t fou (F
r aig
ndur
a he D
shinatio
g n
mowi
rtath
litflo
y oati
n ng
theob
yojec
unts.
ge
r fish was caused by the expansion of the fishoci
ptme
ortnt
antbe
fefor
atue 1
re99
s in3 a
thre
e ve
estry
imun
atecer
d ttai
imn,
e sas
erithe
es fl
of oat
biging
ey-o
e rbje
ecct
ruifis
tmhe
entrie
(Fs, w
ighureich
D ca
atinrag
g.e
Trec
heru
re itmen
waent i
s at ins v
p 1er
erio99y un
d 9-2
of00
ab0.
ov T
e-ahe
ve re
ragcru
e ritm
ecen
ruits
tm we
enre
t in ab
1ov
994e a
-1ve
99ra
8, ge
folin ave
IATTC-73-04 Tunas and billfishes in the EPO 67

represented in only a few length-frequency data sets. The extended period of relatively large recruitments in 1995 to 1998 coincided with the expansion of the fisheries that catch bigeye in association with
est level by the end of 2005 (Figure D-5). There has been an accelerated decline in biomass since peak in 2000 ing morta tes that, e the expan ing on floatin pu
ne ry ad h g r i o t as ngl sh
re s cru t a he ed ev s nd t d ore no
the n e s ing a PO u l ) wli m n ev t tha e t ti at rr nm io o ner he nce B s ted ab, 1% lev rr di e um el M
h nd r nc tand v t Th ateu nf e is le than e es 2 ev ss s
di w i cl w v
im th r R p c occ n - d BR lyai t v spo g t AM les ta re
uc cr n ter t av lev s (F e
av wei o the c h o fish o d su 993 and 19 h in th r le ince n. T sp patt m issf ro ield-per-recruit perspective.
he ase s ecen tche e es d ou a A Ta). hing mo is pro rtional to f c pa of ecc re maintained, the level of ng o th SY ou f n -20 e ffor ec ng p le ld e
g- erag ie bou ou s al st a. The AMS f in the EP ld i - s ty
ilar to that for the longline fishery pe u tc g do xp flo - fi a d 3 Y r nre Y a g mo it les t Y e D
a cons gest st 0 g ss el lere g to (Tab - S he fish g mortality (F ultiplier are sen iv ssme m pa erize the at are included the a essme and the ri
sumed to represent average fishing mortality, but under all scenarios considered, fishing mortality is ng to the AMSY.
The estimates of recruitment and biomass were only moderately sensitive to the steepness of the stock-recruitment relationship. The current status and future projections are considerably more pessimistic, in terms of stock status, if a stock-recruitment relationship (h = 0.75) exists.
The effects of Resolution C-04-09
floating objects.
Fishing has reduced the total biomass of bigeye present in the EPO, and it is predicted that it will be near its lowthe
c. Analysis of the levels of fish lity associated with each fishery indica
sinsei
sion of the purse-seine fish g objects in the early to mid-1990s, the rse- fishe has h a muc reate mpact n the stock han h the lo ine fi ery.
The lation hip between re itmtheref
en nd t environmental index us in pr ious as essments was fou o be not significant, an was t used in the analysis.
At begin ing of 2005, th pawn biom ss of bigeye tuna in the E (Fig re D-6; arge dot as dec ning fro a rece t high l el. A t tim he spawning biomass ra o (the r io of cu ent spaw ing bio ass to b mass f spaw s in t abse of fishing mortality; S R) wa estima to be out
SY), 0.13 about 4 less than the el co espon ng to th average maxim sustainable yi d (SBRA
wit lower a uppe confide e limits (±2 s ard de iations) of abou 0.08 and 0.18. e estim of the pper co idenc bound ss th timate of SBRAMSY (0. 1). Pr ious a essment had pre cted that the spa ning b omass would de ine belo the SBRAMSY le el.
Est ates of e ave age SB roje ted to ur duri g 2005 2010 in icate that the S is like to rem n
ed or re below h
uitmee le el corre ndin o the SY for many years un s fishing mor lity is g atly
red t is grea han erage els for a number of year igur D-7).
The erage ght f fish in atc f all eries c mbined eclined bstantially in 1 94, and as rema ed at at lowe vel s the he recent age- ecific ern of fishing ortality not sati actory f m a y
In t base c asse sment, r t ca s ar timate to have been ab turrent
5% bove the MSY ( ble D-1 If fis rtality po ishing effort, and the tterns age-sp ific sele tivity a fishi effort c rresponding to e AM is ab t 57% o the rece t (2002 03) l vel of e t
t 11%. D reasi t
ld increhe effort to 57% of its resent vel wou increas the
lon term av e y ld by a aO cou
nd w ase the pawning potenti of the ock by bwere
out 69% Y o bigeye be max mized if the age specific electivi patternsim that o rates south of 15°N beca se it ca hes lar e
eater thar indivi u
the als.
Bef re the e ansion of the ating object shery th t starte in 199 , AMS was gcur nt AMS nd the fishin rtal y was s than that corresponding o AMS (Figur -8).
All nalyses idered sug that at the art of 2 05 the spawnin bioma was b ow the vel cor spondin the AMSY le D 1). AM Y and t in ) m sit e to how the asse nt odel is ramet d, data th in ss nt, pe ods aswell above the level correspondi
are estimated to be insufficient to allow the stock to rebuild. If the effort is reduced to levels corresponding to AMSY, the stock will rebuild to SBRAMSY within the 5-year projection period.
Summary:
1. Recent fishing mortality levels are 75% greater than those corresponding to the AMSY.
IATTC-73-04 Tunas and billfishes in the EPO 68

2. As a consequence, if fishing effort is not reduced, total biomass and spawning biomass will remain around the lowest levels observed during the period modelled (1975-2005).
3. The current status and future projections are considerably more pessimistic in terms of stock status if a stock-recruitment relationship (h = 0.75) exists.
4. These conclusions are robust to the alternative mrev
odel and data formulations considered in this and p ious analyses.
F E D l cat (re atc disca r the purse-sei sh d catches for the longline f ies ey the rn P Ocea 5 sedstock assessment. Purse- ca r 2 are based o ding th 99on unloadin adju o a fo dentifi n, ose f 00 n co tion ng.
F A D turas s (c r más rtes sq d y cre s d querí an a do en el Océano Pacífico o l, 4en alu la po ón pt ueras d 975 se ba d dela 93 dato es justado ara toma n cuent entifica nes inco ctde 2000-200 muestre e c ión por pecies. captura alangre de 1975 002
portadas a la CIAT por los gobiernos, y las de 2003 son predichas por el modelo con base en el nivel de fuerzo de 2002 y estimaciones de la biomasa vulnerable a los palangres en 2003.
IGUR -1. Tota ches tained c hes plus reds) fo ne fi eries, an retained
ishereine
, of bigtches fo
e tuna in1975-199
aste acific n unloa
n, 197data,
-2004, uose for 1
in the 3-1999 s
sted tg data ccount r mis-in catio and th or 20 -2004 o species mposi sampli
IGUR -1. Cap totale apturas etenidas desca ) de las pe uerías e cerco apturas tenida e las pes as pal greras de tún patu rienta 1975-200 , usadas la ev ación de blaci . Las ca uras cerq e 1 -1992 san en atos de scargas, s de 19 -1999 en s de d cargas ad s p r e a id cio rre as, y las
4 en el o d omposic es Las s p ras -2 son la rees
IATTC-73-04 Tunas and billfishes in the EPO 69

U . U zamientos de más de 1000 mn de atunes patudo marcados en el Océano Pacífico.
FIGFIG
RE DRA D
-2. -2. D
Moe
vespla
ments of more than 1000 nm of tagged bigeye tuna in the Pacific Ocean
-3. ruited to the the E vectors that fish in the range of ages indicated in the title of each panel. For example, the trend illustrated
p quarters old. atún patudo
es ías del OPO. Cada recuadro ilustra un promedio de cuatro vectores trimestrales de or pesca afectaron los peces de la edad indicada en el título de cada recuadro. Por endencia trada e recuadr perior i erdo es edio de las mortalidades por ectaron a peces de entre 1-4 trimestres de edad.
FIGUfisheraffectin theFIGUreclutmortaejemppesca
RE Dies of ed the upper-RA Dado a llidad plo, la t que af
TimPO
e s. E
eriac
es h
of pan
aveel
ragillu
e str
totate
al s a
annn
uaaver
l fiag
shie
ngof
mfou
ortar a
litnn
y oual
n fi
bigshi
eyeng
tumo
narta
reclity
left -3.as p
ane Serie
quer
l iss d
ane
avetie
ramp
ge o
of de
the fla
ismo
hinrta
g mlid
ortad
al po
itier
s thpes
at aca
ftri
fectme
ed stra
fishl t
tota
hat l m
weedia
re 1-4 de
que ilus n el o su zqui un prom
IATTC-73-04 Tunas and billfishes in the EPO 70

FIG D-4. Es ed rec t of big a to es of th . The estim s are scaled so that the e ate of v cruitment is equal to 1.0. The bold line illustrates the maximum likelihood estimate recru nd the areas the approximate 95% confidence intervals around thos stimateFIG D-4. Reclutamiento estimado de atudo querías O. Se es n las esti es para que la estim e recluta virge a a 1,0. ea gruesa i ra las esti es de rec miento de verosimili ima, y sombrea ca los intervalos de confianza de 95% aproximados de esas estima
URE timat ruitmen eye tun the fisheri e EPO atestims
irgin re of itment, a
s shaded indicates
. e eURA atún p a las pes del OP cala
lumacion ación d miento n equivalg La lín stmacion luta tud máx el área da indi
ciones.
IATTC-73-04 Tunas and billfishes in the EPO 71

FIG -5. Biomass trajectory of a sim na that was not exploited during 1975- (dashed line) and that pre lid line). The shaded areas betw e two how th s of the impac d to ea y. FIG D-5. oria de sa de u ación de atún no explo rante 197 (líne razos) e pred odel luación sólida). áreas som s ent os líne imp a pesca a a cad o de pes
URE D2004
ulated population of bigeye tudicted by the stock assessment model (so
een th lines s e portion fishery t attribute ch fisherURA Trayect la bioma na pobl simulada patudo tada du
5-2004 a de t y la qu ice el m o de eva (línea Las breada re las d as señalan la porción del acto de l atribuid a métod
ca.
IATTC-73-04 Tunas and billfishes in the EPO 72

FIGURE D-6. Estimated time series of spawning biomass ratios (SBRs) for bigeye tuna in the EPO. The dashed horizontal line (at about 0.21) identifies the SBR at AMSY. The solid line illustrates the maximum likelihood estimates, and the shaded areas are 95% confidence intervals around those estimates. The estimates after 2005 (the large dot) indicate the SBR predicted to occur if effort continues at the average of that observed in 2004, catchability (with effort deviates) continues at the average for 2002 and 2003 (except for the northern longline fishery, for which the data for 2001-2002 are used), and average environmental conditions occur during the next 5 years. FIGURA D-6. Serie de tiempo estimada de los cocientes de biomasa reproductora (SBR) para el atún patudo en el OPO. La línea de trazos horizontal (en aproximadamente 0.21) identifica el SBR en RMSP. La línea sólida ilustra las estimaciones de verosimilitud máxima, y el área sombreada representa los intervalos de confianza de 95% alrededor de esas estimaciones. Las estimaciones a partir de 2005 (el punto grande) señalan el the SBR predicho si el esfuerzo continúa en el nivel observado en 2004, la capturabilidad (con desvíos de esfuerzo) continúa en el promedio de 2002 y 2003 (con excepción de la pesquería palangre del norte, para la cual se utiliza los datos de 2001-2002), y con condiciones ambientales promedio en los 5 próximos años.
IATTC-73-04 Tunas and billfishes in the EPO 73

. Predicted catches of bigeye for the purse-seine and pole-and l) and
(lowe tchability focept for the northern longl fi h the data for 2001-20 haded
t 95% confidence intervals for the predictions of future catches. the vertical p-7. Capturas predicha e ara las d cuadro
y ferior), basadas en el esfuerzo promedio d de 2002 y
20 ciones futuras. Nótese que las esc
FIlon20arescFIsuprdede
GUREgline
03 (exas re
ales oGURperior)omedio 2001- captu
D-7 -line (upper paner 2002 and he s
(re
edic
r panel) fisheries, based on average effort for 2004 and average caine shery, for whic 02 ar
Note thate used). T
pref theA D
senanels are different.
s d atún patudo p pesquerías e cerce 2004
o y yde la capturabilidad
caña palangreras (recuadro in
2003 (con z
excepción br
depr
as v
la pesquería palangre del sur, para la cual eseer
se utiliza los datos a l02). Las onas som eadas re
alntatica
n les
int d
erve lo
alos r
s dec
e uad
conro
fias s
nzon
a d dif
e er
95ent
% es.
par
as prras
IATTC-73-04 Tunas and billfishes in the EPO 74

FIGU 004 d the change (increase or redu n the effort required to produce the AMSY (lower panel), esti ed separately for each year using the average age-specif mortality for that year. FIGU y cam (aumento o reducción) del esfue a produ SP (recuadro inferior), estimado separado para cada año, usando pesca por edad de ese año.
RE D-8. AMSY (upper panel), 1975-2 , an ction) imat
ic fishing RA D-8. RMSP (recuadro superior) bio rzo necesario parcir el RMpromedio
por la mortalidad por
IATTC-73-04 Tunas and billfishes in the EPO 75

TABL stimates of the AMSY and its asso quantities for the base case assessment and the sensitivity analysis including a stock-recruitment re h a steepness (h) of 0.7.5. All analyses are based on average fishing mortality for 2002 and 03. B2005, BAMSY, and B0 are the biomass of bigeye + years old at the start of 2005, at AMSY, and without fishing, respectively, and S2005, SAMSY, and S0 are
the female spawning biomass at the start of 2005, at AMSY, and without fishing, respectively. C2004 is the estimated total catch in 2004. TABLA D-1. Estimaciones del RMSP y sus valores asociados para la evaluación del caso base y el análisis de sensibilidad que incluye una relación población-reclutamiento con una inclinación (h) de 0.75. Todos los análisis se basan en la mortalidad por pesca media de 2002 y 2003. B2005, BRMSP, y B0 son la biomasa de patudo de edad 1+ años al principio de 2005, en RMSP, y sin pesca, respectivamente, y S2005, SRMSP, y S0 son la biomasa reproductora de hembras al principio de 2005, en RMSP, y sin pesca, respectivamente. C2004 es la captura total estimada en 2004.
Base case Steepness = 0.75
E D-1. E ciatedlationship wit 20
1
Caso base Inclinación = 0.75 AMSY—RMSP 95572 91270 BAMSY—BRMSP 292504 462975 SAMSY—SRMSP 482 879 BAMSY/B0—BRMSP/B0 0.29 0.36 SAMSY/S0—SRMSP/S0 0.21 0.30 C2004/AMSY—C2004/RMSP 1.05 1.13 B2005/BAMSY—B2005/BRMSP 0.76 0.54 S2005/SAMSY—S2005/SRMSP 0.59 0.41 F multiplier—Multiplicador de F 0.57 0.41
IATTC-73-04 Tunas and billfishes in the EPO 76

E. PACIFIC BLUEFIN TUNA
Tagging studies have shown that there is exchange of Pacific bluefin between the eastern and western Pacific Ocean. Larval, postlarval, and early juvenile bluefin have been caught in the western Pacific Ocean (WPO), but not the eastern Pacific Ocean (EPO), so it is likely that there is a single stock of bluefin in the Pacific Ocean.
Most of the catches of bluefin in the EPO are taken by purse seiners. Nearly all of the purse-seine catch is made west of Baja California and California, within about 100 nautical miles of the coast, between about 23°N and 35°N. In recent years a considerable portion of the purse-seine catch of bluefin has been transported to holding pens, where the fish are held for fattening and later sale as sashimi-grade fish. Les ounts of bluefin are caught by ine gear. Bluefin have beduring every month of the year, but most of the fish are taken during May through Oc
B xplo various gears in the WPO from aiwan okkaid Age-0 fish abocm in length are caught by trolling during July-O oku Island and south of Shizuoka Prefecture. During November-April age-0 fish about 35 tr ing sou west of Kyushu Island. Age- nd ol ght ostly during May-Sep , betw bout 30° N and 0°-15 E. Bluefin of various sizes are also caught by traps, gillnets, and oth , especia n the Sea of Japan. Sm mounts of bluef re also ght nea soucoast of Japan by l ining.
The high-seas longline fisheries are d mainly at t ical tu , albaco and bill es, bu am acific bluefin are caught by these fisheries. Small amounts of uefin are so ca Japanese pole-and vessel n the h seas
Tagging studies, conducted with conventional a archiv tags, ha reveale great de f inf abo life hist of bluefin. As stated above, it a ears tha pawnin ccurs o the WPO. Some fish appare the WPO, whil others m ate to the EPO. These mig begin ly, or perhaps entirely, during the first and second years of life. The first- and sec ar migrants are exp ed to rious fisheries before beginning the y e EPmigrants, after crossing the ocean, are posed commercial and r reationa heries o alifo Baja California. Eventually, t survi rs retur o the W .
st o found in the EPO in wa wher sea-s ce tem tures (SSTs) are between Fis to 31 cm in l th are nd in t WPO waters w re the SS are between al o arval d earl enile fin is oubte rongly influenced by the
environment. Cond ions in the WPO ile fish there tha move al e timing of these movements. e, on P ly inf e re of the veni to t PO.
ance f blu in O en at n is e tirely e IATTC has calculated “habitat” and “bluefin-vessel” indices for the EPO routinely for
several years.
A preliminary cohort analysis has indicated that the biomass of the spawning stock was relatively high during the 1960s, decreased during the 1970s and 1980s, and then increased during the 1990s. The recruitment was estimated to be highly variable, with four or five strong cohorts produced during the 1960-1998 period.
The total catches of bluefin have fluctuated considerably during the last 50 years (Figure E-1). The presence of consecutive years of above-average catches (mid-1950s to mid-1960s) and below-average catches (early 1980s to early 1990s) could be due to consecutive years of above-average and below-average recruitment. The results of yield-per-recruit and cohort analyses indicate that greater catches could be obtained if the catches of age-0 and age-1 fish were reduced or eliminated.
ser am recreational, gillnet, and longl en caught tober.
luefin are e ited by T to H o. ut 15 to 30 ctober south of Shik
to 60 cm in length are taken by oll th and1 a der fish are cau by purse seining, m tember
een a -42° 14 2°er gear lly i all a in a cau r the theastern
ongl
irected rop nas re, fish t smallounts of P bl al ught by
-line s o hig .
nd al ve d a g
al on
ormationut the ory pp t s o ly in
ntly remain their entire lives in e igrrations most
ond-ye os va ir journel
to th O. The rex to ec fis ff C nia and
he vo n t PO
Bluefin are mo ften ters e the urfa pera17° and 23°C. 24° and 29°C.
h 15 eng fou he in he TsThe surviv f l an y juv blue und dly st
it probably influence the portions of the juven t to the EPO, and
hso th Likewis conditi s in the E O probab luence
the timing of t turn ju le fish he W
Various indices satisfactory. Th
of abund o efin the EP have be calcul ed, but no e of these n
IATTC-73-04 Tunas and billfishes in the EPO 77

Spawner-recruit analyses do not indicate that the recruitment of Pacific bluefin could be increased by permitting more fish to spawn.
FIGURE E-1. Retained catches of Pacific bluefin, 195 02.
. 2-20
FIGURA E-1. Capturas retenidas de aleta azul del Pacífico, 1952-2002
IATTC-73-04 Tunas and billfishes in the EPO 78

F. ALBACORE TUNA
Most scientists who have studied albacore in the Pacific Ocean have concluded that there are two stocks, one occurring in the northern hemisphere and the other in the southern hemisphere. Albacore are caught
ls in the western North Pacific. In the North Pa 2% of the fish are taken in surface fisheries that catch smaller, yo bacore, whereas onl of the a caugh h Pacific are
Total an atches of re from Pacific d in 1976 at about 125,000 t, and then clined. Ca recovere the 1990 reached t in 1999 (Figure F-1a). In the South acific, ann tches ha ed betwee t 25,000 and 55,000 t since 1980 (Figure F-1b).
The juveniles and a lts are cau ostly in t oshio Cur he North Transition Zone, and the California rrent in t rth Pacif the Subtr Converg one in the South Pacific, but spawni occurs in l and sub l waters, ng aroun and 20ºS latitude. North Pacific albacore are believ pawn be rch an the wes central Pacific.
The movements of North Pacifi core are influen oceanic conditions, and migrating albacore tend to concentrate alon nic fron he great majority are caught in waters between 15º and 19.5º C. Details of the mi remain unclear, but juvenile fish (2- to 5-year-olds) believed t e into the n Pacific i pring and to the western and central Pacific, perhaps an in the late fall and winter, and tending to remain
ere as they mature. It has been hypothesized that there are two subgroups of North Pacific albacore, separated at 40ºN in the EPO, with the northern subgroup more likely to migrate to the western and central Pacific Ocean.
Less is known about the movements of albacore in the South Pacific Ocean. The juveniles move southward from the tropics when they are about 35 cm long, and then eastward along the Subtropical Convergence Zone to about 130°W. When the fish approach maturity they return to the tropics, where they spawn. Recoveries of tagged fish released in areas east of 155°W were usually made at locations to the east and north of the release site, whereas those of fish released west of 155°W were usually made at locations to the west and north of the release site.
New age-structured stock assessments were presented for the South and North Pacific stocks of albacore in 2003 and 2004, respectively.
The South Pacific assessment, carried out with MULTIFAN-CL by the Secretariat for the Pacific Community, incorporated catch and effort, length-frequency, and tagging data. The stock was estimated to be well above the level that would produce the average maximum sustainable yield (AMSY), and that yield would continue to increase with further increases in effort, though the extent to which yield could increase sustainably is not well determined. Although the recent recruitments are estimated to be slightly below average, there currently appears to be no need to restrict the fisheries for albacore in the South Pacific Ocean.
Virtual population analyses of the North Pacific stock of albacore were carried out during the 19th North Pacific Albacore Workshop in 2004. The estimated 2004 biomass, 438,000 t (Figure F-2), was about 25% greater than that estimated for 1975, the first year of the period modeled. The estimated recruitments since 1990 have generally been greater than those of the 1980s, and the catches per unit effort for most of the surface fisheries have increased in recent years. However, longline catch rates have declined since the mid-1990s. The Workshop estimated low (0.43) and high (0.68) levels for fishing mortality (F) at full recruitment, and noted that if rates of F continue at assumed levels, it is unlikely that the spawning stock biomass (SSB) will rebuild to SSBAMSY levels within a 5-year time period.
The 2005 meeting of the International Scientific Committee of the North Pacific gave the following advice:
by longliners in most of the North and South Pacific, but not often between about 10°N and 5°S, by trollers in the eastern and central North Pacific and the central South Pacific, and by pole-and-line vesse
cific about 6y about 10%unger al lbacore
the North t in the Sout
taken by surface gears. nual c d during
albaco peake121,500 de tches s, and
P ual ca ve rang n abou
du ght m he Kur rent, t PacificCu he No ic and opical ence Z
ng tropica tropica centeri d 20ºNed to s tween Ma d July in tern and
c alba strongly ced by g ocea ts in the North Pacific Transition Zone. T
gration are o mov easter n the s early summer, returning
nually, th
IATTC-73-04 Tunas and billfishes in the EPO 79

“Future SSB can be maintained at or above the minimum ‘observed’ SSB (43,000 t in 1977) with
ed to maintain SSB at or above the 25th percentile threshold.”
F’s slightly higher than the current F range. However, the lowest ‘observed’ SSB estimates all occurred in late 1970’s and may be the least reliable estimates of SSB. A more robust SSB threshold could be based on the lower 10th or 25th percentile of ‘observed’ SSB. If so done, current F should maintain SSB at or above the 10th percentile threshold but a modest reduction from current F may be need
The IATTC staff considers the higher level for current fishing mortality (0.68) to be more likely, based on the methods used to calculate the estimates. Furthermore, even the high estimate may be too low, given the retrospective bias shown by the model. According to North Pacific Albacore Workshop estimates, the higher fishing mortality of 0.68 implies an equilibrium spawning stock biomass at 17% of unfished levels. Projections assuming fishing mortality of 0.68, under low and high scenarios of future recruitment, suggest that the biomass may decline if current levels of fishing mortality persist.
FIGURE F-1a. Retained catches of North Pacific albacore, 1950-2003. FIGURA F-1a. Capturas retenidas de albacora del Pacífico norte, 1950-2003.
FIGURE F-1b. Retained catches of South Pacific albacore, 1950-2003. FIGURA F-1b. Capturas retenidas de albacora del Pacífico sur, 1950-2003.
IATTC-73-04 Tunas and billfishes in the EPO 80

FIGURE F-2. Time series of total biomass (B) and spawning stock biomass (SSB) of North Pacific albacore tuna, in metric tons, from the North Pacific Albacore Workshop analyses in 2004 and 2002. Time series for B are based on January 1 estimates, and for SSB on estimates at the beginning of the spawning season ('mid-year'). FIGURA F-2. Serie de tiempo de la biomasa total (B) y biomasa de la población reproductora (SSB) del atún albacora del Pacífico Norte, en toneladas métricas, de los análisis de la Reunión Técnica sobre el Albacora del Pacífico Norte en 2004 y 2002. Las series de tiempo B se basan en estimaciones al 1 de enero, aquéllas de SSB en estimaciones al principio de la temporada de desove ('medio año').
IATTC-73-04 Tunas and billfishes in the EPO 81

G. SWORDFISH
Swcaught isphere nations. Lesser amounts are take men. During the most recent three-year period the greatest catches in the EPO have been taken by vessels of Spain, Chile, and Japan, which together harvested about 72% of the total swordfish catch taken in the region. Of these three, Spain and Chile have fisheries that target swordfish, while swordfish taken in the Japanese fishery are incidental catches in a fishery that predominately targets bigeye tuna. Other States with fisheries known to target swordfish are Mexico and the United States.
Swordfish reach maturity at about 5 to 6 years of age, when they are about 150 to 170 cm in length. They probably spawn more than once per season. Unequal sex ratios occur frequently. For fish greater than 170 cm in length, the proportion of females increases with increasing length.
Only fragmentary data are available on the movements of swordfish. They tend to inhabit waters further below the surface during the day than at night.
Swordfish tend to inhabit frontal zones. Several of these occur in the eastern Pacific Ocean (EPO), including areas off California and Baja California, off Ecuador, Peru, and Chile, and in the equatorial Pacific. Swordfish tolerate temperatures of about 5° to 27°C, but their optimum range is about 18° to 22°C. Swordfish larvae have been found only at temperatures exceeding 24°C.
It is considered, based on fisheries data, that there are two stocks of swordfish in the EPO, one with its center of distribution in the southeastern Pacific Ocean, and another with its center of distribution off California and Baja California. As well, there may be movement of a northwestern Pacific stock of swordfish into the EPO at various times. Results of genetic studies specifically undertaken to help resolve the question of stock structure are expected to be completed within the next few months.
Results of preliminary modeling with MULTIFAN-CL of a North Pacific swordfish stock in areas north of 10°N and west of 135°W indicate that in recent years the biomass level has been stable and well above 50% of the unexploited levels of stock biomass, implying that swordfish are not overexploited at current levels of fishing effort.
The standardized catch rates (CPUEs) of longline fisheries in the northern and southern regions of the
these considerations, and the historically stable catches, it appears that swordfish are not
thern region have doubled during this period, reaching 13,300 t in 2002, which exceeded the previously-recorded high catch of 12,400 t reported in 1991. At some point it would be a normal expectation that high levels of catch maintained over a period of time will result in reductions in CPUE.
ordfish (Xiphias gladius) occur throughout the Pacific Ocean between about 50°N and 50°S. They are mostly by the longline fisheries of Far East and Western Hem
n by gillnet and harpoon fisheries. They are seldom caught by recreational fisher
EPO and trends in relative abundance obtained from them do not indicate declining abundances. Attempts to fit production models to the data failed to produce estimates of management parameters, such as average maximum sustained yield, under reasonable assumptions of natural mortality rates, due to lack of contrast in the trends. This lack of contrast suggests that the fisheries that have been taking swordfish in these regions have not been of a magnitude sufficient to cause significant responses in the populations. Based onoverfished in the northern and southern regions of the EPO.
However, there have been increases in operations of and catches (Figure G-1) from fisheries that are targeting swordfish, particularly those gillnet and longline fisheries previously noted, and the stocks should be monitored closely for changes in trends in catch and catch rates. The average annual catch during 1998-2002 for the northern region has been about 4,800 t, and for the southern region about 9,100 t. It should be noted that catches in the sou
IATTC-73-04 Tunas and billfishes in the EPO 82

FIGURE G-1. Retained catches of swordfish in the eastern Pacific Ocean, 1975-2003, by gear type. FIGURA G-1. Capturas retenidas de pez espada en del Océano Pacífico oriental, 1975-2003, por arte de pesca.
IATTC-73-04 Tunas and billfishes in the EPO 83

H. BLUE MARLIN
The best knowledge currently available indicates that blue marlin (Makaira nigricans) constitutes a single world-wide species and that there is a single stock of blue marlin in the Pacific Ocean. For this reason, statistics on catches (Figure H-1) are compiled, and analyses of stock status are made, for the entire Pacific Ocean, even though it is important to know how catches in the eastern Pacific Ocean (Figure H-2) vary over time.
Blue marlin are taken by longline vessels of many nations that fish for tunas and billfishes between about 50°N and 50°S. Lesser amounts are taken by recreational fisheries and by various commercial surface fisheries.
Small numbers of blue marlin have been tagged, mostly by recreational fishermen, with conventional tags. A few of these fish have been recaptured long distances from the locations of release. In addition, blue marlin have been tagged with acoustic tags and their activities monitored for short periods.
Blue marlin usually inhabit regions where the sea-surface temperatures (SSTs) are greater than 24°C, and they spend about 90% of their time at depths in which the temperatures are within 1° to 2° of the SSTs.
The Deriso-Schnute delay-difference population dynamics model, a form of production model, was used to assess the status of the blue marlin stock in the Pacific Ocean. Data for the estimated annual total retained catches for 1951-1997 and standardized catch rates developed from catch and nominal fishing effort data for the Japanese longline fishery for 1955-1997 were used. It was concluded that the levels of biomass and fishing effort were near those required to maintain the average maximum sustainable yield (AMSY).
A more recent analysis, using MULTIFAN-CL, was conducted to assess the blue marlin stocks in the Pacific Ocean and to evaluate the efficacy of habitat-based standardization of longline effort. There is
l harvest.
considerable uncertainty regarding the levels of fishing effort that would produce the AMSY. However, it was determined that blue marlin in the Pacific Ocean are close to fully exploited, i.e. that the population is near the top of the yield curve. It was also found that standardization of effort, using a habitat-based model, allowed estimation of parameters within reasonable bounds and with reduced confidence intervals about the estimates.
The fisheries in the EPO have historically captured about 10 to 18% of the total harvest of blue marlin from the Pacific Ocean, with captures in the most recent 5-year period averaging about 3,800 t, or 10% of the tota
IATTC-73-04 Tunas and billfishes in the EPO 84

FIGURE H-1. Retained catches of blue marlin in the Pacific Ocean, 1962-2002. FIGURA H-1. Capturas retenidas de marlín azul en el Océano Pacífico, 1962-2002.
FIGURE H-2. Retained catches of blue marlin in the eastern Pacific Ocean, 1975-2003, by gear type. FIGURA H-2. Capturas retenidas de marlín azul en el Océano Pacífico oriental, 1975-2003, por arte de pesca.
IATTC-73-04 Tunas and billfishes in the EPO 85

I. STRIPED MARLIN
Striped marlin (Tetrapturus audax) occur throughout the Pacific Ocean between about 45°N and 45°S. They are caught mostly by the longline fisheries of Far East and Western Hemisphere nations. Lesser amounts are caught by recreational, gillnet, and other fisheries. During recent years the greatest catches (Figure I-1) in the eastern Pacific Ocean (EPO) have been taken by fisheries of Costa Rica, Japan, and the Republic of Korea.
Striped marlin reach maturity when they are about 140 cm long, and spawning occurs in widely-scattered areas of the Pacific Ocean.
The stock structure of striped marlin in the Pacific Ocean is not well known. There are indications that there is only limited exchange of striped marlin between the EPO and the central and western Pacific Ocean, so it is considered in this report that examinations of local depletions and independent assessments of the striped marlin of the EPO are meaningful. An analysis of trends in catch rates in subareas suggest that the fish in the EPO consist of one stock. Genetic studies have suggested that there are separate populations in the eastern and western South Pacific and that there may be a separate populations with centers of distribution in the regions proximate to Hawaii in the north-central Pacific and to Ecuador and to Mexico in the EPO. However, preliminary results of more recent analyses suggest that the fish in the Ecuador and Mexico region are from a single population.
Few tagging data are available for striped marlin. Most recaptures of tagged fish released off the tip of the Baja California peninsula have been made in the general area of release, but some have been recaptured around the Revillagigedo Islands, a few around Hawaii, and one near Norfolk Island.
Such being the case, the conclusions reached for a single-stock model, chosen on the basis of trends in catch rates, should be considered tentative, and efforts should be undertaken to resolve the question of
ethod. Analyses of stock status made using two production models, taking into account
t would produce the AMSY. An analysis, using the Deriso-Schnute delay–difference model, yielded estimates of AMSY in the range of 8,700 to 9,200 t, with current biomass greater than that needed to produce the AMSY and about 70% of the size of the unexploited biomass.
Landings and standardized fishing effort for striped marlin decreased in the EPO from 1990-1991 through 1998, and this decline has continued, with annual catches during 2000 to 2003 between about 2,000 and 2,100 t, levels that are well below estimated AMSY harvest levels. This may result in a continued increase in the biomass of the stock in the EPO.
The stock(s) of striped marlin in the EPO are apparently in good condition, with current and near-term anticipated fishing effort less than that required to produce the AMSY.
stock structure of striped marlin in the EPO. To this end, a collaborative study to investigate the stock structure and status of striped marlin in the Pacific has been undertaken.
Standardized catch rates were obtained from a general linear model and from the statistical habitat-based standardization mthe time period when billfish were targeted by longline fishing in the EPO, were considered the most plausible. A Pella-Tomlinson model yielded estimates of the average maximum sustained yield (AMSY) in the range of 3,700 to 4,100 t, with a current biomass to be about 47% of the unfished biomass. The current biomass is estimated to be greater than the biomass tha
IATTC-73-04 Tunas and billfishes in the EPO 86

FIGURE I-1. Retained catches of striped marlin in the eastern Pacific Ocean, 1975-2003, by gear type. FIGURA I-1. Capturas retenidas de marlín rayado en el Océano Pacífico oriental, 1975-2003, por arte de pesca.
IATTC-73-04 Tunas and billfishes in the EPO 87

J. ECOSYSTE
The FAO Code of Conduct for Responsible Fisheries provides that management of fisheries should ensure the conservation not only of target spec s, but ther specie ng to the same ecosystem Reykjavik Declaration on Responsible Fisheries in t tem elaborated this stand itment to incorporate an ecosyste h into fishe gement.
The IATTC has taken account of ecosystem issues in many decisions, bu ecently has not focused its attention on the entire ecosystem in which the target species, the tunas and billfishes, reside. This section provides a coherent view, summarizing what is known about the direct impact of the fisheries u cies grou s of the ecosys nd reviews wh nown about the environm tly impacted by the fisheries. The purpose is to provide the C tunity to consider the ecosystem as a whole as part of its consideration of the status of the tuna and billfish stocks and management me .
This review stem considerations into the management Rather, its prime purpose is to offer the Comm part of its agenda.
It is important to re d on the recent past; we have no inform ent is subject to change on a variety more recently recognized longer-ter ate changes.
In addition to reporting t s, the staff has reported the bycatches are
Unfortunately, while relatively good inform e entire fishery is not available. The inform t) purse seiners that carry ob m (AIDCP), and informati , pole-and-line vessels, and much of the longli parts of the longline fleet. Information on bycatches and discards is also available for large purse-seiners, and for some smaller ones. There is yet little information available on bycatches and discards for other fishing vessels.
2. THE IMPACT OF CATCHES
2.1. Single-species assessments
This section provides a summary of current information on the effect of the tuna fisheries on stocks of single species in the eastern Pacific Ocean (EPO). It focuses on the current biomass of each stock
M CONSIDERATIONS
1. Introduction ........................................................................................................................................ 88 2. The impact of catches......................................................................................................................... 88 3. Other ecosystem components............................................................................................................. 93 4. Trophic interactions............................................................................................................................ 94 5. Physical environment ......................................................................................................................... 95 6. Aggregate indicators .......................................................................................................................... 96 7. Ecosystem modeling .......................................................................................................................... 97 8. Actions by the IATTC and AIDCP addressing ecosystem considerations ........................................ 98 9. Future developments .......................................................................................................................... 99 1. INTRODUCTION
ie also of the o s belongi. In 2001, the
wit commhe Ecosys
ard h a m approac ries mana
of its t until r
pon various species and spe p tem, a at is kent and about other species that are not direc
o miss th pporm ion e oasures
does not suggest objectives for the incorporation of ecosyof tuna or billfish fisheries, nor any new management measures.
ission the opportunity to ensure that ecosystem considerations are clearly
member that the view that we have of the ecosystem is baseation about the ecosystem before exploitation began. Also, the environm
of time scales, including the well-known El Niño fluctuations and m changes, such as the Pacific Decadal Oscillation and other clim
he catches of the principal species of tunas and billfishe of other species that are normally discarded. In this section, data on these bycatches
presented in the context of the effect of the fishery on the ecosystem. ation is available for the tunas and billfishes, information for th
ation is comprehensive for large (carrying capacity greater than 363 servers under the Agreement on the International Dolphin Conservation Prograon on retained catches is also reported for other purse seiners
ne fleet. Some information is available on sharks that are retained by
IATTC-73-04 Tunas and billfishes in the EPO 88
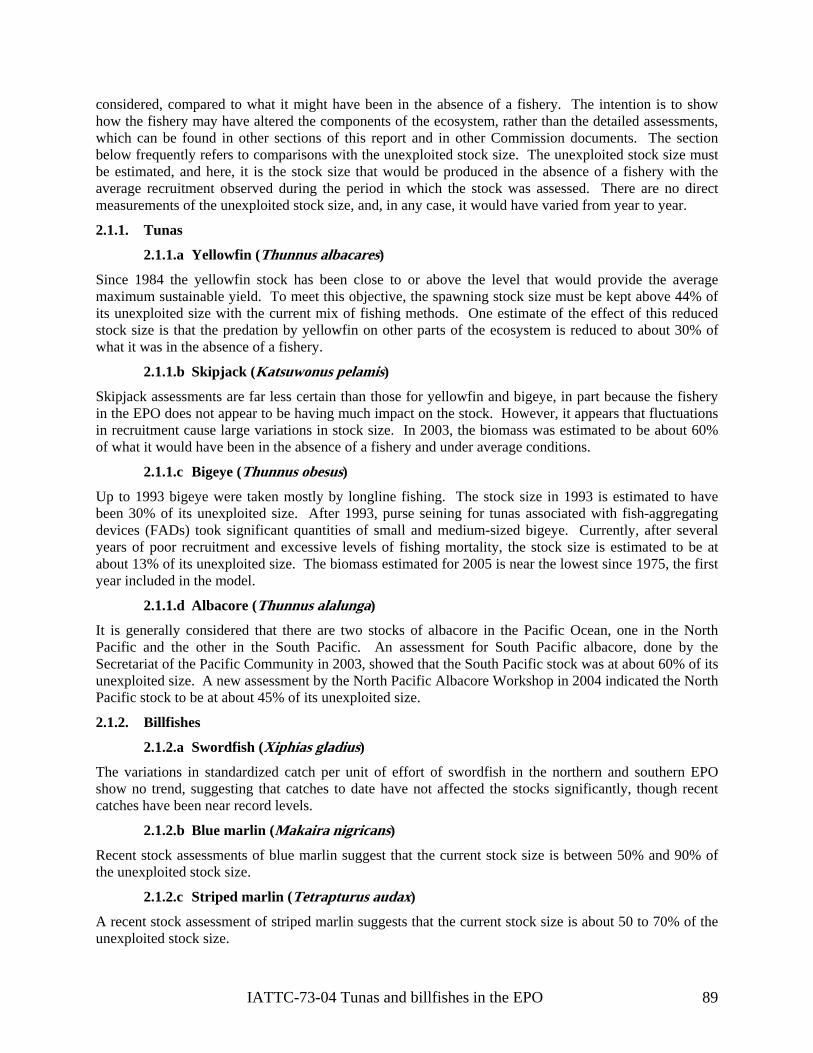
considered, compared to what it might have been in the absence of a fishery. The intention is to show
ed. There are no direct
2.1.1.c Bigeye (Thunnus obesus)
1975, the first
e.
2.1.2. Billfishes
2.1.2.a Swordfish (Xiphias gladius)
The variations in standardized catch per unit of effort of swordfish in the northern and southern EPO show no trend, suggesting that catches to date have not affected the stocks significantly, though recent catches have been near record levels.
2.1.2.b Blue marlin (Makaira nigricans)
Recent stock assessments of blue marlin suggest that the current stock size is between 50% and 90% of the unexploited stock size.
2.1.2.c Striped marlin (Tetrapturus audax)
A recent stock assessment of striped marlin suggests that the current stock size is about 50 to 70% of the unexploited stock size.
how the fishery may have altered the components of the ecosystem, rather than the detailed assessments, which can be found in other sections of this report and in other Commission documents. The section below frequently refers to comparisons with the unexploited stock size. The unexploited stock size must be estimated, and here, it is the stock size that would be produced in the absence of a fishery with the average recruitment observed during the period in which the stock was assessmeasurements of the unexploited stock size, and, in any case, it would have varied from year to year.
2.1.1. Tunas
2.1.1.a Yellowfin (Thunnus albacares)
Since 1984 the yellowfin stock has been close to or above the level that would provide the average maximum sustainable yield. To meet this objective, the spawning stock size must be kept above 44% of its unexploited size with the current mix of fishing methods. One estimate of the effect of this reduced stock size is that the predation by yellowfin on other parts of the ecosystem is reduced to about 30% of what it was in the absence of a fishery.
2.1.1.b Skipjack (Katsuwonus pelamis)
Skipjack assessments are far less certain than those for yellowfin and bigeye, in part because the fishery in the EPO does not appear to be having much impact on the stock. However, it appears that fluctuations in recruitment cause large variations in stock size. In 2003, the biomass was estimated to be about 60% of what it would have been in the absence of a fishery and under average conditions.
Up to 1993 bigeye were taken mostly by longline fishing. The stock size in 1993 is estimated to have been 30% of its unexploited size. After 1993, purse seining for tunas associated with fish-aggregating devices (FADs) took significant quantities of small and medium-sized bigeye. Currently, after several years of poor recruitment and excessive levels of fishing mortality, the stock size is estimated to be at about 13% of its unexploited size. The biomass estimated for 2005 is near the lowest since year included in the model.
2.1.1.d Albacore (Thunnus alalunga)
It is generally considered that there are two stocks of albacore in the Pacific Ocean, one in the North Pacific and the other in the South Pacific. An assessment for South Pacific albacore, done by the Secretariat of the Pacific Community in 2003, showed that the South Pacific stock was at about 60% of its unexploited size. A new assessment by the North Pacific Albacore Workshop in 2004 indicated the North Pacific stock to be at about 45% of its unexploited siz
IATTC-73-04 Tunas and billfishes in the EPO 89

2.1.2.d Black marlin (Makaira indica), sailfish (Istiophorus platypterus), and shortbill spearfish (Tetrapterus angustirostris)
No recent formal stock assessments have been made for these species, although there are some data presented in the IATTC Bulletin series published jointly by scientists of the National Research Institute of Far Seas Fisheries (NRIFSF) of Japan and the IATTC that show trends in catches, effort, and catches per unit of effort.
2.1.3. Summary
The estimated catches (including purse-seine discards), in metric tons, of tunas and billfishes in the EPO during 2004 are as follows.
PS OBJ NOA DEL
LP LL OTR Total
Yellowfin tuna 25,720 103,878 141,611 1,905 2,041 1,442 276,597 Skipjack tuna 99,244 106,882 7,205 481 26 17 213,855 Bigeye tuna 65,171 3,385 0 0 39,729 6 108,290 Albacore tuna 0 106 0 0 11,509 7,676 19,291 Swordfish 1 1 1 0 1,916 45 1,964 Blue marlin 308 12 8 0 416 73 817 Striped marlin 8 4 8 0 214 33 267 Black marlin 99 8 16 0 4 0 126 Sailfish 3 19 45 0 48 87 202 Shortbill spearfish <1 <1 <1 0 0 0 <1
2.2. Marine mammals
Marine mammals, especially spotted dolphins (Stenella attenuata), spinner dolphins (S. longirostris), and common dolphins (Delphinus delphis), are frequently found associated with yellowfin tuna in the size
the early years of the fishery, but after the late 1980s it decreased precipitously. Preliminary mortality estimates of dolphins in the fishery in 2004 are as follows:
Incidental mortality
range of about 10 to 40 kg in the EPO. Purse-seine fishermen have found that their catches of yellowfin in the EPO can be maximized by setting their nets around herds of dolphins and the associated schools of tunas, and then releasing the dolphins while retaining the tunas. The incidental mortality of dolphins in this operation was high during
Species and stock number metric tons Offshore spotted dolphin
Northeastern 250 14 Western/southern 248 14
Spinner dolphin Eastern 220 10 Whitebelly 214 10
Common dolphin Northern 159 13 Central 100 8 Southern 222 18
Other dolphins1 56 3 Total 1,469 90
1 "Other dolphins" includes the following species and stocks, whose observed mortalities were as follows: striped dolphins, 5 (0.5 t); coastal spotted dolphin, 9 (0.5 t), Central American spinner dolphin (Stenella longirostris centroamericana) 7 (0.3 t); rough-toothed dolphin (Steno bredanensis) 1 (0.2 t); unidentified dolphins, 34 (1.7 t).
IATTC-73-04 Tunas and billfishes in the EPO 90

Studies of the association of tunas with dolphins have been an important component of the staff’s long-term approach to understanding key interactions in the ecosystem. The extent to which yellowfin tuna and dolphins compete for resources, or whether either or both of them benefits from the interaction, remain critical pieces of information, given the large biomasses of both groups and their high rates of prey consumption. Populations of dolphins involved in the purse-seine fishery were reduced from their unexploited levels during the 1960s and 1970s, and there is now some evidence of a slow recovery.
During 2003, scientists of the U.S. National Marine Fisheries Service (NMFS) conducted the latest in a series of research cruises under the Stenella Abundance Research Project (STAR). The primary objective of the multi-year study is to investigate trends in population size of the dolphins that have been taken as incidental catch by the purse-seine fishery in the EPO. During STAR 2003, data on cetacean distribution, herd size, and herd composition were collected aboard two research vessels, David Starr Jordan and McArthur II, to estimate dolphin abundance. These data are currently being analyzed.
Scientists of the NMFS have made estimates of the abundances of several other species of marine
iet, including spotted dolphins. Bryde’s whales
Niño events, especially in coastal ecosystems. Examples that have been documented include dolphins, pinnipeds and Bryde’s whales off Peru, and pinnipeds around the Galapagos Islands. Large whales are able to move in response to changes in prey productivity and distribution.
2.3. Sea turtles
Sea turtles are caught on longlines when they take the bait on hooks, are snagged accidentally by hooks, or are entangled in the lines. Estimates of incidental mortality of turtles due to longline and gillnet fishing are few. It was reported that 166 leatherback (Dermochelys coriacea) and 6,000 other turtle species, mostly olive Ridley (Lepidochelys olivacea), were incidentally caught by Japan’s longline fishery in the EPO during 2000 (4th meeting IATTC Working Group on Bycatch). Of these, 25 and 3,000, respectively, were dead. The mortality rates due to longlining in the EPO are likely to be similar for other fleets targeting bigeye tuna, and possibly greater for those that set lines at shallower depths for albacore and swordfish. About 23 million of the 200 million hooks set each year in the EPO by distant-water longline vessels target swordfish with shallow longlines. In addition, there is a sizeable fleet of local longline vessels that fish for tunas and billfishes in the EPO.
Sea turtles are occasionally caught in purse seines in the EPO tuna fishery. Most interactions occur when
ea turtles
drown. In some cases, they are entangled by the
mammals based on data from research cruises made between 1986 and 2000 in the EPO. The STAR 2003 cruises will provide further estimates of abundance of these mammals. Of the species not significantly affected by the tuna fishery, short-finned pilot whales (Globicephala macrorhynchus) and three stocks of common dolphins showed increasing trends in abundance during that 15-year period. The apparent increased abundance of these mammals may have caused a decrease in the carrying capacity of the EPO for other predators that overlap in d(Balaenoptera edeni) also increased in estimated abundance, but there is very little diet overlap between these baleen whales and the upper-level predators impacted by the fisheries. Striped dolphins (Stenella coeruleoalba) showed no clear trend in estimated abundance over time, and the estimates of abundance of sperm whales (Physeter macrocephalus) tended to decrease in recent years.
Some marine mammals are adversely affected by reduced food availability during El
the turtles associate with floating objects (for the most part FADs), and are captured when the object is encircled. In other cases, nets set around unassociated schools of tunas or schools associated with dolphins may capture sea turtles that happen to be at that location. The olive Ridley turtle is, by far, the species of sea turtle taken most often by purse seiners. It is followed by the black or green s(Chelonia agassizi), and, very occasionally, by the loggerhead (Caretta caretta) and hawksbill (Eritmochelys imbricata) turtles. Only one leatherback mortality has been recorded during the 10 years that IATTC observers have been recording this information. Some of the turtles are unidentified because they were too far from the vessel or it was too dark for the observer to identify them. Sea turtles, at times, become entangled in the webbing under FADs and
IATTC-73-04 Tunas and billfishes in the EPO 91
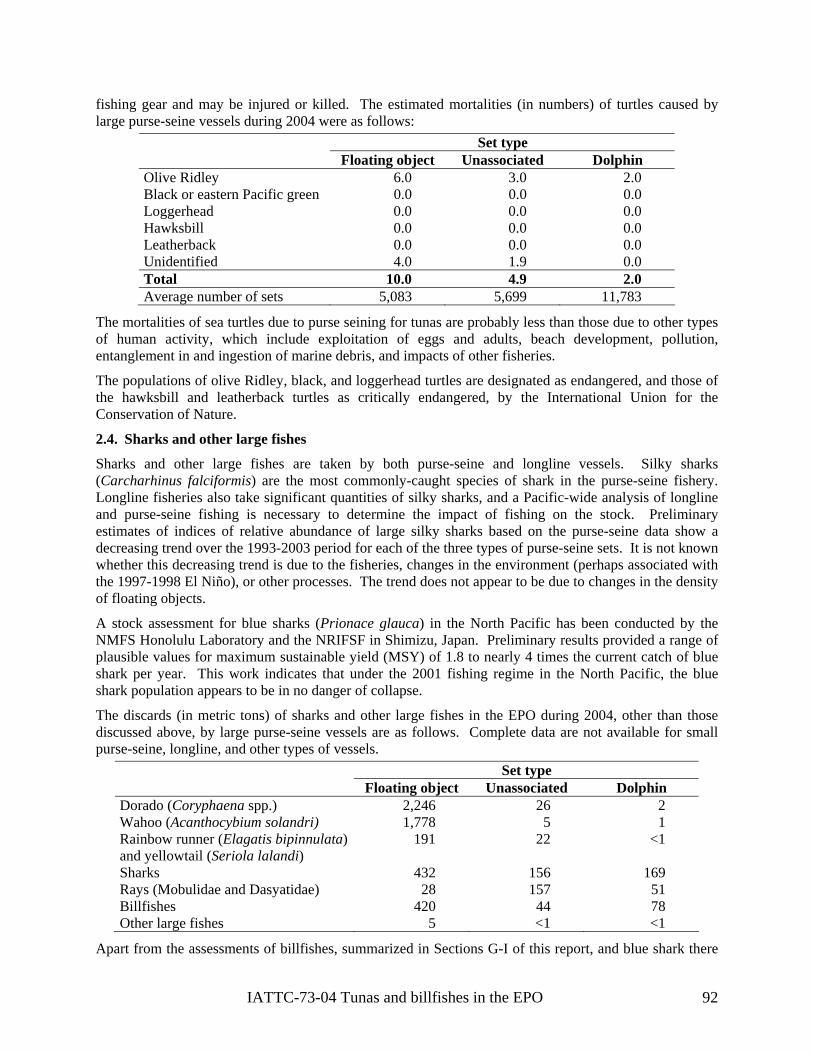
fishing gear and may be injured or killed. The estimated mortalities (in numbers) of turtles caused by large purse-seine vessels during 2004 were as follows:
Set type Floating object Unassociated Dolphin
Olive Ridley 6.0 3.0 2.0 Black or eastern Pacific green 0.0 0.0 0.0 Loggerhead 0.0 0.0 0.0 Hawksbill 0.0 0.0 0.0 Leatherback 0.0 0.0 0.0 Unidentified 4.0 1.9 0.0 Total 10.0 4.9 2.0 Average number of sets 5,083 5,699 11,783
The mortalities of sea turtles due to purse seining for tunas are probably less than those due to other types of human activity, which include exploitation of eggs and adults, beach development, pollution, entanglement in and ingestion of marine debris, and impacts of other fisheries.
The populations of olive Ridley, black, and loggerhead turtles are designated as endangered, and those of the hawksbill and leatherback turtles as critically endangered, by the International Union for the Conservation of Nature.
2.4. Sharks and other large fishes
Sharks and other large fishes are taken by both purse-seine and longline vessels. Silky sharks (Carcharhinus falciformis) are the most commonly-caught species of shark in the purse-seine fishery. Longline fisheries also take significant quantities of silky sharks, and a Pacific-wide analysis of longline and purse-seine fishing is necessary to determine the impact of fishing on the stock. Preliminary estimates of indices of relative abundance of large silky sharks based on the purse-seine data show a decreasing trend over the 1993-2003 period for each of the three types of purse-seine sets. It is not known whether this decreasing trend is due to the fisheries, changes in the environment (perhaps associated with the 1997-1998 El Niño), or other processes. The trend does not appear to be due to changes in the density of floating objects.
A stock assessment for blue sharks (Prionace glauca) in the North Pacific has been conducted by the NMFS Honolulu Laboratory and the NRIFSF in Shimizu, Japan. Preliminary results provided a range of plausible values for maximum sustainable yield (MSY) of 1.8 to nearly 4 times the current catch of blue shark per year. This work indicates that under the 2001 fishing regime in the North Pacific, the blue shark population appears to be in no danger of collapse.
The discards (in metric tons) of sharks and other large fishes in the EPO during 2004, other than those discussed above, by large purse-seine vessels are as follows. Complete data are not available for small purse-seine, longline, and other types of vessels.
Set type Floating object Unassociated Dolphin
Dorado (Coryphaena spp.) 2,246 26 2 Wahoo (Acanthocybium solandri) 1,778 5 1 Rainbow runner (Elagatis bipinnulata) and yellowtail (Seriola lalandi)
191 22 <1
Sharks 432 156 169 Rays (Mobulidae and Dasyatidae) 28 157 51 Billfishes 420 44 78 Other large fishes 5 <1 <1
Apart from the assessments of billfishes, summarized in Sections G-I of this report, and blue shark there
IATTC-73-04 Tunas and billfishes in the EPO 92

are no stock assessments available for these species in the EPO, and hence the impact of the bycatches on
a much lower level, floating-object sets. The bycatch rates of sailfish, manta
currently investigating the
ycatch.
e forage taxa. Very little is known, however, about
the stocks is unknown.
The catch rates of species other than tunas in the purse-seine fishery are different for each type of set. With a few exceptions, the bycatch rates are greatest in sets on floating objects, followed by unassociated sets and, at a much lower level, dolphin sets. Dolphin bycatch rates are greatest for dolphin sets, followed by unassociated sets and, atrays (Mobulidae), and stingrays (Dasyatidae) are greatest in unassociated sets, followed by dolphin sets and then floating-object sets. Because of these differences, it is necessary to follow the changes in frequency of the different types of sets to interpret the changes in bycatch figures. The estimated numbers of purse-seine sets of each type in the EPO during 1987-2004 are shown in Table A-8.
3. OTHER ECOSYSTEM COMPONENTS
3.1. Seabirds
There are approximately 100 species of seabirds in the tropical EPO. Some seabirds associate with subsurface predators, such as fishes (especially tunas) and marine mammals. Subsurface predators often drive prey to the surface to trap them against the air-water interface, where the prey become available to the birds. Most species of seabirds take prey within a half meter of the sea surface or in the air (flyingfishes (Exocoetidae) and flying squid (Ommastrephidae)). In addition to driving the prey to the surface, subsurface predators make prey available to the birds by injuring or disorienting the prey and by leaving scraps after feeding on large prey. Feeding opportunities for some seabird species are dependent on the presence of tuna schools feeding at the surface.
Seabirds are affected by the variability of the ocean environment. During the 1982-1983 El Niño, seabirdpopulations throughout the tropical and northeastern Pacific Ocean experienced breeding failures and mass mortalities, or migrated elsewhere in search of food. Some species, however, are apparently not affected by El Niño events. In general, seabirds that forage in upwelling areas of the tropical EPO and Peru Current suffer reproductive failures and mortalities due to food shortage during El Niño events, while seabirds that forage in areas less affected by El Niño may be relatively unaffected.
According to the Report of the Scientific Research Program under the U.S. International Dolphin Conservation Program Act, prepared by the NMFS in September 2002, there were no significant temporal trends in abundance estimates over the 1986-2000 period for any species of seabird, except for a downward trend for the Tahiti petrel (Pseudobulweria rostrata), in the tropical EPO.
Some seabirds are susceptible to being caught on baited hooks in the pelagic longline fisheries. Data on the bycatch of black-footed albatross (Phoebastria nigripes) by the U.S. pelagic longline fishery in the central North Pacific Ocean have been analyzed, but comparable data for the longline fisheries in the EPO were not available. In an externally-funded study, the IATTC staff is population status of the black-footed albatross in the entire North Pacific, taking into account the effects of fisheries b
3.2. Forage
The forage taxa occupying the middle trophic levels in the EPO are obviously an important component of the ecosystem, providing a link between primary production at the base of the food web and the upper-trophic-level predators, such as tunas and billfishes. The indirect effects of environmental variability are transmitted to the upper trophic levels through thfluctuations in abundance of the large variety of prey species in the EPO. Scientists from the NMFS have recorded data on the distributions and abundances of common prey groups, including lanternfishes (Myctophidae), flyingfishes, and some squids, in the tropical EPO during 1986-1990 and 1998-2000. Mean abundance estimates for all fish taxa, and to a lesser extent for squids, increased from 1986 through 1990. Estimates were low again in 1998, and then increased through 2000. Their interpretation of this
IATTC-73-04 Tunas and billfishes in the EPO 93

pattern was that El Niño events in 1986-1987 and 1997-1998 had negative effects on these prey populations. More data on these taxa were collected during the NMFS STAR 2003 cruises, and are currently being analyzed.
Some small fishes, many of which are forage for the larger predators, are incidentally caught by purse-seine vessels in the EPO. Frigate and bullet tunas (Auxis spp.), for example, are a common prey of many of the animals that occupy the upper trophic levels in the tropical EPO. In the tropical EPO ecosystem model (Section 6), frigate and bullet tunas comprise 10% or more of the diet of eight predator categories. Small quantities of frigate and bullet tunas are captured by purse-seine vessels on th
e high seas and by
ers aboard in the EPO during 2004
local artisanal fisheries in some coastal regions of Central and South America. The vast majority of frigate and bullet tunas captured by tuna purse-seine vessels is discarded at sea. The estimated discards, in metric tons, of small fishes by large purse-seine vessels with observwere as follows:
Set type Floating object Unassociated Dolphin Triggerfishes (Balistidae) and filefishes (Monacanthidae)
255 2 1
Other small fishes 17 1 <1 Frigate and bullet tunas (Auxis spp.) 819 156 24
3.3. Larval fishes and plankton
Larval fishes have been collected by Manta (surface) net tows in the EPO for many years by personnel of
systems, and the natural variability forced by the
ellowfin and skipjack caught
d other epipelagic fishes. Bigeye tuna feed at greater depths than yellowfin and utilize primarily cephalopods and mesopelagic fishes. The most important prey of skipjack
, diet studies have become focused on understanding resource part n wahoo,
the NMFS Southwest Fisheries Science Center. Of the 314 taxonomic categories identified, 17 were found to be most likely to show the effects of environmental change. The occurrence, abundance, and distribution of these key taxa revealed no consistent temporal trends. The phytoplankton and zooplankton populations in the tropical EPO are variable. For example, chlorophyll concentrations on the sea surface (an indicator of phytoplankton blooms) and the abundance of copepods were markedly reduced during the El Niño of 1982-1983, especially west of 120°W. Similarly, surface concentrations of chlorophyll decreased during the 1986-1987 El Niño and increased during the 1988 La Niña due to changes in nutrient availability. The species and size composition of zooplankton is often more variable than zooplankton biomass. When water temperatures increase, warm-water species often replace cold-water species at particular locations. The relative abundance of small-sized copepods off northern Chile, for example, increased during the 1997-1998 El Nino, while the zooplankton biomass did not change. 4. TROPHIC INTERACTIONS
Tunas and billfishes are wide-ranging, generalist predators with high energy requirements, and as such, are key components of pelagic ecosystems. Ecological relationships among large pelagic predators, and between them and animals at lower trophic levels, are not well understood. Given the need to evaluate the implications of fishing activities on the underlying ecosystems, it is essential to acquire a reliable understanding of the trophic structure in open-ocean ecoenvironment.
Knowledge of the trophic ecology of predator fishes has historically derived from diet studies. Tunas that feed inshore utilize different prey than those caught offshore. For example, yoff Baja California feed heavily on red crabs (Pleuroncodes planipes). The most-common prey item for yellowfin tuna caught by purse-seine offshore are frigate and bullet, squids and argonauts (cephalopods), and flyingfishes anskipjack, andare euphausiid crustaceans. Recently
itio ing among the predator communities, comprising tunas, sharks, billfishes, dorado,
IATTC-73-04 Tunas and billfishes in the EPO 94

rainamong
Stoanimal ture. A more-recent method utilizes stab iisot shistory of trophic interactions and information on the structure and dynamics of ecological communities. This technology is now being applied in the pelagic PO, and preliminary results suggest that potentially important components of the food web may not be represented in diet analyses of the principal predators.
5. PHYSICAL ENVIRONMENT2
Environmental conditions affect marine ecosystems, the dynamics and catchability of tuna and billfish stocks, and the operations of the fishermen. Tunas and billfishes are pelagic during all stages of their lives, and the physical factors that affect the tropical and sub-tropical Pacific Ocean can have important effects on their distribution and abundance. Environmental conditions are thought to cause considerable variability in the recruitment of tunas and billfishes. Stock assessments by the IATTC have often included the assumption that oceanographic conditions might influence recruitment in the EPO.
Different types of climate perturbations may impact fisheries differently. It is thought that a shallow thermocline in the EPO contributes to the success of purse-seine fishing for tunas, perhaps by acting as a thermal barrier to schools of small tunas, keeping them near the sea surface. When the thermocline is deep, as during an El Niño event, tunas seem to be less vulnerable to capture and catch rates have declined. Warm sea-surface temperatures (SSTs) can also cause these mobile fishes to move to more favorable habitat.
The ocean environment varies on a variety of time scales, from seasonal to interannual, decadal, and longer (e.g. climate phases or regimes). The dominant source of variability in the upper layers of the EPO is often called the El Niño-Southern Oscillation (ENSO). The ENSO is an irregular fluctuation involving the entire tropical Pacific Ocean and global atmosphere. It results in variations of the winds, rainfall,
ed a connection between the ENSO and the rate of primary production,
Variability on a decadal scale (i.e. 10 to 30 years) also affects the EPO. In the late 1970s in the North Pacific, there was a major shift in physical and biological states. This climate shift was also detected in the tropical EPO, by small increases in SSTs, weakening of the trade winds, and a moderate change in surface chlorophyll levels. Some researchers have reported another major shift in the North Pacific in
bow runner, and others, captured by purse-seine. In general, considerable resource partitioning occurs the components of these communities.
mach contents, however, provide only a relative snapshot of the most recent meal at the time of day an is captured, and under the conditions required for its cap
le sotopes of carbon and nitrogen to investigate trophic relations. Stable carbon and nitrogen ope integrate information on all components of the diet into the animal’s tissues, providing a recent
E
thermocline depth, circulation, biological productivity, and the feeding and reproduction of fishes, birds, and marine mammals. El Niño events occur at 2- to 7-year intervals, and are characterized by weak trade winds, a deep thermocline, and abnormally high SSTs in the equatorial EPO. El Niño’s opposite phase, often called La Niña, is characterized by strong trade winds, a shallow thermocline, and low SSTs. Research has documentphytoplankton biomass, and phytoplankton species composition. Upwelling of nutrient-rich subsurface water is reduced during El Niño episodes, leading to a marked reduction in primary and secondary production. ENSO also directly affects animals at middle and upper trophic levels. Researchers have concluded that the 1982-1983 El Niño, for example, deepened the thermocline and nutricline, decreased primary production, reduced zooplankton abundance, and ultimately reduced the growth rates, reproductive successes, and survival of various birds, mammals, and fishes in the EPO. In general, however, the ocean inhabitants recover within a short time because their life histories are adapted to respond to a variable habitat.
2 Much of the information in this section is from Fiedler, P.C. 2002. Environmental change in the eastern tropical Pacific Ocean: review of ENSO and decadal variability. Mar. Ecol. Prog. Ser. 244: 265-283.
IATTC-73-04 Tunas and billfishes in the EPO 95

1989. Climate-induced variability in the ocean has often been described in terms of “regimes” characterized by relatively stable means and patterns in the physical and biological variables. Analyses by the IATTC have indicated that the yellowfin tuna population in the EPO has experienced two different recruitment regimes (1975-1984 and 1985-present). The yellowfin population has been in a high-recruitment regime, which produced greater biomass levels, for approximately the last 16 years. The increased recruitment is thought to be due to a shift to a higher productivity regime in the Pacific Ocean. Decadal fluctuations in upwelling and water transport are simultaneous to the higher-frequency ENSO pattern and have basin-wide effects on SSTs and thermocline slope that are similar to those caused by ENSO, but on longer time scales.
Environmental variability in the tropical EPO is manifested differently in different regions in which tunas are caught. For example, SST anomalies in the tropical EPO warm pool (5° to 20°N, east of 120°W) have been about one-half the magnitude and several months later than those in the equatorial Pacific NIÑO3 area (5°S to 5°N, 90° to 150°W).
6. AGGREGATE INDICATORS
Recognition of the consequences of fishing for marine ecosystems has stimulated much research in recent years. Researchers ask how the use of performance measures and reference points might be expanded to
ts to date e
examples include incidental mortality limits for dolphins in the EPO purse-seine fishery under the AIDCP. Another area of interest is whether useful performance indicators based on ecosystem-level properties might be developed. Several ecosystem metrics or indicators, including community size structure, diversity indices, species richness and evenness, overlap indices, catch trophic spectra, relative abundance of an indicator species or group, and numerous environmental indicators, have been proposed. Whereas there is general agreement that multiple system-level indicators should be used, there is concern over whether there is sufficient practical knowledge of the dynamics of such metrics and whether a theoretical basis for identifying precautionary or limit reference points based on ecosystem properties exists. Ecosystem-level metrics are not yet commonly used for managing fisheries.
Food web diagrams are useful for representing the structure and flows of ecosystems. Trophic levels (TLs) are used in food-web ecology to characterize the functional role of organisms and to facilitate estimates of energy or mass flow through communities. A simplified food-web diagram, with approximate TLs, of the pelagic tropical EPO is shown in Figure J-1. Toothed whales (Odontoceti, average TL 5.2), large squid predators (large bigeye tuna and swordfish, average TL 5.2) and sharks (average TL 5.0) are top-level predators. Other tunas, large piscivores, dolphins, and seabirds occupy slightly lower TLs. Smaller epipelagic fishes (e.g. Auxis spp. and flyingfishes), cephalopods, and mesopelagic fishes are the principal forage of many of the upper-level predators in the ecosystem. Small fishes and crustaceans prey on two zooplankton groups, and the herbivorous microzooplankton (TL = 2) feed on the producers, phytoplankton and bacteria (TL = 1).
In exploited pelagic ecosystems, fisheries that target large piscivorous fishes act as the ecosystem’s apex predators. Over time, fishing can cause the overall size composition of the catch to decline, and, in
help meet the objectives of ecosystem-based fisheries management. Whereas reference poinhave been used primarily for single-species management of target species, applying performancmeasures and reference points to non-target species is believed to be a tractable first step. Current
general, TLs of smaller organisms are lower than those of larger organisms. The mean trophic level of the organisms taken by a fishery is a potentially useful metric of ecosystem change and sustainability because it integrates an array of biological information about the components of the system. There has been increasing attention to analyzing the mean TL of fisheries catches and discards since a study demonstrated that, according to FAO landings statistics, the mean TL of the fishes and invertebrates landed globally had declined from 1950 to 1994. Some ecosystems, however, have changed in the other direction, from low TL communities to higher TL communities. Given the potential utility of this approach, TLs were estimated for a time series of annual catches and discards from 1993 to 2003 for three
IATTC-73-04 Tunas and billfishes in the EPO 96

purse-seine fishing modes and the pole-and-line fishery in the EPO. The estimates were made bying the TLs from the EPO ecosystem model (see Section 7), weighted by the catch data by
year for all model groups from the IATTC tuna, bycatch, and discard data bases. The TLs of themmed catches of all purse-seine and pole-and-line fisheries were fairly constant from year to y
(Figure J-2: Average PS+LP). The TL of the floating-object sets varied more than those of the other fisheries, due to the interannual variability in the sizes of the tunas caught and the species compositions of
catches in those sets.
TLs were also estimated separately for the time series of retained and discarded catches by year for thepurse-seine fishery from 1993 to 2003 (Figure J-3). The TLs of the retained catches were quite stable
year to year, while the TLs of the discarded catches varied considerably. The greatest variation occurred for sets on unassociated fish. A low TL of the discarded catches by sets on unassociated fish in1998 was due to increased bycatches of rays, which feed on plankton and other small animals that occupy low TLs. From 1998 to 2001, the discarded catches of rays gradually declined and those of large sharks increased, resulting in a gradually increasing TL of the discarded catches over that interval. To a lesser degree, the average TLs of the discarded catches of sets on floating objects also increased from 1998 to 2001. That increase was due primarily to increasing bycatches of large wahoo and small dorado.
ECOSYSTEM MODELING
It is clear that the different components of an ecosystem interact. The best way to describe the relationships and explore their effects is through ecosystem modeling. Our understanding of this com
apply fishery and su ear
the by
from
7.
lex
and sensitive species (e.g. sea turtles). Some taxa all marlins). The model has finer taxonomic
resolution at the upper trophic levels, but most of the system’s biomass is contained in the middle and lower trophic levels. Fisheries landings and discards were estimated for five fishing “gears,” pole-and-line, longline, dolphin sets by purse seiners, floating-object sets by purse seiners, and sets on unassociated schools by purse seiners. The model focuses on the pelagic regions; localized, coastal ecosystems are not adequately described by the model.
Most of the information describing inter-specific interactions in the model comes from a joint IATTC-NMFS project, which included studies of the food habits of co-occurring yellowfin, skipjack, and bigeye tuna, dolphins, pelagic sharks, billfishes, dorado, wahoo, rainbow runner, and others. The impetus of the project was to contribute to the understanding of the tuna-dolphin association, and a community-level sampling design was adopted.
The ecosystem model has been used to evaluate the possible effects of variability in bottom-up forcing by the environment on the middle and upper trophic levels of the pelagic ecosystem. Predetermined time series of producer biomasses were put into the model as proxies for changes in primary production that have been documented during El Niño and La Niña events, and the dynamics of the remaining components of the ecosystem were simulated. The model was also used to evaluate the relative contributions of fishing and the environment in shaping ecosystem structure in the tropical pelagic EPO. This was done by using the model to predict which components of the ecosystem might be susceptible to top-down effects of fishing, given the apparent importance of environmental variability in structuring the ecosystem. In general, animals with relatively low turnover rates were influenced more by fishing than by the environment, and animals with relatively high turnover rates more by the environment than by
pmaze of connections is at an early stage, and, consequently, the current ecosystem models are most useful as descriptive devices for exploring the effects of a mix of hypotheses and established connections among the ecosystem components. Ecosystem models must be compromises between simplistic representations on the one hand and unmanageable complexity on the other.
The IATTC staff has developed a model of the pelagic ecosystem in the tropical EPO (IATTC Bulletin, Vol. 22, No. 3) to explore how fishing and climate variation might affect the animals at middle and upper trophic levels. The ecosystem model has 38 components, including the principal exploited species (e.g. tunas), functional groups (e.g. sharks and flyingfishes), are further separated into size categories (e.g. large and sm
IATTC-73-04 Tunas and billfishes in the EPO 97

fishi
8. NS
8.1. and
8.2. been
which
and
urtle
ng.
ACTIONS BY THE IATTC AND AIDCP ADDRESSING ECOSYSTEM CONSIDERATIO
Both the IATTC and the Agreement on the International Dolphin Conservation Program (AIDCP) have objectives that address the incorporation of ecosystem considerations into the management of the tunafisheries in the EPO. Actions taken in the past include:
Dolphins
a. For many years, the impact of the fishery on the dolphin populations has been assessed, programs to reduce or eliminate that impact have met with considerable success.
b. The incidental mortality of each stock of dolphins has been limited to levels that are insignificantrelative to stock sizes.
Sea turtles
a. A data base on all sea turtle sightings, captures, and mortalities reported by observers has compiled.
b. At its 70th meeting in June 2003, the IATTC adopted a Recommendation on Sea Turtles, contemplates “the development of a three-year program that could include mitigation of sea turtle bycatch, biological research on sea turtles, improvement of fishing gears, industry education other techniques to improve sea turtle conservation.” In January 2004, the Working Group on Bycatch drew up a detailed program that includes all these elements and urges all nations withvessels fishing for tunas in the EPO to provide the IATTC with information on interactions with sea turtles in the EPO, including both incidental and direct catches and other impacts on sea tpopulations. Resolution C-04-07 on a three-year program to mitigate the impact of tuna fishing on sea turtles was adopted by the 72 meeting of the IATTC in June 2004. The resolution includes requirements for data collection, mitigation measures, industry education, capacity building and reporting.
nd
c. Resolution C-04-05, adopted at the 72nd meeting of the IATTC in June 2004, contains provisions on releasing and handling of sea turtles captured in purse seines. The resolution also prohibits vessels from disposing of plastic containers and other debris at sea, and directs the Director to study and formulate recommendations regarding the design of FADs, particularly the use of netting attached underwater to FADs.
d. In response to a request made by the Subsecretaría de Recursos Pesqueros of Ecuador, the IATTC began a program, supported by the World Wildlife Fund and the United States, to mitigate the incidental capture of sea turtles, to reduce the mortality of sea turtles due to longline fishing, and to compare the catch rates of tunas, billfishes, and dorado using circle and J hooks of two sizes. Circle hooks do not hook as many turtles as the J hooks currently used in the longline fishery, and the chance of serious injury to the sea turtles that bite the hooks is reduced because they are wider and they tend to hook the lower jaw, rather than the more dangerous deep hookings in the esophagus and other areas, which are more common with the J hooks. Improved procedures and instruments to release hooked and entangled sea turtles have also been disseminated to the longline fleets of the region. In 2004, observers recorded data on more than 60 fishing trips of the vessels that are testing the different hooks. In addition, workshops and presentations were conducted by IATTC staff and others in Colombia, Costa Rica, Ecuador, El Salvador, Guatemala, Mexico, Panama, and Peru.
8.3. Other species
a. At its 66th meeting in June 2000, the IATTC adopted a resolution on live release of sharks, rays, billfishes, dorado, and other non-target species.
IATTC-73-04 Tunas and billfishes in the EPO 98

b. Resolution C-04-05, adopted at the 72nd meeting of the IATTC in June 2004, directs the Director to seek funds for reduction of incidental mortality of juvenile tunas, for developing techniques and equipment to facilitate release of billfishes, sharks, and rays from the deck or the net, and to carry out experiments to determine the survival rates of released billfishes, sharks, and rays.
8.4. All species
a. Data on the bycatches of large purse-seine vessels are being collected, and governments are urged to provide bycatch information from other vessels.
b. Data on the spatial distributions of the bycatches and the bycatch/catch ratios have been collected for analyses of policy options to reduce bycatches.
c. Information to evaluate measures to reduce the bycatches, such as closures, effort limits, etc., has been collected.
d. Assessments of habitat preferences and the effect of environmental changes have been made.
9. FUTURE DEVELOPMENTS
It is unlikely, in the near future at least, that there will be stock assessments for most of the bycatch species. In lieu of formal assessments, it may be possible to develop indices to assess trends in the status of these species. The IATTC staff’s experience with dolphins suggests that the task is not trivial if relatively high precision is required.
An array of measures has been proposed to study changes in ecosystem properties. This could include studies of average trophic level, size spectra, dominance, diversity, etc., to describe the ecosystem in an aggregate way.
The distributions of the fisheries for tunas and billfishes in the EPO are such that several regions with different ecological characteristics may be included. Within them, water masses, oceanographic or topographic features, influences from the continent, etc., may generate heterogeneity that affects the distributions of the different species and their relative abundances in the catches. It would be desirable to increase our understanding of these ecological strata so that they can be used in our analyses.
It is important to continue studies of the ecosystems in the EPO. The power to resolve issues related to fisheries and the ecosystem will increase with the number of habitat variables, taxa and trophic levels studied and with longer time series of data.
IATTC-73-04 Tunas and billfishes in the EPO 99

FIGURE J-1. Simplified food-web diagram of the pelagic ecosystem in the tropical eastern Pacific Ocean. The numbers inside the boxes indicate the approximate trophic levels of each group. FIGURA J-1. Diagrama simplificado de la red trófica del ecosistema pelágico en el Océano Pacífico oriental tropical. Los números en los recuadros indican el nivel trófico aproximado de cada grupo.
IATTC-73-04 Tunas and billfishes in the EPO 100

FIGURE J-2. Yearly trophic level estimates of the catches (retained and discarded) by the purse-seine and pole-and-line fisheries in the tropical eastern Pacific Ocean. FIGURA J-2. Estimaciones anuales del nivel trófico de las capturas (retenidas y descartadas) de las pesquerías cerquera y cañera en el Océano Pacífico oriental tropical.
FIGURE J-3. Trophic level estimates of the retained catches and discarded catches by purse-seine fishing modes in the tropical eastern Pacific Ocean. FIGURA J-3. Estimaciones del nivel trófico de las capturas retenidas y descartadas por modalidad de pesca cerquera en el Océano Pacífico oriental tropical.
IATTC-73-04 Tunas and billfishes in the EPO 101