IATTC-98-01_The fishery and status of the stocks 2020
148
IATTC-98-01 - Fisheries, stocks, and the ecosystem in the EPO in 2020 1 INTER-AMERICAN TROPICAL TUNA COMMISSION 98 TH MEETING (by videoconference) 23-27 August 2021 DOCUMENT IATTC-98-01 REPORT ON THE TUNA FISHERY, STOCKS, AND ECOSYSTEM IN THE EASTERN PACIFIC OCEAN IN 2020 A. The fishery for tunas and billfishes in the eastern Pacific Ocean ....................................................... 3 B. Yellowfin tuna................................................................................................................................... 49 C. Skipjack tuna ..................................................................................................................................... 66 D. Bigeye tuna ....................................................................................................................................... 71 E. Pacific bluefin tuna ........................................................................................................................... 86 F. Albacore tuna .................................................................................................................................... 90 G. Swordfish .......................................................................................................................................... 97 H. Blue marlin ...................................................................................................................................... 101 I. Striped marlin .................................................................................................................................. 102 J. Sailfish ............................................................................................................................................ 104 K. Silky shark....................................................................................................................................... 107 L. Ecosystem considerations ............................................................................................................... 109 INTRODUCTION This report provides a summary of the catches and effort in 2020 of the fishery for tunas in the eastern Pacific Ocean (EPO), for whose management the Inter-American Tropical Tuna Commission (IATTC) is responsible. It is based on data available to the IATTC staff in March 2021; therefore, some of the data for 2020 are incomplete, and all data for 2019 and 2020 should be considered preliminary. All weights of catches and discards are in metric tons (t). In the tables, 0 means no effort, or a catch of less than 0.5 t; - means no data collected; * means data missing or not available. The following acronyms are used: Species: ALB Albacore tuna (Thunnus alalunga) BET Bigeye tuna (Thunnus obesus) BIL Unidentified istiophorid billfishes BKJ Black skipjack (Euthynnus lineatus) BLM Black marlin (Makaira indica) BUM Blue marlin (Makaira nigricans) BZX Bonito (Sarda spp.) MLS Striped marlin (Kajikia audax) PBF Pacific bluefin tuna (Thunnus orientalis) SFA Indo-Pacific sailfish (Istiophorus platypterus) SKJ Skipjack tuna (Katsuwonus pelamis) SSP Shortbill spearfish (Tetrapturus angustirostris) 1 Used to group known gear types SWO Swordfish (Xiphias gladius) TUN Unidentified tunas YFT Yellowfin tuna (Thunnus albacares) Fishing gears: FPN Trap GN Gillnet HAR Harpoon LL Longline LP Pole and line LTL Troll LX Hook and line OTR Other 1 UNK Unknown PS Purse seine RG Recreational
-
Upload
khangminh22 -
Category
Documents
-
view
4 -
download
0
Transcript of IATTC-98-01_The fishery and status of the stocks 2020
IATTC-98-01 - Fisheries, stocks, and the ecosystem in the EPO in 2020 1
INTER-AMERICAN TROPICAL TUNA COMMISSION
98TH MEETING (by videoconference) 23-27 August 2021
DOCUMENT IATTC-98-01 REPORT ON THE TUNA FISHERY, STOCKS, AND ECOSYSTEM IN
THE EASTERN PACIFIC OCEAN IN 2020
A. The fishery for tunas and billfishes in the eastern Pacific Ocean ....................................................... 3 B. Yellowfin tuna ................................................................................................................................... 49 C. Skipjack tuna ..................................................................................................................................... 66 D. Bigeye tuna ....................................................................................................................................... 71 E. Pacific bluefin tuna ........................................................................................................................... 86 F. Albacore tuna .................................................................................................................................... 90 G. Swordfish .......................................................................................................................................... 97 H. Blue marlin ...................................................................................................................................... 101 I. Striped marlin .................................................................................................................................. 102 J. Sailfish ............................................................................................................................................ 104 K. Silky shark ....................................................................................................................................... 107 L. Ecosystem considerations ............................................................................................................... 109
INTRODUCTION
This report provides a summary of the catches and effort in 2020 of the fishery for tunas in the eastern Pacific Ocean (EPO), for whose management the Inter-American Tropical Tuna Commission (IATTC) is responsible. It is based on data available to the IATTC staff in March 2021; therefore, some of the data for 2020 are incomplete, and all data for 2019 and 2020 should be considered preliminary. All weights of catches and discards are in metric tons (t). In the tables, 0 means no effort, or a catch of less than 0.5 t; - means no data collected; * means data missing or not available. The following acronyms are used:
Species: ALB Albacore tuna (Thunnus alalunga) BET Bigeye tuna (Thunnus obesus) BIL Unidentified istiophorid billfishes BKJ Black skipjack (Euthynnus lineatus) BLM Black marlin (Makaira indica) BUM Blue marlin (Makaira nigricans) BZX Bonito (Sarda spp.) MLS Striped marlin (Kajikia audax) PBF Pacific bluefin tuna (Thunnus orientalis) SFA Indo-Pacific sailfish (Istiophorus
platypterus) SKJ Skipjack tuna (Katsuwonus pelamis) SSP Shortbill spearfish (Tetrapturus
angustirostris)
1 Used to group known gear types
SWO Swordfish (Xiphias gladius) TUN Unidentified tunas YFT Yellowfin tuna (Thunnus albacares) Fishing gears: FPN Trap GN Gillnet HAR Harpoon LL Longline LP Pole and line LTL Troll LX Hook and line OTR Other1 UNK Unknown PS Purse seine RG Recreational

IATTC-98-01 - Fisheries, stocks, and the ecosystem in the EPO in 2020 2
TX Trawl Ocean areas: EPO Eastern Pacific Ocean WCPO Western and Central Pacific
Ocean Set types: DEL Dolphin NOA Unassociated school OBJ Floating object LOG: Flotsam FAD: Fish-aggregating device
Flags: IATTC Members & Cooperating Non-Members BLZ Belize BOL Bolivia CAN Canada CHL Chile CHN China COL Colombia CRI Costa Rica ECU Ecuador EUR European Union EU (CYP) Cyprus EU (ESP) Spain EU (PRT) Portugal FRA France FRA (PYF) French Polynesia GTM Guatemala HND Honduras IDN Indonesia JPN Japan KIR Kiribati KOR Republic of Korea LBR Liberia MEX Mexico NIC Nicaragua PAN Panama PER Peru SLV El Salvador TWN Chinese Taipei USA United States of America VEN Venezuela VUT Vanuatu Other flag codes COK Cook Islands NZL New Zealand RUS Russia
VCT St. Vincent and the Grenadines UNK Unknown
Stock assessment: B Biomass C Catch CPUE Catch per unit of effort F Rate of fishing mortality MSY Maximum sustainable yield S Index of spawning biomass SBR Spawning biomass ratio SSB Spawning stock biomass
IATTC-98-01 - Fisheries, stocks, and the ecosystem in the EPO in 2020 3
A. THE FISHERY FOR TUNAS AND BILLFISHES IN THE EASTERN PACIFIC OCEAN
Introduction ................................................................................................................................................... 3 1. Catches and landings of tunas, billfishes, and associated species ....................................................... 3 2. Catches by species ............................................................................................................................... 4 3. Catches and fishing effort ................................................................................................................... 6 4. Distributions of the catches of tropical tunas ...................................................................................... 7 5. Size compositions of the catches of tunas ........................................................................................... 7 6. The fleets ............................................................................................................................................. 9
INTRODUCTION
This document summarizes the catches and effort of the fisheries for species covered by the IATTC’s Antigua Convention (“tunas and tuna-like species and other species of fish taken by vessels fishing for tunas and tuna-like species”) in the eastern Pacific Ocean (EPO) in 2020. The most important of these species are the scombrids (family Scombridae), which include tunas, bonitos, seerfishes, and some mackerels. The principal species of tunas caught are the three tropical tuna species (yellowfin, skipjack, and bigeye), followed by the temperate tunas (albacore, and lesser catches of Pacific bluefin); other scombrids, such as bonitos and wahoo, are also caught. In addition to the tunas, this document covers the billfishes (swordfish, marlins, shortbill spearfish, and sailfish).
There are important fisheries for dorado, sharks, and other species and groups that interact with the tuna fisheries in the EPO and are thus within the IATTC’s remit. Information on these other species such as carangids (yellowtail, rainbow runner, and jack mackerel), dorado, elasmobranchs (sharks, rays, and skates), among others, is provided in Document SAC-12-12, Ecosystem considerations.
Access to the fisheries is regulated by Resolution C-02-03, which allows only vessels on the IATTC Regional Vessel Register to fish for tunas in the EPO. Vessels are authorized to fish by their respective flag governments, and only duly authorized vessels are included in the Register. The Register lists, in addition to a vessel’s name and flag, its fishing gear, dimensions, carrying capacity, date of construction, ownership, home port, and other characteristics. However, this requirement has not been applied to the thousands of small artisanal vessels, called pangas, that are known to catch tunas, among other species, in coastal waters of the EPO, but data on their numbers, effort, and catches are incomplete or unavailable. A pilot program, focused on sharks, to collect data on these fisheries in Central America is ongoing (SAC-11-14). The results of the pilot study will offer guidance in the development of a long-term sampling program in the region.
The IATTC staff has collected and compiled data on the longline fisheries since 1952, on catches of yellowfin and skipjack since 1954, bluefin since 1973, and bigeye since 1975. The data in this report, which are as accurate and complete as possible, are derived from various sources, including vessel logbooks, on-board observer data, unloading records provided by canners and other processors, export and import records, reports from governments and other entities, and the IATTC species and size composition sampling program.
1. CATCHES AND LANDINGS OF TUNAS, BILLFISHES, AND ASSOCIATED SPECIES
Almost all the catches in the EPO are made by the purse-seine and longline fleets; pole-and-line vessels, and various artisanal and recreational fisheries, account for a small percentage of the total catches. The IATTC staff compiles catch data for all fishing gears, including trolls, harpoons, and gillnets.
Detailed catch data are available for the purse-seine fishery, which takes over 90% of the total reported catches; the data for the other fisheries are incomplete. Purse-seine data for 2019 and 2020, and 2018-2020 data for longlines and other gears, are preliminary.
Since 1993 all Class-62 purse-seine vessels carry observers, who collect detailed data on catches, including
2 Class 6: carrying capacity greater than 363 metric tons (t)
IATTC-98-01 - Fisheries, stocks, and the ecosystem in the EPO in 2020 4
those discarded at sea. Estimates of the “retained” catch (the portion of the total catch that is landed) are based principally on data collected during vessel unloadings.
Longline vessels, particularly the larger ones, fish primarily for bigeye, yellowfin, albacore, and swordfish. Data on the retained catches of most of the larger longline vessels are obtained from the vessels’ flag governments; data for smaller longliners, artisanal vessels, and other vessels that fish for species covered by the Antigua Convention are incomplete or unavailable, but some are obtained from vessel logbooks, or from governments or governmental reports.
Data for the western and central Pacific Ocean (WCPO) are taken from the Tuna Fishery Yearbook for 2019, published by the Western and Central Pacific Fisheries Commission (WCPFC).
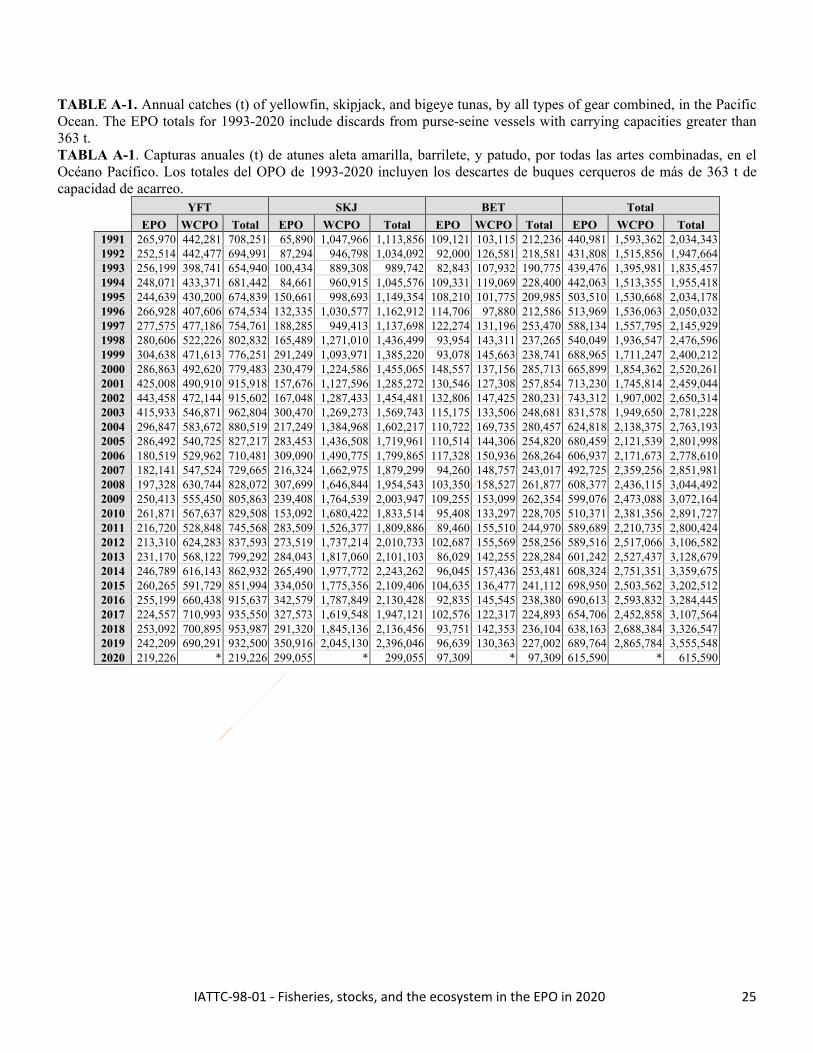
This report summarizes data from all the above sources. The estimated total catches of tropical tunas (yellowfin, skipjack, and bigeye) in the entire Pacific Ocean are shown in Table A-1 and are discussed further in the sections below.
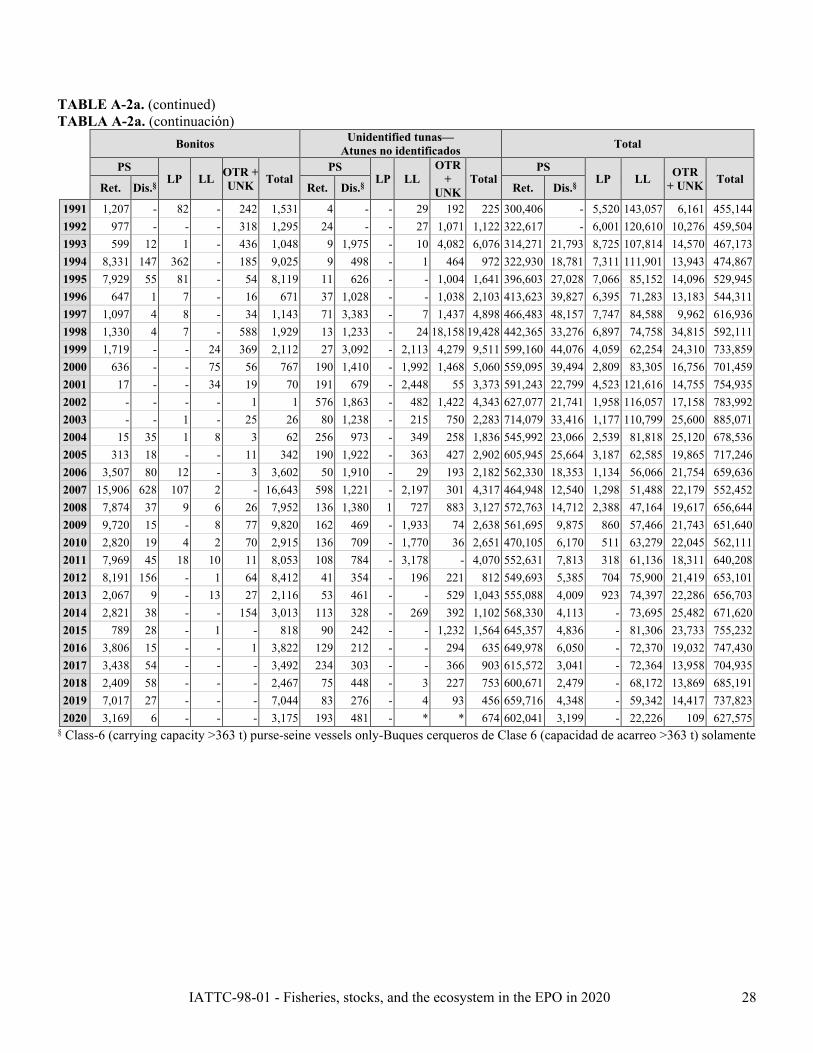
Estimates of the annual retained and discarded catches of tunas and other species taken by tuna-fishing vessels in the EPO during 1991-2020 are shown in Tables A-2a-b.
The catches of tropical tunas during 1991-2020, by flag, are shown in Tables A-3a-e, and the purse-seine catches and landings of tunas during 2019-2020 are summarized by flag in Tables A-4a-b.
2. CATCHES BY SPECIES
2.1. Yellowfin tuna
The total annual catches of yellowfin in the Pacific Ocean during 1991-2020 are shown in Table A-1. The 2020 EPO catch of 219 thousand t is 6% less than the average of 233 thousand t for the previous 5-year period (2015-2019). In the WCPO, the catches of yellowfin reached a record high of 711 thousand t in 2017.
The annual retained catches of yellowfin in the EPO, by gear, during 1991-2020 are shown in Table A-2a. Over the most recent 15-year period (2005-2019), the annual retained purse-seine and pole-and-line catches have fluctuated around an average of 221 thousand t (range: 167 to 270 thousand t). The preliminary estimate of the retained catch in 2020, 219 thousand t, is 4% less than that of 2019, but 1% less than the 2005-2019 average. On average, about 0.4% (range: 0.1 to 1.0%) of the total purse-seine catch of yellowfin was discarded at sea during 2005-2019 (Table A-2a).
During 1991-2005, annual longline catches in the EPO averaged about 22 thousand t (range: 12 to 31 thousand t), or about 7% of the total retained catches of yellowfin. They then declined sharply, to an annual average of 10 thousand t (range: 8 to 13 thousand t), or about 4% of the total retained catches, during 2006-2019. Catches by other fisheries (recreational, gillnet, troll, artisanal, etc.), whether incidental or targeted, are shown in Table A-2a, under “Other gears” (OTR); during 2006-2019 they averaged about 2 thousand t.
2.2. Skipjack tuna
The total annual catches of skipjack in the Pacific Ocean during 1991-2020 are shown in Table A-1. Most of the catch is taken in the WCPO. Prior to 1998, WCPO catches averaged about 900 thousand t; subsequently, they increased steadily, from 1.1 million t to an all-time high of 2 million t in 2019. In the EPO, the greatest catches occurred between 2004 and 2020, ranging from 153 to 351 thousand t, the record catch in 2019.
The annual retained catches of skipjack in the EPO, by gear, during 1991-2020 are shown in Table A-2a. During 2005-2019 the annual retained purse-seine and pole-and-line catch averaged 277 thousand t (range: 147 to 347 thousand t). The preliminary estimate of the retained catch in 2020, 297 thousand t, is 7% greater than the 15-year average for 2005-2019.
Discards of skipjack at sea decreased each year during the period, from 6% in 2005 to a low of less than 1% in 2018, averaging about 2% of the total catch of the species (Table A-2a).

IATTC-98-01 - Fisheries, stocks, and the ecosystem in the EPO in 2020 5
Catches of skipjack in the EPO by longlines and other gears are negligible (Table A-2a).
2.3. Bigeye tuna
The total annual catches of bigeye in the Pacific Ocean during 1991-2020 are shown in Table A-1. Overall, the catches in both the EPO and WCPO have increased, but with considerable fluctuations. In the WCPO they averaged more than 77 thousand t during the late 1970s, decreased during the early 1980s, and then increased steadily to 127 thousand t in 1992; they jumped to 146 thousand t in 1999, and reached a high of 170 thousand t in 2004, since when they have fluctuated between 122 and 159 thousand t. In the EPO, the average catch during 1991-2020 was 104 thousand t, with a low of 75 thousand t in 2020 and a high of 149 thousand t in 2000.
The annual retained catches of bigeye in the EPO by purse-seine and pole-and-line vessels during 1991-2020 are shown in Table A-2a. The introduction of fish-aggregating devices (FADs), placed in the water by fishers to attract tunas, in 1993 led to a sudden and dramatic increase in the purse-seine catches. Prior to 1993, the annual retained purse-seine catch of bigeye in the EPO was about 5 thousand t (Table A-2a); by 1994 it was 35 thousand t, and in 1996 was over 60 thousand t. During 1998-2019 it has fluctuated between 44 and 95 thousand t; the preliminary estimate for 2020 is 75 thousand t.
During 2000-2020 the percentage of the purse-seine catch of bigeye discarded at sea has steadily decreased, from 5% in 2000 to less than 1% in 2014 and 2020, averaging about 1.6%.
Before the expansion of the FAD fishery, longliners caught almost all the bigeye in the EPO, averaging 88 thousand t annually during 1985-1992. Since 1993, the annual average catch has declined by 51%, to 43 thousand t, and the preliminary estimate for 2020 is less than 23 thousand t (Table A-2a).
Small amounts of bigeye are caught in the EPO by other gears (Table A-2a).
2.4. Pacific bluefin tuna
The catches of Pacific bluefin in the entire Pacific Ocean, by flag and gear, as reported by the vessels’ flag governments to the International Scientific Committee for Tuna and Tuna-like Species in the North Pacific Ocean (ISC), are shown in Table A-5a.
The catches of Pacific bluefin in the EPO during 1991-2020, by gear, are shown in Table A-2a. In recent years, purse-seine vessels accounted for over 93% of the annual catch. The 1991-2019 average EPO retained catch is 3.7 thousand t (range: 400 t to 9.9 thousand t); the preliminary estimate for 2020 is 3.4 thousand t (Table A-2a).
Catches of Pacific bluefin by recreational gear in the EPO are reported in numbers of individual fish caught, whereas all other gears report catches in weight; the data are therefore converted to weights for inclusion in the EPO catch totals. The original catch data for 1991-2020, in numbers of fish, are presented in Table A-5b.
2.5. Albacore tuna
Data provided by the relevant CPCs on catches of albacore in the EPO, by gear and area (north and south of the equator), are shown in Table A-6, and for the entire EPO in Table A-2a. A portion of the albacore catch is taken by troll vessels (LTL), included under “Other gears” (OTR) in Table A-2a.
2.6. Other tunas and tuna-like species
While yellowfin, skipjack, and bigeye tunas comprise the great majority of the retained purse-seine catches in the EPO, other tunas and tuna-like species, such as albacore, black skipjack, bonito, frigate and bullet tunas, contribute to the overall harvest. The estimated annual retained and discarded catches of these species during 1991-2020 are shown in Table A-2a. The catches reported in the “unidentified tunas” (TUN) category in Table A-2a contain some catches reported by species (frigate and bullet tunas) along with the unidentified tunas. The total retained catch of these other species by the purse-seine fishery in 2020 was
IATTC-98-01 - Fisheries, stocks, and the ecosystem in the EPO in 2020 6
7.3 thousand t, less than the 2005-2019 average of 9.1 thousand t (range: 2 to 19 thousand t).
Black skipjack are also caught by other gears in the EPO, mostly by coastal artisanal fisheries. Bonitos are also caught by artisanal fisheries, and have been reported as catch by longline vessels in some years.
2.7. Billfishes
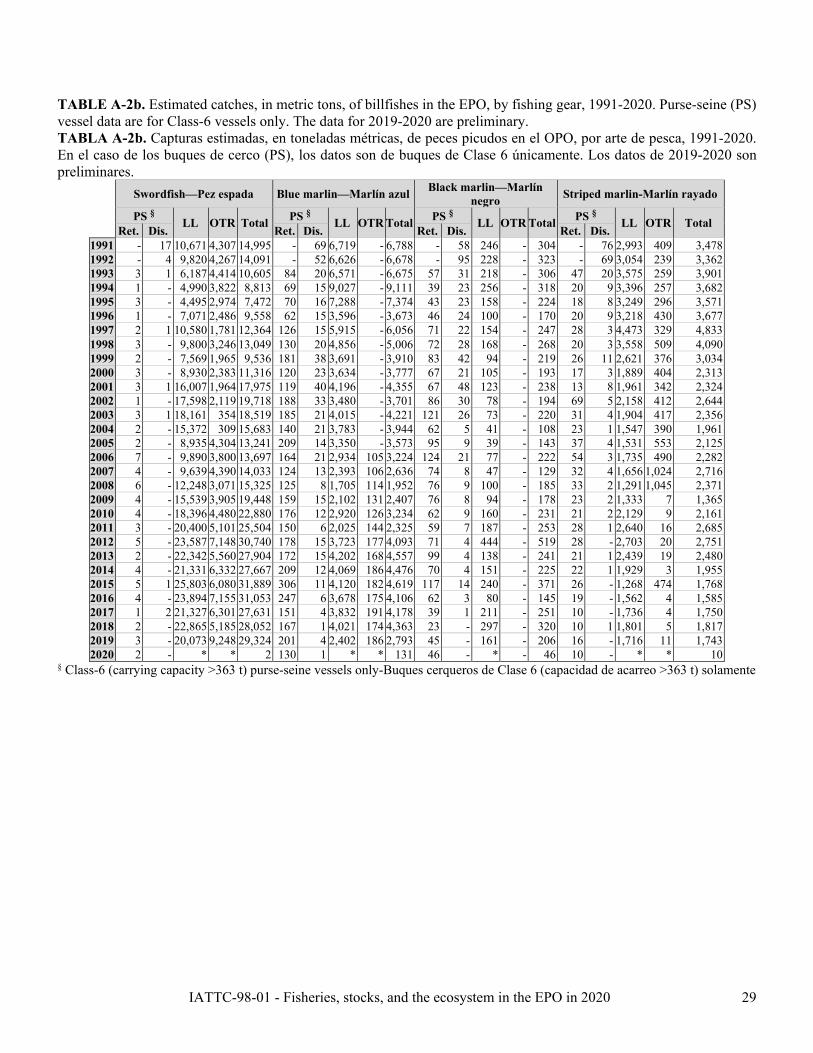
Catch data for billfishes (swordfish, blue marlin, black marlin, striped marlin, shortbill spearfish, and sailfish) are shown in Table A-2b.
Swordfish are caught in the EPO with large-scale and artisanal longlines, gillnets, harpoons, and occasionally with recreational gear. During 1999-2013 the longline catch averaged 15 thousand t, but during 2014-2016 this increased by about 50%, to over 23 thousand t, possibly due to increased abundance of swordfish, increased effort directed toward the species, increased reporting, or a combination of all of these.
Other billfishes are caught with large-scale and artisanal longlines and recreational gear. The average annual longline catches of blue marlin and striped marlin during 2005-2019 were about 3.2 thousand and 1.8 thousand t, respectively. Smaller amounts of other billfishes are taken by longline.
Little information is available on the recreational catches of billfishes, but, the retained catches are believed to be substantially less than the commercial catches for all species, due to catch-and-release practices.
Billfishes are caught incidentally in the purse-seine fisheries, which during 2005-2019 accounted for about 1% of the total catch of billfishes in the EPO. Prior to 2011, they were all classified as discarded dead; however, the growing rate of retention of such bycatches made it important to reflect this in the data, and since 2011 retained catch and discards are reported separately in Table A-2b.
3. CATCHES AND FISHING EFFORT
3.1. Purse seine
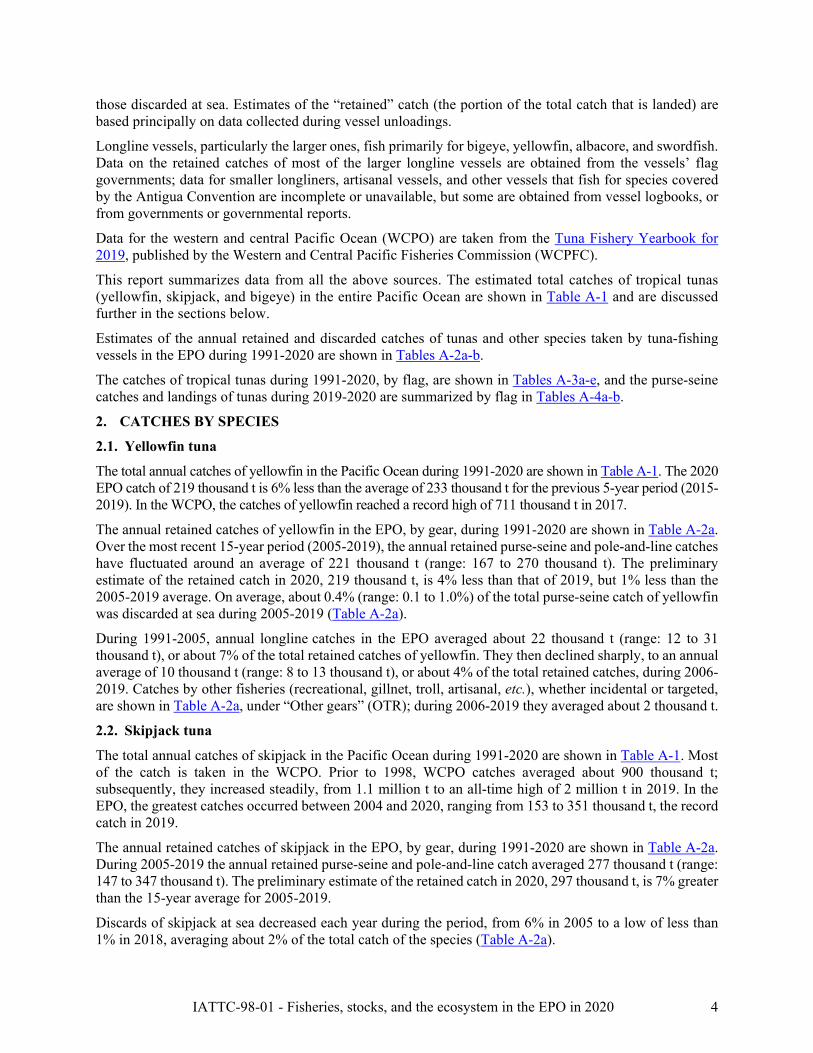
Estimates of the numbers of purse-seine sets of each type (associated with dolphins (DEL), associated with floating objects (OBJ), and unassociated (NOA)) in the EPO during 2005-2020, and the retained catches from those sets, are shown in Table A-7 and Figure 1.3 The estimates for Class 1-54 vessels were calculated from logbook data in the IATTC statistical data base, and those for Class-6 vessels from the observer data bases of the IATTC, Colombia, Ecuador, the European Union, Mexico, Nicaragua, Panama, the United States, and Venezuela.
Since the introduction of artificial fish-aggregating devices (FADs) in the mid-1990s, they have become predominant in the floating-object fishery, and now account for an estimated 98% of all floating-object
3 The catch data for 2005-2020 incorporate previously unavailable data, and are thus different from the
corresponding data presented in previous publications. 4 ≤363 t carrying capacity
FIGURE 1. Purse-seine catches of tunas, by
species and set type, 2005-2020
IATTC-98-01 - Fisheries, stocks, and the ecosystem in the EPO in 2020 7
sets by Class-6 vessels (Table A-8).
3.2. Longline
The reported nominal fishing effort (in thousands of hooks) by longline vessels in the EPO, and their catches of the predominant tuna species, are shown in Table A-9.
4. DISTRIBUTIONS OF THE CATCHES OF TROPICAL TUNAS
4.1. Purse-seine catches
The average annual distributions of purse-seine catches, by set type, of tropical tunas (yellowfin, skipjack, and bigeye) in the EPO during 2015-2019 are shown in Figures A-1a, A-2a, and A-3a, respectively, and preliminary estimates for 2020 are shown in Figures A-1b, A-2b, and A-3b.
Yellowfin: The majority of catches in 2020 were taken in sets associated with dolphins in two principal areas: north of 5°N from 105°W to 135°W, and inshore north of the equator from 100°W to the coast. Lesser amounts were taken in dolphin and floating-object sets throughout the EPO south of 10°N (Figure A-1b).
Skipjack is caught primarily in unassociated tuna sets and floating object sets. The majority of catches in 2020 were taken south of 10°N throughout the EPO, in sets associated with floating objects and in unassociated tuna sets east of 100°W and south along the coast. Unlike previous years, the majority of the skipjack catch far offshore near the western border of the EPO was taken in floating object sets, while more of the skipjack catch near the coast of the Americas was taken in unassociated tuna sets. (Figure A-2b).
Bigeye are not often caught north of about 7°N in the EPO. Almost all of the 2020 catches were taken in sets on FADs far offshore close to the equator, with a lesser concentration around 10°S between 105°W and 120°W (Figure A-3b).
4.2. Longline catches
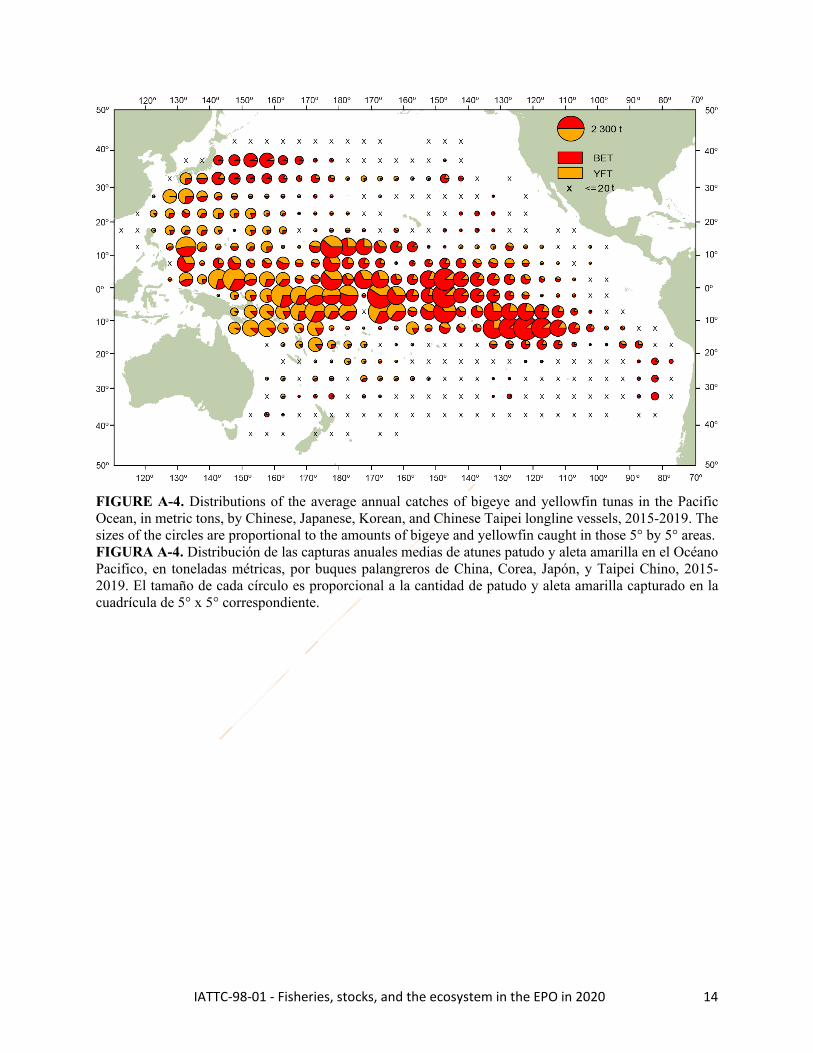
Since 2009, the IATTC has received tuna catch and effort data from Belize, China, France (French Polynesia), Japan, the Republic of Korea, Panama, Chinese Taipei, the United States, and Vanuatu. Albacore, bigeye and yellowfin tunas make up the majority of the catches by most of these vessels. The distributions of the catches of bigeye and yellowfin in the Pacific Ocean by Chinese, Japanese, Korean, and Chinese Taipei longline vessels during 2015-2019 are shown in Figure A-4.
5. SIZE COMPOSITIONS OF THE CATCHES OF TUNAS
5.1. Purse-seine, pole-and-line, and recreational fisheries
Length-frequency samples are the basic source of data used for estimating the size and age compositions of the various species of fish in the landings. This information is necessary to obtain age-structured estimates of the populations for various purposes, primarily the integrated modeling that the staff uses to assess the status of the stocks (see Stock Assessment Reports). Length-frequency samples are obtained from the catches of purse-seine vessels in the EPO by IATTC personnel at ports of landing in Ecuador, Mexico, Panama, and Venezuela. The methods for sampling the catches of tunas are described in the IATTC Annual Report for 2000 and in IATTC Stock Assessment Reports 2 and 4.
Historical long-term time series of size-composition data for yellowfin and bigeye are available in the Stock Assessment Reports, and average length stock status indicators (SSIs) are available for yellowfin, bigeye and skipjack (SAC-12-05). In this report, data on the size composition of the catches during 2015-2020 are presented (Figures A-6 to A-8), with two sets of length-frequency histograms for each species: the first shows the data for 2020 by stratum (gear type, set type, and area), and the second the combined data for each year of the 2015-2020 period.
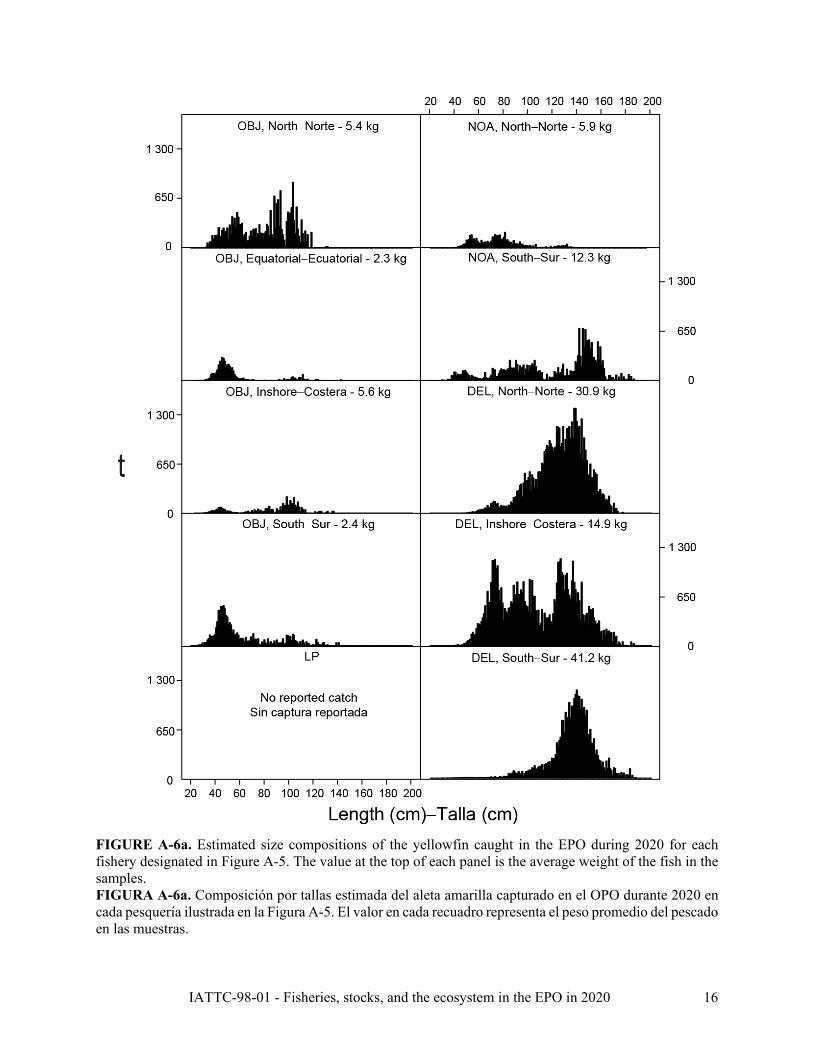
Yellowfin: nine purse-seine fisheries (four associated with floating objects (OBJ), three associated with dolphins (DEL), and two unassociated (NOA)) and one pole-and-line (LP) fishery, which includes

IATTC-98-01 - Fisheries, stocks, and the ecosystem in the EPO in 2020 8
all 13 sampling areas) are defined (Figure A-5). Of the 448 wells sampled during 2020, 354 contained yellowfin. The estimated size compositions of the fish caught are shown in Figure A-6a. Most of the yellowfin catch was taken in the DEL fisheries during the first half of the year, with smaller amounts taken in the OBJ-N fishery in the first quarter and the NOA-N fishery in the second quarter. Large yellowfin (140-160 cm) were caught in the NOA-S fishery in the second quarter, while yellowfin in the 110-150 cm range were caught in the DEL-N fishery throughout the year. Smaller yellowfin (<60 cm) were taken in the OBJ fishery primarily in the first and second quarters.
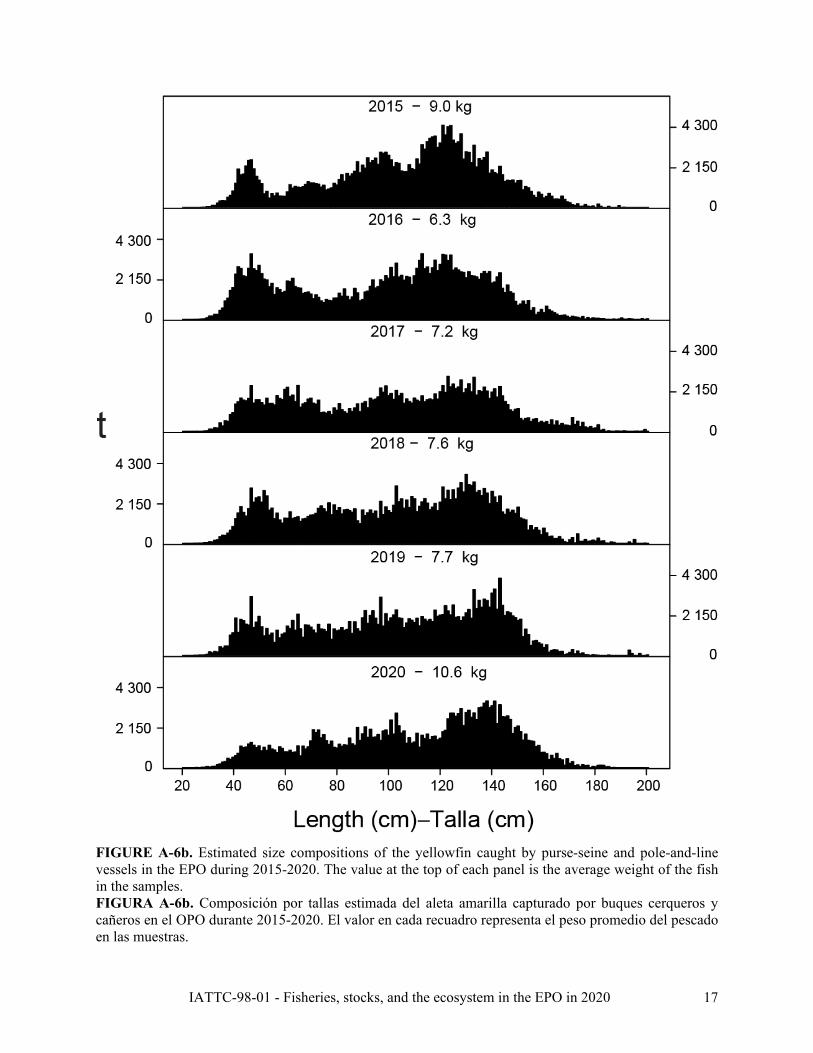
The estimated size compositions of the yellowfin caught by all fisheries combined during 2015-2020 are shown in Figure A-6b. The average weight of yellowfin in 2020, 10.6 kg, was much higher than the previous 4 years (6.3-7.7 kg), and the size distribution also showed a trend toward larger fish, with the greatest quantity around the 100-150 cm range.
Skipjack: seven purse-seine fisheries (four OBJ, two NOA, one DEL) and one LP fishery are defined (Figure A-5); the last two include all 13 sampling areas. Of the 448 wells sampled, 243 contained skipjack. The estimated size compositions of the fish caught during 2020 are shown in Figure A-7a. Most of the skipjack catch was taken in the OBJ-N, OBJ-E and OBJ-S fisheries in the second, third and fourth quarters, and in the NOA-S fishery in the first and second quarters. Larger skipjack (60-70 cm) were caught in the NOA-S fishery in the second quarter. The smallest (<40 cm) were caught primarily in the OBJ-N, OBJ-E and OBJ-S fisheries in the third quarter, and in the OBJ-S fishery in the fourth quarter.
The estimated size compositions of skipjack caught by all fisheries combined during 2015-2020 are shown in Figure A-7b. The average weight of skipjack in 2020 (2.0 kg) was consistent with previous years (1.8-2.2 kg).
Bigeye: six purse-seine fisheries (four OBJ, one NOA, one DEL) and one LP fishery are defined (Figure A-5); all except the OBJ fisheries include all 13 sampling areas. Of the 448 wells sampled, 77 contained bigeye. The estimated size compositions of the fish caught during 2020 are shown in Figure A-8a. Most of the bigeye catch was taken in the OBJ-N fishery in the first and second quarters, and in the OBJ-S fishery throughout the year. Lesser amounts were caught in the OBJ-E fishery in the third quarter.
The estimated size compositions of bigeye caught by all fisheries combined during 2015-2020 are shown in Figure A-8b. The average weight of bigeye in 2020 (5.1 kg) was slightly higher than the previous five years (4.7-5.0 kg). More large bigeye in the 50-100 cm range was caught in 2020 than in previous years, while less of the largest bigeye (>120 cm) was caught.
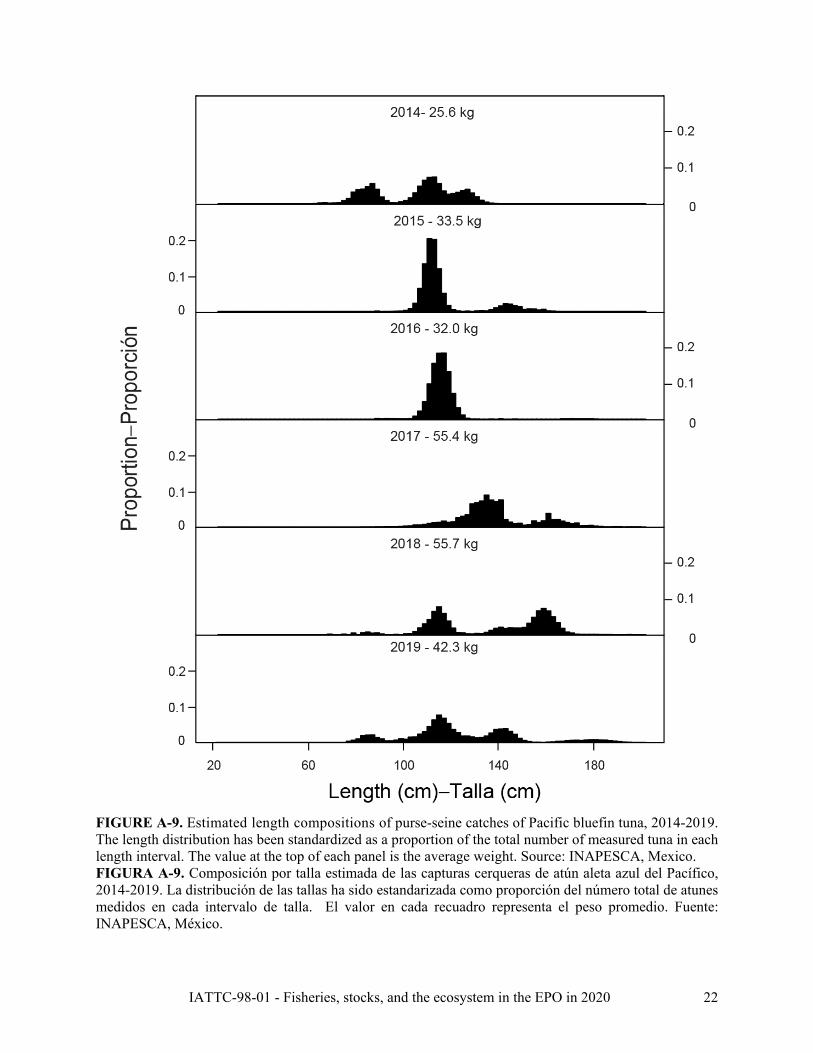
Pacific bluefin are caught by purse-seine and recreational gears off California and Baja California, historically from about 23°N to 35°N, but only between 28°N and 32°N in recent years. The 2020 purse-seine fishing season continued the trend of starting earlier than any previous year: in 2020, bluefin were first caught in early January, and the fishery was closed in early February, when the annual catch limit was reached. Most of the catch is transported live to grow-out pens near the coast of Mexico. Mexico’s National Fisheries Institute (INAPESCA) provided length-composition data for purse-seine catches during 2014-2019 (Figure A-9). PBF length composition data from INAPESCA for 2020 was not available at the time of preparation of this report.
FIGURE 2. Carrying capacity, in cubic meters of well volume, of the purse-seine and pole-and-line fleets in the EPO, 1961-2020

IATTC-98-01 - Fisheries, stocks, and the ecosystem in the EPO in 2020 9
5.2. Longline fishery
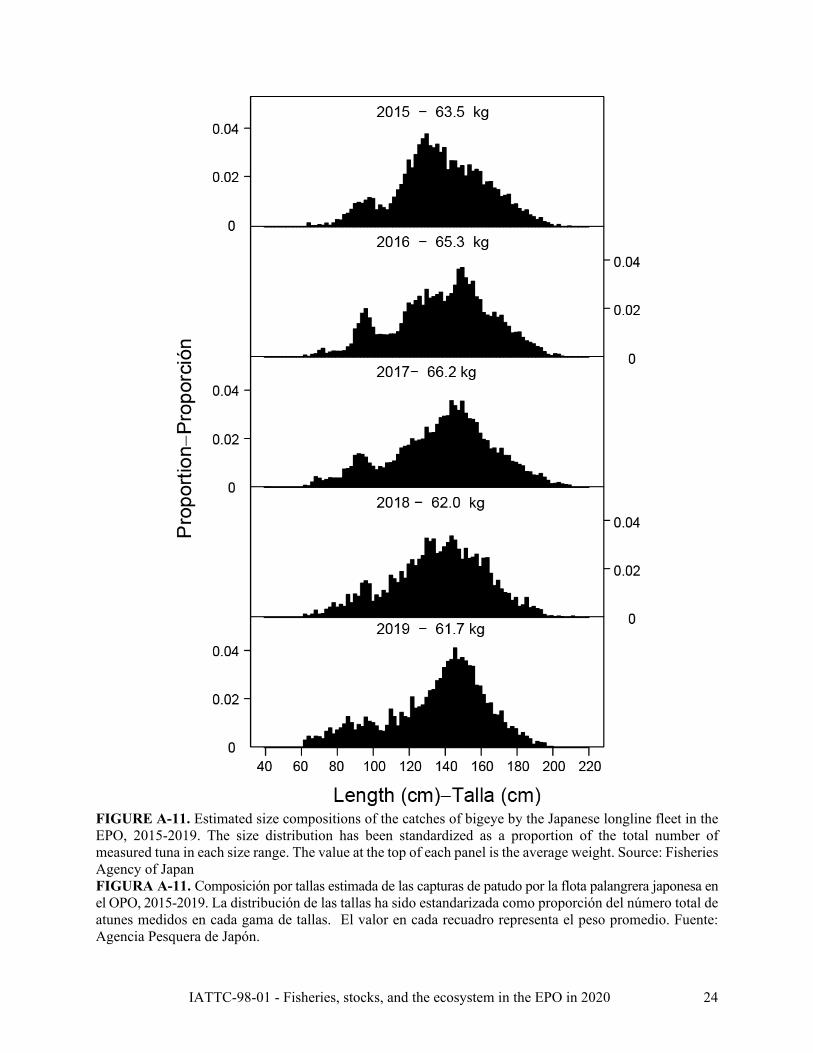
The size compositions of yellowfin and bigeye caught by the Japanese longline fleet (commercial and training vessels) in the EPO during 2015-2019 are shown in Figures A-10 and A-11. The average annual weight during that period ranged from 36.8 to 61.0 kg for yellowfin, and from 61.7 kg to 66.2 kg for bigeye.
5.3. Catches of tunas, by flag and gear
The annual retained catches of tunas in the EPO during 1991-2020, by flag and gear, are shown in Tables A-3a-e. The purse-seine catches of tunas in 2019 and 2020, by flag and species, are summarized in Table A-4a. Of the nearly 602 thousand t of tunas caught in 2020, 46% were caught by Ecuadorian vessels, and 20% by Mexican vessels. Other countries with significant catches included Panama (12%), Colombia (6%), Venezuela (5%), United States (4%), Nicaragua (3%) and Peru (1%). The purse-seine landings of tunas in 2019 and 2020, by species and country of landing, are summarized in Table A-4b. Of the more than 610 thousand t of tunas landed in the EPO in 2020, 64% were landed in Ecuadorian ports, and 20% in Mexican ports. Other countries with landings of tunas in the EPO included Colombia (5%), Peru (2%) and the United States (1%).
6. THE FLEETS
6.1. Purse seine
The IATTC Regional Vessel Register contains detailed records of all purse-seine vessels that are authorized to fish for tunas in the EPO. However, only vessels that fished for yellowfin, skipjack, bigeye, and/or Pacific bluefin tuna in the EPO in 2020 are included in the following description of the purse-seine fleet.
The IATTC uses well volume, in cubic meters (m3), to measure the carrying capacity of purse-seine vessels. Reliable well volume data are available for almost all purse-seine vessels; the well volume of vessels lacking such data is calculated by applying a conversion factor to their capacity in tons (Table A-10; Figure 2).
The 2019 and preliminary 2020 data for numbers and total well volumes of purse-seine vessels that fished for tunas in the EPO are shown in Tables A-11a and A-11b. During 2020, the fleet was dominated by Ecuadorian and Mexican vessels, with about 36% and 24%, respectively, of the total well volume; they were followed by the Panama (11%), United States (7%), Venezuela (7%), Colombia (6%), El Savador (3%), Nicaragua (2%), Peru (2%) and the European Union (Spain) (2%).5
The cumulative capacity at sea during 2020 is compared to those of the previous five years in Figure 3.
The monthly average, minimum, and maximum total well volumes at sea (VAS), in thousands of cubic meters, of purse-seine and pole-and-line vessels that fished for tunas in the EPO during 2010-2019, and the 2020 values, are shown in Table A-12. The monthly values are averages of the VAS estimated at weekly intervals by the IATTC staff. The average VAS values for 2010-2019 and 2020 were slightly over 142 thousand m3 (59% of total capacity) and about 130 thousand m3 (54% of total capacity), respectively.
5 The sum of the percentages may not add up to 100% due to rounding.
FIGURE 3. Cumulative capacity of the purse-seine and pole-
and-line fleet at sea, by month, 2015-2020
IATTC-98-01 - Fisheries, stocks, and the ecosystem in the EPO in 2020 10
6.2. Other fleets of the EPO
Information on other types of vessels that are authorized to fish in the EPO is available in the IATTC’s Regional Vessel Register. In some cases, particularly for large longline vessels, the Register contains information for vessels authorized to fish not only in the EPO, but also in other oceans, and which may not have fished in the EPO during 2020, or ever.

IATTC-98-01 - Fisheries, stocks, and the ecosystem in the EPO in 2020 11
FIGURE A-1a. Average annual distributions of the purse-seine catches of yellowfin, by set type, 2015-2019. The sizes of the circles are proportional to the amounts of yellowfin caught in those 5° by 5° areas. FIGURA A-1a. Distribución media anual de las capturas cerqueras de aleta amarilla, por tipo de lance, 2015-2019. El tamaño de cada círculo es proporcional a la cantidad de aleta amarilla capturado en la cuadrícula de 5° x 5° correspondiente.
FIGURE A-1b. Annual distributions of the purse-seine catches of yellowfin, by set type, 2020. The sizes of the circles are proportional to the amounts of yellowfin caught in those 5° by 5° areas. FIGURA A-1b. Distribución anual de las capturas cerqueras de aleta amarilla, por tipo de lance, 2020. El tamaño de cada círculo es proporcional a la cantidad de aleta amarilla capturado en la cuadrícula de 5° x 5° correspondiente.

IATTC-98-01 - Fisheries, stocks, and the ecosystem in the EPO in 2020 12
FIGURE A-2a. Average annual distributions of the purse-seine catches of skipjack, by set type, 2015-2019. The sizes of the circles are proportional to the amounts of skipjack caught in those 5° by 5° areas. FIGURA A-2a. Distribución media anual de las capturas cerqueras de barrilete, por tipo de lance, 2015-2019. El tamaño de cada círculo es proporcional a la cantidad de barrilete capturado en la cuadrícula de 5° x 5° correspondiente.
FIGURE A-2b. Annual distributions of the purse-seine catches of skipjack, by set type, 2020. The sizes of the circles are proportional to the amounts of skipjack caught in those 5° by 5° areas. FIGURA A-2b. Distribución anual de las capturas cerqueras de barrilete, por tipo de lance, 2020. El tamaño de cada círculo es proporcional a la cantidad de barrilete capturado en la cuadrícula de 5° x 5° correspondiente.

IATTC-98-01 - Fisheries, stocks, and the ecosystem in the EPO in 2020 13
FIGURE A-3a. Average annual distributions of the purse-seine catches of bigeye, by set type, 2015-2019. The sizes of the circles are proportional to the amounts of bigeye caught in those 5° by 5° areas. FIGURA A-3a. Distribución media anual de las capturas cerqueras de patudo, por tipo de lance, 2015-2019. El tamaño de cada círculo es proporcional a la cantidad de patudo capturado en la cuadrícula de 5° x 5° correspondiente.
FIGURE A-3b. Annual distributions of the purse-seine catches of bigeye, by set type, 2020. The sizes of the circles are proportional to the amounts of bigeye caught in those 5° by 5° areas. FIGURA A-3b. Distribución anual de las capturas cerqueras de patudo, por tipo de lance, 2020. El tamaño de cada círculo es proporcional a la cantidad de patudo capturado en la cuadrícula de 5° x 5° correspondiente.
IATTC-98-01 - Fisheries, stocks, and the ecosystem in the EPO in 2020 14
FIGURE A-4. Distributions of the average annual catches of bigeye and yellowfin tunas in the Pacific Ocean, in metric tons, by Chinese, Japanese, Korean, and Chinese Taipei longline vessels, 2015-2019. The sizes of the circles are proportional to the amounts of bigeye and yellowfin caught in those 5° by 5° areas. FIGURA A-4. Distribución de las capturas anuales medias de atunes patudo y aleta amarilla en el Océano Pacifico, en toneladas métricas, por buques palangreros de China, Corea, Japón, y Taipei Chino, 2015-2019. El tamaño de cada círculo es proporcional a la cantidad de patudo y aleta amarilla capturado en la cuadrícula de 5° x 5° correspondiente.

IATTC-98-01 - Fisheries, stocks, and the ecosystem in the EPO in 2020 15
FIGURE A-5. The purse-seine fisheries defined by the IATTC staff for analyses of yellowfin, skipjack, and bigeye in the EPO. The thin lines indicate the boundaries of the 13 length-frequency sampling areas, and the bold lines the boundaries of the fisheries. FIGURA A-5. Las pesquerías cerqueras definidas por el personal de la CIAT para los análisis de los atunes aleta amarilla, barrilete, y patudo en el OPO. Las líneas delgadas indican los límites de las 13 zonas de muestreo de frecuencia de tallas, y las líneas gruesas los límites de las pesquerías.
IATTC-98-01 - Fisheries, stocks, and the ecosystem in the EPO in 2020 16
FIGURE A-6a. Estimated size compositions of the yellowfin caught in the EPO during 2020 for each fishery designated in Figure A-5. The value at the top of each panel is the average weight of the fish in the samples. FIGURA A-6a. Composición por tallas estimada del aleta amarilla capturado en el OPO durante 2020 en cada pesquería ilustrada en la Figura A-5. El valor en cada recuadro representa el peso promedio del pescado en las muestras.
IATTC-98-01 - Fisheries, stocks, and the ecosystem in the EPO in 2020 17
FIGURE A-6b. Estimated size compositions of the yellowfin caught by purse-seine and pole-and-line vessels in the EPO during 2015-2020. The value at the top of each panel is the average weight of the fish in the samples. FIGURA A-6b. Composición por tallas estimada del aleta amarilla capturado por buques cerqueros y cañeros en el OPO durante 2015-2020. El valor en cada recuadro representa el peso promedio del pescado en las muestras.

IATTC-98-01 - Fisheries, stocks, and the ecosystem in the EPO in 2020 18
FIGURE A-7a. Estimated size compositions of the skipjack caught in the EPO during 2020 for each fishery designated in Figure A-5. The value at the top of each panel is the average weight of the fish in the samples. FIGURA A-7a. Composición por tallas estimada del barrilete capturado en el OPO durante 2020 en cada pesquería ilustrada en la Figura A-5. El valor en cada recuadro representa el peso promedio del pescado en las muestras.

IATTC-98-01 - Fisheries, stocks, and the ecosystem in the EPO in 2020 19
FIGURE A-7b. Estimated size compositions of the skipjack caught by purse-seine and pole-and-line vessels in the EPO during 2015-2020. The value at the top of each panel is the average weight of the fish in the samples. FIGURA A-7b. Composición por tallas estimada del barrilete capturado por buques cerqueros y cañeros en el OPO durante 2015-2020. El valor en cada recuadro representa el peso promedio del pescado en las muestras.

IATTC-98-01 - Fisheries, stocks, and the ecosystem in the EPO in 2020 20
FIGURE A-8a. Estimated size compositions of the bigeye caught in the EPO during 2020 for each fishery designated in Figure A-5. The value at the top of each panel is the average weight. FIGURA A-8a. Composición por tallas estimada del patudo capturado en el OPO durante 2020 en cada pesquería ilustrada en la Figura A-5. El valor en cada recuadro representa el peso promedio del pescado en las muestras.

IATTC-98-01 - Fisheries, stocks, and the ecosystem in the EPO in 2020 21
FIGURE A-8b. Estimated size compositions of the bigeye caught by purse-seine vessels in the EPO during 2015-2020. The value at the top of each panel is the average weight. FIGURA A-8b. Composición por tallas estimada del patudo capturado por buques cerqueros en el OPO durante 2015-2020. El valor en cada recuadro representa el peso promedio del pescado en las muestras.
IATTC-98-01 - Fisheries, stocks, and the ecosystem in the EPO in 2020 22
FIGURE A-9. Estimated length compositions of purse-seine catches of Pacific bluefin tuna, 2014-2019. The length distribution has been standardized as a proportion of the total number of measured tuna in each length interval. The value at the top of each panel is the average weight. Source: INAPESCA, Mexico. FIGURA A-9. Composición por talla estimada de las capturas cerqueras de atún aleta azul del Pacífico, 2014-2019. La distribución de las tallas ha sido estandarizada como proporción del número total de atunes medidos en cada intervalo de talla. El valor en cada recuadro representa el peso promedio. Fuente: INAPESCA, México.

IATTC-98-01 - Fisheries, stocks, and the ecosystem in the EPO in 2020 23
FIGURE A-10. Estimated size compositions of the catches of yellowfin by the Japanese longline fleet in the EPO, 2015-2019. The size distribution has been standardized as a proportion of the total number of measured tuna in each size range. The value at the top of each panel is the average weight. Source: Fisheries Agency of Japan. FIGURA A-10. Composición por tallas estimada de las capturas de aleta amarilla por la flota palangrera japonesa en el OPO, 2015-2019. La distribución de las tallas ha sido estandarizada como proporción del número total de atunes medidos en cada gama de tallas. El valor en cada recuadro representa el peso promedio. Fuente: Agencia Pesquera de Japón.
IATTC-98-01 - Fisheries, stocks, and the ecosystem in the EPO in 2020 24
FIGURE A-11. Estimated size compositions of the catches of bigeye by the Japanese longline fleet in the EPO, 2015-2019. The size distribution has been standardized as a proportion of the total number of measured tuna in each size range. The value at the top of each panel is the average weight. Source: Fisheries Agency of Japan FIGURA A-11. Composición por tallas estimada de las capturas de patudo por la flota palangrera japonesa en el OPO, 2015-2019. La distribución de las tallas ha sido estandarizada como proporción del número total de atunes medidos en cada gama de tallas. El valor en cada recuadro representa el peso promedio. Fuente: Agencia Pesquera de Japón.
IATTC-98-01 - Fisheries, stocks, and the ecosystem in the EPO in 2020 25
TABLE A-1. Annual catches (t) of yellowfin, skipjack, and bigeye tunas, by all types of gear combined, in the Pacific Ocean. The EPO totals for 1993-2020 include discards from purse-seine vessels with carrying capacities greater than 363 t. TABLA A-1. Capturas anuales (t) de atunes aleta amarilla, barrilete, y patudo, por todas las artes combinadas, en el Océano Pacífico. Los totales del OPO de 1993-2020 incluyen los descartes de buques cerqueros de más de 363 t de capacidad de acarreo.
YFT SKJ BET Total EPO WCPO Total EPO WCPO Total EPO WCPO Total EPO WCPO Total
1991 265,970 442,281 708,251 65,890 1,047,966 1,113,856 109,121 103,115 212,236 440,981 1,593,362 2,034,343 1992 252,514 442,477 694,991 87,294 946,798 1,034,092 92,000 126,581 218,581 431,808 1,515,856 1,947,664 1993 256,199 398,741 654,940 100,434 889,308 989,742 82,843 107,932 190,775 439,476 1,395,981 1,835,457 1994 248,071 433,371 681,442 84,661 960,915 1,045,576 109,331 119,069 228,400 442,063 1,513,355 1,955,418 1995 244,639 430,200 674,839 150,661 998,693 1,149,354 108,210 101,775 209,985 503,510 1,530,668 2,034,178 1996 266,928 407,606 674,534 132,335 1,030,577 1,162,912 114,706 97,880 212,586 513,969 1,536,063 2,050,032 1997 277,575 477,186 754,761 188,285 949,413 1,137,698 122,274 131,196 253,470 588,134 1,557,795 2,145,929 1998 280,606 522,226 802,832 165,489 1,271,010 1,436,499 93,954 143,311 237,265 540,049 1,936,547 2,476,596 1999 304,638 471,613 776,251 291,249 1,093,971 1,385,220 93,078 145,663 238,741 688,965 1,711,247 2,400,212 2000 286,863 492,620 779,483 230,479 1,224,586 1,455,065 148,557 137,156 285,713 665,899 1,854,362 2,520,261 2001 425,008 490,910 915,918 157,676 1,127,596 1,285,272 130,546 127,308 257,854 713,230 1,745,814 2,459,044 2002 443,458 472,144 915,602 167,048 1,287,433 1,454,481 132,806 147,425 280,231 743,312 1,907,002 2,650,314 2003 415,933 546,871 962,804 300,470 1,269,273 1,569,743 115,175 133,506 248,681 831,578 1,949,650 2,781,228 2004 296,847 583,672 880,519 217,249 1,384,968 1,602,217 110,722 169,735 280,457 624,818 2,138,375 2,763,193 2005 286,492 540,725 827,217 283,453 1,436,508 1,719,961 110,514 144,306 254,820 680,459 2,121,539 2,801,998 2006 180,519 529,962 710,481 309,090 1,490,775 1,799,865 117,328 150,936 268,264 606,937 2,171,673 2,778,610 2007 182,141 547,524 729,665 216,324 1,662,975 1,879,299 94,260 148,757 243,017 492,725 2,359,256 2,851,981 2008 197,328 630,744 828,072 307,699 1,646,844 1,954,543 103,350 158,527 261,877 608,377 2,436,115 3,044,492 2009 250,413 555,450 805,863 239,408 1,764,539 2,003,947 109,255 153,099 262,354 599,076 2,473,088 3,072,164 2010 261,871 567,637 829,508 153,092 1,680,422 1,833,514 95,408 133,297 228,705 510,371 2,381,356 2,891,727 2011 216,720 528,848 745,568 283,509 1,526,377 1,809,886 89,460 155,510 244,970 589,689 2,210,735 2,800,424 2012 213,310 624,283 837,593 273,519 1,737,214 2,010,733 102,687 155,569 258,256 589,516 2,517,066 3,106,582 2013 231,170 568,122 799,292 284,043 1,817,060 2,101,103 86,029 142,255 228,284 601,242 2,527,437 3,128,679 2014 246,789 616,143 862,932 265,490 1,977,772 2,243,262 96,045 157,436 253,481 608,324 2,751,351 3,359,675 2015 260,265 591,729 851,994 334,050 1,775,356 2,109,406 104,635 136,477 241,112 698,950 2,503,562 3,202,512 2016 255,199 660,438 915,637 342,579 1,787,849 2,130,428 92,835 145,545 238,380 690,613 2,593,832 3,284,445 2017 224,557 710,993 935,550 327,573 1,619,548 1,947,121 102,576 122,317 224,893 654,706 2,452,858 3,107,564 2018 253,092 700,895 953,987 291,320 1,845,136 2,136,456 93,751 142,353 236,104 638,163 2,688,384 3,326,547 2019 242,209 690,291 932,500 350,916 2,045,130 2,396,046 96,639 130,363 227,002 689,764 2,865,784 3,555,548 2020 219,226 * 219,226 299,055 * 299,055 97,309 * 97,309 615,590 * 615,590

IATTC-98-01 - Fisheries, stocks, and the ecosystem in the EPO in 2020 26
TABLE A-2a. Estimated catches, in metric tons, of tunas and bonitos in the EPO, by fishing gear, 1991-2020. For purse-seine (PS) vessels, retained (Ret.) catches include all vessels; discard (Dis.) data are for Class-6 vessels only. ‘C’ indicates that the catch has been combined with the total in the ‘OTR’ column. The purse-seine and pole-and-line (LP) data for yellowfin, skipjack, and bigeye tunas have been adjusted to the species composition estimate, and are preliminary. The data for 2019-2020 are preliminary. TABLA A-2a. Capturas estimadas, en toneladas métricas, de atunes y bonitos en el OPO, por arte de pesca, 1991-2020. En el caso de los buques de cerco (PS), las capturas retenidas (Ret) incluyen todos los buques; los datos de descartes (Dis.) son de buques de Clase 6 únicamente. ’C’ indica que la captura se ha combinado con el total en la columna ‘OTR’. Los datos de los atunes aleta amarilla, barrilete, y patudo de las pesquerías de cerco y de caña (LP) fueron ajustados a la estimación de composición por especies, y son preliminares. Los datos de 2019-2020 son preliminares.
Yellowfin—Aleta amarilla Skipjack—Barrilete Bigeye—Patudo PS LP LL OTR +
UNK Total PS LP LL OTR + UNK Total PS LP LL OTR +
UNK Total Ret. Dis.§ Ret. Dis.§ Ret. Dis.§ 1991 231,257 - 2,856 30,899 958 265,970 62,228 - 1,717 36 1,909 65,890 4,870 - 31 104,195 25 109,121 1992 228,121 - 3,789 18,646 1,958 252,514 84,283 - 1,957 24 1,030 87,294 7,179 - - 84,808 13 92,000 1993 219,492 4,713 4,951 24,009 3,034 256,199 83,830 10,515 3,772 61 2,256 100,434 9,657 653 - 72,498 35 82,843 1994 208,408 4,525 3,625 30,026 1,487 248,071 70,126 10,491 3,240 73 731 84,661 34,899 2,266 - 71,360 806 109,331 1995 215,434 5,275 1,268 20,596 2,066 244,639 127,047 16,373 5,253 77 1,911 150,661 45,321 3,251 - 58,269 1,369 108,210 1996 238,607 6,312 3,762 16,608 1,639 266,928 103,973 24,494 2,555 52 1,261 132,335 61,311 5,689 - 46,958 748 114,706 1997 244,878 5,516 4,418 22,163 600 277,575 153,456 31,338 3,260 135 96 188,285 64,272 5,402 - 52,580 20 122,274 1998 253,959 4,697 5,085 15,336 1,529 280,606 140,631 22,643 1,684 294 237 165,489 44,129 2,822 - 46,375 628 93,954 1999 281,920 6,547 1,783 11,682 2,706 304,638 261,565 26,046 2,044 201 1,393 291,249 51,158 4,932 - 36,450 538 93,078 2000 253,263 6,205 2,431 23,855 1,109 286,863 205,647 24,467 231 68 66 230,479 95,282 5,417 - 47,605 253 148,557 2001 383,936 7,028 3,916 29,608 520 425,008 143,165 12,815 448 1,214 34 157,676 60,518 1,254 - 68,755 19 130,546 2002 412,286 4,140 950 25,531 551 443,458 153,546 12,506 616 261 119 167,048 57,421 949 - 74,424 12 132,806 2003 383,279 5,865 470 25,174 1,145 415,933 273,968 22,453 638 634 2,777 300,470 53,052 2,326 - 59,776 21 115,175 2004 272,557 3,000 1,884 18,779 627 296,847 197,824 17,078 528 713 1,106 217,249 65,471 1,574 - 43,483 194 110,722 2005 268,101 2,771 1,822 11,946 1,852 286,492 263,229 16,915 1,299 231 1,779 283,453 67,895 1,900 - 40,694 25 110,514 2006 166,631 1,534 686 10,210 1,458 180,519 296,268 11,177 435 224 986 309,090 83,838 1,680 - 31,770 40 117,328 2007 170,016 1,725 894 8,067 1,439 182,141 208,295 6,450 276 238 1,065 216,324 63,450 890 - 29,876 44 94,260 2008 185,057 696 814 9,820 941 197,328 296,603 8,249 499 1,185 1,163 307,699 75,028 2,086 - 26,208 28 103,350 2009 236,757 1,262 709 10,444 1,241 250,413 230,523 6,064 151 1,584 1,086 239,408 76,799 1,019 - 31,422 15 109,255 2010 251,009 1,031 460 8,339 1,032 261,871 147,192 2,769 47 1,815 1,269 153,092 57,752 564 - 37,090 2 95,408 2011 206,851 415 276 8,048 1,130 216,720 276,035 5,215 24 1,384 851 283,509 56,512 631 - 32,317 - 89,460 2012 198,017 451 400 12,954 1,488 213,310 266,215 3,511 303 2,381 1,109 273,519 66,020 473 - 36,167 27 102,687 2013 218,187 207 759 10,783 1,234 231,170 278,560 2,254 164 2,024 1,041 284,043 49,487 273 - 36,170 99 86,029 2014 234,066 517 C 8,649 3,557 246,789 261,469 2,596 C 194 1,231 265,490 60,445 83 - 35,340 177 96,045 2015 245,727 334 C 10,637 3,567 260,265 328,907 3,699 C 189 1,255 334,050 62,913 177 - 41,524 21 104,635 2016 242,118 404 - 9,807 2,871 255,199 337,561 4,086 - 214 718 342,579 56,731 541 - 35,541 22 92,835 2017 210,980 412 - 10,480 2,685 224,557 324,759 1,765 - 170 879 327,573 66,973 201 - 35,360 42 102,576 2018 238,981 231 - 12,468 1,412 253,092 288,821 865 - 1,221 413 291,320 64,523 145 - 29,065 18 93,751 2019 228,313 578 - 11,920 1,398 242,209 347,405 2,851 - 252 408 350,916 69,223 117 - 27,281 18 96,639 2020 219,078 148 - * * 219,226 297,299 1,756 - * * 299,055 74,981 102 - 22,226 * 97,309 § Class-6 (carrying capacity >363 t) purse-seine vessels only-Buques cerqueros de Clase 6 (capacidad de acarreo >363 t) solamente

IATTC-98-01 - Fisheries, stocks, and the ecosystem in the EPO in 2020 27
TABLE A-2a. (continued) TABLA A-2a. (continuación) Pacific bluefin—Aleta azul del Pacífico Albacore—Albacora Black skipjack—Barrilete negro PS
LP LL OTR + UNK Total
PS LP LL OTR +
UNK Total PS
LP LL OTR + UNK Total
Ret. Dis. § Ret. Dis. § Ret. Dis. § 1991 419 - - 5 55 479 - - 834 7,893 2,754 11,481 421 - - - 25 446 1992 1,928 - - 21 147 2,096 - - 255 17,080 5,740 23,075 105 - - 3 - 108 1993 580 - - 11 316 907 - - 1 11,194 4,410 15,605 104 3,925 - 31 - 4,060 1994 969 - - 12 116 1,097 - - 85 10,390 10,154 20,629 188 857 - 40 - 1,085 1995 659 - - 25 264 948 - - 465 6,185 7,427 14,077 202 1,448 - - - 1,650 1996 8,333 - - 19 83 8,435 11 - 72 7,631 8,398 16,112 704 2,304 - 12 - 3,020 1997 2,608 3 2 14 235 2,862 1 - 59 9,678 7,540 17,278 100 2,512 - 11 - 2,623 1998 1,772 - - 95 516 2,383 42 - 81 12,635 13,158 25,916 489 1,876 39 - - 2,404 1999 2,553 54 5 151 514 3,277 47 - 227 11,633 14,510 26,417 171 3,404 - - - 3,575 2000 3,712 - 61 46 349 4,168 71 - 86 9,663 13,453 23,273 294 1,995 - - - 2,289 2001 1,155 3 1 148 378 1,685 3 - 157 19,410 13,727 33,297 2,258 1,019 - - - 3,277 2002 1,758 1 3 71 620 2,453 31 - 381 15,289 14,433 30,134 1,459 2,283 8 - - 3,750 2003 3,233 - 3 87 369 3,692 34 - 59 24,901 20,397 45,391 433 1,535 6 13 117 2,104 2004 8,880 19 - 15 59 8,973 105 - 126 18,444 22,011 40,686 884 387 - 27 862 2,160 2005 4,743 15 - - 80 4,838 2 - 66 9,350 15,668 25,086 1,472 2,124 - - 22 3,618 2006 9,928 - - - 93 10,021 109 - 1 13,831 18,980 32,921 1,999 1,972 - - - 3,971 2007 4,189 - - - 14 4,203 187 - 21 11,107 19,261 30,576 2,307 1,625 - 2 54 3,988 2008 4,392 14 15 - 63 4,484 49 - 1,050 9,218 16,505 26,822 3,624 2,251 - - 8 5,883 2009 3,428 24 - - 161 3,613 50 2 C 12,072 19,090 31,214 4,256 1,020 - 2 - 5,278 2010 7,746 - - 3 89 7,838 25 - C 14,256 19,363 33,644 3,425 1,079 - 8 184 4,696 2011 2,829 4 - 1 244 3,078 10 - C 16,191 16,074 32,275 2,317 719 - 6 - 3,042 2012 6,705 - - 1 405 7,111 - - C 24,198 18,100 42,298 4,504 440 - 5 7 4,956 2013 3,154 - - 1 819 3,974 - - C 25,396 18,513 43,909 3,580 805 - 10 24 4,419 2014 5,263 66 - - 427 5,756 - - C 29,231 19,463 48,694 4,153 486 - 11 81 4,731 2015 3,168 - - 15 405 3,588 - - C 28,939 17,142 46,081 3,763 356 - 1 111 4,231 2016 3,025 - - 31 381 3,437 2 - - 26,777 14,567 41,346 6,606 792 - - 178 7,576 2017 4,109 - - 22 470 4,601 - - - 26,332 9,463 35,795 5,079 306 - - 53 5,438 2018 2,852 - - 31 527 3,410 8 - - 25,384 11,154 36,546 3,002 732 - - 118 3,852 2019 2,475 - - 36 440 2,951 - - - 19,849 11,929 31,778 5,200 499 - - 131 5,830 2020 3,383 19 - * 109 3,511 - - - * * * 3,938 687 - - * 4,625
§ Class-6 (carrying capacity >363 t) purse-seine vessels only-Buques cerqueros de Clase 6 (capacidad de acarreo >363 t) solamente
IATTC-98-01 - Fisheries, stocks, and the ecosystem in the EPO in 2020 28
TABLE A-2a. (continued) TABLA A-2a. (continuación)
Bonitos Unidentified tunas— Atunes no identificados Total
PS LP LL OTR +
UNK Total PS
LP LL OTR
+ UNK
Total PS
LP LL OTR + UNK Total Ret. Dis.§ Ret. Dis.§ Ret. Dis.§
1991 1,207 - 82 - 242 1,531 4 - - 29 192 225 300,406 - 5,520 143,057 6,161 455,144 1992 977 - - - 318 1,295 24 - - 27 1,071 1,122 322,617 - 6,001 120,610 10,276 459,504 1993 599 12 1 - 436 1,048 9 1,975 - 10 4,082 6,076 314,271 21,793 8,725 107,814 14,570 467,173 1994 8,331 147 362 - 185 9,025 9 498 - 1 464 972 322,930 18,781 7,311 111,901 13,943 474,867 1995 7,929 55 81 - 54 8,119 11 626 - - 1,004 1,641 396,603 27,028 7,066 85,152 14,096 529,945 1996 647 1 7 - 16 671 37 1,028 - - 1,038 2,103 413,623 39,827 6,395 71,283 13,183 544,311 1997 1,097 4 8 - 34 1,143 71 3,383 - 7 1,437 4,898 466,483 48,157 7,747 84,588 9,962 616,936 1998 1,330 4 7 - 588 1,929 13 1,233 - 24 18,158 19,428 442,365 33,276 6,897 74,758 34,815 592,111 1999 1,719 - - 24 369 2,112 27 3,092 - 2,113 4,279 9,511 599,160 44,076 4,059 62,254 24,310 733,859 2000 636 - - 75 56 767 190 1,410 - 1,992 1,468 5,060 559,095 39,494 2,809 83,305 16,756 701,459 2001 17 - - 34 19 70 191 679 - 2,448 55 3,373 591,243 22,799 4,523 121,616 14,755 754,935 2002 - - - - 1 1 576 1,863 - 482 1,422 4,343 627,077 21,741 1,958 116,057 17,158 783,992 2003 - - 1 - 25 26 80 1,238 - 215 750 2,283 714,079 33,416 1,177 110,799 25,600 885,071 2004 15 35 1 8 3 62 256 973 - 349 258 1,836 545,992 23,066 2,539 81,818 25,120 678,536 2005 313 18 - - 11 342 190 1,922 - 363 427 2,902 605,945 25,664 3,187 62,585 19,865 717,246 2006 3,507 80 12 - 3 3,602 50 1,910 - 29 193 2,182 562,330 18,353 1,134 56,066 21,754 659,636 2007 15,906 628 107 2 - 16,643 598 1,221 - 2,197 301 4,317 464,948 12,540 1,298 51,488 22,179 552,452 2008 7,874 37 9 6 26 7,952 136 1,380 1 727 883 3,127 572,763 14,712 2,388 47,164 19,617 656,644 2009 9,720 15 - 8 77 9,820 162 469 - 1,933 74 2,638 561,695 9,875 860 57,466 21,743 651,640 2010 2,820 19 4 2 70 2,915 136 709 - 1,770 36 2,651 470,105 6,170 511 63,279 22,045 562,111 2011 7,969 45 18 10 11 8,053 108 784 - 3,178 - 4,070 552,631 7,813 318 61,136 18,311 640,208 2012 8,191 156 - 1 64 8,412 41 354 - 196 221 812 549,693 5,385 704 75,900 21,419 653,101 2013 2,067 9 - 13 27 2,116 53 461 - - 529 1,043 555,088 4,009 923 74,397 22,286 656,703 2014 2,821 38 - - 154 3,013 113 328 - 269 392 1,102 568,330 4,113 - 73,695 25,482 671,620 2015 789 28 - 1 - 818 90 242 - - 1,232 1,564 645,357 4,836 - 81,306 23,733 755,232 2016 3,806 15 - - 1 3,822 129 212 - - 294 635 649,978 6,050 - 72,370 19,032 747,430 2017 3,438 54 - - - 3,492 234 303 - - 366 903 615,572 3,041 - 72,364 13,958 704,935 2018 2,409 58 - - - 2,467 75 448 - 3 227 753 600,671 2,479 - 68,172 13,869 685,191 2019 7,017 27 - - - 7,044 83 276 - 4 93 456 659,716 4,348 - 59,342 14,417 737,823 2020 3,169 6 - - - 3,175 193 481 - * * 674 602,041 3,199 - 22,226 109 627,575
§ Class-6 (carrying capacity >363 t) purse-seine vessels only-Buques cerqueros de Clase 6 (capacidad de acarreo >363 t) solamente
IATTC-98-01 - Fisheries, stocks, and the ecosystem in the EPO in 2020 29
TABLE A-2b. Estimated catches, in metric tons, of billfishes in the EPO, by fishing gear, 1991-2020. Purse-seine (PS) vessel data are for Class-6 vessels only. The data for 2019-2020 are preliminary. TABLA A-2b. Capturas estimadas, en toneladas métricas, de peces picudos en el OPO, por arte de pesca, 1991-2020. En el caso de los buques de cerco (PS), los datos son de buques de Clase 6 únicamente. Los datos de 2019-2020 son preliminares.
Swordfish—Pez espada Blue marlin—Marlín azul Black marlin—Marlín negro Striped marlin-Marlín rayado
PS § LL OTR Total PS § LL OTR Total PS § LL OTR Total PS § LL OTR Total Ret. Dis. Ret. Dis. Ret. Dis. Ret. Dis.
1991 - 17 10,671 4,307 14,995 - 69 6,719 - 6,788 - 58 246 - 304 - 76 2,993 409 3,478 1992 - 4 9,820 4,267 14,091 - 52 6,626 - 6,678 - 95 228 - 323 - 69 3,054 239 3,362 1993 3 1 6,187 4,414 10,605 84 20 6,571 - 6,675 57 31 218 - 306 47 20 3,575 259 3,901 1994 1 - 4,990 3,822 8,813 69 15 9,027 - 9,111 39 23 256 - 318 20 9 3,396 257 3,682 1995 3 - 4,495 2,974 7,472 70 16 7,288 - 7,374 43 23 158 - 224 18 8 3,249 296 3,571 1996 1 - 7,071 2,486 9,558 62 15 3,596 - 3,673 46 24 100 - 170 20 9 3,218 430 3,677 1997 2 1 10,580 1,781 12,364 126 15 5,915 - 6,056 71 22 154 - 247 28 3 4,473 329 4,833 1998 3 - 9,800 3,246 13,049 130 20 4,856 - 5,006 72 28 168 - 268 20 3 3,558 509 4,090 1999 2 - 7,569 1,965 9,536 181 38 3,691 - 3,910 83 42 94 - 219 26 11 2,621 376 3,034 2000 3 - 8,930 2,383 11,316 120 23 3,634 - 3,777 67 21 105 - 193 17 3 1,889 404 2,313 2001 3 1 16,007 1,964 17,975 119 40 4,196 - 4,355 67 48 123 - 238 13 8 1,961 342 2,324 2002 1 - 17,598 2,119 19,718 188 33 3,480 - 3,701 86 30 78 - 194 69 5 2,158 412 2,644 2003 3 1 18,161 354 18,519 185 21 4,015 - 4,221 121 26 73 - 220 31 4 1,904 417 2,356 2004 2 - 15,372 309 15,683 140 21 3,783 - 3,944 62 5 41 - 108 23 1 1,547 390 1,961 2005 2 - 8,935 4,304 13,241 209 14 3,350 - 3,573 95 9 39 - 143 37 4 1,531 553 2,125 2006 7 - 9,890 3,800 13,697 164 21 2,934 105 3,224 124 21 77 - 222 54 3 1,735 490 2,282 2007 4 - 9,639 4,390 14,033 124 13 2,393 106 2,636 74 8 47 - 129 32 4 1,656 1,024 2,716 2008 6 - 12,248 3,071 15,325 125 8 1,705 114 1,952 76 9 100 - 185 33 2 1,291 1,045 2,371 2009 4 - 15,539 3,905 19,448 159 15 2,102 131 2,407 76 8 94 - 178 23 2 1,333 7 1,365 2010 4 - 18,396 4,480 22,880 176 12 2,920 126 3,234 62 9 160 - 231 21 2 2,129 9 2,161 2011 3 - 20,400 5,101 25,504 150 6 2,025 144 2,325 59 7 187 - 253 28 1 2,640 16 2,685 2012 5 - 23,587 7,148 30,740 178 15 3,723 177 4,093 71 4 444 - 519 28 - 2,703 20 2,751 2013 2 - 22,342 5,560 27,904 172 15 4,202 168 4,557 99 4 138 - 241 21 1 2,439 19 2,480 2014 4 - 21,331 6,332 27,667 209 12 4,069 186 4,476 70 4 151 - 225 22 1 1,929 3 1,955 2015 5 1 25,803 6,080 31,889 306 11 4,120 182 4,619 117 14 240 - 371 26 - 1,268 474 1,768 2016 4 - 23,894 7,155 31,053 247 6 3,678 175 4,106 62 3 80 - 145 19 - 1,562 4 1,585 2017 1 2 21,327 6,301 27,631 151 4 3,832 191 4,178 39 1 211 - 251 10 - 1,736 4 1,750 2018 2 - 22,865 5,185 28,052 167 1 4,021 174 4,363 23 - 297 - 320 10 1 1,801 5 1,817 2019 3 - 20,073 9,248 29,324 201 4 2,402 186 2,793 45 - 161 - 206 16 - 1,716 11 1,743 2020 2 - * * 2 130 1 * * 131 46 - * - 46 10 - * * 10
§ Class-6 (carrying capacity >363 t) purse-seine vessels only-Buques cerqueros de Clase 6 (capacidad de acarreo >363 t) solamente

IATTC-98-01 - Fisheries, stocks, and the ecosystem in the EPO in 2020 30
TABLE A-2b. (continued) TABLA A-2b. (continuación)
Shortbill spearfish— Marlín trompa corta
Sailfish— Pez vela
Unidentified istiophorid billfishes—Picudos istio-fóridos no identificados
Total billfishes— Total de peces picudos
PS § LL OTR Total PS § LL OTR Total PS § LL OTR Total PS § LL OTR Total Ret. Dis. Ret. Dis. Ret. Dis. Ret. Dis. 1991 - - 1 - 1 - - 717 - 717 - - 112 - 112 - 220 21,459 4,716 26,395 1992 - 1 1 - 2 - - 1,351 - 1,351 - - 1,123 - 1,123 - 221 22,203 4,506 26,930 1993 - - 1 - 1 26 32 2,266 - 2,324 29 68 1,650 - 1,747 246 172 20,468 4,673 25,559 1994 - - 144 - 144 19 21 1,682 - 1,722 7 16 1,028 - 1,051 155 84 20,523 4,079 24,841 1995 1 - 155 - 156 12 15 1,351 - 1,378 4 9 232 - 245 151 71 16,928 3,270 20,420 1996 1 - 126 - 127 10 12 738 - 760 6 13 308 - 327 146 73 15,157 2,916 18,292 1997 1 - 141 - 142 12 11 1,891 - 1,914 3 5 1,324 - 1,332 243 57 24,478 2,110 26,888 1998 - - 200 - 200 28 31 1,382 - 1,441 5 7 575 55 642 258 89 20,539 3,810 24,696 1999 1 - 278 - 279 33 8 1,216 - 1,257 6 12 1,136 - 1,154 332 111 16,605 2,341 19,389 2000 1 - 285 - 286 33 17 1,380 - 1,430 3 6 880 136 1,025 244 70 17,103 2,923 20,340 2001 - - 304 - 304 18 45 1,539 325 1,927 2 5 1,741 204 1,952 222 147 25,871 2,835 29,075 2002 1 - 273 - 274 19 15 1,792 17 1,843 4 5 1,862 14 1,885 368 88 27,241 2,562 30,259 2003 1 4 290 - 295 38 49 1,174 - 1,261 6 5 1,389 - 1,400 385 110 27,006 771 28,272 2004 1 - 207 - 208 19 13 1,400 17 1,449 4 4 1,385 - 1,393 251 44 23,735 716 24,746 2005 1 - 229 - 230 32 11 805 15 863 5 3 901 - 909 381 41 15,790 4,872 21,084 2006 1 - 231 - 232 30 13 1,007 35 1,085 23 4 490 1 518 403 62 16,364 4,431 21,260 2007 1 - 239 - 240 41 8 1,032 64 1,145 13 4 1,171 15 1,203 289 37 16,177 5,599 22,102 2008 1 - 266 - 267 28 7 524 72 631 16 5 1,587 8 1,616 285 31 17,721 4,310 22,347 2009 1 - 446 - 447 17 6 327 8 358 11 1 1,799 12 1,823 291 32 21,640 4,063 26,026 2010 1 - 519 - 520 27 20 655 3 705 8 2 2,604 - 2,614 299 45 27,383 4,618 32,345 2011 - - 462 - 462 18 5 658 28 709 15 1 2,377 3 2,396 273 20 28,749 5,292 34,334 2012 1 - 551 - 552 14 2 685 15 716 10 1 2,178 - 2,189 307 22 33,871 7,360 41,560 2013 1 - 913 - 914 16 2 614 9 641 15 3 2,743 1 2,762 326 25 33,391 5,757 39,499 2014 - - 721 - 721 16 1 481 8 506 8 2 220 3 233 329 20 28,902 6,532 35,783 2015 1 - 497 - 498 18 8 1,402 22 1,450 19 1 705 4 729 492 35 34,036 6,762 41,325 2016 1 - 416 - 417 49 9 457 19 534 112 9 732 1 854 494 27 30,818 7,353 38,692 2017 - - 245 - 245 22 2 525 15 564 164 12 258 15 449 387 21 28,135 6,526 35,069 2018 - - 235 - 235 13 2 467 17 499 123 6 203 10 342 338 10 29,888 5,391 35,627 2019 - - 813 - 813 17 1 856 5 879 121 5 416 51 593 403 11 26,436 9,501 36,351 2020 - - * - * 19 1 * * 20 72 2 * * 74 279 5 * * 284
§ Class-6 (carrying capacity >363 t) purse-seine vessels only-Buques cerqueros de Clase 6 (capacidad de acarreo >363 t) solamente
IATTC-98-01 - Fisheries, stocks, and the ecosystem in the EPO in 2020 31
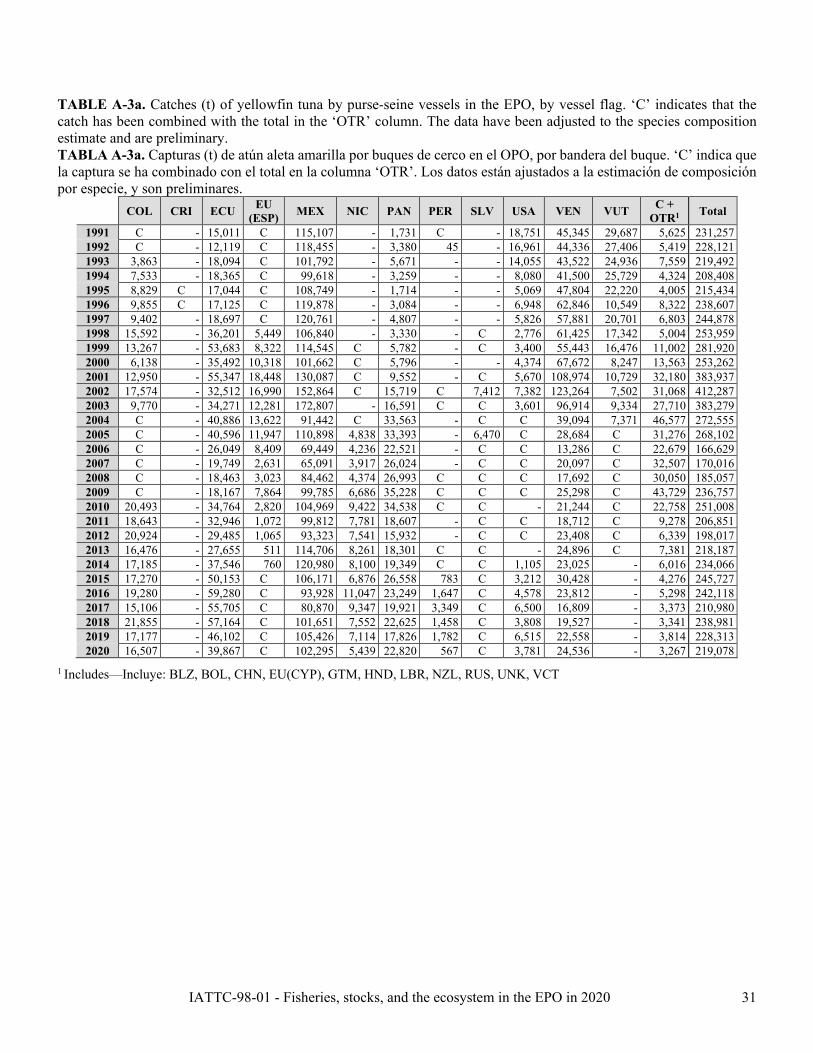
TABLE A-3a. Catches (t) of yellowfin tuna by purse-seine vessels in the EPO, by vessel flag. ‘C’ indicates that the catch has been combined with the total in the ‘OTR’ column. The data have been adjusted to the species composition estimate and are preliminary. TABLA A-3a. Capturas (t) de atún aleta amarilla por buques de cerco en el OPO, por bandera del buque. ‘C’ indica que la captura se ha combinado con el total en la columna ‘OTR’. Los datos están ajustados a la estimación de composición por especie, y son preliminares.
COL CRI ECU EU (ESP) MEX NIC PAN PER SLV USA VEN VUT C +
OTR1 Total
1991 C - 15,011 C 115,107 - 1,731 C - 18,751 45,345 29,687 5,625 231,257 1992 C - 12,119 C 118,455 - 3,380 45 - 16,961 44,336 27,406 5,419 228,121 1993 3,863 - 18,094 C 101,792 - 5,671 - - 14,055 43,522 24,936 7,559 219,492 1994 7,533 - 18,365 C 99,618 - 3,259 - - 8,080 41,500 25,729 4,324 208,408 1995 8,829 C 17,044 C 108,749 - 1,714 - - 5,069 47,804 22,220 4,005 215,434 1996 9,855 C 17,125 C 119,878 - 3,084 - - 6,948 62,846 10,549 8,322 238,607 1997 9,402 - 18,697 C 120,761 - 4,807 - - 5,826 57,881 20,701 6,803 244,878 1998 15,592 - 36,201 5,449 106,840 - 3,330 - C 2,776 61,425 17,342 5,004 253,959 1999 13,267 - 53,683 8,322 114,545 C 5,782 - C 3,400 55,443 16,476 11,002 281,920 2000 6,138 - 35,492 10,318 101,662 C 5,796 - - 4,374 67,672 8,247 13,563 253,262 2001 12,950 - 55,347 18,448 130,087 C 9,552 - C 5,670 108,974 10,729 32,180 383,937 2002 17,574 - 32,512 16,990 152,864 C 15,719 C 7,412 7,382 123,264 7,502 31,068 412,287 2003 9,770 - 34,271 12,281 172,807 - 16,591 C C 3,601 96,914 9,334 27,710 383,279 2004 C - 40,886 13,622 91,442 C 33,563 - C C 39,094 7,371 46,577 272,555 2005 C - 40,596 11,947 110,898 4,838 33,393 - 6,470 C 28,684 C 31,276 268,102 2006 C - 26,049 8,409 69,449 4,236 22,521 - C C 13,286 C 22,679 166,629 2007 C - 19,749 2,631 65,091 3,917 26,024 - C C 20,097 C 32,507 170,016 2008 C - 18,463 3,023 84,462 4,374 26,993 C C C 17,692 C 30,050 185,057 2009 C - 18,167 7,864 99,785 6,686 35,228 C C C 25,298 C 43,729 236,757 2010 20,493 - 34,764 2,820 104,969 9,422 34,538 C C - 21,244 C 22,758 251,008 2011 18,643 - 32,946 1,072 99,812 7,781 18,607 - C C 18,712 C 9,278 206,851 2012 20,924 - 29,485 1,065 93,323 7,541 15,932 - C C 23,408 C 6,339 198,017 2013 16,476 - 27,655 511 114,706 8,261 18,301 C C - 24,896 C 7,381 218,187 2014 17,185 - 37,546 760 120,980 8,100 19,349 C C 1,105 23,025 - 6,016 234,066 2015 17,270 - 50,153 C 106,171 6,876 26,558 783 C 3,212 30,428 - 4,276 245,727 2016 19,280 - 59,280 C 93,928 11,047 23,249 1,647 C 4,578 23,812 - 5,298 242,118 2017 15,106 - 55,705 C 80,870 9,347 19,921 3,349 C 6,500 16,809 - 3,373 210,980 2018 21,855 - 57,164 C 101,651 7,552 22,625 1,458 C 3,808 19,527 - 3,341 238,981 2019 17,177 - 46,102 C 105,426 7,114 17,826 1,782 C 6,515 22,558 - 3,814 228,313 2020 16,507 - 39,867 C 102,295 5,439 22,820 567 C 3,781 24,536 - 3,267 219,078
1 Includes—Incluye: BLZ, BOL, CHN, EU(CYP), GTM, HND, LBR, NZL, RUS, UNK, VCT

IATTC-98-01 - Fisheries, stocks, and the ecosystem in the EPO in 2020 32
TABLE A-3b. Annual catches (t) of yellowfin tuna by longline vessels, and totals for all gears, in the EPO, by vessel flag. ‘C’ indicates that the catch has been combined with the total in the ‘OTR’ column. The data for 2019-2020 are preliminary. TABLA A-3b. Capturas anuales (t) de atún aleta amarilla por buques de palangre en el OPO, y totales de todas las artes, por bandera del buque. ’C’ indica que la captura se ha combinado con el total en la columna ‘OTR’. Los datos de 2019-2020 son preliminares.
CHN CRI FRA (PYF) JPN KOR MEX PAN TWN USA VUT C +
OTR1 Total LL
Total PS+LL OTR2
1991 - 169 - 23,721 5,688 - - 1,319 2 - * 30,899 262,156 3,814 1992 - 119 57 15,296 2,865 - - 306 3 - * 18,646 246,767 5,747 1993 - 200 39 20,339 3,257 C - 155 17 - 2 24,009 243,501 7,985 1994 - 481 214 25,983 3,069 41 - 236 2 - * 30,026 238,434 5,112 1995 - 542 198 17,042 2,748 7 - 28 31 - * 20,596 236,030 3,334 1996 - 183 253 12,631 3,491 0 - 37 13 - * 16,608 255,215 5,401 1997 - 715 307 16,218 4,753 - - 131 11 - 28 22,163 267,041 5,018 1998 - 1,124 388 10,048 3,624 16 - 113 15 - 8 15,336 269,295 6,614 1999 - 1,031 206 7,186 3,030 10 - 186 7 - 26 11,682 293,602 4,489 2000 - 1,084 1,052 15,265 5,134 153 359 742 10 5 51 23,855 277,118 3,540 2001 942 1,133 846 14,808 5,230 29 732 3,928 29 13 1,918 29,608 413,544 4,436 2002 1,457 1,563 278 8,513 3,626 4 907 7,360 5 290 1,528 25,531 437,817 1,501 2003 2,739 1,418 462 9,125 4,911 365 C 3,477 5 699 1,973 25,174 408,453 1,615 2004 798 1,701 767 7,338 2,997 32 2,802 1,824 6 171 343 18,779 291,336 2,511 2005 682 1,791 530 3,966 532 0 1,782 2,422 7 51 183 11,946 280,047 3,674 2006 246 1,402 537 2,968 928 0 2,164 1,671 21 164 109 10,210 176,841 2,144 2007 224 1,204 408 4,582 353 8 - 745 11 154 378 8,067 178,083 2,333 2008 469 1,248 335 5,383 83 5 - 247 33 175 1,842 9,820 194,877 1,755 2009 629 1,003 590 4,268 780 10 - 636 84 244 2,200 10,444 247,201 1,950 2010 459 3 301 3,639 737 6 - 872 54 269 1,999 8,339 259,348 1,492 2011 1,807 - 349 2,373 754 6 - 647 55 150 1,907 8,048 214,899 1,406 2012 2,591 1,482 538 3,600 631 7 519 749 39 155 2,643 12,954 210,971 1,888 2013 1,874 1,424 410 3,117 928 8 325 572 43 101 1,981 10,783 228,970 1,993 2014 2,120 1,072 567 2,633 704 4 249 896 61 323 20 8,649 242,715 3,557 2015 2,642 1,415 929 2,177 957 20 419 1,287 121 530 139 10,637 256,364 3,567 2016 2,398 1,010 825 1,839 1,124 29 688 1,222 253 166 253 9,807 251,925 2,871 2017 2,907 837 1,252 1,463 1,176 10 612 1,263 536 406 18 10,480 221,460 2,685 2018 5,386 1,190 1,101 1,413 1,189 - 231 1,212 427 293 26 12,468 251,449 1,412 2019 3,372 1,490 1,015 1,810 1,725 - 314 1,556 256 344 37 11,920 240,233 1,398 2020 * * * * * * * * * * * * 219,078 *
1 Includes—Incluye: BLZ, CHL, ECU, EU(ESP), EU(PRT), GTM, HND, NIC, SLV 2Includes gillnets, pole-and-line, recreational, troll and unknown gears—Incluye red agallera, caña, artes deportivas, y desconocidas

IATTC-98-01 - Fisheries, stocks, and the ecosystem in the EPO in 2020 33
TABLE A-3c. Catches (t) of skipjack tuna by purse-seine and longline vessels in the EPO, by vessel flag, adjusted to the species composition estimate. ‘C’ indicates that the catch has been combined with the total in the ‘OTR’ column. The 2019-2020 data are preliminary. TABLA A-3c. Capturas (t) de atún barrilete por buques de cerco y de palangre en el OPO, por bandera del buque, ajustadas a la estimación de composición por especie. ‘C’ indica que la captura se ha combinado con el total en la columna ‘OTR’. Los datos de 2019-2020 son preliminares.
PS LL+
OTR2 COL CRI ECU EU(ESP) MEX NIC PAN PER SLV USA VEN VUT C+OTR1 Total 1991 C - 18,438 C 10,916 - 1,720 C - 13,162 5,217 9,051 3,724 62,228 3,662 1992 C - 25,408 C 9,188 - 3,724 352 - 14,108 10,226 13,315 7,962 84,283 3,011 1993 3,292 - 21,227 C 13,037 - 1,062 - - 17,853 7,270 10,908 9,181 83,830 6,089 1994 7,348 - 15,083 C 11,783 - 2,197 - - 8,947 6,356 9,541 8,871 70,126 4,044 1995 13,081 C 31,934 C 29,406 - 4,084 - - 14,032 5,508 13,910 15,092 127,047 7,241 1996 13,230 C 32,433 C 14,501 - 3,619 - - 12,012 4,104 10,873 13,201 103,973 3,868 1997 12,332 - 51,826 C 23,416 - 4,277 - - 13,687 8,617 14,246 25,055 153,456 3,491 1998 4,698 - 67,074 20,012 15,969 - 1,136 - C 6,898 6,795 11,284 6,765 140,631 2,215 1999 11,210 - 124,393 34,923 16,767 C 5,286 - C 13,491 16,344 21,287 17,864 261,565 3,638 2000 10,138 - 104,849 17,041 14,080 C 9,573 - - 7,224 6,720 13,620 22,399 205,644 365 2001 9,445 - 66,144 13,454 8,169 C 6,967 - C 4,135 3,215 7,824 23,813 143,166 1,696 2002 10,908 - 80,378 10,546 6,612 C 9,757 C 4,601 4,582 2,222 4,657 19,283 153,546 996 2003 14,771 - 139,804 18,567 8,147 - 25,084 C C 5,445 6,143 14,112 41,895 273,968 4,049 2004 C - 89,621 8,138 24,429 C 20,051 - C C 23,356 4,404 27,825 197,824 2,347 2005 C - 140,927 9,224 32,271 3,735 25,782 - 4,995 C 22,146 C 24,149 263,229 3,309 2006 C - 138,490 16,668 16,790 8,396 44,639 - C C 26,334 C 44,952 296,269 1,645 2007 C - 93,553 2,879 21,542 4,286 28,475 - C C 21,990 C 35,571 208,296 1,579 2008 C - 143,431 4,841 21,638 7,005 43,230 C C C 28,333 C 48,125 296,603 2,847 2009 C - 132,712 6,021 6,847 5,119 26,973 C C C 19,370 C 33,481 230,523 2,821 2010 11,400 - 82,280 1,569 3,010 5,242 19,213 C C - 11,818 C 12,660 147,192 3,132 2011 23,269 - 149,637 5,238 11,899 3,889 29,837 - C C 27,026 C 25,240 276,035 2,259 2012 15,760 - 151,280 15,773 18,058 3,931 25,786 - C C 20,829 C 14,798 266,215 3,793 2013 22,168 - 172,002 2,900 17,350 4,345 31,022 C C - 17,522 C 11,251 278,560 3,229 2014 22,732 - 172,239 5,581 8,783 6,300 21,776 C C 521 13,767 - 9,770 261,469 1,425 2015 16,431 - 208,765 C 23,515 1,261 31,427 5,225 C 16,826 4,792 - 20,665 328,907 1,444 2016 20,665 - 190,577 C 13,286 1,971 32,844 6,449 C 40,036 9,067 - 22,666 337,561 932 2017 19,284 - 190,139 C 21,238 6,959 37,419 6,257 C 24,989 7,288 - 11,186 324,759 1,049 2018 15,365 - 177,456 C 17,014 7,759 36,504 4,119 C 11,869 6,679 - 12,056 288,821 1,634 2019 23,395 - 211,827 C 19,656 8,089 33,662 8,944 C 19,706 5,719 - 16,407 347,405 660 2020 15,536 - 191,038 C 7,240 9,063 39,402 2,616 C 13,972 4,555 - 13,877 297,299 *
1 Includes—Incluye: BLZ, BOL, CHN, EU(CYP), GTM, HND, LBR, NZL, RUS, VCT, UNK 2 Includes gillnets, pole-and-line, recreational, and unknown gears—Incluye red agallera, caña, artes deportivas y desconocidas
IATTC-98-01 - Fisheries, stocks, and the ecosystem in the EPO in 2020 34
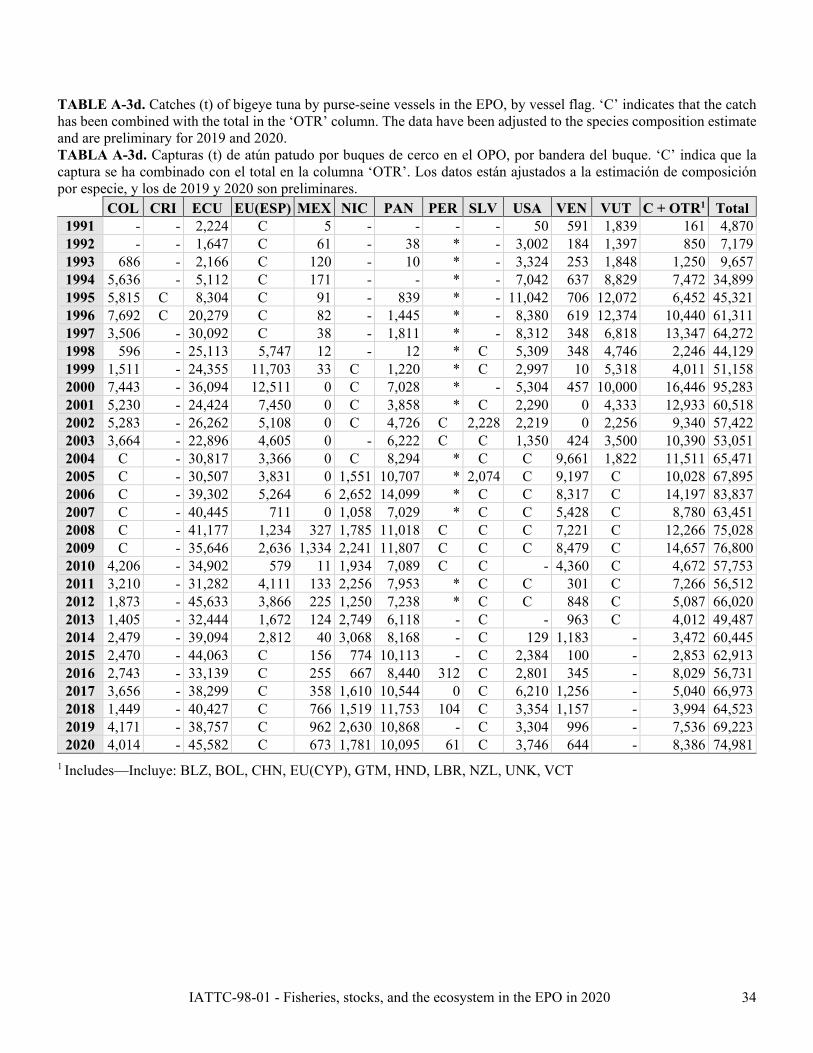
TABLE A-3d. Catches (t) of bigeye tuna by purse-seine vessels in the EPO, by vessel flag. ‘C’ indicates that the catch has been combined with the total in the ‘OTR’ column. The data have been adjusted to the species composition estimate and are preliminary for 2019 and 2020. TABLA A-3d. Capturas (t) de atún patudo por buques de cerco en el OPO, por bandera del buque. ‘C’ indica que la captura se ha combinado con el total en la columna ‘OTR’. Los datos están ajustados a la estimación de composición por especie, y los de 2019 y 2020 son preliminares.
COL CRI ECU EU(ESP) MEX NIC PAN PER SLV USA VEN VUT C + OTR1 Total 1991 - - 2,224 C 5 - - - - 50 591 1,839 161 4,870 1992 - - 1,647 C 61 - 38 * - 3,002 184 1,397 850 7,179 1993 686 - 2,166 C 120 - 10 * - 3,324 253 1,848 1,250 9,657 1994 5,636 - 5,112 C 171 - - * - 7,042 637 8,829 7,472 34,899 1995 5,815 C 8,304 C 91 - 839 * - 11,042 706 12,072 6,452 45,321 1996 7,692 C 20,279 C 82 - 1,445 * - 8,380 619 12,374 10,440 61,311 1997 3,506 - 30,092 C 38 - 1,811 * - 8,312 348 6,818 13,347 64,272 1998 596 - 25,113 5,747 12 - 12 * C 5,309 348 4,746 2,246 44,129 1999 1,511 - 24,355 11,703 33 C 1,220 * C 2,997 10 5,318 4,011 51,158 2000 7,443 - 36,094 12,511 0 C 7,028 * - 5,304 457 10,000 16,446 95,283 2001 5,230 - 24,424 7,450 0 C 3,858 * C 2,290 0 4,333 12,933 60,518 2002 5,283 - 26,262 5,108 0 C 4,726 C 2,228 2,219 0 2,256 9,340 57,422 2003 3,664 - 22,896 4,605 0 - 6,222 C C 1,350 424 3,500 10,390 53,051 2004 C - 30,817 3,366 0 C 8,294 * C C 9,661 1,822 11,511 65,471 2005 C - 30,507 3,831 0 1,551 10,707 * 2,074 C 9,197 C 10,028 67,895 2006 C - 39,302 5,264 6 2,652 14,099 * C C 8,317 C 14,197 83,837 2007 C - 40,445 711 0 1,058 7,029 * C C 5,428 C 8,780 63,451 2008 C - 41,177 1,234 327 1,785 11,018 C C C 7,221 C 12,266 75,028 2009 C - 35,646 2,636 1,334 2,241 11,807 C C C 8,479 C 14,657 76,800 2010 4,206 - 34,902 579 11 1,934 7,089 C C - 4,360 C 4,672 57,753 2011 3,210 - 31,282 4,111 133 2,256 7,953 * C C 301 C 7,266 56,512 2012 1,873 - 45,633 3,866 225 1,250 7,238 * C C 848 C 5,087 66,020 2013 1,405 - 32,444 1,672 124 2,749 6,118 - C - 963 C 4,012 49,487 2014 2,479 - 39,094 2,812 40 3,068 8,168 - C 129 1,183 - 3,472 60,445 2015 2,470 - 44,063 C 156 774 10,113 - C 2,384 100 - 2,853 62,913 2016 2,743 - 33,139 C 255 667 8,440 312 C 2,801 345 - 8,029 56,731 2017 3,656 - 38,299 C 358 1,610 10,544 0 C 6,210 1,256 - 5,040 66,973 2018 1,449 - 40,427 C 766 1,519 11,753 104 C 3,354 1,157 - 3,994 64,523 2019 4,171 - 38,757 C 962 2,630 10,868 - C 3,304 996 - 7,536 69,223 2020 4,014 - 45,582 C 673 1,781 10,095 61 C 3,746 644 - 8,386 74,981
1 Includes—Incluye: BLZ, BOL, CHN, EU(CYP), GTM, HND, LBR, NZL, UNK, VCT

IATTC-98-01 - Fisheries, stocks, and the ecosystem in the EPO in 2020 35
TABLE A-3e. Annual catches (t) of bigeye tuna by longline vessels, and totals for all gears, in the EPO, by vessel flag. ‘C’ indicates that the catch has been combined with the total in the ‘OTR’ column. The data for 2019-2020 are preliminary. TABLA A-3e. Capturas anuales (t) de atún patudo por buques de palangre en el OPO, y totales de todas las artes, por bandera del buque. ‘C’ indica que la captura se ha combinado con el total en la columna ‘OTR’. Los datos de 2019-2020 son preliminares.
CHN CRI FRA (PYF) JPN KOR MEX PAN TWN USA VUT C +
OTR1 Total LL
Total PS + LL OTR2
1991 - 1 - 85,011 17,883 - - 1,291 9 - * 104,195 109,065 56 1992 - 9 7 74,466 9,202 - - 1,032 92 - * 84,808 91,987 13 1993 - 25 7 63,190 8,924 * - 297 55 - * 72,498 82,155 35 1994 - 1 102 61,471 9,522 - - 255 9 - * 71,360 106,259 806 1995 - 13 97 49,016 8,992 - - 77 74 - * 58,269 103,590 1,369 1996 - 1 113 36,685 9,983 - - 95 81 - * 46,958 108,269 748 1997 - 9 250 40,571 11,376 - - 256 118 - * 52,580 116,852 20 1998 - 28 359 35,752 9,731 - - 314 191 - * 46,375 90,504 628 1999 - 25 3,652 22,224 9,431 - - 890 228 - * 36,450 87,608 538 2000 - 27 653 28,746 13,280 42 14 1,916 162 2,754 11 47,605 142,887 253 2001 2,639 28 684 38,048 12,576 1 80 9,285 147 3,277 1,990 68,755 129,273 19 2002 7,614 19 388 34,193 10,358 - 6 17,253 132 2,995 1,466 74,424 131,845 12 2003 10,066 18 346 24,888 10,272 - C 12,016 232 1,258 680 59,776 112,828 21 2004 2,645 21 405 21,236 10,729 - 48 7,384 149 407 459 43,483 108,954 194 2005 2,104 23 398 19,113 11,580 - 30 6,441 536 318 151 40,694 108,589 25 2006 709 18 388 16,235 6,732 - 37 6,412 85 960 195 31,771 115,608 40 2007 2,324 15 361 13,977 5,611 - - 6,057 417 1,013 101 29,876 93,326 44 2008 2,379 16 367 14,908 4,150 - - 1,852 1,277 790 468 26,207 101,236 28 2009 2,481 13 484 15,490 6,758 - - 3,396 730 1,032 1,038 31,422 108,221 15 2010 2,490 4 314 15,847 9,244 - - 5,276 1,356 1,496 1,063 37,090 94,842 2 2011 5,450 - 445 13,399 6,617 - - 3,957 1,050 694 706 32,318 88,829 - 2012 4,386 3 464 16,323 7,450 - - 4,999 875 1,063 604 36,167 102,187 27 2013 5,199 - 527 14,258 8,822 - - 4,162 2,054 604 544 36,170 85,657 99 2014 5,253 9 526 13,634 8,203 - 114 4,511 2,073 897 120 35,340 95,785 177 2015 8,401 8 692 13,079 8,635 - 364 5,181 2,948 1,888 328 41,524 104,437 21 2016 7,052 3 477 10,467 7,692 - 313 6,006 2,090 762 679 35,541 92,272 22 2017 7,093 16 700 8,054 8,749 - 357 6,186 2,700 1,359 147 35,360 102,333 42 2018 6,060 14 897 6,130 6,675 - 415 5,125 2,410 1,194 145 29,065 93,588 18 2019 5,372 23 800 6,024 6,137 - 325 5,868 1,732 836 163 27,281 96,504 18 2020 4,046 * 121 5,858 6,001 - * 5,524 * 676 * 22,226 97,207 *
1 Includes—Incluye: BLZ, CHL, ECU, EU(ESP), EU(PRT), HND, SLV 2 Includes gillnets, pole-and-line, recreational, and unknown gears—Incluye red agallera, caña, artes deportivas, y desconocidas
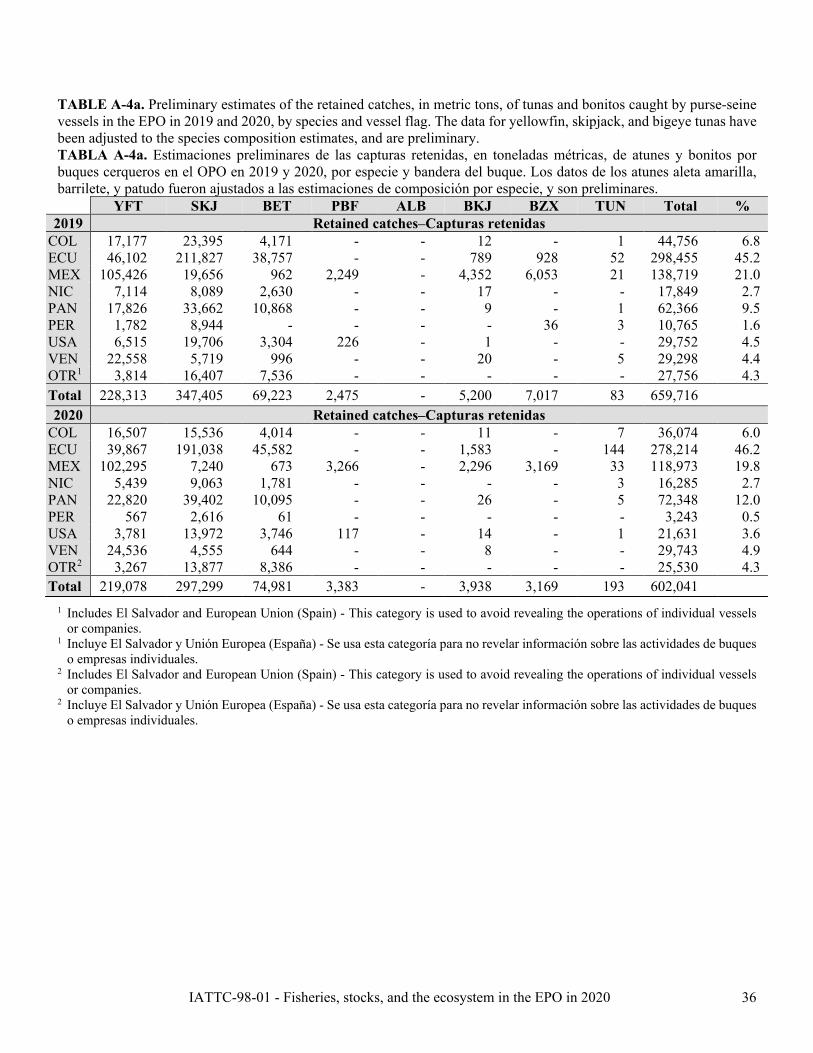
IATTC-98-01 - Fisheries, stocks, and the ecosystem in the EPO in 2020 36
TABLE A-4a. Preliminary estimates of the retained catches, in metric tons, of tunas and bonitos caught by purse-seine vessels in the EPO in 2019 and 2020, by species and vessel flag. The data for yellowfin, skipjack, and bigeye tunas have been adjusted to the species composition estimates, and are preliminary. TABLA A-4a. Estimaciones preliminares de las capturas retenidas, en toneladas métricas, de atunes y bonitos por buques cerqueros en el OPO en 2019 y 2020, por especie y bandera del buque. Los datos de los atunes aleta amarilla, barrilete, y patudo fueron ajustados a las estimaciones de composición por especie, y son preliminares.
YFT SKJ BET PBF ALB BKJ BZX TUN Total % 2019 Retained catches–Capturas retenidas
COL 17,177 23,395 4,171 - - 12 - 1 44,756 6.8 ECU 46,102 211,827 38,757 - - 789 928 52 298,455 45.2 MEX 105,426 19,656 962 2,249 - 4,352 6,053 21 138,719 21.0 NIC 7,114 8,089 2,630 - - 17 - - 17,849 2.7 PAN 17,826 33,662 10,868 - - 9 - 1 62,366 9.5 PER 1,782 8,944 - - - - 36 3 10,765 1.6 USA 6,515 19,706 3,304 226 - 1 - - 29,752 4.5 VEN 22,558 5,719 996 - - 20 - 5 29,298 4.4 OTR1 3,814 16,407 7,536 - - - - - 27,756 4.3 Total 228,313 347,405 69,223 2,475 - 5,200 7,017 83 659,716 2020 Retained catches–Capturas retenidas
COL 16,507 15,536 4,014 - - 11 - 7 36,074 6.0 ECU 39,867 191,038 45,582 - - 1,583 - 144 278,214 46.2 MEX 102,295 7,240 673 3,266 - 2,296 3,169 33 118,973 19.8 NIC 5,439 9,063 1,781 - - - - 3 16,285 2.7 PAN 22,820 39,402 10,095 - - 26 - 5 72,348 12.0 PER 567 2,616 61 - - - - - 3,243 0.5 USA 3,781 13,972 3,746 117 - 14 - 1 21,631 3.6 VEN 24,536 4,555 644 - - 8 - - 29,743 4.9 OTR2 3,267 13,877 8,386 - - - - - 25,530 4.3 Total 219,078 297,299 74,981 3,383 - 3,938 3,169 193 602,041
1 Includes El Salvador and European Union (Spain) - This category is used to avoid revealing the operations of individual vessels or companies.
1 Incluye El Salvador y Unión Europea (España) - Se usa esta categoría para no revelar información sobre las actividades de buques o empresas individuales.
2 Includes El Salvador and European Union (Spain) - This category is used to avoid revealing the operations of individual vessels or companies.
2 Incluye El Salvador y Unión Europea (España) - Se usa esta categoría para no revelar información sobre las actividades de buques o empresas individuales.

IATTC-98-01 - Fisheries, stocks, and the ecosystem in the EPO in 2020 37
TABLE A-4b. Preliminary estimates of the landings, in metric tons, of tunas and bonitos caught by purse-seine vessels in the EPO in 2019 and 2020, by year, species and country of landing. The data for yellowfin, skipjack, and bigeye tunas have not been adjusted to the species composition estimates and are preliminary. TABLA A-4b. Estimaciones preliminares de las descargas, en toneladas métricas, de atunes y bonitos por buques cerqueros en el OPO en 2019 y 2020, por año, especie y país de descarga. Los datos de los atunes aleta amarilla, barrilete, y patudo no fueron ajustados a las estimaciones de composición por especie, y son preliminares.
YFT SKJ BET PBF ALB BKJ BZX TUN Total % 2019 Landings-Descargas COL 14,778 19,863 2,706 - - 3 - - 37,350 5.7 ECU 81,694 272,493 38,472 - - 816 928 52 394,455 60.7 MEX 104,529 22,690 906 2,249 - 4,348 6,054 14 140,790 21.7 PER 3,758 19,821 1,072 - - 30 36 14 24,731 3.8 USA 3,788 5,661 330 226 - - - 7 10,012 1.6 OTR1 19,172 16,679 6,587 - - 3 - - 42,441 6.5 Total 227,719 357,207 50,073 2,475 - 5,200 7,018 87 649,779 2020 Landings-Descargas COL 16,674 13,969 2,645 - - 10 - 3 33,301 5.4 ECU 71,665 276,517 38,812 - - 1,600 - 141 388,735 63.7 MEX 100,951 10,881 1,225 3,266 - 2,297 3,169 33 121,822 20.0 PER 1,379 8,947 563 - - 19 - 6 10,914 1.8 USA 1,794 3,550 447 117 - - - - 5,908 1.0 OTR2 28,851 15,156 5,754 - - - - - 49,761 8.1 Total 221,314 329,020 49,446 3,383 - 3,926 3,169 183 610,441
1 Includes Costa Rica, El Salvador, Guatemala, Kiribati and Panama - This category is used to avoid revealing the operations of individual vessels or companies.
1 Incluye Costa Rica, El Salvador, Guatemala, Kiribati y Panamá - Se usa esta categoría para no revelar información sobre las actividades de buques o empresas individuales.
2 Includes Costa Rica, El Salvador, Guatemala, Kiribati and Unknown - This category is used to avoid revealing the operations of individual vessels or companies.
2 Incluye Costa Rica, Desconocida, El Salvador, Guatemala y Kiribati - Se usa esta categoría para no revelar información sobre las actividades de buques o empresas individuales.

IATTC-98-01 - Fisheries, stocks, and the ecosystem in the EPO in 2020 38
TABLE A-5a. Annual retained catches of Pacific bluefin tuna, by gear type and flag, in metric tons, 1991-2019. The data for 2018 and 2019 are preliminary; 2020 data are not available. TABLA A-5a. Capturas retenidas anuales de atún aleta azul del Pacífico, por arte de pesca y bandera, en toneladas, 1991-2019. Los datos de 2018 y 2019 son preliminares; no se dispone de datos de 2020.
PBF Western Pacific flags—Banderas del Pacífico occidental1 EPO flags—Banderas del OPO
Total JPN KOR TWN Sub-total
MEX USA Sub- total PS LP LL OTR PS OTR PS LL OTR PS OTR PS OTR
1991 9,808 286 218 4,204 265 - - 342 119 15,242 9 - 410 98 517 15,759 1992 7,162 166 513 3,204 288 - 73 464 8 11,878 0 - 1,928 171 2,099 13,977 1993 6,600 129 812 1,759 40 - 1 471 3 9,815 - - 580 386 966 10,781 1994 8,131 162 1,206 5,667 50 - - 559 - 15,775 63 2 906 145 1,116 16,891 1995 18,909 270 678 7,223 821 - - 335 2 28,238 11 - 657 294 962 29,200 1996 7,644 94 901 5,359 102 - - 956 - 15,056 3,700 - 4,639 110 8,449 23,505 1997 13,152 34 1,300 4,354 1,054 - - 1,814 - 21,708 367 - 2,240 264 2,871 24,579 1998 5,391 85 1,255 4,450 188 - - 1,910 - 13,279 1 0 1,771 703 2,475 15,754 1999 16,173 35 1,157 5,246 256 - - 3,089 - 25,956 2,369 35 184 592 3,180 29,136 2000 16,486 102 953 7,031 2,401 - - 2,780 2 29,755 3,019 99 693 380 4,191 33,946 2001 7,620 180 791 5,614 1,176 10 - 1,839 4 17,234 863 - 292 392 1,547 18,781 2002 8,903 99 841 4,338 932 1 - 1,523 4 16,641 1,708 2 50 625 2,385 19,026 2003 5,768 44 1,237 3,345 2,601 - - 1,863 21 14,879 3,211 43 22 373 3,649 18,528 2004 8,257 132 1,847 3,855 773 - - 1,714 3 16,581 8,880 14 - 61 8,955 25,536 2005 12,817 549 1,925 6,363 1,318 9 - 1,368 2 24,351 4,542 - 201 80 4,823 29,174 2006 8,880 108 1,121 4,058 1,012 3 - 1,149 1 16,332 9,806 - - 96 9,902 26,234 2007 6,840 236 1,762 4,983 1,281 4 - 1,401 10 16,517 4,147 - 42 14 4,203 20,720 2008 10,221 64 1,390 5,505 1,866 10 - 979 2 20,037 4,407 15 - 64 4,486 24,523 2009 8,077 50 1,080 4,814 936 4 - 877 11 15,849 3,019 - 410 162 3,591 19,440 2010 3,742 83 890 3,681 1,196 16 - 373 36 10,017 7,746 - - 89 7,835 17,852 2011 8,340 63 837 3,754 670 14 - 292 24 13,994 2,731 1 - 343 3,075 17,069 2012 2,462 113 673 2,846 1,421 2 - 210 4 7,731 6,668 1 - 442 7,111 14,842 2013 2,771 8 784 2,848 604 1 - 331 3 7,350 3,154 - - 820 3,974 11,324 2014 5,456 5 683 3,429 1,305 6 - 483 42 11,409 4,862 - 401 427 5,690 17,099 2015 3,645 8 649 2,085 676 1 - 552 26 7,642 3,082 - 86 412 3,580 11,222 2016 5,095 44 691 2,514 1,024 5 - 454 0 9,827 2,709 - 316 412 3,437 13,264 2017 4,540 49 913 3,491 734 9 - 415 0 10,151 3,643 - 466 472 4,581 14,732 2018 4,049 8 700 1,447 523 12 - 381 3 7,123 2,482 - 12 554 3,048 10,171 2019 4,464 0 1,002 2,031 542 39 - 486 3 8,081 2,249 - 226 478 2,953 11,034
1 Source: International Scientific Committee, 20th Plenary Meeting, PBFWG workshop report on Pacific Bluefin Tuna, July 2020—Fuente: Comité Científico Internacional, 20ª Reunión Plenaria, Taller PBFWG sobre Atún Aleta Azul del Pacífico, julio de 2020
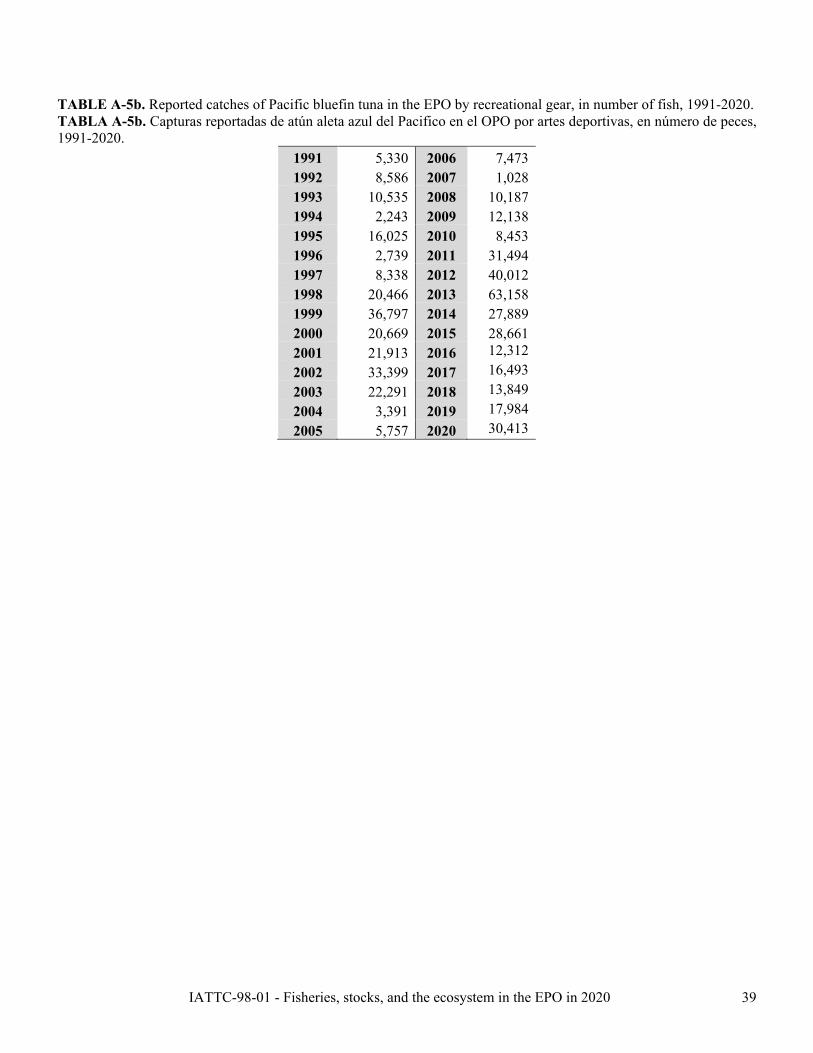
IATTC-98-01 - Fisheries, stocks, and the ecosystem in the EPO in 2020 39
TABLE A-5b. Reported catches of Pacific bluefin tuna in the EPO by recreational gear, in number of fish, 1991-2020. TABLA A-5b. Capturas reportadas de atún aleta azul del Pacifico en el OPO por artes deportivas, en número de peces, 1991-2020.
1991 5,330 2006 7,473 1992 8,586 2007 1,028 1993 10,535 2008 10,187 1994 2,243 2009 12,138 1995 16,025 2010 8,453 1996 2,739 2011 31,494 1997 8,338 2012 40,012 1998 20,466 2013 63,158 1999 36,797 2014 27,889 2000 20,669 2015 28,661 2001 21,913 2016 12,312 2002 33,399 2017 16,493 2003 22,291 2018 13,849 2004 3,391 2019 17,984 2005 5,757 2020 30,413

IATTC-98-01 - Fisheries, stocks, and the ecosystem in the EPO in 2020 40
TABLE A-6. Annual retained catches of albacore in the EPO, by gear and area (north and south of the equator), in metric tons, 1991-2019. The data for 2018 and 2019 are preliminary; 2020 data are not available. TABLA A-6. Capturas retenidas anuales de atún albacora en el OPO, por arte y zona (al norte y al sur de la línea ecuatorial), en toneladas, 1991-2019. Los datos de 2018 y 2019 son preliminares; no se dispone de datos de 2020.
ALB North—Norte South—Sur Total LL LTL1 OTR Subtotal LL LTL OTR Subtotal 1991 1,514 2,617 6 4,137 6,379 795 170 7,344 11,481 1992 1,635 4,770 2 6,407 15,445 1,205 18 16,668 23,075 1993 1,772 4,332 25 6,129 9,422 35 19 9,476 15,605 1994 2,356 9,666 106 12,128 8,034 446 21 8,501 20,629 1995 1,380 7,773 102 9,255 4,805 2 15 4,822 14,077 1996 1,675 8,267 99 10,041 5,956 94 21 6,071 16,112 1997 1,365 6,115 1,019 8,499 8,313 466 0 8,779 17,278 1998 1,730 12,019 1,250 14,999 10,905 12 0 10,917 25,916 1999 2,701 11,028 3,668 17,397 8,932 81 7 9,020 26,417 2000 1,880 10,960 1,869 14,709 7,783 778 3 8,564 23,273 2001 1,822 11,727 1,638 15,187 17,588 516 6 18,110 33,297 2002 1,227 12,286 2,388 15,901 14,062 131 40 14,233 30,134 2003 1,129 17,808 2,260 21,197 23,772 419 3 24,194 45,391 2004 854 20,288 1,623 22,765 17,590 331 0 17,921 40,686 2005 405 13,807 1,741 15,953 8,945 181 7 9,133 25,086 2006 3,671 18,515 408 22,594 10,161 48 119 10,328 32,922 2007 2,708 17,948 1,415 22,071 8,399 19 87 8,505 30,576 2008 1,160 17,137 308 18,605 8,058 0 159 8,217 26,822 2009 91 17,933 996 19,020 11,981 0 213 12,194 31,214 2010 1,134 18,246 892 20,272 13,122 3 247 13,372 33,644 2011 1,833 15,437 426 17,696 14,357 0 222 14,579 32,275 2012 4,583 16,633 1,222 22,438 19,613 35 210 19,858 42,296 2013 6,193 17,398 844 24,435 19,204 0 271 19,475 43,910 2014 3,546 18,178 1,042 22,766 25,685 0 243 25,928 48,694 2015 2,067 15,986 934 18,987 26,873 0 221 27,094 46,081 2016 1,641 13,600 677 15,918 25,136 0 290 25,426 41,346 2017 2,512 8,871 386 11,769 23,820 0 206 24,026 35,795 2018 2,433 10,433 399 13,265 22,951 0 329 23,280 36,546 2019 2,980 10,199 1,368 14,547 16,869 0 362 17,231 31,778
1 Includes pole-and-line—Incluye caña
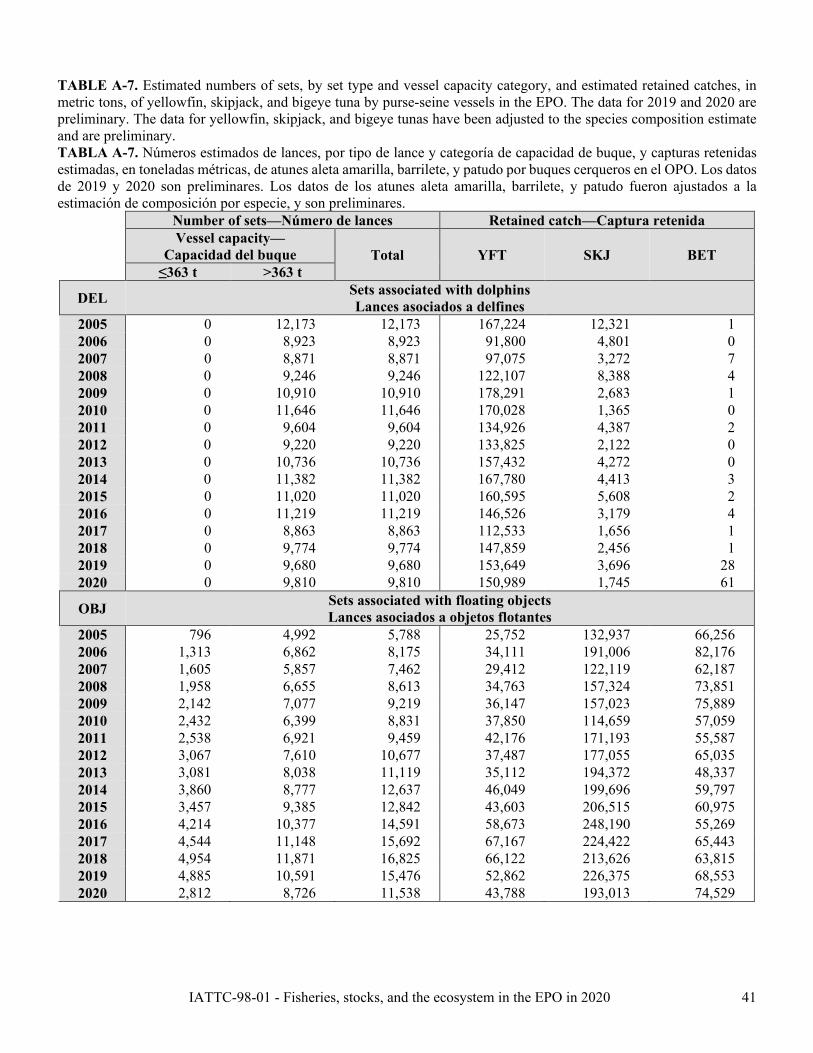
IATTC-98-01 - Fisheries, stocks, and the ecosystem in the EPO in 2020 41
TABLE A-7. Estimated numbers of sets, by set type and vessel capacity category, and estimated retained catches, in metric tons, of yellowfin, skipjack, and bigeye tuna by purse-seine vessels in the EPO. The data for 2019 and 2020 are preliminary. The data for yellowfin, skipjack, and bigeye tunas have been adjusted to the species composition estimate and are preliminary. TABLA A-7. Números estimados de lances, por tipo de lance y categoría de capacidad de buque, y capturas retenidas estimadas, en toneladas métricas, de atunes aleta amarilla, barrilete, y patudo por buques cerqueros en el OPO. Los datos de 2019 y 2020 son preliminares. Los datos de los atunes aleta amarilla, barrilete, y patudo fueron ajustados a la estimación de composición por especie, y son preliminares.
Number of sets—Número de lances Retained catch—Captura retenida Vessel capacity—
Capacidad del buque Total YFT SKJ BET ≤363 t >363 t
DEL Sets associated with dolphins Lances asociados a delfines
2005 0 12,173 12,173 167,224 12,321 1 2006 0 8,923 8,923 91,800 4,801 0 2007 0 8,871 8,871 97,075 3,272 7 2008 0 9,246 9,246 122,107 8,388 4 2009 0 10,910 10,910 178,291 2,683 1 2010 0 11,646 11,646 170,028 1,365 0 2011 0 9,604 9,604 134,926 4,387 2 2012 0 9,220 9,220 133,825 2,122 0 2013 0 10,736 10,736 157,432 4,272 0 2014 0 11,382 11,382 167,780 4,413 3 2015 0 11,020 11,020 160,595 5,608 2 2016 0 11,219 11,219 146,526 3,179 4 2017 0 8,863 8,863 112,533 1,656 1 2018 0 9,774 9,774 147,859 2,456 1 2019 0 9,680 9,680 153,649 3,696 28 2020 0 9,810 9,810 150,989 1,745 61
OBJ Sets associated with floating objects Lances asociados a objetos flotantes
2005 796 4,992 5,788 25,752 132,937 66,256 2006 1,313 6,862 8,175 34,111 191,006 82,176 2007 1,605 5,857 7,462 29,412 122,119 62,187 2008 1,958 6,655 8,613 34,763 157,324 73,851 2009 2,142 7,077 9,219 36,147 157,023 75,889 2010 2,432 6,399 8,831 37,850 114,659 57,059 2011 2,538 6,921 9,459 42,176 171,193 55,587 2012 3,067 7,610 10,677 37,487 177,055 65,035 2013 3,081 8,038 11,119 35,112 194,372 48,337 2014 3,860 8,777 12,637 46,049 199,696 59,797 2015 3,457 9,385 12,842 43,603 206,515 60,975 2016 4,214 10,377 14,591 58,673 248,190 55,269 2017 4,544 11,148 15,692 67,167 224,422 65,443 2018 4,954 11,871 16,825 66,122 213,626 63,815 2019 4,885 10,591 15,476 52,862 226,375 68,553 2020 2,812 8,726 11,538 43,788 193,013 74,529
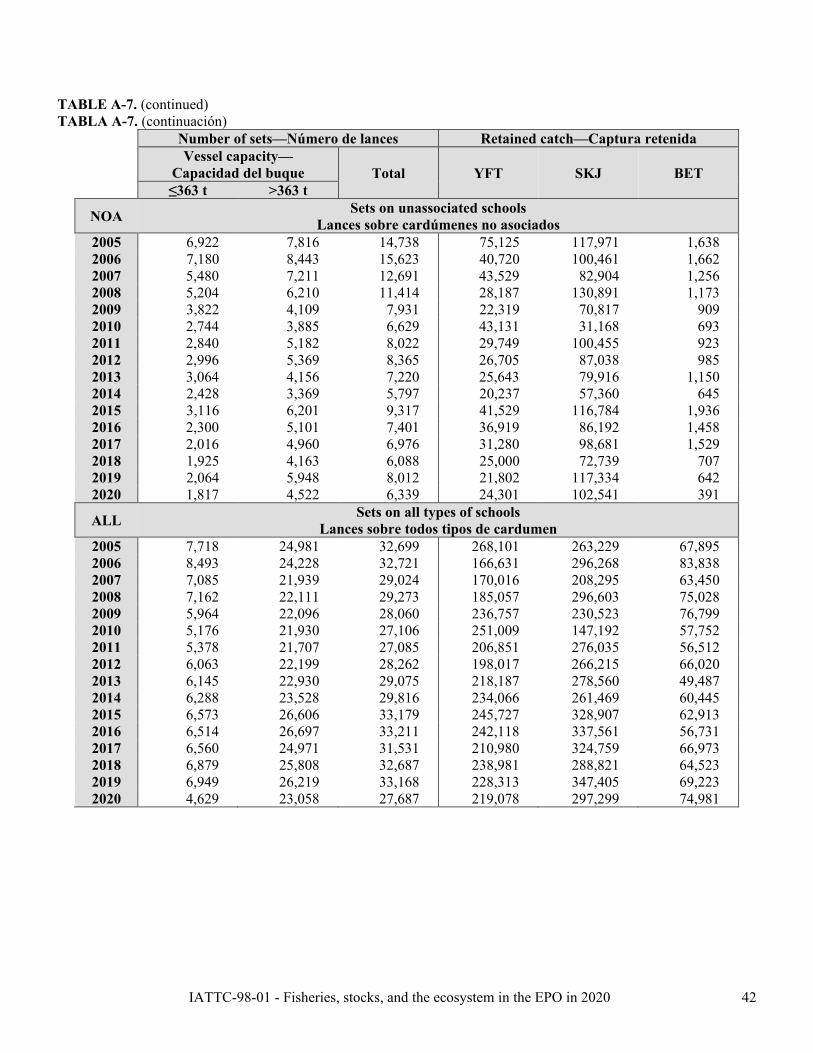
IATTC-98-01 - Fisheries, stocks, and the ecosystem in the EPO in 2020 42
TABLE A-7. (continued) TABLA A-7. (continuación)
Number of sets—Número de lances Retained catch—Captura retenida Vessel capacity—
Capacidad del buque Total YFT SKJ BET ≤363 t >363 t
NOA Sets on unassociated schools Lances sobre cardúmenes no asociados
2005 6,922 7,816 14,738 75,125 117,971 1,638 2006 7,180 8,443 15,623 40,720 100,461 1,662 2007 5,480 7,211 12,691 43,529 82,904 1,256 2008 5,204 6,210 11,414 28,187 130,891 1,173 2009 3,822 4,109 7,931 22,319 70,817 909 2010 2,744 3,885 6,629 43,131 31,168 693 2011 2,840 5,182 8,022 29,749 100,455 923 2012 2,996 5,369 8,365 26,705 87,038 985 2013 3,064 4,156 7,220 25,643 79,916 1,150 2014 2,428 3,369 5,797 20,237 57,360 645 2015 3,116 6,201 9,317 41,529 116,784 1,936 2016 2,300 5,101 7,401 36,919 86,192 1,458 2017 2,016 4,960 6,976 31,280 98,681 1,529 2018 1,925 4,163 6,088 25,000 72,739 707 2019 2,064 5,948 8,012 21,802 117,334 642 2020 1,817 4,522 6,339 24,301 102,541 391
ALL Sets on all types of schools Lances sobre todos tipos de cardumen
2005 7,718 24,981 32,699 268,101 263,229 67,895 2006 8,493 24,228 32,721 166,631 296,268 83,838 2007 7,085 21,939 29,024 170,016 208,295 63,450 2008 7,162 22,111 29,273 185,057 296,603 75,028 2009 5,964 22,096 28,060 236,757 230,523 76,799 2010 5,176 21,930 27,106 251,009 147,192 57,752 2011 5,378 21,707 27,085 206,851 276,035 56,512 2012 6,063 22,199 28,262 198,017 266,215 66,020 2013 6,145 22,930 29,075 218,187 278,560 49,487 2014 6,288 23,528 29,816 234,066 261,469 60,445 2015 6,573 26,606 33,179 245,727 328,907 62,913 2016 6,514 26,697 33,211 242,118 337,561 56,731 2017 6,560 24,971 31,531 210,980 324,759 66,973 2018 6,879 25,808 32,687 238,981 288,821 64,523 2019 6,949 26,219 33,168 228,313 347,405 69,223 2020 4,629 23,058 27,687 219,078 297,299 74,981

IATTC-98-01 - Fisheries, stocks, and the ecosystem in the EPO in 2020 43
TABLE A-8. Types of floating objects involved in sets by vessels of >363 t carrying capacity, 2005-2020. The 2020 data are preliminary. TABLA A-8. Tipos de objetos flotantes sobre los que realizaron lances buques de >363 t de capacidad de acarreo, 2005-2020. Los datos de 2020 son preliminares.
OBJ Flotsam
Naturales FADs
Plantados Unknown
Desconocido Total No. % No. % No. %
2005 603 12.1 4,281 85.8 108 2.2 4,992 2006 697 10.2 6,123 89.2 42 0.6 6,862 2007 597 10.2 5,188 88.6 72 1.2 5,857 2008 560 8.4 6,070 91.2 25 0.4 6,655 2009 322 4.5 6,728 95.1 27 0.4 7,077 2010 337 5.3 6,038 94.3 24 0.4 6,399 2011 563 8.1 6,342 91.6 16 0.2 6,921 2012 286 3.8 7,321 96.2 3 < 0.1 7,610 2013 274 3.4 7,759 96.5 5 0.1 8,038 2014 283 3.2 8,490 96.7 4 < 0.1 8,777 2015 273 2.9 9,093 96.9 19 0.2 9,385 2016 278 2.7 10,070 97.0 29 0.3 10,377 2017 271 2.4 10,877 97.6 0 0 11,148 2018 322 2.7 11,549 97.3 0 0 11,871 2019 216 2.0 10,373 97.9 2 < 0.1 10,591 2020 140 1.6 8,586 98.4 0 0 8,726
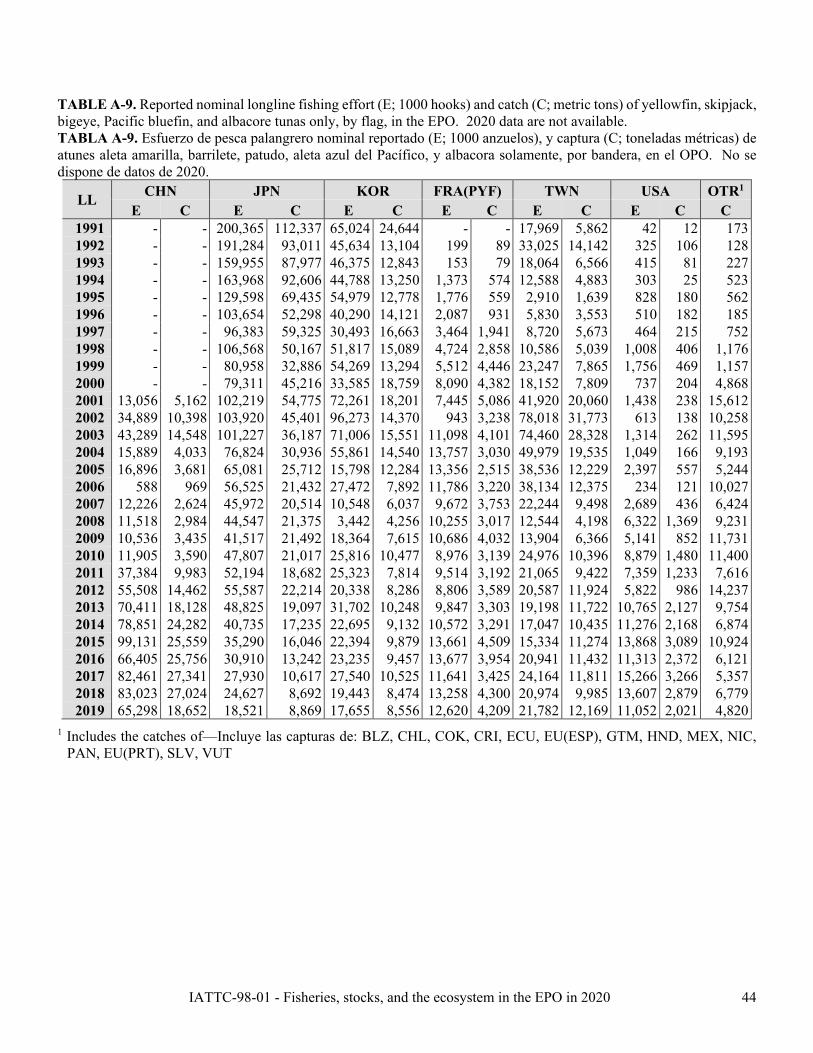
IATTC-98-01 - Fisheries, stocks, and the ecosystem in the EPO in 2020 44
TABLE A-9. Reported nominal longline fishing effort (E; 1000 hooks) and catch (C; metric tons) of yellowfin, skipjack, bigeye, Pacific bluefin, and albacore tunas only, by flag, in the EPO. 2020 data are not available. TABLA A-9. Esfuerzo de pesca palangrero nominal reportado (E; 1000 anzuelos), y captura (C; toneladas métricas) de atunes aleta amarilla, barrilete, patudo, aleta azul del Pacífico, y albacora solamente, por bandera, en el OPO. No se dispone de datos de 2020.
LL CHN JPN KOR FRA(PYF) TWN USA OTR1 E C E C E C E C E C E C C
1991 - - 200,365 112,337 65,024 24,644 - - 17,969 5,862 42 12 173 1992 - - 191,284 93,011 45,634 13,104 199 89 33,025 14,142 325 106 128 1993 - - 159,955 87,977 46,375 12,843 153 79 18,064 6,566 415 81 227 1994 - - 163,968 92,606 44,788 13,250 1,373 574 12,588 4,883 303 25 523 1995 - - 129,598 69,435 54,979 12,778 1,776 559 2,910 1,639 828 180 562 1996 - - 103,654 52,298 40,290 14,121 2,087 931 5,830 3,553 510 182 185 1997 - - 96,383 59,325 30,493 16,663 3,464 1,941 8,720 5,673 464 215 752 1998 - - 106,568 50,167 51,817 15,089 4,724 2,858 10,586 5,039 1,008 406 1,176 1999 - - 80,958 32,886 54,269 13,294 5,512 4,446 23,247 7,865 1,756 469 1,157 2000 - - 79,311 45,216 33,585 18,759 8,090 4,382 18,152 7,809 737 204 4,868 2001 13,056 5,162 102,219 54,775 72,261 18,201 7,445 5,086 41,920 20,060 1,438 238 15,612 2002 34,889 10,398 103,920 45,401 96,273 14,370 943 3,238 78,018 31,773 613 138 10,258 2003 43,289 14,548 101,227 36,187 71,006 15,551 11,098 4,101 74,460 28,328 1,314 262 11,595 2004 15,889 4,033 76,824 30,936 55,861 14,540 13,757 3,030 49,979 19,535 1,049 166 9,193 2005 16,896 3,681 65,081 25,712 15,798 12,284 13,356 2,515 38,536 12,229 2,397 557 5,244 2006 588 969 56,525 21,432 27,472 7,892 11,786 3,220 38,134 12,375 234 121 10,027 2007 12,226 2,624 45,972 20,514 10,548 6,037 9,672 3,753 22,244 9,498 2,689 436 6,424 2008 11,518 2,984 44,547 21,375 3,442 4,256 10,255 3,017 12,544 4,198 6,322 1,369 9,231 2009 10,536 3,435 41,517 21,492 18,364 7,615 10,686 4,032 13,904 6,366 5,141 852 11,731 2010 11,905 3,590 47,807 21,017 25,816 10,477 8,976 3,139 24,976 10,396 8,879 1,480 11,400 2011 37,384 9,983 52,194 18,682 25,323 7,814 9,514 3,192 21,065 9,422 7,359 1,233 7,616 2012 55,508 14,462 55,587 22,214 20,338 8,286 8,806 3,589 20,587 11,924 5,822 986 14,237 2013 70,411 18,128 48,825 19,097 31,702 10,248 9,847 3,303 19,198 11,722 10,765 2,127 9,754 2014 78,851 24,282 40,735 17,235 22,695 9,132 10,572 3,291 17,047 10,435 11,276 2,168 6,874 2015 99,131 25,559 35,290 16,046 22,394 9,879 13,661 4,509 15,334 11,274 13,868 3,089 10,924 2016 66,405 25,756 30,910 13,242 23,235 9,457 13,677 3,954 20,941 11,432 11,313 2,372 6,121 2017 82,461 27,341 27,930 10,617 27,540 10,525 11,641 3,425 24,164 11,811 15,266 3,266 5,357 2018 83,023 27,024 24,627 8,692 19,443 8,474 13,258 4,300 20,974 9,985 13,607 2,879 6,779 2019 65,298 18,652 18,521 8,869 17,655 8,556 12,620 4,209 21,782 12,169 11,052 2,021 4,820
1 Includes the catches of—Incluye las capturas de: BLZ, CHL, COK, CRI, ECU, EU(ESP), GTM, HND, MEX, NIC, PAN, EU(PRT), SLV, VUT

IATTC-98-01 - Fisheries, stocks, and the ecosystem in the EPO in 2020 45
TABLE A-10. Numbers and well volumes, in cubic meters, of purse-seine and pole-and line vessels of the EPO tuna fleet. The data for 2019 and 2020 are preliminary. TABLA A-10. Número y volumen de bodega, en metros cúbicos, de buques cerqueros y cañeros de la flota atunera del OPO. Los datos de 2019 y 2020 son preliminares.
PS LP Total No. Vol. (m3) No. Vol. (m3) No. Vol. (m3)
1991 152 124,062 22 1,997 174 126,059 1992 158 116,619 20 1,807 178 118,426 1993 151 117,593 15 1,550 166 119,143 1994 166 120,726 20 1,726 186 122,452 1995 175 123,798 20 1,784 195 125,582 1996 180 130,774 17 1,646 197 132,420 1997 194 147,926 23 2,127 217 150,053 1998 202 164,956 22 2,216 224 167,172 1999 208 178,724 14 1,642 222 180,366 2000 205 180,679 12 1,220 217 181,899 2001 204 189,088 10 1,259 214 190,347 2002 218 199,870 6 921 224 200,791 2003 214 202,381 3 338 217 202,719 2004 218 206,473 3 338 221 206,811 2005 220 212,419 4 498 224 212,917 2006 225 225,166 4 498 229 225,664 2007 227 225,359 4 380 231 225,739 2008 219 223,804 4 380 223 224,184 2009 221 224,632 4 380 225 225,012 2010 202 210,025 3 255 205 210,280 2011 208 213,237 3 339 211 213,576 2012 209 217,687 4 464 213 218,151 2013 203 212,087 3 268 206 212,355 2014 226 230,379 2 226 228 230,605 2015 244 248,428 1 125 245 248,553 2016 250 261,474 0 0 250 261,474 2017 254 263,018 0 0 254 263,018 2018 261 263,666 0 0 261 263,666 2019 261 265,085 0 0 261 265,085 2020 240 239,687 0 0 240 239,687

IATTC-98-01 - Fisheries, stocks, and the ecosystem in the EPO in 2020 46
TABLE A-11a. Estimates of the numbers and well volume (cubic meters) of purse-seine (PS) and pole-and-line (LP) vessels that fished in the EPO in 2019, by flag and gear. Each vessel is included in the total for each flag under which it fished during the year but is included only once in the “Grand total”; therefore, the grand total may not equal the sums of the individual flags. TABLA A-11a. Estimaciones del número y volumen de bodega (metros cúbicos) de buques cerqueros (PS) y cañeros (LP) que pescaron en el OPO en 2019 por bandera y arte de pesca. Se incluye cada buque en los totales de cada bandera bajo la cual pescó durante el año, pero solamente una vez en el “Total general”; por consiguiente, los totales generales no equivalen necesariamente a las sumas de las banderas individuales.
Flag Bandera
Gear Arte
Well volume —Volumen de bodega (m3) Total <401 401-800 801-1300 1301-1800 >1800 No. Vol. (m3) Number—Número
COL PS 2 2 7 3 - 14 14,860 ECU PS 38 33 22 9 12 114 91,057
EU(ESP) PS - - - - 2 2 4,120 MEX PS 5 2 21 23 - 51 61,146 NIC PS - - 3 2 1 6 9,066 PAN PS - 2 5 6 4 17 23,719 PER PS 6 5 - - - 11 4,767 SLV PS - - - 1 2 3 6,202 USA PS 11 - 3 9 6 29 30,367 VEN PS - - 7 6 1 14 19,781
Grand total— Total general PS 62 44 68 59 28 261
Well volume—Volumen de bodega (m3) Grand total— Total general PS 16,015 26,070 75,928 88,886 58,186 265,085
- : none—ninguno
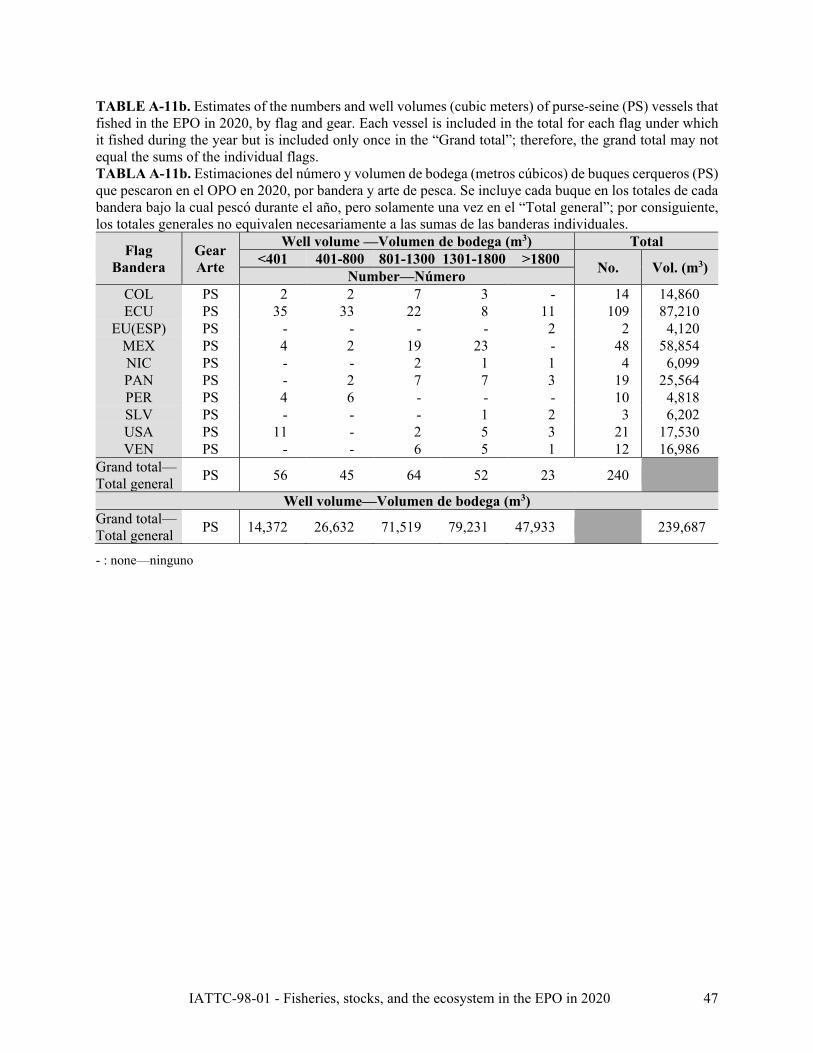
IATTC-98-01 - Fisheries, stocks, and the ecosystem in the EPO in 2020 47
TABLE A-11b. Estimates of the numbers and well volumes (cubic meters) of purse-seine (PS) vessels that fished in the EPO in 2020, by flag and gear. Each vessel is included in the total for each flag under which it fished during the year but is included only once in the “Grand total”; therefore, the grand total may not equal the sums of the individual flags. TABLA A-11b. Estimaciones del número y volumen de bodega (metros cúbicos) de buques cerqueros (PS) que pescaron en el OPO en 2020, por bandera y arte de pesca. Se incluye cada buque en los totales de cada bandera bajo la cual pescó durante el año, pero solamente una vez en el “Total general”; por consiguiente, los totales generales no equivalen necesariamente a las sumas de las banderas individuales.
Flag Bandera
Gear Arte
Well volume —Volumen de bodega (m3) Total <401 401-800 801-1300 1301-1800 >1800 No. Vol. (m3) Number—Número
COL PS 2 2 7 3 - 14 14,860 ECU PS 35 33 22 8 11 109 87,210
EU(ESP) PS - - - - 2 2 4,120 MEX PS 4 2 19 23 - 48 58,854 NIC PS - - 2 1 1 4 6,099 PAN PS - 2 7 7 3 19 25,564 PER PS 4 6 - - - 10 4,818 SLV PS - - - 1 2 3 6,202 USA PS 11 - 2 5 3 21 17,530 VEN PS - - 6 5 1 12 16,986
Grand total— Total general PS 56 45 64 52 23 240
Well volume—Volumen de bodega (m3) Grand total— Total general PS 14,372 26,632 71,519 79,231 47,933 239,687
- : none—ninguno

IATTC-98-01 - Fisheries, stocks, and the ecosystem in the EPO in 2020 48
TABLE A-12. Minimum, maximum, and average capacity, in thousands of cubic meters, of purse-seine and pole-and-line vessels at sea in the EPO during 2010-2019 and in 2020, by month. TABLA A-12. Capacidad mínima, máxima, y media, en miles de metros cúbicos, de los buques cerqueros y cañeros en el mar en el OPO durante 2010-2019 y en 2020, por mes.
Month Mes
2010-2019 2020 Min Max Ave.-Prom. 1 86.9 129.6 100.2 105.3 2 150.7 192.3 171.6 154.2 3 135.4 189.7 164.1 159.3 4 145.9 200.8 167.1 151.2 5 139.8 196.9 166.5 159.3 6 154.9 198.6 171.6 157.2 7 154.1 200.4 170.5 161.4 8 108.0 148.7 122.4 107.6 9 105.5 142.2 119.3 102.2
10 150.7 188.9 172.8 141.7 11 102.8 140.8 122.5 93.9 12 45.9 68.2 57.2 72.5
Ave.-Prom. 123.4 166.4 142.1 130.5

IATTC-98-01 - Fisheries, stocks, and the ecosystem in the EPO in 2020 49
B. YELLOWFIN TUNA
For the full version of this analysis, see documents SAC-11-05, SAC-11-07, SAC-11-INF-J and SAC-11-08.
Yellowfin are distributed across the Pacific Ocean, but the bulk of the catch is made in the eastern and western regions. Purse-seine catches in the vicinity of the western boundary of the EPO at 150oW are relatively low, but have been increasing, mainly in sets on floating objects (Figure A-1a and A-1b, Tables A-1, A-2). The majority of the catch in the eastern Pacific Ocean (EPO) is taken in purse-seine sets associated with dolphins and floating objects (Figure B-1). Tagging studies of yellowfin throughout the Pacific indicate that they tend to stay within 1,800 km of their release positions. This regional fidelity, along with the geographic variation in phenotypic and genotypic characteristics of yellowfin shown in some studies, suggests that there might be multiple stocks of yellowfin in the EPO and throughout the Pacific Ocean. However, movement rates between these putative stocks, as well as across the 150°W meridian, cannot be estimated with currently-available tagging data.
In 2021, stock status indicators (SSIs) were developed for yellowfin using the data collected in the EPO as a whole (SAC-12-05). In the short term, the indicators show the effect of the COVID-19 pandemic. The effort in the floating-object fishery decreased about 25% from 2019 to 2020. The capacity slightly decreased as well. There was apparent decrease in the floating object catches, however the port sampling operations were similarly affected, thus the catch estimates may be uncertain. In contrast, for the other two fisheries, the purse seine fishery associated with dolphins and the unassociated fishery, the effort and catches were stable since 2018. The long term trends, show that most floating-object fishery SSIs suggest that the yellowfin stock has potentially been subject to increased fishing mortality, mainly due to the increase in the number of sets in the floating-object fishery since 2005 (Figure B-2) and corresponding increase in catch for yellowfin (Figure B-3), associated with decline in catch-per-set (Figure B-3) and reduction in the average length of the fish in the catch (Figure B-3) for the floating-object fishery. This coincided with a declining trend in the yellowfin longline CPUE index based on spatio-temporal modelling which remained at low historic levels since 2005 (Figure B-4). Trends in some of the other SSIs do not support the interpretation that increased fishing mortality is occurring as a result of an increase in the numbers of floating-object sets, such as trends in catch-per-set for other set types (Figure B-3), mean length of yellowfin in the other set types (Figure B-3), and the longline SSIs (Figure B-3). The SSI based on spatio-temporal modelling of CPDF for the purse-seine fishery associated with dolphins shows a period of low values starting in 2015 (Figure B-4) which coincides with a period of increased yellowfin catches in floating-objects set (Figure B-3). The SSI based on spatio-temporal modelling of CPUE for the longline fishery do not coincide with the purse-seine one (Figure B-4). Identifying the causes of differences in the SSIs is difficult, even when SSIs are considered in aggregate. The inconsistencies among SSIs for yellowfin may be due to an interaction between potential stock structure and differences in the spatial distribution of effort in the different set types. In addition, catch-per-set may not be a reliable indicator of abundance, particularly for the target species (i.e. yellowfin in the dolphin-associated fishery). Nonetheless, the fact that most SSIs based on the floating-object fishery are consistent with an increase in fishing mortality in that fishery means that precautionary management measures should be considered to prevent further increases. Due to the COVID-19 effect, 2020 should be regarded with caution when interpreting long term trends in the indicators.
A workplan to improve the stock assessments for tropical tunas was completed taking into consideration the results of the external review of yellowfin. The yellowfin review panel did not single out a particular model configuration as a replacement for the current base case model, but suggested a variety of alternatives for the staff to consider. To encompass as many scenarios as possible, the staff developed a pragmatic risk assessment framework to apply for both species, which included the development of hypothesis, the implementation and weighting of models, and the construction of risk tables based on the combined result (SAC-11-08, SAC-11-INF-F,SAC-11-INF-J).
The degree of spatial mixing of the yellowfin tuna population in the EPO was considered the main

IATTC-98-01 - Fisheries, stocks, and the ecosystem in the EPO in 2020 50
uncertainty within the risk analysis (SAC-11-INF-J). This conclusion came from the detailed inspection of the contradictory indices of abundance. Previous assessments used five indices of abundance, one from the longline fishery and four from the purse-seine fisheries, and the length composition data from longline and purse-seine fisheries. The model was unable to reconcile indices from different fisheries and length-frequency data that apparently carried contradictory signals about the status of the stock (SAC-10 INF-F). To solve the inconsistencies, spatiotemporal models were used to produce new purse-seine and longline indices and associated length frequencies, but the inconsistencies were not resolved (Figure B-4). The mismatch was most apparent in 2001-2003, when a peak occurred earlier in the longline index and later in the purse-seine index (opposite to what was expected given the growth and selectivity assumptions of the model). By incorporating length classes in the standardization, it became clear that the differences were due mainly to the 1998 cohort (of an important El Niño year) being prominent in the longline index, while not showing in in purse-seine index, and the opposite occurring with the 1999 cohort (an equally important La Niña year). The mismatch between the purse-seine and the longline indices continues to be striking in the updated series (Figure B-4). Spatial heterogeneity was considered as the most plausible explanation for the unresolved inconsistencies.
Three overarching hypotheses related to the degree of spatial mixing of the yellowfin tuna stock in the EPO where developed (SAC-11-INF-J). Of those, the high-mixing hypothesis was assumed for the benchmark assessment, with the purse-seine index assumed the most representative of the core of the exploited population (SAC-11-07). A series of lower hierarchical level hypotheses were developed regarding other major uncertainties in the previous assessment. From those, 12 reference models were developed, which combine components that address changes in selectivity and catchability, growth, asymptotic selectivity, and density-dependence in the index catchability (Table B-1). Each reference model was run with four steepness of the stock-recruitment relationship assumptions (0.7, 0.8, 0.9, and 1.0). A total of 48 models composed the benchmark assessment for yellowfin tuna (SAC-11-07). In addition, new fishery definitions were implemented, and spline selectivity functions were adopted for most fisheries. All EPO catches were added to the models, which were fit to a standardized purse-seine index of abundance for the EPO north of 5°N and to the length-composition data from the purse-seine fisheries that operate north of 5°N, in order to avoid contamination of the signal with that of a possible southern population. The models were diagnosed for model misspecification, lack of fit, retrospective bias, among others (SAC-11-07). Rather than choosing a base-case model, all models where used to produce management advice by combining them using relative weights determined based on several criteria, including performance on model diagnostics (SAC-11-INF-J).
The 48 models of the benchmark assessment estimate similar relative recruitment trends, regardless of the steepness assumed (Figure B-5). All biomass trajectories have declining trends, but they vary in the magnitude of the declines (Figure B-6). All models indicate the highest F for fish aged 21+ quarters (5.25+ years), followed by fish aged 11-20 quarters (2.75-5 years) (Figure B-7). All models estimate similar impacts of the different types of fisheries (Figure B-8). The longline and the sorted discard fisheries have the smallest impact, while the purse-seine fisheries associated with dolphins have the greatest impact during most of the assessment period (1984-2019). In 1990s the impact of the floating-object fisheries started to be noteworthy, and surpassed that of the unassociated fisheries around 2008 and that of the purse-seine fisheries associated with dolphins in 2018. At the beginning of 2020, the spawning biomass (S) of yellowfin ranged from 49% to 219% of the level at dynamic MSY (SMSY_d); 12 models suggested that it was below that level (Figure B-9, Table B-2). At the beginning of 2020, the spawning biomass (S) of yellowfin ranged from 145% to 345% of the limit reference level (SLIMIT); no models suggest that it was below that limit. During 2017-2019 the fishing mortality (F) of yellowfin ranged from 40% to 168% of the level at MSY (FMSY); 14 models suggested that it was above that level. During 2017-2019, the fishing mortality of yellowfin ranged from 22% to 65% of the limit reference level (FLIMIT); no models suggest that it was above that limit. Every reference model suggests that lower steepness values correspond to more pessimistic estimates of stock status: lower S and higher F relative to the reference points.

IATTC-98-01 - Fisheries, stocks, and the ecosystem in the EPO in 2020 51
The results from the reference models are combined in a risk analysis to provide management advice (SAC-11-08). The probabilities of exceeding the reference points where computed using each model result and its associated weight, the final estimates are in Table B-3 and Figures B-9 and B-10. All probability distributions are unimodal (Figure B-10). There is a low probability of Fcur being above FMSY (9%). The probability of Fcur being above FLIMIT is zero. The probability of the spawning biomass being below SMSY_d
is low (12%). The probability of the spawning biomass exceeding SLIMIT is zero. The combined expected risk of F exceeding FMSY is below 50% for six closure durations (Table B-3; Figure B-11), varying from 26% (no closure) to 5% (100 days), with a low risk (9%) for the current closure (72 days). One model (Base-A) produced a pessimistic result (a risk above 50% of exceeding FMSY for all scenarios (Table B-3), but this model has a very low relative weight (0.01).
A key uncertainty not addressed in this assessment is the spatial structure of the stock of yellowfin tuna in the EPO. Future work to further improve the assessment will focus on it.

IATTC-98-01 - Fisheries, stocks, and the ecosystem in the EPO in 2020 52
TABLE B-1. Model configurations (hypotheses) used for yellowfin tuna in the EPO (from SAC-11-08 Table A)

IATTC-98-01 - Fisheries, stocks, and the ecosystem in the EPO in 2020 53
TABLE B-2. Management quantities for yellowfin tuna in the EPO for each reference model summarized over the four steepness values. See explantion of code in Table B-1 (from SAC-11-08 Table 1)
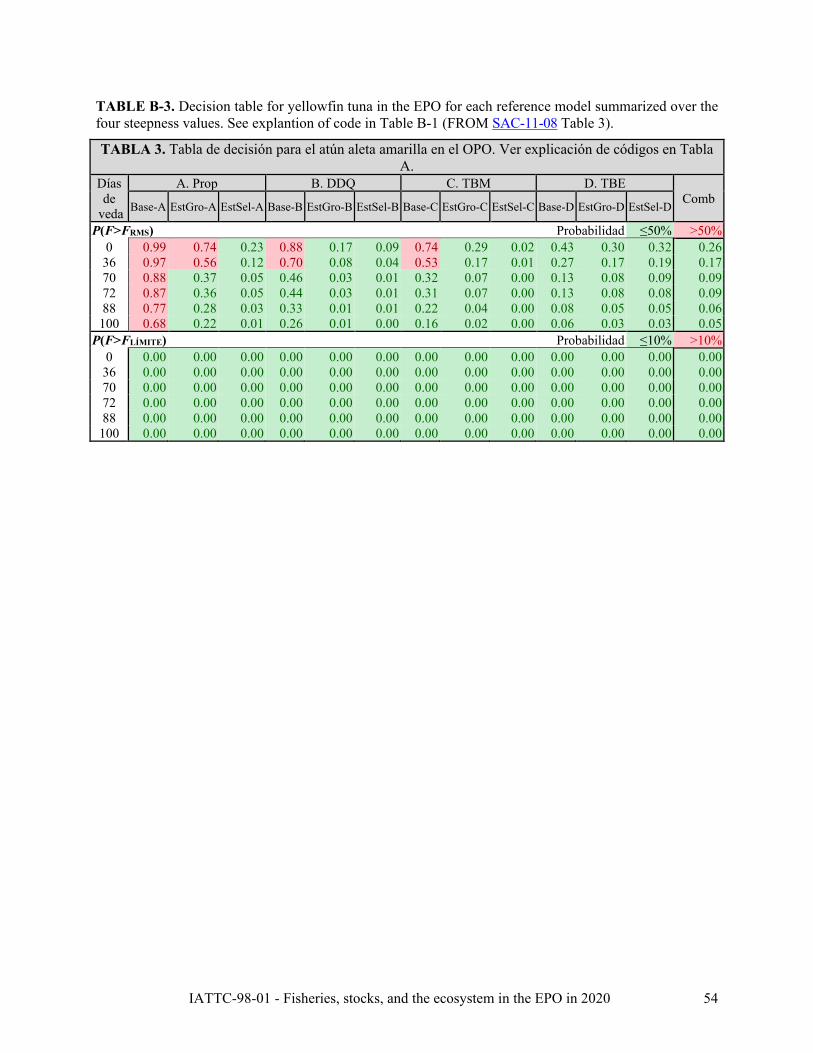
IATTC-98-01 - Fisheries, stocks, and the ecosystem in the EPO in 2020 54
TABLE B-3. Decision table for yellowfin tuna in the EPO for each reference model summarized over the four steepness values. See explantion of code in Table B-1 (FROM SAC-11-08 Table 3).
TABLA 3. Tabla de decisión para el atún aleta amarilla en el OPO. Ver explicación de códigos en Tabla A.
Días de
veda
A. Prop B. DDQ C. TBM D. TBE Comb Base-A EstGro-A EstSel-A Base-B EstGro-B EstSel-B Base-C EstGro-C EstSel-C Base-D EstGro-D EstSel-D
P(F>FRMS) Probabilidad ≤50% >50% 0 0.99 0.74 0.23 0.88 0.17 0.09 0.74 0.29 0.02 0.43 0.30 0.32 0.26
36 0.97 0.56 0.12 0.70 0.08 0.04 0.53 0.17 0.01 0.27 0.17 0.19 0.17 70 0.88 0.37 0.05 0.46 0.03 0.01 0.32 0.07 0.00 0.13 0.08 0.09 0.09 72 0.87 0.36 0.05 0.44 0.03 0.01 0.31 0.07 0.00 0.13 0.08 0.08 0.09 88 0.77 0.28 0.03 0.33 0.01 0.01 0.22 0.04 0.00 0.08 0.05 0.05 0.06
100 0.68 0.22 0.01 0.26 0.01 0.00 0.16 0.02 0.00 0.06 0.03 0.03 0.05 P(F>FLÍMITE) Probabilidad ≤10% >10%
0 0.00 0.00 0.00 0.00 0.00 0.00 0.00 0.00 0.00 0.00 0.00 0.00 0.00 36 0.00 0.00 0.00 0.00 0.00 0.00 0.00 0.00 0.00 0.00 0.00 0.00 0.00 70 0.00 0.00 0.00 0.00 0.00 0.00 0.00 0.00 0.00 0.00 0.00 0.00 0.00 72 0.00 0.00 0.00 0.00 0.00 0.00 0.00 0.00 0.00 0.00 0.00 0.00 0.00 88 0.00 0.00 0.00 0.00 0.00 0.00 0.00 0.00 0.00 0.00 0.00 0.00 0.00
100 0.00 0.00 0.00 0.00 0.00 0.00 0.00 0.00 0.00 0.00 0.00 0.00 0.00

IATTC-98-01 - Fisheries, stocks, and the ecosystem in the EPO in 2020 55
FIGURE B-1. Total catches (retained catches plus discards) for the purse-seine fisheries, by set type (DEL, NOA, OBJ), and retained catches for the longline (LL) and other (OTR) fisheries, of yellowfin tuna in the eastern Pacific Ocean, 1975-2020. The purse-seine catches are adjusted to the species composition estimate obtained from sampling the catches. The 2020 data are preliminary. FIGURA B-1. Capturas totales (capturas retenidas más descartes) en las pesquerías de cerco, por tipo de lance (DEL, NOA, OBJ), y capturas retenidas de las pesquerías de palangre (LL) y otras (OTR), de atún aleta amarilla en el Océano Pacífico oriental, 1975-2020. Se ajustan las capturas de cerco a la estimación de la composición por especie obtenida del muestreo de las capturas. Los datos de 2020 son preliminares.

IATTC-98-01 - Fisheries, stocks, and the ecosystem in the EPO in 2020 56
FIGURE B-2. Indicators of total effort in the EPO, based on purse-seine data closure-adjusted capacity, 2000-2020; annual total number of sets, by type, 1987-2019) and based on longline data for 2000-2018 (effort reported by all fleets, in total numbers of hooks; proportion of the effort corresponding to Japan). The dashed horizontal lines are the 5th and 95th percentiles, the solid horizontal line is the median. FIGURA B-2. Indicadores del esfuerzo total en el OPO, basados en datos de cerco (capacidad ajustada por veda, 2000-2020; número total anual de lances, por tipo, 1987-2019) y en datos de palangre de 2000-2018 (esfuerzo notificado por todas las flotas, en número total de anzuelos; proporción del esfuerzo correspondiente a Japón). Las líneas horizontales de trazos representan los percentiles de 5 y 95%, y la línea horizontal sólida la mediana.

IATTC-98-01 - Fisheries, stocks, and the ecosystem in the EPO in 2020 57
FIGURE B-3. Indicators (catch (t and numbers); CPUE (t/day fished); average length (cm)) for the yellowfin tuna stock in the eastern Pacific Ocean, from purse-seine fisheries; relative catch and relative average length, obtained from standardized length composition using spatiotemporal model, from longline fisheries. FIGURA B-3. Indicadores (captura (t); esfuerzo (días de pesca); CPUE (t/día de pesca); talla promedio (cm)) para la población de atún aleta amarilla en el Océano Pacífico oriental, de las pesquerías de cerco, Captura relativa y talla promedio relativa de las pesquerías de palangre, obtenidas de la composición por talla estandarizada usando el modelo espaciotemporal, de las pesquerías de palangre.

IATTC-98-01 - Fisheries, stocks, and the ecosystem in the EPO in 2020 58
FIGURE B-4. Top: Relative abundance indices derived from catch per unit of effort of purse-seine (1985-2020) and longline (1995- 2020 3rd quarter) fisheries standardized using spatiotemporal models. Bottom – Spatial domain of the purse-seine and longline derived indices. FIGURA B-4. Arriba: Índices de abundancia relativa derivados de la captura por unidad de esfuerzo de las pesquerías de cerco (1985-2020) y de palangre (1995-2020 3er trimestre) estandarizados mediante modelos espaciotemporales. Abajo: Dominio espacial de los índices derivados de cerco y palangre.
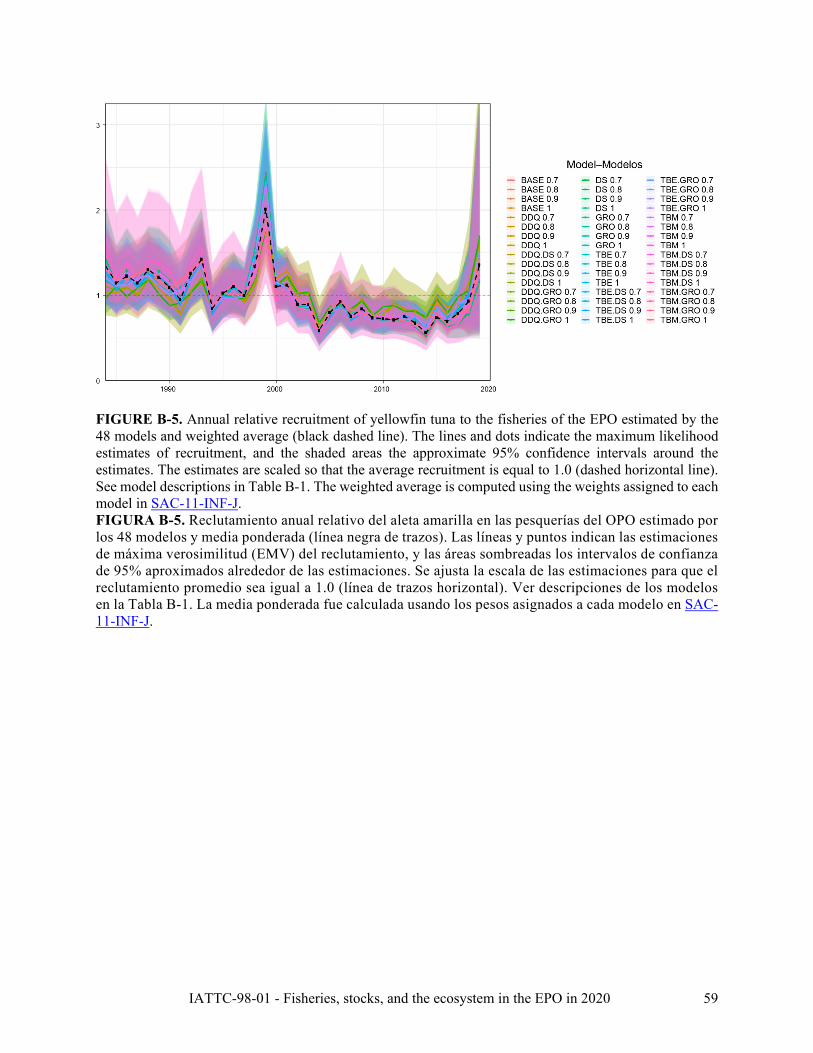
IATTC-98-01 - Fisheries, stocks, and the ecosystem in the EPO in 2020 59
FIGURE B-5. Annual relative recruitment of yellowfin tuna to the fisheries of the EPO estimated by the 48 models and weighted average (black dashed line). The lines and dots indicate the maximum likelihood estimates of recruitment, and the shaded areas the approximate 95% confidence intervals around the estimates. The estimates are scaled so that the average recruitment is equal to 1.0 (dashed horizontal line). See model descriptions in Table B-1. The weighted average is computed using the weights assigned to each model in SAC-11-INF-J. FIGURA B-5. Reclutamiento anual relativo del aleta amarilla en las pesquerías del OPO estimado por los 48 modelos y media ponderada (línea negra de trazos). Las líneas y puntos indican las estimaciones de máxima verosimilitud (EMV) del reclutamiento, y las áreas sombreadas los intervalos de confianza de 95% aproximados alrededor de las estimaciones. Se ajusta la escala de las estimaciones para que el reclutamiento promedio sea igual a 1.0 (línea de trazos horizontal). Ver descripciones de los modelos en la Tabla B-1. La media ponderada fue calculada usando los pesos asignados a cada modelo en SAC-11-INF-J.
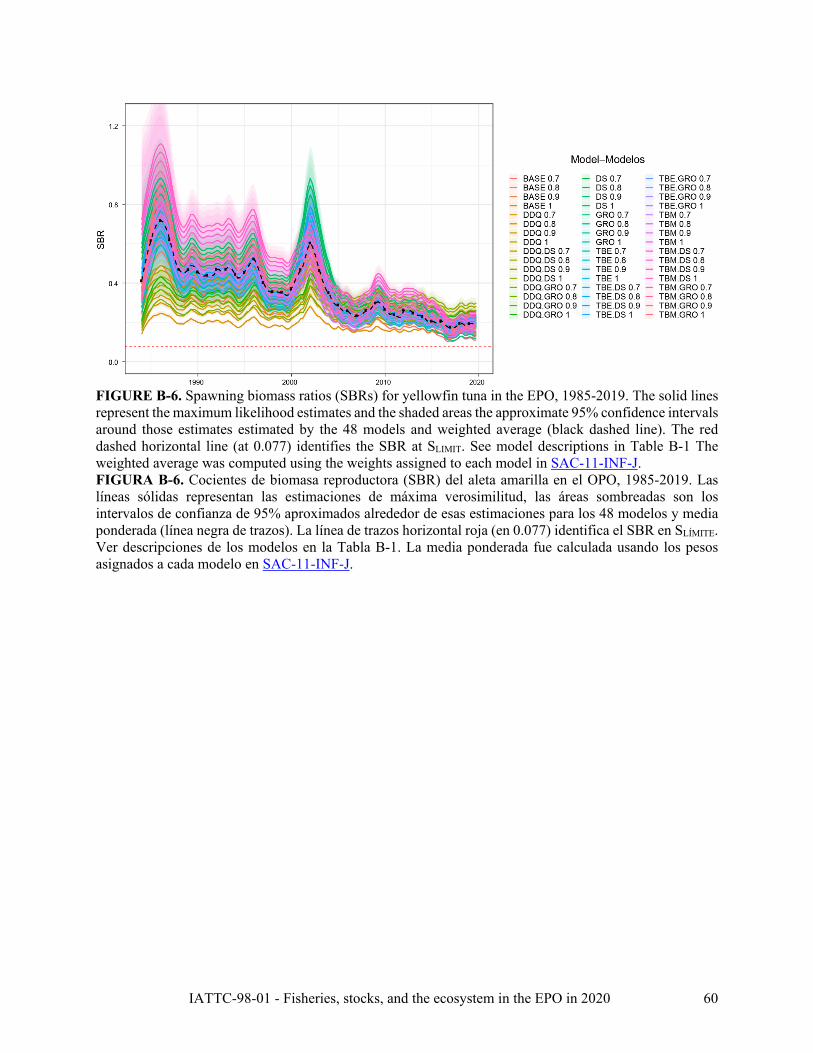
IATTC-98-01 - Fisheries, stocks, and the ecosystem in the EPO in 2020 60
FIGURE B-6. Spawning biomass ratios (SBRs) for yellowfin tuna in the EPO, 1985-2019. The solid lines represent the maximum likelihood estimates and the shaded areas the approximate 95% confidence intervals around those estimates estimated by the 48 models and weighted average (black dashed line). The red dashed horizontal line (at 0.077) identifies the SBR at SLIMIT. See model descriptions in Table B-1 The weighted average was computed using the weights assigned to each model in SAC-11-INF-J. FIGURA B-6. Cocientes de biomasa reproductora (SBR) del aleta amarilla en el OPO, 1985-2019. Las líneas sólidas representan las estimaciones de máxima verosimilitud, las áreas sombreadas son los intervalos de confianza de 95% aproximados alrededor de esas estimaciones para los 48 modelos y media ponderada (línea negra de trazos). La línea de trazos horizontal roja (en 0.077) identifica el SBR en SLÍMITE. Ver descripciones de los modelos en la Tabla B-1. La media ponderada fue calculada usando los pesos asignados a cada modelo en SAC-11-INF-J.

IATTC-98-01 - Fisheries, stocks, and the ecosystem in the EPO in 2020 61
FIGURE B-7. Average annual fishing mortality (F) of yellowfin tuna in the EPO, by age group (in quarters), for all gears, estimated by the 48 models and weighted average. See model descriptions in Table B-1. The weighted average was computed using the weights assigned to each model in SAC-11-INF-J. FIGURA B-7. Mortalidad por pesca (F) anual promedio del atún aleta amarilla en el OPO, por grupo de edad (en trimestres), por todas las artes, estimada por los 48 modelos y media ponderada. Ver descripciones de los modelos en la Tabla B-1. La media ponderada fue calculada usando los pesos asignados a cada modelo en SAC-11-INF-J.

IATTC-98-01 - Fisheries, stocks, and the ecosystem in the EPO in 2020 62
FIGURE B-8. Impact of fishing, 1985-2019: trajectory of the spawning biomass (a fecundity index, see text for details) of a simulated population of yellowfin tuna that was never exploited (dashed line) and that predicted by each model, with a steepness of 1.0 (solid line). The shaded areas between the two lines show the portions of the impact attributed to each fishing method. See model descriptions in Table B-1. FIGURA B-8. Impacto de la pesca, 1985-2019: trayectoria de la biomasa reproductora (un índice de fecundidad, ver detalles en el texto) de una población simulada de aleta amarilla que nunca fue explotada (línea de trazos) y la trayectoria predicha por cada modelo, con una inclinación de 1.0 (línea sólida). Las áreas sombreadas entre las dos líneas muestran las porciones del impacto atribuido a cada método de pesca. Ver descripciones de los modelos en la Tabla B-1.

IATTC-98-01 - Fisheries, stocks, and the ecosystem in the EPO in 2020 63
FIGURE B-9. Kobe (phase) plot of the time series of estimates of spawning stock size (S) and fishing mortality (F) of yellowfin tuna relative to their MSY reference points. The colored panels are separated by the target reference points (SMSY and FMSY). Limit reference points (dashed lines), which correspond to a 50% reduction in recruitment from its average unexploited level, based on a conservative steepness (h) of 0.75 for the Beverton-Holt stock-recruitment relationship, are merely indicative, since they vary by model and are based on all models combined. The center point for each model indicates the current stock status, based on the average fishing mortality (F) over the last three years; The solid black circle represents all models combined; to be consistent with the probabilistic nature of the risk analysis and the HCR, it is based on P(Scur/SLIMIT<x) = 0.5 and P(Fcur/FMSY>x) = 0.5. The lines around each estimate represent its approximate 95% confidence interval. FIGURA B-9. Diagrama de Kobe (fase) de la serie de tiempo de las estimaciones del tamaño de la población reproductora (S) y de la mortalidad por pesca (F) del atún aleta amarilla relativas a sus puntos de referencia de RMS. Los paneles de colores están separados por los puntos de referencia objetivo (SRMS y FRMS). Los puntos de referencia límite (líneas de trazos), que corresponden a una reducción del 50% del reclutamiento de su nivel promedio sin explotación, basados en una inclinación (h) cautelosa de 0.75 para la relación población-reclutamiento de Beverton-Holt, son meramente indicativos, ya que varían por modelo y se basan en todos los modelos combinados. El punto central para cada modelo indica la condición actual de la población, con base en la mortalidad por pesca media durante los tres últimos años. El círculo negro sólido representa todos los modelos combinados; para ser consistente con la naturaleza probabilista del análisis de riesgos y la RCE, se basa en P(Sact/SLÍMITE<x) = 0.5 y P(Fact/FRMS>x) = 0.5. Las líneas alrededor de cada estimación representan su intervalo de confianza aproximado de 95%.
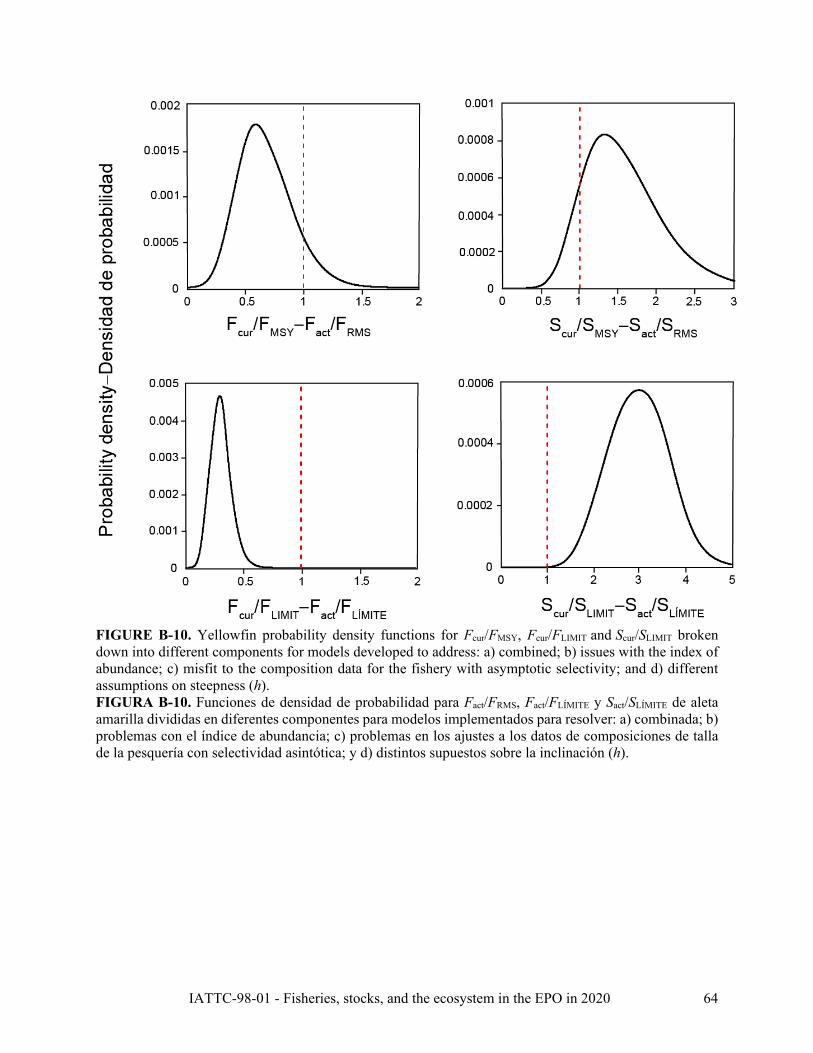
IATTC-98-01 - Fisheries, stocks, and the ecosystem in the EPO in 2020 64
FIGURE B-10. Yellowfin probability density functions for Fcur/FMSY, Fcur/FLIMIT and Scur/SLIMIT broken down into different components for models developed to address: a) combined; b) issues with the index of abundance; c) misfit to the composition data for the fishery with asymptotic selectivity; and d) different assumptions on steepness (h). FIGURA B-10. Funciones de densidad de probabilidad para Fact/FRMS, Fact/FLÍMITE y Sact/SLÍMITE de aleta amarilla divididas en diferentes componentes para modelos implementados para resolver: a) combinada; b) problemas con el índice de abundancia; c) problemas en los ajustes a los datos de composiciones de talla de la pesquería con selectividad asintótica; y d) distintos supuestos sobre la inclinación (h).

IATTC-98-01 - Fisheries, stocks, and the ecosystem in the EPO in 2020 65
FIGURE B-11. Risk curves showing the probability of exceeding the target and limit reference points (RPs) for different durations of the temporal closure for yellowfin in the EPO. FIGURA B-11. Curvas de riesgo que señalan la probabilidad de rebasar los puntos de referencia (PR) objetivo y límite con diferentes duraciones de la veda temporal para aleta amarilla en el OPO.
IATTC-98-01 - Fisheries, stocks, and the ecosystem in the EPO in 2020 66
C. SKIPJACK TUNA
A major management objective for tunas in the eastern Pacific Ocean (EPO) is to keep stocks at levels capable of producing maximum sustainable yields (MSYs). Management objectives based on MSY or related reference points (e.g. fishing mortality that produces MSY (FMSY); spawner-per-recruit proxies) are in use for many species and stocks worldwide. However, these objectives require that reference points and quantities to which they are compared be available. The various reference points require different amounts and types of information, ranging from biological information (e.g. natural mortality, growth, and stock-recruitment relationship) and fisheries characteristics (e.g. age-specific selectivity), to absolute estimates of biomass and exploitation rates. These absolute estimates generally require a formal stock assessment model. For many species, the information required to estimate these quantities is not available, and alternative approaches are needed.
Skipjack tuna is a notoriously difficult species to assess. Due to its high and variable productivity (i.e. annual recruitment is a large proportion of total biomass), it is difficult to detect the effect of fishing on the population with standard fisheries data and stock assessment methods. This is particularly true for the stock of the EPO, due to the lack of age-composition data, and especially tagging data, without which a conventional stock assessment of skipjack is not possible. The continuous recruitment and rapid growth of skipjack mean that the temporal stratification needed to observe modes in length-frequency data make the current sample sizes inadequate. Previous assessments have had difficulty in estimating the absolute levels of biomass and exploitation rates, due to the possibility of a dome-shaped selectivity curve, which would mean that there is a cryptic biomass of large skipjack that cannot be estimated. The most recent assessment of skipjack in the EPO is considered preliminary because it is not known whether the catch per day fished for purse-seine fisheries is proportional to abundance. Further analysis of currently available tagging data is unlikely to improve the skipjack stock assessment and a fully length-structured model produced unrealistic estimates. In addition to the problems listed above, the levels of age-specific natural mortality are uncertain, if not unknown, and current yield-per-recruit (YPR) calculations indicate that the YPR would be maximized by catching the youngest skipjack in the model. Therefore, neither the biomass- nor fishing mortality-based reference points, nor the indicators to which they are compared, are available for skipjack in the EPO.
One of the major problems mentioned above is the uncertainty as to whether the catch per unit of effort (CPUE) of the purse-seine fisheries is an appropriate index of abundance for skipjack, particularly when the fish are associated with fish-aggregating devices (FADs). Purse-seine CPUE data are particularly problematic, because it is difficult to identify the appropriate unit of effort. In previous analyses, effort was defined as the amount of searching time required to find a school of fish on which to set the purse seine, and this is approximated by number of days fished. Few skipjack are caught in the longline fisheries or dolphin-associated purse-seine fisheries (Figure C-1), so these fisheries cannot be used to develop reliable indices of abundance for skipjack. Within a single trip, purse-seine sets on unassociated schools are generally intermingled with floating-object or dolphin-associated sets, complicating the CPUE calculations. Maunder and Hoyle (2007) developed a novel method to generate an index of abundance, using data from the floating-object fisheries. This method used the ratio of skipjack to bigeye in the catch and the “known” abundance of bigeye based on stock assessment results. Unfortunately, the method was of limited usefulness, and more research is needed to improve it. Currently, there is no reliable index of relative abundance for skipjack in the EPO. Therefore, other indicators of stock status, such as the average weight of the fish in the catch, should be investigated.
Since the stock assessments and reference points for skipjack in the EPO are so uncertain, developing alternative methods to assess and manage the species that are robust to these uncertainties would be beneficial. Full management strategy evaluation (MSE) for skipjack would be the most comprehensive method to develop and test alternative assessment methods and management strategies; however, developing MSE is time-consuming, and has not yet been conducted for skipjack. In addition, higher priority for MSE is given to yellowfin and bigeye tuna, as available data indicate that these species are

IATTC-98-01 - Fisheries, stocks, and the ecosystem in the EPO in 2020 67
more susceptible to overfishing than skipjack. Therefore, Maunder and Deriso (2007) investigated some simple indicators of stock status based on relative quantities. Rather than using reference points based on MSY, they compared current values of indicators to the distribution of indicators observed historically. They also developed a simple stock assessment model to generate indicators for biomass, recruitment, and exploitation rate. However, this year catch-per-set by set type replaces the catch-per-day-fished Stock Status Indicators (SSIs) used previously, which are considered unreliable due to possible biases in the method used to assign days fished to set types; also, the model-based indicators used for skipjack are no longer reported because they were based on the same CPDF data. The current SSIs begin in 2000 because the IATTC port-sampling program began the species composition sampling in that year, and it is after the major offshore expansion of the floating-object fishery which started in the mid-1990s. All SSIs are scaled (relative indicators) so that their average equals 1 during the 2000-2020 period. The reference levels were changed from the 5% and 95% percentiles to the 10% and 90% percentiles because extreme percentiles are less reliable with fewer years of data. The indicators for skipjack are presented in SAC-12-05. The COVID-19 pandemic has affected the fishery, and hence the SSIs in 2020, due to the reduced number of sets in the floating-object fishery, and therefore, this year should be used with caution when interpreting long term trends.
Many of the indicator values for recent years are near their reference levels with 2020 being an exception in that the number of sets in the floating-object fishery was substantially reduced (Figures B-2 and C-2). This 25% decline in the total number of floating-object sets from 2019 to 2020 is most likely attributable to the effect of the COVID-19 pandemic on fishery operations. The catch per set skipjack increased in 2020, but this may be due to the larger reduction in the number of sets made by IATTC Class 1-5 vessels, which have lower catch per set, as compared to the number of sets made by IATTC Class-6 vessels (see Table 7 of SAC-12-03). Exceeding a reference level can have multiple interpretations, and these will depend on the particular SSI being considered and whether the upper or the lower reference level has been exceeded. To interpret trends in SSIs, it may be helpful to take multiple SSIs into consideration simultaneously.
Most floating-object fishery SSIs suggest that the skipjack has potentially been subject to increased fishing mortality, mainly due to the increase in the number of sets in the floating-object fishery. Of particular concern is the constantly increasing trend in the number of floating object sets observed since 2005 (Figure B-2). This is reflected as an increase in catch for skipjack in floating-object sets and a decline in catch-per-set and in average length of the fish in the catch for the floating-object fishery (Figure C-2). The interpretation of increased fishing mortality is supported by trends in average length of skipjack caught in the other set types. On the other hand, trends in catch-per-set for unassociated sets, are not consistent with this interpretation (Figure C-2). The average length of fish in the retained catch may be less influenced by the unprecedented changes in fishing operations due to COVID-19, and in 2020 is at historically low levels in the floating-object fishery (Figure C-2).
The fact that most SSIs based on the floating-object fishery are consistent with an increase in fishing mortality in that fishery means that precautionary management measures should be considered to prevent further increases.
Productivity and susceptibility analysis (PSA; see IATTC Fishery Status Report 12, Figure L-4) shows that skipjack has substantially higher productivity than bigeye. Biomass (B) and the fishing mortality that corresponds to MSY (FMSY) are, respectively, negatively and positively correlated with productivity. Therefore, since skipjack and bigeye have about the same susceptibility, and susceptibility is related to fishing mortality, the status of skipjack can be inferred from the status of bigeye, but only if the fishing mortality of bigeye is below the MSY level (i.e., F<FMSY). Since an assessment of bigeye is available, inferences can be made about the status of skipjack. Taking the risk analysis results for bigeye as reference (SAC-11-08), the staff infers the following about the skipjack stock status in the EPO (Table A):
1. There is less than 50% probability that FMSY has been exceeded (P(F>FMSY)<50%), and a less than 53% probability that Scur is below SMSY (P(S<SMSY)<53%),
IATTC-98-01 - Fisheries, stocks, and the ecosystem in the EPO in 2020 68
2. There is less than 5% probability that FLIMIT has been exceeded (P(F>FLIMIT)<5%), and less than 6% probability that SLIMIT has been breached (P(S>SLIMIT)<6%).
These inferences about skipjack stock status from the PSA analysis are interim: direct advice from a skipjack assessment is still needed. The staff is currently conducting a multi-year tagging study of tropical tunas in the EPO aimed at obtaining data that will contribute to, and reduce uncertainty in, tuna stock assessments, particularly for skipjack (Project E.4.a; see SAC-12-06). In addition, an MSE process for tropical tunas, which includes skipjack, is ongoing at IATTC.

IATTC-98-01 - Fisheries, stocks, and the ecosystem in the EPO in 2020 69
FIGURE C-1. Total catches (retained catches plus discards) for the purse-seine fisheries, by set type (NOA, OBJ) and retained catches for the other (OTR) fisheries, of skipjack tuna in the eastern Pacific Ocean, 1975- 2020. The purse-seine catches are adjusted to the species composition estimate obtained from sampling the catches. The 2020 catch data are preliminary. FIGURA C-1. Capturas totales (capturas retenidas más descartes) en las pesquerías de cerco, por tipo de lance (NOA, OBJ), y capturas retenidas de las otras pesquerías (OTR), de atún barrilete en el Océano Pacífico oriental, 1975-2020. Se ajustan las capturas de cerco a la estimación de la composición por especie obtenida del muestreo de las capturas. Los datos de captura de 2020 son preliminares.

IATTC-98-01 - Fisheries, stocks, and the ecosystem in the EPO in 2020 70
FIGURE C-2. Indicators of stock status for skipjack tuna in the eastern Pacific Ocean. OBJ: floating-object fishery; NOA: unassociated fishery; DEL: dolphin associated fishery. All indicators are scaled so that their average equals one. FIGURA C-2. Indicadores de condición de la población de atún barrilete en el Océano Pacífico oriental. OBJ: pesquería sobre objetos flotantes; NOA: pesquería no asociada; CPDP: captura por día de pesca. Se ajusta la escala de todos los indicadores para que su promedio equivalga a uno.
IATTC-98-01 - Fisheries, stocks, and the ecosystem in the EPO in 2020 71
D. BIGEYE TUNA
For the full version of this analysis, see documents SAC-11-05, SAC-11-06, SAC-11-INF-F, and SAC-11-08.
Bigeye tuna are distributed in tropical and temperate waters across the Pacific Ocean. In the eastern Pacific Ocean (EPO), the majority of catch before 1993 was taken by longline fisheries that target large bigeye (Figure D-1). Due to the expansion of purse-seine fisheries associated with floating objects, purse-seine fisheries that target small bigeye have replaced longline fisheries as the dominant fishery type for EPO bigeye since 1996.
In 2021, stock status indicators (SSIs) were developed for bigeye using the data collected in the EPO as a whole (SAC-12-05). For the floating-object fishery, the main fishery for bigeye since 1993, fishing effort has been continuously increasing (Figure B-2). This increase in fishing effort corresponds to increased catch, decreased catch per set, and decreased average length for the floating-object fishery during the same time (Figure D-2). In 2020, Covid-19 became a global pandemic and had pronounced impacts on the floating-object fishery in the EPO. Specifically, fishing effort dramatically decreased (Figure B-2) while catch and catch per set for bigeye both notably increased in 2020 (Figure D-2). The opposite trend in fishing effort and bigeye catch in 2020 could be real due to, for example, strong recent recruitments or shifted spatial distribution of fishing effort towards bigeye hotspots. However, the staff cannot rule out the possibility that the opposite trend is an artifact of the Covid-impacted port-sampling program for species and size compositions. In fact, the proportions of total trips and wells sampled both dropped by around 50% from 2019 to 2020 and the degree of drop varies greatly among ports. As such, the estimate of bigeye catch for 2020 is likely more uncertain and biased. The staff plans to analyze this issue in detail and, if needed, improve the estimate of bigeye catch for 2020. Due to the COVID-19 effect, 2020 should be regarded with caution when interpreting long term trends in the indicators. The fishing effort associated with the longline fishery, in comparison, does not show a noticeable long-term trend and remained around the median level since 2013 (Figure B-2). The longline index of abundance represents adult population trend and is one of the key inputs to the stock assessment model for bigeye. It suggests a long-term decreasing trend in adult population abundance since 2000 (Figure D-3). However, the average length for the longline fishery remained relatively stable since 2000 (Figure D-3).
A workplan to improve the stock assessments for tropical tunas was executed and an external review for bigeye was completed. The external review panel did not single out a particular model configuration as a replacement for the base case model but suggested a variety of alternatives for the staff to consider. To encompass as many hypotheses as possible, the staff developed a pragmatic risk assessment framework to apply for both species, which included the development of hypotheses, the implementation and weighting of models, and the construction of risk tables based on the combined result across all reference models (SAC-11-08, SAC-11-INF-F, SAC-11-INF-J).
The reference models for the benchmark assessment of bigeye were built based on three overarching hypotheses (SAC-11-INF-J). The first overarching hypothesis is about the cause of the apparent recruitment shift which coincides with the expansion of the floating-object fishery, assuming that shift is either real or an artifact of model misspecification. The second overarching hypothesis consists of two levels. The first level represents the cause of the apparent recruitment shift given it is an artifact of model misspecification. It is assumed that mis-specified process is either known (movement, mortality, selectivity, or growth) or unknown (other than those four processes). The second level represents the cause of the misfit to the length composition data from the longline fishery that has asymptotic selectivity. It is assumed that the misfit is due to random observation error or an artifact of model misspecification (in growth, selectivity, or natural mortality). The third overarching hypothesis is about the steepness of the Beverton-Holt stock-recruitment relationship, which was assumed in the reference models to be 0.7, 0.8, 0.9, or 1.0. In total, 44 reference models were retained in the benchmark assessment for bigeye tuna (SAC-11-06). These reference models on which the management advice is based were combined using relative weights determined by several criteria, including performance on

IATTC-98-01 - Fisheries, stocks, and the ecosystem in the EPO in 2020 72
model diagnostics (SAC-11-INF-J).
The results from the 44 reference models for bigeye show that (1) the recruitment shift is apparent in some but not all models (Figure D-4); (2) all models show a decreasing trend in spawning biomass while the scale of the spawning biomass varies dramatically among models (Figure D-5); (3) since 2000, the fishing mortality on juvenile bigeye (age 1-8 quarters) has increased while that on adult bigeye (age 13-39 quarters) has decreased (Figure D-6). The fishery impact plot shows clearly that the floating-object fishery has the dominant impact on the current spawning biomass of bigeye, regardless of the model (Figure D-7).
Regarding management quantities (Figure D-8), the 44 reference models estimate that (1) at the beginning of 2020, the spawning biomass of bigeye ranged from 14% to 212% of the level at dynamic MSY; 26 models suggest that it was below that level; (2) at the beginning of 2020, the spawning biomass of bigeye ranged from 51% to 532% of the limit reference level; five models suggest that it was below that limit; (3) during 2017-2019, the fishing mortality of bigeye ranged from 51% to 223% of the level at MSY; 26 runs suggest that it was above that level; (4) during 2017-2019, the fishing mortality of bigeye ranged from 32% to 114% of the limit reference level; three models suggest that it was above that limit.
The results from the 44 reference models are combined in a risk analysis framework to provide management advice (SAC-11-08). The combined risk curves (Figure D-9) show that (1) the probabilities of fishing mortality during 2017-2019 (𝐹𝐹𝑐𝑐𝑢𝑢𝑢𝑢) being higher than the target and limit reference levels are 50% and 5%, respectively; (2) the probabilities of spawning biomass at the beginning of 2020 (𝑆𝑆𝑐𝑐𝑢𝑢𝑢𝑢) being lower than the target and limit reference levels are 53% and 6%, respectively. Although the combined distribution suggests that the probability of 𝐹𝐹𝑐𝑐𝑢𝑢𝑢𝑢 being higher than the limit reference level is much lower than 10%, the combined probability distribution is bimodal (Figure D-10). This bimodal pattern for bigeye is due to the substantial differences in estimates between two groups of models, one more pessimistic and one more optimistic (Figures D-5 and D-11; Table D-2). It should be noted that the combined risk curve based only on pessimistic models shows that the probability of 𝐹𝐹𝑐𝑐𝑢𝑢𝑢𝑢 being higher than the limit reference level reaches 10% (Figure D-11 and Table D-3), the level beyond which additional management measures shall be established (Resolution C-16-02). The bimodality complicates the evaluation of the status of the bigeye stock and of the potential outcomes of management actions. This issue needs to be addressed in the future to improve management advice.
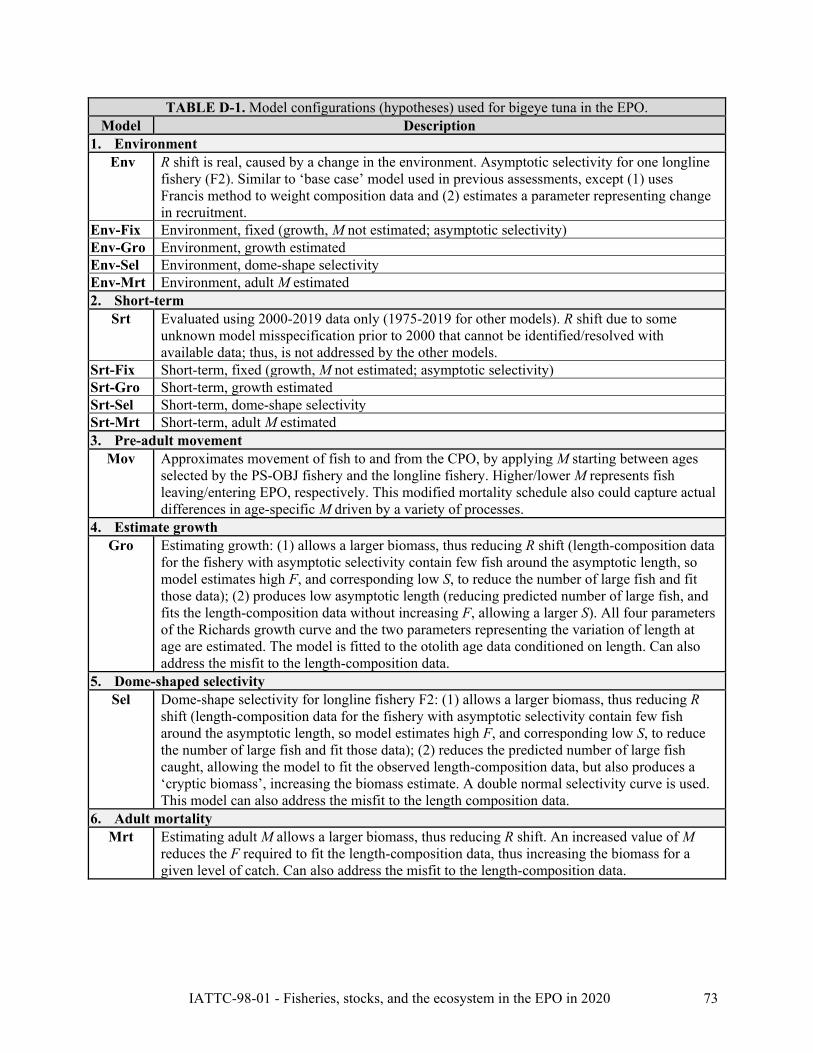
IATTC-98-01 - Fisheries, stocks, and the ecosystem in the EPO in 2020 73
TABLE D-1. Model configurations (hypotheses) used for bigeye tuna in the EPO. Model Description
1. Environment Env R shift is real, caused by a change in the environment. Asymptotic selectivity for one longline
fishery (F2). Similar to ‘base case’ model used in previous assessments, except (1) uses Francis method to weight composition data and (2) estimates a parameter representing change in recruitment.
Env-Fix Environment, fixed (growth, M not estimated; asymptotic selectivity) Env-Gro Environment, growth estimated Env-Sel Environment, dome-shape selectivity Env-Mrt Environment, adult M estimated 2. Short-term
Srt Evaluated using 2000-2019 data only (1975-2019 for other models). R shift due to some unknown model misspecification prior to 2000 that cannot be identified/resolved with available data; thus, is not addressed by the other models.
Srt-Fix Short-term, fixed (growth, M not estimated; asymptotic selectivity) Srt-Gro Short-term, growth estimated Srt-Sel Short-term, dome-shape selectivity Srt-Mrt Short-term, adult M estimated 3. Pre-adult movement
Mov Approximates movement of fish to and from the CPO, by applying M starting between ages selected by the PS-OBJ fishery and the longline fishery. Higher/lower M represents fish leaving/entering EPO, respectively. This modified mortality schedule also could capture actual differences in age-specific M driven by a variety of processes.
4. Estimate growth Gro Estimating growth: (1) allows a larger biomass, thus reducing R shift (length-composition data
for the fishery with asymptotic selectivity contain few fish around the asymptotic length, so model estimates high F, and corresponding low S, to reduce the number of large fish and fit those data); (2) produces low asymptotic length (reducing predicted number of large fish, and fits the length-composition data without increasing F, allowing a larger S). All four parameters of the Richards growth curve and the two parameters representing the variation of length at age are estimated. The model is fitted to the otolith age data conditioned on length. Can also address the misfit to the length-composition data.
5. Dome-shaped selectivity Sel Dome-shape selectivity for longline fishery F2: (1) allows a larger biomass, thus reducing R
shift (length-composition data for the fishery with asymptotic selectivity contain few fish around the asymptotic length, so model estimates high F, and corresponding low S, to reduce the number of large fish and fit those data); (2) reduces the predicted number of large fish caught, allowing the model to fit the observed length-composition data, but also produces a ‘cryptic biomass’, increasing the biomass estimate. A double normal selectivity curve is used. This model can also address the misfit to the length composition data.
6. Adult mortality Mrt Estimating adult M allows a larger biomass, thus reducing R shift. An increased value of M
reduces the F required to fit the length-composition data, thus increasing the biomass for a given level of catch. Can also address the misfit to the length-composition data.
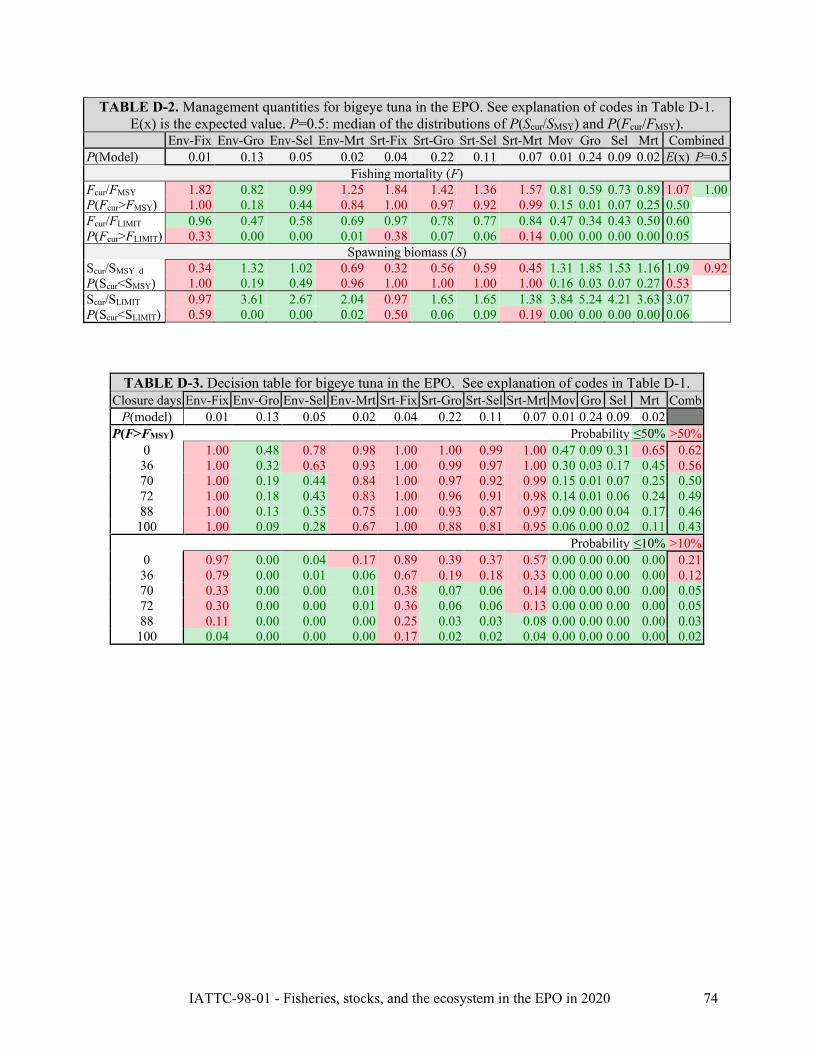
IATTC-98-01 - Fisheries, stocks, and the ecosystem in the EPO in 2020 74
TABLE D-2. Management quantities for bigeye tuna in the EPO. See explanation of codes in Table D-1. E(x) is the expected value. P=0.5: median of the distributions of P(Scur/SMSY) and P(Fcur/FMSY).
Env-Fix Env-Gro Env-Sel Env-Mrt Srt-Fix Srt-Gro Srt-Sel Srt-Mrt Mov Gro Sel Mrt Combined P(Model) 0.01 0.13 0.05 0.02 0.04 0.22 0.11 0.07 0.01 0.24 0.09 0.02 E(x) P=0.5
Fishing mortality (F) Fcur/FMSY 1.82 0.82 0.99 1.25 1.84 1.42 1.36 1.57 0.81 0.59 0.73 0.89 1.07 1.00 P(Fcur>FMSY) 1.00 0.18 0.44 0.84 1.00 0.97 0.92 0.99 0.15 0.01 0.07 0.25 0.50 Fcur/FLIMIT 0.96 0.47 0.58 0.69 0.97 0.78 0.77 0.84 0.47 0.34 0.43 0.50 0.60 P(Fcur>FLIMIT) 0.33 0.00 0.00 0.01 0.38 0.07 0.06 0.14 0.00 0.00 0.00 0.00 0.05
Spawning biomass (S) Scur/SMSY d 0.34 1.32 1.02 0.69 0.32 0.56 0.59 0.45 1.31 1.85 1.53 1.16 1.09 0.92 P(Scur<SMSY) 1.00 0.19 0.49 0.96 1.00 1.00 1.00 1.00 0.16 0.03 0.07 0.27 0.53 Scur/SLIMIT 0.97 3.61 2.67 2.04 0.97 1.65 1.65 1.38 3.84 5.24 4.21 3.63 3.07 P(Scur<SLIMIT) 0.59 0.00 0.00 0.02 0.50 0.06 0.09 0.19 0.00 0.00 0.00 0.00 0.06
TABLE D-3. Decision table for bigeye tuna in the EPO. See explanation of codes in Table D-1. Closure days Env-Fix Env-Gro Env-Sel Env-Mrt Srt-Fix Srt-Gro Srt-Sel Srt-Mrt Mov Gro Sel Mrt Comb
P(model) 0.01 0.13 0.05 0.02 0.04 0.22 0.11 0.07 0.01 0.24 0.09 0.02 P(F>FMSY) Probability ≤50% >50%
0 1.00 0.48 0.78 0.98 1.00 1.00 0.99 1.00 0.47 0.09 0.31 0.65 0.62 36 1.00 0.32 0.63 0.93 1.00 0.99 0.97 1.00 0.30 0.03 0.17 0.45 0.56 70 1.00 0.19 0.44 0.84 1.00 0.97 0.92 0.99 0.15 0.01 0.07 0.25 0.50 72 1.00 0.18 0.43 0.83 1.00 0.96 0.91 0.98 0.14 0.01 0.06 0.24 0.49 88 1.00 0.13 0.35 0.75 1.00 0.93 0.87 0.97 0.09 0.00 0.04 0.17 0.46 100 1.00 0.09 0.28 0.67 1.00 0.88 0.81 0.95 0.06 0.00 0.02 0.11 0.43
Probability ≤10% >10% 0 0.97 0.00 0.04 0.17 0.89 0.39 0.37 0.57 0.00 0.00 0.00 0.00 0.21
36 0.79 0.00 0.01 0.06 0.67 0.19 0.18 0.33 0.00 0.00 0.00 0.00 0.12 70 0.33 0.00 0.00 0.01 0.38 0.07 0.06 0.14 0.00 0.00 0.00 0.00 0.05 72 0.30 0.00 0.00 0.01 0.36 0.06 0.06 0.13 0.00 0.00 0.00 0.00 0.05 88 0.11 0.00 0.00 0.00 0.25 0.03 0.03 0.08 0.00 0.00 0.00 0.00 0.03 100 0.04 0.00 0.00 0.00 0.17 0.02 0.02 0.04 0.00 0.00 0.00 0.00 0.02

IATTC-98-01 - Fisheries, stocks, and the ecosystem in the EPO in 2020 75
FIGURE D-1. Total catches (retained catches plus discards) by the purse-seine (PS) fisheries, and retained catches by the longline (LL) fisheries, of bigeye tuna in the eastern Pacific Ocean, 1975-2020. The purse-seine catches are adjusted to the species composition estimate obtained from sampling the catches. 2020 data are preliminary. FIGURA D-1. Capturas totales (capturas retenidas más descartes) de las pesquerías de cerco (PS), y capturas retenidas de las pesquerías de palangre (LL), de atún patudo en el Océano Pacífico oriental, 1975-2020. Se ajustan las capturas de cerco a la estimación de la composición por especie obtenida del muestreo de las capturas. Los datos de 2020 son preliminares.

IATTC-98-01 - Fisheries, stocks, and the ecosystem in the EPO in 2020 76
FIGURE D-2. Indicators of catch, catch per set, and average length for bigeye tuna in the EPO based on purse-seine data. FIGURA D-2. Indicadores de captura, captura por lance, y talla promedio para el atún patudo en el OPO basados en datos de cerco.

IATTC-98-01 - Fisheries, stocks, and the ecosystem in the EPO in 2020 77
Figure D-3. Index of abundance and average length of bigeye in the EPO, based on Japanese longline data for 1975-2020. The dashed horizontal lines are the 5th and 95th percentiles, the solid horizontal line is the median. Figura D-3. Índice de abundancia y talla promedio del patudo en el OPO, basados en datos de palangre japoneses para 1975-2020. Las líneas horizontales de trazos representan los percentiles de 5 y 95%, y la línea horizontal sólida la mediana.

IATTC-98-01 - Fisheries, stocks, and the ecosystem in the EPO in 2020 78
FIGURE D-4. Comparison of annual relative recruitment estimates for bigeye tuna in the eastern Pacific Ocean from the twelve reference models (only the estimates that correspond to steepness = 1.0 are shown). The shaded areas represent the 95% confidence intervals and the black line represents the combined estimates across the twelve models. FIGURA D-4. Comparación de las estimaciones de reclutamiento relativo anual de atún patudo en el Océano Pacífico oriental de los doce modelos de referencia (se muestran solamente las estimaciones que corresponden a la inclinación = 1.0). Las áreas sombreadas representan los intervalos de confianza de 95% y la línea negra representa las estimaciones combinadas de los doce modelos.
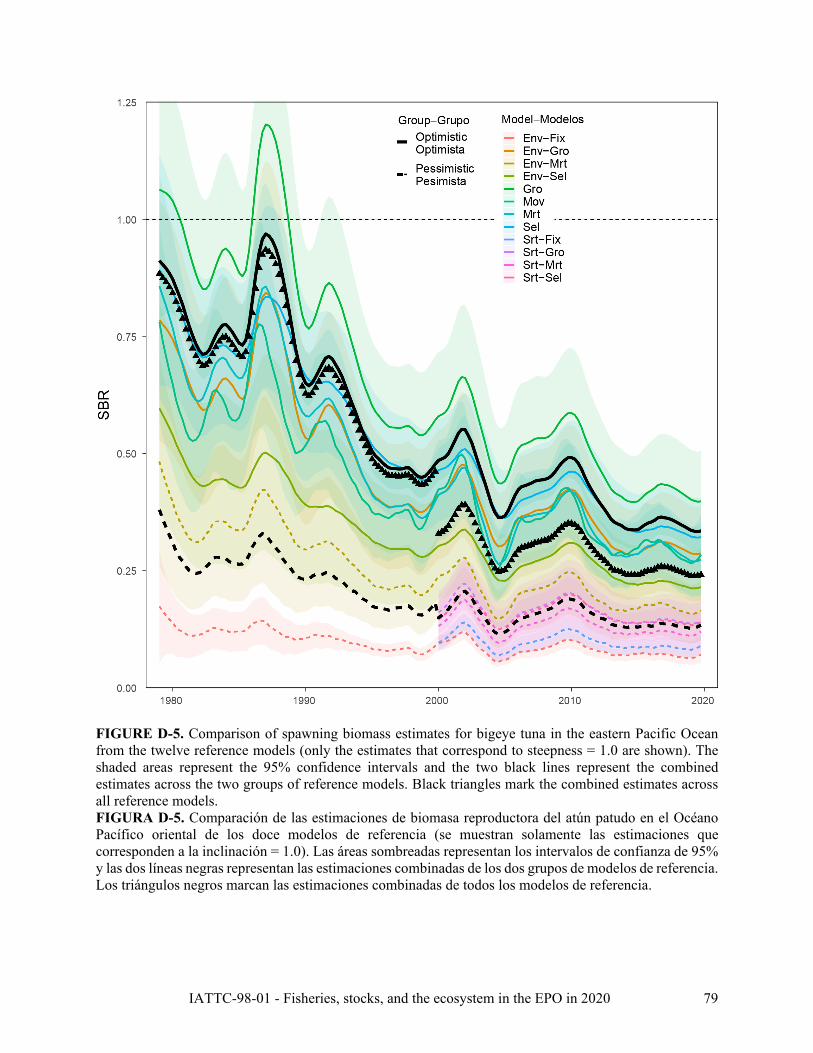
IATTC-98-01 - Fisheries, stocks, and the ecosystem in the EPO in 2020 79
FIGURE D-5. Comparison of spawning biomass estimates for bigeye tuna in the eastern Pacific Ocean from the twelve reference models (only the estimates that correspond to steepness = 1.0 are shown). The shaded areas represent the 95% confidence intervals and the two black lines represent the combined estimates across the two groups of reference models. Black triangles mark the combined estimates across all reference models. FIGURA D-5. Comparación de las estimaciones de biomasa reproductora del atún patudo en el Océano Pacífico oriental de los doce modelos de referencia (se muestran solamente las estimaciones que corresponden a la inclinación = 1.0). Las áreas sombreadas representan los intervalos de confianza de 95% y las dos líneas negras representan las estimaciones combinadas de los dos grupos de modelos de referencia. Los triángulos negros marcan las estimaciones combinadas de todos los modelos de referencia.

IATTC-98-01 - Fisheries, stocks, and the ecosystem in the EPO in 2020 80
FIGURE D-6. Comparison of average annual fishing mortality, by age groups, of bigeye tuna in the eastern Pacific Ocean (only the estimates that correspond to steepness = 1.0 are shown). The black dots show the combined values across all models with a steepness of 1.0. FIGURA D-6. Comparación de la mortalidad por pesca anual promedio, por grupos de edad, del atún patudo en el Océano Pacífico oriental (se muestran solamente las estimaciones que corresponden a la inclinación = 1.0). Los puntos negros muestran los valores combinados de todos los modelos con una inclinación de 1.0.
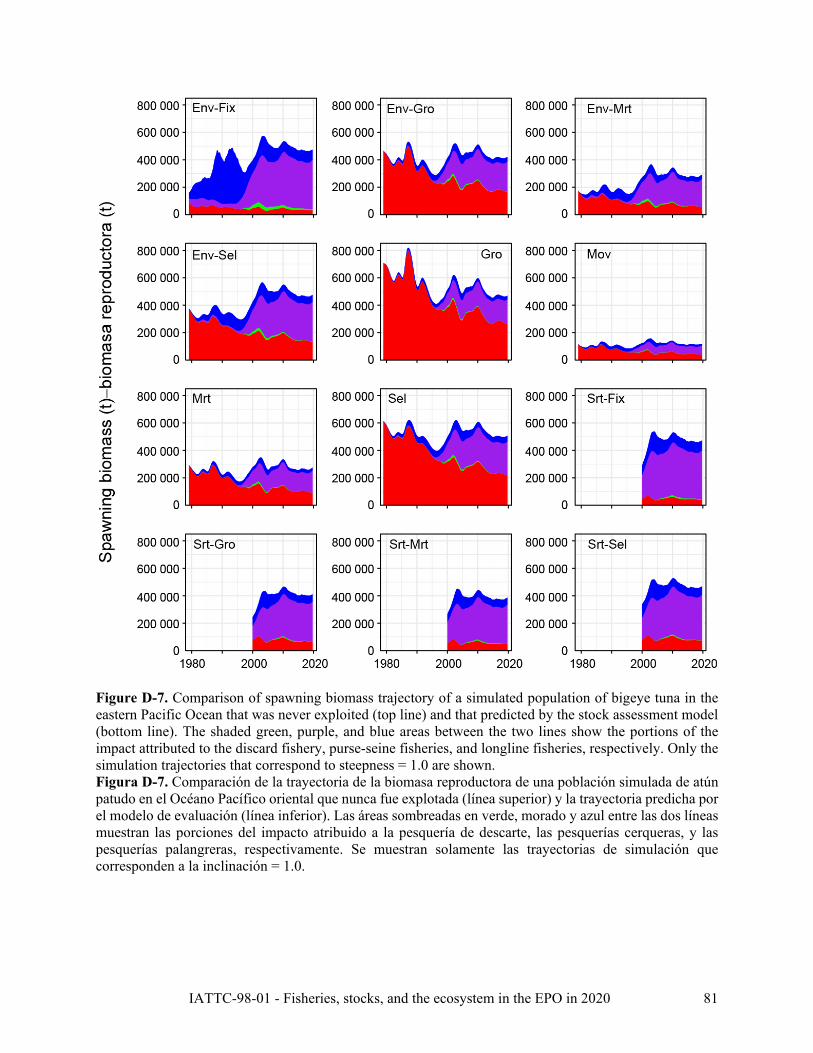
IATTC-98-01 - Fisheries, stocks, and the ecosystem in the EPO in 2020 81
Figure D-7. Comparison of spawning biomass trajectory of a simulated population of bigeye tuna in the eastern Pacific Ocean that was never exploited (top line) and that predicted by the stock assessment model (bottom line). The shaded green, purple, and blue areas between the two lines show the portions of the impact attributed to the discard fishery, purse-seine fisheries, and longline fisheries, respectively. Only the simulation trajectories that correspond to steepness = 1.0 are shown. Figura D-7. Comparación de la trayectoria de la biomasa reproductora de una población simulada de atún patudo en el Océano Pacífico oriental que nunca fue explotada (línea superior) y la trayectoria predicha por el modelo de evaluación (línea inferior). Las áreas sombreadas en verde, morado y azul entre las dos líneas muestran las porciones del impacto atribuido a la pesquería de descarte, las pesquerías cerqueras, y las pesquerías palangreras, respectivamente. Se muestran solamente las trayectorias de simulación que corresponden a la inclinación = 1.0.
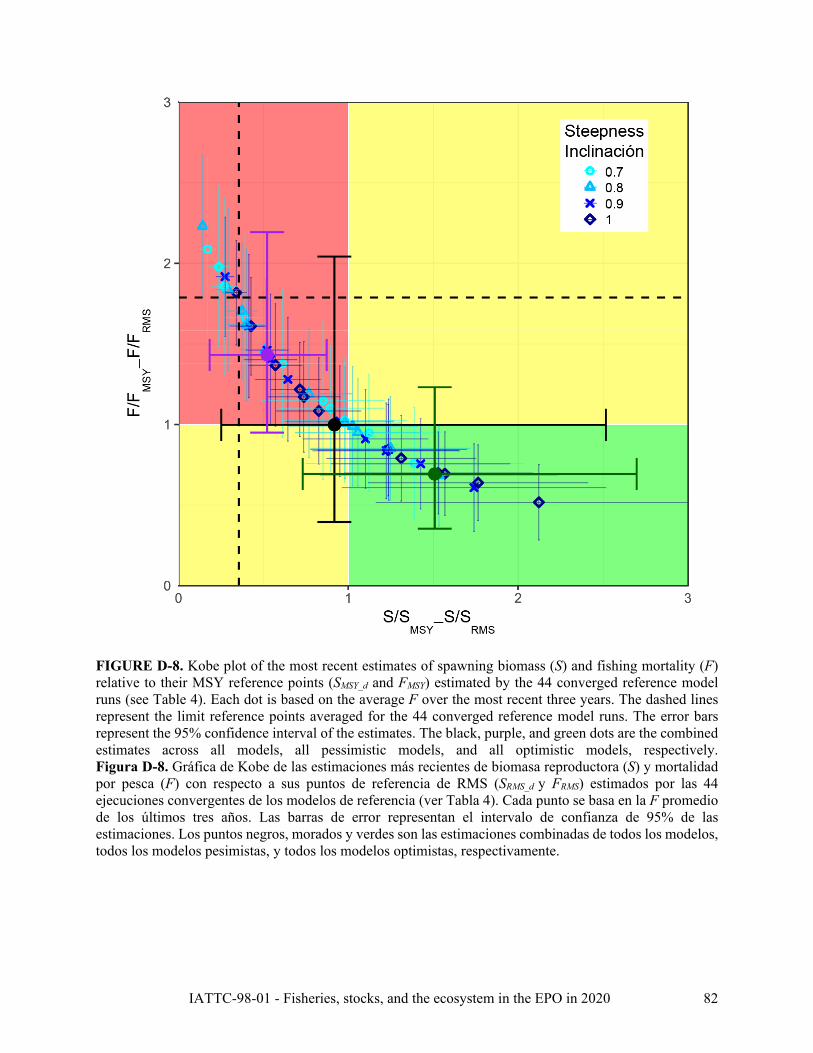
IATTC-98-01 - Fisheries, stocks, and the ecosystem in the EPO in 2020 82
FIGURE D-8. Kobe plot of the most recent estimates of spawning biomass (S) and fishing mortality (F) relative to their MSY reference points (SMSY_d and FMSY) estimated by the 44 converged reference model runs (see Table 4). Each dot is based on the average F over the most recent three years. The dashed lines represent the limit reference points averaged for the 44 converged reference model runs. The error bars represent the 95% confidence interval of the estimates. The black, purple, and green dots are the combined estimates across all models, all pessimistic models, and all optimistic models, respectively. Figura D-8. Gráfica de Kobe de las estimaciones más recientes de biomasa reproductora (S) y mortalidad por pesca (F) con respecto a sus puntos de referencia de RMS (SRMS_d y FRMS) estimados por las 44 ejecuciones convergentes de los modelos de referencia (ver Tabla 4). Cada punto se basa en la F promedio de los últimos tres años. Las barras de error representan el intervalo de confianza de 95% de las estimaciones. Los puntos negros, morados y verdes son las estimaciones combinadas de todos los modelos, todos los modelos pesimistas, y todos los modelos optimistas, respectivamente.

IATTC-98-01 - Fisheries, stocks, and the ecosystem in the EPO in 2020 83
FIGURE D-9. Risk curves showing the probability of exceeding the target (blue) and limit (red) reference points for different durations of the temporal closure. FIGURA D-9. Curvas de riesgo que señalan la probabilidad de rebasar los puntos de referencia objetivo (azul) y límite (rojo) para diferentes duraciones de la veda temporal.

IATTC-98-01 - Fisheries, stocks, and the ecosystem in the EPO in 2020 84
FIGURE D-10. Combined bigeye probability density function for Fcur/FMSY, Fcur/FLIMIT, Scur/SMSY, and Scur/SLIMIT. FIGURA D-10. Función de densidad de probabilidad combinada para Fact/FRMS, Fact/FLÍMITE, Sact/SRMS, y Sact/SLÍMITE de patudo.

IATTC-98-01 - Fisheries, stocks, and the ecosystem in the EPO in 2020 85
Figure D-11. Risk curves showing the probability of exceeding the target (top) and limit (bottom) reference points for bigeye with different durations of the temporal closure, combined by pessimistic and optimistic models resulting from the bimodal combined distribution. Figura D-11. Curvas de riesgo que señalan la probabilidad de rebasar los puntos de referencia objetivo (arriba) y límite (abajo) con diferentes duraciones de la veda temporal, combinados por modelos pesimistas y optimistas que resultan de la distribución combinada bimodal.
IATTC-98-01 - Fisheries, stocks, and the ecosystem in the EPO in 2020 86
E. PACIFIC BLUEFIN TUNA
Tagging studies have shown that there is exchange of Pacific bluefin between the eastern and western Pacific Ocean. Larval, post larval, and early juvenile bluefin have been caught in the western Pacific Ocean (WPO), but not in the eastern Pacific Ocean (EPO), so it is likely that there is a single stock of bluefin in the Pacific Ocean (or possibly two stocks in the Pacific Ocean, one spawning in the vicinity of Taiwan and the Philippines and the other spawning in the Sea of Japan).
Most of the commercial catches of bluefin in the EPO are taken by purse seiners. Nearly all of the purse-seine catches have been made west of Baja California and California, within about 100 nautical miles of the coast, between about 23°N and 35°N. Ninety percent of the catch is estimated to have been between about 60 and 100 cm in length, representing mostly fish 1 to 3 years of age. Aquaculture facilities for bluefin were established in Mexico in 1999, and some Mexican purse seiners began to direct their effort toward bluefin during that year. During recent years, most of the catches have been transported to holding pens, where the fish are held for fattening and later sale to sashimi markets. Lesser amounts of bluefin are caught by recreational, gillnet, and longline gear. Bluefin have been caught in the EPO during every month of the year, but most of the fish are taken from May through October.
Bluefin are exploited by various gears in the WPO from Taiwan to Hokkaido, Japan. Age-0 fish, about 15 to 30 cm in length, are caught by the Japanese troll fishery during July-October south of Shikoku Island and south of Shizuoka Prefecture. During November-April, age-0 fish about 35 to 60 cm in length are taken in troll fisheries south and west of Kyushu Island. Age-1 and older fish are caught by purse seining, mostly during May-September, between about 30°-42°N and 140°-152°E. Bluefin of various sizes are also caught by traps, gillnets, and other gear, especially in the Sea of Japan. Additionally, small amounts of bluefin are caught near the southeastern coast of Japan by longlining. The Chinese Taipei small-scale longline fishery, which has expanded since 1996, takes bluefin tuna more than 180 cm in length from late April to June, when they are aggregated for spawning in the waters east of the northern Philippines and Taiwan.
The high-seas longline fisheries are directed mainly at tropical tunas, albacore, and billfishes, but small amounts of Pacific bluefin are caught by these fisheries. Small amounts of bluefin are also caught by Japanese pole-and-line vessels on the high seas.
Tagging studies, conducted with conventional and archival tags, have revealed a great deal of information about the life history of bluefin. Some fish apparently remain their entire lives in the WPO, while others migrate to the EPO. These migrations begin mostly during the first and second years of life. The first- and second-year migrants are exposed to various fisheries before beginning their journey to the EPO. Then, after crossing the ocean, they are exposed to commercial and recreational fisheries off California and Baja California. Eventually, the survivors return to the WPO.
Bluefin more than about 50 cm in length are most often found in waters where the sea-surface temperatures (SSTs) are between 17° and 23°C. Fish 15 to 31 cm in length are found in the WPO in waters where the SSTs are between 24° and 29°C. The survival of larval and early juvenile bluefin is undoubtedly strongly influenced by the environment. Conditions in the WPO probably influence recruitment, and thus the portions of the juvenile fish there that migrate to the EPO, as well as the timing of these migrations. Likewise, conditions in the EPO probably influence the timing of the return of the juvenile fish to the WPO.
The total catches of bluefin have fluctuated considerably during the last 50 years (Figure E-1). The consecutive years of above-average catches (mid-1950s to mid-1960s) and below-average catches (early 1980s to early 1990s) could be due to consecutive years of above-average and below-average recruitments. The estimated impact of the fisheries on the bluefin population for the entire time period modeled (1952-2018) is substantial (Figure E-2). The WPO fisheries have had a greater impact than the EPO fisheries, and their impact increased starting in 1980s only leveling off in 2000s.
An update stock assessment was carried out by the Pacific Bluefin Working Group of the International Scientific Committee for Tuna and Tuna-like Species in the North Pacific Ocean (ISC) in 2020. The
IATTC-98-01 - Fisheries, stocks, and the ecosystem in the EPO in 2020 87
assessment was conducted with Stock Synthesis 3, an integrated statistical age-structured stock assessment model. The base-case model results show that: (1) spawning stock biomass (SSB) fluctuated throughout the assessment period (fishing years 1952-2018); (2) the SSB steadily declined from 1996 to 2010; (3) the slow increase of the stock biomass continues since 2011; (4) total biomass in 2018 exceeded the historical median with an increase in immature fish; and (5) fishing mortality (F%SPR) declined from a level producing about 1% of SPR in 2004-2009 to a level producing 14% of SPR in 2016-2018. Historical recruitment estimates have fluctuated since 1952 without an apparent trend. Relatively low recruitment levels estimated in 2010-2014 were of concern in the 2016 assessment. The 2015 recruitment estimate is lower than the historical average while the 2016 recruitment estimate is higher than the historical average. The recruitment estimates for 2017 and 2018, which are based on fewer observations and more uncertain, are below the historical average. A substantial decrease in estimated F is observed in ages 0-2 in 2016-2018 relative to the previous years. Note that stricter management measures in WCPFC and IATTC have been in place since 2015.
The point estimate of the 2018 SSB was 4.5% of the SSB in the absence of fishing (4.5%SSBF=0), and the recent (2016-2018) fishing mortality (F) corresponds to F14%SPR. Because the harvest strategy contains catch limits, fishing mortality is expected to decline, i.e., Fx%SPR will increase as biomass increases. No biomass-based limit or target reference points have been adopted to evaluate whether Pacific bluefin is overfished. However, the stock is overfished relative to common target reference points and to the IATTC limit reference point used for tropical tunas. Also, no fishing intensity-based limit or target reference points have been adopted to evaluate whether overfishing of Pacific bluefin is occurring, but the stock is subject to overfishing relative to most common fishing intensity-based reference points.
Resolution C-18-02 states that the Commission recognizes that the management objective of the IATTC is to maintain or restore fish stocks at levels capable of producing MSY, and shall implement a provisional rebuilding plan by adopting an 1) initial (first) rebuilding target of SSBmed, 1952-2014 (the median point estimate for 1952-2014) to be achieved by 2024 with at least 60% probability and 2) a second rebuilding target of 20%SSBF=0 to be achieved within 10 years of reaching the initial rebuilding target or by 2034, whichever is earlier, with at least 60% probability. The IATTC has adopted resolutions to restrict the catch of bluefin tuna in the EPO (e.g. C-16-08, C-18-01, and C-20-02). Resolution C-20-02 limit the commercial catches in the IATTC Convention Area by all CPCs to a combined total of 3,925 t during 2021. Resolution C-18-02 also requires that no later than the IATTC meeting in 2020, taking into account the outcomes of the Joint IATTC-WCPFC NC Working Group, the Commission shall consider and develop candidate reference points and harvest control rules. These candidate reference points and harvest control rules will be forwarded to the Joint IATTC-WCPFC NC Working Group and ISC for consideration and potential inclusion in a management strategy evaluation to be completed by the ISC. This task has still not been accomplished. The harvest strategy proposed at the Joint WCPFC NC-IATTC WG meeting guided projections conducted by the ISC to provide catch reduction options if the projection results show that the initial rebuilding target will not be achieved with at least 60% probability by 2024 or to provide relevant information for a potential increase in catch if the probability of achieving the initial rebuilding target exceeds 75% by 2024. The projection based on the base-case model mimicking the current management measures by the WCPFC (CMM 2017-08) and IATTC (C-16-08) under the low recruitment scenario resulted in an estimated 100% probability of achieving the initial rebuilding target by 2024. This estimated probability is above the threshold (75% or above in 2024) prescribed by the harvest strategy. The low recruitment scenario is more precautionary than the recent 10 years recruitment scenario. In the harvest strategy, the recruitment scenario is switched from the low recruitment to the average recruitment scenario beginning in the year after achieving the initial rebuilding target. The estimated probability of achieving the second rebuilding target 10 years after the achievement of the initial rebuilding target or by 2034, whichever is earlier, is 99%. This estimate is above the threshold (60% or above in 2034) prescribed by the harvest strategy.

IATTC-98-01 - Fisheries, stocks, and the ecosystem in the EPO in 2020 88
FIGURE E-1. Retained catches of Pacific bluefin tuna, by gear, 1952-2019. GN: gillnet; LL: longline; LX: hook and line; OTR: other; PS: purse seine. FIGURA E-1. Capturas retenidas de atún aleta azul del Pacífico, por arte, 1952-2019. GN: red agallera; LL: palangre; LX: sedal y anzuelo; OTR: otras; PS: red de cerco.

IATTC-98-01 - Fisheries, stocks, and the ecosystem in the EPO in 2020 89
FIGURE E-2. Estimates of the impact on the Pacific bluefin tuna population of fisheries in the EPO and in the WPO (upper panel). The dashed line represents the estimated hypothetical unfished spawning biomass, and the solid line the estimated actual spawning biomass. The shaded areas indicate the impact attributed to each fishery. The lower panel presents the proportion of impact attributed to the EPO and WPO. (Figure from the draft Executive Summary of ISC 2020 stock assessment; subject to change and approval by the ISC Plenary.) FIGURA E-2. Estimaciones del impacto sobre la población de atún aleta azul del Pacífico de las pesquerías en el OPO y en el WPO (panel superior). La línea de trazos representa la biomasa reproductora no pescada hipotética estimada, y la línea sólida la biomasa reproductora real estimada. Las áreas sombreadas indican el impacto atribuido a cada pesquería. El panel inferior ilustra la proporción del impacto atribuida al OPO y al WPO. (Figura del borrador de resumen ejecutivo de la evaluación de 2020 del ISC; sujeta a cambio y aprobación por la plenaria del ISC.)

IATTC-98-01 - Fisheries, stocks, and the ecosystem in the EPO in 2020 90
F. ALBACORE TUNA
There are two stocks of albacore in the Pacific Ocean, one in the northern hemisphere and the other in the southern hemisphere. Albacore are caught by longline gear in most of the North and South Pacific, but not often between about 10°N and 5°S, by trolling gear in the eastern and central North and South Pacific, and by pole-and-line gear in the western North Pacific. In the North Pacific, about 40% of the catch is taken by pole-and-line and troll fisheries that catch smaller, younger albacore, and about 50% was taken by longline. In the South Pacific, almost all the albacore is taken by longline. The total annual catches of South Pacific albacore ranged from about 25,000 to 50,000 t during the 1980s and 1990s but increased after that and are currently at the highest levels. During 2017-2019, the albacore catches in the south Pacific averaged about 87,000 t (Figure F-1a), of which about 25% was taken in the eastern Pacific Ocean (EPO). The total annual catches of North Pacific albacore peaked in 1976 at about 125,000 t, declined to about 38,000 t in 1991, and then increased to about 122,000 t in 1999 (Figure F-1b). They declined again in the early 2000s, then recovered. Since 2012 catches have declined from about 92,000 to about 57,600 t in 2018, increasing again slightly in 2019 and averaging about 61,000 t in 2017-2019, of which 22% was taken in the EPO. Those declines in catches coincide with decline in effort in the north EPO (Figure F-2)
Juvenile and adult albacore are caught mostly in the Kuroshio Current, the North Pacific Transition Zone, and the California Current in the North Pacific and in the Subtropical Convergence Zone in the South Pacific, but spawning occurs in tropical and subtropical waters, centering around 20oN and 20oS latitudes. North Pacific albacore are believed to spawn between March and July in the western and central Pacific.
The movements of North Pacific albacore are strongly influenced by oceanic conditions, and migrating albacore tend to concentrate along oceanic fronts in the North Pacific Transition Zone. Most of the catches are made in water temperatures between about 15o and 19.5oC. Details of the migration remain unclear, but juvenile fish (2- to 5-year-olds) are believed to move into the eastern Pacific Ocean (EPO) in the spring and early summer, and return to the western and central Pacific, perhaps annually, in the late fall and winter, where they tend to remain as they mature. This pattern may be complicated by sex-related movements of large adult fish (fork length (FL) >125 cm), which are predominately male, to areas south of 20°N. The significance of such movements for the demographic dynamics of this stock are uncertain at present.
Less is known about the movements of albacore in the South Pacific Ocean. The juveniles move southward from the tropics when they are about 35 cm long, and then eastward along the Subtropical Convergence Zone to about 130°W. When the fish approach maturity they return to tropical waters, where they spawn. Recoveries of tagged fish released in areas east of 155°W were usually made at locations to the east and north of the release site, whereas those of fish released west of 155°W were usually made at locations to the west and north of the release site.
The most recent published stock assessments for the South and North Pacific stocks of albacore are from 2018 and 2020, respectively. The assessments indicate that it is not likely that either stock is overfished or that overfishing is taking place.
South Pacific albacore
The assessment of South Pacific albacore carried out in 2018 by scientists of the Secretariat of the Pacific Community, using MULTIFAN-CL, covered the 1960-2016 period, and incorporated catch-and-effort, length-frequency, and tagging data, and information on biological parameters. As in the 2015 assessment, the eastern boundary is at 130°W, so not all the catches from the EPO are included. A summary of the conclusions can be found here. The changes from the previous assessment include simplifying the regional structure (from eight to five regions), the inclusion of abundance indices based on standardized operational-level longline data (including Japan) using indices of abundance derived from CPUE standardized using spatiotemporal models and updated maturity at length. Results were reported for a diagnostic case and for an uncertainty grid, which considers key sensitivities. Contradictory signals about stock status were found: a strong signal in the size data that fishing has no impact, and a strong signal in the CPUE data that
IATTC-98-01 - Fisheries, stocks, and the ecosystem in the EPO in 2020 91
abundance is declining. The results in the uncertainty grid were highly variable, but no model suggested overfishing or an overfished state, according to the WCPFC limit reference point of 20% of the spawning stock biomass (SSB) in the absence of fishing (20%SSBF=0). Fishing mortality (F) generally increased up to about 2012, but has declined sharply in recent years, and is below the MSY level (F2012-2015/FMSY ranged from 0.06 to 0.53). The SSB has declined over time, but increased slightly recently, and in 2016 was above the MSY level (base case SSB2016 /SSBMSY ranged from 1.45 to 10.74). It is important to note that SSBMSY is lower than the WCPFC limit reference point (SSBMSY/SSBF=0 ranges from 0.06 to 0.22). Notwithstanding these results, the assessment recommended that the WCPFC consider reducing longline fishing mortality and longline catches to avoid a decline in the vulnerable biomass and maintain economically viable catch rates. Since the end of 2020, the IATTC staff is working in collaboration with the SPC in the new assessment of south Pacific albacore that is expected to be completed in 2022 (SAC-11-01a).
North Pacific albacore
A new stock assessment was completed in 2020 by the Albacore Working Group (ALBWG) of the International Scientific Committee for Tuna and Tuna-like Species in the North Pacific Ocean (ISC) (ISC/20/Annex/12, SAC-11-INF-I). The north Pacific albacore tuna stock has been exploited for a long time, the catches were the highest in 1976 (about 127,000 t) and the lowest in 1991 (about 37,000 t). During the assessment period (1994-2018), the highest catches were in 1999 (about 119,000 t) and the lowest in 2018 (about 57,600 t). About 2/3 of the catches come from surface fisheries (troll and pole-and-line) that harvest mainly juveniles, and the rest from longline fisheries. On average, about 20% of the catches are taken within the area of application of the Antigua Convention.
The assessment was done using the “best model” approach. The working group concluded that the stock was not experiencing overfishing and was probably not overfished (Figure F-2, Table F-1). The current depletion is 0.46 (SSB2018/SSB_d , where SSB_d is the dynamic spawning stock biomass without fishing for 2018). The ratio of SSB2018/SMSY = 3.01). The relative current fishing mortality is F2015-2017/F50%= 1 , F2015-
2017/F20% =0.62, F2015-2017/FMSY =0.60 (Table 1). Ten years projections with either constant catch (average of 2013-2017, 69,000 t) or constant fishing mortality (at the F2015-2017 level) predicted an increase in the female spawning biomass.
The current IATTC conservation and management measures for north Pacific albacore (Resolutions C-05-02, C-13-03 and C-18-03) are based on maintaining the fishing effort below the 2002-2004 levels. The effort levels in eastern Pacific Ocean for 2018-2020 are 63% and 65% of those in 2002-2004, for vessel-days and number of vessels respectively, and are showing a declining trend in the last 10 years (Figure F-2).
The Working Group finished a Management Strategy Evaluation (MSE) for the North Pacific albacore stock and presented the results to the stakeholders in regional workshops. The first round of the MSE was concluded and reported during the 4th ISC ALB MSE workshop in March 2019 (ISC/19/ANNEX/06). Several operating models were developed, and equal weights were assumed for all alternative operating models when evaluating the harvest control rules, HCRs. Additional work was conducted in a second round of the MSE, when mixed control rules were tested (under mixed control, longline fleets are subject to a total allowable catch, TAC, whereas surface fleets are managed with a total allowable effort, TAE) and the effect of a “ghost fleet” (a fleet with undeclared catch) was evaluated. The results of the MSE were included in a recorded presentation for the SAC-12 meeting (SAC-12 INF-C, SAC-12-INF-C presentation) and were presented at the 2021 ISC plenary (ISC).
The following management objectives for the North Pacific albacore tuna were developed in the context of the MSE process and were adopted by the IATTC in 2020 (IATTC-95).
Overarching objective: maintain the viability and sustainability of the current NPALB stock and fisheries.
1. Maintain spawning biomass above the limit reference point
2. Maintain total biomass, with reasonable variability, around the historical average depletion of total biomass

IATTC-98-01 - Fisheries, stocks, and the ecosystem in the EPO in 2020 92
3. Maintain harvest ratios by fishery (fraction of fishing impact with respect to SSB) at historical average
4. Maintain catches by fishery above average historical catch
5. If a change in total allowable effort and/or total allowable catch occurs, the rate of change should be relatively gradual
6. Maintain F at the target value with reasonable variability
The main results of the MSE can be summarized in four main points:
1) Under both TAC and mixed control, all harvest control rules (HCRs) were able to maintain the stock above the WCPFC’s limit reference point (20% SSB0_d), the IATTC limit reference point used for tropical tunas (7.7%SSB0), and the limit reference point (LRP) specified by each HCR with high probability (>0.8), when simulation outcomes across all reference scenarios where considered.
2) Under mixed control, there was a tradeoff between the odds of biomass being above the 20%SSB0_d LRP and catch metrics. Mixed control maintained higher and less variable stock biomass than TAC control as the catches of surface fleets under effort control responded quickly to changes in biomass and their catch levels were not impacted by assessment errors in biomass estimate. The odds of SSB being above the 20%SSB0_d LRP or the equilibrium 7.7%SSB0 LRP, and of relative biomass being above minimum historical were higher for F50 rules, but this came at the cost of a decrease in the odds of annual, medium term, or long term catch being above historical catches.
3) Under TAC control, median catch is higher for F40 HCRs, but also more variable, than F50 HCRs. The tradeoff between average catch and catch variability leads to the odds of catch being above historical being comparable between F50 and F40 HCRs.
4) HCRs with the LRP and SSB threshold reference points closer to the SSB associated with Ftarget resulted in a higher frequency of management interventions.
In addition, the results of adding a ghost fleet showed that all HCRs succeeded in maintaining the stock at healthy levels, but the catches of the other fleets decreased to compensate for the increase in fishing mortality.
Given the relative stability in the biomass and fishing mortality in recent years, the adoption of the management objectives by the IATTC, the fact that most of the catches of the north Pacific albacore stock are taken in the Western and Central Pacific Ocean and in view of the final results of the MSE, the staff recommends that the commission adopts a HCR in coordination with the Western and Central Pacific Fisheries Commission taking into account the performance of the tested HCRs.
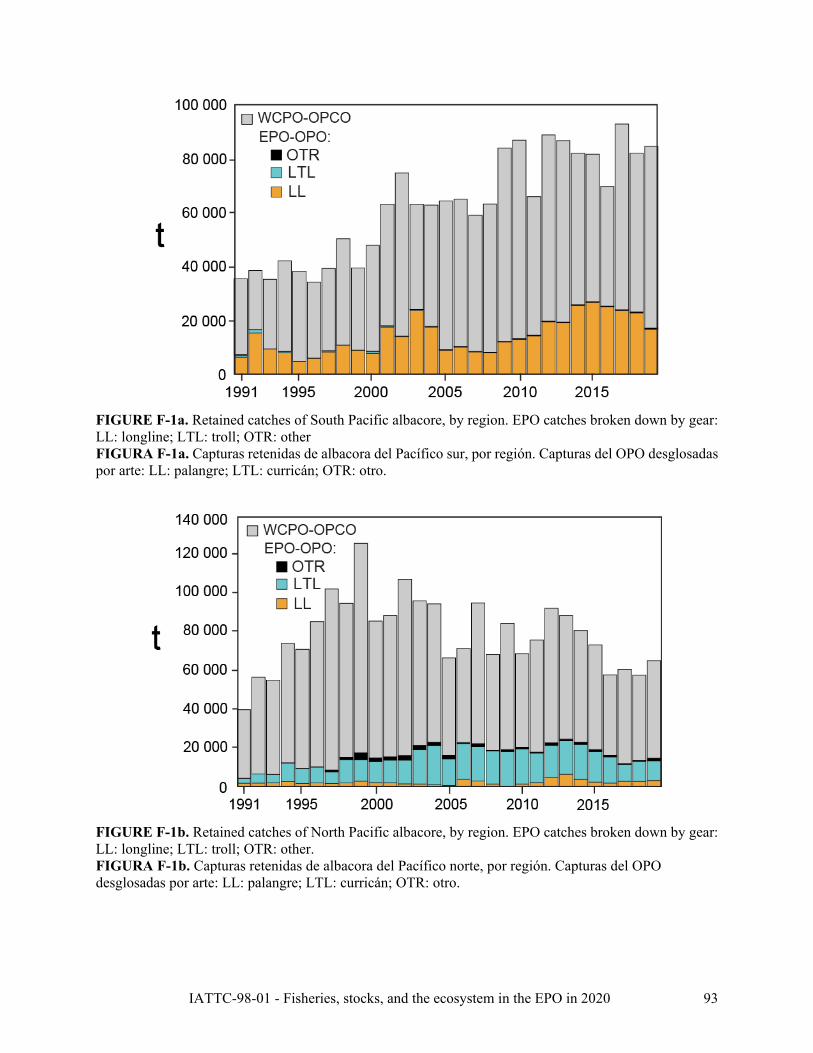
IATTC-98-01 - Fisheries, stocks, and the ecosystem in the EPO in 2020 93
FIGURE F-1a. Retained catches of South Pacific albacore, by region. EPO catches broken down by gear: LL: longline; LTL: troll; OTR: other FIGURA F-1a. Capturas retenidas de albacora del Pacífico sur, por región. Capturas del OPO desglosadas por arte: LL: palangre; LTL: curricán; OTR: otro.
FIGURE F-1b. Retained catches of North Pacific albacore, by region. EPO catches broken down by gear: LL: longline; LTL: troll; OTR: other. FIGURA F-1b. Capturas retenidas de albacora del Pacífico norte, por región. Capturas del OPO desglosadas por arte: LL: palangre; LTL: curricán; OTR: otro.

IATTC-98-01 - Fisheries, stocks, and the ecosystem in the EPO in 2020 94
Figure F-2. Effort in vessel-days and number of vessels for the North Pacific albacore tuna in the eastern Pacific Ocean. Figura F-2. Esfuerzo en días de buque y número de buques para el atún albacora del Pacífico norte en el Océano Pacífico oriental.

IATTC-98-01 - Fisheries, stocks, and the ecosystem in the EPO in 2020 95
Figure F-3. Kobe plot showing the status of the north Pacific albacore (Thunnus alalunga) stock relative to the 20% of the dynamic spawning biomass with no fishing and corresponding fishing intensity (F20%), with 95% confidence intervals: (A) Base-case trajectory (start year, 1994, is a triangle and terminal year, 2018, is a circle). (B) Final year for base-case model (black), sensitivity model with different growth assumptions (blue), update of the 2017 model to 2020 data (red) (SAC-11-INF-I). Figura F-3. Gráfica de Kobe que muestra la condición de la población de atún albacora del Pacífico norte (Thunnus alalunga) con respecto al 20% de la biomasa reproductora dinámica sin pesca y la intensidad de pesca correspondiente (F20%), con intervalos de confianza de 95%: (A) Trayectoria del caso base (el año de inicio, 1994, es un triángulo y el año terminal, 2018, es un círculo). (B) Año final para el modelo de caso base (negro), modelo de sensibilidad con diferentes supuestos de crecimiento (azul), actualización del modelo de 2017 a los datos de 2020 (rojo) (SAC-11-INF-I).

IATTC-98-01 - Fisheries, stocks, and the ecosystem in the EPO in 2020 96
Table F-1. Estimates of maximum sustainable yield (MSY), female spawning biomass (SSB), and fishing intensity (F) based reference point ratios for north Pacific albacore tuna for: 1) the base case model; 2) sensitivity model with different growth assumptions; and 3) update of the 2017 model to 2020 data. 20%SSB0_d is 20% of the dynamic female spawning biomass with no fishing. Tabla F-1. Estimaciones del rendimiento máximo sostenible (RMS), la biomasa reproductora de las hembras (SSB) y la intensidad de pesca (F) basadas en los cocientes de puntos de referencia para el atún albacora del Pacífico norte para: 1) el modelo de caso base; 2) el modelo de sensibilidad con diferentes supuestos de crecimiento; y 3) la actualización del modelo de 2017 a los datos de 2020. 20%SSB0_d es el 20% de la biomasa reproductora dinámica sin pesca.
MSY (t) A 102,236 84,385 113,522 SSBMSY (t)
B 19,535 16,404 21,431 SSB0 (t)
B 136,833 113,331 152,301
SSB2018 (t) B 58,858 34,872 77,077 SSB2018/20%SSB0_d B 2.30 1.63 2.63 F2015-2017 0.50 0.64 0.43 F2015-2017/FMSY 0.60 0.77 0.52 F2015-2017/F0.1 0.57 0.75 0.49 F2015-2017/F10% 0.55 0.71 0.48 F2015-2017/F20% 0.62 0.80 0.54 F2015-2017/F30% 0.71 0.91 0.62 F2015-2017/F40% 0.83 1.06 0.72 F2015-2017/F50% 1.00 1.27 0.86
A – MSY includes male and female juvenile and adult fish B – Spawning stock biomass (SSB) refers to mature female biomass only.
Source: SAC-11-INF-I

IATTC-98-01 - Fisheries, stocks, and the ecosystem in the EPO in 2020 97
G. SWORDFISH
Swordfish (Xiphias gladius) occur throughout the Pacific Ocean (PO) between about 50°N and 50°S. In the Eastern Pacific Ocean (EPO), they are caught mostly by the longline fishery—about 80% of the catch in weight on average in recent years —by distant water fleets of Far East and Western Hemisphere nations. Lesser amounts are taken by drifting gillnets (~20%), mainly in South America, and minimal amounts by other gillnets and harpoon. They are seldom caught in the recreational fishery in the EPO.
Swordfish grow in length very rapidly, with both males and the faster-growing females reaching lower-jaw-fork lengths of more than a meter during their first year. Swordfish begin reaching maturity at about two years of age, when they are about 150 to 170 cm in length, and by age four all are mature. They probably spawn more than once per season. For fish greater than 170 cm in length, the proportion of females increases with increasing length.
Swordfish tend to inhabit waters further below the surface during the day than at night, and they tend to inhabit current frontal zones. Several of these fronts occur in the eastern Pacific Ocean (EPO), including areas off California and Baja California, off Ecuador, Peru, and Chile, and in the equatorial Pacific. Swordfish tolerate temperatures of about 5° to 27°C, but their preferred range is about 18° to 22°C, while larvae have been found only at temperatures exceeding 24°C.
There is strong evidence that swordfish in the Pacific comprise multiple stocks. Several specific spawning regions are known, and analyses of fisheries, tagging and genetic data suggest that there is only limited exchange of swordfish between geographical areas, including between the eastern and western, and the northern and southern, Pacific Ocean. As many as six stocks may exist in the Pacific Ocean, but the exact boundaries of these stocks, as well as their exchange rates—for the purposes of stock assessment—is currently uncertain. In the early 2000’s, the IATTC produced indicators for swordfish in five areas of the EPO: two areas north of 10°N, separated at 125°W, a central area between 10°N and 5°S, and two areas south of 5°S, separated at 90°W.
In 2020, the IATTC staff hosted the 1st Technical Workshop on Swordfish in the South EPO (SWO-01)—in a virtual format—in preparation for the 2021 IATTC stock assessment. The latest information on stock structure was reviewed, and a plan for exploring the stock structure uncertainty was established. The area north of 5°S and south of 10°N will be explored in the South EPO assessment, which includes the area south of 5°S that defined the stock boundary in the previous assessment (SAC-02-09). The IATTC staff proposed to the ISC Billfish working group that the area north of 10°N be included in the next North Pacific swordfish assessment (ISC/21/BILLWG-01), in light of recent tagging information presented during SWO-01 on the movement of swordfish across the current assumed stock boundary for the North Pacific swordfish stock—a diagonal line from the tropics in the Central Pacific to the Northern coast of Mexico, stock area 1 in Figure S1 of ISC/18/ANNEX/16). The ISC Billfish working group accepted the proposal and plans to assess the North Pacific stock in 2022. The IATTC staff plans to host additional workshops during 2021 to conclude the South EPO assessment in collaboration with the main CPCs.
A sex-specific age-structured stock assessment of swordfish in the Pacific Ocean north of the equator (from 2007) indicated that, at the level of fishing effort in 2002, there was negligible risk of the spawning biomass decreasing to less than 40% of its unfished level. In a partially overlapping region, the results of a North Pacific swordfish stock assessment completed in 2019 using data through 2016 (ISC/18/ANNEX/16) indicated that stock biomass was 87% above SSBMSY and fishing mortality was 45% below FMSY, indicating that the stock is not overfished and overfishing is not occurring at current levels of fishing effort.
For the South PO, three assessments are noteworthy, with partially overlapping boundaries. In 2017, the Secretariat of the Pacific Community (SPC) undertook an assessment of the southern hemisphere swordfish stock. The assumed stock included the entire western and central Pacific Ocean and, in the EPO, extended southward from 4°S and eastward to 130°W (SC13-SA-WP-13), which is the overlapping area between the IATTC and the WCPFC jurisdictions. Considerable catch of swordfish east of 130°W, was not part of that assessment. In 2010, an exploratory stock assessment of swordfish for the Chilean EEZ was undertaken which

IATTC-98-01 - Fisheries, stocks, and the ecosystem in the EPO in 2020 98
integrated partial information from distant water fleets (IFOP 2010). In 2011, the IATTC performed a south EPO assessment of the area south of 5°S (SAC-02-09), which is the most recent assessment done by the IATTC in the south EPO. The key results from that assessment—conducted using Stock Synthesis—were that (1) the swordfish stock in the South EPO was not experiencing overfishing and was not overfished; and (2) the spawning biomass ratio was about 1.45, indicating that the spawning biomass was about 50% above the virgin spawning biomass, and substantially above the level expected to produce catch at the MSY level. There was no indication of a significant impact of fishing on this stock. The results of the assessment did suggest an expansion of the fishery to components of the stock that were previously not, or only lightly, exploited.
The total annual longline fishing effort for the main longline fleets in the north EPO increased from about 25 million hooks in 2007 to about 49 million hooks in 2013 and is about 43 million hooks in 2015-2019 (Figure G-1). The last five-year average remains significantly below the 2001–2003 average of 83 million hooks. Based on the latest stock assessment for part of the north EPO, and the long period of relatively stable catches that have average 3,494 mt over the past 10 years (Figure G-2), swordfish are probably not overfished, and overfishing is most likely not occurring in the North EPO.
The total annual longline fishing effort for the main longline fleets in the south EPO in the last 30 years was the highest in 1991 (263 million hooks), declined steadily to about half that in 2000, increasing again to an average of 300 million hooks in 2001–2003, decreasing to about 88 million hooks in 2008. In the past 5 years, the total effort has been relatively stable, averaging 1440 million hooks (2015–2019) (Figure G-3). In the South EPO, catches have been steadily increasing since about 2005, reaching a peak catch of 29,036 mt in 2016, after which catches declined to 23,002 mt in 2019. Nonetheless, the average annual catch over the past 5 years (during 2015–2019) was 25,782 mt, which is in the vicinity of the estimated MSY (~25,000 t) for the area south of 5°S (Figure G-4).

IATTC-98-01 - Fisheries, stocks, and the ecosystem in the EPO in 2020 99
FIGURE G-1. Longline fishing effort (in millions of hooks) in the North EPO for the main longline fleets (Table A-9). FIGURA G-1. Esfuerzo de pesca de palangre (en millones de anzuelos) en el OPO Norte para las principales flotas palangreras (Tabla A-9).
FIGURE G-2. Retained catches of swordfish in the North EPO. FIGURA G-2. Capturas retenidas de pez espada en el OPO Norte.

IATTC-98-01 - Fisheries, stocks, and the ecosystem in the EPO in 2020 100
FIGURE G-3. Longline fishing effort (in millions of hooks) in the South EPO for the main longline fleets (Table A-9). FIGURA G-3. Esfuerzo de pesca de palangre (en millones de anzuelos) en el OPO Sur para las principales flotas palangreras (Tabla A-9).
FIGURE G-4. Retained catches of swordfish in the South EPO. FIGURA G-4. Capturas retenidas de pez espada en el OPO Sur.
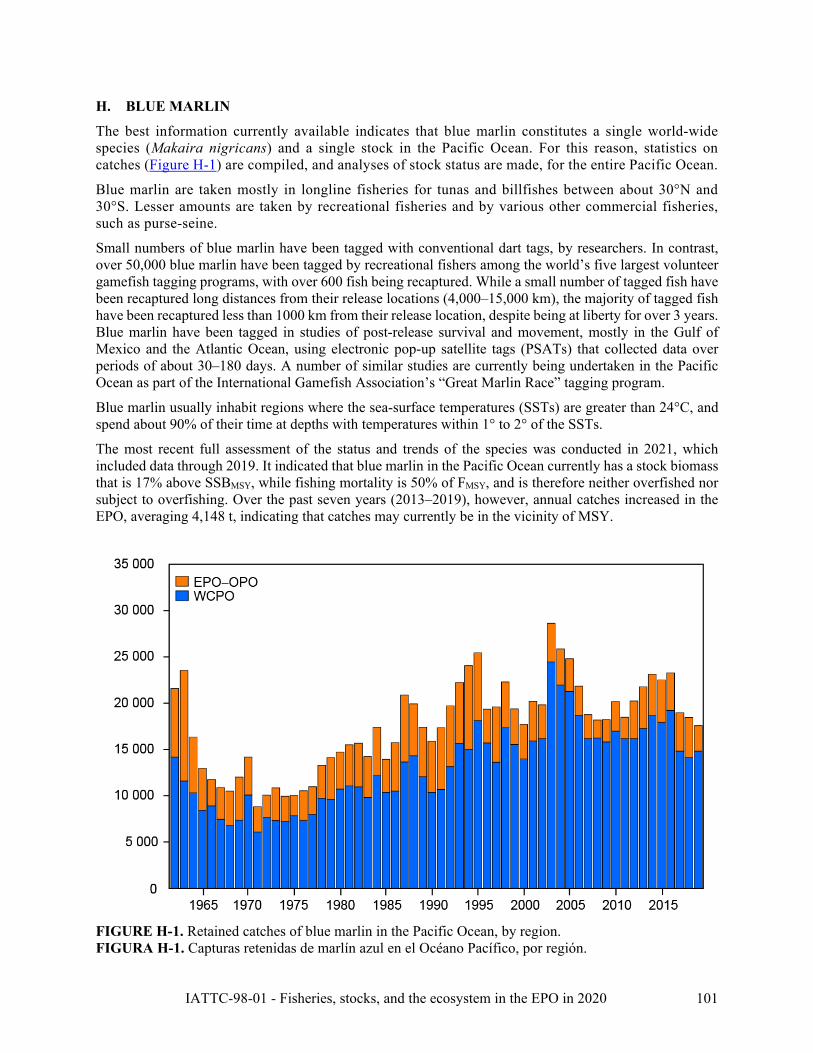
IATTC-98-01 - Fisheries, stocks, and the ecosystem in the EPO in 2020 101
H. BLUE MARLIN
The best information currently available indicates that blue marlin constitutes a single world-wide species (Makaira nigricans) and a single stock in the Pacific Ocean. For this reason, statistics on catches (Figure H-1) are compiled, and analyses of stock status are made, for the entire Pacific Ocean.
Blue marlin are taken mostly in longline fisheries for tunas and billfishes between about 30°N and 30°S. Lesser amounts are taken by recreational fisheries and by various other commercial fisheries, such as purse-seine.
Small numbers of blue marlin have been tagged with conventional dart tags, by researchers. In contrast, over 50,000 blue marlin have been tagged by recreational fishers among the world’s five largest volunteer gamefish tagging programs, with over 600 fish being recaptured. While a small number of tagged fish have been recaptured long distances from their release locations (4,000–15,000 km), the majority of tagged fish have been recaptured less than 1000 km from their release location, despite being at liberty for over 3 years. Blue marlin have been tagged in studies of post-release survival and movement, mostly in the Gulf of Mexico and the Atlantic Ocean, using electronic pop-up satellite tags (PSATs) that collected data over periods of about 30–180 days. A number of similar studies are currently being undertaken in the Pacific Ocean as part of the International Gamefish Association’s “Great Marlin Race” tagging program.
Blue marlin usually inhabit regions where the sea-surface temperatures (SSTs) are greater than 24°C, and spend about 90% of their time at depths with temperatures within 1° to 2° of the SSTs.
The most recent full assessment of the status and trends of the species was conducted in 2021, which included data through 2019. It indicated that blue marlin in the Pacific Ocean currently has a stock biomass that is 17% above SSBMSY, while fishing mortality is 50% of FMSY, and is therefore neither overfished nor subject to overfishing. Over the past seven years (2013–2019), however, annual catches increased in the EPO, averaging 4,148 t, indicating that catches may currently be in the vicinity of MSY.
FIGURE H-1. Retained catches of blue marlin in the Pacific Ocean, by region. FIGURA H-1. Capturas retenidas de marlín azul en el Océano Pacífico, por región.

IATTC-98-01 - Fisheries, stocks, and the ecosystem in the EPO in 2020 102
I. STRIPED MARLIN
Striped marlin (Kajikia audax) occur throughout the Pacific Ocean between about 45°N and 45°S. The assessment on which this report is based is for the stock of striped marlin in the eastern Pacific Ocean (EPO) north of 10°S, east of about 145°W north of the equator, and east of about 165°W south of the equator. Although not included in the assessment model, there may be limited exchange of fish between this stock and stocks in adjacent regions.
Significant effort has been devoted to understanding the stock structure of striped marlin in the Pacific Ocean, which is moderately well known. It is clear that there are a number of stocks. Information on movement from research studies deploying conventional dart tags is limited, although over 40,000 striped marlin have been tagged by various volunteer recreational fisher tagging programs. Although reported recapture rates are below 1%, recapture data show that striped marlin are capable of moving long distances (5,000–6,000 km), however, most recaptures have occurred reasonably close to the release location. In the EPO specifically, fish tagged off the tip of Baja California were generally recaptured near where they were tagged, but some were recaptured around the Revillagigedo Islands, a few around Hawaii, and one near Norfolk Island, off Australia. Tagging studies in the Pacific, using pop-off satellite tags, indicated that there is essentially no mixing among tagging areas, and that striped marlin maintain site fidelity. Analyses of fisheries and genetic data indicate that the northern EPO supports a single stock, though there may be a seasonal low-level presence of juveniles from a more westerly Hawaii/Japan stock.
Historically, the majority of the catch in the EPO was taken by longline fisheries, which began expanding into the EPO in the mid-1950s and extended throughout the region by the late 1960s. Except for a few years in the late 1960s to early 1970s in the northern EPO, these fisheries did not target billfish. More recently, catches by recreational fisheries have become important, although most fish caught are released (Figure I-1). However, the survival rate of released fish is little understood.
Fishing by artisanal longline vessels targeting tuna and other species off Central America, for which data availability is limited, appears to have increased, over the past decade at least. The shifting patterns of areas fished and targeting practices increase the difficulties encountered when using fisheries data in analyses of stock status and trends. These difficulties are exacerbated when analyzing species which are not principal targets of the fishery, and further complicated when the total catch of the species by all fisheries is not known.
The last full assessment of striped marlin was conducted in 2008, using Stock Synthesis, and later updated with data through October 2010. Key results were that (1) the stock was not overfished; (2) overfishing was not occurring; and (3) the spawning stock biomass was above the level that would support MSY. More recently, average annual catches during 2015–2019 (1,732 t) were at about half the estimated MSY level in 2010. If fishing effort and catches continue at the 2010 level (2,129 t), it is expected that the biomass of the stock will continue to increase over the near term.
The fishing effort by large longline vessels in the North EPO has increased by about 20% since 2010, but the catch of striped marlin has remained largely unchanged. In 2019, the ISC completed a full assessment of the North Pacific stock of striped marlin for the period 1975–2017. This assessment showed a decline in the estimated spawning stock biomass from 17,000 mt in 1975 to 6,000 mt in 2017. Despite a marked reduction in fishing mortality for 2015–2017, the stock was deemed to be overfished and subject to overfishing relative to MSY-based reference points.
The recreational fishery has increased its contribution to the total annual reported catches of striped marlin in the EPO, particularly in the North EPO, from around 10% in 1990 to 64% and 84% in 2007 and 2008, respectively. However, a paucity of reported data since 2009 probably means that the catches of striped marlin in the EPO have been significantly underestimated since this time. Also, it appears that catches of billfishes, including striped marlin, by the artisanal longline fishery operating off Central America are not reported, at least not to the IATTC, or are incomplete. Therefore, the total catch of striped marlin in the EPO, and thus the total impact of fishing on the stock since about 2009, are not known.

IATTC-98-01 - Fisheries, stocks, and the ecosystem in the EPO in 2020 103
Efforts continue to obtain reliable catch data from all fisheries. Until the data are available and updated, and a review of the status of striped marlin in the EPO is completed, it is recommended that, as a precautionary measure, fishing effort by fisheries that take the majority of the striped marlin catch in the EPO not be increased.
FIGURE I-1. Total reported catches of striped marlin in the North EPO by longline (LL) and other (OTR) fisheries (primarily recreational, 1954–2019. Due to unreported catches by recreational fisheries, estimates for 2009–2019 are minimums. FIGURA I-1. Capturas totales reportadas de marlín rayado en el OPO Norte por las pesquerías palangreras (LL) y otras (OTR, principalmente recreativas), 1954–2019. Debido a capturas no reportadas por pesquerías recreativas, las estimaciones de 2009–2019 son mínimas.
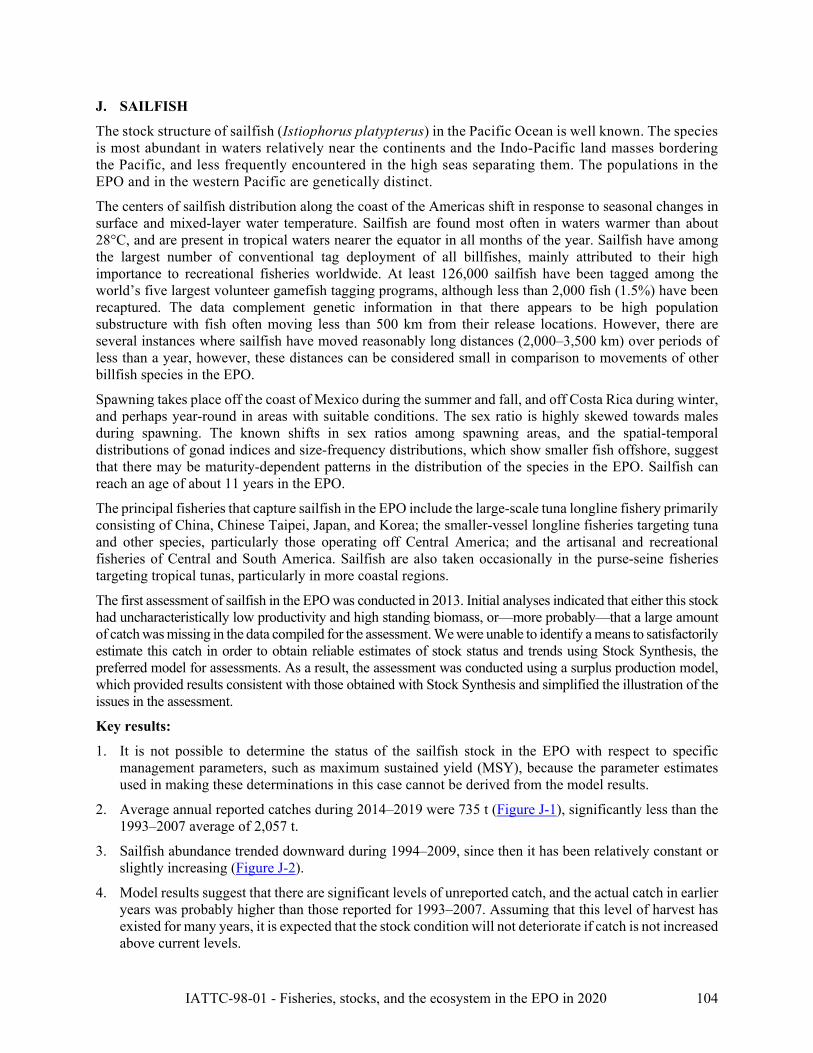
IATTC-98-01 - Fisheries, stocks, and the ecosystem in the EPO in 2020 104
J. SAILFISH
The stock structure of sailfish (Istiophorus platypterus) in the Pacific Ocean is well known. The species is most abundant in waters relatively near the continents and the Indo-Pacific land masses bordering the Pacific, and less frequently encountered in the high seas separating them. The populations in the EPO and in the western Pacific are genetically distinct.
The centers of sailfish distribution along the coast of the Americas shift in response to seasonal changes in surface and mixed-layer water temperature. Sailfish are found most often in waters warmer than about 28°C, and are present in tropical waters nearer the equator in all months of the year. Sailfish have among the largest number of conventional tag deployment of all billfishes, mainly attributed to their high importance to recreational fisheries worldwide. At least 126,000 sailfish have been tagged among the world’s five largest volunteer gamefish tagging programs, although less than 2,000 fish (1.5%) have been recaptured. The data complement genetic information in that there appears to be high population substructure with fish often moving less than 500 km from their release locations. However, there are several instances where sailfish have moved reasonably long distances (2,000–3,500 km) over periods of less than a year, however, these distances can be considered small in comparison to movements of other billfish species in the EPO.
Spawning takes place off the coast of Mexico during the summer and fall, and off Costa Rica during winter, and perhaps year-round in areas with suitable conditions. The sex ratio is highly skewed towards males during spawning. The known shifts in sex ratios among spawning areas, and the spatial-temporal distributions of gonad indices and size-frequency distributions, which show smaller fish offshore, suggest that there may be maturity-dependent patterns in the distribution of the species in the EPO. Sailfish can reach an age of about 11 years in the EPO.
The principal fisheries that capture sailfish in the EPO include the large-scale tuna longline fishery primarily consisting of China, Chinese Taipei, Japan, and Korea; the smaller-vessel longline fisheries targeting tuna and other species, particularly those operating off Central America; and the artisanal and recreational fisheries of Central and South America. Sailfish are also taken occasionally in the purse-seine fisheries targeting tropical tunas, particularly in more coastal regions.
The first assessment of sailfish in the EPO was conducted in 2013. Initial analyses indicated that either this stock had uncharacteristically low productivity and high standing biomass, or—more probably—that a large amount of catch was missing in the data compiled for the assessment. We were unable to identify a means to satisfactorily estimate this catch in order to obtain reliable estimates of stock status and trends using Stock Synthesis, the preferred model for assessments. As a result, the assessment was conducted using a surplus production model, which provided results consistent with those obtained with Stock Synthesis and simplified the illustration of the issues in the assessment.
Key results:
1. It is not possible to determine the status of the sailfish stock in the EPO with respect to specific management parameters, such as maximum sustained yield (MSY), because the parameter estimates used in making these determinations in this case cannot be derived from the model results.
2. Average annual reported catches during 2014–2019 were 735 t (Figure J-1), significantly less than the 1993–2007 average of 2,057 t.
3. Sailfish abundance trended downward during 1994–2009, since then it has been relatively constant or slightly increasing (Figure J-2).
4. Model results suggest that there are significant levels of unreported catch, and the actual catch in earlier years was probably higher than those reported for 1993–2007. Assuming that this level of harvest has existed for many years, it is expected that the stock condition will not deteriorate if catch is not increased above current levels.
IATTC-98-01 - Fisheries, stocks, and the ecosystem in the EPO in 2020 105
5. A precautionary approach that does not increase fishing effort directed at sailfish, and that closely monitors catch until sufficient data are available to conduct another assessment, is recommended.
6. A reliable assessment of the sailfish resources in the EPO cannot be obtained without reliable estimates of catch. It is therefore recommended that: a. historical data on catches of sailfish be obtained wherever possible b. fisheries currently reporting sailfish catches commingled with other species be required to report
catches by species. c. existing data from small-scale fisheries, such as local longline fleets, artisanal and recreational
fisheries, be compiled and that, where necessary, catch monitoring programs to identify catches by species be implemented.
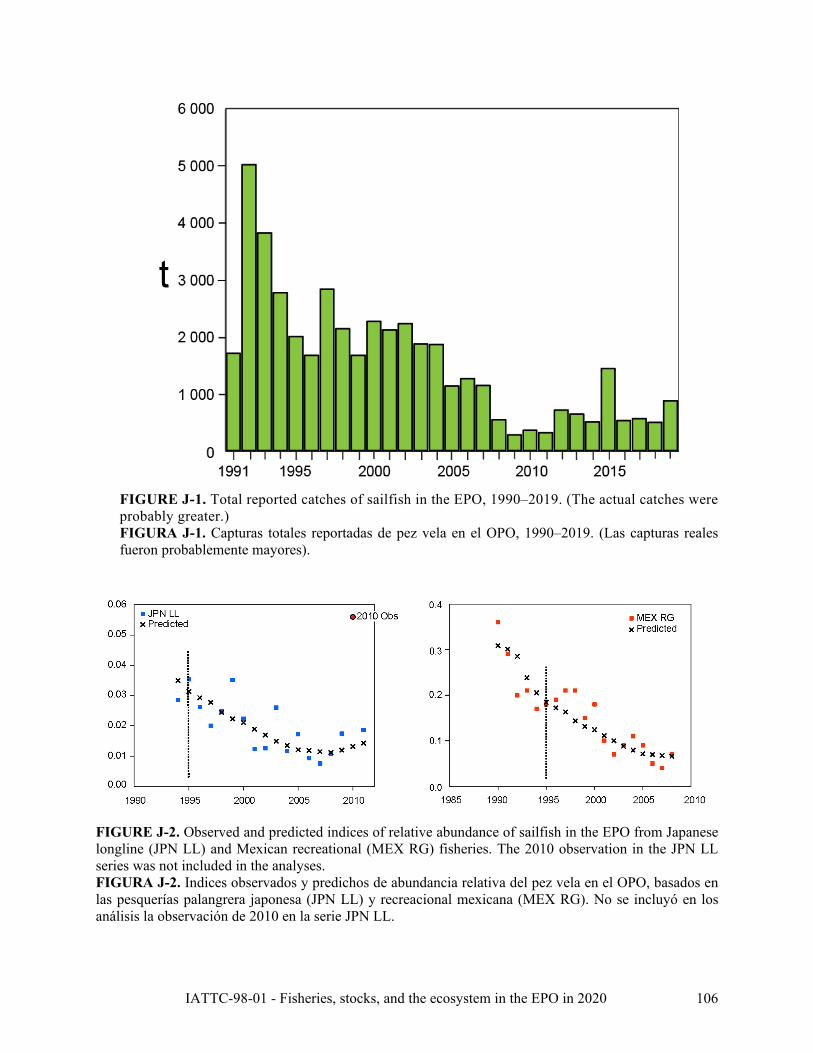
IATTC-98-01 - Fisheries, stocks, and the ecosystem in the EPO in 2020 106
FIGURE J-1. Total reported catches of sailfish in the EPO, 1990–2019. (The actual catches were probably greater.) FIGURA J-1. Capturas totales reportadas de pez vela en el OPO, 1990–2019. (Las capturas reales fueron probablemente mayores).
FIGURE J-2. Observed and predicted indices of relative abundance of sailfish in the EPO from Japanese longline (JPN LL) and Mexican recreational (MEX RG) fisheries. The 2010 observation in the JPN LL series was not included in the analyses. FIGURA J-2. Indices observados y predichos de abundancia relativa del pez vela en el OPO, basados en las pesquerías palangrera japonesa (JPN LL) y recreacional mexicana (MEX RG). No se incluyó en los análisis la observación de 2010 en la serie JPN LL.
IATTC-98-01 - Fisheries, stocks, and the ecosystem in the EPO in 2020 107
K. SILKY SHARK Updated stock status indicators for silky sharks in the eastern Pacific Ocean (1994-2020)
The indices for large silky sharks (> 150 cm total length (TL)), based on data from the purse-seine fishery on floating objects, have been updated through 2020 for the north and south EPO (Figure K-1; BYC-10 INF A). Previous analyses (SAC-08-08a(i)) identified a correlation between north EPO indices, particularly those for small (< 90 cm TL) and medium silky sharks (90 – 150 cm TL), and interannual variability in oceanographic conditions, and thus the indices for those size categories, and for all silky sharks, were not updated because of concerns about bias. Because of recent increases in the live release of silky sharks, two sets of indices for large silky sharks were computed, one including live release data and the other not. Taken together, the two sets of indices likely bracket the trend that would have resulted in both the north and south EPO if “finning”6, shark handling, and data recording practices had continued unchanged since 1994. The real trend is considered to be closer to the index based on dead + live releases because sharks recorded as released alive in recent years would probably have been recorded as dead previously, and thus the dead + live release is likely a more consistent indicator. The terminal point of these indices suggests a relatively stable abundance level for over a decade, with the 2020 values at, or slightly below, the 2019 values, following a more pronounced decrease in the indices from 2017 to 2018, and thus no changes to management measures are recommended. However, the stock status is uncertain, and an assessment has not been possible due to the paucity of data, especially for the longline fleets of coastal nations, which are believed to have the greatest impact on the stock (SAC-05-11a). Thus, the IATTC staff reiterates its previous recommendation (SAC-07-06b(i), SAC-07-06b(iii), SAC-08-11) that improving shark fishery data collection in the EPO is critical. This will facilitate the development of other stock status indicators and/or conventional stock assessments to better inform the management of the silky shark and other co-occurring shark species.
6 Cutting the fins off sharks and discarding the carcass.
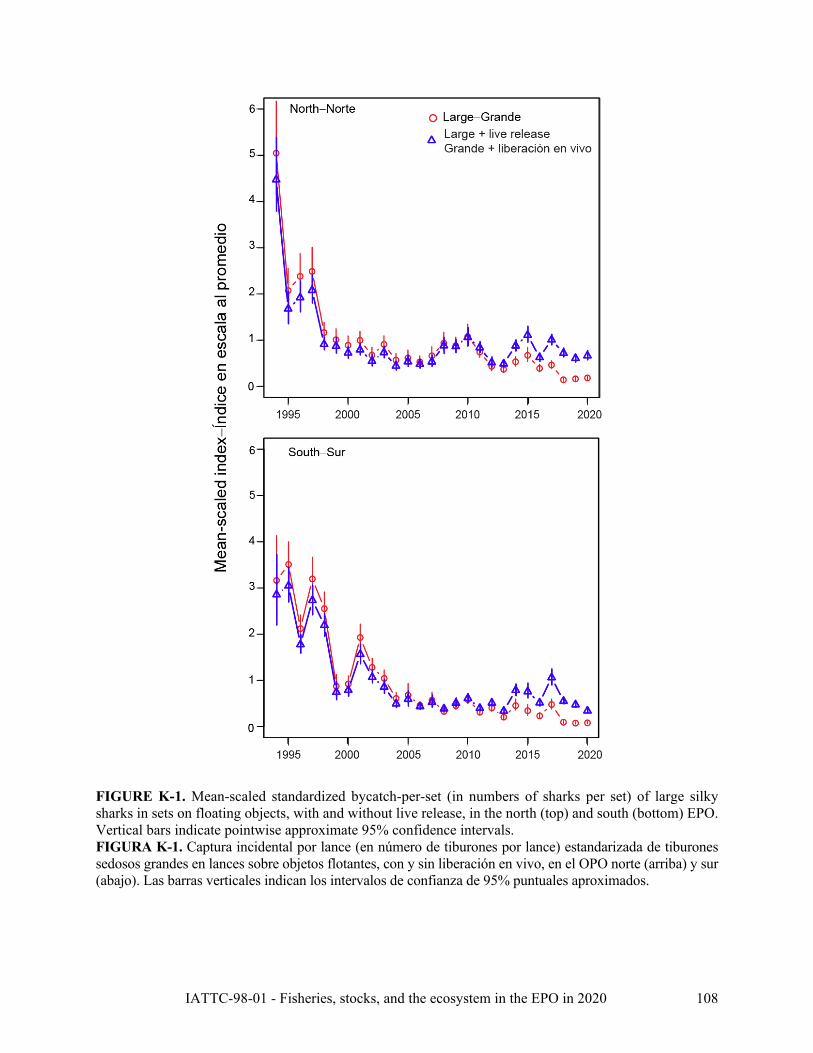
IATTC-98-01 - Fisheries, stocks, and the ecosystem in the EPO in 2020 108
FIGURE K-1. Mean-scaled standardized bycatch-per-set (in numbers of sharks per set) of large silky sharks in sets on floating objects, with and without live release, in the north (top) and south (bottom) EPO. Vertical bars indicate pointwise approximate 95% confidence intervals. FIGURA K-1. Captura incidental por lance (en número de tiburones por lance) estandarizada de tiburones sedosos grandes en lances sobre objetos flotantes, con y sin liberación en vivo, en el OPO norte (arriba) y sur (abajo). Las barras verticales indican los intervalos de confianza de 95% puntuales aproximados.

IATTC-98-01 - Fisheries, stocks, and the ecosystem in the EPO in 2020 109
L. ECOSYSTEM CONSIDERATIONS
1. Introduction ...................................................................................................................................... 109 2. Data sources ..................................................................................................................................... 110 2.1. Purse-seine ....................................................................................................................................... 110 2.2. Longline ........................................................................................................................................... 111 3. Fishery interactions with species groups .......................................................................................... 112 3.1. Tunas and billfishes .......................................................................................................................... 112 3.2. Marine mammals .............................................................................................................................. 112 3.3. Sea turtles ......................................................................................................................................... 112 3.4. Seabirds ............................................................................................................................................ 113 3.5. Sharks ............................................................................................................................................... 114 3.6. Rays .................................................................................................................................................. 115 3.7. Other large fishes ............................................................................................................................. 115 3.8. Forage species .................................................................................................................................. 116 4. Physical environment ...................................................................................................................... 116 4.1. Environmental indicators ................................................................................................................. 117 4.2. Spatio-temporal exploration of environmental conditions ............................................................... 119 4.3. Environmental conditions and distribution of catches ........................................................................ 120 5. Identification of species at risk ......................................................................................................... 120 6. Ecosystem dynamics ........................................................................................................................ 121 6.1. Ecological indicators ........................................................................................................................ 121 7. Future developments ........................................................................................................................ 122 Acknowledgments ..................................................................................................................................... 123 Literature cited .......................................................................................................................................... 123 1. INTRODUCTION
Over the past two decades, the scope of management of many fisheries worldwide has broadened to take into account the impacts of fishing on non-target species in particular, and the ecosystem generally. This ecosystem approach to fisheries management (EAFM) is important for maintaining the integrity and productivity of ecosystems while maximizing the utilization of commercially-important fisheries resources, but also ecosystem services that provide social, cultural and economic benefits to human society.
EAFM was first formalized in the 1995 FAO Code of Conduct for Responsible Fisheries, which stipulates that “States and users of living aquatic resources should conserve aquatic ecosystems” and that “management measures should not only ensure the conservation of target species, but also of species belonging to the same ecosystem or associated with or dependent upon the target species”. In 2001, the Reykjavik Declaration on Responsible Fisheries in the Marine Ecosystem elaborated these principles with a commitment to incorporate an ecosystem approach into fisheries management.
The IATTC’s Antigua Convention, which entered into force in 2010, is consistent with these instruments and principles. Article VII (f) establishes that one of the functions of the IATTC is to “adopt, as necessary, conservation and management measures and recommendations for species belonging to the same ecosystem and that are affected by fishing for, or dependent on or associated with, the fish stocks covered by this Convention, with a view to maintaining or restoring populations of such species above levels at which their reproduction may become seriously threatened”. Prior to that, the 1999 Agreement on the International Dolphin Conservation Program (AIDCP) introduced ecosystem considerations into the management of the tuna fisheries in the EPO. Consequently, for over twenty years the IATTC has been aware of ecosystem issues, and has moved towards EAFM in many of its management decisions (e.g., SAC-10 INF-B). Within the framework of the Strategic Science Plan (SSP), the IATTC staff is conducting novel and innovative ecological research aimed at obtaining the data and developing the tools required to
IATTC-98-01 - Fisheries, stocks, and the ecosystem in the EPO in 2020 110
implement EAFM in the tuna fisheries of the EPO. Current and planned ecosystem-related activities by the staff is summarized in the SSP (IATTC-93-06a) and the Staff Activities and Research report (SAC-12-01).
Determining the ecological sustainability of EPO tuna fisheries is a significant challenge, given the wide range of species with differing life histories with which those fisheries interact. While relatively good information is available for catches of tunas and billfishes across the entire fishery, this is not the case for most non-target (i.e. “bycatch”) species, especially those that are discarded at sea or have low economic value (see section 2). Furthermore, environmental processes that operate on a variety of time scales (e.g., El Niño-Southern Oscillation, Pacific Decadal Oscillation, ocean warming, anoxia and acidification) can influence the abundance and horizontal and vertical distribution of species to different degrees, which in turn affects their potential to interact with tuna fisheries.
Biological reference points, based on estimates of fishing mortality, spawning stock biomass, recruitment, and other biological parameters, have been used for traditional single-species management of target species, but the reliable catch and/or biological data required for determining such reference points, or alternative performance measures, are unavailable for most bycatch species. Similarly, given the complexity of marine ecosystems, there is no single indicator that can holistically represent their structure and internal dynamics and thus be used to monitor and detect the impacts of fishing and the environment.
The staff has presented an Ecosystem Considerations report since 2003, but this report is significantly different from its predecessors, in content, structure, and purpose. Its primary purpose is to complement the annual report on the fishery (SAC-12-03) with information on non-target species and on the effect of the fishery on the ecosystem, and to describe how ecosystem research can contribute to management advice and the decision-making process. It also describes some important recent advances in research related to assessing ecological impacts of fishing and the environment on the EPO ecosystem.
2. DATA SOURCES
In this report, estimated total catches of bycatch species were obtained from observer data for the large-vessel purse-seine fishery7, nominal catches reported by the limited observer coverage onboard the small-vessel purse-seine fishery8, and gross annual removals by the longline fishery were obtained from data reported by CPCs to the IATTC. Purse-seine data were available through 2020, with data from the last 2 years considered preliminary as of March 2021. Longline data were available through 2019 as the deadline for data reporting for the previous year occurs after the annual SAC meeting. Each data source is described in detail below.
2.1. Purse-seine
Data from the purse-seine fishery is compiled from 3 data sources: 1) IATTC and National Program observer data, 2) vessel logbook data extracted by staff at the Commission’s field offices in Latin American tuna ports, and 3) cannery data. The observer data from the large-vessel (Class 6) fishery are the most comprehensive in terms of bycatch species. Observers of the IATTC and the various National Programs provide detailed bycatch data by species, catch, disposition and effort for the exact fishing position (i.e., the latitude and longitude of the purse-seine set). Both the fisher-completed logbook and cannery datasets contain very limited data on bycatch species as reporting is primarily focused on commercially important tuna species. The logbook data, like the purse seine, includes the exact fishing position, but limited effort data are recorded with only one entry per day, regardless of the number of sets made. The cannery (or “unloading”) data do not have an exact fishing position but rather a broad geographic region where fish were caught (e.g., the eastern Pacific or western Pacific Ocean). These data contain bycatch species only if they were retained in a purse-seine well during the fishing operation.
Smaller (Class 1-5) purse-seine vessels are not required to carry observers. The primary sources of
7 Size class 6 purse-seine vessels with a carrying capacity > 363 t 8 Vessels with a carrying capacity <363 t

IATTC-98-01 - Fisheries, stocks, and the ecosystem in the EPO in 2020 111
unobserved data are logbook records, cannery unloading records, and port sampling by IATTC field office staff, all of which focus on tuna species. As such, there is limited information recorded on interactions with bycatch species by smaller vessels. In recent years there has been an increase in the number of smaller vessels that have carried observers. This is due to AIDCP requirements for fishing during closure periods for Class 6 purse-seine vessels, a desire for dolphin-safe fishery certification, a current IATTC pilot project trialing the efficacy of electronic monitoring methodologies (SAC-11-11), and a voluntary observer program for smaller Ecuadorian vessels that began in 2018. The minimum observer-derived catch estimates for bycatch species by small vessel trips are included in this report (Table L-7) to provide the basic information currently available for this fishery, with a view to expanding reporting on this fishery as data provision is hoped to improve in future. In 2020, most trips (76%) made by smaller vessels were unobserved, 17% were from the voluntary Ecuador observer program, 5% from National Observer program and 2% from the IATTC observer program.
Therefore, in this report we primarily focus on the comprehensive observer dataset from large purse-seine vessels to provide catch estimates for bycatch species. Under the AIDCP program, an observer is placed on a large purse-seine vessel prior to each trip. The bycatch data provided by the observers is used to estimate total catches, by set type (i.e. floating objects (OBJ), unassociated tunas (NOA), and dolphins (DEL))3. The numbers of sets of each type made in the EPO during 2005–2020 are shown in Table A-7 of Document SAC-12-03.
Despite the observer requirement, some sets are known to have taken place, based on logbooks and other sources, but were not observed. For example, at the start of bycatch data collection in 1993, about 46% of sets were observed, increasing to 70% in 1994. From 1994 to 2008, the average percent of sets observed was around 80%. From 2009 onwards, nearly 100% of sets were observed. Catch-per-day data for both target and non-target bycatch species are extrapolated9 to account for such instances.
2.2. Longline
The considerable variability in reporting formats of longline data has hindered the staff’s ability to estimate EPO-wide catches for bycatch species (SAC-08-07b, SAC-08-07d, SAC-08-07e). Bycatch data for longline fisheries reported here were obtained using data of gross annual removals estimated by each CPC and reported to the IATTC in summarized form. This is the same data source used to compile annual longline estimates for principal tuna and tuna-like species SAC-12-03. Because there is uncertainty in whether the IATTC is receiving all bycatch data from the longline fishery of each CPC, these data are considered incomplete, or ‘sample data‘, and are therefore regarded as minimum annual reported catch estimates for 1993–2019. A staff-wide collaboration is underway to revise the data provision Resolution C-03-05 to improve the quality of data collection, reporting, and analysis to align with IATTC’s responsibilities set forth in the Antigua Convention and the SSP (SAC-12-09).
During this process, the staff were able to determine that the longline catches of sharks, reported by CPCs were several times higher than previously reported catches for the longline fishery. A review of the data revealed that a high proportion of shark catches were assigned to “other gears” in the annual Fishery Status Reports since 2006 but were in fact taken by longline by coastal CPCs. Therefore, the resulting transfer of catch data from “other gears” to “longline” significantly increased the longline catches of sharks from 2006
9 The observed data is aggregated by species, year, flag and set type. The number of known unobserved sets is taken
from logbooks and other sources. Additionally, there are known EPO trips for which the staff do not know the number and type of sets made. Therefore, known bycatch-per-day from observer data is calculated by species, year, flag and set type, and applied to the number of days-at-sea for each trip to estimate the bycatch. In some instances, there may be unobserved sets or days-at-sea data by a flag that have no equivalent observer data for that year to facilitate a reliable estimation of catch. For these trips, yearly data from a proxy flag is used. The proxy flag is determined by subsequent 5 trips made by the vessel where an observer was onboard, and adopting the predominant flag used for those trips as the proxy flag. Then the bycatch-per-set or day of the known proxy flag for the year in question is applied to the data for the unrepresented flag.

IATTC-98-01 - Fisheries, stocks, and the ecosystem in the EPO in 2020 112
onwards (see Table A2c in SAC-11-03).
Longline observer data reporting has been improving since Resolution C-19-08 entered into force. The staff has received detailed set-by-set operational level observer data for several CPCs, although the level of observer coverage has often been less than the current mandated coverage of 5% of the total number of hooks or “effective days fishing”. Furthermore, for most CPCs, the coverage is significantly lower than the 20% coverage recommended by the staff, the Working Group on Bycatch, and the Scientific Advisory Committee. The effectiveness of the mandated 5% observer coverage for assessing whether the observer coverage is representative of the activities of the total fleet is presented in BYC-10 INF-D. Although CPCs made a tremendous effort in improving their reporting of longline observer data, results from the analysis showed that 5% observer coverage is insufficient for estimating the total catch of the relatively data-rich yellowfin and bigeye tunas, and so catch estimates for bycatch species are likely to be less reliable given that less data are available for bycatch species. IATTC staff will seek to provide estimates of longline catches in the EPO based on observer data in the future, but the results of the aforementioned analysis highlights a clear need for data reporting of bycatch species to improve (see SAC-12-09).
3. FISHERY INTERACTIONS WITH SPECIES GROUPS
3.1. Tunas and billfishes
Data on catches of the principal species of tunas and bonitos of the genera Thunnus, Katsuwonis, Euthynnus, and Sarda, and of billfishes in the Istiophoridae and Xiiphidae families, are reported in Document SAC-12-03. The staff has developed stock assessments and/or stock status indicators (SSIs) for tunas (SAC-12-05), a workplan for bigeye and yellowfin stock assessments (SAC-12-01) and skipjack assessment methods (SAC-12-06). The staff has also collaborated in the assessments of Pacific bluefin and albacore tunas led by the International Scientific Committee for Tuna and Tuna-like Species in the North Pacific Ocean (ISC), the assessment of south Pacific albacore tuna led by the Western and Central Pacific Fisheries Commission (WCPFC), and will collaborate on the ISC assessment for northern EPO swordfish to be carried out in 2021. A workplan for completing a southern EPO swordfish assessment and a progress report on the assessment is provided in SAC-12-07.
3.2. Marine mammals
Marine mammals, especially spotted dolphins (Stenella attenuata), spinner dolphins (S. longirostris), and common dolphins (Delphinus delphis), are frequently associated with yellowfin tuna in the EPO. Purse-seine fishers commonly set their nets around herds of dolphins and the associated yellowfin tuna, and then release the dolphins while retaining the tunas. The incidental mortality of dolphins was high during the early years of the fishery, but declined dramatically in the early 1990s, and has remained at low levels thereafter (Figure L-1).
Estimates of incidental mortality of dolphins in the purse-seine fishery of large vessels during 1993–2020 are shown in Table L-1. In 2020, the stock of dolphins with the highest incidental mortality was the eastern spinner (n=251), followed by the western-southern spotted (n=154), whitebelly spinner (n=138), and northeastern spotted dolphins (n=105). Common dolphins were least impacted by the fishery, with mortalities of 1 northern, 17 central, and 3 southern common dolphins.
The staff plans to analyze available reported and observed marine mammal interaction data for the purse-seine and longline fisheries. These data will be reported in the near future.
3.3. Sea turtles
Sea turtles are occasionally caught in the purse-seine fishery in the EPO, usually when associated with floating objects that are encircled, although they are sometimes also caught by happenstance in sets on unassociated tunas or tunas associated with dolphins. They can also become entangled in the webbing under fish-aggregating devices (FADs) and drown or be injured or killed by fishing gear.
IATTC-98-01 - Fisheries, stocks, and the ecosystem in the EPO in 2020 113
Figure L-2 shows the number of estimated sea turtle mortalities and interactions recorded by observers on large purse-seine vessels, by set type, during 1993–2020. Interactions were defined from observer information recorded as fate on the dedicated turtle form as: entangled, released unharmed, light injuries, escaped from net, observed but not involved in the set and other/unknown. The olive ridley turtle (Lepidochelys olivacea) is, by far, the species of sea turtle most frequently caught, with a total of 21,429 interactions and 949 mortalities (~4%) during 1993-2020, but only 297 interactions (zero mortalities) in 2020 (Table L-2). In 2020, there were 42 interactions recorded with eastern Pacific (23 green turtle, 23 loggerhead, 6 hawksbill, 3 leatherback, and 155 unidentified turtles) and only 2 mortalities, each of an unidentified turtle species.
One olive ridley turtle was reported by an observer onboard the smaller purse-seine vessels in 2020, but because 24% of small vessels carried an observer, this estimate must be considered as a minimum estimate only.
In the longline fishery, sea turtles are caught when they swallow a baited hook, are accidentally hooked, or drown after becoming entangled in the mainline, floatlines or branchlines and cannot reach the surface to breathe. They are also caught in coastal pelagic and bottom-set gillnet fisheries, where they become enmeshed in the net or entangled in the floatlines or headrope. Although very few data are available on incidental mortality of turtles by longline and gillnet fishing, the mortality rates in the EPO industrial longline fishery are likely to be lowest in “deep” sets (around 200-300 m) targeting bigeye tuna, and highest in “shallow” sets (<150 m) targeting albacore and swordfish. There is also a sizeable fleet of artisanal longline and gillnet fleets from coastal nations that are known to catch sea turtles, but limited data are available.
Data on sea turtle interactions and mortalities in the longline fishery have not been available (SAC-08-07b), although they are expected to improve with the submission of operational-level observer data for longline vessels >20 m beginning in 2019 pursuant to Resolution C-19-08. Recalling the observer coverage for most longline vessels is 5% or less, compared to 100% of observed trips in the large-vessel purse-seine fishery, the observer data provided by CPCs for 2019 include 71 turtle interactions, of which eight (11%) resulted in mortalities. The reported interactions/mortalities by species were loggerhead (31/1), green (18/0), olive ridley (11/5), leatherback (8/3), and Kemp’s ridley (1/1), plus unidentified sea turtles (1/1). The staff hopes to use the new operational observer data submissions required under C-19-08 to report the first total longline fleet catch estimate for sea turtle species in the future, although BYC-10 INF-D cautions that the current 5% observer coverage is likely insufficient for producing reliable estimates of total catch.
Various IATTC resolutions, most recently C-19-04, have been intended to mitigate fishing impacts on sea turtles and establish safe handling and release procedures for sea turtles caught by purse-seine and longline gears.
A preliminary vulnerability assessment was conducted for the eastern Pacific stock of leatherback turtles for 2018, using the Ecological Assessment of Sustainable Impacts of Fisheries (EASI-Fish) approach (see section 5) (BYC-10 INF-B). The status of the stock was determined to be “most vulnerable” in 2018, while scenario modelling showed that if the implementation of improved handling and release practices by the longline fleet could reduce post-release mortality by around 20% or more the population might recover to a “least vulnerable”, assuming fishing effort levels of all EPO fisheries do not increase. The staff has continued to collaborate with the Inter-American Convention for the Protection and Conservation of Sea Turtles (IAC) in 2020–2021 to improve the assessment using updated fisheries data from coastal CPCs and is planned to be completed by late 2021.
3.4. Seabirds
There are approximately 100 species of seabirds in the tropical EPO. Some of them associate with epipelagic predators, such as fishes (especially tunas) and marine mammals, near the ocean surface; for some, feeding opportunities are dependent on the presence of tuna schools feeding near the surface. Some
IATTC-98-01 - Fisheries, stocks, and the ecosystem in the EPO in 2020 114
seabirds, especially albatrosses and petrels, are caught on baited hooks in pelagic longline fisheries.
The IATTC has adopted one resolution on seabirds (C-11-02); also, the Agreement on the Conservation of Albatrosses and Petrels (ACAP) and BirdLife International have updated their maps of seabird distribution in the EPO, and have recommended guidelines for seabird identification, reporting, handling, and mitigation measures (SAC-05 INF-E, SAC-07-INF-C(d), SAC-08-INF-D(a), SAC-08-INF-D(b), BYC-08 INF J(b)). Additionally, ACAP has reported on the conservation status of albatrosses and large petrels (SAC-08-INF-D(c); BYC-08 INF J(a)).
As with sea turtles, data on seabird interactions and mortalities in the longline fishery have been unavailable (SAC-08-07b), but with the submission of operational-level observer data for longline vessels >20 m beginning from 2019 some minimum estimates are available for reporting. The observer data submitted by CPCs for 2019 contained 3,165 interactions with seabirds—all recorded as dead (or presumed dead due to incomplete disposition data)—with the exception of 18 black-footed albatross (Phoebastria nigripes) that were released alive with injuries. The reported interactions/mortalities by species were unidentified boobies and gannets (1,720/1,720), unidentified seabirds (546/546), black-footed albatross (370/352), wedge-tailed shearwater (306/306), Leach's storm-petrel (88/88), Wandering albatross (71/71), and Laysan albatross (64/64). The staff hopes to report the first total longline fleet catch estimate for seabird species in the near future using the operational observer data.
3.5. Sharks
Sharks are caught as bycatch in EPO tuna purse-seine fisheries and as either bycatch or a target in longline and multi-species and multi-gear fisheries of the coastal nations.
Stock assessments or stock status indicators (SSIs) are available for only four shark species in the EPO: silky (Carcharhinus falciformis) (Lennert-Cody et al. 2018; BYC-10 INF-A), blue (Prionace glauca) (ISC Shark Working Group), shortfin mako (Isurus oxyrinchus) (ISC Shark Working Group), and common thresher (Alopias vulpinus) (NMFS). As part of the FAO Common Oceans Tuna Project, Pacific-wide assessments of the porbeagle shark (Lamna nasus) in the southern hemisphere (Clarke 2017) and the bigeye thresher shark (Alopias superciliosus) (Fu et al. 2018) were completed in 2017, and for the silky shark (Clarke 2018a) in 2018, as well as a risk assessment for the Indo-Pacific whale shark population (Clarke 2018b) also in 2018. Whale shark interactions with the tuna purse-seine fishery in the EPO are summarized in document BYC-08 INF-A. The impacts of tuna fisheries on the stocks of other shark species, not previously mentioned, in the EPO are unknown.
Catches (t) of sharks in the large-vessel purse-seine fishery (1993–2020) and minimum reported catch estimates10 by longline fisheries (1993–2019) are provided in Table L-3, while catches of the most frequently caught species, discussed below, are shown in Figure L-3. Total longline catch estimates for 2020 were not available at the time of this report and reporting of many shark species by longline gear began in 2006. The silky shark (family Carcharhinidae) is the species of shark most commonly caught in the purse-seine fishery with annual catches averaging 552 t—primarily from sets on floating objects (Figure L-3)—and being 357 t in 2020. In contrast, minimum reported annual catch in the longline sample data for 2006–2019 averaged 11,155 t and was 2,600 t in 2019. Annual catch for the oceanic whitetip shark (Carcharhinidae) in the purse-seine fishery averaged 59 t (also primarily from sets on floating objects) and was 4 t in 2020. The minimum reported annual catch in the longline fishery from 2006–2019 averaged 153 t and none were reported in 2019. Catches of oceanic whitetip have declined in the purse-seine fishery since the early 2000s, while catches have been variable in the longline fishery (Figure L-3). Minimum annual reported catch of blue shark in the longline fishery from 1993–2019 averaged 5,803 t and was 11,012t in 2019. By contrast, the annual catch in the purse-seine fishery averaged only 2 t, with 1 t caught in 2020.
10 Sharks caught by longline vessels are recorded using different weight metrics (e.g. round, trunk or whole weight)
and thus, total annual reported catch estimates may contain a mix of these weight metrics. The staff is working on harmonizing shark data collection to improve the reliability of total catch estimates (e.g. SAC-11-13).

IATTC-98-01 - Fisheries, stocks, and the ecosystem in the EPO in 2020 115
Other important species of sharks caught in the purse-seine and longline fisheries include the smooth hammerhead (Sphyrna zygaena), the pelagic thresher (Alopias pelagicus), and mako sharks (Isurus spp.) (Table L-3, Figure L-3). Catch estimates for the smooth hammerhead shark in the purse-seine fishery averaged 26 t (primarily caught in floating-object sets) and was 7 t in 2020, while in the longline fishery minimum annual reported catch averaged 959 t (2006–2019) and was 33 t in 2019. In contrast, the pelagic thresher was caught primarily in unassociated tuna school sets in the purse-seine fishery with the estimated annual catch averaging 5 t and was 2 t in 2020. Minimum annual reported catch of the pelagic thresher in the longline fishery averaged 2,199 t (2007–2019) and was 444 in 2019. Catch estimates for the mako sharks in the purse-seine fishery were lower than the aforementioned shark species averaging 3 t and was 3 t in 2020. However, in the longline fishery the minimum annual reported catch averaged 1,335 t (1993–2019) and was 1,927 t in 2019.
The limited observer data from small purse-seine vessels showed 17 t of silky shark and 3 t of scalloped hammerhead were caught in floating-object sets in 2020, while those of other shark species or species groups were minimal (<1 t) (Table L-7).
The artisanal longline fisheries of the coastal CPCs target sharks, tunas, billfishes and dorado (Coryphaena hippurus), and some of these vessels are similar to industrial longline fisheries in that they operate in areas beyond national jurisdictions (Martínez-Ortiz et al. 2015). However, essential shark data from these longline fisheries are often lacking, and therefore conventional stock assessments and/or stock status indicators cannot be produced (see data challenges outlined in SAC-07-06b(iii)). An ongoing project is being undertaken to improve data collection on sharks, particularly for Central America, for the longline fleet through funding from the Food and Agriculture Organization of the United Nations (FAO) and the Global Environmental Facility (GEF) under the framework of the ABNJ Common Oceans program (SAC-07-06b(ii), SAC-07-06b(iii)). A one-year pilot study was conducted in 2019, collecting shark-fishery data and developing and testing sampling designs for a long-term sampling program for the shark fisheries throughout Central America (Phase 2 of the project). A progress report on the FAO-GEF ABNJ project was presented at SAC-11 (SAC-11-05). The pilot study will continue through 2020. Data obtained from this project may be included in future iterations of the Ecosystem Considerations report to provide improved catch estimates for sharks by the various longline fleets.
3.6. Rays
Estimated annual catches of manta rays (Mobulidae) and stingrays (Dasyatidae) by the large-vessel purse-seine (1993–2020) and minimum reported annual catches by longline (1993–2019) fisheries are provided in Table L-4, while catches of key species are shown in Figure L-4. These rays are primarily caught by the purse-seine fishery, while limited catches were reported for the longline fishery only for the Munk’s devil ray (2009: 6 t, 2010: 118 t) and Dasyatidae spp. (16 t over a 6-year period), with half the catches made in 2009 (Table L-4). The giant manta had the largest average catches in the purse-seine fishery (19 t), followed by the spinetail (14 t), and smoothtail (8 t) mobulid rays. Catches of these species in 2020 were 4, 13, and 1 t, respectively. Catches of the pelagic stingray were low, averaging only 2 t and being 2 t in 2020 (Table L-4). Although catches of these rays can be variable by set type, they have been highest in unassociated sets, followed by dolphin sets, and lowest in floating-object sets (Figure L-4).
For the small purse-seine vessel fishery, the limited available observer data for 2020 was minimal (≤1 t) for all other ray species or species groups (Table L-7).
3.7. Other large fishes
Large pelagic fishes caught by the large-vessel purse-seine, primarily on floating-object sets, (1993–2020) and longline (1993–2019) fisheries are shown in Table L-5, with time series of catches of key species presented in Figure L-5. The most commonly-caught pelagic fishes in both fisheries is dorado (Coryphaenidae) with the estimated average annual catch for the purse-seine fishery being 1,291 t (778 t in 2020) and the minimum reported annual catch for the longline fishery averaging 6,054 t (1,540 t in 2019). Dorado is also one of the
IATTC-98-01 - Fisheries, stocks, and the ecosystem in the EPO in 2020 116
most important species caught in the artisanal fisheries of the coastal nations of the EPO (SAC-07-06a(i)). Recommendations for potential reference points and harvest control rules for dorado in the EPO was presented at SAC-10 (SAC-10-11).
Other key species caught by the purse-seine fishery include wahoo (Scombridae) and rainbow runner (Carangidae). Wahoo had an estimated average annual catch of 377 t for the purse-seine fishery, although catches have declined from a peak of 1,025 t in 2001 to 127 t in 2020 (Figure L-5). Minimum reported annual catch of wahoo by the longline fishery have averaged 163 t and was 325 t in 2019. No catches of rainbow runner have been reported by the longline fishery. However, in the purse-seine fishery, estimated average annual catches of rainbow runner were 48 t, with the peak catch in 2007 at 158 t and declining thereafter to 23 t in 2020 (Figure L-5).
Pelagic fishes commonly reported by the longline fishery include opah (Lampridae), snake mackerels (Gempylidae) and pomfrets (Bramidae). Minimum reported annual catches for these species averaged 349 t (1993–2019), 373 t (2006–2019), and 48 t (1993–2019), respectively. Catches of all these taxa have increased after the mid-2000s (Figure L-5). For the most recent year (2019), there were 681 t, 300 t, and 80 t of opah, snake mackerels, and pomfrets reported, respectively (Table L-5).
The limited observer data available for 2020 for the small purse-seine fishery included 88 t of dorado and 16 t of wahoo caught in floating-object sets, while the remaining species or species groups of large fishes had ≤1 t reported (Table L-7).
3.8. Forage species
A large number of taxa occupying the middle trophic levels in the EPO ecosystem—generically referred to as “forage” species—play a key role in providing a trophic link between primary producers at the base of the food web and the upper-trophic-level predators, such as tunas and billfishes. Some small forage fishes are incidentally caught in the EPO by purse-seine vessels on the high seas, mostly in sets on floating objects, and by coastal artisanal fisheries, but are generally discarded at sea. Catches of these species are presented in Table L-6 with key species as identified by catch data presented in Figure L-6 for the large-vessel purse-seine fishery, with the majority of catches coming from floating object sets.
Bullet and frigate tunas (Scombridae) are by far the most commonly reported forage species with estimated annual catches averaging 1,053 t from 1993–2020. However, their catches have declined from 1,922 in 2005 to 481 t in 2020 (Figure L-6). Triggerfishes (Balistidae) and filefishes (Monacanthidae) are the second most commonly reported forage group with annual estimated catches averaging 260 t and totaling 47 t in 2020. Catches for this group peaked in 2004 at 914 t but have otherwise been variable. Annual catches of sea chubs (Kyphosidae) have averaged 15 t, which began to increase after 2002 but have steadily decreased to 3 t in 2020. Lastly, annual catches of the various species in the category ‘epipelagic forage fishes’ averaged 4 t with 4 t estimated to be caught in 2020. A total of 66 t of bullet and frigate tunas and 12 t of triggerfishes and filefishes were reported by observers on the limited number of trips on small purse-seine vessels that carried an observer in 2020. Catches of all other species or species groups of small fishes were minimal (≤1 t) (Table L-7).
4. PHYSICAL ENVIRONMENT
Environmental conditions affect marine ecosystems, the dynamics and catchability of target and bycatch species, and the activities of fishers, and physical factors can have important effects on the distribution and abundance of marine species11. The following summary of the physical environment covers: 1) short- and
11 See SAC-04-08, Physical Environment, and SAC-06 INF-C for a comprehensive description of the effects of
physical and biological oceanography on tunas, prey communities, and fisheries in the EPO.

IATTC-98-01 - Fisheries, stocks, and the ecosystem in the EPO in 2020 117
long-term environmental indicators, and 2) environmental conditions and their effect on the fishery during the previous year, in this case, 2020.
4.1. Environmental indicators
The ocean environment changes on a variety of time scales, from seasonal to inter-annual, decadal, and longer. Longer-term climate-induced changes, typically decadal (at intervals of 10–30 years) and characterized by relatively stable average conditions and patterns in physical and biological variables, are called “regimes”. However, the dominant source of variability in the upper layers of the EPO is the El Niño-Southern Oscillation (ENSO), an irregular fluctuation involving the entire tropical Pacific Ocean and the world’s atmosphere (Fiedler 2002). El Niño events occur at two- to seven-year intervals, and are characterized by weaker trade winds, deeper thermoclines, and higher sea-surface temperatures (SSTs) in the equatorial EPO. El Niño’s opposite phase, commonly called La Niña, is characterized by stronger trade winds, shallower thermoclines, and lower SSTs. The changes in the biogeochemical environment caused by ENSO have an impact on the biological productivity, feeding, and reproduction of fishes, seabirds, and marine mammals (Fiedler 2002).
ENSO is thought to cause considerable variability in the availability for capture of commercially-important tunas and billfishes in the EPO (Bayliff 1989). For example, the shallow thermocline during a La Niña event can increase purse-seine catch rates for tunas by compressing the preferred thermal habitat of small tunas near the sea surface, while the deeper thermocline during an El Niño event likely makes tunas less vulnerable to capture, and thus reduces catch rates. Furthermore, warmer- or cooler-than-average SSTs can also cause the fish to move to more favorable habitats, which may also affect catch rates as fishers expend more effort on locating the fish.
Recruitment of tropical tunas in the EPO may also be affected by ENSO events. For example, strong La
FIGURE L-7. El Niño regions used as indicators of El Niño Southern Oscillation (ENSO) events in the Pacific Ocean (top panel), and the Oceanic Niño Index (ONI) used to monitor ENSO conditions in Niño region 3.4 from 5°N to 5°S and 120°W to 170°W (bottom panel). Time series shows the running 3-month mean ONI values from the start of the IATTC observer program through December 2020. ONI data obtained from: http://origin.cpc.ncep.noaa.gov/products/analysis_monitoring/ensostuff/ONI_v5.php FIGURA L-7. Regiones de El Niño utilizadas como indicadores de los eventos de El Niño-Oscilación del Sur (ENOS) en el Océano Pacífico (panel superior), e Índice de El Niño Oceánico (ONI) usado para dar seguimiento a las condiciones de ENOS en la región Niño 3.4 de 5°N a 5°S y de 120°O a 170°O (panel inferior). Las series de tiempo muestran los valores del promedio móvil de 3 meses del ONI desde el inicio del programa de observadores de la CIAT hasta finales de diciembre de 2020. Datos del ONI obtenidos de: http://origin.cpc.ncep.noaa.gov/products/analysis_monitoring/ensostuff/ONI_v5.php

IATTC-98-01 - Fisheries, stocks, and the ecosystem in the EPO in 2020 118
Niña events in 2007–2008 may have been partly responsible for the subsequent lower recruitment of bigeye tuna, while the largest recruitments corresponded to the extreme El Niño events in 1982–1983 and 1998 (SAC-09-05). Yellowfin recruitment was also low in 2007, but high during 2015–2016, after the extreme El Niño event in 2014–2016 (SAC-09-06).
The Climate Diagnostics Bulletin of the US National Weather Service reported that in 2020 anomalies—defined in the Bulletin as a departure from the monthly mean—in oceanic and atmospheric characteristics (e.g., surface and sub-surface temperatures, thermocline depth, wind, and convection) were indicative of ENSO-neutral conditions during January–July and La Niña conditions during August–December.
Indices of variability in such conditions are commonly used to monitor the direction and magnitude of ENSO events in the Pacific Ocean. In this report, the Oceanic Niño Index (ONI), used by the US National Oceanic and Atmospheric Administration (NOAA) as the primary indicator of warm El Niño and cool La Niña conditions within the Niño 3.4 region in the east-central tropical Pacific Ocean (Dahlman 2016)
(Figure L-7), is used to characterize inter-annual variability in SST anomalies. The ONI is a measure of El Niño defined by NOAA as “a phenomenon in the equatorial Pacific Ocean characterized by a five consecutive 3-month running mean of SST anomalies in the Niño 3.4 region that is above (below) the threshold of +0.5°C (-0.5°C).” The ONI categorizes ENSO events from “extreme” to “weak” (Figure L-7). For example, the “extreme” El Niño event in 1997–1998 was followed by a “very strong” La Niña event in 1998–2000. “Strong” La Niña events were also observed in 2007–2008 and 2010–2011. The highest ONI values (>2.5) were recorded during the 2015–2016 El Niño event. ENSO-neutral conditions occurred during much of 2020, with moderate-strong La Niña conditions from August through December.
The Pacific Decadal Oscillation (PDO; Figure L-8) index is used to describe longer-term fluctuations in the Pacific Ocean, and has also been used to explain, for example, the influence of environmental drivers on the vulnerability of silky sharks to fisheries in the EPO (Lennert-Cody et al. 2018). The PDO—a long-lived El Niño-like pattern of Pacific climate variability, with events persisting 20–30 years—tracks large-scale interdecadal patterns of environmental and biotic changes, primarily in the North Pacific Ocean (Mantua 1997), with secondary patterns observed in the tropical Pacific, the opposite of ENSO (Hare and Mantua 2000). As with ENSO, PDO phases are classified as “warm” or “cool”. PDO values peaked at 2.79 in August 1997 and at 2.62 in April 2016, both of which coincided with the extreme El Niño events indicated
FIGURE L-8. Monthly values of the Pacific Decadal Oscillation (PDO) Index, January 1993–December 2020. PDO data obtained from: https://psl.noaa.gov/data/gridded/data.noaa.ersst.v5.html FIGURA L-8. Valores mensuales del índice de Oscilación Decadal del Pacífico (PDO), enero de 1993–diciembre de 2020. Datos de la PDO obtenidos de: https://psl.noaa.gov/data/gridded/data.noaa.ersst.v5.html

IATTC-98-01 - Fisheries, stocks, and the ecosystem in the EPO in 2020 119
by the ONI. During 2020, cool PDO conditions persisted.
4.2. Spatio-temporal exploration of environmental conditions
A time series of SST and chlorophyll-a concentration (CHL-a; an indicator of primary productivity biomass) (Figure L-9) in the eastern tropical Pacific (ETP) from 5°N to 5°S—the same latitudinal band used in the ONI—was explored to show the variability in these variables across space and time using time-longitude Hovmöller diagrams. The SST time series show mean monthly values from 1993–2020, while that for CHL-a concentrations covers data for 2003–2020 due to data availability. The SST plot (Figure L-9) clearly shows the extension of warmer waters during the extreme El Niño events of 1997–1998 and 2015–2016 and cooler waters during the strong La Niña events in 1999–2000, 2007–2008 and 2010–2011 across the ETP. The CHL-a plot (Figure L-9), although the pattern is less clear than the SST plot, shows an increase in CHL-a concentrations following the strong La Niña events in 2007–2008 and 2010–2011, likely due to increases in nutrient availability.
FIGURE L-9. Time-longitude Hovmöller diagram with data averaged across the tropical eastern Pacific Ocean from 5°N to 5°S for mean monthly SST for January 1993–December 2020 (top panel) (https://www.esrl.noaa.gov/psd/) and mean monthly chlorophyll-a concentration for January 2003–December 2020 (bottom panel) (https://coastwatch.pfeg.noaa.gov/erddap/info/erdMH1chlamday/index.html) FIGURA L-9. Diagrama de Hovmöller tiempo-longitud con datos promediados en el Océano Pacífico tropical oriental de 5°N a 5°S para la TSM promedio mensual de enero de 1993 a diciembre de 2020 (panel superior) (https://www.esrl.noaa.gov/psd/) y concentración promedio mensual de clorofila-a de enero de 2003 a diciembre de 2020 (panel inferior) (https://coastwatch.pfeg.noaa.gov/erddap/info/erdMH1chlamday/index.html.

IATTC-98-01 - Fisheries, stocks, and the ecosystem in the EPO in 2020 120
4.3. Environmental conditions and distribution of catches
The availability of fish, and thus catches, are strongly related to environmental conditions and processes, particularly in pelagic waters (Fiedler and Lavín 2017; Chassot et al. 2011). ENSO conditions are influenced by many oceanic and atmospheric factors, but both SST and CHL-a levels are known to be good explanatory variables to describe and predict the habitat and distributions of oceanic animals (Hobday and Hartog 2014).
Figures L-10 and L-11 show quarterly mean SSTs and CHL-a concentrations, respectively, to: 1) provide a general indication of seasonal environmental variability, and 2) overlay the distribution of tropical tuna catches, as a first step, to illustrate the potential influence of environmental conditions on catches across the EPO during 2020. In future, the staff plans to incorporate the catch distribution of key bycatch species and develop species distribution models to better describe potential relationships between environment and species.
Cooler waters occurred off northern Mexico and the southwestern United States around 30°N and extended westwards during quarters 1 (January–March) and 2 (April–June), and off South America, south of the equator and east of 100°W, in quarters 3 (July–September) and 4 (October–December). Warmer waters developed off Central America and extended westwards during quarters 2 and 3. A secondary warm pool was observed in the southwestern EPO (10–20°S, 140°–150°W) during quarters 1 and 2.
CHL-a concentrations were highest along the equator and the coast of the Americas year-round. The oligotrophic12 South Pacific Gyre—located between around 20°–40°S and extending from 150°–90°W—was present in quarter 1, retracted in quarters 2 and 3, and returned in quarter 4.
During quarters 1 and 2, skipjack predominated in the catches in the cooler waters (~25°C) off the coast of South America, where CHL-a concentration was high. Yellowfin tuna was the predominant tuna species in the catch primarily north of the equator and east of 120°W during these same quarters where warmer waters occurred. During quarters 3 and 4, the tuna catches along the coast of South America decreased as cooler waters expanded throughout the region. Bigeye tuna catches mostly occurred south of ~5°S with larger catches taken west of ~120°W where warmer waters persisted during quarters 1–3. A secondary concentration of catches occurred west of 130°W, close to the western boundary of the EPO, primarily during quarters 1–3.
5. IDENTIFICATION OF SPECIES AT RISK
The primary goal of EAFM is to ensure the long-term sustainability of all species impacted—directly or indirectly—by fishing. However, this is a significant challenge for fisheries that interact with many non-target species with diverse life histories, for which reliable catch and biological data for single-species assessments are lacking. An alternative for such data-limited situations, reflected in Goal L of the SSP, are Ecological Risk Assessments (ERAs), vulnerability assessments that are designed to identify and prioritize at-risk species for data collection, research and management.
‘Vulnerability’ is defined as the potential for the productivity of a stock to be diminished by the direct and indirect impacts of fishing activities. The IATTC staff has applied qualitative assessments, using Productivity-Susceptibility Analysis (PSA) to estimate the relative vulnerability of data-limited, non-target species caught in the EPO by large purse-seine vessels (Duffy et al. 2019) and by the longline fishery (SAC-08-07d).
Because PSA is unable to quantitatively estimate the cumulative effects of multiple fisheries on data-poor bycatch species, a new approach—Ecological Assessment of Sustainable Impacts of Fisheries (EASI-Fish)—was developed by the IATTC staff in 2018 (SAC-09-12) to overcome this issue. This flexible, spatially-explicit method uses a smaller set of parameters than PSA to first produce a proxy for the fishing mortality rate (F) of each species, based on the ‘volumetric overlap’ of each fishery on the geographic
12 An area of low productivity, nutrients, and surface chlorophyll, often referred to as an “oceanic desert”.

IATTC-98-01 - Fisheries, stocks, and the ecosystem in the EPO in 2020 121
distribution of these species. The estimate of F is then used in length-structured per-recruit models to assess the vulnerability of each species using conventional biological reference points (e.g. FMSY, F0.1).
EASI-Fish was successfully applied to 24 species representing a range of life histories, including tunas, billfishes, tuna-like species, elasmobranchs, sea turtles and cetaceans caught in EPO tuna fisheries as a ‘proof of concept’ in 2018 (SAC-09-12). It was subsequently used to assess the vulnerability status of the spinetail devil ray (Mobula mobular), caught by all industrial tuna fisheries in the EPO (BYC-09-01), and the EPO stock of the critically-endangered leatherback turtle (Dermochelys coriacea) (BYC-10 INF-B). Therefore, EASI-Fish will be used in future to assess the vulnerability of all species groups (e.g., elasmobranchs, sea turtles, teleosts) impacted by EPO tuna fisheries.
6. ECOSYSTEM DYNAMICS
Although vulnerability assessments (e.g., EASI-Fish) are useful for assessing the ecological impacts of fishing by assessing the populations of individual species, ecosystem models are required to detect changes in the structure and internal dynamics of an ecosystem. These models are generally data- and labor-intensive to construct, and consequently, few fisheries worldwide have access to a reliable ecosystem model to guide conservation and management measures. These models require a good understanding of ecosystem components and the direction and magnitude of the trophic flows between them, which require detailed ecological studies involving stomach contents and/or stable isotope studies. Purposefully, IATTC staff have had a long history of undertaking such trophic studies, including the experimental determination of consumption estimates of yellowfin tuna at NMFS Kewalo Basin facility on Oahu, HI in the 1980s, to more recent analyses of stomach content and stable isotope analysis of a range of top-level predators.
In 2003, the IATTC staff compiled the trophic data to complete the development of a model of the pelagic ecosystem in the tropical EPO (IATTC Bulletin, Vol. 22, No. 3)—named “ETP7”—to explore how fishing and climate variation might affect target species (e.g. tunas), byproduct species (e.g., wahoo, dorado), elasmobranchs (e.g., sharks), forage groups (e.g., flyingfishes, squids) and species of conservation importance (e.g., sea turtles, cetaceans). A simplified food-web diagram, with approximate trophic levels (TLs), from the model is shown in Figure L-12.
The model was calibrated to time series of biomass and catch data for a number of target species for 1961–1998. There have been significant improvements in data collection programs in the EPO since 1998, that has allowed the model to be updated with these new data up to 2018 (“ETP-21”). A full description of the structural update of the model, attaining mass-balance, and calibration to time series data is provided in SAC-12-13.
6.1. Ecological indicators
Since 2017, ETP8 and ETP-21 have been used in the Ecosystem Considerations report to provide annual values for seven ecological indicators that, together, can identify changes in the structure and internal dynamics of the ETP ecosystem. These indicators are: mean trophic level of the catch (TLc), the Marine Trophic Index (MTI), the Fishing in Balance (FIB) index, Shannon’s index, and the mean trophic level of the modelled community for trophic levels 2.0–3.25 (TL2.0), ≥3.25–4.0 (TL3.5), and >4.0 (TL4.0). A full description of these indicators is provided in SAC-10-14. Additionally, simulations using ETP-21 were conducted to assess potential impacts of the FAD fishery on the structure of the ecosystem (SAC-12-13).
A significant update of the ETP8 model was undertaken in 2021 (“ETP-21”) due to a significant change in how the IATTC staff have reclassified the catch data submitted by the CPCs for “other gears” into longline and other gear types following an internal review of the data. This resulted in a dramatic increase in reported longline catches of high trophic level predators (sharks), which can have a strong influence on ecosystem dynamics. Annual catch estimates by species for 1993–2018 were assigned to the relevant functional groups in the ETP-21 model, which was then rebalanced and recalibrate to time series data to provide an updated ecosystem status for 2021.
IATTC-98-01 - Fisheries, stocks, and the ecosystem in the EPO in 2020 122
Ecological indicators showed that values for TLc and MTI decreased from their peak of 4.77 and 4.83 in 1991 to 4.64 and 4.65 in 2018, respectively, as the purse-seine fishing effort on FADs significantly increased (Figure L-13), where there was increasing catches of high trophic level bycatch species that tend to aggregate around floating objects (e.g., sharks, billfish, wahoo and dorado). Since its peak in 1991, TLc declined by 0.05 of a trophic level in the subsequent 28 years, or 0.04 trophic levels per decade. The expansion of the FAD fishery is also seen in the FIB index that exceeds zero after 1990, as well as the continual change in the evenness of biomass of the community indicated by Shannon’s index.
The above indicators generally describe the change in the exploited components of the ecosystem, whereas community biomass indicators describe changes in the structure of the ecosystem once biomass has been removed due to fishing. The biomass of the TLMC4.0 community was at one of its highest values (4.493) in 1986 but has continued to decline to 4.470 in 2018 (Figure L-13). As a result of changes in predation pressure on lower trophic levels, between 1993 and 2018 the biomass of the TLMC3.25 community increased from 3.801 to 3.829, while interestingly, the biomass of the TLMC2.0 community also increased from 3.092 to 3.107.
Together, these indicators show that the ecosystem structure has likely changed over the 40-year analysis period. The consistent patterns of change in each ecological indicator, particularly in the mean trophic level of the communities since 1993, certainly warrant the continuation, and ideally an expansion, of monitoring programs for fisheries in the EPO.
7. FUTURE DEVELOPMENTS
It is unlikely, in the near future at least, that there will be stock assessments for most of the bycatch species. Therefore, the IATTC must continue to undertake ecological research that can provide managers with reliable information to guide the development of science-based conservation and management measures, where required, to ensure the IATTC continues to fulfil its responsibilities under the Antigua Convention and the objectives of the IATTC’s 5-year SSP. The priority research areas that have been identified by the scientific staff that require further development are detailed below:
• Following the development of the EASI-Fish approach, analysis of the full suite of over 100 impacted bycatch species will be conducted in stages, by taxonomic group, beginning in 2022. The priority of groups to be assessed will likely be elasmobranchs, teleosts, turtles and cetaceans.
• A shortcoming of the ETP-21 ecosystem model, from which annual ecological indicator values are derived, is that its structure is based on stomach content data from fish collected in 1992–1994. Given the significant environmental changes that have been observed in the EPO over the past decade, there is a critical need to collect updated trophic information. There have been proposals made by the staff in 2018–2021 to establish an ecological monitoring program to collect stomach content data to update the ecosystem model.
• A second limitation of the ETP-21 model is that it describes only the tropical component of the EPO ecosystem, and results cannot be reliably extrapolated to other regions of the EPO. Therefore, after updated diet information is collected, future work will aim to develop a spatially-explicit model that covers the entire EPO and calibrate the model with available time series of catches, ideally for species representing different trophic levels, and effort data for key fisheries in the EPO.
• Environmental variables can have a profound influence on the catches of target and bycatch species, as has been shown previously by IATTC staff and now undertaken annually in this report. However, the staff’s research to investigate the impact of environmental conditions on the fishery could be greatly improved with the availability of high-resolution operational level data for the longline fishery. Although IATTC Members and CPCs are now required to submit operational level observer data to the IATTC that covers at least 5% of their fleets, the staff concluded that these

IATTC-98-01 - Fisheries, stocks, and the ecosystem in the EPO in 2020 123
data are not representative of the fleet (BYC-10 INF-D) and therefore brings into question the validity of using submitted longline data for future environmental analyses until the observer coverage reaches at least 20%.
ACKNOWLEDGMENTS
We would like to thank Nick Vogel, Joydelee Marrow, and Joanne Boster for their assistance with data preparation, Alexandre Aires-da-Silva and Paulina Llano for their reviews of this document, and Christine Patnode for improving the figures. We gratefully acknowledge the early ecosystem research by Robert Olson that contributed to this report. His initiation of the Ecosystem Considerations report in 2003 was first presented at the 8th Meeting of the Working Group to Review Stock Assessments in 2007 (SAR-08-17 J) and has been updated annually.
LITERATURE CITED
Bayliff, W.H. 1989. Inter-American Tropical Tuna Commission, Annual Report for 1988. IATTC, La Jolla, CA USA. 270 pp. Chassot, E., S. Bonhommeau, G. Reygondeau, K. Nieto, J.J. Polovina, M. Huret, N.K. Dulvy, and H. Demarcq. 2011. Satellite remote sensing for an ecosystem approach to fisheries management. ICES Journal of Marine Science 68(4): 651-666. Clarke, S. 2017. Southern Hemisphere porbeagle shark (Lamna nasus) stock status assessment. WCPFC-SC13-2017/SA-WP-12 (rev. 2). Pages 75. Western and Central Pacific Fisheries Commission. Scientific Committee Thirteenth Regular Session, Rarotonga, Cook Islands. Clarke, S. 2018a. Pacific-wide silky shark (Carcharhinus falciformis) Stock Status Assessment. WCPFC-SC14-2018/SA-WP-08. Pages 137. Western and Central Pacific Fisheries Commission, Busan, Korea. Clarke, S. 2018b. Risk to the Indo-Pacific Ocean whale shark population from interactions with Pacific Ocean purse-seine fisheries. WCPFC-SC14-2018/SA-WP-12 (rev. 2). Pages 55. Western and Central Pacific Fisheries Commission, Scientific Committee Fourteenth Regular Session, Busan, Korea. Dahlman, L. 2016. Climate Variability: Oceanic Niño Index. https://www.climate.gov/news-features/understanding-climate/climate-variability-oceanic-ni%C3%B1o-index. National Oceanic and Atmospheric Administration. Duffy, L.M., and S.P. Griffiths. 2019. Assessing attribute redundancy in the application of productivity-susceptibility analysis to data-limited fisheries. Aquatic Living Resources 32(20): 1-11. Duffy, L.M., C.E. Lennert-Cody, R. Olson, C.V. Minte-Vera, and S.P. Griffiths. 2019. Assessing vulnerability of bycatch species in the tuna purse-seine fisheries of the eastern Pacific Ocean. Fisheries Research 219 Fiedler, P., and M. Lavín. 2017. Oceanographic Conditions of the Eastern Tropical Pacific. In P. W. Glynn, D. P. Manzello, and I. C. Enochs (eds.), Coral Reefs of the Eastern Tropical Pacific: Persistence and Loss in a Dynamic Environment, p. 59-83. Springer, Netherlands. Fiedler, P.C. 2002. Environmental change in the eastern tropical Pacific Ocean: review of ENSO and decadal variability. Administrative Report LJ-02-16. Southwest Fisheries Science Center. Pages 38. National Marine Fisheries Service, NOAA, La Jolla, CA.
IATTC-98-01 - Fisheries, stocks, and the ecosystem in the EPO in 2020 124
Fu, D., M.-J. Roux, S. Clarke, M. Francis, A. Dunn, S. Hoyle, and C. Edwards. 2018. Pacific-wide sustainability risk assessment of bigeye thresher shark (Alopias superciliosus). WCPFC-SC13-2017/SA-WP-11. Rev 3 (11 April 2018). Western and Central Pacific Fisheries Commission. Scientific Committee Thirteenth Regular Session, Rarotonga, Cook Islands. Hare, S.R., and N.J. Mantua. 2000. Empirical evidence for North Pacific regime shifts in 1977 and 1989. Progress in Oceanography 47: 103-145. Hobday, A.J., and J.R. Hartog. 2014. Derived Ocean Features for Dynamic Ocean Management. Oceanography 27(4): 134-145. Lennert-Cody, C.E., S.C. Clarke, A. Aires-da-Silva, M.N. Maunder, P.J.S. Franks, M.H. Román, A.J. Miller, and M. Minami. 2018. The importance of environment and life stage on interpretation of silky shark relative abundance indices for the equatorial Pacific Ocean Fisheries Oceanography: 1-11 Mantua, N.J., S.R. Hare, Y. Zhang, J.M. Wallace, and R.C. Francis. 1997. A Pacific interdecadal climate oscillation with impacts on salmon production. Bulletin of the American Meteorological Society 78: 1069-1079. Martínez-Ortiz, J., A. Aires-da-Silva, C.E. Lennert-Cody, and M.N. Maunder. 2015. The Ecuadorian artisanal fishery for large pelagics: species composition and spatio-temporal dynamics. PLoS ONE 10(8): e0135136.
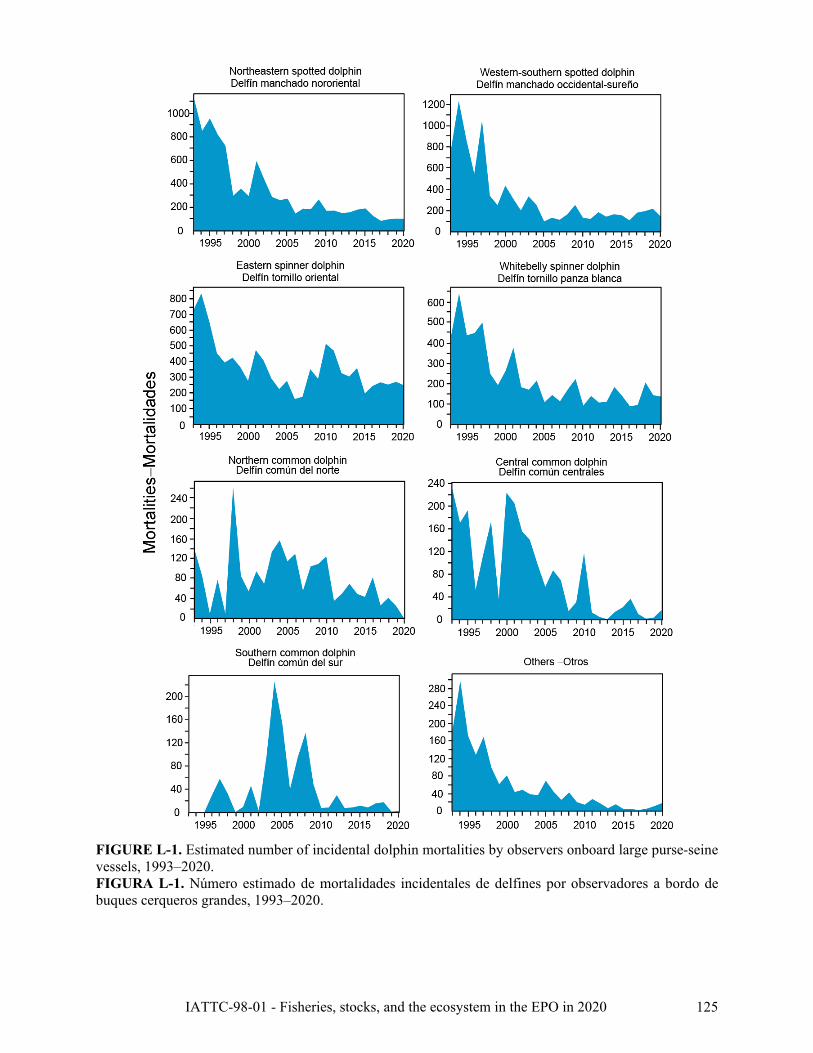
IATTC-98-01 - Fisheries, stocks, and the ecosystem in the EPO in 2020 125
FIGURE L-1. Estimated number of incidental dolphin mortalities by observers onboard large purse-seine vessels, 1993–2020. FIGURA L-1. Número estimado de mortalidades incidentales de delfines por observadores a bordo de buques cerqueros grandes, 1993–2020.
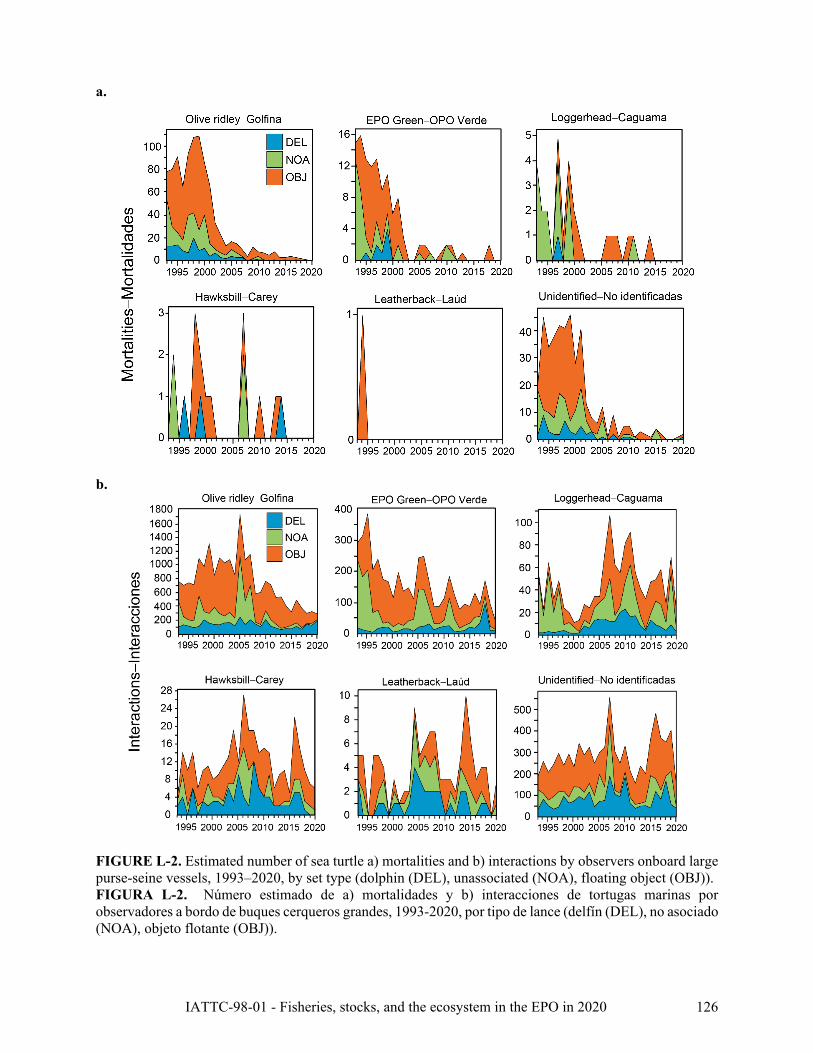
IATTC-98-01 - Fisheries, stocks, and the ecosystem in the EPO in 2020 126
a.
b.
FIGURE L-2. Estimated number of sea turtle a) mortalities and b) interactions by observers onboard large purse-seine vessels, 1993–2020, by set type (dolphin (DEL), unassociated (NOA), floating object (OBJ)). FIGURA L-2. Número estimado de a) mortalidades y b) interacciones de tortugas marinas por observadores a bordo de buques cerqueros grandes, 1993-2020, por tipo de lance (delfín (DEL), no asociado (NOA), objeto flotante (OBJ)).
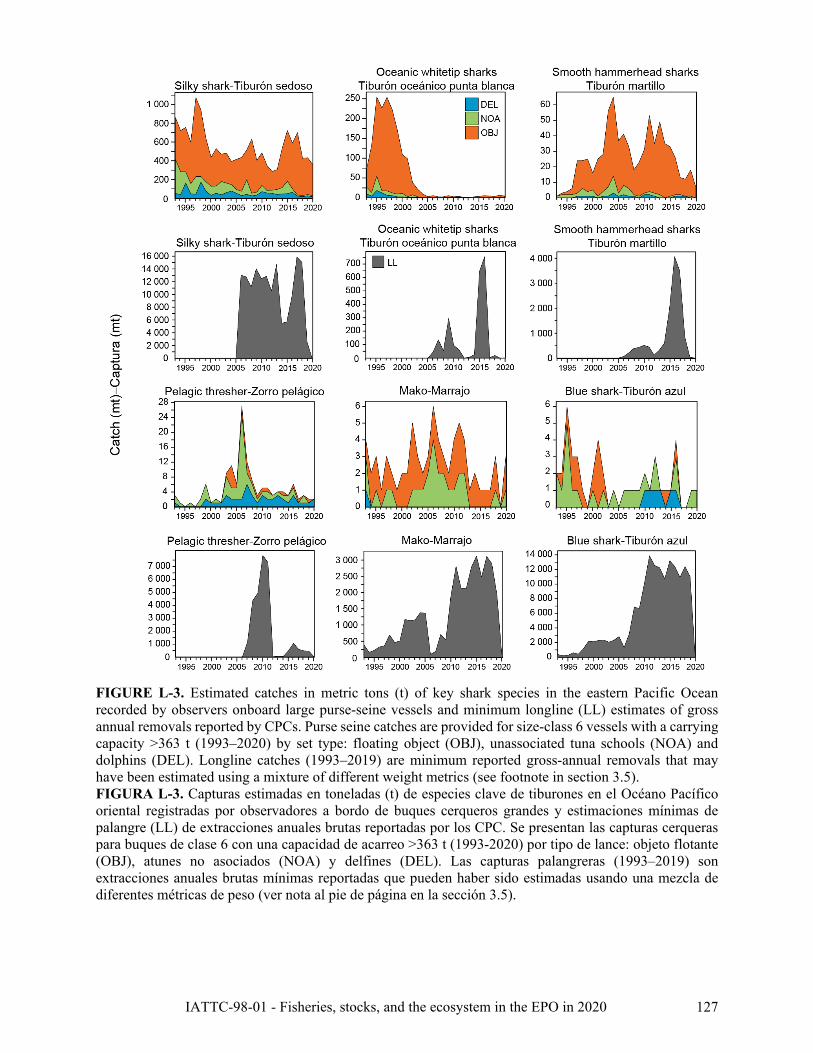
IATTC-98-01 - Fisheries, stocks, and the ecosystem in the EPO in 2020 127
FIGURE L-3. Estimated catches in metric tons (t) of key shark species in the eastern Pacific Ocean recorded by observers onboard large purse-seine vessels and minimum longline (LL) estimates of gross annual removals reported by CPCs. Purse seine catches are provided for size-class 6 vessels with a carrying capacity >363 t (1993–2020) by set type: floating object (OBJ), unassociated tuna schools (NOA) and dolphins (DEL). Longline catches (1993–2019) are minimum reported gross-annual removals that may have been estimated using a mixture of different weight metrics (see footnote in section 3.5). FIGURA L-3. Capturas estimadas en toneladas (t) de especies clave de tiburones en el Océano Pacífico oriental registradas por observadores a bordo de buques cerqueros grandes y estimaciones mínimas de palangre (LL) de extracciones anuales brutas reportadas por los CPC. Se presentan las capturas cerqueras para buques de clase 6 con una capacidad de acarreo >363 t (1993-2020) por tipo de lance: objeto flotante (OBJ), atunes no asociados (NOA) y delfines (DEL). Las capturas palangreras (1993–2019) son extracciones anuales brutas mínimas reportadas que pueden haber sido estimadas usando una mezcla de diferentes métricas de peso (ver nota al pie de página en la sección 3.5).
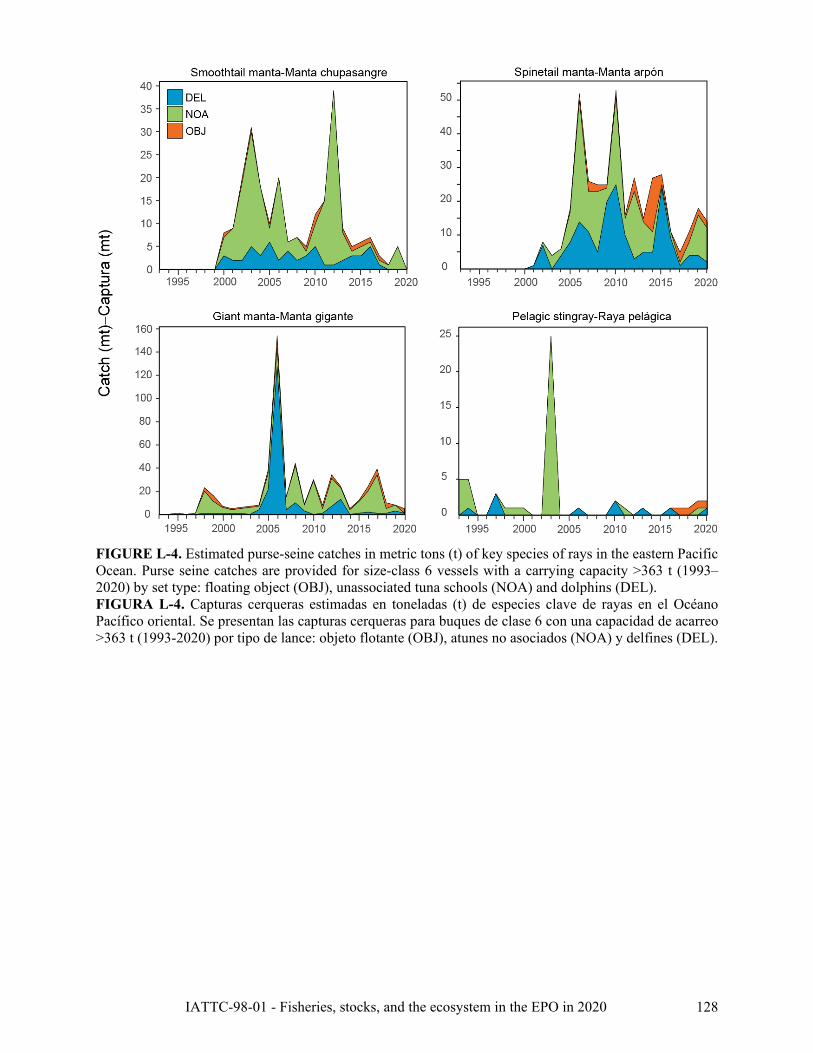
IATTC-98-01 - Fisheries, stocks, and the ecosystem in the EPO in 2020 128
FIGURE L-4. Estimated purse-seine catches in metric tons (t) of key species of rays in the eastern Pacific Ocean. Purse seine catches are provided for size-class 6 vessels with a carrying capacity >363 t (1993–2020) by set type: floating object (OBJ), unassociated tuna schools (NOA) and dolphins (DEL). FIGURA L-4. Capturas cerqueras estimadas en toneladas (t) de especies clave de rayas en el Océano Pacífico oriental. Se presentan las capturas cerqueras para buques de clase 6 con una capacidad de acarreo >363 t (1993-2020) por tipo de lance: objeto flotante (OBJ), atunes no asociados (NOA) y delfines (DEL).

IATTC-98-01 - Fisheries, stocks, and the ecosystem in the EPO in 2020 129
FIGURE L-5. Estimated purse-seine and longline catches in metric tons (t) of key species of large fishes in the eastern Pacific Ocean. Purse seine catches are provided for size-class 6 vessels with a carrying capacity >363 t (1993–2020) by set type: floating object (OBJ), unassociated tuna schools (NOA) and dolphins (DEL). Longline (LL) catches (1993–2019) are minimum reported gross-annual removals. FIGURA L-5. Capturas cerqueras y palangreras estimadas en toneladas (t) de especies clave de peces grandes en el Océano Pacífico oriental. Se presentan las capturas cerqueras para buques de clase 6 con una capacidad de acarreo >363 t (1993-2020) por tipo de lance: objeto flotante (OBJ), atunes no asociados (NOA) y delfines (DEL). Las capturas palangreras (LL) (1993–2019) son extracciones anuales brutas mínimas reportadas.
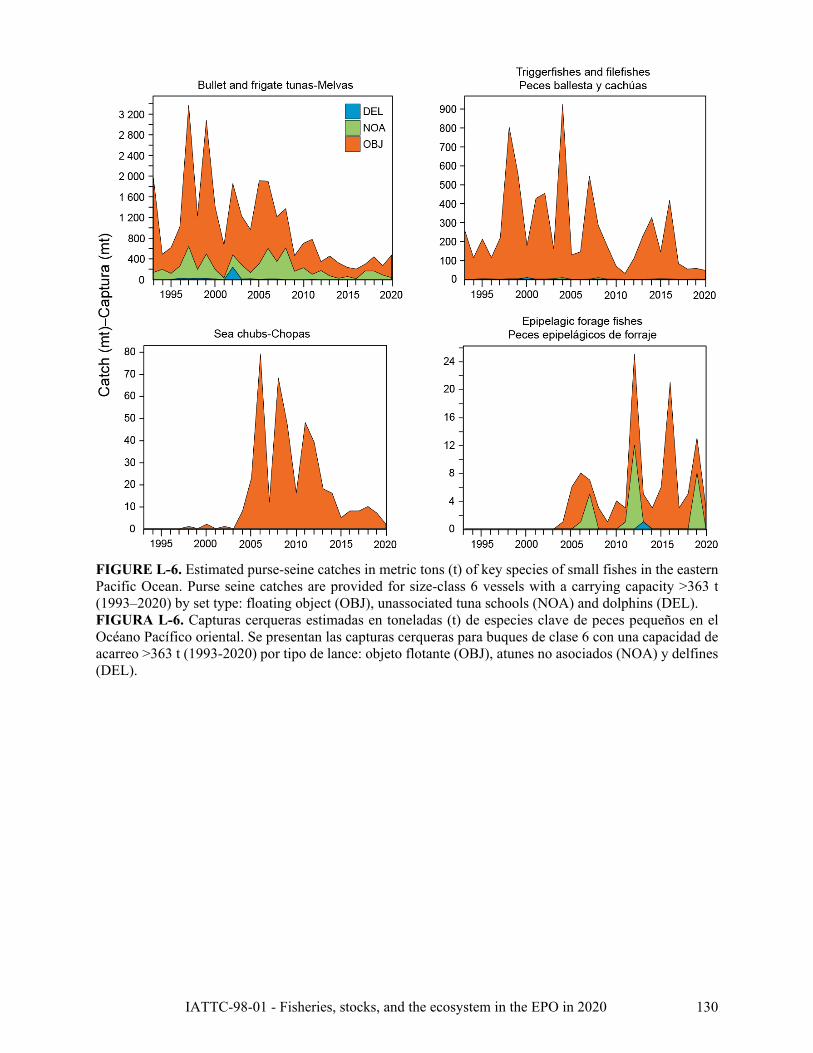
IATTC-98-01 - Fisheries, stocks, and the ecosystem in the EPO in 2020 130
FIGURE L-6. Estimated purse-seine catches in metric tons (t) of key species of small fishes in the eastern Pacific Ocean. Purse seine catches are provided for size-class 6 vessels with a carrying capacity >363 t (1993–2020) by set type: floating object (OBJ), unassociated tuna schools (NOA) and dolphins (DEL). FIGURA L-6. Capturas cerqueras estimadas en toneladas (t) de especies clave de peces pequeños en el Océano Pacífico oriental. Se presentan las capturas cerqueras para buques de clase 6 con una capacidad de acarreo >363 t (1993-2020) por tipo de lance: objeto flotante (OBJ), atunes no asociados (NOA) y delfines (DEL).

IATTC-98-01 - Fisheries, stocks, and the ecosystem in the EPO in 2020 131
FIGURE L-10. Mean sea surface temperature (SST) for each quarter during 2020 with catches of tropical tunas overlaid. SST data obtained from NOAA NMFS SWFSC ERD on January 15, 2021, “Multi-scale Ultra-high Resolution (MUR) SST Analysis fv04.1, Global, 0.01°, 2002–present, Monthly”, https://coastwatch.pfeg.noaa.gov/erddap/info/jplMURSST41mday/index.html. FIGURA L-10. Temperatura superficial del mar (TSM) promedio para cada trimestre de 2020 con las capturas de atunes tropicales superpuestas. Datos de TSM obtenidos de NOAA NMFS SWFSC ERD el 15 de enero de 2021, “Multi-scale Ultra-high Resolution (MUR) SST Analysis fv04.1, Global, 0.01°, 2002–present, Monthly”, https://coastwatch.pfeg.noaa.gov/erddap/info/jplMURSST41mday/index.html.

IATTC-98-01 - Fisheries, stocks, and the ecosystem in the EPO in 2020 132
FIGURE L-11. Mean log chlorophyll-a concentration (in mg m3) for each quarter during 2020 with catches of tropical tunas overlaid. Chlorophyll data obtained from NOAA CoastWatch on January 25, 2021, “Chlorophyll, NOAA, VIIRS, Science Quality, Global, Level 3, 2012-present, Monthly”, NOAA NMFS SWFSC ERD, https://coastwatch.pfeg.noaa.gov/erddap/info/nesdisVHNSQchlaMonthly/index.html. FIGURA L-11. Concentración promedio de clorofila-a (en mg m3) para cada trimestre de 2020 con las capturas de atunes tropicales superpuestas. Datos de clorofila obtenidos de NOAA CoastWatch el 25 de enero de 2021, “Chlorophyll, NOAA, VIIRS, Science Quality, Global, Level 3, 2012-present, Monthly”, NOAA NMFS SWFSC ERD, https://coastwatch.pfeg.noaa.gov/erddap/info/nesdisVHNSQchlaMonthly/index.html.

IATTC-98-01 - Fisheries, stocks, and the ecosystem in the EPO in 2020 133
FIGURE L-12. Simplified food-web diagram of the pelagic ecosystem in the tropical EPO. The numbers inside the boxes indicate the approximate trophic level of each group. FIGURA L-12. Diagrama simplificado de la red trófica del ecosistema pelágico en el OPO tropical. Los números en los recuadros indican el nivel trófico aproximado de cada grupo.
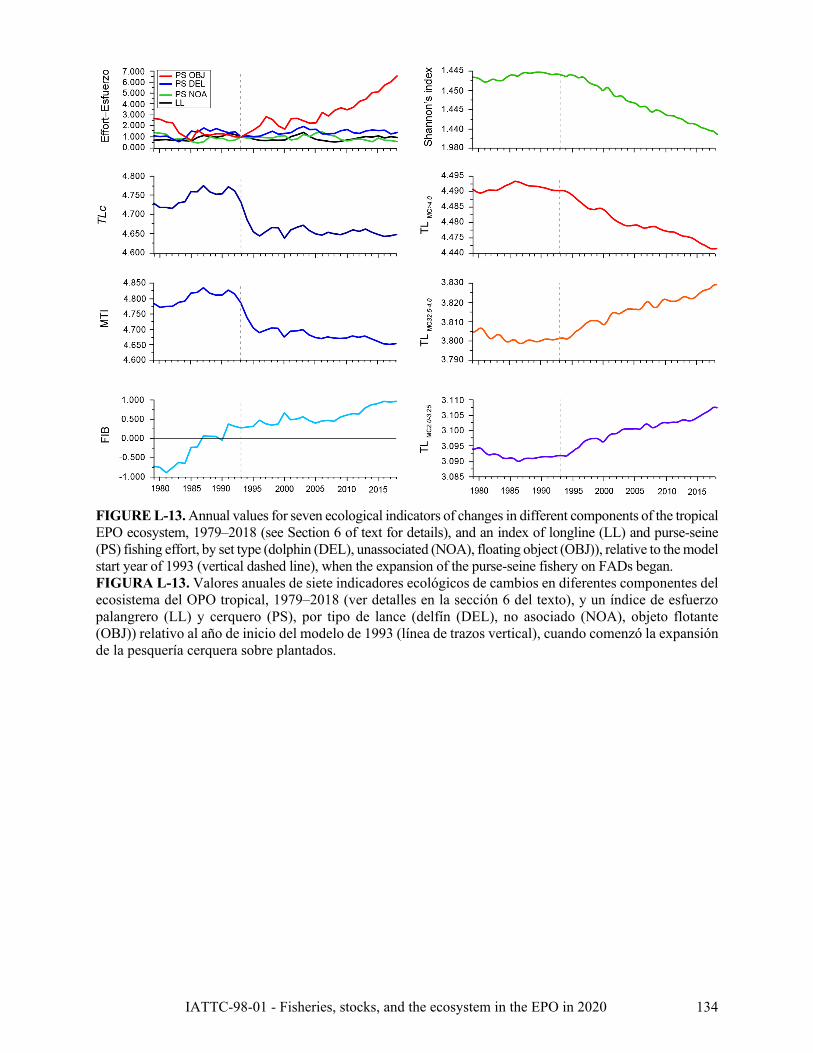
IATTC-98-01 - Fisheries, stocks, and the ecosystem in the EPO in 2020 134
FIGURE L-13. Annual values for seven ecological indicators of changes in different components of the tropical EPO ecosystem, 1979–2018 (see Section 6 of text for details), and an index of longline (LL) and purse-seine (PS) fishing effort, by set type (dolphin (DEL), unassociated (NOA), floating object (OBJ)), relative to the model start year of 1993 (vertical dashed line), when the expansion of the purse-seine fishery on FADs began. FIGURA L-13. Valores anuales de siete indicadores ecológicos de cambios en diferentes componentes del ecosistema del OPO tropical, 1979–2018 (ver detalles en la sección 6 del texto), y un índice de esfuerzo palangrero (LL) y cerquero (PS), por tipo de lance (delfín (DEL), no asociado (NOA), objeto flotante (OBJ)) relativo al año de inicio del modelo de 1993 (línea de trazos vertical), cuando comenzó la expansión de la pesquería cerquera sobre plantados.

IATTC-98-01 - Fisheries, stocks, and the ecosystem in the EPO in 2020 135
Table L-1. Incidental dolphin mortalities in numbers of individuals (Num) and average weights in metric tons (t) by stock in the eastern Pacific Ocean caused by the large vessel purse-seine fishery with a carrying capacity >363 t from 1993–2020. Data for 2020 are considered preliminary. Tabla L-1. Mortalidades incidentales de delfines, en número de individuos (Núm.) y peso promedio en toneladas (t), por población, en el océano Pacífico oriental ocasionadas por la pesquería cerquera de buques grandes con una capacidad de acarreo >363 t de 1993-2020. Los datos de 2020 se consideran preliminares.
Stenella attenuata Stenella longirostris Delphinus delphis Offshore1 Spinner Common
Northeastern Western-
southern Eastern Whitebelly Northern Central Southern Other dolphins
Year Num Wt Num Wt Num Wt Num Wt Num Wt Num Wt Num Wt Num Wt 1993 1,112 56.3 773 44.4 725 34.4 437 22.5 139 9.1 230 15.1 0 0.0 185 8.0 1994 847 42.9 1,228 70.6 828 39.3 640 32.9 85 5.6 170 11.1 0 0.0 298 12.0 1995 952 48.2 859 49.4 654 31.0 436 22.4 9 <1 192 12.6 0 0.0 173 13.0 1996 818 41.4 545 31.3 450 21.3 447 23.0 77 5.0 51 3.3 30 2.0 129 5.0 1997 721 36.5 1,044 60.0 391 18.5 498 25.6 9 <1 114 7.5 58 3.8 170 14.0 1998 298 15.1 341 19.6 422 20.0 249 12.8 261 17.1 172 11.3 33 2.2 100 8.0 1999 358 18.1 253 14.5 363 17.2 192 9.9 85 5.6 34 2.2 1 <1 62 4.0 2000 295 14.9 435 25.0 275 13.0 262 13.5 54 3.5 223 14.6 10 <1 82 5.0 2001 592 30.0 315 18.1 470 22.3 374 19.2 94 6.2 205 13.4 46 3.0 44 <1 2002 435 22.0 203 11.7 403 19.1 182 9.4 69 4.5 155 10.2 3 <1 49 3.0 2003 288 14.6 335 19.3 290 13.8 170 8.7 133 8.7 140 9.2 97 6.4 39 3.0 2004 261 13.2 256 14.7 223 10.6 214 11.0 156 10.2 97 6.4 225 14.7 37 <1 2005 273 13.8 100 5.8 275 13.0 108 5.6 114 7.5 57 3.7 154 10.1 70 3.0 2006 147 7.4 135 7.8 160 7.6 144 7.4 129 8.4 86 5.6 40 2.6 45 2.0 2007 189 9.6 116 6.7 175 8.3 113 5.8 55 3.6 69 4.5 95 6.2 26 <1 2008 184 9.3 167 9.6 349 16.6 171 8.8 104 6.8 14 <1 137 9.0 43 3.0 2009 266 13.5 254 14.6 288 13.7 222 11.4 109 7.1 30 2.0 49 3.2 21 <1 2010 170 8.6 135 7.8 510 24.2 92 4.7 124 8.1 116 7.6 8 <1 15 <1 2011 172 8.7 124 7.1 467 22.1 139 7.1 35 2.3 12 <1 9 <1 28 2.0 2012 151 7.6 187 10.8 324 15.4 107 5.5 49 3.2 4 <1 30 2.0 18 0.0 2013 158 8.0 145 8.3 303 14.4 111 5.7 69 4.5 0 0.0 8 <1 7 <1 2014 181 9.2 168 9.7 356 16.9 183 9.4 49 3.2 13 <1 9 <1 16 <1 2015 191 9.7 158 9.1 196 9.3 139 7.1 43 2.8 21 1.4 12 <1 5 <1 2016 127 6.4 111 6.4 243 11.5 89 4.6 82 5.4 36 2.4 9 <1 5 <1 2017 85 4.3 183 10.5 266 12.6 95 4.9 26 1.7 9 <1 16 1.0 3 <1 2018 99 5.0 197 11.3 252 12.0 205 10.5 41 2.7 1 <1 18 1.2 6 <1 2019 104 5.3 220 12.7 269 12.8 143 7.4 25 1.6 3 <1 2 <1 12 <1 2020 105 5.3 154 8.9 251 11.9 138 7.1 1 <1 17 1.1 3 <1 20 1.1
Total 9,579 485.2 9,141 525.6 10,178 482.7 6,300 323.9 2,226 145.8 2,271 148.8 1,102 72.2 1,708 94.8 1Estimates for offshore spotted dolphins include mortalities of coastal spotted dolphins
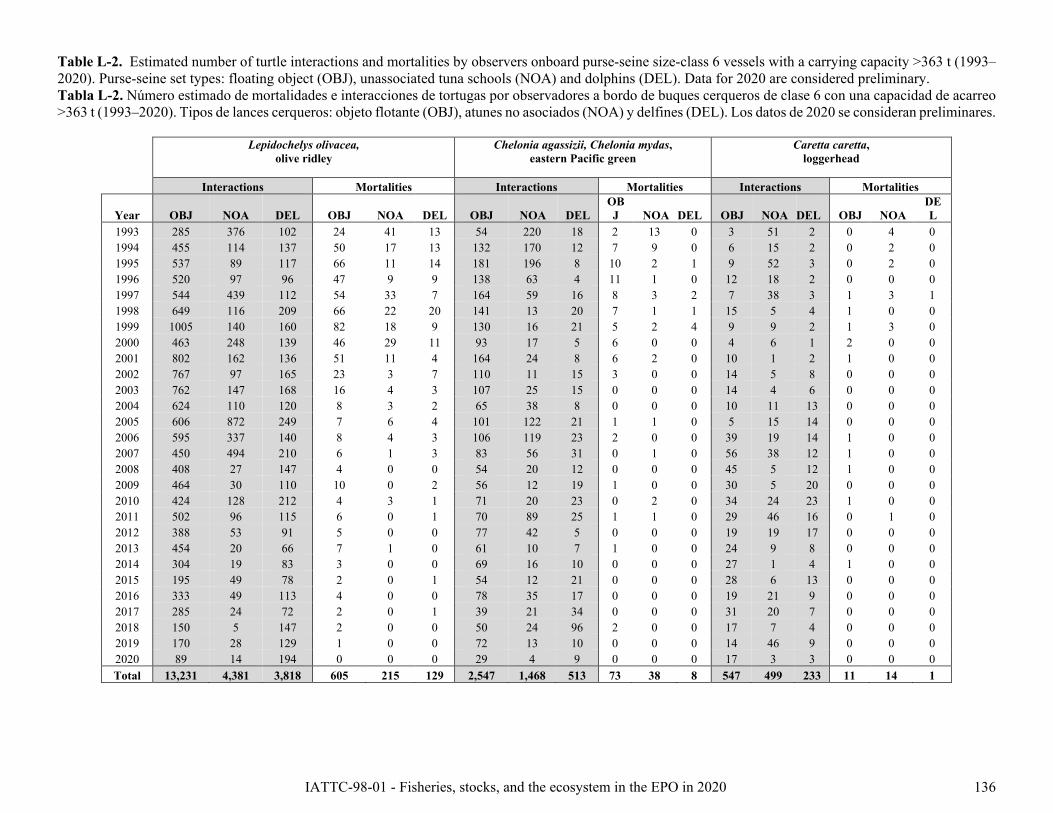
IATTC-98-01 - Fisheries, stocks, and the ecosystem in the EPO in 2020 136
Table L-2. Estimated number of turtle interactions and mortalities by observers onboard purse-seine size-class 6 vessels with a carrying capacity >363 t (1993–2020). Purse-seine set types: floating object (OBJ), unassociated tuna schools (NOA) and dolphins (DEL). Data for 2020 are considered preliminary. Tabla L-2. Número estimado de mortalidades e interacciones de tortugas por observadores a bordo de buques cerqueros de clase 6 con una capacidad de acarreo >363 t (1993–2020). Tipos de lances cerqueros: objeto flotante (OBJ), atunes no asociados (NOA) y delfines (DEL). Los datos de 2020 se consideran preliminares.
Lepidochelys olivacea, olive ridley
Chelonia agassizii, Chelonia mydas, eastern Pacific green
Caretta caretta, loggerhead
Interactions Mortalities Interactions Mortalities Interactions Mortalities
Year OBJ NOA DEL OBJ NOA DEL OBJ NOA DEL OBJ NOA DEL OBJ NOA DEL OBJ NOA
DEL
1993 285 376 102 24 41 13 54 220 18 2 13 0 3 51 2 0 4 0 1994 455 114 137 50 17 13 132 170 12 7 9 0 6 15 2 0 2 0 1995 537 89 117 66 11 14 181 196 8 10 2 1 9 52 3 0 2 0 1996 520 97 96 47 9 9 138 63 4 11 1 0 12 18 2 0 0 0 1997 544 439 112 54 33 7 164 59 16 8 3 2 7 38 3 1 3 1 1998 649 116 209 66 22 20 141 13 20 7 1 1 15 5 4 1 0 0 1999 1005 140 160 82 18 9 130 16 21 5 2 4 9 9 2 1 3 0 2000 463 248 139 46 29 11 93 17 5 6 0 0 4 6 1 2 0 0 2001 802 162 136 51 11 4 164 24 8 6 2 0 10 1 2 1 0 0 2002 767 97 165 23 3 7 110 11 15 3 0 0 14 5 8 0 0 0 2003 762 147 168 16 4 3 107 25 15 0 0 0 14 4 6 0 0 0 2004 624 110 120 8 3 2 65 38 8 0 0 0 10 11 13 0 0 0 2005 606 872 249 7 6 4 101 122 21 1 1 0 5 15 14 0 0 0 2006 595 337 140 8 4 3 106 119 23 2 0 0 39 19 14 1 0 0 2007 450 494 210 6 1 3 83 56 31 0 1 0 56 38 12 1 0 0 2008 408 27 147 4 0 0 54 20 12 0 0 0 45 5 12 1 0 0 2009 464 30 110 10 0 2 56 12 19 1 0 0 30 5 20 0 0 0 2010 424 128 212 4 3 1 71 20 23 0 2 0 34 24 23 1 0 0 2011 502 96 115 6 0 1 70 89 25 1 1 0 29 46 16 0 1 0 2012 388 53 91 5 0 0 77 42 5 0 0 0 19 19 17 0 0 0 2013 454 20 66 7 1 0 61 10 7 1 0 0 24 9 8 0 0 0 2014 304 19 83 3 0 0 69 16 10 0 0 0 27 1 4 1 0 0 2015 195 49 78 2 0 1 54 12 21 0 0 0 28 6 13 0 0 0 2016 333 49 113 4 0 0 78 35 17 0 0 0 19 21 9 0 0 0 2017 285 24 72 2 0 1 39 21 34 0 0 0 31 20 7 0 0 0 2018 150 5 147 2 0 0 50 24 96 2 0 0 17 7 4 0 0 0 2019 170 28 129 1 0 0 72 13 10 0 0 0 14 46 9 0 0 0 2020 89 14 194 0 0 0 29 4 9 0 0 0 17 3 3 0 0 0 Total 13,231 4,381 3,818 605 215 129 2,547 1,468 513 73 38 8 547 499 233 11 14 1
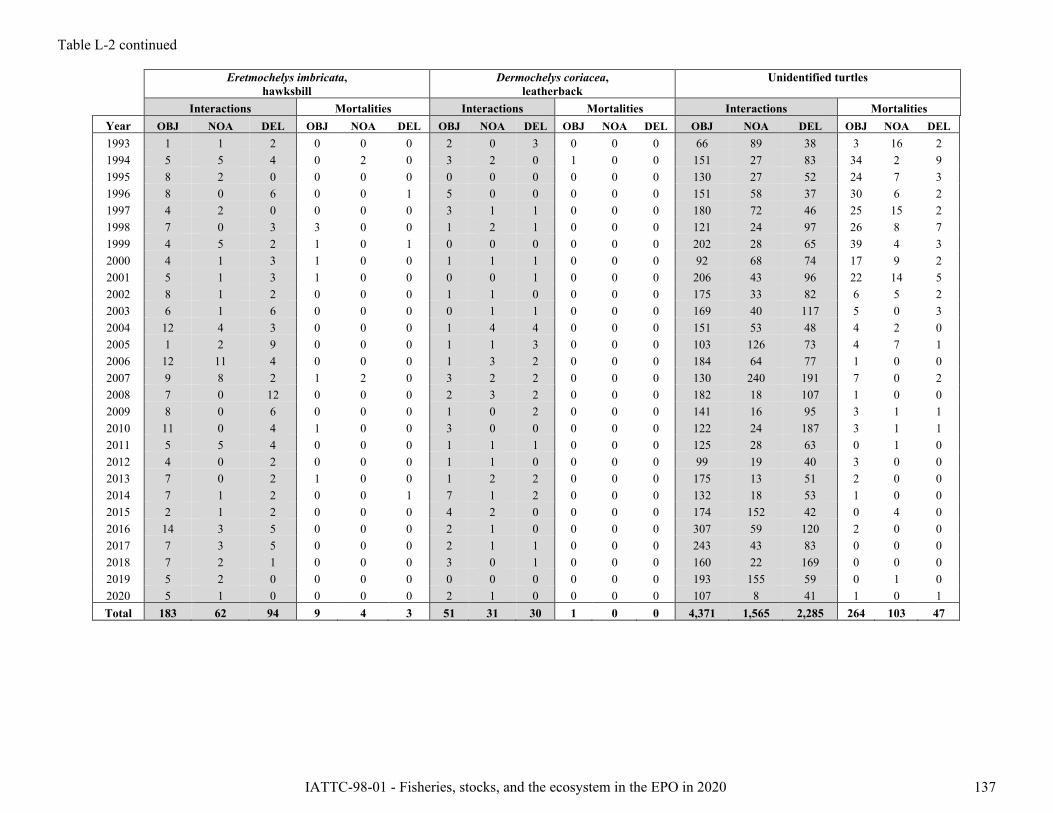
IATTC-98-01 - Fisheries, stocks, and the ecosystem in the EPO in 2020 137
Table L-2 continued
Eretmochelys imbricata, hawksbill
Dermochelys coriacea, leatherback
Unidentified turtles
Interactions Mortalities Interactions Mortalities Interactions Mortalities Year OBJ NOA DEL OBJ NOA DEL OBJ NOA DEL OBJ NOA DEL OBJ NOA DEL OBJ NOA DEL 1993 1 1 2 0 0 0 2 0 3 0 0 0 66 89 38 3 16 2 1994 5 5 4 0 2 0 3 2 0 1 0 0 151 27 83 34 2 9 1995 8 2 0 0 0 0 0 0 0 0 0 0 130 27 52 24 7 3 1996 8 0 6 0 0 1 5 0 0 0 0 0 151 58 37 30 6 2 1997 4 2 0 0 0 0 3 1 1 0 0 0 180 72 46 25 15 2 1998 7 0 3 3 0 0 1 2 1 0 0 0 121 24 97 26 8 7 1999 4 5 2 1 0 1 0 0 0 0 0 0 202 28 65 39 4 3 2000 4 1 3 1 0 0 1 1 1 0 0 0 92 68 74 17 9 2 2001 5 1 3 1 0 0 0 0 1 0 0 0 206 43 96 22 14 5 2002 8 1 2 0 0 0 1 1 0 0 0 0 175 33 82 6 5 2 2003 6 1 6 0 0 0 0 1 1 0 0 0 169 40 117 5 0 3 2004 12 4 3 0 0 0 1 4 4 0 0 0 151 53 48 4 2 0 2005 1 2 9 0 0 0 1 1 3 0 0 0 103 126 73 4 7 1 2006 12 11 4 0 0 0 1 3 2 0 0 0 184 64 77 1 0 0 2007 9 8 2 1 2 0 3 2 2 0 0 0 130 240 191 7 0 2 2008 7 0 12 0 0 0 2 3 2 0 0 0 182 18 107 1 0 0 2009 8 0 6 0 0 0 1 0 2 0 0 0 141 16 95 3 1 1 2010 11 0 4 1 0 0 3 0 0 0 0 0 122 24 187 3 1 1 2011 5 5 4 0 0 0 1 1 1 0 0 0 125 28 63 0 1 0 2012 4 0 2 0 0 0 1 1 0 0 0 0 99 19 40 3 0 0 2013 7 0 2 1 0 0 1 2 2 0 0 0 175 13 51 2 0 0 2014 7 1 2 0 0 1 7 1 2 0 0 0 132 18 53 1 0 0 2015 2 1 2 0 0 0 4 2 0 0 0 0 174 152 42 0 4 0 2016 14 3 5 0 0 0 2 1 0 0 0 0 307 59 120 2 0 0 2017 7 3 5 0 0 0 2 1 1 0 0 0 243 43 83 0 0 0 2018 7 2 1 0 0 0 3 0 1 0 0 0 160 22 169 0 0 0 2019 5 2 0 0 0 0 0 0 0 0 0 0 193 155 59 0 1 0 2020 5 1 0 0 0 0 2 1 0 0 0 0 107 8 41 1 0 1 Total 183 62 94 9 4 3 51 31 30 1 0 0 4,371 1,565 2,285 264 103 47

IATTC-98-01 - Fisheries, stocks, and the ecosystem in the EPO in 2020 138
Table L-3. Estimated purse-seine catches by set type in metric tons (t) of sharks by observers onboard size-class 6 vessels with a carrying capacity >363 t (1993–2020) and minimum reported longline (LL) catches of sharks (gross-annual removals in t) (1993–2019, *data not available). Purse-seine set types: floating object (OBJ), unassociated tuna schools (NOA) and dolphins (DEL). Species highlighted bold are discussed in main text. Data for 2019 (longline) and 2020 (purse-seine) are considered preliminary. “Other sharks” include whale shark (Rhincodon typus), basking shark (Cetorhinus maximus) and unidentified sharks (Euselachii). Tabla L-3. Capturas cerqueras estimadas de tiburones, por tipo de lance, en toneladas (t), por observadores a bordo de buques de clase 6 con una capacidad de acarreo >363 t (1993–2020) y capturas palangreras (LL) mínimas reportadas de tiburones (extracciones anuales brutas en t) (1993–2019, *datos no disponibles). Tipos de lances cerqueros: objeto flotante (OBJ), atunes no asociados (NOA) y delfines (DEL). Las especies en negritas se discuten en el texto principal. Los datos de 2019 (palangre) y 2020 (cerco) se consideran preliminares. “Otros tiburones” incluyen el tiburón ballena (Rhincodon typus), el tiburón peregrino (Cetorhinus maximus) y tiburones (Euselachii) no identificados.
Carcharhinidae
Carcharhinus falciformis, silky shark
Carcharhinus longimanus, oceanic whitetip
Prionace glauca, blue shark
Other Carcharhinidae, requiem sharks
Purse seine Purse seine
Purse seine Purse seine Year OBJ NOA DEL LL OBJ NOA DEL LL OBJ NOA DEL LL OBJ NOA DEL LL 1993 447 360 51 - 44 18 9 - <1 2 <1 360 2 5 3 - 1994 439 244 38 - 119 9 4 - <1 1 <1 209 24 14 5 - 1995 471 120 162 - 200 36 18 - <1 5 <1 280 4 2 11 - 1996 442 107 47 - 209 5 12 - 2 <1 <1 606 12 <1 7 - 1997 843 188 42 - 236 11 6 - 2 <1 <1 425 18 3 5 - 1998 710 59 171 - 211 7 5 - 1 <1 <1 1,164 4 <1 <1 - 1999 460 100 74 - 163 7 2 - <1 <1 <1 2,185 9 <1 <1 - 2000 308 97 30 - 98 9 2 - <1 <1 <1 2,112 5 <1 <1 - 2001 399 76 53 - 96 <1 <1 - 4 <1 <1 2,304 9 <1 - - 2002 291 142 35 - 31 6 <1 <1 1 <1 <1 2,356 4 17 <1 - 2003 320 102 59 - 19 <1 <1 - <1 <1 <1 2,054 7 6 <1 - 2004 247 68 76 - 9 <1 <1 <1 <1 <1 - 2,325 5 3 <1 - 2005 322 41 51 - 2 - <1 - <1 <1 - 2,825 4 2 3 - 2006 361 46 27 13,053 5 <1 <1 46 <1 1 <1 1,341 13 3 8 280 2007 316 156 41 12,771 2 - <1 136 <1 1 - 3,169 8 24 11 419 2008 577 27 25 11,205 2 - <1 55 <1 1 <1 6,838 11 <1 1 741 2009 339 31 33 14,042 4 <1 <1 294 <1 <1 <1 6,678 29 4 20 431 2010 347 66 70 12,510 2 - <1 94 <1 1 1 10,130 17 10 21 4,259 2011 266 26 55 12,866 2 - <1 63 <1 <1 1 13,863 20 6 4 4,730 2012 200 33 52 10,585 <1 <1 - 1 <1 2 <1 12,565 8 <1 1 4,082 2013 212 55 38 14,762 <1 <1 - 5 <1 <1 1 12,237 12 2 3 753 2014 422 68 45 5,511 2 - - 25 1 <1 <1 10,728 13 <1 5 1,515 2015 540 133 48 5,690 3 <1 <1 647 <1 <1 <1 13,194 31 7 2 1,901 2016 488 36 63 9,610 5 <1 <1 755 <1 2 1 12,381 35 <1 3 2,755 2017 665 12 21 15,893 4 <1 <1 3 <1 <1 - 10,931 54 <1 2 2,562 2018 397 12 16 15,072 3 - <1 19 <1 <1 <1 12,394 28 3 1 1,360 2019 392 13 25 2,600 5 <1 <1 - <1 <1 <1 11,012 26 4 6 10 2020 332 12 14 * 4 - <1 * <1 <1 - * 87 5 4 *
Total 11,556 2,431 1,462 156,170 1,482 111 64 2143 19 24 9 156,668 498 128 130 25,799
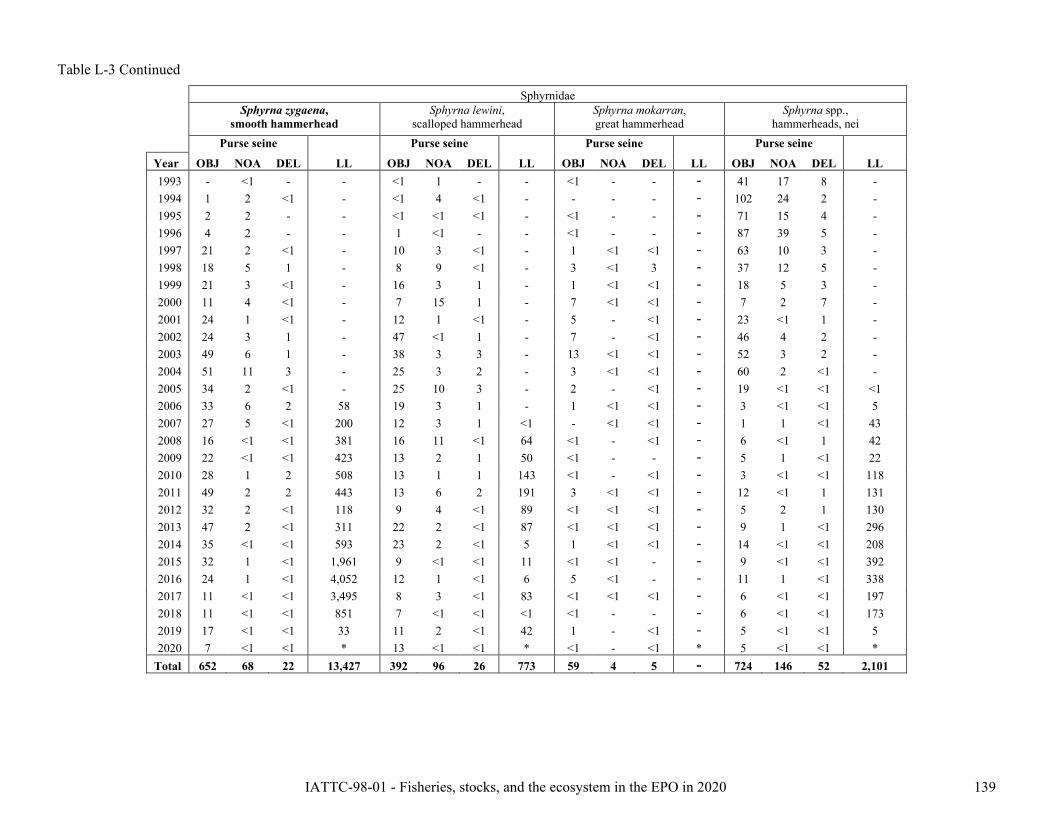
IATTC-98-01 - Fisheries, stocks, and the ecosystem in the EPO in 2020 139
Table L-3 Continued
Sphyrnidae
Sphyrna zygaena, smooth hammerhead
Sphyrna lewini, scalloped hammerhead
Sphyrna mokarran, great hammerhead
Sphyrna spp., hammerheads, nei
Purse seine
Purse seine
Purse seine
Purse seine
Year OBJ NOA DEL LL OBJ NOA DEL LL OBJ NOA DEL LL OBJ NOA DEL LL 1993 - <1 - - <1 1 - - <1 - - - 41 17 8 - 1994 1 2 <1 - <1 4 <1 - - - - - 102 24 2 - 1995 2 2 - - <1 <1 <1 - <1 - - - 71 15 4 - 1996 4 2 - - 1 <1 - - <1 - - - 87 39 5 - 1997 21 2 <1 - 10 3 <1 - 1 <1 <1 - 63 10 3 - 1998 18 5 1 - 8 9 <1 - 3 <1 3 - 37 12 5 - 1999 21 3 <1 - 16 3 1 - 1 <1 <1 - 18 5 3 - 2000 11 4 <1 - 7 15 1 - 7 <1 <1 - 7 2 7 - 2001 24 1 <1 - 12 1 <1 - 5 - <1 - 23 <1 1 - 2002 24 3 1 - 47 <1 1 - 7 - <1 - 46 4 2 - 2003 49 6 1 - 38 3 3 - 13 <1 <1 - 52 3 2 - 2004 51 11 3 - 25 3 2 - 3 <1 <1 - 60 2 <1 - 2005 34 2 <1 - 25 10 3 - 2 - <1 - 19 <1 <1 <1 2006 33 6 2 58 19 3 1 - 1 <1 <1 - 3 <1 <1 5 2007 27 5 <1 200 12 3 1 <1 - <1 <1 - 1 1 <1 43 2008 16 <1 <1 381 16 11 <1 64 <1 - <1 - 6 <1 1 42 2009 22 <1 <1 423 13 2 1 50 <1 - - - 5 1 <1 22 2010 28 1 2 508 13 1 1 143 <1 - <1 - 3 <1 <1 118 2011 49 2 2 443 13 6 2 191 3 <1 <1 - 12 <1 1 131 2012 32 2 <1 118 9 4 <1 89 <1 <1 <1 - 5 2 1 130 2013 47 2 <1 311 22 2 <1 87 <1 <1 <1 - 9 1 <1 296 2014 35 <1 <1 593 23 2 <1 5 1 <1 <1 - 14 <1 <1 208 2015 32 1 <1 1,961 9 <1 <1 11 <1 <1 - - 9 <1 <1 392 2016 24 1 <1 4,052 12 1 <1 6 5 <1 - - 11 1 <1 338 2017 11 <1 <1 3,495 8 3 <1 83 <1 <1 <1 - 6 <1 <1 197 2018 11 <1 <1 851 7 <1 <1 <1 <1 - - - 6 <1 <1 173 2019 17 <1 <1 33 11 2 <1 42 1 - <1 - 5 <1 <1 5 2020 7 <1 <1 * 13 <1 <1 * <1 - <1 * 5 <1 <1 *
Total 652 68 22 13,427 392 96 26 773 59 4 5 - 724 146 52 2,101
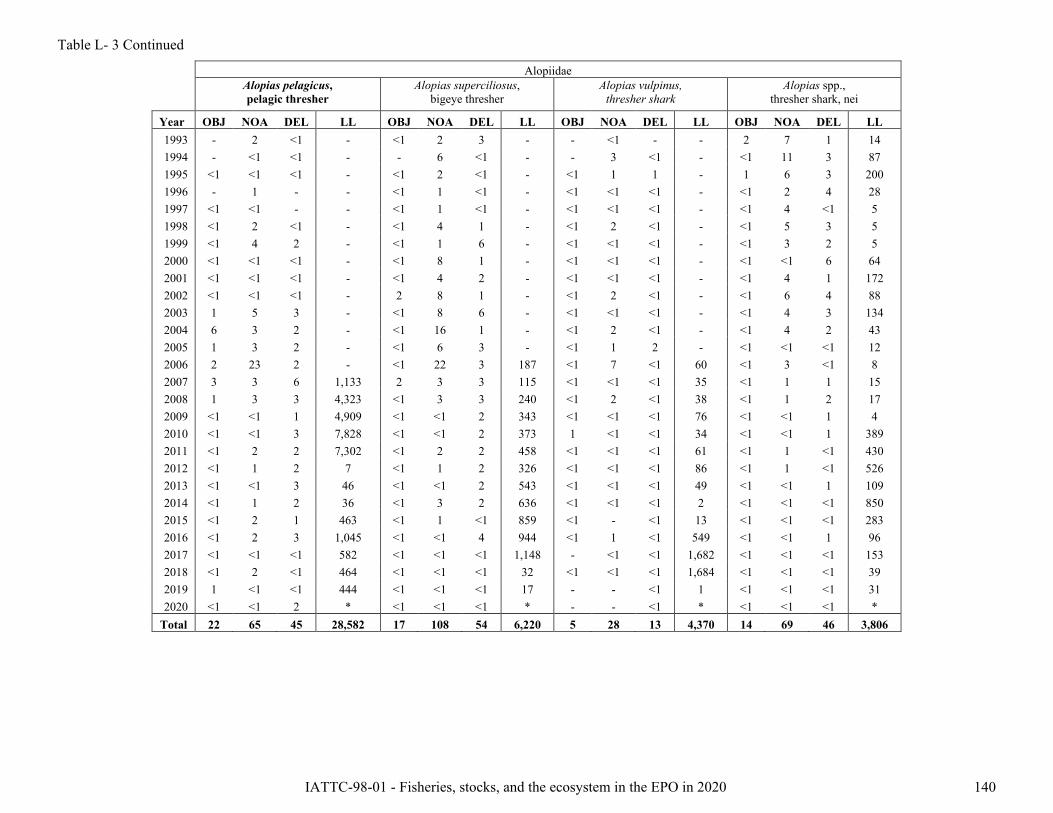
IATTC-98-01 - Fisheries, stocks, and the ecosystem in the EPO in 2020 140
Table L- 3 Continued
Alopiidae
Alopias pelagicus, pelagic thresher
Alopias superciliosus, bigeye thresher
Alopias vulpinus, thresher shark
Alopias spp., thresher shark, nei
Year OBJ NOA DEL LL OBJ NOA DEL LL OBJ NOA DEL LL OBJ NOA DEL LL 1993 - 2 <1 - <1 2 3 - - <1 - - 2 7 1 14 1994 - <1 <1 - - 6 <1 - - 3 <1 - <1 11 3 87 1995 <1 <1 <1 - <1 2 <1 - <1 1 1 - 1 6 3 200 1996 - 1 - - <1 1 <1 - <1 <1 <1 - <1 2 4 28 1997 <1 <1 - - <1 1 <1 - <1 <1 <1 - <1 4 <1 5 1998 <1 2 <1 - <1 4 1 - <1 2 <1 - <1 5 3 5 1999 <1 4 2 - <1 1 6 - <1 <1 <1 - <1 3 2 5 2000 <1 <1 <1 - <1 8 1 - <1 <1 <1 - <1 <1 6 64 2001 <1 <1 <1 - <1 4 2 - <1 <1 <1 - <1 4 1 172 2002 <1 <1 <1 - 2 8 1 - <1 2 <1 - <1 6 4 88 2003 1 5 3 - <1 8 6 - <1 <1 <1 - <1 4 3 134 2004 6 3 2 - <1 16 1 - <1 2 <1 - <1 4 2 43 2005 1 3 2 - <1 6 3 - <1 1 2 - <1 <1 <1 12 2006 2 23 2 - <1 22 3 187 <1 7 <1 60 <1 3 <1 8 2007 3 3 6 1,133 2 3 3 115 <1 <1 <1 35 <1 1 1 15 2008 1 3 3 4,323 <1 3 3 240 <1 2 <1 38 <1 1 2 17 2009 <1 <1 1 4,909 <1 <1 2 343 <1 <1 <1 76 <1 <1 1 4 2010 <1 <1 3 7,828 <1 <1 2 373 1 <1 <1 34 <1 <1 1 389 2011 <1 2 2 7,302 <1 2 2 458 <1 <1 <1 61 <1 1 <1 430 2012 <1 1 2 7 <1 1 2 326 <1 <1 <1 86 <1 1 <1 526 2013 <1 <1 3 46 <1 <1 2 543 <1 <1 <1 49 <1 <1 1 109 2014 <1 1 2 36 <1 3 2 636 <1 <1 <1 2 <1 <1 <1 850 2015 <1 2 1 463 <1 1 <1 859 <1 - <1 13 <1 <1 <1 283 2016 <1 2 3 1,045 <1 <1 4 944 <1 1 <1 549 <1 <1 1 96 2017 <1 <1 <1 582 <1 <1 <1 1,148 - <1 <1 1,682 <1 <1 <1 153 2018 <1 2 <1 464 <1 <1 <1 32 <1 <1 <1 1,684 <1 <1 <1 39 2019 1 <1 <1 444 <1 <1 <1 17 - - <1 1 <1 <1 <1 31 2020 <1 <1 2 * <1 <1 <1 * - - <1 * <1 <1 <1 *
Total 22 65 45 28,582 17 108 54 6,220 5 28 13 4,370 14 69 46 3,806
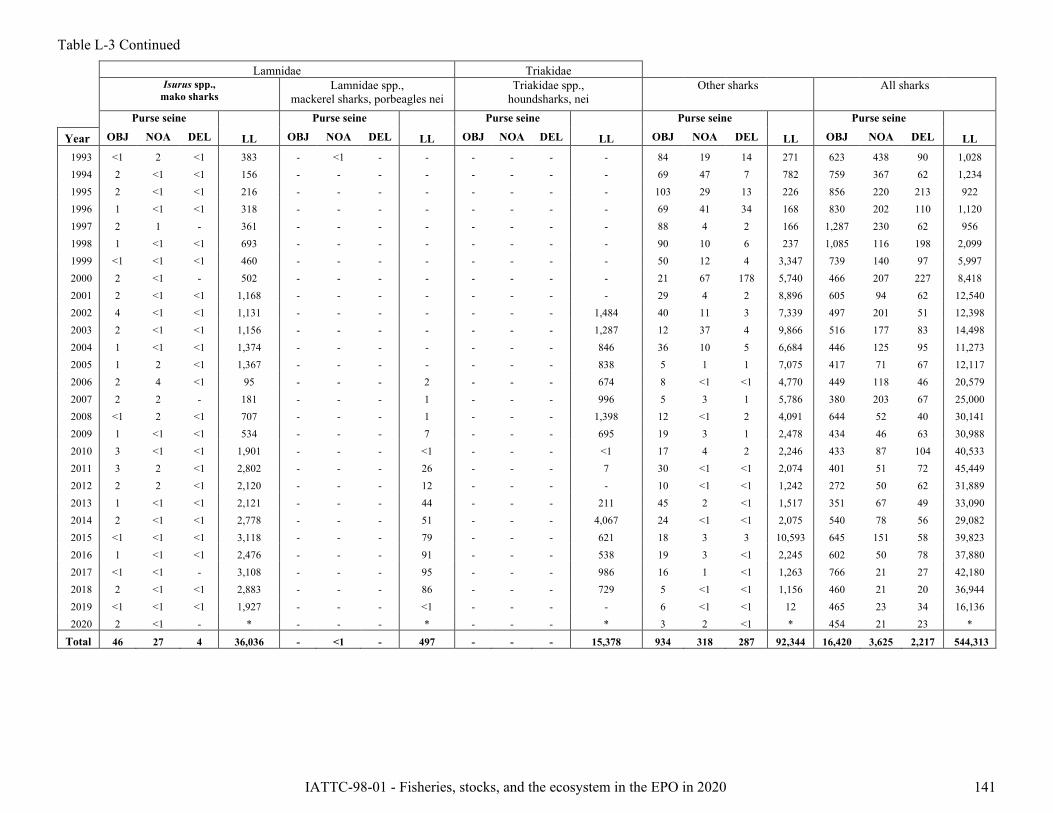
IATTC-98-01 - Fisheries, stocks, and the ecosystem in the EPO in 2020 141
Table L-3 Continued
Lamnidae Triakidae
Isurus spp., mako sharks
Lamnidae spp., mackerel sharks, porbeagles nei
Triakidae spp., houndsharks, nei
Other sharks All sharks
Purse seine Purse seine Purse seine Purse seine Purse seine
Year OBJ NOA DEL LL OBJ NOA DEL LL OBJ NOA DEL LL OBJ NOA DEL LL OBJ NOA DEL LL 1993 <1 2 <1 383 - <1 - - - - - - 84 19 14 271 623 438 90 1,028 1994 2 <1 <1 156 - - - - - - - - 69 47 7 782 759 367 62 1,234 1995 2 <1 <1 216 - - - - - - - - 103 29 13 226 856 220 213 922 1996 1 <1 <1 318 - - - - - - - - 69 41 34 168 830 202 110 1,120 1997 2 1 - 361 - - - - - - - - 88 4 2 166 1,287 230 62 956 1998 1 <1 <1 693 - - - - - - - - 90 10 6 237 1,085 116 198 2,099 1999 <1 <1 <1 460 - - - - - - - - 50 12 4 3,347 739 140 97 5,997 2000 2 <1 - 502 - - - - - - - - 21 67 178 5,740 466 207 227 8,418 2001 2 <1 <1 1,168 - - - - - - - - 29 4 2 8,896 605 94 62 12,540 2002 4 <1 <1 1,131 - - - - - - - 1,484 40 11 3 7,339 497 201 51 12,398 2003 2 <1 <1 1,156 - - - - - - - 1,287 12 37 4 9,866 516 177 83 14,498 2004 1 <1 <1 1,374 - - - - - - - 846 36 10 5 6,684 446 125 95 11,273 2005 1 2 <1 1,367 - - - - - - - 838 5 1 1 7,075 417 71 67 12,117 2006 2 4 <1 95 - - - 2 - - - 674 8 <1 <1 4,770 449 118 46 20,579 2007 2 2 - 181 - - - 1 - - - 996 5 3 1 5,786 380 203 67 25,000 2008 <1 2 <1 707 - - - 1 - - - 1,398 12 <1 2 4,091 644 52 40 30,141 2009 1 <1 <1 534 - - - 7 - - - 695 19 3 1 2,478 434 46 63 30,988 2010 3 <1 <1 1,901 - - - <1 - - - <1 17 4 2 2,246 433 87 104 40,533 2011 3 2 <1 2,802 - - - 26 - - - 7 30 <1 <1 2,074 401 51 72 45,449 2012 2 2 <1 2,120 - - - 12 - - - - 10 <1 <1 1,242 272 50 62 31,889 2013 1 <1 <1 2,121 - - - 44 - - - 211 45 2 <1 1,517 351 67 49 33,090 2014 2 <1 <1 2,778 - - - 51 - - - 4,067 24 <1 <1 2,075 540 78 56 29,082 2015 <1 <1 <1 3,118 - - - 79 - - - 621 18 3 3 10,593 645 151 58 39,823 2016 1 <1 <1 2,476 - - - 91 - - - 538 19 3 <1 2,245 602 50 78 37,880 2017 <1 <1 - 3,108 - - - 95 - - - 986 16 1 <1 1,263 766 21 27 42,180 2018 2 <1 <1 2,883 - - - 86 - - - 729 5 <1 <1 1,156 460 21 20 36,944 2019 <1 <1 <1 1,927 - - - <1 - - - - 6 <1 <1 12 465 23 34 16,136 2020 2 <1 - * - - - * - - - * 3 2 <1 * 454 21 23 *
Total 46 27 4 36,036 - <1 - 497 - - - 15,378 934 318 287 92,344 16,420 3,625 2,217 544,313

IATTC-98-01 - Fisheries, stocks, and the ecosystem in the EPO in 2020 142
Table L-4. Estimated purse-seine catches by set type in metric tons (t) of rays by observers onboard size-class 6 vessels with a carrying capacity >363 t (1993–2020) and minimum reported longline (LL) catches of rays (gross-annual removals in t) (1993–2019, *data not available). Purse-seine set types: floating object (OBJ), unassociated tuna schools (NOA) and dolphins (DEL). Species highlighted bold are discussed in main text. Data for 2019 (longline) and 2020 (purse-seine) are considered preliminary. “Other rays” include Chilean torpedo (Torpedo tremens), Pacific cownose (Rhinoptera steindachneri), and unidentified eagle rays (Myliobatidae). Tabla L-4. Capturas cerqueras estimadas de rayas, por tipo de lance, en toneladas (t), por observadores a bordo de buques de clase 6 con una capacidad de acarreo >363 t (1993–2020) y capturas palangreras (LL) mínimas reportadas de rayas (extracciones anuales brutas en t) (1993–2019, *datos no disponibles). Tipos de lances cerqueros: objeto flotante (OBJ), atunes no asociados (NOA) y delfines (DEL). Las especies en negritas se discuten en el texto principal. Los datos de 2019 (palangre) y 2020 (cerco) se consideran preliminares. “Otras rayas” incluyen la raya temblara (Torpedo tremens), raya gavilán dorado (Rhinoptera steindachneri), y águilas de mar (Myliobatidae) no identificadas.
Mobulidae Mobula thurstoni, smoothtail manta
Mobula mobular, spinetail manta
Mobula munkiana, munk's devil ray
Mobula tarapacana, chilean devil ray
Mobula birostris, giant manta
Purse seine Purse seine Purse seine Purse seine Purse seine Year OBJ NOA DEL LL OBJ NOA DEL LL OBJ NOA DEL LL OBJ NOA DEL LL OBJ NOA DEL LL 1993 - - - - - - - - - - - - - - - - - - - - 1994 - <1 - - - - - - - - - - - - - - <1 - - - 1995 - - - - - - - - - - - - - - - - - <1 - - 1996 - - - - - - - - - - - - - - - - - - - - 1997 - - - - - - - - - - - - - - - - - <1 - - 1998 - <1 - - - - - - - - - - - - - - 3 19 <1 - 1999 - <1 <1 - - - - - - - - - - - - - 5 10 <1 - 2000 1 4 3 - - - - - - - - - - - - - <1 5 <1 - 2001 <1 7 2 - <1 <1 1 - - - <1 - <1 - - - 1 3 <1 - 2002 <1 17 2 - <1 <1 7 - <1 <1 <1 - <1 1 <1 - 1 4 1 - 2003 <1 25 5 - <1 4 <1 - <1 <1 <1 - - - <1 - <1 6 <1 - 2004 <1 15 3 - <1 2 4 - - <1 <1 - <1 2 <1 - 1 3 4 - 2005 <1 3 6 - 1 9 8 - - <1 <1 - <1 4 7 - 3 14 21 - 2006 <1 18 2 - 2 36 14 - - 2 <1 - <1 6 3 - 10 16 128 - 2007 <1 2 4 - 3 12 11 - <1 <1 <1 - 2 4 2 - <1 11 4 - 2008 <1 5 2 - 2 18 5 - <1 3 <1 - <1 24 3 - 2 32 10 - 2009 <1 1 3 - 1 4 20 - <1 1 <1 6 <1 <1 8 - <1 5 3 - 2010 2 5 5 - 2 26 25 - <1 1 <1 118 <1 1 8 - 1 29 <1 - 2011 <1 14 <1 - 1 5 10 - <1 1 <1 - <1 3 7 - 3 4 <1 - 2012 <1 38 1 - 4 20 3 - <1 1 <1 - <1 7 1 - 3 24 7 - 2013 <1 6 2 - 1 9 5 - <1 1 <1 - <1 3 1 - <1 10 13 - 2014 <1 <1 3 - 16 6 5 - <1 <1 <1 - <1 <1 <1 - <1 4 - - 2015 <1 2 3 - 3 1 24 - <1 <1 1 - 1 2 6 - <1 10 <1 - 2016 <1 <1 5 - <1 2 9 - <1 2 2 - 1 2 2 - 4 18 2 - 2017 <1 <1 1 - 3 1 1 - <1 <1 <1 - <1 - <1 - 5 33 <1 - 2018 <1 1 <1 - 3 4 4 - <1 <1 <1 - 1 <1 <1 - 5 4 <1 - 2019 <1 5 <1 - 2 12 4 - <1 - <1 - 3 <1 1 - <1 5 3 - 2020 <1 <1 <1 * 2 10 2 * <1 - <1 * <1 <1 <1 * 4 - <1 *
Total 12 172 53 - 46 180 162 - 2 15 10 - 16 64 54 - 55 272 201 -

IATTC-98-01 - Fisheries, stocks, and the ecosystem in the EPO in 2020 143
Table L-4 Continued
Mobulidae Dasyatidae
Mobulidae spp.,
mobulid rays, nei Pteroplatytrygon violacea,
pelagic stingray Dasyatidae spp.,
stingrays, nei Other rays All rays
Purse seine Purse seine Purse seine Purse seine Purse seine
Year OBJ NOA DEL LL OBJ NOA DEL LL OBJ NOA DEL LL OBJ NOA DEL LL OBJ NOA DEL LL
1993 9 213 27 - <1 5 <1 - - - - - - - - - 9 219 27 - 1994 3 73 19 - <1 4 <1 - - - - - - - - - 3 77 20 - 1995 3 29 30 - <1 <1 <1 - - - - - - - - - 3 30 30 - 1996 4 73 16 - <1 <1 <1 - - - - - - - - - 4 74 16 - 1997 5 41 17 - <1 <1 3 - - - - - - - - - 5 42 20 - 1998 5 228 18 - <1 <1 <1 - - 3 - - <1 <1 - - 7 251 20 - 1999 8 84 16 - <1 1 <1 - - - - - - - - - 13 96 17 - 2000 2 94 23 - <1 <1 <1 - - - - - - - - - 4 104 27 - 2001 3 20 23 - <1 <1 <1 - - - - - - - - - 5 30 27 - 2002 2 69 37 - <1 <1 <1 - <1 - - - - - - - 6 92 48 - 2003 9 61 37 - <1 25 <1 - - - - - - - - - 11 121 44 - 2004 4 46 19 - <1 <1 <1 - <1 5 <1 - - - - - 6 75 31 - 2005 2 19 11 - <1 <1 <1 - <1 <1 <1 - - 31 - - 8 80 53 - 2006 3 23 14 - <1 <1 <1 - <1 12 <1 - - - 3 - 16 115 166 - 2007 2 12 12 - <1 <1 <1 - <1 3 <1 2 - <1 - - 8 44 35 2 2008 3 10 5 - <1 <1 <1 - <1 <1 <1 2 - - - - 8 93 27 2 2009 2 7 15 - <1 <1 <1 - <1 <1 1 8 - - - - 6 19 50 13 2010 7 20 17 - <1 <1 2 - <1 - <1 3 - 20 - - 13 103 58 121 2011 1 11 5 - <1 <1 <1 - <1 <1 <1 <1 - <1 - - 7 40 25 <1 2012 1 10 3 - <1 <1 <1 - <1 <1 <1 - <1 <1 <1 - 9 100 16 - 2013 <1 6 6 - <1 <1 <1 - <1 <1 <1 - - - 1 - 5 36 28 - 2014 1 4 1 - <1 <1 <1 - <1 <1 <1 - - - - - 20 17 11 - 2015 1 4 9 - <1 <1 <1 - <1 <1 1 1 - - - - 7 20 46 1 2016 3 12 11 - <1 <1 <1 - <1 - <1 - - - - - 10 37 32 - 2017 7 20 6 - <1 <1 <1 - <1 <1 <1 - - - <1 - 18 56 11 - 2018 6 5 6 - <1 <1 <1 - <1 <1 <1 - - - - - 17 15 12 - 2019 4 16 8 - <1 <1 <1 - <1 <1 <1 - - <1 <1 - 11 40 18 - 2020 4 5 9 * <1 <1 <1 * <1 <1 <1 * - - - * 11 15 14 *
Total 104 1,214 420 - 10 42 16 - 4 27 7 16 <1 52 5 - 249 2,039 928 -

IATTC-98-01 - Fisheries, stocks, and the ecosystem in the EPO in 2020 144
Table L-5. Estimated purse-seine catches by set type in metric tons (t) of large fishes by observers onboard size-class 6 vessels with a carrying capacity >363 t (1993–2020) and minimum reported longline (LL) catches of large fishes (gross-annual removals in t) (1993–2019, *data not available). Purse-seine set types: floating object (OBJ), unassociated tuna schools (NOA) and dolphins (DEL). Species highlighted bold are discussed in main text. Data for 2019 (longline) and 2020 (purse-seine) are considered preliminary. “Other large fishes” include unidentified mackerels (Scombridae), luvar (Luvarus imperialis), and large fishes nei (not elsewhere identified). Tabla L-5. Capturas cerqueras estimadas de peces grandes, por tipo de lance, en toneladas (t), por observadores a bordo de buques de clase 6 con una capacidad de acarreo >363 t (1993–2020) y capturas palangreras (LL) mínimas reportadas de peces grandes (extracciones anuales brutas en t) (1993–2019, *datos no disponibles). Tipos de lances cerqueros: objeto flotante (OBJ), atunes no asociados (NOA) y delfines (DEL). Las especies en negritas se discuten en el texto principal. Los datos de 2019 (palangre) y 2020 (cerco) se consideran preliminares. “Otros peces grandes” incluyen caballas (Scombridae) no identificadas, pez emperador (Luvarus imperialis), y peces grandes nep (no identificados en otra parte).
Coryphaenidae Scombridae Carangidae
Coryphaenidae spp., dorado Acanthocybium solandri, wahoo Elagatis bipinnulata, rainbow
runner Seriola spp., amberjacks, nei Caranx spp., jacks, crevalles, nei
Purse seine Purse seine Purse seine Purse seine Purse seine Year OBJ NOA DEL LL OBJ NOA DEL LL OBJ NOA DEL LL OBJ NOA DEL LL OBJ NOA DEL LL 1993 702 14 <1 17 152 11 <1 2 16 <1 <1 - - - - - - - - - 1994 1,221 20 <1 46 472 1 1 <1 14 <1 <1 - <1 - - - - - - - 1995 1,071 22 3 39 379 <1 <1 1 11 <1 <1 - <1 <1 - - - - - - 1996 1,312 18 <1 43 271 <1 <1 1 28 3 <1 - 4 - - - - - - - 1997 1,225 12 <1 6,866 475 3 1 <1 60 2 <1 - 1 - - - <1 - - - 1998 816 18 <1 2,528 396 <1 4 2 93 <1 <1 - 4 - - - <1 - - - 1999 1,238 4 <1 6,283 161 <1 <1 2 110 <1 <1 - <1 - - - <1 - - - 2000 1,437 51 2 3,537 277 2 <1 2 53 5 <1 - <1 - - - <1 - - - 2001 2,202 17 3 15,942 1,023 2 <1 6 90 <1 <1 - 1 - - - <1 - - - 2002 1,815 8 <1 9,464 571 <1 <1 18 94 1 <1 - <1 <1 - - <1 - - - 2003 894 11 1 5,301 428 <1 <1 164 108 2 - - 1 <1 - - <1 - - - 2004 1,018 17 1 3,986 380 <1 <1 155 62 <1 - - 56 9 <1 1 2 <1 - - 2005 972 75 1 3,854 420 <1 <1 155 66 <1 <1 - 26 2 <1 - 2 1 - - 2006 1,197 58 <1 3,408 424 1 <1 167 73 <1 <1 - 53 8 <1 - 10 220 <1 - 2007 1,235 47 1 6,907 421 2 <1 221 157 <1 - - 18 80 <1 - 1 11 - - 2008 1,112 17 2 15,845 249 1 <1 213 40 <1 <1 - 27 <1 - - 17 18 - - 2009 1,722 7 <1 17,136 547 <1 <1 336 28 <1 <1 - 13 <1 - - 11 8 - - 2010 912 3 <1 9,484 373 1 <1 284 17 <1 <1 - 3 23 - - 1 48 - - 2011 1,410 7 <1 12,438 169 2 <1 242 22 <1 - - 7 33 - <1 4 14 - 1 2012 1,705 18 <1 17,255 313 <1 <1 230 13 1 - - 10 7 - - 2 15 <1 - 2013 1,455 7 <1 11,249 518 1 <1 291 19 <1 - - 6 <1 <1 - 4 2 <1 - 2014 1,779 9 <1 3,342 517 2 <1 287 15 <1 <1 - 6 2 - - 3 <1 <1 - 2015 1,167 8 <1 1,206 357 1 <1 285 15 <1 - - 6 <1 - - 9 8 <1 - 2016 949 7 <1 446 318 2 <1 321 26 <1 <1 - 12 <1 <1 - 4 <1 8 - 2017 1,557 11 <1 1,804 335 <1 <1 318 18 <1 <1 - 12 5 <1 - 4 12 - - 2018 1,483 5 5 3,500 230 <1 <1 364 20 <1 - - 62 <1 - - 9 <1 - - 2019 1,208 29 <1 1,540 201 <1 <1 325 21 <1 <1 - 12 4 <1 - 5 <1 - - 2020 774 4 <1 * 127 <1 <1 * 23 - <1 * 9 2 - * 2 <1 <1 *
Total 35,589 525 30 163,466 10,506 42 10 4,393 1,313 19 <1 - 353 176 <1 2 92 360 9 1
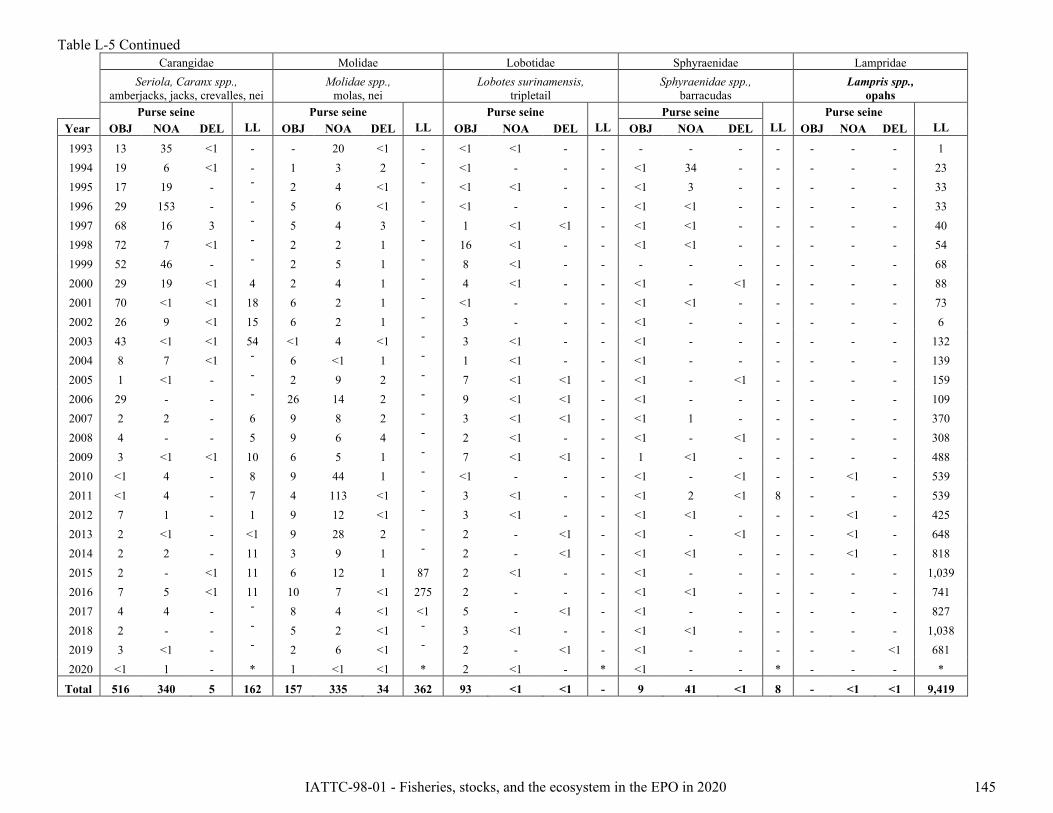
IATTC-98-01 - Fisheries, stocks, and the ecosystem in the EPO in 2020 145
Table L-5 Continued Carangidae Molidae Lobotidae Sphyraenidae Lampridae
Seriola, Caranx spp.,
amberjacks, jacks, crevalles, nei Molidae spp.,
molas, nei Lobotes surinamensis,
tripletail Sphyraenidae spp.,
barracudas Lampris spp.,
opahs Purse seine Purse seine Purse seine Purse seine Purse seine
Year OBJ NOA DEL LL OBJ NOA DEL LL OBJ NOA DEL LL OBJ NOA DEL LL OBJ NOA DEL LL
1993 13 35 <1 - - 20 <1 - <1 <1 - - - - - - - - - 1 1994 19 6 <1 - 1 3 2 - <1 - - - <1 34 - - - - - 23 1995 17 19 - - 2 4 <1 - <1 <1 - - <1 3 - - - - - 33 1996 29 153 - - 5 6 <1 - <1 - - - <1 <1 - - - - - 33 1997 68 16 3 - 5 4 3 - 1 <1 <1 - <1 <1 - - - - - 40 1998 72 7 <1 - 2 2 1 - 16 <1 - - <1 <1 - - - - - 54 1999 52 46 - - 2 5 1 - 8 <1 - - - - - - - - - 68 2000 29 19 <1 4 2 4 1 - 4 <1 - - <1 - <1 - - - - 88 2001 70 <1 <1 18 6 2 1 - <1 - - - <1 <1 - - - - - 73 2002 26 9 <1 15 6 2 1 - 3 - - - <1 - - - - - - 6 2003 43 <1 <1 54 <1 4 <1 - 3 <1 - - <1 - - - - - - 132 2004 8 7 <1 - 6 <1 1 - 1 <1 - - <1 - - - - - - 139 2005 1 <1 - - 2 9 2 - 7 <1 <1 - <1 - <1 - - - - 159 2006 29 - - - 26 14 2 - 9 <1 <1 - <1 - - - - - - 109 2007 2 2 - 6 9 8 2 - 3 <1 <1 - <1 1 - - - - - 370 2008 4 - - 5 9 6 4 - 2 <1 - - <1 - <1 - - - - 308 2009 3 <1 <1 10 6 5 1 - 7 <1 <1 - 1 <1 - - - - - 488 2010 <1 4 - 8 9 44 1 - <1 - - - <1 - <1 - - <1 - 539 2011 <1 4 - 7 4 113 <1 - 3 <1 - - <1 2 <1 8 - - - 539 2012 7 1 - 1 9 12 <1 - 3 <1 - - <1 <1 - - - <1 - 425 2013 2 <1 - <1 9 28 2 - 2 - <1 - <1 - <1 - - <1 - 648 2014 2 2 - 11 3 9 1 - 2 - <1 - <1 <1 - - - <1 - 818 2015 2 - <1 11 6 12 1 87 2 <1 - - <1 - - - - - - 1,039 2016 7 5 <1 11 10 7 <1 275 2 - - - <1 <1 - - - - - 741 2017 4 4 - - 8 4 <1 <1 5 - <1 - <1 - - - - - - 827 2018 2 - - - 5 2 <1 - 3 <1 - - <1 <1 - - - - - 1,038 2019 3 <1 - - 2 6 <1 - 2 - <1 - <1 - - - - - <1 681 2020 <1 1 - * 1 <1 <1 * 2 <1 - * <1 - - * - - - *
Total 516 340 5 162 157 335 34 362 93 <1 <1 - 9 41 <1 8 - <1 <1 9,419

IATTC-98-01 - Fisheries, stocks, and the ecosystem in the EPO in 2020 146
Table L-5 Continued
Gempylidae spp.,
snake mackerels, nei Bramidae spp., pomfrets, nei
Other large fishes Unidentified fishes All fishes
Purse seine Purse seine Purse seine Purse seine Purse seine Year OBJ NOA DEL LL OBJ NOA DEL LL OBJ NOA DEL LL OBJ NOA DEL LL OBJ NOA DEL LL
1993 - - - - - - - <1 3 <1 <1 - <1 - <1 183 887 79 1 203 1994 - - - - - - - 2 3 87 <1 - <1 <1 12 250 1,731 152 16 321 1995 - - - - - - - 2 <1 3 <1 - 3 1 <1 209 1,485 53 4 285 1996 - - - - - - - 2 3 125 <1 - 3 <1 <1 456 1,655 306 1 535 1997 - - - - - - - 6 7 5 <1 - 7 2 - 847 1,850 44 7 7,760 1998 - - - - - - - 9 13 10 <1 - 7 <1 <1 1,338 1,420 38 7 3,931 1999 - - - - - - - 3 4 54 <1 - 22 4 <1 974 1,599 114 2 7,330 2000 - - - - - - - 4 1 1 - - 1 <1 <1 1,485 1,804 82 4 5,119 2001 - - - - - - - 5 2 9 <1 - 3 <1 <1 1,720 3,398 30 4 17,763 2002 - - - - - - - <1 2 <1 <1 - 2 6 <1 1,895 2,521 27 2 11,399 2003 - - - - - - - - 4 <1 - - 2 2 - 4,386 1,484 19 2 10,037 2004 - - - - - - - - 4 <1 <1 - 10 <1 <1 377 1,548 35 3 4,658 2005 - - - - - - - 18 <1 <1 <1 - 3 <1 <1 303 1,501 89 3 4,489 2006 - - - 18 - <1 - 17 <1 <1 <1 7 3 <1 <1 285 1,824 302 3 4,011 2007 - - - 65 - - - 57 1 <1 <1 5 1 5 <1 1,763 1,848 158 4 9,394 2008 - - - 144 - - - 68 1 <1 <1 - <1 <1 <1 793 1,462 44 6 17,375 2009 - - - 412 - - - 56 1 <1 <1 67 2 - <1 1,077 2,343 21 2 19,581 2010 - - - 575 - - - 64 <1 - <1 - <1 <1 - 879 1,318 122 2 11,833 2011 - - - 506 - <1 - 50 <1 <1 - 15 <1 - <1 612 1,621 175 <1 14,418 2012 - - - 661 - - - 61 <1 2 <1 23 1 <1 - 1,293 2,065 57 1 19,949 2013 - - - 574 - - - 134 <1 <1 <1 36 <1 <1 - 1,112 2,016 40 3 14,045 2014 - - - 431 - - - 138 <1 <1 - 77 <1 - - 1,013 2,329 25 2 6,115 2015 - - - 321 <1 - - 172 <1 <1 - 7 2 <1 - 1,367 1,568 30 2 4,495 2016 <1 - - 730 - - - 108 <1 <1 <1 100 <1 1 - 506 1,328 23 9 3,238 2017 - - - 258 - - - 126 <1 <1 - 62 1 - - 1,532 1,946 36 1 4,928 2018 - - - 227 - - - 125 <1 - - <1 <1 <1 <1 222 1,816 9 6 5,478 2019 - - - 300 - - - 80 <1 - - 25 <1 <1 <1 274 1,455 41 1 3,225 2020 - - - * - - - * <1 - - * <1 <1 <1 * 940 9 <1 *
Total <1 - - 5,223 <1 <1 - 1,306 56 298 <1 425 75 24 13 27,151 48,759 2,160 101 211,918
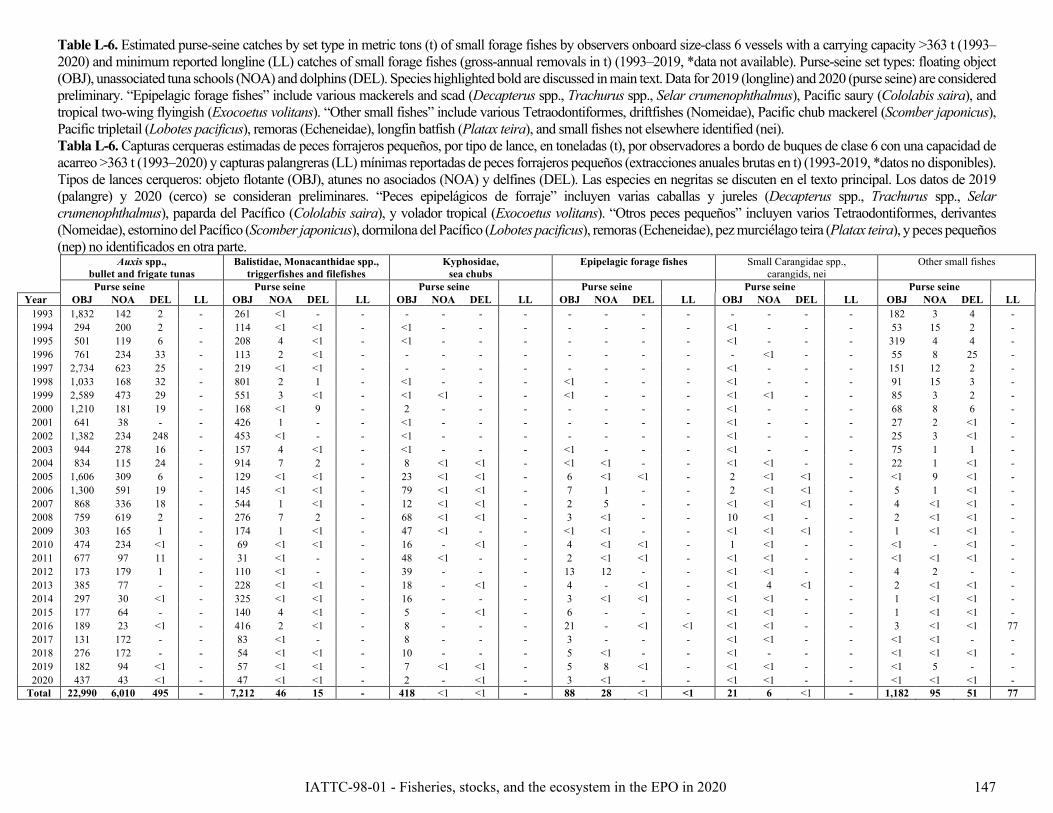
IATTC-98-01 - Fisheries, stocks, and the ecosystem in the EPO in 2020 147
Table L-6. Estimated purse-seine catches by set type in metric tons (t) of small forage fishes by observers onboard size-class 6 vessels with a carrying capacity >363 t (1993–2020) and minimum reported longline (LL) catches of small forage fishes (gross-annual removals in t) (1993–2019, *data not available). Purse-seine set types: floating object (OBJ), unassociated tuna schools (NOA) and dolphins (DEL). Species highlighted bold are discussed in main text. Data for 2019 (longline) and 2020 (purse seine) are considered preliminary. “Epipelagic forage fishes” include various mackerels and scad (Decapterus spp., Trachurus spp., Selar crumenophthalmus), Pacific saury (Cololabis saira), and tropical two-wing flyingish (Exocoetus volitans). “Other small fishes” include various Tetraodontiformes, driftfishes (Nomeidae), Pacific chub mackerel (Scomber japonicus), Pacific tripletail (Lobotes pacificus), remoras (Echeneidae), longfin batfish (Platax teira), and small fishes not elsewhere identified (nei). Tabla L-6. Capturas cerqueras estimadas de peces forrajeros pequeños, por tipo de lance, en toneladas (t), por observadores a bordo de buques de clase 6 con una capacidad de acarreo >363 t (1993–2020) y capturas palangreras (LL) mínimas reportadas de peces forrajeros pequeños (extracciones anuales brutas en t) (1993-2019, *datos no disponibles). Tipos de lances cerqueros: objeto flotante (OBJ), atunes no asociados (NOA) y delfines (DEL). Las especies en negritas se discuten en el texto principal. Los datos de 2019 (palangre) y 2020 (cerco) se consideran preliminares. “Peces epipelágicos de forraje” incluyen varias caballas y jureles (Decapterus spp., Trachurus spp., Selar crumenophthalmus), paparda del Pacífico (Cololabis saira), y volador tropical (Exocoetus volitans). “Otros peces pequeños” incluyen varios Tetraodontiformes, derivantes (Nomeidae), estornino del Pacífico (Scomber japonicus), dormilona del Pacífico (Lobotes pacificus), remoras (Echeneidae), pez murciélago teira (Platax teira), y peces pequeños (nep) no identificados en otra parte.
Auxis spp.,
bullet and frigate tunas Balistidae, Monacanthidae spp.,
triggerfishes and filefishes Kyphosidae,
sea chubs Epipelagic forage fishes Small Carangidae spp.,
carangids, nei Other small fishes
Purse seine Purse seine Purse seine Purse seine Purse seine Purse seine Year OBJ NOA DEL LL OBJ NOA DEL LL OBJ NOA DEL LL OBJ NOA DEL LL OBJ NOA DEL LL OBJ NOA DEL LL
1993 1,832 142 2 - 261 <1 - - - - - - - - - - - - - - 182 3 4 - 1994 294 200 2 - 114 <1 <1 - <1 - - - - - - - <1 - - - 53 15 2 - 1995 501 119 6 - 208 4 <1 - <1 - - - - - - - <1 - - - 319 4 4 - 1996 761 234 33 - 113 2 <1 - - - - - - - - - - <1 - - 55 8 25 - 1997 2,734 623 25 - 219 <1 <1 - - - - - - - - - <1 - - - 151 12 2 - 1998 1,033 168 32 - 801 2 1 - <1 - - - <1 - - - <1 - - - 91 15 3 - 1999 2,589 473 29 - 551 3 <1 - <1 <1 - - <1 - - - <1 <1 - - 85 3 2 - 2000 1,210 181 19 - 168 <1 9 - 2 - - - - - - - <1 - - - 68 8 6 - 2001 641 38 - - 426 1 - - <1 - - - - - - - <1 - - - 27 2 <1 - 2002 1,382 234 248 - 453 <1 - - <1 - - - - - - - <1 - - - 25 3 <1 - 2003 944 278 16 - 157 4 <1 - <1 - - - <1 - - - <1 - - - 75 1 1 - 2004 834 115 24 - 914 7 2 - 8 <1 <1 - <1 <1 - - <1 <1 - - 22 1 <1 - 2005 1,606 309 6 - 129 <1 <1 - 23 <1 <1 - 6 <1 <1 - 2 <1 <1 - <1 9 <1 - 2006 1,300 591 19 - 145 <1 <1 - 79 <1 <1 - 7 1 - - 2 <1 <1 - 5 1 <1 - 2007 868 336 18 - 544 1 <1 - 12 <1 <1 - 2 5 - - <1 <1 <1 - 4 <1 <1 - 2008 759 619 2 - 276 7 2 - 68 <1 <1 - 3 <1 - - 10 <1 - - 2 <1 <1 - 2009 303 165 1 - 174 1 <1 - 47 <1 - - <1 <1 - - <1 <1 <1 - 1 <1 <1 - 2010 474 234 <1 - 69 <1 <1 - 16 - <1 - 4 <1 <1 - 1 <1 - - <1 - <1 - 2011 677 97 11 - 31 <1 - - 48 <1 - - 2 <1 <1 - <1 <1 - - <1 <1 <1 - 2012 173 179 1 - 110 <1 - - 39 - - - 13 12 - - <1 <1 - - 4 2 - - 2013 385 77 - - 228 <1 <1 - 18 - <1 - 4 - <1 - <1 4 <1 - 2 <1 <1 - 2014 297 30 <1 - 325 <1 <1 - 16 - - - 3 <1 <1 - <1 <1 - - 1 <1 <1 - 2015 177 64 - - 140 4 <1 - 5 - <1 - 6 - - - <1 <1 - - 1 <1 <1 - 2016 189 23 <1 - 416 2 <1 - 8 - - - 21 - <1 <1 <1 <1 - - 3 <1 <1 77 2017 131 172 - - 83 <1 - - 8 - - - 3 - - - <1 <1 - - <1 <1 - - 2018 276 172 - - 54 <1 <1 - 10 - - - 5 <1 - - <1 - - - <1 <1 <1 - 2019 182 94 <1 - 57 <1 <1 - 7 <1 <1 - 5 8 <1 - <1 <1 - - <1 5 - - 2020 437 43 <1 - 47 <1 <1 - 2 - <1 - 3 <1 - - <1 <1 - - <1 <1 <1 -
Total 22,990 6,010 495 - 7,212 46 15 - 418 <1 <1 - 88 28 <1 <1 21 6 <1 - 1,182 95 51 77

IATTC-98-01 - Fisheries, stocks, and the ecosystem in the EPO in 2020
148
Table L-7. Minimum nominal purse-seine catches by set type in metric tons (t) in 2020 for size-class 1–5 vessels with a carrying capacity <363 t as reported by observers in 24% of all trips that carried an observer. Purse-seine set types: floating object (OBJ) and unassociated tuna schools (NOA). Tabla L-7. Capturas cerqueras nominales mínimas, por tipo de lance, en toneladas (t), en 2020 para buques de clases 1-5 con una capacidad de acarreo <363 t según lo reportado por los observadores en el 24% de todos los viajes que llevaban observador a bordo. Tipo de lances cerqueros: objeto flotante (OBJ) y atunes no asociados (NOA).
Set type Taxa Common name Scientific name OBJ NOA Sharks Silky shark Carcharhinus falciformis 17 <1
Blue shark Prionace glauca - <1
Other Carcharhinidae Carcharhinidae spp. <1 -
Smooth hammerhead Sphyrna zygaena <1 <1
Scalloped hammerhead Sphyrna lewini 3 -
Hammerhead, nei Sphyrna spp. <1 -
Pelagic thresher shark Alopias pelagicus <1 - Other shark <1 - Rays Smoothtail manta Mobula thurstoni <1 <1
Spinetail manta Mobula mobular <1 1
Munk's devil ray Mobula munkiana - <1
Chilean devil ray Mobula tarapacana <1 <1
Giant manta Mobula birostris - <1
Mobulidae ray, nei Mobulidae spp. <1 <1
Pelagic stingray Pteroplatytrygon violacea <1 <1 Stingray, nei Dasyatidae spp. <1 <1 Large fishes Dorado Coryphaenidae spp. 88 <1
Wahoo Acanthocybium solandri 16 <1
Rainbow runner Elagatis bipinnulata 1 -
Amberjack, nei Seriola spp. 1 -
Jacks, crevalles, nei Caranx spp. <1 -
Amberjack, jack, crevalles, nei Seriola, Caranx spp. <1 -
Mola, nei Molidae spp. <1 -
Tripletail Lobotes surinamensis <1 <1 Other large fish <1 - Small fishes Bullet and frigate tunas Auxis spp. 60 6
Triggerfishes, filefishes Balistidae, Monacanthidae spp. 12 <1
Sea chubs Kyphosidae spp. <1 -
Small carangid, nei Carangidae spp. <1 <1 Epipelagic forage fishes <1 -