Top Stocks For 2021 - AWS
173
TOP STOCKS FOR 2021
-
Upload
khangminh22 -
Category
Documents
-
view
3 -
download
0
Transcript of Top Stocks For 2021 - AWS
TOP STOCKSFOR 2021

2WWW.SUMZERO.COM
SumZero is not a registered investment advisor or broker-dealer, and is not licensed nor qualified to
provide investment advice. There is no requirement that any of our Information Providers be registered
investment advisors or broker-dealers. Nothing published or made available by or through SumZero should
be considered personalized investment advice, investment services or a solicitation to BUY, SELL, or HOLD
any securities or other investments mentioned by SumZero or the Information Providers. Never invest based
purely on our publication or information, which is provided on an “as is” basis without representations.
Past performance is not indicative of future results. YOU SHOULD VERIFY ALL CLAIMS, DO YOUR OWN
DUE DILIGENCE AND/OR SEEK YOUR OWN PROFESSIONAL ADVISOR AND CONSIDER THE INVESTMENT
OBJECTIVES AND RISKS AND YOUR OWN NEEDS AND GOALS BEFORE INVESTING IN ANY SECURITIES
MENTIONED. INVESTMENT DOES NOT GUARANTEE A POSITIVE RETURN AS STOCKS ARE SUBJECT TO
MARKET RISKS, INCLUDING THE POTENTIAL LOSS OF PRINCIPAL. You further acknowledge that SumZero,
the Information Providers or their respective affiliates, employers, employees, officers, members, managers
and directors, may or may not hold positions in one or more of the securities in the Information and
may trade at any time, without notification to you, based on the information they are providing and will
not necessarily disclose this information to subscribers, nor the time the positions in the securities were
acquired. You confirm that you have read and understand, and agree to, our full disclaimer and terms of
use, a copy of which can be accessed by clicking here and that neither SumZero nor any of its Information
Providers is in any way responsible for any investment losses you may incur under any circumstances.
All content and material within in this document is the exclusive intellectual property of SumZero, Inc., and
may not be reproduced without the prior written permission of SumZero, Inc.
DISCLAIMER

ABOUT THETOP STOCKSCHALLENGE
3
The ideas featured within this report were selected as the
15 Winners and Finalists of the 5th Top Stocks Challenge,
an annual investment research competition hosted
by SumZero, a global platform of nearly 20K buyside
investment professionals.
SumZero members are investment professionals working
at hedge funds, private equity funds, mutual funds,
and family offices or are investment professionals with
substantial prior fund experience. The complete research
history of individuals featured in this report, as well as
bios, and work history can be found on the SumZero
database.
VALIDITY OF THE THESIS
STRENGTH OF THE SUPPORTING ARGUMENT
FEASIBILITY OF THE TRADE
ORIGINALITY
The 75+ submissions entered into this year’s
Challenge were independently assessed
and voted on by a panel of 39 senior fund
professionals and asset allocators. The
following, multi-factor criteria was utilized
to determine the Winners:
WWW.SUMZERO.COM

4WWW.SUMZERO.COM
TABLE OF CONTENTS5
6
21
32
37
38
49
59
71
72
82
97
101
102
109
119
129
130
145
152
ASIA ................................................................................................................................................WINNER: RAZER BY JACK CHAN ..................................................................................................FINALIST: LIFL FINANCE BY GOKUL RAJ ....................................................................................
FINALIST: SHANGRI-LA BY ERIC SEE ..........................................................................................
MICRO CAPS ...............................................................................................................................
WINNER: NET 1 BY JUD TRAPHAGEN ..........................................................................................
FINALIST: CDON BY BRAD HATHAWAY .......................................................................................
FINALIST: AUTOMATIC BANK BY CHRISTOPHER CAMPBELL ......................................................
SMALL CAPS ................................................................................................................................
WINNER: VITAL FARMS BY SAHIL CHAWLA ................................................................................
FINALIST: CINEPLEX BY JEROME HASS ......................................................................................
FINALIST: BRIGHTCOVE BY JEFFREY MEYERS ...........................................................................
MID CAPS ....................................................................................................................................
WINNER: RENT A CENTER BY CHRIS COLVIN ...........................................................................
FINALIST: VONTIER BY RADO BRADISTILOV ............................................................................
FINALIST: COLLIERS BY ALEX AGOSTINO .................................................................................
LARGE/MEGA CAPS ...............................................................................................................
WINNER: ELECTRONIC ARTS BY AUBREY BROCKLEBANK .......................................................
FINALIST: AIRBUS BY EVGENY VOSTRESTO .............................................................................
FINALIST: GOODRX BY RICHARD CHU ......................................................................................

Name must be based in the Asia Pacific or Oceanic Region
ASIA-PACIFIC & OCEANIA

6WWW.SUMZERO.COM
Razer Inc Ord
L O N G
Razer is a well-known gaming brand. Although razer fail to win the first
digital banking license in Singapore, we see a deep value investment
opportunity for future digital banking business.
TIMEFRAME
1-2 YearsSITUATION
ValueMARKET CAP
280.0M USDATTACHMENTS
About Morgan Housel
Five States Capital is currently a Hong Kong based licensed corporation under the Securities and Futures Ordinance (“SFO”) to carry out Type 1 (dealing in securities), Type 4 (advising on securities) and Type 9 (asset management) regulated activities. We provide investment advisory services to professional investors and high-net-worth clients which utilize China’s high-quality assets and resources. We adhere to our business philosophy, “integrity, professional, rigour and responsibility”, and actively grasps the market opportunities with the aim of compounding growth through quality value investments for our partners. The best way to learn more about the Five States Capital is to read the investor letters on Five States Capital’s SumZero page or visit http://www.fivestates.com.hk/.
About Five States Capital
Jack is a Hong Kong / China equities focused Portfolio Manager with specialization on various long short strategies. Jack holds a bachelor’s degree in Accounting and Finance from University of Hong Kong who has over 10 years of global investment experiences as a Chartered Alternative Investment Analyst. In 2014 - 2018, he held the position of Executive Director and Senior Portfolio Manager at Sun International Asset, Investment Director at regional multi-strategy hedge fund Silver Tree and Vice President at Alphalex Capital. Jack collaborated on this idea with his colleague, Arthur Lee, who is a Hong Kong / China equities focused Research Analyst with specialization on various long short strategies.
About Jack Chan
WINNER
Idea Posted: 12/23/2020
Asset: Equity
Idea Updated: 12/26/2020
Symbol: 1337:HK
RETURN TO DATE:
3.9%
EXPECTED RETURN:
166.67%
Jack ChanBADGES:Five States Capital Resources Limited
Asia

7WWW.SUMZERO.COM
Asset Class: Equity Symbol: 1337:HK Updated: 12/26/2020 Submitted: 12/23/2020
Razer Inc Ord
BY:
CURRENTLY AT:
Jack Chan
Razer is a well-known gaming brand. Although razer fail to win the first
digital banking license in Singapore, we see a deep value investment
opportunity for future digital banking business.
ASSET CLASS:
EquitySITUATION:
ValueTARGET ALLOCATION:
2% - 5%CATALYSTS:
N/A
TIMEFRAME:
1-2 Years
EXPECTED RETURN
TARGET PRICE
INITIAL PRICE
166.67%
6.40 HKD
2.31 HKD
Pricing & Return Details LO N G
INTRODUCTION
Investors are seeking for a stock with quality brand, competitive
products, growing industry and innovative business model. We
found Razer Inc (1337.hk) fulfills the requirements and ready to
have a good time in 2021.
Razer is a well-known gamer-focused brand targeting to build an
all-in-one gaming eco-system. Market’s first impression on Razer
is a hardware company selling gaming headset, monitor, laptop,
mice, chair, keyboard and kinds of peripherals. Many investors
have been led to believe that Razer is a COVID beneficial stock
and should be underweight after the launch of vaccine and
technology sector great-rotation. However, we will show you
that Razer is not only a hardware company and COVID beneficial
stock but also a Fintech new-star while dividing the investment
thesis presented into hardware and Fintech parts.
Our investment thesis is simple:
• The product quality (comments and evaluation from major
technology hubs), sales figure and brand loyalty of Razer
is far better than major hardcore competitors (Logitech
and Corsair) but the valuation does not match (Razer is
significantly behind);
• The financial service penetration rate in South East Asia is
trail. Razer will be the game changer in financial service
and Fintech industry while in-game purchase is a good
entry point for FinTech (payment) service;
• Short term selling flow caused by the failure on Singapore
first digital banking license creates a good buying
opportunity;
• Razer Pay GMV would keep on a high growth track;
INVESTMENT THESIS
Five States Capital Resources Limited

8WWW.SUMZERO.COM
• Razer Fintech business is the road to follow Alibaba’s
3-year successful story with at least one digital banking
license before 2023;
• Lessons of Gamestop indicates commission scheme is the
future of gaming industry. As long as gaming hardware
product edge and the launch of innovative payment
and reward product Razer Gold, commission from game
maker (like Microsoft, Sony and Capcom) and game
operator will be a future growth driver which still does
not be reflected; Certain deep value choice in 2021 with
relatively low P/E to peers
HARDWARE BUSINESS
Diversified product edge with valuation comparability.
To compete with Logitech and Corsair, Razer offers a richer
product matrix to fulfill the signature slogan “For Gamers,
By Gamers” which satisfy both professional and rookie users
which demand on boarder price range and types. Of course, a
richer product matrix doesn’t mean certain product edge, we
have to check the gross margin and sales revenue growth. The
gross margin on gaming peripherals is decreasing within the
industry due to the inflation on upstream materials with a key
fact that Razer’s gross margin is highly in line with Corsair
which indicates the valuation comparability. We believe
Logitech is slightly competitive on the predicted gross
margin due to the production scale. The market worried on
the bad sales growth in 2019, however, Razer has dropped
out the unprofitable smart phone business which has not
yet been reflected on the coming financial statement. Sales
growth in 2021 would be proved in next part.

9WWW.SUMZERO.COM
Champions on product evaluation and key date sales figure. To
evaluate the real product competitiveness, the best way is to
compare the comments from leading technology hubs and the
sales figure on key dates. We evaluate the common products
(gaming headset, monitor, laptop, mice, chair and keyboard)
in peripheral category from PC Gamer, Techradar, Tom’s,
Gamesradar and IGN. The evaluation includes user experience,
function, practicality and price while Razer has a definite
advantage in gaming headset, monitor and laptop and relative
advantage in keyboard. Although Logitech are well- known
for mice, Razer is still the first choice for gamers while the
low-end gaming keyboard successfully carve up the market
with Corsair. Razer shows a product quality and edge when
competing with Logitech and Corsair. Apart from product
quality, Razer also wins the sales battlefield. We try to capture
the sales figure during Amazon Prime day and Thanksgiving
holiday which are good samples to predict whole year sales.
Razer shows absolute advantage in gaming mice, keyboard,
headset and controller on Amazon Prime day while dominates
in gaming keyboard, mice, headset and music controller on
Thanksgiving holiday among the three brands. The bright
sales figure supports the growth of hardware business in 2021.
THE BEST GAMING HEADSET IN 2020
THE BEST GAMING MONITOR IN 2020
THE BEST GAMING LAPTOP IN 2020
TOP TECHNOLOGY HUBS COMMENTS:

10WWW.SUMZERO.COM
THE BEST GAMING MOUSE IN 2020
BEST GAMING MICE SELLER
BEST GAMING KEYBOARD SELLER
AMAZON PRIME DAY 2020 STATISTICS:
Razer takes 7 positions in the first 10 ranking
THE BEST GAMING CHAIR IN 2020
THE BEST GAMING KEYBOARD IN 2020
Razer takes 8 positions in the first 10 ranking

11WWW.SUMZERO.COM
BEST GAMING HEADSET SELLER
Razer takes 5 positions in the first 10 ranking
BEST GAMING CONTROLLER SELLER
Razer takes 2 positions in the first 10 ranking
THANKSGIVING HOLIDAY STATISTICS
BEST GAMING KEYBOARD SELLER
Razer takes 3 positions in the first 15 ranking
BEST GAMING MICE SELLER
Razer takes 8 positions in the first 15 ranking

12WWW.SUMZERO.COM
BEST GAMING HEADSET SELLER
Razer takes 2 positions in the first 15 ranking
BEST GAMING GAMEPADS & STANDARD CONTROLLER SELLER
Razer takes 3 positions in the first 15 ranking
BEST GAMING MUSIC CONTROLLER SELLER
Razer takes 5 positions in the first 8 ranking
LOYALTY EDGE FOR GAMERS
No matter how good the products and the sales figure are,
only sticky users will create long-term brand edge. Several
factors contribute to Razer’s high loyalty that could not be
copied by others. Leading social platform followers proved
the royalty edge.

13WWW.SUMZERO.COM
CLEAR TARGET USER CYCLE
Razer targets gamers as core customers clearly to build the
business. To agglomerate the gamers, Razer launches Razer
Insider (a forum) to interact. Gamers may find useful tips and
raise questions to other users to gain new insights, and more
importantly, stay within Razer’s cycle. Some may question
that Corsair does the same manner to retain the users,
however, Razer Insider is hotter counted by the posts updated
and discussed per day. In addition, those forum users are
social media active users while they like to hash tag #game
#Razer related to game posts. In other words, Razer has a
user activeness edge which push further on new comers.
KNOW WHAT GAMERS WANT
As proved by the sales figure, Razer know what gamers want.
If a product is cheap enough but lack of quality, no users would
buy it. The continuous sales successful story proved the point.
TEAM RAZER AS BRAND ICON
It is very common to see gaming peripheral producers
sponsor e-sport teams during different tournaments. The idea
is simple, tournament candidates will use the products and
may win the tournaments using the sponsored products, thus
elevating the brand name. Razer not only put resources on
e-sport, like holding Razer SEA Invitational 2020 tournament,
but also own a professional team. As a house brand, Team
Razer use own products for training while tournament track
records are stable. In other words, users can enrich Razer
product experience via stable good tournament result.
Moreover, Razer keeps on signing new teams with high social
media followers to maintain the brand online influence. The
secret behind is Team Razer will go to offline stores and
events to interact with brand fans, thus enhancing brand
influence.
REBATE USERS
When the social media followers reached 8 million, Razer
started a rebate scheme to users. This scheme wins a positive
interaction which push the brand name. We expected Razer
will keep on published similar rebating scheme to acquire new
users.
CERTAIN DEEP VALUE CHOICE IN 2021
We have proven that Razer has a competitive market position,
product edge and sales figure in the gaming industry. More
importantly, the brand loyalty with growing gamers and
followers could sustain the business which should have a
similar or even better valuation multiple than the peers.
However, the market is undervalued Razer while being out of
the red prediction still does not reflected by the market.
[figure below]
From the valuation matrix, Razer has a 15.1X implied P/E
multiple while 26X for Logitech and Corsair in 2023. We
believe Razer’s P/E should be valued as +10% higher than
Corsair while announced the predicted annualized positive net
profit in 2020 H1 report. It is a good chance to capture Razer
in 2021 for a certain doubled valuation.
NEW BUSINESS MODEL
Razer shows the growth quality and product competitiveness
among major competitors, but the original business still
doesn’t lead to positive net profit as long as the size grow.
In the view of this, Razer upgraded the model to two
drivers, Razer FinTech and hardware, and more importantly,
transformed to B2B2C from B2C model while kicking out
smartphone business in 2018.

14WWW.SUMZERO.COM
LAUNCH RAZER GOLD AS A START OF
FINTECH BUSINESS
Decentralized and over scattered gaming credit is a problem
in the industry which resulting in a relatively small credit
purchasing amount. To solve the problem, Razer launched
Razer Gold in 2017 as a trial. Once gamers purchased Razer
Gold, they can connect to more than 2,500 hot games and
online stores including Razer Game Store and GamersGate
in the format of spending directly or exchange for a specific
credit in different games with more than 1 million retail points.
More importantly, gamers can rebate a versatility Razer Silver
when purchasing a Razer Gold to pay for Razer Store gaming
peripherals and exclusive equipment in specific games.
We believe the launch of Razer Gold may drive a +20% for
peripherals sale in 2020 and at least 10% after 2020.
PAYPAL’S INSIGHT AS A START. IN NOV 2020
Paypal officially opened cryptocurrency trading on their
platform while users can integrate cryptocurrency, including
bitcoin, on their e-wallet for normal e-commerce transaction.
We believe this is a giant positive fundamental change
since Razer can refer to the same manner to add major
cryptocurrency for realizing Razer Silver backed by a solid
demand which means rebate could be transformed to major
cryptocurrency directly. A more diverse realization channel
push the use of Razer Gold, thus enhancing the motivation.
The rebate scheme not only benefit the gaming credit but also
another FinTech business - Razer Pay.
GAMING DEMAND AS ENTRY TO START PAYMENT
BUSINESS
The launch of Razer Gold in 2017 settled the decentralized
gaming credit problem while the registered users had been
raised +40% in only half a year. It is obvious that the new
registration is demanding for Razer Gold. In the view of
this, Razer launched Razer Pay in Malaysia in 2018 and later
pressed ahead in Singapore with the aim to satisfy the online
payment to purchase Razer Gold. The idea is registered users
would take Razer Pay as the first payment priority even
outside purchasing razer Gold as they trust the brand name.
After the APP update in 2019 Feb, GMV has raised +1,500%

15WWW.SUMZERO.COM
YoY while +540% YoY for the average trading volume per
month. As long as more enterprises is willing to join Razer
Pay in the view of high payment users’ growth, GMV has
raised +114% YoY in 2020 H1 even under pandemic with more
than 1 million offline payment point which become one of the
largest O2O digital payment networks in SEA. We expect the
payment business will has a sharpen growth in 2021 driven
by 100 million Razer platform registered users with +45% YoY
MAU growth.
COOPERATION WITH VISA TAKES RAZER
PAYMENT TO THE NEXT LEVEL
In Oct 2020, Razer cooperates with Visa to launch a credit
card service with +1% cash rebate and +5% rebate on
Razer Store gaming peripheral products which expands
the application scenario to normal life and push the user
stickiness under the high rebate scheme. We expect the credit
card services drives +24% extra growth on GMV.
THE ROAD TO LICENSED FINTECH BUSINESS
On 4th Dec 2020, consortium of Razer and FWD failed to win
the first digital banking license issued by Monetary Authority
of Singapore. We believe the short-term selling flow is a very
attractive buying point to enter. Upon the license failure, we
might as well take a look on Alibaba experience.
[figure below]
Ant Group is a well-known FinTech arm of Alibaba. In actual,
Alibaba started the first FinTech business, Alibaba Small and
Micro Financial Services Company, in 2010 with the aim to
provide digital banking (lending) service. Due to the high
growth and absolute amount on GMV, Alibaba started FinTech
business in response to the financial planning demand and
a higher user realization efficiency. The logic is simple that
Alibaba launched additional banking related services after
the GMV is sufficient to cover user demand. We found that
Razer is on the road now. In 2010, the internet penetration
rate in only 34% in China while 61% in SEA today. In other
words, the GMV has to be at least 5.5+ billion USD to get
into the digital banking services today. By considering only
40% banking service penetration rate in SEA, Razer Youth
Bank is an excellent growth driver after GMV reached the
estimated hurdle to provide banking services while we expect
Razer can complete the target before 2022. In addition,
Razer is applying digital banking licenses in Malaysia and
the Philippines in parallel. By considering a lack of financial
market and GMV requirement than Singapore, we expect
Razer can get the licenses in 2021. We believe serving the
youth using gaming as the entry point is the correct way while
razer is on the road.
Gigantic digital banking market in SEA. As long as the digital
banking license failure in Singapore, investors may think this
is the end of Razer’s Fintech road because Singapore is the
financial market leader in SEA. We have a completely opposite
view. According to the internet economy report published by
Google, Temasek and Bain & Company, Singapore is not the
GMV leader in SEA.

16WWW.SUMZERO.COM
The logic of digital banking is simple while GMV is the first
consideration and financial market just serve as an assistant
role for banking tools providing. The statistics reflected that
digital banking opportunities are enormous in SEA but not
only Singapore. Since Singapore is not the GMV leader in SEA
while having a developed financial market, excess licenses
would affect the stability of financial system in certain. Grab
is supported by strong food delivery while SEA (company) is
supported by strong e-commerce experience which is enough
for the market acceptance in Singapore. We believe SEA
countries except Singapore need more digital banking licenses
and service providers to enhance the financial market backed
by solid GMV. Although Razer doesn’t win a digital banking
license in Singapore, we believe South East Asia is waiting for
Razer.
ALIBABA 3-YEAR GROWTH STORY AS REFERENCE
After the launch of Fintech business, Alibaba shows a high
growth after 2012. In 2014, the Fintech business contributed
0.15% revenue of GMV while the internet penetration rate
is only 47.9%. We believe Razer would follow the same
successful 3-year growth story in 2012-2014.
Although SEA GMV growth (estimated 20% CAGA growth) is slower than China GMV growth in 2013 and 2014, SEA shows a higher
internet penetration rate and absolutely low digital banking penetration rate (predicted 9.84% in 2023) which contributes to a higher
digital banking revenue realization because the statistics reflects that SEA residents need digital banking services backed by high GMV.

18WWW.SUMZERO.COM
Estimated +9.84% penetration rate means near 10% of GMV
would be transfer to digital banking revenue. By considering
Alibaba growth experience with 0.15% penetration rate, we
give 2.5% to Razer’s 2023 GMV for digital banking revenue
which would be used for P/S valuation. If Razer could gain
at least one digital banking license in SEA before 2023, the
above statistics would account for the high growth of digital
banking business.
LESSONS FROM GAMESTOP INDICATES EXTRA
REVENUE OPPORTUNITY
As long as the launch of Xbox Games Pass in 2017, traditional
gaming wholesaler faced a press. Under the new scription
model on cloud gaming, the revenue of Gamestop drops
significantly. To get out of the trough, Gamestop announced
a strategic partnership with Microsoft in Oct 2020 while they
earn commission for referring new Xbox gamers successfully.
The new revenue model is clear that cross-selling is the key.
For instance, Gamestop would recommend Xbox racing game
if the customers are seeking for a gaming steering wheel.
This model indicates active cross-selling in offline stores since
Razer is now cooperating with more than 33,000 games. We
expect when customers are seeking for Razer peripherals in
offline stores, salesperson will recommend the cooperated
games.
VALUATION
We have proven that Razer fulfills the criteria of quality
growth and deep value. To value the stock, we use P/E
method for existence business with the assistance of P/S
multiple for digital banking business while number of e-sport
gamers, gaming laptop market size, gaming hardware market
size, SEA GMV and Alibaba experience would be the key
assumption for valuation. We give Razer a target price $6.36
with 197% potential upside.
BETTER BRAND NAME AND PRODUCT QUALITY
THAN PEERS
Razer shows a better product edge proved by leading
technology and gaming hubs. More importantly, the most
updated sales figure states that Razer is the champion of
gaming hardware while user stickiness is proven at the same
time. We believe Razer should have a valuation at least no less
than the peers. Although Fintech business is included when
we use the P/E valuation to peers, it only accounts for 20% of
revenue structure while 30X P/E is a reasonable valuation. It
is clear that market prediction, 15X P/E, is undervalued while
value would be released since 2021.
GMV IS THE KEY FOR NEW FINTECH BUSINESS
FinTech business is hard to value because only few peers
could be referred in the market. We believe GMV is the key
of payment and digital banking business so realization of
GMV and Alibaba experience is used for prediction. SEA
(company) is definitely a good peer for Razer since SEA is
an e-commerce payment leader in South East Asia while
winning the Singapore digital banking license already. In a
long term, Razer would catch up SEA while 9.8X P/S valuation
is reasonable.
$6.4 target price in 2023. Overall, we give Razer a target price
$6.4 with a near 200% upside.

An exclusive database of 14K+ actionable and peer-reviewed research ideas with
complete performance attribution and firm transparency.
Real-time alerts with up-to-date commentary from sector/regional experts on
thousands of stocks and bonds uncovered by Wall Street and global banks.
Proprietary analyst rankings data, sentiment filters, private messaging, and more.
•
•
•
VISIT SUMZERO.COM ›
JOIN SUMZERO TO DOWNLOAD THE COMPLETE REPORT
WWW.SUMZERO.COM 20
CONCLUSION
This is a rare opportunity to own a company who will grow
above 200% in the future. Despite short-term decline in share
price due to the sell-flow, fundamentals of company do not
get any worse, but better as shown with its sales figure and
digital banking business expectation. Does it make sense
when peers did get worse already rebounded in valuation, but
Razer is still out of favor?
DISCLAIMER:
Any recommendations contained in this report may not be
suitable for all investors. Although the information contained
herein has been obtained from sources believed to be reliable,
its accuracy and completeness cannot be guaranteed.
Employees of Five States Capital may hold positions in the
recommended securities or in other securities of companies
mentioned in this report. This report may not be reproduced,
copied, duplicated or electronically forwarded without the
expressed written consent of Five States Capital. Buy or sell of
holding positions may be completed without any notification
or publication.

21WWW.SUMZERO.COM
Iifl Finance (iifl Holdings) Ord
L O N G
A granular retail credit platform run by a brilliant owner-operator with
best in class operating and growth metrics available at 0.85X Book and
<5X normalized profits with clear catalysts !
TIMEFRAME
2-5 Years
SITUATION
Growth At Reasonable Price
MARKET CAP
5.0M USD
About Morgan Housel
BAVARIA Industries Group AG is a family holding company that holds majority interests in companies showing clear potential for improvement or facing new challenges. Using our BAVARIA operating system helps the companies to identify potential cost reductions and performance enhancements and support the implementation of the measures considered necessary.
About Bavaria Industries Group
Gokulraj Ponnuraj is a value investor with a focus on small and mid-cap compounders and spin-off’s with a bias towards emerging markets. He has been investing in the Indian markets for more than ten years and in global markets for the last four years. Gokul manages the public equities portfolio at Bavaria Industries Group. The firm uses its balance sheet assets (permanent capital) to invest in opportunities with an attractive risk-reward trade off. Gokul holds a Master in Finance degree from London Business School and a CFA charter holder.
About Gokul Raj
FINALIST
Idea Posted: 12/13/2020
Asset: Equity
Idea Updated: 12/16/2020
Symbol: IIFL:IN
RETURN TO DATE:
EXPECTED RETURN:
116.83%
Gokul RajBADGES:Portfolio Manager at Bavaria Industries Group
Asia
CURRENT RANKING: #14 All-Time
ATTACHMENTS
148 245
-1.6%

22WWW.SUMZERO.COM
Asset Class: Equity Symbol: IIFL:IN Updated: 12/16/2020 Submitted: 12/13/2020
Iifl Finance (iifl Holdings) Ord
BY:
CURRENTLY AT:
Gokul Raj
A granular retail credit platform run by a brilliant owner-operator with
best in class operating and growth metrics available at 0.85X Book and
<5X normalized profits with clear catalysts !
ASSET CLASS:
Equity
SITUATION:
Growth At Reasonable Price
TARGET ALLOCATION:
5% - 10%
CATALYSTS:
Spin OffManagement Change
Corporate Restructuring
TIMEFRAME:
2-5 Years
EXPECTED RETURN
TARGET PRICE
INITIAL PRICE
116.83%
250.00 INR
117.15 INR
Pricing & Return Details LO N G
Disclaimer: The author of this idea and the author’s fund had
a position in this security at the time of posting and may trade
in and out of this position without informing the SumZero
community.
BRIEF INVESTMENT THESIS:
IIFL Finance is a well-run AA rated Indian NBFC that can
consistently grow at 20%+ CAGR by re-investing its profits
and compounding shareholder value. If the firm is able to
achieve its aspirational technology pivot towards an asset-
light
business model through Co-Origination & Loan Assignment
and also bring down its wholesale exposure substantially
down from the current 11% of AUM, I believe that the firm
will easily deliver multi-bagger returns in less than 3 years
through sheer valuation re-rating. In the long run, investing
in IIFL Finance is an opportunity to partner with a smart
and ethical owner-operator who can identify and execute
well on opportunities in the fast-growing Indian financial
services space. The firm is uniquely positioned to ride on its
large branch footprint created to support its gold loans and
microfinance business to roll-out other granular retail loans
like Home and Business credit in a cost-effective manner
and also cross-sell fee-based products through the group’s
expertise.
INVESTMENT THESIS
BADGES:
Bavaria Industries Group
148 245

23WWW.SUMZERO.COM
The platform’s ability to originate, underwrite, cross-
sell, and collect retail loans cost-effectively at scale in
sub-segments underserved by banks through better
execution would be valuable in an environment in which
liquidity constraints are lower. While headwinds from
increased credit costs post COVID exist, I believe that
there are enough tailwinds for the firm in terms of better
liquidity, lower funding costs, higher assignment income,
improved cross-sell fees, cyclical economic recovery,
rating upgrades, etc. The competitive peer set is benign
at this point as the 2-year liquidity freeze in the Indian
credit markets has led to consolidation with the exit of
several weak firms. While Indian NBFC’s across the board
(except the top 3) have been beaten down badly ever
since the IL&FS crisis, I believe that nimble firms with the
right portfolio exposures like IIFL Finance can compete
effectively in the market place and position themselves
well for the upcoming growth cycle.
5 REASONS WHY THIS ASYMMETRIC INVESTMENT OPPORTUNITY EXISTS!
1. INDIA’S LEHMAN MOMENT:
Indian NBFC’s (Non-Bank Financial Companies) were on
a tear until 2018 when the collapse of a large financial
institution (IL&FS) froze the credit markets completely.
The Indian bond markets have been dislocated for over
two years now as there has been a spate of large financial
bankruptcies that followed: DHFL, Yes Bank, Reliance
Capital, Religare, Franklin credit funds, etc. All NBFC’s had
to vacate the short term CP (Commercial Paper) market
as firms weren’t able to roll over these liabilities and shift
to longer tenure funding with an increasing dependence
on banks. The credit risk and term spreads have been
extremely elevated since then. You can see this from the

24WWW.SUMZERO.COM
securitized asset trading trends below,
India’s central bank and the finance ministry has put in
place multiple initiatives to heal the credit markets and
revive NBFC lending. As the central bank pumped in a
huge liquidity surplus to tackle the market stress, there
have been signs of bond markets reviving. As interest
rates have fallen significantly (over 200 bps), the spread
between AA bonds and AAA/ G Sec bonds has started to
compress and I believe that the search for yields would
flush in liquidity towards well-run AA firms like IIFL
Finance.
I believe that only a few NBFC’s like IIFL have come
out of this crisis without any meaningful hit to their
governance reputation. IIFL Finance had to reduce its
commercial paper exposure from 35% of its liabilities
in 2018 to almost zero now. They were able to make
this transition successfully while still growing their asset
base (10% growth even in a crisis year) because of their
ability to securitize/ assign granular liquid retail loans.
IIFL’s exposure towards short tenure loans like Gold
loans, Micro Finance loans also helped in better asset-
liability management with positive liquidity across time
buckets.
2. BAD CREDIT CYCLE IN A SLOWING ECONOMY:
Indian economy had been slowing down even before
COVID with 8 quarters of continuous reduction in GDP
growth rates on the back of a tight monetary and fiscal
policy. The country had also gone through several resets
in terms of Demonetisation, GST, RERA, IBC, etc which
exposed firms who were swimming naked. The credit
costs across financial institutions were creeping up and
the Indian financial sector as a whole has one of the
largest pile-ups of non-performing loans globally. The
massive COVID disruption has only added to the credit
woes of financial institutions.
IIFL Finance was able to navigate this tough credit
environment with little impact as its overall Gross NPA’s
rose by less than 60 bps and Net NPA’s by less than
30 bps during this period, outperforming its peer set
significantly. IIFL has also reported a healthy rebound
in collections as the COVID-related moratorium ended.
Similarly, the collateral values of its underlying loans
like Gold, Home, Real estate, etc have held up well and
hence even in the case of a default, the recovery would
be healthy as LTV’s continue to be below 65% across
segments. The firm had provisioned healthily upfront
for the COVID stress (114% GNPA coverage) and carries
overall provisions of 4.2% of on-book AUM despite
historical gross NPA’s being lower than 2%. The firm
has healthy pre-provision profits to continue generating
strong profitability (15-20% ROE) even while providing
for COVID stress. I expect the credit costs to normalize
in a couple of quarters as the economy seems to be
bouncing back quickly.
3. SPIN-OFF DYNAMICS:
The firm used to trade as IIFL Holdings until May 2019
post which its wealth and securities business was spun
off as separate listings. The combined stock had a market
cap of almost 4X of IIFL Finance’s and the wealth
business has almost 2X. I believe that the stock had to
undergo technical selling dynamics as with all post-spin-
off shares. I believe that this corporate restructuring
happened during one of the toughest periods for NBFC’s
and hence it hasn’t been priced well by the markets.
There has been very little analyst coverage on the stock
and it gets clubbed with other wholesale lending or
brokerage based firms that have a completely different
business profile.
Similarly, IIFL Finance has undergone meaningful
transition as the wealth business built its own NBFC
book overtime and the firm acquired a Micro Finance
institution and sold its CV lending book which makes
it difficult to compare historical financials. The firm has
only one standalone annual report but the investor
presentation (attached here) is pretty detailed and the
management call transcripts are insightful as well. I
expect the market to understand the business better over
time and give it the valuation it deserves.

25WWW.SUMZERO.COM
4. EXAGGERATED CONCERNS AROUND
REAL ESTATE LENDING:
Indian real estate lending firms went through a trial by fire
over the last 2 years as it has been the worst hit segment in
this whole liquidity crisis episode. IIFL Finance often gets
clubbed with other wholesale lending peers like Edelweiss,
Piramal, JM Financial, etc because of its history in funding
real estate developers. While the firm initially started with
construction finance at the start of the decade, it has
been defocusing that segment since early 2016 as the
management believed that the better lending opportunity
was in the retail segments. The firm’s wholesale lending
AUM is less than 12% of its overall portfolio but in
absolute terms equals 88% of its book value.
I believe that the fears around the firm’s wholesale
construction financing book are exaggerated as it carries
around 13%+ provisions for this book (580 Cr provisions
on a 4000 Cr book). Also, the firm has started providing
detailed disclosures on this book with a large part of their
exposure being towards late-stage construction projects
in the affordable housing segment. The management
also discloses the stress test results of this portfolio with
assumptions that have clearly not turned true. It is very
clear from primary data over the last few months that the
Mumbai real estate market has picked up significantly post
unlock especially in the affordable segment from reputed
developers and hence I believe there is enough reason to
believe that the firm is more than adequately provided on
this portfolio.
IIFL has been prudent in ensuring that they are the sole
lenders in all their projects with proper ring-fenced
structures and personal guarantees from promoters.
The biggest risk with the real estate lending portfolio
is projects getting stuck midway because of liquidity
constraints. In IIFL’s case, the firm needs only around 350
Cr of incremental disbursements to complete it’s under
construction portfolio. The management has also been
pro-active in roping in new developers, fund infusion, etc
for the resolution of slow-moving projects.
Most importantly, I believe that the wholesale lending
portfolio can decrease by over 50% naturally as they
get refinanced by banks once they are near completion.
So even without any management action, it should
become less than 5% of overall AUM in the next 6-8
quarters as the retail portfolio will continue to grow
strongly. Meanwhile, the management has clearly
stated their intention of selling this wholesale portfolio
within the next 3 months and I believe that would be
the single biggest catalyst for valuation re-rating. The
management has already started negotiations with
external investors for this portfolio and they don’t
expect any higher provisions/ write-down from this sale.
5. UNDIFFERENTIATED SPACE /
COMPANY-SPECIFIC CONCERNS:
The freezing of Indian credit markets had broken
the business models of several NBFC’s as they didn’t
have access to a low- cost deposit base and became
dependent on the banks to roll over their existing
liabilities. This made them totally uncompetitive in any
lending segment in which their primary competitor
were banks or in segments where there were no natural
buyers for their loans. This completely changed the
investment thesis of NBFC’s from nimble market share
gainers to losers and thus the tremendous de-rating.
The wholesale NBFC’s had to move their portfolios
to AIF structures or de-grow their balance sheets in
absolute terms to survive the crisis.
IIFL Finance has been able to grow during this period
because of its focus on granular retail loans that are
liquid and are difficult to access for the banks. Even in
segments like home loans where banks have a strong
presence, IIFL Home Finance has focused on Tier-3
cities or on customers in niches like the self-employed
segment where there is underwriting/ collections
complexity. In most of its lending segments, the biggest
competitor for the firm were from other NBFC’s/ HFC’s
(Housing Finance Companies) and hence they have

26WWW.SUMZERO.COM
benefited from the reduced competitive intensity. Their
pricing power can be seen from sticky NIM’s that they
were able to generate through this crisis. The firm’s
securitization/ assignment history has ensured that
banks were ready buyers for these priority sector loans
to fulfill their regulatory obligations.
Since IIFL’s onboarding yields on all their credit
segments except home loans are upwards of 15%, I don’t
believe that a few bps of higher borrowing costs breaks
their business model. I believe that lending successfully
to these segments is primarily a function of efficiency
and the winner is usually a firm with the right people,
processes, and branches to source, disburse and collect
loans in a cost effective manner. For example, the total
employee cost is almost 25% of the net interest income
and 65% of the total fixed expenses. IIFL employs
almost 17, 300 people, and the higher operational cost
(50% cost/ income ratio) for banks to replicate IIFL’s
employee or branch count would more than negate their
borrowing cost advantage.
One of the other concerns for markets has been the
relatively higher gearing of IIFL Finance (6X - Debt/
Equity) with limited room for growth. I believe that
the total capital adequacy at the firm’s Holdco level
is 18.7% with 15% of Tier-1 equity, but the majority
of the growth (60%+) is happening at the subsidiary
levels (Housing Finance subsidiary and Micro Finance
subsidiary) which have 24.3% (Tier 1 - 19.4%) and
23.9% (Tier 1 - 19.5%) capital adequacy respectively.
Also, they have gold loans at the Holdco level which can
be sold even in a distressed market for upfront profits to
boost equity capital if required. The business generates
15%+ ROE even during a stress period and hence they
would be able to grow at a healthy pace without diluting
their equity capital.
5 REASONS WHY IIFL FINANCE CAN BE A LONG TERM COMPOUNDER!
1. NIMBLE MANAGEMENT WITH A HISTORY OF
STRONG EXECUTION:
While IIFL Finance has been run by two professional
CEOs over the last 5 years, the group’s founder
Chairman Mr. Nirmal Jain (age-53) who took over as
CEO of the firm earlier this year has always been a
hands-on manager of the credit business. He is a first-
generation professional entrepreneur who foresaw the
growth opportunities in the Indian financial services
space and executed well to build four well-governed
publicly traded businesses with a combined market
cap of over 16,000 Cr - IIFL Wealth (India’s largest
wealth and alternative asset manager), IIFL Securities
(Equity capital market focused broking and investment
banking business), 5 Paisa (India’s 3rd largest discount
brokerage) and IIFL Finance. He has achieved this by
being able to attract the right talent and incentivizing
them through equity ownership. All the group entities
are run by CEOs with substantial skin in the game and
hence Nirmal is able to spend over 80%+ of his time
on building IIFL Finance as the leading retail lender. He
hasn’t sold a single share of his since the group’s listing
and just clips dividends from his holdings.
IIFL Finance has executed well on scaling the retail
credit business aggressively from an AUM of <1,000
Cr in 2010 to 12,000 Cr in 2015 to 35,000 Cr in 2020.
They have managed risks well through adequate
diversification by continuously adding new segments
and moving into lower ticket categories (Net NPA’s
have consistently been below 1%). The management
was prudent and ahead of its peers in shifting the
business model away from wholesale lending when the
easier route for AUM scale-up was to press the pedal
on construction and structured finance in which IIFL
had an established business. IIFL’s management has
not just been nimble in spotting new opportunities
but also in adapting to reality quicker as they did with
the disposal of their CV lending immediately post the
IL&FS crisis or tapping the foreign bond markets at the
right time.

27WWW.SUMZERO.COM
While several NBFC’s have quickly grown their wholesale
book, I believe it is very unique for a professional
entrepreneur to build a 35,000+ Cr retail lending book
within a decade from scratch. Even larger NBFC’s like
Aditya Birla capital or L&T Finance has a smaller retail
book than IIFL Finance and other well run larger ones like
Bajaj, Mahindra, Sundaram, Cholamandalam, etc have an
Industrial house backing and a longer operating history.
With a strong base built, I believe that IIFL Finance is
well placed to continue scaling up its book over the next
decade by capitalizing on the credit opportunities that will
arise as India grows from a 2.5 Trillion $ economy to an
8-10 Trillion $ economy.
2. RIGHT EXPOSURE TO ATTRACTIVE
CREDIT SEGMENTS:
IIFL Finance’s retail credit AUM break-up is as follows:
Home Loans (36%), Gold Loans (32%), Business Loans
(22%), and Micro Loans (10%). While Home loan is a long
tenure asset, business loans are medium tenure and Gold
& Micro loans are shorter tenure and this diversification
enables better asset-liability matching. I believe that
the firm has found the right team, cost structure, and
processes in each of these segments to scale up their book
going forward. Indian retail credit is a huge opportunity
with low household debt/ GDP and a young aspirational
population. The firm doesn’t need to take higher credit
risks as there are enough underserved segments because
of the Indian lending landscape being tilted towards PSU
Banks (over 50%+ share) who are extremely inefficient as
shown from their credit costs in like-to-like segments at 3X
of well run NBFC’s like IIFL FInance.
GOLD LOANS - I believe that IIFL’s biggest execution
success has been in gold loans which is a pull product with
very high OPEX. While every analyst understands that Gold
loan lending has tremendous tailwinds for the next few
years, I don’t think many realize that IIFL’s gold loan book
(AUM of 11,400 Cr) is the fastest-growing among scaled-
up NBFC’s and is already the 3rd largest at around 60%
the size of Manappuram’s and 25% of Muthoot’s. The firm
has recently roped in Indian cricketer ‘Rohit Sharma’
as its brand ambassador for its marketing campaigns. I
believe there is still headroom for higher disbursements
from its existing Gold loan infrastructure and the
business can continue growing faster than peers for the
next few years. Gold lending leaders like Muthoot and
Manappuram have had a long and successful operating
history in the Gold lending segment but have found it
difficult to diversify into newer segments.
HOME LOANS - In home loans, IIFL Finance’s average
onboarding ticket size is 15 Lakh Rs and they are one
of the largest processors of affordable housing subsidy
targeted towards first-time buyers. While this is a
yield sensitive segment unlike others, IIFL’s strategy
here is to assign/ securitize lower-yielding loans while
generating fee income through cross-selling of other
financial products to maintain 20% ROE’s. Similarly, since
they focus on difficult-to-access segments in terms of
geography or client profile, they are able to get almost
20% of their home book to be funded by NHB refinance
at subsidized rates, and that allows them to compete
effectively against larger HFC’s or banks. The churn on
their home loans to refinance/ balance transfer is only
12-15% of their opening book. With 3 of the top-5 HFC’s
in major trouble, the management sees them going up
the market share ladder from Top-10 in the mortgage
industry to Top-5 over the next few years.
BUSINESS LOANS - The split between secured and
unsecured business loans is 67% and 33% respectively.
As with the other segments, IIFL Finance has
continuously increased the granularity of their loans
by reducing the average ticket size from 90 Lakhs in
2016 to around 18 Lakhs now. This has allowed the
firm to increase the onboarding yield from 13% to 18%
during this period. Around 75% of their business loan
customers are small retailers and traders and only 25%
are in the manufacturing sector. I believe that the small
service business owner is extremely underserved and
often depends on informal financial lenders for his
credit needs. They are able to assign roughly 10% of this
portfolio to banks. COVID- related stress is highest in this

28WWW.SUMZERO.COM
portfolio and hopefully, the key learnings from this cycle
will enable the firm to tweak its processes and scale-up
this business going forward amidst weakened competition
especially on the unsecured business loans.
MICRO LOANS - The firm’s micro loans business is a
result of its acquisition of Samasta Microfinance whose
founder continues to run this segment. This business
has allowed the group to expand its branches into small
villages while delivering profitable growth. Currently,
health insurance is the only cross-sold product from
these MFI branches (560 in total) but the management
has tested a few pilot projects of rolling out home and
business loans out of these MFI branches which have been
successful and would be scaled up going forward. The
firm’s MFI portfolio is well-diversified geographically and
has an average loan size of 33,000 Rs.
3. ROBUST BRANCH INFRASTRUCTURE &
TECHNOLOGY INVESTMENTS:
IIFL Finance has one of the most expansive branch
network spread out across India with a total count of 2400
which is higher than several large NBFC’s that are multiple
times bigger. The management has grown its branch count
at an impressive rate with it being doubled over the last
5 years alone. The firm hasn’t rolled out all its lending
products from all branches and I believe that there are
still meaningful operational synergies and leverage to be
extracted going forward which should help it to decrease
the cost to income ratio. With 85% of its branches in Tier-
2 and 3 locations, IIFL has the ability to put together a
geographically diversified pool of securities that can be
sold to banks and other investors.
IIFL’s gold loan business would always require a physical
branch in a convenient location with adequate security and
vaults for their walk-in customers. This branch network
enables the firm to roll out other lending products at
minimal costs. For example, the operating cost of running
a gold loan business is almost 7-8% of AUM and this
can be spread over other credit products. Gold loans as
a standalone business covers the entire fixed costs of
the platform, providing tremendous advantages to its
other segments. Gold loans are currently disbursed out
of 1740 branches but the home & secured MSME loans
are sourced only in 450 branches as they didn’t want to
spread themselves too thin. The management is mapping
their gold branches with nearby HFC branches and this
will enable them to grow distribution as the firm has
completely digitized its home loan processing end-to-end.
The firm’s robust branch network combined with its
investment in technology would enable them to provide
a far better phygital/ omnichannel experience when
compared with fintech peers. The management has used
the COVID crisis to dramatically overhaul its cost base by
automating several processes and reducing turnaround
time through process innovations. They expect all their
sales leads to be generated digitally or through walk-in
customers and thereby reduce the requirement of sales
employees. IIFL has made the processes for all its loans
digital, paperless, and to a large extent faceless. All
these technology investments have enabled it to provide
complete transparency on the loans to their bank buyers.
Indian policymaking is moving towards OCEN (open credit
enablement networks) which would help the firm to access
alternate user data digitally with consent from customers
and this should enable digital underwriters with experience
like IIFL to grow quickly over the next decade. The firm
has already tied-up with several technology companies
with first loss guarantees to disburse digital loans for
their customers with a current book size of 400 Cr. The
group has always been comfortable with large technology
investments since inception as they started their journey
as an internet-based brokerage business with a strong
trader terminal to cater to the DIY customer base but lost
their focus with diversification into other financial services.
Nirmal Jain has learned from his mistakes in the brokerage
segment in which they were late to the mobile app-based
discount brokerage game and had to cede market share
to upstarts like Zerodha. He doesn’t want a repeat of
that in the retail credit business and hence wants to keep
investing heavily in technology going forward as well.

29WWW.SUMZERO.COM
4. BUSINESS MODEL PIVOT IS HIGHLY
ROE ACCRETIVE:
IIFL’s management has made a pivot towards a capital-
light business model that can be captured under the
tagline “Own the customer, Sell the loan”, post the IL&FS
liquidity crisis and the recent corona virus disruption.
They are moving more of their loans towards either a
co-origination model with public sector banks (PSB’s) or
securitize/ assign their loan pools to transfer the balance
sheet risks while clipping fee income. In the co-origination
model, the customer also benefits as the borrower gets
a lower blended interest rate of the two lending partners
which enables a Win-Win relationship for all stakeholders.
In any liquidity crisis, money moves towards PSB’s as they
have the strongest liability franchise. The biggest weakness
of PSB’s is their bloated OPEX cost structure and lack
of a good underwriting culture that makes them totally
uncompetitive in the small-ticket retail lending segments.
Thus IIFL Finance is an ideal partner for PSBs to grow their
retail finance books by buying their asset pools. Since IIFL
Finance will continue to own the customer relationship,
they will have the ability to generate fee income by cross-
selling investment/ insurance products (almost 10% of
PAT) throughout the loan tenure using the group’s financial
product distribution expertise.
As of today, IIFL Finance’s on-balance sheet assets
are 73% of AUM, and assigned loans are 27%. The
management believes that they will be able to shift more
of the AUM towards assigned and co-originated loans
which would enable them to grow faster without any
equity/ debt capital constraints. The firm currently works
with multiple banking/ financial institution partners but
around 80% of the assignment sales is to PSB’s. Almost
35% of its gold loan and home loan books are assigned to
partners and the firm has been able to generate almost
6% of AUM on its assigned assets which is an indication of
healthy pricing power.
One of the major concerns of the assignment model is
the buyers’ ability to cherry-pick the best assets which
would leave the higher risk non-performing assets on
IIFL’s balance sheet. The firm’s gross NPA’s in on-balance
sheet assets is definitely much higher than that of its
overall AUM, but the difference isn’t meaningfully large
to be concerned. While it has been a buyers market over
the last 2 years as several weaker players were desperate
sellers of their loan books, I believe that the pricing on
assignment transactions would tighten going forward as
there is surplus liquidity in the system (seller’s market)
and the weaker players have been weeded out. NBFC’s
losing seasoned books/ customers to cheaper bank
refinancing has always been there even in the older
lending model and is nothing new to be worried about.
I also believe that some analysts wrongly believe that
the co-origination and assignment models have no entry
barriers. IIFL has ready buyers for its retail pools primarily
because of the firm’s track record. Their securitized/
assigned assets in general have performed much better
than the credit expectations of buyers. All assignment
transactions with NBFC’s start off on small pools and,
partner banks scale up their purchases only after
witnessing the performance of the originator’s assets
across a few loan cycles. This evolution is pretty similar
to how a finance firm generally moves up the rating
curve with lower borrowing costs as it executes well by
managing risks across cycles. The spread for a similarly
rated pool that is originated by firms with different
governance perception can be as high as 100-300 bps.
The successful execution of shifting more AUM under
co-origination and assignment models would result
in IIFL Finance becoming a capital-light business with
sustainably high ROE’s. While banks are the primary
buyers of loan pools at this point, I believe that quality
originators like IIFL Finance will have access to a
diversified investor base in the future with the evolution
of insurance firms, pension funds, alternate funds, etc. The
recent reforms on creation of CDS markets, IBC, etc along
with sustainably lower interest rate regime and digital
distribution costs will help to create a proper high yield
credit market and broaden the investor participation for
loan pools.

30WWW.SUMZERO.COM
5. JUICY VALUATIONS BACKED BY
HEALTHY EARNINGS GROWTH:
I believe that the accounting around assignment
transactions makes it slightly complicated to understand
the normalized earnings power of IIFL Finance. In
assignment transactions, the net interest margin strip
between the pool’s loan yield and the buyers’ cap rate (the
rate at which the bank wants to lend to IIFL + its credit
loss expectations on the pool with a buffer) is discounted
back and booked immediately in the P&L statement.
Since the credit risk is entirely transferred to the buyer,
the upfronting of income is fair and mandated under
IFRS. Unwind of the discount rate from the NIM strip and
amortization of fee income are spread over the tenure of
the loan through the firm’s P&L statement. IIFL Finance
usually charges around 25 bps maintenance fees on
assigned assets.
Currently, 65% of IIFL’s fee income is from credit
processing related fees and 35% is from cross-selling
income. Fee Income is incrementally around 25-30% of
the firm’s overall profits and the management expects it
to improve it to 30-35% over the medium term. Roughly
50% of the assignment income is up-fronting of NIM
from the sale of assets in that quarter and the remaining
50% is from the discount unwind of the assignment back
book along with maintenance fees. Hence there is healthy
predictability in the firm’s income statement and we
don’t need to do any major adjustments to calculate the
normalized earnings power as the trend of assignments is
only expected to accelerate going forward.
Even during the last quarter when there were additional
provisions for COVID, the firm was able to generate over
17% ROE. IIFL Finance in H1FY21 has generated a profit
before tax of almost 800 cr if you exclude the special
provisions for COVID related stress. The firm’s high
pre-provision profits would enable it to survive even if
economic stress continues for many more quarters. If the
economy normalizes quickly, I believe that the firm will
generate almost 1400 Cr of profit after tax next year (3X
PAT of FY 22E). It’s not very difficult to understand that
the current trading valuations of 0.85X Price/ Book and
<5X normalized earnings is extremely juicy for a well-run
business with healthy growth prospects.
CONCLUSION - NEAR TERM CATALYSTS AND LONG TERM OPTIONALITIES:
IIFL Finance is a play on the megatrend of ‘Formalization
and Financialization of Indian economy’ over the next
decade. Unlike developed markets, the Indian retail credit
opportunity is extremely attractive as well run financiers
like IIFL Finance are able to originate secure Gold or
Home loans at 70% LTV ratio with a spread of over 800
bps on Gsec’s. IIFL’s team has navigated through several
challenges over the last decade and built a strong retail
credit platform to ride the next wave of growth.
I believe that the immediate near-term catalysts for the
stock would be the sale of the wholesale loan book,
lowering of borrowing costs, and a sustainable pick-up in
home sales on the back of lower interest rates. Over the
next 4-8 quarters, I believe that stabilization and possible
up-gradation of its credit rating would be possible. The
broader economic recovery and the declared profits
of IIFL Finance over the next few quarters should in
itself catch the attention of market participants. IIFL’s
Promoters currently own 25% of the firm while long-term
investors like Fairfax and CDC own 30% and 15.5% of the
firm respectively. Since almost 75% of the firm is held by
strong hands, the real free float of the stock is limited
and hence any large incremental buying could re-rate the
stock quickly (promoters did small creeping acquisitions in
H1, 2020, but they are limited at 25% because of the open
offer regulations).
In the long-term, I believe that the end game for IIFL
Finance would be to convert itself from an NBFC to a
universal bank. Since the group is focused only on financial
services and has a history of transparent operations under
various financial regulators like SEBI, IRDA, NHB, RBI, etc, I
believe that it would face little resistance from the banking

An exclusive database of 14K+ actionable and peer-reviewed research ideas with
complete performance attribution and firm transparency.
Real-time alerts with up-to-date commentary from sector/regional experts on
thousands of stocks and bonds uncovered by Wall Street and global banks.
Proprietary analyst rankings data, sentiment filters, private messaging, and more.
•
•
•
VISIT SUMZERO.COM ›
JOIN SUMZERO TO DOWNLOAD THE COMPLETE REPORT
WWW.SUMZERO.COM 31
regulator to convert to a bank over the next decade. Even
otherwise, I believe there could be a possibility of Fairfax
backed CSB Bank merging with IIFL Finance as the former
needs to reduce the promoter shareholding and there are
synergies between CSB’s liability franchise and IIFL’s asset
franchise. I think Nirmal Jain wants to emulate Uday Kotak
in building a large financial services group with a retail
bank as the nucleus. Anyways an investor in IIFL Finance
at the current valuations only needs a normalization in
the credit environment to generate healthy returns and
these long-run ambitions are just free optionalities.
DISCLAIMER: We own around 1% of IIFL Finance and
hence I am completely biased. We haven’t bought or sold
the stock in the last 30 days. Please consult your registered
investment advisor. I have had a regulatory issue in the
past because of my board membership at a previous
employer and that has been resolved. We might buy/ sell
shares without informing SumZero’s members.

32WWW.SUMZERO.COM
Shangri-La Asia Limited
L O N G
Covid-19 is an opportunity to buy this well-established
brand name
TIMEFRAME
2-5 Years
SITUATION
Event / Special Situations
MARKET CAP
3.3B USD
About Morgan HouselInvesting since 1991, EDBI is a Singapore-based global investor in select high growth technology sectors ranging from Information & Communication Technology (ICT), Emerging Technology (ET), Healthcare (HC) and other strategic industries. As a value creating investor, EDBI assists companies achieve their ambitious goals by leveraging our broad network, resources and expertise. With our growth capital, EDBI supports companies seeking to grow in Asia and globally through Singapore.
About EDBI
FINALIST
Idea Posted: 12/17/2020
Asset: Equity
Idea Updated: 12/20/2020
Symbol: 69:HK
Eric SeePortfolio Manager at EDBI
Asia
ATTACHMENTS
RETURN TO DATE:
2.49%
EXPECTED RETURN:
143.24%

33WWW.SUMZERO.COM
Asset Class: Equity Symbol: 69:HK Updated: 12/20/2020 Submitted: 12/17/2020
Shangri-La Asia Limited
BY:
CURRENTLY AT:
Eric See
Covid-19 is an opportunity to buy this well-established
brand name
ASSET CLASS:
Equity
SITUATION:
Event / Special Situations
TARGET ALLOCATION:
1%-1.5%CATALYSTS:
N/A
TIMEFRAME:
2-5 Years
EXPECTED RETURN
TARGET PRICE
INITIAL PRICE
143.24%
18.00 HKD
7.22 HKD
Pricing & Return Details LO N G
COMPANY BACKGROUND
Shangri-La Asia Limited (“Shang”), is a hospitality group
that is focused on the ownership and management of
hotels under the Hong Kong-based Shangri-La Hotels and
Resorts, a leading luxury hotel group. In addition to hotels,
Shang also holds a portfolio of investment properties for
rental and develops properties for sale.
Company has a portfolio worldwide with a total of 102
owned and/or managed hotels and owned stakes in 23
investment properties across 27 countries. Its presence is
mainly in the Asia Pacific, especially within Hong Kong/
Mainland China.
BUSINESS SEGMENTS
HOTEL OWNERSHIP
Company owns and/or manages a total of 102 hotels under
its registered brand names of “Shangri-La Hotels and
Resorts”, “Kerry Hotels”, “Hotel Jen” and “Traders Hotels”.
These are usually 5-star deluxe hotels, located centrally in
each city. , “Shangri-La Hotels and Resorts” is the marquee
brand of the group.
“Kerry Hotels” cater to business travellers, combining a
vibrant and relaxed environment with service and quality
through integration of business, entertainment and
recreation.
INVESTMENT THESIS
EDBI

34WWW.SUMZERO.COM
“Hotel Jen” is a unique brand designed to appeal to a ‘New
Generation’ of travellers via a mix of style and service delivery.
“Traders Hotels” properties owned by SHANG have been
gradually redeveloped and rebranded as “Hotel Jen”, with the
only 3 remaining owned by third parties.
CHINA BUSINESS TRAVEL DEMAND IS
RECOVERING
According to the latest CITS American Express Global
Business Travel survey, 31% of the Chinese corporate
respondents expect to increase corporate travel budgets in
the coming year, a jump from 17% last year. This is positive for
Shangri-la as business travellers account for c. 65% of its room
nights.
Unlike other hotel operators, Shang owns an asset-heavy
strategy when it comes to the Hotel Properties segment,
holding equity interests in 79 hotels. SHANG has a 51% or
more ownership stake in 55 out of 79 of those properties.
Of these, it has full ownership of 34 hotels. This accounts
for a room inventory of 25,405 keys after adjusting for its
proportionate ownership (from a gross total of 34,993 keys).
Hotel Management is operated via SHANG’s wholly-owned
subsidiary, SLIM International Limited. This is a small business
of Shang.
PROPERTY RENTAL
Shang also owns properties comprising office, commercial
and residential spaces, with a total GFA of ~920,000 sqm
after adjustment for proportionate share which it rents out.
Its property portfolio are located in strategic locations across
Asia. For example, in Mainland China are situated in Tier 1
cities, Beijing, Shanghai, Tianjin, and Tier 2 cities, Dalian,
Qingdao, Hangzhou, Chengdu. Meanwhile, properties in
Singapore are located in prime locations near prime shopping
belt Orchard Road. The properties in other countries are
located in capital cities or commercial centres, with the
exception of the Cairns which is a popular tourist destination
in Australia.
The operating income from property rentals is expected to
be anchored by China World Trade Center which accounts
for 32.2% of total GFA (after adjustment for proportionate
interests). China World Trade Center, the largest up-market
commercial mixed-use development in the world, along with
Century Towers Beijing, are both owned by China World Trade
Center Company Limited (“CWTC”) (listed), in which Shang
owns a 50% equity interest.
PROPERTY SALES
Company traditionally held equity interests in composite
developments in Mainland China, the Philippines and Sri
Lanka, with its sister company, KPL.
CORPORATE STRUCTURE
INVESTMENT THESIS
SIGNIFICANCE OF THE SHANGRI-LA BRAND
Shang’s brand is uniquely positioned as a leading luxury
hotel group providing 5-star hotel accommodation. This
brand equity creates intangible benefits to its other business
segments namely in the rental as well as the property sales
segment. Shang has also expanded beyond the luxury tag and
entered into the mid-market segment, with its brands “Kerry
Hotels” and “Hotel Jen” targeting the business and younger
travellers respectively. Sales from F&B also form a significant
source of revenue ~40% of revenue from hotel operations.
ASSET-HEAVY HOTEL OPERATOR WITH
TANGIBLE VALUE
Shang owns 25,405 keys, representing an attributable 73%
(ie: 25,405 out of 34,993 keys), which is significant versus its
asset-light operators. Most of these hotels are also located

35WWW.SUMZERO.COM
at key Asian gateways like Shanghai, Shenzhen, Hong Kong,
Singapore, Kuala Lumpur and Manila.
We prefer hotel operators with an asset heavy portfolio. As
it forms a baseline for minority equity holders position in the
company, and do not place too much emphasis in the brand
value and operating experience associated with asset light
operators. Hotels as an asset class are in a unique position
where the brand and day-to-day management are important
income drivers. Hotel-by-hotel income and valuation are not
provided although number of rooms by property is provided.
IMPROVED OPERATING EFFICIENCY
Management has started to centralize some of the back-
of-house functions, including procurement, IT, human
resources and finance. Management sees annual cost savings
potentials of US$50-100m when this ‘Shared Services’ plan
is fully implemented. For example, only 10% of the group’s
US$1.2bn procurement is handled at the corporate level. More
importantly, management believes that creating a consistent
and reliable back-of- house function can help the group win
more management contracts. In terms of pricing, the group
will also strictly enforce its pricing agreements with the online
travel agencies (OTAs) so that they do not undercut the group’s
best available rates.
COVID-19 IS AN OPPORTUNITY TO BUY THIS
WELL-ESTABLISHED BRAND NAME
There are not many opportunities to be able to capture a
sizeable, well established, and market leader in its segment in
every industry. In hotels, it is no exception. However, due to the
effects of covid-19 and travel restrictions, business performance
for 2020 has been impacted. It is however, our view that this is
a temporary delay of the busines by a year, or more aptly we
categorically put Shang as one of the companies where 2020
has been a lost year for the company. While we are uncertain
how speedy travel will resume with the approval of the vaccine,
or to what magnitude will it recover to pre-covid levels, but
recent quarterly results shows that it is above 70% recovery
from pre-covid. Fundamentally, we believe that luxury travel
will resume in a V shape recovery as consumers will tend to
spend most of their discretionary spending in holidays and
travel when the health situation turns for the better. However,
the slowdown in the economies of the various countries do
present a risk factor to the overall thesis.
VALUATION
We use a SOTP valuation to value the group. Based on the 3
business segment. We noted that the China portfolio takes
up a significant portion of the hotels business. On a group
basis, accounting for subsidiary and associates also form large
portion of the valuation of the group.
As stated, as hotel management and property development is
not a core business of the group, it presents a small portion of
the overall group value. We deem this as non-core.

An exclusive database of 14K+ actionable and peer-reviewed research ideas with
complete performance attribution and firm transparency.
Real-time alerts with up-to-date commentary from sector/regional experts on
thousands of stocks and bonds uncovered by Wall Street and global banks.
Proprietary analyst rankings data, sentiment filters, private messaging, and more.
•
•
•
VISIT SUMZERO.COM ›
JOIN SUMZERO TO DOWNLOAD THE COMPLETE REPORT
WWW.SUMZERO.COM 36
Current price of HKD 7.22 is a discount of 60% discount
to the NAV
POTENTIAL RISK
Slower than expected recovery in hotel bookings to Covid-19
levels Slowdown in economy affecting future growth in RevPar
Mark down in valuation of its portfolio assets
Unable to achieve cost optimization efficiency.
High gearing ratio, with a large proportion in fixed rates.
CONCLUSION AND RECOMMENDATION
Shang is an established hotel owner and operator, focused on
the Asia-Pacific region. Its predecessor and related entities set
up the first “Shangri-La” in Singapore in 1971, Hong Kong in
1981 and was an early entrant into the Mainland China luxury
hotel market in 1984. It has a recurring income stream from
the Hotel Properties segment. The group has shown resilience
during the peak of the covid period, primarily from a strong
sponsor behind the group. The current price of HKD 7.22
has a good margin of safety from the Net Asset Value. There
are positive catalyst from the recovery of travel. The strong
sponsor coupled with the low interest rate environment allow
the group to be opportunistic during such times to be on the
lookout for accretive acquisitions. If there is a lack of targets,
it will also give the group an opportunity to bring down the
cost of financing, through refinancing with some of the higher
loan facilities, and potentially switch from fixed to floating
rates in order to reduce the interest expense of the group.
The action items discussed above are pockets of opportunity
for the management team, introduced in 2017, to increase the
value of the group to its shareholders. As such, in conclusion,
we recommend a buy at current price of HKD 7.22.

Ideas on companies whose respective market capitalizations
were less than US $300M at the time of submission.
MICRO CAPS
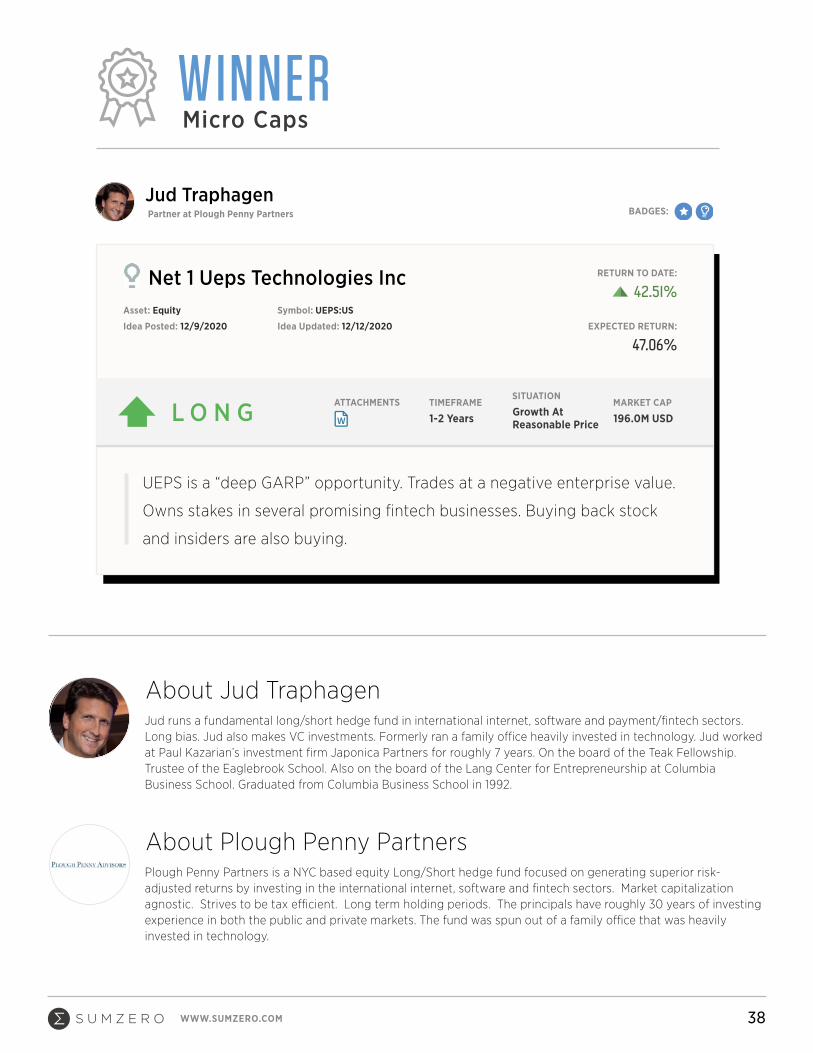
38WWW.SUMZERO.COM
Net 1 Ueps Technologies Inc
L O N G
UEPS is a “deep GARP” opportunity. Trades at a negative enterprise value.
Owns stakes in several promising fintech businesses. Buying back stock
and insiders are also buying.
TIMEFRAME
1-2 Years
SITUATION
Growth At Reasonable Price
MARKET CAP
196.0M USD
About Morgan Housel
Plough Penny Partners is a NYC based equity Long/Short hedge fund focused on generating superior risk-adjusted returns by investing in the international internet, software and fintech sectors. Market capitalization agnostic. Strives to be tax efficient. Long term holding periods. The principals have roughly 30 years of investing experience in both the public and private markets. The fund was spun out of a family office that was heavily invested in technology.
About Plough Penny Partners
Jud runs a fundamental long/short hedge fund in international internet, software and payment/fintech sectors. Long bias. Jud also makes VC investments. Formerly ran a family office heavily invested in technology. Jud worked at Paul Kazarian’s investment firm Japonica Partners for roughly 7 years. On the board of the Teak Fellowship. Trustee of the Eaglebrook School. Also on the board of the Lang Center for Entrepreneurship at Columbia Business School. Graduated from Columbia Business School in 1992.
About Jud Traphagen
WINNER
Idea Posted: 12/9/2020
Asset: Equity
Idea Updated: 12/12/2020
Symbol: UEPS:US
RETURN TO DATE:
42.51%
EXPECTED RETURN:
47.06%
Jud TraphagenPartner at Plough Penny Partners
Micro Caps
ATTACHMENTS
BADGES:

39WWW.SUMZERO.COM
Asset Class: Equity Symbol: UEPS:US Updated: 12/12/2020 Submitted: 12/9/2020
Net 1 Ueps Technologies Inc
BY:
CURRENTLY AT:
Jud Traphagen
UEPS is a “deep GARP” opportunity. Trades at a negative enterprise value.
Owns stakes in several promising fintech businesses. Buying back stock and
insiders are also buying.
ASSET CLASS:
Equity
SITUATION:
Growth At Reasonable Price
TARGET ALLOCATION:
2% - 5%
CATALYSTS:Management ChangeInsider Buying/Selling
Corporate RestructuringSubsidiary IPO
TIMEFRAME:
1-2 Years
EXPECTED RETURN
TARGET PRICE
INITIAL PRICE
47.06%
7.00 USD
3.34 USD
Pricing & Return Details LO N G
EXECUTIVE SUMMARY
• Recommendation: Long with a 6/30/21 price target of
$7.00 reflecting 108% upside to the current share price
of $3.36.
• Business Overview: Net 1 UEPS Technologies, Inc. (“Net1”,
“UEPS”, or “the Company”) provides payments and financial
services in South Africa. In addition, it has a portfolio of
minority stakes and VC investments in various financial and
FinTech businesses (“non-core assets”). The business is
headquartered in Johannesburg, South Africa and employs
2,875 globally.
INVESTMENT THESIS
BADGES:
Plough Penny Partners
EXHIBIT A: FINANCIAL & TRADING SNAPSHOT

40WWW.SUMZERO.COM
• Summary Thesis: UEPS offers a unique, “deep GARP”
opportunity. At its current share price of $3.36, UEPS
trades at a negative enterprise value ($209mm net cash
vs. $188mm market capitalization), implying both its core
business and non-core assets are essentially worthless.
Based on our Base Case valuation, in which we value the
core business at 1x FY21 Revenue and the value of the non-
core assets at their current carrying value, we ascribe a
6/30/21 PT of $7.00. The core business has begun to show
signs of a turnaround including growing nearly 40% on a
QoQ basis in FQ1 2021 and adding over 40k customers on a
net basis in the month of October 2020. While the business
is small for a public company, its board is sophisticated
and as such is directing the business to focus its operations
and return capital to investors. The Company has recently
announced a $50 million stock buyback. We believe this
strategy will unlock shareholder value. In addition, two
board members have recently purchased stock on the
open market and the largest shareholder Value Capital
Partners has also been buying shares on the open market.
• What the Market is Missing & Catalysts: As a micro-cap
operating in Africa, the stock is under-covered with only
one analyst from a relatively small brokerage firm (B. Riley
Securities) covering it. In addition, the core business is
complex and investor relations messaging is confusing,
thus making valuation difficult. The values of the non-core
assets are difficult to determine due to limited reporting.
Finally, the poor recent financial performance has driven
the share price down. Institutional ownership has fallen
proportionally. We have identified several potential
catalysts, including sales & IPOs of non-core assets as well
as the naming of a new CEO, expounded upon in Catalysts
below.
• COVID: Primary operating business is in South Africa,
which as a southern hemisphere country, is now entering
summertime and thus a milder period for COVID. COVID
cases peaked in July 2019 and have stabilized at about 25%
of that peak.
• Note: all currency figures will be USD, in which Net1 both
trades and reports, unless otherwise noted.
BUSINESS HISTORY & SITUATION OVERVIEW
EXHIBIT B: UEPS TRADING HISTORY
• Business History: UEPS was founded in 1997. In 2004 the
private equity firm Brait (founded by Antony Ball whose
current firm Value Capital is the largest shareholder)
acquired Net1 Applied Technologies Holdings Limited, a
publicly listed South African payments business. In 2004,
Net1 went public on the Nasdaq. The business has made
a number of acquisitions and investments over its history
including the 2010 acquisition of KSNET, a payments
processor in South Korea (recently divested).
• How UEPS got so cheap/Loss of Government Contract:
UEPS won a contract in 2013 with the South African Social
Security Agency (“SASSA”) to electronically distribute
welfare and pension payments to over 10mm South
Africans. In March 2018, the contract ended, at which time
the contract represented ~1/4 of revenue and ~1/3 of EBIT.
This in turn necessitated a significant reorganization of the
business including letting go of ~1/2 of the workforce.
• Re-involvement of Antony Ball: Antony Ball, whose
current firm Value Capital Partners is the largest
shareholder owning 16% of UEPS, was re-elected to the
board in March 2020. Having taken Net1 public on the
Nasdaq roughly 15 years ago, he knows this business very
well. He deserves a lot but not all of the credit for the
recent reorganization and burgeoning turnaround.

41WWW.SUMZERO.COM
• Strategic review: Following a strategic review, the board
set out to undergo a number of strategic initiatives to
rationalize and streamline the business. In March of 2020,
UEPS sold their Korean payments business KSNET for
$237mm in cash. In April of 2020, UEPS sold its remaining
stake in DNI, a provider of commerce-related services,
for ~$48mm. In 2020, Net1 divested FIHRST, a provider
of payroll management services, for $11.7 million. Net1
plans on divesting or otherwise shutting down other
less profitable, non-African lines of business and letting
go of some of the senior management involved in those
businesses.
• Board changes: Over the past two quarters, Net1 has
added 5 independent board members, including Ali
Mazanderani, a FinTech veteran and StoneCo (public
Brazilian FinTech company with $23bn market cap)
director who is formally consulting for the company.
• Stock buyback: The board has earmarked $50mm of the
proceeds from the divestitures for share buybacks.
• New CEO: In September 2020, the CEO Herman Kotze,
stepped down and was replaced by the CFO, Alex Smith,
on an interim basis. The Company is now searching for a
long-term replacement.
• Insider buying: Since May 2020, Antony Ball and his firm
Value Capital Partners have purchased over 2.5 million
shares valued at more than $5 million on the open market.
Their most recent open market purchase was on 11/24/20
at $3.39 per share, basically where the stock is today.
Another board member purchased on the open market in
September 2020.
CORE BUSINESS OVERVIEW
• Summary: Net1 has built a diverse payments and financial
services business in South Africa. The Company has
the opportunity to leverage its unique technology,
infrastructure, and trusted brands to build a FinTech
business capable of dominating the South African market.
• Market Opportunity & TAM: South Africa is an emerging
market with a population of ~58 million and a GDP of $385
billion in 2019, making it the second largest economy in
Africa. South Africa has a nascent financial infrastructure,
with limited access to fundamental financial services for
large geographic swathes of the country and segments
of the population. At the same time, smartphone usage is
common (over half the population uses mobile internet),
credit card adoption is growing (13% annual growth since
2012), the educated work force is growing rapidly, and
the economy has vast potential including some of the
largest reserves of various rare minerals (platinum, gold,
palladium, etc.). These all provide strong fundamentals
for long term economic growth & FinTech penetration.
Net1 focuses on providing its financial services to the
underbanked in South Africa, which includes:
° B2C: ~26mm low income South African consumers
° B2B: 1.6mm MSME (Micro, Small and Medium
Enterprises) South African merchants that are currently
unable to accept electronic payments
• Technology & Infrastructure:
° UEPS Technology Protocol: Due to the large rural
population as well as intermittent infrastructure
availability, there is a need in South Africa for a financial
transaction processing network that works offline as
well as online. Net1 built a unique technology called
the Universal Electronic payment system that is at
once operable with the EMV protocol (and therefore
capable of working with Visa/Mastercard cards and
card readers) while functioning offline. UEPS combines
biometric authentication, last mile payment processing,
and cash interoperability to provide secure and
convenient payments infrastructure.
° Mobile Virtual Card: Net1 developed a proprietary
technology for sending mobile virtual cards, which
enables secure payments and money transfers using 1x,
unique codes.

42WWW.SUMZERO.COM
° Physical Branches: The Company distributes its
services through ~350 retail locations, including
financial services branches, financial service express
stores, and satellite branches.
° ATM Network: Approximately ~60% of the South
African economy is transacted over cash. As such,
UEPS complements its financial transaction processing
business with a network of 1,500 mobile (i.e. mounted
on pickup trucks, traveling with armored vehicles) and
stationary ATMs. Net1 is the market share leader in this
area and has a well-known brand name.
• Products & Solutions:
° EasyPay: Provides card payment processing services
to businesses and bill payment services to consumers.
Leading bill payments services market share in South
Africa. Growing rapidly – processing ~1.4mm bill
payments per month (October), up from ~1.1mm per
month at beginning of CY2020.
° EasyPay Everywhere: Provides mobile banking to
consumers. ~1mm active accounts, with approximately
~$30mm run rate revenue. $780mm TAM.
° MoneyLine: Offers microloans to consumers & MSMEs.
Average term life of ~6 months. Average value of a
little under $100. While some of the microfinance loans
are securitized, much of it remains on Net1’s books.
$25.6mm book value as of 9/30/20. $1.4bn consumer
opportunity, $4.2bn business opportunity.
° SmartLife: Life insurance policies, primarily issued for
the purpose of covering funeral expenses. 230k paying
policies. $1.6bn market opportunity.
° Cashpaymaster Services (“CPS”): Distributes social
welfare payments to over nine million beneficiaries.
Currently in liquidation.
• Strategy:
° Turnaround: The strategy of the core business
is to leverage its existing assets, brands, and
technologies to transform from a payment
processor into a modern FinTech providing a
comprehensive bundle of financial services to
MSMEs and consumers. Through their existing
distribution channels and strong brand name,
they’re able to acquire new customers at a much
lower customer acquisition cost than competitors
° Long Term Outlook: Given UEPS’ strong brand
name in South Africa, its staff of over 200
software engineers on staff, its scale relative to
other South African FinTech businesses, and its
indexing to a number of long-term, secular trends
(formalization & card adoption of global economy,
mobile payments in the emerging economy,
democratization of financial services, etc.), we
believe Net1 is well positioned to succeed in the
long run.
NON-CORE ASSETS
• Summary: Prior management accumulated a
significant portfolio of minority and VC investments.
Generally, these investments are in hypergrowth,
FinTech businesses in emerging markets. UEPS
has information rights and is on the board of all of
their minority investments. Besides the assets listed
below, the Company has made several other minority
investments which we assume are write-offs at this
time. The Company discloses their investments in detail
in their quarterly earnings deck.
[See Exhibit D on following page]

43WWW.SUMZERO.COM
EXHIBIT D: NON-CORE ASSETS SUMMARY Numbers below as of 9/30/20
Bank Frick
FinBond Group
MobiKwik
Carbon
Cell C
Total
Blockchain based banking services based in Liechtenstein
Publicly traded consumer bank operating in South Africa
Fintech company operating in India
Fintech company operating in Nigeria, Kenya, and Ghana
Mobile network operator operating in South Africa
• Had been on pace to grow 40% YoY in 2020, prior to COVID.
• Publishes financial statements bi- annually on its website.
• Advent of bitcoin and blockchain is secular tailwind.
• Publicly traded on JSE with $66mm market cap
• Negatively affected by COVID but still EBITDA positive and well capitalized.
• Releases bi-annual financial statements.
• One of the largest b2c fintech companies in India.
• In November raised $6 million at a pre-money valuation of $375 million in Nov. 2020 from HT Media Group and a founder of Infosys. UEPS stake now worth $45 million
• Partnered with American Express to launch Amex’s first credit card in India.
• Investors include Sequoia Capital, Intel, American Express.
• 120 million consumer customers and 3 million retailer customers.
• For the year ended 6/30/20: $54 million revenue, up 130% for year ended and EBITDA breakeven.
• Publishes financials every year on their website.
• Has formally stated they are planning on going public in 2022.
• Public fintech comps like STNE, PAGS and SQ trade at 34x, 12x and 10x EV/sales respectively
• Neobank B2C business model.
• Doing roughly $24mm of revenues, growing triple digits YOY.
• Been profitable for two years.
• Has won many awards as best Fintech company and best fintech app in Africa.
• Publishes audited financials every year on website.
• Carried at $0mm as the business is undergoing reorganization, after which UEPS will be significantly diluted.
• 2017 valuation of $150mm.
35%
35%
12%
25%
15%
$31mm
$14mm
$27mm
$7mm
$0mm
$79mm
Asset Name Description % Ownership Value Notes

44WWW.SUMZERO.COM
BASIS OF REPORTING & FINANCIAL ANALYSIS
• See Appendix A: Financial Performance and Outlook
• Basis of Reporting: The Core Business is broken down
into South African Transaction Processing (“SATP”),
International Transaction Processing (“ITP”), and Financial
Inclusion and Applied Technologies (“FIAT”).
° SATP: Includes EasyPay and other revenues derived
from services provided to merchants. $73.8mm
of FY20 revenue, forecast to be $71.4mm in FY21.
$2.5mm of FY21 EBIT.
° ITP: Includes card issuing, merchant acquiring, and
payment services revenues in Europe, North America,
and China. Included KSNET prior to divestiture.
$71.4mm of FY20 revenue, forecast to be $5.7mm
in FY21 (decline largely due to KSNET divestiture).
($13.5mm) of FY21 EBIT.
° FIAT: Includes EasyPay Everywhere and other
consumer financial services businesses. $82.3mm
of FY20 revenue, forecast to be $64.6mm in FY21.
$7.7mm of FY21 EBIT.
° The non-core assets listed above are accounted for via
either the equity or cost method and as such are not
consolidated into the Company’s operating income.
• Historical Performance: The core business grew to a peak
of $674mm of revenue / $169mm of Adj. EBITDA in FY15.
The business stalled and then deteriorated significantly
following the loss of SASSA as a customer in 2018.
• FY20 & Q1FY21 Performance: FY20 performance was
poor, due to both ongoing headwinds stemming from
divestitures as well as COVID-related disruption. Q1
performance was stronger and reflected an end of
COVID related disruption. Q1 revenue of $37mm
reflected 39% QoQ growth and a significant beat
relative to B. Riley’s expectation of $30mm.
• FY21 & Beyond Outlook: We expect the business
to continue its rebound from its 2020 performance
in FY21. Because of the high margin nature of EPE
customers, we believe the path to breakeven largely
relies on continued net customer additions. When
the Company had adequate capital, they were able
to spend enough on sales & marketing to add 100k of
EPE customers per month. Per their FQ1 2021 earning
call, the Company added 40k net EPE customers in
October, translating to ~$1.2mm in ARR. This was the
first positive monthly growth of EPE customers in
over two years. The Company is targeting 400k net
EPE customer additions, translating to ~$12mm of
ARR.
SUM-OF-THE-PARTS VALUATION & RETURNS ANALYSIS
• Summary: We used a sum-of-the-parts valuation
method in which (i) UEPS’ $209mm of net cash,
(ii) the value of its core business and (iii) the value
of its non-core assets are summed to determine its
valuation.
• Base Case: In our base case, the core business
drives to breakeven by FY21 and is worth 1x FY21
revenue (5x at scale EBITDA, assuming at scale
EBITDA margins of 20%). Note that this valuation
is significantly cheaper than other emerging
markets FinTech businesses (Appendix C: Public
Comparables). Non-core assets are valued at the
current carrying value. This leads to equity value /
share price on 6/30/2022 of $421.6mm / $7.38 per
share respectively.

45WWW.SUMZERO.COM
• Bull Case: In our bull case, the core business grows
10% faster than in the base case and trades at 1.5x
FY21 revenue. MobiKwik goes public and trades at
10x ARR of $100mm, a significant discount to other
hyper growth, emerging market fintech companies
(StoneCo, PagSeguro, MercadoLibre; see Appendix
C: Public Comparables) There is a recovery of the
Cell C investment amounting to $26.3mm (15% of
$175mm 2017 valuation). Other non-core assets are
recovered based on their current carrying values.
This leads to equity value / share price on 6/30/2022
of $634.0mm / $11.10 per share respectively. See
Appendix B: Bull & Bear Case Sum-of-the-Parts.
• Bear Case: In our bear case, the Core business
burns $20mm over the subsequent 3 quarter period
and is deemed valueless. All non-core assets are
also deemed valueless. In this case, the business is
worth its current cash positions less the subsequent
cash burn. This leads to equity value / share price
on 6/30/2022 of $189.2mm / $3.31 per share
respectively. See Appendix B: Bull & Bear Case
Sum-of-the-Parts.
CATALYSTS
1. Naming of New CEO: We expect the market to react
positively to the announcement of a suitable and
well-reputed CEO.
2. Capital Allocation / Buyback: The board has
announced a plan to return $50mm of cash
to shareholders through share buybacks. The
remaining ~$150 million of cash will be used for
organic growth of the core business and potential
acquisitions.
3. Core Business Turnaround: Should the operational
turnaround plan succeed, and the business renew
its growth, increased interest from investors would
drive the share price up. We believe the business
achieving breakeven operating profitability would
be a significant milestone.
4. Sales & IPO of Non-Core Assets: Significant value
of the business has already been unlocked via
divestitures and will continue to be realized upon
future divestitures. In particular, we view the
potential IPO of MobiKwik to be a major potential
catalyst, as they have already received a third-party
valuation ~67% higher than where UEPS carries
their investment and similar mobile payments
businesses in other emerging markets have been
extremely well received by the market.
5. Purchase of FinTech business in South Africa:
Management has mentioned they may make
acquisitions in South Africa. The acquisition of a
pure FinTech business would add aditional digital
expertise.
6. Launch of new products: We expect many pure
fintech products to be rolled out over next few
years.
7. Re-branding: The Company is in the process of
re-branding. The website is outdated. The story for
investors is unclear and messy. As the Company re-
brands and makes its investor reporting clearer, the
value will become clearer to Wall Street.
EXHIBIT E: BASE CASE SUM-OF-THE-PARTS

46WWW.SUMZERO.COM
KEY RISKS
1. Illiquid Stock: UEPS’ stock is thinly traded, with
average daily volume of 0.21mm shares. In addition,
there is significant ownership concentration (Value
Capital Partners owns 16% and International Finance
Corporation owns 14%).
2. Macroeconomic Risks: South Africa has several
structural economic issues that predate COVID. GDP
growth has been <2% going back to 2013, which
is exceptionally low for a developing economy.
Unemployment has lingered between 25-30%.
3. Currency Risk: 97% of FY20 revenue was derived from
providing services within South Africa, which uses the
highly volatile ZAR. Should the ZAR depreciate relative
to USD at a rate greater than its historical average
depreciation, the share price would fall.
4. Execution Risk: Our thesis is contingent on operational
improvement within the core business and further
liquidation of the non-core investments. As such, it will
require strong execution. Should the Company fail to hire
the right CEO, the Company may not execute well.
5. New Products Fail: The Company plans on launching
new products. They may fail at doing so.
6. Non-Core Assets Fail: UEPS’ non-core assets are largely
high growth venture businesses, commensurate with
their own risks.
7. Regulatory Risk: As a consumer finance business
operating in a highly regulated economy, UEPS faces
numerous regulatory risks, including potential new
regulation as well as ongoing matters from existing
regulation. The primary South African credit regulatory
agency has applied to cancel Moneyline’s credit license.
This matter has been ongoing for several years and
has no clear outcome at this time. In 2019, South Africa
passed the National Credit Amendment Bill
which provided credit relief to consumers which
in turn had significant adverse effects on UEPS’
Moneyline business. South Africa has made
significant investments in “Postbank”, a bank
subsidiary of the South African Post Office that
uses post office branches as bank branches. In
2017, Postbank won the SASSA contract from
UEPS, which led to the loss of SASSA revenue
in 2018. Finally, the Protection of Personal
Information Act (“POPI”) went into effect in
South Africa in 2020. POPI provides various
consumer data privacy restrictions, similar in
spirit to GDPR in Europe. This regulation limits
various data collection processes of UEPS and
poses the risk of regulatory fines in the future.
8. Partner Risk: As Net1 lacks registration as a
retail bank yet engages in banking activities,
the Company has to partner with a registered
bank, namely Grindrod bank, a South Africa
based bank. UEPS therefore has risk stemming
both from the partnership itself as well as the
risk that Grindrod bank remains a solvent, going
concern in good standing with the South African
regulatory agencies.

47WWW.SUMZERO.COM
APPENDICESPrimary Research Sources: Capital IQ; UEPS filings, press releases & websites; B Riley Securities Equity Research; Maxim Group Equity Research
APPENDIX B: BULL & BEAR CASE SUM-OF-THE-PARTS
APPENDIX A: FINANCIAL PERFORMANCE AND OUTLOOK

An exclusive database of 14K+ actionable and peer-reviewed research ideas with
complete performance attribution and firm transparency.
Real-time alerts with up-to-date commentary from sector/regional experts on
thousands of stocks and bonds uncovered by Wall Street and global banks.
Proprietary analyst rankings data, sentiment filters, private messaging, and more.
•
•
•
VISIT SUMZERO.COM ›
JOIN SUMZERO TO DOWNLOAD THE COMPLETE REPORT
WWW.SUMZERO.COM 48
APPENDIX C: PUBLIC COMPARABLES

49WWW.SUMZERO.COM
Cdon Ab
L O N G
Recently-spun, fast-growing e-commerce marketplace that should see
massive growth in profits and is undervalued compared to peers.
TIMEFRAME
2-5 Years
SITUATION
Growth At Reasonable Price
MARKET CAP
N/A
About Morgan Housel
Far View Partners is a concentrated, global investment fund that aims to generate attractive long-term returns while seeking to minimize permanent capital impairment. Far View’s portfolio will usually consist of 10-20 positions, mainly, but not limited to, long investments in both domestic and international equities and will be highly concentrated in its top few positions. The Partnership’s strategy utilizes a multi-year time horizon to focus on special situations and value investments.
About Far View Capital Management
Brad Hathaway is the Managing Partner of Far View Capital Management, an Aspen based fund that invests globally with a long-term value and special situations strategy. Prior to launching Far View, Brad worked at J Goldman & Company and Tocqueville Asset Management.
About Brad Hathaway
FINALIST
Idea Posted: 12/7/2020
Asset: Equity
Idea Updated: 12/10/2020
Symbol: CDON:SS
EXPECTED RETURN:
115.52%
Brad HathawayBADGES:Portfolio Manager at Far View Capital Management
Micro Caps
CURRENT RANKING: #5 Consumer Discretionary
ATTACHMENTS
39 862
RETURN TO DATE:
63.38%
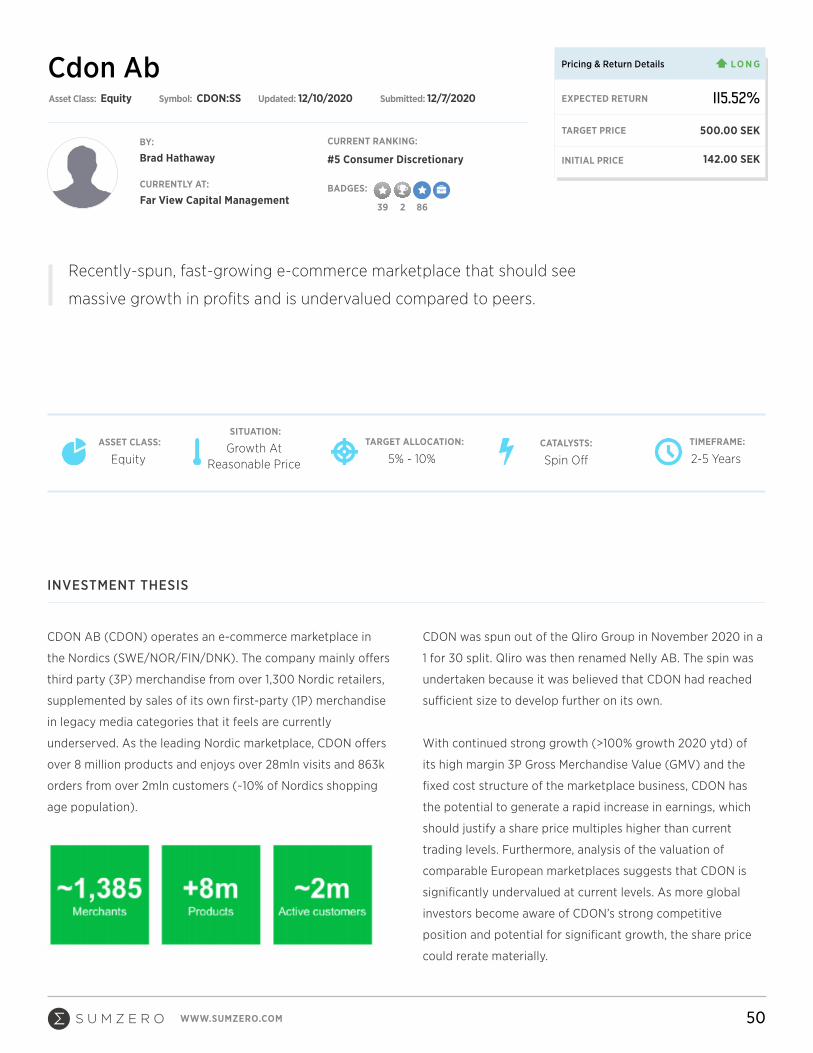
50WWW.SUMZERO.COM
Asset Class: Equity Symbol: CDON:SS Updated: 12/10/2020 Submitted: 12/7/2020
Cdon Ab
BY:
CURRENTLY AT:
Brad Hathaway
Recently-spun, fast-growing e-commerce marketplace that should see
massive growth in profits and is undervalued compared to peers.
ASSET CLASS:
Equity
SITUATION:
Growth At Reasonable Price
TARGET ALLOCATION:
5% - 10%CATALYSTS:
Spin Off
TIMEFRAME:
2-5 Years
EXPECTED RETURN
TARGET PRICE
INITIAL PRICE
115.52%
500.00 SEK
142.00 SEK
Pricing & Return Details LO N G
CDON AB (CDON) operates an e-commerce marketplace in
the Nordics (SWE/NOR/FIN/DNK). The company mainly offers
third party (3P) merchandise from over 1,300 Nordic retailers,
supplemented by sales of its own first-party (1P) merchandise
in legacy media categories that it feels are currently
underserved. As the leading Nordic marketplace, CDON offers
over 8 million products and enjoys over 28mln visits and 863k
orders from over 2mln customers (~10% of Nordics shopping
age population).
CDON was spun out of the Qliro Group in November 2020 in a
1 for 30 split. Qliro was then renamed Nelly AB. The spin was
undertaken because it was believed that CDON had reached
sufficient size to develop further on its own.
With continued strong growth (>100% growth 2020 ytd) of
its high margin 3P Gross Merchandise Value (GMV) and the
fixed cost structure of the marketplace business, CDON has
the potential to generate a rapid increase in earnings, which
should justify a share price multiples higher than current
trading levels. Furthermore, analysis of the valuation of
comparable European marketplaces suggests that CDON is
significantly undervalued at current levels. As more global
investors become aware of CDON’s strong competitive
position and potential for significant growth, the share price
could rerate materially.
INVESTMENT THESIS
Far View Capital ManagementBADGES:
CURRENT RANKING:
#5 Consumer Discretionary
39 862
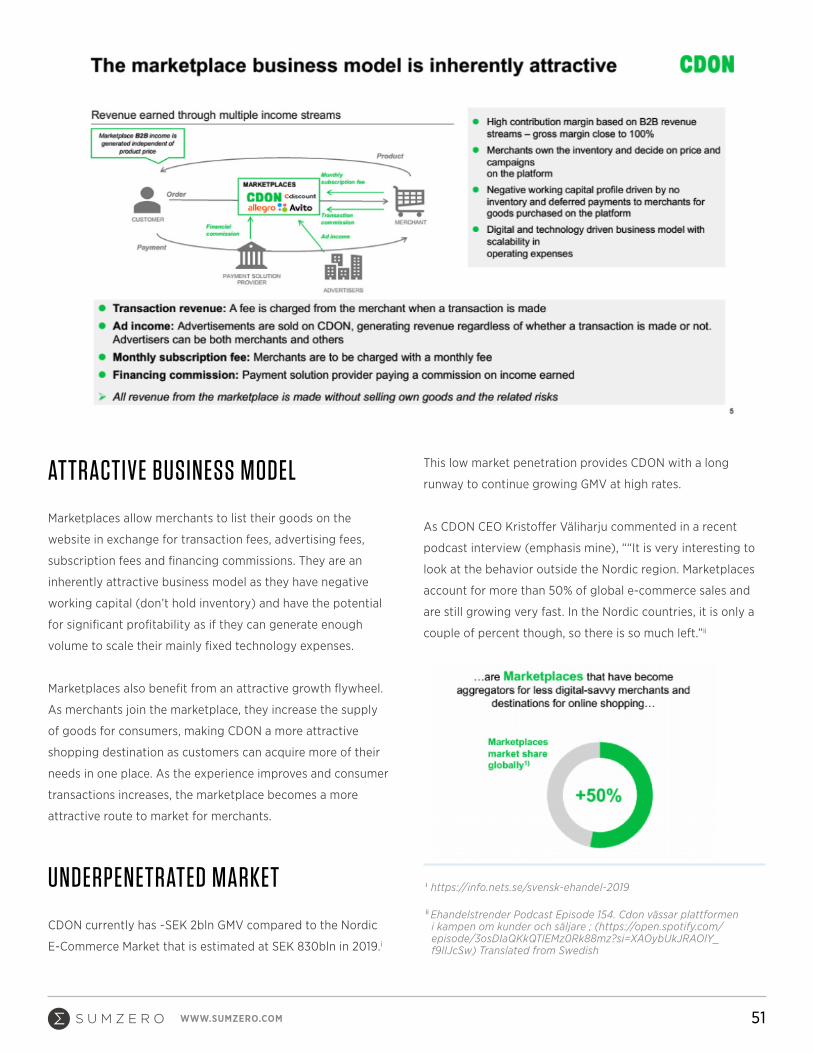
51WWW.SUMZERO.COM
ATTRACTIVE BUSINESS MODEL
Marketplaces allow merchants to list their goods on the
website in exchange for transaction fees, advertising fees,
subscription fees and financing commissions. They are an
inherently attractive business model as they have negative
working capital (don’t hold inventory) and have the potential
for significant profitability as if they can generate enough
volume to scale their mainly fixed technology expenses.
Marketplaces also benefit from an attractive growth flywheel.
As merchants join the marketplace, they increase the supply
of goods for consumers, making CDON a more attractive
shopping destination as customers can acquire more of their
needs in one place. As the experience improves and consumer
transactions increases, the marketplace becomes a more
attractive route to market for merchants.
UNDERPENETRATED MARKET
CDON currently has ~SEK 2bln GMV compared to the Nordic
E-Commerce Market that is estimated at SEK 830bln in 2019.i
This low market penetration provides CDON with a long
runway to continue growing GMV at high rates.
As CDON CEO Kristoffer Väliharju commented in a recent
podcast interview (emphasis mine), ““It is very interesting to
look at the behavior outside the Nordic region. Marketplaces
account for more than 50% of global e-commerce sales and
are still growing very fast. In the Nordic countries, it is only a
couple of percent though, so there is so much left.”ii
i https://info.nets.se/svensk-ehandel-2019
ii Ehandelstrender Podcast Episode 154. Cdon vässar plattformen i kampen om kunder och säljare ; (https://open.spotify.com/episode/3osDIaQKkQTlEMz0Rk88mz?si=XAOybUkJRAOlY_f9lIJcSw) Translated from Swedish

52WWW.SUMZERO.COM
While CDON only has portion of e-commerce sales, it already
has 10% of the Nordics shopping age population in its
customer base. Thus, the company has a huge opportunity
to grow if they can continue to grow their share of wallet so
that revenue market share more closely approximates their
customer market share.
CDON currently has over 1,300 merchants of the 50-
60k merchants in the Nordics so there is a lot of room to
continue connecting retailers to their online marketplace.
As more merchants connect, customers will enjoy a larger
range of goods and be able to make more purchases on the
marketplace.
E-commerce overall is also relatively underpenetrated in the
Nordics compared to other European markets.
STRONG COMPETITIVE POSITION
CDON benefits from its strong brand recognition, a legacy of
being an online 1P retailer in the Nordics for over 20 years.
As the CEO notes (emphasis mine), “There is an incredible
value to having a four- letter domain that most people in the
Nordics actually know. It takes time to build that domain and
we have done that for 21 years and it is great, so we stand for
something that most people associate with e-commerce.”iii
CDON is the largest marketplace in the Nordics and considers
itself the only local marketplace at scale. The company only
sees a few other small regional players that are much smaller
as well as some marketplaces in specific verticals (ex Zalando
in fashion, Elgiganten in consumer electronics, Fyndiq in
bargain products).
This leading Nordic position has also allowed CDON to act
as a gateway to the Nordics for international retailers. In
Q2 20, French marketplace CDiscount launched with CDON
with over 50,000 products in the Swedish market. As
Thomas Metivier, Cdiscount’s International Director noted
(emphasis mine), “Sweden and the Nordic countries are a
very attractive market for us, but it is also a fragmented
market to enter on our own. Via CDON, we can quickly
and safely expand our sales to the Nordic markets. As
the largest in the market, CDON was a given choice and
it feels safe that they know how we can best market our
range in a cost-effective and attractive way to consumers
here.”iv
Many investors are worried about the impact that Amazon
may have on CDON’s business as they launched Amazon.se
in 2020. Swedish customers already shopped on Amazon,
mainly through Amazon.de and having it delivered cross-
border to Sweden.
However, Amazon is often not a category killer in markets
it enters later. Michael Storakers, the head of the Storakers
McCann advertising agency in Sweden commented
(emphasis mine) that he does not expect Amazon to be
able to get anything close to the market shares it has in the
US, Germany and the UK, where it has been operating for
more than 20 years. “They launched when the e-commerce
market in general was very, very young in those markets,”
he says. “If you look at the recent launches, like in Australia,
Turkey and the Netherlands, they have only been able to
take a [small] per cent of the market. So I would say that
the best guess is that they take a [small] percentage of the
market here.v
iii Ehandelstrender Podcast Episode 154. Cdon vässar plattformen i kampen om kunder och säljare ; (https://open.spotify.com/episode/3osDIaQKkQTlEM z0Rk88mz?si=XAOybUkJRAOlY_f9lIJcSw) Translated from Swedish
iv https://www.dagenshandel.se/article/view/725534/cdon_lanserar_fransk_ehandelsjatte_i_sverige
v https://www.wired.co.uk/article/amazon-sweden-launch (https://www.wired.co.uk/article/amazon-sweden-launch)

53WWW.SUMZERO.COM
Boston Consulting Group estimates that Amazon will
take 5-10% of the Swedish e-commerce market by 2025,
leaving significant room for other players.vi
Other markets where Amazon has struggled as
a later entry include Brazil (entered in 2012, has
Prime),Singapore (Amazon still the #4 player after
launching in July 2017, and Australia (launched in 2017 yet
still far behind Ebay).vii
Amazon’s Swedish launch has also gone quite poorly
with the company using the Argentine flag instead of the
Swedish flag on the site’s country picker and included
prices indicated at the nearest Ere (Swedish penny)
which hasn’t been used in Sweden in more than a decade.
Amazon also struggled with translations to Swedish
(children’s puzzle with yellow rapeseed flowers described
as having a “sexual assault flower motif”, football shirts
labeled as “child sex attack shirt”).viii
Amazon also has not launched Prime in Sweden and does
not control its own logistics networks (and may never due
to fear of Sweden’s strong culture of unionization).ix
Moreover, there is a silver lining from Amazon’s entry as it
has driven increased awareness from Swedish merchants
about the value of marketplaces. As CDON’s CEO notes
about Amazon (emphasis mine), “Is it a threat? I would
say that Amazon is more of an opportunity. All of a
sudden, 60,000 retailers in Sweden will ask themselves,
‘how do we relate to marketplaces?”.
Since Project Dancing Queen was announced, CDON’s
marketplace has actually seen, he boasts, “an accelerated
intake of new merchants. Amazon is very good at taking
care of the consumers, but what we hear from our
merchants is that they’re not as good at dealing with
merchant needs. And we would like to be the merchants’
best friend,” he says.x
CDON sees itself as a local champion for Nordic
merchants who want to avail themselves of the benefits
of the marketplace model without succumbing to
pressure from Amazon. CDON offers lower merchant fees,
quicker integration, greater data for merchants, and lack
of competition from 1P offerings.
[see figure on following page]
This lack of merchant friendliness has shown up in results
as nearly all the sellers on Amazon’s Swedish marketplace
are from other European countries and less than 100
sellers are Sweden-based.xi
While Amazon will certainly increase its Swedish
e-commerce market share with its local language launch,
I believe there is more than enough addressable market
for both CDON and Amazon to thrive as they expand their
share of overall Swedish retail sales. In the other Nordic
countries, CDON will still only face competition from non-
local Amazon sites.
vi https://www.dagenshandel.se/article/view/765964/analys_amazon_tar_510_procent_av_svenska_marknaden_till_2025
vii Morgan Stanley November 9 2020 Allegro Initiation Report
viii ttps://todaysecommerce.com/news/123/nordics-gets-its-first-amazon-online-store/
ix https://korii.slate.fr/biz/ecommerce-comment-suede-resiste-amazon-lancement-erreurs-traductions-logistique-prix (https://korii.slate.fr/biz/ecommerce-comment-suede-resiste-amazon-lancement-erreurs-traductions-logistique-prix)
x https://www.wired.co.uk/article/amazon-sweden-launch (https://www.wired.co.uk/article/amazon-sweden-launch)
xi https://www.marketplacepulse.com/articles/amazon-launches-in-sweden (https://www.marketplacepulse.com/articles/amazon-launches-in-sweden)

54WWW.SUMZERO.COM
MISLEADING FINANCIALS
One reason why CDON may be mispriced is that the
company’s reported revenues do not accurately reflect its
underlying growth. CDON is currently undergoing a shift
from 1P to 3P which depresses top line revenue. While
100% of 1P GMV is recognized as revenue, a marketplace
will only recognize ~10% of 3P GMV as revenue.
Since 2017 CDON 1P GMV has declined almost 60% and
now represents only 26% of total GMV. Thus, while TTM 3P
GMV is up over 200% since 2017 and total GMV is down
only 4%, TTM revenue is down almost 50% from 2017
levels.
CDON has reached an inflection point as 3P GMV is now
80% of revenues in Q3 2020. More importantly, 3P revenue
has ~95% gross margins while 1P revenue has ~10% gross
margins so gross profit is much more heavily weighted
to 3P GMV. Thus, continued 3P GMV growth will now
generate increasingly rapid gross profit growth.
PROJECTIONS
CDON has been growing 3p GMV >100% for 2020 ytd as
merchants and customers continue grow on the platform. If
we assume strong but moderating GMV growth till 2024, 3P
GMV would reach SEK 6.4bln vs. SEK 2.0 bln today. Combined
with a continued decline in the 1P business and 2024 revenues
should be relatively flat compared to FY 2020 but gross profit
should increase at a >25% CAGR. SG&A should be relatively

55WWW.SUMZERO.COM
fixed as CDON has made significant technology investments
to increase the level of automation on their platform and
has a highly scalable e-commerce platform.xii The historical
financials provide evidence for this operating leverage. Q4
is the seasonally strongest portion of the year due to the
holidays and Q4 2019 represented over 100% of 2019 EBITDA
as the first 9 months of the year were loss-making and then
more than made up for by a significant increase in Q4 volume
and profitability.
Combine CDON’s potential for strong GMV growth with
its leverageable platform and it is possible to see EBITDA
increase to ~250mln in FY 2024 from ~30mln in FY 2020.*
Please note that the following are very rough projections
to show the scale of the opportunity here. I have laid them
out clearly so that everyone can adjust the assumptions as
they see fit.
* Any projections, market outlooks or estimates in this article are forward-looking statements and are based upon certain assumptions. Due to various risks and uncertainties, actual market events, opportunities or results may differ materially from those reflected in or contemplated by such forward-looking statements and any such projections, outlooks or assumptions should not be construed to be indicative of the actual events which will occur.
xii https://www.dagenshandel.se/article/view/744671/sa_ska_cdon_boosta_anslutna_ehandlarnas_forsaljning (https://www.dagenshandel.se/article/view/744671/sa_ska_cdon_boosta_anslutna_ehandlarnas_forsaljning)

56WWW.SUMZERO.COM
It should be noted that Polish peer Allegro’s results show
that a more mature marketplace can have EBITDA margins
above 50%. Japanese marketplace Mercari is generating
30% adjusted operating margins and is targeting 40%
in the medium term. While Allegro and Mercari Japan
are obviously much further along in their trajectories,
their results show that a 3P marketplace can be a highly
profitable business at scale.
EUROPEAN MARKETPLACE COMPS
We have two European marketplace comps who have
recently listed, Allegro in Poland and Ozon in Russia
(Nasdaq listed). While they are both materially bigger
in their core markets, the underlying nature of their
businesses is very similar to CDON.
It should also be noted that Amazon is widely rumored to
be entering Poland where it already has a strong existing
warehouse network to serve its German site.xiii
As we can see, the relative valuations are materially
different.
As an example of private market valuation, Walmart
acquired Indian marketplace Flipcart in 2018 for
2.8x GMV.xiv
CAPITALIZATION AND VALUATION
CDON currently has 6mln shares for a SEK 869mln market
cap at SEK 145. Post spin, the company has SEK 46mln of
net cash for a total EV of SEK 823mln. TTM GMV is 2.2bln
(0.4x), TTM sales were 957mln (0.9x) and TTM EBITDA was
29mln (28x).
If CDON can generate ~250mln of EBITDA in 2024,
then the share would be worth SEK 830 at 20x (which
appears reasonable for a company that would have
grown EBITDA at an almost 70% CAGR over 4 years).
Discount that back for 3 years at 20% and CDON would
be worth ~SEK 480.
It should be noted that a similar valuation at 1x 2024
GMV would be materially higher. It should be noted
that this GMV of SEK 6.4bln would still be less than 1%
of the total Nordic E-Commerce market.
xiii https://www.parcelandpostaltechnologyinternational.com/analysis/amazons-imminent-arrival-in-poland-and-how-it- will-disrupt-the-last-mile.html (https://www.parcelandpostaltechnologyinternational.com/analysis/amazons-imminent- arrival-in-poland-and-how-it-will-disrupt-the-last-mile.html)
xiv https://corporate.walmart.com/newsroom/2018/05/09/walmart-to-invest-in-flipkart-group-indias-innovative- ecommerce-company

57WWW.SUMZERO.COM
MANAGEMENT
CDON is being led by Kristoffer Valiharju who has
been with the company for the past 3 years as COO.
Previously he worked for DTC retailer Dustin and in
the DTC division of Dell computer and has several
years of e-commerce expertise.
Since the spin in early November, insiders have
purchased almost SEK 5.0mln of stock at prices as
high as SEK 143.xv
CDON’s CEO also bought another 23k shares Qliro
Group at SEK 6.03 before the split and 1 for 30 spin of
CDON.xvi
RISKS
1) EXECUTION
CDON needs to be able to manage significant
growth without issue. So far the company has
managed 100% GMV growth during 2020 but
it needs to continue to execute at higher GMV
volumes for the next few years.
2) COMPETITION
Amazon is always a risk given their size relative to
CDON. There could be some unique reason why
Amazon decides to invest significant money in an
attempt to dominate the Nordics more than other
late-mover regions. A new marketplace competitor
could emerge or enter the market and take significant
share.
3) TECHNOLOGY RISK
Data breaches, platform failures and other technology
issues could be a huge problem for CDON.
4) SWEDISH SMALL CAP
Stock is relatively small and illiquid with minimal
broker coverage.
xiv https://corporate.walmart.com/newsroom/2018/05/09/walmart-to-invest-in-flipkart-group-indias-innovative-ecommerce-company
xv https://marknadssok.fi.se/Publiceringsklient/en- GB/Search
xvi https://marknadssok.fi.se/Publiceringsklient/en- GB/Search

An exclusive database of 14K+ actionable and peer-reviewed research ideas with
complete performance attribution and firm transparency.
Real-time alerts with up-to-date commentary from sector/regional experts on
thousands of stocks and bonds uncovered by Wall Street and global banks.
Proprietary analyst rankings data, sentiment filters, private messaging, and more.
•
•
•
VISIT SUMZERO.COM ›
JOIN SUMZERO TO DOWNLOAD THE COMPLETE REPORT
WWW.SUMZERO.COM 58
ADDITIONAL DISCLOSURE
Information presented in this article is for educational
purposes only and does not intend to make an offer or
solicitation for the sale or purchase of any specific securities,
investments, or investment strategies. Investments involve
risk and unless otherwise stated, are not guaranteed. Be sure
to first consult with a qualified financial adviser and/or tax
professional before implementing any strategy discussed
herein. Past performance is not indicative of future results.

59WWW.SUMZERO.COM
Automatic Bank Services Ltd Ord
L O N G
Under-the-radar monopoly card payment network in Israel trading at a
highly discounted valuation. 15x P/E; earnings compounding at mid-teens
driven by long-duration secular tailwinds.
TIMEFRAME
2-5 Years
SITUATION
Growth At Reasonable Price
MARKET CAP
34.0M USD
About Morgan Housel
The Fund is a global, diversified equity long/short generalist fund. The Fund’s investment objective is to generate absolute returns over a long-term time horizon while seeking to minimize the risk of permanent capital impairment. Strategies employed by the Fund may include deep value, transformations, compounders and special situations with the unifying theme of fundamental analysis to identify attractive risk/reward investments. Crescent Rock Capital Management, LP is managed by Co-CIOs Boris Vuchic and Michael Marone who worked together for 10 years at Pennant Capital Management as Partners. They are joined by John Rolfe (Senior Analyst), Scott Mosberg (Chief Operating Officer) and Chris Campbell (Analyst).
About Crescent Rock Capital Management LP
Christopher is an analyst at Crescent Rock Capital Management, a long/short hedge fund based in Summit, NJ. Prior to joining Crescent Rock, he worked at a concentrated, long-biased investment partnership and in Goldman Sachs’ research division. He graduated with a BSBA (magna cum laude) from Washington University in St. Louis.
About Christopher Campbell
FINALIST
Idea Posted: 12/12/2020
Asset: Equity
Idea Updated: 12/31/2020
Symbol: SHVA:IT
RETURN TO DATE:
-1.81%
EXPECTED RETURN:
68.58%
Christopher CampbellBADGES:Analyst at Crescent Rock Capital Management LP
Micro Caps
CURRENT RANKING: #32 All-Time
ATTACHMENTS
16 20

60WWW.SUMZERO.COM
Asset Class: Equity Symbol: SHVA:IT Updated: 12/31/2020 Submitted: 12/12/2020
Automatic Bank Services Ltd Ord
BY:
CURRENTLY AT:
Christopher Campbell
Under-the-radar monopoly card payment network in Israel trading at a
highly discounted valuation. 15x P/E; earnings compounding at mid-teens
driven by long-duration secular tailwinds.
ASSET CLASS:
Equity
SITUATION:
Growth At Reasonable Price
TARGET ALLOCATION:
2% - 5%CATALYSTS:
N/A
TIMEFRAME:
2-5 Years
EXPECTED RETURN
TARGET PRICE
INITIAL PRICE
68.58%
22.00 ILS
13.29 ILS
Pricing & Return Details LO N G
EXECUTIVE SUMMARY
Automated Banking Services (otherwise known as “Shva,”
the Hebrew acronym for Automated Banking Services) is a
long. Shva is the monopoly network for card payments in
Israel, effectively acting as a toll booth on secularly growing
digital payments in the country. Like similar businesses (V, MA,
etc.), Shva benefits from long-duration tailwinds and has an
exceptional business model and financial profile with 45%+
EBITDA margins and high returns on capital. Despite these
qualities, the stock trades at just 8.5x EBITDA and 15x P/E, a
valuation that is attractive in absolute terms and stunningly
cheap when compared to the 30x+ EBITDA and ~35x+ P/E
multiples that comps trade it.
The opportunity exists due to the stock’s limited English
language disclosures, lack of any sell-side coverage, illiquidity,
and the recency of its IPO (June 2019) and consequent lack
of investor discovery. Importantly, the company has recently
begun to take several steps to improve investor outreach and
address the factors behind its mispricing. This, in addition to the
likely initiation of a meaningful dividend in the coming months,
should help close the significant valuation gap that exists today.
In a scenario in which the stock receives modest multiple
expansion to just 12.5x EBITDA (still significantly below comps),
investors can earn a 2x MOIC over the next three years (26%
IRR). Even absent any multiple expansion, the stock should be
able to compound at at least a high-teens annual rate driven
by HSD-LDD top-line growth coupled with high incremental
margins and an entry FCF yield of 6.6% (based on 2021
numbers).
INVESTMENT THESIS
Crescent Rock Capital
Management LP
BADGES:
CURRENT RANKING: #32 All-Time
16 20

61WWW.SUMZERO.COM
BUSINESS OVERVIEW AND BACKGROUND
Shva operates the sole network for card payments in
Israel, acting as an intermediary that connects card issuers,
acquirers, and merchants in order to facilitate the processing
of card transactions. Through its network, Shva “switches”
(authorizes, clears, and settles) all card-based transactions in
Israel, including purchases made online and through mobile
payment applications such as Bit, Pepper Pay, PayBox, and
Apple Pay (launching in Israel this year). Additionally, Shva
is responsible for connecting terminals to its network. This
is essentially identical to the role that Mastercard and Visa
play in the United States (and other geographies), with the
only significant difference being that MA and V also earn a
meaningful portion of their revenue from cross-border fees
and provide a slightly broader array of value-add services –
e.g. consulting and research, fraud detection, etc. – on top of
their core switching services.
*Note: Financials in cap table above are in millions of Israeli shekels. 1 NIS = 0.31 USD.

62WWW.SUMZERO.COM
The company was founded in 1978 and went public in June
2019. Similar to Mastercard, Shva was initially formed as a
joint venture owned by a group of banks. The company came
public as a result of legislation which required Israel’s banks
to reduce their respective ownership stakes in the company to
no more than 10%. Today, Bank Hapoalim, Bank Leumi, Israel
Discount Bank, and the First International Bank of Israel each
own 10% (i.e., the maximum allowed) of the company. Notably,
one of these banks, the First International Bank of Israel,
owned 3.3% of the company prior to the IPO and increased
its stake to 10% through open market purchases following the
IPO. Additionally, Visa and Mastercard each own 10%, having
purchased their stakes in November 2018 and April 2019,
respectively. As a consequence, the public float is just 40% of
shares outstanding.
It’s worth noting that the company’s position as a national
monopoly wasn’t granted via legislation. Rather, it is a
natural consequence of network effects and the difficulty
for an incremental entrant to earn an adequate return on the
required infrastructure and technology investment needed
to establish a competing network in a country as small as
Israel. Indeed, as I understand it, Visa and Mastercard at
one point contemplated building competing networks in
Israel, but both had a difficult time breaking into the market
and ultimately abandoned their efforts before deciding to
invest in the company after the banks were forced to divest
portions of their stakes.
HOW DOES SHVA MAKE MONEY?
Shva earns revenue solely from fees and does not lend or
take credit risk. Its fees derive from two primary sources,
each of which account for roughly half of the company’s
revenue.
• Transaction-based fees (44% of 2019 revenue):
Shva earns fees for each transaction that goes
through its network. It earns separate fees for the
settlement, authorization, and clearing of each
transaction (0.6969 agorot, 1.173 agorot, and 0.9448
agorot per transaction, respectively). In 2019, average
total fees per transaction was 2.14 agora (equivalent
to ~0.66 US cents).

63WWW.SUMZERO.COM
• Infrastructure-based fees (47% of 2019 revenue):
Shva gets paid 15 shekels per month for each terminal in
Israel connected to its network. If the terminal is EMV-
enabled, SHVA gets an additional 4 shekels per month
(19 shekels total).
THESIS DETAIL
ROBUST TOP-LINE GROWTH DRIVEN BY
MULTIPLE TAILWINDS
Shva has consistently grown top-line at HSD-LDD rates
annually, with revenue growing at a 10.6% CAGR between
2014 and 2019. On top of this, EBITDA margins have expanded
from 30.7% in 2017 to 46.3% in 2019 (and further to 48.7% in
1Q20 before COVID-related factors brought margins in 2Q20
and 3Q20 closer to 2019 levels).
CARD TRANSACTION REVENUE DRIVERS
From 2015 to 2019, the number of card transactions in Israel
grew at an 8.9% CAGR. The growth in card transactions has
been driven by the secular shift towards electronic payments
(driven by the superior convenience of electronic payment
methods, growth in ecommerce, etc.) as well as broader
growth in consumer spending (leading to more transactions
per person).
Importantly, there’s still a long runway for the shift towards
electronic payments to continue. In 2018, credit/debit
card transactions constituted just 38% of payments in
Israel1. Cash, checks, and bank transfers each accounted
for 26%, 13%, and 19%, respectively. Moreover, these
statistics measure the mix of payment method by total
dollar value rather than the number of transactions. Since
a disproportionate share of smaller-value transactions
are made in cash rather than by card and because Shva is
compensated based on fixed fees per transaction rather
than as a percentage of the dollar value of transactions
that go through its network, these statistics understate
the magnitude of Shva’s revenue opportunity from the
continued growth in card usage/penetration.
[see figure on following page]
It’s likely that COVID will ultimately accelerate the ongoing
shift towards digital payments as more consumers embrace
ecommerce and contactless payments. Additionally, the
Ministry of Transportation has recently taken steps to enable
the acceptance of digital payments on public transportation,
which should further accelerate the shift away from cash and
other payment methods.
Beyond the HSD historical growth in the number of card
transactions, Shva has also seen growth in the average
revenue it receives per transaction. In 2019, Shva earned
an average of 2.14 agorot per card transaction vs. 2.04
agorot in 2018 (4.8% growth). This growth was not
driven by price increases, but rather by an increase in the
proportion of transactions that go through the authorization
process. Recall that Shva is paid a separate fee for each
of the services that it provides (settlement, clearing, and
authorization). Over time, as more transactions have
required authorization, Shva’s blended average revenue
per transaction has grown. With Shva’s average fee per
transaction sitting at 2.14 agorot today vs. a maximum of
2.82 agorot for transactions that utilize all of the company’s
services, there’s potential upside of 32% to Shva’s current
revenue per transaction over the long-term even before
considering the impact of price increases. Additionally,
there’s scope to broaden the range of value-add services

64WWW.SUMZERO.COM
that Shva offers its customers. For example, the company
is in the process of developing and rolling out dynamic
currency conversion, a service that will allow tourists and
other foreign visitors in Israel to pay for transactions in
their local currency when paying by card.
Terminal Infrastructure Revenue Drivers
From 2015 to 2018, the number of terminals in Israel grew
at a 4.8% CAGR.
In addition to growth in the number of terminals, Shva’s
terminal business is set to benefit from another important
driver over the near/medium-term: the shift to the EMV
standard in Israel. While Shva earns 15 shekels per month
for each regular terminal, it earns an additional 4 shekels
per month (19 shekels/month total) for terminals that are
outfitted for EMV. The Bank of Israel has been actively
encouraging the shift to the EMV standard. Since 2015,
issuers have been prohibited from issuing non-smart
cards. Additionally, businesses with over 100mm shekels
in revenue from credit cards will be required to move
to the EMV standard by November 2020, with smaller
businesses having until July 2021. As a result, the proportion
of terminals that are EMV-enabled has inflected significantly,
nearly doubling between August and November2 of this year.
Shva won’t see the full impact of this in 2020 because
it agreed in March 2020 to discount the 4 shekel/month
surcharge for EMV terminals by 50% from March 2020
through the end of the year in order to help encourage
the shift to contactless payments during COVID. However,
with each terminal that’s outfitted for EMV representing a
27% uplift in revenue per- terminal for Shva (19 shekels vs.
15 shekels), this will be a significant tailwind in 2021/2022.
Importantly, shifting from regular terminals to EMV-enabled
terminals entails essentially no incremental ongoing costs
for Shva, so the vast bulk of this incremental revenue will fall
through directly to the bottom line.
1 https://www.boi.org.il/en/NewsAndPublications/PressReleases/
Pages/24-07-2019.aspx (https://www.boi.org.il/en/
NewsAndPublications/PressReleases/Pages/24-07-2019.aspx)
2 https://www.shva.
co.il/%d7%a0%d7%aa%d7%95%d7%a0%d7%99-
%d7%94%d7%98%d7%9e%d7%a2%d7%aa-
%d7%9e%d7%a2%d7%a8%d7%9b%d7%aa-%d7%94emv/
(https://www.shva.co.il/%D7%A0%D7%AA%D7%95%D7%
A0%D7%99- %D7%94%D7%98%D7%9E%D7%A2%D7%AA-
%D7%9E%D7%A2%D7%A8%D7%9B%D7%AA-%D7%94emv/).
Page is only available in Hebrew. Screenshot shown was
translated using Google Translate.

65WWW.SUMZERO.COM
HIGHLY COMPELLING VALUATION WITH
SEVERAL CATALYSTS TO CLOSE THE
RELATIVE VALUATION GAP
Despite a dominant competitive position, an attractive margin
structure, and significant multi-year secular tailwinds, Shva
trades at a highly discounted valuation. At 8.5x EBITDA, 15x
P/E, and a 6.6% FCF yield on my 2021 numbers, the stock
is cheap on an absolute basis. However, when viewed on a
relative basis next to peers with similar business models and
financial profiles, Shva is drastically mispriced.
This attractive valuation is a result of several non-fundamental
factors. First, Shva’s regulatory filings are published
exclusively in Hebrew. Additionally, as a consequence of its
small market cap (527mm shekels / 162mm USD) and thin
public float owing to several large long-term holders, the
stock is illiquid. Finally, the stock has no sell-side coverage, is
listed on a less-visible exchange, and has only been publicly
traded for ~18 months, all of which has limited investor
discovery.
Importantly, the company is taking steps to address many
of the factors behind its mispricing. Earlier this year, the
company began publishing translated copies of its annual
and quarterly reports in English (these are generally made
available a few weeks after initial publication in Hebrew;
though only the 2019 annual report and the 2Q20 quarterly
report are currently available in English and all previous filings
remain available in Hebrew only). Furthermore, the company
added an English language Investor Relations section to its
website last month (although content on the page is sparse
today). When I spoke with IR, it was clear that Shva has
received significant interest from non-Israeli investors (which
came as a significant surprise to the company), including
several large US institutional investors, but that the lack
of English financials was a non- starter for many of these
foreign investors. As such, publishing financials in English
and improving efforts to reach out to non-Israeli investors
would likely go a long way towards attracting incremental
buyers and could potentially drive a material re-rating. Shva’s
relatively small market cap / float means it only takes a few
incremental buyers to push the stock meaningfully higher.
On top of this, the company should soon begin paying out a
meaningful dividend. Though the company’s dividend policy is
to pay out 50% of its net income, it is currently unable to pay
dividends as a result of a temporary moratorium placed on
financial institutions’ dividend payments by the Bank of Israel
due to COVID. However, given its strong financial position
(especially relative to other financial institutions that take
actual credit risk such as banks, who were the primary target
of the Bank of Israel’s dividend moratorium), the company
has applied for approval to begin paying dividends last month

66WWW.SUMZERO.COM
and is currently awaiting approval. At today’s valuation, the
company’s 50% payout policy would translate into a well-
covered, growing ~3% dividend yield. In a low interest rate
world, such a dividend would likely add significant appeal to
the equity story.
As an illustration of the multiple that Shva could potentially
trade at if it addressed some of these issues, it’s worth noting
that the publicly-traded Tel Aviv Stock Exchange (TASE IT)
– which like Shva is a monopolistic financial infrastructure
provider that’s listed in and operates in Israel, but regularly
publishes investor materials in English and already pays
a dividend – trades at a mid-teens EBITDA multiple and
35x+ P/E despite its similar expected top-line growth, lower
margins (~30% EBITDA margins vs. Shva’s 45%+), and greater
disintermediation risk (Israeli companies can bypass TASE
by listing on other countries’ exchanges – e.g. Check Point
Software – whereas all card transactions in Israel must pass
through Shva’s network). Convergence to TASE’s EBITDA /
P/E multiple alone (without accounting for any earnings
growth) would drive upside of 37% / 136% for Shva.
VALUATION AND RETURNSBASE CASE [see chart below]
• Conservatively assume no multiple expansion despite
significant valuation gap vs. peers
• 10% top-line growth
° Fees from card transactions should grow at low double
digits driven by ~9% annual growth in the number of
transactions coupled with modest growth in revenue
per transaction (driven by measured price increases
over time, the introduction of additional value-add
services beyond core switching functions, and increases
in the proportion of transactions that go through
authorization). Over the near-term, card transactions
could grow faster than the 9% historical CAGR following
the rebound from COVID.
° Terminal fees should grow at a low-to-mid-teens rate
over the next few years, driven by ~5% growth in the
number of terminals and a ~20% cumulative pricing

67WWW.SUMZERO.COM
uplift as 100% of terminals move to the EMV standard
and the discount for the EMV surcharge lapses after
2020.
• 80% incremental EBITDA margins, lower than actual
incremental margins observed from 2017-2019
• 50% payout ratio (consistent with the company’s
dividend policy). Assume no capital deployment beyond
the dividend even though the company will have cash
significantly in excess of the minimum liquidity level
required by the Bank of Israel. Management has stated that
it will also pursue M&A where it makes sense, but I give no
credit to this.
• Three-year total shareholder return of 22.28 ( 20.71 exit
price and 1.57 in total dividends); ~70% return and ~19%
IRR.
MULTIPLE EXPANSION CASE [see chart below]
• Operating assumptions identical to base case
• Exit multiple of 12.5x LTM EBITDA, closer to TASE’s
EBITDA multiple, but still a significant discount to other
payments peers. 12.5x EBITDA translates to a 5% LTM
levered FCF yield, still significantly cheaper than comps
(including TASE).
• Three-year total shareholder return of 26.13 ( 24.56 exit
price and 1.57 in total dividends); ~100% return and ~26%
IRR
BEAR CASE [see chart on following page]
• Assumes end of cooperative agreement between Shva
and Masav and associated incremental expenses of 15mm
(see “Risk” section for details). I not only assume that the
separation occurs (which for reasons articulated below I
believe is unlikely), but also that Shva doesn’t raise prices
in order to offset the impact (which is also unlikely, as
the company has already indicated that it would raise its
prices in this scenario). As a result, I consider this to be a
highly punitive, low- probability outcome.

68WWW.SUMZERO.COM
• I assume that the 15mm in incremental expenses begins
flowing through in 2021, despite the fact that a separation
would take a number of year in practice (and in any case
wouldn’t begin until well into 2021 at the earliest).
• Assume no multiple expansion. This is highly conservative
not only because Shva trades at a significant discount
to peers, but also because the removal of the Masav
separation overhang should result in the company trading
at a higher multiple than it does today when some
uncertainty still exists.
• These assumptions drive 1-year target price of ~ 12.00
(~ 11.80 exit price + 0.30 dividend), representing ~10%
downside. However, over a longer holding period, the
underlying compounding math (double digit top-line
growth, high incremental margins, and still-cheap 2021
FCF yield of 4.5% even when burdening earnings for the
15mm increase in expenses) allows an investor to earn a
respectable 10% IRR through 2023 even in this draconian
scenario.
• Overall, the combination of a significantly net-cash
balance sheet, secular tailwinds enabling HSD-LDD
top-line growth for years to come, and a cheap absolute
valuation makes it highly difficult to underwrite a poor
outcome.
RISKS
• Potential separation of Shva and Masav: Masav is a
clearing house for interbank transfers in Israel that, like
Shva until its IPO, is jointly owned by the five major
Israeli banks. Shva and Masav currently share significant
resources with each other, including office space,
technology infrastructure, and other shared services. Now
that Shva has been separated from the banks, the Israeli
Competition Authority has argued that the cooperation
between these two entities constitutes an anticompetitive
arrangement that had not received prior approval, despite
Shva and Masav sharing these resources for over 35 years
and providing services for different types of transactions

69WWW.SUMZERO.COM
(card payments and bank transfers, respectively). In
response, Shva has filed a motion for approval of the
relationship to the Jerusalem District Court. If Shva and
Masav were no longer able to share resources, Shva has
estimated that its operating costs would increase by
15.3mm shekels. While potentially meaningful, I believe
this risk is mitigated by several key factors:
° The Bank of Israel (the supervisory body for
financial institutions in Israel) supports Shva and
Masav’s position in the matter.
° Shva’s legal argument is similar to the one made
by Mizrahi Tefahot Bank and Union Bank when
it appealed against the Competition Authority’s
attempt to block their proposed merger. The
Jerusalem District Court ultimately rejected the
Competition Authority’s argument and approved
the merger. Notably, the judge in Shva’s case
is also the same one that ruled in favor of the
Mizrahi-Union merger. Furthermore, Shva has hired
the same lawyer.
° If Shva and Masav separate and lose the
operational efficiencies that stem from sharing
infrastructure, Shva and Masav would likely
raise prices in order to compensate (note that
Masav’s profitability would be impacted to a
higher degree than Shva). Indeed, this is one of
the legal arguments being made by Shva, Masav,
and the Bank of Israel. Notably, the Competition
Authority is only allowed to consider the impact
on competition when taking an action, whereas
the District Court (as the ultimate arbiter) can
take into account broader considerations such
as efficiency and the impact on prices and to
the consumer. Shva’s ability to raise prices in
order to offset the impact of higher costs should
minimize the impact of severing Shva and Masav’s
cooperative arrangement even in the event that
the Competition Authority is successful in its
motion (which for the reasons articulated here I
believe is unlikely anyway).
• Regulation of pricing: Given its status as a monopoly,
it’s possible that politicians/regulators could seek
to place limits on the rates charged by Shva in the
future.
° Mitigant: Shva has operated since 1978 and hasn’t
seen government action taken against the rates it
charges. Shva has historically been conservative
with respect to its pricing, and most studies
comparing costs between different countries
have found that Shva’s rates are actually lower
than most of its peer in other geographies.3
° Mitigant: There’s little political incentive to go
after Shva’s fees since most consumers/voters
are unaware of Shva and because its fees are
paid by issuers and acquirers rather than directly
by consumers.
• Disintermediation: It’s possible that in the future,
payment applications that pay directly from a
customer’s bank account (thus bypassing Shva’s
network) will be developed.
° Mitigant: Currently, all mobile payment
applications in Israel (Bit, Pepper, PayBox, and
Apple Pay) make use of cards.
° Mitigant: Even in countries where such payment
applications have been embraced (e.g. Sweden),
they have generally been used primarily for P2P
transfers and have taken a very small share of
payments to businesses (where Shva derives
essentially all of its revenue).
3 See, for example, page 32 of this report: https://www.boi.org.il/
en/PaymentSystem/LawsAndRegulations/Announcements%20
Document/Payment%20Card%20Trans action%20Chain%20
(Final%20Report)%20Bank%20of%20Israel.pdf (https://
www.boi.org.il/en/PaymentSystem/LawsAndRegulations/
Announcements%20Document/Payment%20Card%20Tran
saction%20Chain%20(Final%20Report)%20Bank%20of%20Israel.
pdf)

An exclusive database of 14K+ actionable and peer-reviewed research ideas with
complete performance attribution and firm transparency.
Real-time alerts with up-to-date commentary from sector/regional experts on
thousands of stocks and bonds uncovered by Wall Street and global banks.
Proprietary analyst rankings data, sentiment filters, private messaging, and more.
•
•
•
VISIT SUMZERO.COM ›
JOIN SUMZERO TO DOWNLOAD THE COMPLETE REPORT
WWW.SUMZERO.COM 70

Ideas on companies whose respective market capitalizations were
between US $300M and US $2B at the time of submission.
SMALL CAPS

72WWW.SUMZERO.COM
Vital Farms
S H O R T
The egg market will crack in 2021 as COVID demand cedes. VITL IPO’d
in July with inflated financials fueling their valuation. In 2021 they will
compete with Amazon and halve topline growth.
TIMEFRAME
1-2 YearsSITUATION
ContrarianMARKET CAP
N/AATTACHMENTS
About Morgan Housel
Freddie Mac makes homeownership and rental housing more accessible and affordable. Operating in the secondary mortgage market, we keep mortgage capital flowing by purchasing mortgage loans from lenders so they in turn can provide more loans to qualified borrowers. Our mission to provide liquidity, stability, and affordability to the U.S. housing market in all economic conditions extends to all communities from coast to coast.
About Freddie Mac
I’m a 22 year old investor and have been the PM of my brokerage account for 4 years. Generally, I am interested in a bit of everything - value/growth/long/short/situations and prefer conviction and concentration. I graduated from UC Berkeley in 2020 with a double major in Economics and Interdisciplinary studies. Currently I work at Freddie Mac on the Multifamily Capital Markets team. I am also pursuing my CFA. [email protected]
About Sahil Chawla
WINNER
Idea Posted: 12/21/2020
Asset: Equity
Idea Updated: 12/24/2020
Symbol: VITL: US
EXPECTED RETURN:
50.76%
Sahil ChawlaAnalyst at Freddie Mac
Small Caps
RETURN TO DATE:
9.63%

73WWW.SUMZERO.COM
Asset Class: Equity Symbol: VITL: US Updated: 12/24/2020 Submitted: 12/21/2020
Vital Farms
BY:
CURRENTLY AT:
Sahil Chawla
The egg market will crack in 2021 as COVID demand cedes. VITL IPO’d in
July with inflated financials fueling their valuation. In 2021 they will compete
with Amazon and halve topline growth.
ASSET CLASS:
EquitySITUATION:
ContrarianTARGET ALLOCATION:
1.5% - 2%CATALYSTS:
N/A
TIMEFRAME:
1-2 Years
EXPECTED RETURN
TARGET PRICE
INITIAL PRICE
50.76%
13.00 USD
Pricing & Return Details S H O R T
DISCLAIMER: The author of this idea had a position in this
security at the time of posting and may trade in and out of
this position without informing the SumZero community.
Vital Farms is a branded egg distributor, focusing on
supplying pasture-raised eggs to meet the growing trend
of ethical food consumption. At its core, Vital is selling
a commodity and what moat the company does have is
eroding. A combination of unsustainable trends have caused
the outlook of the company to be severely overstated, with
multiple catalysts for a realization of a more realistic valuation.
Current Price: $26.40
Target Price: $13
Downside: 50%
THESIS SUMMARY
Vital Farms went public in July 2020. COVID-related demand
from stockpiling and home-cooking as well as growth in
distribution has shrouded the true operating nature of the
company. At 80x 2021 EV/EBITDA, VITL is a short with
multiple pathways for realizing a more realistic valuation.
1. YOY COMPS: COVID has disrupted the growing
trend of eating out in favor of home-cooking.
Stockpiling has also caused shortages of eggs in some
locations. As we return to normalcy, Vital Farms will
show worsening financial results. In their S-1, they
attributed half of growth and 280 bps of margin to
stockpiling. Further, their biggest revenue source,
Whole Foods, began to compete against them at the
INVESTMENT THESIS
Freddie Mac
28.46 USD

74WWW.SUMZERO.COM
peak of the craze. As demand dies down, the effects
will shine through Vital Farms’ financials.
2. SATURATION OF DISTRIBUTION: During the
demand craze of this year, new store growth has fallen
to 5% QoQ. Prime locations for distribution are likely
to have already been picked up and new additions are
less accretive, driving down revenue/store compared
to sellside assumptions.
3. COMPETITION: Currently, brand power and
differentiation between conventional eggs allow for
a $1-$2 markup. Vital Farms relies on mainstream
(Walmart, Albertsons) and natural (Whole Foods,
Sprouts) stores. In no location was Vital Farms
the cheapest, losing to competing brands in the
mainstream locations and store-brands in the natural
locations, each offering identical pasture-raised eggs.
Now that the market has been proven, big players are
also beginning to enter it.
4. REGULATION: 7 states with 23% of US population
have enacted regulation moving away from
conventional methods into cage-free and above. As
suppliers are forced to comply, the cage-free method
will become normative, eroding the ethical moat of
Vital Farms that relies on the comparison of pasture-
raised to typical methods of keeping hens and inviting
conventional suppliers into their market.
5. VALUATION: Their closest competitor Cal-Maine
trades at 1.1x 2021 revenue and 13x 2021 EV/EBITDA
vs 3.6x and 82x for Vital Farms. We will see why the
growth premium is unwarranted even in the best-case
scenario, implying ~50% downside.
CATALYST SUMMARY
In 2021 the company’s results will have to answer competition
on the part of their largest customer undercutting them
by over $1 in almost all major metropolitan areas, a sharp
decrease in egg demand as COVID’s effects dissipate, and
slowing new store growth. Beyond 2021 they will face the
transition of the US egg supply to cage-free and how they
plan to maintain market share in such an environment with
growing competition.
BUSINESS
Vital Farms operates in the growing trend of ethical
food consumption. Consumers show a sizable interest in
understanding where their food comes from, with more
than 75% attributing some weight to sustainable practice in
purchasing decisions.1
Eggs are a ~$10Bn business in the USA. of that goes to egg
products - meaning that they aren’t sold as shelled eggs but
rather in liquid or solid form for use in egg-based foods. The
rest of the production is split between conventional, cage-
free, free-range, pasture-raised, and a few other varied labels.
Conventional eggs are the largest market since they are the
cheapest, both in the retail and food service segments. This
market is shrinking in favor of labels with less implied cruelty
due to demand and regulation. The shell egg market as a
whole has seen constant but slow growth over time. Segments
within the shelled egg market, like pasture-raised, are gaining
market share at much higher rates.
As an egg distributor, Vital Farms partners with “family farms”
to sell Pasture-Raised eggs. They sign contracts with these
farm owners that guarantee purchase of the eggs at a given
rate while farms are responsible for all of the working capital
needed to produce them. When signing these contracts, Vital
Farms ensures that the conditions for the hens are enough to
meet the Certified Humane definition of 108 sq ft per bird and
are then able to market the eggs as such (not regulated by
the USDA). Once they purchase the eggs, they send them to
their processing location where they are weighed, sorted, and
packaged. They have one location in Springfield, MO which
they are working to double the capacity of. From there, it is
shipped to retail locations around the US, sold under their
brand-name.
1 https://sustainablebrands.com/read/stakeholder-trends-and-insights/77-of-americans-say-sustainability-factors-into-food- purchasing-decisions
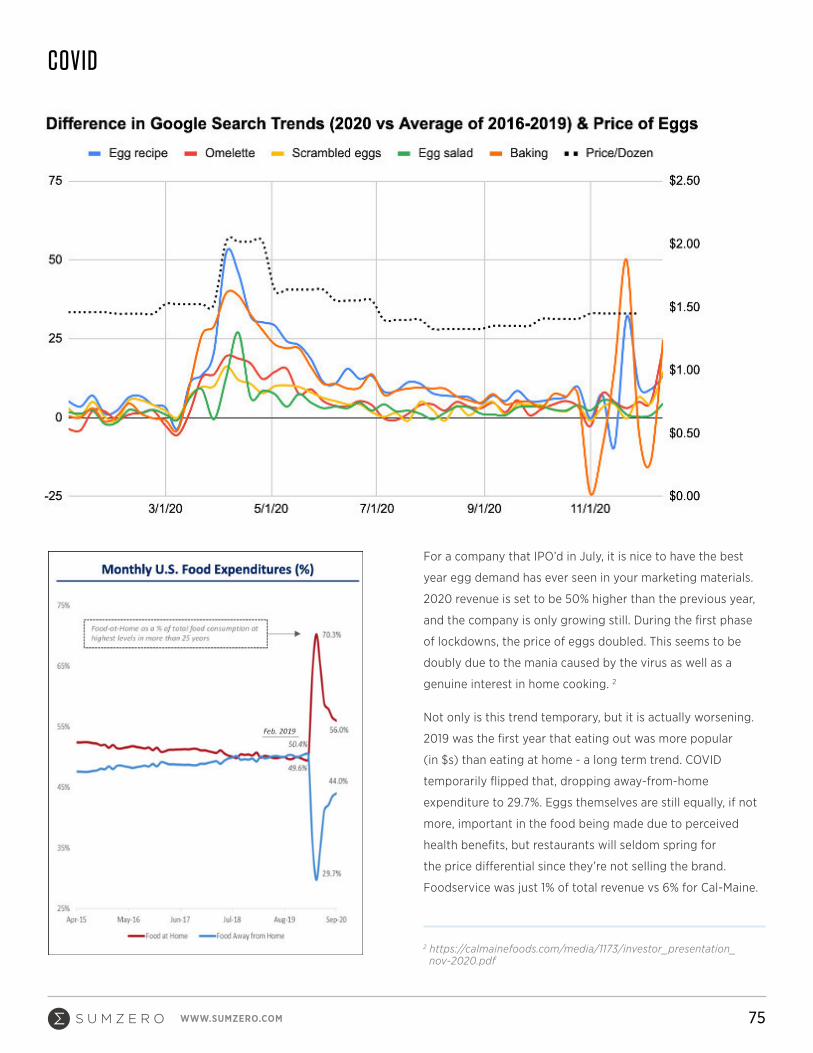
75WWW.SUMZERO.COM
COVID
For a company that IPO’d in July, it is nice to have the best
year egg demand has ever seen in your marketing materials.
2020 revenue is set to be 50% higher than the previous year,
and the company is only growing still. During the first phase
of lockdowns, the price of eggs doubled. This seems to be
doubly due to the mania caused by the virus as well as a
genuine interest in home cooking. 2
Not only is this trend temporary, but it is actually worsening.
2019 was the first year that eating out was more popular
(in $s) than eating at home - a long term trend. COVID
temporarily flipped that, dropping away-from-home
expenditure to 29.7%. Eggs themselves are still equally, if not
more, important in the food being made due to perceived
health benefits, but restaurants will seldom spring for
the price differential since they’re not selling the brand.
Foodservice was just 1% of total revenue vs 6% for Cal-Maine.
2 https://calmainefoods.com/media/1173/investor_presentation_nov-2020.pdf

76WWW.SUMZERO.COM
Egg consumption per capita has historically grown at a rate
of about 0.7% per year since 1999. From 2015-2019, the
rate increased to 3.5%.3 2020 has been a true aberration,
with half of revenue growth and 280 bps of margin
improvement attributed to price and volume resulting from
lockdowns.4
COMPETITION
What is the order of operations in choosing here? I’d argue
1. What price am I willing to pay? 2. How many do I want?
3. Should I buy a sustainable brand? And then, using the
narrowed down options, maximize ethics while minimizing
price. But how long are you willing to spend on this? How
long does it take to find Vital Farms?
Vital farms claims in their earnings report to be the #2
Overall Egg Brand and #1 Pasture-Raised Egg Brand in the
US with 80% market share.[5] This couldn’t be farther from
reality as they exclude private labels in their calculation,
even as private labels like those of Sprouts and Whole
Foods carry the same ethos of the store in being natural.
In reality, assuming their supply has grown with their demand,
they are not even in the top-50 egg producers. Compared to
Cal-Maine’s 44m hens, Vital Farms likely has closer to 3m.[6]
They also lose on price. Vital Farms sells their Pasture-Raised
eggs for $5.99 and Organic Pasture-Raised eggs for $6.99.
Whole Foods accounts for over 30% of their revenue and has
undercut them on price in the Pasture-Raised category in all
of the top-30 cities by population in the US according to my
research. Based the earliest online reviews for Whole Foods’
product, this was launched in April 2020 so results have yet
to normalize the impact. Sprouts similarly carries their brand
at $1 cheaper (seems to have launched in late 2019) but I have
also found Organic Pasture-Raised eggs by a local (Bay Area)
brand (Red Hill) for $3.99 - $2 cheaper.
3 https://unitedegg.com/facts-stats/
4 https://investors.vitalfarms.com/static-files/5ce98856-66b2-4b85-b30c-79823bb66a9c
5 https://investors.vitalfarms.com/static-files/6de2cdce-b67f-4f05-a314-126927d47d5a
6 https://www.itpnews.com/uploads/2018/02/watt_eggi_201802.pdf?direct_access_media=1

77WWW.SUMZERO.COM
Further, in their S-1 they claim “the U.S. pasture-raised retail
egg market in 2019 accounted for approximately $177.0 million
in retail sales and has grown at a CAGR of 31.7% between 2017
and 2019”.7 Using this, we are able to back-out their market
share to see that, even before Amazon and Sprouts entered
their market, they were losing share despite their growth.
These competitors have better distribution at lower costs,
the same, if not better, access to Vital Farms customers, and
pricing power over the company itself, given the high reliance
on these concentrated revenue streams.
OTHER BETS
Vital has also begun selling products like hard boiled eggs,
butter, ghee, liquid whole eggs, and egg bites. These products
are more likely to be sold at Whole Foods and Sprouts vs their
mainstream distribution sources (5.7 average items including
eggs vs 2.8). Based on the store penetration of 1,577 for hard
boiled eggs, the most successful non-butter venture, these
items have far less reach and are contributing negligible
amounts to revenue compared to butter at ~10% of revenue
with 12,060 stores.8
Butter is sold only in the 8oz quantity for $3.99-4.99 and
ranges from 2x as expensive (including 16oz adjusted prices)
to 25% more expensive (8oz only) compared to other Pasture-
Raised brands. Compared to conventional butter, Vital Farms
was 2.5x the cost (16oz only). The butter market at large is
also smaller, at $3.3Bn with a 2.7% CAGR from 2017-2019.9
7 https://investors.vitalfarms.com/static-files/c6d115bd-6bd6-4a72-ad76-7b0b3a8df27f
8 https://investors.vitalfarms.com/static-files/6de2cdce-b67f-4f05-a314-126927d47d5a
9 https://investors.vitalfarms.com/static-files/c6d115bd-6bd6-4a72-ad76-7b0b3a8df27f

78WWW.SUMZERO.COM
BRANDING
Their selling point to consumers and investors comes in
the form of supposed brand power, attesting that people
should, and are willing to, pay more for the eggs with
the same certification so long as it is sold under the logo
of Vital Farms. This only accounts for a small sect of
loyal customers while many will be driven towards the
competitive offerings of the private labels of grocers,
who also are able to determine the real estate of the egg
section.
And, for those brand-sensitive customers, Vital Farms is
losing the narrative battle. With a smaller base of 89,000
Instagram followers compared to the 109,000 of Pete and
Gerry’s - a rival ethical egg producer - their draw is only
worsening in comparison. 10
Monthly Gained Followers for ‘Vital Farms’
Monthly Gained Followers for ‘Pete and Gerry’s
Organic Eggs’
This is also as brands that may be less social media
savvy offer identical products at rapid rates of increased
distribution like Handsome Brook Farms and Happy Egg Co.
The latter is Walmart’s brand of choice - cheaper by over $1.
Competitors aren’t all pasture-raised but do compete for
the same customer base by offering free-range and organic
options. Many of the largest brands, like Cal-Maine, are
currently sitting at cage-free (45% of revenue) but, as demand
and regulations change, have the ability and distribution to
enter higher-standard markets with force.
REGULATION
MAJOR EGG LABELS
Conventional: Chickens are treated legally
Cage-free: Chickens did not live in cages
Free Range: Access was provided to the outdoors
Pasture-Raised: Chickens spend the day outside and have
indoor spaces to spend the night or winter in (up to 2 weeks)
Organic/GMO: Describes the chicken feed
This trend of ethical consumption has gone mainstream. Both
Walmart and McDonalds have pledged to only use cage-free
eggs by 2025. Many states already have enacted similar laws
that would require all eggs sold in the state to be cage free
- amounting to over 20% of the US population. In totality,
to reach these goals, over half of all eggs being produced
will come from cage free sources. Cage-free is becoming a
de-facto norm that eventually most producers will abide by.
Some consumers will lose the ethical imperative to avoid the
cheapest eggs as they are less cruel.
10 Socialblade.com
11 https://www.fb.org/market-intel/cage-free-eggs-were-once-
expected-to-dominate-the-egg-market
11

79WWW.SUMZERO.COM
Producers are going to have to make this transition
soon. Cal-Maine estimates that 70% of hens will need
to be in cage-free facilities by 2026 and have invested
over $400m to make that a reality already.12 Most other
producers will be forced to cease operations in traditional
means. This can also mean graduating beyond cage-free
into higher ethical certifications - like pasture-raised.
It’s an economic decision. If there are profits being
made supplying those eggs, they will enter the market
and drive down profits for existing players. In the past,
conventional producers were able to operate as normal
without having to make any major investments. In the
coming years, they are forced to upgrade their facilities,
basically being pushed into the ethical egg market at
least at the lowest level by their customers, states, and
consumers. The largest portion of the $10Bn TAM is
going to be distributed into the different egg varieties,
increasing competition at all levels.
VARIANT VIEW
The biggest problem with the sellside estimates is the use
of 2020 as a base year and failure to recognize the first
principles of operating as an oligopoly.
On the former: estimates tout extreme CAGR figures for
a market with a hard ceiling. Pasture-Raised eggs are a
growing subsect of a growing subsect (cage free+) of
a mature market growing at 1-3% a year. Irrespective of
the competition that has breached the castle, it’s hard to
see why 2021 will be a year with more growth given the
aberration that 2020 has been.
On an egg-revenue per store basis (assumes 10% of
revenue from other bets) the company historically has
operated in the range of $10,000 +/- $2,000, even in
2020. There are about 40,000 locations in the US that
sell grocery items.13 To be in that same range of 90% of
revenue from eggs and ~$10,000 per store, they would
essentially need to be in every single one of these
locations by 2024 (more than doubling locations and
their historical location growth rate) and cannot suffer
any loss in unit economics. This is taking the projected 2024
revenue as given.
Marginal store additions are likely to continue at a slower rate
since demand for higher-end commodities is not ubiquitous
and the best locations are likely to be already served. All of
the top-30 cities by population carry their products already.
Still, if we assume a generous growth rate, bringing them to
over 22,000 stores in 2024, revenue projections are hard to
comprehend. At over half of US stores served, egg-revenue
assumptions imply a more than doubling of revenue per store.
Further, revenue assumptions continue to assume extreme
growth in the size of the market and Vital Farm’s implied
share. The market for pasture-raised eggs is unsustainable
since the region where hens can access the pasture year-
round is limited to the south due to the suitable weather.
The model demonstrates exactly how the sell side
assumptions of over $500m in 2024 revenue, implying $450m
from eggs, are not rooted in reality. If we keep 2020’s market
size as even, or write in a small decline followed by continued
strong growth, and factor in a generous 50%+ market share,
we are still far from the base case.
[see figure on following page]
This isn’t technology. It’s hard to see why the demand shifts of
home-cooking and stockpiling should continue as we return
to normalcy at the rate that these estimates assume. The
basic problem is that projections ignore the reality faced by
the company in the grocery store. Even without 2020 - the
company was facing an inflection point in their ability to
sustain their growth. Remember - half of their 2020 growth
is due to COVID. Their multiple is going to be harder to justify
when topline growth falls dramatically.
12 https://calmainefoods.com/media/1173/investor_presentation_nov-2020.pdf
13 https://www.foodindustry.com/articles/how-many-grocery-stores-are-there-in-the-united-states/

80WWW.SUMZERO.COM
VALUATION
As a result, to reach the price target of $13, I have modeled
in some more very generous assumptions. At an 8% EBITDA
margin, higher than they have ever achieved, and a 30x
multiple, higher than Facebook, they are worth 40-50+%
less - even using sellside estimates. Other companies
that trade at more than twice their market multiple may
continue to put up big numbers, growing to their valuation.
For Vital Farms, 2021 and beyond should be years of
reckoning for the reasons mentioned earlier. The valuation
in the model is accommodating to protect from unexpected
developments. It would be reasonable to expect downside
below $12 absent any saving graces.
It’s also worth noting that the company seems prone to
tail risk. The avian influenza outbreak in 2016 reduced
Cal-Maine sales by 44%. In 2019, Vital was subject to a
recall in hard boiled eggs due to listeria. Vital farms has a
concentrated production base and only one distribution
center that they are expanding capacity on located in
Springfield, MO.

An exclusive database of 14K+ actionable and peer-reviewed research ideas with
complete performance attribution and firm transparency.
Real-time alerts with up-to-date commentary from sector/regional experts on
thousands of stocks and bonds uncovered by Wall Street and global banks.
Proprietary analyst rankings data, sentiment filters, private messaging, and more.
•
•
•
VISIT SUMZERO.COM ›
JOIN SUMZERO TO DOWNLOAD THE COMPLETE REPORT
WWW.SUMZERO.COM 81
RISKS
• State laws making cage-free eggs the norm can be
deemed unconstitutional as it regulates interstate
commerce. This has been denied by district courts and
the Supreme Court refused to hear the case.
• Butter and other products can bridge the gap in projected
revenue.
• There may be some permanence in lockdown trends. If
people continue to cook at home it would help sustain
some of the growth the egg market has seen but would
still likely equate to a YoY decline.
• Possibility of a buyout by Cal-Maine sized producer. This
would kill the brand ethos and is unlikely at this valuation.
They are already investing in expansion for cage-free
eggs and have a history of acquiring farms making them
more likely to compete on contracts with farmers vs
buying Vital Farms outright.
• International expansion. This would increase the number
of potential customers but there are not many candidate
markets that don’t already have their demand met.
Additionally, it would be a significant downward force on
margins.
• Growth in egg consumption accelerates. If this were a
concern it would be possible to turn this into a pair trade
by going long Cal-Maine (CALM).

82WWW.SUMZERO.COM
Cineplex Inc Com
L O N G
From Long-Term Bear to Bull. Cineplex’s near monopoly on movie
cinemas in Canada’s largest cities remains a rare gem. Cash cow should
be milked, no point in trying to make it a show horse.
TIMEFRAME
1-2 YearsSITUATION
Deep ValueMARKET CAP
163.0M USD
About Morgan Housel
Lightwater Partners is an independent Toronto-based investment manager founded in 2007. We manage funds on behalf of individuals, families, Investment Advisors, family offices and corporations, both domestically and internationally. Lightwater Partners is registered in Canada with the Ontario Securities Commission as a Portfolio Manager, Investment Fund Manager, and Exempt Market Dealer. Our investment focus is mid-Cap Canadian stocks. We seek to identify “uncrowded” or under-followed companies that are under-valued or over-valued by the market. This approach has allowed Lightwater to outperform Canadian equity markets over the past 12 years while exhibiting lower risk and volatility than the market. To maintain a lower-risk profile, we have portfolio protection in place at all times: short positions are used to hedge long investments.
About Lightwater Partners Ltd.
Jerome joined Lightwater as a Portfolio Manager in 2007 and has over 25 years experience in the financial industry. Previously, he worked as a Portfolio Manager at a prominent Canadian hedge fund and Montrusco Bolton Investments. Mr. Hass also worked as a Portfolio Manager in London, England for Canada Life Assurance Company. He started on the buy-side at Scottish Amicable Investment Managers in Scotland. Mr. Hass also worked as a sell-side Analyst with HSBC Investment Bank in Singapore and Malaysia. He began his career as an Economist with the Ministry of Finance. He holds a Bachelor degree in Economics from the University of Western Ontario, a Master of Arts in Applied Economics from the University of Victoria as well as a Master of Science degree in Economics from the London School of Economics. He obtained the Chartered Financial Analyst (“CFA”) designation in 1998.
About Jerome Hass
FINALIST
Idea Posted: 12/23/2020
Asset: Equity
Idea Updated: 12/27/2020
Symbol: CGX:CN
RETURN TO DATE:
1.7%
EXPECTED RETURN:
262.86%
Jerome Hass BADGES:Portfolio Manager at Lightwater Partners Ltd.
Small Caps
CURRENT RANKING: #2 Special Situations
ATTACHMENTS
11 13

83WWW.SUMZERO.COM
Asset Class: Equity Symbol: CGX:CN Updated: 12/27/2020 Submitted: 12/23/2020
Cineplex Inc Com
BY:
CURRENTLY AT:
Jerome Hass
From Long-Term Bear to Bull. Cineplex’s near monopoly on movie cinemas
in Canada’s largest cities remains a rare gem. Cash cow should be milked,
no point in trying to make it a show horse.
ASSET CLASS:
EquitySITUATION:
Deep ValueTARGET ALLOCATION:
5% - 10%
CATALYSTS:
M&A/Buyout Target
TIMEFRAME:
1-2 Years
EXPECTED RETURN
TARGET PRICE
INITIAL PRICE
262.86%
34.00 CAD
9.21 CAD
Pricing & Return Details LO N G
CINEPLEX: FROM LONG-TERM BEAR TO BULL
1. SUMMARYIn this report we outline why we were short Cineplex in the
past and why we now see the stock as extremely under-
valued with a $34 per share target (250%+ upside). The film
exhibition industry is widely perceived to be a sunset industry.
We believe the industry data conveys a less gloomy reality
than this perception. Cineplex’s near monopoly on movie
cinemas in Canada’s largest cities remains a gold mine. The
six year diversification strategy has been a disaster. A new
owner would quickly ditch the capital intensive non-theatre
ventures that have been a drain on the Cineplex’s cashflows
for years. Once streamlined and returned to its asset-light
model, Cineplex would emerge as a cash cow. There is further
upside from a private equity buyer, as its stable cashflows
allow it to load the company with debt. Regardless of
technological innovations, consumers still want to get out
of their home occasionally. A night at the cinema is a cheap
form of entertainment that should rebound back to normal
with pent-up demand from COVID-19 restrictions.
Lightwater funds own both the common shares (CGX-
TSX) and listed convertible debentures (CGX.DB.B-TSX) of
Cineplex. We prefer the debentures for their 5.75% coupon,
low conversion price ($10.94), and superior creditor position.
The author personally owns both the debentures and
common shares.
INVESTMENT THESIS
Lightwater Partners Ltd.
BADGES:
CURRENT RANKING: #2 Special Situations
11 13

84WWW.SUMZERO.COM
2. COMPANY PROFILECineplex is the dominant movie exhibitor in Canada (with
75% market share pre-pandemic). The company’s size and
scope create a material barrier to entry and of strategic
importance to film distributors, concession suppliers,
and advertisers. If a distributor wants to show a film in
Canada, it needs to talk to Cineplex. It also operates a near-
monopoly with its national in- theater advertising network
(with 94% market share), as well as a digital signage
business, and a restaurant / entertainment chain, The Rec
Room. Cineplex cinemas operate only in Canada and are
not affiliated with movie chains outside Canada.
3. INDUSTRY OVERVIEW“When is the last time you went to a movie?”, a former
Cineplex shareholder recently commented when asked
of his views on the stock (pre-COVID-19 lockdowns). The
film exhibition industry is widely perceived to be a sunset
industry. We believe the industry data conveys a less dour
reality than this perception. Below shows a rather healthy
looking graph showing U.S. Domestic Box Office revenues
over the past 25 years. It has more than doubled over the
period, growing at a respectable CAGR of 3.0%.
Critics will correctly argue that U.S. attendance has been
declining for more than a decade, with a peak in 2002 (see
chart below). Attendance will fluctuate year to year so we
prefer to look at averages. Comparing average attendance
over the last five years (2015-19) with the five years before
that (2010-14), U.S. attendance dropped a relatively modest
3% or roughly 0.6% per year.
The drop in attendance was largely offset by increases in U.S.
ticket prices. As shown by the graph below comparing growth
in average U.S. ticket prices versus total box office revenues
(1995-2019), both have more than doubled over the period
(3.0% CAGR).
The story in Canada is clouded by the absence of industry-
wide data. Cineplex has held a 70% to 78% market share since
2012 so its data covers the bulk of the industry. Critics tend
to focus on the decline in attendance since 2015 – largely
attributed to the rise in popularity of Netflix (at the end of
2019, Netflix had an estimated 6.5 million subscribers in
Canada). However, with the benefit of a longer time series
(20 years), one observes that attendance has been largely
source: https://www.the-numbers.com
source: https://www.the-numbers.com
source: https://www.the-numbers.com

85WWW.SUMZERO.COM
flat since 2009 (see chart below). We recognize the
imperfections of this data; however, it clearly conveys a
healthier industry profile in Canada than the U.S.A. This
may be partial explained by the large market share (10%)
held by independent cinema exhibitors, many of whom
show ‘non-Hollywood’ products such as French language,
Canadian or foreign films. Many provinces, such as Ontario,
have programs to specifically support ‘repertory’ or art
cinemas.
In contrast to its U.S. peers, Cineplex has not relied on
prices increases to grow its box office revenues over the
past ten years (see blue bars in chart below). Their strategy
has been to keep its base ticket price “as affordable as
possible”. The modest base ticket price increases (2017-19)
were directly attributable to significant hikes in the legal
minimum wage (notably Ontario raised its minimum by
20% in 2018), as 90% of Cineplex’s 13,000 employees earn
minimum wage.
Cineplex has been effective in using its SCENE loyalty
program to target additional concession sales and premium
services (gold bars in chart below). The growth in its Box
Office per Patron has been driven by the move to higher-
priced premium offerings (such as VIP theatres, D-Box
special effects, enhanced UltraAVX sound, IMAX screens,
3D movies). The VIP format has also enhanced concessions
per patron, as VIP guests consume twice the average rate.
The introduction of alcohol and better quality food will
continue to increase basket size and act as a tailwind for
further concession growth per patron.
We believe Cineplex movie prices are 10% to 17% lower in
general than its US peers. This is in contrast to most other
consumer products and services in Canada, where prices
are typical significantly higher than U.S. prices. American
cinema operators may need to be more cautious on the risk of
continued price increases, whereas Cineplex has more scope
to do so in the future.
CINEPLEX PRICES LARGELY FLAT 2009-2019
Cineplex is the largest cinema operator in Canada with a 75%
market share at the end of 2019. It has held as a high as 78%
share. We suspect their market share will rise in the post
COVID-19 era, as some of its smaller rivals will not survive
the extended lockdown. The #2 player in Canada (Landmark)
does not operate in the largest urban areas so Cineplex enjoys
a near monopoly in markets such as Vancouver and Toronto.
Cineplex does not operate any cinemas outside Canada.
source: Cineplex investor presentations
source: Cineplex presentation Q4 2010
source: Cineplex presentation Q4 2019 and Rentrak

86WWW.SUMZERO.COM
Cineplex is the fourth largest cinema operator in North
America in terms of the number of screens, behind AMC,
Cineworld / Regal and Cinemark. In November 2019,
Cineworld made a $34 cash bid for Cineplex. The combination
of the two would have created the largest cinema chain in
North America.
A lot of media attention has focused on Netflix and other
streaming services during the pandemic. The quality of audio
video systems available to consumers at home is comparable
to cinema standards and the breadth and depth of content
is impressive. Regardless of technological innovations,
consumers still want to get out of their home occasionally.
This is especially so during the COVID-19 lockdowns.
Commercial cinema has survived many technological changes
over the last 100 years. A night at the cinema is a cheap form
of entertainment that will not disappear any time soon.
4. FROM LONG-TERM BEAR TO BULL
It may surprise our long-term investors to read that we have
a long position in Cineplex. Historically, no one would accuse
us of being cheerleaders for the stock; we have been out-
spoken critics of the company for the past six years [see video
clip link below this paragraph]. We even argued the bear
case in a bull versus bear debate live on the Business News
Network (BNN) against a prominent mutual fund manager.
Our funds first began shorting Cineplex in 2014. Our view
was due to (i) its extreme over-valuation and (ii) its much-
lauded diversification strategy. There is a scarcity of stable
consumer stocks in Canada so the stock was ‘over-owned’
by institutional managers, especially following the 2008-09
recession when the cinema business was widely viewed as
‘recession-proof’. As a consequence, Cineplex was grossly
over-valued relative to its larger, more profitable American
peers such as Cinemark, Regal or AMC. At times, Cineplex
traded at twice the valuation of its American peers.
A FORMER STOCK MARKET DARLING – UNTIL 2015
When analyzing Cineplex, investors and Analysts tend to
focus on the upcoming slate of films. History has shown that
Analysts are not particular good at picking box office winners
and losers. As a hedge fund, we mitigate as much risk as
possible. In this instance, the main risks to our short position
were blockbuster movies and higher movie attendance. To
offset this industry- specific risk, we weheld a long position
in Cinemark (CNK-NYSE). Cinemas generally show the same
movies north and south of the 49th parallel, so we didn’t
really care if the next Star Wars episode or Fast & Furious
17 was a hit or a flop because we had hedged out box-office
risk. Moreover, Cinemark actually stuck to its core business
of exhibiting movies unlike Cineplex, which diversified into
non-cinema businesses (such as stand-alone casual dining
restaurants and E-gaming tournaments) while driving up
operating costs and reducing margins.
Source: Cineworld presentation, 16 December 2019
Source: Cineplex AGM presentation 2015

87WWW.SUMZERO.COM
When analyzing Cineplex, investors and Analysts tend to
focus on the upcoming slate of films. History has shown that
Analysts are not particular good at picking box office winners
and losers. As a hedge fund, we mitigate as much risk as
possible. In this instance, the main risks to our short position
were blockbuster movies and higher movie attendance. To
offset this industry- specific risk, we weheld a long position
in Cinemark (CNK-NYSE). Cinemas generally show the same
movies north and south of the 49th parallel, so we didn’t
really care if the next Star Wars episode or Fast & Furious
17 was a hit or a flop because we had hedged out box-office
risk. Moreover, Cinemark actually stuck to its core business
of exhibiting movies unlike Cineplex, which diversified into
non-cinema businesses (such as stand-alone casual dining
restaurants and E-gaming tournaments) while driving up
operating costs and reducing margins.
As shown by the four-year chart [below] (1 January2015 to
31 December 2018), this pair trade worked very well. While
Cinemark was flat (+1.4%) over the interval, Cineplex was
down 42%. So the weakness in Cineplex’s share price should
not be attributed to weak industry fundamentals. The blame
should be placed on its diversification strategy.
5. THE DIVERSIFICATION OR ‘DI-WORSIFICATION’ STRATEGY
The current CEO of Cineplex, Ellis Jacob, has held the office
since 2003. From 2003 to 2015, the company was a stock
market darling, generating a 23% CAGR over the period.
Every institutional manager and Investment Advisor held the
stock. It was also popular with grandma and grandpa due to
its growing 3% dividend yield (paid monthly) and resilient
business model.
Cinemas have existed as commercial enterprises for 125 years
so one would be safe to describe it as a mature industry.
Theatres face increasing competition from online rivals such
as Netflix and Disney+. As well, by 2015 Cineplex held a
CHART COMPARING CINEPLEX VERSUS CINEMARK OVER FOUR YEARS FROM 2015 TO 2018

88WWW.SUMZERO.COM
78% market share in Canada as it had consolidated the few
remaining cinema chains. There was only two cinema chains
left of any size, Landmark (10% share) and Guzzo (2% share;
independents hold about 10% share), so further acquisitions
were unlikely due to the threat of the Competition Bureau
blocking them. Despite being the land of oligopolies and
monopolies, even in Canada industry concentration has its
limits.
Sell-side Analysts like growth companies because they need
capital to grow, which means their employers (brokerage
houses) generate deals. Conversely, companies that are cash
cows and are self-sufficient in capital do not get much interest
from the brokerage community. That’s why CEO Ellis Jacob
and the Cineplex leadership team decided the company
needed to be about more than the movies.
It is not surprising that when management proposed the
growth and diversification strategy, Analysts were quick to
embrace the idea. As one Analyst observed at the time, “This
strategy should not only lower earnings volatility, but also
offer higher growth potential relative to Cineplex’s traditional
business”. Other Analysts were worried that its core business
was “at the mercy of the film slate, and is obviously quite
mature and at some risk over the medium term.” Management
ultimately sought to have half of its revenues and EBITDA
from ‘non-Hollywood’ products. As a result of this vision,
Cineplex was lauded as having one of the best management
teams in Canada.
5.1 THE WRECK ROOM
The most prominent diversification initiative is The Rec Room,
although shareholders may prefer our alternative spelling,
the Wreck Room, given the drain this venture has put on
Cineplex’s cashflows. These are stand-alone casual dining
amusement gaming, and live entertainment venues, similar
the Dave & Buster model. We prefer to view them as ‘Chucky
Cheese for millennials’.
Our biggest criticism of the diversification is that Cineplex
they are capital-intensive versus its capital-light core business,
lowering returns on capital and equity for the overall business
mix. The Rec Room is case in point: the net cost for each
facility is anywhere from $6 million-$10 million per site,
depending on the size. Management aimed to open 10 to 15
locations. Analysts initially believed these facilities would earn
better returns than the core cinema business to justify the
capital outlay but that had not proven to be the case. Specific
financial data on this segment are not disclosed but we do
not believe it is close to profitable six years into the project.
To date only, seven Rec Room locations have opened, an
indication that even management might concede the roll-out
has not been a success.
5.2 NON-CINEMA DIGITAL SIGNAGE
Cineplex’s media operations consist of two segments: an in-
house theatre advertising arm, (Cineplex Media) and its digital
signage business (Cineplex Digital Media). While all traditional
media platforms have faced advertising headwinds, its in-
theatre advertising has more held up reasonably well. Given
that Cineplex controls about 94% of this market in Canada, we
view in-theatre advertising as part of its core cinema business
and believe it should remain so, even under private equity
ownership.
Conversely, we do not like the digital signage business, both
as a customer and an investor. Thanks to Cineplex’s new
digital signs, when one goes into a Tim Hortons to buy a
coffee and doughnut, the customer is greeted by a multi-
media display that tells you everything but the price of the
coffee and doughnut that you want to order. Cineplex also
has a contract to provide digital signage at ‘The Beer Store’
in Ontario (the creatively named monopoly beer retailer in
Ontario). Thanks to Cineplex’s signage, in order for a beer
customer to look up the price of a product, one has to leave
the main line-up (yes, we actually have to line-up to buy beer
at the monopoly store in Ontario) to walk over to the ATM-
like device that apparently has pricing information. Since
these machines were installed a few years ago, I have yet to
see anyone actually look up a price. This is clearly a boon to
breweries, as customers are now even less price-aware than in
the past. This digital technology replaces the 1950’s style price
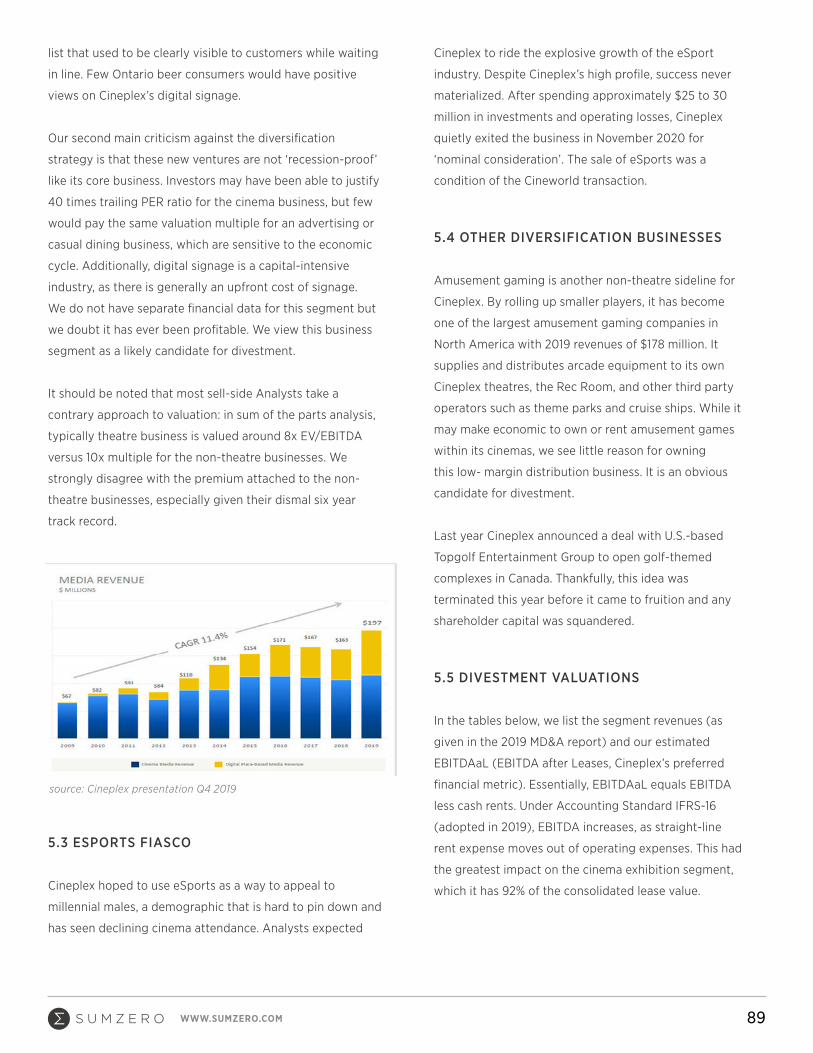
89WWW.SUMZERO.COM
list that used to be clearly visible to customers while waiting
in line. Few Ontario beer consumers would have positive
views on Cineplex’s digital signage.
Our second main criticism against the diversification
strategy is that these new ventures are not ‘recession-proof’
like its core business. Investors may have been able to justify
40 times trailing PER ratio for the cinema business, but few
would pay the same valuation multiple for an advertising or
casual dining business, which are sensitive to the economic
cycle. Additionally, digital signage is a capital-intensive
industry, as there is generally an upfront cost of signage.
We do not have separate financial data for this segment but
we doubt it has ever been profitable. We view this business
segment as a likely candidate for divestment.
It should be noted that most sell-side Analysts take a
contrary approach to valuation: in sum of the parts analysis,
typically theatre business is valued around 8x EV/EBITDA
versus 10x multiple for the non-theatre businesses. We
strongly disagree with the premium attached to the non-
theatre businesses, especially given their dismal six year
track record.
5.3 ESPORTS FIASCO
Cineplex hoped to use eSports as a way to appeal to
millennial males, a demographic that is hard to pin down and
has seen declining cinema attendance. Analysts expected
Cineplex to ride the explosive growth of the eSport
industry. Despite Cineplex’s high profile, success never
materialized. After spending approximately $25 to 30
million in investments and operating losses, Cineplex
quietly exited the business in November 2020 for
‘nominal consideration’. The sale of eSports was a
condition of the Cineworld transaction.
5.4 OTHER DIVERSIFICATION BUSINESSES
Amusement gaming is another non-theatre sideline for
Cineplex. By rolling up smaller players, it has become
one of the largest amusement gaming companies in
North America with 2019 revenues of $178 million. It
supplies and distributes arcade equipment to its own
Cineplex theatres, the Rec Room, and other third party
operators such as theme parks and cruise ships. While it
may make economic to own or rent amusement games
within its cinemas, we see little reason for owning
this low- margin distribution business. It is an obvious
candidate for divestment.
Last year Cineplex announced a deal with U.S.-based
Topgolf Entertainment Group to open golf-themed
complexes in Canada. Thankfully, this idea was
terminated this year before it came to fruition and any
shareholder capital was squandered.
5.5 DIVESTMENT VALUATIONS
In the tables below, we list the segment revenues (as
given in the 2019 MD&A report) and our estimated
EBITDAaL (EBITDA after Leases, Cineplex’s preferred
financial metric). Essentially, EBITDAaL equals EBITDA
less cash rents. Under Accounting Standard IFRS-16
(adopted in 2019), EBITDA increases, as straight-line
rent expense moves out of operating expenses. This had
the greatest impact on the cinema exhibition segment,
which it has 92% of the consolidated lease value.
source: Cineplex presentation Q4 2019

90WWW.SUMZERO.COM
In terms of divestments, it makes sense to combine
non-theatre food and Rec Room / Location Based
Entertainment together, even if Cineplex reports them
separately. We estimate that Cineplex was losing about
$2 million annually in each of its seven stores. The total capex
for the seven stores we estimate as $70 million. There are
additional assets involved so we believe $86 million or 1x
revenues is a reasonable estimate since the centres are
newly-built.
Digital sign business has high upfront costs but long-tailed
revenue streams. Even if not profitable currently, the assets
and revenue stream have value. We believe 3x revenues is
reasonable or $244 million. We are below sell-side estimates
for this asset of $260 to $325 million.
We value the gaming distribution business at 1x revenues or
7.5x estimated EBITDAaL.
The combined estimated value of the divestments is
$437 million. [see figure below]
6. THE CORE THEATRE BUSINESS
We believe management has done a very good job within
its core cinema business. The company has been at the
forefront of numerous film exhibition industry initiatives
and innovations. It remains a global leader in the industry
for its execution, as illustrated by its revenue per patron and
concession per patron trends.
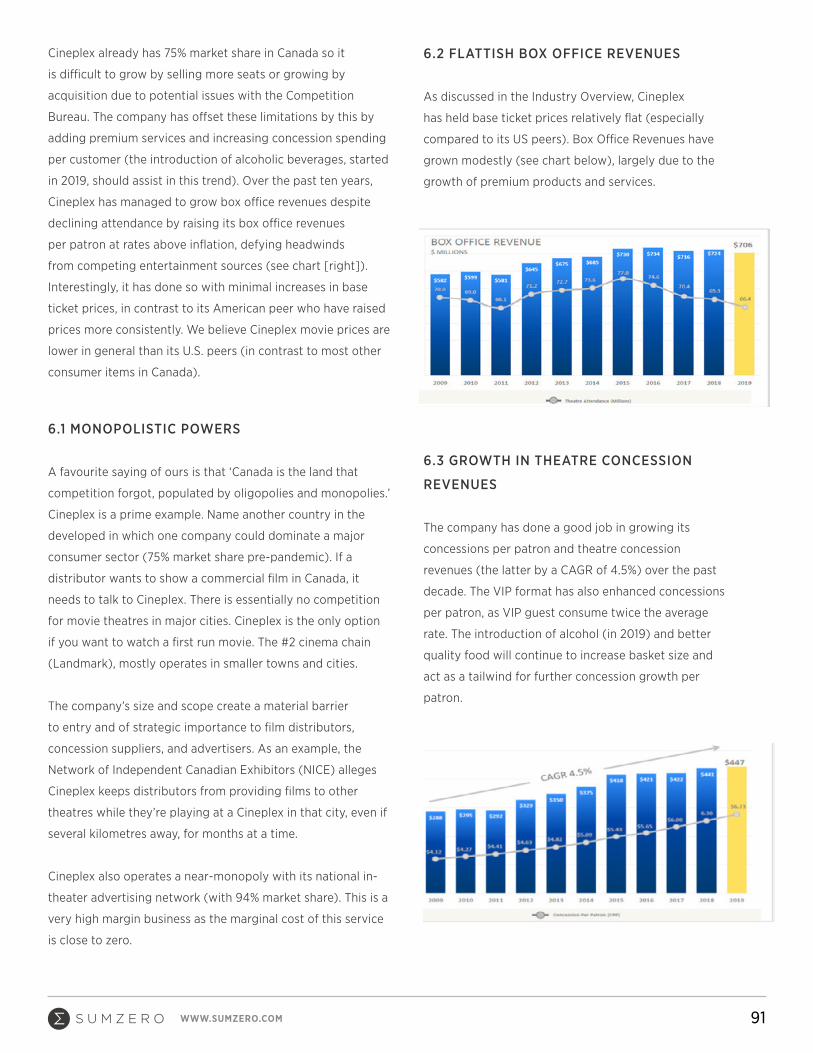
91WWW.SUMZERO.COM
Cineplex already has 75% market share in Canada so it
is difficult to grow by selling more seats or growing by
acquisition due to potential issues with the Competition
Bureau. The company has offset these limitations by this by
adding premium services and increasing concession spending
per customer (the introduction of alcoholic beverages, started
in 2019, should assist in this trend). Over the past ten years,
Cineplex has managed to grow box office revenues despite
declining attendance by raising its box office revenues
per patron at rates above inflation, defying headwinds
from competing entertainment sources (see chart [right]).
Interestingly, it has done so with minimal increases in base
ticket prices, in contrast to its American peer who have raised
prices more consistently. We believe Cineplex movie prices are
lower in general than its U.S. peers (in contrast to most other
consumer items in Canada).
6.1 MONOPOLISTIC POWERS
A favourite saying of ours is that ‘Canada is the land that
competition forgot, populated by oligopolies and monopolies.’
Cineplex is a prime example. Name another country in the
developed in which one company could dominate a major
consumer sector (75% market share pre-pandemic). If a
distributor wants to show a commercial film in Canada, it
needs to talk to Cineplex. There is essentially no competition
for movie theatres in major cities. Cineplex is the only option
if you want to watch a first run movie. The #2 cinema chain
(Landmark), mostly operates in smaller towns and cities.
The company’s size and scope create a material barrier
to entry and of strategic importance to film distributors,
concession suppliers, and advertisers. As an example, the
Network of Independent Canadian Exhibitors (NICE) alleges
Cineplex keeps distributors from providing films to other
theatres while they’re playing at a Cineplex in that city, even if
several kilometres away, for months at a time.
Cineplex also operates a near-monopoly with its national in-
theater advertising network (with 94% market share). This is a
very high margin business as the marginal cost of this service
is close to zero.
6.2 FLATTISH BOX OFFICE REVENUES
As discussed in the Industry Overview, Cineplex
has held base ticket prices relatively flat (especially
compared to its US peers). Box Office Revenues have
grown modestly (see chart below), largely due to the
growth of premium products and services.
6.3 GROWTH IN THEATRE CONCESSION
REVENUES
The company has done a good job in growing its
concessions per patron and theatre concession
revenues (the latter by a CAGR of 4.5%) over the past
decade. The VIP format has also enhanced concessions
per patron, as VIP guest consume twice the average
rate. The introduction of alcohol (in 2019) and better
quality food will continue to increase basket size and
act as a tailwind for further concession growth per
patron.

92WWW.SUMZERO.COM
6.4 HIDDEN GEM: THE ‘SCENE’ LOYALTY PROGRAM
Cineplex has a loyalty program that puts most airlines’
frequent flier programs to shame. It boasts 10.3 million
members – Canada only has a population of 37.7 million, so
that means 27.3% of every man, woman and child in Canada
is a SCENE member. Cineplex claims that over 45% of all
Canadian households have at least one SCENE member.
The SCENE program has been active for more than a decade
and has a very robust database that allowed the company to
target offers to guests and encourage concession spending.
Notwithstanding privacy concerns, we believe there is scope
to monetize this loyalty program for additional revenues
streams Similarly, Air Canada very successfully spun out its
Aeroplan frequent flier program as a separate stock market
listing (before eventually deciding to buy it back). On 18
December 2020, Cineplex announced a deal with Bank of
Nova Scotia to enhance their reward programs. As part of the
deal, Scotiabank will pay Cineplex $60 million before
year-end. This is at least a start towards monetarizing the
hidden value of this asset.
7. SURVIVING UNTIL THE PANDEMIC ENDS
Q2 and Q3 were ugly quarters for Cineplex, Q4 and Q1 will
not be much better. Surging COVID-19 cases have led to many
jurisdictions imposing restrictions on public gatherings and
lockdowns. Cinema operators are highly vulnerable to such
lockdowns, and revenues will fall towards zero for the time
being. Investors are clearly concerned about Cineplex’s ability
to survive until the pandemic ends. The company has done a
good job managing cash flow and liquidity. We believe CGX
has sufficient liquidity to bridge the next two quarters before
the expected return of blockbuster films in Q2 2021.
7.1 MARKET SPOOKED BY Q1 ‘GOING CONCERN’
LANGUAGE AND IMPAIRMENTS
The Street was clearly spooked by the inclusion of ‘Going
Concern’ language in its Q1 earnings release on June 30th.
The share price dropped 19% on the day. While we have
been critical of Cineplex senior management in general,
we were impressed by their candour on that day. To our
knowledge, Cineplex was one of the few companies to issue
such a warning in Canada, although a lot more companies
should have. In Q1, Cineplex reported $46.5 million in
adjusted EBITDA earnings on sales of $282 million. If the
cannabis sector exhibited a similar level of conservativism
in their financial reporting, most cannabis companies would
be required to issue ‘going concern’ warnings with every
quarterly report. We suspect the ‘going-concern’ warning
was inspired by its legal counsel in order to mitigate potential
personal liability for its Directors, senior management and
for the company itself. The company has already completed
a $315 million convertible debenture financing to fulfil a
requirement for debt covenant relaxations, which permitted
the removal of the ‘going concern’ language from its Q2
earnings release.
The company also made a number of other announcements
that rattled investor confidence: (i) an amendment agreement
with its lenders to immediately suspend financial covenants
provided at least $250 million in new capital is raised and
a portion is used to pay down debt; (ii) $173 million in non-
cash impairment charges related to goodwill ($88.5 million),
right-of-use assets ($50.6 million) and property, equipment
and leaseholds ($33.9 million) and (iii) formal repudiation
of the agreement with Cineworld ($34 cash bid to take-over
Cineplex). The main cause of the write-down was a change
in the discount rate of its $1.2 billion in lease assets from
3.5% at year-end to 9.5% to 11.0% in Q1 (under accounting
standard IFRS-16). In view of the COVID-19 crisis, this increase
in risk seems sensible. Our view is that Cineworld suffered
from buyer’s remorse after making a poorly timed binding

93WWW.SUMZERO.COM
cash offer for Cineplex at $34 in November 2019. The deal
was schedule to close in Q2. Cineplex has commenced legal
proceedings against Cineworld with the trial scheduled for
September 2021.
7.2 CASH BURN AT $15 TO $20 MILLION / MONTH
Management has guided for cash burn to be in a range of $15
to $20 million per month. The company performed within
those expectations in Q2 at $18 million and $16.6 million in Q3.
We conservatively estimate that Q4, Q1 and Q2 cash burn will
be below $15 million / month as the company will benefit from
revised federal government rent and wage subsidy programs.
For lockdown jurisdictions such as Toronto, the new federal
rent subsidy program will cover 90% of rent or mortgage
payments. As well, rent abatement deals with landlords will
take full effect in Q4 and Q1. The wage and rent subsidies
have been extended until the end of June 2021. Management
has lowered capex to $50 million for the next 12 months
(versus $150 million before COVID-19) although we would
prefer to eliminate all capex. The dividend will stay suspended
indefinitely.
7.3 RENT CONCESSIONS
Management also has reached agreements with landlords to
receive rent abatements and convert some fixed payments
into variable, based on revenue performance. Cineplex
reduced its net cash lease outflow by $58 million in Q3
(including the sale of certain restrictive lease rights to
landlords for $21 million), and expects further savings in
Q4/20 and into Q1/21.
7.4 DEBT COVENANTS RELAXED
In November, Cineplex announced a revised credit agreement
with lenders that suspends covenant tests until Q2 2021.
At that time, bank debt must be at least 3.75x annualized
adjusted EBITDA (decreasing to 3.0x through the following
three quarters) and as well as a liquidity test. We do not view
either test as onerous.
7.5 ONE-TIME CASH INFUSIONS
During its Q3 conference call, management announced that
it expects to receive a tax rebate of $61.2 million in early 2021
as a result of tax loss carry-back for 2020 applied to its tax
bill for the past three years. On December 22nd, the company
announced the sale and leaseback of its corporate head office
building in Toronto for gross proceeds of $57 million. The
sale is expected to close in early January 2021. On December
18th, Cineplex announced enhancements to its SCENE loyalty
program to includes rewards with the Bank of Nova Scotia’s
customer loyalty program. Under the agreement, Scotiabank
will pay Cineplex $60 million on or before 31 December 2020.
Approximately 50% of the HQ sale and Scotiabank deal ($85
million) will be used to permanently pay down their existing
credit facilities. It total, Cineplex should receive $178 million
in one-time cash infusions in Q1 of which $119 million will be
available to Cineplex.
7.6 NO FURTHER CAPITAL RAISES
Cineplex - as a condition for the relaxation of the credit
covenants – issued $315 million of convertible debentures in
July 2020 (Lightwater funds participated in the deal). $100
million of the proceeds was used to permanently reduce
its credit facility. We do not forecast any additional capital
raises in 2021. The combination of wage and rent subsidies,
leaseback of head office, and tax rebate should be sufficient
to meet the cashflow requirements of the company without
drawing down on its credit facilities or issuing equity or debt.
Management projects a neutral impact from working capital
on a forward basis. In total, we expect the company to receive
$111 million in cash infusions in 1H 2021 more than offsetting
the estimated cash burn of $90 million. We forecast Cineplex
to return to positive FCF in Q3 2020.
7.7 CINEPLEX SURVIVES WITH NO PERMANENT
DAMAGE DUE TO COVID-19
We do not foresee permanent impairments to cinema
attendance or its business model as a result of the COVID-19

94WWW.SUMZERO.COM
pandemic. The pandemic has had a dramatic impact on its
current business but the stock market is a forward-looking
entity and we do not believe the market is pricing in a full
recovery.
8. TARGET PRICE
In our financial model of Cineplex, our fundamental
assumptions are that:
1. Life returns to normal by the start of 2022; and
2 There is no permanent damage to Cineplex
business operations; and
• The divestment of ‘growth’ assets occurs before
start of 2022; and
1, There is no earnings or sales growth from
2019 to 2022; and
2. Trailing earnings from 2019 are the basis of
our 2022 estimates.
The proceeds from the ‘growth’ divestments are $437.4
million. At the end of Q3, Cineplex had $460 million in debt
(credit facilities due Nov. 2023). The sale of its corporate
headquarters for $57 million and the SCENE deal announced
with Bank of Nova Scotia to pay $60million before year-end
will raise $117 million. Half of this amount will be used to
permanently reduce debt, which would drop to $402 million.
If Cineplex made the divestments as we propose, it would be
able to pay off its credit facility entirely ($402 million debt vs
$437.6 million from sale).
Under new Accounting Standard IFRS-16, all leases are shown
as liabilities on the balance sheet. Previously, these items
were ‘off-balance sheet’. The $316 million in convertible
debentures are convertible at a share price of $10.94. Even
under our worst-case scenario, we believe these debentures
will be converted prior to maturity. Hence, if divestments were
made and the credit facilities paid down, Cineplex would be
considered debt-free under pre-IFRS-16 accounting.
Based on the run-rate for the first 3 quarters, Cineplex should
pay over $55 million in debt interest and fees in 2020. This
compares with$36 million in 2019. We suspect the 2020 figure
is inflated by fees and penalties, so we use the 2019 interest
expense of $36 million as our benchmark. By paying down
debt, Cineplex will save $36 million in interest expenses in
2022. Adding the impact of lower earnings due to divestments
and lower interest expenses, our base case EBITDA for 2022
becomes $434.3 million.
Aside from Big Tech companies such as Google or Facebook
(both of which face issues with competition authorities), it is
difficult to find a consumer company in a developed country
with as dominant market position as Cineplex. Monopolies are
rare in public markets so they deserve to trade at premium
valuations. Utilities, who often hold local monopolies, are the
closest kin. In Canada, low growth utilities trade at about 12.5x
forward EV/EBITDA valuations. Once Cineplex re- focuses
on the core cinema business, it deserves to trade at similar
valuations. In the interim, we use a 10x EV/EBITDA multiple for
Cineplex as our base case.
In 2015, when Cineplex’s diversification began, AMC, Regal
and Cinemark all traded at 10x EV/EBITDA while Cineplex
traded at 14x multiple. A return to Cineplex’s asset-light
pre-diversification model justifies at least a 10x multiple. We
are comfortable with Cineplex trading a premium valuation
to its U.S. peers given Cineplex’s monopolistic positioning
compared to the more competitive U.S. market.
[see chart on following page]
Our base case of 10x EV/EBITDA 2022 generates a share value
of $34.25. Note that we increased the denominator of shares
outstanding on the assumption that the $316.25 million face
value of convertible debentures will be converted at $10.94,
adding 28.908 million new shares. Note that our $34 valuation
coincides with the $34 cash bid offered by Cineworld in
November 2019.
We have also conducted this analysis based on using
pre-IFRS-16 accounting (lowering EBITDA in numerator,
eliminating leases in the denominator). The results are not
materially different.

95WWW.SUMZERO.COM
9. PRIVATE EQUITY TAKE-OUT
Last month, Apollo Global Management Inc. (NYSE: APO)
announced an unsolicited $39 cash bid for Great Canadian
Gaming (GC-TSX), the largest casino operator in Canada.
The bid price was a 59% premium to the 30 day VWAP. On
December 21, the bid was increased to $45 cash. The offer
demonstrates that private equity firms are interested in cash
cow businesses, especially at bargain valuations.
Here are a few key points that a private equity owner of
Cineplex would adhere to:
1. Cash cow should be milked, no point in trying to make it
a show horse.
2. Abandon the ‘Di-Worsification’ strategy. Sell-off all
‘growth initiatives’ to focus on core cinema business 3.
Return to an asset-light business model
4. Load up on debt. As a private entity, leverage could be
increased substantially
5. Monetize its SCENE loyalty program. Scotiabank deal in
December 2020 is a start
6. Slash the $80million SG&A expense (2019 figure)
7. Pursue litigation against Cineworld
8. Re-list the company a few years down the road with
some lipstick.
Our base case valuation of Cineplex at $34 per share is on the
basis that it continues to be a publicly-listed entity. Canadian
investors are notoriously leery of high financial leverage.
Given its near monopoly and stable cashflows, once removed
from the glare of public markets, Cineplex has the potential
to dramatically increase its debt leverage. In this era of ultra
low interest rates, this is a sought-after attribute. In such a
scenario, a PE firm could justify a much higher valuation for
Cineplex than $34 per share.
An exclusive database of 14K+ actionable and peer-reviewed research ideas with
complete performance attribution and firm transparency.
Real-time alerts with up-to-date commentary from sector/regional experts on
thousands of stocks and bonds uncovered by Wall Street and global banks.
Proprietary analyst rankings data, sentiment filters, private messaging, and more.
•
•
•
VISIT SUMZERO.COM ›
JOIN SUMZERO TO DOWNLOAD THE COMPLETE REPORT
WWW.SUMZERO.COM 96
10. CATALYSTS
There are a number of catalysts in the next twelve
months:
• Easing of restrictions on large gatherings
• Positive news on a number of vaccine trial results
will increased the likelihood of theatres re-opening
• Film studios announcing releases of first-run
movies
• Pent Up Movie Demand; Asian demand has already
rebounded
• 2021 film slate: double the usual number of releases
• End of Tax-Loss Selling in late December
• Cineworld trial starts in September
• Potential divestment of ‘growth’ initiatives
• Management ready to hang up ‘for sale’ sign again;
CEO at the helm since 2003.
One potential catalyst that we do not expect to see is positive
sentiment from Analysts, both sell-side and buy-side. Most
of the same Analysts who were leading the cheers for
management and its diversification strategy when the stock
was north of $50 per share are still covering the name. Once
burned, twice shy. With the stock at $9, Analysts do not
appear to be willing to stick their necks out in support of this
former stock market darling.
11. RISKS
We outline a number of potential risks to our thesis and
Cineplex:
• Extended second wave or Third wave of COVID-19
• Additional restrictions on large-scale gatherings such as
cinemas
• Failing Debt Covenant tests in Q1 and Q2
• Shorter release windows from studios
• Bankruptcy

97WWW.SUMZERO.COM
Brightcove Inc Com
L O N G
Brightcove is an underfollowed SaaS company with a new
management team poised to accelerate revenue growth and
significantly expand margins.
TIMEFRAME
2-5 YearsSITUATION
ValueMARKET CAP
415.0M USD
About Morgan Housel
Cobia Capital is a value-oriented long / short equity fund focused on the small cap technology sector. The fund has returned a cumulative 312% net since inception in January 2008 versus 138% for the Russell 2000 Index, and 62% for the HFRI Equity Hedge Index. These returns have been achieved with low net and gross exposures and limited correlation to U.S. equity indices.
About Cobia Capital Management
Jeffrey Meyers has 24 years of experience investing long and short in the small-cap technology space. Cobia has returned a cumulative net of 312% since inception versus 138% for the Russell 2000 Index and 62% for the HFRI Equity Hedge Index.
About Jeffrey Meyers
FINALIST
Idea Posted: 12/9/2020
Asset: Equity
Idea Updated: 12/12/2020
Symbol: BCOV:US
RETURN TO DATE:
5.5%
EXPECTED RETURN:
82.79%
Jeffrey MeyersBADGES:Portfolio Manager at Cobia Capital Management
Small Caps
CURRENT RANKING: #5 All-Time
261 310

98WWW.SUMZERO.COM
Asset Class: Equity Symbol: BCOV:US Updated: 12/12/2020 Submitted: 12/9/2020
Brightcove Inc Com
BY:
CURRENTLY AT:
Jeffrey Meyers
Brightcove is an underfollowed SaaS company with a new
management team poised to accelerate revenue growth and
significantly expand margins.
ASSET CLASS:
EquitySITUATION:
ValueTARGET ALLOCATION:
5% - 10%
CATALYSTS:
M&A/Buyout Target
TIMEFRAME:
2-5 Years
EXPECTED RETURN
TARGET PRICE
INITIAL PRICE
82.79%
33.25 USD
17.24 USD
Pricing & Return Details LO N G
Brightcove (BCOV) is a Software as a Service (SaaS) business
trading well below traditional SaaS multiples. The company,
which supplies video hosting and analytics services to
its customers, is a turnaround situation with strong new
management team and strategy. With a $750 million market
cap and $30 million in net cash, its stock trades at an
enterprise value to revenue ratio of 3.5x, well below the 6x to
10x of SaaS peers growing at mid-teens revenue growth rates
with similar gross margins. I believe the discount arises from
the perception that Brightcove is not truly a SaaS business
with recurring revenue from its customers over a long period
of time. It has historically served smaller businesses which
can be transitory based on their own success. The company’s
dollar based net retention rate, a metric that is scrutinized in
SaaS companies, dipped to 80% in the June quarter as many
of the company’s small customers failed due to Covid-19
issues. In addition to the troubles at its smaller customers,
one of Brightcove’s large media customers also failed in the
June quarter, adding to the pressure on this metric. I believe
that Brightcove’s 2nd quarter retention issues were temporary,
and not indicative of the company’s underlying business.
Retention was an issue that plagued many technology
companies that catered to the small and medium sized
business (SMB) base. The company’s 3rd quarter metric
showed much improvement which should solidify next year
with renewed focus on retention.
Brightcove sells to two customer segments, media and
enterprise. Media companies use Brightcove to broadcast
their content to their subscriber bases. Enterprise customers
use Brightcove to direct video content to either their own
employees or their customers, or both. During Covid-19
INVESTMENT THESIS
Cobia Capital Management
BADGES:
CURRENT RANKING: #5 All-Time
261 310

99WWW.SUMZERO.COM
with in-person events and conferences shut down, many
companies decided to do virtual conferences, with
Brightcove hosting the video content. An example is the
South by Southwest show, that usually draws more than
100,000 attendees, went virtual this year and chose to use
Brightcove to host the video after a competitive bakeoff.
Historically Brightcove’s media customers were small
and medium sized – after they grew to a certain size and
technical capability, they would leave Brightcove to handle
their own hosting. Brightcove is now bidding some large
media companies to take up their hosting business and
let those companies focus on their core strength, which is
creating content. If a large player like a Hulu, Disney+, or
HBO Max decided to go with Brightcove, this would be a
watershed moment for the company and, in my opinion,
would immediately create multiple expansion for the stock.
Brightcove’s enterprise customers tend to be larger and
stickier than the media customers, and their proportion
within the business has been increasing over time. These
enterprise customers include companies such as Ford,
Adobe, and Johnson & Johnson.
CEO Jeff Ray was hired 3 years ago with a mandate to turn
around Brightcove’s business, and he implemented many
changes to the business model so far. On the product side,
Brightcove was an unfocused video platform when Jeff
arrived and since then he has productized various aspects of
the platform to simplify presentation to the customer and to
allow for upsell to the existing base. New products include
Brightcove Beacon, Brightcove Engage, and Brightcove
Campaign, and all have been well received by customers
and prospects. Jeff turned over about 40% of the salesforce
and put in place a new head of sales who revamped the go
to market approach of the company. He started a channel
development team to build an indirect channel to expand
the company’s reach in the market. He is enacting a strategy
to reduce churn with both media and enterprise customers.
This broad turnaround have been brewing under the surface
for the past three years and is finally beginning to show up
in the numbers. The company beat revenue and earnings
estimates the past two quarters and is poised to show
accelerating revenue growth in 2021 and beyond. In the
September quarter, Brightcove disclosed a dollar based
net retention rate of 101%, which while perhaps being slightly
inflated by a rash of upsells in the quarter, was much better
than the 80% number in the 2nd quarter. The company thinks
that the true impact of their plan to reduce churn will be seen
in mid-2021 and beyond.
The video hosting business is a competitive one, with the
most visible competitor now being Vimeo, a subsidiary of
IAC/InterActiveCorp. Vimeo has been growing at a rapid pace
and IAC is considering spinning it off now into the public
markets. On the surface, it appears that Vimeo is taking
share from Brightcove as it is currently growing faster. The
truth is that Vimeo and Brightcove play in different segments
of the market. This is demonstrated by the average annual
subscription prices of each company. Vimeo’s is in the $200
range, while Brightcove’s is $89,000. Obviously Brightcove
is addressing much larger customers with a broader product
set than Vimeo. Also, in cases where Brightcove and Vimeo
have gone head-to-head, Brightcove has won most of that
business. A good example of this is the South by Southwest
conference I mentioned earlier, where Brightcove won
because its platform is much more robust than Vimeo’s. I
believe that a Vimeo spinoff would be good for Brightcove’s
stock as Vimeo would likely trade above 10x sales and this
would make Brightcove’s 3.5x multiple appear extremely
appealing.
I believe that Brightcove will rerate in 2021 with an
accelerating revenue growth profile and operating leverage
leading to sharply higher margins. I believe revenue can
accelerate to 15% in 2021 versus 5.5% in 2020, and EBITDA
margins can rise to 12% from 9.5% in 2020. While the stock
currently trades at 3.5x sales, I believe a more appropriate
multiple to be 6x sales, which is on the low end of a SaaS
peer group with similar revenue growth and gross margin
profiles. This would imply a $33.25 stock price, or about
90% upside from current levels. If Vimeo were to go public
and command a 10x revenue multiple, a similar multiple on
Brightcove would imply a $55 stock price, or 210% upside
from current levels. I believe catalysts for Brightcove include
continuing fundamental progress in its earnings reports and
the possibility that a large media player will decide to use
Brightcove for its video hosting.

An exclusive database of 14K+ actionable and peer-reviewed research ideas with
complete performance attribution and firm transparency.
Real-time alerts with up-to-date commentary from sector/regional experts on
thousands of stocks and bonds uncovered by Wall Street and global banks.
Proprietary analyst rankings data, sentiment filters, private messaging, and more.
•
•
•
VISIT SUMZERO.COM ›
JOIN SUMZERO TO DOWNLOAD THE COMPLETE REPORT
WWW.SUMZERO.COM 100
Risk factors for an investment in Brightcove include renewed
lockdowns due to Covid, as many of Brightcove’s customers
are still SMBs. It is also a competitive market so Brightcove
needs to keep executing on the sales side. Brightcove has
benefitted from the pandemic as many events have gone
virtual causing their sponsors to need its services. If the
world goes back to in-person events with no video, that
could hurt the company. Brightcove believes, and I agree, that
future events are likely to be hybrids of in-person plus video,
as companies have seen how they can reach many more
people virtually. As such, there will still be a robust need for
Brightcove’s products.

Ideas on companies whose respective market capitalizations
were between US$2B and US$10B at the time of submission.
MID CAPS

102WWW.SUMZERO.COM
Rent a Center Inc
L O N G
Recent Acquisition Transforms RCII into a High-Growth, FinTech Platform
Yet Valued as No-Growth, Brick-and-Mortar Retailer
TIMEFRAME
2-5 Years
SITUATION
Growth At Reasonable Price
MARKET CAP
1.7B USD
About Morgan Housel
Breach Inlet Capital is a long/short manager utilizing an extensive research process to uncover mispriced small cap equities. We manage a concentrated portfolio of high-conviction investments, apply a patient perspective to capitalize on volatile public markets, and add value as engaged shareholders.
About Breach Inlet Capital Management
Chris Colvin, CFA, is the Founder of Breach Inlet Capital. Prior to Breach Inlet, he was the Portfolio Manager at Freeman Group (a family office), where he launched and managed a concentrated public markets portfolio. He also led diligence and was a board member for private equity investments. Before Freeman, he was a Senior Analyst at Highland Capital Management, where he managed a portfolio of distressed credits and a long/short equity fund. He began his career as an investment banking analyst at Stephens, where he also helped evaluate private equity investments. He graduated from Wake Forest University with a BS in Business.
About Chris Colvin
WINNER
Idea Posted: 12/22/2020
Asset: Equity
Idea Updated: 12/25/2020
Symbol: RCII:US
RETURN TO DATE:
19.32%
EXPECTED RETURN:
77.36%
Chris ColvinPortfolio Manager at Breach Inlet Capital Management
Mid Caps
ATTACHMENTS
BADGES:
CURRENT RANKING: #14 LTM
12 29

103WWW.SUMZERO.COM
Asset Class: Equity Symbol: RCII:US Updated: 12/25/2020 Submitted: 12/22/2020
Rent a Center Inc
BY:
CURRENTLY AT:
Chris Colvin
Recent Acquisition Transforms RCII into a High-Growth, FinTech Platform
Yet Valued as No-Growth, Brick-and-Mortar Retailer
ASSET CLASS:
Equity
SITUATION:
Growth At Reasonable Price
TARGET ALLOCATION:
10%+
CATALYSTS:
M&A/Buyout Target
TIMEFRAME:
2-5 Years
EXPECTED RETURN
TARGET PRICE
INITIAL PRICE
77.36%
84.00 USD
39.69 USD
Pricing & Return Details LO N G
SUMMARY
We believe Rent-A-Center’s (“RCII”) transformative evolution
remains under-appreciated. In January 2018, RCII brought
back Mitch Fadel to be CEO. He swiftly took actions to
improve the profitably of its stores that caused EBITDA to
~quadrupled from 2017 to 2020 (midpoint of guidance).
With the recently announced acquisition of Acima, he has
transformed RCII into a high-growth FinTech platform. As a
result, we estimate RCII’s cash EPS will double from ~$3 today
to $6 in 2022. If accurate, RCII trades for less than 7x 2022
cash EPS. Based on the company’s growth trajectory, we
would argue the company is worth north of 20x earnings. But
even using a more conservative 14x, we arrive at a price target
of $84 and 100%+ upside (see Valuation section below).
BUSINESS DESCRIPTION
RCII provides credit-constrained consumers access to
brand-name household goods through flexible lease
agreements. The benefit of these transactions is that
customers own the product after a prescribed number of cash
rental payments, hence it is called “rent-to-own” (“RTO”).
In the traditional RTO model, customers visit RTO stores to
lease product. This business has many compelling dynamics.
Since customers can return the product with no further
obligation, RTO transactions are not considered loans and
therefore not subject to usury laws. Therefore, RTO companies
can earn attractive unit economics and high profit margins.
INVESTMENT THESIS
BADGES:
Breach Inlet Capital Management
12 29

104WWW.SUMZERO.COM
Also, customers’ weekly rental payments equate to
a recurring revenue stream. Third, the RTO industry
is recession-resilient because it attracts incremental
consumers as credit tightens in economic downturns.
Finally, the traditional RTO market is effectively a duopoly
between RCII and Aaron’s (“AAN”). They have consistently
dominated market share through reputable brands and
extensive store networks.
Over the past decade, traditional RTO companies have
expanded their presence at retailers’ stores through a
point-of-sale (“POS”) solution known as virtual RTO
(“VRTO”). A VRTO transaction occurs as follows: 1)
customer enters a retail store (such as Ashley’s Furniture),
2) customer wants to buy a $2k couch but his/her credit
score is too low to use a credit card or store’s financing
option, 3) customer applies for an VRTO agreement
through his/her mobile phone, 4) customer approved in
seconds & VRTO company purchases the couch on the
customer’s behalf, 5) customer leaves with the couch
& then makes VRTO payments over the next 12 months
until customer owns the couch. VRTO is a win/win for the
customer/retailer by enabling more purchases/sales. VRTO
also shares the same attractive dynamics as traditional
RTO, but is capital-light (no stores) and higher-growth
(untapped potential).
With more and more products being purchased online,
e-commerce will drive the future of the RTO industry.
Traditional RTO providers lease through their own
websites, while VRTO companies lease through their
retail partners’ websites. With that overview, let’s turn to
RCII’s transformative evolution and how the company will
accelerate growth through its FinTech platform.
2013-2017: SEVERLY IMPACTED BY
MANAGEMENT MISTEPS
In January 2014, Robert Davis replaced RCII’s co-founder
Mark Speese as CEO. Davis, who had served as RCII’s CFO
since 1999, was chosen over Mitch Fadel, who had served
as President since 2000. Due to a lax credit environment
and lack of innovation from Speese as the long-time CEO,
RCII’s growth had stalled beginning in 2007 and then
EBITDA declined 15% to ~$335mm in 2013.
Davis hoped to reignite growth with critical changes.
Unfortunately, ideas that seemed compelling in a
spreadsheet did not translate in the real world for the
former CFO. The key self-inflicted mistakes included 1) a
disastrous implementation of a new POS system coupled
with 2) a labor initiative of replacing tenured staff with
part-time employees. Traditional RTO is a relationship-
driven business with customers paying weekly and often
requiring extensions from store managers, so the two
missteps occurring simultaneously compounded RCII’s
troubles. By 2017, EBITDA had fallen ~75% to ~$80mm and
net leverage exceeded 7.5x. As a result, shareholders had
lost patience with Davis’ strategy.
2018-2020: MITCH FADEL RETURNS AS CEO
In late 2017 and early 2018, a reputable activist shareholder
replaced several directors. In turn, Fadel was named CEO
and RCII launched a sales process. By July 2018, RCII had
agreed to sell itself for $15 per share to Vintage Capital, a
private equity owner of the largest private RTO company.
But in December 2018, RCII canceled the merger when
Vintage forgot to provide “formal notice” to extend
the merger closing (which had been delayed due to an
extended FTC review). From the perspective of RCII’s
Board, $15 per share vastly undervalued RCII (by December
2018) given its dramatically improving results.
In 2018 and 2019, Fadel made key changes including:
1) cutting excess costs, 2) rehiring tenured employees
with customer relationships, 3) introducing an elastic/
inelastic pricing strategy, 4) upgrading the product mix,
and 5) extending the “same as cash” price from three
months to six. This last change was crucial. Customers can
own product by: 1) making all rental payments (typically
over 12-months) or 2) paying the “same as cash” price.
By extending the latter to six months, this caused RCII’s
average customer to make payments for longer knowing
he/she still had the “same as cash” option.
105WWW.SUMZERO.COM
Due to Fadel’s initiatives, RCII’s EBITDA quickly rebounded
from ~$80mm in 2017 to ~$255mm by 2019. Over this brief
period, net leverage also fell from above 7.5x to below
1.0x. Entering 2020, RCII guided to EBITDA of $255-
$285mm. Instead of being hurt by COVID, Fadel and his
team capitalized on: 1) greater demand for home goods,
2) less credit availability for subprime consumers, and 3)
struggling competitors with weaker balance sheets. By
3Q20, RCII had raised 2020 EBITDA guidance to $308-
$323mm. If achieved, RCII will have ~quadrupled EBITDA
since Fadel rejoined only three years ago.
2021+: ACCELERATING GROWTH VIA
ACQUISITION OF ACIMA
From 2018-2020, Fadel had focused most of his efforts
on RCII’s stores. As a result, store profits rapidly rose and
reached new highs. In fact, RCII reported its eleventh
consecutive quarter of positive same store sales in 3Q20.
Going forward, we think its stores can grow EBITDA 3-5%
annually through digital penetration. In 3Q20, sales on
rentacenter.com increased 70%+ y/y. Online orders rose
from 11% of store sales in 1Q19 to 21% in 3Q20, representing
a quick ascent yet leaving plenty of room to expand.
In 2020, RCII will receive ~80% of EBITDA from its US
stores (and rentacenter.com), but only ~15% from its VRTO
platform. After closing the acquisition of Acima in mid-
2021, VRTO should represent 50%+ of RCII’s EBITDA and
will be RCII’s primary future growth driver. Hence, VRTO
will now be Fadel’s focus.
Today, RCII offers VRTO through its business called
Preferred Dynamix (“PD”), which is the fourth largest VRTO
provider. PD recently unveiled Preferred Digital, which is
a mobile app that pre-approves customers for up to $4k
of credit for use at partnering retailers. The business will
also launch Preferred Marketplace, which will be a website
where consumers can directly lease items from various
retailers without having to go to each retailer’s website.
Marketplace appears to be the first of its kind so could
revolutionize and disrupt the VRTO market. Due to these
initiatives and pipeline of potential new retail partners, RCII
had guided to PD growing ~50% from 2020 to $1.2b in 2022.
Following the acquisition of Acima, pro forma VRTO revenue
will vastly exceed RCII’s prior 2022 target. More specifically,
VRTO Revenue will immediately jump from ~$800mm to $2b+
making Acima + PD the second largest VRTO business. This
scale coupled with Acima’s national sales team should enable
RCII to attract more large retailers and accelerate growth.
Also, Acima brings its best-in-class underwriting & decision
engine that drives industry-leading margins. For perspective,
Acima has a four-year Revenue CAGR of ~90% and an 18%
EBITDA margin (compared to 11% for the PD segment and RCII
consolidated).
Furthermore, Acima’s sophisticated mobile technology
expands PD’s e-commerce platform. Over the past year, online
sales rose from 1% of orders to 15% for Acima. VRTO follows
retail so more sales are shifting online. RCII will capitalize
by combining Acima’s digital presence with PD’s e-comm
initiatives.
Despite the clear benefits and value of the Acima acquisition,
RCII paid ~7.5x 2020 EBITDA or ~10x FCF. When adjusting
for the $200mm NPV from the associated tax step-up, RCII
purchased Acima for only ~6.5x EBITDA or ~9x FCF. For
reference, the largest competitor (Progressive Holdings or
“PRG”) trades for ~11.5x 2020 EBITDA and ~16.5x FCF. And
in December, a SPAC called Finserv acquired a VRTO peer
(Katapult) for ~25x 2020 EBITDA. Katapult just became
profitable and has far less scale than Acima.
We believe RCII negotiated the attractive Acima purchase
price because RCII was the only logical buyer. Our diligence
indicates that national retailers have a strong preference for
partnering with public VRTO companies. Outside of RCII, the
only public company was PRG, which was in the middle of
completing its spinoff from AAN and does not need to add
scale.
Acima’s other option was to IPO or sell to a SPAC, but our
understanding is Acima’s Founder/CEO Aaron Allred: 1) did
not want to be a public CEO, 2) wanted to take some money

106WWW.SUMZERO.COM
off the table after primarily bootstrapping Acima’s growth,
and 3) wanted to retain some upside. RCII met all three
criteria: 1) Allred will not have to be public CEO, 2) 75% of
proceeds are in cash, and 3) 25% of proceeds are in equity.
With the expansion of e-commerce and addition of new
product verticals, RCII estimates that VRTO’s total addressable
market is $40-60b. Today, the entire VRTO industry only
has $7b of Revenue so the untapped potential is immense.
RCII should now be well-positioned to capitalize on this
whitespace.
VALUATION
We forecast cash EPS of $6 per share in 2022 based on the
following assumptions:
1. VRTO EBITDA grows 20% annually from $294mm pro
forma 2020 to $423mm in 2022.
2. RCII Stores/Other EBITDA grows 4% annually from
$246mm in 2020 to $266mm in 2022.
3. Combined 2022 EBITDA would then be $689mm.
4. We assume RCII’s 2x leverage target and 6% interest rate
to equal $83mm interest expense.
5. We estimate CapX/D&A to be $60mm in 2020 plus
$20mm from Acima so $80mm total.
6. 24% tax rate implies $126mm of taxes.
7. Above implies $400mm of FCF or $6 per share based on
67mm shares (includes 10.8mm shares for the purchase
of Acima).
PRG is only expected to grow EBITDA 7% annually for the next
two years compared to our estimate of 13% annually for RCII.
Yet again, PRG trades for ~11.5x 2020 EBITDA and ~16.5x 2020
cash EPS. For conservatism, we assume RCII should trade for
~10x EBITDA or ~14x cash EPS implying a fair value of $84 per
share or more than 100% upside over the next two years.
LEADERSHIP
Fadel has generated a 55%+ IRR for shareholders since
becoming CEO in early 2018. We think his acquisition of
Acima may be his smartest move yet. He is certainly aligned
with shareholders. In 2019, ~90% of his compensation was
discretionary and ~80% of that was in equity. His current
equity ownership is worth ~$20mm or ~20x his annual salary
of $1mm.
Fadel also surrounded himself with talented execs, including
Jason Hogg. Hogg was named EVP of PD in June 2020 and
will continue to lead PD when combined with Acima. He has
founded several consumer FinTech businesses and led similar
divisions of larger companies. Hogg will soon have Acima’s
Allred to help accelerate growth. Allred successfully grew
Acima from nil to $1.2b+ in seven years, while only needing
$9mm of outside equity capital. Allred is incentivized with his
stock locked up for three years.
RISKS & MITIGATING FACTORS
1. RCII’s acquisition of Acima is not approved by regulators.
2. Rejection seems unlikely since RCII’s pro forma VRTO
Revenue will still be below PRG’s ~$2.5b.
3. Even without Acima, we forecast RCII to earn $4 of
cash EPS in 2022 implying RCII trades for only ~10x.
2. RCII poorly integrates Acima leading to lower profits,
distractions, and charge offs.
1. During Fadel’s tenure as President and then since
he became CEO in January 2018, he has proven to
be an excellent operator and consistently exceeded
expectations.
2. Though much smaller, RCII appeared to seamlessly
integrate its August 2019 acquisition of Merchant’s
Preferred.

107WWW.SUMZERO.COM
3. RCII will be integrating its smaller Preferred Dynamix
business (only $69mm EBITDA) into the much larger
and well-performing Acima ($225mm EBITDA), which
we think reduces operational complexity and risk.
3. Government support and stay at home trends may have
inflated RCII and Acima’s 2020 profits.
1. Acima’s growth rate slowed in 2020, so does not
seem inflated by COVID.
2. RCII offers third party insurance to cover payments
for those unemployed (even those receiving
unemployment benefits), but less than 1% of
customers have utilized this implying most of its
customers are not unemployed.
3. We assume 20% growth for RCII’s VRTO, which is far
lower than Acima’s historical profit growth of 100%+
and RCII’s prior guidance for Preferred Lease of
50%+.
4. The Acima acquisition increases RCII’s leverage to 2.5x,
which could become a burden.
1. RCII has a conservative management team, hence
RCII had zero net debt before announcing the Acima
acquisition.
2. Management has guided to reducing net leverage to
< 2x net leverage by 2022. RCII’s stores and VRTO
generate significant FCF, so we believe this target is
very achievable.
CONCLUSION
RCII trades for only ~8.5x pro forma 2020 cash EPS. It appears
the company is viewed as a no-growth, brick-and-mortar
retailer. In reality, RCII has transformed into a high-growth,
FinTech platform serving a vast and underpenetrated market.
It is increasingly rare to find well-managed growth companies
trading for < 10x cash EPS, so we find this investment
opportunity uniquely compelling.
We think RCII’s transformation and valuation will
become more apparent as RCII continues to execute its
strategy and then closes the Acima acquisition. We then
forecast RCII’s share price to more than double. Given
Fadel’s track record, we believe our assumptions could
prove conservative.
DISCLOSURES
This information is provided on a confidential basis
and for informational purposes only. This material may
not be reproduced, displayed, modified or distributed
without the express prior written consent of Breach Inlet
Capital Management, LLC (“BICM”). This information is
intended solely for the recipient. This presentation has
been prepared, in part, based on information reported
or provided by Rent-A-Center, Inc. or other third-party
sources. BICM has not independently verified such
information and cannot guarantee the accuracy of all
data contained herein. This information is not complete
and is only current as of the date hereof and may be
superseded by subsequent market events or for other
reasons. This information is not investment advice and
is not a recommendation to purchase or sell any specific
security. All opinions herein are those of Chris Colvin,
principal of BICM. Mr. Colvin and BICM do not make
any representations or warranties as to the accuracy or
completeness of the information including that obtained
from third-parties or which is provided in third-party
sites linked in this presentation. Mr. Colvin and clients of
BICM have a position in the security presented, which
may be increased or decreased at any time with no
notice to the recipient of this information.
This information does not constitute an offer or
solicitation to buy or sell an interest in any private
funds (a “Fund”) managed by BICM or any other
security. Interests in a Fund can only be made pursuant
to a private placement memorandum and associated
documents.
This presentation contains forward-looking statements
that include statements, express or implied, regarding

An exclusive database of 14K+ actionable and peer-reviewed research ideas with
complete performance attribution and firm transparency.
Real-time alerts with up-to-date commentary from sector/regional experts on
thousands of stocks and bonds uncovered by Wall Street and global banks.
Proprietary analyst rankings data, sentiment filters, private messaging, and more.
•
•
•
VISIT SUMZERO.COM ›
JOIN SUMZERO TO DOWNLOAD THE COMPLETE REPORT
WWW.SUMZERO.COM 108
current expectations, estimates, projections, opinions,
and beliefs of BICM, as well as assumptions on which
those statements are based. Words such as “believes,”
“expects,” “endeavors,” “anticipates,” “intends,”
“plans,” “estimates,” “projects,” “assumes,” “potential,”
“should,” and “objective,” and variations of such words
and similar words, also identify forward- looking
statements. Such statements are forward-looking in
nature and involve a number of known and unknown
risks, uncertainties and other factors, including those
described in this presentation, and accordingly, actual
results may differ materially and no assurance can
be given that the security presented will achieve the
results discussed herein. Recipients are cautioned
not to place undue reliance on any forward-looking
statements or examples included in this presentation,
and BICM assumes no obligation to update any
statements as a result of new information, subsequent
events or any other circumstances. Such statements
speak only as of the date that they were originally
made.
There are inherent limitations regarding hypothetical
or estimated information. There can be no assurance
that such values can be realized or that actual results
will not differ materially from those presented. Actual
returns to investors will be reduced by expenses such
as performance fees. There is significant risk pro forma
financials may never be realized if the assumptions are
incorrect, incomplete or other intervening factors which
are not contemplated in the pro forma assumptions.
©2020 Breach Inlet Capital Management, LLC. All rights
reserved.
109WWW.SUMZERO.COM
Vontier Corp
L O N G
As a recent spin off from Fortive, VNT is a bone fide special situation
which is mispriced due to investor base transition and largely
misunderstood. We expect VNT to double in 12-24 months
TIMEFRAME
1-2 YearsSITUATION
Event / Special Situations
MARKET CAP
5.6B USDATTACHMENTS
About Morgan HouselFounder and Managing Partner of Serdika Advisors. Rado has extensive experience in long/short equity special situations investing as well as investment banking.
Prior to founding Serdika, he was a Co-Founding Partner and Portfolio Manager of the London office for Visium, $8Bn AUM US multi-strategy hedge fund. Previously Rado was Portfolio Manager for Talisman Global Asset Management, £3bn family office in London. When he was living in New York, Rado worked for SAC Capital and was a Partner in a hedge fund start up Exton Capital as well as a Principal at Tiedemann.
Prior to launching his investment career 16 years ago, Rado worked in Equity Research at Goldman Sachs and then did Mergers and Acquisitions for the Financial Institutions Group at Morgan Stanley.
Rado has an MBA from Columbia Business School where he focused on Value Investing and Private Equity and a BA in Economics and International Studies from Macalester College, both with Honors.
In 2017 Rado was selected as the Winner of the inaugural Sohn Conference Stock picking Contest in London. Previously Rado served as Judge for Sumzero and Wharton Hedge Fund Club long/short equity competitions
About Rado Bradistilov
FINALIST
Idea Posted: 12/23/2020
Asset: Equity
Idea Updated: 12/28/2020
Symbol: VNT:US
RETURN TO DATE:
2%
EXPECTED RETURN:
101.03%
Rado Bradistilov Managing Partner at Serdika Advisors
Mid Caps
BADGES:

110WWW.SUMZERO.COM
Asset Class: Equity Symbol: VNT:US Updated: 12/28/2020 Submitted: 12/23/2020
Vontier Corp
BY:
CURRENTLY AT:
Rado Bradistilov
As a recent spin off from Fortive, VNT is a bone fide special situation which
is mispriced due to investor base transition and largely misunderstood. We
expect VNT to double in 12-24 months
ASSET CLASS:
Equity
SITUATION:
Event / Special Situations
TARGET ALLOCATION:
10%+
CATALYSTS:
M&A/Buyout Targetand Spin Off
TIMEFRAME:
1-2 Years
EXPECTED RETURN
TARGET PRICE
INITIAL PRICE
101.03%
70.00 USD
34.15 USD
Pricing & Return Details LO N G
THESIS: LONG VONTIER (VNT US), MARKET CAP: $5.8BN, EV OF $7.3BN
We consider Vontier to be one of the most attractive
investments for 2021 as it ticks a myriad of boxes which
simultaneously provide both very attractive upside optionality
and margin of safety/negligible chance for permanent loss of
capital, regardless of the macro environment:
1. As a recent spin off from Fortive, VNT is a bone fide
special situation which is mispriced due to an ongoing
investor base transition and largely misunderstood
2. VNT is a high-quality compounder with leading market
shares in attractive, recession- prone niche businesses
evidenced by consistent revenue growth, high ROIC,
and impressive FCF generation
3. VNT is also a genuine value investment as its core
business trades at a 10.2% pro forma 2022 FCF yield
and at a significant discount to its peer group, and
that is before taking into account its strategic stakes in
highly attractive minority investments
4. In 2021 VNT is about to become a major disruptor in
the hyper-growth EV space via ongoing investments
which can potentially represent half of its current
market value
5. Through its Vontier Business System (VBS) and an
optimized balance sheet, VNT is about to engage in
game-changing M&A which together with consistent
operational performance should help significantly
re-rate the stock
As a result, we expect VNT to double in the next 18-24 months
INVESTMENT THESIS
Serdika Advisors
BADGES:

111WWW.SUMZERO.COM
BUSINESS DESCRIPTION
VNT is a market leader in global mobility technologies with
$2.7bn of sales as follows: 68% from North America, 18%
from Emerging Markets, 10% from Europe, 4% from RoW.
The overall business is recession-resistant, has a large
installed base, and limited cyclicality. Historically, VNT has
exhibited a 6% top line CAGR (2005-2019) and never had
a down top- line year with the exception of 2009 (-6%).
Revenue tends to grow at ‘GDP+’ rates (due to leading
market positions, 20% recurring revenue, and significant
exposure to EM). VNT has attractive 42-44% gross margin,
20%+ improving EBIT Margins, and 100%+ FCF conversion.
CHART 1: VONTIER’S PRODUCT MAP AND
ADDRESSABLE MARKET [see image below]
MOBILITY TECHNOLOGIES:
Gilbarco Veeder Root ($1.9bn of 2019 sales, 69% of total
revenue, 20%+ EBIT margin) is the global leader in gas
station fueling equipment and services. GVR provides
fuel dispensers, POS software and payment systems,
cloud services, tank monitoring systems, and aftermarket
services (#1 in the US with 27% market share ahead of #2
Dover with ~20%). GVR is the only global provider of
full-service c-store solutions.
Through its GVR (developed markets) and Orpak
(emerging markets) brands, VNT serves owners and
operators of over 260,000 retail fuel stations and
convenience stores globally. VNT’s POS payment system
has an installed base of approximately 650,000
pay-at-pump devices and 69,000 convenience stores.
This is a very sticky, oligopolistic market with high
barriers to entry driven by a large installed base,
environmental and payments regulation and a
full-service offering with a $7bn global TAM growing
at MSD (aided by 14% EM growth CAGR since 2009).
The business combines hardware, sensors, software,
analytics, payment and innovative mobility infrastructure
solutions and increasingly benefits from recurring sales.

112WWW.SUMZERO.COM
Here is a recent photo of the GVR product taken from our
‘local’ petrol station in London:
Teletrac Navman ($200m or 7% of total revenue) is a
niche software-as-a-service (SaaS) telematics provider
that leverages location-based (GPS) technology and
services for managing mobile assets. This business benefits
from structural tailwinds as fleet managers are looking
to cut costs and improve efficiencies through the use of
technology. This cloud-based fleet tracking software is
used to track over 480,000 vehicles for more than 40,000
companies including service vehicles (60%), highway
freight (30%), construction and mining (10%). The business
is present globally with NA at 49%, EU 33%, and RoW 18%
of sales. The division is in the midst of a turnaround led
by a new management team and characterized by the
introduction of its new technology platform TN360 which
is quite differentiated due to real- time sensor data and
AI-based analytics. Its early impact has been to lower churn,
grow average revenue per unit 30%+ with 75% contract
margins where over 50% of sales are to new customers.
This is a high-recurring revenue business with $5bn TAM,
growing at HSD, which is currently ‘close to break-even’
according to VNT management. The main competitor to TN
is Trimble.
Global Traffic Technologies (GTT) is currently <2% of total
revenue. GTT is a provider of intelligent traffic control systems
primarily for emergency response and transit agencies (e.g.,
bus, rail) due to its best-in-class algorithms and application
expertise. It has an installed base of 90,000 intersections
across 3,100 customers. It benefits from structural trends
such as ‘smart cities’ while constantly adding new verticals.
The TAM is $8bn with MSD growth driven by sensor and AI
traffic management while tolling and parking technologies
are targeted adjacencies. Mobile payments and direct
payment from the vehicle are expected to increase, and GTT
technology helps manage payment complexity. GTT’s growing
subscription business reduces upfront investment and
broadens the target customer base. GTT is highly profitable
with estimated ~30% EBITA margins. GTT was the only asset
that did not originate within Danaher and was purchased in
2016 by Fortive post its spin.
DIAGNOSTICS AND REPAIR TECHNOLOGIES
Matco Tools (<20% of total revenue, 2.5% CAGR 2010-2019)
is a leading manufacturer and distributor of auto repair tools
and diagnostic equipment and software via 1,800 franchisees
across North America. It allows repair technicians to drive
productivity and deal with the increasing complexity and
digitalization of repairs. Matco transacts with 140,000 repair
shops and 600,000 technicians. It provides financing to both
franchisees and to technicians. Its premium quality, service,
and lifetime warranty command brand strength and customer
loyalty. Matco focuses on product innovation, digital workflow
solutions, and a shift to software and service which drive
continuous margin improvement. The Matco Tools App allows
customers to order products directly online. Matco benefits
from predictable growth and commands the highest segment
EBITDA margins within the group at 30%+.
Hennessy Industries (<5% of total revenue) is a leading
manufacturer of aftermarket wheel- service equipment (e.g.,
tire changers, wheel balancers and weights, and brake lathes).
Customers are based in the US and Canada and include
professional mechanics and auto technicians through the
same 1,800 franchisee network as well as independent auto

113WWW.SUMZERO.COM
after-market customers such as tire dealers and big-box
retailers. With the exception of Teletrac Navman, Hennessy
has the lowest segment EBITA margins at <10% but also
benefits from predictable growth and is synergistic to VNT’s
full service offering to its franchisees.
Matco and Hennessy’s combined TAM is $7bn and market
growth is expected to continue in the LSD. US SAAR should
stage a recovery post Covid-19 which will be a tailwind
to growth in 2021. Structural growth is tied to auto after-
market activity (i.e., the growing age of the US auto fleet
and miles driven). In addition, today’s cars feature 100m
lines of code and that number is expected to grow 2-3x,
driving the ongoing need for diagnostics and digital workflow
improvements. Franchisee growth can continue at similar pace
in North America as current geographic coverage is <70%.
REASONS FOR DISCOUNT/VARIANT PERCEPTION
VNT was just recently spun off tax-free from Fortive (FTV)
in October 2020. FTV was itself spun out of Danaher in 2016.
Under the FTV umbrella, the VNT business was arguably
increasingly viewed as non-core evidenced by the fact that
historically less than 5% of Fortive’s capital was deployed
in mobility infrastructure while VNT represented over 1/3 of
pre-spin FTV revenue. The Danaher and Fortive corporate
culture have always been of active corporate value creation
so the VNT spin is consistent with the Danaher playbook.
Fortive is now free to focus on its professional instrumentation
segments which measure and monitor business processes and
grow its related software business while VNT is unconstrained
to re- invest its high FCF into its own growth opportunities.
FTV still owns 19.9% of VNT shares.
As per the usual spin-off dynamics, FTV investors dumped
the perceived as lower-growth and smaller VNT spinco at a
when-issued price of $35. In the early weeks post the spin the
share price dropped to the high $20’s due to the technical
dislocation and hence provided a great entry point while the
shareholder base was actively churning. Currently VNT shares
trade around $34, which is still below the when-issued price.
We strongly believe that at current levels VNT still provides a
compelling entry as we shall discuss in the valuation section
below.
Let us quickly address the elephant in the room: what was
left unsaid by FTV and is perhaps the main reason for the
spin is VNT’s reliance on the internal combustion engine (ICE)
market and investor perception that any business related to
ICE is increasingly a melting ice cube. FTV investors may have
been concerned that over time VNT will drag down its own
premium multiple or FTV management may have decided to
pre-empt such a debate.
Our own variant perception is that a ‘melting ice cube’
scenario as it pertains to VNT’s collection of businesses is
decidedly false. VNT benefits from multiple secular growth
drivers such as population growth, urbanization, traffic
congestion, safety regulations, clean and efficient mobility
solutions, vehicle and supply chain complexity. It has multi-
decade sticky relationships with fueling stations which will
continue to innovate to retain customers whether they drive
ICE vehicles or EVs.
There is no debate that the aggregate global car park will
continue to grow and the fleet age is rising. VNT has produced
a chart which indexes the density of fueling stations to
population in Europe to 100 and in the US to 229, while
the equivalent number is only 33 in China and 24 in India,
providing a long tailwind of structural growth mainly from EM
and to some extent from Europe. For example, VNT expects
the station count in India to double in the next five years.
Normally, only a third of a gas station profits are derived from
selling fuel, which is a lower margin business than in-store
sales. VNT is embedded outside and inside the store and it
helps operators transition from a ‘gas station’ to a ‘retailer’
mindset.
It is easy to see how a perfunctory look at GVR’s business
may discard it as undesirable as everyone sees that EV sales
projections are constantly rising. However, focusing on EV
sales misses the forest for the trees as the % of ICE vehicles in
the aggregate car park is the key variable. EVs still represent

114WWW.SUMZERO.COM
less than 1% of the global car park and ICE vehicles are
expected to still be >90% of the global car park through 2030.
At this rate, this transition represents 1% annual headwind to
VNT’s business for the next 10 years, which is hardly a game
changer.
Finally, and perhaps still unbeknownst to the market, VNT
will likely play a leading role in its customers’ transition from
petrol fueling equipment to electric chargers. This will likely
be a game changer for investor perception while specific
catalysts drive a re-rating starting in 2021.
TRITIUM: HIDDEN VALUE AND A POTENTIAL GAME CHANGER
Tritium is an Australian-based technology leader and
manufacturer of high-speed chargers for EVs (also known
as DC chargers). The company developed its first product, a
motor inverter for solar vehicle racing in 1999, accumulating
decades of valuable IP long before the EV market came into
existence. In 2012 Tritium provided the battery management
system for the Deepsea Challenger that James Cameron took
to the bottom of the Mariana Trench.
The difference between AC and DC chargers is drastic in terms
of the miles range per charge as well as the timing it take to
complete a charge. As EVs continue to improve their range,
AC chargers become obsolete while the high value-add DC
chargers become the industry standard. The smallest 50kw
DC charger today delivers 80 miles of range with a 20-munute
charge. The sweet spot is currently in the 150-175kw category
which can deliver 150km range with a 10-minute charge, if
the car is able to take that much power. Tritium currently
makes 350kw professional chargers which deliver 350km
range quickly and are suitable for highway rest stops and
heavy-duty mining vehicles. Tritium is also developing a 1GW
charger for heavy-duty trucks so it is at the forefront of next-
generation technology. The chargers are sold to fleets and
charging station network operators.
Tritium has a global footprint, with installations in over
30 countries, and is a leader in the European market with
approximately 2,700 high-speed chargers deployed globally
as of 2019; we estimate that at the moment the number of
deployed Tritium chargers is likely >4,000. Tritium has been
in business for twenty years and has established itself at
the forefront of the market with an estimated 20% global
share, second only to ABB’s Terra. Tritium has 90% share
in its native Australia, 50% share in Norway, 25% in the US,
and 20% in the UK. While Tesla operates its own closed-loop
system with 20,000 internally-produced superchargers in over
2,000 stations worldwide, Tritium DC chargers are capable of
charging Tesla vehicles with a special connector.
Tritium is the exclusive provider of DC chargers for
Chargepoint, the world’s largest EV charging network.
Interestingly, Chargepoint makes AC chargers but it does
not have the technological know-how to produce its own DC
charger so it gave exclusivity to Tritium. Tritium together with
ABB is also the exclusive supplier of DC chargers to IONITY,
the #1 charging network in Europe, a JV of BMW, Daimler, VW,
and Ford. Porsche unveiled its next generation charger also
engineered and produced by Tritium. Blink Charging, another
publicly-traded US charging network also uses Tritium DC
chargers.
Chargepoint recently went public via a $2.4bn SPAC and both
Chargepoint and Blink currently have $1bn+ valuations for
what seems like a very commoditized offering with no barriers
to entry, unlike Tritium which has a proven technological
moat. Last month Tritium unveiled its third-generation DC
charging system, the RTM75, which is more compact, easier
and cheaper to install and maintain than any other DC charger
on the market. Tritium chargers have ‘plug and charge’
functionality, i.e., no need to pre-register to a network. As a
point of reference, a 50kw unit sells for $30,000 while the
350kw is sold for $100,000.
How is any of this relevant to VNT? In September 2018 FTV
acquired a 19.3% stake in Tritium for $49m which is now
held by VNT as an equity investment and carried at cost in
Other Assets on the balance sheet. It is interesting that in the
VNT 82-page investor presentation concurrent with the spin
off, there is no mention of Tritium. However, management
disclosed that VNT has an option to buy the entire company
in 2021.

115WWW.SUMZERO.COM
We have pieced together scarcely available public
information to determine that FTV probably paid ~10x 2018
Revenue for its minority stake and we know that Tritium
sales more than doubled in 2019. Our ‘quick and dirty’ DCF
assumes Tritium will grow close to 80% in 2020, 50% in
2021 and that VNT will pay 12x 2021 Revenue (unlikely to
be higher than the 10x initial entry, but we are trying to be
conservative) to buy the entire business, which is roughly a
cash outlay of $1.5bn. If we assume sales grow at a 40% clip
until 2030, then the Tritium units sold would be very roughly
50,000. By 2030, the world will have 40 million EV charging
points, according to GTM research, so this number feels like a
drop in the bucket and entirely achievable. We make certain
assumptions on normalized margins and ROIC to get to an
NPV for Tritium of $1.8bn, or $10.76 per VNT share, more
than 30% of VNT’s current market value, which is significant
hidden value and a strategic game changer.
The partnership between GVR and Tritium is a testament
to FTV/VNT management’s forward thinking. It is a huge
win-win as Tritium can use the GVR channel to go to market
and start installing DC chargers throughout its global fueling
station network. China will be by far the largest EV market
in the world and the GVR/Tritium partnership is incredibly
well positioned to participate in that growth given GVR’s
pedigree in the fueling station market.
Outside of the significant financial implications, the Tritium
partnership addresses the key structural issue that may be
plaguing VNT shares. As the transition from ICE vehicles to
EV progresses, VNT is actually incredibly well positioned to
lead the charge and be invaluable to its customers and avoid
the eventual growth de-acceleration that the decline in ICE
vehicle usage would have eventually brought.
DRIIVZ: MORE VALUE CAPTURE POTENTIAL FOR VNT IN THE EV ECO-SYSTEM
Driivz is an Israeli cloud-based EV charging network
management software company. Driivz supports EV
charging operations, energy management, and billing and
maintains relationships with some of the largest networks
of public EV fast charging stations in the US, currently
managing tens of thousands of stations. Its aim is to become
the embedded OS for EV charging stations. GVR announced
a minority investment in Driivz, part of a US$11M funding
round co-led by Centrica Innovations in 2020, and has an
option to buy the entire company in 2022. Little is available
publicly about its financials; however, we have put together
a framework which values Driivz at less than $0.50 per VNT
share today, which could grow to about $5 per share by 2030
and highlights how well positioned VNT is to capture value in
the EV eco-system.
FINANCIALS AND VALUATION SUMMARY
VNT has a market cap of $5.8bn
and an EV of $7.3bn, pro forma for
$84m of cash due from its former
parent that is to hit VNT’s balance
sheet in 4Q20.

116WWW.SUMZERO.COM
VNT trades at 11.4x EV/2021 EBITDA, a significant discount
to DOV at 15.0x (despite superior operating metrics in the
fueling station segment) and FELE (a smaller competitor
to GVR) at 17.5x.
VNT also trades at 13.6x 2021 P/E vs. DOV at 20.1x and
FELE at 28.6x, again a sizeable discount.
VNT also trades at similar discount to the broader
industrial comps despite often better margins and FCF
conversion.
In addition, based on our ROIC/WACC methodology
and assuming top line growth of 3%, we estimate VNT’s
intrinsic value (IV) should reach $70 in 12-24 months,
resulting in 100% upside. This includes the aforementioned
values for Tritium and Driivz.
The $70 intrinsic value would imply EV/EBITDA multiple of
14.7x, consistent with the broader peer group at 15.0x, and
implied P/E of 24.9x, again consistent with the peer group.
It is worth pointing out that if Tritium is consolidated by
then, it will have a significant positive effect on aggregate
top line growth, therefore a premium to the comps may be
warranted.
As mentioned earlier, Teletrac Navman is currently close
to break-even and GTT, despite its high margins, is still
quite small. Therefore, their contribution is non-existent in
the historical FCF and vastly understated in the near-term
projections. Both are growing, predictable recurring revenue
businesses with margin potential higher than the group
average. Their respective growth tailwinds and positive
mix impact on VNT margins are still quite misunderstood.
According the one sell-side analyst the NPV of Telematics
and GTT is $10 and $8 per share, respectively, which is more
than 50% of the current share price on a SOTP basis.
M&A AND BALANCE SHEET CAPACITY
According to management, VNT will be managed to a
3x ND/EBITDA leverage ratio and any extra cash will be
invested in M&A. 2020 has been a very strong year in terms
of FCF generation and based on management’s recent
comments, 4Q20 FCF generation will be exceptional which
will de-lever the balance sheet to 2.2x at YE20, likely ahead
of consensus expectations. 2021 FCF generation will be
strong but cash tax spill over from 2020 and a working
capital build will mean that FCF is likely lower than in 2020,
yet leverage will likely go down to 1.5x by YE21. 2022 FCF
will be back to normal, therefore leverage at YE22 will likely
by around 0.7x, in the absence of any M&A in the meantime.

117WWW.SUMZERO.COM
Re-levering the balance sheet back to 3.0x would imply $1.6bn
of M&A firepower by YE22 based on our projections, slightly
ahead of management’s $1.5bn guidance. It is interesting
that this M&A capacity will likely match the cash outlays
required to buy 100% of Tritium and Driivz in 2021 and 2022,
respectively.
In a theoretical case, where VNT instead engages in more
traditional bolt-on M&A deals at 12x EV/EBITDA multiple on
average, the likely FCF accretion will be 15% or pro-forma FCF
in 2022 will reach $3.50 per share, as shown below. Therefore,
buying VNT today at 10.2% 2022 FCF yield qualifies as a value
investment when the broader peer group trades at more than
twice its FCF multiple. To say it another way, it is easy to see
how VNT stock ought to double if they continue to execute
operationally according to the VBS system (adopted from
the vaunted Danaher Business System), part of which is fully
optimizing the balance sheet to engage in accretive M&A.
RISKS
ICE to EV transition: clearly this is the #1 strategic issue but as
we have discussed at length, VNT is well prepared to benefit
from the transition to EV via its Tritium/Driivz stakes
EMV related slowdown: EMV developed and managed by
American Express, Discover, JCB, Mastercard, UnionPay, and
Visa is a global standard for credit cards that use computer
chips to authenticate chip-card transactions. Pre-EMV VNT
grew top line at a 5% CAGR, while it has grown at 6% in the
2015-19 period due to regulated EMV adoption. The EMV
adoption sunset means that 2021 and 2022 will be re-set years,
with a $150-200m aggregate hit well flagged by management
and in consensus numbers. In our model aggregate top line
growth in 2021 is only 1% while DOV sees 1-2% fueling station
growth in 2021, therefore VNT management and our model
could turn out to be conservative. 2022/23 growth rate should
normalize to a ‘GDP+’ historical rates + any benefit from future
M&A
Teletrac churn: something to monitor although the early signs
from the introduction of the new TN360 platform have been
encouraging and should help Teletrac turn cash flow positive
Matco financing: the bad debt trend related to Matco
extending financing to both franchisees and customers
although immaterial, bears watching
Lack of segment profitability: ideally management should
report segment profitability and hopefully disclosure will
improve over time, although the market already has a decent
idea of segment margins as we pointed out in the business
description.
Overhang from FTV stake sale: the market may be concerned
with any technical overhang from future FTV share sales
but given FTV’s own experience with spin offs, it should be
sophisticated enough to handle the process well. In addition,
as the upside optionality laid out here becomes better
understood, placing the shares becomes easier.
CATALYSTS
We feel that management has decent visibility into the
backlog for the first half of 2021. The key catalysts will revolve
around M&A, in particular the exercise of the 2021 Tritium
option which if it materializes as we expect, will be a game
changer for the shares.

An exclusive database of 14K+ actionable and peer-reviewed research ideas with
complete performance attribution and firm transparency.
Real-time alerts with up-to-date commentary from sector/regional experts on
thousands of stocks and bonds uncovered by Wall Street and global banks.
Proprietary analyst rankings data, sentiment filters, private messaging, and more.
•
•
•
VISIT SUMZERO.COM ›
JOIN SUMZERO TO DOWNLOAD THE COMPLETE REPORT
WWW.SUMZERO.COM 118
HEDGE
We believe VNT is such an idiosyncratic and underpinned
situation that a hedge is not required but being short a basket
of gas stations will protect against further ICE-driven de-
rating while a pair of long VNT/short DOV will lock in VNT’s
material multiple discount
Serdika is a fundamental long/short equity special situations fund launched in London in December 2019. Serdika’s strategy is to own equities that benefit from and sell short equities that are impaired by special situations, corporate transformation, and secular disruption catalysts, often expressed with an activist value maximization mindset.
The goal is to consistently produce robust absolute returns via long and short single-stock alpha generation and sophisticated risk management, regardless of market conditions and with negligible net exposure in the -10% to 20% range. The performance target is to generate uncorrelated annual net returns of 15-20% with no down years and with below average volatility.
Serdika also offers co-investment opportunities in companies with material corporate transformation potential or an activist angle via SPVs or bespoke advisory arrangements.
Serdika is run by Rado Bradistilov, winner of the 2017 Sohn London Conference Stock Picking Contest
About Serdika Advisors

119WWW.SUMZERO.COM
Colliers International Sub Vtg Com
L O N G
Colliers is a high-quality compounder hiding in plain sight. A long
overdue multiple re-rating combined with strong organic growth, margin
expansion, and M&A suggests many ways to win.
TIMEFRAME
1-2 YearsSITUATION
ValueMARKET CAP
1.8B USDATTACHMENTS
About Morgan Housel
Kinsman Oak Capital Partners Inc. is an independent Toronto-based boutique investment firm that strives to generate superior long-term results over multiple market cycles, net of fees. The firm was founded in 2020 by Alexander Agostino and its sole focus is managing the Kinsman Oak Equity Fund. Long-term outperformance is driven by adhering to a disciplined, consistent and repeatable investment process. Our investment philosophy is to buy securities at a significant discount to intrinsic value. Markets are generally efficient but, in rare circumstances, attractive investment opportunities can present themselves. Market inefficiencies are uncommon, so we relentlessly hunt for them.
About Kinsman Oak Capital Partners Inc.
Alex is the sole portfolio manager of the Kinsman Oak Equity Fund. Prior to founding Kinsman Oak Capital Partners, he was on the investment team at Venator Capital Management from 2013 to 2019. He focused primarily on North American long/short equity investment opportunities during that time. Alex is a CFA charterholder and received his Bachelor of Business Administration degree from Wilfrid Laurier University where he graduated with distinction.
About Alex Agostino
FINALIST
Idea Posted: 12/19/2020
Asset: Equity
Idea Updated: 12/22/2020
Symbol: CIGI:CN
RETURN TO DATE:
-3.2%
EXPECTED RETURN:
26.10%
Alex Agostino Chief Executive Officer at Kinsman Oak Capital Partners Inc.
Mid Caps
BADGES:

120WWW.SUMZERO.COM
Asset Class: Lorem Symbol: CIGI:CN Updated: 12/22/2020 Submitted: 12/19/2020
Colliers International Sub Vtg Com
BY:
CURRENTLY AT:
Alex Agostino
Colliers is a high-quality compounder hiding in plain sight. A long overdue
multiple re-rating combined with strong organic growth, margin expansion,
and M&A suggests many ways to win.
ASSET CLASS:
EquitySITUATION:
ValueTARGET ALLOCATION:
5% - 10%CATALYSTS:
N/A
TIMEFRAME:
1-2 Years
EXPECTED RETURN
TARGET PRICE
INITIAL PRICE
26.10%
140.00 CAD
114.75 CAD
Pricing & Return Details LO N G
1. Multiple re-rating candidate. The core business has
transformed its revenue composition from primarily
cyclical, low-margin sources to high-margin, recurring
value-added services. CIGI is a prime candidate for a
multiple re-rating given close to 60% of forward EBITDA
will come from recurring revenue streams.
2. Strategic investments provide runway for long-term
growth. CIGI is creating a unique platform of numerous
commercial real estate and related offerings. Combining
adjacent and new market verticals can create revenue
synergies by cross-selling services between these
subsidiaries. Further, the new verticals have highly
fragmented end markets where Colliers can take share and
pursue tuck-in acquisitions to enhance its growth profile.
3. High insider ownership and long history of creating
shareholder value. Insiders own approximately 25% of the
economic interest and 54% of the voting share. Shareholder
value creation has been unlocked in a variety of ways
including organic growth, strategic acquisitions, and spin-
offs. Jay Hennick, Chairman and CEO, has demonstrated a
commitment to maximizing shareholder value for decades.
INTRODUCTION
Colliers is a deeply underappreciated high-quality
compounder, in our view. The company is dual listed on the
TSX and Nasdaq under the symbol CIGI. Our thesis is relatively
straightforward.
INVESTMENT THESIS
BADGES:
Kinsman Oak Capital Partners Inc.

121WWW.SUMZERO.COM
In short, the business has undergone a multi-year strategic
shift and has transformed itself from a low-margin, cyclical,
and commoditized business into a business that generates
50% of sales, and more than 55% of EBITDA, from high
margin, recurring revenue streams.
We feel this strategic shift is overlooked by investors and,
as the business continues to grow its recurring revenue
segments, a pending change in perception will warrant a
multiple re-rating. Going forward, we estimate more than 50%
sales and almost 60% of EBITDA will be recurring in nature,
which suggests this tipping point may be soon.
Long-term we believe the business has significant growth
opportunities ahead of it. CIGI is building out a unique
platform of numerous commercial real estate related services
which deepen its economic moat and provide growth
opportunities in both adjacent markets and new market
verticals.
COMPANY BACKGROUND
Colliers was founded by Jay Hennick, who still serves
as the CEO and Chairman. Hennick owns all of the
outstanding multi-voting shares and controls 43% of the
total votes. He has proven to make
shareholder friendly decisions in the
past, such as the spin-off of
FirstService Corporation (FSV) in 2015.
Hennick, along with the other insiders,
own an economic interest of 25% and
control 54% of the total votes.
Historically, the company relied heavily
on its commercial real estate Sales &
Lease Brokerage business. Colliers was
successful at building a name for itself
and has grown sales from $340 million
in 2000 to $3 billion in 2019 (plus an
additional $2.4 billion if you count FSV).
Sales & Lease Brokerage is generally a low-margin,
cyclical, and commoditized business that warrants a
relatively low valuation multiple. Colliers has undergone
a strategic shift to focus their business on higher margin,
recurring revenue streams such as Outsourcing &
Advisory and Investment Management.
The street still views Colliers as the same business it used
to be, and this misconception presents an opportunity
for those willing to dig beneath the surface to really
understand the vision Colliers has of their future.
BUSINESS SEGMENTS
Colliers primarily operates in three business segments:
1. Sales & Lease Brokerage (50% of sales) –
Leasing, Capital Markets
2. Outsourcing and Advisory (44% of sales) –
Project Mgmt., Valuation, Prop. Mgmt.,
Loan Servicing
3. Investment Management (6% of sales) –
Advisory, Incentive Fees, Transaction & Other

122WWW.SUMZERO.COM
SEGMENT #1 – SALES & LEASE BROKERAGE
This segment is what investors typically think of when they
hear the name “Colliers.” This segment tends to be lower
margin and very cyclical. It has been hit hard from Covid-19.
Colliers does not break out EBITDA by segment, but we
estimate normalized margins to be ~11%.
SEGMENT #2 – OUTSOURCING AND ADVISORY
This segment is significantly underappreciated by investors,
in our view. This segment posted 2.7% y/y growth in 9 months
ended September 2020, despite Covid-19. We believe this
speaks volumes to the recurring and non-cyclical nature of
its revenue streams. Colliers does not break out EBITDA by
segment, but we estimate normalized margins to be ~14%.
[see Figure A below]
SEGMENT #3 – INVESTMENT MANAGEMENT
The Investment Management segment is relatively new, and
Colliers entered the space by acquiring Harrison Street in
2018. Colliers does not break out EBITDA by segment, but we
estimate normalized margins to be ~36%.
[see Figure B below]
SEGMENT GROWTH RATES
The Outsourcing & Advisory Segment grew top-line sales at
an annualized rate of 16% between 2015-2019. It’s difficult
to parse out segmented data going further back than 2014
because Colliers’ reported revenues included FirstService.
The Outsourcing & Advisory segment also managed to post
low-single-digit growth this year amidst a global pandemic, a
feat we feel reflects well on the company’s management team.
[see chart on following page]
Figure A
Figure B

123WWW.SUMZERO.COM
Outsourcing & Advisory and Investment Management not
only possess more attractive investment characteristics
from a revenue reliability, EBITDA margin, and cyclicality
standpoint, but both were growing at a faster rate than Sales
& Lease Brokerage before the pandemic as well. This shift in
revenue composition is no accident.
STRATEGIC TRANSFORMATION
CIGI’s strategic shift has been underway for years and we
believe the revenue and margin profile of the business
is approaching a tipping point where the successful
transformation will be impossible to ignore. The progress
since 2010 is undeniable and analyzing the company’s
EBITDA margin paints a clean picture.
Colliers increased EBITDA from $27 million in 2010 (3.2%
margin) to $359 million in 2019 (11.8% margin). Increasing
EBITDA dollars 13x while quadrupling EBITDA margins
over the past ten years is impressive on its own, but the
company also managed to grow the recurring portion
from 31% in 2017 to 57% in 2020.
EBITDA margin expansion combined with the increased
portion of recurring EBITDA is driven largely by the
company’s changing revenue sources. Sales & Lease
Brokerage comprised of 66% of revenues in 2014 vs.
50% today. Outsourcing & Advisory comprised of 34% of
revenues in 2014 vs. 44% today. Investment Management
accounted for zero revenues in 2014 and comprises of 6%
of revenues today. See below.

124WWW.SUMZERO.COM
Colliers is far less geared towards the underlying real estate
than it used to be, especially since adding Harrison Street,
Dougherty, and Maser Consulting to their platform. Most of
the CRE business is now recurring as well.
This trend in revenue mix shift is still ongoing and, in our
view, has a long runway ahead of it. As a larger portion of the
company’s revenue and EBITDA come from recurring sources,
analysts will be forced to value the entire entity on a sum-
of-the-parts basis and assign a more appropriate valuation
multiple to each segment.
Today, most analysts assign a price target based on a
company-wide EV/EBITDA multiple derived from CIGI’s
historical trading range which does not appropriately reflect
the positive fundamental changes to the business model over
the years. We believe assigning a price target today, when
recurring revenues are 50% of revenues, based on the stock’s
previous trading range, when recurring revenues were only
34% of revenues, significantly undervalues two out of three
business segments.
LONGER-TERM VISION
Colliers does not explicitly lay out their strategic vision for the
next 5-10 years, so this section is mainly our interpretation
from reading between the lines. The company is clearly
gravitating towards higher value-added services that carry
better margins, have less cyclicality, and minimal capex
requirements.
It appears to us Colliers has already laid the foundation to
build out a platform of related commercial real estate services
that can drive meaningful revenue synergies going forward.
Cross-selling is probably not the right word but offering
services in adjacent markets allows them to increase revenue
capture with existing clients.
Long-term, Colliers’ decision to enter new market verticals
goes beyond revenue synergies from complimentary service
offerings. These new market verticals provide a valuable
growth engine for the company going forward. We believe the
management team intends to take share in highly fragmented
markets and pursue tuck-ins to further enhance the growth
profile of the overall business.
SHAREHOLDER VALUE CREATION THROUGH M&A
Colliers “big three” strategic investments over the past
few years were (1) Harrison Street, (2) four subsidiaries
of Dougherty Financial, and (3) Maser Consulting. These
acquisitions, explored in more detail below, provide Colliers
with a suite of new service offerings and give Colliers a
foothold in a variety of new end markets.
[see figure below]
HARRISON STREET
Harrison Street appears to be the most transformative deal.
The recurring nature of the business’s revenue stream is
underappreciated, in our view. Roughly 50% of AUM is in
open-end evergreen funds, meaning revenue generated
from these perpetual structure vehicles are truly recurring,
provided there are no significant redemptions. The other 50%
of AUM is derived from closed-end funds with average fund
lives between 8-10 years. Harrison Street is consistently raising
money for new closed-end funds to offset maturing funds.

125WWW.SUMZERO.COM
Growing AUM is only the first step to unlocking shareholder
value from this acquisition. Real estate assets managed by
Harrison Street provide Colliers with an enormous pipeline to
drive growth in the rest of their segments.
Colliers can offer services when any underlying assets need
to be purchased, sold, or leased; needs a valuation opinion
or property management services; requires a loan or debt
financing; or if any assets need consulting/engineering
services. Integrating these businesses and leveraging this
unique platform could unlock meaningful shareholder value
long-term.
DOUGHERTY FINANCIAL SUBSIDIARIES
Colliers acquired four subsidiaries from Dougherty Financial,
a debt finance and loan servicing platform. The interesting
part is this acquisition came with a DUS license (Delegated
Underwriting & Servicing). The DUS Program grants approved
lenders the ability to underwrite, close, and sell loans on
multifamily and senior living properties to Fannie Mae without
prior Fannie Mae review.
The opportunity for Colliers, specifically, is this license grants
them the ability to provide debt for all the transactions they
do in the multifamily, senior living, student housing, and
affordable housing space. So, on top of getting a brokerage
fee on the placement of that debt, Colliers can also earn
fees to originate the debt and then additional revenue from
servicing it over the following 20 years. The cross-selling
opportunity is enormous on its own. The additional sticky
revenue generated from servicing Fannie Mae loans for the
next two decades is the real kicker.
MASER CONSULTING
Maser Consulting provides a variety of engineering and
design services in real estate and infrastructure end markets.
We believe the decision to enter this new market vertical
gives Colliers an incredible growth opportunity that is largely
neglected by investors. Beyond the obvious revenue synergies
from integrating Maser into Colliers’ platform, this acquisition
presents an opportunity to take market share and pursue
tuck-ins in highly fragmented end markets.
Colliers has already demonstrated their ability to create value
by organically taking share in fragmented industries and
bolstering that process with shrewd tuck-ins. The potential
growth runway is long and, if Colliers can successfully run
the same playbook with Maser, this segment could provide a
tailwind to earnings growth for many years.
UNIQUE PLATFORM
Without getting too lost in the weeds about each individual
acquisition, the main point is this. Colliers has a strategic
vision for the future of their business. The management team
is deepening the business’s economic moat, improving growth
prospects, and increasing the reliability of its cash flows as
activities are diversified away from the traditional commercial
real estate sales and leasing brokerage.
This symbiotic relationship between the base business and
the above acquisition targets will improve revenue synergies
short-term. But the real opportunity is longer-term in
nature. Colliers is transforming its business; its future growth
prospects are bright, and investors continue to underestimate
the company’s long-term earnings potential. The Colliers
of yesteryear was transactionally focused on commercial
real estate deals. Colliers is de-emphasizing that part of
the business as they become closer to a one-stop-shop for
anything real estate related.
COMPOUNDER WITH HIGH INSIDE OWNERSHIP
We believe the management team possesses the necessary
expertise to successfully implement this long-term strategic
vision. Key decision makers appear to be properly incentivized
to execute effectively.

126WWW.SUMZERO.COM
COLLIERS IS A TRADITIONAL COMPOUNDER
Any way you spin it, Colliers has been a compounder
for decades, and Jay Hennick has been at the helm the
entire time. Most long ideas are complimentary of existing
management teams and reference anecdotal or qualitative
data. But, in this case, the results speak volumes.
FIRSTSERVICE CORPORATION SPIN-OFF
Not only has Hennick demonstrated his ability to compound
capital but, just as importantly, he has demonstrated a
willingness to prioritize what is best for shareholders. Colliers
made the decision to spin-off FirstService Corporation into
a standalone entity in 2015 and appoint a separate CEO to
lead the business. Below illustrates how well FirstService has
performed post-spin.
INSIDE OWNERSHIP
Hennick, along with the rest of the management team and
board members, have significant skin in the game. We feel this
aligns their interests with those of the shareholders. Key
decision makers at the firm have a vested interest in driving
the share price higher. High inside ownership alone does not
eliminate certain risks such as overpaying for acquisition
targets, excessive use of leverage, or engaging in other
value destructive behaviour.
But, when combined with other elements of our thesis
and a strong corporate culture, it leads us to believe the
management team is far less likely to recklessly swing for
the fences to goose annual performance bonuses.
It is worth noting Hennick owns 100% of the outstanding
multiple voting shares (1,325,694 shares outstanding).
Spruce House is an investment management firm with
board representation through Benjamin Stein. Another
large investment firm, BloombergSen, owns another 5% of
the shares outstanding according to their most recent 13-F
filing. This concentrated ownership situation reduces the
shares available for float.
VALUATION
We believe CIGI should be valued on a SOTP basis by
assigning different multiples to their (1) Sales & Lease
Brokerage segment and (2) Outsourcing & Advisory and
Investment Management segments.
Sales & Lease Brokerage: The closest public company
comparable for this segment is Marcus and Millichap
(MMI). MMI is skewed more toward investment sales, more
profitable during the good times and less profitable than
the bad times. We believe CIGI’s Sales & Lease Brokerage
segment should trade roughly in line with MMI at 10x
EBITDA.

127WWW.SUMZERO.COM
Outsourcing & Advisory and Investment Management:
Finding a clean comparable for this segment is more difficult.
Instead, we gauge its worth by its underlying investment
characteristics. These segments grow organically at
mid-to-high single digits plus tuck-ins, have recurring revenue
during recessions, strong EBITDA margins, and generate a ton
of FCF due to minimal capex requirements. We believe, given
today’s ultra-low-rate environment and pricey stock market,
this segment should trade for at least 16x EBITDA.
ESTIMATESBelow are our forward estimates for Colliers.
KEY ASSUMPTIONS
We estimate the Sales & Lease Brokerage segment will fully
recover by 2023. This assumption may prove to be overly
conservative but, given there is so little available information
about the trajectory of the recovery, we prefer to model
conservatively and be surprised to the upside.
We anticipate the Outsourcing & Advisory / IM segments will
rebound quickly next year, and that momentum should carry
forward for the next two years with a combination of organic
growth and tuck-in acquisitions.
Our margin assumption for the Sales & Lease Brokerage
business is 11% and a blended 15% margin for the Outsourcing
& Advisory and Investment Management segments. We feel
this assumption is realistic and we are not pricing in overly
aggressive margin expansion in the coming years.
It is worth noting that our estimates are fairly in line with
sell-side expectations. We believe there is a degree of
conservatism in these forward numbers and any surprises are
more likely to be to the upside than the downside.
PRICE TARGET
Below is our sum-of-the-parts analysis for approximating
a fair value for CIGI shares in CAD. We believe upside is
substantial given the low prospective return investment
landscape. Further, it’s not often that high-quality
compounders have more than 20% upside in one year and
almost 40% upside over a two year holding period.
CATALYSTS
1. Multiple re-rating. We believe the primary catalyst for CIGI
will be a change in investor / sell-side perception of the
business. Again, the “Colliers” brand is still perceived to
be a low-margin, cyclical sales & leasing business. When
recurring revenue contributes more than 50% of revenue
and almost 60% of EBITDA, this misconception becomes
practically impossible to ignore.

An exclusive database of 14K+ actionable and peer-reviewed research ideas with
complete performance attribution and firm transparency.
Real-time alerts with up-to-date commentary from sector/regional experts on
thousands of stocks and bonds uncovered by Wall Street and global banks.
Proprietary analyst rankings data, sentiment filters, private messaging, and more.
•
•
•
VISIT SUMZERO.COM ›
JOIN SUMZERO TO DOWNLOAD THE COMPLETE REPORT
WWW.SUMZERO.COM 128
2. Continued earnings growth and M&A.
Continued organic earnings growth and additional
value creation from M&A activity. Colliers has been busy
in the M&A market and tends to make shrewd deals, in
our opinion. We believe the company is more likely to
make tuck-in acquisitions to bolster top-line revenue
growth, rather than large transformative acquisitions.
3. Recovery in Sales & Lease Brokerage segment.
Additional potential upside from a faster than expected
recovery in the Sales & Lease Brokerage segment. We
have no view of where commercial real estate prices are
going in the short-to-medium term. That said, Colliers
is less geared towards the underlying asset value. Sales
and leasing volume – not price – is the critical factor.
The company gets paid when activity occurs, regardless
of transaction price. Even if commercial real estate
value declines, we believe the volumes will eventually
return.
RISKS
• Continued weakness in the Sales & Leasing Brokerage
segment. A second wave of the virus could potentially result in
a continued impact on transaction volumes throughout 2021.
• Execution risk. There is always execution risk any time a
business is undergoing a strategic transformation. That said,
we feel the management team has done a fantastic job so far
which bodes well for the future.
• Potential value trap. A key tenet of our thesis is a pending
multiple re-rating. There is no guarantee the investment
community will share the same opinion on the quality of the
Outsourcing & Advisory or Investment Management segments.
In that instance, a multiple re-rating would be unlikely.
• Slowing growth in Outsourcing & Advisory and Investment
Management segments. Should these segments stop
growing, due to company-specific or market related factors,
the valuation multiple applied to the whole business could
contract.
• Low float can result in choppy trading patterns. We estimate
a significant percentage of common shares outstanding are
closely held and do not frequently trade. This can cause
volatility uncorrelated to the market.
Ideas on companies whose respective market capitalizations
were US$10B or greater at the time of submission.
LARGE/MEGA CAPS

130WWW.SUMZERO.COM
Electronic Arts Inc
L O N G
EA is high-quality & trading at a reasonable valuation. Growth prospects
are excellent and will benefit from the console replacement cycle which
provides an earnings catalyst over next 2yrs.
TIMEFRAME
2-5 Years
SITUATION
Growth At Reasonable Price
MARKET CAP
36.0B USDATTACHMENTS
About Morgan Housel
Mayar Capital was established to provide investment advisory and asset management services to institutions, family offices, and high net-worth individuals globally. Mayar Capital manages a single long-only Responsible Global Equity single. Investors can access the strategy through the flagship Mayar Fund, which was launched in May 2011. Mayar Capital have also offered the strategy in Separately Managed Accounts since 2013. Mayar Capital underlined the commitment to responsible investing by becoming a signatory of the UN-backed Principles for Responsible Investing in 2019.
About Mayar Capital Management
Aubrey is the Senior Analyst and a Director at Mayar Capital where he joined in 2015 from Odey Asset Management, where he had worked for two years as an Analyst with coverage of Software and Chemicals on a global basis. Aubrey began his investing career at Rathbones in 2007 and has a first in Law and a masters in Competition Law from UCL.
About Aubrey Brocklebank
WINNER
Idea Posted: 12/22/2020
Asset: Equity
Idea Updated:1/8/2021
Symbol: EA:US
RETURN TO DATE:
1.3%
EXPECTED RETURN:
63.72%
Aubrey BrocklebankAnalyst at Mayar Capital Management
Large/Mega Caps
BADGES:

131WWW.SUMZERO.COM
Asset Class: Equity Symbol: EA:US Updated: 1/8/2021 Submitted: 1/8/2021
Electronic Arts Inc
BY:
CURRENTLY AT:
Aubrey Brocklebank
EA is high-quality & trading at a reasonable valuation. Growth prospects
are excellent and will benefit from the console replacement cycle which
provides an earnings catalyst over next 2yrs.
ASSET CLASS:
Equity
SITUATION:
Growth At Reasonable Price
TARGET ALLOCATION:
2% - 5%
CATALYSTS:
Regulatory Change
TIMEFRAME:
2-5 Years
EXPECTED RETURN
TARGET PRICE
INITIAL PRICE
63.72%
231.20 USD
139.43 USD
Pricing & Return Details LO N G
BUSINESS QUALITY
• Exceptionally High Quality Business; only form of
entertainment to improve over time
• Scale Advantage as games become bigger and more
complex
• Data collection will give them an unassailable AI
advantage, especially in sports
• Multiplayer games have Network Effect and switching
costs (in terms of time spent)
• Excellent customer economics - Cheapest form of
entertainment by the hour
COMPANY QUALITY & ROBUSTNESS
• No accounting manipulation red flags raised
• High Returns on Capital, and Excellent Cash Conversion
• However - highly operationally leveraged (double edged
sword)
• Micro Transactions and Lootboxes pose the greatest risk
to this investment
MID TO LONG TERM GROWTH OUTLOOK
• Console cycle and release of PS5 and new XBOX
INVESTMENT THESIS
BADGES:
Mayar Capital Management

132WWW.SUMZERO.COM
• Big ‘real world’ events - NFL e-sports & World Cup
2022 E-Sport Optionality
• Under-monetized, cheapest entertainment per hour
° Many ways for this to be increased (such as
advertising (see Burger King)
• Transition to Digital is Margin Enhancing
° Even though 80% is already digital (though
less by volumes), that is still an gross margin
increase of 5pts from 75%to 80%
• Inclusion of Female teams in FIFA, and increase in girls
football (soccer) can double TAM
VALUATION
• Undemanding Multiples
° 17x EBIT (2022)
° 5% FCF is undemanding
• DCF offers over 50% upside (and over 100% in my bull
case) A positive upgrade cycle can easily see this be
revised upward Similar valuation to peers, but benefits
from...
° Female adoption
° Equity Bond like returns for FIFA and Madden
RISKS
• A potential blockbuster could flop
° Games have become established franchises
Sports have prove bond like returns
• Competitive threat from Mobile Gaming
° Not really the same product, an opportunity
more than anything
• Regulatory risk re: Lootboxes
° Many jurisdictions are against regulations
° Laws in the USA have been proposed to protect
computer games
WHAT IS EA
Electronic Arts produce computer games for PC and
Console, and to a limited extent Mobile.
For many years (much to my chagrin not) I dismissed
computer games as an industry as I believed that they
were a blockbuster/hit driven business that was inherently
unpredictable.
However, many of EA’s games are in fact franchises that are
decades old.
FIFA began in 1993; and possibly generates around 40% of
EAs revenue. Every year they bring out a new version with
all the latest football stars licenced. And every year (almost)
is more successful than the last.
Battlefront is a Star Wars game which was launched in
2004, and has been successful since then.
The Sims and SimCity began in 1989 and has sold over 200
million games since then.
And Madden Football (the American variety) is where it all
began in 1988, and has sold over 250 million copies since
then.
One of the successful elements that, founder, Trip Hawkins
discovered was that by licencing the brands of real teams
and players he had a game that sold better, and also had
great repeat sales. As new players join in real life, they
create a need for an update in the game.

133WWW.SUMZERO.COM
BUSINESS QUALITY
CONTINUOUS IMPROVEMENT IN TECHNOLOGY
Computer games are a unique form of entertainment as they
are probably the only form that genuinely improves over time.
If you are a movie studio and you are
producing a gangster/mobster movie
you have to compete with this:
It is hard to believe that this movie is
almost 50 years old. Yet (other than
part 2) there has not been a better
movie made on the subject. And the
Irishman does not come close!
Yet computer games will almost certainly be better (with the
exception of GoldenEye and MarioKart for the N64 which will
always be the two best games ever made).
In the same year that the Godfather was made this seminal
computer game was released:
And if we want to look at FIFA through the ages we can see
just how dramatic this improvement has been.
These improvements are not just limited to the graphics, but
also to the gameplay, the sounds, and not to mention the
ability to play massive multiplayer games with millions of
people across the globe.
FIFA 94
FIFA 2000
FIFA 2006
FIFA 2011
FIFA 20

134WWW.SUMZERO.COM
Virtual and augmented reality are likely to play a part in
future gaming.
Maybe one day you could play a football game on your desk
or coffee table!
And maybe most excitingly AI will advent the rise of
personalised gaming. As the machine analyses each player it
will be able to optimise multiplayer opponents and partners.
It will be able to create AI opponents which are more realistic
and engaging.
Personalised gaming could lead to far better gameplay and
user engagement. Not to mention monetisation, AI can be
used to enhance game recommendations and better direct
retention rate marketing.Article on AI and Personalised
Gaming (https://knowledge.wharton.upenn.edu/article/
telling-data-story-behind-video-gaming/)
Furthermore, it favours the incumbents as AI is predicate on
large datasets. Thus, whoever has the best dataset wins.
INCREASING COMPLEXITY
The increasing quality of games is matched by the
increasing complexity and difficult in producing a AAA
blockbuster game.
Over the last ten years EA have significantly reduced the
number of titles released annually and increased the spend on
each title.
[see chart below]
As can be seen the number of employees taken to produce a
AAA game has doubled, and the R&D per game as increased
by almost 10x.
This makes it increasingly difficult for competitors. And it
makes it nigh on impossible to start-up a new games company
from scratch to compete with these titles.
NETWORK EFFECT
The evolution of online multiplayer games has created a
network effect, that we believe is particularly effective in
Sports Titles.

135WWW.SUMZERO.COM
According to the last earnings call EA has 330 unique
accounts playing across their titles; and FIFA has 100 million
players globally.
[see image above]
What this means is that whenever you want to play a
game online (any time night or day) you will probably find
somebody to play against (in any geography/language). But
more importantly all your friends (real world and online) that
play will be using this game.
This effectively makes sports games “winner take all”. This is
because if you want to play a Football game you play FIFA –
who plays PES anymore?
If we look at FIFA sales vs PES (sales per title not per year) we
can see how Konami has gone from being a serious challenger
to FIFA to a non-entity. (these figures are as of mid 2019
hence the low 2019 numbers)
There will always be more that one shooter game, but when it
comes to multiplayer sports it is hard to see how this network
effect gets broken. EA would have to make some very
significant unforced errors in order to lose this lead.
DATA AND AI
Google is in an enviable position: it does not matter how
much money a competitor brings to the table they will not be
able to replicate the data that google has amassed and thus is
always at a disadvantage.
Whenever we find a business that could not be replicated no
matter how much is thrown at it we must realise that we have
found something very special.
EA could become one such business (if it is not already).
The data collected on the 100m FIFA players and the 30m
online Ultimate Team players gives them a very significant
advantage over other sports game developers.
There are very few other games developers with as many
players, and the resources to crunch all that data. And even
fewer competitors in EA’s sphere. A sports game does not
necessarily compete with a shooter game, and the data from
one may not necessarily be applied to the other. So, this
means that EA can completely lock in their advantage in
Football and many other sports.
A final consideration regarding Network Effect and AI/Data is
that this is an expanding moat. Data collection is only going to
improve and this will be a virtuous cycle that may well ensure
that their franchises continue to dominate their respective
niches.

136WWW.SUMZERO.COM
Customer Economics
Gaming is one of the cheapest forms of entertainment when
measured on an hourly basis.
The average gamer spends around 7 hours a week playing
games.
According to Sony they had sold 91.6m PS4 units between
2013 and 2019; whilst there were 876m games for the PS4
sold. This equates to around 9-10 games sold per console; and
the average age of a console is maybe 3-5 years. Thus we can
assume the average person buys around 2-3 games a year.
Let us assume 2.5 games a year at $50, and one console every
5 years at $300. This equates to $0.51 per hour.
Let us compare to cable or streaming. The average household
has 2.6 streaming platforms, and that costs $14pcm (Netflix
current price). Whilst the average household watches 3 hours
of television per day it is hard to attribute all that to streaming
as even a complete cord-cutter may watch free-to-air news.
Hence we have assumed two hours a day of television (for
both cable and streaming). And for cable we have assumed a
cost of $50pcm.
We can argue the toss over several of these inputs, however
the point remains that gaming is a very cheap form of
entertainment. Not only that it is probably the most engaging
form of entertainment.
As a result of this we believe that it is higher under-monetised
and could benefit from price increases, as well as further
monetisation from advertising.
The other benefit from having excellent customer economics
is that the price elasticity can really help with volume growth.
COMPANY QUALITY
RETURNS
This is a high return, high margin business
With excellent Free Cash Conversion

137WWW.SUMZERO.COM
The company has also rewarded shareholders with
buybacks (as can be seen in the chart of shares
outstanding)
And the company has just recently started paying out a
dividend.
Given the high quality nature of this business, and
its economic moat, we believe that these returns are
sustainable. And we will detail later why we believe the
economics of EA to be able to improve from here.
MANAGEMENT
Andrew Wilson has been the CEO of EA for 7 years, and
prior to that he was head of EA Sports.
In that time returns have improved and acquisitions have
been small bolt-on acquisitions. That is until last week when
EA entered a competitive tender to bid for Codemasters
(CDM LN).
They produce the F1 game as well as Dirt (a rally game).
This is a natural fit into the EA Sports portfolio. It plays
absolutely to the strengths of the team in respect to
licencing etc.
Whilst entering a competing bid at 30x EBIT (2022) may
seem like an expensive acquisition there should be an
awful lot of synergies for both cost and revenues.
However, given that the acquisition represents 3.3% of EV
this is still a pretty small deal.
LEVERAGE
This company runs a healthy net cash position; whilst
there is a small amount of debt on the balance sheet that
is outweighed by the $6bn of cash (less the one and a half
for the CDM LN acquisition).
[see figure below]
HOWEVER this is a business that has a lot of fixed costs.
The result of this is that the business is operationally
leveraged.
This can clearly be seen by looking at the Margin profile of
EA and also by looking at the growth in revenue compared
with the growth in fixed costs. [see figure on following page]
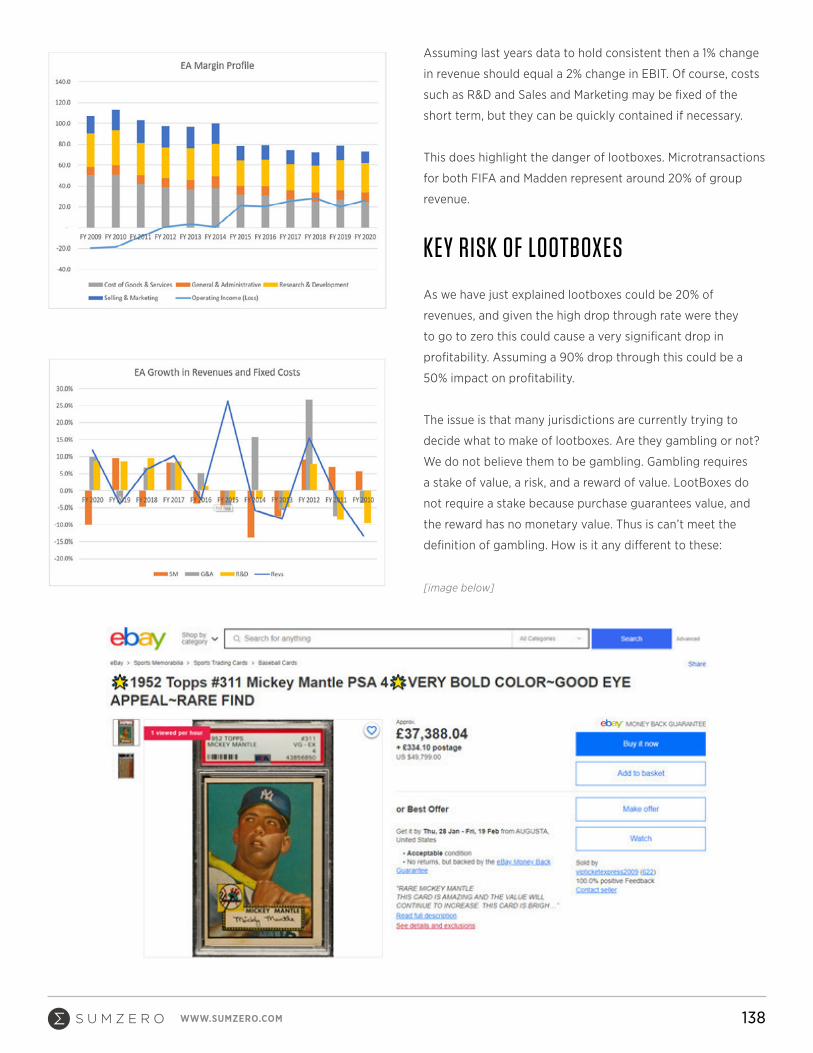
138WWW.SUMZERO.COM
Assuming last years data to hold consistent then a 1% change
in revenue should equal a 2% change in EBIT. Of course, costs
such as R&D and Sales and Marketing may be fixed of the
short term, but they can be quickly contained if necessary.
This does highlight the danger of lootboxes. Microtransactions
for both FIFA and Madden represent around 20% of group
revenue.
KEY RISK OF LOOTBOXES
As we have just explained lootboxes could be 20% of
revenues, and given the high drop through rate were they
to go to zero this could cause a very significant drop in
profitability. Assuming a 90% drop through this could be a
50% impact on profitability.
The issue is that many jurisdictions are currently trying to
decide what to make of lootboxes. Are they gambling or not?
We do not believe them to be gambling. Gambling requires
a stake of value, a risk, and a reward of value. LootBoxes do
not require a stake because purchase guarantees value, and
the reward has no monetary value. Thus is can’t meet the
definition of gambling. How is it any different to these:
[image below]

139WWW.SUMZERO.COM
The Netherlands Gambling commission has stated that
lootboxes should be illegal under gambling laws, as have
Belgium, Japan have said that SOME lootboxes COULD be
considered to be ‘prizes’.
However New Zealand has stated that virtual items of no
realisable value can not be gambling, the UK had agreed
(though are now reviewing this issue), and France has also
stated the same.
The USA is currently undergoing a review and given that
this is EA’s largest market is weighing upon the stock price.
However, these fears may prove to be unfounded.
Senator Josh Hawley (youngest senator and republican) has
brought a bill (with bipartisan support) that would seek to
regulate lootboxes. Interestingly enough, he has not gone
down the ‘gambling route’. He has instead sought to outlaw
“pay- to-win” transactions.
This, I believe, will be the downfall of this bill. Had it sought to
classify such transactions as gambling then it may be easier
to gain support of the house. However, this is a very draconian
and interventionist piece of legislation that will unlikely sit
easily in a liberal free-market country like America.
(As an aside it is the ‘pay-to-win’ nature that seems to have
people upset; though it flummoxes me as to why: Lewis
Hamilton is the best driver - but he also has a pretty good car!
it is well known in any competitive sport that in order to be
the best one needs the best equipment too. Is this really so
contraversial?)
Of course, trying to classify microtransactions as gambling
would be very difficult given the 9th circuit decision (Kater v.
Churchill Downs Inc., No. C15-612MJP, 2015 WL 9839755, at *4
(W.D. Wash. Nov. 19, 2015)) it was held that a game cannot be
gambling “due to its lack of real-world monetary capability”.
Furthermore the State of Washington has introduced
House Bill 2720 and Senate Bill 6568 which aim to protect
microtransactions and specifically exclude them from being
considered as gambling.
http://lawfilesext.leg.wa.gov/biennium/2019-20/Pdf/Bills/
House%20Bills/2720.pdf?q=20201123052103
And the Senate bill makes clear their reasoning
http://lawfilesext.leg.wa.gov/biennium/2019-20/Pdf/Bills/
Senate%20Bills/6568.pdf?q=20201218084213
As such it seems unlikely that the US will enact a full
prohibition on microtransactions, and if they do then it would
seem likely that it would be a half measure similar to the
Japanese Gacha ban which seems to have had little effect
on microtransactions. See here (https://www.eurogamer.net/
articles/2017-10-19-what-the-uk-can-learn-from-the-far-easts-
battle-with-loot-boxes)
It strikes me that the bear case here is that games are forced
to come with a “Parental Advisory” label. It seems reminiscent

140WWW.SUMZERO.COM
of the Tipper Gore’s filthy fifteen! (https://www.rollingstone.com/music/music-lists/pmrcs-filthy-15-where-are-they-now-
60601/)
IF this is the case then the economic harm to EA is likely to
be minimal given that under 18s represent around 20% of
gamers. And they are unlikely to be the big spenders on such
microtransactions.
And given that USA, whilst the largest market for FIFA is still
only 25% of FIFA we can be fairly assured that the impact will
not be that severe.
Let’s assume that microtransactions (25% of revenues) are
restricted for 35% of the world for 20% of the market (under
18s) with a 90% drop through on 35% EBITDA margins. Then
this would be less than a 5% hit to EBITDA.
This then also assumes that EA do not change their mechanics
so as to avoid any regulations. Such changes could include
disabling the ability to trade players, or removing part of the
element of surprise.
GROWTH AND ECONOMICS
TOP LINE
EA has many growth opportunities; and these here are my
growth assumptions.
10% may seem a little punchy given that the growth from the
last console cycle was 7.5% CAGR.
However, there are many reasons that I believe that the top
line should be stronger this time.
CONSOLE CYCLE
The last console cycle was in 2013 and the PS4 sold 110m units
over seven years. However analysts are figuring that the PS5
will sell 120-170m units over 5 years. That is over 50% more
per year than the last cycle. This rumour has been supported
by sources in the supply chain in this article (https://www.
digitimes.com/news/a20200727PD211.html):

141WWW.SUMZERO.COM
Covid is certainly not hurting this prediction. Not just because
more people have been at home; but also because creators
have been staying at home there will be less live music, less
movies, less competing forms of entertainment.
HARDWARE IMPROVEMENT
This is not just console hardware. But mobile.
And we are now on iPhone 12! I do not know if the 12 is 84x
faster than the 6; however we can be sure that the multiple is
still a big number.
The point of this is that EA has been underperforming in
mobile compared with console.
This is because AAA blockbuster games are best suited to
consoles, and mobiles simply have not had the power to run
AAA games.
So the big point here is just simply that as mobile computing
power catches up with consoles then EA should be able to
take much greater share. As they currently only have 1% of
the mobile market it is really not difficult to imagine them
doubling their market share in the next ten years or less.
This is especially plausible given the success they have on
other platforms especially with their licenced content.
REDUCED BARRIERS TO GAMING
Over the last ten years in order to play EA games a gamer
needed either a games console or a specced out PC. Games
Streaming has the effect of lowering the barriers to entry for
potential gamers.
By outsourcing the computing power to the cloud it means
that gamers do not need to spend that initial outlay. This will
naturally enable more gamers.
CAN FIFA OFFER EQUAL OPPORTUNITIES?
Female gaming has been growing in popularity

142WWW.SUMZERO.COM
However this does not paint the whole picture. IT would seem
according to the games ‘Trophy’ system that only 2.5% of
games played are with women’s teams.
Of course many girls could be playing mens teams; but the
opposite might be true given these statistics:
https://quanticfoundry.com/2017/01/19/female-gamers-by-genre/ (https://quanticfoundry.com/2017/01/19/female-
gamers-by- genre/
However according to FIFA (https://www.fifa.com/who-we-are/news/fifa-survey-approximately-250-million-footballers-
worldwide-88048) (the actual sport association) In 2001 20%
of the 250 million actual football players were women. And
80% of them were juniors.
Given that in England there has been a 54% increase in girls
football teams; and a 715% increase in “wildcats centres
(https://www.theguardian.com/football/2020/may/14/fa-hits-target-to-double-womens-football-participation-in-
three-years- england-gameplan-for-growth)” for girls aged
5-11.
It would seem that there is a mismatch between girls that play
football and girls that play football games; even compared
with games such as Star Wars where 29% of gamers are
girls (compared with 16% for the genre average (https://
quanticfoundry.com/2017/01/19/female-gamers-by-genre/))
2016 EA introduced female teams to the game; but only at a
national level and not at a club level. Investor Relations tell
me that so far they have not been gaining much traction. But
it strikes me that over the next ten year it is inevitable that
this number increases substantially. And that EA will have
succesfully negotiated club licencing.
Should it take another ten years, and FIFA achieves a
similar level to the Star Wars games then that would be an
incremental 2.5% growth to FIFA, which could in itself add 1%+
CAGR to EA as a group.
However these things tend to snowball, and when they take
off the growth could be more meaningful.
Furthermore looking at female purchase intent (according to
YouGov surveys) we saw an interesting spike in September,
and also levels are higher than historically, and also higher
than 2%!
PRICING
For the last 15 years computer games have been static.
According to an article by Bloomberg (https://www.bloomberg.com/news/articles/2020-11-09/game-prices-go-
up-to-70-the-first-increase-in-15-years) Nintendo set many
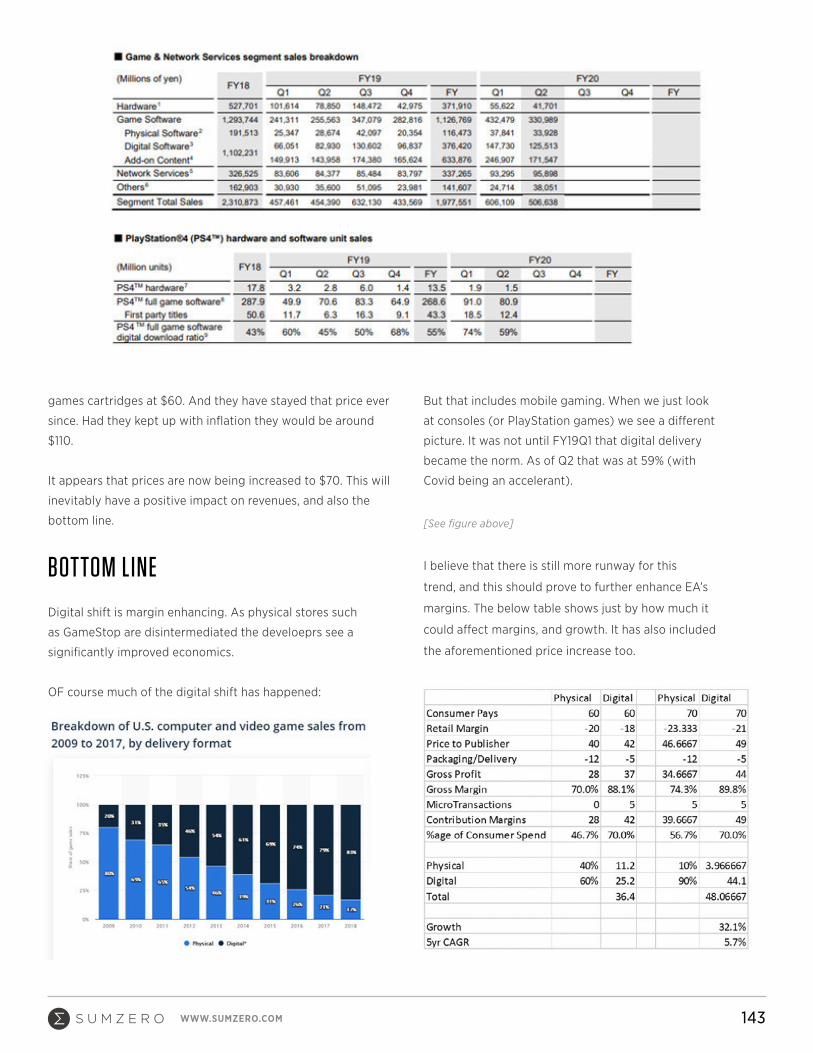
143WWW.SUMZERO.COM
games cartridges at $60. And they have stayed that price ever
since. Had they kept up with inflation they would be around
$110.
It appears that prices are now being increased to $70. This will
inevitably have a positive impact on revenues, and also the
bottom line.
BOTTOM LINE
Digital shift is margin enhancing. As physical stores such
as GameStop are disintermediated the develoeprs see a
significantly improved economics.
OF course much of the digital shift has happened:
But that includes mobile gaming. When we just look
at consoles (or PlayStation games) we see a different
picture. It was not until FY19Q1 that digital delivery
became the norm. As of Q2 that was at 59% (with
Covid being an accelerant).
[See figure above]
I believe that there is still more runway for this
trend, and this should prove to further enhance EA’s
margins. The below table shows just by how much it
could affect margins, and growth. It has also included
the aforementioned price increase too.

An exclusive database of 14K+ actionable and peer-reviewed research ideas with
complete performance attribution and firm transparency.
Real-time alerts with up-to-date commentary from sector/regional experts on
thousands of stocks and bonds uncovered by Wall Street and global banks.
Proprietary analyst rankings data, sentiment filters, private messaging, and more.
•
•
•
VISIT SUMZERO.COM ›
JOIN SUMZERO TO DOWNLOAD THE COMPLETE REPORT
WWW.SUMZERO.COM 144
OTHER ISSUES
Potential reduction in platform fee. Apple recently
reduced their platform fees from 30 to 15% for many apps
(https://www.ft.com/content/fbabedb0-3ed2-4c47-94f2-
f165bd15edb3) as the games industry consolidates they
will gain power of the platforms. And some (EA included)
may also become the platforms themselves (EA is currently
experimenting with its own streaming service).
The move to subscription could be as powerful for EA as it
was for Adobe. This could be especially potent given their
high sales and marketing spend.
e-Sports is obviously another massive source of optionality. I
have not addressed this issue yet because it is not important
to my investment case; and it is pure speculation as there is
simply not enough evidence for me to make this my case for
owning EA.
That being said, I am very happy to have such optionality.
And it could be big. We just have to look at the revenue per
view amongst other sports to start dreaming of what could
happen...
VALUATION
On a very simplistic basis this is a business that trades at
around a 5% FCF yield, and can grow FCF at at least 10% for
the foreseeable future. This should provide an IRR of around
15% - which in a zero interest rate environment should be
valued at infinity! ;)
Alternatively, please see my attached DCF. I have used three
scenarios. The first being my base case which gives us 65%
upside and a target price of 231.2
My bull case (which has revenues growing at 10% to 2025) and
also has a full margin uplift has 130% upside.
For the bear case I have imagined fixed costs remain fixed,
and COGS fall 5% whilst revenues fall 25%. This is to try
and simulate what might happen if LootBoxes are forcibly
removed. It then takes until 2025 for earnings to recover to
2020 levels in this scenario. In this fairly extreme scenario
there is only 20% downside.
Of course if this does happen I expect the stock to over-react
just a little bit.

145WWW.SUMZERO.COM
Airbus Se Ord
L O N G
Airlines need to replace 3K+ single-aisle planes that are parked and will
be retired. Airbus’ A320 program will take share from 737s and yield 30-
40% higher profit per aircraft post-COVID.
TIMEFRAME
2-5 YearsSITUATION
ValueMARKET CAP
67.7B USD
About Morgan Housel
Falcon Edge Capital is a diversified global alternative asset manager with about half of the AUM is managed in a global long/short equity strategy. In public markets portfolio, Falcon Edge Capital typically has several “core” concentrated high-conviction positions and uses hedges to manage risk.
About Falcon Edge Capital
I’m an Investment Analyst at Falcon Edge Capital, a long/short equity hedge fund based out of NYC. I work on global investment opportunities across several sectors. I typically focus on situations where I find a clear reason for a stock price dislocation and a possible catalyst. Prior to joining Falcon Edge, I worked as an Analyst at Caro-Kann Capital, where I focused on equity event-driven investment opportunities globally. I graduated with an MBA degree and concentrations in Analytic Finance and Economics from The University of Chicago Booth School of Business. I’m also a CFA and CAIA charterholder.
About Evgeny Vostretsov
FINALIST
Idea Posted: 12/13/2020
Asset: Equity
Idea Updated: 12/17/2020
Symbol: AIR.PA
RETURN TO DATE:
-2.3%
EXPECTED RETURN:
99.78%
Evgeny VostretsovBADGES:Analyst at Falcon Edge Capital
Large/Mega Caps
CURRENT RANKING: #15 All-Time
9 30

146WWW.SUMZERO.COM
Asset Class: Equity Symbol: AIR.PA Updated: 12/17/2020 Submitted: 12/13/2020
Airbus Se Ord
BY:
CURRENTLY AT:
Evgeny Vostretsov
Airlines need to replace 3K+ single-aisle planes that are parked and will be
retired. Airbus’ A320 program will take share from 737s and yield 30-40%
higher profit per aircraft post-COVID.
ASSET CLASS:
EquitySITUATION:
ValueTARGET ALLOCATION:
10%+CATALYSTS:
N/A
TIMEFRAME:
2-5 Years
EXPECTED RETURN
TARGET PRICE
INITIAL PRICE
99.78%
180.00 EUR
92.19 EUR
Pricing & Return Details LO N G
ELEVATOR PITCH:
• Deliveries of new narrow-body airplanes are likely to
be higher that the market estimates now because 3K+
narrow-body airplanes are likely to never fly again in a
post COVID world.
• Airbus should take market share from Boeing in narrow-
body market because Airbus has a better narrow-body
product.
• Airbus will have significantly higher profit per airplane in
2023 compared to that in 2019.
Airbus has 100%+ FCF Yield and P/E on 2024 estimates.
COMMERCIAL NARROW-BODY AIRPLANE DELIVERIES ARE LIKELY TO EXCEED MARKET EXPECTATIONS
Airline passenger traffic is expected to recover to 2019 level
roughly around 2024. Domestic traffic is expected to recover
faster than transcontinental traffic. It means that traffic on NB
airplanes will recover a little faster.
I focus my discussion on narrow-body market starting from
here because Airbus’ narrow-body program, A320 family,
largely determines the profitability of the whole company.
INVESTMENT THESIS
Falcon Edge Capital
BADGES:
CURRENT RANKING: #15 All-Time
9 30

147WWW.SUMZERO.COM
I focus my discussion on narrow-body market starting from
here because Airbus’ narrow-body program, A320 family,
largely determines the profitability of the whole company.
Airlines would need to have at least the same size of NB
fleet as they had in 2019. Before COVID, active commercial
narrow-body airplane fleet was ~18K aircraft. Now only ~12-
13K of these airplanes fly. There are only two ways to satisfy
the requirements for the fleet in 2023-2024: (1) re-introduce
parked airplanes back into the fleet or (2) take deliveries of
new airplanes.
Airlines are likely to retire airplanes that are not being flown
for several months, yet alone for couple of years. Here is why:
• The option of bringing an old airplane is not great and is
expensive
° It is expensive to keep an airplane in airworthy
condition if it is not flying and generating revenue.
• The maintenance checks must be performed at
the specific age intervals even when airplane
is not flown. Heavy maintenance checks on
airframe and engines are typically performed
every 5-6 years, although this interval has
become a bit longer for airplanes made in the
recent years. Cost of a heavy check and engine
overhaul for a narrow body aircraft runs in a
range of ~$2m for airframe and $3.5-5m for each
engine.
• => Airlines would not perform such
maintenance of the airplane that does not fly
and generate revenue.
° Bringing back an airplane that was not properly
maintained is expensive and can be unsafe.
• All the maintenance that was skipped would have
to be performed. After a long time in storage it
is likely to be both airframe checks and engine
overhauls.
• An airplane after a long storage would require
very thorough check of all systems even if it was
not yet time for some of such checks because
otherwise if might not be safe to return it to
service. Once even a minor issue found during
such check it needs to be fixed even if otherwise
airplane could have safely flown for years until a
major check before it is found. It created a risk
of additional costs that an airline cannot predict
before it commits to sending an aircraft for
maintenance.
• Additionally, airlines “manage green time” of
the engines, i.e. if an airline has an airplane that
requires engine maintenance but not any heavy
airframe maintenance, airlines will swap engines
from one of the parked airplanes. Such practice
allows an airline to save cash on maintenance.
Therefore, an airplane that was parked for long
time is likely to be stripped of engines and
possibly some other parts that would need to be
reinstalled before an airplane can fly again.
Feedback from industry experts who manage
fleets at airlines and aircraft leasing companies
suggests that smaller versions of airplanes (A319,
737-700) are likely be donors of engines, so that
even a 10+ years old airplanes can be stripped of
engines and retired.
• => In any case, at is likely to cost $12-15mm
of cash upfront to bring the airplane back.
However, an airline will still end up with an old
airplane that is less fuel-efficient and more
expensive to maintain.
° Alternative is too good:
• An airline can get a sale-leaseback deal on a new
aircraft. The airline typically would be able to
unfreeze the capital tied up in the pre-delivery
payments that it made for the aircraft.
• A new aircraft is on warranty for the first 5 years,
so it does not require any maintenance costs. It

148WWW.SUMZERO.COM
is also at least 15%+ more fuel efficient than the
aircraft it replaces.
• Old aircraft airframe and engines can later be
monetized once the market for used serviceable
material comes back.
• => this alternative is both (1) good for an
airline’s current cash position and (2) allows
the airline to have newer equipment and hence
lower costs per seat-mile post COVID.
Therefore, unless an older airplane had the major maintenance
and engine overhaul just recently before COVID, it is likely to
be parked for a long time and eventually retired.
We can expect ~3,000+ of airplanes to be retired. There are
several ways to get to this number:
• One top-down way to estimate it is:
° ~6K airplanes that will be 15+ years by 2023
° Major maintenance is due every 5-6 years.
° => about half of these airplanes are likely to require
significant maintenance within 2-3 years. These are
the ones that are likely to be parked and eventually
retired.
• Another way is to look at the data:
° Currently, 5,000+ narrow-body airplanes are parked
and 4,000+ of them have not flown for >3 months.
° It compares to <2,000 parked in the beginning of
2020, during low season.
° Of the 4,000 that are not flown, most will likely not
fly again. If an airline intends to retain an airplane in
the fleet, the airline will typically fly it 1-2 times every
1-2 weeks.
° => Up to 4,000+ are likely to be retired.
Consensus (compiled by Visible Alpha) implies ~2,100
deliveries of NB airplanes from the beginning of the pandemic
and before 2023. Consensus implies that 3,000 deliveries of
narrow after the beginning of the pandemic will happen only
by early 2024.

149WWW.SUMZERO.COM
AIRBUS HAS THE BEST NARROW-BODY PRODUCT AND IS IN POSITION TO MAKE AIRLINES TAKE DELIVERIES
Airbus is likely to take larger share of market in narrow-body
segment. Airbus A321, the larger aircraft in A320 family,
is a superior product that provides better economics for
the airlines. That is especially true for the LR, long-range,
and XLR, extra-ling-range, versions. Boeing does not have
a product that could be a rival. 737-Max-8 variant offers
competitive economics for short-haul missions, but 737-
MAX cannot offer that for longer-range missions. That is an
objective advantage that is separate from the question of how
much the safety and negative publicity of 737-Max will be an
issue in the long- term.
In a world where there is less transcontinental travel, A321xlr
can serve a long-haul mission with narrow-body economics.
The very same airplane can be used on a busy short-haul
line that requires a larger narrow-body. The only small
disadvantage of using an XLR on a short mission additional
weight of extra fuel tanks that would be left empty. A321xlr
provides necessary flexibility of missions and is well-suited for
a post-pandemic world.
Airbus has a much better starting position to negotiate the
timing of deliveries with the airlines. For the airline industry
and specific airlines, it is much easier to walk away from
Boeing 737-MAX deliveries because the deliveries are delayed
already by more than a year. 12 months of delay of a delivery
allows an airline to cancel the delivery without any penalties.
In case of Airbus that did not have such delays, airlines cannot
just walk away. Airbus has collected pre-delivery payments
and legally could retain those if an airline does not take
delivery.
Obviously, Airbus does not want to destroy the relationships
with customers, so it allowed deferrals of deliveries. The catch
is that if an airline wants to defer deliveries it will move the
whole skyline of deliveries to the right. Additionally, Airbus
cannot give any airline all the delivery it wants just in 2023
or 2024 when the traffic is expected to recover. Hence, if you
are an airline and you need new airplanes by 2023-2024 you
have to take them gradually throughout 2020-2024. This way
Airbus secured its delivery skyline even for the years of low
traffic.
AIRBUS WILL HAVE HIGHER PROFIT PER NARROW-BODY AIRPLANE IN 2024 THAN IT HAD IN 2019
There are several key reasons why profit per aircraft would
significantly improve in Airbus’ A320 program between 2019
and 2024 from ~EUR 12-13mm (based on EBIT before R&D) to
~EUR 17m.
• In 2019, Airbus was still delivering A320 CEO (conventional
engine option, an old version).
° These we ~15% of deliveries in 2019. Neos would bring
~EUR 1.5mm more margin.
° => ~EUR 0.2mm avg. margin impact.
• In 2019, only ~30% of delivered A320 airplanes were A321s
and in 2024 at to 50% can be A321s.
° A321 is essentially the same plane with the same
equipment and engines but longer body and more
seats so it is priced higher. That brings at least ~EUR
2-3mm per airplane
° => ~EUR 0.5mm avg. margin impact.
• Up to half of A321s can be XLRs. That is up to 25%
° XLT does not have any direct competition, so likely
can bring up to additional EUR 5mm of margin over a
standard A321.
° => ~EUR 1.2mm avg. margin impact.
• Airbus has taken steps to resolve previous production
issues. Optimization can save up to EUR 1B in run-rate
costs once all the A320 facilities come back to scale.

150WWW.SUMZERO.COM
° => ~EUR 1.5mm avg. margin impact.
• Operating leverage will contribute the rest
° When the traffic recovers, Airbus would necessarily
be at a higher production rates in A320 program than
it had in 2019
° When the airline industry fleet size comes back to
pre-COVID level it would need approximately the
same # of airplane for growth as it needed in 2019
but Airbus will have higher market share because of
its superior product.
° Spreading the fixed costs of A320 program over
5-20% more airplanes.
° => ~EUR 0.5–1.5mm avg. margin impact.
VALUATION ON 2024 ESTIMATES
Airbus can be delivering ~70 A320s per months in 2024:
• Assumption: traffic and active fleet of narrow-body
airplanes comes back to 2019 level and 5% long term traffic
growth from that level. In other words, it’s an L-shaped
recovery ~15-18% below previous trajectory.
• NB traffic continues to grow a little faster, giving this
market additional 100 bps of growth.
• Retirements will be lower than normal because of the
wave of retirements in 2020-2024. Assume ~1% of fleet in
retirements compared to normal 2-3%
• => ~1260 NB airplanes per year.
• Assuming Airbus takes 2/3 of this market, it will deliver
840 airplanes, or 70/month.
2024 EBIT assumptions:
• With 840 deliveries and EUR 17mm on EBIT per airplane
we get EUR 14.3B of EBIT from A320 program.
• I assume that WB programs (A330 and A350) are back to
breakeven or small profit. A220 program should be close
to breakeven or turning to profit around 2024. Services
continue bringing ~EUR 0.2B. I assume R&D expense of
EUR 3B in 2024.
• I assume EBIT of Airbus Defense, Helicopters, Corporate
and HQ expenses, as well as FX to be in line with
consensus estimates.
• => it brings be to EUR 12.7B of EBIT for Airbus.
That’s about EUR 9.0-9.2B of Adj. Net profit. It implies ~EUR
11.7 of Adj. EPS. It puts Airbus on 7.9x 2024 P/E.
As Airbus continues to amortize the equipment and tooling
and collecting PDPs (Pre-delivery payments) on growing
deliveries, it can translate to ~EUR 10B+ of FCF (before
customer financing and M&A). It implies ~EUR 12.8 of FCF/
share. It puts Airbus on 13.8% 2024 FCF yield today.
Pre-COVID of ~18x P/E and 7% FCF Yield give the price target
of EUR 180-210 in 2-3 years.
RISKS:
• Trajectory and timing passenger traffic recovery is a risk
factor.
° Given the roll-out of several vaccines in 2021, we can
expect the pandemic to be under control by the end
of 2021 or beginning of 2022.
° Therefore, expectation of short-haul traffic recovery
in 2023 and transcontinental traffic in late 2024 or
2025 seems reasonable.
• A new R&D cycle by the OEMs
° Airplanes are designed with the specific power plant
design in mind.
° Therefore, in absence of new engine technology
it does not make sense for Boeing to start a new

An exclusive database of 14K+ actionable and peer-reviewed research ideas with
complete performance attribution and firm transparency.
Real-time alerts with up-to-date commentary from sector/regional experts on
thousands of stocks and bonds uncovered by Wall Street and global banks.
Proprietary analyst rankings data, sentiment filters, private messaging, and more.
•
•
•
VISIT SUMZERO.COM ›
JOIN SUMZERO TO DOWNLOAD THE COMPLETE REPORT
WWW.SUMZERO.COM 151
program that would risk being outdated soon after
entrance to service. Even if such program would have
started, it would take 7+ years to begin deliveries.
° The risk is a very remote possibility at this point.
We are likely to see new engine technology being
developed before this risk becomes an issue at all.
• Capital allocation by Airbus is another risk. Airbus can be
influenced by European governments to deploy capital in
pursuing projects that can prove value-destructive.
° At this point, it is a remote possibility because Airbus
is getting government funding for projects such as
new fuel airplanes rather than is made to allocate
capital towards that.
° That is an item to watch on Airbus in the long-term.

152WWW.SUMZERO.COM
GoodRx Holdings, Inc. Class a
L O N G
Prescription drug savings platform building the front-door to healthcare.
Amazon’s entry has created a compelling entry point as user growth
begins to normalize post-reopening.
TIMEFRAME
1-2 YearsSITUATION
GrowthMARKET CAP
N/A
About Morgan Housel
Luca Capital manages fundamental, long-only equity portfolios with the goal of providing net returns above the general market over the long-term by investing in leading companies in industries with high secular growth. It concentrates in its highest conviction ideas, typically holding 10-15 positions.
About Luca Capital, LLC
Richard Chu is an Analyst at Luca Capital, LLC, an investment firm that manages separate accounts for clients and the parent company of Saga Partners, LLC. You can find him on Twitter @richard_chu97. Prior to joining Luca Capital, Richard worked as a technology consultant at EY. He graduated with a BComm from Queen’s University in Canada in 2019.
About Richard Chu
FINALIST
Idea Posted: 12/14/2020
Asset: Equity
Idea Updated: 12/17/2020
Symbol: GDRX:US
EXPECTED RETURN:
38.47%
Richard ChuAnalyst at Luca Capital, LLC
Large/Mega Caps
RETURN TO DATE:
-3.73%

153WWW.SUMZERO.COM
Asset Class: Equity Symbol: GDRX:US Updated: 12/17/2020 Submitted: 12/14/2020
GoodRx Holdings, Inc. Class a
BY:
CURRENTLY AT:
Richard Chu
Prescription drug savings platform building the front-door to healthcare.
Amazon’s entry has created a compelling entry point as user growth begins
to normalize post-reopening.
ASSET CLASS:
EquitySITUATION:
GrowthTARGET ALLOCATION:
5% - 10%CATALYSTS:
N/A
TIMEFRAME:
1-2 Years
EXPECTED RETURN
TARGET PRICE
INITIAL PRICE
38.47%
60.00 USD
45.01 USD
Pricing & Return Details LO N G
• GoodRx is a health tech company focused on making
healthcare affordable through its prescription drug
pricing comparison and savings platform and its
telemedicine offering
• They are the category leader in a massive, untapped
market with over 4.9M monthly active consumers
• Their competitive position is secure as they continue
to gain bargaining power over PBMs with scale and
source cheaper pricing through data network effects
• Amazon’s entry has created a compelling entry point
as user growth begins to normalize post-reopening
INTRODUCTION
Why do Americans spend twice as much per capita
on healthcare compared to citizens from other OECD
countries but rank among last in numerous quality of
care rankings such as obesity or chronic disease? Why
is it that affordable healthcare coverage still remains out
of reach for over 10% of Americans, which led to ~66% of
all personal bankruptcies between 2013 and 2016? Why
should 64% of Americans make the decision to risk their
health by avoiding or delaying medical care because of
the cost?
INVESTMENT THESIS
Luca Capital, LLC

154WWW.SUMZERO.COM
Doug Hirsch and Trevor Bezdek asked themselves the same
questions and founded GoodRx as the answer. Today, 4.9 million
Americans a month rely on GoodRx in order to find affordable
healthcare and it has saved a cumulative $25 billion since 2011.
When 70% of consumers still do not know that they can price
shop for their prescriptions, I think GoodRx is just getting
started.
BUSINESS
GoodRx started out as a price comparison tool for prescriptions
and that remains at the core of what they do today (~90% of total
revenues); however, they’ve been able to leverage the dominance
they’ve achieved in this market to expand into adjacencies
including subscriptions, pharmaceutical manufacturer solutions,
and telehealth. [See image below]
PRESCRIPTIONS
Through GoodRx’s app or website, consumers access coupons or
sign up for a discount card which significantly reduces their cost
of medication (average discount to list price is >70%). GoodRx
claims that consumers are 50-70% more likely to afford and fill
a prescription and thus follow through with their prescribed
treatment plan due to its offering.
Through GoodRx’s app or website, consumers access coupons
or sign up for a discount card which significantly reduces their
cost of medication (average discount to list price is >70%).
GoodRx claims that consumers are 50-70% more likely to
afford and fill a prescription and thus follow through with their
prescribed treatment plan due to its offering.
In order to understand where these cost savings come from,
we need to take a step back and understand how drug pricing
works. Pharmacies establish Usual and Customary (U&C)
prices for prescriptions which is the price that uninsured
consumers are asked to pay. These often differ dramatically
between pharmacies and are usually significantly inflated.
Pharmacies do this because they have contracts with
Pharmacy Benefit Managers (PBMs) which themselves help
insurance companies manage drug costs.
In these contracts, PBMs agree to pay the pharmacy the lesser
of (http://www.thethrivingpharmacist.com/2016/11/27/the-
art-of-the-claw-back/):
1. The Average Wholesale Price (AWP) minus a
percentage plus a dispensing fee
2. The Maximum Allowable Cost (MAC) plus a
dispensing fee
3. The pharmacy’s U&C price
Source: GoodRx Investor Presentation (https://investors.goodrx.com/static-files/271f2a2f-3bb5-4a77-8292-047ab8853cc2)

155WWW.SUMZERO.COM
AWP is the price that the pharmacy pays to buy the
drug from the wholesaler plus a markup of usually
around 20%. MAC is the maximum price that a PBM
will pay for generic drugs or brand name drugs with
generic versions available. PBMs have free reign over
determining these prices, thereby forcing pharmacies
to acquire drugs at more favourable prices, while using
another higher set of prices when they sell to their
clients, pocketing the difference. This leads to artificially
high U&C prices which have to be set above the
maximum allowable reimbursement from any payer so
as to not potentially miss out on profits.
[see image below]
Since the PBM industry is itself disjointed with multiple
MAC lists each with different drugs and prices, it
becomes impossible to adjust U&C prices slightly above
every single MAC price. Thus, if a pharmacy wanted to
be competitive in the cash market, they would need
to sacrifice their reimbursement margins which is a
terrible trade-off as it forms the vast majority of their
revenue, and PBMs are incentivized to lower MAC
further overtime which further makes such a strategy
untenable.
So, with that in mind, PBMs are able to negotiate
“discounted pricing” via their MAC lists which end
up being significantly lower than U&C prices. The
pharmacies that are under the PBM’s network accept
these prices to access the plan’s members. GoodRx
partners with PBMs like Express Scripts and OptumRx
that share their negotiated rates. For uninsured
consumers, the value proposition is clear as they are
no longer forced to pay the artificially high U&C prices.
For insured consumers, which form ~74% of GoodRx’s
userbase (34% Medicare, 4% Medicaid, and 36%
commercial), since MAC rates can vary dramatically
across PBMs, 40% of the time for the top 100 drugs,
GoodRx is cheaper than insurance co-pays. In both of
these cases, PBMs benefit from accessing previously
out-of-reach uninsured consumers as well as saving
money by having consumers pay the entire cost out-
of-pocket. The pharmacy collects a per-prescription
fee which is paid to the PBM which then shares it with
GoodRx for finding the customer, leading to a take
rate of 14-15% on generics. This has steadily increased
as more volume is transacted through GoodRx, and I’d
expect this rate to continue to remain stable as there
are no competitors that come close to GoodRx’s scale.
Source: GoodRx Investor Presentation (https://investors.goodrx.com/static-files/271f2a2f-3bb5-4a77-8292-047ab8853cc2)

156WWW.SUMZERO.COM
Each day, GoodRx aggregates 150 billion prescription data
points from PBMs, pharmacies, pharmaceutical manufacturers,
patient assistance programs, and Medicare to always find the
best prices for consumers. GoodRx’s first-to-scale advantage
is a big moat here, since they maintain the largest database
of pricing information, they are able to consistently find
lower prices than competitors which in turn, attracts
more consumers and more PBMs, which contribute more
data to drive lower pricing.
Source: GoodRx Investor Presentation (https://investors.goodrx.com/static-files/271f2a2f-3bb5-4a77-8292-047ab8853cc2)
Source: GoodRx Investor Presentation (https://investors.goodrx.com/static-files/271f2a2f-3bb5-4a77-8292-047ab8853cc2)

157WWW.SUMZERO.COM
The value proposition to the consumer is clear, they are able
to easily compare prices across over 70,000 pharmacies
(nearly all in the US) and access GoodRx coupons for free
through its user-friendly platform. Once a code is used, it’s
registered in the pharmacy’s database and is automatically
applied for future refills and in many cases, additional
prescriptions. This introduces predictability to GoodRx’s
revenue base as over 80% of its transactions are from repeat
activity (majority of prescriptions are for chronic medication)
as well as driving future business to the pharmacy. GoodRx
boasts an incredible NPS of +90 with consumers.
The benefit to PBMs is also evident as GoodRx is oftentimes
their only significant direct-to-consumer channel, where they
offer their network rates to GoodRx’s userbase and earn a
share of the per-prescription fee. As a result, GoodRx has
never lost a PBM client.
GoodRx claims to benefit pharmacies by reducing the 20-
30% of prescriptions written that are not filled due to cost,
and increasing foot traffic and the likelihood of consumers
purchasing high margin non-pharmacy items. Although
in practice, pharmacies’ margins get squeezed and even
turn negative in some cases, and they are forced to pay the
administrative fee per transaction when the customer may
have visited their pharmacy regardless. This has led some
pharmacies to attempt to disintermediate GoodRx by offering
the discounted price directly to consumers through local
coupon programs and not paying the fee. However, their PBM
contracts forbid this, and it’s hard to see this taking off at a
widespread level before PBMs intervene; ultimately, it’s the
PBMs and GoodRx that have the bargaining power because
they control the demand. This also seems to mostly happen at
independent pharmacies, which form around 37% of the total.
SUBSCRIPTIONS
Another area where both pharmacies and GoodRx benefit
is in driving repeat visits with GoodRx even partnering with
Kroger, the fourth largest US retail pharmacy chain, to provide
co-branded subscription products such as Kroger Rx Savings
Club. Consumers pay an annual fee of $36 for individuals and
$72 for families which is shared with GoodRx and they can
access even lower prescription prices at all Kroger locations
including over 100 common generics for free. GoodRx also
partners with pharmacies to drive increased flu vaccinations
which they’ve expanded from two to eight chains this year.
Source: GoodRx Investor Presentation (https://investors.goodrx.com/static-files/271f2a2f-3bb5-4a77-8292-047ab8853cc2)

158WWW.SUMZERO.COM
GoodRx also offers their own subscription savings program
called GoodRx Gold where frequent users of the app can
again pay a $6 monthly fee for individuals and $10 for
families to get over 1,000 prescriptions for under $10,
as well as other features like free mail order delivery,
refill reminders, and price alerts. These customers are
substantially more profitable than prescription consumers
with two times the revenue contribution in year one and the
amount of subscribers has grown 15x from the end of 2018
to June 30, 2020.
PHARMACEUTICAL MANUFACTURER SOLUTIONS
GoodRx is increasingly moving into brand medications
which formed 80% of prescription spend in 2019 by
partnering with pharmaceutical manufacturers that pay
them to integrate their affordability solutions such as co-pay
cards, patient assistance programs, and more for brand
medications. Since brand medications are around six times
more expensive as generics and coverage is complicated,
GoodRx is an important channel to reach consumers as
brand drugs form 20% of searches on its platform. It is
reasonable to expect a lower take rate, however, as margins
on brand medications are significantly lower than generics.
TELEHEALTH
This is all great but as with every DTC business, acquiring
consumers cost-effectively is a challenge as CAC will
continue to rise over time and Google becomes the real
winner. However, GoodRx is able to circumvent traditional
marketing channels and acquire customers at a fraction
of the cost that other DTC digital health companies
like Hims & Hers do by partnering with providers. In a
recent survey, GoodRx found that 68% of providers have
recommended GoodRx to their patients and 17% of its
website visitors are healthcare professionals. Improving
affordability leads to improved medication adherence which
leads to better outcomes and lower overall costs. Non-
adherence is estimated (https://www.sec.gov/Archives/
edgar/data/1809519/000119312520234662/d949310ds1.
htm#rom949310_11) to result in a patient death every four
minutes in the US and can cost up to $300 billion per year
in incremental healthcare expenses. When consumers use
GoodRx, they are 50-70% more likely to afford and fill a
prescription and thus follow through with their prescribed
treatment plan, which reduces the burden on health
systems and emergency rooms, so providers are very
happy to recommend GoodRx and have an NPS of +86.
In order to facilitate this, GoodRx provides physical cards
for in- office use and launched a GoodRx Pro app (has an
App Store rating of 4.8/5.0) for healthcare professionals
to facilitate electronic prescriptions. GoodRx also works
with leading electronic health record (EHR) providers
to integrate its pricing tool directly into prescribing
workflows.
This win-win-win for consumers, PBMs, and providers has
culminated in an unmatched value proposition that has
propelled GoodRx to become the second most popular
medical app on the App Store, a testament to being
the “front door of healthcare”. Furthermore, GoodRx
is increasingly leveraging this massive userbase by
expanding into adjacent markets. One such example is
their foray into telemedicine in 2019 with their acquisition
of HeyDoctor. Customers are paired with either an in-
house provider or one from the various physician networks
that GoodRx contracts with who cover 25 conditions
with visits starting at $20 across all 50 states. Recently,
GoodRx paired their prescription offering with HeyDoctor
to offer discounted prices on drugs that can be fulfilled
either through mail order (processed by a third-party
partner) or a retail pharmacy. Since launching this feature,
10% of HeyDoctor consumers have taken advantage
of GoodRx codes and there is room to grow as 20% of
consumers who search for medication on GoodRx do not
have a prescription. This direct-to- consumer telemedicine
offering competes directly with digital pharmacies
like Hims & Hers and Ro, as well as larger telemedicine
companies like Teladoc or Amwell. Although HeyDoctor
only sees a fraction of the visits that established
competitors do, it has been growing significantly faster,
demonstrating the value of GoodRx’s unique position as
the leading prescription drug price comparison platform.
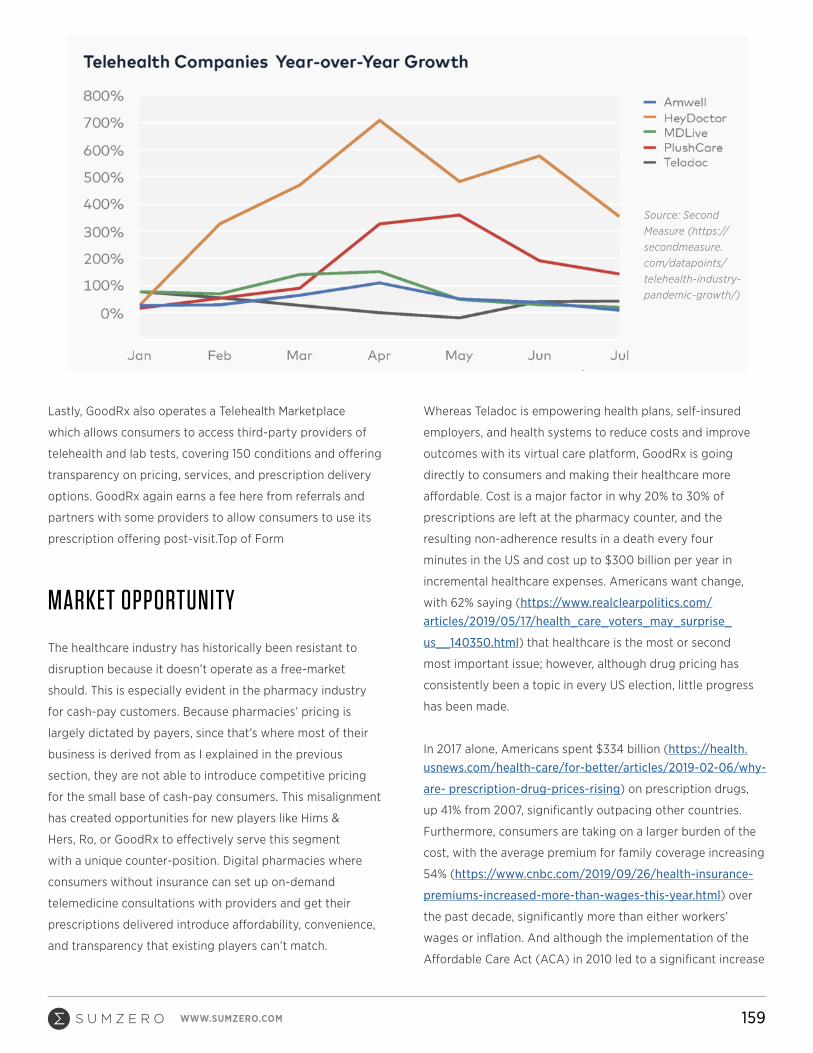
159WWW.SUMZERO.COM
Lastly, GoodRx also operates a Telehealth Marketplace
which allows consumers to access third-party providers of
telehealth and lab tests, covering 150 conditions and offering
transparency on pricing, services, and prescription delivery
options. GoodRx again earns a fee here from referrals and
partners with some providers to allow consumers to use its
prescription offering post-visit.Top of Form
MARKET OPPORTUNITY
The healthcare industry has historically been resistant to
disruption because it doesn’t operate as a free-market
should. This is especially evident in the pharmacy industry
for cash-pay customers. Because pharmacies’ pricing is
largely dictated by payers, since that’s where most of their
business is derived from as I explained in the previous
section, they are not able to introduce competitive pricing
for the small base of cash-pay consumers. This misalignment
has created opportunities for new players like Hims &
Hers, Ro, or GoodRx to effectively serve this segment
with a unique counter-position. Digital pharmacies where
consumers without insurance can set up on-demand
telemedicine consultations with providers and get their
prescriptions delivered introduce affordability, convenience,
and transparency that existing players can’t match.
Whereas Teladoc is empowering health plans, self-insured
employers, and health systems to reduce costs and improve
outcomes with its virtual care platform, GoodRx is going
directly to consumers and making their healthcare more
affordable. Cost is a major factor in why 20% to 30% of
prescriptions are left at the pharmacy counter, and the
resulting non-adherence results in a death every four
minutes in the US and cost up to $300 billion per year in
incremental healthcare expenses. Americans want change,
with 62% saying (https://www.realclearpolitics.com/articles/2019/05/17/health_care_voters_may_surprise_
us__140350.html) that healthcare is the most or second
most important issue; however, although drug pricing has
consistently been a topic in every US election, little progress
has been made.
In 2017 alone, Americans spent $334 billion (https://health.usnews.com/health-care/for-better/articles/2019-02-06/why-
are- prescription-drug-prices-rising) on prescription drugs,
up 41% from 2007, significantly outpacing other countries.
Furthermore, consumers are taking on a larger burden of the
cost, with the average premium for family coverage increasing
54% (https://www.cnbc.com/2019/09/26/health-insurance-
premiums-increased-more-than-wages-this-year.html) over
the past decade, significantly more than either workers’
wages or inflation. And although the implementation of the
Affordable Care Act (ACA) in 2010 led to a significant increase
Source: Second Measure (https://secondmeasure.com/datapoints/telehealth-industry-pandemic-growth/)

160WWW.SUMZERO.COM
in Americans covered by insurance, that trend has reversed
in recent years. In 2019, 10.9% of Americans (https://www.kff.org/uninsured/issue-brief/key-facts-about-the-uninsured- population/#:~:text=However%2C%20beginning%20in%20
2017%2C%20the,2016%20to%2010.9%25%20in%202019.)
under 65 were uninsured, and 73.7% of them cited a lack of
affordability as the main factor.
It’s clear that Americans want solutions but awareness, in
general, has been low due to a significant lack of transparency.
As previously mentioned, according to GoodRx, 70% of
consumers do not know that the price of a prescription can
vary widely across pharmacies, sometimes by over 100 times
for the same medication! Common healthcare services and
surgical procedures can also vary greatly in price, with
differences of up to 39 times for the same service within
similar geographies. Hemant Taneja, a managing director
at the VC firm General Catalyst touches on this in his
book UnHealthcare. It’s that misalignment of incentives
where who decides the treatment, who pays for it, and
who benefits are all different. This has resulted in an
utter lack of transparency for consumers that is unique
to healthcare. Why can we price shop on Amazon for
something as inconsequential as a smartphone case
when we can’t do the same for provider visits or essential
medications?
Through its prescription price comparison tool and
telehealth marketplace, GoodRx is bringing prices down
across the board and creating the same consumer-
focused experience that we’ve come to expect in every
other industry. This is a massive opportunity no matter
how you frame it, in fact, GoodRx advertises an $800
billion TAM.
[see image below]
In reality, though, this figure seems a bit inflated as
GoodRx cannot realistically capture the entire market.
Let’s calculate the serviceable addressable market.
Source: KFF (https://www.kff.org/uninsured/issue-brief/key-facts-about-the-uninsured- population/#:~:text=However%2C%20beginning%20in%202017%2C%20the,2016%20to%2010.9%25%20in%202019.)
Source: GoodRx Investor Presentation (https://investors.goodrx.com/static-files/271f2a2f-3bb5-4a77-8292-047ab8853cc2)

161WWW.SUMZERO.COM
PRESCRIPTION OPPORTUNITY
According to CMS, the US prescription market is expected
to reach $360 billion in 2020, with an additional $164 billion
in unfilled prescriptions. However, 20% of prescription
spending was for generics in 2019. Therefore, we can imply
the generics market is worth $105 billion and brand $419
billion. It is reasonable to expect that GoodRx can capture the
unfilled prescription opportunity as it claims consumers are
50-70% more likely to afford and fill a prescription with its
platform. However, branded medications have historically only
formed 5% of GoodRx’s revenue base. Applying GoodRx’s
14-15% take rate to the $105 billion generics market leads to
a $15.75 billion opportunity. Generic spend is expected to
grow at an 11% CAGR through 2024. GoodRx also charges for
a subscription offering through GoodRx Gold, which is $5.99/
month for individuals. Since the uninsured population would
benefit the most from the discounts, let’s assume that GoodRx
can potentially capture the 28.9 million uninsured Americans,
leading to another $2.08 billion.
PHARMACEUTICAL MANUFACTURER SOLUTIONS OPPORTUNITY
Pharmaceutical manufacturers spent $30 billion (https://
apnews.com/article/f44a7baa710d458ca50edd66affc1b91)
on medical marketing and advertising in the US in 2016.
The majority of it went to health professionals in paying for
free drug samples but consumer-focused ads are growing
significantly faster, accounting for one-third of overall
spending (from 12% in 1997) or $10 billion. This is the market
that GoodRx can hope to capture.
TELEHEALTH OPPORTUNITY
It’s no surprise that telehealth has seen a significant boost
from the pandemic, with consumer adoption tripling (https://
blog.zoom.us/transforming-medical-landscape-telehealth-
before-during-after-covid-19/) from 11% in 2019 to 46% as
of April 2020. In the US, there were 879.6 million outpatient
visits in 2018, and McKinsey estimated that 24% of these visits
could be delivered virtually, leading to 211.1 million visits a
year. If we multiply that by HeyDoctor’s $35 average visit fee,
then we get a market size of $7.39 billion. It should also be
considered that GoodRx gets referral fees with its telehealth
marketplace.
This all leads us to a serviceable addressable market of $35.2
billion which is a far cry from the $800 billion TAM that
GoodRx advertises but still significantly larger than most
companies.
COMPETITION
There are numerous other prescription price comparison tools;
however, GoodRx is by far the largest with SingleCare and
RxSaver as its closest competitors. GoodRx’s dominance is
clearly evident when looking at App Store rankings: GoodRx is
second, SingleCare is 24th and RxSaver is 26th as of the time
of writing. RxSaver by RetailMeNot, like GoodRx, partners
with a number of PBMs whereas SingleCare is a wholly owned
subsidiary of RxSense. SingleCare’s vertical integration means
that they negotiate directly with pharmacies and don’t have
to share their fee with third-party PBMs; however, this also
means they only work with about half the number of PBMs as
GoodRx.
When comparing discounts for the top 10 most popular
prescription medications (https://www.goodrx.com/drug-
guide) on GoodRx in New York City, GoodRx’s pricing
advantage is clear, with lower prices than both SingleCare and
RxSaver for 6 of the top 10 drugs.

162WWW.SUMZERO.COM
There are also various PBM-owned prescription savings
programs such as Optum Perks by Optum, ReducedRx by
CVS, or InsideRx by Express Scripts, but because they are
limited to their own networks, they are not able to offer the
same levels of savings. GoodRx’s massive userbase means
they have the most bargaining power and hence can negotiate
better margins and work with more pharmacies and PBMs.
Pharmacies also compete directly against GoodRx with their
own savings programs but again, they are limited in the
discounts they are able to formally offer because lowering
U&C prices would encroach on the vast majority of their
revenue base.
In terms of its telemedicine offering, HeyDoctor did over 1,000
visits a day in Q2, which is far cry from the 2.8M visits that
industry giant Teladoc processed in the quarter. However,
GoodRx has a unique relationship with patients. On average,
Americans see their primary care physicians about four times
a year (https://www.commonwealthfund.org/international-
health-policy-center/system-stats/annual-physician-visits)
whereas they visit a pharmacy about 35 times (https://blog.prescribewellness.com/community-pharmacist-key-
medication-adherence/). The frequency at which consumers
depend on GoodRx’s app means that there is a significant
opportunity to bolt on additional offerings to become the
one-stop- shop for healthcare. I thought it was smart for them
to launch a telehealth marketplace back in March 2020 as that
industry, like with pharmaceuticals, is increasingly fragmented
with over 260 providers (https://www.beckershospitalreview.
com/lists/260-telehealth-companies-to-know-2020.html)
in the US. Consumers can depend on GoodRx to help them
parse through an increasing number of options and get
discounts on some services while telemedicine providers
see it as an important channel for customer acquisition.
I mentioned in my Teladoc thesis that I see telemedicine
largely as a commoditized service, and GoodRx’s entry will no
doubt continue to pressure per-visit margins down over time
as they’ve done with prescriptions. I believe that the larger
providers are somewhat insulated from this and especially
Teladoc with its Livongo acquisition.
Lastly, GoodRx competes against digital pharmacies. This
could be the likes of Amazon Pharmacy or Capsule which both
offer free delivery after patients send them their prescriptions
or integrated players like Hims & Hers or Ro where patients
can chat with providers and get prescriptions written for them
and regularly delivered in discrete packaging.
I think that GoodRx has a superior competitive position
vis-à-vis both of these players. Capsule delivers same day
but only in New York City, Boston, Chicago, and Twin Cities.
Hims & Hers and Ro benefit from vertical integration and
their main selling point is the convenience of seeing a doctor
via telehealth and their unique branding. However, they are
increasingly competing on price to attract customers. Ro,
for example, recently launched Ro Pharmacy which is similar
to GoodRx Gold in that consumers pay $5 per month per
medication (for over 300 generic medications in 23 states).
This is disruptive to traditional pharmacies that can’t afford to
compete on U&C pricing.
Where GoodRx wins is by offering lower prices, higher variety,
and cheaper and more sustainable CAC. Instead of building
out their own distribution networks, GoodRx can just leverage
their relationships with multiple PBMs that compete with
each other and drive down prices for GoodRx’s userbase
while offering the most diverse array of medications. They will
always have the advantage in users which they can then cross
and upsell into, aided by their provider relationships, making
for more attractive unit economics.
Amazon has made a lot of news lately (https://press.aboutamazon.com/news-releases/news-release-details/introducing- amazon-pharmacy-prescription-medications-
delivered) when they announced Amazon Pharmacy, an
extension of their 2018 PillPack acquisition, where Prime
members can now receive free two-day delivery and five-day
delivery for everyone else. They also announced a prescription
savings benefit where Prime members can save up to 80%
discounts on generics and 40% for brand without insurance
at over 50,000 pharmacies including Rite Aid, CVS, Walmart,
and Walgreens. They are partnering with InsideRx (Express
Scripts) which also works with GoodRx to provide the benefit.
The Pharmacy offering isn’t likely to affect GoodRx
significantly, as mail order only forms around 4.9% of

163WWW.SUMZERO.COM
prescriptions (https://www.politico.com/newsletters/prescription-pulse/2020/08/18/postal-service-pressure-
turns-to-prescriptions-789999). COVID-19 had some
brief impact with mail-order prescriptions rising 21% YoY
(https://www.pharmacist.com/article/mail-order-drug-
delivery-rises-during-coronavirus-lockdowns) during the
last week of March to bring their share to 5.8%, but this
bump was short-lived. People can even use the GoodRx
coupons at Amazon Pharmacy, just like at every other
pharmacy.
However, the discount card should be considered a direct
competitor. Doug tried to assuage investor concerns by
pointing out that regulations require that Amazon offer
a discount card in order to publish drug prices and its
main focus is on its mail order pharmacy. In addition,
because Amazon is only working with a single PBM, it is
unlikely they will be able to match GoodRx’s discounts in
the near term. GoodRx has access to 13 PBMs competing
against each other to offer their cash network rates so
it has a higher chance of finding cheaper prices. Retail
pharmacies and PBMs will also likely be reluctant to work
with Amazon, similar what happened after they acquired
PillPack (https://www.insurancejournal.com/news/
national/2019/09/19/540432.htm) which might push them
closer to GoodRx.
I believe the market overreacted to the announcement and
discount cards and mail order aren’t new and Amazon will
face significant hurdles in adoption with both. Although
Amazon might be able to overcome its pricing disadvantage
through its scale, it would be premature to count GoodRx out.
In the end, Amazon’s entry might just broaden the market for
everyone; Doug has previously said that their real competitor
is the 70% of consumers who don’t realize that prices differ
across pharmacies.
COMPETITIVE ADVANTAGES
1. NETWORK EFFECTS
GoodRx’s larger userbase means that they become a more
attractive partner to PBMs, which results in access to the most
data points, thereby increasing the likelihood that they will be
able to find lower prices than competitors and driving further
user growth.
The same dynamic occurs with telehealth where telemedicine
providers partner with GoodRx and increasingly compete
against each other by offering discounts to GoodRx users with
the goal of making it up with increased volume.
Source: GoodRx Investor Presentation (https://investors.goodrx.com/static-files/271f2a2f-3bb5-4a77-8292-047ab8853cc2)

164WWW.SUMZERO.COM
2. BRANDING
GoodRx is the leading prescription pricing tool in the US,
and spent $177 million in marketing last year, approximately
45.6% of total revenue. With an NPS of +90 among patients
and +86 among providers, as well as a 4.8/5.0 rating on the
App Store and Play Store over 743,000 reviews and being the
second most popular medical app, it’s clear that GoodRx has
established significant mindshare.
3. SCALE ECONOMIES
Providers actively champion GoodRx with over 68% having
recommended GoodRx before. Combined with GoodRx’s
brand and lower prices and they are able to acquire users at
a fraction of the cost as competitors with an under 8-month
payback period. Besides SingleCare and RxSaver, other
programs have struggled to get the same traction and new
upstarts would have to spend significantly on user acquisition
and subsidizing drug costs in order to match GoodRx’s value
proposition.
4. COUNTER-POSITIONING
Pharmacies cannot lower cash prices significantly without
damaging their core business, placing GoodRx in a unique
position to serve an increasing number of cash-pay patients.
FINANCIALS
GoodRx has grown revenues at a steady 57% CAGR between
2016 and 2019, driven by monthly active consumers (MAC)
and gross merchandise value (GMV) which grew at a 59% and
52% CAGR respectively. It has unheard of 95% gross margins
and is already quite profitable with adjusted EBITDA growing
at a 75% CAGR from 2016 to 2019.
GoodRx recently reported strong Q3’20 results. They
achieved $140.5 million in revenue (+38% YoY), maintained
extraordinary 94.6% gross margins, achieved a 37.8%
adjusted EBITDA margin and grew net income by 53% YoY.
Spending on sales and marketing remained consistent at
46% of revenue but an increase in R&D and G&A (mostly
due to IPO) spending led to a 460 basis point decrease
in adjusted EBITDA margin YoY. They logged a record 4.9
million monthly active consumers, up 29% YoY (MAC only
includes prescription customers).
Source: Company Filings
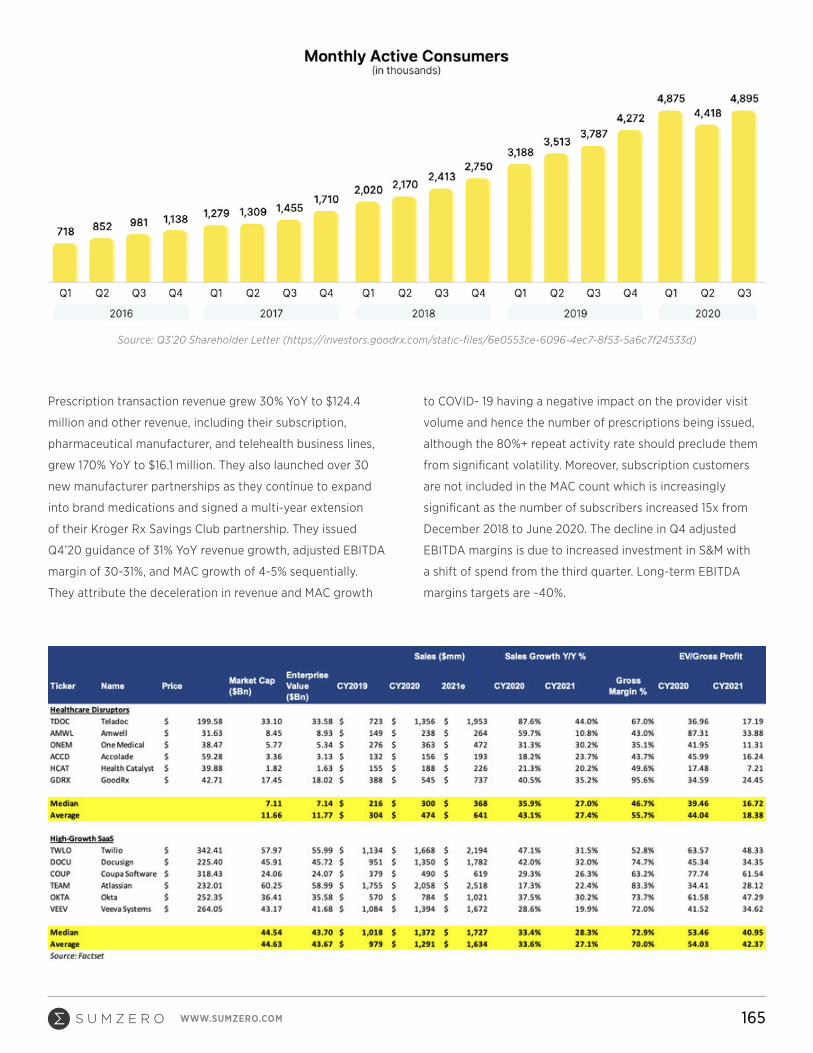
165WWW.SUMZERO.COM
Prescription transaction revenue grew 30% YoY to $124.4
million and other revenue, including their subscription,
pharmaceutical manufacturer, and telehealth business lines,
grew 170% YoY to $16.1 million. They also launched over 30
new manufacturer partnerships as they continue to expand
into brand medications and signed a multi-year extension
of their Kroger Rx Savings Club partnership. They issued
Q4’20 guidance of 31% YoY revenue growth, adjusted EBITDA
margin of 30-31%, and MAC growth of 4-5% sequentially.
They attribute the deceleration in revenue and MAC growth
to COVID- 19 having a negative impact on the provider visit
volume and hence the number of prescriptions being issued,
although the 80%+ repeat activity rate should preclude them
from significant volatility. Moreover, subscription customers
are not included in the MAC count which is increasingly
significant as the number of subscribers increased 15x from
December 2018 to June 2020. The decline in Q4 adjusted
EBITDA margins is due to increased investment in S&M with
a shift of spend from the third quarter. Long-term EBITDA
margins targets are ~40%.
Source: Q3’20 Shareholder Letter (https://investors.goodrx.com/static-files/6e0553ce-6096-4ec7-8f53-5a6c7f24533d)

166WWW.SUMZERO.COM
RISKS
GoodRx faces three primary risks: PBM concentration, margin
contraction from an increasing mix shift towards their lower
margin telehealth offering, and healthcare reform.
GoodRx’s top three PBM partners accounted for 48% of
revenue in H1’20, down from 55% in 2019 and they now
work with over a dozen PBMs in total. However, GoodRx
is a value-add for these PBMs because they can leverage
the cash-network rates they negotiate with their pharmacy
networks to access GoodRx’s userbase. Thus, there is not
much rationale not to work with GoodRx and as such, they
have never lost a PBM partner. PBMs might feel threatened
in the future, as more volumes pass through GoodRx, but
even if they do cancel their contract, GoodRx would still get
paid in perpetuity for the transactions they generate and
just divert those revenues to another PBM’s rates. In fact,
GoodRx already mix shifts between PBMs depending on
which one is most favourable to them in terms of margins
(advantage of operating in a fragmented industry and owning
the customer!). If the industries that GoodRx competes in see
increasing consolidation, it would be a threat to GoodRx’s take
rates however as suppliers gain bargaining power. At the same
time, the larger GoodRx gets, the less control any single PBM
would have over them because they would make up a larger
portion of their overall volumes.
GoodRx’s telehealth services also operate at significantly
lower contribution margins than their prescription business
(HeyDoctor at breakeven) which will pressure their margins as
it is growing significantly faster. I believe that the investment
is worth it though, as it will allow GoodRx to further monetize
their customer base and make the platform stickier for both
patients and physicians. In addition, the core prescription
business works against itself longer term, because as prices
start to come down across the board, then the need for
a GoodRx will start to diminish. The telehealth market is
developing fast and very much still in land-grab mode,
so although this will continue to be a drag on margins for
GoodRx right now, it will lead to stronger revenue growth
over the longer term. It should also be noted that telehealth
only formed ~17% of other revenues and 2% of total revenues
in H1’20 so it is very early. Contribution margins with
manufacturer solutions are also significantly higher at ~80%,
and comparable to their prescription business so how fast that
grows relative to telehealth will be important to consider.
Lastly, reform on prescription drug pricing is been a frequent
issue every election but no substantial change has been
achieved. Doug even said that he wants the government to
solve this and that GoodRx shouldn’t have to exist (https://www.protocol.com/manuals/health-care-revolution/
prescriptions-goodrx-coronavirus-interview). Medicare Part
D, which covers prescription drug costs, was enacted by
George W. Bush in 2006 and has met opposition ever since
(https://www.politifact.com/factchecks/2017/jan/17/tammy-baldwin/tammy-baldwin-federal-government-prohibited-
negoti/) because the government can’t negotiate prices with
drug manufacturers but efforts to repeal this have fallen flat.
Besides that, Trump recently signed four executive orders
(https://www.cnn.com/2020/07/24/politics/trump-drug-
prices/index.html) aimed at lowering drug prices:
1. Set Medicare reimbursement levels for certain drugs
based on the rates that other developed countries pay,
a “most- favoured-nation-price”
2. Allowing pharmacies and drug wholesalers to import
drugs from Canada where prices are lower
3. Directing Federally Qualified Health Centers to pass
along discounts on insulin and EpiPens to their patients
4. Banning drug manufacturers from providing rebates
to PBMs and insurers for people who have prescription
drug coverage under Medicare Part D and passing
those discounts to consumers directly
However, signing these orders is just the first step in
making these changes into reality, which would face intense
opposition in the courts, and even if implemented, would not
make a substantial difference in drug prices. For example,
drug manufacturers negotiate rebates with PBMs for better
coverage, with the goal of encouraging patients to choose
their brand name drugs. If the patient buys that drug, PBMs
receive a rebate which they share with insurance companies.
The proposal to ban rebates was originally dismissed because

An exclusive database of 14K+ actionable and peer-reviewed research ideas with
complete performance attribution and firm transparency.
Real-time alerts with up-to-date commentary from sector/regional experts on
thousands of stocks and bonds uncovered by Wall Street and global banks.
Proprietary analyst rankings data, sentiment filters, private messaging, and more.
•
•
•
VISIT SUMZERO.COM ›
JOIN SUMZERO TO DOWNLOAD THE COMPLETE REPORT
WWW.SUMZERO.COM 167
it would lead to higher costs for insurance companies, higher
premiums for patients, and higher Medicare spending by
the government. Furthermore, as I mentioned, branded
medications have historically only formed 5% of GoodRx’s
revenue base. Overall, significant disruption to GoodRx’s
business model is unlikely to happen in the near-term.
CONCLUSION
American healthcare has never been more unaffordable and
COVID-19 exacerbated the issue by leaving millions more
without coverage. When the government’s hands continue to
be tied as a result of political gridlock and intense lobbying by
powerful industry stakeholders against any significant change,
GoodRx has never been more important. Its business model is
a win-win-win for PBMs/insurers, healthcare consumers,
and providers and quite literally saves lives. It’s clear the
importance of this mission reverberates through the company
as well with a 4.6/5.0 Glassdoor rating (https://www.
glassdoor.ca/Reviews/GoodRx-Reviews-E1138304.htm) and
98% approval of the co-CEOs.
Doug and Trevor are on a mission to build the leading
consumer-focused digital health platform in the US. By
helping users filter PBM’s negotiated rates and telemedicine
offerings, they are putting the power back in the consumer’s
hands just like it is in every other industry and becoming the
first stop on any health journey.
Once GoodRx establishes themselves as the consumer-facing
platform where most drugs are purchased through, they will
have the pricing power to push both PBM and pharmacy
margins down and maintain a high take rate because the
alternative to not using GoodRx would be a materially higher
drug price for the consumer.

168WWW.SUMZERO.COM
SumZero is the world’s largest community of investment professionals working with the industry’s most
prominent hedge funds, mutual funds and private equity funds. With more than 20,000+ pre-screened
professionals collaborating on a fully transparent platform, SumZero provides direct access to thousands of
proprietary investment reports every year and fosters on-going communication within the network.
The research on SumZero cuts through the noise that pervades the industry and provides its community with
in-depth, actionable investment research and data. The platform further enables members to build a track record,
expand their networks in relevant capacities, and identify further professional opportunities within the industry.
SumZero offers several ancillary services in support of our research platform. These services include capital
introduction, buyside career placement, media placement and more.
ABOUT SUMZERO

169www.sumzero.com
SumZero’s carefully vetted community of members
is currently 20,000+ and growing globally. Driven
by a network effect, the community’s ongoing
growth stimulates platform interaction and
engagement - steadily building a robust collection
of data that continuously delivers value to its users.
THECOMMUNITY
WWW.SUMZERO.COM

170
SumZero provides investment professionals access to
continuous idea generation and allows them to monitor
what their peers are saying about names in which they’re
currently invested, or looking to invest in.
There is no other community-driven platform or network
from which an investment professional can derive more
direct value.
THERESEARCH
WWW.SUMZERO.COM

171
SumZero Cap Intro is a reverse-solicitation platform that
connects eligible funds with pre-qualified institutional
LPs for the mutual purpose of capital allocation. Cap Intro
is available on an opt-in basis to all hedge funds, private
equity funds, and other asset managers that are actively
fundraising.
Using Cap Intro, fund managers leverage direct exposure
to a community of more than 400 pre-vetted allocators
by presenting their strategy and performance via a self-
curated fund profile. In turn, allocators use these profiles
to discover, screen, and initiate direct conversations with
funds.
CAP INTRO
SUCCESS METRICS
While SumZero Cap Intro never
guarantees the placement of capital to
any individual firm, the platform can
guarantee recurring exposure to a highly
selective group of institutional LPs with
active mandates associated with fund
allocations. Some success metrics follow.
2014 86
2015 101
2016 190
2017 117
2018 356
UNIQUE ALLOCATOR
INQUIRIES TO FUNDS
INVESTOR LETTER 4,600+
3,400+
490+
470+
1,050+
# OF DOWNLOADED
ATTACHMENTS BY TYPE
CROSS BORDER INQUIRIES TO FUNDS 150+
PITCHBOOK
RETURNS
CASE STUDY/ WHITEPAPER
OTHER
WWW.SUMZERO.COM
2019 593
2020 260

172WWW.SUMZERO.COM
SumZero provides investment professionals access to
continuous idea generation and allows them to monitor
what their peers are saying about names in which they’re
currently invested, or looking to invest in.
There is no other community-driven platform or network
from which an investment professional can derive more
direct value.
COMMUNITY FEEDBACK
SumZero is the industry thought leader attracting
research from vetted buyside analysts/PMs at
funds operating around the world, from New
York, to London, Hong Kong and Singapore.
Transparent, actionable investments ideas with
a focus on primary research, rigorous valuation
work, and contrarian opportunities.
SIDDHARTH CHORARIA
HEAD OF ANALYSIS, AMIRAL GESTION
SumZero is a phenomenal resource, providing
access to an army of PMs and buyside analysts.
JOHN ROLFE
FOUNDER/PM, ARGAND
CAPITAL ADVISORS
VICTOR BONILLA
PORTFOLIO MANAGER,
ALLIANCEBERNSTEIN
SumZero has been beyond helpful to my hedge
fund career, giving me the exposure that
eventually led me directly into not one, but
two hedge fund jobs. For anyone who works
on the buyside, if you can post your ideas on
SumZero, I highly encourage you to do so as it’s
an increasingly competitive investment in your
personal brand. As loyal and grateful as I am to
Wharton, I have often said that SumZero has done
more for my hedge fund career than my MBA
ever did. I simply cannot thank you guys enough
for this and for giving me the chance to compete
for eight years in the world’s biggest, most legit
online community of hedge fund investors.

173WWW.SUMZERO.COM
SumZero is not a registered investment advisor or broker-dealer, and is not licensed nor qualified to
provide investment advice. There is no requirement that any of our Information Providers be registered
investment advisors or broker-dealers. Nothing published or made available by or through SumZero should
be considered personalized investment advice, investment services or a solicitation to BUY, SELL, or HOLD
any securities or other investments mentioned by SumZero or the Information Providers. Never invest based
purely on our publication or information, which is provided on an “as is” basis without representations.
Past performance is not indicative of future results. YOU SHOULD VERIFY ALL CLAIMS, DO YOUR OWN
DUE DILIGENCE AND/OR SEEK YOUR OWN PROFESSIONAL ADVISOR AND CONSIDER THE INVESTMENT
OBJECTIVES AND RISKS AND YOUR OWN NEEDS AND GOALS BEFORE INVESTING IN ANY SECURITIES
MENTIONED. INVESTMENT DOES NOT GUARANTEE A POSITIVE RETURN AS STOCKS ARE SUBJECT TO
MARKET RISKS, INCLUDING THE POTENTIAL LOSS OF PRINCIPAL. You further acknowledge that SumZero,
the Information Providers or their respective affiliates, employers, employees, officers, members, managers
and directors, may or may not hold positions in one or more of the securities in the Information and
may trade at any time, without notification to you, based on the information they are providing and will
not necessarily disclose this information to subscribers, nor the time the positions in the securities were
acquired. You confirm that you have read and understand, and agree to, our full disclaimer and terms of
use, a copy of which can be accessed by clicking here and that neither SumZero nor any of its Information
Providers is in any way responsible for any investment losses you may incur under any circumstances.
All content and material within in this document is the exclusive intellectual property of SumZero, Inc., and
may not be reproduced without the prior written permission of SumZero, Inc.
DISCLAIMER