2020.pdf - Karachi Stocks
73
-
Upload
khangminh22 -
Category
Documents
-
view
2 -
download
0
Transcript of 2020.pdf - Karachi Stocks


CompanyInformation
Chief Financial Officer
Mr. Junaid Aslam
Company Secretary
Mr. Umair Mukhtar
Board of Directors
Mr. Tariq Moinuddin KhanMs. Nusrat MunshiMr. Zafar Iqbal SobaniMr. Naved Abid KhanMr. Kamran NishatMr. Mahmud Yar HirajMr. Muhammad Kamran Mirza
ChairmanManaging Director & Chief Executive OfficerIndependent DirectorIndependent DirectorNon-Executive Director Non-Executive DirectorNon-Executive Director
Audit Committee
Mr. Zafar Iqbal SobaniMr. Kamran NishatMr. Mahmud Yar HirajMr. Muhammad Kamran Mirza
ChairmanMemberMemberMember
Human Resource andRemuneration Committee
Mr. Naved Abid KhanMs. Nusrat MunshiMr. Mahmud Yar HirajMr. Muhammad Kamran Mirza
ChairmanMemberMemberMember
Strategy Committee
Mr. Kamran NishatMs. Nusrat MunshiMr. Mahmud Yar HirajMr. Muhammad Kamran Mirza
ChairmanMemberMemberMember
Share Registrar
CDC Share Registrar Services Limited
Head of Internal Audit
Mr. Shahzaib Tariq
Legal Advisors
Sattar & Sattar
Auditors
EY Ford RhodesChartered Accountants
Bankers
Allied Bank LimitedDubai Islamic BankFaysal Bank LimitedJS Bank Limited MCB Islamic Bank LimitedMCB Bank Limited
Meezan Bank LimitedThe Bank of Punjab United Bank LimitedHabib Bank LimitedHabib Metropolitan Bank LimitedBank Al Habib Limited
Plant-II
D-109, S.I.T.E., KarachiTel.: +9221 32572695 & 32563598Fax: +9221 32564670
Plant-III
F/46, S.I.T.E., Super HighwayPhase II, Karachi
Website
www.agp.com.pk
B-23-C, S.I.T.E., Karachi Tel.: +9221 111-247-247 Fax: +9221 32570678
Registered Officeand Plant-I
13AnnualReport
202012AGPLimited

Directors’Profile
Chairman – Board of DirectorsMr. Tariq Moinuddin Khan
Mr. Tariq Moinuddin Khan, Chairman of OBS Group, has over 31 years of broad based healthcare experience. Under his oversight, OBS has emerged as a partner of choice for multinational pharmaceutical companies willing to work in Pakistan.
He is the Honorary Consul General of Netherlands in Karachi, Secretary General of World Federation of Consuls, Brussels for Pakistan Chapter, Former President of Pakistan Sri Lanka Business Forum to promote trade between the two countries and Member of ASPEN Institute (USA).
Following a successful career with leading companies in Canada and subsequently with Saudi Royal family, he joined Organon Pharma B.V. (OBS) (now part of Merck & Co. Inc. USA) in 2000. Later, he was based in KSA and served as Managing Director, Organon Pharma B.V. (OBS) for KSA and Pakistan.
In 2006, he did a management buyout of Organon Pharma B.V. (OBS) followed by acquisition of Merck Sharp & Dohme (MSD) Pakistan business, Schering Plough Pakistan business, MSD Srilanka Operations, AGP Pvt. Ltd. and Johnson and Johnson’s Pharmaceutical Division, Janssen Pharma’s Pakistan operations.
He is a graduate of the Concordia University, Montreal Canada and has a Post Graduate Diploma in Public Accountancy (GDPA) from McGill University. He is also a Certified Management Accountant from Ontario Canada and Certified Public Accountant from California, USA.
Ms. Nusrat Munshi has over 30 years of broad based experience in banking and pharmaceutical sector. She is the Managing Director and CEO of AGP Limited and also serves as director on the Board of OBS Healthcare (Private) Limited, Aspin Pharma (Private) Limited and OBS Green (Private) Limited. She joined AGP Limited in June 2007 and worked as Director of Finance, Information Systems and HR prior to her elevation as the Managing Director in 2009. She successfully steered the Company during the critical process of change in ownership in 2014 after which the Company has emerged much stronger with long term horizon.
She started her career with the Banking Industry and has experience of over a decade in Treasury, Corporate and Credit. She has also worked with HSBC Canada and was the Regional Corporate Head at HSBC, Pakistan before joining AGP Limited.
She holds a BBA (Hons) and MBA from the Institute of Business Administration and a second MBA from the Queens University, Canada.
Managing Director &Chief Executive Officer
Ms. Nusrat MunshiChairman –Human Resource & Remuneration Committee
Mr. Naved Abid Khan
Mr. Naved Abid Khan brings along with him over 31 years of work experience with 28 years of broad based banking experience. He is currently serving as Chairman & Chief Executive of Sharmeen Khan Memorial Foundation & Chairman Pakistan Microfinance Investment Company. He is also a Board Member of Karachi Shipyard and Engineering Works, Dubai Islamic Bank, NRSP Microfinance Bank Limited, Saif power, Board of Investment, Galiyat Development Authority, Naymat Collateral Management Company Limited, Bahria Foundation and Gas & Oil Company Pakistan.
During his career, he has served as the President & Chief Executive Officer of Faysal Bank Limited, ABN Amro Bank Pakistan Limited, President of Overseas Investors Chambers of Commerce and Industry, Chairman of Pakistan Banks Association, Faysal Asset Management Limited, Academic Board of Institute of Bankers Pakistan, President of Rotary Club of Karachi Metropolitan, Vice President of Institute of Bankers Pakistan and Member of the Institute of Bankers’ Council. He also served at senior key positions in Bank of America, Pakistan.
He holds a Bachelor of Science Degree from Indiana University, USA and a Master of Business Administration degree from Butler University, USA.
75AnnualReport
202074AGPLimited

Mr. Zafar Iqbal Sobani brings with him around forty years of experience of working in the manufacturing, power sector and audit profession in Pakistan and in the Middle East. Currently, he is on the Board of Privatization Commission, Zephyr Power (Private) Limited, TRG (Pakistan) Limited, Primus Leasing Limited, IT Minds and Fauji Cement Limited.
During his career, he has worked with House of Habib in the areas of New Project Development and Real Estate Management. He also leads the power sector of the Country as CEO of Hubco Pakistan and CEO of Liberty Power Tech. Majority of his career was spent with Century Paper & Board Mills Limited, a part of Lakson Group overseeing various business activities. He has been the President of Institute of Chartered Accountants of Pakistan (ICAP) and served actively in council and regional committee in various capacities. He worked with A.F. Ferguson (PWC) in Pakistan and Ernst and Young, Kingdom of Saudi Arabia. He held the position as Chairman of Quality Control Board of ICAP overseeing quality of auditing profession for nine years and Member of the Managing Committee of Overseas Investors Chamber of Commerce and Industry. He is the Sponsor Director of Pakistan Institute of Corporate Governance and holds Certification as a trainer of Corporate Governance by IFC.
He obtained qualification of Chartered Accountancy and Cost & Management Accountancy in early eighties.
Mr. Kamran Nishat is currently the Managing Director & Chief Executive Officer of Muller & Phipps Pakistan (Private) Limited.
He is also serving in the capacity of Chief Executive Officer at M&P Express Logistic (Private) Limited, M&P Logistic (Private) Limited, Logex (Private) Limited, Tech Sirat (Private) Limited, Veribest Brands Pakistan (Private) Limited and Tech Sirat Technology (Private) Limited.
He holds the rich professional experience in different sectors for more than 35 years.
He is serving as the Independent Director at the Boards of Dawood Hercules Corporation Limited and Cyan Limited. He is serving as Director at the Board of Briogene (Private) Limited.
He is currently a member of Executive Committee and Chairman of Finance & Taxation subcommittee at the American Business Counsel. He has served as past president of American Business Counsel as well. Recently, he is serving his contributions at the National Skills University Islamabad as the member of the Advisory Council.
In past, he served as the Member of Accounting and Auditing Standards Committee (South) of the Institute of Chartered Accountants of Pakistan (ICAP), Information Technology Committee (South) of the ICAP and Management Association of Pakistan.
He is a Chartered Accountant and a fellow member of ICAP.
Chairman – Audit CommitteeMr. Zafar Iqbal Sobani
Non–Executive DirectorMr. Kamran Nishat
Mr. Mahmud Yar Hiraj has over 19 years of professional experience in private equity, principal investments and investment banking. He is a founding partner and a member of the Investment Committee at Baltoro Capital, a leading private equity firm.
Prior to Baltoro, he was the Head of Principal Investments at Bank Alfalah & held leading roles at Dhabi Group with representation on Investment Committees and boards of various portfolio companies. Mr. Mahmud Yar Hiraj has worked at leading global financial institutions and investment banks in US, UK and Canada. He started his career at the investment banking division of Salomon Smith Barney (Citigroup) in New York before moving to London to join Citigroup’s Financial Sponsors Group where his clients included leading global private equity firms. His other experiences include executive positions at J.P. Morgan and Scotia Capital in North America, where he advised various leading Fortune 500 Companies and sponsors on mergers and acquisitions and capital market fundraising and restructuring transactions.
Mr. Mahmud Yar Hiraj holds an MBA from Yale University and a BA from McGill University.
Mr. Muhammad Kamran Mirza brings with him over 14 years of experience of Financial Markets focused primarily on Sell-side and Buy-side Investment Advisory. Prior to joining OBS Group in 2018, he was part of JS Bank Limited as Executive Vice President and Head of Investment Banking Group where he advised corporates on mergers, acquisitions, divestitures, debt and equity capital market transactions with a focus on pharmaceutical, microfinance, logistics, financial services and industrial sectors.
He joined JS Bank in 2007 as an analyst and due to his entrepreneurial mindset and ability to steer the franchise to deliver strong performance through the cycles, he rose to a position of Head of Investment Banking in a very short span of time. Prior to joining JS Bank, he had a short stint with a leading telecom company as Projects Management Executive.
A certified director from Pakistan Institute of Corporate Governance, he is currently serving as a Board Member of AGP Limited, OBS Healthcare (Pvt.) Limited, Aspin Pharma (Pvt.) Limited, Home Medics (Pvt.) Limited, OBS AGP (Pvt.) Limited and other OBS Group companies. He was also on the Panel of Experts of the Listing Committee of Pakistan Stock Exchange.
He holds an undergraduate degree in commerce with a gold medal and is an MBA graduate from the Institute of Business Management (IoBM).
Non–Executive DirectorMr. Mahmud Yar Hiraj
Non–Executive DirectorMr. Muhammad Kamran Mirza
77AnnualReport
202076AGPLimited

Dear Shareholders,
I would like to present Chairman’s review report for the year
ended December 31, 2020.
It is a privilege to state that the Company has delivered strong
results despite adversity and unprecedented challenges
posed by Covid-19. Undoubtedly, the credit of this resilient
performance goes to the employees who worked with utmost
commitment and dedication even in these difficult times and
helped the Company to achieve sustainable growth in sales
and profits, and hence maximized returns to shareholders.
I would also like to put forward, my appreciation for the
exemplary performance of our Chief Executive Officer under
whose brilliant leadership, the Company continued with
growth trajectory regardless of the global pandemic.
I am grateful to the valuable contributions of my fellow Board
members, who offered unparalleled strategic guidance
and directions in paving a prosperous way forward for the
Company. Our Board comprises of diverse and proficient
group of highly accomplished professionals. The Board
particularly ensured that their roles and responsibilities,
as defined by the Companies Act 2017 and governed by
the Listed Companies (Code of Corporate Governance)
Regulations, 2019, are carried out diligently.
The Board has formed three committees, Audit Committee,
Human Resource and Remuneration Committee and
Strategy Committee to review, deliberate and present their
recommendations as per their mandates. The members
are adequately and appropriately placed in the respective
committees on the basis of their relevant expertise and
core functionality areas. The committees carried out their
responsibilities effectively in accordance with the code of
corporate governance and terms of reference duly approved
by the Board.
On behalf of the Board, I would like to express my gratitude
to our stakeholders for their continued support and
encouragement. I would specially like to place on record
my appreciation for the outstanding efforts of our entire
management team in these exceptional circumstances.
Tariq Moinuddin Khan
Chairman
Chairman’s Review
The credit of this resilient performance goes to the employees who worked with utmost commitment and dedication even in these difficult times.
79AnnualReport
202078AGPLimited

CEO’S Message
The year 2020 was an unusual year with unprecedented challenges posed by Covid-19 pandemic. The outbreak of global coronavirus disrupted the socio-economic environment compelling severe restrictions on trade and commerce and raising serious uncertainty in business community. The movement was suppressed as lockdowns were imposed and international borders remained closed for major part of the year. In these difficult times, the Government of Pakistan, particularly the State Bank of Pakistan (SBP), remained steadfast and made concerted efforts to sustain the economy by introducing a set of remedial measures such as refinancing policies, reduction of policy rate, controlled local currency devaluation, provision of subsidies and short-term tax reliefs.
While the Government played its role in ensuring an adjustable macroeconomic environment, the Company’s unwavering performance was driven by the exemplary dedication and commitment of its employees. Our treasured employees ensured that the supplies of our essential medicines are readily available for the patients in need. It is through their valuable support, that the Company was able to not only respond to the pandemic effectively but simultaneously, progress towards achieving its strategic goals and objectives.
Even in this adversity, the Company was able to record sales of PKR 6.9 billion, reflecting a double-digit growth of 11.1% over the last year. Our flagship brand Rigix, the largest selling anti-histamine in Pakistan, registered a growth of 25% and its sales reached PKR 1.45 Billion. Rigix tablet, became our first dosage form to reach the covated PKR 1 Billion milestone. Another top brand of the Company, Osnate achieved the milestone and joined Rigix in the PKR 1 Billion club as per IQVIA MAT 2020.
Despite the increase in administrative costs as we took preventative measures against Covid-19, the Company’s focus on high potential products, minimization of marketing & travel-related costs, timely repayment of loans with reduction in interest rates, and increased efficiency in operations led the Company to increases its net profit to PKR 1.6 Billion and earnings per share to PKR 5.67, demonstrating a growth of 9.8%.
As per Company’s commitment towards providing its shareholders with the greatest value, AGP’s market capitalization grew to PKR 31.9 Billion from PKR 27.8 Billion, depicting a rise of 14.6%. Also, the Board announced a final dividend of PKR 1 per share, increasing the total annual dividend to PKR 2 per share for the year 2020.
Testament to the Company’s promise towards strong corporate governance, strict adherence to statutory compliances, highest standards of professionalism, gender diversity and equitable treatment of employees, I am pleased to share that the Company received various accolades and acknowledgements throughout the year as we secured a position in the prestigious list of Top 25 Companies of 2019 announced by the Pakistan Stock Exchange (PSX), secured 3rd position in Best Corporate Report Awards Competition held by the joint committee of ICAP and ICMAP, and won three Global Diversity and Inclusion Benchmark Awards (GDIB).
As we move forward, the Company is continuously focused towards enabling growth and development through expansion in the market coverage of its existing product portfolio and building onto its product mix to avail various opportunities locally and internationally. The commencement of commercial operations of Nutraceutical plant has opened new avenues in enhancing our sales position. Consistent
with our strategic objective, the Board of Directors has authorized the Company to participate in the acquisition of selected portfolio of pharmaceutical products which are commercialized in Pakistan under the Sandoz brand. We are fully geared to capitalize on the opportunities of this acquisition and it is likely to bring operational efficiencies, logistical synergies, and enhancement of product portfolio and profitability of the Company.
Due to a low yet growing health expenditure per capita and health expenditure as a percentage of GDP, Pakistan’s pharmaceutical market currently holds enormous untapped potential and prospects for future growth remain strong. AGP is duly prepared for availing the countless opportunities that lie within the pharmaceutical industry and export potential of domestic medicines around the globe.
Lastly, I would specially like to place on record my gratitude and appreciation for outstanding efforts of our employees that enabled us to deliver a resilient performance throughout the year that was full of challenges and uncertainties. Their exemplary dedication and efforts led the Company to grow sustainably even during these difficult times.
The Company is looking forward to a prosperous future for its employees, shareholders, partners, and customers, all of which we consider as our greatest assets. At AGP, we are committed to deliver quality products that improve people’s access towards healthcare and wellbeing and thus, promising a healthier tomorrow!
Nusrat MunshiManaging Director &Chief Executive Officer
As we move forward, the Company is continuously focused towards enabling growth and development through expansion in the market coverage of its existing product portfolio and building onto its product mix to avail various opportunities locally and internationally.
81AnnualReport
202080AGPLimited

CorporateGovernance Framework
Compliance with the Best Practices of Code of Corporate Governance
Adhering to the Company standards, the Board of Directors has throughout the financial year 2020, complied with the requirements of the Listed Companies (Code of Corporate Governance) Regulations, 2019, Rule Book of the Pakistan Stock Exchange Limited and the Financial Reporting Framework of Securities & Exchange Commission of Pakistan (SECP). Report of the Board’s Audit Committee on adherence to the Code of Corporate Governance, Statement of Compliance with the Code of Corporate Governance by the Chairman and the Chief Executive Officer and review report by the Company’s Auditors are included in this Report.
Governance Practices beyond Legal Requirements
The Company complies with all the requirements of Code of Corporate Governance and other Regulations. AGP has always believed in going the extra mile and staying ahead with legal formalities. In view of this strategy, we comply with all mandatory legal requirements and have also carried out the following practices in addition to the legal requirements:
◆ Best corporate reporting practices as recommended jointly by the Institute of Chartered Accountants of Pakistan (ICAP) and Institute of Cost and Management Accountant of Pakistan (ICMAP)
◆ Disclosure of various financial analysis including ratios, reviews, risk matrices and graphs etc. in the Annual Report
◆ Implementation of Health, Safety and Environment practices to ensure safety of employees and society at large
As we continue to grow and evolve, we remain focused on our principles and rules. These include our governance and compliance frameworks. They form the bedrock of all our efforts, while ensuring that we adhere to the highest standards of ethical and responsible behavior.
Business Ethics and Anti-Corruption
Based on an ethical corporate culture, fundamental values of the Company are cornerstone of our operations. The values are integrated into daily work and business practices of all employees through the Code of Conduct and various unit-specific ethical compliance procedures. The Members of the Audit Committee meet at regular and defined statutory intervals during the year to review the adequacy and effectiveness of the internal controls, including those relating to the strengthening of the Company’s risk management policies and systems.
Conflict of Interest of Board Members
Within the framework of their roles and responsibilities, all Board members are exclusively committed to the interests of the Company and neither pursue personal interests nor grant unjustified advantages to third parties. The Board members are responsible for appropriate self-disclosure in a transparent manner and in the case of doubtful situation, are encouraged to discuss it with peers or the Chair of the meeting for guidance.
Role of the Chairman
The Chair is responsible for the leadership and management of the Board and for ensuring that the Board and its committees function effectively. One way in which this is achieved is by ensuring Directors receive accurate, timely and clear information. He is also responsible for agreeing and regularly reviewing the training and development needs of each Director which he does with the assistance of the Company Secretary for governance related matters and the CEO for industry-specific knowledge and insights. The Chairman’s role involves but is not limited to the following:
◆ To ensure that the Board plays an effective role in setting up the Company’s corporate strategy and business direction.
◆ To promote and oversee the highest standards of corporate governance within the Board and the Company.
◆ To ensure integrity, credibility, trustworthiness and active participation of Board members in key matters of the Company.
◆ To ensure that the Board only directs the Company and does not manage it.
◆ To ensure that relevant, accurate and up to date Company information is received from the management and shared with the Board members to enable them to monitor performance, make sound decisions and give appropriate advice to promote the success of the Company.
◆ To review the Board performance and to take the lead in identifying and meeting the development needs of individual directors and to address the development needs of the Board as a whole with a view to enhance its overall effectiveness as a team.
◆ To manage and solve conflict (if any) amongst the Board members and to also ensure freedom of opinion in the Board.
◆ To promote highest moral, ethical and professional values and good governance throughout the Company.
◆ To ensure that a formal and effective mechanism is in place for an annual evaluation of the Board’s own performance, members of the Board and of its committees.
Chairman’s Significant Commitments
AGP’s Chairman Mr. Tariq Moinuddin Khan is the chairman of OBS group and its subsidiary Companies. He also serves as the Honorary General Consul of Netherlands, Karachi and Secretary General of World Federation of Consuls, Brussels for Pakistan Chapter.
Role of CEO
The CEO holds the overall responsibility for the implementation of the strategy agreed by the Board, the operational management of the Company and the business enterprises connected with it. She is well supported in the task by the members of senior management which heads their respective departments. The CEO reports to the Board of Directors and her responsibilities mainly include:
83AnnualReport
202082AGPLimited
◆ Formulating, and after Board approval, successfully implementing Company policies.
◆ Directing strategy towards the profitable growth and operations of the Company.
◆ Developing strategic operating plans that reflect the longer-term objectives and priorities established by the Board.
◆ Maintaining an ongoing dialogue with the Chairman of the Board to keep him fully informed of all significant developments.
◆ Putting in place adequate operational planning and financial control systems.
◆ Ensuring that operating objectives and required standards of performance are understood by all Company employees.
◆ Monitoring of operating and financial results against budget.
◆ Taking remedial action where necessary and informing the Board of significant changes.
◆ Ensuring that the Company is in compliance with all applicable laws and regulations.
◆ Building and maintaining an effective executive team and appropriate succession plans.
Evaluation of the performance of the Chief Executive
The CEO, being part of the Board, attends every meeting of the Board. The CEO provides an overview of the Company’s performance to the Board and addresses any specific questions by the Board members. The performance of the CEO is assessed through the evaluation system set by the Company which is based on both qualitative and quantitative objectives. These objectives include financial performance, processes improvement, business excellence, compliance, sustainability and people management.
Diversity Policy
AGP has a diverse and balanced Board which not only represents the shareholders but also provides a mix of professional expertise in leadership, finance, legal, corporate law and business management skills and experiences covering adequately all areas of AGP’s business undertakings. Furthermore, in compliance with
requirements of Code of Corporate Governance, a female director is also present on the Board of Directors. To encourage representation of minority shareholders, the Company facilitated the minority members, as a class, to contest election of directors for which purpose, the Company fully complies with the relevant regulation.
The Board has given categorical instructions to sustain a diverse workforce and an inclusive environment that respects and shows care for all its people, irrespective of any sort of bias, and helps improve business performance. Alleviation of gender discrimination is instilled in the human capital strategy.
Whistleblowing Policy
AGP does not tolerate any unlawful and unethical activity and vows to take appropriate action to ensure compliance with law and safeguarding the interest of all stakeholders.
The Whistle Blowing Policy formalizes the company’s commitment to enabling its employees, shareholders and business associates to make fair and prompt disclosure of circumstances where it is genuinely believed that the company’s business is being carried out in an inappropriate manner or in violation of applicable laws, or the Company’s policies, procedures and ethical values. The whistleblowing unit, comprising of senior officials, is entrusted with duty to deal with the concerns or issues. Along with internal means, the stakeholders may also raise their concerns using e-mail and regular mail at the designated addresses mentioned on the official website of the Company. The policy is designed to:
◆ Support company’s values in line with its commitment to the highest possible standards of ethical, moral and legal business conduct and its strong pledge to open and candid communication.
◆ Ensure that all stakeholders can raise concerns without fear of retribution and with full confidence that their identities will not be revealed.
◆ Provide a swift and confidential process for rectifying misconduct wherever and whenever it occurs in the Company.
During the year 2020, six complaints were received and were disposed after formal investigation by the whistleblowing unit. One of the complaint was serious in nature, employee involved in physical abuse was terminated and blacklisted. All other complaints were minor events requiring management’s attention only. Appropriate actions were taken for avoidance of such incidents in future. The CEO presented a whistleblowing status report of these complaints to the Audit Committee, clearly disclosing how such matters were dealt with and finally concluded.
IT Governance
AGP has aligned itself to efficient use of Information Technology resources in achieving its strategic and operational objectives while increasing shareholders’ value.
To ensure value creation through benefits realization and resource optimization, the Company has IT framework which governs the following aspects;
◆ Alignment of IT objectives with overall corporate strategy;
◆ Maximize return on technology investment by assuring that all the activities planned are delivered as per agreed achievable targets;
◆ Ensure provision of a coherent and integrated IT architecture and management structure;
◆ Encourage proactive innovation and automation in all business functions;
◆ Assist in the decision-making process by providing reliable information and reports;
◆ Ensure the necessary protection of IT assets through optimization of IT Risk Management;
◆ Comply with legal and regulatory requirements, internal controls and monitoring, and related policies and procedures;
◆ Ensure the satisfaction of end users expectations with respect to IT services; and
◆ Employ comprehensive sourcing procedures to manage third parties / vendors relationships
Policy for Records Safety
The Company considered information as one of the most valued business asset and placed great emphasis for storage and safe custody of its financial and non-financial records. The Company uses the SAP system for recording its financial information. The access to electronic information has been limited and secured through implementation of a comprehensive password protected authorization matrix. The Company’s physical record have been stored in efficient, secure and easy to retrieve manner. The records have been kept at secure places with adequate measures in place.
The Company believes and practices that the information should be accessed on a need-to-know basis. For this purpose, the Company has put in place a mechanism to define required access control measures to Company’s information, applications and system resources in a controlled environment to protect the privacy, security and confidentiality of Company information technology resources.
Investors’ Relations Policy
We have earned the trust of our investors and are fully committed to sustain it. Thus, to set guidelines for handling and addressing Investors’ and Shareholders’ grievances effectively and ensuring Investors’/Shareholders’ satisfaction, an Investor Grievance Policy has been formulated and strictly followed. The objective of this Policy is to enable effective communication and foster healthy relationships with shareholders / investors and resolve their concerns on a timely basis. The Company has internally established a mechanism for investor services and grievances handling. Main principles of the Investors Grievance Policy are as follows:
◆ All the investors are treated fairly and equally at all times
◆ Complaints raised by investors are dealt with courtesy, fairness and in a timely manner
◆ The Management works in good faith and without prejudice towards the interests of any of the investors
85AnnualReport
202084AGPLimited

Investors’ Contacts Section on Our Website
Detailed information of the Company regarding financial highlights, investor information, share pattern/value and other requisite information specified under the relevant regulations, has been placed on the corporate website of the Company, which is updated on regular basis.
In order to promote investor relations and facilitate access to the Company for grievance / other query registration, an ‘Investors’ Contacts’ section has been introduced on Company’s website www.agp.com.pk, besides the link to ‘SECP’s Service Desk Management System’. The contact details of persons designated for assistance and handling investor related queries / grievances are also placed under this section.
Human Resource Management Policy
AGP has high standards of Human Resource Management practices to attract, induct, develop, retain and motivate high caliber talent who are qualified, capable and willing to contribute their best towards accomplishment of Company objectives.
The Company’s HR policy has been developed encompassing the following principles:
Equal OpportunityThe Company shall provide equal opportunity to all job applicants through clearly defined and consistently applied induction standards. In addition, a work environment shall be provided where every employee has an equal opportunity for optimum career growth and development.
Recruitment and SelectionThe hiring process of the Company is transparent and fair. The hiring process is followed consistently to select the right candidate as per the job requirement.
Training and DevelopmentAppropriately planned activities are designed to help employees become more effective at their work by improving, updating or refining their experience, knowledge and skills through,
formal training, education programs or on the job development that meets employee and Company objectives.
Performance ManagementA transparent, objective oriented and merit based Performance Management System is followed, that supports and conserves a culture of learning, innovation, leadership and accountability.
Compensation and BenefitsCompensation commensurate with the industry, particularly pharmaceutical sector and marked to market allowances and benefits are provided to attract and retain talent in the Company.
Diversity and InclusionWork environment free from all forms of discrimination and biases is provided where all individuals are treated fairly and respectfully, have equal access to opportunities and resources so that they may contribute fully to the success of the organization. Female participation in the workforce is encouraged.
Succession PlanningA key organizational priority for the HR department is to ensure structured career progression for all employees. To facilitate employees in steering their careers and realizing their full potential, a succession planning policy has been formally documented.
Related Party Transaction PolicyThe Company has a policy governing procedures for related party transactions and to ensure that all such transactions are reviewed, considered, approved and reported in accordance with the international accounting standards, applicable laws and regulations. The policy ensures that:
◆ All transactions with related parties arising in the normal course of business are carried out in an unbiased, arm’s length basis at normal commercial terms and conditions
◆ All transactions with related parties are referred to the Board Audit Committee for review and for onward recommendation to the Board of Directors for review and approval
◆ The Company maintains the record of Related party transactions, prescribed in the Companies Act, 2017 and the Companies (Related Party Transactions and Maintenance of Related Records) Regulations, 2018
◆ In the event, majority of Directors of AGP are interested in transactions with related parties, such transactions are referred to the shareholders in a general meeting for approval. However, during the year no related party transaction required shareholders’ approval
Related Party Transactions During the year
The Company entered into Related party transactions during the year. Details of these transactions are disclosed in note 34 to financial statements attached therein.
Environmental, Social and Governance Policy
The Company believes in promoting sustainability in business strategies related to Environment, Social and Governance including Health, Safety and Environment (HSE) aspects and provides a roadmap to the stakeholders to conduct business in a fair, transparent and responsible manner.
This policy ensures that business is conducted in a manner, which pro-actively ensures the safety of all employees, assets, interest of community and preservation of environment. It also serves as a guide to strategic plans and systematic management of Corporate Social Responsibility (CSR) initiatives and activities.
Committees of the Board
The Board of Directors of the Company oversees the operations and affairs of the Company in an effective and efficient manner and for the aforesaid purpose, the Board has constituted three committees. These committees act as advisory bodies to the Board, keeping the Board updated about key developments and changes in the operating environment.
The Board comprises of two independent directors who are not involved in the Company’s
management nor are connected with any business or other relationships that could interfere materially with, or appear to affect, their judgement.
Audit Committee
The terms of reference of Audit Committee have been explicitly documented and approved by the Board of Directors. The salient features of terms of reference of the Audit Committee are:
◆ Determination of appropriate measures to safeguard the Company’s assets
◆ Review of annual and interim financial statements of the Company, prior to their approval by the Board
◆ Review of preliminary announcements of results prior to external communication and publication
◆ Facilitating the external audit and discussion with external auditors of major observations arising from interim and final audits
◆ Review of management letter issued by external auditors and management’s response thereto
◆ Ensuring coordination between the internal and external auditors of the Company
◆ Review of the scope and extent of internal audit, audit plan, reporting framework and procedures and ensuring that the internal audit function has adequate resources
◆ Consideration of major findings of internal investigations of activities characterized by fraud, corruption and abuse of power and management’s response thereto
◆ Ascertaining that the internal control systems, accounting systems and the reporting structure are adequate and effective
◆ Review of the Company’s statement on internal control systems prior to endorsement by the Board and internal audit reports
◆ Instituting special projects, value for money studies or other investigations on any matter specified by the Board, in consultation with the CEO
◆ Determination of compliance with relevant statutory requirements
◆ Monitoring compliance with Code of Corporate Governance
87AnnualReport
202086AGPLimited

◆ Review of arrangement for staff and management to report to the Audit Committee in confidence, concerns, if any, about actual or potential improprieties and recommend instituting remedial and mitigating measures
◆ Recommend to the Board the appointment of external auditors, their removal and audit fees
◆ Consideration of any other issue or matter as may be assigned by the BOD
Human Resource and Remuneration Committee
The terms of reference of the Human Resource and Remuneration Committee are determined by the Board. The salient features of terms of reference of the Human Resource and Remuneration Committee are:
◆ Recommend to the Board for consideration and approval a policy framework for determining remuneration of Directors and members of senior management
◆ Undertaking annually a formal process of evaluation of performance of the Board as a whole and its committees either directly or by engaging external independent consultant
◆ Recommending human resource management policies to the Board
◆ Recommending to the Board the selection, evaluation, development, compensation (including retirement benefits) of CEO, Chief Operating Officer (COO), Chief Financial Officer, Company Secretary and Head of Internal Audit
◆ Consideration and approval on recommendations of CEO on such matters for key management positions who report directly to CEO or COO
◆ Where human resource and remuneration consultants are appointed, they shall disclose to the committee their credentials and as to whether they have any other connection with the company
Strategy Committee
The terms of reference of the Strategy Committee are determined by the Board. The salient features of terms of reference of the Strategy Committee
are:
◆ Review and make recommendations to the Board regarding potential projects and new avenues for diversified investment of Company’s capital and financial resources providing attractive returns;
◆ Review and provide guidance to the Board about proposed mergers, acquisitions, divestitures and similar transactions; &
◆ May engage legal counsels or other consultants on terms and conditions that deems reasonably appropriate (including fees) to carry out its duties and responsibilities. The task of engaging appropriate experts may also be delegated to the senior management.
List of Companies in which Executive Director is acting as a Non-Executive Director
The Company only has one Executive Director of the Board which is CEO of the Company. The CEO of the Company, Ms. Nusrat Munshi holds Non-Executive Directorship on the Board of the following companies:
◆ OBS Healthcare (Pvt.) Limited
◆ Aspin Pharma (Pvt.) Limited
◆ OBS Green (Pvt.) Limited
Board Meetings held outside Pakistan
No Board meeting was held outside Pakistan during the year 2020, in order to economize on the resources of the Company.
Meetings of the Board
As prescribed by the law, Board is required to meet at least once per quarter to monitor the Company’s performance and for effective and timely accountability of its Management.
The Board held six meetings during the year. The notices and relevant materials, including agendas of the meetings were circulated in advance, in a timely manner. Decisions made by the Board during the meetings were clearly stated in the minutes of the meetings maintained by the Company Secretary, and were duly circulated to all the directors for endorsement and were approved in the subsequent Board meetings.
All meetings of the Board during the year had attendance more than requisite quorum prescribed by the Code of Corporate Governance and were also attended by the Chief Financial Officer and the Company Secretary or in their absence, the nominee appointed by the Board except such part of the meetings wherein agenda item relates to consideration of their performance or terms and conditions of their service.
Board’s Roles and Decision Making
The powers of the Board of Directors and the management of the Company have been defined with special reference to, and in compliance with, the Companies Act 2017, the Code of Corporate Governance and the Articles of Association of the Company.
The core function of the Board is to act as stewards on behalf of the shareholders in governance of the Company. At AGP, the Board performs its duties by giving strategic directions to the management, setting performance targets and monitoring their achievements. Matters requiring a resolution by the Board of Directors in accordance with laws and regulations and important matters concerning management are resolved by the Board of Directors. The Board at AGP also oversees the business of the Company in light of emerging risks and opportunities on a regular basis.
Functions delegated to the Management
The management headed by the CEO is responsible for the business execution in an effective and ethical manner in conformity with the strategies approved by the Board, including annual targets of sales, costs and profitability.
It is also responsible for identifying new areas of investment for the Company, managing the principal risks which could affect the achievement of Company’s objectives and compliance with legal and regulatory requirements.
Policy of Retention of Board Fee by the Executive Director in Other Companies
The Executive Director of the Company is not remunerated with the Board fee against her services as Non-Executive Director in other companies.
Security Clearance of Foreign Directors
AGP does not has a foreign director on its Board. In case a foreign director is elected on the Board in future, security clearance will be duly made from the Ministry of Interior.
Directors’ Training Program
Since the Board has duly complied with the Directors’ training program requirements and the criteria as prescribed in the regulations, therefore the Board has not arranged the training program during the year. Further, only one member of the Board is yet to obtain the requisite certification which will ensure the accreditation of the entire Board.
Trading in Shares by Directors and Executives
During the year, 13,500 shares of AGP was traded by an executive of the Company. No other trading was conducted by the directors, executives and their spouses and minor children.
Shares held by Sponsors / Directors / Executives
During the year, the Sponsors’, Directors and Executives and their spouses held the following number of shares as of December 31, 2020.
A detailed pattern of shareholding is disclosed on pages 206 to 209 of the Annual Report.
Particulars Number of Shares
Sponsors 148,950,434
Directors & their spouse(s) 36,004
Executives & their spouse(s) 1,375
89AnnualReport
202088AGPLimited

Encouragement of Minority Shareholders to attend the General Meetings
The Company encourages all its shareholders to attend the general meetings. It circulates the notice of general meetings well within regulatory timeframe. Moreover, advertisement is published in English and Urdu newspapers, having nationwide circulation. The Company also updates its website with respect to notices of general meetings. We also ensure that the Annual Report, containing the agenda and notice of general meeting, is dispatched to every shareholder at her/his registered address within the stipulated time and uploaded on the website of the company.
Queries raised at last Annual General Meeting
No significant issues were raised during the 6th Annual General Meeting (AGM) of the Company held on May 5, 2020. Queries raised during the last AGM of the Company pertained to the Company’s published financial statements, which were responded by present Board members, the CEO and Company Secretary and resolved to the satisfaction of the shareholders.
Presence of the Chairperson Audit Committee at the AGM
Chairman of the Audit committee – Mr. Zafar Iqbal Sobani was present at the last AGM to an-swer any questions on the Committee’s activities and matters within the scope of the Committee’s responsibilities.
Formal Orientation Program
When a new member is taken on Board it is ensured that he/she is provided with a detailed orientation of the Company, covering the following objectives:
◆ The Company’s vision and strategies
◆ Company’s core competencies, investments, diversification ventures, etc.
◆ Organizational / group structure, associations
and other related parties
◆ Summary of the Company’s major assets, liabilities, noteworthy contracts and major competitors
◆ Major risks both external and internal, including legal and regulatory risks and constraints
◆ Critical performance indicators
◆ Summary of major members, stakeholders, suppliers and auditors
◆ Role and responsibility of the Director as per the Companies Act, including Code of Corporate Governance and any other regulatory laws applicable in Pakistan
◆ AGP’s expectations from the Board, in terms of output, professional behavior, values and ethics
◆ Major policies of the Company
Apart from a formal orientation program, Directors are encouraged to attend trainings, which help them reassess their role in the Company’s progress and hone their competencies for the betterment of the Company in line with Code of Corporate Governance.
Connection of External Search Consul-tancy for Appointment of Chairman or Independent Directors
The Company has effectively maintained the structure of its Board of Directors with the composition of a chairman, two independent directors and 4 non-executive directors. During the year, there was no change in the Board’s members and hence, the need for an external search consultancy for the appointment of chairman or independent directors did not arise.
Covid-19 Strategic Response
The Company’s strategic response to Covid-19 with detailed explanation has been appropriately outlined on the pages 52 & 53 of the Annual Report.
91AnnualReport
202090AGPLimited

Stakeholders’Relationships and Engagement
The Company places great emphasis on the development of sustained stakeholder relationships. It has developed various mechanisms that enable the Board and management to understand and consider stakeholder views and cater to their needs and interests.
Stakeholders’ Engagement Process
AGP regularly engages and effectively communicates with its stakeholders. The table sets out our key stakeholder groups, some of the ways in which we engage with them and how these relationships are likely to affect the performance and value of the entity.
93AnnualReport
202092AGPLimited

Steps taken by the Board to engage with Shareholders
The AGP’s Board is cognizant of the potential impact of its decisions on stakeholders. In the performance of its duty to promote the success of the Company, the Board gives regard to a number of factors, including listening to and considering the views of shareholders and other key stakeholders. The Board’s interaction with the Company’s main stakeholder group – shareholders is set out below in more detail.
Participation at General Meetings
The Company engages with shareholders in several ways. This includes regular communications, the General Meetings and other investor relations activities. It announces results on a quarterly basis and annual results are included in the annual report. The management encourages maximum participation of shareholders including minority shareholders to attend general meetings. In addition to the legal requirements of dispatching and newspaper publication of the notice of general meetings, the shareholders can also view a notification through “Latest News” on the official website of the Company, which advises them that the annual report and notice of the general meetings are available.
The CEO and management maintain a continued and active dialogue with institutional shareholders on performance of the Company through regular meetings. The Company Secretary acts a focal point for handling investor grievances and queries raised through email, website or telephone. The Company Secretary also acts as a focal point for managing key relationships with the Company’s registrar. For facilitation of stakeholders and shareholders, the “Investors’ Relations” section is also present on the corporate website of the Company, containing useful information from investors’ perspective.
Last Annual General Meeting
The last Annual General Meeting had a considerable level of attendance, of more than 81%, and interactive engagement by shareholders. All the proposed resolutions were duly approved by shareholders. The Annual General Meeting held by the Company, provided an opportunity to put questions to the Board during the formal proceedings, while providing shareholders the chance to meet informally with the Board Directors and senior management.
Corporate Briefing Session
In the last quarter of the year, the CEO, Ms Nusrat Munshi, gave a presentation to shareholders and analysts. In this event, the CEO presented the highlights of financial results strictly ensuring accuracy and completeness of information, for the benefit of the audience. The session concluded with a Question & Answer session and the questions were responded to the statisfaction of the attendees.
Statement of Value Added and Distributed
EMPLOYEES ASREMUNERATIONAND BENEFITS
2020: 1,309
2019: 1,068
GOVERNMENT ASTAXES & DUTIES
2020: 300
2019: 446
STATUTORY LEVIES2020: 150
2019: 144
PROVIDERS OFLONG TERM FINANCE
2020: 466
2019: 686
SHAREHOLDERSAS DIVIDEND
2020: 840
2019: 350
REINVESTED2020: 381
2019: 433
RETAINED WITH ENTITY2020: 747
2019: 1,096 4,193
Wealth Generated
Wealth Distributed
95AnnualReport
202094AGPLimited

Directors’ReportThe Board of Directors of AGP Limited is pleased to present the Annual Report along with the audited financial statements for the year ended December 31, 2020.
Principal Activity
The Company is primarily engaged in manufacturing, marketing and sales of pharmaceuticals and healthcare products in the domestic and export market. During the year, Company’s state of the art nutraceutical facility also commenced operations which will enable it to aggressively launch new products in the market.
Market Overview
The pharmaceutical industry in Pakistan recorded a sales value in excess of PKR 500 Billion as per MAT Q4`2020 Industry Report issued by IQVIA Solutions Pakistan Pvt. Ltd., pharma research company. During the year under review, retail pharma business witnessed a growth of 10.1% over the last year primarily due to a high demand of COVID-management medicines and one time CPI based price increase allowed by Drug Regulatory Authority of Pakistan (DRAP).
Financial Results
The financial results of the Company in compari-son to last year are as follows:
Particulars Unit Dec-20
Dec-19
Increase %
Net Revenue
PK
R in
M
illio
n 6,946 6,253 11.1%
Gross Profit 3,861 3,659 5.5%
Profit After Tax 1,587 1,446 9.8%
Earnings Per Share PKR 5.67 5.17 9.8%
AGP continued its double-digit sales growth trajectory, an achievement amidst the unprecedented challenges posed by global Covid-19 pandemic. The topline grew to PKR 6,946 Million i.e. 11.1% higher than last year. Despite a challenging environment, AGP’s sales
performance displayed great resilience through continued production and ensured availability of its product portfolio in the market.
The strong performance in sales was backed by an increase of 9% in the domestic retail portfolio and a robust growth of more than 41% in Afghanistan sales. The Company’s top products continued to deliver stellar performance particularly Rigix, Osnate, Ceclor and Anafortan Plus.
The healthy sales growth could not be fully translated to gross profit as margins remained under pressure due to local currency devaluation and a one-off provisioning of Covid-19 antibody testing kits as the same became redundant due to rapidly evolving testing technology. Despite these factors, gross margins of the Company remained impressive as compared to the industry.
The administrative costs increased by PKR 69 Million, mainly on account of strengthening of workforce in line with expanding business operations and implementing preventive measures against Covid-19. Marketing and selling expenses were contained and grew only by 8% due to travel related restrictions. Finance costs witnessed a reduction of 33.1% primarily due to timely repayment of outstanding Sukuk, low interest rate regime and limited utilization of running finance facility. Taxation showed a decrease of 10.3%, as last year one-time prior year charge was booked on account of provision of super tax. The impressive results yield earnings per share of PKR 5.67, presenting an increase of 9.8%.
Capital Structure
Total equity at the year-end increased to PKR 8,210 Million as compared to PKR 7,463 Million last year, an increase of 10%. The Company continued its settlement of long-term financing on a timely basis and made Sukuk repayment of PKR 482 Million and obtained running musharikah under SBP Refinance Scheme amounting to PKR 315 Million during the year, thus reducing the long term financings to PKR 1,041 Million.
The Company made capital investment of PKR 381 Million through internally generated funds in line with the Company’s future business plans for expansion. The key components of the expenditure included the balancing, modernization and restructuring of existing plants to enhance capacities and efficiencies and construction of the new office block.
During the year, PACRA maintained AGP’s long term credit rating at A+ and short term credit rating at A1 respectively.
Profit Distribution and Reserves
The revenue reserves – unappropriated profit of the Company at beginning of the year stood at PKR 4,663 Million. The net profit for the year increased the reserves by PKR 1,587 Million. On the other hand, final and interim dividend payments decreased the reserves by 560 Million and PKR 280 Million respectively. The closing balance of unappropriated profit was PKR 5,410 Million, signifying an overall increase of 16%.
Appropriations PKR in Million
Opening unappropriated profit 4,663
Net Profit 1,587
Final dividend at PKR 2 per share (560)
Interim dividend at PKR 1 per share (280)
Closing unappropriated profit 5,410
Dividend
The Board of Directors of the Company in its meeting held on February 26, 2021 is pleased to recommend a final cash dividend of PKR 1 per share i.e. 10% for the year ended 2020, for shareholder’s approval at the Annual General
Meeting to be held on April 26, 2021. This is in addition to an interim cash dividend of PKR 1 per share i.e. 10% paid to the shareholders during the year 2020, bringing the total dividend for the year ended 2020 to PKR 2 per share i.e. 20%.
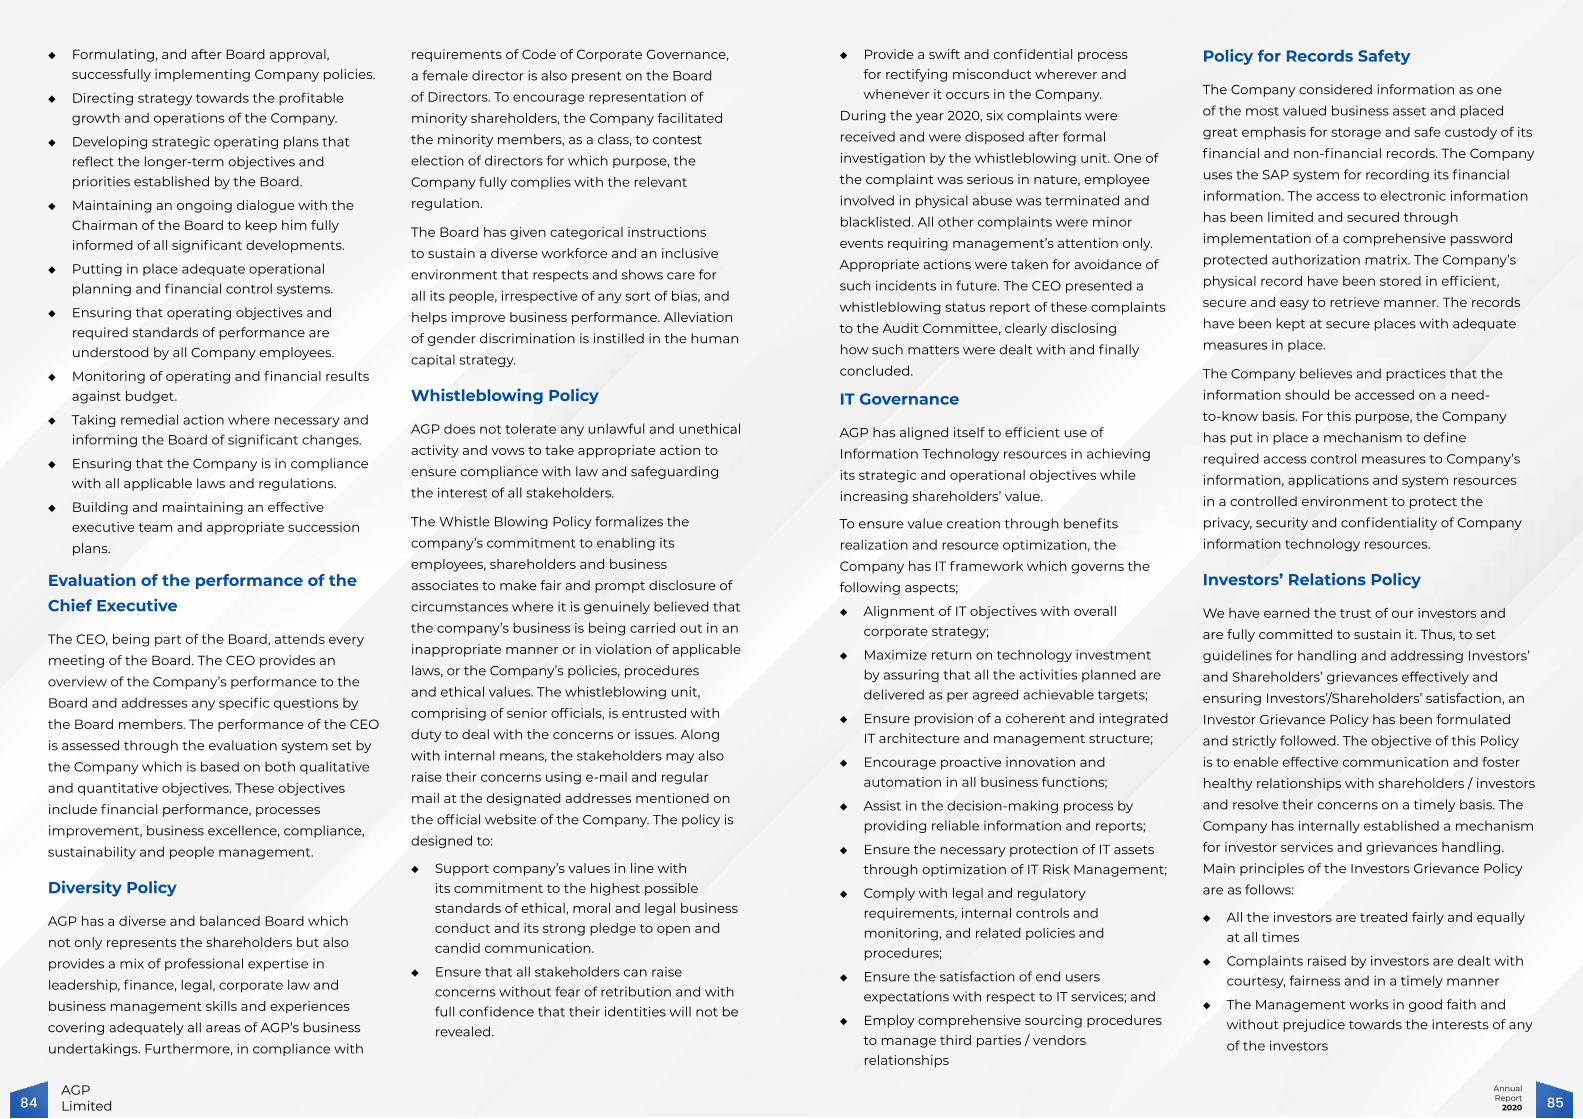
Pattern of Shareholding
The Company’s shares are listed on the Pakistan Stock Exchange Limited. The shareholding information as of December 31, 2020 and other related information including trade of shares by a director, CEO, substantial shareholder and/or their spouses and minor children is set out in the relevant section of pattern of shareholding in the annual report.
Subsequent Events
Subsequent to the reporting date, the Board, in its meeting held on 03 February 2021, has authorized the Company to participate with its parent company, through a Special Purpose Vehicle (SPV), OBS AGP (Private) Limited, for the purpose of acquisition of a selected portfolio of products which are commercialized in Pakistan under the Sandoz brand (“brands”) that are owned by Sandoz AG, Switzerland. The Company will own majority of the equity of sixty-five percent (65%) shareholding in the SPV. The acquisition is subject to necessary corporate and regulatory approvals and successful closing of the transaction with Sandoz AG. The said acquisition is likely to increase the market share, bring operational and logistical synergies and enhance the product portfolio of the Company along with increase in the Company’s revenues and profitability.
Business Impact on Environment
At AGP Limited, we pride ourselves as a socially responsible corporate entity that places utmost importance in the social costs and benefits arising from our business decisions. Not only do we believe in conducting business operations while adhering to environmental regulatory standards such as Environment, Health and Safety (EHS) standards and Sindh Environmental Protection Agency (SEPA), but going an extra
97AnnualReport
202096AGPLimited

mile as we make a concerted effort towards exercising diligence in creating a positive impact.
We fully account for the sustainability aspect of our decisions while demonstrating high ethical values. We focus on minimizing our carbon footprint by reducing carbon emissions and undertaking projects that help in conservation of water and energy. As part of our “Go Green Strategy” to develop sustainable sources of energy, we made an investment of around PKR 60 Million in installing solar panels that will cover around 12% of our energy needs. Simultaneously, we are conducting tree plantation drives in various areas of Karachi to ensure a greener future.
Our production practices conform to international standards and comply with good manufacturing practices (cGMP). Our processes and controls are agile and sustainable, ensuring that we do not compromise on quality and safety for our employees. Similarly, our products pass through stringent quality criteria, adequately serving the needs of our customers. To help achieve these objectives, well designed trainings and courses, both internal and external are imparted to concerned employees to maintain and further improve EHS performance in all operational areas of the Company.
Corporate Social Responsibility
During the year, the implications of Covid-19 required an urgent and concerted response as it imposed grave danger on the general public. As a major player in the pharmaceutical market, AGP remained fully cognizant of its responsibilities to-wards joining the community in the fight against the pandemic.
We have undertaken the sponsorship of various projects throughout the year pertaining to the promotion of wellbeing of the society.
Our approach, while pursuing sustainable development goals (SDGs) as adopted by Government of Pakistan (GoP), towards improving sustainability can be summarized through the following table:
SDGs ACTIONS
Goal 2:
Zero Hunger
◆ Several ration drives were
conducted for distribution of
food to the underprivileged
population;
◆ Joined hands with DoctHERS,
a digital health platform, to
improve the overall health
of underprivileged women,
particularly pregnant females
and feeding mothers, by
enabling provision of easier
access to the relevant
healthcare products in our
portfolio at discounted prices.
Goal 3:
Good Health and Well Being
◆ We made several monetary
donations alongwith
medicines, PPE equipment,
antibody testing kits to various
institutions. We also donated a
set of anesthesia machine with
ventilator;
◆ Arranged screening camps
for Hepatitis B & C testing and
served around 2,000 people
in various institutes all over
Pakistan;
◆ Introduced Dial Clinics, a
digital platform to provide
online consultancies wherein
2,500 plus consultancies were
conducted from experienced
Doctors;
◆ Launched a series of health
awareness sessions “Sehat ki
Baatien” through renowned
healthcare practitioners and
more than 30 such sessions
were held during 2020.
Goal 4:
Quality
Education
◆ A policy is in place that provides
educational scholarships for
Higher Secondary, Graduation
and Professional / Technical
to the needy and deserving
children of factory workers and
support staff.
Goal 5:
Gender Equality
◆ We have female strength of
over 10.3% as a total workforce;
◆ Female led pharmaceutical
listed company;
◆ Won GDIB award for the
2nd consecutive year and
this year we are awarded in
three different categories,
recruitment & developments,
benefits and social
responsibility;
◆ Provide safe, convenient and
affordable transportation
facility to our female employees
of lower management staff.
Goal 6:
Clean Water and Sanita-tion
◆ Effluent water treatment plant
is in place for proper water
disposal that complies with
Sindh Environment Protection
Agency (SEPA) and approved
by the competent regulatory
authority;
◆ Conserving water by using taps
with sensors and springs.
Goal 7:
Affordable and Clean Energy
◆ Installation of Solar Power
System on all 3 manufacturing
sites that will cover around 12%
of our energy needs.
Goal 8:
Decent Work and Economic Growth
◆ Particle Size Analyzer is
installed which provides more
intelligence in the existing
process as well as new product
development as potential
problems related to particle
size can be detected at early
stage;
◆ A proper framework is in place
to ensure that same wages and
benefits are provided to male
and female staff doing the
same level of job with similar
qualifications.
Goal 10:
Reduced inequalities
◆ Duly adhere to all fiscal policies
pertaining to labor wages and
compensation;
◆ The composition of employees
contains different ethnic
groups including minority
classes;
◆ The management strictly
ensure that all workers and
staff are older than 18 years of
age and strongly discourages
child labor.
Risk Management
The Board of AGP believes that governance of risk is integral to Company’s strategy and to the achievement of our long-term sustainable growth targets. The overall risk management framework focuses on mitigating potential adverse effects of risks and uncertainties being faced by the Company.
The management has maintained a sound system of risk identification and management. This entails identifying, evaluating and addressing strategic, financial, operational, reputational and legal and compliance risks faced by the Company. A summary of the principal risks, together with their mitigation plan, is presented to the Audit Committee for their review, consideration and necessary guidance. The conclusion and results are also shared with the Board.
The principal risks currently being faced by the Company include increase in cost of doing business due to devaluation of the Pakistani rupee and domestic inflation. To contain the devaluation impact, we have substituted bulk of our dollar denominated Chinese imports into Chinese Yuan. The smooth and uninterrupted supply of necessary Active Pharmaceutical Ingredients (APIs) may be threatened due to cross border geo-political challenges and escalation in COVID-19 pandemic. The Company, as part of its strategy, is building adequate raw material inventory and also working aggressively to develop alternate vendor sources.
99AnnualReport
202098AGPLimited

Composition and Meetings of the Board and its Committees
The Board comprises of eminent personnel from varied fields with diverse skill set and knowledge in the relevant subjects, to provide strategic guidance to the Company. Our Board composition represents the interests of all categories of shareholders.
During 2020, the Company formed a Board Strategy Committee for reviewing the Company’s investment transactions and performance, and in overseeing the Company’s capital and financial resources. The meetings of the Board and its committees were held as follows for adoption of best corporate governance practices by the Company and monitoring effectiveness of such practices:
Board of Directors (Board) 6
Board Audit Committee (BAC) 4
Human Resource & Remuneration Committee (HRC) 3
Board Strategy Committee (BSC) 1
The composition and attendance records the meetings of the Board and its committees are as follows:
Name Categories Board BAC HRC BSC
Tariq Moinuddin Khan
Non-Executive Director 6/6 - - -
Naved Abid Khan
Independent Director 6/6 - 3/3 -
Zafar Iqbal Sobani
Independent Director 6/6 4/4 - -
Kamran Nishat
Non-Executive Director 6/6 4/4 - 1/1
Nusrat Munshi
Executive Director 6/6 - 3/3 1/1
Mahmud Yar Hiraj
Non-Executive Director 5/6 3/4 2/3 1/1
Muhammad Kamran Mirza
Non-Executive Director 6/6 4/4 3/3 1/1
Mr. Tariq Moinuddin Khan chairs the meetings of Board and Mr. Naved Abid Khan, Mr. Zafar Iqbal Sobani and Mr. Kamran Nishat chair the meetings of HRC, BAC and BSC respectively. The meetings of the Board and its committees were
presided over by their respective Chairman. Leave of absence was duly granted to Directors who could not attend the meetings of the Board and its committees.
The Chief Financial Officer and Company Secretary attended all meetings of the Board except such part of the meetings wherein agenda item relates to consideration of their performance or terms and conditions of their service.
The Chief Financial Officer attended meetings of BAC at the invitation of the Chairman of Audit Committee.
Adequacy of Internal Controls
The Board of Directors has established a system of sound internal control, which is effectively implemented and maintained at all levels within the company. The independent internal audit function of the Company is outsourced to a reputable professional service firm, A.F.Ferguson & Co. (AFF) who are suitably qualified and experienced for the purpose.
The internal audit is conducted as per the internal audit plan duly reviewed and approved by the Audit Committee. The internal audit plan is driven by the Company’s organizational objectives and priorities, and the risks that may prevent the Company from meeting those objectives. The Audit Committee reviews the effectiveness of the internal control framework whereas AFF regularly monitors and provides assurance on the effectiveness and adequacy of the internal controls and risk management framework
Board Evaluation
The Company has appointed Pakistan Institute of Corporate Governance (PICG) to evaluate the performance of the Board as a whole, its Committees and members of the Board. PICG is a not-for-profit company engaged in promoting good corporate governance practices in Pakistan. Their faculty comprises of professionals from diverse experiences and backgrounds. This shows the Board’s commitment towards excellence in corporate governance.
Results of these evaluations are then discussed in detail in the subsequent Board meeting to
address the highlighted areas and improve the Board’s performance. For the year 2020, the Board’s performance and effectiveness has been assessed as ‘Satisfactory’.
Directors’ Remuneration
In compliance with the applicable laws and regulations and as permitted by Articles of Association of the Company, the Board has duly approved the remuneration of the members of the Board for attending meetings of the Board and its committees.
To attract and retain directors to successfully govern affairs of the Company and to encourage value addition, the levels of remuneration is appropriate and commensurate with the expertise and responsibility and aligned in line with prevailing industry trends and business practices. However, the meeting fee shall not be at a level that it could be perceived to compromise the independence.
Disclosure with respect to remuneration package of each of the directors and chief executive including but not limited to salary, benefits, bonuses, stock options, pension and other incentives is as follows:
ChiefExecutive
Directors Executives
2020 2019 2020 2019 2020 2019
[------------ Rupees in '000 ------------]
Managerial remuneration 15,904 14,458 - - 211,071 157,896
Bonus 2,171 1,971 - - 19,547 11,209
Performance incentive 38,289 31,902 - - 2,060 4,604
Reimbur-sement of expenses
403 300 - - 22,523 13,731
Provident fund 1,085 985 - - 10,788 7,115
Others 1,449 1,316 - - 14,282 15,452
59,301 50,932 - - 280,271 210,007
Number of persons 1 1 6 6 52 41
During the year, fee paid to two (2019: two) independent directors and four (2019: Nil) non-executive directors for attending board and other meetings amounted to PKR 4.2 Million (2019: PKR 1.13 Million). During the year, the Company revised its policy of meeting fee to Directors, wherein the Board approved a meeting fee of Non-Executive Directors equivalent to Independent Directors.
Travelling and boarding expenses of executive and non-executive directors borne by the Company amounted to PKR 11.5 million (2019: PKR 9.49 million). Number of non-executive directors at year end were four (2019: four).
Directors’ Compliance Statement
The Board is pleased to state that:
◆ The financial statements prepared by the Company’s management fairly present its state of affairs, the result of its operations, cash flows and changes in equity;
◆ Proper books of account of the Company have been maintained;
◆ There are no significant doubts regarding the Company’s ability to continue as a going concern;
◆ Appropriate accounting policies have been consistently applied in preparation of the financial statements and accounting estimates are based on reasonable and prudent judgment;
◆ International financial reporting standards, as applicable in Pakistan, have been followed in preparation of the financial statements and any departure there from has been adequately disclosed;
◆ The system of internal control is sound in design and has been effectively implemented and monitored;
◆ There has been no material departure from the best practices of corporate governance, as detailed in the listing regulations;
◆ Information regarding outstanding taxes and levies, as required by listing regulations, is disclosed in the notes to the financial statements;
◆ The Board has duly complied with the Directors’ training program requirements and the criteria as prescribed in the regulations;
◆ The key operating and financial data for the last five years is set out in the relevant sections of the annual report; &
◆ The management of the Company is committed to good corporate governance and appropriate steps are taken to comply with best practices.
101AnnualReport
2020100AGPLimited

Provident Fund
The Company provides retirement benefits to its employees. This includes a contributory Provident Fund for all employees. Value of investments of Define Contribution Provident fund based on their accounts as at December 31, 2020 was PKR 279 Million - audit in progress, whereas at December 2019 it was PKR 226 Million – audited.
Auditors
The present auditors, M/s EY Ford Rhodes, Chartered Accountants retired, and being eligible, have offered themselves for reappointment for the new financial year. In concurrence with the Audit Committee, the Board has recommended the appointment of M/s EY Ford Rhodes Chartered Accountants as the statutory auditors of the Company, to the shareholders for their approval at the forthcoming Annual General Meeting.
Future Outlook
AGP continues to strengthen its footsteps in Pakistan’s pharmaceutical industry. With a large and growing population base, the Pakistani pharmaceutical market is poised to grow significantly with expectations of increase in per capita health spend. The Company made significant financial progress during 2020 by leveraging on better sales performance and production efficiencies.
The Company remains focused on serving its customers, strengthening and building stakeholder relationships, expanding and diversifying its product offering and exploring opportunities for accelerating growth in the coming financial year.
In line with AGP’s commitment towards growth and excellence, we have participated with our parent company Aitkenstuart Pakistan (Private) Limited through a Special Purpose Vehicle set up by Aitkenstuart for the purpose of acquisition of a selected portfolio of products which are commercialized in Pakistan under the Sandoz brand. Simultaneously, the Company is also making tireless efforts in immunization of the population against Covid-19 as it has already
obtained emergency use authorization (EUA) for the vaccine “Sputnik-V” developed by the Gamaleya National Center of Epidemiology and Microbiology, Russia. We are grateful and acknowledge the commitment and determination of DRAP and Health Ministry of Pakistan in granting registration of the Vaccine on a fast track basis.
As we look to the year ahead, AGP is committed to continue build on our competencies, implementing strategies and best governance practices to deliver to the expectations of stakeholders, contributing to a positive progress trajectory through capitalizing on organic and inorganic growth opportunities.
Acknowledgment
The Board would like to express its deep appreciation to its employees for their continued hard work, dedication and resilience in the face of adversity. Despite several difficulties, Company registered a remarkable performance with the undying support of its stakeholders.
The Board would like to place an appreciation on record to the Government and State Bank of Pakistan for introduction of a set of measures such as refinancing policies, reduction of policy rate, short-term tax reliefs and subsidies. These measures are helping to build fiscal resilience, stimulate business recovery and spur economic growth.
The Board looks forward to the forthcoming Annual General Meeting of the shareholders to discuss Company’s performance during the year 2020, and is thankful for the trust and confidence reposed in the Board and the management by the shareholders.
Nusrat MunshiChief Executive Officer
Muhammad Kamran Mirza
Non - Executive Director
103AnnualReport
2020102AGPLimited

105AnnualReport
2020104AGPLimited

107AnnualReport
2020106AGPLimited

109AnnualReport
2020108AGPLimited

111AnnualReport
2020110AGPLimited

The members of the Audit Committee are pleased to present their report to the shareholders for the year ended December 31, 2020.
Composition of the Audit Committee
The audit committee (Committee) comprises of the four (4) members. The Chairman is an independent director, who is not the Chairman of the Board. The remaining three members are non-executive directors. All the members are qualified as financially literate professional and the Committee as a whole possesses significant economic, financial and business acumen.
The Chief Executive Officer (CEO), the Chief Financial Officer (CFO) and the Internal Auditors are not members of the Committee but attended all its meetings during the year at the invitation of the Chairman. The Committee has appointed company secretary as a secretary of the committee.
Meetings of the Audit Committee
The audit committee met once every quarter primarily to review and recommend quarterly / half yearly and annual financial statements to the Board for its considerations and approval. The details of all related party transactions were placed periodically before the Committee and upon satisfaction and recommendations of the Committee, the same were placed before the Board for review and approval.
The secretary of the Committee, circulates minutes of meetings to all members, directors, head of internal audit and where required to CFO prior to the next meeting of the Board. The Chairman provides updates of the significant matters discussed in the meeting to the Board.
Financial Statements
The Committee has concluded its annual review of the Company’s performance, financial position, and cash flows during the year ended December 31, 2020, and reports that:
◆ The financial statements of the Company for the year ended December 31, 2020 have been prepared on a going concern basis under requirements of the Companies Act 2017, incorporating the requirements of the Code of Corporate Governance, International Financial Reporting Standards and other applicable regulations.
◆ These financial statements present a true and fair view of the Company state of affairs, results of operations, profits, cash flows and changes in equities of the Company for the year ended December 31, 2020.
◆ The auditors have issued unmodified audit reports in respect of the above financial statements in line with the Auditors (Reporting Obligations) Regulations, 2018 issued by SECP.
◆ Appropriate accounting policies have been consistently applied, which have been appropriately disclosed in the financial statements.
◆ The Chief Executive Officer, one Non-Executive Director and the Chief Financial Officer have endorsed the financial statements of the Company, while the Directors’ Report is signed by Chief Executive Officer and one Non-Executive Director. They acknowledge their responsibility for true and fair presentation of the Company’s financial condition and results, compliance with regulations and applicable accounting standards and establishment and maintenance of internal controls and systems of the Company.
◆ Accounting estimates are based on reasonable and prudent judgment. Proper and adequate accounting records have been maintained by the Company in accordance with the Companies Act, 2017. The financial statements comply with the requirements of
Report of the Audit Committee
the Fourth Schedule to the Companies Act, 2017.
◆ The Company has issued a “Statement of Compliance with the Code of Corporate Governance” which has also been reviewed and certified by the External Auditors of the Company.
Internal Audit Function
The internal audit function is outsourced to a well-reputed professional service firm, M/s A.F.Ferguson & Co., Chartered Accountants (AFF) who are suitably qualified and experienced for the purpose. The Company has also appointed a fulltime employee other than CFO, as Head of Internal Audit (HOIA) holding equivalent qualification prescribed under the Code of Corporate Governance 2019 (Code). The HOIA functionally report to the Committee and administratively to the CEO and his performance appraisal was done jointly by the Chairman of the Committee and the CEO.
The Audit Committee has ensured the achievement of operational, compliance, risk management, financial reporting and control objectives, safeguarding of the assets of the Company and shareholders’ wealth, through assurances provided by internal audit function.
The internal audit is conducted as per the internal audit plan duly approved by the Committee. All internal audit reports are provided for the review of external auditors. The auditors also discussed major findings in relation to the reports with the Committee, and the Committee reports matters of significance to the Board.
Coordination between the External and Internal Auditors was facilitated to ensure efficiency and contribution to the Company’s objectives including a reliable financial reporting system. At year-end meeting, the Committee met AFF along with HOIA without the presence of CEO & CFO. The management supported internal audit activities and provided all the required information on timely basis. The recommendations of the auditors were agreed and there was no point of conflict between the management and the internal auditors.
Internal Control and Risk Management
The Board has implemented the internal control system, the independent internal audit function of the Company regularly monitors the implementation of financial and operational controls, whereas the Committee reviews the effectiveness of the internal control framework. The Committee also reviewed the summary of risk assessment registers to ascertain that principal business risks are well identified and adequate action plans for mitigating risks are developed and implemented.
The Company’s approach towards risk management has been disclosed in the risk assessment portion of the Directors Report. The types and detail of risks along with mitigation measures are disclosed in relevant section of the Annual Report.
External Auditors
The statutory auditors of the Company, M/s EY Ford Rhodes, Chartered Accountants (EY), have completed their assignments of the audit of Company’s financial statements and the statement of Compliance with the Code for the year ended December 31, 2020 and shall retire on the conclusion of the 7th Annual General Meeting of the Company.
The Chairman met the EY audit team along with engagement partner Mr. Arif Nazeer at the start of the audit to ensure appropriateness of audit planning and sufficiency of resources and also discussed the possible impact of new IFRSs on the Company’s financial statements and other critical matters, if any. The Committee reviewed the Management Letter issued by external auditors along with Management’s response / actions plans. At year-end meeting, the Committee met Mr. Arif Nazeer along with his senior team members without the presence of CEO, CFO and HOIA. The Committee discussed the audit process and the observation, if any, regarding the audit of the financial statements and compliance with the applicable regulations or any other issues.
113AnnualReport
2020112AGPLimited

The Committee being satisfied with the performance of external auditors, has suggested their appointment for the year 2021 at the forthcoming Annual General Meeting of the Company.
The Audit Committee
The Audit Committee believes that it has carried out responsibilities to the full, in accordance with Terms of Reference approved by the Board, which included principally the items mentioned above and the actions taken by the Audit Committee in respect of each of these responsibilities. Evaluation of the Board’s performance, which also included members of the Audit Committee was carried out separately and is detailed in Annual Report.
Conclusion
The Committee has performed its duties and discharges its responsibilities in compliance with the Code and as per the Terms of Reference approved by the Board. The evaluation of the Committee was carried out by external independent consultant, Pakistan Institute of Corporate Governance.
Zafar Iqbal SobaniChairman - Board Audit CommitteeFebruary 25, 2021
Statementof Compliance
with Listed Companies (Code of Corporate Governance) Regulations, 2019
AGP LIMITEDYEAR ENDED 31 DECEMBER 2020
The Company has complied with the requirements of the Listed Companies (Code of Corporate Governance) Regulations, 2019 in the following manner:
1. The total number of Directors are 7 as per the following:
a. Male 06b. Female 01
2. The composition of the Board is as follows:
a. Independent Directors 02 Mr. Naved Abid KhanMr. Zafar Iqbal Sobani
b. Non-executive Directors 04
Mr. Tariq Moinuddin KhanMr. Kamran NishatMr. Mahmud Yar HirajMr. Muhammad Kamran Mirza
c. Executive Director (Female Director) 01 Ms. Nusrat Munshi
3. The Directors have confirmed that none of them is serving as a Director on more than seven listed companies, including this Company;
4. The Company has prepared a code of conduct and has ensured that appropriate steps have been taken to disseminate it throughout the Company along with its supporting policies and procedures;
5. The Board has developed a vision/mission statement, overall corporate strategy and significant policies of the Company. The Board has ensured that complete record of particulars of the significant policies along with their date of approval or updating is maintained by the Company;
6. All the powers of the Board have been duly exercised and decisions on relevant matters have been taken by the Board/ shareholders as empowered by the relevant provisions of the Companies Act, 2017 (the Act) and the Regulations;
7. The meetings of the Board were presided over by the Chairman and, in his absence,
by a Director elected by the Board for this purpose. The Board has complied with the requirements of Act and the Regulations with respect to frequency, recording and circulating minutes of meetings of the Board;
8. The Board have a formal policy and transparent procedures for remuneration of Directors in accordance with the Act and the Regulations;
9. The Board has duly complied with the Directors’ Training Program requirements and the criteria as prescribed in the Regulations;
10. The Board has approved appointment of Chief Financial Officer, Company Secretary and Head of Internal Audit, including their remuneration and terms and conditions of employment and complied with relevant requirements of the Regulations;
11. Chief Financial Officer and Chief Executive Officer duly endorsed the financial statements before approval of the Board;
12. The Board has formed following committees comprising of members given below:
115AnnualReport
2020114AGPLimited

a. Audit CommitteeMr. Zafar Iqbal Sobani - Chairman (Independent Director)Mr. Kamran Nishat - (Non-Executive Director)Mr. Mahmud Yar Hiraj - (Non-Executive Director)Mr. Muhammad Kamran Mirza - (Non-Executive Director)
b. Human Resource and Remuneration CommitteeMr. Naved Abid Khan - Chairman (Independent Director)Ms. Nusrat Munshi - (Executive Director)Mr. Mahmud Yar Hiraj - (Non-Executive Director)Mr. Muhammad Kamran Mirza - (Non-Executive Director)
c. Board Strategy CommitteeMr. Kamran Nishat - Chairman (Non-Executive Director)Ms. Nusrat Munshi - (Executive Director)Mr. Mahmud Yar Hiraj - (Non-Executive Director)Mr. Muhammad Kamran Mirza - (Non-Executive Director)
13. The Terms of Reference of the aforesaid committees have been formed, documented and advised to the committee for compliance;
14. The frequency of meetings of the committees were as per following:
a. Audit Committee: Four meetings during the financial year ended December 31, 2020.
b. HR and Remuneration Committee: Three meetings during the financial year ended December 31, 2020.
c. Board Strategy Committee: One meeting during the financial year ended December 31, 2020.
15. The Board has outsourced the internal audit function to M/s. A.F. Ferguson & Co., Chartered Accountants who are considered suitably qualified and experienced for the purpose and are conversant with the policies and procedures of the Company;
16. The statutory auditors of the Company have confirmed that they have been given a satisfactory rating under the Quality Control
Review program of the Institute of Chartered Accountants of Pakistan (ICAP) and registered with Audit Oversight Board of Pakistan, that they and all their partners are in compliance with International Federation of Accountants (IFAC) guidelines on code of ethics as adopted by the ICAP and that they and the partners of the firm involved in the audit are not close relative (spouse, parent, dependent and non-dependent children) of the Chief Executive Officer, Chief Financial Officer, Head of Internal Audit, Company Secretary or Directors of the Company;
17. The statutory auditors or the persons associated with them have not been appointed to provide other services except in accordance with the Act, these Regulations or any other regulatory requirement and the auditors have confirmed that they have observed IFAC guidelines in this regard; and
18. We confirm that all other requirements of regulations 3 (Number of Directorship), 6 (Independent Director), 7 (Female Director), 8 (Executive Director), 27 (Audit Committee), 32 (Terms of appointment of external auditor), 33 (Rotation of auditors) and 36 (Compliance Statement and Auditor Review) of the Regulations have been complied with.
Tariq Moinuddin KhanChairman of the Board
Nusrat MunshiChief Executive Officer
117AnnualReport
2020116AGPLimited

StrategicOutlookForward Looking Statement
AGP will continue to strive for sustainable growth utilizing Company’s own resources and focusing on inorganic opportunities. The Company plans to capitalize on its existing product pipeline, penetrating deeper into the domestic markets, marking the presence in international markets and strengthening our portfolio by introducing new products. Based on these measures, the Company has set a target higher than current years’ growth for both revenue and profitability.
The Company is also actively pursuing inorganic growth opportunity in hand and subject to necessary regulatory approvals, the acquisition of a selected portfolio of products which are commercialized in Pakistan under the Sandoz brand. This acquisition is likely to bring operational efficiencies, logistical synergies and enhance the product portfolio of the Company.
The Company is looking forward to a prosperous future for its employees, shareholders, partners, and customers, all of which we consider as our greatest assets.
Uncertainties that could affect entity’s resources, revenues and operations
Company’s response to critical challenges
1. Potential implications of Covid-19 AGP fully realized the vulnerabilities associated with the global outbreak of Covid-19 pandemic and geared itself to respond accordingly. Appropriate remedial actions are planned and are put in place to mitigate adverse impacts of the pandemic.
◆ Unavailability of raw materials and other inputs
The Supply Chain department is constantly monitoring raw material inventory, particularly for our top brands and building inventory where needed to avoid any potential stock out position.
We have developed alternate vendor sources where possible and required, to mitigate supply chain disruption emphasizing particularly on the supplies being sourced from India due to political instability between the two countries.
The management will maintain the inventory coverage keeping Covid-19 implications in close considerations.
◆ Loss of production due to absenteeism of human resources
The Production department is managing the continuous production of our healthcare products by following Covid-19 protocols and SOPs.
In times of need, labor mobility was ensured through provision of conveyance facilities with proper SOPs.
As and when necessary, extra workers shifts will be promulgated to ensure that social distancing is maintained on the production floors.
◆ Disruptions in distribution network for supplies of healthcare products
The Company has adopted a thorough and highly adaptable strategy to make sure that the supplies of its medicines is available in the market all the time.
Close monitoring of the market dynamics and needs and robust distribution planning will ensure that general public have access to essential medicines.
2. Increase in cost of doing business due to devaluation of the Pakistani rupee and domestic inflation
To contain the devaluation impact, we have substituted bulk of our dollar denominated Chinese imports into Chinese Yuan.
The Company is actively pursuing geographical diversification and is in search for feasible international markets to penetrate. This will help the Company in acquiring valuable foreign currency, hedging the risks of PKR devaluation.
The Company looks forward for favorable Government policies and measures to facilitate business environment, and Drug Regulatory Authority Pakistan (DRAP) in particular to support the pharmaceutical industry. The annual CPI linked price increase will continue to mitigate the impact of devaluation and monetary tightening to some extent.
3. PESTEL factors We keep a stringent eye on the external environment to remain mindful of the potential opportunities and possible uncertainties. The detailed PESTEL analysis, describing a framework of macro-environmental factors used in the environmental scanning, is mentioned on page 22 and 23 in Company’s overview section.
Performance Analysis and Progress Made over Last Year’s Statement
Driven by its relentless commitment to provide affordable and reliable health care solutions, AGP has continued its journey towards operational and financial excellence with pride and passion. Accordingly, the Company achieved double digit growth of 11.1% in revenue. Impressive topline performance together with focus on cost effectiveness has translated in to an increase of 9.8% in profitability. In line with the Company’s aim to establish its presence across borders, Afghanistan sales have experienced a robust growth as it penetrated further in the Afghanistan pharmaceutical market. To support sales growth and enhance the product portfolio, the Company introduced 4 products. The new launches include Zapol, our sanitizer prepared as per WHO formula and Test Kits to detect the presence of Covid-19 antibodies within 15 minutes. In our dedication to expand our horizons and open new avenues, nutraceutical plant, that was acquired last year, commenced operations in the last quarter of the year.
Sources of Information and Assumptions Used
A holistic view of past trends, prevailing market conditions and future expectations are embedded in the framework for development of business forecasts and projections. Comprehensive information from critical functions of the Company, including but not limited to Marketing and Sales, Production and Operations, Quality Management & Finance along with external industry and market analysis is used for the planning. External factors that are relevant and appropriate in the circumstances, such as macro and micro economic indicators, market trends, availability of active pharmaceutical ingredients, data from regulatory authorities and research companies and competitors’ actions etc. are also taken into account when devising future plans.
These forecasts are adopted as budget after approval by the Board of Directors. Periodic reviews of performance against the budget is done to ensure adequate monitoring and control. Corrective actions including amendment of budget and reallocation of resources are initiated, if required. New ventures have to pass through an extensive due diligence process encompassing the technical, financial and regulatory feasibility studies with an involvement of core management team and external experts, if and when required.
119AnnualReport
2020118AGPLimited


2020In NumbersFinancial KPIs Non-Financial KPIs
123AnnualReport
2020122AGPLimited

KEY PERFORMANCE INDICATORS Unit 2020 2019 2018 2017 2016
Profitability RatiosGross profit to sales % 55.6 58.5 56.5 60.8 58.5 Net profit to sales % 22.9 23.1 22.4 26.1 25.8 EBITDA margin to sales % 32.0 34.9 32.1 36.4 38.9 Operating leverage ratio Times 0.1 1.6 0.1 0.4 1.5 Return on equity % 19.3 19.4 19.0 22.4 25.4 Return on Capital Employed % 17.7 17.3 15.3 16.1 14.2
Liquidity RatiosCurrent ratio Times 1.7 1.6 1.4 1.3 0.9 Quick / Acid test ratio Times 0.9 0.9 0.8 0.8 0.6 Cash to Current Liabilities Times 0.25 0.09 0.02 0.02 0.25Cash flow from operations to Sales Times 0.2 0.2 0.2 0.2 0.2
Investment / Market RatiosEarnings per share (EPS) and diluted EPS PKR 5.7 5.2 4.3 4.4 3.9 Price Earnings ratio Times 20.1 19.2 20.3 N/A N/APrice to Book ratio Times 3.9 3.7 3.8 N/A N/ADividend Yield ratio % 1.8 3.3 1.4 N/A N/ADividend Payout ratio % 35.3 62.9 29 N/A N/ADividend per share PKR 2.0 3.3 1.3 N/A N/AMarket value per share - at the year end PKR 113.9 99.4 87.4 N/A N/A - high during the year PKR 126.9 99.7 107.2 N/A N/A - low during the year PKR 73.0 51.5 68.4 N/A N/ABreakup value per share PKR 29.3 26.7 22.7 19.7 15.3
Capital Structure RatiosFinancial leverage ratio Times 0.1 0.2 0.3 0.4 0.8 Weighted average cost of debt % 12.3 14.0 8.8 10.6 22.0Debt to Equity ratio (as per book value) Times 0.1 0.2 0.3 0.4 0.8 Debt to Equity ratio (as per market value) Times 0.03 0.04 0.07 N/A N/AInterest Cover ratio Times 13.7 9.0 8.1 5.8 4.2
Activity / Turnover RatiosTotal Assets turnover ratio Times 0.7 0.7 0.6 0.6 0.5 Fixed assets turnover ratio Times 0.9 0.8 3.0 3.0 3.0 No. of Days in Inventory Days 130 127 114 117 98 No. of Days in Receivables Days 32 29 32 31 27 No. of Days in Creditors Days 100 106 114 143 113 Operating Cycle Days 63 51 33 4 12
FinancialRatios
Profitability Ratios
Despite economic headwinds due to Covid-19
pandemic, the Company is able to register a double
digit growth of 11.1% in the revenue. However,
the resilient growth in topline could not be fully
translated as the gross profit margin experienced
a decrease to 55.6% from 58.5%, owing to the one-
off provisioning of Covid-19 antibody test kits as the
same became redundant due to rapidly evolving
technology and devaluation of Pakistani rupee.
However, the Company is able to maintain its net
profit margin as the marketing and travel related
costs were contained due to Covid-19 restrictions.
Further, finance cost has been reduced due to
decrease in policy rate as announced by State Bank
of Pakistan whereas taxation expense has reduced
as there was no super tax provision in the current
year as compared to the last year. The return on
capital employed increased by around 41 bps as the
Company timely settled its liabilities, indicating an
increase in the efficiency of its employed resources.
Liquidity Ratios
The Current ratio rose to 1.7 times, attaining its peak
in the last five years. This indicates that the Company
is constantly improving its ability to meet its short
term obligations, an excess of around 70% in the form
of current assets. Due to the improvement in early
settlement of liabilities, quick ratio increased to 0.9
times which is higher than the last five years.
Investment / Market Ratios
The Company’s share traded on Pakistan Stock
Exchange between the range of PKR 73.0 to PKR
126.9, with year-end share price closing at PKR 113.9
against PKR 99.4 in 2019. The earnings per share
improved to PKR 5.67 per share as compared to PKR
5.17 per share as a result of better sales performance
and financial and operational efficiencies.
The dividend policy of the Company maintained
a strategic balance between retaining equity for
profitable ventures and paying out dividend to its
shareholders. Contributing with this objective for
growth and development and yielding sufficient
operational gains for our shareholders, the
Company’s Board of Directors have approved a total
dividend of PKR 2.0 per share.
Capital Structure Ratios
Debt to Equity Ratio improved to 0.1 from 0.2 last
year, owing to timely repayment of long term debt.
The interest cover ratio has increased to a five-year
high of 13.7 times, demonstrating improvement
in the Company’s ability to settle its financial
obligations as financial cost has decreased resulting
in increase in net profits.
Activity / Turnover Ratios
The total assets turnover ratio has continued its
trajectory of a steady increase which shows that
the Company’s ability to generate sales from its
assets has improved. This has been backed by an
increase in the fixed assets turnover ratio. Despite the
challenges caused by Covid-19, the Company ensured
continuity in production and operation, including
higher buffer stock levels. Hence, the operating
cycle was recorded at 63 days as the number of
days in inventory increased by 3, number of days
in receivable increased by 3 and number of days in
payable decreased by 6.
Methods and Assumptions Used in Compiling the Key PerformanceIndicators
The Company has set financial and non-financial
indicators to track progress against strategic
objectives. Sales are monitored regularly and
future lines of actions are decided accordingly. The
Company analyses a number of internal and external
factors including availability and quality of in-house
resources, economic indicators, geopolitical situation,
competitors’ positioning and general market trends
while compiling KPIs. These indicators have been
compiled through methodologies widely used
in the industry and are reviewed regularly by the
Management Team and on quarterly basis by the
Board to take appropriate corrective actions when
and where necessary.
Ratio Analysis
125AnnualReport
2020124AGPLimited

Gross profit to sales
58.5%
60.8%
56.5%
58.5%
55.6%
2016
2017
2018
2019
2020
EBITDA margin to sales
38.9%
36.4%
32.1%
34.9%
32.0%
2016
2017
2018
2019
2020
Return on equity
25.4%
22.4%
19.0%
19.4%
19.3%
2016
2017
2018
2019
2020
Current ratio
0.9
1.3
1.4
1.6
1.7
2016
2017
2018
2019
2020
Cash to Current Liabilities
0.25
0.020.02
0.09
0.25
2016
2017
2018
2019
2020
Net profit to sales
25.8%
26.1%
22.4%
23.1%
22.9%
2016
2017
2018
2019
2020
Return on Capital Employed
14.2%
16.1%
15.3%
17.3%
17.7%
2016
2017
2018
2019
2020
Quick / Acid test ratio
0.6
0.8
0.8
0.9
0.9
2016
2017
2018
2019
2020
Earnings per share (PKR)
3.9
4.4
4.35.2
5.7
2016
2017
2018
2019
2020
Interest Cover ratio
4.2
5.8
8.1
9.0
13.7
2016
2017
2018
2019
2020
Fixed Asset Turnover Ratio
3.0
3.0
3.0
0.8
0.9
2016
2017
2018
2019
2020
Weighted average cost of debt
22.0%
10.6%
8.8%
14.0%
12.3%
2016
2017
2018
2019
2020
Cash flow from operations to Sales
0.25
0.20
0.18
0.24
0.23
2016
2017
2018
2019
2020
Debt to Equity ratio
0.79
0.39
0.26
0.16
0.13
2016
2017
2018
2019
2020
Total assets turnover ratio
0.5
0.6
0.6
0.7
0.7
2016
2017
2018
2019
2020
Financial leverage ratio
0.8
0.4
0.3
0.2
0.1
2016
2017
2018
2019
2020
Graphical Presentation of Financial Ratios
127AnnualReport
2020126AGPLimited

DuPontAnalysis
Dupont Analysis 2020 2019
Tax burden 82% 79%
Interest burden 93% 89%
EBIT margin 30% 33%
Asset turnover (times) 0.7x 0.7x
Leverage 13% 16%
Return on equity 19% 19%
19%Return on
Equity
16%Return on
Asset
81%EquityRatio
23%NP Margin
0.7Asset
Turnover(Times)
8,210Equity
10,191Total
Assets
1,587Net Profit
6,946Revenue
10,191Total
Assets
1,980Total
Liabities
8,210Equity
6,946Revenue
5,359Total cost
7,615Non-Current
Assets
2,575CurrentAssets
472Non-Current
Liabiities
1,508Current
Liabilities
PKR in Million
FreeCash Flows
EconomicValue Added
2020 2019 2018
---------PKR in Million---------NOPAT 2,192 2,002 1,546
Cost of Capital (1,054) (1,262) (1,084)
Economic value added 1,138 740 462
The topline recorded at PKR 6,946 Million, a growth of 11.1% over the last year, on the back of strong
performance of the domestic retail portfolio supported by the robust growth in sales to Afghanistan.
Despite an increase in the administrative costs owing to the preventative measures against Covid-19, the
marketing costs were contained due to travel related restrictions, finance costs reduced due to a reduction in
the policy rate by State Bank of Pakistan, and taxation expenses reduced as there was no super tax provision
in the current year. Resultantly, the bottom-line increased to PKR 1,587 Million, a growth of 9.8% over the last
year, reflecting a net profit margin of 23%.
Total assets of the Company witnessed an increase of 6.1%, driven mainly by capital investment for
nutraceutical facility and balancing, modernization and restructuring of existing plants to enhance capacities
and efficiencies. The stock in trade was maintained at an optimum inventory levels. This resulted in an asset
turnover of 0.7 times and in turn, return on assets of 16%.
The Company continued its settlement of long term financing on a timely basis and hence, the total liabilities
reduced by 7.4%. On the other hand, owner’s equity increased by 10% to PKR 8.2 Billion, improving the equity
ratio to 81% from 78% last year. As a result of these factors, the Company recorded a return on equity of 19%.
Economic value added (EVA) is a measure of a company’s financial performance based on the residual wealth
calculated by deducting its cost of capital from its operating profit, adjusted for taxes on cash basis (NOPAT).
2020 2019 2018 2017 2016
---------------------- PKR in Million ----------------------
Profit before taxation 1,927 1,825 1,426 1,333 1,168
Adjustment of non-cash items 432 494 382 450 537
Changes in working capital (292) (119) (322) (132) 43
2,067 2,200 1,486 1,652 1,748
Less: Capital Expenditures (381) (433) (337) (194) (125)
Free cash flows 1,687 1,767 1,149 1,458 1,622
129AnnualReport
2020128AGPLimited

VerticalAnalysis
(PKR in Million)---- 2020 ---- ---- 2019 ---- ---- 2018 ---- ---- 2017 ---- ---- 2016 ----
PKR % PKR % PKR % PKR % PKR %
Statement of Financial Position
Assets
Non-current AssetsProperty, plant & equipment 2,203 21.6 1,977 20.6 1,685 18.8 1,479 17.3 1,393 16.4 Intangible assets 5,398 53.0 5,395 56.2 5,398 60.2 5,385 63.2 5,402 63.5 Long-term loans, deposits & receivables 14 0.1 14 0.1 12 0.1 11 0.1 9 0.1
7,615 74.7 7,385 76.9 7,095 79.2 6,875 80.6 6,804 79.9 Current AssetsStores, spares and loose tools 7 0.1 7 0.1 7 0.1 7 0.1 7 0.1 Stock-in-trade 1,184 11.6 1,013 10.6 797 8.9 670 7.9 513 6.0 Trade debts 705 6.9 523 5.4 483 5.4 467 5.5 345 4.1 Loans and advances 30 0.3 34 0.4 67 0.7 48 0.6 58 0.7 Trade deposits, prepayments and other receivables 31 0.3 88 0.9 5 0.1 7 0.1 4 0.0
Taxation – net 248 2.4 435 4.5 483 5.4 423 5.0 280 3.3 Cash and bank balances 370 3.6 117 1.2 24 0.3 30 0.4 502 5.9
2,575 25.3 2,216 23.1 1,868 20.8 1,652 19.4 1,709 20.1
Total Assets 10,191 100.0 9,602 100.0 8,963 100.0 8,527 100.0 8,513 100.0
Equity & Liabilities
EquityShare Capital 2,800 27.5 2,800 29.2 2,800 31.2 2,800 32.8 2,800 32.9 Revenue reserve 5,410 53.1 4,663 48.6 3,568 39.8 2,711 31.8 1,477 17.4
8,210 80.6 7,463 77.7 6,368 71.0 5,511 64.6 4,277 50.2 Non-Current LiabilitiesLong-term financing 400 3.9 717 7.5 1,192 13.3 1,673 19.6 2,231 26.2 Deferred grant 8 0.1 - - - - - - - - Gas infrastructure development cess 8 0.1 - - - - - - - -
Deferred Taxation 56 0.6 71 0.7 59 0.7 41 0.5 26 0.3 472 4.6 788 8.2 1,251 14.0 1,714 20.1 2,257 26.5
Current liabilitiesTrade and other payables 837 8.2 846 8.8 660 7.4 801 9.4 692 8.1 Unclaimed dividend 2 0.0 1 0.0 31 0.3 - - - - Accrued interest 4 0.0 13 0.1 18 0.2 11 0.1 127 1.5 Short-term borrowings - - - - 145 1.6 - - 22 0.3 Current maturity of long-term financing 665 6.5 491 5.1 490 5.5 490 5.7 1,138 13.4
1,508 14.8 1,351 14.1 1,344 15.0 1,302 15.3 1,979 23.2
Total Equity & Liabilities 10,191 100.0 9,602 100.0 8,963 100.0 8,527 100.0 8,513 100.0
Statement of profit or loss
Net sales 6,946 100.0 6,253 100.0 5,382 100.0 4,725 100.0 4,206 100.0 Cost of sales 3,086 44.4 2,594 41.5 2,341 43.5 1,851 39.2 1,746 41.5Gross profit 3,861 55.6 3,659 58.5 3,041 56.5 2,874 60.8 2,460 58.5
Administrative expenses 227 3.3 158 2.5 127 2.4 134 2.8 109 2.6 Marekting & selling exenses 1,404 20.2 1,294 20.7 1,153 21.4 1,050 22.2 763 18.1 Other expenses 183 2.6 167 2.7 152 2.8 100 2.1 102 2.4 Other income 32 0.5 11 0.2 17 0.3 20 0.4 42 1.0 Finance cost 152 2.2 227 3.6 200 3.7 277 5.9 361 8.6
Profit before tax 1,927 27.7 1,825 29.2 1,426 26.5 1,333 28.2 1,168 27.8 Taxation 339 4.9 378 6.1 220 4.1 100 2.1 81 1.9 Profit after tax 1,587 22.9 1,446 23.1 1,206 22.4 1,234 26.1 1,087 25.8
Graphical Presentation ofVertical Analysis
2016
2017
2018
2019
2020
4,206 2,460 1,529 1,168 1,087
4,725 2,874 1,610 1,333 1,234
5,382 3,041 1,626 1,426 1,206
6,253 3,659 2,052 1,825 1,446
6,946 3,861 2,078 1,927 1,587
Profit After TaxProfit Before TaxOperating ProfitsGross ProfitNet Sales
Property, Plant and Equipment (PPE)
Non-Current Assets (Excluding PPE)
Current Assets
2020 2019 2018 2017 20160
10
20
30
40
50
60
70
80
90
100
21.6
53.1
25.3
20.6
56.3
23.1
18.8
60.4
20.8
17.3
63.3
19.4
16.4
63.6
20.1
Equity
Non-Current Liabilities
Current Liabilities
0
10
20
30
40
50
60
70
80
90
100
2020 2019 2018 2017 2016
80.6
4.6
14.8
77.7
8.2
14.1
71.0
14.0
15.0
64.6
20.1
15.3
50.2
26.5
23.2
Financial Position Analysis - Assets(Percentage)
Profit or Loss Analysis
Financial Position Analysis - Equity & Liabilities (Percentage)
131AnnualReport
2020130AGPLimited

HorizontalAnalysis
(PKR in Million)
2020PKR
20vs19%
2019 PKR
19vs18%
2018PKR
18vs17%
2017PKR
17vs16%
2016PKR
Statement of Financial Position
Assets
Non-Current AssetsProperty, plant and equipment 2,203 11.5 1,977 17.3 1,685 14.0 1,479 6.1 1,393
Intangible assets 5,398 0.1 5,395 (0.06) 5,398 0.2 5,385 (0.3) 5,402
Long-term loans, deposits and receivables 14 6.1 14 13.3 12 9.9 11 26.6 9
7,615 3.1 7,385 4.1 7,095 3.2 6,875 1.0 6,804 Current AssetsStores, spares and loose tools 7 5.3 7 (9.0) 7 10.9 7 3.1 7 Stock-in-trade 1,184 16.9 1,013 27.1 797 19.0 670 30.6 513 Trade debts 705 35.0 523 8.1 483 3.6 467 35.1 345 Loans and advances 30 (11.4) 34 (49.4) 67 38.8 48 (17.5) 58 Trade deposits, prepayments and other receivables 31 (64.6) 88 1,512.4 5 (23.7) 7 100.6 4
Taxation – net 248 (43.1) 435 (10.1) 483 14.2 423 51.1 280 Cash and bank balances 370 215.6 117 379.7 24 (19.4) 30 (94.0) 502
2,575 16.2 2,216 18.6 1,868 13.1 1,652 (3.3) 1,709
Total Assets 10,191 6.1 9,602 7.1 8,963 5.1 8,527 0.2 8,513
Equity & Liabilities
EquityShare Capital 2,800 - 2,800 - 2,800 - 2,800 - 2,800 Revenue reserve 5,410 16.0 4,663 30.7 3,568 31.6 2,711 83.5 1,477
8,210 10.0 7,463 17.2 6,368 15.6 5,511 28.9 4,277
Non-Current liabilitiesLong-term financing 400 (44.3) 717 (39.8) 1,192 (28.8) 1,673 (25.0) 2,231 Deferred grant 8 100.0 - - - - - - - Gas infrastructure development cess 8 100.0 - - - - - - - Deferred Taxation 56 (20.8) 71 20.2 59 43.7 41 57.9 26
472 (40.1) 788 (37.0) 1,251 (27.0) 1,714 (24.1) 2,257
Current liabilitiesTrade and other payables 837 (1.0) 846 28.0 660 (17.5) 801 15.7 692 Unclaimed dividend 2 75.5 1 (96.9) 31 100.0 - - - Accrued interest 4 (70.8) 13 (26.4) 18 63.6 11 (91.3) 127 Short-term borrowings - - - (100.0) 145 100.0 - (100.0) 22 Current maturity of long-term financing 665 35.5 491 0.3 490 - 490 (57.0) 1,138
1,508 11.7 1,351 0.5 1,344 3.3 1,302 (34.2) 1,979
Total Equity & Liabilities 10,191 6.1 9,602 7.1 8,963 5.1 8,527 0.2 8,513
Statement of profit or loss
Net sales 6,946 11.1 6,253 16.2 5,382 13.9 4,725 12.3 4,206 Cost of sales 3,086 19.0 2,594 10.8 2,341 26.5 1,851 6.0 1,746 Gross profit 3,861 5.5 3,659 20.3 3,041 5.8 2,874 16.8 2,460
Administrative expenses 227 43.6 158 24.1 127 (5.1) 134 23.2 109 Marekting & selling exenses 1,404 8.5 1,294 12.2 1,153 9.9 1,050 37.6 763 Other expenses 183 9.7 167 10.2 152 52.1 100 (1.9) 102 Other income 32 180.4 11 (33.6) 17 (13.0) 20 (53.6) 42 Finance cost 152 (33.1) 227 13.5 200 (27.8) 277 (23.3) 361
Profit before tax 1,927 5.6 1,825 28.0 1,426 6.9 1,333 14.2 1,168 Taxation 339 (10.3) 378 72.1 220 120.9 100 23.1 81 Profit after tax 1,587 9.8 1,446 20.0 1,206 (2.3) 1,234 13.5 1,087
Graphical Presentation ofHorizontal Analysis
11.5
17.3
14.0
6.1
3.1 4.1 3.21.0
16.2
18.6
13.1
(3.3)-5
0
5
10
15
20
Property, Plant andEquipment (PPE)
Non-CurrentAssets (Excluding PPE)
Current Assets
20 vs 19 19 vs 18 18 vs 17 17 vs 16
20 vs 19 19 vs 18 18 vs 17 17 vs 16
(50.0)
(40.0)
(30.0)
(20.0)
(10.0)
-
10.0
20.0
30.0
40.0
Equity Non-Current Liabilities Current Liabilities
Financial Position Analysis - Equity & Liabilities (Percentage)
40.1 37.0
27.024.1
10.0
17.2 15.6
28.9
11.7
0.5 3.3
34.2
Financial Position Analysis - Assets(Percentage)
133AnnualReport
2020132AGPLimited

Summary of Cash FlowStatement
2 0 2 0 2 0 1 9 2 0 1 8 2 0 1 7 2 0 1 6
------------------ (PKR in Million) ------------------------------------- (PKR in Million) -------------------
CASH FLOW FROM OPERATING ACTIVITIES
Net profit before taxation 1,927 1,825 1,426 1,333 1,168
Adjustments for non cash & other items 432 494 382 450 537
Changes in working capital (292) (119) (322) (132) 43
Cash generated from operations 2,067 2,200 1,486 1,652 1,748
Finance costs paid (161) (232) (168) (373) (418)
Income tax paid (167) (318) (261) (228) (214)
Statutory charges paid (150) (144) (89) (115) (73)
Net cash flows generated from operating activities 1,590 1,507 967 936 1,043
CASH FLOWS FROM INVESTING ACTIVITIES
Fixed capital expenditure (381) (433) (337) (194) (125)
Proceeds from disposal of operating fixed assets 8 12 14 16 19
Others 13 5 5 (2) -
Net cash flows used in investing activities (360) (415) (318) (180) (106)
CASH FLOWS FROM FINANCING ACTIVITIES
Dividend paid (839) (380) (319) - -
Long-term financing repaid - net (137) (474) (480) (1,206) (1,116)
Net cashflows used in financing activities (977) (854) (799) (1,206) (1,116)
Net increase / (decrease) in cash & cash equivalents 253 238 (151) (450) (179)
Cash & cash equivalents at the beginning of the year 117 (121) 30 480 659 Cash & cash equivalents at the end of the year 370 117 (121) 30 480
2020 2019 2018 2017 2016
------------------ (PKR in Million) ------------------
Property, plant & equipment 2,203 1,977 1,685 1,479 1,393
Intangible assets 5,398 5,395 5,398 5,385 5,402
Long-term deposits and receivables 14 14 12 11 9
Non-Current Assets 7,615 7,385 7,095 6,875 6,804
Current Assets 2,575 2,216 1,868 1,652 1,709
Total Assets 10,191 9,602 8,963 8,527 8,513
Share Capital 2,800 2,800 2,800 2,800 2,800
Revenue Reserve 5,410 4,663 3,568 2,711 1,477
Total Equity 8,210 7,463 6,368 5,511 4,277
Non-Current liabilities 472 788 1,251 1,714 2,257
Current liabilities 1,508 1,351 1,344 1,302 1,979
Total Liabilities 1,980 2,139 2,595 3,016 4,236
Total Equity & Liabilities 10,191 9,602 8,963 8,527 8,513
Summary of Statement of Financial Position
Summary of Statement of Profit or Loss
2020 2019 2018 2017 2016------------------------- (PKR in Million) -------------------------
Net sales 6,946 6,253 5,382 4,725 4,206
Gross profit 3,861 3,659 3,041 2,874 2,460
Operating profit 2,078 2,052 1,626 1,610 1,529
Profit before tax 1,927 1,825 1,426 1,333 1,168
Taxation 339 378 219 100 81
Profit after tax 1,587 1,446 1,207 1,234 1,087
135AnnualReport
2020134AGPLimited

Graphical Presentationof Statement of FinancialPosition and Profit or Loss
SUMMARY OF PROFIT OR LOSS
4,725 1,851134
1,050100
277100
2017
2020 6,946 3,086227
1,404
183152
339
2019 6,253 2,594158
1,294
167227
378
2018 5,382 2,341127
1,153152
200219
2016 4,206 1,746109
763102
36181
Net SalesCost of SalesAdministration ExpensesMarekting & Selling ExensesOther ExpensesFinance CostTaxation
SUMMARY OF FINANCIAL POSITION - ASSETS
2020 2,203 5,398 1,184 705 370 316
2016 1,393 5,402 513 345 502 349
1,479 5,385 670 46730
4852017
1,685 5,398 797 48324
5632018
1,977 5,395 1,013 523117
5632019
PPEIntangiblesStock-in-TradeTrade DebtsCashOther Current Assets
SUMMARY OF FINANCIAL POSITION - EQUITY & LIABILITIES
2016 2,800 1,477 2,23126
692 1,138
2,800 2,711 1,67341
801 4902017
2,800 3,568 1,19259
660 4902018
2,800 4,663 71771
846 4912019
2,800 5,410 40056
837 6652020
EquityRevenue ReserveLong Term LoanDeferred TaxTrade PayablesCurrent Maturity of LTL
Statement of Cash Flows -Direct Method
2 0 2 0 2 0 1 9----- (Rupees in ‘000) -----
CASH FLOWS FROM OPERATING ACTIVITIES
Cash received from customer - net 6,763,600 6,219,312
Cash paid to supplier / employees / service providers (4,696,229) (4,018,563)
Finance costs (161,171) (232,161)
Income tax (166,786) (317,595)
Workers' Profit Participation Fund (105,937) (96,046)
Workers' Welfare Fund (24,307) (32,381)
Central Research Fund (19,664) (15,346)
Net cash flows generated from operating activities 1,589,506 1,507,220
CASH FLOWS FROM INVESTING ACTIVITIES
Fixed capital expenditure (380,568) (433,088)
Proceeds from disposal of operating fixed assets 7,521 12,465
Long-term deposits and receivables (825) -
Interest income received 13,745 5,138
Net cash flows used in investing activities (360,127) (415,485)
CASH FLOWS FROM FINANCING ACTIVITIES
Dividend paid (839,268) (380,087)
Long-term financings repaid - net (137,485) (473,940)
Net cashflows used in financing activities (976,753) (854,027)
Net increase in cash and cash equivalents 252,626 237,708
Cash and cash equivalents at the beginning of the year 117,154 (120,554)
Cash and cash equivalents at the end of the year 369,780 117,154
137AnnualReport
2020136AGPLimited

Five YearAnalysisStatement of Financial Position Analysis
Assets
The overall non-current assets have increased by PKR 811 Million over last five years mainly because capital expenditures of PKR 1,470 Million over 5 years were offset by depreciation and disposals. The majority of the capital expenditures were incurred for balancing, modernization and replacements of plant and machinery to enhance and upgrade manufacturing capacities and operational efficiencies of the Company. In recent years, sizable investments were made in developing state of the art nutraceutical production capabilities and construction of a new office block. The Company has a plan to utilize old office building for expansion of manufacturing facility area.
A nutraceutical plant was purchased in 2019 and modernized during 2020 with a total capital outlay of PKR 220 Million. The facility has commenced operations in the last quarter of the year. Further, an office block is being constructed with a capital expenditure of PKR 230 Million until December 2020. The Company also purchased 0.5acre land in 2018 for future expansion for PKR 35 Million.
The current assets have increased by PKR 867 Million in last 5 years due to investment in working capital to manage business operations. In line with business volume, stock-in-trade is recorded at PKR 1,184 Million, showing an increase of more than 2 times over the last 5 years. The Company is maintaining optimum level of inventory to ensure uninterrupted production particularly in view of supply disruptions due to Covid-19 pandemic. The Company has maintained number of days in receivables at around 32 days and have increased by PKR 360 million over the last 5 years which is in line with growth in revenue of the Company.
Equity and Liabilities
The equity of the Company comprises of Shareholder’s equity and revenue reserves. The Company’s equity increased to over PKR 8.2 Billion from PKR 4.3 Billion over the last 5 years after adjustments for dividend payments to shareholders of PKR 1.54 Billion. There were no further changes on the Company’s equity during the period; the Company was enlisted on the Pakistan Stock Exchange in 2018.
The long term liability has decreased as the Company settled its long term debts of PKR 2,624 Million with internal sources over the last 5 years. The Company has restructured its long term debts from syndicate finance arrangement in June 2017 by issuing 5-year Sukuk bonds which enabled the Company to avail lower financing costs due to floating rate of mark-up associated with Sukuk certificates. Also the principal repayments were reduced significantly as the remaining syndicate finance in 2017 was converted into Sukuk bonds with 5-year term. Further, the Company has availed Refinance Scheme for Payment of Wages & Salaries introduced by the State Bank of Pakistan to the tune of PKR 315 Million.
The current liabilities have reduced by PKR 471 Million in last 5 years majorly due to reduction of current payments of long term liabilities, as more fully explained in the preceding paragraph. Number of days in creditors have improved and increase in trade payables have is in line with the growth in business operations.
Statement of Profit & Loss Analysis
Net Revenue
The revenue of the Company has grown with a cumulative average growth rate (CAGR) of 12.0%, better than the industry CAGR of 11.5% over the last 5 years as per MAT Q4 2020 Industry Report issued by IQVIA Solutions Pakistan Pvt Ltd. With
renewed focus on growth, the company has launched 31 new products and line extensions during the period which cumulatively added PKR 900 Million in 2020.
The increase in sales is mainly on the back of strong performance of the domestic retail portfolio aptly supported by robust growth in exports. The Company changed its export partner in Afghanistan in 2019 which has yielded substantial increase in Afghanistan sales.
Cost of Sales
The year 2020 was a tough year due to economic headwinds posed by the Covid-19 pandemic. Adding to the challenges, the Company recorded a one-off provisioning of Covid-19 antibody test kits as they became redundant due to rapidly evolving technology. Significant devaluation of local currency, substantial rise in domestic inflation and utility rates have caused cost of sales to increase considerably over the period. However, one-time price adjustment allowed by Drug Regulatory Authority of Pakistan (DRAP) along with a CPI based price increase in the wake of devaluation of Pak Rupee and domestic inflation, supported the industry to partially mitigate the sharp increase in the cost of doing business. The Company has always focused to bring efficiency in operations and resultantly Company’s cost economization efforts along with business-friendly measures taken by DRAP has enabled the Company to maintain impressive gross margins in excess of 55% throughout the period.
Expenditures
The increase in administrative and marketing expenses is mainly on account of strengthening of human resources required to support growing business needs of the Company. Addition of nutraceutical plant has also augmented expenditures whereas economic benefits associated with the business proposition will flow to the entity in the short term to medium term. Upsurge in domestic inflation and utility rates have also led business expenditures to rise. Despite these factors, Company’s resilient focus on cost containment has enabled the Company to contain expenses well within the average
industry range.
Finance costs have decreased substantially as the principal payment of outstanding loans has decreased due to timely payments and reduction in policy rates. The tax expense were lower in 2016 to 2017 as group tax benefits were claimed on acquisition related expenses.
Net Profit
In spite of rising costs of doing business due to macroeconomic factors and challenges posed by Covid-19 in 2020, the impressive top-line performance coupled with efficient cost control measures have led the Company to achieve double digit CAGR of 10% in net profit over the 5 years period.
Cash flow Analysis
Operating Activities
The cash flow from operating activities grew with a CAGR of 11.1% in the 5 years period which is in line with the CAGR of sales and net profit. The finance costs have reduced as the long term liabilities are decreasing due to timely repayments of loan instalments.
Due to efficient tax management, the payments for income tax have decreased significantly as the Company has managed to realize and settle tax refunds of earlier years.
Investing Activities
Capital investments of PKR 1,470 Million were made during the last 5 years mainly for balancing, modernization and replacement of plant and machinery as more fully explained in the opening paragraph of assets in the Statement of Financial Position Analysis.
Financing Activities
The Company paid dividends of PKR 3.00, PKR 1.25 and PKR 1.25 per shares in 2020, 2019 and 2018 respectively aggregating to PKR 1.54 Billion. Net principal repayments of long term liabilities cumulating to PKR 3.4 Billion are being made as agreed schedules with the financial institutions.
139AnnualReport
2020138AGPLimited

Share PriceSensitivity Analysis
HIGHLOW
VOLUMECLOSE
KEY
0
200
400
600
800
1,000
1,200
1,400
Jan-20 Feb-20 Mar-20 Apr-20 May-20 Jun-20 Jul-20 Aug-20 Sep-20 Oct-20 Nov-20 Dec-20
80.0
100.0
120.0
VOLUME SHARE PRICE
Share Price Movement
Share Price Information
The Company’s shares are listed on the Pakistan Stock Exchange (PSX), which represents the Country’s capital market. The Company’s share price is affected by both internal and external factors. The Company’s financial performance directly impacts its share price. External factors, such as economic and political environment of the Country, Government regulations, macro-economic indicators and stakeholder view impact the share price. During the year, AGP’s share price remained an attraction for investors due to continuous improvement in revenue and profitability despite challenging socio economic environment. The movement of AGP’s share price throughout the year is shown below.
Market Capitalization and Sensitivity Analysis
The capital market witnessed a growth of 2.9% during the year, recording a market capitalization of PKR 8,035 Billion, up from PKR 7,812 Billion in the preceding year. KSE-100 index also rose to 43,755 points from 40,735 points at the end of the year, registering an increase of 7.4% compared to the last year. The share price of AGP outperformed the market and its market capitalization improved to PKR 31.9 Billion from PKR 27.8 Billion, an increase of 14.6%, while there has been no change in the number of shares outstanding of the Company throughout the year.
CAPEXRationalizationDuring the year 2020, the Company made capital investment of PKR 381 Million through internally generated funds. The funds were maily utilized for nutraceutical facility revamping and improving construction of new office block and for (BMR) of plant and machinery.
The Company plans to incur capital expenditure to complete the new office block in the next year. Further investment will be made in BMR to enhance capacities and efficiencies.
A nutraceutical plant was purchased in 2019 and further modernized during 2020 with a total capital outlay of PKR 220 Million which has commenced operations in the last quarter of 2020. Furthermore, an office block has been constructed and is in final stages of completion, with a capital expenditure for PKR 230 Million. The Company also purchased 0.5acre land in 2018 for future expansion for PKR 35 Million.
Statement of Unreserved Compliance of International Financial Reporting Standards (IFRS)
The Company’s Financial statements have been prepared in accordance with the accounting and reporting standards as applicable in Pakistan, which comprise of:
◆ International Financial Reporting Standards (IFRSs), issued by the International Accounting Standards Board (IASB) as are notified under the Companies Act, 2017;
◆ Provisions of and directives issued under the Companies Act, 2017.
Where the provisions of and directives issued under the Companies Act, 2017 differ from IFRS Standards, the provisions of and directives issued under the Companies Act, 2017 have been followed.
Note 4.21 of the financial statements specifies the standards and interpretations which are yet to be effective in Pakistan. The Company believes that the impact of these standards and interpretations does not have any material impact on the financial statements.
CEO Presentation VideoChief Executive’s presentation video regarding Company’s business overview, performance, strategy and outlook of the Company, is available on AGP’s Website and can be accessed through the following web link:
http://agp.com.pk/documentary/
141AnnualReport
2020140AGPLimited

Quarterly Analysis
Net Turnover Gross Profit Operating Profit Profit After Tax
Quarter 1 1,756 972 592 435
Quarter 2 1,417 773 422 320
Quarter 3 1,818 948 522 414
Quarter 4 1,955 1,168 542 418
6,946 3,861 2,078 1,587
This year was adversely impacted by the global Covid-19 pandemic and yet the Company has managed to post
impressive financial results in the year as a whole. Despite socio-economic disturbances, the Company was able
to record double digit growth of 11% and 10% in revenue and net profitability. The second quarter was the most
affected period for the Company, ignoring which the revenue has registered a growth of 17.5% over same period last
year.
The strong performance in sales was backed by an increase of 9% in the domestic retail portfolio and a robust
growth of more than 41% in Afghanistan sales. However, margins remained under pressure due to local currency
devaluation and a one-off provisioning of Covid-19 antibody testing kits as the same became redundant due to
rapidly evolving testing technology. Generally, the expenditures have increased, mainly on account of strengthening
of workforce in line with expanding business operations and implementing preventive measures against Covid-19
whereas marketing and selling expenses were contained due to travel related restrictions. Finance costs witnessed
a reduction primarily due to timely repayment of outstanding Sukuk, low interest rate regime and limited utilization
of running finance facility. The impressive top-line performance with emphasis on cost containment, yielded an
earnings per share of PKR 5.67, presenting an increase of 10%. A detailed financial analysis of quarterly performance
is shown below.
0%
Quarter 1 Quarter 2 Quarter 3 Quarter 4
25%
50%
75%
100%
28%
26%
20%
30%
25%
20%
26%
25%
20%
26%
26%
20%
25%
Ner Turnover
25%
Gross Profit
28%
Operating Profit
27%
Profit After Tax
QUARTER
1Net revenue for the quarter is at PKR 1,756 Million, which is 9% higher than the same period last year (SPLY).
It is the most affected quarter because of lockdowns and business restrictions due to Covid-19 pandemic. The revenue for the period was PKR 1,417 Million which is 9% lower than SPLY.
This quarter witnessed an economic recovery as there was improvement in Covid-19 cases and hence lock down situations.Accordingly, the revenue boosted to PKR 1,818 Million, representing an increase of 30% over SPLY. The robust increase in Afghanistan sales was a major contributing factor in this growth.
The Company continued the growth trajectory and earned a revenue of PKR 1,955 Million which is 16% higher than SPLY. Both domestic retail portfolio and Afghanistan sales showed impressive growth in the quarter.
Gross profit was PKR 972 Million which is 4% higher than SPLY and translates into a gross margin of over 55%.
Gross profit was recorded at PKR 773 Million, which translated into a gross margin of 55% despite the peak of pandemic crisis.
Gross profit was PKR 948 Million which is 19% higher than SPLY. However, due to a one-off provisioning of Covid-19 antibody testing kits, gross margin was recorded at 52%.
Gross profit was recorded at PKR 1,168 Million which is 15% higher than SPLY and translates in to a year highest gross margin of 60%. The margins improved because of better sales mix of high margin products.
Operating profit was PKR 592 Million which was 7% higher than SPLY.
Operating profit was registered at PKR 422 Million. However, due to containment of expenses, particularly travel related costs, operating margin is maintained at 30%
Operating profit was PKR 522 Million which was 13% higher than SPLY and translates in to an operating margin of 29%.
Operating profit was recorded at PKR 542 Million which is 4.4% lesser than SPLY. With normalization of pandemic situation, marketing and promotional expenses have shown an increased. Further, the expenditures have also increased to support sales growth.
The Company earned a profit after tax (PAT) of PKR 435 Million in the quarter which is 2% higher than SPLY. During this quarter, net margin is maintained at 25% with earnings per share (EPS) recorded at PKR 1.55
The Company earned a PAT of PKR 320 Million, 1% higher than SPLY. During this quarter, on account of peak pandemic situation, the net margin for the quarter was recorded at 23% with EPS of PKR 1.14.
The Company earned a PAT of PKR 414 Million, 29% higher than SPLY. Net margin was maintained at 23% with the EPS of PKR 1.48.
The Company earned a PAT of PKR 418 Million which is 9% higher than SPLY. Net Margin for the quarter was recorded at 21 with EPS of PKR 1.49.
QUARTER
2
QUARTER Net Turnover Gross Profit Operating Profit Profit After Tax
QUARTER
3
QUARTER
4
(PKR in Million)
143AnnualReport
2020142AGPLimited


147AnnualReport
2020146AGPLimited

149AnnualReport
2020148AGPLimited

Statement of Financial PositionAs At 31 December 2020
2 0 2 0 2 0 1 9
Note --------(Rupees in ‘000)--------
ASSETS NON-CURRENT ASSETS
Property, plant and equipment 5 2,203,001 1,976,564
Intangible assets 6 5,397,875 5,395,055
Long-term deposits and receivables 7 14,339 13,514
7,615,215 7,385,133
CURRENT ASSETS
Stores, spares and loose tools 7,144 6,785
Stock-in-trade 8 1,184,441 1,013,401
Trade debts 9 705,290 522,535
Loans and advances 10 30,016 33,863
Trade deposits, prepayments and other receivables 11 31,157 87,940
Taxation – net 247,623 434,809
Cash and bank balances 12 369,780 117,154
2,575,451 2,216,487 TOTAL ASSETS 10,190,666 9,601,620
EQUITY AND LIABILITIES
SHARE CAPITAL AND RESERVES
Issued, subscribed and paid-up capital
Share capital 13 2,800,000 2,800,000
Revenue reserve - unappropriated profits 5,410,326 4,662,899
8,210,326 7,462,899
NON-CURRENT LIABILITIES
Long-term financings 14 399,732 717,065
Deferred grant 15 7,906 -
Gas infrastructure development cess 16 8,383 -
Deferred tax liabilities - net 17 56,201 70,920
472,222 787,985 CURRENT LIABILITIES
Trade and other payables 18 837,209 845,557
Unclaimed dividends 1,701 969
Accrued interest 3,870 13,249
Current maturity of non-current liabilities 20 665,338 490,961
1,508,118 1,350,736
CONTINGENCIES AND COMMITMENTS 21
TOTAL EQUITY AND LIABILITIES 10,190,666 9,601,620 The annexed notes 1 to 39 form an integral part of these financial statements.
________________________ ___________________________ ________________________ Chief Financial Officer Chief Executive Officer Director
Statement of Profit or LossFor The Year Ended 31 December 2020
2 0 2 0 2 0 1 9
Note -------(Rupees in ‘000)-------
Revenue from contracts with customers - net 22 6,946,355 6,253,239
Cost of sales 23 (3,085,723) (2,594,117)
Gross profit 3,860,632 3,659,122
Administrative expenses 24 (226,693) (157,872)
Marketing and selling expenses 25 (1,403,883) (1,293,946)
Other expenses 26 (183,172) (166,927)
Other income 27 31,588 11,264
Finance costs 28 (151,792) (226,858)
(1,933,952) (1,834,339)
Profit before taxation 1,926,680 1,824,783
Taxation 29 (339,253) (378,395)
Net profit for the year 1,587,427 1,446,388
Earnings per share - basic and diluted 13.2 Rs. 5.67 Rs. 5.17
The annexed notes 1 to 39 form an integral part of these financial statements.
________________________ ___________________________ ________________________ Chief Financial Officer Chief Executive Officer Director
151AnnualReport
2020150AGPLimited

Statement of Comprehensive IncomeFor The Year Ended 31 December 2020
2 0 2 0 2 0 1 9
-------(Rupees in ‘000)-------
Net profit for the year 1,587,427 1,446,388
Other comprehensive income, net of tax - -
Total comprehensive income for the year 1,587,427 1,446,388
The annexed notes 1 to 39 form an integral part of these financial statements.
Statement of Changes In EquityFor The Year Ended 31 December 2020
Share Capital
Revenuereserve -
Unappropriated profits
Total
------------------ Rupees in ' 000------------------
Balance as at 31 December 2018 - Restated 2,800,000 3,566,511 6,366,511
Profit for the year - 1,446,388 1,446,388
Other comprehensive income for the year, net of tax - - -
Total comprehensive income for the year - 1,446,388 1,446,388
Interim dividend for the year ended 31 December 2019
@ Rs. 1.25 per share - (350,000) (350,000)
Balance as at 31 December 2019 2,800,000 4,662,899 7,462,899
Profit for the year - 1,587,427 1,587,427
Other comprehensive income for the year, net of tax - - -
Total comprehensive income for the year - 1,587,427 1,587,427
Final dividend for the year ended 31 December 2019
@ Rs. 2 per share - (560,000) (560,000)
Interim dividend for the year ended 31 December 2020
@ Re. 1 per share - (280,000) (280,000)
Balance as at 31 December 2020 2,800,000 5,410,326 8,210,326
The annexed notes 1 to 39 form an integral part of these financial statements.
________________________ ___________________________ ________________________ Chief Financial Officer Chief Executive Officer Director
________________________ ___________________________ ________________________ Chief Financial Officer Chief Executive Officer Director
153AnnualReport
2020152AGPLimited

Statement of Cash Flows For The Year Ended 31 December 2020
2 0 2 0 2 0 1 9
Note -------(Rupees in ‘000)-------
CASH FLOWS FROM OPERATING ACTIVITIES
Cash generated from operations 32 2,067,371 2,200,428
Payments for:
Finance costs (161,171) (232,161)
Income tax (166,786) (317,597)
Workers' Profit Participation Fund (105,937) (96,046)
Workers' Welfare Fund (24,307) (32,381)
Central Research Fund (19,664) (15,346)
Net cash flows generated from operating activities 1,589,506 1,506,897
CASH FLOWS FROM INVESTING ACTIVITIES
Fixed capital expenditure (380,568) (433,088)
Proceeds from disposal of operating fixed assets 7,521 12,465
Long-term deposits and receivables (825) (1,590)
Interest income received 13,745 7,051
Net cash flows used in investing activities (360,127) (415,162)
CASH FLOWS FROM FINANCING ACTIVITIES
Dividend paid (839,268) (380,087)
Long-term financings repaid - net (137,485) (473,940)
Net cashflows used in financing activities (976,753) (854,027)
Net increase in cash and cash equivalents 252,626 237,708
Cash and cash equivalents at the beginning of the year 117,154 (120,554)
Cash and cash equivalents at the end of the year 33 369,780 117,154
No non-cash item is included in investing and financing activities
The annexed notes 1 to 39 form an integral part of these financial statements.
Notes to The Financial Statements For The Year Ended 31 December 2020
1. THE COMPANY AND ITS OPERATIONS
1.1 AGP Limited (the Company) was incorporated as a public limited company in May 2014 under the repealed Companies
Ordinance, 1984 (now Companies Act, 2017). The Company got listed on Pakistan Stock Exchange Limited on 05 March
2018. The registered office of the Company is situated at B-23C, S.I.T.E., Karachi. The principal activities of the Company
include import, marketing, export, dealership, distribution, wholesale and manufacturing of all kinds of pharmaceutical
products.
1.2 As of reporting date, Aitkenstuart Pakistan (Private) Limited (parent company) holds 52.98% (2019: 52.98%) of the
share capital of the Company and West End 16 Pte Limited, Singapore is the ultimate parent company.
1.3 Geographical location and addressess of major business units of the Company are as under:
Location Purpose
B-23C, S.I.T.E. Karachi Head Office and Production Plant
D-109, S.I.T.E. Karachi Production Plant
F/46, S.I.T.E. Superhighway Phase II, Karachi Production plant
2. STATEMENT OF COMPLIANCE
These financial statements have been prepared in accordance with the accounting and reporting standards as
applicable in Pakistan. The accounting and reporting standards as applicable in Pakistan comprise of International
Financial Reporting Standards (IFRSs), issued by International Accounting Standard Board (IASB) and Islamic Financial
Accounting Standards (IFASs) issued by Institute of Chartered Accountants of Pakistan (ICAP), as notified under
Companies Act, 2017 (the Act) and, provisions of and directives issued under the Act. Where the provisions of and
directives issued under the Act differ from the IFRSs, the provisions of and directives issued under the Act have been
followed.
3. BASIS OF PREPARATION
These financial statements have been prepared under the historical cost convention, unless otherwise specifically
stated.
4. SUMMARY OF ACCOUNTING POLICIES
4.1 Standards, amendments, interpretations and improvements adopted during the year
The accounting policies adopted in the preparation of these financial statements are consistent with those of the
previous financial year, except as described below:
New / amended standards and interpretations
IFRS 3 - Definition of a Business (Amendments)
IFRS 9 / IAS 39 / IFRS 7 - Interest Rate Benchmark Reform (Amendments)
IFRS 14 - Regulatory Deferral Accounts
IFRS 16 - COVID-19 Related Rent Concessions (Agreements)
IAS 1 / IAS 8 - Definition of Material (Amendments)
Conceptual Framework for Financial Reporting
The adoption of above standards, amendments, interpretations and improvement to standards did not have any
material effect on these financial statements of the Company.
________________________ ___________________________ ________________________ Chief Financial Officer Chief Executive Officer Director
155AnnualReport
2020154AGPLimited

Notes to The Financial Statements For The Year Ended 31 December 2020
4.2 Significant accounting judgements, estimates and assumptions
The preparation of the financial statements in conformity with approved accounting standards requires the use of
certain critical accounting estimates and assumptions. It also requires management to exercise its judgment in the
process of applying the Company’s accounting policies. Estimates, assumptions and judgements are continually
evaluated and are based on historical experience and other factors, including expectations of future events that are
believed to be reasonable under the circumstances. Revisions to accounting estimates are recognised in the period in
which the estimate is revised and in any future periods affected. Significant accounting estimates and judgments are
disclosed in relevant notes to these financial statements and summarised below.
a) Impairment of goodwill and intangible assets having indefinite useful lives (Refer notes 4.4 and 4.8)
The Company assesses annually at year end and when circumstances indicate that the carrying value may
be impaired. Impairment for goodwill and intangible having indefinite useful lives is determined by assessing
the recoverable amount using Level 1 of fair value hierarchy of cash generating unit (i.e. at the Company
level) to which these assets relates. When the recoverable amount of CGU is less than its carrying amount, an
impairment loss is recognised.
b) Allowances for expected credit losses (Refer note 4.7.1)
The Company has established a provision matrix that is based on the Company’s historical credit loss
experience, adjusted for forward-looking factors specific to the debtors and the economic environment.
However, in certain cases, the Company may also consider a financial asset to be in default when internal or
external information indicates that the Company is unlikely to receive the outstanding contractual amounts in
full before taking into account any credit enhancements held by the Company. The Company will calibrate the
matrix to adjust the historical credit loss experience with forward-looking information. The amount of ECLs is
sensitive to changes in circumstances and of forecast economic conditions. The Company’s historical credit
loss experience and forecast of economic conditions may also not be representative of customer’s actual
default in the future. At each reporting date, the historical observed default rates are updated and changes
in the forward-looking estimates are analysed. Any change might affect the carrying value and amount of
expected credit loss charge to profit or loss.
c) Taxes (Refer note 4.11)
In making the estimates for income taxes, the Company takes into account the current income tax law and
decisions taken by appellate authorities on certain issues in the past. There may be various matters where
the Company’s view differs with the view taken by the income tax department at the assessment stage and
where the Company considers that its view on items of a material nature is in accordance with the law. The
difference between the potential and actual tax charge, if any, is disclosed as a contingent liability.
Significant management judgement is required to determine the amount of deferred tax that can be
recognised, based upon the likely timing and the level of future taxable profits, together with future tax
planning strategies. The management consider tax consequences that would follow from the manner in
which the entity expects, at the end of the reporting period, to recover or settle the carrying amount of its
assets and liabilities.
Notes to The Financial Statements For The Year Ended 31 December 2020
4.3 Property, plant and equipment
(i) Operating fixed assets
Property, plant and equipment are stated at cost less accumulated depreciation and accumulated impairment
losses, if any, except for freehold land, which is stated at cost, if any.
Depreciation charge is based on the straight-line method whereby the cost of an asset is written off to
statement of profit or loss over its estimated useful life after taking into account residual value, if material. The
cost of leasehold land is depreciated in equal installments over the lease period and charged to statement of
profit or loss. Depreciation on additions is charged from the month in which the asset is available for use and
no depreciation is charged in the month of disposal. The rates of depreciation disclosed in note 5.1 to these
financial statements. When a particular class of asset under property, plant and equipment includes an item
having different useful life and is required to be replaced at different intervals, the Company depreciates it
separately based on its specific useful life.
The residual value, depreciation method and the useful lives of each part of property, plant and equipment
that is significant in relation to the total cost of the asset are reviewed at each reporting date and adjusted, if
appropriate. An asset’s carrying amount is written down immediately to its recoverable amount, if the asset’s
carrying amount is greater than its estimated recoverable amount.
Maintenance and normal repairs are charged to statement of profit or loss as and when incurred. Major
renewals and improvements are capitalised when it is probable that respective future economic benefits
will flow to the Company and the cost of the item can be measured reliably and assets so replaced, if any, are
derecognised or retired.
An item of property, plant and equipment is derecognised upon disposal or when no future economic benefits
are expected to arise from the continued use of asset. Gains and losses on disposal of assets are taken to the
statement of profit or loss.
(ii) Capital work-in-progress
Capital work-in-progress is stated at cost less accumulated impairment losses, if any and consists of costs
incurred in respect of operating fixed assets in the course of their construction, installation and acquisition.
Transfers are made to relevant asset category as and when assets are available for intended use.
4.4 Intangible assets
Intangible assets acquired separately (other than goodwill and intangible assets having indefinite useful lives) are
stated at cost less accumulated amortisation and accumulated impairment losses, if any. The cost of intangible assets
acquired in business combinations is their fair value at the date of acquisition.
Amortisation is based on the cost of an asset less its residual value. Amortisation is recognised in statement of profit or
loss on a straight-line basis over the estimated useful lives of intangible assets. Full month’s amortisation is charged in
the month of addition when asset is available for use, whereas amortisation on disposals is charged upto the month in
which the disposal takes place. Amortisation methods, useful lives and residual values are reviewed at each reporting
date and adjusted, if appropriate.
Intangible assets (goodwill and intangibles having an indefinite useful lives i.e trademarks) are stated at cost less
accumulated impairment losses, if any. These are tested for impairment annually at year end and when circumstances
indicate that the carrying value may be impaired. Impairment is determined by assessing the recoverable amount
of Cash Generating Unit (CGU) (i.e. the Company as a whole is considered to be a single CGU) to which the assets
relate. When the recoverable amount of cash generating unit is less than its carrying amount, an impairment loss is
recognised.
157AnnualReport
2020156AGPLimited

Notes to The Financial Statements For The Year Ended 31 December 2020
4.5 Stores, spares and loose tools
Stores, spares and loose tools are stated at the lower of weighted average cost and net realisable value (NRV). Cost
comprises all costs of purchase, and other costs incurred in bringing the stores, spares and loose tools to their present
location and condition. Net realisable value is the estimated selling price in the ordinary course of business less net
estimated costs to sell, which is generally equivalent to replacement cost and is also adjusted through systematic
provision for damaged, obsolete and slow moving items. Items in transit are valued at cost comprising invoice value
plus other charges incurred thereon up to the reporting date.
4.6 Stock-in-trade
These are valued at the lower of NRV and cost determined as follows:
- Raw and packing material - weighted average cost.
- Work-in-process and finished goods - cost of direct materials and labor plus attributable overheads.
- Finished goods (manufactured and trading products) - weighted average cost.
- Stock in transit - invoice price plus other charges paid thereon.
Cost of raw material and finished trading goods comprises purchases cost and other incidental charges incurred in
bringing the inventories to their present location and condition. Manufactured finished goods and work-in-progress
include prime cost and appropriate portion of production overheads based on the normal operating capacity but
excluding borrowing costs. Net realisable value signifies the estimated selling price in the ordinary course of business
less net estimated costs of completion and the estimated costs necessary to make the sale and is also adjusted through
systematic provision for damaged, obsolete and slow moving items. Items in transit are valued at cost comprising
invoice value plus other charges incurred thereon up to the reporting date.
4.7 Financial Instruments
4.7.1 Financial assets
i) Initial recognition and measurement
Financial assets are classified, at initial recognition, as subsequently measured at amortised cost, fair value
through other comprehensive income (OCI), and fair value through profit or loss.
The classification of financial assets at initial recognition depends on the financial asset’s contractual cash
flow characteristics and the Company’s business model for managing them. With the exception of trade debts,
the Company initially measures a financial asset at its fair value plus, in the case of a financial asset not at fair
value through profit or loss, transaction costs. Trade debts are measured at the transaction price determined
under IFRS 15.
In order for a financial asset to be classified and measured at amortised cost or fair value through OCI, it
needs to give rise to cash flows that are ‘solely payments of principal and interest (SPPI)’ on the principal
amount outstanding. This assessment is referred to as the SPPI test and is performed at an instrument level.
The Company’s business model for managing financial assets refers to how it manages its financial assets in
order to generate cash flows. The business model determines whether cash flows will result from collecting
contractual cash flows, selling the financial assets, or both.
Notes to The Financial Statements For The Year Ended 31 December 2020
ii) Subsequent measurement
For purposes of subsequent measurement, financial assets are classified into following categories:
a) Financial assets at amortised cost (debt instruments)
This category is the most relevant to the Company. The Company measures financial assets at
amortised cost if both of the following conditions are met:
- the financial asset is held within a business model with the objective to hold financial assets
in order to collect contractual cash flows; and
- the contractual terms of the financial asset give rise on specified dates to cash flows that are
solely payments of principal and interest on the principal amount outstanding.
Financial assets at amortised cost are subsequently measured using the effective interest rate (EIR)
method and are subject to impairment. Gains and losses are recognised in Statement of profit or
loss when the asset is derecognised, modified or impaired.
b) Financial assets designated at fair value through OCI with recycling of cumulative gains and
losses (debt instruments)
The Company measures debt instruments at fair value through OCI if both of the following
conditions are met:
- The financial asset is held within a business model with the objective of both holding to
collect contractual cash flows and selling; and
- The contractual terms of the financial asset give rise on specified dates to cash flows that are
solely payments of principal and interest on the principal amount outstanding.
For debt instruments at fair value through OCI, interest income, foreign exchange revaluation and
impairment losses or reversals are recognised in the Statement of profit or loss and computed
in the same manner as for financial assets measured at amortised cost. The remaining fair value
changes are recognised in OCI. Upon derecognition, the cumulative fair value change recognised
in OCI is recycled to profit or loss.
The Company does not have any debt instruments at fair value through OCI investments during
the current and last year and as of reporting date.
c) Financial assets designated at fair value through OCI with no recycling of cumulative gains and
losses upon derecognition (equity instruments)
Upon initial recognition, the Company can elect to classify irrevocably its equity investments as
equity instruments designated at fair value through OCI when they meet the definition of equity
under IAS 32 Financial Instruments: Presentation and are not held for trading. The classification is
determined on an instrument-by-instrument basis.
Gains and losses on these financial assets are never recycled to statement of profit or loss. Dividends
are recognised as dividend income in the statement of profit or loss when the right of payment has
been established, except when the Company benefits from such proceeds as a recovery of part of
the cost of the financial asset, in which case, such gains are recorded in OCI. Equity instruments
designated at fair value through OCI are not subject to impairment assessment.
The Company does not have any equity investments during the current and last year and as of
reporting date.
159AnnualReport
2020158AGPLimited

Notes to The Financial Statements For The Year Ended 31 December 2020
d) Financial assets at fair value through profit or loss
Financial assets at fair value through profit or loss include financial assets held for trading, financial
assets designated upon initial recognition at fair value through profit or loss, or financial assets
mandatorily required to be measured at fair value. Financial assets are classified as held for trading
if they are acquired for the purpose of selling or repurchasing in the near term. Financial assets
with cash flows that are not solely payments of principal and interest are classified and measured
at fair value through profit or loss, irrespective of the business model. Notwithstanding the criteria
for debt instruments to be classified at amortised cost or at fair value through OCI, as described
above, debt instruments may be designated at fair value through profit or loss on initial recognition
if doing so eliminates, or significantly reduces, an accounting mismatch.
Financial assets at fair value through profit or loss are carried in the statement of financial position
at fair value with net changes in fair value recognised in the Statement of profit or loss. This category
includes listed equity investments which the Company had not irrevocably elected to classify at fair
value through OCI. Dividends on listed equity investments are also recognised as dividend income
in the Statement of profit or loss when the right of payment has been established.
The Company does not have any listed equity investments during the current and last year and as
of reporting date.
iii) Derecognition
A financial asset (or, where applicable, a part of a financial asset or part of a group of similar financial assets)
is primarily derecognised (i.e., removed from the Company’s statement of financial position) when:
- the rights to receive cash flows from the asset have expired; or
- the Company has transferred its rights to receive cash flows from the asset or has assumed an
obligation to pay the received cash flows in full without material delay to a third party under a pass-
through arrangement; and either (a) the Company has transferred substantially all the risks and
rewards of the asset, or (b) the Company has neither transferred nor retained substantially all the
risks and rewards of the asset, but has transferred control of the asset.
When the Company has transferred its rights to receive cash flows from an asset or has entered into
a pass-through arrangement, it evaluates if, and to what extent, it has retained the risks and rewards
of ownership.
When it has neither transferred nor retained substantially all of the risks and rewards of the asset,
nor transferred control of the asset, the Company continues to recognise the transferred asset to the
extent of its continuing involvement. In that case, the Company also recognises an associated liability.
The transferred asset and the associated liability are measured on a basis that reflects the rights and
obligations that the Company has retained.
Continuing involvement that takes the form of a guarantee over the transferred asset is measured
at the lower of the original carrying amount of the asset and the maximum amount of consideration
that the Company could be required to repay.
Notes to The Financial Statements For The Year Ended 31 December 2020
iv) Impairment
The Company recognises an allowance for expected credit losses (ECLs) for all debt instruments not held
at fair value through profit or loss. ECLs are based on the difference between the contractual cash flows
due in accordance with the contract and all the cash flows that the Company expects to receive, discounted
at an approximation of the original effective interest rate. The expected cash flows will include cash flows
from the sale of collateral held or other credit enhancements that are integral to the contractual terms. The
Company applies a simplified approach in calculating ECLs for its trade debts and receivables. Therefore, the
Company does not track changes in credit risk, but instead recognises a loss allowance based on lifetime
ECLs at each reporting date. For deposits, other receivables and bank balances that are held with reputational
banks and other third parties, the Company applies low credit risk simplifications. At each reporting date,
the Company evaluates whether these assets are considered to have low credit risk using all reasonable and
supportable information that is available without un-due cost or effort including their credit ratings assessed
by reputable agencies and therefore assessed to have immaterial impact of allowances for ECL. For trade
debts and receivables, the Company has established a provision matrix that is based on its historical credit loss
experience, adjusted for forward-looking factors specific to the third parties and the economic environment.
The Company considers a financial asset in default when contractual payments are past due over 180 days.
However, in certain cases, the Company may also consider a financial asset to be in default when internal or
external information indicates that the Company is unlikely to receive the outstanding contractual amounts
in full before taking into account any credit enhancements held by the Company. A financial asset is written
off when there is no reasonable expectation of recovering the contractual cash flows.
4.7.2 Financial liabilities
i) Initial recognition and measurement
Financial liabilities are classified, at initial recognition, as financial liabilities at fair value through profit or loss,
loans and borrowings, payables, or as derivatives designated as hedging instruments in an effective hedge,
as appropriate.
All financial liabilities are recognised initially at fair value and, in the case of loans and borrowings and payables,
net of directly attributable transaction costs.
ii) Subsequent measurement
The measurement of financial liablities depends on their classification, as described below:
a) Financial liabilities at fair value through profit or loss
Financial liabilities at fair value through profit or loss include financial liabilities held for trading
and financial liabilities designated upon initial recognition as at fair value through statement of
profit or loss. Gains or losses on liabilities held for trading are recognised in the statement of profit
or loss. Financial liabilities designated upon initial recognition at fair value through profit or loss are
designated at the initial date of recognition, and only if the criteria in IFRS 9 are satisfied.
161AnnualReport
2020160AGPLimited

Notes to The Financial Statements For The Year Ended 31 December 2020
b) Loans and borrowings
After initial recognition, interest-bearing loans and borrowings are subsequently measured at
amortised cost using the EIR method. Gains and losses are recognised in statement of profit or loss
when the liabilities are derecognised as well as through the EIR amortisation process. Amortised cost
is calculated by taking into account any discount or premium on acquisition and fees or costs that
are an integral part of the EIR. The EIR amortisation is included as finance costs in the Statement of
profit or loss.
iii) Derecognition
A financial liability is derecognised when the obligation under the liability is discharged or cancelled or expires.
When an existing financial liability is replaced by another from the same lender on substantially different
terms, or the terms of an existing liability are substantially modified, such an exchange or modification is
treated as the derecognition of the original liability and the recognition of a new liability. The difference in the
respective carrying amounts is recognised in the Statement of profit or loss.
4.7.3 Offsetting of financial instruments
Financial assets and financial liabilities are offset and the net amount is reported in the financial position if there is a
currently enforceable legal right to offset the recognised amounts and there is an intention to settle on a net basis, to
realise the assets and settle the liabilities simultaneously.
4.8 Impairment of non-financial assets (including goodwill and intangibles with indefinite useful lives)
The carrying amounts of non-financial assets (other than inventories and deferred tax) are reviewed at each reporting
date to determine whether there is any indication of impairment. If any such indication exists, or when annual
impairment testing for asset is required then the asset’s recoverable amount is estimated. The recoverable amount
of an asset or cash-generating unit is the greater of its value-in-use and its fair value less costs to sell. In assessing
value-in-use, the estimated future cash flows are discounted to their present value using a pre-tax discount rate that
reflects current market assessment of the time value of money and the risks specific to the asset.
In determining the fair value less cost of sell, recent market transaction are taken into account, if no such transaction
can be identified appropriate valuation model is used. These calculations are corroborated by valuation multiples,
quoted share prices for publicly traded companies or other fair value indicators. For the purpose of impairment testing,
assets that cannot be tested individually are grouped together into the smallest group of assets that generates cash
inflows from continuing use that are largely independent of the cash inflows of other assets or groups of assets (“the
cash-generating unit, or CGU”).
An impairment loss is recognised if the carrying amount of an asset or its CGU exceeds its estimated recoverable
amount. Impairment losses are recognised in the statement of profit or loss.
Goodwill is tested for impairment annually at year end and when the circumstances indicate that the carrying
value may be impaired. Impairment is determined for goodwill by assessing the recoverable amount of each cash
generating unit (CGU) or group of CGUs to which the goodwill relates. When the recoverable amount of CGU is less
than its carrying amount, an impairment loss is recognised.
Notes to The Financial Statements For The Year Ended 31 December 2020
Intangible assets with indefinite useful lives are tested for impairment annually at year end either individually or at
the CGU level, as appropriate, and when circumstances indicate that the carrying value may be impaired.
For assets excluding goodwill, an assessment is made at each reporting date as to whether there is any indication
that previously recognised impairment losses may no longer exist or may have decreased. If such indication exists, the
Company estimates the asset’s recoverable amount.
A previously recognised impairment loss is reversed only if there has been a change in the assumptions used to
determine the asset’s recoverable amount since the last impairment loss was recognised. The reversal is limited so
that the carrying amount of the asset does not exceed its recoverable amount, nor exceed the carrying amount that
would have been determined, net of depreciation, had no impairment loss been recognised for the asset in prior
years. Such reversal is recognised in the statement of profit or loss.
Impairment losses relating to goodwill are not reversed in future periods.
4.9 Cash and cash equivalents
Cash and cash equivalents comprise of cash in hand and current and deposit accounts held with banks, which
are subject to insignificant risk of change. Short-term finance facilities availed by the Company, which are payable
on demand and form an integral part of the Company’s cash management are included as part of cash and cash
equivalents for the purpose of statement of cash flows.
4.10 Borrowing costs
Borrowing costs are recognised as an expense in the period in which these are incurred except to the extent of
borrowing costs that are directly attributable to the acquisition, construction or production of a qualifying asset. Such
borrowing costs, if any, are capitalized as part of the cost of that asset.
4.11 Taxation
Income tax expense is recognised in the statement of profit or loss, except to the extent that it relates to items
recognised in statement of profit or loss and other comprehensive income or directly in equity. In this case, the tax is
also recognised in statement of other comprehensive income or directly in equity.
Current
Provision for current taxation is based on taxable income at the enacted or substantively enacted rates of taxation
after taking into account the available tax credits and rebates, if any, in accordance with provision of the Income Tax
Ordinance, 2001. It also includes any adjustment to tax payble in respect of prior years. The charge for current tax
includes adjustments to charge for prior years, if any. However, for income covered under final tax regime, taxation is
based on applicable tax rates under such regime.
Deferred
Deferred tax is recognised using balance sheet method, providing for temporary differences between the carrying
amounts of assets and liabilities for financial reporting purposes and the amounts used for taxation purposes.
Deferred tax assets and liabilities are measured at the tax rates that are expected to apply in the year when the asset is
realised or the liability is settled, based on tax rates (and tax laws) that have been enacted or substantively enacted at
the reporting date. In this regard, the effects on deferred taxation of the portion of income expected to be subject to
final tax regime is adjusted in accordance with the requirements of Accounting Technical Release – 27 of the Institute
of Chartered Accountants of Pakistan.
163AnnualReport
2020162AGPLimited

Notes to The Financial Statements For The Year Ended 31 December 2020
Deferred tax liabilities are recognised for all taxable temporary differences. Deferred tax on goodwill and intangible
assets having indefinte useful lives are considered on account of tax consequences that would follow from the expected
manner of recovery of these assets. While deferred tax assets are recognised for all deductible temporary differences,
carry forward of unused tax losses and unused tax credits, to the extent that it is probable that taxable profits for the
foreseeable future will be available against which the asset can be utilised. The carrying value of deferred tax assets
is reviewed at each reporting date and reduced to the extent that it is no longer probable that the related tax benefit
will be realised.
Unrecognised deferred tax assets are reassessed at each reporting date and are recognised to the extent that it is
probable that future taxable profit will allow deferred tax asset to be recovered.
Deferred tax is charged or credited to statement of profit or loss. However, deferred tax relating to items recognised
directly in the other comprehensive income is recognised in the statement of comprehensive income or directly in
equity.
Deferred tax asset and deferred tax liabilities are offset only if there is a legally enforceable right to offset current assets
and liabilities and they relate to the income tax levied by same tax authority.
4.12 Government grant
Government grant is recognised where there is reasonable assurance that the grant will be received and all attached
conditions will be complied with. When the grant related to an expense item, it is recognised in the statement of
profit or loss on a systematic basis over the periods that the related costs, for which it is intended to compensate, are
expensed. When the grant relates to an asset, it is recognised as income in equal amounts over the expected useful
life of the related asset.
The financing facility is recognised and measured in accordance with the accounting policies as disclosed in note 4.7.2
to these financial statements.
4.13 Provisions
A provision is recognised in the statement of financial position when the Company has a present (legal or constructive)
obligation as a result of a past event, and it is probable that an outflow of economic benefits will be required to settle
the obligation and a reliable estimate can be made of the amount of obligation. The amount recognised as a provision
reflects the best estimate of the expenditure required to settle the present obligation at the end of the reporting
period. They are reviewed at each reporting date and adjusted prospectively to reflect current best estimate.
4.14 Employee benefits
4.14.1 Staff provident fund
The Company operates approved contributory provident fund for all its permanent staff. Equal monthly
contributions are made, both by the Company and the employees, to the fund at the rate of 8.33% of basic
salary and cost of living allowance.
4.14.2 Compensated absences
Accrual for compensated absences is made to the extent of value of accrued absences of the employees at
the reporting date using their current salary levels as per Company’s policy.
Notes to The Financial Statements For The Year Ended 31 December 2020
4.15 Foreign currency translation
Transactions in foreign currencies are translated into Pakistani Rupee at the rate ruling at the date of the transaction.
Monetary assets and liabilities denominated in foreign currencies are retranslated at the exchange rate ruling at the
reporting date. Exchange gains and losses are recognised in Statement of profit and loss. Non-monetary items that
are measured in terms of historical cost in a foreign currency are translated using the exchange rates as at the dates
of the initial transactions. Non-monetary items measured at fair value in a foreign currency are translated using the
exchange rates at the date when the fair value was determined.
4.16 Revenue recognition
4.16.1 Revenue from contracts with customers
a) Sale of goods
The Company is engaged in the manufacturing and selling of pharmaceutical products. Revenue
from contracts with customers is recognised when control of the goods is transferred to the
customer at an amount that reflects the consideration to which the Company expects to be entitled
in exchange for those goods. The Company has concluded that it is the principal in its revenue
arrangements because it typically controls the goods before transferring them to the customer.
Revenue from sale of goods is recognised at the point in time when control of the asset is
transferred to the customer, generally on delivery of the goods. The normal credit term is 30 days
upon delivery. The Company considers whether there are other promises in the contract that are
separate performance obligations to which a portion of the transaction price needs to be allocated
(e.g., discounts). In determining the transaction price for the sale of goods, the Company considers
the effects of variable consideration, the existence of significant financing components, non cash
consideration, and consideration payable to the customer (if any).
b) Variable consideration
If the consideration in a contract includes a variable amount, the Company estimates the amount
of consideration to which it will be entitled in exchange for transferring the goods to the customer.
The variable consideration is estimated at contract inception and constrained until it is highly
probable that a significant revenue reversal in the amount of cumulative revenue recognised
will not occur when the associated uncertainty with the variable consideration is subsequently
resolved. The contracts for the sale of goods provides certain customers with a right to return
within a specified period.
i) Right of return
The contracts for sales of goods provides certain customers with a right to return the
products within a specfied time. The Company uses the expected value method to
estimate the goods that will be returned because this method best predicts the amount
of variable consideration to which the Company will not be entitled. The Company
applies the requirements on constraining estimates of variable consideration in order to
determine the amount of variable consideration that can be included in the transaction
price and recognised as revenue. A refund liability is recognised for the goods that are
expected to be returned (i.e. amount not included in the transaction price). A right of
return assets (and corresponding adjustment to cost of sales) is also recognised for the
right to recover the goods from the customer.
165AnnualReport
2020164AGPLimited

Notes to The Financial Statements For The Year Ended 31 December 2020
ii) Discounts
The Company offers discounts to certain distributors, who shall pass the same onwards and
accordingly accounted for as a reduction from the transaction price. A refund liability is
recognised for the expected future discounts (i.e. the amount not included in the transaction
price).
c) Contract balances
i) Contract assets
A contract asset is the right to consideration in exchange for goods transferred to the
customer. If the Company performs by transferring goods to a customer before the customer
pays consideration or before payment is due, a contract asset is recognised for the earned
consideration that is conditional.
ii) Trade debts
A receivable represents the Company’s right to an amount of consideration that is
unconditional (i.e., only the passage of time is required before payment of the consideration
is due). Refer to Accounting policies of financial assets as disclosed in note 4.7.1 ‘financial
assets’ to these financial statements.
iii) Contract liabilities
A contract liability is the obligation to transfer goods to a customer for which the Company
has received consideration (or an amount of consideration is due) from the customer. If
a customer pays consideration before the Company transfers goods to the customer, a
contract liability is recognised when the payment is made or the payment is due (whichever
is earlier). Contract liabilities are recognised as revenue when the Company performs under
the contract.
d) Assets and liabilities arising from rights of return
i) Right of return assets
Right of return asset represents the Company’s right to recover the goods expected to
be returned by customers. The asset is measured at the former carrying amount of the
inventory, less any expected costs to recover the goods, including any potential decreases
in the value of the returned goods. The Company updates the measurement of the asset
recorded for any revisions to its expected level of returns, as well as any additional decreases
in the value of the returned products.
Returns for the Company comprise of expired products or near expiry products (i.e. within 6
months of expiry), which are of zero value by the time of return and are subject to disposition
as per prevailing statutory laws.
ii) Refund liabilities
A refund liability is the obligation to refund some or all of the consideration received (or
receivable) from the customer and is measured at the amount the Company ultimately
expects it will have to return to the customer. The Company updates its estimates of refund
liabilities (and the corresponding change in the transaction price) at the end of each
reporting period.
Notes to The Financial Statements For The Year Ended 31 December 2020
4.16.2 Other income
Other income is recorded on accrual basis and interest income is accounted for using the effective interest
rate (EIR) method.
4.17 Dividends and other appropirations
Dividend distribution to the Company’s shareholders is recognised as a liability in the period in which the dividends
are approved. However, if these are approved after the reporting period but before the financial statement are
authorised for issue, disclosure is made in these financial statements.
4.18 Segment reporting
The Company as a whole is considered to be a single cash generating unit. Operating segments are reported in a
manner consistent with the internal reporting provided to the Chief Operating Decision Maker. Segment results,
assets and liabilities include items directly attributable to a segment. Segment capital expenditure is the total cost
incurred during the year to acquire property, plant and equipment and intangible assets.
4.19 Earning per share
The Company presents basic and diluted earnings per share (EPS) data for its ordinary shares. Basic EPS is calculated
by dividing the profit or loss attributable to ordinary shareholders of the Company by the weighted average number
of ordinary shares outstanding during the year. Diluted EPS is determined by adjusting the profit or loss attributable
to ordinary shareholders and the weighted average number of ordinary shares outstanding for the effects of all
dilutive potential ordinary shares.
4.20 Functional and presentation currency
Items included in these financial statements are measured using the currency of the primary economic environment
in which the Company operates. The financial statements are presented in Pak Rupees, which is the Company’s
functional and presentation currency.
4.21 Standards, interpretations, amendments and improvements to approved accounting standards that are not yet
effective
The following standards, amendments, interpretations and improvements with respect to the approved accounting
standards as applicable in Pakistan would be effective from the dates mentioned below against the respective
standard or interpretation or improvement:
StandardsEffective date (annual
periods beginning on or after)
IFRS 3 - Reference to the Conceptual Framework (Amendments) 01 January 2022IFRS 9, IAS 39, IFRS 7, IFRS 4 and IFRS 16 - Interest Rate Benchmark Reform - Phase 2 (Amendments) 01 January 2021IFRS 10 - Consolidated financial statements and IAS 28 Investment in Associates and Joint Ventures - Sale or Contribution of Assets between an Investor andits Associate or Joint Venture (Amendment) Not yet finalizedIAS 1 - Classification of Liabilities as Current or Non-Current (Amendments) 01 January 2023IAS 16 - Property, Plant and Equipment : Proceeds before Intended Use (Amendments) 01 January 2022IAS 37 - Onerous Contracts - Costs of Fulfilling a Contract (Amendments) 01 January 2022Improvement to accounting standards issued by the IASB (2018-2020 cycle) 01 January 2022
The above standards and amendments are not expected to have any material impact on the Company’s financial
statements in the period of initial application.
Further, the following new standards have been issued by IASB which are yet to be notified by the SECP for the
purpose of applicability in Pakistan.
167AnnualReport
2020166AGPLimited

Notes to The Financial Statements For The Year Ended 31 December 2020
Standards
Effective date (annual periods beginning on or
after)
IFRS 17 – Insurance Contracts 01 January 2023
The Company expects that above new standards will not have any impact on the Company's financial statements in
the period of initial application.
4.22 COVID-19 impact on the Company’s financial position and performance
On March 11, 2020, the World Health Organization made an assessment that the outbreak of a coronavirus (COVID-19)
can be characterized as a pandemic. The outbreak of COVID-19 continues to progress and evolve. Therefore, it was
challenging, to predict the full extent and duration of its business and economic impact.
Though, COVID-19 pandemic has caused slowdown of the overall economy and has caused disruptions amongst the
Company’s supply chain partners, workforce, facilities and operations. The Company however, being covered under
essential services of providing pharmaceutical products is in better position with less being impacted in terms of
the financial performance. The Company continues to monitor the rapidly evolving situation closely, including the
potential impacts on revenue, supply chain continuity, employees and operations. The Company has taken effective
measures for proactive inventory management to develop alternate and reliable vendor sources and build inventory
levels to ensure supplies of goods in the short to medium term.
Further, the Company deployed effective measures to maintain sufficient liquidity and funds which includes
deferment of expenditures and availing the temporary Refinance Scheme for Payment of Wages and Salaries
introduced by State Bank of Pakistan (SBP) at subsidized rates to support businesses in the aftermath of COVID-19
outbreak. Necessary precautions and procedures were also deployed by the Company to address workforce safety,
promote labour mobility and sustain remote working capability to ensure uninterrupted production and hence
availability of our medicines for patients.
4.22.1 Property, plant and equipment
Due to COVID-19 pandemic, we do not foresee any change in usage and / or retention strategy of the Company’s
assets or any adverse effect as the Company’s operational activities continues without any disruption during the
period. Therefore, the significant judgements, estimates and the methods of consumption adopted in determining
recoverable and residual values, depreciation method and useful lives of these assets are the same as those applied
in preparation of financial statements of the Company for the year ended 31 December 2019.
4.22.2 Intangible assets
The carrying value of goodwill and intangible assets having indefinite useful lives has been allocated to AGP Limited,
(i.e. a single cash generating unit (CGU)), which is also the operating and reportable segment for impairment testing.
The Company performed its impairment test annually at year end (i.e. 31 December 2019). However, given the current
situation because of COVID-19, the Company performed its impairment testing as at 31 December 2020 and considers
the relationship between its market capitalisation, using the Level 1 input of the fair value hierarchy - quoted prices
of the Company, and its book value, among other factors. As a result of this assessment, the management did not
identify any impairment for the cash generating unit to which goodwill of Rs. 743.23 million and intangible assets with
indefinite useful lives of Rs. 4,641.09 million are allocated.
Notes to The Financial Statements For The Year Ended 31 December 2020
4.22.3 Allowance for expected credit loss
The Company has established a provision matrix that is based on the Company’s historical credit loss experience.
The matrix has been adjusted for forward-looking factors specific to the debtors and the economic environment
including the macroeconomic effects resulting from COVID-19 outbreak. Management also considered the impact
of COVID-19 on the probability of default, exposure at default and loss given default and concluded that there is no
material impact on these financial statements.
4.22.4 Revenue from contract with customers
Given the current economic condition and overall domestic and international lockdown due to COVID-19 outbreak,
the Company budgeted revenue for FY 2020 from ongoing and future contracts with customers was slightly affected
in the first six months of the year. However, there was significant improvement in the second half of the year in
domestic sales on uplifting of lock-down and improving economic conditions. Even export sales also improved after
opening of Pak-Afghan border.
The Company continues the attitude of being cautious and adhering to the strict SOPs including Government
recommended precautions to keep the work environment safe for the employees and ensure business continuity for
the Company. As the businesses and the economy have opened up, we remain cautiously optimistic about the future
growth prospects.
2 0 2 0 2 0 1 9Note -------(Rupees in ‘000)-------
5. PROPERTY, PLANT AND EQUIPMENT
Operating fixed assets 5.1 1,858,858 1,846,072
Capital work-in-progress 5.2 344,143 130,492
2,203,001 1,976,564
169AnnualReport
2020168AGPLimited

5.1 Operating fixed assets
Land Buildings Plant and machinery
Furniture and
fixtures
Motor Vehicles
Office equipment
Gas and electrical fittings
Refrigerators and air-
conditioners
Laboratory equipments
Computers and related accessories
Total
Freehold Leasehold Factory Office
------------------------------------------------------------------------------ Rupees in ‘ 000 ---------------------------------------------------------------------
Net carrying value basisYear ended 31 December 2020
Opening net book value
369,000
228,819
398,022
12,193
385,910
21,793
153,330
22,613
4,346
102,422
129,520
18,104
1,846,072
*Transfers (note 5.2.1)
-
-
44,617
-
33,134
2,770
25,449
9,572
3,591
10,294
8,891
19,435
157,753
Disposals (at NBV)
Cost
-
-
-
-
(7,230)
(26)
(11,981)
(1,607)
(192)
(2,781)
-
(12,253)
(36,070)
Depreciation
-
-
-
-
5,092
26
8,490
1,499
167
2,722
-
12,253
30,249
- - - - (2,138) - (3,491) (108) (25) (59) - - (5,821)
Assets written off (at NBV)
Cost
-
-
-
(1,464)
(5,676)
(355)
-
(414)
(30)
(60)
(1,445)
(625)
(10,069)
Depreciation
-
-
-
1,428
4,031
355
-
414
26
60
1,404
625
8,343
-
-
-
(36)
(1,645)
-
-
-
(4)
-
(41)
-
(1,726)
Depreciation charge
-
(4,259)
(16,054)
(2,526)
(23,850)
(3,288)
(36,885)
(3,993)
(844)
(15,192)
(18,029)
(12,500)
(137,420)
Closing net book value
369,000
224,560
426,585
9,631
391,411
21,275
138,403
28,084
7,064
97,465
120,341
25,039
1,858,858
Gross carrying value basisAs at 31 December 2020
Cost
369,000
245,284
509,790
24,504
484,216
36,131
207,743
47,173
11,513
141,958
193,523
55,919
2,326,754
Accumulated depreciation
-
(20,724)
(83,205)
(14,873)
(90,795)
(14,856)
(69,340)
(19,089)
(4,449)
(44,493)
(73,182)
(30,880)
(465,886)
Accumulated impairment
-
-
-
-
(2,010)
-
-
-
-
-
-
-
(2,010)
Net book value
369,000
224,560
426,585
9,631
391,411
21,275
138,403
28,084
7,064
97,465
120,341
25,039
1,858,858
Net carrying value basisYear ended 31 December 2019
Opening net book value
369,000
162,454
335,371
15,017
331,889
16,351
149,704
15,155
3,318
88,422
108,976
9,933
1,605,590
*Transfers (note 5.2.1)
-
70,112
77,826
-
84,022
8,195
45,967
10,797
1,524
27,038
37,895
16,373
379,749
Disposals (at NBV)
Cost
-
-
(272)
(131)
(11,601)
(465)
(24,495)
(467)
-
(1,313)
(7,224)
(4,489)
(50,457)
Depreciation
-
-
131
89
6,839
465
17,807
307
-
1,097
6,026
4,366
37,127
- - (141) (42) (4,762) - (6,688) (160) - (216) (1,198) (123) (13,330)
Depreciation charge
-
(3,747)
(15,034)
(2,782)
(25,239)
(2,753)
(35,653)
(3,179)
(496)
(12,822)
(16,153)
(8,079)
(125,937)
Closing net book value
369,000
228,819
398,022
12,193
385,910
21,793
153,330
22,613
4,346
102,422
129,520
18,104
1,846,072
Gross carrying value basisAs at 31 December 2019
Cost
369,000
245,284
465,173
25,968
463,988
33,742
194,275
39,622
8,144
134,505
186,077
49,362
2,215,140
Accumulated depreciation
-
(16,465)
(67,151)
(13,775)
(76,068)
(11,949)
(40,945)
(17,009)
(3,798)
(32,083)
(56,557)
(31,258)
(367,058)
Accumulated impairment
-
-
-
-
(2,010)
-
-
-
-
-
-
-
(2,010)
Net book value
369,000
228,819
398,022
12,193
385,910
21,793
153,330
22,613
4,346
102,422
129,520
18,104
1,846,072
Annual rate of depreciation (%) - 60 / 91 years 3.33 5 5 10 20 10 10 10 10 33
5.1.1 Particulars of immovable assets (freehold / leasehold lands and buildings for factory and office premises) of the Company are as follows:
Location Addresses Usage of immovable property Covered Area (Acres)
Karachi B-23C, S.I.T.E. Karachi Head Office and Production Plant 2.809Karachi D-109, S.I.T.E. Karachi Production Plant 1.25Karachi F/46, S.I.T.E. Superhighway Phase II, Karachi Production Plant 0.50
Karachi E-134, S.I.T.E. Area, Super Highway Phase II, Karachi Future expansion 0.50
Notes to The Financial Statements For The Year Ended 31 December 2020
* Represents assets transfers from capital work-in-progress (note 5.2.1)
Notes to The Financial Statements For The Year Ended 31 December 2020
2 0 2 0 2 0 1 9Note -------(Rupees in ‘000)-------
5.1.2 Deprecation for the year has been allocated as follows:
Cost of sales 23 93,744 86,900 Administrative expenses 24 8,928 6,439 Marketing and selling expenses 25 34,748 32,598
137,420 125,937
5.1.3 The cost of fully depreciated assets of the Company amounted to Rs. 238.95 million (2019: Rs. 237.89 million). In addition, land includes leasehold land having cost of Rs.35.17 million remains idle as of 31 December 2020 and 2019.
5.1.4 Details of operating fixed assets disposed off during the year are as follows:
Description Mode ofdisposal Cost Accumulated
DeprecationNet book
valueSales
proceedsGain / (loss)
Relationship of purchaser
with theCompany
Particulars of buyers
----------------------- Rupees in '000 --------------------Aggregate amount of assets disposed off having NBV not exceeding Rs. 5 million
36,070 30,249 5,821 7,521 1,700 various various
2020 36,070 30,249 5,821 7,521 1,700
2019 50,457 37,127 13,330 12,466 (865)
2 0 2 0 2 0 1 9 2 0 2 0 2 0 1 9
Additions duringthe year
Closing balance asat December 31
----------(Rupees in ‘000)----------
5.2 Capital work-in-progress comprise of:
Land - 70,112 - -
Buildings - factory / office 170,701 135,861 209,587 83,504
Plant and machinery 70,223 79,570 77,221 40,129
Furniture and fixtures 18,195 7,723 15,425 -
Motor vehicles 27,967 43,998 2,517 -
Office equipment 9,572 10,660 - -
Gas and electrical fittings 3,591 1,524 - -
Refrigerators and air conditioners 26,796 26,734 21,561 5,059
Laboratory equipments 11,596 36,499 2,705 -
Computer and related accessories 20,344 18,116 2,709 1,800
Solar Panels 5,498 - 5,498 -
Softwares 16,085 2,291 6,920 -
380,568 433,088 344,143 130,492
171AnnualReport
2020170AGPLimited

Notes to The Financial Statements For The Year Ended 31 December 2020
2 0 2 0 2 0 1 95.2.1 The following is the movement in capital work-in-progress during the year: Note -------(Rupees in ‘000)-------
Opening balance 130,492 79,444 Additions during the year 5.2 380,568 433,088 Transferred during the year to:- operating fixed assets 5.1 (157,753) (379,749)- intangible assets 6.1 (9,164) (2,291)Closing balance 344,143 130,492
2 0 2 0 2 0 1 96. INTANGIBLE ASSETS Note -------(Rupees in ‘000)-------
Goodwill 6.2 743,226 743,226 Trademarks - (indefinite lives) 6.2 4,641,087 4,641,087 Computer software 13,562 10,742
5,397,875 5,395,055
Goodwill Trademarks - Indefinite
Trademarks - finite
Computer softwares Total
6.1 Intangible assets -------------------------Amount in Rupees ‘000-------------------------
Net carrying value basisYear ended 31 December 2020Opening net book value 743,226 4,641,087 - 10,742 5,395,055
Transfers (note 5.2.1) - - - 9,164 9,164 Amortisation charge - - - (6,344) (6,344)Closing net book value 743,226 4,641,087 - 13,562 5,397,875
Gross carrying value basisAs at 31 December 2020
Cost 743,226 4,641,087 365,930 52,791 5,803,034 Accumulated amortisation - - (365,930) (39,229) (405,159)Net book value 743,226 4,641,087 - 13,562 5,397,875
Net carrying value basisYear ended 31 December 2019
Opening net book value 743,226 4,641,087 - 13,943 5,398,256 Transfers (note 5.2.1) - - - 2,291 2,291Amortisation charge - - - (5,492) (5,492)Closing net book value 743,226 4,641,087 - 10,742 5,395,055
Gross carrying value basisAs at 31 December 2019
Cost 743,226 4,641,087 365,930 43,627 5,793,870 Accumulated amortisation - - (365,930) (32,885) (398,815)Net book value 743,226 4,641,087 - 10,742 5,395,055
Annual rate of amortisation (%) - - 10-20 33
Notes to The Financial Statements For The Year Ended 31 December 2020
6.2 Impairment testing of goodwill and intangible assets (i.e. trademarks) having indefinite lives
The carrying value of goodwill and intangibles assets having indefinite useful lives has been allocated to AGP Limited,
the Company as a whole i.e. a single cash generating unit (CGU), which is also the operating and reportable segment
for impairment testing. The Company performed its impairment test annually at year end (i.e. 31 December 2020).
Considering the relationship between its market capitalisation, using the Level 1 input of the fair value hierarchy -
quoted prices of the Company, and its book value, among other factors. As a result of this analysis, the management
did not identify any impairment for the cash generating unit to which goodwill of Rs. 743.226 million and intangible
asset with indefinite useful lives of Rs. 4,641.087 million are allocated.
2020 20196.3 Amortisation for the year has been allocated as follows: Note ------(Rupees in ‘000)------
Cost of sales 23 1,081 363 Administrative expenses 24 5,236 4,796 Marketing and selling expenses 25 27 333
6,344 5,492
6.4 The cost of fully amortized assets of the Company amounted to Rs. 393.21 million (2019: Rs. 392.11 million).
173AnnualReport
2020172AGPLimited

2 0 2 0 2 0 1 9
9. TRADE DEBTS - unsecured Note ------(Rupees in ‘000)------
Related parties (associated companies)- OBS Pakistan (Private) Limited 3,490 625- Aspin Pharma (Private) Limited 3,140 1,054 - Muller & Phipps Pakistan (Private) Limited 654,779 491,824
9.2 661,409 493,503
Others than related parties 44,785 30,256 9.1 706,194 523,759
Less: Allowances for expected credit losses 9.4 (904) (1,224)
705,290 522,535
9.1 The credit risk exposure on the Company's trade debts using provision matrix at year end is as follows:
Days past due
TOTAL Current 1-30 days 30- 90 days 90 and above days
-----------------(Rupees in ‘000)-----------------
2020
Expected credit loss rate 0.13% 0% 0% 0% 3.95%Estimated total gross carrying amount at default 706,194 606,203 75,303 1,786 22,902
Expected credit loss 904 - - - 904
2019
Expected credit loss rate 0.23% 0% 0% 0% 4.93%
Estimated total gross carrying amount at default 523,759 432,408 27,181 39,323 24,847
Expected credit loss 1,224 - - - 1,224
Notes to The Financial Statements For The Year Ended 31 December 2020
2 0 2 0 2 0 1 9Note ------(Rupees in ‘000)------
7. LONG-TERM DEPOSITS AND RECEIVABLES
Security deposits - unsecured, considered good 9,665 9,759
Receivables from employees - secured, considered good 7.1 8,202 6,232
Less: Recoverable within one year (3,528) (2,477)
4,674 3,755
14,339 13,514
7.1 Represents interest free receivables from the employees of the Company on acocunt of purchase of vehicles (i.e. motor bikes) and laptops, in accordance with their employment terms. These receivables are secured against the title of said assets and are recoverable within five and three years respectively in equal monthly installments. The discounting impact of these receivables to their present value is not considered by the management of the Company, as the financial impact is immaterial.
2 0 2 0 2 0 1 9
8. STOCK-IN-TRADE Note ------(Rupees in ‘000)------
Raw and packing materials
- In hand 8.1 568,332 521,864
- In transit 32,442 35,005
600,774 556,869
Work-in-process 86,860 58,022 Finished goods- Manufacturing 217,995 217,846 - Trading 376,498 201,774
594,493 419,620
Provision for obsolescence and slow moving stock 8.3 (97,686) (21,110)
8.2 1,184,441 1,013,401
Notes to The Financial Statements For The Year Ended 31 December 2020
8.1 Included herein items having value of Rs. 14.87 million (2019: Rs. 21.51 million), representing stock held by third parties.
8.2 Stock-in-trade includes items having cost of Rs. 1.56 million (2019: Rs. 4.88 million) written down to net realisable value of Rs. 1.20 million (2019: Rs. 3.98 million) resulting in a writedown of Rs. 0.36 million (2019: Rs. 0.90 million).
2 0 2 0 2 0 1 98.3 Provision for obsolescence and slow moving stock is as follows: Note ------(Rupees in ‘000)------
Opening balance 21,110 17,229
Provision made during the year - net 8.3.1 93,270 11,900
Written off during the year (16,694) (8,019)
97,686 21,110
8.3.1 Included herein Rs. 89.87 million (2019: Nil) on account of provision for SARS Covid Antibody Kits, since the testing was not executed as per the initially anticipated volumes and accordingly, the same remained unutilised.
175AnnualReport
2020174AGPLimited

Notes to The Financial Statements For The Year Ended 31 December 2020
9.2 The ageing analysis of unimpaired trade debts due from related parties is as follows:
Days past due
TOTAL Current 1-30 days 30- 90 days 90 and above days
----------(Rupees in ‘000)----------2020OBS Pakistan (Private) Limited 3,490 - 909 2,581 - Aspin Pharma (Private) Limited 3,141 3,101 - 40 -
Muller & Phipps Pakistan (Private) Limited 654,778 602,951 37,794 (2,038) 16,071
661,409 606,052 38,703 583 16,071 2019OBS Pakistan (Private) Limited 625 312 313 - - Aspin Pharma (Private) Limited 1,054 937 48 69 -
Muller & Phipps Pakistan (Private) Limited 491,824 428,041 22,530 27,178 14,075 493,503 429,290 22,891 27,247 14,075
9.3 The maximum amount outstanding from related parties at any time during the year calculated by reference to month end balances are as follows:
2 0 2 0 2 0 1 9Related parties - associated companies Note ------(Rupees in ‘000)------
OBS Pakistan (Private) Limited 3,826 10,696 Aspin Pharma (Private) Limited 18,428 10,759 Muller and Phipps Pakistan (Private) Limited 664,625 647,644
9.4 The movement in allowances for expected credit losses is as follows:
Opening balance 1,224 - Adjustments due to initial application of IFRS 9 - 1,114 Allowances for expected credit losses for the year (net) (320) 110 Closing balance 9.4.1 904 1,224
9.4.1 Included herein amount of Rs 0.81 million (2019: Rs. Nil) related to Muller and Phipps Pakistan (Private) Limited, a related party.
2 0 2 0 2 0 1 9
10. LOANS AND ADVANCES - Considered good Note ------(Rupees in ‘000)------
Advances - unsecured- suppliers 18,954 18,970 - employees 9,423 7,525- custom authorities / clearing agents 1,639 7,368
30,016 33,863
Notes to The Financial Statements For The Year Ended 31 December 2020
2 0 2 0 2 0 1 9------(Rupees in ‘000)------
11. TRADE DEPOSITS, PREPAYMENTS AND OTHER RECEIVBALES Trade deposits - considered good, unsecuredSecurity deposits 9,108 6,178 Margin on letters of credit 16,112 76,509
25,220 82,687
Prepayments - insurance 383 240
Other receivablesCurrent portion of receivables from employees - secured 7 3,528 2,477 Receivable from Workers’ Profit Participation Fund 18.2 694 - Others - unsecured 1,332 2,536
5,554 5,013 31,157 87,940
12. CASH AND BANK BALANCES
Cash at banksCurrent accounts- local currency 66,854 4,448 - foreign currency 346 346 Deposit accounts 12.1 301,757 111,716
368,957 116,510 Cash in hand 823 644
12.2 369,780 117,154
12.1 These carry markup at the rates ranging from 2.75% to 11.66% (2019: 4.22% to 12.30%) per annum.
12.2 The following information is disclosed by the Compamy being a Shariah compliant entity and listed on Islamic index:
Financing Facility
Obtained
Financing Facility Utilized
Current / Deposit
Accounts
Profit / Markup Earned
Profit / Markup Paid
-------------------------------------- Rupees in ‘000) -------------------------------------- 2020Shariah compliant financingsShort-term borrowings 1,050,000 - 294,814 10,073 295 Long-term financings-Sukuk 2,448,000 721,177 - - 129,145 -Diminishing musharikah 25,000 5,105 - - 845 -Running musharikah 350,000 314,560 - - 11,732
3,873,000 1,040,842 294,814 10,073 142,017 Conventional financings
Short-term borrowings 900,000 - 74,143 3,672 1,995 4,773,000 1,040,842 368,957 13,745 144,012
2019Shariah compliant financingsShort-term borrowings 700,000 - 77,737 3,289 2,660 Long-term financings
-Sukuk 2,448,000 1,201,559 - - 209,536
-Diminishing musharikah 25,000 6,467 - - 297 3,173,000 1,208,026 77,737 3,289 212,493
Conventional financingsShort-term borrowings 1,150,000 - 38,773 2,806 5,821
4,323,000 1,208,026 116,510 6,095 218,314
177AnnualReport
2020176AGPLimited

13. SHARE CAPITAL
Authorised share capital
2 0 2 0 2 0 1 9 2 0 2 0 2 0 1 9
-------Number of shares ---------- ------(Rupees in ‘000)------
Ordinary shares of Rs. 10 each 350,000,000 350,000,000 fully paid in cash 3,500,000 3,500,000
Issued, subcribed and paid-up capital
2 0 2 0 2 0 1 9 2 0 2 0 2 0 1 9 -------Number of shares ---------- ------(Rupees in ‘000)------
Ordinary shares of Rs. 10 each
280,000,000 280,000,000 fully paid in cash 2,800,000 2,800,000
13.1 Voting rights, board selection and similar rights of shareholders are in proportion to the shareholding of the Company.
2 0 2 0 2 0 1 9
13.2 Basic and diluted earnings per share (EPS) ------(Rupees in ‘000)------
Net profit for the year 1,587,427 1,446,388
--------- Number of shares ---------
Weighted average number of ordinary outstanding during the year 280,000,000 280,000,000
Basic and diluted earnings per share (EPS) 5.67 5.17
2 0 2 0 2 0 1 914. LONG-TERM FINANCINGS - secured ------(Rupees in ‘000)------
Running musharikah under SBP Refinance Scheme 14.1 314,560 - Diminishing musharikah 14.2 5,105 6,467 Sukuk net of transaction cost of Rs. 13.25 million (2019: Rs. 22.44 million)] 14.3 721,177 1,201,559
1,040,842 1,208,026 Less: current maturity 20 (641,110) (490,961)
399,732 717,065 The movement in long term financing is as follows:
Opening balance 1,208,026 1,681,966 Financing obtained during the year 314,560 6,467 Financing repaid during the year (481,744) (480,407)Closing balance 1,040,842 1,208,026
14.1 With a view to support businesses to continue payment of wages and salaries to their workers and employees in the aftermath of COVID-19 outbreak, State Bank of Pakistan (SBP) has introduced a temporary Refinance Scheme for Payment of Wages and Salaries to the workers and employees of business concerns for three (3) months (i.e. April 2020 to June 2020) at a subsidized mark-up rate. However, since the impact of pandemic continues, subsequently the facility has been extended to the Company for a further period of three (3) months (i.e. from July 2020 to September 2020).
The Company has availed and entered into an arrangement of said refinancing scheme with the Faysal Bank Limited (FBL) up to Rs.350 million for a period of 2.5 years including 6 months grace period. The repayment will be made in 8 equal instalments after the grace period. It carries profit rate of SBP rate (i.e. NIL) + 1% per annum. The facility is secured against first pari passu hypothecation charge of Rs. 334 million and ranking charge of Rs. 133 million over current assets of the Company. The security is common for funded facilities. As of reporting date, Rs 5.74 million of the facility limit remained unutilised.
14.2 The Company had obtained diminishing musharakah (DM) facility of Rs. 25 million from Bank Islami Pakistan Limited for purchase of private and commercial vehicles. The facility limit utilised is repayable in equal monthly installments of Rs.0.11 million in arrears. The maximum period of finance is 5 years. The facility carries profit at the rate of 6 months KIBOR + 1.5% per annum with floor of 14% and cap of 24%. The facility is secured against 15% share of the Company (minimum), and ownership title over DM assets duly insured comprehensively. As of reporting date, Rs. 18.20 mllion of the facility limit remained unutilised.
14.3 The Company had obtained long-term finance of Rs. 2,448 million through the issuance of Sukuk certificates repayable in quarterly instalments commencing from September 2017, over the term of 5 years. These carry profit rate of 3 months KIBOR + 1.30% per annum and are secured against the present and future property, plant and equipment of the Company to the extent of Rs. 2,412 million.
2 0 2 0 2 0 1 915. DEFERRED GRANT Note ----- Rupees in '000 ------
Recognized during the year 39,907 - Released to statement of profit or loss 27 (10,208) - As at December 31, 2020 29,699 - Current portion under non-current liabilities 20 (21,793) -
7,906 -
16. GAS INFRASTRUCTURE DEVELOPMENT CESS
Gas Infrastructure Development Cess 10,818 - Less: Current portion under non-current liability 20 (2,435) -
8,383 -
16.1 In accordance with the Gas Infrastructure Development Cess Act, 2011 (GIDC Act, 2011), the Company was required to pay GIDC to applicable supplier of Gas, as specified in the First Schedule and at rates specified in the Second Schedule to the GIDC Act, 2011. The Honourable Supreme Court of Pakistan on August 13, 2020 decided the Gas Infrastructure Development Cess (GIDC) case and held that the levy of GIDC under the GIDC Act 2015 is constitutional. The Apex court further stated that all industrial and commercial entities which consume natural gas pass on the burden to their customers, have to pay the GID Cess that become due upto 31 July 2020 w.e.f 2011. Later, in November 2020, the SCP also dismissed all review petitions. Accordingly, the Company in the current year has recognised a liability for GIDC in these financial statements.
Notes to The Financial Statements For The Year Ended 31 December 2020
Notes to The Financial Statements For The Year Ended 31 December 2020
179AnnualReport
2020178AGPLimited

2 0 2 0 2 0 1 917. DEFERRED TAX LIABILITIES - NET ------(Rupees in ‘000)------
Taxable temporary differencesAccelerated tax depreciation / amortisation 82,217 76,691 Deferred grant 7,837 -
90,054 76,691 Deductible temporary differencesProvisions (26,016) (5,771)Long-term financings (7,837) -
(33,853) (5,771) 56,201 70,920
2 0 2 0 2 0 1 918. TRADE AND OTHER PAYABLES Note ------(Rupees in ‘000)------
Creditors 464,351 464,112 Accrued liabilities 245,649 275,578 Compensated absences 34,217 23,377 Retention money 13,192 8,955 Other payables: - Provident fund 18.1 5,622 4,647 - Infrastructure Cess 13,801 13,801 - Workers’ Profit Participation Fund 18.2 - 2,335 - Workers’ Welfare Fund 18.3 26,918 24,096 - Central Research Fund 18.4 20,789 19,664 - Withholding tax 5,831 3,898 - Sales tax 4,954 3,489 - Others 1,885 1,605
837,209 845,557
18.1 Payable to the provident fund
18.1.1 Investments of provident fund have been made in accordance with the Provisions of Section 218 of the Act and the rules formulated for this purpose.
18.1.2 During the year, the Company's contribution to provident fund amounted to Rs. 27.17 million (2019: Rs. 22.83 million).
Notes to The Financial Statements For The Year Ended 31 December 2020
2 0 2 0 2 0 1 918.2 Workers’ Profits Participation Fund Note ------(Rupees in ‘000)------
Balance at the beginning of the year 2,335 1,043 Allocation for the year 102,908 97,338
105,243 98,381 Payments made during the year (105,937) (96,046)
(694) 2,335
18.3 Workers’ Welfare Fund
Balance at the beginning of the year 24,096 32,178 Charge for the year 27,129 24,299
51,225 56,477 Payments made during the year (24,307) (32,381)
26,918 24,096 18.4 Central Research Fund
Balance at the beginning of the year 19,664 15,346 Charge for the year 20,789 19,664
40,453 35,010 Payments made during the year (19,664) (15,346)
20,789 19,664
19. SHORT-TERM BORROWINGS - Secured
19.1 As of reporting date, the facilities relating to running finance under mark-up arrangements obtained from commercial banks of Rs.900 million (2019: Rs. 1,150 million) remained untilised carrying markup at the rate of 1 - 3 months KIBOR plus 0.30% to 1.50% per annum payable quarterly. The facility is secured by way of hypothecation charge over current assets of the Company.
19.2 As of reporting date, the facilities relating to running musharka arrangements obtained from islamic banks of Rs.1,050 million (2019: Rs. 700 million) remained untilised carrying markup at rate of 1 - 3 months KIBOR plus 0.70% to 1% per annum payable quarterly. The facility is secured by way of hypothecation charge over current assets of the Company.
2 0 2 0 2 0 1 920. CURRENT MATURITY OF NON-CURRENT Note ------(Rupees in ‘000)------
LIABILITIES
Long-term financings 14 641,110 490,961 Deferred grant 15 21,793 - Gas infrastructure development cess 16 2,435 -
665,338 490,961
Notes to The Financial Statements For The Year Ended 31 December 2020
181AnnualReport
2020180AGPLimited

Notes to The Financial Statements For The Year Ended 31 December 2020
21. CONTINGENCIES AND COMMITMENTS
21.1 Contingencies
21.1.1
21.1.2
21.1.3
Notes to The Financial Statements For The Year Ended 31 December 2020
21.1.4
21.1.5
In year 2018, the Company received a demand for tax year 2017 from the taxation authorities of Rs.145.93
million in respect of amortisation of goodwill and the payment made by the Company towards Sindh
Revenue Board (SRB) in respect of Workers Welfare Fund (WWF) disallowed. The Company filed an appeal
before Commissioner Inland Revenue Appeals [CIR(A)] against the above mentioned demand and the
case was decided in favor of the Company in respect of amortisation of goodwill allowed, whereas WWF
has been rejected. In the year 2019, the Company had filed an appeal before Appellate Tribunal Inland
Revenue (ATIR) to allow expense in respect of WWF. Whereas during the year 2018, the taxation authority
filed an appeal before ATIR against amortisation of goodwill allowed by CIR(A), for which no hearing is
fixed till date. The Company, in view of a tax advice, expects a favorable outcome, accordingly, no provision
has been made in these financial statements.
In year 2014, the Company imported an active pharmaceutical material namely Ossein Mineral Complex
(OMC) which is exempt from sales tax. Customs duty and advance income tax paid at applicable rates
by the Company on the import. No discrepancy and irregularity was made out against the Company at
the time of release of its consignments of OMC. However, after the release of its consignments the tax
authorities made demand of short-paid duties and taxes which includes 30% custom duty, 17% sales
tax and 5% advance income tax on the imported value, amounted to Rs.5.11 million, without issuing any
show cause notice. The Company has filed a petition before High Court of Sindh (SHC) which is pending
adjudication. During the year, the petition has been withdrawn by the Company, as recommended by
the lawyer on the contention that the case pertains to classification of raw material in accordance with
Customs Act, 1969 and already pending before the Pakistan Custom Tarrif (PCT) committee. The Company
is now contesting the case before PCT committee level. The Company, in view of a legal advice, expects a
favorable outcome, accordingly, no provision has been made in these financial statements.
In year 2008, the Company imported consignments of Medicines (Multivitamin) against which, it filed
goods declaration through their authorized clearing agent. The Company declared the description of
goods as medicines and claimed assessment under relevant PCT Code. The Custom Authorities rejected
these assessments and issued demand notices to the Company indicating short levy of duty / taxes. The
Deputy Collector of Customs, Air Freight Unit/Jinnah International Airport, Karachi, passed an order against
the Company according to which the Company was liable to pay the short paid amount of Rs.1.17 million
against the respective consignments / demand notices. The Company filed appeal before the Collectors
of Customs, Sales Tax & Federal Excise (Appeals) which was decided in favor of the Company vide their
order dated 30 October 2009. The Deputy Collector of Customs, Air Freight Unit approached the learned
Tribunal, Customs, Central Excise & Sales Tax, Bench, and filed appeal against the said order which was
also dismissed and decided in favour of the Company vide order dated 23 December 2010. Thereafter, the
Collector of Customs (Preventive) filed the title reference before the SHC which is pending adjudication.
The Company, in view of a legal advice, expects a favorable outcome, accordingly, no provision has been
made in these financial statements.
In year 2020, during the course of tax audits for tax years 2018 and 2019, the Company has received a show
cause notice from Sindh Revenue Board (SRB), for depositing Sindh Sales Tax (SST) of Rs. 22.21 million on
account of contract labour services acquired by the Company during years ended 31 December 2017 and
2018 based on the contention by SRB that the services of labour and manpower supply are covered under
Second Schedule to the Sindh Sales Tax on Services Act, 2011 (the Act). In addition, under Withholding
Rules 2014, the Company is liable to deduct the amount of sales tax at the applicable tax rate on the basis
of gross value of the taxable services.
On the other hand, the Company’s contention was that SRB relied upon the Notifications issued by SRB to
impose SST on the reimbursements of, inter alia, salary payments that the Company made to providers of
services, though these reimbursements do not fall within the definition of “labour and manpower supply
services” under Section 2(55A) of the Act nor do they constitute part of the value of such taxable service.
Therefore, the amount of sales tax shall be worked out on the basis of net value of the taxable services.
Further, the Notifications were unlawful and unconstitutional, as under the Constitution no tax may be
levied for the purposes of the province except by or under an Act of the Provincial Assembly. Hence, being
aggrieved, the Company had filed a constitutional petition C.P.No. D-1014 of 2020 with the Honourable
High Court of Sindh (SHC) against the said show cause notice, whereby SHC has granted a stay order dated
17 February 2020 against recovery of the amount and directed SRB not to pass any final adverse order till
next date of hearing. On 17 Novemebr 2020, the case has been decided in favour of the Company. However,
SRB is expected to file an appeal against the said order with the Honourable Supreme Court of Pakistan.
The Company expects a favourable outcome on this matter and accordingly, no provision has been made
in these financial statements.
Economic Coordination Committee (ECC) of the Cabinet in its meeting held on 26 June 2019 has taken
the decision to discontinue Industrial Support Package (ISP) for industrial consumers, which includes a
decreased off peak hour rate/unit. The decision was effective from 01 July 2019, but since, there were some
clarity issues, as to timeline and implementation, therefore K-Electric Limited (KEL) continued to provide
relief to industrial consumers during off-peak hours under the support package. However, as per Ministry
of Energy Corrigendum of SRO 575 (1) / 2019 dated 22 January 2020, industrial tariff rates were revised w.e.f
01 July 2019 due to withdrawal of ISP from off-peak consumption, accordingly, the impact of the same
amounting to Rs. 5.46 million has been included in the energy bill for the month of March 2020 by KEL. The
Company being aggrieved filed a constitutional petition C.P.No. D-2300 of 2020 against the withdrawal
of ISP in the Honourable High Court of Sindh (SHC), whereby SHC has granted stay order dated 28 April
2020 in respect of recovery of ISP charges. The SHC has declared the above mentioned corrigendum as
illegal and ordered KEL to refund or adjust any sums paid by consumers or reissue bills to petitioners who
have not paid bills or ISP component. KEL is expected to file an appeal against SHC order, however, the
Company is confident of a favourable outcome, hence, no provision for the above charges have been made
in these financial statements.
183AnnualReport
2020182AGPLimited

Notes to The Financial Statements For The Year Ended 31 December 2020
2 0 2 0 2 0 1 921.1.6 Guarantees ------(Rupees in ‘000)------
Bank guarantees- limit 310,000 260,000
- unutilised portion 287,160 234,139
- utilised portion 22,840 25,861
21.2 Commitments
21.2.1 As at 31 December 2020, capital expenditure contracted for but not incurred amounted to Rs 95.67 million (2019: Rs 92.550 million).
2 0 2 0 2 0 1 921.2.2 Letters of credit ------(Rupees in ‘000)------
Letters of credit - limit 2,320,000 2,320,000
- unutilised portion 2,117,043 1,929,854
- utilised portion 202,957 390,146
2 0 2 0 2 0 1 922. REVENUE FROM CONTRACT WTH CUSTOMERS - net Note ------(Rupees in ‘000)------
Sale of goods (at a point in time)Local - Manufacturing 6,002,331 5,743,682 - Trading 993,388 730,293
6,995,719 6,473,975 Export 738,224 352,755 Less: Trade discounts (735,389) (557,409) Sales returns (38,172) (14,111) Sales tax (14,027) (1,971)
(787,588) (573,491) 22.1 & 22.2 6,946,355 6,253,239
22.1 Included herein sales of Rs. 5,667 million (2019: Rs. 5,403 million) made to related parties (see note 34).
22.2 Revenue recognised during the year includes Rs. NIL (2019: Rs. 1.06 million) included in contract liabilities at the beginning of the year.
Notes to The Financial Statements For The Year Ended 31 December 2020
2 0 2 0 2 0 1 923. COST OF SALES Note ------(Rupees in ‘000)------
Cost of sales – manufacturing
Raw and packing materials consumedOpening stock 8 556,869 469,435 Purchases 1,880,289 1,709,718 Available for consumption 2,437,158 2,179,153 Closing stock 8 (600,774) (556,869)Raw and packing material consumed 1,836,384 1,622,284
Manufacturing costSalaries, wages and other benefits 23.1 461,214 378,784 Stores and spares consumed 25,794 23,740 Provision against slow moving and obsolete materials - net 8.3 93,270 11,900 Processing charges 10,634 7,651 Freight 5,798 5,050 Fuel, gas and electricity 117,014 105,460
Repairs and maintenance 74,973 71,482
Travelling and conveyance 20,080 20,079 Insurance 5,956 6,040 Laboratory expenses 26,216 17,914 Rates and taxes 874 4,016 Depreciation 5.1.2 93,744 86,900 Amortisation 6.3 1,081 363 Postage, telegraph and telephones 2,377 2,651
Printing and stationery 6,041 3,161
945,066 745,191 2,781,450 2,367,475
Work-in-processOpening stock 8 58,022 43,601 Closing stock 8 (86,860) (58,022)
(28,838) (14,421)Cost of goods manufactured 2,752,612 2,353,054
Finished goodsOpening stock 8 217,846 216,385 Closing stock 8 (217,995) (217,846)
(149) (1,461)2,752,463 2,351,593
Cost of samples for marketing and sales promotion 25 (52,583) (54,145)
Cost of sales – tradingOpening stock 8 201,774 84,825 Purchases 560,567 413,618 Closing stock 8 (376,498) (201,774)
385,843 296,669 3,085,723 2,594,117
23.1 Included herein Rs. 7.7 million (2019: Rs. 6.79 million) in respect of staff retirement benefits.
185AnnualReport
2020184AGPLimited

Notes to The Financial Statements For The Year Ended 31 December 2020
2 0 2 0 2 0 1 924. ADMINISTRATIVE EXPENSES Note ------(Rupees in ‘000)------
Salaries and other benefits 24.1 118,653 91,942 Travelling and conveyance 408 479 Printing and stationery 1,610 1,871 Directors' remuneration 4,200 1,125 Postage, telegrams and telephones 467 485 Legal and professional 43,659 24,468 Research cost 1,500 1,679 Repairs and maintenance 6,937 5,003 Software license renewals and maintenance fee 16,724 12,555 Subscription and fee 1,362 662 Advertisement 2,063 221 Auditors' remunerations 24.2 3,213 3,878 Donations 24.3 8,790 1,580 Insurance 439 405 Depreciation 5.1.2 8,928 6,439 Amortisation 6.3 5,236 4,796 Corporate social responsibility 2,146 - Vehicle running expenses 358 284
226,693 157,872
24.1 Included herein Rs. 3.69 million (2019: Rs. 2.81 million) in respect of staff retirement benefits.
2 0 2 0 2 0 1 924.2 Auditors' remunerations ------(Rupees in ‘000)------
Statutory audit fee 1,663 1,512 Special audit fee 120 1,188 Half yearly review and other certifications 1,264 875 Out of pocket expenses 166 303
3,213 3,878
24.3 Donation to a single party exceeding higher of Rs. 1 miilion or 10% of total donations are as follows:
2 0 2 0 2 0 1 9------(Rupees in ‘000)------
Patients' Aid Foundation 2,944 - National Institute of Kidney Diseases 1,100 - Saylani Welfare Trust 1,041 -
5,085 -
24.3.1 None of the directors of the Company or their spouses had any interest in the donee.
2 0 2 0 2 0 1 925. MARKETING AND SELLING EXPENSES Note ------(Rupees in ‘000)------
Salaries and other benefits 25.1 685,379 598,786 Travelling and conveyance 180,877 184,251 Repairs and maintenance 6,021 4,808Insurance 4,557 4,708 Depreciation 5.1.2 34,748 32,598 Amortisation 6.3 27 333 Printing and stationery 3,709 3,756 Samples 23 52,583 54,145 Sales promotion expenses 284,983 267,378 Meeting and conferences 60,927 79,547 Communication 14,890 10,879 Subscription 14,295 9,658 Freight, handling and transportation 60,887 43,099
1,403,883 1,293,946
25.1 Included herein Rs.15.79 million (2019: Rs. 13.24 million) in respect of staff retirement benefits.
2 0 2 0 2 0 1 926. OTHER EXPENSES Note ------(Rupees in ‘000)------
Workers’ Profit Participation Fund 18.2 102,908 97,338 Workers’ Welfare Fund 18.3 27,129 24,299 Central Research Fund 18.4 20,789 19,664 Exchange loss - net 30,940 24,651 Allowances for expected credit loss (net) 9.4 (320) 110 Assets written off 5.1 1,726 - Loss on disposal of operating fixed assets - (net) - 865
183,172 166,927
27. OTHER INCOME
Income from financial assets
Markup on deposit accounts 13,745 6,095
Income from non-financial assets
Gain on sale of operating fixed assets (net) 5.1.4 1,700 - Government grant 15 10,208 - Scrap sales 5,930 5,032 Others 5 137
17,843 5,169 31,588 11,264
28. FINANCE COSTS
Mark-up on:- long-term financings 141,722 209,833 - short term borrowings 2,290 8,481
144,012 218,314 Bank charges 7,780 8,544
151,792 226,858
Notes to The Financial Statements For The Year Ended 31 December 2020
187AnnualReport
2020186AGPLimited

29. TAXATION 2 0 2 0 2 0 1 9------(Rupees in ‘000)------
Current 353,207 278,738 Prior 765 87,523 Deferred (14,719) 12,134
339,253 378,395
29.1 Relationship between income tax expense and accounting profit is as follows:
Profit before taxation 1,926,680 1,824,783
Tax at the applicable tax rate of 29% (2019: 29%) 558,737 529,187 Prior year charge 765 87,523 Effect of lower tax rate (177,152) (171,956)Effect of tax credits (41,099) (69,535)Others (1,998) 3,176
339,253 378,395
Effective tax rate 17.61% 20.74%
30. REMUNERATION OF CHIEF EXECUTIVE, DIRECTORS AND EXECUTIVES
Chief Executive Directors Executives2020 2019 2020 2019 2020 2019
---------------------------- Rupees in '000 ---------------------------
Managerial remuneration 15,904 14,458 - - 211,071 157,896 Bonus 2,171 1,971 - - 19,547 11,209 Performance incentive 38,289 31,902 - - 2,060 4,604 Reimbursement of expenses 403 300 - - 22,523 13,731 Provident fund 1,085 985 - - 10,788 7,115 Others 1,449 1,316 - - 14,282 15,452
59,301 50,932 - - 280,271 210,007
Number of persons 1 1 6 6 52 41
30.1 In addition, the chief executive and certain executives are provided with free use of Company maintained car in
accordance with their entitlements.
During the year, fee paid to two (2019: two) independent directors and four (2019: Nil) non-executive directors for
attending board and other meetings amounted to Rs. 4.2 million (2019: Rs. 1.13 million). Travelling and boarding
expenses of executive and non-executive directors borne by the Company amounted to Rs. 11.5 million (2019: Rs. 9.49
million). Number of non-executive directors at year end were four (2019: four).
30.3 No remuneration was paid/payable to any of the directors other than chief executive.
31. PRODUCTION CAPACITY
The capacity and production of the Company’s plants is indeterminable, as these are multi-product plants involving
varying processes of manufacturing. The Company’s production is based on market demand.
Notes to The Financial Statements For The Year Ended 31 December 2020
30.2
Notes to The Financial Statements For The Year Ended 31 December 2020
2 0 2 0 2 0 1 932. CASH GENERATED FROM OPERATIONS Note ------(Rupees in ‘000)------
Profit before taxation 1,926,680 1,824,783
Adjustments for non-cash items:Depreciation 5.1.2 137,420 125,937 Amortisation 6.3 6,344 5,492 Allowances for expected credit losses 26 (320) 110 (Gain) / loss on disposal of operating fixed assets 27 (1,700) 865 Assets written off 26 1,726 - Mark-up on deposits accounts 27 (13,745) (6,095)Finance costs 28 151,792 226,858 Workers' Profit Participation Fund 26 102,908 97,338 Workers' Welfare Fund 26 27,129 24,299 Central Research Fund 26 20,789 19,664
432,343 494,468 Operating profit before working capital changes 2,359,023 2,319,251 Working capital changes
(Increase) / decrease in current assetsStores, spares and loose tools (359) 673 Stock-in-trade (171,040) (216,384)Trade debts (182,435) (40,321)Loans and advances 3,847 30,575 Trade deposits, prepayments and other receivables 57,477 (80,967)
(292,510) (306,424)Increase / (decrease) in current liabilitiesTrade and other payables 858 187,601
2,067,371 2,200,428
2 0 2 0 2 0 1 933. CASH AND CASH EQUIVALENTS Note ------(Rupees in ‘000)------
Cash and bank balances 12 369,780 117,154
189AnnualReport
2020188AGPLimited

Notes to The Financial Statements For The Year Ended 31 December 2020
34. TRANSACTIONS WITH RELATED PARTIES
The related parties of the Company comprises ultimate parent company, parent company, group companies, associated companies, staff retirement funds, directors and key management personnel. All transactions with related parties are executed into at agreed terms duly approved by the Board of Directors of the Company. Transactions with related parties, other than those disclosed elsewhere in these financial statements, are as follows:
Name and country of Incorporation
Basis of relationship
% of shares held by related parties Nature of transactions 2 0 2 0 2 0 1 9
------(Rupees in ‘000)------
Parent company
Aitkenstuart Pakistan(Private) Limited -Pakistan
Parentcompany
52.98% (2019:52.98%) Dividend paid 445,051 176,857
Associated companies
OBS Pakistan (Private) Limited- Pakistan
Commondirectorship(significantinfluence)
Nil (2019: NIL)
Sale of goods 4,408 6,926
Expenditure incurred / paid by the
Company on behalf of associate 2,334 3,362
Expenditure incurred / paid by
associate on behalf of the Company - 9,569
Dividend paid - -
Aspin Pharma (Private) Limited - Pakistan
Commondirectorship 4.79% (2019: 4.79%)
Sale of goods 38,637 29,322
Expenditure incurred / paid by the
Company on behalf of associate 745 2,243
Expenditure incurred / paid by
associate on behalf of the Company 13,249 -
Dividend paid 40,200 16,750
Muller and PhippsPakistan (Private) Limited - Pakistan
Commondirectorship
13.54% (2019:13.54%)
Sale of goods 5,624,161 5,422,654
Expenditure incurred / paid by the
Company on behalf of the associate - -
Settlement of amount incurred by the
associate on behalf of the Company 77,812 58,085
Dividend paid 113,760 47,400
OBS Green (Private) Ltd - Pakistan
Commondirectorship NIL (2019: NIL)
Purchase of Personal Protective
Equipment Kits 400 -
Service charges for test kits 546 -
Staff retirement benefits - AGP Limited staff provident fund Contribution paid 26,201 22,444
Key management personnel (other than Chief Executive) Managerial remuneration 68,962 58,426
Bonus 7,899 4,266
Performance incentives 236
Reimbursement of expenses 3,525 1,511
Provident Fund 3,556 2,027
Dividend paid 19 40
Others 4,589 2,523
Directors Dividend paid 1,893 789
Board and other meeting fee 4,200 1,125
Others (due to common directorship)
Dubai Islamic Bank Limited - Pakistan Repayment of long-term financings 119,657 134,104
Muller & Phipps Express Logistics (Private) Limited - Pakistan Services incurred 48 475
Baltoro Partners (Private) Limited - Pakistan Purchase of test kits 240 -
34.1 The related parties status of outstanding receivables / payables as at 31 December 2020 and 2019 is disclosed in respective notes to these financial statements.
35. FINANCIAL RISK MANAGEMENT OBJECTIVES AND POLICIES
The Company's activities expose it to a variety of financial risks: credit risk, liquidity risk and market risk (including currency, interest rate and other price risks). The Company's overall risk management policy focuses on the unpredictability of financial markets and seeks to minimise potential adverse effects on the Company's financial performance. No changes were made in the risk management framework and capital management of the Company during the year ended 31 December 2020.
35.1 Risk management framework
The Board of Directors has overall responsibility for the establishment and over sight of the Company's risk management framework. The executive management team is responsible for developing and monitoring the Company’s risk management policies. The team regularly meets and any changes and compliance issues are reported to the Board of Directors through the audit committee.
Risk management systems are reviewed regularly by the executive management team to reflect changes in market conditions and the Company’s activities. The Company, through its training and management standards and procedures, aims to develop a disciplined and constructive control environment in which all employees understand their roles and obligations.
The audit committee oversees compliance by management with the Company’s risk management policies and procedures, and reviews the adequacy of the risk management framework in relation to the risks faced by the Company.
Notes to The Financial Statements For The Year Ended 31 December 2020
191AnnualReport
2020190AGPLimited

Notes to The Financial Statements For The Year Ended 31 December 2020
35.1.1 Financial assets and liabilities by category and their respective maturities are as follows:
Interest bearing Non-Interest bearing
Maturity upto one
year
Maturity after one
yearTotal
Maturity upto one
year
Maturity after one
yearTotal Total
------------------------------------------ (Rupees in ‘000) ------------------------------------------ Financial assets (at amortised cost)
Deposits and receivables -
-
- 30,080 14,339 44,419 44,419
Trade debts -
-
- 705,290 - 705,290 705,290
Cash and bank balances 301,757 - 301,757 67,200 - 67,200 368,957 December 31, 2020 301,757 - 301,757 802,570 14,339 816,909 1,118,666
Financial liabilities (at amortised cost)
Long-term financings 641,110 399,732 1,040,842 - - - 1,040,842 Trade and other payables - - - 764,916 - 764,916 764,916 Unclaimed dividends - - - 1,701 - 1,701 1,701 Accrued interest - - - 3,870 - 3,870 3,870 December 31, 2020 641,110 399,732 1,040,842 770,487 - 770,487 1,811,329
Interest bearing Non-Interest bearing
Maturity upto one
year
Maturity after one
yearTotal
Maturity upto one
year
Maturity after one
yearTotal Total
------------------------------------------ (Rupees in ‘000) ------------------------------------------
Financial assets (at amortised cost)
Deposits and receivables - - - 87,700 13,514 101,214 101,214 Trade debts - - - 522,535 - 522,535 522,535 Cash and bank balances 111,716 - 111,716 4,794 - 4,794 116,510 December 31, 2019 111,716 - 111,716 615,029 13,514 628,543 740,259
Financial liabilities (at amortised cost)
Long-term financings 490,961 717,065 1,208,026 - - - 1,208,026 Trade and other payables - - - 778,274 - 778,274 778,274 Unclaimed dividends - - - 969 - 969 969 Accrued interest - - - 13,249 - 13,249 13,249 December 31, 2019 490,961 717,065 1,208,026 792,492 - 792,492 2,000,518
35.1.2 The carrying values of all financial assets and liabilities reflected in these financial statements approximate their fair values.
Notes to The Financial Statements For The Year Ended 31 December 2020
35.2 Capital Management
The Company’s objective when managing capital is to safeguard the Company’s ability to remain as a going concern and continue to provide returns for shareholders and benefits for other stakeholders and to maintain an optimal capital structure to reduce the cost of capital. Capital includes issued capital and reserves and the Company is not subject to any regulatory capital requirements. The Company is currently financing majority of its operations / investing activities through long-term financing and short-term borrowings in addition to its equity.
2 0 2 0 2 0 1 9Note ------(Rupees in ‘000)------
Long-term financings 14 1,040,842 1,208,026 Accrued interest 3,870 13,249 Total debts 1,044,712 1,221,275 Less: Cash and bank balances 12 369,780 117,154 Net debts 674,932 1,104,121
Total capital 8,210,326 7,462,899
Gearing ratio 8% 15%
35.3 Credit risk
35.3.1 Credit risk is the risk of financial loss to the Company if one party to a financial instrument will fail to discharge an obligation and cause the other party to incur a financial loss without taking into account the fair value of any collateral. Concentration of credit risk arises when a number of counter parties are engaged in similar business activities or have similar economic features that would cause their ability to meet contractual obligations to be similarly affected by changes in economical, political or other conditions. Concentrations of credit risk indicate the relative sensitivity of the Company's performance to developments affecting a particular industry. Credit risk of the Company arises principally from the trade debts, deposits, other receivables and balances with banks. The carrying amount of financial assets represents the maximum credit exposure. The management continuously monitors the credit exposure towards the customers and records an allowance for expected credit loss. The credit risk on liquid funds such as balances with banks is limited because the counter parties are banks with reasonably high credit ratings. The Company seeks to minimize the credit risk exposure through having exposures only to customers considered credit worthy and obtaining securities, where applicable. The maximum exposure to credit risk at the reporting date is:
2 0 2 0 2 0 1 9Note ------(Rupees in ‘000)------
Receivables and deposits 7 & 11 44,419 101,214 Trade debts 9 705,290 522,535 Bank balances 12 368,957 116,510
1,118,666 740,259
Secured 8,202 6,232 Unsecured 1,110,464 734,027
1,118,666 740,259
Not past due 606,203 427,806
193AnnualReport
2020192AGPLimited

Notes to The Financial Statements For The Year Ended 31 December 2020
35.3.2 The credit quality of financial assets can be assessed by reference to external credit ratings or the historical information about counter party default rates as follows:
2 0 2 0 2 0 1 9
------(Rupees in ‘000)------
Trade debts (note 9)Customers with no defaults in the past one year 705,290 522,535
Bank Balances (note 12)A-1+ 316,806 115,801 A-1 52,151 709
368,957 116,510
35.3.3 As at reporting date, there are no financial assets that could otherwise be past due or impaired whose terms have been renegotiated.
35.4 Liquidity risk
Liquidity risk is the risk that the Company will not be able to meet its financial obligations as they fall due. The Company applies prudent liquidity risk management by maintaining sufficient bank balances and the availability of funding through an adequate amount of committed credit facilities.
The table below summarises the maturity profile of the Company’s financial liabilities based on contractual undiscounted payments:
On demand Less than 3 months
3 to 12 months
More than 12 months Total
--------------------------- Rupees in '000 ------------------------------
2020Long-term financings - 160,277 480,833 399,732 1,040,842 Trade and other payables 34,217 715,622 15,077 - 764,916 Unclaimed dividends - 1,701 - - 1,701 Accrued interest - 3,870 - - 3,870
34,217 881,470 495,910 399,732 1,811,329
2019Long-term financings - 122,740 368,221 717,065 1,208,026 Trade and other payables 23,377 744,337 10,560 - 778,274 Unclaimed dividends - 969 - - 969 Accrued interest - 13,249 - - 13,249
23,377 881,295 378,781 717,065 2,000,518
35.5 Market risk
Market risk is the risk that fair value of future cash flows of a financial instrument will fluctuate because of changes in market prices. Market prices comprise three types of risk: currency risk, interest rate risk and equity price risk.
35.5.1 Interest rate risk
Interest rate risk is the risk that the fair value of future cash flows of a financial instrument will fluctuate because of changes in market interest rates. The Company's exposure to the risk of changes in market interest rate relates primarily to the Company's long-term financing and short-term borrowings at a floating rate to meet its business operations requirements. The Company manages interest rate risk by maintaining arrangement with number of financial institutions to have access to the best possible rate, if financing from banks is required. Management of the Company estimates that 1% increase in the market interest rate, with all other factors remaining constant, would decrease the Company’s profit before tax by Rs.10.46 million, and a 1% decrease would result in the increase in the Company’s profit before tax by the same amount. However, in practice, the actual result may differ from the sensitivity analysis.
Notes to The Financial Statements For The Year Ended 31 December 2020
35.5.2 Currency risk
Currency risk is the risk that the fair value or future cash flows of a financial instrument will fluctuate because of the changes in foreign exchange rates. The Company is mainly exposed to such risk in respect of foreign currency receivables from customers, bank balances and payable to suppliers amounting. The Company manages currency risk by carefully selecting countries for purchasing which pose minimum risk for foreign currency fluctuations. Moreover, the Company's exports in foreign currency are pursued to offset the adverse currency fluctuations.
The significant currency exposure at the year end is as follows:
2020 2019 USD EURO CNY CHF USD EURO CNY CHF
Financial assetsTrade debts 150,144 - - - 103,516 - - - Bank balances - 1,992 - - - 1,992 - -
150,144 1,992 - - 103,516 1,992 - -
Financial liabilitiesTrade payables (1,067,898) (28,506) (1,990,298) - (1,435,744) (40,848) (1,439,589) (45,000)
------------------------------------ Equivalent Rs '000 ----------------------------------Financial assetsTrade debts 23,998 - - - 16,121 - - - Bank balances - 392 - - - 346 - -
23,998 392 - - 16,121 346 - -
Financial liabilitiesTrade payables (170,687) (5,606) (48,684) - (222,756) (7,061) (31,883) (7,035)
The exchange rates applied during the year and at year end were as follows:
Average rate for the year
Spot rate as at 31 December
2020 2019 2020 2019----(Rupees in ‘000)---- ----(Rupees in ‘000)----
US Dollar 162.02 150.06 159.83 154.85 Chinese Yuan 23.42 21.79 24.46 22.24 Euro 184.20 168.75 196.64 173.48 Swiss Franc 172.13 151.25 181.49 160.08
Sensitivity analysis
Every 1% increase or decrease in exchange rate, with all other variables held constant, will decrease or increase profit before tax for the year by Rs 2.03 million (2019: Rs 2.52 million).
35.5.3 Equity price risk
Equity price risk is the risk of loss arising from uncertainities about future values of investments securities movements in prices of equity investments. The Company is not exposed to any equity price risk, as the Company does not have any investment in equity securities.
35.6 Fair values of financial assets and liability
Fair value is the amount for which an asset could be exchanged, or a liability can be settled, between knowledgeable willing parties in an arm's length transaction other than in a forced or liquidation sale. The carrying values of all financial assets and liabilities reflected in the financial statements approximate their fair values.
195AnnualReport
2020194AGPLimited

Notes to The Financial Statements For The Year Ended 31 December 2020
36. INFORMATION ABOUT OPERATING SEGMENTS
36.1 For management purposes, the activities of the Company are organised into one operating segment i.e. manufacture and sale of pharmaceutical products. The Company operates in the said reportable operating segment based on the nature of the products, risks and returns, organisational and management structure and internal financial reporting systems. The operating interests of the Company are confined to Pakistan in terms of production/generation capacity. Accordingly, the information and figures reported in these financial statements are related to the Company’s only reportable segment in Pakistan.
36.2 Export sales made to Afghanistan represents the geographical breakup of the Company's gross turnover.
36.3 The revenue information is based on the location of the customer. The details of customers with whom the revenue from sales transactions amount to 10% or more of the Company's overall revenue related to manufactured and trading goods is as follows:
2 0 2 0 2 0 1 9
------(Rupees in ‘000)------
- Muller & Phipps Pakistan (Private) Limited 5,624,161 5,422,654
36.4 Non-current assets of the Company are confined within Pakistan and consist of property, plant and equipment, intangibles assets and long-term deposits and receivables.
37. DATE OF AUTHORISATION
These financial statements were authorised for issue on 26 February 2021 by the Board of Directors of the Company.
38. SUBSEQUENT EVENT
38.1 Subsequent to the reporting date, the Board of Directors (the Board), in its meeting held on 03 February 2021, has authorized the Company to participate with its parent company through a Special Purpose Vehicle (SPV) for the purpose of acquisition of a selected portfolio of products which are commercialized in Pakistan under the Sandoz brand (“brands”) that are owned by Sandoz AG, Switzerland. The Company will own majority of the equity upto sixty-five percent (65%) shareholding in the SPV. The acquisition is subject to necessary corporate and regulatory approvals and successful closing of the transaction with Sandoz AG. The said acquisition is likely to increase the market share, bring operational and logistical synergies and enhance the product portfolio of the Company along with increase in the Company’s revenues and profitability, improve value proposition for customers, employees and other stakeholders and in turn maximizing shareholders' value.
38.2 The Board of Directors in its meeting held on 26 February 2021 has proposed a final cash dividend for the year 2020 of Re. 1 per share (aggregating to Rs. 280 million) subject to approval of shareholders in the Annual General Meeting of the Company to be held on 26 April 2021. This is in addition to the interim cash dividend of Re. 1 per share aggregating to the total dividend for the year of Rs. 2 per share.
39. GENERAL
39.1 The number of persons employed as at year end were 976 (2019: 900) and the average number of persons employed during the year were 967 (2019: 901).
39.2 Corresponding figures have been rearranged and reclassified for better presentation, wherever considered necessary. However, there are no material transactions to report.
39.3 Figures have been rounded off to the nearest thousand rupees, unless otherwise stated.
________________________ ___________________________ ________________________ Chief Financial Officer Chief Executive Officer Director
197AnnualReport
2020196AGPLimited


Notice of 7th Annual General MeetingNOTICE is hereby given that the 7th Annual General Meeting (Meeting) of the shareholders of AGP Limited (the Company) will be held on Monday, April 26, 2021 11:30 A.M. at Beach Luxury Hotel, Moulvi Tamizuddin Khan Road, Karachi, to transact the following business:
ORDINARY BUSINESS
I. To confirm the minutes of Extraordinary General Meeting held on April 02, 2021
II. To consider, approve and adopt the audited financial statements of the Company together with Directors’ and Auditors’ Reports thereon for the year ended December 31, 2020.
III. To appoint Auditors for the year ending December 31, 2021 and fix their remuneration.
IV. To consider and approve the payment of final dividend at the rate of PKR 1 per share (i.e. 10%) as recommended by the Board of Directors.
V. To transact any other business with the permission of the Chair.
By Order of the Board
Karachi. Umair MukhtarDated: April 05, 2021 Company Secretary
NOTES:
1. Closure of share transfer books
The share transfer books of the Company will remain closed from April 20, 2021 to April 26, 2021 (both days inclusive). Transfers received in order at the office of our Registrar, namely CDC Share Registrar Services Limited situated at CDC House, 99-B, Block B, S.M.C.H.S. Main Shahrah-e-Faisal, Karachi - 74400 by the close of business (5:00 p.m.) on April 19, 2021 will be treated as being in time for the purposes of payment of final cash dividend to the transferees and to attend and vote at the Meeting.
2. Appointment of proxy holderA member of the Company entitled to attend and vote at the Meeting may appoint a proxy to attend and vote on his / her behalf. Proxies in order to be effective must be received at the registered office of the Company or emailed at [email protected] not later than forty-eight (48) hours before the time of holding the Meeting. In calculating the aforesaid time period, no account shall be taken of any day that is not a working day. A member shall not be entitled to appoint more than one proxy. Proxy form is available at Company’s website www.agp.com.pk and also attached at the end of the annual report.
3. Guidelines for CDC Account Holders
Any Individual Beneficial Owner of CDC, entitled to vote at this Meeting, must bring his/her original Computerized National Identity Card (CNIC) to prove identity, and in case of proxy, a copy of shareholder’s attested CNIC must be attached with the proxy form. Representatives of corporate members should bring the usual documents required for such purpose.
CDC Account Holders will also have to follow the under mentioned guidelines as laid down in Circular 1 dated January 26, 2000 issued by the Securities and Exchange Commission of Pakistan (SECP).
4. Participation in the Meeting
Keeping in view continuing threats of Covid-19 pandemic and to ensure maximization of members’ participation, the SECP, through its Circular No. 04 of 2021 dated February 15, 2021, has advised all listed companies to hold general meetings virtually through video link as a regular feature, till further order, in addition to the requirement of holding physical meeting. Accordingly, in the best health interest of our valued shareholders and to ensure maximum participation, the Company is also providing facility to its valued shareholders to attend the AGM through video link facility.
To attend the AGM through video link, members are requested to register their following particulars by sending an e-mail at [email protected].
Folio / CDCaccount no.
No. ofshares held Name CNIC No Cell No. Email
address
The video link and login credentials will be shared with the shareholders whose e-mails, containing all the requested particulars, are received at the given e-mail address by or before the close of business hours (5:00 p.m.) on April 22, 2021. The shareholders are also encouraged to send their comments / suggestions, related to the agenda items of the AGM on the above mentioned e-mail address by the close of business hours (5:00 p.m.) April 22, 2021.
5. Notice of Meeting and Annual Report The notice of Meeting along with Annual Report 2020 will also be uploaded on the official website of the Company. Further the same shall also be posted at PUCAR system of Pakistan Stock Exchange Limited and e-mailed to the members who have provided their valid email addresses to the Company or Registrar. Other members who wish to receive the Annual Report 2020 through email may send us the request at [email protected] as per the standard request form available at the Company’s website.
Members are requested to intimate any change in their registered email addresses on a timely manner, to ensure effective communication by the Company.
6. E- VotingMembers can exercise their right to poll subject to meeting of requirement of Section 143 to 145 of the Companies Act, 2017 and applicable clauses of Companies (Postal Ballot) Regulations 2018.
7. Video Conference Facility
Pursuant to Section 132(2) of the Companies Act, 2017, if the Company receives consent from members holding in aggregate ten percent (10%) or more shareholding residing at geographical location, to participate in the meeting through video conference at least seven (7) days prior to the date of meeting, the Company will arrange video conference facility in that city subject to availability of such facility in that city. The Company will intimate members regarding venue of video conference facility at least five (5) days before the date of the Meeting along with complete information necessary to enable them to access such facility. In order to avail this facility please provide the following information to our Registrar:
201AnnualReport
2020200AGPLimited

8. Electronic payment of cash dividendIn accordance with the provisions of section 242 of the Companies Act 2017, a listed company is required to pay cash dividend only through electronic mode directly in to the bank account designated by the entitled shareholders. Accordingly, the shareholders are requested to provide the information mentioned on an E-Dividend Mandate Form available at the website of the Company to the Registrar. The CDC account holders must submit their information directly to their broker (participant) / CDC.
As per the provisions of the section 243(3) of the Companies Act, 2017 and Regulation 6 of the Companies (Distribution of Dividends) Regulations, 2017, the Company may withhold the payment of dividend to shareholders who have not provided valid bank details and copy of valid CNIC or NTN.
9. Withholding tax on dividends
In pursuance to section 150 of Income Tax Ordinance, 2001, the rates of deduction of income tax from dividend payments shall be 15% for a person appearing in Active Taxpayers List (ATL) and 30% for a person not appearing in ATL. In case of joint shareholders, tax will be deducted on the basis of shareholding of each shareholder as may be notified by them, in writing as follows, to our Registrar, by the close of business (5:00 p.m.) on April 19, 2021, or if no such notification is received each shareholder shall be assumed to have an equal number of shares:
Folio / CDSAccount
No.Total Shares
Principal Shareholder Joint Shareholder
Nameand
CNIC No.
ShareholdingProportion
(No. of Shares)
Nameand
CNIC No.
ShareholdingProportion
(No. of Shares)
Withholding Tax exemption from the dividend income shall only be allowed if a copy of valid tax exemption certificate is made available to the Registrar by close of business (5:00 p.m.) on April 19, 2021.
“I/We, _________of _____________ being a member of AGP Limited holder of ________Ordinary Share(s) as per Register Folio No./ CDC Account No. ___________ hereby opt for video conference facility at (Please insert name of the City).
__________________Signature of member”
203AnnualReport
2020202AGPLimited

205AnnualReport
2020204AGPLimited
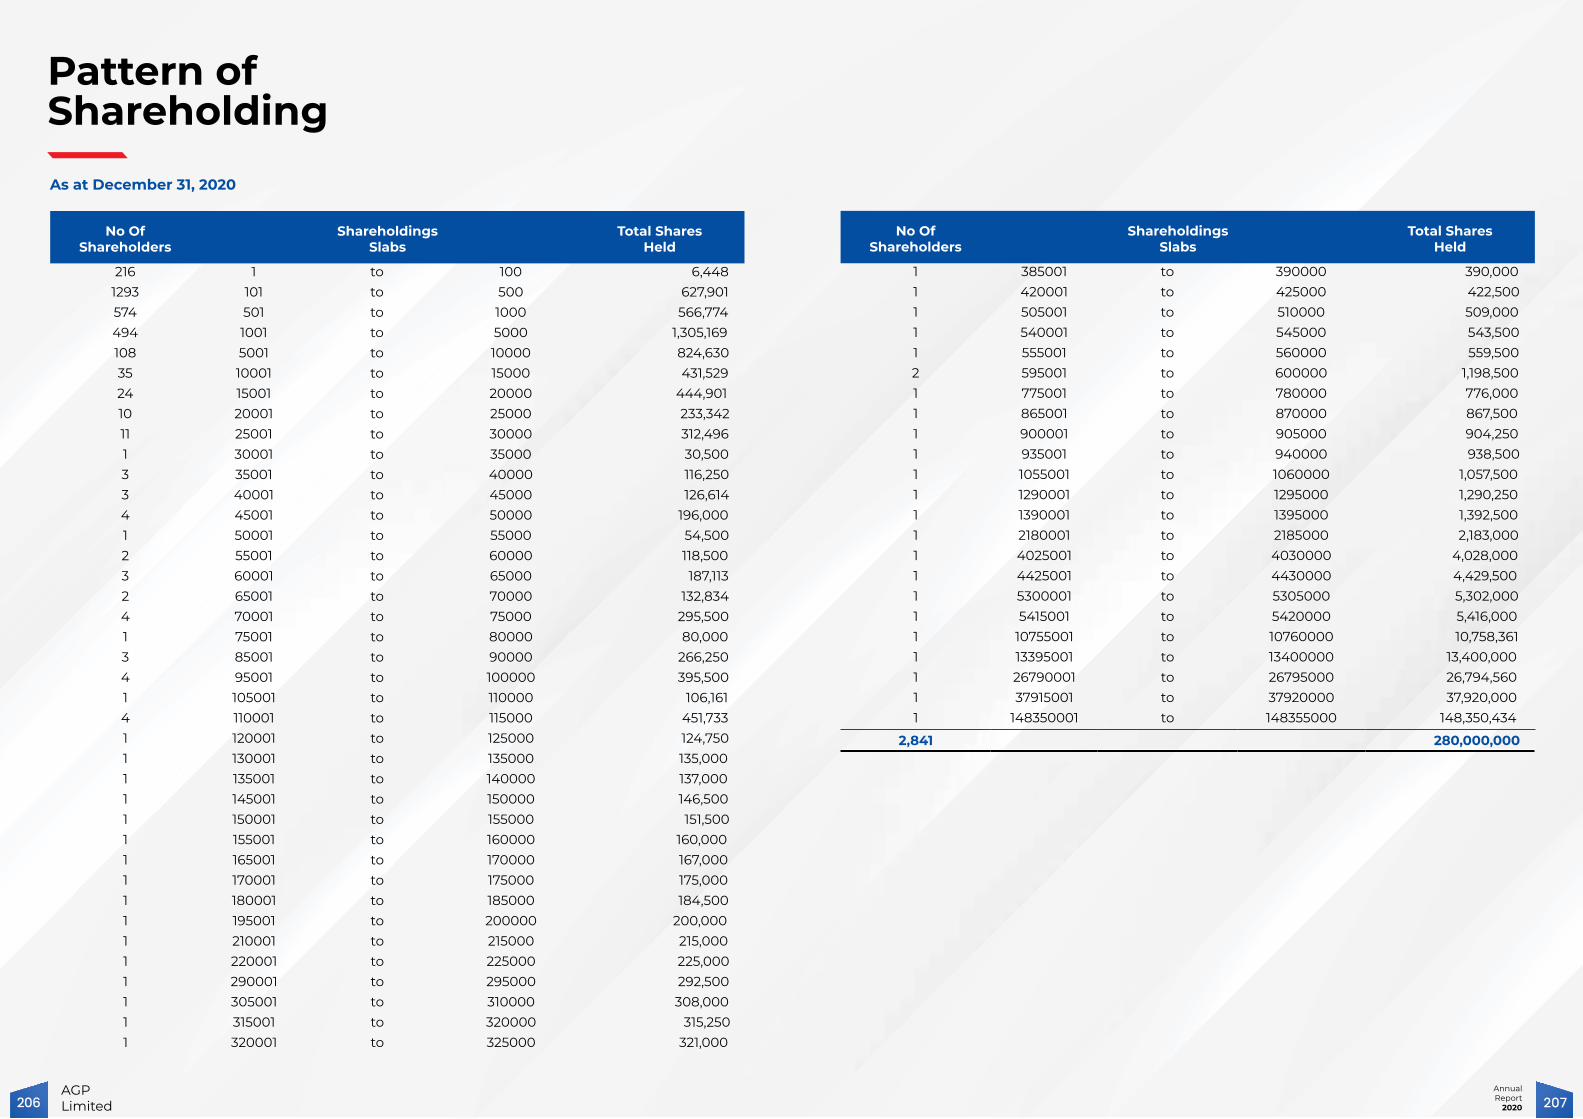
Pattern ofShareholdingAs at December 31, 2020
No OfShareholders
ShareholdingsSlabs
Total SharesHeld
216 1 to 100 6,448 1293 101 to 500 627,901 574 501 to 1000 566,774 494 1001 to 5000 1,305,169 108 5001 to 10000 824,630 35 10001 to 15000 431,529 24 15001 to 20000 444,901 10 20001 to 25000 233,342 11 25001 to 30000 312,496 1 30001 to 35000 30,500 3 35001 to 40000 116,250 3 40001 to 45000 126,614 4 45001 to 50000 196,000 1 50001 to 55000 54,500 2 55001 to 60000 118,500 3 60001 to 65000 187,113 2 65001 to 70000 132,834 4 70001 to 75000 295,500 1 75001 to 80000 80,000 3 85001 to 90000 266,250 4 95001 to 100000 395,500 1 105001 to 110000 106,161 4 110001 to 115000 451,733 1 120001 to 125000 124,750 1 130001 to 135000 135,000 1 135001 to 140000 137,000 1 145001 to 150000 146,500 1 150001 to 155000 151,500 1 155001 to 160000 160,000 1 165001 to 170000 167,000 1 170001 to 175000 175,000 1 180001 to 185000 184,500 1 195001 to 200000 200,000 1 210001 to 215000 215,000 1 220001 to 225000 225,000 1 290001 to 295000 292,500 1 305001 to 310000 308,000 1 315001 to 320000 315,250 1 320001 to 325000 321,000
No OfShareholders
ShareholdingsSlabs
Total SharesHeld
1 385001 to 390000 390,000 1 420001 to 425000 422,500 1 505001 to 510000 509,000 1 540001 to 545000 543,500 1 555001 to 560000 559,500 2 595001 to 600000 1,198,500 1 775001 to 780000 776,000 1 865001 to 870000 867,500 1 900001 to 905000 904,250 1 935001 to 940000 938,500 1 1055001 to 1060000 1,057,500 1 1290001 to 1295000 1,290,250 1 1390001 to 1395000 1,392,500 1 2180001 to 2185000 2,183,000 1 4025001 to 4030000 4,028,000 1 4425001 to 4430000 4,429,500 1 5300001 to 5305000 5,302,000 1 5415001 to 5420000 5,416,000 1 10755001 to 10760000 10,758,361 1 13395001 to 13400000 13,400,000 1 26790001 to 26795000 26,794,560 1 37915001 to 37920000 37,920,000 1 148350001 to 148355000 148,350,434
2,841 280,000,000
207AnnualReport
2020206AGPLimited
As at December 31, 2020
Categories of Shareholders Shareholders
SharesHeld Percentage
Directors and their spouse(s) and minor children
Mr. Tariq Moinuddin Khan 1 600,000 0.21 Mr. Muhammad Kamran Mirza 1 30,500 0.01 Mrs. Faiza Kamran - Spouse of Mr. Muhammad Kamran Mirza 1 5,000 0.00Mr. Zafar Iqbal Sobani 1 500 0.00 Mr. Naved Abid Khan 1 1 0.00 Mr. Kamran Nishat 1 1 0.00 Ms. Nusrat Munshi 1 1 0.00 Mr. Mahmud Yar Hiraj 1 1 0.00
Associated Companies, undertakings and related partiesAitkenstuart Pakistan (Private) Limited 1 148,350,434 52.98 Muller & Phipps (Pakistan) (Private) Limited 1 37,920,000 13.54 Aspin Pharma (Pvt.) Limited 1 13,400,000 4.79
Executives 3 1,375 0.00
Public Sector Companies and Corporations NIL - -
Banks, development finance institutions,non-banking finance companies, insurancecompanies, takaful, modarabas and pension funds
15 9,180,661 3.28
Mutual FundsCDC - Trustee Faysal Islamic Stock Fund 1 111,900 0.04 CDC - Trustee NIT Asset Allocation Fund 1 54,500 0.02 CDC - Trustee Faysal Islamic Dedicated Equity Fund 1 422,500 0.15 CDC - Trustee NBP Islamic Regular Income Fund 1 6,500 0.00 CDC Trustee - Meezan Dedicated Equity Fund 1 135,000 0.05 CDC - Trustee Alfalah GHP Islamic Dedicated Equity Fund 1 14,500 0.01 MCBFSL Trustee ABL Islamic Dedicated Stock Fund 1 40,000 0.01 CDC - Trustee Meezan Asset Allocation Fund 1 292,500 0.10 CDC - Trustee NBP Islamic Active Allocation Equity Fund 1 13,500 0.00 CDC - Trustee NIT Islamic Equity Fund 1 48,500 0.02 CDC - Trustee NBP Islamic Stock Fund 1 509,000 0.18 CDC - Trustee Nafa Islamic Principal Protected Fund - II 1 5,000 0.00 CDC - Trustee National Investment (Unit) Trust 1 21,000 0.01 MCBFSL - Trustee ABL Islamic Stock Fund 1 10,000 0.00 CDC - Trustee HBL Islamic Stock Fund 1 250 0.00 CDC - Trustee NBP Sarmaya Izafa Fund 1 27,500 0.01
Categories of Shareholders Shareholders
SharesHeld Percentage
CDC - Trustee ABL Stock Fund 1 10,000 0.00 CDC - Trustee NIT-Equity Market Opportunity Fund 1 98,500 0.04 CDC - Trustee Alfalah GHP Alpha Fund 1 62,500 0.02 CDC - Trustee Alfalah GHP Stock Fund 1 167,000 0.06 CDC - Trustee Alfalah GHP Islamic Stock Fund 1 146,500 0.05 CDC - Trustee NBP Balanced Fund 1 6,500 0.00 CDC - Trustee NBP Stock Fund 1 559,500 0.20 CDC - Trustee Atlas Islamic Stock Fund 1 500 0.00 CDC - Trustee Meezan Islamic Fund 1 5,416,000 1.93 CDC - Trustee Al Meezan Mutual Fund 1 904,250 0.32 CDC - Trustee Alhamra Islamic Asset Allocation Fund 1 225,000 0.08 CDC - Trustee AKD Index Tracker Fund 1 19,876 0.01 CDC - Trustee Alfalah GHP Value Fund 1 65,500 0.02 CDC - Trustee Faysal Stock Fund 1 448 0.00 CDC - Trustee Meezan Balanced Fund 1 390,000 0.14 CDC - Trustee Alhamra Islamic Stock Fund 1 308,000 0.11 CDC - Trustee MCB Pakistan Stock Market Fund 1 543,500 0.19
General Publica. Local 2,715 6,521,925 2.33 b. Foreign 6 25,500 0.01
Foreign Companies 4 6,294,500 2.25
Others 54 47,033,877 16.80 Total 2,841 280,000,000 100.00
Share holders holding 5% or more Shares Held Percentage
Aitkenstuart Pakistan (Private) Limited 148,350,434 52.98
Muller & Phipps (Pakistan) (Private) Limited 37,920,000 13.54
Baltoro Growth Fund 26,794,560 9.57
Details of trading in shares by Executive during the yearNo. of Shares
Bought SoldDr. Imran Khalid (Ex-Employee) 7,500 6,000
Executive means the CEO, Chief Operating Officer, CFO, HOIA, Company Secretary and employees of the Company whose annual basic salary exceeds the threshold of PKR 5 Million as determined by Board of Directors.
Pattern ofShareholding
209AnnualReport
2020208AGPLimited

Form of Proxy
Seventh Annual General Meeting I/We_______________________________________ of _________________________________, being a Member of AGP Limited holding ________________________ ordinary shares, HEREBY APPOINT_______________________________________ of _____________________________, or failing him/her __________________________ of ___________________________ as my/our proxy in my/our absence to attend and to vote and act for me/us and on my/our behalf at the Annual General Meeting of the Company to be held on Monday, April 26, 2021 at 11:30 A.M. at Beach Luxury Hotel, Moulvi Tamizuddin Khan Rd, Karachi 74000, Karachi, at any adjournment thereof.
As witness my/our hand(s) this _____ day of _____________________ 2021.
Signed in the presence of:
Notes:
1. The Member is requested: I. to affix Revenue Stamp of Rs. 10/- at the place indicated above; II. to sign in the same style of signature as is registered with the Company; III. to write down his/her Folio Number/CDC Account Number.
2. For the appointment of the above Proxy to be valid, this instrument of proxy must be received at the Share Registrar of the Company, CDC Share Registrar Services Limited, CDC House, 99-B, Block-B, S.M.C.H.S., Main Shahra-e-Faisal, Karachi 74400, at least 48 hours before the time fixed for the Meeting.
3. Any alteration made in this instrument of proxy should be initialed by the person who signs it. In addition to the above, the following requirements have to be met for CDC Account Holders / Corporate Entities: I. Attested copies of CNIC or the passport of the beneficial owners and of the Proxy must be
furnished with the proxy form. II. The Proxy must produce his original CNIC or original passport at the time of the Meeting. III. In case of corporate entities, the Board of Directors’ resolution/power of attorney and specimen
signature must be submitted (unless it has been provided earlier) along with proxy forms to the Share Registrar.
Witness 1
Signature:Name: CNIC No: Address:
Witness 2
Signature:Name: CNIC No: Address:
Name of Shareholder:Folio No. / CDC Account No:Signature of the Shareholder:
Ten Rupees Revenue Stamps
211AnnualReport
2020210AGPLimited

Standard Request FormCirculation of Annual Audited Accounts
The Company Secretary AGP Limited, B-23-C, S.I.T.E., Karachi-75700, Pakistan
Subject: Circulation of Annual Audited Accounts via Email/CD/USB/DVD or Any Other Media
Pursuant to the directions given by the Securities and Exchange Commission of Pakistan through its SRO 787(1)/2014 dated September 8, 2014 and SRO 470(1)/2016 dated May 31, 2016 that have allowed the companies to circulate its Annual Audited Accounts (i.e. Annual Balance Sheet and Profit and Loss Accounts, Statements of Comprehensive Income, Cash Flow Statement, Notes to the Financial Statements, Auditor’s and Director’s Report) to its members/shareholders, along with the Notice of the Annual General Meeting (AGM) through Email/CD/DVD/USB/ or any other Electronic Media at their registered Addresses.
Shareholders who wish to receive the hard copy of Audited Annual Financial Statements along with a Notice of the AGM via e-mail, shall have to fill the below form and send us to Company address.
I/We hereby consent Option 1 or Option 2 to the above said SROs for Audited Financial Statements and Notice of General Meeting(s) delivered to me hard form instead Email/CD/DVD/USB or any others Electronic Media.
OPTION 1 – VIA EMAILName of the Members/ Shareholders:
CNIC /SNIC #:
Folio / CDC Account Number:
Valid Email Address (to receive Financial Statements along with Notice of General Meeting(s) instead of hard copy, CD/DVD/USB.):
OPTION 2 – HARD COPYName of the Members/ Shareholders:
CNIC /SNIC #:
Folio / CDC Account Number:
Valid Email Address (to receive Financial Statements along with Notice of General Meeting(s) instead of hard copy, CD/DVD/USB.):
I/We hereby confirm that the above – mentioned information is correct and in case of any change therein, I/we will immediately intimate to the Company’s Share Registrar. I/we further confirm that the transmission of Company’s Annual Audited Financial Statements and Notice of General Meeting(s) through my/our above address would be taken as compliance with the Companies Act, 2017.
_______________________ SHAREHOLDER SIGNATURE
E - DividendMandate Form
Shareholder’s Detail
Name of Company AGP Limited
Name of Shareholder
Folio No./CDC Participants ID A/c No.
CNIC No. (for individual shareholders) /NTN (for corporate shareholders)(please attach a photocopy)
Passport No. (for foreign shareholders)
Cell Number & Land Line Number
Email Address
Shareholder’s Bank Detail
Title of Bank Account
International Bank Account Number (IBAN)
Bank’s Name
Branch Name and Address
It is stated that the above‐mentioned information is correct and in case of any change therein, I will immediately intimate Participant / Share Registrar accordingly.
__________________________Date: ____________ (Signature of Shareholder)
Notes: 1. Please provide complete IBAN Number (24 digits), after checking with your concerned branch to
enable electronic credit directly into your bank account.
2. Signature must match with specimen signature registered with the Company.
3. The Shareholder who hold shares in physical form are requested to submit the above-mentioned information to the Share Registrar. The Shareholders who hold shares in Central Depository Company are requested to submit the above-mentioned information to their Broker (Participant) with a copy of E-Dividend Mandate Form to the Share Registrar.
4. The name and address of the Share Registrar of the Company is as follows:
CDC Share Registrar Services LimitedCDC House 99-B, Block B, S.M.C.H.S. Main Shahra-e-Faisal Karachi 74400 Pakistan
213AnnualReport
2020212AGPLimited

AGP Limited B-23-C, S.I.T.E.,Karachi - 75700, Pakistan.E-mail: [email protected].: +92-21-111 247 247Fax: +92-21-2570678