Grain Stocks Methodology and Quality Measures
17
Grain Stocks Methodology and Quality Measures (April 2021) 1 USDA, National Agricultural Statistics Service Grain Stocks Methodology and Quality Measures ISSN: Released April 8, 2021, by the National Agricultural Statistics Service (NASS), Agricultural Statistics Board, United States Department of Agriculture (USDA). Scope and Purpose: Estimates of grain stocks and capacity are derived from the Agricultural Survey and the Off-Farm Grain Stocks (OFGS) survey. The Agricultural Survey is a quarterly survey (March, June, September, and December) conducted in all States, except Hawaii, which collects on-farm grain stocks and storage each quarter. Reports received from individual farmers and ranchers remain confidential and are used only in combination with other reports to arrive at State and National estimates. The OFGS survey is conducted quarterly in all States, except Alaska, Connecticut, Hawaii, Nevada, and Rhode Island. For the OFGS survey, elevators, warehouses, and processing facilities are contacted to determine how much of a commodity is being stored at a certain point in time. Published estimates for the off-farm grain stocks are used in combination with the on-farm grain stocks estimates to get a complete picture of the amount of grain stored across the country. The use of crop acreage, production, and stocks information is extensive and varied. It helps producers find the best market opportunities for their commodities. Often, recommendations and forecasts presented in agricultural magazines, news releases, etc. are based on data from the Agricultural Survey and the OFGS surveys found in NASS reports. Uses of data by farm organizations, financial institutions, insurance companies, agribusinesses, State and National farm policy makers, and buyers of agricultural products may range from maintaining a basic data series to preparing marketing campaigns and determining needs and rates on farm loans and insurance policies. Government agencies at various levels are important users of statistics. Federal farm programs require information on acreage, production potential, stocks, prices, and income. Agricultural statistics are used to plan and administer Federal and State programs in areas such as consumer protection, conservation, foreign trade, education, and recreation. Timeline: The reference date for the stocks portion of both surveys is the first of the month (March, June, September, and December) with a data collection period of approximately 15 calendar days. Regional Field Offices (RFOs) may begin data collection two days prior to the reference date. Data collection continues until a scheduled ending date, and RFOs have about 4 or 5 business days to complete editing and analysis, execute the summary, and interpret the survey results. The Agricultural Statistics Board (ASB) conducts the National review, reconciles State estimates to the National estimates, and prepare the official estimates for release in 5 or 6 business days. The Grain Stocks report is released at the end of each specified month above except for December. The December 1 stocks estimates are published in early January. The publication contains quarterly U.S. and State level data for grain stocks for all wheat, barley, corn, Durum wheat, oats, sorghum, and soybeans. Certain months of the publication contain annual grain stocks data for canola, mustard seed, rapeseed, rye, and safflower. Additionally, biannual grain stocks data are published for chickpeas, dry edible peas, and lentils in June and December, and for sunflower in March and September. Sampling: The target population for the Agricultural Survey is farms with cropland and/or storage capacity. NASS uses a dual frame approach, consisting of list frame and area frame components, to provide complete coverage of this target population. The list frame includes all known farms. Crop acreages and storage capacity of each farm is maintained on the list frame to allow NASS to define list frame sampling populations for specific surveys and to employ efficient sampling designs. Only list frame records with positive planted acres or storage capacity of the desired commodities are included in the list frame population. A lower boundary, such as 50 acres of total cropland or 1,000 bushels of grain storage capacity, is used for some States to establish the list frame population. The area frame contains all land in the State and, as such, is complete. The land is stratified according to intensity of agriculture using satellite imagery and sampled to effectively measure crops and livestock. All sampled land areas are
-
Upload
khangminh22 -
Category
Documents
-
view
6 -
download
0
Transcript of Grain Stocks Methodology and Quality Measures

Grain Stocks Methodology and Quality Measures (April 2021) 1 USDA, National Agricultural Statistics Service
Grain Stocks Methodology and Quality Measures
ISSN:
Released April 8, 2021, by the National Agricultural Statistics Service (NASS), Agricultural Statistics Board, United States Department of
Agriculture (USDA).
Scope and Purpose: Estimates of grain stocks and capacity are derived from the Agricultural Survey and the Off-Farm
Grain Stocks (OFGS) survey. The Agricultural Survey is a quarterly survey (March, June, September, and December)
conducted in all States, except Hawaii, which collects on-farm grain stocks and storage each quarter. Reports received
from individual farmers and ranchers remain confidential and are used only in combination with other reports to arrive at
State and National estimates. The OFGS survey is conducted quarterly in all States, except Alaska, Connecticut, Hawaii,
Nevada, and Rhode Island. For the OFGS survey, elevators, warehouses, and processing facilities are contacted to
determine how much of a commodity is being stored at a certain point in time. Published estimates for the off-farm grain
stocks are used in combination with the on-farm grain stocks estimates to get a complete picture of the amount of grain
stored across the country.
The use of crop acreage, production, and stocks information is extensive and varied. It helps producers find the best
market opportunities for their commodities. Often, recommendations and forecasts presented in agricultural magazines,
news releases, etc. are based on data from the Agricultural Survey and the OFGS surveys found in NASS reports. Uses of
data by farm organizations, financial institutions, insurance companies, agribusinesses, State and National farm policy
makers, and buyers of agricultural products may range from maintaining a basic data series to preparing marketing
campaigns and determining needs and rates on farm loans and insurance policies. Government agencies at various levels
are important users of statistics. Federal farm programs require information on acreage, production potential, stocks,
prices, and income. Agricultural statistics are used to plan and administer Federal and State programs in areas such as
consumer protection, conservation, foreign trade, education, and recreation.
Timeline: The reference date for the stocks portion of both surveys is the first of the month (March, June, September, and
December) with a data collection period of approximately 15 calendar days. Regional Field Offices (RFOs) may begin
data collection two days prior to the reference date. Data collection continues until a scheduled ending date, and RFOs
have about 4 or 5 business days to complete editing and analysis, execute the summary, and interpret the survey results.
The Agricultural Statistics Board (ASB) conducts the National review, reconciles State estimates to the National
estimates, and prepare the official estimates for release in 5 or 6 business days. The Grain Stocks report is released at the
end of each specified month above except for December. The December 1 stocks estimates are published in early January.
The publication contains quarterly U.S. and State level data for grain stocks for all wheat, barley, corn, Durum wheat,
oats, sorghum, and soybeans. Certain months of the publication contain annual grain stocks data for canola, mustard seed,
rapeseed, rye, and safflower. Additionally, biannual grain stocks data are published for chickpeas, dry edible peas, and
lentils in June and December, and for sunflower in March and September.
Sampling: The target population for the Agricultural Survey is farms with cropland and/or storage capacity. NASS uses a
dual frame approach, consisting of list frame and area frame components, to provide complete coverage of this target
population.
The list frame includes all known farms. Crop acreages and storage capacity of each farm is maintained on the list frame
to allow NASS to define list frame sampling populations for specific surveys and to employ efficient sampling designs.
Only list frame records with positive planted acres or storage capacity of the desired commodities are included in the list
frame population. A lower boundary, such as 50 acres of total cropland or 1,000 bushels of grain storage capacity, is used
for some States to establish the list frame population.
The area frame contains all land in the State and, as such, is complete. The land is stratified according to intensity of
agriculture using satellite imagery and sampled to effectively measure crops and livestock. All sampled land areas are
2 Grain Stocks Methodology and Quality Measures (April 2021) USDA, National Agricultural Statistics Service
enumerated in June. The farms found operating in these segments are checked to see if they are included in the list frame
population. The farms that are not included in the list frame sampling population are sub-sampled for the March,
September, and December surveys so that the target population is completely represented. These farms are referred to as
the nonoverlap portion of the area frame (NOL). The area frame portion of the Agricultural Survey sample is selected
from the NOL using a stratified sample design based on data collected in the June Area Survey. A final sampling weight
is assigned to each area frame sampling unit which is used to create the survey estimates.
The Agricultural Survey list frame sample is selected using a multivariate probability proportional to size (MPPS)
sampling scheme. Each list frame record is assigned a measure of size based on the control data for multiple specified
commodities. The MPPS design makes it very easy to target sample sizes for the commodities of interest, and it is a more
efficient design because farms will have a more optimal probability of selection based upon their individual commodities
and size. A replication scheme is used to reduce respondent burden and to provide indications of change by comparing
reports from the same farm operators. Specific replicates are designated as a stocks panel to accurately measure change in
stocks from quarter to quarter.
After the list frame samples are drawn, the sample weights are calibrated so the sum of the weighted commodities in the
sample equals the sum of the list frame data for the targeted commodities for each quarter. For example, the sum of the
weighted list frame data for storage capacity equals the sum of the population list frame data and is the same for each of
the four quarters. All list frame records in the sample are grouped into strata based on the amount of cropland and capacity
they have on the list frame. These strata are only used for nonresponse adjustments.
For each commodity, target coefficients of variation (CVs) are determined in advance of sampling to provide a certain
level of precision for the stocks estimates. The CV is defined as the ratio of the standard error to the estimate expressed as
a percentage. At the U.S. level, these target CVs range from 2% to 4% for corn, from 2% to 5% for soybeans, and from
3% to 4% for all wheat stocks depending which quarter of the marketing year the survey occurs. As on-farm stocks
become scarce toward the end of the marketing year, the CVs of the stocks estimates generally increase. However, the
standard errors also become smaller as stock levels decline across the marketing year. Each year, the final survey CVs are
examined against the target CVs to see if any modifications to the sampling procedures are needed. CVs at the State level
are expected to be higher than the U.S. level estimates due to the smaller sample sizes, and State level target CVs are set
accordingly. Over the last decade, the U.S. level survey CVs have ranged from 1.5% to 4.5% for corn stocks, from 2% to
11% for soybean stocks, and from 2% to 5% for all wheat stocks.
The OFGS target population is all entities in the United States that store at least 1,000 bushels of grain (excluding peanuts
and rice) off the farm. The OFGS sampling frame comprises all active operations – elevators, grain and oilseed processing
plants, terminals, and other facilities that store grain or oilseeds (excluding peanuts and rice) - on NASS’s List Frame that
have at least 1,000 bushels of off farm grain storage capacity. The OFGS sampling frame is grouped into specialty and
non-specialty operations and stratified using off farm grain storage capacity as a measure of size. The OFGS is a census;
hence, stratification is only used for nonresponse adjustments.
Data Collection: For consistency across modes, the paper version is considered the master questionnaire and the web,
Computer Assisted Personal Interview (CAPI), and Computer Assisted Telephone Interview (CATI) instruments are built
to model the paper instrument. Questionnaire content and format are evaluated annually through a specifications process
where requests for changes are evaluated and approved or disapproved. Input may vary from question wording or
formatting to a program change involving the deletion or modification of current questions or addition of new ones. If
there are significant changes to either the content or format proposed, a NASS survey methodologist will pre-test the
changes for usability. Prior to the start of data collection, all modes of instruments are reviewed and web, CAPI, and
CATI instruments are thoroughly tested.
All federal data collections require approval by the Office of Management and Budget (OMB). NASS must document the
public need for the data, apply sound statistical practice, prove the data does not already exist elsewhere, and ensure the
public is not excessively burdened. The questionnaires must display an active OMB number that gives NASS the
authority to conduct the survey, a statement of the purpose of the survey and the use of the data being collected, a
response burden statement that gives an estimate of the time required to complete the form, a confidentiality statement

Grain Stocks Methodology and Quality Measures (April 2021) 3 USDA, National Agricultural Statistics Service
that the respondent’s information will be protected from disclosure, and a statement saying that response to the survey is
voluntary and not required by law.
In addition to asking the specific storage capacity and stocks questions, all instruments collect information to verify the
sampled unit, determine any changes in the name or address, identify any partners to detect possible duplication, verify
the farm still qualifies for the target population, and identify any additional operations operated by the sampled operator.
Sampled farms and ranches receive a cover letter with the questionnaire mailing explaining the survey and providing
instructions for completing the survey on the internet. The letter also notifies them that they will be contacted for survey
purposes only if they do not return the questionnaire or complete the survey on the web. All modes of data collection are
utilized for each survey. While mail and web data collection are the least costly methods of data collection, the short data
collection period and the uncertainty of postal delivery times limits the effectiveness of collecting data by mail. Most of
the data are collected by CATI in one of the five Data Collection Centers. Limited personal interviewing may be done,
generally for large operations or those with special handling arrangements. A coordination tool is available to determine if
any sampled farms are in multiple on-going surveys, so data collection can be coordinated.
OFGS Headquarter operations have the option of reporting for each elevator under their control or reporting total levels
for each State in which they operate. If a firm chooses to report for each elevator, they complete a separate report for each
elevator. If an operation chooses to report State totals, a report is completed for each State. Headquarter reports often
account for many individual elevators in a State. The tables on pages 11-14 of this report reflect the counts of reporting
units not the counts of individual elevators.
Survey Edit: As survey data are collected and captured, data are edited for consistency and reasonableness using
automated systems. The edit logic ensures the coding of administrative data follows the methodological rules associated
with the survey design. Relationships between data items (i.e. responses to individual questions) on the current survey are
verified. Some data items in the current survey are compared to data items from earlier surveys to ensure certain
relationships are logical. The edit assigns a status to each record, indicating whether the record passes or fails the edit
requirements for consistency and reasonableness. Records that fail edit requirements must be updated or must be certified
by an analyst to be exempt from the failed edit requirement. All records must pass edit requirements, or be certified
exempt, before further analysis and summary.
Analysis Tools: Edited data from both surveys are processed and analyzed separately through standard interactive
analysis tools which display data for all reports by item. The tools provide scatter plots, tables, charts, and special
tabulations that allow the analyst to compare record level data with previously reported data for the same record and
reported data from similar records. Atypical responses, unusual data relationships, and statistical outliers for all items are
revealed by the analysis tool. RFO and Headquarters staff review such relationships to determine if they are correct. Data
found to be in error are corrected, while accepted data are retained.
Nonsampling Errors: Nonsampling error is present in any survey process. This error includes reporting, recording, and
editing errors, as well as nonresponse error. Steps are taken to minimize the impact of these errors, such as questionnaire
testing, comprehensive interviewer training, validation and verification of processing systems, application of detailed
computer edits, and evaluation of the data via the analysis tool. The respondent pool is monitored and reviewed during
and after data collection, and data collection strategies modified where necessary, to continually minimize nonresponse
error.
Estimators: Response to both surveys is voluntary. Some producers refuse to participate in the survey. Others cannot be
located during the data collection period and some submit incomplete reports. These nonrespondents must be accounted
for if accurate estimates of stocks are to be made. For the Agricultural Survey, nonrespondents are accounted for by
imputing data where there are missing values.
The imputation program imputes for missing survey data using reported survey data and list frame data from “similar”
reports with complete data. The algorithm defines “imputation groups” as Agricultural Statistics Districts (ASD) and
within the strata assigned at the time of sampling. Operations in the strata with the most capacity and cropland do not

4 Grain Stocks Methodology and Quality Measures (April 2021) USDA, National Agricultural Statistics Service
form homogeneous groups and are not eligible for machine imputation. If multiple follow ups do not produce a response,
RFO statisticians are required to manually impute.
For all other strata the algorithm will first impute capacity for the nonrespondent. When available, previously reported
capacity is used. Otherwise, the ratio of current survey capacity to the list frame data value for capacity is calculated from
the respondents in an imputation group. This ratio is applied to the nonrespondent’s frame capacity to derive the imputed
value for the current survey. Missing stocks are imputed similarly using the respondents’ ratio of stocks to capacity within
each imputation group. An imputation group must have five or more respondents before it is used. Those with insufficient
response are collapsed across ASD and, if there is still insufficient response, collapsed with adjacent strata.
Two kinds of estimators are used for stocks in the Agricultural Survey: direct expansions and ratio estimators. Direct
expansions are used to estimate totals such as total capacity and stocks. For the list frame, direct expansions are calculated
by summing the reported and imputed commodity values multiplied by the original sample weights. For the NOL sample,
the direct expansion is calculated by summing the total farm data for each tract operation multiplied by the original
sample weights adjusted for the proportion of the operation’s total farmland found in the area sample. The multiple frame
direct expansion is the sum of the direct expansions from the list frame and the area frame NOL component. Variances
and CVs are calculated using non-imputed data only for the direct expansions to measure the precision of the stocks
estimates. U.S. level CVs from the Agricultural Survey for the last eight quarters are displayed in the table on page 15 of
this report.
The ratio estimator takes the form of a ratio of two direct expansions which are calculated by summing over the total
sample (list + NOL), the reported commodity values multiplied by the original sample weights adjusted for usability
status. The ratio estimator is used for all within and across-survey ratios (e.g. Current to Previous Stocks, Stocks to
Production, and Stocks to Capacity). This estimator relies exclusively on reported data. For the survey to survey ratios,
both the current and previous survey data must be reported or estimated to be included in the ratio. If either of these
components is not complete, the sampling unit is excluded from the estimate and the weights of the complete records are
adjusted accordingly.
The reweighting of the record level sample weight is made within the strata. The adjustment is calculated by summing the
weights for all sample records within the strata and dividing by the sum of the weights from the usable records. This ratio
is applied to the weights of the usable records. This adjustment assumes that the data of the nonrespondents are similar to
the data of the respondents. CVs are also calculated for any ratio estimates in the summary. One advantage of the ratio
estimator is that the CVs tend to be smaller than those for the direct expansions.
For the OFGS survey, an estimator that uses capacity information is used to calculate the direct expansion for total stocks.
The estimator calculates a nonresponse adjustment by summing the capacity values for all reports and dividing by the sum
of the capacity values for the usable operations in the lower strata. Operations in the higher strata must be manually
imputed to account for any nonresponse. Any errors that may arise from manually imputing records are not captured in
the calculated CVs.
The calculated CVs capture the relative uncertainty that originates from sampling the target population and the loss of
sample from nonresponse. However, the CVs do not capture the effect of possible reporting errors or errors that may arise
from nonrespondents making fundamentally different grain storing decisions than respondents within imputation or
nonresponse adjustment groups.
Estimation: When all samples are accounted for, all responses fully edited, and the analysis material is reviewed, each
RFO executes the summary for their States for each survey. When all RFOs have run summaries, Headquarters executes
the National summary. Since all States conduct identical surveys, the samples can be pooled, and National survey results
computed. The summary results provide multiple point estimates and corresponding standard errors for each data series
being estimated. It also provides information used to assess the performance of the current survey and evaluate the quality
of the survey results, such as strata level expansions, response rates, and percent of the expansion from usable reports.
RFO staff are responsible for performing a detailed review of their survey results. Any irregularities revealed by the
summary must be investigated and, if necessary, resolved. Using the historical relationship of the survey results to the

Grain Stocks Methodology and Quality Measures (April 2021) 5 USDA, National Agricultural Statistics Service
official estimate, RFO staff must interpret the survey results and submit a recommended estimate to Headquarters for any
commodity produced in their States that contributes to the published National estimate. The data are viewed in tabular and
graphical form and a consensus estimate is established. RFO staff see their survey results only and do not have access to
other States’ results. For some data series, information from other sources (administrative data) is also utilized in the
process of establishing estimates.
For the National estimates, NASS assembles a panel of statisticians to serve as the ASB which reviews the National
results and establishes the National estimates. Since larger sample sizes yield more precise results, NASS employs the
“top-down” approach by determining the National estimates first and reconciling the State estimates to the National
estimate. The ASB has the advantage of being able to examine results across States, compare the State recommendations,
and utilize administrative data available only at the U.S. level. The same estimators used in the State summaries are
produced by the National summary. The ASB follows the same approach as the States in determining the National
estimate. The historical relationship of the survey results to the official estimate is evaluated over time to determine
accuracy and bias using tables and graphs. Each ASB member completes an independent interpretation of the survey
results which are shared with the other members. Differing conclusions are discussed and members must explain the logic
behind their estimate. An official National estimate is established only upon ASB consensus. Often the State
recommendations do not sum to the National estimate. ASB members must reexamine the State results and adjust some
States to make the sum of the estimates agree with the National estimate.
External information (administrative data) is also utilized in this process. To be considered, these data must be deemed to
be reliable and come from unbiased sources. The most common administrative data for grain stocks are the outstanding
loan data from USDA’s Farm Service Agency.
For grain stocks, NASS employs a balance sheet approach to corroborate the survey results and official estimates. After
estimates are made for on-farm and off-farm stocks, the totals of these two are combined and evaluated using the balance
sheet. This method utilizes external information to check the reasonableness of the stocks estimates. This external data
will vary some by crop, but includes imports and disappearance data for exports, food use (such as soybeans crushed),
feed use, seed use, and industrial use (such as corn processed to produce ethanol and other by-products). This approach is
typically limited to National level estimates.
Estimates are open to revision on a preannounced schedule only if new information becomes available. On-farm and off-
farm stocks are subject to revision the quarter following initial publication and again in the following December 1 Grain
Stocks report published in January each year. Every five years, estimates will also be reviewed following the Census of
Agriculture, which is an exhaustive data collection effort of all known farm operations across the U.S. The information
gathered from the Census of Agriculture provides the last chance for revision.

6 Grain Stocks Methodology and Quality Measures (April 2021) USDA, National Agricultural Statistics Service
Quality Metrics for Grain Stocks
Purpose and Definitions: Under the guidance of the Statistical Policy Office of the Office of Management and Budget
(OMB), the United States Department of Agriculture’s National Agricultural Statistics Service (NASS) provides data
users with quality metrics for its published data series. The metrics tables below describe the performance data for all
surveys contributing to the publication. The accuracy of data products may be evaluated through sampling and
nonsampling error. There is no sampling error present for the OFGS survey since it is a census of all known grain storage
entities. The Agricultural Survey CVs measure the error due to sampling as well as some nonsampling error. Nonsampling
error is also evaluated by examining response rates and the weighted item response rates.
Sample size is the number of observations selected from the population to represent a characteristic of the
population. Operations that did not have the item of interest or were out of business at the time of data collection
have been excluded.
Response rate is the proportion of the above sample that completed the survey. This calculation follows
Guideline 3.2.2 of the OMB Standards and Guidelines for Statistical Surveys (September 2006).
Weighted item response rate is a ratio of reported survey data expanded by the original sampling weight
compared to final nonresponse adjusted summary totals.
Coefficient of variation provides a measure of the size for the standard error relative to the point estimate and is
used to measure the precision of the results of a survey estimator.

Grain Stocks Methodology and Quality Measures (April 2021) 7 USDA, National Agricultural Statistics Service
March Agricultural Survey Sample Size and Response Rate - States and United States: 2019 and 2020
State Sample Size Response Rate
2019 2020 2019 2020
(number) (number) (percent) (percent)
Alabama Alaska Arizona Arkansas California Colorado Connecticut Delaware Florida Georgia Idaho Illinois Indiana Iowa Kansas Kentucky Louisiana Maine Maryland Massachusetts Michigan Minnesota Mississippi Missouri Montana Nebraska Nevada New Hampshire New Jersey New Mexico New York North Carolina North Dakota Ohio Oklahoma Oregon Pennsylvania Rhode Island South Carolina South Dakota Tennessee Texas Utah Vermont Virginia Washington West Virginia Wisconsin Wyoming United States
830 (NA) 377
1,766 2,343 1,923
286 388 611
1,343
1,752 2,720 2,158 2,687 3,955 1,551 1,027
416 957 333
1,841 2,931 1,399 3,071 2,347 3,552
225 237 389 575
1,206 1,800 3,190 1,749 2,420 1,235 1,502
63 876
2,859
1,313 4,637
835 498
1,419 1,826
445 2,010
928
74,801
815 114 422
1,702 2,278 1,955
281 402 658
1,394
1,819 2,620 2,200 2,744 3,848 1,619 1,018
405 991 310
1,858 3,030 1,367 3,161 2,330 3,599
209 230 412 577
1,214 1,710 3,058 1,770 2,382 1,131 1,488
60 860
2,882
1,291 4,853
846 497
1,394 1,807
451 2,025
897
74,984
70.1 (NA) 74.3 65.2 53.4 47.4 53.5 45.4 54.3 56.5
54.1 55.9 52.7 52.8 41.9 57.6 74.1 57.2 56.3 52.3
56.7 50.1 68.8 48.3 49.4 44.7 57.3 54.4 59.4 61.7
60.5 58.7 40.7 54.8 62.1 55.1 56.6 44.4 71.7 41.8
65.7 64.4 81.7 57.0 59.6 49.8 69.4 59.0 59.1
54.8
56.0 55.3 63.5 66.0 51.4 50.0 50.5 41.0 55.9 54.6
55.1 54.9 50.0 52.8 41.7 57.3 74.6 57.0 55.4 58.4
52.7 51.2 68.4 49.7 53.6 47.4 61.7 53.9 55.6 61.5
56.1 54.6 44.3 49.9 65.9 56.3 55.3 36.7 64.0 43.9
62.4 62.6 77.7 57.9 57.7 49.5 63.0 56.7 63.2
54.4
(NA) Not available.

8 Grain Stocks Methodology and Quality Measures (April 2021) USDA, National Agricultural Statistics Service
June Agricultural Survey Sample Size and Response Rate - States and United States: 2019 and 2020
State Sample Size Response Rate
2019 2020 2019 2020
(number) (number) (percent) (percent)
Alabama Alaska Arizona Arkansas California Colorado Connecticut Delaware Florida Georgia Idaho Illinois Indiana Iowa Kansas Kentucky Louisiana Maine Maryland Massachusetts Michigan Minnesota Mississippi Missouri Montana Nebraska Nevada New Hampshire New Jersey New Mexico New York North Carolina North Dakota Ohio Oklahoma Oregon Pennsylvania Rhode Island South Carolina South Dakota Tennessee Texas Utah Vermont Virginia Washington West Virginia Wisconsin Wyoming United States
1,176 77
337 1,596 1,823 1,741
92 338 473
1,489
1,589 2,123 1,960 2,604 3,947 1,686 1,172
274 891 98
1,785 2,336 1,280 2,516 1,639 3,143
218 71
325 626
1,114 1,509 2,467 1,470 2,168
909 1,381
18 965
2,578
1,305 4,107
634 182
1,220 1,543
402 2,079
801
66,277
1,201 77
293 1,609 1,914 1,803
97 344 461
1,511
1,641 2,262 2,067 2,295 4,018 1,851 1,142
276 934 119
1,873 2,498 1,297 2,722 1,775 3,130
219 83
402 583
1,152 1,523 2,729 1,610 2,337
963 1,491
30 971
2,733
1,425 4,059
702 195
1,242 1,418
402 2,196
792
68,467
60.7 55.8 69.1 63.3 50.0 41.8 47.8 36.1 56.0 52.5
45.4 48.2 49.7 47.7 39.7 50.2 71.5 60.6 57.8 62.2
58.8 46.2 63.8 46.7 47.0 41.4 58.3 64.8 55.4 58.5
58.3 55.8 36.8 52.1 60.7 50.7 56.5 44.4 59.5 40.3
56.6 58.8 71.5 62.1 53.1 44.1 62.9 52.1 54.9
51.1
70.9 64.9 72.0 56.6 53.9 45.3 38.1 35.8 50.5 54.6
46.5 51.4 48.9 48.6 34.5 58.2 64.5 51.8 48.8 42.0
54.8 51.1 63.2 43.2 47.6 44.0 54.3 41.0 47.5 63.3
47.7 67.0 37.1 44.5 57.3 53.5 48.8 30.0 55.9 40.7
64.4 58.5 77.9 55.4 63.0 44.4 76.9 52.9 62.9
51.3

Grain Stocks Methodology and Quality Measures (April 2021) 9 USDA, National Agricultural Statistics Service
September Agricultural Survey Sample Size and Response Rate - States and United States: 2019 and 2020
State Sample Size Response Rate
2019 2020 2019 2020
(number) (number) (percent) (percent)
Alabama Alaska Arizona Arkansas California Colorado Connecticut Delaware Florida Georgia Idaho Illinois Indiana Iowa Kansas Kentucky Louisiana Maine Maryland Massachusetts Michigan Minnesota Mississippi Missouri Montana Nebraska Nevada New Hampshire New Jersey New Mexico New York North Carolina North Dakota Ohio Oklahoma Oregon Pennsylvania Rhode Island South Carolina South Dakota Tennessee Texas Utah Vermont Virginia Washington West Virginia Wisconsin Wyoming United States
790 142 360
1,122 1,543
994 (NA) 259 529
1,083
1,249 2,243 1,969 2,567 2,581 1,163
813 225 689
(NA)
1,433 2,128 1,172 2,456 1,847 2,246 (NA) (NA) 359 562
945
1,108 2,271 1,373 2,055
731 1,094 (NA) 898
2,303
980 3,169
624 (NA) 902
1,365 387
2,056 501
55,286
702 143 273
1,120 1,438 1,101 (NA) 274 431
1,090
1,286 2,169 1,918 2,488 2,620 1,120
852 244 739
(NA)
1,421 2,148 1,151 2,423 1,868 2,225 (NA) (NA) 329 486
1,028 1,081 2,371 1,328 2,196
705 1,148 (NA) 920
2,291
943 3,168
620 (NA) 866
1,290 312
2,031 497
54,854
68.6 55.6 72.5 62.0 56.4 40.7 (NA) 40.2 57.8 55.7
47.9 53.3 58.5 59.3 43.5 54.4 71.8 60.0 48.2 (NA)
61.5 57.2 66.5 48.3 49.3 46.9 (NA) (NA) 65.2 58.4
61.6 52.3 43.6 57.9 65.8 49.2 55.5 (NA) 64.6 45.2
65.6 66.7 78.5 (NA) 58.0 47.2 72.9 59.4 58.3
55.8
73.4 64.3 74.0 55.1 53.0 47.4 (NA) 38.0 58.5 59.4
45.7 61.3 51.0 53.3 42.5 72.9 57.5 52.5 54.1 (NA)
61.2 46.5 66.6 53.3 45.9 48.6 (NA) (NA) 66.0 56.8
59.3 76.5 43.9 51.9 58.1 56.5 57.1 (NA) 65.0 40.1
70.2 61.1 76.9 (NA) 68.0 40.1 85.6 56.6 59.8
55.0
(NA) Not available.

10 Grain Stocks Methodology and Quality Measures (April 2021) USDA, National Agricultural Statistics Service
December Agricultural Survey Sample Size and Response Rate - States and United States: 2019 and 2020
State Sample Size Response Rate
2019 2020 2019 2020
(number) (number) (percent) (percent)
Alabama Alaska Arizona Arkansas California Colorado Connecticut Delaware Florida Georgia Idaho Illinois Indiana Iowa Kansas Kentucky Louisiana Maine Maryland Massachusetts Michigan Minnesota Mississippi Missouri Montana Nebraska Nevada New Hampshire New Jersey New Mexico New York North Carolina North Dakota Ohio Oklahoma Oregon Pennsylvania Rhode Island South Carolina South Dakota Tennessee Texas Utah Vermont Virginia Washington West Virginia Wisconsin Wyoming United States
1,043 171 493
1,758 2,331 1,534
262 387 889
1,587
1,650 2,513 2,503 2,836 3,001 1,651 1,436
370 951 283
1,791 2,845 1,587 3,240 2,213 3,159
206 212 496 708
1,108 1,825 2,875 1,692 2,586
906 1,375
67 1,041 2,704
1,463 4,933
803 509
1,390 1,736
538 2,193
658
74,508
989 174 348
1,780 2,187 1,628
245 392 855
1,581
1,618 2,421 2,440 2,737 3,031 1,597 1,473
367 962 286
1,782 2,792 1,546 3,185 2,222 3,158
204 207 479 638
1,120 1,811 2,931 1,672 2,648
841 1,383
65 1,081 2,582
1,419 4,702
816 499
1,354 1,592
522 2,144
629
73,135
65.5 60.8 72.4 63.3 50.5 45.4 48.9 36.2 56.7 56.3
48.8 51.5 54.3 55.6 40.7 49.3 71.0 51.6 53.2 57.2
55.2 55.0 66.7 45.5 51.6 40.5 52.4 43.9 52.8 59.2
54.2 52.5 35.6 58.0 63.7 54.3 55.9 32.8 62.2 38.8
62.6 60.0 79.0 57.4 57.7 46.3 68.2 58.4 59.0
53.4
73.9 55.7 74.7 59.1 50.3 48.3 49.0 38.5 56.6 57.9
53.6 56.0 51.5 49.4 47.0 65.8 72.9 55.3 49.1 64.0
57.4 49.4 69.7 50.4 53.3 47.5 35.8 53.6 59.5 63.6
56.5 71.0 39.8 51.2 64.3 57.9 49.9 41.5 68.2 48.9
62.9 58.9 80.3 57.9 63.7 50.1 82.0 55.2 63.4
55.7

Grain Stocks Methodology and Quality Measures (April 2021) 11 USDA, National Agricultural Statistics Service
March Off Farm Grain Stocks Survey Sample Size and Response Rate - States and United States: 2019 and 2020
State Sample Size Response Rate
2019 2020 2019 2020
(number) (number) (percent) (percent)
Alabama Alaska Arizona Arkansas California Colorado Connecticut Delaware Florida Georgia Idaho Illinois Indiana Iowa Kansas Kentucky Louisiana Maine Maryland Massachusetts Michigan Minnesota Mississippi Missouri Montana Nebraska Nevada New Hampshire 1 New Jersey New Mexico New York North Carolina North Dakota Ohio Oklahoma Oregon Pennsylvania Rhode Island South Carolina South Dakota Tennessee Texas Utah Vermont Virginia Washington West Virginia Wisconsin Wyoming United States
53 (NA)
15 46 59 44
(NA) 16 13 94
41
302 183 309 183 140 19
(NA) 35
(NA)
111 304 30
174 85
140 (NA)
13 9 4
30 122 205 160 56 29
121 (NA)
38 124
116 184 20
(NA) 67 41 8
167 14
3,924
50 (NA)
15 52 55 47
(NA) 13 15 92
43
294 180 305 175 132 21
(NA) 32
(NA)
107 304 33
169 84
138 (NA)
14 4 4
29 119 198 158 54 29
117 (NA)
39 115
111 176 23
(NA) 65 40 8
168 13
3,840
86.8 (NA) 86.7 80.4 79.7 79.5 (NA) 62.5
100.0 93.6
80.5 77.8 61.2 87.4 78.7 82.1 89.5 (NA) 51.4 (NA)
98.2 67.4 86.7 71.8 91.8 76.4 (NA) 38.5
100.0 100.0
66.7 77.0 78.5 65.6 78.6 79.3 78.5 (NA)
100.0 87.9
79.3 72.8 85.0 (NA) 85.1 78.0
100.0 69.5 71.4
77.9
86.0 (NA) 66.7 88.5 80.0 78.7 (NA) 69.2 73.3 88.0
69.8 76.9 60.6 89.2 78.9 88.6 76.2 (NA) 81.3 (NA)
97.2 64.1 84.8 67.5 76.2 69.6 (NA) 21.4 25.0 75.0
65.5 75.6 71.7 72.8 77.8 65.5 65.8 (NA)
100.0 91.3
82.9 71.6 47.8 (NA) 80.0 72.5
100.0 64.3 61.5
75.7
(NA) Not available. 1 Includes data for Maine, Massachusetts, New Hampshire, and Vermont.

12 Grain Stocks Methodology and Quality Measures (April 2021) USDA, National Agricultural Statistics Service
June Off Farm Grain Stocks Survey Sample Size and Response Rate - States and United States: 2019 and 2020
State Sample Size Response Rate
2019 2020 2019 2020
(number) (number) (percent) (percent)
Alabama Alaska Arizona Arkansas California Colorado Connecticut Delaware Florida Georgia Idaho Illinois Indiana Iowa Kansas Kentucky Louisiana Maine Maryland Massachusetts Michigan Minnesota Mississippi Missouri Montana Nebraska Nevada New Hampshire 1 New Jersey New Mexico New York North Carolina North Dakota Ohio Oklahoma Oregon Pennsylvania Rhode Island South Carolina South Dakota Tennessee Texas Utah Vermont Virginia Washington West Virginia Wisconsin Wyoming United States
51 (NA)
15 53 58 45
(NA) 15 13 94
45
300 180 305 181 137 19
(NA) 35
(NA)
111 302 30
169 87
141 (NA)
11 9 5
30 118 202 159 56 28
119 (NA)
38 123
107 184 21
(NA) 65 41 8
166 14
3,890
49 (NA)
14 51 54 44
(NA) 15 13 90
41
285 173 293 166 125 18
(NA) 32
(NA)
108 295 33
163 83
134 (NA)
14 4 3
29 115 194 147 53 28
110 (NA)
39 114
113 163 21
(NA) 65 40 8
165 12
3,716
76.5 (NA) 86.7 83.0 81.0 82.2 (NA) 53.3 76.9 93.6
75.6 75.3 65.6 88.5 81.8 81.0 94.7 (NA) 65.7 (NA)
98.2 67.5 86.7 74.0 86.2 70.2 (NA) 27.3 77.8
100.0
76.7 81.4 74.8 72.3 78.6 78.6 74.8 (NA) 92.1 82.9
85.0 75.0 85.7 (NA) 80.0 78.0
100.0 68.7 71.4
77.8
71.4 (NA) 71.4 96.1 72.2 86.4 (NA) 73.3 69.2 91.1
75.6 75.1 52.6 91.5 75.3 91.2 83.3 (NA) 78.1 (NA)
90.7 67.8 90.9 68.1 79.5 73.9 (NA) 50.0
100.0 100.0
55.2 80.0 76.8 61.2 88.7 67.9 66.4 (NA) 92.3 91.2
89.4 78.5 66.7 (NA) 87.7 80.0
100.0 63.6 66.7
76.8
(NA) Not available. 1 Includes data for Maine, Massachusetts, New Hampshire, and Vermont.

Grain Stocks Methodology and Quality Measures (April 2021) 13 USDA, National Agricultural Statistics Service
September Off Farm Grain Stocks Survey Sample Size and Response Rate - States and United States: 2019 and 2020
State Sample Size Response Rate
2019 2020 2019 2020
(number) (number) (percent) (percent)
Alabama Alaska Arizona Arkansas California Colorado Connecticut Delaware Florida Georgia Idaho Illinois Indiana Iowa Kansas Kentucky Louisiana Maine Maryland Massachusetts Michigan Minnesota Mississippi Missouri Montana Nebraska Nevada New Hampshire 1 New Jersey New Mexico New York North Carolina North Dakota Ohio Oklahoma Oregon Pennsylvania Rhode Island South Carolina South Dakota Tennessee Texas Utah Vermont Virginia Washington West Virginia Wisconsin Wyoming United States
50 (NA)
15 54 54 44
(NA) 15 14 92
43
301 179 303 176 137 18
(NA) 34
(NA)
110 303 32
169 88
140 (NA)
13 5 4
29 118 199 159 56 29
116 (NA)
39 120
111 177 22
(NA) 64 38 8
166 15
3,859
46 (NA)
14 52 52 42
(NA) 15 14 91
44
287 170 295 165 133 17
(NA) 32
(NA)
107 296 33
164 85
130 (NA)
14 4 4
31 115 195 147 56 30
113 (NA)
39 114
113 158 21
(NA) 65 39 8
164 13
3,727
76.0 (NA) 86.7 85.2 68.5 79.5 (NA) 80.0 85.7 90.2
67.4 73.4 60.3 89.1 75.6 79.6 66.7 (NA) 79.4 (NA)
99.1 75.6 71.9 68.0 88.6 76.4 (NA) 30.8 40.0
100.0
69.0 74.6 71.4 71.7 75.0 75.9 63.8 (NA) 92.3 88.3
78.4 69.5 81.8 (NA) 79.7 76.3 87.5 69.9 66.7
76.2
93.5 (NA) 71.4 84.6 63.5 76.2 (NA) 53.3
100.0 92.3
65.9 67.9 58.2 86.8 73.9 88.7 70.6 (NA) 62.5 (NA)
95.3 68.6 90.9 63.4 88.2 71.5 (NA) 28.6 25.0
100.0
45.2 80.0 77.9 61.9 78.6 70.0 61.9 (NA) 94.9 93.9
89.4 69.6 81.0 (NA) 86.2 71.8
100.0 64.6 76.9
75.1
(NA) Not available. 1 Includes data for Maine, Massachusetts, New Hampshire, and Vermont.

14 Grain Stocks Methodology and Quality Measures (April 2021) USDA, National Agricultural Statistics Service
December Off Farm Grain Stocks Survey Sample Size and Response Rate - States and United States: 2019 and 2020
State Sample Size Response Rate
2019 2020 2019 2020
(number) (number) (percent) (percent)
Alabama Alaska Arizona Arkansas California Colorado Connecticut Delaware Florida Georgia Idaho Illinois Indiana Iowa Kansas Kentucky Louisiana Maine Maryland Massachusetts Michigan Minnesota Mississippi Missouri Montana Nebraska Nevada New Hampshire 1 New Jersey New Mexico New York North Carolina North Dakota Ohio Oklahoma Oregon Pennsylvania Rhode Island South Carolina South Dakota Tennessee Texas Utah Vermont Virginia Washington West Virginia Wisconsin Wyoming United States
48 (NA)
16 56 55 45
(NA) 15 14 91
44
294 178 298 173 135 20
(NA) 33
(NA)
107 298 32
169 86
139 (NA)
13 5 5
30 116 199 159 55 28
120 (NA)
39 121
108 172 23
(NA) 65 42 8
163 15
3,832
48 (NA)
16 52 55 46
(NA) 16 12 90
46
285 170 287 161 130 17
(NA) 32
(NA)
107 291 33
163 83
126 (NA)
14 4 4
30 114 188 150 52 29
109 (NA)
38 114
115 157 20
(NA) 62 42 8
163 12
3,691
79.2 (NA) 68.8 91.1 85.5 73.3 (NA) 80.0 78.6 93.4
72.7 78.6 62.9 90.9 80.3 86.7 95.0 (NA) 75.8 (NA)
100.0 66.8 84.4 67.5 82.6 72.7 (NA) 61.5 40.0
100.0
70.0 78.4 72.4 67.9 92.7 85.7 66.7 (NA) 94.9 91.7
80.6 73.8 78.3 (NA) 84.6 81.0 87.5 64.4 73.3
77.7
91.7 (NA) 62.5 92.3 80.0 71.7 (NA) 18.8
100.0 94.4
73.9 71.6 58.2 92.3 80.1 90.8 70.6 (NA) 53.1 (NA)
86.9 65.6 72.7 71.8 88.0 76.2 (NA) 64.3
100.0 100.0
70.0 83.3 70.7 67.3 71.2 75.9 66.1 (NA) 92.1 95.6
91.3 75.2 70.0 (NA) 83.9 69.0
100.0 63.2 58.3
76.6
(NA) Not available. 1 Includes data for Maine, Massachusetts, New Hampshire, and Vermont.
Grain Stocks Methodology and Quality Measures (April 2021) 15 USDA, National Agricultural Statistics Service
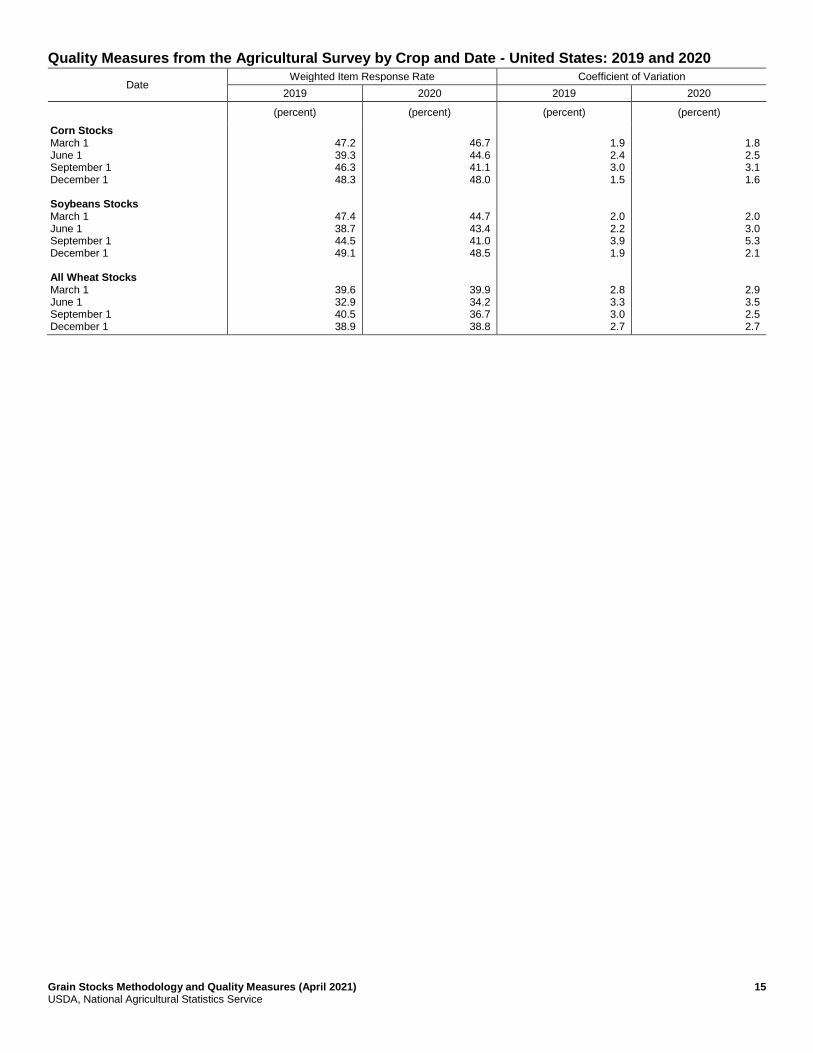
Quality Measures from the Agricultural Survey by Crop and Date - United States: 2019 and 2020
Date Weighted Item Response Rate Coefficient of Variation
2019 2020 2019 2020
(percent) (percent) (percent) (percent)
Corn Stocks March 1 June 1 September 1 December 1 Soybeans Stocks March 1 June 1 September 1 December 1 All Wheat Stocks March 1 June 1 September 1 December 1
47.2 39.3 46.3 48.3
47.4 38.7 44.5 49.1
39.6 32.9 40.5 38.9
46.7 44.6 41.1 48.0
44.7 43.4 41.0 48.5
39.9 34.2 36.7 38.8
1.9 2.4 3.0 1.5
2.0 2.2 3.9 1.9
2.8 3.3 3.0 2.7
1.8 2.5 3.1 1.6
2.0 3.0 5.3 2.1
2.9 3.5 2.5 2.7

16 Grain Stocks Methodology and Quality Measures (April 2021) USDA, National Agricultural Statistics Service
Quality Measures from Off Farm Grain Stocks Survey by Crop and Date - United States: 2019 and 2020
Date Weighted Item Response Rate Coefficient of Variation
2019 2020 2019 2020
(percent) (percent) (percent) (percent)
Corn Stocks March 1 June 1 September 1 December 1 Soybeans Stocks March 1 June 1 September 1 December 1 All Wheat Stocks March 1 June 1 September 1 December 1
86.7 86.1 84.4 84.8
86.7 86.4 82.2 85.6
91.1 93.2 82.7 85.7
83.8 84.3 80.6 84.3
84.6 84.4 86.0 86.0
84.8 82.9 80.2 84.0
0.2 0.2 0.3 0.2
0.3 0.3 0.6 0.3
0.3 0.3 0.3 0.3
0.2 0.3 0.3 0.2
0.2 0.2 0.2 0.2
0.4 0.5 0.3 0.4

Information Contacts
Process Unit Telephone Email
Estimation ..................................... Data Collection ............................. Questionnaires ............................. Sampling and Editing .................... Analysis and Estimators ................ Dissemination ............................... Media Contact and Webmaster .....
Crops Branch Survey Administration Branch Data Collection Branch Sampling, Editing, and Imputation Methodology Branch Summary, Estimation, and Disclosure Methodology Branch Data Dissemination Office Public Affairs Office
(202) 720-2127 (202) 690-4847 (202) 720-6201 (202) 690-8141 (202) 690-8141 (202) 720-3869 (202) 720-2639
[email protected] [email protected] [email protected] [email protected] [email protected] [email protected] [email protected]
Access to NASS Reports For your convenience, you may access NASS reports and products the following ways:
All reports are available electronically, at no cost, on the NASS web site: www.nass.usda.gov
Both national and state specific reports are available via a free e-mail subscription. To set-up this free
subscription, visit www.nass.usda.gov and click on “National” or “State” in upper right corner above “search”
box to create an account and select the reports you would like to receive.
Cornell’s Mann Library has launched a new website housing NASS’s and other agency’s archived reports. The new website, https://usda.library.cornell.edu. All email subscriptions containing reports will be sent from the new website, https://usda.library.cornell.edu. To continue receiving the reports via e-mail, you will have to go to the new website, create a new account and re-subscribe to the reports. If you need instructions to set up an account or subscribe, they are located at: https://usda.library.cornell.edu/help. You should whitelist [email protected] in your email client to avoid the emails going into spam/junk folders.
For more information on NASS surveys and reports, call the NASS Agricultural Statistics Hotline at (800) 727-9540,
7:30 a.m. to 4:00 p.m. ET, or e-mail: [email protected].
The U.S. Department of Agriculture (USDA) prohibits discrimination against its customers, employees, and applicants for
employment on the basis of race, color, national origin, age, disability, sex, gender identity, religion, reprisal, and where
applicable, political beliefs, marital status, familial or parental status, sexual orientation, or all or part of an individual's
income is derived from any public assistance program, or protected genetic information in employment or in any program
or activity conducted or funded by the Department. (Not all prohibited bases will apply to all programs and/or
employment activities.)
If you wish to file a Civil Rights program complaint of discrimination, complete the USDA Program Discrimination
Complaint Form (PDF), found online at www.ascr.usda.gov/filing-program-discrimination-complaint-usda-customer, or
at any USDA office, or call (866) 632-9992 to request the form. You may also write a letter containing all of the
information requested in the form. Send your completed complaint form or letter to us by mail at U.S. Department of
Agriculture, Director, Office of Adjudication, 1400 Independence Avenue, S.W., Washington, D.C. 20250-9410, by fax
(202) 690-7442 or email at [email protected].