Genetic Stock Structure of Frigate Tuna (Auxis thazard) Along ...
11
Turkish Journal of Fisheries and Aquatic Sciences 12: 893-903 (2012) www.trjfas.org ISSN 1303-2712 DOI: 10.4194/1303-2712-v12_4_17 © Published by Central Fisheries Research Institute (CFRI) Trabzon, Turkey in cooperation with Japan International Cooperation Agency (JICA), Japan Genetic Stock Structure of Frigate Tuna (Auxis thazard) Along Indian Coast Based on PCR-RFLP Analyses of mtDNA D-Loop Region Introduction Frigate tuna is an important commercial fish of family Scombridae. It is circumtropical in distribution and has been recorded in most of the warm seas of the Pacific, Atlantic and Indian Oceans. It usually inhabits the top 50 m of water column, with a localized migratory habit and primarily restricted to continental shelves (Maguire et al., 2006). Though larvae have high temperature tolerance between 21.6 o and 30.5 o C, their optimum temperature is between 27 o and 27.9 o C (Collette and Nauen, 1983). From larval records, it is deduced that frigate tuna spawns throughout its distribution range. However, spawning season varies in correlation with temperature and other environmental changes (Collette and Nauen, 1983). Spawning is believed to occur in several batches with fecundity of about 1.37 million eggs per year. In Indian waters, spawning occur mainly during monsoon (August to November), with fecundity range between 0.2 and 1.06 million eggs per spawning in correlation with size of females (Rao, 1964; Pillai and Gopakumar, 2003). India is fortunate to have large resources of tuna. The estimated potential of tuna in Exclusive Economic Zone (EEZ) of India is about 278,000 tonnes (Pillai and Mallia, 2007). Despite high abundance, very little information is available on genetic stocks of tuna species in Indian waters. To date, only four genetic studies were reported across the Indian coast (Menezes et al., 2006, 2008, 2012; Kumar et al., 2012). However, no genetic stock structure information is available on frigate tuna, the second largest tuna fishery in coastal waters of India (Pillai and Mallia, 2007). Based on the population parameters, estimated exploitation rate of frigate tuna was 0.72, whereas the optimum exploitation rate was at 0.40, indicating that frigate tuna is exploited relatively at high rates in Indian waters (Pillai and Gopakumar, 2003). Therefore, knowledge of the genetic structure of frigate tuna will be essential for making conservation strategy and enhancement program for sustainable use. For the sustainable use of a fishery, a clear understanding of the stock structure of the exploited species is needed. Knowledge of stock structure is critical to management of a fishery as each stock within the fishery may possess novel genetic, physiological, behavioral, and other characters that promote distinct differences in life-history traits (Reiss et al., 2009). Overharvesting can occur if a species is considered panmictic in distribution but in reality has a fragmented population structure. Rare or unique genetic stocks also can be lost irretrievably if they are not protected (Graves, 1998). Many approaches are typically used to Girish Kumar 1, *, Swaraj Priyaranjan Kunal 1 , Maria Rosalia Menezes 1 1 National Institute of Oceanography, Biological Oceanography Division (BOD), Dona Paula, Goa 403004, India. * Corresponding Author: Tel.: +91.97 66548060; Fax:-; E-mail: [email protected] Received 11 June 2012 Accepted 30 October 2012 Abstract Frigate tuna (Auxis thazard) is an epipelagic, neritic as well as oceanic species. In present study, genetic variation was surveyed using PCR-RFLP of mitochondrial DNA D-loop region to test for the presence of stock structure of frigate tuna along the Indian coast. A total of 364 individuals were sampled from eight major fishing zones along the Indian coast. PCR- RFLP analyses of D-loop revealed significant genetic heterogeneity between samples of Port-Blair and rest of the Indian coast. Population genetic structure was also corroborated by significant value of global test of population differentiation among samples (P = 0.01). Therefore, the null hypothesis of single genetic stock of frigate tuna along the Indian coast can be rejected. The results of present study suggest the two genetic stocks of frigate tuna across the coastal waters of India. Keywords: Genetic variation, Indian waters, composite morph.
-
Upload
khangminh22 -
Category
Documents
-
view
1 -
download
0
Transcript of Genetic Stock Structure of Frigate Tuna (Auxis thazard) Along ...

Turkish Journal of Fisheries and Aquatic Sciences 12 893-903 (2012)
wwwtrjfasorg ISSN 1303-2712
DOI 1041941303-2712-v12_4_17
copy Published by Central Fisheries Research Institute (CFRI) Trabzon Turkey in cooperation with Japan International Cooperation Agency (JICA) Japan
Genetic Stock Structure of Frigate Tuna (Auxis thazard) Along Indian Coast
Based on PCR-RFLP Analyses of mtDNA D-Loop Region
Introduction
Frigate tuna is an important commercial fish of
family Scombridae It is circumtropical in distribution
and has been recorded in most of the warm seas of the
Pacific Atlantic and Indian Oceans It usually
inhabits the top 50 m of water column with a
localized migratory habit and primarily restricted to
continental shelves (Maguire et al 2006) Though
larvae have high temperature tolerance between 216o
and 305oC their optimum temperature is between 27
o
and 279oC (Collette and Nauen 1983) From larval
records it is deduced that frigate tuna spawns
throughout its distribution range However spawning
season varies in correlation with temperature and
other environmental changes (Collette and Nauen
1983) Spawning is believed to occur in several
batches with fecundity of about 137 million eggs per
year In Indian waters spawning occur mainly during
monsoon (August to November) with fecundity range
between 02 and 106 million eggs per spawning in
correlation with size of females (Rao 1964 Pillai and
Gopakumar 2003)
India is fortunate to have large resources of tuna
The estimated potential of tuna in Exclusive
Economic Zone (EEZ) of India is about 278000
tonnes (Pillai and Mallia 2007) Despite high
abundance very little information is available on
genetic stocks of tuna species in Indian waters To
date only four genetic studies were reported across
the Indian coast (Menezes et al 2006 2008 2012
Kumar et al 2012) However no genetic stock
structure information is available on frigate tuna the
second largest tuna fishery in coastal waters of India
(Pillai and Mallia 2007) Based on the population
parameters estimated exploitation rate of frigate tuna
was 072 whereas the optimum exploitation rate was
at 040 indicating that frigate tuna is exploited
relatively at high rates in Indian waters (Pillai and
Gopakumar 2003) Therefore knowledge of the
genetic structure of frigate tuna will be essential for
making conservation strategy and enhancement
program for sustainable use
For the sustainable use of a fishery a clear
understanding of the stock structure of the exploited
species is needed Knowledge of stock structure is
critical to management of a fishery as each stock
within the fishery may possess novel genetic
physiological behavioral and other characters that
promote distinct differences in life-history traits
(Reiss et al 2009) Overharvesting can occur if a
species is considered panmictic in distribution but in
reality has a fragmented population structure Rare or
unique genetic stocks also can be lost irretrievably if
they are not protected (Graves 1998)
Many approaches are typically used to
Girish Kumar1 Swaraj Priyaranjan Kunal
1 Maria Rosalia Menezes
1
1 National Institute of Oceanography Biological Oceanography Division (BOD) Dona Paula Goa 403004 India
Corresponding Author Tel +9197 66548060 Fax-
E-mail girishkumarniogmailcom Received 11 June 2012
Accepted 30 October 2012
Abstract
Frigate tuna (Auxis thazard) is an epipelagic neritic as well as oceanic species In present study genetic variation was
surveyed using PCR-RFLP of mitochondrial DNA D-loop region to test for the presence of stock structure of frigate tuna
along the Indian coast A total of 364 individuals were sampled from eight major fishing zones along the Indian coast PCR-
RFLP analyses of D-loop revealed significant genetic heterogeneity between samples of Port-Blair and rest of the Indian
coast Population genetic structure was also corroborated by significant value of global test of population differentiation
among samples (P = 001) Therefore the null hypothesis of single genetic stock of frigate tuna along the Indian coast can be
rejected The results of present study suggest the two genetic stocks of frigate tuna across the coastal waters of India
Keywords Genetic variation Indian waters composite morph
894 G Kumar et al Turk J Fish Aquat Sci 12 893-903 (2012)
differentiate populations or stocks such as
morphometrics meristics reproductive features
(spawning season fecundity) growth rates and
genetic analyses Among these the genetic approach
to fish stock assessment is comparatively more
successful as it is cost effective and results can be
obtained with high accuracy Mitochondrial DNA
(mtDNA) is commonly used in population genetic
surveys due to its high abundance in the cell high
mutation rate maternal inheritance and haploid
nature (Curole and Kocher 1999) Due to maternal
inheritance and haploid nature the effective
population size for mtDNA reduces to one-fourth of
that for nuclear genes (Lindak and Paul 1994) which
makes it potentially more sensitive indicator of
genetic drift than nuclear DNA In addition the high
mutation rates of mtDNA can produce intraspecific
divergence in relatively short evolutionary times
MtDNA variation of the population has been widely
studied through Polymerase Chain Reaction (PCR)
based Restriction Fragment Length Polymorphism
(RFLP) due to its high resolution and low cost
Nevertheless RFLP has been proved to be useful
genetic tool in differentiating the many tuna species
(Ward et al 1997 Chow and Ushiama 1995
Menezes et al 2006)
In present study PCR-RFLP analysis of the
mtDNA D-loop region was employed to examine
population genetic structure of frigate tuna along the
Indian coast Present study is the first of its kind on
identification of stock structure of frigate tuna in
Indian waters
Materials and Methods
DNA Isolation
A total of 364 fin clip samples of frigate tuna
were collected from eight locations of Indian coast
(Table 1 Figure 1) and preserved in absolute alcohol
until DNA extraction Total genomic DNA was
isolated following the protocol described by Asahida
Table 1 Estimates of genetic diversity within samples of frigate tuna for RFLP data number of samples (n) number of
composite morphs (nh) composite morphs diversity (h) and nucleotide diversity (π)
Samples Date of collection Location (n) (nh) (h) (π)
Veraval (VE) October 2007 2054degN 7022degE 50 12 07690 22873
Ratnagiri (RA) January 2008 1659degN 7318degE 50 12 07804 22073
Kochi (KO) February 2008 958degN 7616degE 50 15 07600 22367
Kavaratti (KA) November 2008 1034degN 7237degE 50 11 06922 17829
Port-Blair (PB) July 2008 1140degN 9246degE 14 8 08681 22857
Tuticorin (TU) September 2009 849degN 7808degE 50 11 07763 21437
Pondicherry (PO) July 2008 1156degN 7950degE 50 16 08433 23951
Vizag (VI) February 2009 1742degN 8315degE 50 10 07004 19755
Total 364 32 07684 21611
Figure 1 Map showing the sampling sites of frigate tuna along the Indian coast VE Veraval RA Ratnagiri KO Kochi KA Kavaratti PB Port-Blair TU Tuticorin PO Pondicherry VI Vizag
GKumar et al Turk J Fish Aquat Sci 12 893-903 (2012) 895
et al (1996) The quantity and quality of the extracted
DNA was estimated using UV-VIS spectrophotometer
(UV-1800 Shimadzu Japan) Each sample was
estimated to have 20-30 ng of DNA per micro litre of
solution The DNA samples were stored at 4degC prior
to PCR analysis
DNA Amplification
The PCR was used to amplify a fragment of 500
bp (Figure 2) (supplementary data) of the control
region (D-loop) using the primer set 5
CCGGACGTCGGAGGTTAAAAT 3 (forward) and
5 AGGAACCAAATGCCAGGAATA 3 (reverse)
The primers were designed from a GenBank sequence
of Auxis thazard (Menezes et al 2006 accession
number NC005318) DNA samples were amplified in
Eppendorf Thermocycler (ep gradient S)
Amplification was carried out in 50 μl reaction
mixture containing 2 μl of template DNA 5 μl of 10X
buffer (100 mM Tris-HCl pH 8middot3 15 mM MgCl2
500 mM KCl) 1middot0 μl of each primer (100 pmol) 5 μl
of a 2middot5 mM solution of each deoxyribonucleoside
triphosphate (dNTP) 2middot5 units of Taq DNA
polymerase and milliQ water PCR parameters
consisted of 35 cycles of denaturation at 94degC for 1
minute annealing at 55degC for 1 minute and extension
at 72degC for 1 minute Final extension was done at
72degC for 5 minutes
RFLP
The PCR products were digested with six
restriction enzymes (four base recognition enzymes
Alu I Hae III Hha I Msp I and Rsa I and the five
base recognition enzyme Hinf I) Restriction digestion
was carried out in a 10 μl volume containing 2 μl of
PCR product 2 units of restriction enzyme 1 μl of the
appropriate buffer and 7 μl of ultrapure water in an
incubator at 37degC for overnight Restriction digestion
products were electrophoresed on a 25 agarose gel
using 1X TBE buffer and visualized via ultraviolet
transilluminator after staining of the gel with
ethidium bromide The 100 bp DNA ladder was used
as the molecular weight standard
Data Analyses
Data analysis was initiated by preparing a matrix
of data which includes presence or absence of
different restriction fragment patterns found with
respect to each endonuclease Since Msp I and Hae III
did not show polymorphism restriction pattern of
these two enzymes were not used for constructing
data set Also because only one region of mtDNA
was studied composite restriction patterns were called
as composite morphs instead of composite haplotypes
Matrix data were used to analyze the population
structure and genetic variation by Arlequin version
35 (Excoffier and Lischer 2010) The genetic
diversity was obtained by estimating nucleotide
diversity (π) and composite morph diversity (h) for
the mtDNA using Tajimarsquos (1983) and Neirsquos (1987)
methods The pairwise fixation index (FST) was
employed to test the genetic differentiation between
samples The significance of FST was tested by 1000
permutations for each pairwise comparison The null
hypothesis of population panmixia was also tested
using an exact test of the differentiation of composite
morphs among samples using 100000 Markov steps
Overall genetic heterogeneity was tested using an
analysis of molecular variance (AMOVA) approach
(Excoffier et al 1992) This approach performs a
standard analysis of variance in which the total
variance is partitioned in covariance components due
to inter-individual differences inter-population
differences and differences between groups of
populations Estimates of expected number of female
migrants between samples per generation (Nfm) was
calculated using the formula 2Nfm = ((1FST)-1)
(Takahata and Palumbi 1985) The population
parameters θ and τ were also estimated in Arlequin A
statistical test of mutation neutrality was carried out
using Fursquos FS test (Fu 1997) and Tajimarsquos D test
(Tajima 1989) The significances of these statistics
were estimated by 1000 replicates The estimated τ
value was transformed to estimate time since
expansion using the formula T= τ2μ where μ is the
Figure 2 500 bp PCR amplified product of frigate tuna Where M is the 100bp DNA marker and 1-12 is the amplified DNA
product
896 G Kumar et al Turk J Fish Aquat Sci 12 893-903 (2012)
mutation rate and T is the time since expansion
(Slatkin and Hudson 1991) In present study the
mutation rate of 36 times 10minus8
mutations per site per year
was applied for the control region sequence of frigate
tuna as this rate has been reported for the mtDNA
control region in teleosts (Donaldson and Wilson
1999) Phylogenetic relationships among
mitochondrial D-loop composite morphs were
assessed using a Minimum Spanning Network (MSN)
based on number of different restriction sites with
program Arlequin MSN was illustrated using
HapStar Version 05 (Teacher and Griffiths 2011)
Results
Genetic Diversity
PCR-RFLP analysis of the mtDNA D-loop
amplicon using the six restriction enzymes Rsa I Alul
I Hinf I Hha I Msp I and Hae III detected 18
restriction sites For the enzymes Rsa I Alul I Hinf I
and Hha I at least two fragment patterns were
observed while Msp I and Hae III showed only one
restriction pattern The polymorphic band pattern of
restriction enzymes (Rsa I Alu I Hinf I Hha I) are
presented as supplementary data (Figure 3(a-g)) A
total of 32 different composite morphs were identified
(Table 2) The most commonly observed composite
morph was AAAA followed by BAAA and GAAA
Total five composite morphs were shared among all
the eight geographical regions while fourteen
composite morphs were unique to their sampling
regions The estimates of composite morphs diversity
(h) derived from RFLP data were high for all the eight
sampling localities with value ranging from 06922 to
08681 (Table 1) The nucleotide diversity (π) among
the samples ranged from 17829 to 23951 (Table 1)
The MSN (Figure 2) indicates that composite morphs
are closely related and there is no clear pattern of
composite morphs and geographic location among
samples
Population Genetic Structure
Significant genetic heterogeneity was observed
in global test of differentiation among samples (P =
001) In addition exact test of population
differentiation showed significant genetic
differentiation between PB and (VE RA KA TU
VI) (Table 3) However most of the pairwise FST
values were not significant at P lt 005 level except
between PO and VI (Table 4) The overall FST
calculated by pooling the eight samples was not
significant (FST = 00049 Pgt005) (Table 5) The
estimated value of female migrants per generation
(using FST = 00049) was 102 among the eight
samples However restricted gene flow (Nfm = 16)
was observed between samples of PB and (VE RA
KO KA TU PO VI)
(a)
(b)
Figure 3(a b) shows the restriction digestion of mtDNA (D-loop) of frigate tuna with enzyme Rsa I Where M is the 100 bp
DNA marker and A B C D E F and G are different restriction patterns
GKumar et al Turk J Fish Aquat Sci 12 893-903 (2012) 897
Historic Demography
The Arlequin analyses of mtDNA showed large
differences in θ0 and θ1within all sampling localities
suggesting a rapid population expansion (Table 6)
The overall Fs value was highly significant with (P
=lt 001) while Tajimas D test of selective neutrality
was non-significant (P gt 005) (Table 6) The overall
(c)
(d)
Figure 3 (c d) shows the restriction digestion of mtDNA (D-loop) of frigate tuna with enzyme Alu I Where M is the 100
bp DNA marker and A B C and D are different restriction patterns
(f)
(g)
Figure 3 (f g) shows the restriction digestion of mtDNA (D-loop) of frigate tuna with enzyme Hinf I Where M is the 100 bp
DNA marker and A B and C are different restriction patterns
898 G Kumar et al Turk J Fish Aquat Sci 12 893-903 (2012)
tau (τ) value for entire samples was 44844 (Table 6)
indicating that the population expansion of frigate
tuna in Indian waters took place about 012 million
years before present
Discussion
Exact test of population differentiation showed
significant genetic heterogeneity between samples of
PB and (VE RA KA TU VI) indicating the
existence of two genetic stocks of frigate tuna along
the Indian coast Thus the null hypothesis of single
panmictic population of frigate tuna in Indian waters
can be rejected However AMOVA and pairwise
comparisons among samples failed to produce any
significant FST values indicating that it was not
Figure 3(h) shows the restriction digestion of mtDNA (D-loop) of frigate tuna with enzyme Hha I Where M is the 100
bp DNA marker and A B are different restriction patterns
Table 2 Distribution of 32 composite morphs from RFLP data Letters reflects individual composite morphs for restriction
enzymes Rsa I Alu I Hinf and Hha I (left to right)
Number Composite
Morphs
VE RA KO KA PB TU PO VI
h1 AAAA 046 044 048 054 029 042 034 052
h2 AAAB - - - - - - 002 -
h3 AABA - - - 002 007 - - -
h4 ABAA 010 002 004 004 007 004 006 002
h5 ABBA 006 - - - - - - -
h6 ACAA 008 006 004 004 - 008 004 004
h7 ADBA - - - - - - - 004
h8 BAAA 008 006 006 012 007 020 008 016
h9 BABA - - - 002 - - 002 -
h10 BBAA - 002 - 004 - 002 002 -
h11 BDAA - - - - - 002 - -
h12 CAAA 004 004 002 004 007 010 010 002
h13 CABA 002 002 - - - - - -
h14 CACA - - - - - 002 - -
h15 CBAA - - 002 - - - - -
h16 DAAA - - 004 - 029 - - -
h17 DCAA - 008 006 - 007 - 002 -
h18 EAAA 004 006 006 004 - - 002 010
h19 EABA - - - - - 002 - -
h20 EBAA 002 - - - - - - -
h21 ECAA - - - 002 - - - -
h22 FAAA - 002 002 - - - 002 -
h23 FACA 002 - - - - - - -
h24 GAAA 006 014 008 008 007 004 018 004
h25 GACA 002 - 002 - - - - -
h26 GBAA - 004 002 - - 004 002 004
h27 GBBA - - 002 - - - - -
h28 GCBA - - - - - - - 002
h29 GDAA - - - - - - 002 -
h30 GABA - - 002 - - - - -
h31 ACBA - - - - - - 002 -
h32 GCAA - - - - - - 002 -
GKumar et al Turk J Fish Aquat Sci 12 893-903 (2012) 899
possible to discern reproductive isolation between any
of the samples (Boustany et al 2008) Differences
observed in the results of exact test and AMOVA are
due to the fact that exact test is based on differences
in haplotype frequencies among populations whereas
population differentiation is computed as an average
over all polymorphic sites in AMOVA Therefore
exact test results in significant differences if
populations have different sets of haplotypes whereas
with AMOVA populations cannot be significantly
differentiated if they have similar frequencies of
polymorphic sites despite having different sets of
haplotypes
Genetic differentiation has generally been
supposed to be low among tuna populations within
and between oceans This is presumably related to the
biological characteristics of tuna species such as
reproduction in the open ocean large effective
population sizes and high adult vagility (Durnad et
al 2005) Nonetheless population structure does
exist in marine species due to (i) limits to gene flow
from barriers created by oceanic circulation patterns
currents and tectonic plate boundaries (ii) isolation-
by-distance (iii) behavioural control of dispersal by
Table 3 Non-differentiation exact P -values between all pairs of frigate tuna samples
Sample VE RA KO KA PB TU PO VI
VE
RA 01837
KO 04394 09671
KA 05166 04353 05551
PB 00258 00419 03279 00124
TU 01395 00566 00544 04312 00130
PO 02193 07760 04561 05598 01653 02405
VI 01479 01681 03928 05556 00029 01723 00227
Table 4 Pairwise FST (below) and P (above) values among samples of frigate tuna for RFLP data
Sample VE RA KO KA PB TU PO VI
VE 09990 02099 02861 09375 03291 01113 03096
RA -00167 03447 02090 06982 05283 03047 04403
KO 00076 00019 06729 01309 09932 02861 00518
KA 00046 00070 -00062 04043 04932 01104 00977
PB -00125 -00069 00135 00008 01748 00537 01729
TU 00029 -00025 -00169 -00025 00088 03428 00762
PO 00150 00033 00040 00148 00216 00029 00322
VI 00069 00000 00525 00357 00211 00443 00540
Table 5 Results of analysis of molecular variance (AMOVA) testing genetic structure of frigate tuna based on mtDNA D-
loop region RFLP data
Source of variation Variance Percentage of variation F statistic P-values
One group- (VE RA KO PB TU PO VI)
Among populations
Withinpopulations
00052
10760
048
9952
FST = 00049
P = 01769
Table 6 Demographic parameters of frigate tuna based on mtDNA D-loop region RFLP data τ θ0 θ1 Tajimarsquos D test and
Fursquos Fs values
Population τ θ0 θ1 Tajimas D Fus Fs
VE 53477 04852 99999 -04324 -29853
RA 47598 09756 99999 -05208 -31727
KO 50684 05414 99999 -06876 -62145
KA 50723 00721 99999 -05759 -33620
PB 36484 04975 99999 -10634 -28500
TU 44688 07154 99999 -05911 -24529
PO 35098 09440 99999 -08734 -68700
VI 52148 00422 99999 -05695 -19962
Total 44844 03762 99999 -03049 -180500
Significant at Plt005 Plt001 and Plt0001 respectively
900 G Kumar et al Turk J Fish Aquat Sci 12 893-903 (2012)
migration (iv) natural selection due to environmental
gradients and (v) historical subdivision of
populations due to changes in sea level (Palumbi
1994) Moreover greater genetic divergence among
populations might be expected in coastal restricted
marine species than in epipelagic species because
their inshore habitat requirements shorter migration
distances and vulnerability to climatic fluctuations
(Crosetti et al 1994 Rossi et al 1998) Frigate tuna
being primarily a coastal species with localized
migratory habit conforms to this pattern in the tested
samples
Prior to this study no published data were
available on genetic stock structure of frigate tuna in
Indian waters However genetic study on other tuna
species in Indian and neighbouring seas has been
reported For example in northwestern Indian Ocean
genetically discrete yellowfin tuna populations and
two stocks of skipjack tuna have been reported using
mitochondrial and nuclear DNA analyses
(Dammannagoda et al 2008 2011) In a recent study
sequence analysis of D-loop region indicated four
different stocks of skipjack tuna (Katsuwonus
pelamis) along Indian coast (Menezes et al 2012)
Results of present study are also supported by inter
and intra-oceanic genetic study in several tuna and
scombroid fishes For example based on restriction
fragment patterns of mtDNA significant population
structure in the Pacific Ocean was found in striped
marlin blue marlin and sailfish (Graves and
McDowell 1995 Buonaccorsi et al 1999) Chow
and Ushiama (1995) reported small but significant
heterogeneity in restriction fragments of mtDNA
between samples of albacore tuna from the Atlantic
and Pacific Ocean Hoolihan et al (2004) using PCR-
RFLP study of the mtDNA control region were able
to detect significant differences between sailfish from
the Arabian Gulf compared to those outside the Gulf
despite the relatively close proximity of these
populations In addition Menezes et al (2006) found
significant genetic heterogeneity among samples of
skipjack tuna from the Indian and Pacific Ocean
Another important factor relevant to current
study is the peculiar ocean current pattern in the study
area Unlike other major oceans and seas Indian Seas
are strongly affected by monsoonal current Frigate
tuna known to spawn in the waters around Mangalore
Vizhingam and Tuticorin during monsoon period
(Rao 1964 Muthaih 1985 Pillai and Gopakumar
2003) Monsoonal current causing the mixing of the
larval populations of different spawning grounds
along the Indian coast and thus low genetic
differentiation among samples Low genetic variation
is also supported by high rates of gene flow observed
in present study
Environmental factors both past and present
shape population genetic structure by creating or
eliminating barriers among populations Historical
Figure 4 Minimum spanning network showing relationships among 32 mtDNA D- loop region composite morphs of frigate
tuna Each circle represents a unique composite morph in the sample and size of each circle represents relative frequency of
composite morph
GKumar et al Turk J Fish Aquat Sci 12 893-903 (2012) 901
environmental events relevant to the creation and
maintenance of distinct fish populations include
glaciations formation of land-bridges and sea level
changes Andaman Sea is a part of Indian Ocean
which is located to the southeast of the Bay of Bengal
west of Thailand south of Myanmar and east of the
Andaman and Nicobar Islands Although
biogeographically it belongs to the eastern Indian
Ocean it is strongly influenced by the western Pacific
Ocean biota via the north-westerly through-flow in
the Strait of Malacca It is thus an area of
distributional confluence of the biota of both the
Indian Ocean and the Pacific Ocean (Satapoomin
2002 2007 Kimura and Satapoomin 2009) Being a
marginal sea separated from the main Indian Ocean
by the Andaman-Nicobar Island arcs it has been a
distinctly closed and isolated basin during the
Pleistocene the last glacial period (about 12000 years
ago) when the sea level was estimated as being 100
m lower than at present (Morley and Flenley 1987)
Such isolation processes are believed to have
promoted speciation andor endemism of the fish
fauna in the Andaman Sea (McManus 1985 Randall
1998 Randall and Satapoomin 1999) Closed and
isolated basin of the Andaman Sea may have
constituted barrier to the gene flow between Port-
Blair and rest of Indian coast frigate tuna populations
and thus caused the genetic differentiation observed in
this study
Grant and Bowen (1998) classified the marine
fishes into four categories based on different
combinations of small and large values for haplotype
and nucleotide diversity High levels genetic diversity
at both haplotypes (composite morphs) and nucleotide
levels observed in this study belongs to the fourth
category which may be attributed to secondary
contact between previously differentiated allopatric
lineages or to a long evolutionary history in large
stable population (Grant and Bowen 1998)
The tau (τ) value for entire data set indicating
that frigate tuna originated about 012 million years
before present in Indian waters Large differences
observed between θ0 and θ1 suggesting a rapid
population expansion event Population expansion
was also supported by overall negative and significant
value of Fus Fs test However Tajimarsquos D test was
not significant for any of the sample suggesting the
evolution of mtDNA control region sequences in
tested samples of frigate tuna are not under strong
selection
Conclusion
In conclusion the results of present study show
that there are at least two genetic stocks of frigate
tuna in coastal waters of India one around the
Andaman Sea and a second around rest of the Indian
coast Therefore the two populations should be
considered as separate management units for
conservation However as these conclusion are based
on small number of samples at Port-Blair (n =14) and
single gene locus the results should be complemented
with additional sampling and additional analysis with
other molecular markers As to identify management
units for fish species reliably a single approach will
not be adequate or appropriate (Carlsson et al 2007)
Combining the results of several techniques can
provide considerable insight into the stock structure of
species Therefore a multidisciplinary approach
integrating genetics with morphometrics meristics
life history characteristics otolith microchemistry and
tagging would provide further valuable insights into
the biological diversity and phylogeography of frigate
tuna
Acknowledgements
We wish to thank SR Shetye Director
National Institute of Oceanography (NIO) for the
facilities Financial support by a grant-in-aid project
ldquoGenetic characterization of tunas using DNA
markersrdquo from the Department of Science and
Technology (DST) New Delhi to MRM is gratefully
acknowledged GK and SPK are grateful to DST for
their fellowship support This paper forms a part of
the PhD research of GK
References
Asahida T Kobayashi T Saitoh K and Nakayama I
1996 Tissue preservation and total DNA extraction
from fish stored at ambient temperature using buffers
containing high concentration of urea Fish Sci 62
727-730
Boustany AM Reeb CA and Block BA 2008
Mitochondrial DNA and electronic tracking reveal
population structure of Atlantic bluefin tuna (Thunnus
thynnus) Mar Biol 156 13-24
Buonaccorsi VP Reece KS Morgan LS and Graves
JE 1999 Geographic distribution of molecular
variance within the blue marlin (Makaira nigricans) A
hierarchical analysis of allozyme single copy nuclear
DNA and mitochondrial DNA markers Evolution 53
568-579
Carlsson J McDowell JR Carlsson JEL and Graves
JE 2007 Genetic identity of YOY bluefin tuna from
the eastern and western Atlantic spawning areas J
Hered 98 23-28
Chow S and Ushiama H 1995 Global population
structure of albacore (Thunnus alalunga) inferred by
RFLP analysis of the mitochondrial ATPase gene Mar
Biol 123 39-45
Collette BB and Nauen CE 1983 FAO species
catalogue vol 2Scombrids of the world An annotated
and illustrated catalogue of tunas mackerels bonitos
and related species known to date FAO Fish Synop
125 1-137
Crosetti D Nelson WS and Avise JC 1994
Pronounced genetic structure of mitochondrial DNA
among populations of the circumglobally distributed
grey mullet (Mugil cephalus) J Fish Biol 44 47-58
Curole JP and Kocher TD 1999 Mitogenomics digging
deeper with complete mitochondrial genomes Trends
902 G Kumar et al Turk J Fish Aquat Sci 12 893-903 (2012)
Ecol Evol 14 394-398
Dammannagoda ST Hurwood DA and Mather PB
2008 Evidence for fine geographical scale
heterogeneity in gene frequency in yellowfin tuna
(Thunnus albacares) from north Indian Ocean around
Srilanka Fish Res 90 (1-3) 147-157
Dammannagoda ST Hurwood DA and Mather PB
2011 Genetic analysis reveals two stocks of skipjack
tuna (Katsuwonus pelamis) in northwestern Indian
Ocean Can J Fish Aquat Sci 68 210-223
Donaldson KA and Wilson RR 1999 Amphi-Panamaic
geminates of snook (Percoidei Centropomidae) provide
a calibration of the divergence rates in the
mitochondrial DNA control region of fishes Mol
Phylo Evol 13 208-213
Durand JD Collet A Chow S Guinand B and Borsa
P 2005 Nuclear and mitochondrial DNA markers
indicate unidirectional gene flow of Indo-Pacific to
Atlantic bigeye tuna (Thunnus obesus) populations and
their admixture off southern Africa Mar Biol 147
313-322
Excoffier L and Lischer HEL 2010 Arlequin suite ver
35 A new series of programs to perform population
genetics analyses under Linux and Windows Mol
Ecol Resources 10 564-567
Excoffier L Smouse PE and Quattro JM 1992
Analysis of molecular variance inferred from metric
distances among DNA haplotypes application to
human mitochondrial DNA restriction data Genetics
131 479-491
Fu YX 1997 Statistical tests of neutrality of mutations
against population growth hitchhiking and background
selection Genetics 147 915-925
Grant WS and Bowen BW 1998 Shallow population
histories in deep evolutionary lineages of marine fishes
insights from sardines and anchovies and lessons for
conservation J Hered 89 415-426
Graves JE 1998 Molecular insights into the population
structures of cosmopolitan marine fishes J Hered 89
427-437
Graves JE and McDowell JR 1995 Inter-ocean genetic-
divergence of istiophorid billfishes Mar Biol 122
193-203
Hoolihan JP Premanandh J DrsquoAloia-Palmieri MA and
Benzie JAH 2004 Intraspecific phylogeographic
isolation of Arabian Gulf sailfish Istiophorus
platypterus inferred from mitochondrial DNA Mar
Biol 145 465-475
Kimura S and Satapoomin U 2009 Fishes of Andaman
Sea West Coast of Southern Thailand National
Museum of Nature and Science Tokyo 346 pp
Kumar G Kunal SP Menezes MR and Meena MR
2012 Single genetic stock of kawakawa Euthynnus
affinis (Cantor 1849) along the Indian coast inferred
from sequence analyses of mitochondrial DNA D-loop
region Conser Genet DOI 101007s10592-012-
0359-5
Lindak P and Paul M 1994 Developments in molecular
genetic techniques in fisheries Rev Fish Biol Fish 4
272-299
Maguire JJ Sissenwine M Csirke J Grainger R and
Garcia S 2006 Highly migratory species The State of
World Highly Migratory Straddling and Other High
Seas Fishery Resources and Associated Species Food
and Agriculture Organization of the United Nations 84
pp
McManus JW 1985 Marine speciation tectonics and sea-
level changes in Southeast Asia Proceedings of Fifth
International Coral Reef Congress Tahiti Vol 4 pp
133-138
Menezes MR Ikeda M and Taniguchi N 2006 Genetic
variation in skipjack tuna Katsuwonus pelamis (L)
using PCR-RFLP analysis of mitochondrial DNA D-
loop region J Fish Biol 68 (a) 156-161
Menezes MR Kumar G and Kunal SP 2012
Population genetic structure of skipjack tuna
Katsuwonus pelamis from the Indian coast using
sequence analysis of the mitochondrial DNA D-loop
region J Fish Biol 80 2198-2212
Menezes MR Noguchi D Nakajima M and Taniguchi
N 2008 Microsatellite development and survey of
genetic variation in skipjack tuna Katsuwonus pelamis
(L) J Fish Biol 73 463-473
Morley RJ and Flenley JR 1987 Late Cainozoic
vegetational and environmental changes in the Malay
Archipelago In TC Whitmore (Ed) Biogeographical
Evolution of the Malay Archipelago Clarendon Press
Oxford 50-59
Muthaih C 1985 Maturation and spawning of Euthynnus
affinis Auxis thazard and A rochei in the Mangalore
inshore area during 1979-1982 In EG Silas (Ed)
Tuna fisheries of the Exclusive Economic Zone of
India Biology and stock assessment Bulletin of
Central Marine Fisheries Research Institute 36 71-85
Nei M 1987 Molecular Evolutionary Genetics Columbia
University Press New York 512 pp
Palumbi SR 1994 Genetic-divergence reproductive
isolation and marine speciation Ann Rev Ecol Syst
25 547-572
Pillai NGK and Mallia JV 2007 Bibliography on
Tunas CMFRI Special Publication No 92 325 pp
Pillai PP and Gopakumar G 2003 In M Mohan Joseph
AA Jayaprakash (Eds) Status of exploited marine
fishery resources of India 51-59
Randall JE 1998 Zoogeography of shore fishes of the
Indo-Pacific region Zool Stud 37(4) 227-268
Randall JE and Satapoomin U 1999 Archamia ataenia a
new species of cardinalfish (Perciformes Apogonidae)
from the Andaman Sea and Mentawai Islands Res
Bull Phuket Mar Biol Cent 62 1-8
Rao KVN 1964 An account of the ripe ovaries of some
Indian tunas Proceedings of the Symposium on
Scombroid Fishes Part 2 Marine Biological
Association of India Symposium Series 1 733-743
Reiss H Hoarau G Dickey-Collas M and Wolff WJ
2009 Genetic population structure of marine fish
mismatch between biological and fisheries management
units Fish Fish 10 361-395
Rossi AR Capula M and Crosetti D 1998 Allozyme
variation in global populations of striped mullet Mugil
cephalus (Pisces Mugilidae) Mar Biol 131 203-212
Satapoomin U 2007 A Guide to Reef Fishes of the
Andaman Sea Thailand Phuket Marine Biological
Center Department of Marine and Coastal Resources
231 pp
Satapoomin U and Winterbottom R 2002 Redescription
of the gobioid fish Cryptocentrus pavoninoides
(Bleeker 1849) with notes on sexual dichromatism in
shrimp gobies Aqua- J Ichthy Aquat Biol 5(2) 53-
64
Slatkin M and Hudson R 1991 Pairwise comparisons of
mitochondrial DNA sequences in stable and
exponentially growing populations Genetics 129 555-
562
GKumar et al Turk J Fish Aquat Sci 12 893-903 (2012) 903
Tajima F 1983 Evolutionary relationship of DNA
sequences to finite populations Genetics 105 437-
460
Tajima F 1989 Statistical method for testing the neutral
mutation hypothesis by DNA polymorphism Genetics
10 512-526
Takahata N and Palumbi SR 1985 Extranuclear
differentiation and gene flow in the finite island model
Genetics 109 441-457
Teacher AGF and Griffiths DJ 2011 HapStar
automated haplotype network layout and visualization
Mol Ecol Resources 11 151-153
Ward RD Elliot NG Innes BH Smolenski AJ and
Grewe PM 1997 Global population structure of
yellowfin tuna (Thunnus albacares) inferred from
allozyme and mitochondrial DNA variation Fish Bull
95 566-575
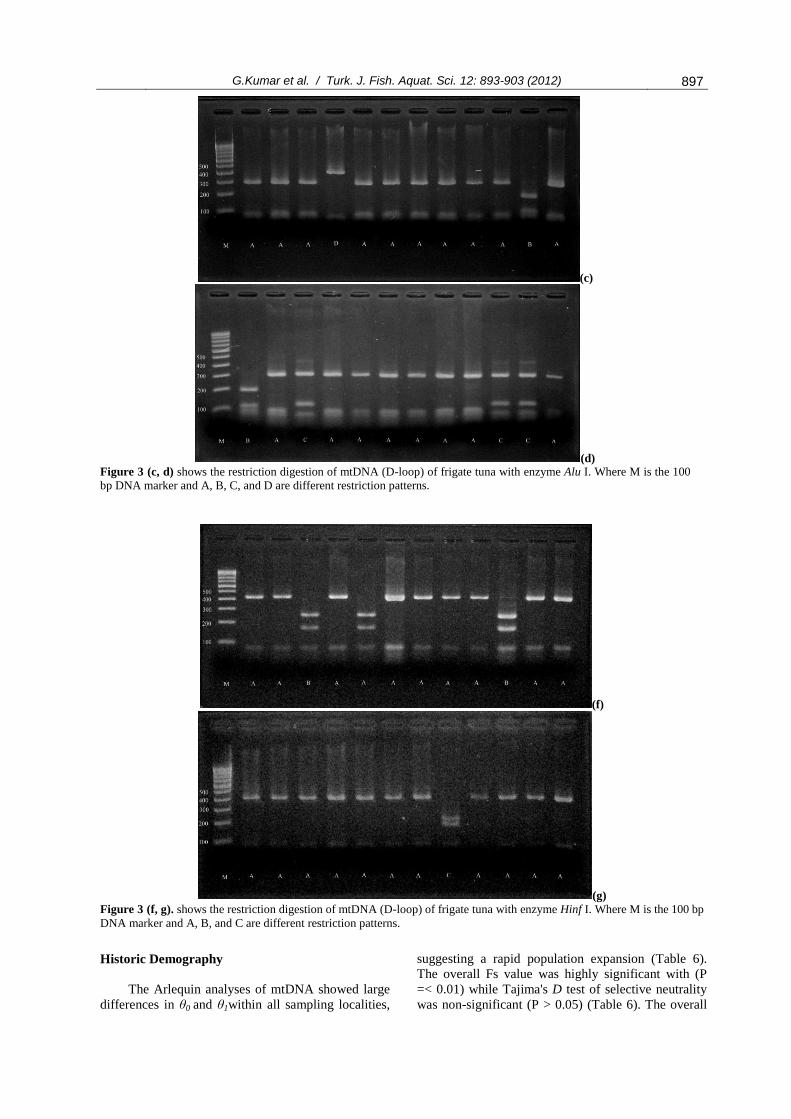
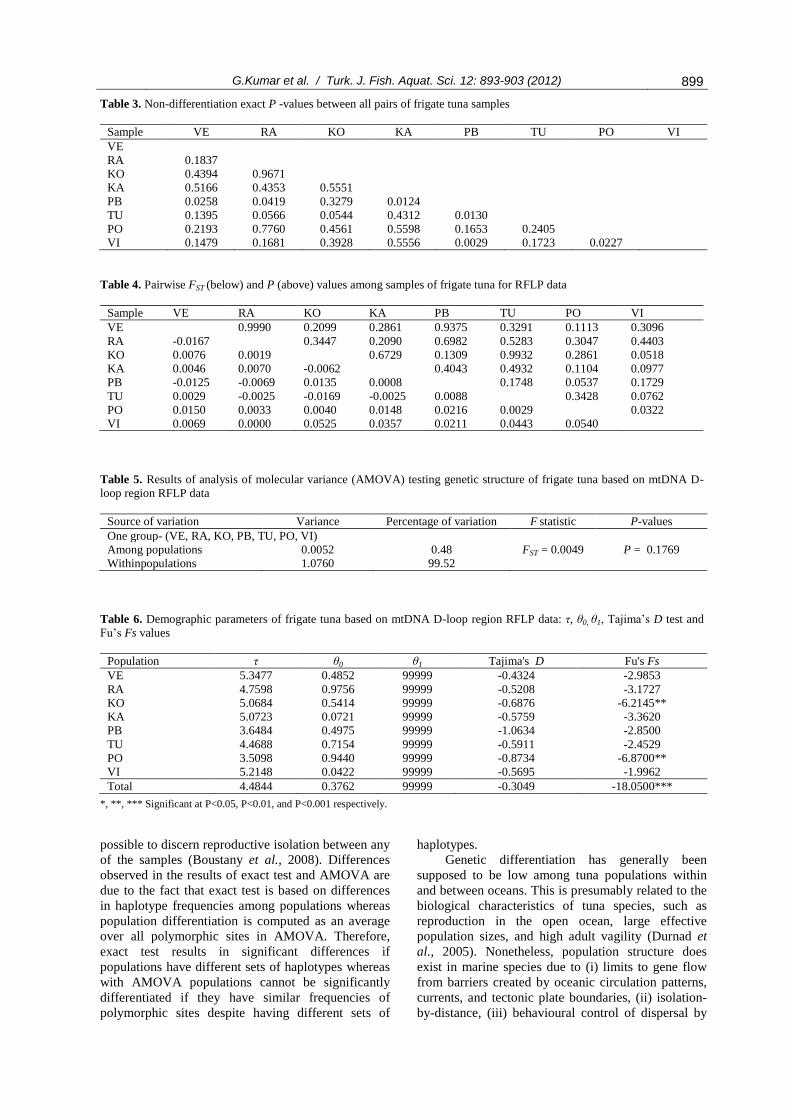
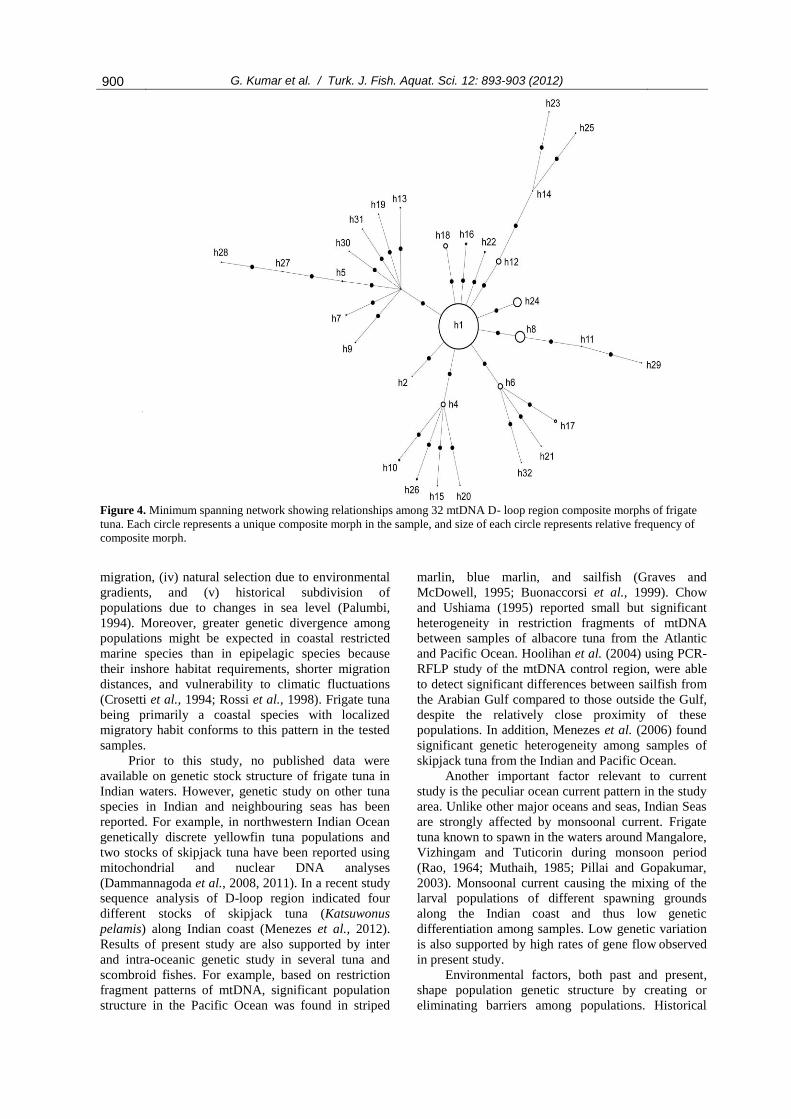