Are self-description scales better than agree/disagree scales?
�������� ����� ��
Trophic structure of vermetid reef community: High trophic diversity at smallspatial scales
Francesca Colombo, Valentina Costa, Stanislas F. Dubois, Paola Gian-guzza, Antonio Mazzola, Salvatrice Vizzini
PII: S1385-1101(12)00157-8DOI: doi: 10.1016/j.seares.2012.10.005Reference: SEARES 1006
To appear in: Journal of Sea Research
Received date: 1 August 2012Revised date: 16 October 2012Accepted date: 21 October 2012
Please cite this article as: Colombo, Francesca, Costa, Valentina, Dubois, Stanislas F.,Gianguzza, Paola, Mazzola, Antonio, Vizzini, Salvatrice, Trophic structure of vermetidreef community: High trophic diversity at small spatial scales, Journal of Sea Research(2012), doi: 10.1016/j.seares.2012.10.005
This is a PDF file of an unedited manuscript that has been accepted for publication.As a service to our customers we are providing this early version of the manuscript.The manuscript will undergo copyediting, typesetting, and review of the resulting proofbefore it is published in its final form. Please note that during the production processerrors may be discovered which could affect the content, and all legal disclaimers thatapply to the journal pertain.
ACC
EPTE
D M
ANU
SCR
IPT
ACCEPTED MANUSCRIPT
1
Trophic structure of vermetid reef community: high trophic diversity at small spatial scales
Francesca Colombo a,*, Valentina Costa a,b, Stanislas F. Dubois c, Paola Gianguzza a, Antonio
Mazzola a, Salvatrice Vizzini a
a Department of Earth and Marine Sciences, University of Palermo, CoNISMa, via Archirafi 18 - 90123
Palermo, Italy
b Department of Environmental Sciences, University of Parma, Parco Area delle Scienze 11/A - 43124
Parma, Italy
c IFREMER, Laboratory of Benthic Ecology, Technopole Brest Iroise BP70 29280 Plouzane, France
*Corresponding author
Tel.: +39-091-23862874
Fax :+39-091-6100278
Email: [email protected]
Abstract
Stable isotopes were used to investigate contributions of autochthonous (i.e. benthic: epilithon and
macroalgae) and allochthonous (i.e. pelagic: phytoplankton) organic matter sources to the diet of
suspension-feeders, grazers and predators associated to small reef-pools (cuvettes) created by
the reef-building species Dendropoma petraeum in the north-western coast of Sicily (Italy).
Contributions of potential food sources were calculated using Bayesian mixing-models and
integrated to a multivariate approach to highlight the diversity of C and N pathways within
Dendropoma cuvettes. Both pelagic and benthic organic matter sources were exploited by benthic
consumers, although clear differences were revealed in the various species depending on their
feeding strategy. Three different trophic pathways were identified: one based mainly on
phytoplankton, one based mainly on macroalgae and a third one mainly on epilithon. Suspension-
feeders seemed to rely mainly on allochthonous organic matter sources, while grazers showed a
wider diet spectrum. Predators revealed a high specialization in each of the three food chains and
showed a distinct reliance on organic matter originated from benthic or pelagic sources. Stable
ACC
EPTE
D M
ANU
SCR
IPT
ACCEPTED MANUSCRIPT
2
isotopes evidenced here a marked differentiation of the trophic niche within the cuvette-associated
community, which allows minimizing competition in very space-limited conditions.
Key-words: Dendropoma petraeum; stable isotope; Bayesian mixing model; trophic niche;
intertidal.
ACC
EPTE
D M
ANU
SCR
IPT
ACCEPTED MANUSCRIPT
3
1. Introduction
Nearshore and shallow coastal areas are characterized by food webs with high level of
connectance and by a strong bentho-pelagic coupling (Bode et al., 2006). Generally in these
systems, the large variety of primary producers, such as seagrasses, macroalgae,
microphytobenthos and phytoplankton makes the identification of food sources exploited by
benthic organisms and the detection of the main trophic pathways difficult (Bode et al., 2006;
Golléty et al., 2010). In temperate rocky shores communities, macroalgae constitute the most
representative vegetation sustaining most primary production (Little et al., 2009). Macroalgae enter
the food web mostly via detritic pathways, because of low grazing pressure due to the presence of
low digestible components (e.g. polyphenols) (Buchsbaum et al., 1991; Duggins and Eckman,
1997). Moreover, in intertidal rocky shores, herbivores can also largely graze on benthic
microalgae (Jenkins and Hartnoll, 2001). Besides this benthic autochthonous production, pelagic
allochthonous production (i.e. phytoplankton) actually plays a pivotal trophic role for macrobenthic
species (Lefebvre et al., 2009). Thus, both allochthonous and autochthonous organic matter
sources support intertidal food webs, even thought their respective roles are affected by local
environmental conditions, such as substratum features, hydrodynamic forcing and seasonal
variation (Lefebvre et al., 2009; Golléty et al., 2010).
Bioengineer reef building species are known to increase spatial complexity by creating
microhabitats, and affecting the local hydro-sedimentary patterns, and ultimately offering numerous
spatial niches for a large and often unique diverse associated species (Dubois et al. 2002;
Callaway et al., 2010). However, trophic processes within associated reef-building species, such
as food partitioning and inter-specific competition, have received little attention so far.
Within rocky intertidal Mediterranean habitats, vermetid reefs are unique and highly diverse
biogenic constructions, structurally comparable to coralline reefs in tropical seas (Safriel and Ben-
Eliahu, 1991). Indeed, they play a structural role in modifying shape and ecological characteristics
of the transitional area between mesolittoral and infralittoral rocky flats, making the habitat more
complex and tridimensional. In the Mediterranean Sea, the gastropod Dendropoma petraeum
represents the main structural vermetid species (Safriel, 1975). In close association with coralline
ACC
EPTE
D M
ANU
SCR
IPT
ACCEPTED MANUSCRIPT
4
algae (Safriel 1975; Calvo et al., 1998), it builds reefs, which host a highly diverse community.
Dendropoma reefs can be divided into three different morphological zones, from the inshore
towards the open sea: the inner edge (terrestrial boundary), the cuvette (pools in the central zone),
and the outer edge (sea boundary) (Molinier and Picard, 1953; Chemello and Silenzi, 2011). Each
of those zones are fashioned by hydrodynamics features (such as wave exposures) and the reef-
building activity of the gastropods. The cuvette is the most conspicuous zone, with a high level of
habitat heterogeneity and the most diverse associated community (Chemello et al., 1998).
Structurally, they are similar to tidal pools in the rocky shore environment (Little et al., 2009).
Previous descriptions of benthic assemblages inhabiting these reefs revealed high diversity and
species abundance at small scale (i.e. cuvette scale) (Chemello et al., 1998; Badalamanti et al.,
1998; Mannino, 1992; Goren and Galil, 2001), but the functional ecology of these unique and
complex bioconstructions is still poorly understood (Vizzini et al., 2012).
Stable isotope analyses (SIA) have been used as a powerful tool to describe the organic matter
flow and to resolve trophic relationship in coastal ecosystems (e.g. Vizzini and Mazzola, 2006;
Bode et al., 2006; Schaal et al., 2010). Classically, the 13C signature patterns are useful to
elucidate the origin and pathways of organic matter in food webs, as the primary sources may be
isotopically distinct, thus allowing distinctions between pelagic and benthic contributions (France,
1995). The 15N signals are used to described food chains lengths and prey-predators relationships
(Minagawa and Wada, 1984)
In this study, SIA was used to investigate trophic structure and functioning of vermetid reef
intertidal communities and to understand how organic matter sources are exploited by the
macrofauna species. In detail, the aims were i) to characterize the food web structure of D.
petraeum reef cuvettes, ii) to investigate the contribution of autochthonous and allochthonous
organic matter sources to the consumers’ diet, and iii) to examine how food sources are partitioned
within small spatial scales (i.e. within cuvettes).
2. Materials and methods
2.1 Study area
ACC
EPTE
D M
ANU
SCR
IPT
ACCEPTED MANUSCRIPT
5
The study was carried out along the north-western coast of Sicily (Italy) in the Marine Protected
Area (MPA) “Capo Gallo-Isola delle Femmine”. This MPA is divided into three different zones of
protection: zone A (integral reserve), zone B (general reserve) and zone C (partial reserve). The
intertidal rocky shores and the infralittoral seabed host a number of species and communities
worthy of protection for their high ecological value and conservation interest, such as Posidonia
oceanica meadows, sciaphilous communities characterized by the soft red macroalgae Corallina
elongata and C. officinalis, in addition to one of the most extensive vermetid reefs in the
Mediterranean (Badalamenti et al., 1992). The sampling area is situated in the zone B of protection
located in the eastern part of the reserve (38 12.754 N, 13 17.455 E).
2.2 Sample collection
Macrobenthic organisms and potential food sources, i.e. the autochthonous benthic epilithon (EPI)
and macroalgae (MA) and the allochthonous suspended particulate organic matter (SPOM) as a
proxy for pelagic phytoplankton, were sampled in May, when primary production reaches maximum
values in the Mediterranean. Samples of surface seawater were collected off the reef, so that
phytoplankton is not mixed with resuspended material from the reef. EPI, MA and macrobenthos
were sampled at low tide in randomly selected reef cuvettes, about 150-200 cm in size (equivalent
spherical diameters), distant from a few meters. EPI was collected in triplicate by scraping the reef
surface with blades. The most abundant and frequent reef MA (i.e. Ceramium sp., Cystoseira spp.
and Laurencia sp.) (Mannino, 1992) were collected in triplicate by hand.
To investigate the taxonomic groups representing most of the biomass within the cuvettes,
sampling focused on the most abundant and representative species typifying the vermetid reef
cuvette community, from the basis of several previous investigations (Chemello et al., 1998;
Badalamenti et al., 1998; Mannino, 1992). Epifaunal organisms were collected using a diverse set
of gears, including scrapers and scalpels for molluscs (bivalves and gastropods), nets for small
crustaceans and traps for fishes. Endofaunal species associated to microhabitats within the reef-
builder D. petraeum were collected by carefully extracting small portions of reef; particular care
was taken to avoid serious damages to the bioconstruction.
ACC
EPTE
D M
ANU
SCR
IPT
ACCEPTED MANUSCRIPT
6
2.3 Laboratory analyses
Once in the laboratory, SPOM samples were obtained by filtering 2 l of pre-filtered (200 µm)
seawater onto pre-combusted (450°C, 4 h) Whatman GF/F filters within 2 hours of collection.
Epilithon was observed under a stereo-microscope to identify the main components: benthic
diatoms and filamentous algae were found to both dominate samples. For technical reasons, the
whole sample was analysed for isotopic ratios as separation techniques did not allow to get pure
samples. Epibionts were carefully removed from MA samples. EPI, MA and SPOM samples were
analysed separately for δ15N and δ13C. Prior δ13C analyses, samples were acidified with drop-by-
drop 2N HCl to remove carbonates before drying and grinding (Carabel et al., 2006). For each
species of invertebrates and fish, several specimens were pooled, not only to reach the analytical
weight in case of small species, but also to limit inter-individual variability. Samples were rinsed
with distilled water; muscle tissues were dissected from large individuals (e.g. fishes, large
crustaceans and molluscs) and whole body was used for small individuals. All samples were dried
to constant weight at 60°C and ground into a homogeneous powder using mortar and pestle.
Isotopic analyses were performed with an isotope ratio mass spectrometer (ThermoElectron Delta
Plus XP) connected to an elemental analyser (ThermoElectron Flash EA 1112). Isotopic values
were expressed in conventional δ unit notation (as parts per mil) in relation to international
standards (Peedee Belemnite, for 13C/12C; atmospheric N2 for 15N/14N), following the formula:
δX = [(Rsample / Rstandard ) – 1] x 103, where X is 13C or 15N and R is the corresponding 13C/12C or
15N/14N ratio. Analytical precision based on the standard deviation of replicates of internal
standards (International Atomic Energy Agency IAEA-NO-3 for δ15N and IAEA-CH-6 for δ13C) was
0.2 ‰ for both δ13C and δ15N.
Trophic levels were calculated for each consumer following Post (2002a); the lowest δ15N value in
primary consumers was chosen as a baseline.
2.4 Data analysis
ACC
EPTE
D M
ANU
SCR
IPT
ACCEPTED MANUSCRIPT
7
Statistical significance of differences in stable isotope ratio among OM sources (SPOM, epilithon,
and the macroalgae Laurencia sp., Cystoseira spp., Ceramium sp.) was first assessed with non-
parametric Kruskal-Wallis tests on ranks and then with post hoc multiple comparison tests
(Statistica 8.0 package) when significant. To estimate the proportion of sources contributing to the
consumers’ diet, we applied a Bayesian mixing model approach, using the software package SIAR
(Stable Isotope Analysis in R) (Parnell et al., 2010). When several sources contribute to the diet of
an organism, mathematical mixing model can help to estimate the contribution of each end-
member to the food web. In this perspective, Bayesian statistics have proven to be of a great help,
as they allow models to incorporate variability in organisms and food sources signatures, as well
as in trophic fractionation (Parnell et al., 2010). The OM sources considered were EPI and reef MA
as autochthonous sources, and SPOM as allochthonous source. Isotopic trophic-step fractionation
is no longer considered as a constant value, especially regarding trophic-step enrichment from
primary producers to primary consumers, as numerous factors are known to affect discrimination
processes in organisms tissues (Martinez Del Rio et al., 2009). Several investigations have
provided models as proxy to estimate source-specific trophic enrichment factor (TEF) based on the
isotopic signature of the food source (see review in Caut et al., 2009). TEFs were estimated for
each of the selected sources based on linear models provided in Caut et al. (2009) for
invertebrates, as Δδ13C = -0.113 x δ13CSource - 1.916 and Δδ15N= -0.311 x δ15NSource + 4.065. For
consumers exhibiting higher trophic levels (secondary consumers and TL > 3), two TEFs were
then considered, the first TEF being calculated using Caut et al. (2009) models and the second
TEF in accordance with averaged values reported in the literature (1.0‰ for δ13C and 3.4‰ for
δ15N) (De Niro and Epstein, 1978; Minagawa and Wada, 1984; Post, 2002a), as in higher trophic
chain positions TEFs are reported to be much constant (Vander Zanden and Rasmussen, 2001;
McCutchan et al., 2003) and cannot be calculated from models since prey signatures are too
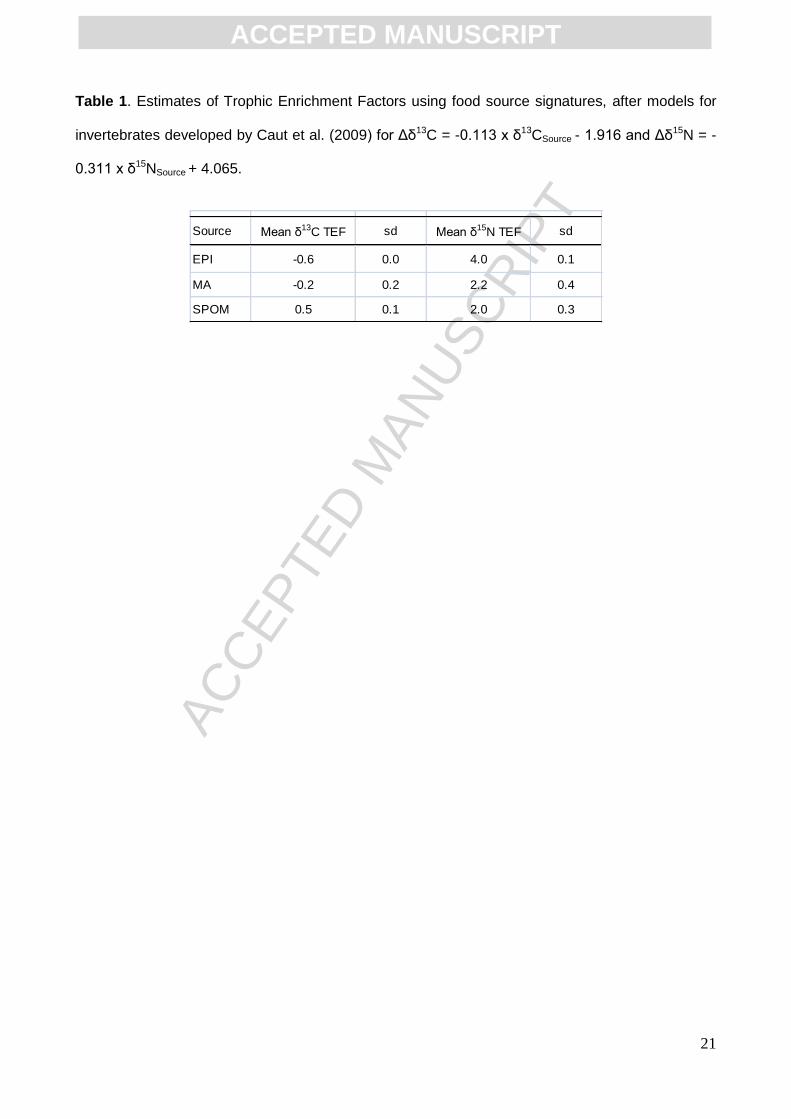
diverse. As showed in Table 1, TEF for first trophic step was comprised between -0.6 and +0.5 ‰
for Δδ13C and +2.0 and +4.0 ‰ for Δδ15N, which fall perfectly within the ranges of reviewed
estimates of TEFs (ibid.). The standard deviations calculated for TEFs originated from the
variability in primary consumers’ isotopic signatures.
ACC
EPTE
D M
ANU
SCR
IPT
ACCEPTED MANUSCRIPT
8
In order to identify food sources pathways, non-Metric Multidimensional scaling (nMDS) ordination
and hierarchical clustering (Euclidean distance, group average mode) were performed on the
Bayesian mixing model results. Minimum, maximum (expressed as 95th percentiles) and mean
contributions to the consumer diet for each food source were used as factors for each species, to
encompass all the variability in the estimation of food sources contributions. Clusters were tested
with the similarity profile (Simprof) procedure described in Clarke and Gorley (2006). All the
species diets (along with uncertainties) were permutated and compared with what expected under
a simple null hypothesis of no differences in primary consumer’s contributions to diets. This
procedure hence meaningfully grouped all species that rely on the same basal sources, regardless
their feeding mode or trophic level.
Results
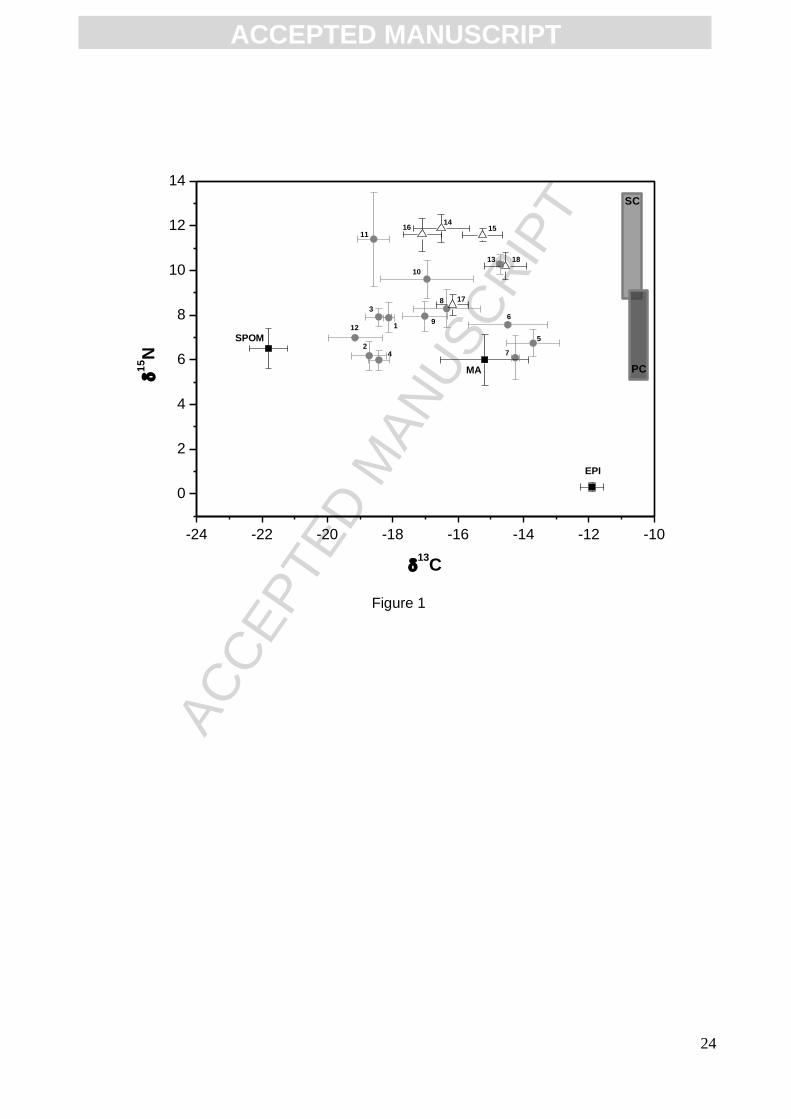
3.1. δ13C and δ15N of organic matter sources and consumers
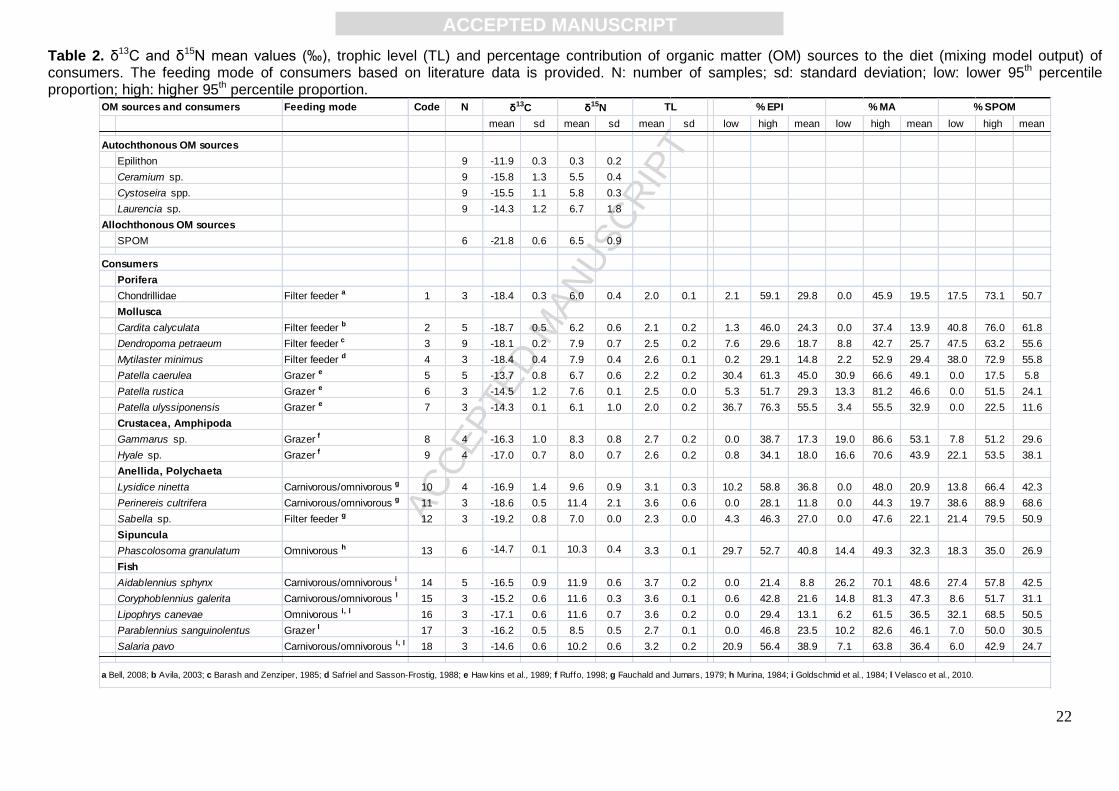
Isotopic values of organic matter sources exhibited wide ranges for both carbon and nitrogen: δ15N
ranged from 0.3 ± 0.2‰ for epilithon to 6.7 ± 1.8‰ for Laurencia sp., while δ13C values varied from
-21.8 ± 0.6‰ for SPOM to -11.9 ± 0.3‰ for epilithon (Table 2). Overall significant differences
between organic matter sources were observed for both δ13C (p<0.001) and δ15N (p<0.001).
However post-hoc multiple comparisons showed that no significant differences were found
between macroalgal species, hereafter pooled as a unique source called macroalgae (MA).
Consumers’ isotopic signatures also exhibited large isotopic carbon and nitrogen ranges (Table 2).
The lowest δ15N values were for sea sponges Chondrillidae (6.0±0.4‰), hence used as baseline to
calculate trophic levels of other species. Blenniidae finfishes, and especially Aidablennius sphynx
(11.9 ± 0.6‰) exhibited the highest δ15N values (11.9 ± 0.6‰). Estimates of trophic levels allowed
the distinction between primary consumers (2 < TL < 3) and secondary consumers (TL > 3), as
reported in Fig. 1, which matched the feeding mode retrieved from the literature (Table 2). Carbon
signatures of consumers varied markedly, mainly for primary consumers that are well discriminated
on the δ13C axis, with no overlap. Organisms’ signatures spanned from the most depleted values of
ACC
EPTE
D M
ANU
SCR
IPT
ACCEPTED MANUSCRIPT
9
filter-feeders (from -19.2 to -18.1‰) to more enriched values of grazers (from -17 to -13.7‰).
Secondary consumers exhibited a slight narrower carbon range than primary consumers (Fig. 1).
3.2 Mixing model output
Bayesian mixing model outcomes showed a high variability in the relative contributions of the three
OM sources (EPI, MA and SPOM) to the consumers’ diet (Table 2), as most of the species
signatures fell close to the barycentre of the isotopic space defined by the 3 potential food sources;
the ranges of possible contributions were expressed as 95th percentiles interval. Overall, EPI
percentage contributions exhibited the lowest values for A. sphynx, ranging from 0.0 to 21.4%,
while the highest values for Patella ulyssiponensis, ranging from 36.7% to 76.3%; MA lowest
proportion in diet was for Cardita calyculata (from 0.0 to 37.4%), whereas the highest was for
Gammarus sp. (from 19.0% to 86.6%); SPOM contribution showed the widest range of variation,
displaying proportion values from 0.0 to 17.5% for Patella caerulea, while from 38.6% to 88.9% for
the Nereididae Perinereis cultrifera (Table 2).
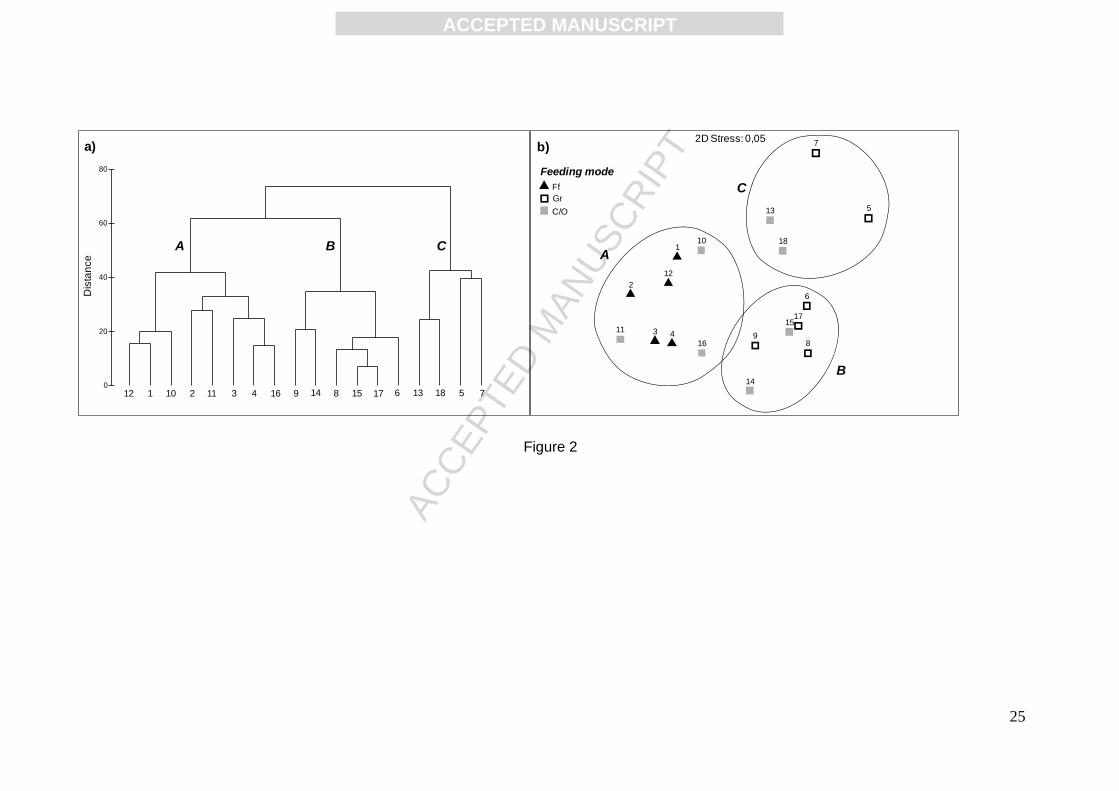
Overall, three groups of consumers were identified using cluster and nMDS ordination (Fig. 2). As
ordination was performed on the Bayesian mixing model results, within each group, species
depend on the same basal sources and hence belong to the same trophic pathway. Simprof
procedure showed that the three clusters were significantly discriminated (p<0.01). The group A is
the larger one and relied largely on SPOM. It included all the filter-feeders, three
carnivores/omnivores (i.e. the Eunicidae Lysidice ninetta, the Nereididae P. cultrifera and
Lipophrys canevae). The group B had an intermediate size and was characterized by a larger
contribution of MA as basal source. It included grazers (Gammarus sp., Hyale sp., Patella rustica,
Parablennius sanguinolentus) and carnivores/omnivores (A. sphynx and Coryphoblennius galerita).
The group C was the smallest one and clustered P. caerulea and P. ulyssiponensis, together with
Phascolosoma granulatum and Salaria pavo. Those species mainly rely on EPI, with the exception
of P. cerulea, showing a slightly higher mean contribution of MA.
4. Discussion
ACC
EPTE
D M
ANU
SCR
IPT
ACCEPTED MANUSCRIPT
10
4.1 Contribution of organic matter sources to food web pathways
Vermetid reef cuvettes represent an intertidal complex system of pools featured by rich faunal
abundance and diversity, as well as rich macroalgae and epilithic community. The spatial
complexity of the reef offers large surfaces for macroalgae and epilithon to grow, making those
sources of primary importance in the contribution of the diet to local diversity. Allochthonous
organic matter input originating from the open sea as phytoplankton (SPOM), enter the D.
petraeum cuvettes in an uneven manner and mainly through wave action. Autochthonous and
allochthonous organic matter sources are isotopically distinguishable for both carbon and nitrogen.
SPOM showed a lower proportion of the heavy carbon isotope than the autochthonous OM
sources, which is consistent with the prevalence of phytoplanktonic components, typically depleted
in comparison with benthic organic matter (France, 1995). The SPOM isotopic signature matches
literature data (e.g. Harmelin-Vivien et al., 2008; Lefebvre et al., 2009). Macroalgae had a much
depleted δ13C signal than phytoplankton, while δ15N remained quite similar. All investigated
macroalgae species had non-significantly different signatures and were considered as a unique
pool of organic matter. As a result, if some specialization between macroalgae grazers occurs, SIA
did not allow discrimination within the community. Epilithon showed an isotopic signature highly
enriched in 13C and depleted in 15N compared to other potential food sources. Such a signature is
due to the prevalence of filamentous cyanobacteria (see Vizzini et al., 2012 and references
therein). Cyanobacteria, while rarely investigated in isotopic studies – mostly for technical reasons
– commonly co-occur with pelagic or benthic microalgae and are suspected to play a significant
role as a food resource in sandy sediments (Evrard et al., 2010). However, despite the ubiquitous
distribution, their trophic role is still poorly described in rocky shores and their contributions, when
evidenced, remain sporadic in time or minor in terms of contribution (Golléty et al., 2010; Schaal et
al., 2010). However, this investigation clearly evidenced the role of cyanobacteria in the food web
cuvettes of D. petraeum reefs.
The carbon isotopic signatures of the cuvette species spanned approximately over the same δ13C
range as the food sources (ca. 7‰). This indicates that the whole trophic niche of the cuvette
space (as defined by the diversity of the food sources) was exploited, hence minimizing inter-
ACC
EPTE
D M
ANU
SCR
IPT
ACCEPTED MANUSCRIPT
11
specific competition for food. Because food sources are isotopically easily discriminated, the
results of the mixing models offered here trustworthy estimates of species diets and allowed us to
better understand the general food web structure within the cuvette habitat. Multivariate analysis
revealed the presence of 3 main pathways of organic matter sources, embracing groups of species
sharing the same basal sources.
The first trophic pathway had phytoplankton as main basal source, and includes species (identified
as group A) with a mean estimated contribution of SPOM of 55% (mean min = 31% ; mean max =
75%). Species identified from the literature as suspension-feeders are represented here with the
bivalves C. calyculata and Mytilaster minimus, as well as the sea-sponges (Chondrillidae). The
reef-builder D. petraeum also mainly relied on phytoplankton, as previously showed (Vizzini et al.,
2012). Even if all the filter-feeders clustered together, they showed differences in the sources
contribution, meaning that their trophic niche did not completely overlap, as reported for filter
feeders in other studies (Dubois et al., 2007a, 2007b; Schaal et al., 2010). This pathway also
includes polychaete species of the families Eunicidae and Nereididae: even if they are often
reported as carnivores/omnivores, L. ninetta showed trophic level lower than the other predators,
whereas P. cultrifera exhibited here a predatory behaviour by targeting species from this group A
(although the large δ15N range suggests that it feeds on various trophic level). It is likely that
Nereididae prey upon the most abundant species, namely D. petraeum, as predatory polychaetes
belonging to this family are often reported in biogenic structures where they prey in tubes from the
reefs builder (Dubois et al., 2002). In exhaustive investigations of coastal benthic community,
Nereididae also exhibit high nitrogen values (Grall et al., 2006; Dubois et al., 2007a, Schaal et al.,
2010). The Blenniidae L. canevae has a similar trophic level to P. cultrifera, although in the
literature the dominance of algae in gut contents is reported (Velasco et al., 2010). This study
showed that they may also prey upon D. petraeum. Indeed, while they cannot reach the entire
mollusc within its tube, they actually ‘graze’ the head from D. petraeum filtering individuals. The
very close species Lipophrys pholis was also reported to prey on reef-builder Sabellaria alveolata
heads (Dubois et al., 2002).
ACC
EPTE
D M
ANU
SCR
IPT
ACCEPTED MANUSCRIPT
12
The second pathway was based on macroalgae, being composed of species (group B) that relied
mainly on macroalgae as basal sources (on average 48%; mean min = 16%; mean max = 80%). At
the bottom of this pathway, the gastropod P. rustica and two amphipod species (Gammarus sp.
and Hyale sp.), as well as the finfish P. sanguinolentus where all identified as grazers from the
literature (Hawkins et al., 1989; Ruffo, 1998, Velasco et al., 2010). However, the mollusc P. rustica
showed a higher δ13C signature than amphipods or P. sanguinolentus, suggesting either the
grazing on different macroalgae or a larger contribution of epilithon. At the top of this pathway, two
carnivorous Blenniidae species (A. sphynx and C. galerita) are targeting amphipods as the main
component of their diet.
The third food pathway included species (group C) mainly based on epilithon, which yielded an
average contribution of 42% (mean min = 30%; mean max = 62%). This group is composed of the
two gastropods, Patella caerulea and P. ulyssiponensis, known to scrape the reef surface with their
radula (Hawkins et al., 1989). The sipunculid P. granulatum belongs to this pathway, but exhibited
a much higher δ15N value than the Patellidae species. Little is known on sipunculids’ diet, but they
are mainly considered as deposit-feeders (Murina, 1984). This species is found in the crevices and
in empty D. petraeum tubes, where it scrapes off food from the substratum for epilithon and
macroalgae detritus: it is likely that it also behaves as a scavenger during its borrowing activity,
feeding on died organisms, hence explaining its high δ15N value. S. pavo is a Blenniidae species
living in crevices and this study shows that it is likely to prey on Patellidae species.
The clustering of species into three different trophic pathways is based on the result of similarities
in food sources contributions in species diets estimated with Bayesian statistics. While this
approach led here to three obvious – statistically distinct – clusters, one should also consider that
species are trophically plastic. This MDS approach produces here hard clustering, because a
clear-cut decision for each object (species) is made. Further applications of this approach need to
pay special attention to species at the edges of the clusters, hence considering they may belong to
several clusters. In this perspective, fuzzy clustering method allows for some ambiguity in the data,
which often occurs in practice, especially for trophic behaviour.
ACC
EPTE
D M
ANU
SCR
IPT
ACCEPTED MANUSCRIPT
13
4.2 Structure and functional diversity within cuvette food web
Isotopic data on the main species representing most of the diversity and the biomass of the benthic
assemblage associated to the cuvette of D. petraeum reefs revealed that both allochthonous and
autochthonous food sources contribute to the food web. Cuvettes are morphological depressions
created by vermetid biogenic reefs and are in many ways similar to tidal pools on rocky shores.
Intertidal tides pools are stressful environments for benthic organisms, with immersion and
emersion periods bringing allochthonous food (phytoplankton) (Little et al., 2009). This study
showed that within the cuvette food web, the whole trophic niche is exploited by species inhabiting
the cuvettes: indeed, we showed here that the number of species is evenly distributed between
allochthonous (45% of species) and autochthonous (55% of species) food sources. This could
contribute to regulate primary production within the cuvettes and to minimize intra- and inter-
specific food competition in a stressful environment subject to short-term changes. By closely
looking at the grazers trophic group, for example, it is worth noticing an even split between species
focusing mainly on macroalgae and species focusing on epilithic microalgae. Even within the
Patellidae, one of the most abundant and diverse group in rocky shores (Little et al., 2009), mixing
models revealed inter-specific differences in their diets. Calculation of the trophic levels also
revealed an equal distribution of predators between each food pathway. While fish species (i.e. L.
canevae) and polychaetes (i.e. P. cultrifera) feed on suspension-feeders, other fishes (i.e. A.
sphinx and C. galerita) prey on macroalgae grazers and S. pavo prey on epilithon grazers. These
results are supported by previous investigations of gut contents of Blenniidae from rocky pools,
revealing high degree of trophic specialization (Velasco et al., 2010). Interestingly, the Eunicidae
species did not exhibit a predatory behaviour, as suggested from the literature (Fauchald and
Jumars, 1979) and hence limits the trophic competition with other polychaete predators (e.g.
Nereididae species),as previously showed in soft sediment between Eunicidae and Glyceridae
species (Dubois et al., 2007a) . The diversity in predator trophic niches can reduce the top-down
effect in the community organization (e.g. Estes et al., 2001) and we hypothesized here that the
diversity in top-down pressures could contribute to the stability and the resilience of cuvettes food
web.
ACC
EPTE
D M
ANU
SCR
IPT
ACCEPTED MANUSCRIPT
14
Variations in δ15N ranges give an estimate of the length of the food chain, and provide a proxy of
the complexity in trophic interactions (Post, 2002b). Autochthonous and allochthonous food
pathways exhibited very similar food chain lengths and all the predators exhibited very similar δ15N
signatures. This pattern leads to a wide range in δ13C at the top of the food chain. This isotopic
space pattern is uncommon (the isotopic space is actually not pyramidal-shaped), because rocky
shore communities classically revealed that top predators all prey upon all species, coupling the
diverse pathways, hence showing a narrower δ13C range (Gollety et al., 2010). Conversely
predators investigated here revealed a high level of specialization in each of the three food chains,
showing that even at small spatial scale (meter-scale), high specialisation of predators leads to the
exploitation of the whole trophic niche, which allows minimizing competition.
Acknowledgments
We are grateful to R. Chemello for sharing his knowledge and for his precious suggestions, A.
Savona for field assistance, A.E. Aleo for help with laboratory analyses. The authors are grateful to
Dr. C.G. Gelpi (Louisiana State University) who corrected and edited the English grammar. This
study was funded by the Università di Palermo and Ministero dell’Istruzione, dell’Università e della
Ricerca.
References
Avila, S.P., 2003. The littoral molluscs (Gastropoda, Bivalvia and Polyplacophora) of Sao Vicente,
Capelas (Sao Miguel Island, Azores): ecology and biological associations to algae. Iberus 21,
1-23.
Badalamenti, F., Chemello, R., D’Anna, G., Riggio, S., 1998. Diversity of the Polychaete
assemblage in the hard bottom mediolittoral along the north-western sicilian coast: the role
played by the vermetid biocostruction. 1° Convegno Nazionale delle Scienze del Mare
“Diversità e Cambiamento” Abstract 14.
ACC
EPTE
D M
ANU
SCR
IPT
ACCEPTED MANUSCRIPT
15
Badalamenti, F., Chemello, R., Gristina, M., Riggio, S., Toccaceli M., 1992. Caratterizzazione delle
piattaforme a molluschi vermetidi nella costa tra Capo Gallo ed Isola delle Femmine (PA): area
proposta come riserva naturale marina. Oebalia 17, 547-549.
Barash, A., Zenziper Z., 1985. Structural and biological adaptation of Vermetidae (Gastropoda).
Bollettino Malacologico Milano 21, 145-176.
Bell, J.J., 2008. The functional roles of marine sponges. Estuarine, Coastal and Shelf Science 79,
341-353.
Bode, A., Alvarez-Ossorio, M.T., Vrela, M., 2006. Phytoplankton and macrophyte contributions to
littoral food webs in the galician upwelling estimated from stable isotopes. Marine Ecology
Progress Series 318, 89-102.
Buchsbaum, R., Valiela, I., Swain, T., Dzierzeski, M., Allen, S., 1991. Available and refractory
nitrogen in detritus of coastal vascular plants and macroalgae. Marine Ecology Progress
Series 72, 131-143.
Callaway, R., Desroy, N., Dubois, S.F., Fournier, J., Frost, M., Godet, L., Hendrick, V.J., Rabaut,
M., 2010. Ephemeral bio-engineers or reef-building polychaetes: how stable are aggregations
of the tube worm Lanice conchilega (Pallas, 1766)? Integrative and Comparative Biology 50,
237-250.
Calvo, M., Templado, J., Penchaszadeh, P.E., 1998. Reproductive biology of the Gregarious
Mediterranean vermetid gastropod Dendropoma petraeum. Journal of the Marine Biological
Association of the United Kingdom 78, 525-549.
Carabel, S., Godínez-Domínguez, E., Verísimo, P., Fernández, L., Freire, J., 2006. An assessment
of sample processing methods for stable isotope analyses of marine food webs. Journal of
Experimental Marine Biology and Ecology 336, 254-261.
ACC
EPTE
D M
ANU
SCR
IPT
ACCEPTED MANUSCRIPT
16
Caut, S., Angulo, E., Courchamp, F., 2009. Variation in discrimination factors (Δ15N and Δ13C): the
effect of diet isotopic values and applications for diet reconstruction. Journal of Applied
Ecology 46, 443-453.
Chemello, R., Ciuna, I., Pandolfo, A., Riggio, S., 1998. Molluscan assemblages associated with
intertidal vermetid formations: a morpho-functional approach. Bollettino Malacologico Roma 33,
105-114.
Chemello, R., Silenzi S., 2011. Vermetid reefs in the Mediterranean Sea as archives of sea-level
and surface temperature changes. Chemistry and Ecology 27, 121-127.
Clarke, K.R., Gorley, R.N., 2006. Primer Ver. 6 User Manual/Tutorial. Primer-E, Plymouth.
De Niro, M.J., Epstein, S., 1978. Influence of diet on the distribution of carbon isotopes in animals.
Geochimica et Cosmochimica Acta 42, 495-506.
Dubois, S., Marin-léal, J.C., Ropert, M., Lefebvre, S., 2007a. Effects of oyster farming on
macrofaunal assemblages associated with Lanice conchilega tubeworm populations: A trophic
analysis using natural stable isotopes. Aquaculture 271, 336-349.
Dubois, S., Orvain, F., Marin-léal, J. C., Ropert, M., and Lefebvre, S., 2007b. Small-scale spatial
variability of food partitioning between cultivated oysters and associated suspension-feeding
species, as revealed by stable isotopes. Marine Ecology Progress Series 336, 151-160.
Dubois, S., Retiere, C., Olivier, F., 2002. Biodiversity associated with Sabellaria alveolata
(Polychaeta: Sabellariidae) reefs: effects of human disturbances. Journal of the Marine
Biological Association of the United Kingdom 82, 817-826.
Duggins, D.O., Eckman, J.E., 1997. Is kelp detritus a good food for suspension feeders? Effects of
kelp species, age and secondary metabolites. Marine Biology 128, 489–49.
ACC
EPTE
D M
ANU
SCR
IPT
ACCEPTED MANUSCRIPT
17
Estes, J., Crooks, K., Holt, R., 2001. Ecological role of predators, Encyclopedia of Biodiversity (Vol
4). Academic Press, pp. 857-878.
Evrard, V., Soetaert, K., Heip, C.H.R., Huettel, M., Xenopoulos, M.A., Middelburg, J.J., 2010.
Carbon and nitrogen flows through the benthic food web of a photic subtidal sandy sediment.
Marine Ecology Progress Series 416, 1-16.
Fauchald K., Jumars P.A., 1979. The diet of worms: a study of polychaete feeding guilds.
Oceanography and Marine Biology: An Annual Review 17, 193-284.
France, R.L., 1995. Carbon-13 enrichment in benthic compared to planktonic algae: food web
implications. Marine Ecology Progress Series 124, 307-312.
Goldschmid, A., Kotrschal, A.K., Wirtz, P., 1984. Food and gut length of 14 adriatic blenniid fish
(Blenniidae; Percomorpha; Teleostei). Zoologischer Anzeiger, Jena 213,145-150.
Golléty, C., Riera, P., Davoult, D., 2010. Complexity of the food web structure of the Ascophyllum
nodosum zone evidenced by a δ13C and δ15N study. Journal of Sea Research 64, 304-312.
Goren, M., Galil, B.S., 2001. Fish biodiversity in the vermetid reef of Shiqmona (Israel). Marine
Ecology 22, 369-378.
Grall, J., Le Loc'h, F., Guyonnet, B., Riera, P., 2006. Community structure and food web based on
stable isotopes (δ15N and δ13C) analysis of a North Eastern Atlantic maerl bed. Journal of
Experimental Marine Biology and Ecology 338, 1–15.
Harmelin-Vivien, M., Loizeau, V., Mellon, C., Beker, B., Arlhac, D., Bodiguel, X., Ferraton, F.,
Hermand, R,. Philippon, X., Salen-Picard, C., 2008. Comparison of C and N stable isotope
ratios between surface particulate organic matter and microphytoplankton in the Gulf of Lions
(NW Mediterranean). Continental Shelf Research 28, 1911-1919.
ACC
EPTE
D M
ANU
SCR
IPT
ACCEPTED MANUSCRIPT
18
Hawkins, S.J., Watson, D.C., Hill, A.S., Harding, S.P., Kyriakides, M.A., Hutchinson, S., Norton,
T.A., 1989. A comparison of feeding mechanisms in microphagous, herbivorous, intertidal,
prosobranchs in relation to resource partitioning. Journal of Molluscan Studies 55, 151-165.
Jenkins, S.R., Hartnoll, R.G., 2001. Food supply, grazing activity and growth rate in the limpet
Patella vulgata L.: a comparison between exposed and sheltered shores. Journal of
Experimental Marine Biology and Ecology 258, 123-139.
Lefebvre, S., Leal, J.C.M., Dubois, S., Orvain, F., Blin, J.L., Bataille, M.P., Ourry, A., Galois, R.,
2009. Seasonal dynamics of trophic relationships among co-occurring suspension-feeders in
two shellfish culture dominated ecosystems. Estuarine Coastal and Shelf Science 82, 415-
425.
Little, C., Williams, G.A., Trowbridge, C.D., 2009. The biology of rocky shores. 2nd ed. Oxford
University Press, New York.
Mannino, A.M., 1992. Studio fitosociologico della vegetazione mesolitorale a Lithophyllum
lichenoides PHILIPPI (Rhodophyceae, Corallinales). Naturalista siciliano, Palermo IV, 16, 3-25
Martinez Del Rio, C., Wolf, N., Carleton, S.A., Gannes, L.Z., 2009. Isotopic ecology ten years after
a call for more laboratory experiments. Biological Reviews 84, 91-111.
McCutchan, J.H. Jr, Lewis, W.M. Jr, Kendall, C., McGrath, C.C., 2003. Variation in trophic shift for
stable isotope ratios of carbon, nitrogen, and sulphur. Oikos 102, 378-390.
Minagawa, M., Wada, E., 1984. Stepwise enrichment of 15N along food chains: further evidence
and the relation between 15N and animal age. Geochimica Cosmochimica Acta 48, 1135-1140.
Molinier, R., Picard, J., 1953. Notes biologiques a propos d’un voyage d’étude sur les cotes de
Sicile. Annales de l'Institut Océanographique de Monaco 28, 163-188.
Murina, G.V., 1984. Ecology of Sipuncula. Marine Ecology Progress Series 17, 1-7.
ACC
EPTE
D M
ANU
SCR
IPT
ACCEPTED MANUSCRIPT
19
Owens, N., 1987. Natural variations in 15N in the marine environment. Advances in Marine Biology
24, 389-451.
Parnell, A.C., Inger, R., Bearhop, S., Jackson, A.L., 2010. Source partitioning using stable
isotopes: coping with too much variation. PLoS ONE 5, e9672.
Post, D.M., 2002a. Using stable isotopes to estimate trophic position: models, methods, and
assumptions. Ecology 83, 703-718.
Post, D.M., 2002b. The long and short of food-chain length. Trends in Ecology and Evolution 17,
269-277.
Ruffo, S., 1998. The Amphipoda of the Mediterranean, Part 4. Mémoires de l’Institut
Océanographique de Monaco 13, 815-959.
Safriel, U.N., 1975. The role of vermetid Gastropods in the formation of Mediterranean and Atlantic
reefs. Oecologia 20, 85-101.
Safriel, U.N., Ben-Eliahu, M.N., 1991. The influence of habitat structure and environmental stability
on the species diversity of polychaetes in vermetid reefs. In: Bell, S.S., McCoy, E.D.,
Mushinsky, H.R. (Eds), Habitat Structure - The Physical Arrangement of Objects in Space,
Chapman and Hall, London, pp. 349-372.
Schaal, G., Riera, P., Leroux, C. Grall, J., 2010. A seasonal stable isotope survey of the food web
associated to a peri-urban rocky shore. Marine Biology 157, 283-294.
Vander Zanden, M.J., Rasmussen, J.B., 2001. Variation in delta N-15 and delta C-13 trophic
fractionation: Implications for aquatic food web studies. Limnology and Oceanography 46,
2061-2066.
ACC
EPTE
D M
ANU
SCR
IPT
ACCEPTED MANUSCRIPT
20
Velasco, E.M., Gómez-Cama, M.C., Hernando, J.A. Soriguer, M.C. 2010. Trophic relationships in
an intertidal rockpool fish assemblage in the gulf of Cádiz (NE Atlantic). Journal of Marine
Systems 80, 248-252.
Vizzini, S., Colombo F., Costa, V., Mazzola, A., 2012. Contribution of planktonic and benthic food
sources to the diet of the reef-forming vermetid gastropod Dendropoma petraeum in the
western Mediterranean. Estuarine, Coastal and Shelf Science 96, 262-267.
Vizzini, S., Mazzola, A., 2006. Sources and transfer of organic matter in food webs of a
Mediterranean coastal environment: evidence for spatial variability. Estuarine, Coastal and
Shelf Science 66, 459-467.
ACC
EPTE
D M
ANU
SCR
IPT
ACCEPTED MANUSCRIPT
21
Table 1. Estimates of Trophic Enrichment Factors using food source signatures, after models for
invertebrates developed by Caut et al. (2009) for Δδ13C = -0.113 x δ13CSource - 1.916 and Δδ15N = -
0.311 x δ15NSource + 4.065.
Source Mean δ13C TEF sd Mean δ15N TEF sd
EPI -0.6 0.0 4.0 0.1
MA -0.2 0.2 2.2 0.4
SPOM 0.5 0.1 2.0 0.3
ACC
EPTE
D M
ANU
SCR
IPT
ACCEPTED MANUSCRIPT
22
Table 2. δ13C and δ15N mean values (‰), trophic level (TL) and percentage contribution of organic matter (OM) sources to the diet (mixing model output) of consumers. The feeding mode of consumers based on literature data is provided. N: number of samples; sd: standard deviation; low: lower 95th percentile proportion; high: higher 95th percentile proportion.
Feeding mode Code N
mean sd mean sd mean sd low high mean low high mean low high mean
Epilithon 9 -11.9 0.3 0.3 0.2
Ceramium sp. 9 -15.8 1.3 5.5 0.4
Cystoseira spp. 9 -15.5 1.1 5.8 0.3
Laurencia sp. 9 -14.3 1.2 6.7 1.8
SPOM 6 -21.8 0.6 6.5 0.9
Porifera
Chondrillidae Filter feeder a 1 3 -18.4 0.3 6.0 0.4 2.0 0.1 2.1 59.1 29.8 0.0 45.9 19.5 17.5 73.1 50.7
Mollusca
Cardita calyculata Filter feeder b 2 5 -18.7 0.5 6.2 0.6 2.1 0.2 1.3 46.0 24.3 0.0 37.4 13.9 40.8 76.0 61.8
Dendropoma petraeum Filter feeder c 3 9 -18.1 0.2 7.9 0.7 2.5 0.2 7.6 29.6 18.7 8.8 42.7 25.7 47.5 63.2 55.6
Mytilaster minimus Filter feeder d 4 3 -18.4 0.4 7.9 0.4 2.6 0.1 0.2 29.1 14.8 2.2 52.9 29.4 38.0 72.9 55.8
Patella caerulea Grazer e 5 5 -13.7 0.8 6.7 0.6 2.2 0.2 30.4 61.3 45.0 30.9 66.6 49.1 0.0 17.5 5.8
Patella rustica Grazer e 6 3 -14.5 1.2 7.6 0.1 2.5 0.0 5.3 51.7 29.3 13.3 81.2 46.6 0.0 51.5 24.1
Patella ulyssiponensis Grazer e 7 3 -14.3 0.1 6.1 1.0 2.0 0.2 36.7 76.3 55.5 3.4 55.5 32.9 0.0 22.5 11.6
Crustacea, Amphipoda
Gammarus sp. Grazer f 8 4 -16.3 1.0 8.3 0.8 2.7 0.2 0.0 38.7 17.3 19.0 86.6 53.1 7.8 51.2 29.6
Hyale sp. Grazer f 9 4 -17.0 0.7 8.0 0.7 2.6 0.2 0.8 34.1 18.0 16.6 70.6 43.9 22.1 53.5 38.1
Anellida, Polychaeta
Lysidice ninetta Carnivorous/omnivorous g 10 4 -16.9 1.4 9.6 0.9 3.1 0.3 10.2 58.8 36.8 0.0 48.0 20.9 13.8 66.4 42.3
Perinereis cultrifera Carnivorous/omnivorous g 11 3 -18.6 0.5 11.4 2.1 3.6 0.6 0.0 28.1 11.8 0.0 44.3 19.7 38.6 88.9 68.6
Sabella sp. Filter feeder g 12 3 -19.2 0.8 7.0 0.0 2.3 0.0 4.3 46.3 27.0 0.0 47.6 22.1 21.4 79.5 50.9
Sipuncula
Phascolosoma granulatum Omnivorous h 13 6 -14.7 0.1 10.3 0.4 3.3 0.1 29.7 52.7 40.8 14.4 49.3 32.3 18.3 35.0 26.9
Fish
Aidablennius sphynx Carnivorous/omnivorous i 14 5 -16.5 0.9 11.9 0.6 3.7 0.2 0.0 21.4 8.8 26.2 70.1 48.6 27.4 57.8 42.5
Coryphoblennius galerita Carnivorous/omnivorous l 15 3 -15.2 0.6 11.6 0.3 3.6 0.1 0.6 42.8 21.6 14.8 81.3 47.3 8.6 51.7 31.1
Lipophrys canevae Omnivorous i, l 16 3 -17.1 0.6 11.6 0.7 3.6 0.2 0.0 29.4 13.1 6.2 61.5 36.5 32.1 68.5 50.5
Parablennius sanguinolentus Grazer l 17 3 -16.2 0.5 8.5 0.5 2.7 0.1 0.0 46.8 23.5 10.2 82.6 46.1 7.0 50.0 30.5
Salaria pavo Carnivorous/omnivorous i, l 18 3 -14.6 0.6 10.2 0.6 3.2 0.2 20.9 56.4 38.9 7.1 63.8 36.4 6.0 42.9 24.7
OM sources and consumers
Autochthonous OM sources
Allochthonous OM sources
Consumers
a Bell, 2008; b Avila, 2003; c Barash and Zenziper, 1985; d Safriel and Sasson-Frostig, 1988; e Haw kins et al., 1989; f Ruffo, 1998; g Fauchald and Jumars, 1979; h Murina, 1984; i Goldschmid et al., 1984; l Velasco et al., 2010.
δ13C δ15N TL % EPI % MA % SPOM
ACC
EPTE
D M
ANU
SCR
IPT
ACCEPTED MANUSCRIPT
23
Figure captions
Fig. 1. δ13C and δ15N mean values (‰) and standard deviations for organic matter sources (),
invertebrates ( ) and fish ( ) in the study area. EPI: epilithon; MA: macroalgae; SPOM: suspended
particulate organic matter; consumers are coded in Table 1. Shadowed grey vertical bars represent
the δ15N encompassed by primary consumers (PC) and secondary consumers (SC) according to
calculated TL.
Fig. 2. Dendrogram of hierarchical cluster analysis (a) and non metric multidimensional scaling
(nMDS) ordination (b) of similarity matrix (Euclidian distances) on percentage contributions of
organic matter sources to the consumers diets (lower 95th percentile, higher 95th percentile and
mean value). Significant clusters (A, B and C) corresponding to trophic pathways were tested using
the Simprof procedure. Ff: filter feeders; Gr: grazers; C/O: carnivores/omnivores. Consumers are
coded in Table 1.
ACC
EPTE
D M
ANU
SCR
IPT
ACCEPTED MANUSCRIPT
24
-24 -22 -20 -18 -16 -14 -12 -10
0
2
4
6
8
10
12
14
1
5N
13
C
SPOM
EPI
MA PC
SC
12
24
3
1
8
9
17
7
6
5
10
1116
1415
13 18
Figure 1
ACC
EPTE
D M
ANU
SCR
IPT
ACCEPTED MANUSCRIPT
25
B
1
2
3 4
5
6
7
89
10
11
12
13
14
15
16
17
18
2D Stress: 0,05b)
A
C
Feeding mode
Ff
C/O
a)
0
20
40
60
80Resemblance: D1 Euclidean distance
12 1 10 2 11 3 4 16 9 14 8 15 17 6
Dis
tan
ce
13 18 5 7
A CB
Gr
Figure 2
ACC
EPTE
D M
ANU
SCR
IPT
ACCEPTED MANUSCRIPT
26
Highlights
We investigate the organic matter sources use by vermetid reef cuvette community.
Stable isotopes ratio (δ13
C, δ15
N) was used to describe the trophic web.
Both benthic and pelagic OM sources contribute in different extents.
Three different trophic pathways were identified within the cuvette.
Predators revealed a high specialization in each of the three food chains.
Copyright © 2022 FDOKUMEN