Validated Scales Repository - DOT&E
29
i Validated Scales Repository The DOT&E Validated Scales Repository outlined below includes validated measures of system usability and trust, task workload, and training effectiveness. For each scale, the repository includes information about the validation process, appropriate usage, individual survey items, scoring procedures, and references to additional materials when applicable. Materials from this repository should be used in conjunction with the updated HSI guidance, as the repository does not provide detailed information about survey administration plans or higher-level issues in human factors assessments.
-
Upload
khangminh22 -
Category
Documents
-
view
0 -
download
0
Transcript of Validated Scales Repository - DOT&E
i
Validated Scales Repository
The DOT&E Validated Scales Repository outlined below includes validated measures of system usability and trust, task workload, and training effectiveness. For each scale, the repository includes information about the validation process, appropriate usage, individual survey items, scoring procedures, and references to additional materials when applicable. Materials from this repository should be used in conjunction with the updated HSI guidance, as the repository does not provide detailed information about survey administration plans or higher-level issues in human factors assessments.
i Attachment
Validated Scales Repository
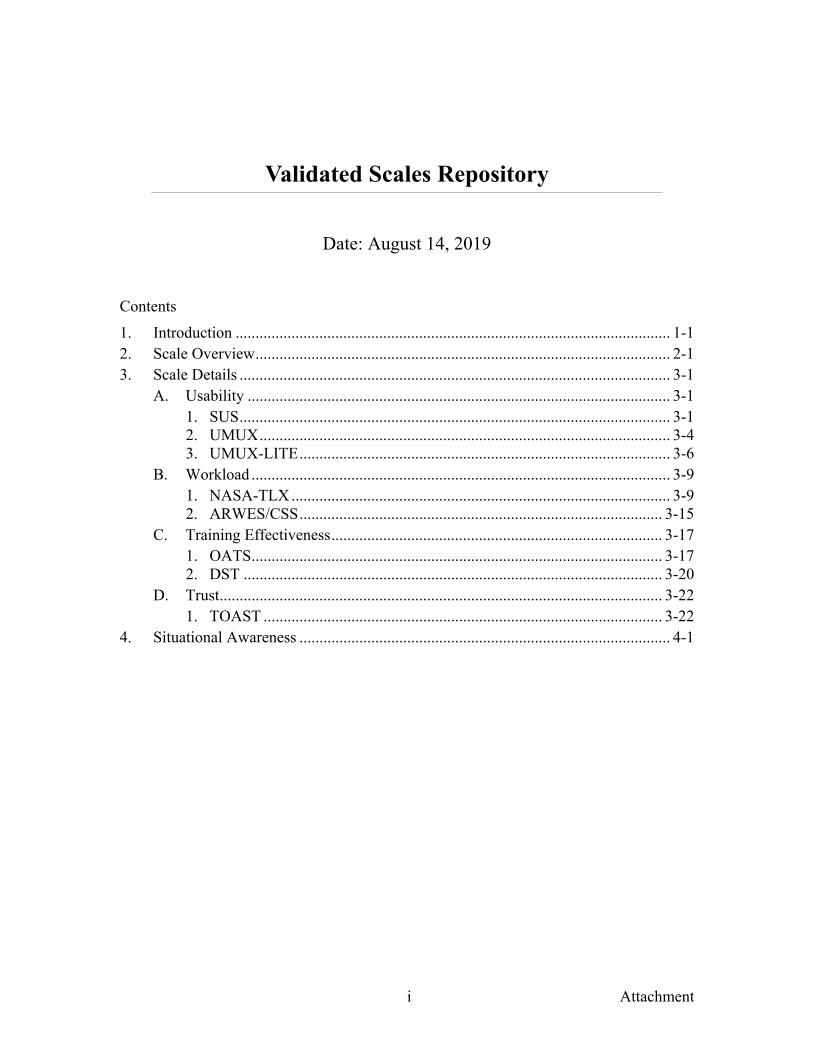
Date: August 14, 2019
Contents 1. Introduction ............................................................................................................. 1-1 2. Scale Overview ........................................................................................................ 2-1 3. Scale Details ............................................................................................................ 3-1
A. Usability .......................................................................................................... 3-1 1. SUS ............................................................................................................ 3-1 2. UMUX ....................................................................................................... 3-4 3. UMUX-LITE ............................................................................................. 3-6
B. Workload ......................................................................................................... 3-9 1. NASA-TLX ............................................................................................... 3-9 2. ARWES/CSS ........................................................................................... 3-15
C. Training Effectiveness ................................................................................... 3-17 1. OATS ....................................................................................................... 3-17 2. DST ......................................................................................................... 3-20
D. Trust ............................................................................................................... 3-22 1. TOAST .................................................................................................... 3-22
4. Situational Awareness ............................................................................................. 4-1

1-1
1. Introduction
When evaluating the quality of human-system interaction, testers commonly need to measure usability, workload, training, and trust. As is the case for all measurement, testers should measure these concepts as precisely as possible, using validated scales to minimize measurement error. In the sections that follow, we identify validated scales designed to measure each of the concepts identified above and we provide helpful information about each scale’s use, including:
• Name(s), including acronyms
• What it measures
• Reference(s)
• Information for creating your own survey forms, including questions, anchors, and administration directions
• Instructions on scoring; when multiple, valid ways of scoring exist, they are all listed
• Pseudocode (not specific to any computer language) to show how to score scales in programs like Excel, SPSS, STATA, R, and Python.
If you have any questions, please contact the Test Science team ([email protected]) for advice.
2-1
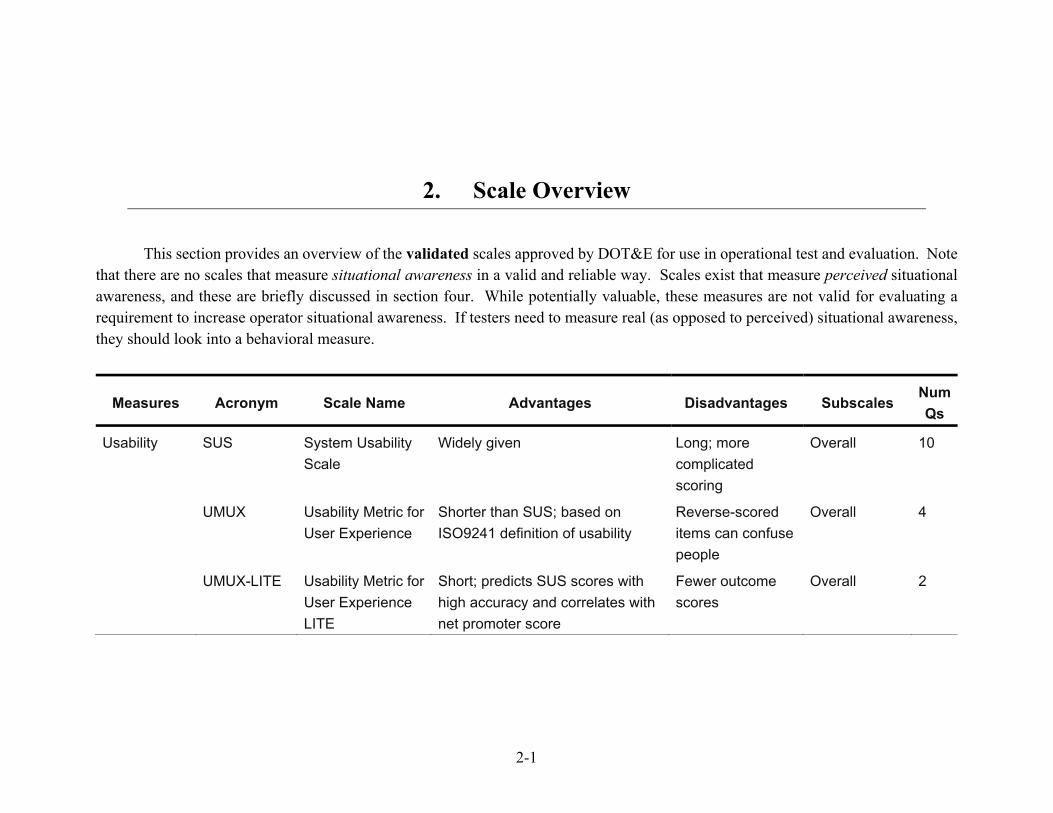
2. Scale Overview
This section provides an overview of the validated scales approved by DOT&E for use in operational test and evaluation. Note that there are no scales that measure situational awareness in a valid and reliable way. Scales exist that measure perceived situational awareness, and these are briefly discussed in section four. While potentially valuable, these measures are not valid for evaluating a requirement to increase operator situational awareness. If testers need to measure real (as opposed to perceived) situational awareness, they should look into a behavioral measure.
Measures Acronym Scale Name Advantages Disadvantages Subscales Num Qs
Usability SUS System Usability Scale
Widely given Long; more complicated scoring
Overall 10
UMUX Usability Metric for User Experience
Shorter than SUS; based on ISO9241 definition of usability
Reverse-scored items can confuse people
Overall 4
UMUX-LITE Usability Metric for User Experience LITE
Short; predicts SUS scores with high accuracy and correlates with net promoter score
Fewer outcome scores
Overall 2

2-2
Measures Acronym Scale Name Advantages Disadvantages Subscales Num Qs
Workload NASA-TLX NASA Task Load Index
Free app; task agnostic Long; original scoring is complicated
Overall 6
Weights* 15
ARWES/CSS AFFTC Revised Workload Estimate Scale
Short (1 question) Small pool of data for comparison
Overall 1
Training Effectiveness
OATS Operational Assessment of Training Scale
Construct subscales Currently undergoing validation
Relevance 9
Efficacy 6
DST Diagnostic Survey of Training
Helpful for improving training Not validated; only used as a supplement
Course 8
Instructor 1
Trust TOAST Trust of Automated Systems Test
Subscales Completed initial validation; additional checks ongoing
Understanding 4
Performance 5 ∗ = Weights only need to be filled out once for each task type.

3-1
3. Scale Details
Information on each scale is given below. This includes the title, citation information, individual items, scoring criteria, and other details.
A. Usability
1. SUS
a. Information for Administrators The SUS is the tried-and-true workhorse of the usability industry. It is longer but gets the job done with higher precision.
• Full title: System Usability Scale
• In-text citation: Brooke (1986)
• Full citation: Brooke, J. (1986). “SUS: A ‘Quick and Dirty’ Usability Scale.” In P. W. Jordan, B. Thomas, B. A. Weerdmeester, & I. L. McClelland (Eds.), Usability Evaluation in Industry (pp. 189–194). London, England: Taylor and Francis.
• Reading scores: Higher scores indicate more usability. The overall average is ~ 68.
– Note that scores are not percentages and should not be interpreted as such. When communicating with people unfamiliar with the SUS it can be useful to convert scores to percentiles.
b. Information for Survey Forms • Title: SUS Scale
• Scale anchors: 1 (Strongly Disagree), 5 (Strongly Agree)
• Directions: Read each statement carefully and indicate the extent to which you agree or disagree using the scale provided.

3-2
c. Individual Items
Number Item
1 I think that I would like to use this system frequently.
2 I found the system unnecessarily complex.
3 I thought the system was easy to use.
4 I think that I would need the support of a technical person to be able to use this system.
5 I found the various functions in this system were well integrated.
6 I thought there was too much inconsistency in this system.
7 I would imagine that most people would learn to use this system very quickly.
8 I found the system very cumbersome to use.
9 I felt very confident using the system.
10 I needed to learn a lot of things before I could get going with this system.
d. Scoring Even-numbered items are reverse-scored and one unit is subtracted from each item to put it on a 0 – 4 scale. This item score is then summed and multiplied by 2.5 to convert it to an overall score on a 0 – 100 scale.
In other words, odd-numbered items are scored as Response − 1 and even-numbered items are scored as 5 − Response.
Formulaically, scored items i can be expressed as:
= × 2.5= (( 1 − 1) + (5 − 2) + ( 3 − 1)+. . . +(5 − 10)) × 2.5 = (20 + ( 1 + 3+. . . + 9) − ( 2 + 4+. . . + 10)) × 2.5
More specifically, “Response” denotes a person’s raw response or unadjusted answer to an item. These values are shown in the formula as SUS[X], where X is an item number. In the formula, “Score” refers to an item score or a scored item. An item is considered to be scored once transformations have been done to interpret each item in the same way (i.e., higher values on each item mean higher usability). “FinalScore” in the formula is the single-item value for the full scale.
3-3
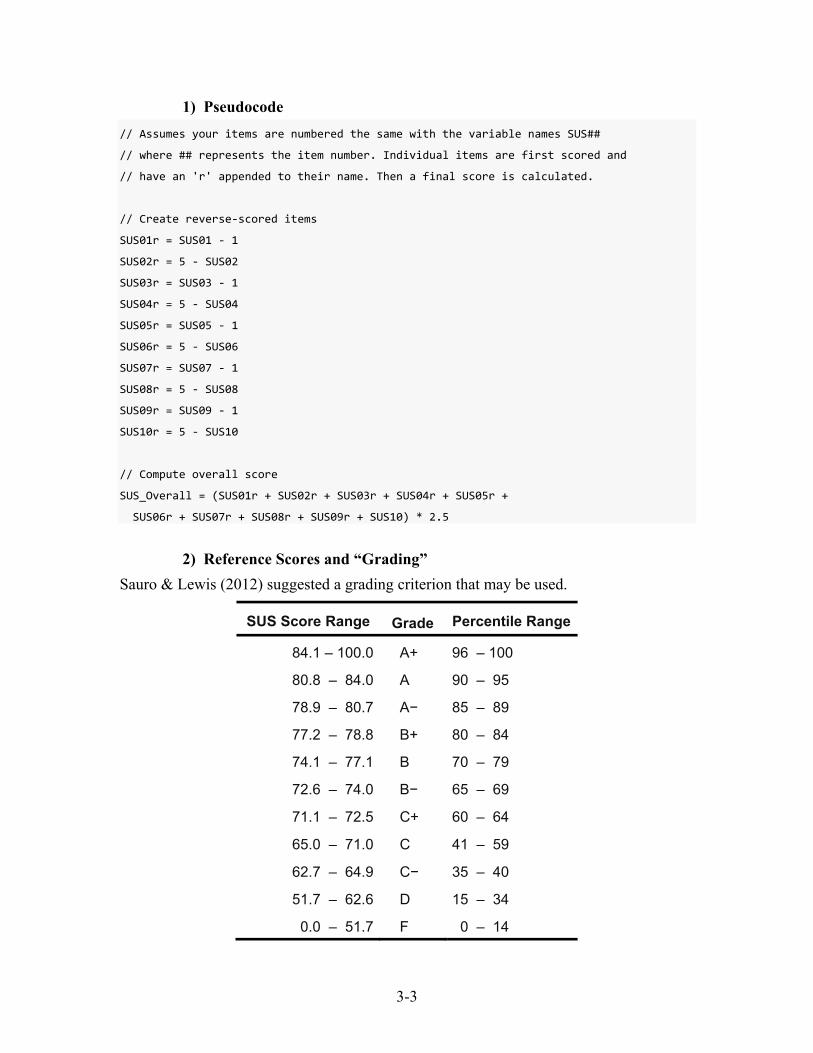
1) Pseudocode // Assumes your items are numbered the same with the variable names SUS##
// where ## represents the item number. Individual items are first scored and
// have an 'r' appended to their name. Then a final score is calculated.
// Create reverse-scored items
SUS01r = SUS01 - 1
SUS02r = 5 - SUS02
SUS03r = SUS03 - 1
SUS04r = 5 - SUS04
SUS05r = SUS05 - 1
SUS06r = 5 - SUS06
SUS07r = SUS07 - 1
SUS08r = 5 - SUS08
SUS09r = SUS09 - 1
SUS10r = 5 - SUS10
// Compute overall score
SUS_Overall = (SUS01r + SUS02r + SUS03r + SUS04r + SUS05r +
SUS06r + SUS07r + SUS08r + SUS09r + SUS10) * 2.5
2) Reference Scores and “Grading” Sauro & Lewis (2012) suggested a grading criterion that may be used.
SUS Score Range Grade Percentile Range
84.1 – 100.0 A+ 96 – 100
80.8 – 84.0 A 90 – 95
78.9 – 80.7 A− 85 – 89
77.2 – 78.8 B+ 80 – 84
74.1 – 77.1 B 70 – 79
72.6 – 74.0 B− 65 – 69
71.1 – 72.5 C+ 60 – 64
65.0 – 71.0 C 41 – 59
62.7 – 64.9 C− 35 – 40
51.7 – 62.6 D 15 – 34
0.0 – 51.7 F 0 – 14

3-4
Bangor, Kortum, & Miller (2008) developed a process for adding more intuitive
verbal labels to scores. This is their equivalent breakdown.
SUS Score Range Adjective
85.59 – 100.00 Best imaginable
72.76 – 85.58 Excellent
52.02 – 72.75 Good
39.18 – 52.01 OK
25.01 – 39.17 Poor
0.00 – 25.00 Worst imaginable
This figure from Bangor et al. (2008) compares the different scoring approaches.
2. UMUX
a. Information for Administrators The UMUX is useful when you want more granularity in measuring usability than is provided by the UMUX-LITE.
• Full title: Usability Metric for User Experience
• In-text citation: Finstad (2010)
• Full citation: Finstad, K. (2010). “The Usability Metric for User Experience.” Interacting with Computers, 22, 323–327. doi: 10.1016/j.intcom.2010.04.004
• Reading scores: Higher scores indicate more usability.
• Variations: There is also a 5-point UMUX-LITE in use.
3-5
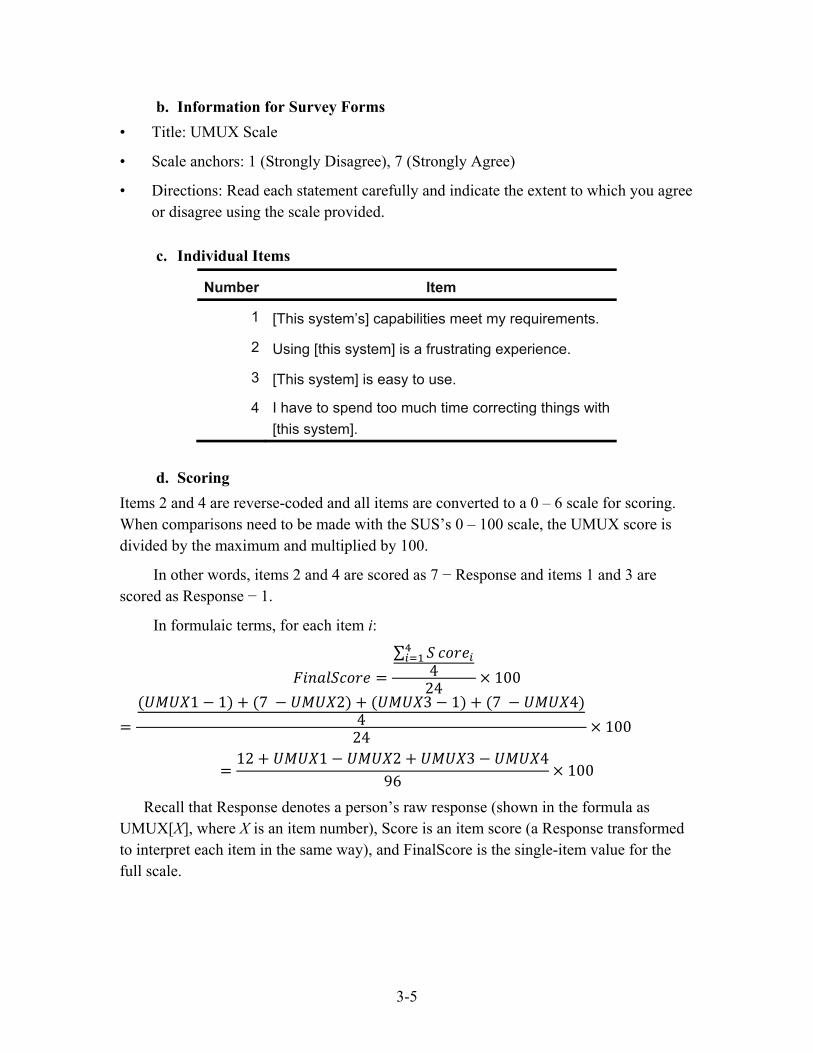
b. Information for Survey Forms • Title: UMUX Scale
• Scale anchors: 1 (Strongly Disagree), 7 (Strongly Agree)
• Directions: Read each statement carefully and indicate the extent to which you agree or disagree using the scale provided.
c. Individual Items
Number Item
1 [This system’s] capabilities meet my requirements.
2 Using [this system] is a frustrating experience.
3 [This system] is easy to use.
4 I have to spend too much time correcting things with [this system].
d. Scoring Items 2 and 4 are reverse-coded and all items are converted to a 0 – 6 scale for scoring. When comparisons need to be made with the SUS’s 0 – 100 scale, the UMUX score is divided by the maximum and multiplied by 100.
In other words, items 2 and 4 are scored as 7 − Response and items 1 and 3 are scored as Response − 1.
In formulaic terms, for each item i:
= ∑ 424 × 100= ( 1 − 1) + (7 − 2) + ( 3 − 1) + (7 − 4)424 × 100 = 12 + 1 − 2 + 3 − 496 × 100
Recall that Response denotes a person’s raw response (shown in the formula as UMUX[X], where X is an item number), Score is an item score (a Response transformed to interpret each item in the same way), and FinalScore is the single-item value for the full scale.

3-6
1) Pseudocode // Assumes your items are numbered the same with the variable names UMUX#
// where # represents the item number. Individual items are first scored and
// have an 'r' appended to their name. Then a final score is calculated.
// Create reverse-scored items
UMUX1r = UMUX1 - 1
UMUX2r = 7 - UMUX2
UMUX3r = UMUX3 - 1
UMUX4r = 7 - UMUX4
// Compute overall score
UMUX_Overall = (((UMUX1r + UMUX2r + UMUX3r + UMUX4r) / 4) / 24) * 100
3. UMUX-LITE
a. Information for Administrators The UMUX-LITE is a good, quick survey for measuring usability.
• Full title: Usability Metric for User Experience LITE
• In-text citation: Lewis, Utesch, & Maher (2015)
• Full citation: Lewis, J. R., Utesch, B. S., & Maher, D. E. (2013). “UMUX-LITE: When There’s No Time for the SUS.” In Proceedings of the SIGCHI Conference on Human Factors in Computing Systems (pp. 2099–2102). Chicago, IL: ACM. doi: 10.1145/2470654.2481287
• Reading scores: Higher scores indicate more usability.
b. Information for Survey Forms • Title: UMUX-LITE Scale
• Scale anchors: 1 (Strongly Disagree), 7 (Strongly Agree)
• Directions: Read each statement carefully and indicate the extent to which you agree or disagree using the scale provided.

3-7
c. Individual Items
Number Item
1 [This system’s] capabilities meet my requirements.
2 [This system] is easy to use.
d. Scoring (1) The UMUX-LITE can be reported as the average of the two items. = 1 + 22
(2) When comparisons need to be made to the SUS’s 0 – 100 scale, the UMUX-LITE score is calculated using the equation below, which the authors call the UMUX-Liter. = 0.65 × (( 1 + 2 − 2) × 10012 ) + 22.9
When using this format, note that the UMUX-LITE’s two questions do not cover the full range of the SUS. The range of the UMUX-LITE as compared to the SUS is [22.9, 87.9].
(3) The UMUX-LITE can be reported as percentile ranks on each item, where item 1 measures usefulness and item 2 measures usability, as shown here.
Note: Image obtained from MeasuringU.
3-8
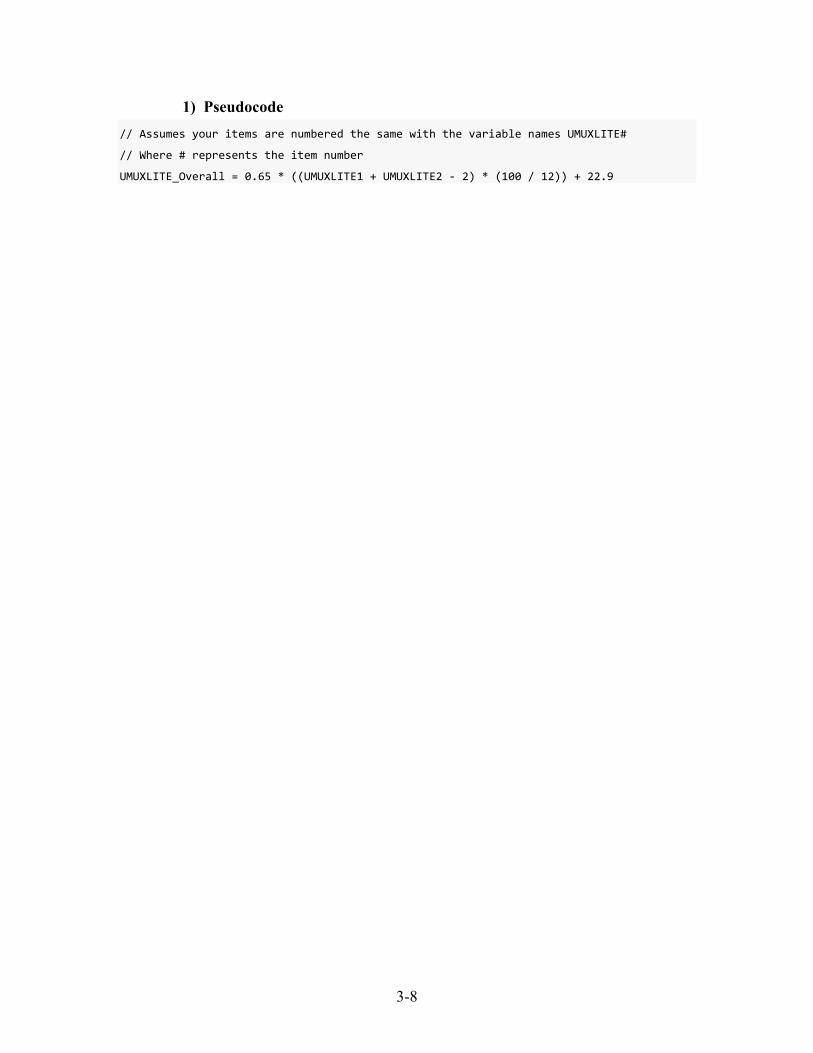
1) Pseudocode // Assumes your items are numbered the same with the variable names UMUXLITE#
// Where # represents the item number
UMUXLITE_Overall = 0.65 * ((UMUXLITE1 + UMUXLITE2 - 2) * (100 / 12)) + 22.9

3-9
B. Workload
1. NASA-TLX
a. Information for Administrators The NASA-TLX has been performing well for decades, but the original scoring method is complicated so we highly recommend using the raw TLX scoring method or the app on NASA’s website.
• Full title: NASA Task Load Index
• In-text citation:
– Original chapter: Hart & Staveland (1988)
– Raw TLX scoring: Hart (2006)
• Full citation
– Original chapter: Hart, S. G., & Staveland, L. E. (1988). “Development of NASA-TLX (Task Load Index): Results of Empirical and Theoretical Research.” In P. A. Hancock & N. Meshkati (Eds.), Human Mental Workload (pp. 139–183). Amsterdam, Netherlands: North Holland Press.
– Raw TLX scoring: Hart, S. G. (2006, October). “NASA-Task Load Index (NASA-TLX); 20 Years Later.” In Proceedings of the Human Factors and Ergonomics Society Annual Meeting (Vol. 50, No. 9, pp. 904–908). Los Angeles, CA: Sage Publications.
• Reading scores: Higher scores indicate higher workload.
• Variations:
– (Recommended) A raw TLX version without any weighting can be used to simplify administration and scoring.
– There is an app available through NASA.
– If task load precludes you from administering the scale during an operational test, it may be administered retrospectively (see administration manual for details).
• Raters should be given the rating scale definitions for the duration of the time they are filling out ratings or weights associated with the NASA-TLX.
• Administrative Note: The NASA-TLX is administered for each task type.1
1 via HealthIT.gov

3-10
1. DEFINE THE TASK(S).
2. (Optional) CONDUCT A HIERARCHICAL TASK ANALYSIS (HTA) FOR THE TASK(S) UNDER ANALYSIS.
3. SELECT PARTICIPANTS based on the goals of the analysis.
4. BRIEF PARTICIPANTS by explaining the purpose of the study and the basics of the NASA-TLX method. A workshop on mental workload and a brief run-through of the NASA-TLX may be useful.
5. PERFORM TASK UNDER ANALYSIS. The participants should perform the tasks and fill out the NASA-TLX form either during the trial or immediately post-trial.
6. FOLLOW WEIGHTING PROCEDURE. Present the 15 pairwise comparisons to the participants, asking them to select from each of the 15 pairs the subscale from each pair that contributed the most to the workload of the task.
7. COMPLETE NASA-TLX RATING. Ask participants to give a rating for each subscale from 1 (low) to 20 (high).
8. TLX SCORE CALCULATION. The TLX software can calculate the overall workload score between 0 and 100.
– Weights only need to be completed once for each task type.
• Example Scripts: These example scripts should be read before a rater fills out the weights and ratings. Slight wording changes may be made (e.g., change “experiment” to “test” or “evaluation,” or change “You will evaluate the task by putting an ‘X’ on each of the six scales…”) to accommodate the way information is being collected.
Two sets of instructions are included on NASA’s website:
– Information before filling out weights for the first time.
– Information before filling out ratings for the first time.
b. Information for Survey Forms This survey has three elements: a reference table with definitions but no items for response, a weights scale that is given once per task, and a rating scale that is given multiple times per task (once per condition).

3-11
Reference Table
• Title: NASA-TLX Reference Sheet Definitions
• Scale anchors: N/A for this reference sheet
• Directions: N/A for this reference sheet
• Note: You can give this sheet to raters for the duration of the task.
Factor Endpoints Description
MENTAL DEMAND
Low/High How much mental and perceptual activity was required (e.g., thinking, deciding, calculating, remembering, looking, searching, etc.)? Was the task easy or demanding, simple or complex, exacting or forgiving?
PHYSICAL DEMAND
Low/High How much physical activity was required (e.g., pushing, pulling, turning, controlling, activating, etc.)? Was the task easy or demanding, slow or brisk, slack or strenuous, restful or laborious?
TEMPORAL DEMAND
Low/High How much time pressure did you feel due to the rate or pace at which the tasks or task elements occurred? Was the pace slow and leisurely or rapid and frantic?
PERFORMANCE Good/Poor How successful do you think you were in accomplishing the goals of the task set by the experimenter (or yourself)? How satisfied were you with your performance in accomplishing these goals?
EFFORT Low/High How hard did you have to work (mentally and physically) to accomplish your level of performance?
FRUSTRATION LEVEL
Low/High How insecure, discouraged, irritated, stressed, and annoyed versus secure, gratified, content, relaxed, and complacent did you feel during the task?

3-12
c. Individual Items Sources of Load (Weights)
• Title: Sources of Workload
• Scale anchors: 0 (Left factor is more important), 1 (Right factor is more important)
• Directions: Read each statement carefully and indicate which item is more important in your evaluation of this task.
Number Left Factor Right Factor
1 Mental Demand Physical Demand
2 Mental Demand Temporal Demand
3 Mental Demand Performance
4 Mental Demand Effort
5 Mental Demand Frustration Level
6 Physical Demand Temporal Demand
7 Physical Demand Performance
8 Physical Demand Effort
9 Physical Demand Frustration Level
10 Temporal Demand Performance
11 Temporal Demand Effort
12 Temporal Demand Frustration Level
13 Performance Effort
14 Performance Frustration Level
15 Effort Frustration Level
Rating Scale
• Title: NASA Task Load Index
• Scale anchors: 0 (Low), 20 (High)
• Directions: Read each statement carefully and indicate your response to each question.

3-13
Number Factor Left Anchor Right Anchor
1 Mental Demand Low High
2 Physical Demand Low High
3 Temporal Demand Low High
4 Performance Good Poor
5 Effort Low High
6 Frustration Level Low High
d. Scoring There are two ways to score the NASA-TLX: the unweighted procedure (recommended) and the weighted procedure.
(1) Unweighted Procedure (also referred to as the raw TLX)
In the unweighted procedure, simply sum all ratings and put on a 0 – 100 scale.
= × 56 = ( 1 + 2+. . . + 6) × 56
(2) Weighted Procedure
The original NASA-TLX includes a process to get an overall workload score wherein each workload subtype is weighted depending on its importance to the task. For example, mental workload is not very relevant to lifting heavy objects, so you would want it to contribute less to your workload score. To calculate this score, respondents are given a pair of subtypes (e.g., Mental vs. Physical) and asked which of those two choices is more important for this task. They make these comparisons for every possible pair of subtypes. Weights are calculated based on the number of times a subtype is chosen as more important than another. So for each weight item, j, score it as follows:
ℎ =
This will result in six scores (i.e., one for each factor). You will then calculate a final score by multiplying each rating, i, by its relevant weight and dividing by 15 to keep it on a 0 – 100 scale. = ∑ × ℎ15
3-14
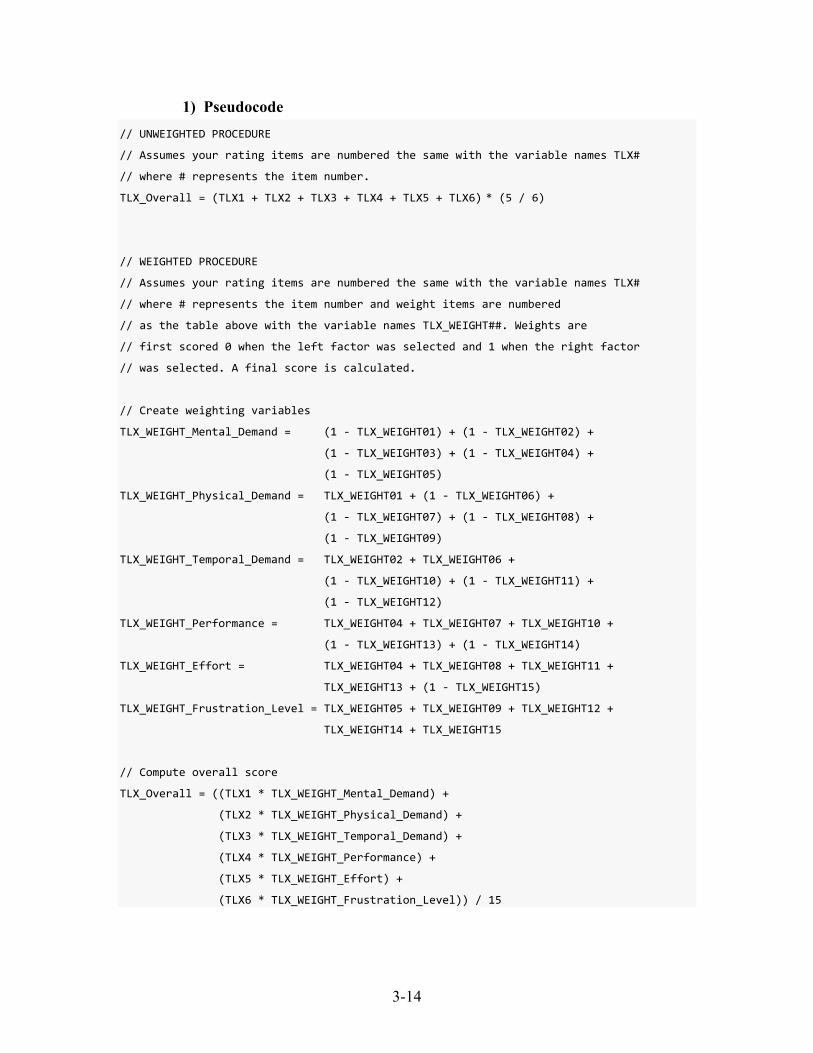
1) Pseudocode // UNWEIGHTED PROCEDURE
// Assumes your rating items are numbered the same with the variable names TLX#
// where # represents the item number.
TLX_Overall = (TLX1 + TLX2 + TLX3 + TLX4 + TLX5 + TLX6) * (5 / 6)
// WEIGHTED PROCEDURE
// Assumes your rating items are numbered the same with the variable names TLX#
// where # represents the item number and weight items are numbered
// as the table above with the variable names TLX_WEIGHT##. Weights are
// first scored 0 when the left factor was selected and 1 when the right factor
// was selected. A final score is calculated.
// Create weighting variables
TLX_WEIGHT_Mental_Demand = (1 - TLX_WEIGHT01) + (1 - TLX_WEIGHT02) +
(1 - TLX_WEIGHT03) + (1 - TLX_WEIGHT04) +
(1 - TLX_WEIGHT05)
TLX_WEIGHT_Physical_Demand = TLX_WEIGHT01 + (1 - TLX_WEIGHT06) +
(1 - TLX_WEIGHT07) + (1 - TLX_WEIGHT08) +
(1 - TLX_WEIGHT09)
TLX_WEIGHT_Temporal_Demand = TLX_WEIGHT02 + TLX_WEIGHT06 +
(1 - TLX_WEIGHT10) + (1 - TLX_WEIGHT11) +
(1 - TLX_WEIGHT12)
TLX_WEIGHT_Performance = TLX_WEIGHT04 + TLX_WEIGHT07 + TLX_WEIGHT10 +
(1 - TLX_WEIGHT13) + (1 - TLX_WEIGHT14)
TLX_WEIGHT_Effort = TLX_WEIGHT04 + TLX_WEIGHT08 + TLX_WEIGHT11 +
TLX_WEIGHT13 + (1 - TLX_WEIGHT15)
TLX_WEIGHT_Frustration_Level = TLX_WEIGHT05 + TLX_WEIGHT09 + TLX_WEIGHT12 +
TLX_WEIGHT14 + TLX_WEIGHT15
// Compute overall score
TLX_Overall = ((TLX1 * TLX_WEIGHT_Mental_Demand) +
(TLX2 * TLX_WEIGHT_Physical_Demand) +
(TLX3 * TLX_WEIGHT_Temporal_Demand) +
(TLX4 * TLX_WEIGHT_Performance) +
(TLX5 * TLX_WEIGHT_Effort) +
(TLX6 * TLX_WEIGHT_Frustration_Level)) / 15
3-15
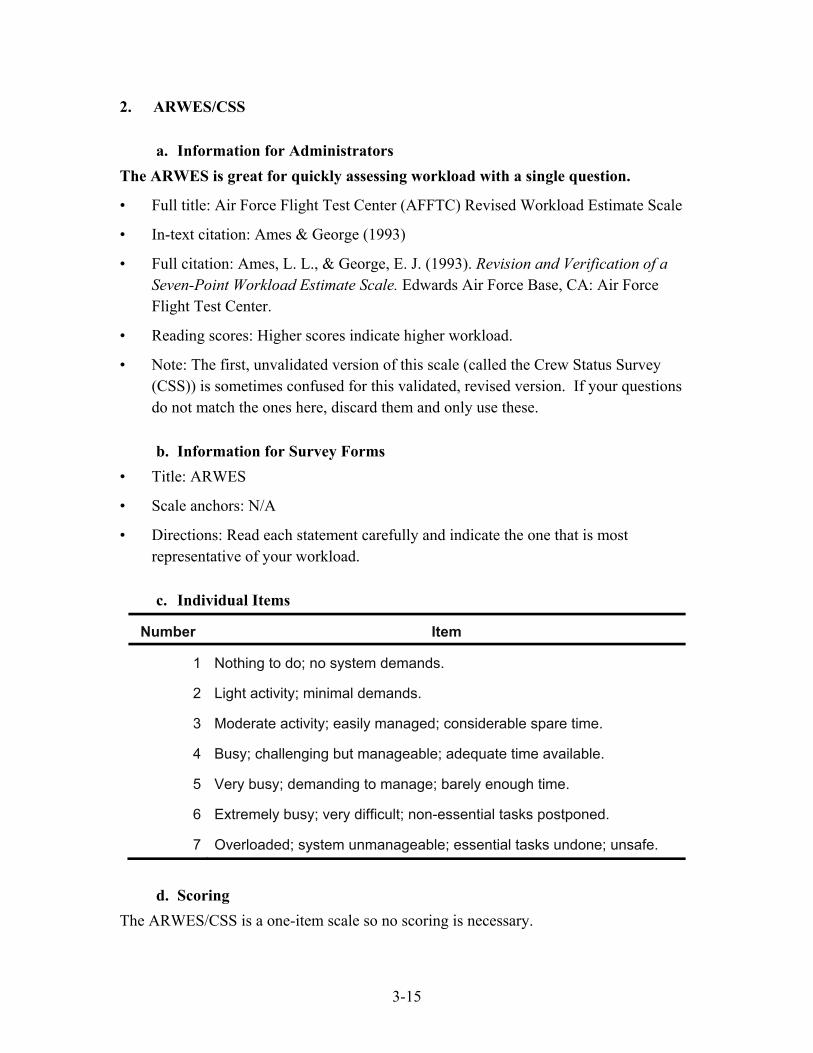
2. ARWES/CSS
a. Information for Administrators The ARWES is great for quickly assessing workload with a single question.
• Full title: Air Force Flight Test Center (AFFTC) Revised Workload Estimate Scale
• In-text citation: Ames & George (1993)
• Full citation: Ames, L. L., & George, E. J. (1993). Revision and Verification of a Seven-Point Workload Estimate Scale. Edwards Air Force Base, CA: Air Force Flight Test Center.
• Reading scores: Higher scores indicate higher workload.
• Note: The first, unvalidated version of this scale (called the Crew Status Survey (CSS)) is sometimes confused for this validated, revised version. If your questions do not match the ones here, discard them and only use these.
b. Information for Survey Forms • Title: ARWES
• Scale anchors: N/A
• Directions: Read each statement carefully and indicate the one that is most representative of your workload.
c. Individual Items
Number Item
1 Nothing to do; no system demands.
2 Light activity; minimal demands.
3 Moderate activity; easily managed; considerable spare time.
4 Busy; challenging but manageable; adequate time available.
5 Very busy; demanding to manage; barely enough time.
6 Extremely busy; very difficult; non-essential tasks postponed.
7 Overloaded; system unmanageable; essential tasks undone; unsafe.
d. Scoring The ARWES/CSS is a one-item scale so no scoring is necessary.
3-16
1) Pseudocode The ARWES/CSS is a one-item scale so no scoring is necessary.
3-17
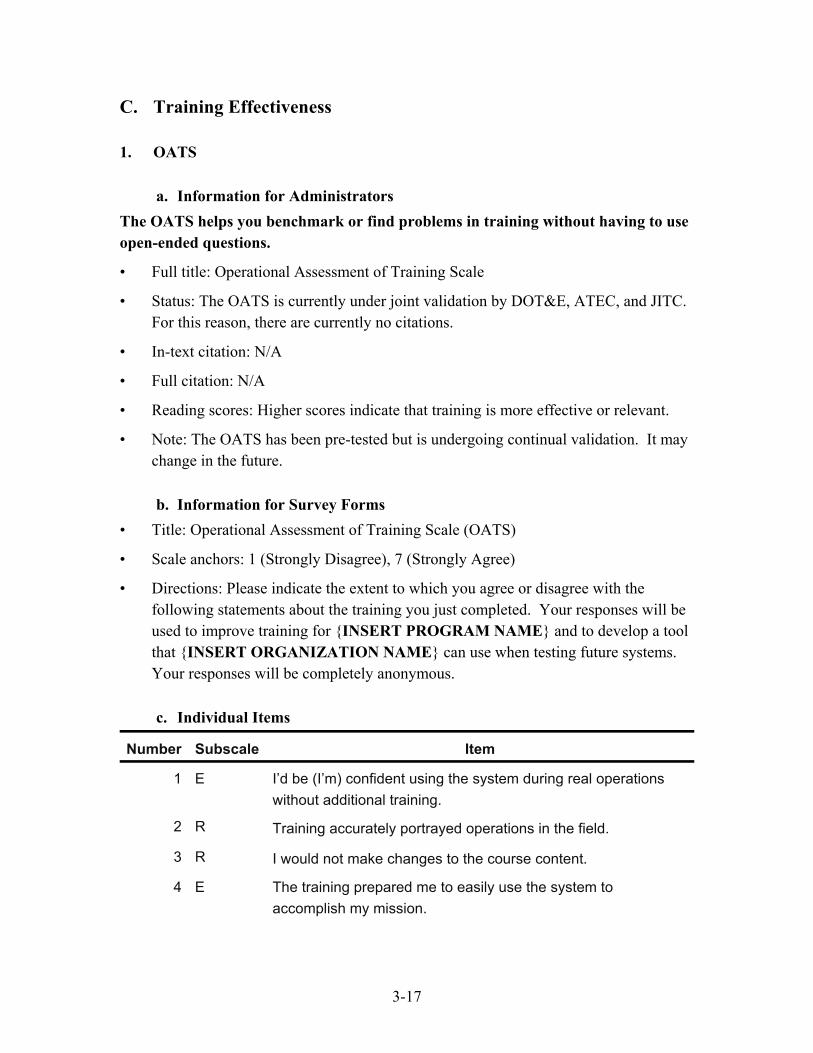
C. Training Effectiveness
1. OATS
a. Information for Administrators The OATS helps you benchmark or find problems in training without having to use open-ended questions.
• Full title: Operational Assessment of Training Scale
• Status: The OATS is currently under joint validation by DOT&E, ATEC, and JITC. For this reason, there are currently no citations.
• In-text citation: N/A
• Full citation: N/A
• Reading scores: Higher scores indicate that training is more effective or relevant.
• Note: The OATS has been pre-tested but is undergoing continual validation. It may change in the future.
b. Information for Survey Forms • Title: Operational Assessment of Training Scale (OATS)
• Scale anchors: 1 (Strongly Disagree), 7 (Strongly Agree)
• Directions: Please indicate the extent to which you agree or disagree with the following statements about the training you just completed. Your responses will be used to improve training for {INSERT PROGRAM NAME} and to develop a tool that {INSERT ORGANIZATION NAME} can use when testing future systems. Your responses will be completely anonymous.
c. Individual Items
Number Subscale Item
1 E I’d be (I’m) confident using the system during real operations without additional training.
2 R Training accurately portrayed operations in the field.
3 R I would not make changes to the course content.
4 E The training prepared me to easily use the system to accomplish my mission.

3-18
Number Subscale Item 5 R I can see myself using what I learned in training during real
operations. 6 E Training prepared me to solve common problems.
7 R The course’s level of difficulty was appropriate for someone in my position.
8 R* The course covered topics I don’t think should have been covered.
9 R All of the information covered was relevant to how I interact with the system.
10 E The training improved my understanding of how to interact with the system.
11 E* I’d (I) want additional training before using the system during real operations.
12 E The training prepared me to properly interact with the system.
13 R* The training had a lot of information that wasn’t relevant to me.
14 R* Training did not cover important ways I interact with the system.
15 R Training adequately covered all important ways I interact with the system.
Key: E = Efficacy; R = Relevance. ∗ Denotes that the item is reverse-scored.
d. Scoring There are two subscales in the OATS and a few reverse-coded items. Items denoted as “reverse-scored” in the table above are scored as 8 – Response.
More formulaically, scored items i in each subscale with s total items can be expressed as: = ∑
= 2 + 3+. . . +(8 − 14) + 159 = 1 + 4+. . . +(8 − 11) + 126
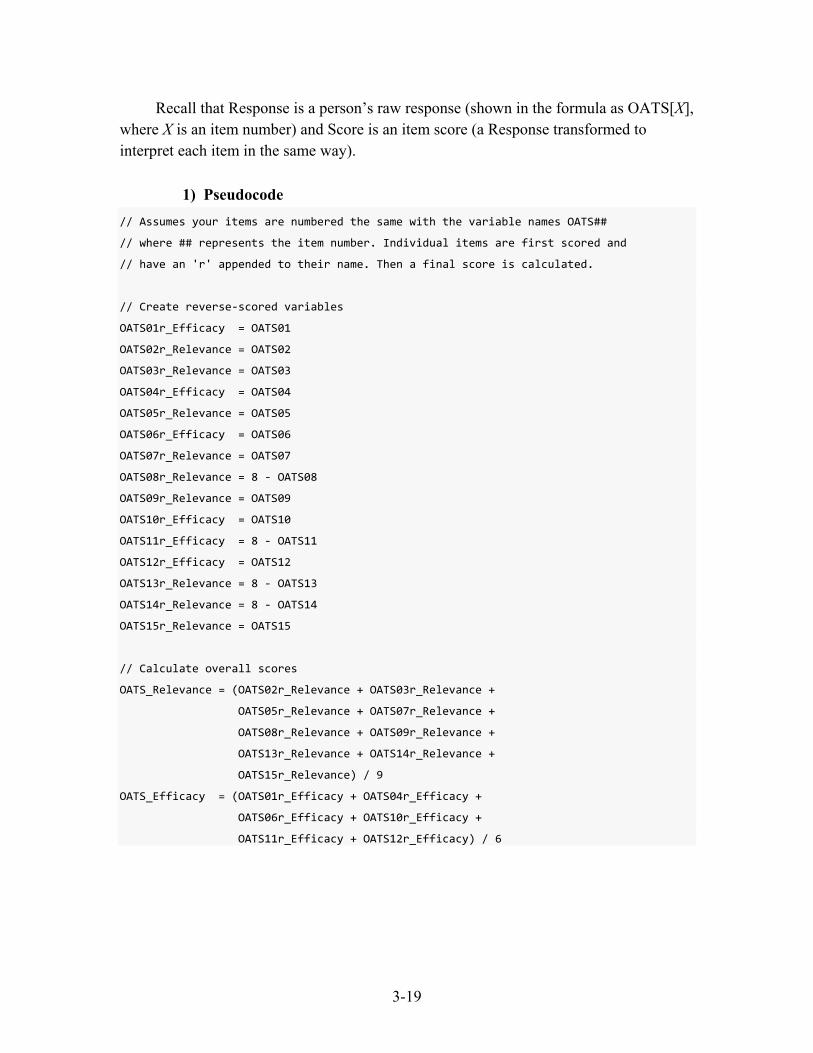
3-19
Recall that Response is a person’s raw response (shown in the formula as OATS[X], where X is an item number) and Score is an item score (a Response transformed to interpret each item in the same way).
1) Pseudocode // Assumes your items are numbered the same with the variable names OATS##
// where ## represents the item number. Individual items are first scored and
// have an 'r' appended to their name. Then a final score is calculated.
// Create reverse-scored variables
OATS01r_Efficacy = OATS01
OATS02r_Relevance = OATS02
OATS03r_Relevance = OATS03
OATS04r_Efficacy = OATS04
OATS05r_Relevance = OATS05
OATS06r_Efficacy = OATS06
OATS07r_Relevance = OATS07
OATS08r_Relevance = 8 - OATS08
OATS09r_Relevance = OATS09
OATS10r_Efficacy = OATS10
OATS11r_Efficacy = 8 - OATS11
OATS12r_Efficacy = OATS12
OATS13r_Relevance = 8 - OATS13
OATS14r_Relevance = 8 - OATS14
OATS15r_Relevance = OATS15
// Calculate overall scores
OATS_Relevance = (OATS02r_Relevance + OATS03r_Relevance +
OATS05r_Relevance + OATS07r_Relevance +
OATS08r_Relevance + OATS09r_Relevance +
OATS13r_Relevance + OATS14r_Relevance +
OATS15r_Relevance) / 9
OATS_Efficacy = (OATS01r_Efficacy + OATS04r_Efficacy +
OATS06r_Efficacy + OATS10r_Efficacy +
OATS11r_Efficacy + OATS12r_Efficacy) / 6

3-20
2. DST
a. Information for Administrators The DST quickly focuses you on ways to improve a training. It should be used as a supplement to the OATS or other training diagnostics; the DST should not be used instead of validated training measures.
• Full title: Diagnostic Survey of Training
• In-text citation: N/A
• Full citation: N/A
• Reading scores: Higher scores indicate that people would like more information on the topic (course subscale) and that the instructor did a good job (instructor subscale).
• Note: This scale is not validated, but it is a useful instrument to supplement the OATS.
b. Information for Survey Forms • Title: Diagnostic Survey of Training (DST)
• Scale anchors: 1 (Significantly Decrease), 7 (Significantly Increase) for course subscale; 1 (Strongly Disagree), 7 (Strongly Agree) for instructor subscale
• Directions: Choose the option that best describes what you think should happen to each of the aspects of training in the list below.
c. Individual Items – Course
Number Item
1 Amount of hands-on training
2 Amount of lecture
3 Detail of course training content
4 Pace of the course training
5 Amount of reference materials provided
6 Amount of time for questions
7 Reinforcement of course training content
8 Overall training length

3-21
d. Individual Items – Instructor
Number Item
1 The instructor did a good job overall
e. Scoring The DST does not necessarily need to be scored and rather can be used as a diagnostic instrument. If you have a lot of low scores for pace, you might consider ways to draw things out, such as adding more hands-on materials.
1) Pseudocode No pseudocode is necessary.
3-22
D. Trust For information about the importance of trust in automation see Lee & See (2004):
Lee, J. D., & See, K. A. (2004). “Trust in Automation: Designing for Appropriate Reliance.” Human Factors, 46(1), 50–80. doi: 10.1518/hfes.46.1.50_30392
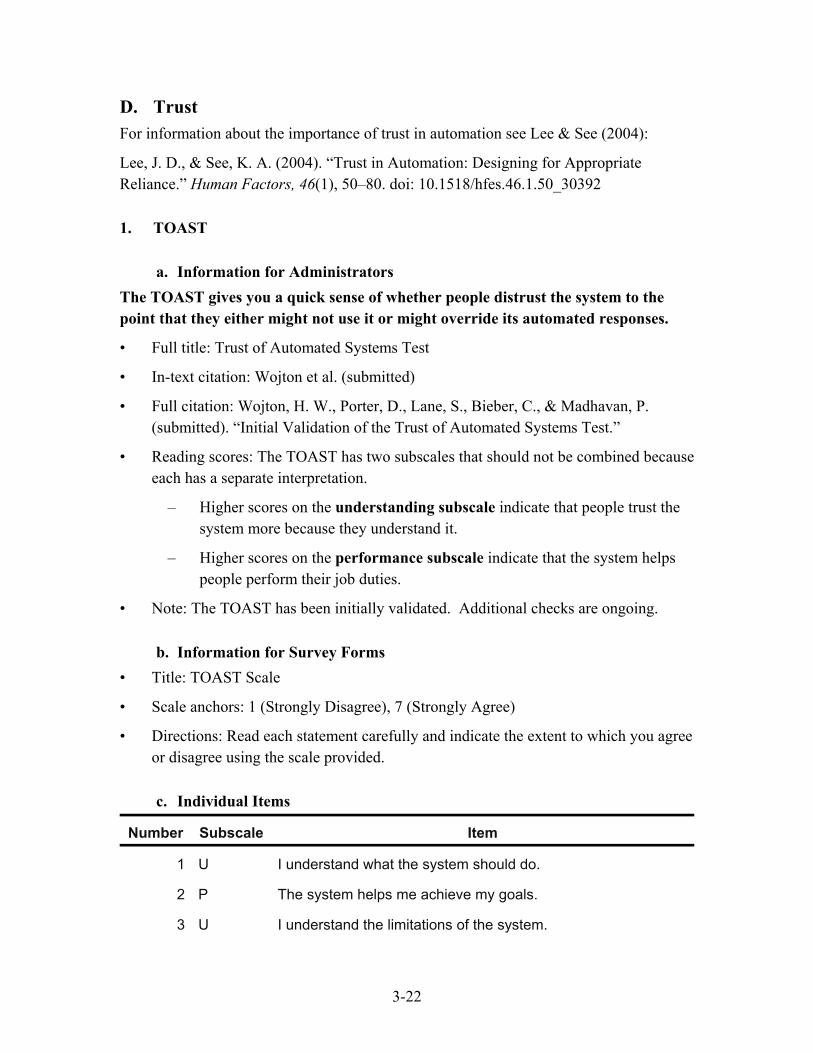
1. TOAST
a. Information for Administrators The TOAST gives you a quick sense of whether people distrust the system to the point that they either might not use it or might override its automated responses.
• Full title: Trust of Automated Systems Test
• In-text citation: Wojton et al. (submitted)
• Full citation: Wojton, H. W., Porter, D., Lane, S., Bieber, C., & Madhavan, P. (submitted). “Initial Validation of the Trust of Automated Systems Test.”
• Reading scores: The TOAST has two subscales that should not be combined because each has a separate interpretation.
– Higher scores on the understanding subscale indicate that people trust the system more because they understand it.
– Higher scores on the performance subscale indicate that the system helps people perform their job duties.
• Note: The TOAST has been initially validated. Additional checks are ongoing.
b. Information for Survey Forms • Title: TOAST Scale
• Scale anchors: 1 (Strongly Disagree), 7 (Strongly Agree)
• Directions: Read each statement carefully and indicate the extent to which you agree or disagree using the scale provided.
c. Individual Items
Number Subscale Item
1 U I understand what the system should do.
2 P The system helps me achieve my goals.
3 U I understand the limitations of the system.

3-23
Number Subscale Item
4 U I understand the capabilities of the system.
5 P The system performs consistently.
6 P The system performs the way it should.
7 P I feel comfortable relying on the information provided by the system.
8 U I understand how the system executes tasks.
9 P I am rarely surprised by how the system responds. Key: U = Understanding subscale; P = Performance subscale.
d. Scoring Each subscale can be scored by calculating the mean of the subscale.
Generally speaking, for each item, i, in a subscale with s items: = ∑
Or more specifically, for each subscale’s individual items: = 1 + 3 + 4 + 84 = 2 + 5 + 6 + 7 + 95
1) Pseudocode // Assumes your items are numbered the same with the variable names TOAST#
// Where # represents the item number
TOAST_Understanding = (TOAST1 + TOAST3 + TOAST4 + TOAST8) / 4
TOAST_Performance = (TOAST2 + TOAST5 + TOAST6 + TOAST7 + TOAST9) / 5
Do not create a total, composite TOAST score because validation has shown it is not a reliable measure.

4-1
4. Situational Awareness
As mentioned previously, we highly recommend measuring situational awareness (SA) using behavioral measures tied to mission-critical outcomes. Techniques to measure real SA typically do not involve scales, so we do not include them in this repository. For an overview of these techniques, their benefits, and limitations (e.g., Situation Awareness Global Assessment Technique or SAGAT), please see this external repository: https://ext.eurocontrol.int/ehp/?q=taxonomy/term/104. However, some techniques in that repository are not appropriate for all systems or tests, and details should be worked out at the program level.
In certain situations, it may be important to measure an operator’s opinion of the quality of their own SA, or their perceived situational awareness. Perceived SA can be measured with a scale. However, we do not include these measures here because in most cases this is not what testers desire, and efforts to validate commonly used perceived SA scales often have found they measure other HSI concepts (e.g., workload).