Stress and Pressure Pulsation Analysis of Low Temperature ...
A
fa
stt
dp
p©
K
1
(sf[
fporm
vR
1d
Available online at www.sciencedirect.com
Medical Engineering & Physics 30 (2008) 1149–1158
Pressure pulsation in roller pumps: A validatedlumped parameter model
Francesco Moscato ∗, Francesco M. Colacino, Maurizio Arabia, Guido A. DanieliDepartment of Mechanical Engineering, University of Calabria, Arcavacata di Rende (CS), Italy
Received 23 May 2007; received in revised form 7 January 2008; accepted 25 February 2008
bstract
During open-heart surgery roller pumps are often used to keep the circulation of blood through the patient body. They present numerous keyeatures, but they suffer from several limitations: (a) they normally deliver uncontrolled pulsatile inlet and outlet pressure; (b) blood damageppears to be more than that encountered with centrifugal pumps.
A lumped parameter mathematical model of a roller pump (SarnsTM 7000, Terumo CVS, Ann Arbor, MI, USA) was developed to dynamicallyimulate pressures at the pump inlet and outlet in order to clarify the uncontrolled pulsation mechanism. Inlet and outlet pressures obtained byhe mathematical model have been compared with those measured in various operating conditions: different rollers’ rotating speed, differentube occlusion rates, and different clamping degree at the pump inlet and outlet.
Model results agree with measured pressure waveforms, whose oscillations are generated by the tube compression/release mechanismuring the rollers’ engaging and disengaging phases. Average Euclidean Error (AEE) was 20 mmHg and 33 mmHg for inlet and outlet
ressure estimates, respectively. The normalized AEE never exceeded 0.16.The developed model can be exploited for designing roller pumps with improved performances aimed at reducing the undesired pressureulsation.
2008 IPEM. Published by Elsevier Ltd. All rights reserved.
control
nsswitb
ha
eywords: Roller pump; Lumped parameter model; Pressure dynamics; Un
. Introduction
During open-heart surgery, cardiopulmonary bypassCPB) is used to relieve heart and lungs of their normal lifeustaining functions. Roller pumps are used to undertake theunctions of blood circulation in approximately 50% of CPB1,2].
For decades, roller pumps were the most accepted pumpsor CPB [3], due to their numerous key features: low cost;redictable mean flow obtained by controlling the arm speedr choosing different tubes’ inner diameter sizes, a quicker
esponse to servo-control; simpler design and thus feweroving parts which would be subject to malfunction.∗ Corresponding author at: Department of Mechanical Engineering, Uni-ersity of Calabria, Via Ponte P. Bucci, Cubo 44/c, 87036 Arcavacata diende (CS), Italy. Tel.: +39 0984 494939; fax: +39 0984 494673.
E-mail address: [email protected] (F. Moscato).
p[nmmued
350-4533/$ – see front matter © 2008 IPEM. Published by Elsevier Ltd. All rightsoi:10.1016/j.medengphy.2008.02.007
led pulsatile pressure; Pulsation mechanism
Nevertheless, they suffer from several limitations: theyormally deliver uncontrolled pulsatile inlet and outlet pres-ure, which generates high frequency harmonics in pressureignals [4]; a phenomenon known as spallation [5,6] exists,hich consists of micro-particles detaching from the tubing
nner walls due to cyclic compression by the rollers; bloodrauma and microemboli delivered to the patient appears toe more than that encountered with centrifugal pumps [7,8].
In the last years, computational studies and models of CPBemodynamics have been reported. In particular, they wereimed at simulating patient hemodynamics during artificialerfusion [9,10], developing automated perfusion strategies11–13], and optimizing the design of CPB circuits [14], butone of them was focused on the pumping element, usuallyodelled as a pure flow generator. A two-dimensional CFD
odel of a roller pump is reported in [15]. This study gaveseful information about roller pump fluid dynamics; how-ver the model did not focus on the uncontrolled pulsatilityynamics.
reserved.
1150 F. Moscato et al. / Medical Engineering
FT
ppam
2
2
Ao
pit
m1Ut
Wi(
nn1p
2
tisiidid4TbvaTua
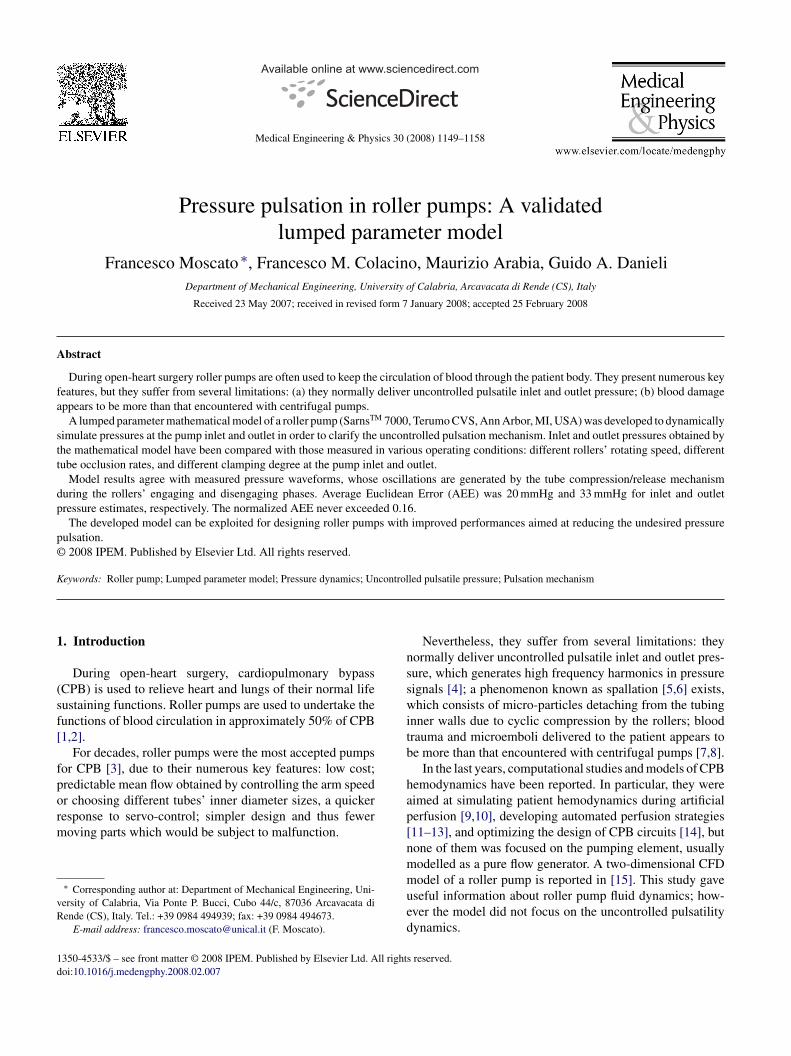
Fp
ig. 1. Picture of the experimental setup. For characteristic dimensions seeable 1.
The aim of the present study is to provide a lumpedarameter model which clarifies the uncontrolled pressureulsatility generation mechanisms in roller pumps, thusllowing considerations on achievable performance improve-ents of roller-type peristaltic pumps.
. Material and methods
.1. Experimental setup
A twin roller pump (SarnsTM 7000, Terumo CVS, Annrbor, MI, USA) connected to an open air reservoir by meansf two hydraulic lines, made up of 3/8 in. × 1/16 in. PVC
mmcz
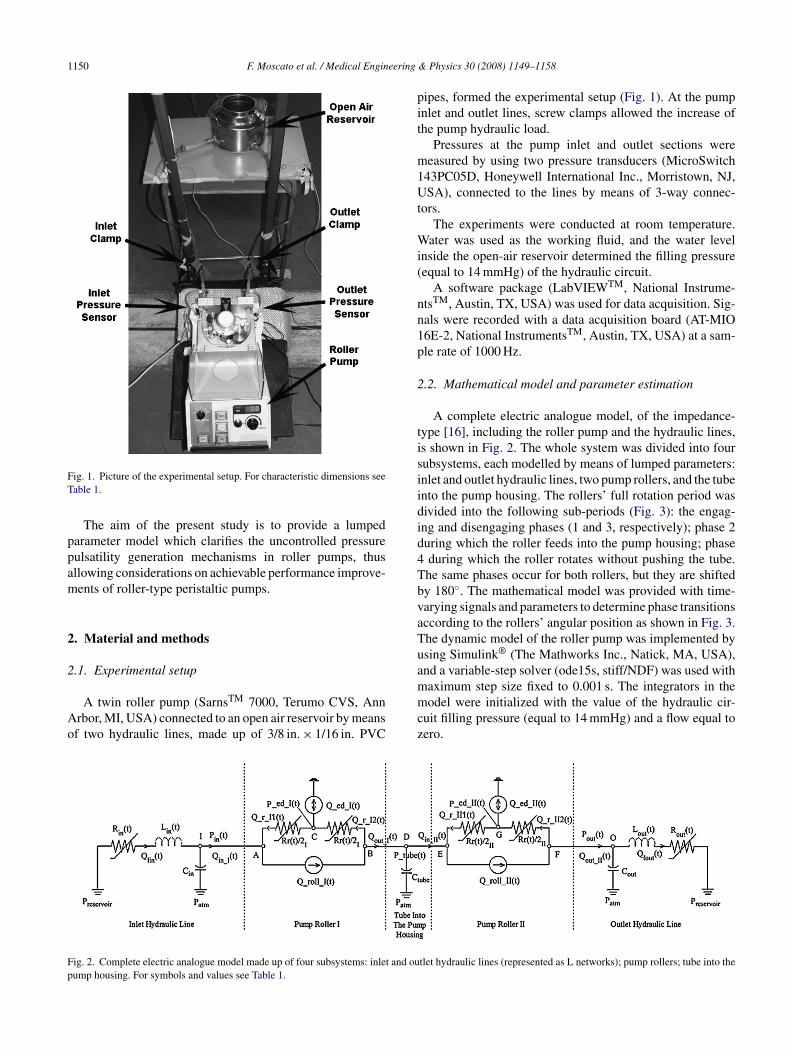
ig. 2. Complete electric analogue model made up of four subsystems: inlet and ouump housing. For symbols and values see Table 1.
& Physics 30 (2008) 1149–1158
ipes, formed the experimental setup (Fig. 1). At the pumpnlet and outlet lines, screw clamps allowed the increase ofhe pump hydraulic load.
Pressures at the pump inlet and outlet sections wereeasured by using two pressure transducers (MicroSwitch
43PC05D, Honeywell International Inc., Morristown, NJ,SA), connected to the lines by means of 3-way connec-
ors.The experiments were conducted at room temperature.
ater was used as the working fluid, and the water levelnside the open-air reservoir determined the filling pressureequal to 14 mmHg) of the hydraulic circuit.
A software package (LabVIEWTM, National Instrume-tsTM, Austin, TX, USA) was used for data acquisition. Sig-als were recorded with a data acquisition board (AT-MIO6E-2, National InstrumentsTM, Austin, TX, USA) at a sam-le rate of 1000 Hz.
.2. Mathematical model and parameter estimation
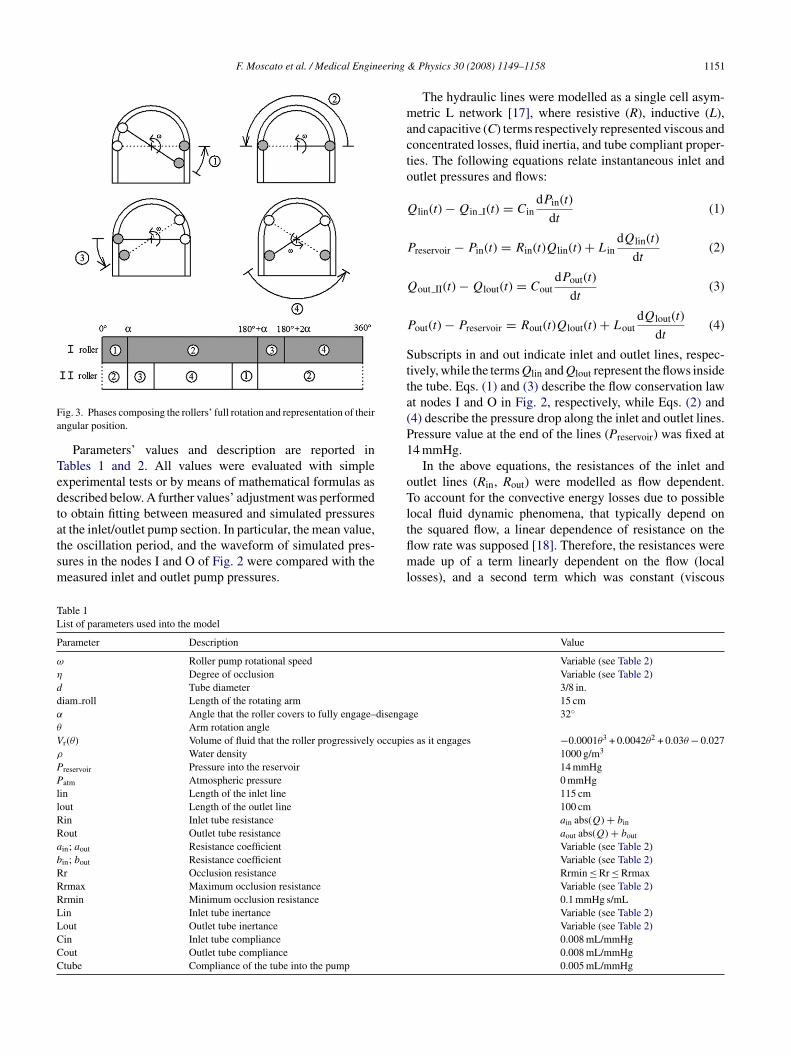
A complete electric analogue model, of the impedance-ype [16], including the roller pump and the hydraulic lines,s shown in Fig. 2. The whole system was divided into fourubsystems, each modelled by means of lumped parameters:nlet and outlet hydraulic lines, two pump rollers, and the tubento the pump housing. The rollers’ full rotation period wasivided into the following sub-periods (Fig. 3): the engag-ng and disengaging phases (1 and 3, respectively); phase 2uring which the roller feeds into the pump housing; phaseduring which the roller rotates without pushing the tube.he same phases occur for both rollers, but they are shiftedy 180◦. The mathematical model was provided with time-arying signals and parameters to determine phase transitionsccording to the rollers’ angular position as shown in Fig. 3.he dynamic model of the roller pump was implemented bysing Simulink® (The Mathworks Inc., Natick, MA, USA),nd a variable-step solver (ode15s, stiff/NDF) was used with
aximum step size fixed to 0.001 s. The integrators in theodel were initialized with the value of the hydraulic cir-uit filling pressure (equal to 14 mmHg) and a flow equal toero.
tlet hydraulic lines (represented as L networks); pump rollers; tube into the
F. Moscato et al. / Medical Engineering
Fa
Tedtatsm
macto
Q
P
Q
P
Stta(P1
oTl
TL
P
ω
η
ddα
θ
Vρ
PPllRRabRRRLLCCC
ig. 3. Phases composing the rollers’ full rotation and representation of theirngular position.
Parameters’ values and description are reported inables 1 and 2. All values were evaluated with simplexperimental tests or by means of mathematical formulas asescribed below. A further values’ adjustment was performedo obtain fitting between measured and simulated pressures
t the inlet/outlet pump section. In particular, the mean value,he oscillation period, and the waveform of simulated pres-ures in the nodes I and O of Fig. 2 were compared with theeasured inlet and outlet pump pressures.tflml
able 1ist of parameters used into the model
arameter Description
Roller pump rotational speedDegree of occlusionTube diameter
iam roll Length of the rotating armAngle that the roller covers to fully engage–disengaArm rotation angle
r(θ) Volume of fluid that the roller progressively occupieWater density
reservoir Pressure into the reservoir
atm Atmospheric pressurein Length of the inlet lineout Length of the outlet linein Inlet tube resistanceout Outlet tube resistance
in; aout Resistance coefficient
in; bout Resistance coefficientr Occlusion resistancermax Maximum occlusion resistancermin Minimum occlusion resistancein Inlet tube inertanceout Outlet tube inertancein Inlet tube complianceout Outlet tube compliancetube Compliance of the tube into the pump
& Physics 30 (2008) 1149–1158 1151
The hydraulic lines were modelled as a single cell asym-etric L network [17], where resistive (R), inductive (L),
nd capacitive (C) terms respectively represented viscous andoncentrated losses, fluid inertia, and tube compliant proper-ies. The following equations relate instantaneous inlet andutlet pressures and flows:
lin(t) − Qin I(t) = CindPin(t)
dt(1)
reservoir − Pin(t) = Rin(t)Qlin(t) + LindQlin(t)
dt(2)
out II(t) − Qlout(t) = CoutdPout(t)
dt(3)
out(t) − Preservoir = Rout(t)Qlout(t) + LoutdQlout(t)
dt(4)
ubscripts in and out indicate inlet and outlet lines, respec-ively, while the terms Qlin and Qlout represent the flows insidehe tube. Eqs. (1) and (3) describe the flow conservation lawt nodes I and O in Fig. 2, respectively, while Eqs. (2) and4) describe the pressure drop along the inlet and outlet lines.ressure value at the end of the lines (Preservoir) was fixed at4 mmHg.
In the above equations, the resistances of the inlet andutlet lines (Rin, Rout) were modelled as flow dependent.o account for the convective energy losses due to possible
ocal fluid dynamic phenomena, that typically depend on
he squared flow, a linear dependence of resistance on theow rate was supposed [18]. Therefore, the resistances wereade up of a term linearly dependent on the flow (localosses), and a second term which was constant (viscous
Value
Variable (see Table 2)Variable (see Table 2)3/8 in.15 cm
ge 32◦
s as it engages −0.0001θ3 + 0.0042θ2 + 0.03θ − 0.0271000 g/m3
14 mmHg0 mmHg115 cm100 cmain abs(Q) + bin
aout abs(Q) + bout
Variable (see Table 2)Variable (see Table 2)Rrmin ≤ Rr ≤ RrmaxVariable (see Table 2)0.1 mmHg s/mLVariable (see Table 2)Variable (see Table 2)0.008 mL/mmHg0.008 mL/mmHg0.005 mL/mmHg

1152 F. Moscato et al. / Medical Engineering & Physics 30 (2008) 1149–1158
Table 2Experiments performed and parameters’ value
Control experiment (a) Speed increase (b) Inlet clamp (c) Outlet clamp (d) Occlusion decrease (e) Occlusion decrease (f) Units
ω 54 108 54 54 54 108 rpmAverage flow 1.81 3.63 1.81 1.81 1.81 3.63 L/min
Occlusion Optimal Optimal Optimal Optimal Decreased Decreased Units
η 1 1 1 1 0.69 0.46ain 0.036 0.036 0.036 0.036 0.036 0.036 mmHg s2/mL2
bin 1 1 6 1 1.2 1 mmHg s/mLaout 0.021 0.021 0.021 0.021 0.021 0.021 mmHg s2/mL2
bout 0.6 0.6 0.6 6.2 0.6 0.6 mmHg s/mLL 0L 0R 170
l
�
Pro
d
�
wdtf
L
trL
lwumco
e
Q
Q
Q
P
P
sdEC
ir
t
Q
taDartwpei
ti∫
w(pa
in 0.121 0.121 0.422out 0.105 0.105 0.105rmax 170 190 170
osses) as reported below:
P(t) = RQ(t) = �plocal + �pviscous
= (a|Q(t)| + b)Q(t). (5)
arameters a and b were determined to, respectively,eproduce peak-to-peak and mean values of the inlet andutlet pressure signals.
The inertial pressure drop in a pipe of length l and diameterwere expressed by:
P(t) = LdQ(t)
dt(6)
here L represents the inertance of the pipe line and it isependent on the fluid density ρ and the geometrical proper-ies of the tube [19]. The inertance was calculated using theormula that follows:
= ρ4l
πd2 . (7)
The inertance L was further adjusted for the experimentalests as the inlet and outlet lines were clamped: the clampeduces the value of the pipe diameter d thus increasing thevalue.The compliant terms Cin and Cout for the inlet and out-
et lines (Fig. 2) were determined experimentally. The tubeas filled up at the atmospheric pressure, then controlled vol-mes of 1 ml were injected and subtracted and the pressureeasured up to values of ±250 mmHg. The compliance was
omputed as the slope of the line obtained by linear regressionf the measured data points.
The roller subsystems were modelled as dipoles. The gov-rning equations for roller I follow:
in I(t) = Q roll I(t) − Q r I1(t) (8)
roll I(t) = Qout I(t) + Q r I2(t) (9)
r I2(t) + Q ed I(t) = Q r I1(t) (10)
ed I(t) − Pin(t) = Rr(t)I
2Q r I1(t) (11)
n∫
.121 0.121 0.121 mmHg s2/mL
.839 0.105 0.105 mmHg s2/mL8 2.5 mmHg s/mL
tube(t) − P ed I(t) = Rr(t)I
2Q r I2(t) (12)
By looking at Fig. 2, Eqs. (8)–(10) describe the flow con-ervation law at the nodes A, B, and C, respectively. Eq. (11)escribes the pressure drop between the nodes C and A, whileq. (12) describes the pressure drop between the nodes B and.
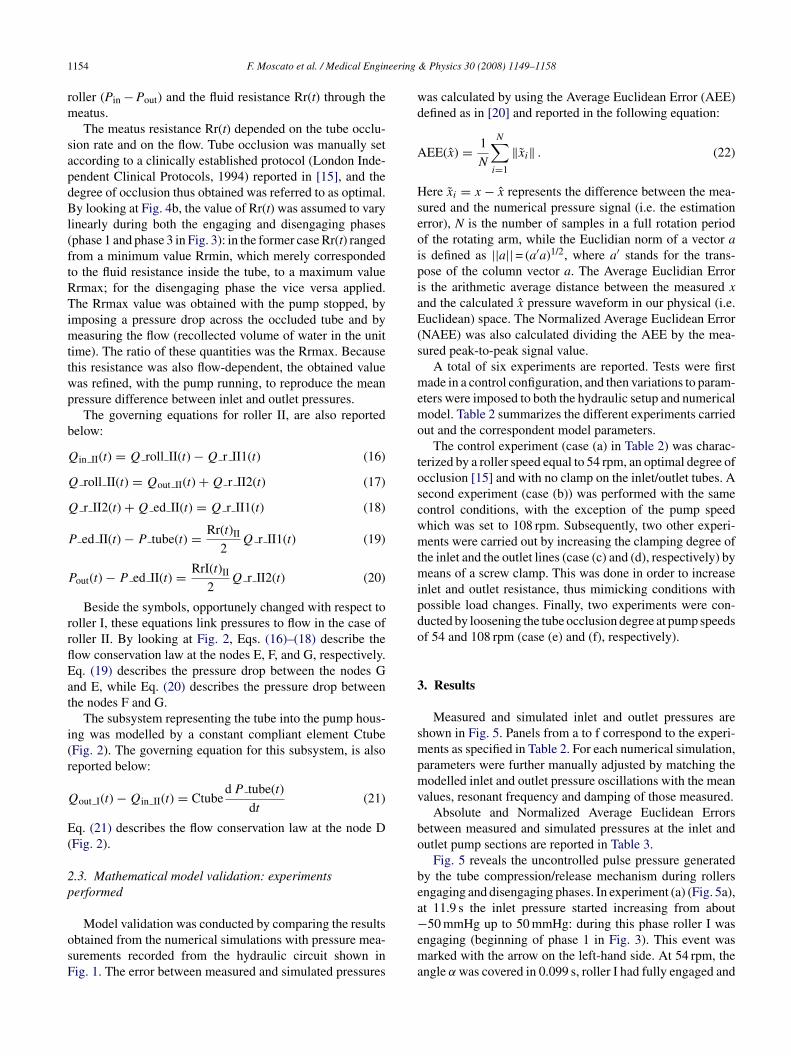
The rollers’ engaging phase is schematically representedn Fig. 4a. During the engaging and disengaging phases, eacholler imposes two flows: Q roll and Q ed.
The Q roll term takes into account the flow generated byhe feed of the roller itself, this contribution was set equal to:
roll(t) = ωdiam roll
2A(t, η) (13)
where ω is the rotating arm angular speed, diam roll/2 ishe rollers’ centre distance from the pivot point of the rotatingrm, and A(t,η) is the area of the tube occluded by the roller.uring the engaging phase (phase 1 in Fig. 3), this area was
ssumed, for simplicity, to vary linearly between 0, when theoller has not yet touched the tube, and A tube = η(πd2/4) (d ishe tube inner diameter, η represents the degree of occlusion)hen the roller has fully engaged. During the disengaginghase (phase 3 in Fig. 3) the area was also assumed to vary lin-arly between A tube and 0. The Q roll input driving functions shown in Fig. 4b.
The Q ed term takes into account the flow generated byhe gradual tube compression/release during the roller engag-ng/disengaging phases. This flow was set equal to:
t eng
0Q ed(t) dt = Vr(t) (14)
here t eng is the time that the roller takes to fully engagedisengage), and Vr(t) is the volume of fluid that the rollerrogressively occupies as it engages (disengages). Since thengular speed ω is always constant, Eq. (14) could be alter-
atively written as follows:α
0Q ed(θ) dθ = Vr(θ) (15)
F. Moscato et al. / Medical Engineering & Physics 30 (2008) 1149–1158 1153
F ), Q edi ump hod see Tab
α
ea
sfsaa
tω
aep
ig. 4. (a) Schematic representation of rollers’ engaging phase; (b) Q roll(tnto the tube due to the engaging roller when the roller moves towards the peforming it); (solid line) cubic interpolation Vr(θ). For symbols and values
being the angle that the roller covers to fully engage (dis-ngage). Its value was imposed by the geometry of the pumpnd was set equal to 32◦.
The flow Q ed was identified by measuring the volumequeezed by the roller throughout the engaging phase as a
unction of the roller angular position (Fig. 4c). It was mea-ured by recording the level increase of a fluid contained ingraduated reservoir. The data points were interpolated bycubic equation, and a parabolic function for Q ed(θ) wasamd
(t), and Rr(t) input driving functions; (c) (dots) measured volume variationusing (the engaging angle is zero when the roller touches the tube withoutle 1.
hen obtained by derivation. With a constant angular speed, Q ed(t) could be easily obtained being θ = ωt. By lookingt Fig. 4b, the function Q ed(t) has a positive sign during thengaging phase and a negative one during the disengaginghase, while it is zero during the remaining ones.
Since, in normal conditions, the tube’s inner walls do notdhere perfectly, a regurgitant flow Q r occurs through theeatus (Fig. 4a). In turn, direction and magnitude of this flow
epend on both the pressure gradient across the squeezing
1 eering
rm
sapdBl(ftRTimttwp
b
Q
Q
Q
P
P
rrflEat
i(r
Q
E(
2p
osF
wd
A
HseoipiaE(s
memo
toscwmtmipdo
3
smpmv
bo
bea
154 F. Moscato et al. / Medical Engin
oller (Pin − Pout) and the fluid resistance Rr(t) through theeatus.The meatus resistance Rr(t) depended on the tube occlu-
ion rate and on the flow. Tube occlusion was manually setccording to a clinically established protocol (London Inde-endent Clinical Protocols, 1994) reported in [15], and theegree of occlusion thus obtained was referred to as optimal.y looking at Fig. 4b, the value of Rr(t) was assumed to vary
inearly during both the engaging and disengaging phasesphase 1 and phase 3 in Fig. 3): in the former case Rr(t) rangedrom a minimum value Rrmin, which merely correspondedo the fluid resistance inside the tube, to a maximum valuermax; for the disengaging phase the vice versa applied.he Rrmax value was obtained with the pump stopped, by
mposing a pressure drop across the occluded tube and byeasuring the flow (recollected volume of water in the unit
ime). The ratio of these quantities was the Rrmax. Becausehis resistance was also flow-dependent, the obtained valueas refined, with the pump running, to reproduce the meanressure difference between inlet and outlet pressures.
The governing equations for roller II, are also reportedelow:
in II(t) = Q roll II(t) − Q r II1(t) (16)
roll II(t) = Qout II(t) + Q r II2(t) (17)
r II2(t) + Q ed II(t) = Q r II1(t) (18)
ed II(t) − P tube(t) = Rr(t)II
2Q r II1(t) (19)
out(t) − P ed II(t) = RrI(t)II
2Q r II2(t) (20)
Beside the symbols, opportunely changed with respect tooller I, these equations link pressures to flow in the case ofoller II. By looking at Fig. 2, Eqs. (16)–(18) describe theow conservation law at the nodes E, F, and G, respectively.q. (19) describes the pressure drop between the nodes Gnd E, while Eq. (20) describes the pressure drop betweenhe nodes F and G.
The subsystem representing the tube into the pump hous-ng was modelled by a constant compliant element CtubeFig. 2). The governing equation for this subsystem, is alsoeported below:
out I(t) − Qin II(t) = Ctubed P tube(t)
dt(21)
q. (21) describes the flow conservation law at the node DFig. 2).
.3. Mathematical model validation: experimentserformed
Model validation was conducted by comparing the resultsbtained from the numerical simulations with pressure mea-urements recorded from the hydraulic circuit shown inig. 1. The error between measured and simulated pressures
−ema
& Physics 30 (2008) 1149–1158
as calculated by using the Average Euclidean Error (AEE)efined as in [20] and reported in the following equation:
EE(x) = 1
N
N∑i=1
‖xi‖ . (22)
ere xi = x − x represents the difference between the mea-ured and the numerical pressure signal (i.e. the estimationrror), N is the number of samples in a full rotation periodf the rotating arm, while the Euclidian norm of a vector as defined as ||a|| = (a′a)1/2, where a′ stands for the trans-ose of the column vector a. The Average Euclidian Errors the arithmetic average distance between the measured xnd the calculated x pressure waveform in our physical (i.e.uclidean) space. The Normalized Average Euclidean Error
NAEE) was also calculated dividing the AEE by the mea-ured peak-to-peak signal value.
A total of six experiments are reported. Tests were firstade in a control configuration, and then variations to param-
ters were imposed to both the hydraulic setup and numericalodel. Table 2 summarizes the different experiments carried
ut and the correspondent model parameters.The control experiment (case (a) in Table 2) was charac-
erized by a roller speed equal to 54 rpm, an optimal degree ofcclusion [15] and with no clamp on the inlet/outlet tubes. Aecond experiment (case (b)) was performed with the sameontrol conditions, with the exception of the pump speedhich was set to 108 rpm. Subsequently, two other experi-ents were carried out by increasing the clamping degree of
he inlet and the outlet lines (case (c) and (d), respectively) byeans of a screw clamp. This was done in order to increase
nlet and outlet resistance, thus mimicking conditions withossible load changes. Finally, two experiments were con-ucted by loosening the tube occlusion degree at pump speedsf 54 and 108 rpm (case (e) and (f), respectively).
. Results
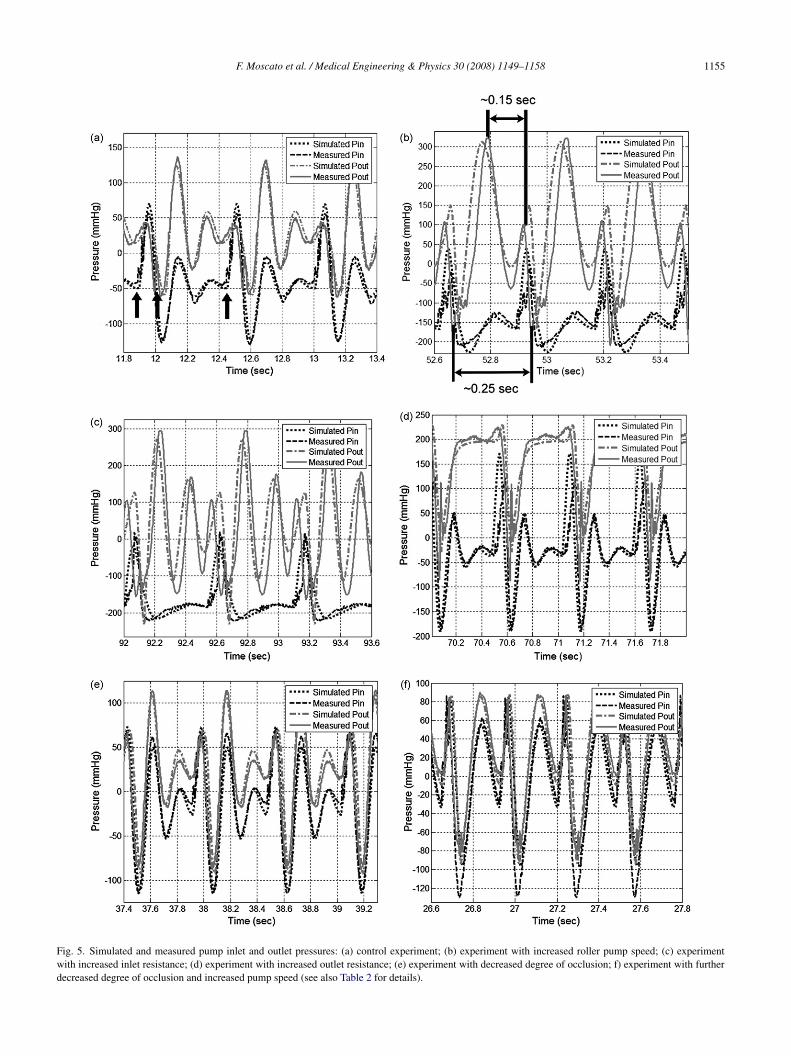
Measured and simulated inlet and outlet pressures arehown in Fig. 5. Panels from a to f correspond to the experi-ents as specified in Table 2. For each numerical simulation,
arameters were further manually adjusted by matching theodelled inlet and outlet pressure oscillations with the mean
alues, resonant frequency and damping of those measured.Absolute and Normalized Average Euclidean Errors
etween measured and simulated pressures at the inlet andutlet pump sections are reported in Table 3.
Fig. 5 reveals the uncontrolled pulse pressure generatedy the tube compression/release mechanism during rollersngaging and disengaging phases. In experiment (a) (Fig. 5a),t 11.9 s the inlet pressure started increasing from about
50 mmHg up to 50 mmHg: during this phase roller I wasngaging (beginning of phase 1 in Fig. 3). This event wasarked with the arrow on the left-hand side. At 54 rpm, the
ngle α was covered in 0.099 s, roller I had fully engaged and
F. Moscato et al. / Medical Engineering & Physics 30 (2008) 1149–1158 1155
Fig. 5. Simulated and measured pump inlet and outlet pressures: (a) control experiment; (b) experiment with increased roller pump speed; (c) experimentwith increased inlet resistance; (d) experiment with increased outlet resistance; (e) experiment with decreased degree of occlusion; f) experiment with furtherdecreased degree of occlusion and increased pump speed (see also Table 2 for details).
1156 F. Moscato et al. / Medical Engineering & Physics 30 (2008) 1149–1158
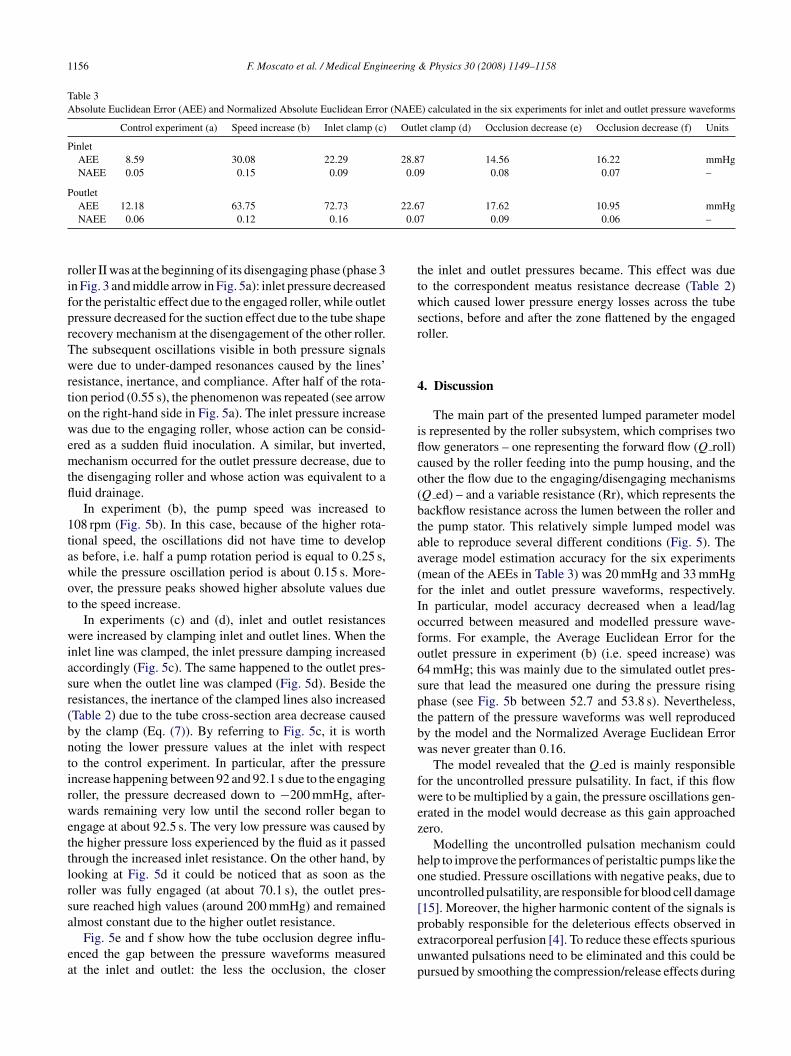
Table 3Absolute Euclidean Error (AEE) and Normalized Absolute Euclidean Error (NAEE) calculated in the six experiments for inlet and outlet pressure waveforms
Control experiment (a) Speed increase (b) Inlet clamp (c) Outlet clamp (d) Occlusion decrease (e) Occlusion decrease (f) Units
PinletAEE 8.59 30.08 22.29 28.87 14.56 16.22 mmHgNAEE 0.05 0.15 0.09 0.09 0.08 0.07 –
Poutlet22.6
0.0
rifprTwrtowemtfl
1tawot
wiasr(bntirwettlrsa
ea
ttwsr
4
iflco(btaa(fIofo6sptbw
fwez
hou[
AEE 12.18 63.75 72.73NAEE 0.06 0.12 0.16
oller II was at the beginning of its disengaging phase (phase 3n Fig. 3 and middle arrow in Fig. 5a): inlet pressure decreasedor the peristaltic effect due to the engaged roller, while outletressure decreased for the suction effect due to the tube shapeecovery mechanism at the disengagement of the other roller.he subsequent oscillations visible in both pressure signalsere due to under-damped resonances caused by the lines’
esistance, inertance, and compliance. After half of the rota-ion period (0.55 s), the phenomenon was repeated (see arrown the right-hand side in Fig. 5a). The inlet pressure increaseas due to the engaging roller, whose action can be consid-
red as a sudden fluid inoculation. A similar, but inverted,echanism occurred for the outlet pressure decrease, due to
he disengaging roller and whose action was equivalent to auid drainage.
In experiment (b), the pump speed was increased to08 rpm (Fig. 5b). In this case, because of the higher rota-ional speed, the oscillations did not have time to develops before, i.e. half a pump rotation period is equal to 0.25 s,hile the pressure oscillation period is about 0.15 s. More-ver, the pressure peaks showed higher absolute values dueo the speed increase.
In experiments (c) and (d), inlet and outlet resistancesere increased by clamping inlet and outlet lines. When the
nlet line was clamped, the inlet pressure damping increasedccordingly (Fig. 5c). The same happened to the outlet pres-ure when the outlet line was clamped (Fig. 5d). Beside theesistances, the inertance of the clamped lines also increasedTable 2) due to the tube cross-section area decrease causedy the clamp (Eq. (7)). By referring to Fig. 5c, it is worthoting the lower pressure values at the inlet with respecto the control experiment. In particular, after the pressurencrease happening between 92 and 92.1 s due to the engagingoller, the pressure decreased down to −200 mmHg, after-ards remaining very low until the second roller began to
ngage at about 92.5 s. The very low pressure was caused byhe higher pressure loss experienced by the fluid as it passedhrough the increased inlet resistance. On the other hand, byooking at Fig. 5d it could be noticed that as soon as theoller was fully engaged (at about 70.1 s), the outlet pres-ure reached high values (around 200 mmHg) and remained
lmost constant due to the higher outlet resistance.Fig. 5e and f show how the tube occlusion degree influ-nced the gap between the pressure waveforms measuredt the inlet and outlet: the less the occlusion, the closer
peup
7 17.62 10.95 mmHg7 0.09 0.06 –
he inlet and outlet pressures became. This effect was dueo the correspondent meatus resistance decrease (Table 2)hich caused lower pressure energy losses across the tube
ections, before and after the zone flattened by the engagedoller.
. Discussion
The main part of the presented lumped parameter models represented by the roller subsystem, which comprises twoow generators – one representing the forward flow (Q roll)aused by the roller feeding into the pump housing, and thether the flow due to the engaging/disengaging mechanismsQ ed) – and a variable resistance (Rr), which represents theackflow resistance across the lumen between the roller andhe pump stator. This relatively simple lumped model wasble to reproduce several different conditions (Fig. 5). Theverage model estimation accuracy for the six experimentsmean of the AEEs in Table 3) was 20 mmHg and 33 mmHgor the inlet and outlet pressure waveforms, respectively.n particular, model accuracy decreased when a lead/lagccurred between measured and modelled pressure wave-orms. For example, the Average Euclidean Error for theutlet pressure in experiment (b) (i.e. speed increase) was4 mmHg; this was mainly due to the simulated outlet pres-ure that lead the measured one during the pressure risinghase (see Fig. 5b between 52.7 and 53.8 s). Nevertheless,he pattern of the pressure waveforms was well reproducedy the model and the Normalized Average Euclidean Erroras never greater than 0.16.The model revealed that the Q ed is mainly responsible
or the uncontrolled pressure pulsatility. In fact, if this flowere to be multiplied by a gain, the pressure oscillations gen-
rated in the model would decrease as this gain approachedero.
Modelling the uncontrolled pulsation mechanism couldelp to improve the performances of peristaltic pumps like thene studied. Pressure oscillations with negative peaks, due toncontrolled pulsatility, are responsible for blood cell damage15]. Moreover, the higher harmonic content of the signals is
robably responsible for the deleterious effects observed inxtracorporeal perfusion [4]. To reduce these effects spuriousnwanted pulsations need to be eliminated and this could beursued by smoothing the compression/release effects during
eering
tamsp
caap
flawtaop
pobap
otmFac
5
w(t(iat
ufv
ptFhnea
C
ripm
R
[
[
[
[
[
[
[[
F. Moscato et al. / Medical Engin
he engaging/disengaging phases. Different geometry for thengle α or the pump housing could be designed, as well asodifications of the number of rollers and the rotating arm
peed during the engaging/disengaging phases. Some of suchossible roller pumps’ modifications are reported in [21–23].
By identifying among the model parameters those thatan influence the pressure pulsation, and by modifying themppropriately, the model could be used to test, on a numericalnd functional basis, improvements to reduce the pressureulsations.
Certain aspects of the present study should be noted.This preliminary study could be completed by measuring
ows at the inlet and the outlet pump sections. Moreover,n improvement for carrying out reproducible experimentsill be the use of servo valves, instead of screw clamp resis-
ances, at the inlet/outlet lines. Given the flow measurementsnd reproducible hydraulic loads for the pump, numericalptimization algorithms could be used to determine modelarameters.
These aspects limit the presented model to a non-redictive one. Because of these reasons, the distributionf estimates and quantification of estimation errors over aroad range of parameter values (pump speed, occlusion ratend hydraulic load variations) were not investigated in theresented study.
It must be noted, however, that the important step forwardf the presented study is the roller pump model architec-ure. The main impact of this finding is that the generation
echanism of unwanted pressure pulsation was revealed.urthermore, we believe that using this model architecturend a more complete experimental setup a predictive modelould be sought.
. Conclusions
A simple and effective dynamical model of a roller pumpas presented. It has been elucidated that the roller subsystem
Fig. 4) was responsible for the unwanted pressure pulsa-ion generation. The tube compression/release mechanismactuated by the rollers during their engaging and disengag-ng phases) caused the pressure at the pump inlet/outlet tobruptly increase/decrease thus triggering pressure oscilla-ions.
This model thus revealed the generation mechanism of thencontrolled pressure pulsatility, which could be exploitedor designing improved roller-type peristaltic pumps pro-ided with more physiologic pumping.
Speculations about possible future improvements of rollerumps should focus on the engaging/disengaging phases ofhe rollers by smoothing the tube compression/release effects.or example, different geometry for the angle α or the pump
ousing could be designed, as well as modifications of theumber of rollers and the rotating arm speed during thengaging/disengaging phases. Every improvement must thenim at reducing the Q ed contribution.[
[
& Physics 30 (2008) 1149–1158 1157
onflict of interest
The authors do not have any financial and personalelationships with other people or organisations that couldnappropriately influence (bias) the work entitled “Pressureulsation in roller pumps: A validated lumped parameterodel”.
eferences
[1] Mejak BL, Stammers A, Rauch E, Vang S, Viessman T. A retro-spective study on perfusion incidents and safety devices. Perfusion2000;15(1):51–61.
[2] Parolari A, Alamanni F, Naliato M, Spirito R, Franze V, Pompilio G,et al. Adult cardiac surgery outcomes: role of the pump type. Eur JCardiothorac Surg 2000;18(5):575–82.
[3] Cooley DA. Development of the roller pump for use in the cardiopul-monary bypass circuit. Tex Heart Inst J 1987;14(2):112–8.
[4] Dougherty FC, Donovan Jr FM, Townsley MI. Harmonic analysis ofperfusion pumps. J Biomech Eng 2003;125(6):814–22.
[5] Briceno JC, Runge TM. Tubing spallation in extracorporeal circuits.An in vitro study using an electronic particle counter. Int J Artif Organs1992;14(4):222–8.
[6] Peek GJ, Thompson A, Killer HM, Firmin RK. Spallation perfor-mance of extracorporeal membrane oxygenation tubing. Perfusion2000;15(5):457–66.
[7] Wheeldon DR, Bethune DW, Gill RD. Vortex pumping for routinecardiac surgery: a comparative study. Perfusion 1990;5(2):135–43.
[8] Moen O, Fosse E, Braten J, Andersson C, Hogasen K, Mollnes TE, et al.Differences in blood activation related to roller/centrifugal pumps andheparin-coated/uncoated surfaces in a cardiopulmonary bypass modelcircuit. Perfusion 1996;11(2):113–23.
[9] Schulz S, Bauernschmitt R, Albers J, Riesenberg A, Schwarzhaupt A,Vahl CF, et al. A mathematical high time resolution model of the arte-rial system under extracorporeal circulation. Biomed Sci Instrument1997;33:406–11.
10] Bauernschmitt R, Naujokat E, Mehmanesh H, Schulz S, Vahl CF,Hagl S, et al. Mathematical modelling of extracorporeal circulation:simulation of different perfusion regimens. Perfusion 1999;14(5):321–30.
11] Anbe J, Tobi T, Nakajima H, Akasaka T, Okinaga K. Microcomputer-based automatic regulation of extracorporeal circulation: a trialfor the application of fuzzy inference. Artif Organs 1992;16(5):532–8.
12] Boschetti F, Montevecchi FM, Fumero R. Virtual extracorporeal circu-lation process. Int J Artif Organs 1997;20(6):341–51.
13] Schwarzhaupt A, Schulz S, Bauernschmitt R, Kiencke U. Simulation ofhuman circulation at cardiopulmonary bypass. Biomed Sci Instrument1997;34:275–80.
14] Pennati G, Fiore GB, Lagana K, Fumero R. Mathematical modelingof fluid dynamics in pulsatile cardiopulmonary bypass. Artif Organs2004;28(2):196–209.
15] Mulholland JW, Shelton JC, Luo XY. Blood flow and damage bythe roller pumps during cardiopulmonary bypass. J Fluid Struct2005;20:129–40.
16] Beranek LL. Acoustics. Acoustical Society of America; 1996.17] Rideout VC, Dick DE. Difference-differential equations for fluid
flow in distensible tubes. IEEE Trans Biomed Eng 1967;14(3):171–7.
18] Idelchik IE.Handbook of hydraulic resistance. 3rd ed. Begell HousePublishers; 2001.
19] Jager GN, Noordergraaf A, Westerhof N. Oscillatory flow impedancein electric analog of arterial system. Circ Res 1965;16:121–33.

1 eering
[
[
158 F. Moscato et al. / Medical Engin
20] Rong Li X, Zhao Z. Evaluation of estimation algorithms part I: incom-prehensive measures of performance. IEEE Trans Aerosp Elect Syst2006;42(4):1340–58.
21] Minarik D, Beck JE, Inventors; Peristaltic pump having means forreducing flow pulsation, patent WO9408138; 1994.
[
[
& Physics 30 (2008) 1149–1158
22] Hirano T, Daiho K, Inventors; Analyzing instrument, patentJP70200009; 1995.
23] Kanda H, Tashiro H, Kato H, Inventors; Perfusion sucking instrument,patent JP2001170062; 2001.
Copyright © 2022 FDOKUMEN