A Rapid, Validated RP-HPLC Method for the Determination of ...
11
Pharmacology & Pharmacy, 2014, 5, 298-308 Published Online March 2014 in SciRes. http://www.scirp.org/journal/pp http://dx.doi.org/10.4236/pp.2014.53037 How to cite this paper: Al-Kaseem, M., et al. (2014) A Rapid, Validated RP-HPLC Method for the Determination of Seven Volatile N-Nitrosamines in Meat. Pharmacology & Pharmacy, 5, 298-308. http://dx.doi.org/10.4236/pp.2014.53037 A Rapid, Validated RP-HPLC Method for the Determination of Seven Volatile N-Nitrosamines in Meat Mohammad Al-Kaseem 1 , Zaid Al-Assaf 1 , François Karabeet 2 1 Department of Analytical and Food Chemistry, Faculty of Pharmacy, Damascus University, Damascus, Syria 2 Department of Chemistry, Faculty of Science, Damascus University, Damascus, Syria Email: [email protected] Received 19 December 2013; revised 22 February 2014; accepted 14 March 2014 Copyright © 2014 by authors and Scientific Research Publishing Inc. This work is licensed under the Creative Commons Attribution International License (CC BY). http://creativecommons.org/licenses/by/4.0/ Abstract The present work reports a rapid reversed-phase high-performance liquid chromatography (RP-HPLC) method for the determination of seven volatile N-nitrosamines namely N-nitrosodi- methylamine (NDMA), N-nitrosomethylethylamine (NMEA), N-nitrosodiethylamine (NDEA), N-ni- trosodiproylamine (NDPA), N-nitrosodi butylamine (NDBA), N-nitrosopiperidine (NPIP) and N-nitrosopyrrolidine (NPYR) for monitoring food safety. A strategic experimental approach was implemented for the method development. The desired chromatographic separation was achieved on a Symmetry C18 (4.6 × 150 mm, 5 µm) column using gradient elution. The optimized mobile phase consisted of the 10 mM ammonium hydroxide pH = 8.9 and acetonitrile. The eluted com- pounds were monitored at 231 nm wavelength using spectrophotometric detector. The developed method separated seven compounds from each other within a run time of 10 min. The method is effective for the determination of presence of these carcinogenic compounds. The average extrac- tion recovery of seven nitrosamines was found 84.5%; the precision of method was found less than 2.7% and accuracy was found between 95% - 102.5%. The assay could be applied in food monitoring safety. Keywords N-Nitrosamines; Rp-HPLC; Food Safety 1. Introduction Nitrosamines form a large group of genotoxic chemical carcinogens which occur in the human diet and other
-
Upload
khangminh22 -
Category
Documents
-
view
0 -
download
0
Transcript of A Rapid, Validated RP-HPLC Method for the Determination of ...
Pharmacology & Pharmacy, 2014, 5, 298-308 Published Online March 2014 in SciRes. http://www.scirp.org/journal/pp http://dx.doi.org/10.4236/pp.2014.53037
How to cite this paper: Al-Kaseem, M., et al. (2014) A Rapid, Validated RP-HPLC Method for the Determination of Seven Volatile N-Nitrosamines in Meat. Pharmacology & Pharmacy, 5, 298-308. http://dx.doi.org/10.4236/pp.2014.53037
A Rapid, Validated RP-HPLC Method for the Determination of Seven Volatile N-Nitrosamines in Meat Mohammad Al-Kaseem1, Zaid Al-Assaf1, François Karabeet2 1Department of Analytical and Food Chemistry, Faculty of Pharmacy, Damascus University, Damascus, Syria 2Department of Chemistry, Faculty of Science, Damascus University, Damascus, Syria Email: [email protected] Received 19 December 2013; revised 22 February 2014; accepted 14 March 2014
Copyright © 2014 by authors and Scientific Research Publishing Inc. This work is licensed under the Creative Commons Attribution International License (CC BY). http://creativecommons.org/licenses/by/4.0/
Abstract The present work reports a rapid reversed-phase high-performance liquid chromatography (RP-HPLC) method for the determination of seven volatile N-nitrosamines namely N-nitrosodi- methylamine (NDMA), N-nitrosomethylethylamine (NMEA), N-nitrosodiethylamine (NDEA), N-ni- trosodiproylamine (NDPA), N-nitrosodi butylamine (NDBA), N-nitrosopiperidine (NPIP) and N-nitrosopyrrolidine (NPYR) for monitoring food safety. A strategic experimental approach was implemented for the method development. The desired chromatographic separation was achieved on a Symmetry C18 (4.6 × 150 mm, 5 µm) column using gradient elution. The optimized mobile phase consisted of the 10 mM ammonium hydroxide pH = 8.9 and acetonitrile. The eluted com- pounds were monitored at 231 nm wavelength using spectrophotometric detector. The developed method separated seven compounds from each other within a run time of 10 min. The method is effective for the determination of presence of these carcinogenic compounds. The average extrac- tion recovery of seven nitrosamines was found 84.5%; the precision of method was found less than 2.7% and accuracy was found between 95% - 102.5%. The assay could be applied in food monitoring safety.
Keywords N-Nitrosamines; Rp-HPLC; Food Safety
1. Introduction Nitrosamines form a large group of genotoxic chemical carcinogens which occur in the human diet and other

M. Al-Kaseem et al.
299
environmental media [1] [2], and can be formed endogenously in the human body [3]. N-nitroso compounds can induce cancer in experimental animals [4]. In foods, nitrosamines are produced from nitrites and secondary amines, which often occur in the form of proteins [5]. Their formation can occur only under certain conditions, including strongly acidic conditions such as that of the human stomach [6]. High temperatures, as in frying, can also enhance the formation of nitrosamines. These processes lead to significant levels of nitrosamines in many foodstuffs [7], especially beer [8], fish, and fish byproducts [9], and also in meat and cheese products preserved with nitrite pickling salt [10]. Nitrosamines can also be found in tobacco smoke, cosmetics, pesticides, and in most rubber products [11] [12]. There are a great number of scientific papers reported in the literature on the presence of volatile nitrosamines in food matrices. In general, these methods recommend the extraction of ni- trosamines from the food matrix by extraction methods, including distillation (steam, vacuum, or atmospheric) [13]-[15], solvent extraction [1], solid-phase extraction [16], solid-phase micro-extraction (SPME) [17], autoc- lave extraction [18], and supercritical fluid extraction (SFE) [19]. Most of the methods comprise two or more clean-up steps, depending on the nitrosamine, the food matrix, and the detection device, and recommend that ni- trosamine formation during sample preparation should be inhibited by adding sulfamic acid, ascorbate, or other nitrosation inhibitors [20]. Several analytical methods have been employed in the past for the quantitative de- termination of nitrosamines in food, including colorimetry, spectrophotometry [21], polarography [22], capillary electro-chromatography [23], micellar electro-kinetic capillary chromatography [24], gas chromatography with flame ionization detection, nitrogen phosphorous detection, thermal energy detection, nitrogen chemilumines- cence detection [25]-[28], and mass spectrometry detection [29]-[31], high-performance liquid chromatography with thermal energy analyzer, mass spectrometry and fluorescence detection, high-performance liquid chroma- tography (HPLC), chemiluminescence method, and chromatography-mass spectrometry [3] [32]. Commonly, there include identical procedures for sample preparation: extraction of N-nitrosamines from a sample (steam or vacuum distillation), multiple extractions of N-nitrosamines from the distillate with methylene chloride, pre- concentration by evaporation, and direct analysis for chromatography-mass spectrometry and chemilumines-cence method [1] [20]. No scientific papers reported using the Reverse-Phase HPLC method and direct UV de-tection when extracting N-nitrosamines by autoclave treatment. However, the literature reveals a very few methods which have been published for quantification of N-nitrosamines in meat products using HPLC with di-rect UV detection and all the reported methods were adopting pre-column or post-column photolysis units or additional derivatization reaction to enhance the light absorbance or to get fluorescent derivatives [3] [8] [20]. First attempts to use HPLC for the determination of N-nitrosamines included reversed-phase HPLC with the UV detection of 7-chloro-4-nitrobenzo-2-oxa-1,3-diazole (NBD chloride), 8-methoxy-5-quinolinesulfonylaziridine (QAZ) or 5-dimethylamino-1-naphthalenesulfonyl chloride (dansyl chloride) derivatives of secondary amines obtained on the denitrosation of N-nitrosamines [32]. Some authors proposed to use post-column photolysis and derivatization. N-nitrosamines are separated from the sample matrix using reversed-phase liquid chromatogra-phy. The N-nitroso bond is cleaved by UV photolysis with the formation of nitrite ion then the nitrite is diazo-tized with sulfanilamide in an acid medium (according to the Griess reaction), and is then coupled with N-(1-naphthyl) ethylenediamine dihydrochloride (NED) to form a purple-coloured azo dye that is quantitatively determined spectrophotometrically at a maximum wavelength, λmax, of 540 nm [1] [32].
The aim of this work was the development of a RP-HPLC with direct UV-detection method for the determi- nation of traces of seven volatile n-nitrosamines simultaneously from meat samples after previous autoclaving treatment [18]. The developed method was validated according to International Conference on Harmonization (ICH) guidelines to show the capability of the method [33].
2. Methods 2.1. Materials EPA 521 nitrosamine mix standard was purchased from Supleco (USA), this solution contained seven analytes at 2000 µg/mL of each: N-nitrosodimethylamine (NDMA), N-nitrosomethylethylamine (NMEA), N-nitroso-die- thylamine (NDEA), N-nitrosopyrrolidine (NPYR), N-nitrosodin-propylamine (NDPA), N-nitrosopiperidine (NPIP) and N-nitrosodi-n-butylamine (NDBA), and individual standards to each of the Nitrosamines with a concentration of 5000 µg/mL from Sigma Aldrich. For sample preparation, sodium hydroxide, ethanol, octane and dichloromethane (DCM) were purchased from Sigma-Aldrich (USA). All other chemicals (ascorbic acid, anhydrous sodium sulfate and sodium chloride) used in this research were of analytical laboratory grade aceto-
M. Al-Kaseem et al.
300
nitrile, Methanol, and water (HPLC grade), ammonium hydroxide acid and HPLC water were obtained from Sigma Aldrich (USA). The 0.22 µm PVDF syringe filter was purchased from Millipore (India). Raw meat sam- ples purchased from local supermarkets in Damascus.
2.2. Apparatus Pyrex tubes (20 ml) with heat-stable Teflon-lined caps were used. Glass column (30 cm × 1.5 cm). Kuderna Danish (KD) concentrator was used for the concentration of organic solvents. Autoclave (Selecta, Spain, 4001757). CAMAG UV Lamp dual wavelength, 254/366 nm, 2 × 8 watt in combination (Switzerland). KNAUER® HPLC system (KNAUER®, Germany), consisting of smart line manager, sample manager, and smartline UV detector 2500. System control, data collection, and data processing were accomplished using Eu- rochromTM chromatography data software.
2.3. Chromatographic Conditions The chromatographic condition was optimized using the Knauer Symmetry C18, 5 µm (100 mm × 4.6 mm) column. A solvent A is 10 mM Ammonium hydroxide and acetonitrile as solvent B. This was then filtered through a 0.22 µm PVDF membrane filter and degassed under vacuum prior to use. The separation of all com- ponents was achieved by gradient elution using solvent A and B. Solution A was used as diluent. The final se- lected and optimized conditions were as follows; injection volume 20 µL, gradient elution (solvent B from 0 to 90% during 10 min then maintained to the end of the run), at a flow rate of 1.0 mL/min at 80˚C (column oven) temperature, detection wavelength 231 nm, and sample temperature 15˚C. Under these conditions, the back-pressure in the system was about 2500 psi.
2.4. Sample Preparation Extraction of N-nitrosamines was performed using the same method as our previous work [18] with a modifica- tion at the end. Approximately 6 grams of meat sample was placed in the Pyrex tube into which 10 mL of so- dium hydroxide 1N was poured. The tube was capped tightly and autoclaved at 121˚C for 10 min. After being allowed to stand at room temperature, the autoclaved solution was transferred to 50 mL separatory funnel. The tubes was rinsed twice with 5 mL of ethanol and then 10 mL of dichloromethane, and the rinsing solutions and 10 mL of 10% aqueous sodium chloride were combined with the original extract in the separatory funnel. After being shaken, the dichloromethane layer was collected, and the water layer was re-extracted with 10 ml of dich- loromethane. The dichloromethane extracts were combined, dried over anhydrous sodium sulfate and concen- trated to approximately 0.5 mL using KD concentrator and nitrogen gas flow. The concentrate was loaded onto a silica gel column (30 cm × 1.5 cm) (equilibrated with dichloromethane) and the column was eluted with 10 ml of dichloromethane. After the addition of 100 µL of octane (to prevent exsiccation of the solvent), the elute was concentrated to 1 mL using KD concentrator and nitrogen gas then extracting 3 mL methanol. This was repeated three times. The combined methanol extracts were concentrated to about 100 µL under a nitrogen stream.
2.5. Preparation of N-Nitrosamine Mix Standard A series of working standard solutions were prepared by appropriate dilution of the EPA 521 nitrosamine mix with solvent A and stored at –20˚C before use. From the primary stock solution 2000 µg/mL of each nitrosamine, a 1/50 dilution was done to get 40 µg/mL secondary stock solution of each nitrosamine. Sequentially dilute sec- ondary stock solution was performed to get standards titrating at 0.5, 1, 2.5, 5, 7.5,10, and 15 µg/mL in 100 mL volumetric flasks, these solutions kept in the absence of light.
3. Results and Discussions 3.1. Method Development and Optimization The main criteria for development of a RP-HPLC method for the determination of seven N-nitrosamine com- pounds in raw meat and the method should be able to quantify all seven compounds in a single run and should be accurate, precise, linear, free of interference from blank, and enough for the routine use in quality control la- boratories. Preliminary experiments were carried out until separation was achieved on C18 using injection vo-

M. Al-Kaseem et al.
301
lume of 20 µL, gradient elution (solvent B from 0% to 90% during 10 min then maintained to the end of the run), at a flow rate of 1.0 mL/min at 80˚C (column oven) temperature, detection wavelength 231 nm, and sample temperature 15˚C, slight low response and some base line disturbance for nitrosamines was observed when ana- lyzing the samples. Therefore, a slight modification on sample preparation was done by extracting the nitrosa- mines with methanol as mentioned in sample preparation. The peak shape and response of all nitrosamines were improved. Finally, satisfactory result was achieved in 10 minutes with flow rate of 1.0 mL/min of the mobile phase. In order to judge the suitability of method for determining the N-nitrosodimethylamine (NDMA), N-ni- trosomethylethylamine (NMEA), N-nitrosodiethylamine (NDEA), N nitrosopyrrolidine (NPYR), N-nitrosodin- propylamine (NDPA), N-nitrosopiperidine (NPIP) and N-nitrosodi-n-butylamine (NDBA) traces in meat, the method was validated as per the ICH guideline for specificity, limit of detection, limit of quantification, linearity, accuracy and precision [33]. The matrix effect was studied by comparing the slope of the aqueous standards and standard additions calibration graphs obtained for the meat samples, no statistically differences were observed, and so quantification was carried out by external calibration. Calibration curves were obtained by least squares linear regression analysis for the peak area versus the analyte concentration using six concentration levels in du- plicate. The method was validated to demonstrate that it is suitable for its intended purpose by the standard pro- cedure to evaluate adequate validation characteristics. Retention times of selected N-nitrosamines were deter- mined by using standard solutions of each nitrosamine. Figure 1 shows the chromatogram obtained by HPLC- UV of unspiked meat sample.
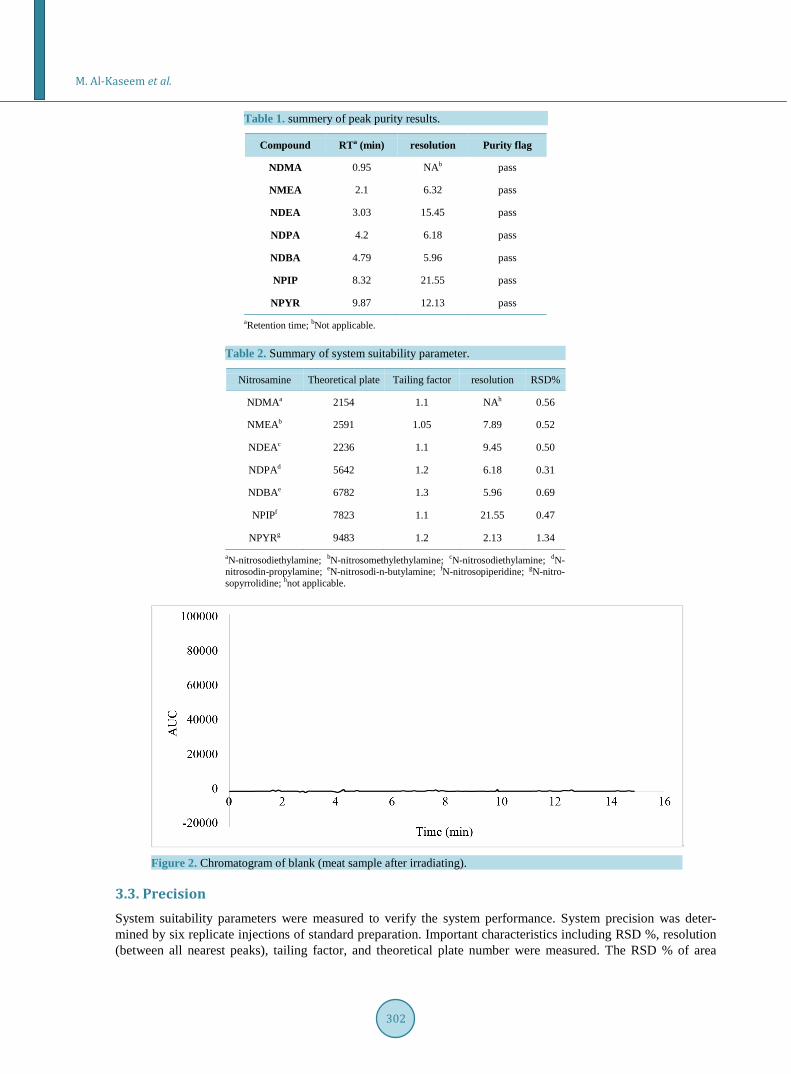
3.2. Specificity/Selectivity Specificity is the ability of the method to measure the analyte response in the presence of diluent. Figures 1 and 2 show that there is no interference at the RT (retention time) for all seven nitrosamine compounds due to the blank, and Table 1 shows the summery peak purity results. To assess the ability of the method, Mix standard solution were prepared with known amounts of NDMA, NMEA, NDEA, NPYR, NDPA, NPIP, NDBA, and in-jected into the HPLC and the chromatograms were recorded. The sample (raw meat) solution was prepared as per the methodology and injected into the chromatograph (control sample). The sample shows no peaks either due to any nitrosamines. So it reveals that the raw meat (control sample) is free from nitrosamines under inves-tigation. Therefore the sample extract was spiked with known amount of each nitrosamine reference standard at target level (1 µg/ml), and injected into the chromatograph (Spiked sample). The relative retention time for NDMA, NMEA, NDEA, NPYR, NDPA, NPIP and NDBA is shown in Table 2. The resolution between the nearest compounds peak (NDPA and NDBA) was found to be 5.96 Therefore, no interference of blank was ob-served corresponding to any of nitrosamines. Therefore, the selectivity of the method was judged from the ab-sence from the interfering peaks (false peaks) at the analyte elution times for blank chromatograms of different unspiked samples after irradiating them to UV light (wavelength 366 nanometer) for three hours to destroy ni-trosamines if they are present [34]. The original signals were wrongly positive if the signals from the samples are not remarkably diminished after the irradiation. No matrix compounds existed that might give a false posi- tive signal to the blank samples as shown in Figure 2.
Figure 1. Chromatogram of meat sample (unspiked and before irradiating).
M. Al-Kaseem et al.
302
Table 1. summery of peak purity results.
Compound RTa (min) resolution Purity flag
NDMA 0.95 NAb pass
NMEA 2.1 6.32 pass
NDEA 3.03 15.45 pass
NDPA 4.2 6.18 pass
NDBA 4.79 5.96 pass
NPIP 8.32 21.55 pass
NPYR 9.87 12.13 pass
aRetention time; bNot applicable.
Table 2. Summary of system suitability parameter.
Nitrosamine Theoretical plate Tailing factor resolution RSD%
NDMAa 2154 1.1 NAh 0.56
NMEAb 2591 1.05 7.89 0.52
NDEAc 2236 1.1 9.45 0.50
NDPAd 5642 1.2 6.18 0.31
NDBAe 6782 1.3 5.96 0.69
NPIPf 7823 1.1 21.55 0.47
NPYRg 9483 1.2 2.13 1.34 aN-nitrosodiethylamine; bN-nitrosomethylethylamine; cN-nitrosodiethylamine; dN- nitrosodin-propylamine; eN-nitrosodi-n-butylamine; fN-nitrosopiperidine; gN-nitro- sopyrrolidine; hnot applicable.
Figure 2. Chromatogram of blank (meat sample after irradiating).
3.3. Precision System suitability parameters were measured to verify the system performance. System precision was deter- mined by six replicate injections of standard preparation. Important characteristics including RSD %, resolution (between all nearest peaks), tailing factor, and theoretical plate number were measured. The RSD % of area
M. Al-Kaseem et al.
303
counts of six replicate injections for all N-nitrosamine peaks were below 2.0%, and the resolution between the two nearest peaks was better than 1.5. These indicate that the system is precise and suitable for determination of all seven N-nitrosamine compounds. The results obtained are shown in Table 2. The parameters all complied with the acceptance criteria and system suitability was established.
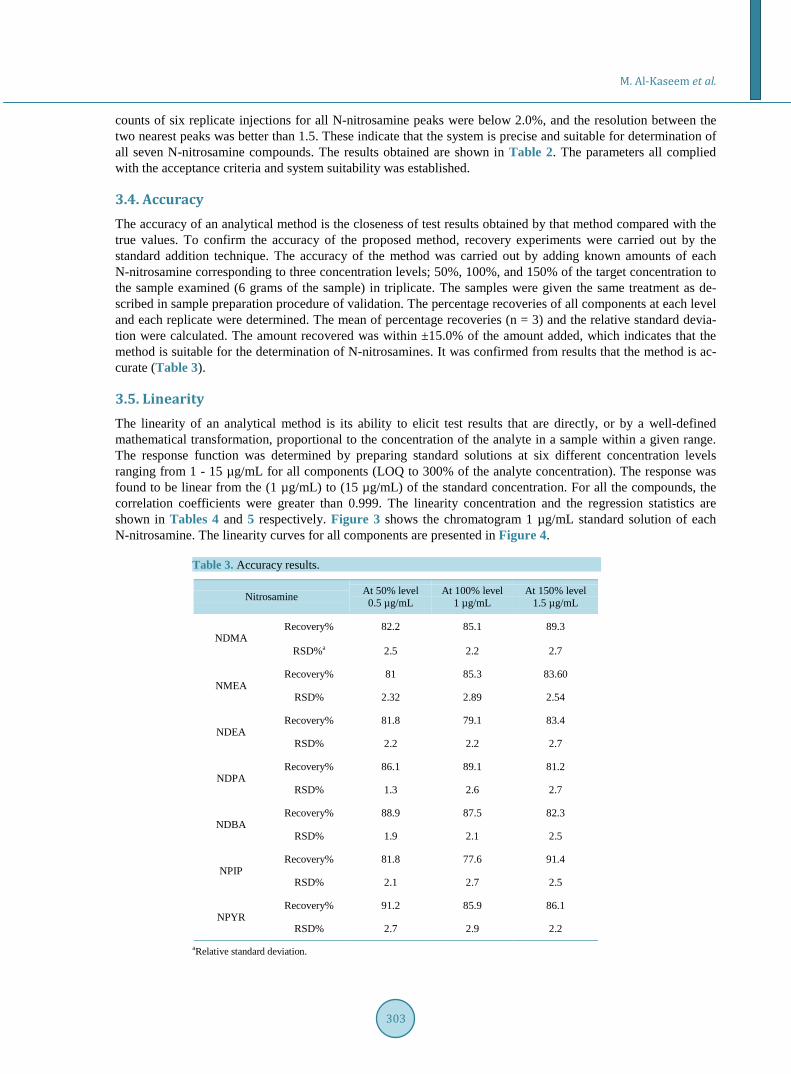
3.4. Accuracy The accuracy of an analytical method is the closeness of test results obtained by that method compared with the true values. To confirm the accuracy of the proposed method, recovery experiments were carried out by the standard addition technique. The accuracy of the method was carried out by adding known amounts of each N-nitrosamine corresponding to three concentration levels; 50%, 100%, and 150% of the target concentration to the sample examined (6 grams of the sample) in triplicate. The samples were given the same treatment as de- scribed in sample preparation procedure of validation. The percentage recoveries of all components at each level and each replicate were determined. The mean of percentage recoveries (n = 3) and the relative standard devia- tion were calculated. The amount recovered was within ±15.0% of the amount added, which indicates that the method is suitable for the determination of N-nitrosamines. It was confirmed from results that the method is ac- curate (Table 3).
3.5. Linearity The linearity of an analytical method is its ability to elicit test results that are directly, or by a well-defined mathematical transformation, proportional to the concentration of the analyte in a sample within a given range. The response function was determined by preparing standard solutions at six different concentration levels ranging from 1 - 15 µg/mL for all components (LOQ to 300% of the analyte concentration). The response was found to be linear from the (1 µg/mL) to (15 µg/mL) of the standard concentration. For all the compounds, the correlation coefficients were greater than 0.999. The linearity concentration and the regression statistics are shown in Tables 4 and 5 respectively. Figure 3 shows the chromatogram 1 µg/mL standard solution of each N-nitrosamine. The linearity curves for all components are presented in Figure 4.
Table 3. Accuracy results.
Nitrosamine At 50% level 0.5 µg/mL
At 100% level 1 µg/mL
At 150% level 1.5 µg/mL
NDMA Recovery% 82.2 85.1 89.3
RSD%a 2.5 2.2 2.7
NMEA Recovery% 81 85.3 83.60
RSD% 2.32 2.89 2.54
NDEA Recovery% 81.8 79.1 83.4
RSD% 2.2 2.2 2.7
NDPA Recovery% 86.1 89.1 81.2
RSD% 1.3 2.6 2.7
NDBA Recovery% 88.9 87.5 82.3
RSD% 1.9 2.1 2.5
NPIP Recovery% 81.8 77.6 91.4
RSD% 2.1 2.7 2.5
NPYR Recovery% 91.2 85.9 86.1
RSD% 2.7 2.9 2.2
aRelative standard deviation.

M. Al-Kaseem et al.
304
Table 4. Linearity concentrations.
Series Number Sample ID Concentration µg/mL
1 LOQ Solution 1
2 50% of linearity level 2.5
3 100% of linearity level 5
4 150% of linearity level 7.5
5 200% of linearity level 10
6 300% of linearity level 15
Table 5. Linearity Statistics.
Compound Linearity Range (µg/mL)
Correlation Coefficient R2 Linearity Equation
NDMA 1.02 - 15.30 0.9998 y = 4804.1x − 105.69
NMEA 1.02 - 15.54 0.9999 y = 6122.8x − 105.69
NDEA 1.04 - 15.53 0.9997 y = 4954x + 189.51
NDPA 1.04 - 15.53 0.9999 y = 10287x + 227.23
NDBA 1.05 - 15.75 0.9989 y = 11098x + 229.09
NPIP 1.03 - 15.45 0.9998 y = 5096.4x + 61.356
NPYR 1.02 - 15.30 0.9999 y = 12444x + 257.85
Figure 3. Chromatogram of composite N-nitrosamines standard (1 µg/ml of each nitrosamine).

M. Al-Kaseem et al.
305
Figure 4. Linearity curves of tested N-nitrosamines.
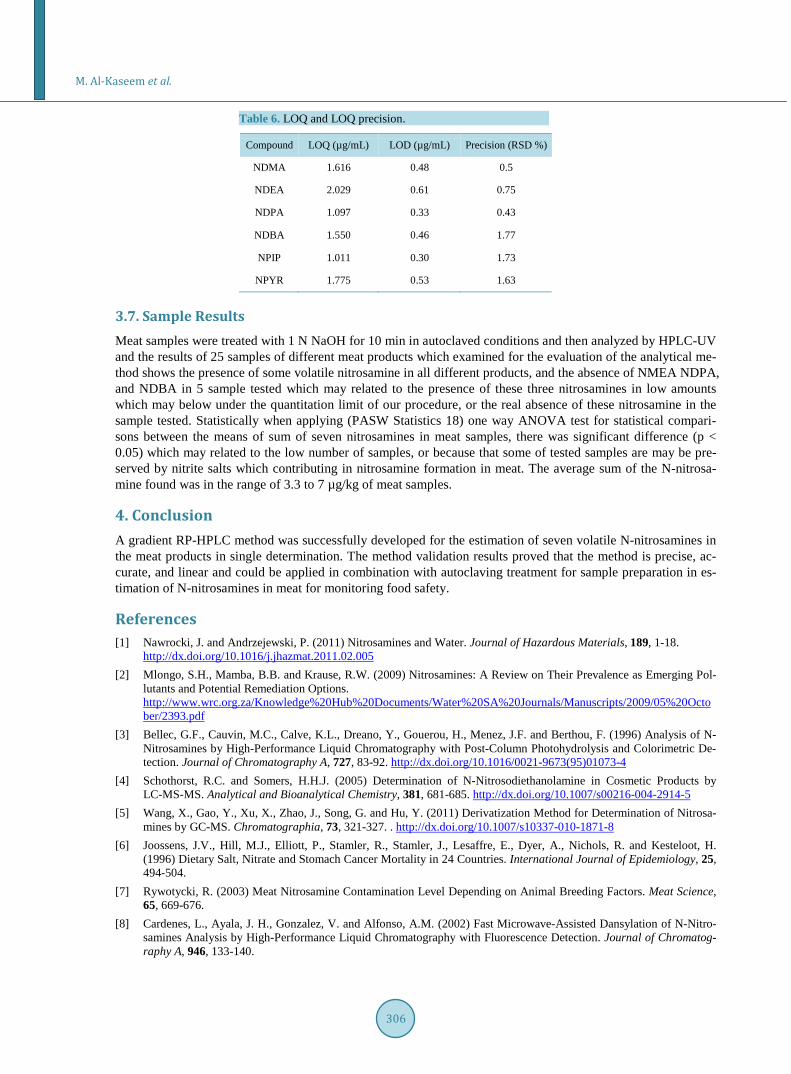
3.6. Limit of Quantification (LOQ) and Limit of Detection (LOD) The signal-to-noise ratio (S/N) method was adopted for the determination of the lower limit of quantification. The limit of quantification is estimated to be ten times the S/N ratio, limit of detection is estimated to be three times of S/N ratio. The quantification limit was achieved by injecting a series of possible dilute solutions of all components and the precision was established at the quantification level. The RSD % of peak areas was well within the acceptance limit, not more than 10%. The determined lower limit of qualification and precision at LOQ values for all components are presented in Table 6.
M. Al-Kaseem et al.
306
Table 6. LOQ and LOQ precision.
Compound LOQ (µg/mL) LOD (µg/mL) Precision (RSD %)
NDMA 1.616 0.48 0.5
NDEA 2.029 0.61 0.75
NDPA 1.097 0.33 0.43
NDBA 1.550 0.46 1.77
NPIP 1.011 0.30 1.73
NPYR 1.775 0.53 1.63
3.7. Sample Results Meat samples were treated with 1 N NaOH for 10 min in autoclaved conditions and then analyzed by HPLC-UV and the results of 25 samples of different meat products which examined for the evaluation of the analytical me- thod shows the presence of some volatile nitrosamine in all different products, and the absence of NMEA NDPA, and NDBA in 5 sample tested which may related to the presence of these three nitrosamines in low amounts which may below under the quantitation limit of our procedure, or the real absence of these nitrosamine in the sample tested. Statistically when applying (PASW Statistics 18) one way ANOVA test for statistical compari- sons between the means of sum of seven nitrosamines in meat samples, there was significant difference (p < 0.05) which may related to the low number of samples, or because that some of tested samples are may be pre- served by nitrite salts which contributing in nitrosamine formation in meat. The average sum of the N-nitrosa- mine found was in the range of 3.3 to 7 µg/kg of meat samples.
4. Conclusion A gradient RP-HPLC method was successfully developed for the estimation of seven volatile N-nitrosamines in the meat products in single determination. The method validation results proved that the method is precise, ac- curate, and linear and could be applied in combination with autoclaving treatment for sample preparation in es- timation of N-nitrosamines in meat for monitoring food safety.
References [1] Nawrocki, J. and Andrzejewski, P. (2011) Nitrosamines and Water. Journal of Hazardous Materials, 189, 1-18.
http://dx.doi.org/10.1016/j.jhazmat.2011.02.005 [2] Mlongo, S.H., Mamba, B.B. and Krause, R.W. (2009) Nitrosamines: A Review on Their Prevalence as Emerging Pol-
lutants and Potential Remediation Options. http://www.wrc.org.za/Knowledge%20Hub%20Documents/Water%20SA%20Journals/Manuscripts/2009/05%20October/2393.pdf
[3] Bellec, G.F., Cauvin, M.C., Calve, K.L., Dreano, Y., Gouerou, H., Menez, J.F. and Berthou, F. (1996) Analysis of N- Nitrosamines by High-Performance Liquid Chromatography with Post-Column Photohydrolysis and Colorimetric De- tection. Journal of Chromatography A, 727, 83-92. http://dx.doi.org/10.1016/0021-9673(95)01073-4
[4] Schothorst, R.C. and Somers, H.H.J. (2005) Determination of N-Nitrosodiethanolamine in Cosmetic Products by LC-MS-MS. Analytical and Bioanalytical Chemistry, 381, 681-685. http://dx.doi.org/10.1007/s00216-004-2914-5
[5] Wang, X., Gao, Y., Xu, X., Zhao, J., Song, G. and Hu, Y. (2011) Derivatization Method for Determination of Nitrosa- mines by GC-MS. Chromatographia, 73, 321-327. . http://dx.doi.org/10.1007/s10337-010-1871-8
[6] Joossens, J.V., Hill, M.J., Elliott, P., Stamler, R., Stamler, J., Lesaffre, E., Dyer, A., Nichols, R. and Kesteloot, H. (1996) Dietary Salt, Nitrate and Stomach Cancer Mortality in 24 Countries. International Journal of Epidemiology, 25, 494-504.
[7] Rywotycki, R. (2003) Meat Nitrosamine Contamination Level Depending on Animal Breeding Factors. Meat Science, 65, 669-676.
[8] Cardenes, L., Ayala, J. H., Gonzalez, V. and Alfonso, A.M. (2002) Fast Microwave-Assisted Dansylation of N-Nitro- samines Analysis by High-Performance Liquid Chromatography with Fluorescence Detection. Journal of Chromatog-raphy A, 946, 133-140.
M. Al-Kaseem et al.
307
[9] Ventanas, S. and Ruiz, J. (2006) On-Site Analysis of Volatile Nitrosamines in Food Model Systems by Solid-Phase Micro-Extraction Coupled to a Direct Extraction Device. Talanta, 70, 1017-1023.
[10] Yurchenko, S. and Molder, U. (2007) The Occurrence of Volatile N-Nitrosamines in Estonian Meat Products. Food Chemistry, 100, 1713-1721.
[11] Ramos, A.M., Orazio, G.D., Borges, J.H., Rocco, A. and Fanali, S. (2011) Multi-Walled Carbon Nano-Tubes-Disper- sive Solid-Phase Extraction Combined with Nano-Liquid Chromatography for the Analysis of Pesticides in Water Samples. Analytical and Bioanalytical Chemistry, 400, 1113-1123.
[12] Planas, C., Palacios, O., Ventura, F., Rivera, J. and Caixach, J. (2008) Analysis of Nitrosamines in Water by Auto- mated SPE and Isotope Dilution GC/HRMS Occurrence in the Different Steps of a Drinking Water Treatment Plant, and in Chlorinated Samples from a Reservoir and a Sewage Treatment Plant Effluent. Talanta, 76, 906-913.
[13] Association of Official Analytical Chemists (1990) N-Nitrosamines (Volatile) in Fried Bacon. Mineral Oil Vacuum Distillation—Thermal Energy Analyzer Method. No. 982.22, Official Methods of Analysis, 15th Edition.
[14] Greenfield, E.L., Smith, W.J. and Malanovski, A.J. (1982) Mineral Oil Vacuum Distillation for Nitrosamines in Fried Bacon, with Thermal Energy Analyser. Journal of the Association Official Analytical Chemists, 65, 1319-1332.
[15] Telling, G.M., Bryce, T.A. and Althorpe, J.J. (1971) Use of Vacuum Distillation and Gas Chromatography-Mass Spec- trometry for Determining Low Levels of Volatile Nitrosamines in Meat Products. Journal of Agricultural and Food Chemistry, 19, 937-940. http://dx.doi.org/10.1021/jf60177a011
[16] Raoul, S., Gremaud, E., Biaudet, H. and Tureski, R. (1997) Rapid Solid-Phase Extraction Method for the Detection of Volatile Nitrosamines in Food. Journal of Agricultural and Food Chemistry, 45, 4706-4713. http://dx.doi.org/10.1021/jf970232q
[17] Ventanas, S., Martín, D., Estévez, M. and Ruiz, J. (2006) Analysis of Volatile Nitrosamines from a Model System Us- ing SPME-DED at Different Temperatures and Times of Extraction. Food Chemistry, 99, 842-850. http://dx.doi.org/10.1016/j.foodchem.2005.08.035
[18] Al-kaseem, M., Assaf, Z. and Karabeet, F. (2013) Rapid and Simple Extraction Method for Volatile N-Nitrosamines in Meat Products. Pharmacology & Pharmacy, 4, 611-618. http://dx.doi.org/10.4236/pp.2013.48087
[19] Fiddler, W. and Pensabene, J.W. (1996) Supercritical Fluid Extraction of Volatile N-Nitrosamines in Fried Bacon and Its Drippings: Method Comparison. Journal of AOAC International, 79, 895-901.
[20] Nollet, M.L. and Toldra, F. (2009) Handbook of Processed Meats and Poultry Analysis. In: Rath, S. and Reyes, F.G.R., Eds., Nitrosamines, Taylor & Francis Group, New York, 687-702.
[21] Qiang, M., Wei, X.H., Chao, W., Hua, B., Cheng, X.G., Ning, S., Yan, X.L. and Bing, W.J. (2011) Determination of Ten Volatile Nitrosamines in Cosmetics by Gas Chromatography Tandem Mass Spectrometry. Chinese Journal of Analytical Chemistry, 39, 1201-1207. http://dx.doi.org/10.1016/S1872-2040(10)60466-5
[22] Walters, C.L., Johnson, E.M. and Ray, N. (1970) Separation and Detection of Volatile and Non-Volatile N-Nitrosa- mines. Analyst, 95, 1970.
[23] Matyska, M.T., Pesek, J.J. and Yang, L. (2000) Screening Method for Determining the Presence of N-Nitrosodiethano- lamine in Cosmetics by Open-Tubular Capillary Electrochromatography. Journal of Chromatography A, 887, 487-503. http://dx.doi.org/10.1016/S0021-9673(00)00451-9
[24] Filho, P.J.S., Valcarcel, M., Rios, A., Zanin, K.D. and Caramoa, E.B. (2003) Determination of Nitrosamines in Pre- served Sausages by Solid-Phase Extraction-Micellar Electro-Kinetic Chromatography. Journal of Chromatography A, 985, 503-512.
[25] Grebel, J.E. and Suffet, H.I. (2007) Nitrogen-Phosphorus Detection and Nitrogen Chemiluminescence Detection of Volatile Nitrosamines in Water Matrices: Optimization and Performance Comparison. Journal of Chromatography A, 1175, 141-144. http://dx.doi.org/10.1016/j.chroma.2007.09.073
[26] Ozel, M.Z., Gongus, F., Yagci, S., Hamilton, J.F. and Lewis, A.C. (2010) Determination of Volatile Nitrosamines in Various Meat Products Using Comprehensive Gas Chromatography-Nitrogen Chemiluminescence Detection. Food and Chemical Toxicology, 48, 3268-3273. http://dx.doi.org/10.1016/j.fct.2010.08.036
[27] Hfiger, B. and Niessner, R. (1996) Determination of N-Nitrosomethylaniline and Methylaniline in the Gas Phase. Mi- crochimica Acta, 122, 35-44. http://dx.doi.org/10.1007/BF01252403
[28] Incavo, J.A. and Schafer, M.A. (2006) Simplified Method for the Determination of N-Nitrosamines in Rubber Vul- canizates. Analytica Chimica Acta, 557, 256-261. http://dx.doi.org/10.1016/j.aca.2005.10.018
[29] Tsikas, D. (2005) Methods of Quantitative Analysis of the Nitric Oxide Metabolites Nitrite and Nitrate in Human Bio-logical Fluids. Free Radical Research, 39, 797-815. http://dx.doi.org/10.1080/10715760500053651
[30] Dallinga, J.W., Pachen, D.M., Lousberg, A.H., Van Geel, J.A., Houben, G.M., Stockburgger, R.W., Maanen, J.M. and Kleinjans, J.C. (1998) Volatile N-Nitrosamines in Gastric Juice of Patients with Various Conditions of the Gastrointes-

M. Al-Kaseem et al.
308
tinal Tract Determined by Gas Chromatography-Mass Spectrometry and Related to Intragastic pH and Nitrate and Ni- trite Levels. Cancer Letters, 124, 119-125. http://dx.doi.org/10.1016/S0304-3835(97)00467-9
[31] Xia, Y., McGuffey, J.E., Bhattacharyya, S., Sellergren, B., Yilmaz, E. and Wang, L. (2005) Analysis of the Tobacco- Specific Nitrosamine 4-(Methylnitrosamino)-1-(3-Pyridyl)-1-Butanol in Urine by Extraction on a Molecularly Im- printed Polymer Column and Liquid Chromatography/ Atmospheric Pressure Ionization Tandem Mass Spectrometry. Analytical Chemistry, 77, 7639-7645. http://dx.doi.org/10.1021/ac058027u
[32] Komarova, N.V. and Velikanov, A.A. (2001) Determination of Volatile N-Nitrosamines in Food by High-Performance Liquid Chromatography with Fluorescence Detection. Journal of Analytical Chemistry, 56, 359-363. http://dx.doi.org/10.1023/A:1016652213062
[33] (2005) International Conference on Harmonization, Validation of Analytical Procedure, Text and Methodology Q2 (R1), IFPMA, Geneva.
[34] BS ISO 29941 (2010) Condoms—Determination of Nitrosamines Migrating from Natural Rubber Latex Condoms. In-ternational Standards.