DEVELOPMENT AND VALIDATION OF A STABILITY INDICATING RP-HPLC METHOD FOR THE ESTIMATION OF KETOROLAC...
10
IAJPS, 2014, Volume1, Issue (2), 80-89 Srinivas et al ISSN 2349-7750 80 www.iajps.com ISSN 2349-7750 INDO AMERICAN JOURNAL OF PHARMACEUTICAL SCIENCES Available online at: http://www.iajps.com Research Article DEVELOPMENT AND VALIDATION OF A STABILITY INDICATING RP-HPLC METHOD FOR THE ESTIMATION OF KETOROLAC TROMETHAMINE IN DRUG SUBSTANCE AND ITS PHARMACEUTICAL FORMULATIONS Srinivas Ganta* 1 , Dr. S. Vidyadhara 1 , Ramanaiah Ganji 2 , Srilakshmi. V 2 , Ravikumar Kavati 3 1.Department of Pharmaceutical Analysis, Chebrolu Hanumaiah Institute of Pharmaceutical Sciencies, Acharya Nagarjuna University, Andhra Pradesh, India. 2. Department of Chemistry, Acharya Nagarjuna University, Andhra Pradesh, India. 3. S S J College of Pharmacy,V.N Pally,Hyderabad,TS,India. ABSTRACT A rapid and sensitive reverse phase High Performance Liquid Chromatographic [RP-HPLC] method was developed for the estimation of Ketorolac tromethamine [KTT] in pure and its capsule dosage forms. The method was validated as per International Conference on Harmonization [ICH] guidelines. The mobile phase used in this study is a mixture of tetrahydrofuran and monobasic ammonium phosphate buffer (pH-3.0) in the ratio of 30:70% v/v. Stationary phase was waters spherisorb C 8 reverse phase column (250×4.6mm, 5μm) dimensions at 40ºc temperature. The analysis was performed with run time of 10.0 minutes at a flow rate of 1.50ml/min. The KTT was monitored at 313nm with UV detection and KTT was eluted at 7.20min. The method was linear (r2 =0.999) at concentration ranging from 100 to 600μg/ml, precise (intra-day relative standard deviation [RSD] and inter-day RSD values < 1.0%), accurate (mean recovery = 99.5%), specific and robust. Detection and quantification limits were 27.0μg/ml and 92.0μg/ml, estimated from linearity by regression method. The results showed that the proposed method is suitable for the precise, accurate and rapid determination of KTT in bulk, its capsule dosage forms. Keywords: Ketorolac tromethamine, RP-HPLC, Validation, Dosage form. *Corresponding author Srinivas Ganta Email:[email protected]
-
Upload
nagajunauniversity -
Category
Documents
-
view
0 -
download
0
Transcript of DEVELOPMENT AND VALIDATION OF A STABILITY INDICATING RP-HPLC METHOD FOR THE ESTIMATION OF KETOROLAC...

IAJPS, 2014, Volume1, Issue (2), 80-89 Srinivas et al ISSN 2349-7750
80
www.iajps.com
ISSN 2349-7750
IINNDDOO AAMMEERRIICCAANN JJOOUURRNNAALL OOFF
PPHHAARRMMAACCEEUUTTIICCAALL SSCCIIEENNCCEESS
Available online at: http://www.iajps.com Research Article
DEVELOPMENT AND VALIDATION OF A STABILITY INDICATING RP-HPLC
METHOD FOR THE ESTIMATION OF KETOROLAC TROMETHAMINE IN
DRUG SUBSTANCE AND ITS PHARMACEUTICAL FORMULATIONS Srinivas Ganta*
1, Dr. S. Vidyadhara
1, Ramanaiah Ganji
2, Srilakshmi. V
2, Ravikumar Kavati
3
1.Department of Pharmaceutical Analysis, Chebrolu Hanumaiah Institute of Pharmaceutical Sciencies, Acharya Nagarjuna
University, Andhra Pradesh, India.
2. Department of Chemistry, Acharya Nagarjuna University, Andhra Pradesh, India.
3. S S J College of Pharmacy,V.N Pally,Hyderabad,TS,India.
ABSTRACT
A rapid and sensitive reverse phase High Performance Liquid Chromatographic [RP-HPLC] method was developed for
the estimation of Ketorolac tromethamine [KTT] in pure and its capsule dosage forms. The method was validated as per
International Conference on Harmonization [ICH] guidelines. The mobile phase used in this study is a mixture of tetrahydrofuran
and monobasic ammonium phosphate buffer (pH-3.0) in the ratio of 30:70% v/v. Stationary phase was waters spherisorb C8
reverse phase column (250×4.6mm, 5μm) dimensions at 40ºc temperature. The analysis was performed with run time of 10.0
minutes at a flow rate of 1.50ml/min. The KTT was monitored at 313nm with UV detection and KTT was eluted at 7.20min. The
method was linear (r2 =0.999) at concentration ranging from 100 to 600μg/ml, precise (intra-day relative standard deviation
[RSD] and inter-day RSD values < 1.0%), accurate (mean recovery = 99.5%), specific and robust. Detection and quantification
limits were 27.0μg/ml and 92.0μg/ml, estimated from linearity by regression method. The results showed that the proposed method
is suitable for the precise, accurate and rapid determination of KTT in bulk, its capsule dosage forms.
Keywords: Ketorolac tromethamine, RP-HPLC, Validation, Dosage form.
*Corresponding author Srinivas Ganta Email:[email protected]
IAJPS, 2014, Volume1, Issue (2), 80-89 Srinivas et al ISSN 2349-7750
81
www.iajps.com
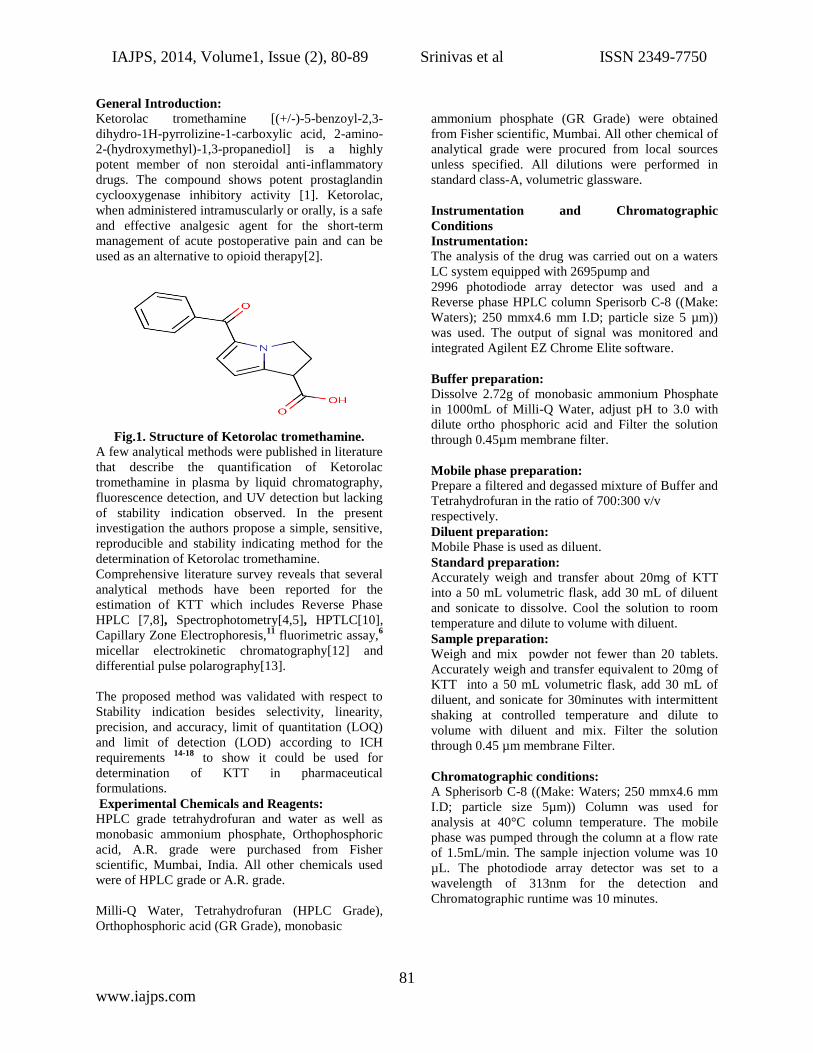
General Introduction:
Ketorolac tromethamine [(+/-)-5-benzoyl-2,3-
dihydro-1H-pyrrolizine-1-carboxylic acid, 2-amino-
2-(hydroxymethyl)-1,3-propanediol] is a highly
potent member of non steroidal anti-inflammatory
drugs. The compound shows potent prostaglandin
cyclooxygenase inhibitory activity [1]. Ketorolac,
when administered intramuscularly or orally, is a safe
and effective analgesic agent for the short-term
management of acute postoperative pain and can be
used as an alternative to opioid therapy[2].
Fig.1. Structure of Ketorolac tromethamine.
A few analytical methods were published in literature
that describe the quantification of Ketorolac
tromethamine in plasma by liquid chromatography,
fluorescence detection, and UV detection but lacking
of stability indication observed. In the present
investigation the authors propose a simple, sensitive,
reproducible and stability indicating method for the
determination of Ketorolac tromethamine.
Comprehensive literature survey reveals that several
analytical methods have been reported for the
estimation of KTT which includes Reverse Phase
HPLC [7,8], Spectrophotometry[4,5], HPTLC[10],
Capillary Zone Electrophoresis,11
fluorimetric assay,6
micellar electrokinetic chromatography[12] and
differential pulse polarography[13].
The proposed method was validated with respect to
Stability indication besides selectivity, linearity,
precision, and accuracy, limit of quantitation (LOQ)
and limit of detection (LOD) according to ICH
requirements 14-18
to show it could be used for
determination of KTT in pharmaceutical
formulations.
Experimental Chemicals and Reagents:
HPLC grade tetrahydrofuran and water as well as
monobasic ammonium phosphate, Orthophosphoric
acid, A.R. grade were purchased from Fisher
scientific, Mumbai, India. All other chemicals used
were of HPLC grade or A.R. grade.
Milli-Q Water, Tetrahydrofuran (HPLC Grade),
Orthophosphoric acid (GR Grade), monobasic
ammonium phosphate (GR Grade) were obtained
from Fisher scientific, Mumbai. All other chemical of
analytical grade were procured from local sources
unless specified. All dilutions were performed in
standard class-A, volumetric glassware.
Instrumentation and Chromatographic
Conditions
Instrumentation:
The analysis of the drug was carried out on a waters
LC system equipped with 2695pump and
2996 photodiode array detector was used and a
Reverse phase HPLC column Sperisorb C-8 ((Make:
Waters); 250 mmx4.6 mm I.D; particle size 5 µm))
was used. The output of signal was monitored and
integrated Agilent EZ Chrome Elite software.
Buffer preparation:
Dissolve 2.72g of monobasic ammonium Phosphate
in 1000mL of Milli-Q Water, adjust pH to 3.0 with
dilute ortho phosphoric acid and Filter the solution
through 0.45µm membrane filter.
Mobile phase preparation:
Prepare a filtered and degassed mixture of Buffer and
Tetrahydrofuran in the ratio of 700:300 v/v
respectively.
Diluent preparation:
Mobile Phase is used as diluent.
Standard preparation:
Accurately weigh and transfer about 20mg of KTT
into a 50 mL volumetric flask, add 30 mL of diluent
and sonicate to dissolve. Cool the solution to room
temperature and dilute to volume with diluent.
Sample preparation:
Weigh and mix powder not fewer than 20 tablets.
Accurately weigh and transfer equivalent to 20mg of
KTT into a 50 mL volumetric flask, add 30 mL of
diluent, and sonicate for 30minutes with intermittent
shaking at controlled temperature and dilute to
volume with diluent and mix. Filter the solution
through 0.45 µm membrane Filter.
Chromatographic conditions:
A Spherisorb C-8 ((Make: Waters; 250 mmx4.6 mm
I.D; particle size 5µm)) Column was used for
analysis at 40°C column temperature. The mobile
phase was pumped through the column at a flow rate
of 1.5mL/min. The sample injection volume was 10
µL. The photodiode array detector was set to a
wavelength of 313nm for the detection and
Chromatographic runtime was 10 minutes.
IAJPS, 2014, Volume1, Issue (2), 80-89 Srinivas et al ISSN 2349-7750
82
www.iajps.com
RESULTS AND DISCUSSION
Method development[11-15]:
Spectroscopic analysis of compound showed that
KTT has maximum UV absorbance (λmax) at 313
nm. Therefore, the chromatographic detection was
performed at 313nm using a Photo diode array
detector. To develop a suitable and robust LC method
for the determination of KTT, different mobile
phases were employed to achieve the best separation
and resolution. The method development was started
with Spherisorb C-8 (Make: Waters; 250 mmx4.6
mm I.D; particle size 5 µm) with the following
mobile phase. Filter the solution through 0.45µm
membrane filter. Prepare a filtered and degassed
mixture of Buffer and Methanol in the ratio of
500:500 v/v respectively. It was observed that a non
symmetrical peak was observed.
For next trial the mobile phase composition was
changed slightly. The mobile phase composition was
Buffer and acetonitrile in the ratio of 600:400 v/v.
above trail the peak shape was little broad but the
peaks are separated. Again the mobile phase
composition changed slightly to Buffer and
tetrahydrofuran in the ratio of 300:700 v/v
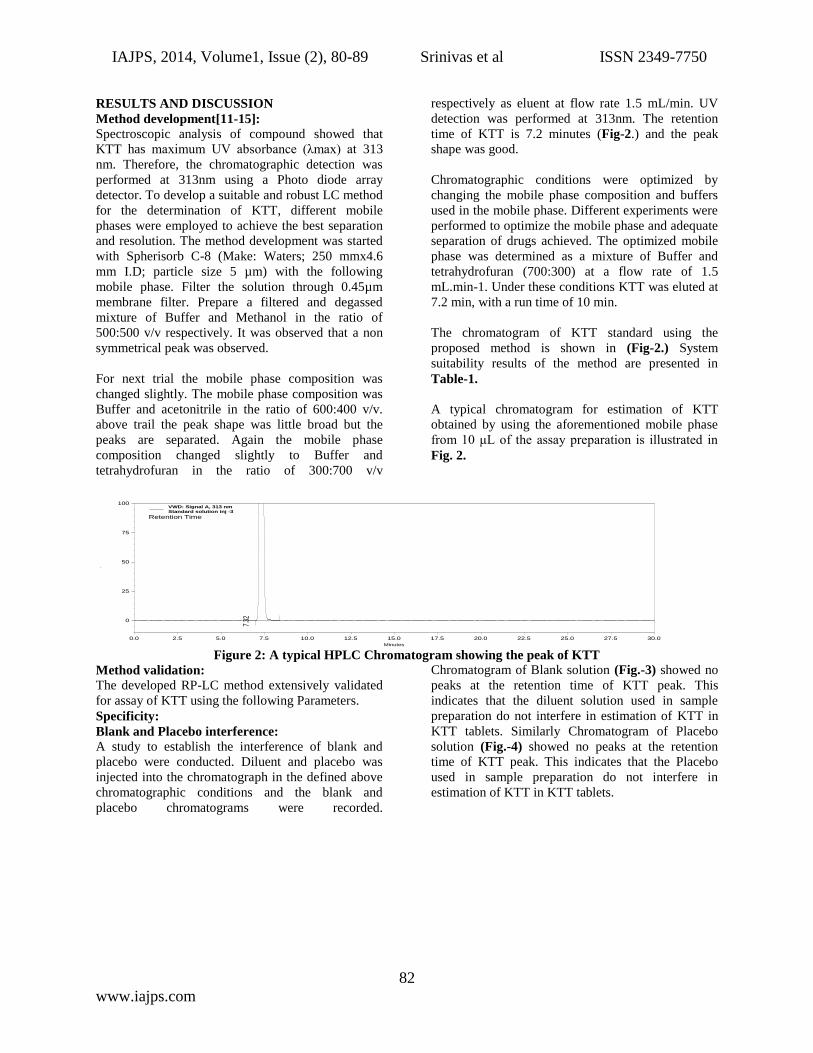
respectively as eluent at flow rate 1.5 mL/min. UV
detection was performed at 313nm. The retention
time of KTT is 7.2 minutes (Fig-2.) and the peak
shape was good.
Chromatographic conditions were optimized by
changing the mobile phase composition and buffers
used in the mobile phase. Different experiments were
performed to optimize the mobile phase and adequate
separation of drugs achieved. The optimized mobile
phase was determined as a mixture of Buffer and
tetrahydrofuran (700:300) at a flow rate of 1.5
mL.min-1. Under these conditions KTT was eluted at
7.2 min, with a run time of 10 min.
The chromatogram of KTT standard using the
proposed method is shown in (Fig-2.) System
suitability results of the method are presented in
Table-1.
A typical chromatogram for estimation of KTT
obtained by using the aforementioned mobile phase
from 10 μL of the assay preparation is illustrated in
Fig. 2.
Minutes
0.0 2.5 5.0 7.5 10.0 12.5 15.0 17.5 20.0 22.5 25.0 27.5 30.0
.
0
25
50
75
100
7.
32
VWD: Signal A, 313 nmStandard solution inj -3
Retention Time
Figure 2: A typical HPLC Chromatogram showing the peak of KTT
Method validation:
The developed RP-LC method extensively validated
for assay of KTT using the following Parameters.
Specificity:
Blank and Placebo interference:
A study to establish the interference of blank and
placebo were conducted. Diluent and placebo was
injected into the chromatograph in the defined above
chromatographic conditions and the blank and
placebo chromatograms were recorded.
Chromatogram of Blank solution (Fig.-3) showed no
peaks at the retention time of KTT peak. This
indicates that the diluent solution used in sample
preparation do not interfere in estimation of KTT in
KTT tablets. Similarly Chromatogram of Placebo
solution (Fig.-4) showed no peaks at the retention
time of KTT peak. This indicates that the Placebo
used in sample preparation do not interfere in
estimation of KTT in KTT tablets.
IAJPS, 2014, Volume1, Issue (2), 80-89 Srinivas et al ISSN 2349-7750
83
www.iajps.com
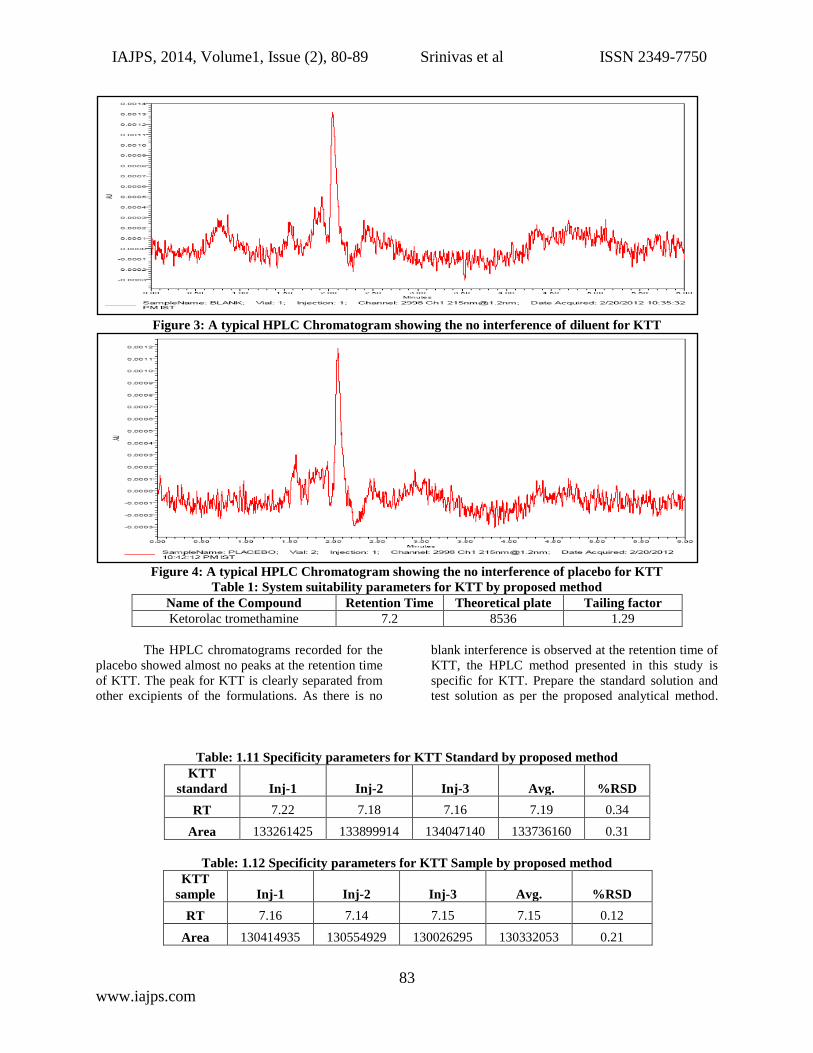
Figure 3: A typical HPLC Chromatogram showing the no interference of diluent for KTT
Figure 4: A typical HPLC Chromatogram showing the no interference of placebo for KTT
Table 1: System suitability parameters for KTT by proposed method
Name of the Compound Retention Time Theoretical plate Tailing factor
Ketorolac tromethamine 7.2 8536 1.29
The HPLC chromatograms recorded for the
placebo showed almost no peaks at the retention time
of KTT. The peak for KTT is clearly separated from
other excipients of the formulations. As there is no
blank interference is observed at the retention time of
KTT, the HPLC method presented in this study is
specific for KTT. Prepare the standard solution and
test solution as per the proposed analytical method.
Table: 1.11 Specificity parameters for KTT Standard by proposed method
KTT
standard Inj-1 Inj-2 Inj-3 Avg. %RSD
RT 7.22 7.18 7.16 7.19 0.34
Area 133261425 133899914 134047140 133736160 0.31
Table: 1.12 Specificity parameters for KTT Sample by proposed method
KTT
sample Inj-1 Inj-2 Inj-3 Avg. %RSD
RT 7.16 7.14 7.15 7.15 0.12
Area 130414935 130554929 130026295 130332053 0.21

IAJPS, 2014, Volume1, Issue (2), 80-89 Srinivas et al ISSN 2349-7750
84
www.iajps.com
Forced Degradation:
Control Sample:
Weigh and finely powder not fewer than 20 Tablets.
Accurately weigh and transfer equivalent to 20 mg of
Ketorolac tromethamine into a 100 ml volumetric
flask add about 70 ml of diluent, and sonicate for
30minutes with intermittent shaking at controlled
temperature and dilute to volume with diluent and
mix. Filter the solution through 0.45 μm membrane
Filter. Transfer 5.0 ml of the above solution into a
100 ml volumetric flask and dilute to volume with
diluent.(Figure 1.21)
Acid Degradation Sample: Weigh and finely powder not fewer than 20 Tablets.
Accurately weigh and transfer equivalent to 20 mg of
Ketorolac tromethamine into a 100 ml volumetric
flask add about 70 ml of diluent, and sonicate for
30minutes with intermittent shaking at controlled
temperature. Then add 10ml of 5N HCl, refluxed for
30min at 60°C, then cooled to room temperature,
neutralize with 5N NaOH and dilute to volume with
diluent and mix. Filter the solution through 0.45 μm
membrane Filter. Transfer 5.0 ml of the above
solution into a 100 ml volumetric flask and dilute to
volume with diluent. (Figure 1.21)
Base Degradation Sample: Weigh and finely powder not fewer than 20 Tablets.
Accurately weigh and transfer equivalent to 20 mg of
Ketorolac tromethamine into a 100 ml volumetric
flask add about 70 ml of diluent, and sonicate for
30minutes with intermittent shaking at controlled
temperature. Then add 10ml of 5N Base (NaOH),
refluxed for 30min at 60°C, then cooled to room
temperature, neutralize with 5N Acid (HCl) and
dilute to volume with diluent and mix. Filter the
solution through 0.45 μm membrane Filter. Transfer
5.0 ml of the above solution into a 100 ml volumetric
flask and dilute to volume with diluent. (Figure 1.21)
Peroxide Degradation Sample: Weigh and finely powder not fewer than 20 Tablets.
Accurately weigh and transfer equivalent to 20 mg of
Ketorolac tromethamine into a 100 ml volumetric
flask add about 70 ml of diluent, and sonicate for
30minutes with intermittent shaking at controlled
temperature. Then add 2ml of 30% Peroxide,
refluxed for 30min at 60°C, then cooled to room
temperature and dilute to volume with diluent and
mix. Filter the solution through 0.45 μm membrane
Filter. Transfer 5.0 ml of the above solution into a
100 ml volumetric flask and dilute to volume with
diluent. (Figure 1.21)
Thermal Degradation Sample: Powder collected from 20 tablets are exposed to heat
at 105°C for about 5days. Then Weigh and finely
powder not fewer than 20 Tablets. Accurately weigh
and transfer equivalent to 20 mg of Ketorolac
tromethamine into a 100 ml volumetric flask add
about 70 ml of diluent, and sonicate for 30minutes
with intermittent shaking at controlled temperature
and dilute to volume with diluent and mix. Filter the
solution through 0.45 μm membrane Filter.
Transfer 5.0 ml of the above solution into a 100 ml
volumetric flask and dilute to volume with diluent.
(Figure 1.21)
Similarly Humidity, UV-Light exposure, Sunlight
exposure and Water hydrolysis stress samples are
prepared and checked for their purity by proposed
method.

IAJPS, 2014, Volume1, Issue (2), 80-89 Srinivas et al ISSN 2349-7750
85
www.iajps.com
Figure 1.21: A typical HPLC Chromatogram showing the degradation profile of Ketorolac tromethamine by
proposed method.
Precision:
In the study of the instrumental system
precision study for six standard preparations showed
a %RSD of retention time 0.13% was obtained, %
RSD 0.37% for the area obtained respectively. In the
study of the instrumental system precision study for
six sample preparations showed a %RSD of retention
time 0.19% was obtained, % RSD 0.10% for the area
obtained respectively.
In the study of the instrumental system precision
where, a RSD of 0.37% was obtained for the standard
area obtained corresponding to the first day, being
0.96% for the second day, respectively. The method
precision study for six sample preparations in
marketed samples showed a RSD of 1.25 % and the
95% confidence interval of 0.2 with the assay range
of 99.9-100.4
For the intermediate precision, a study carried out by
the same analyst working on different day. The
results calculated as inter-day RSD corresponded to
0.3 %( For Standard). The same study was carried out
for different analysts (n = 6 number of samples per
analyst) obtaining a RSD of 0.5 %( Intermediate
Precision) and 95% confidence interval of 0.5 with
the assay range of 99.8-100.6 The Overall %RSD for
n=12 is 0.3. Both results together with the individual
results are showing that the proposed analytical
technique has a good intermediate precision.

IAJPS, 2014, Volume1, Issue (2), 80-89 Srinivas et al ISSN 2349-7750
86
www.iajps.com
Table 2: Method Precision (Inter and Intraday) studies for KTT by proposed method
Summary showing Method Precision by
Proposed Method
Method Precision (Inter &Intra Day)
100.1 100.20
100.7 100.4
99.4 99.6
99.3 99.7
99.2 99.5
100.5 99.6
Overall Avg. 99.9
Overage Std Dev. 0.51
Over all %RSD 0.50
Accuracy:
The accuracy of the method was determined on three
concentration levels by recovery experiments. The
recovery studies were carried out in triplicate
preparations on composite blend collected from 20
tablets of KTT, analyzed as per the proposed method.
The percentage recoveries with found in the range of
99.3 to 100.9 with an overall %RSD of 0.5 for KTT
and From the data obtained which given in Table-
1.17 to Table-1.22 the method was found to be
accurate.
Table: 1.17: Authentic level KTT Working Standard Areas
Table: 1.18: Authentic level KTT Sample Areas
KTT AREA
Inj-1 131035764
Inj-2 130933403
Inj-3 131813023
Inj-4 131055990
Inj-5 131218276
Inj-6 131522187
Mean Area 131263107
Table: 1.19 Assay Preparation (50%) for KTT Sample by proposed method
KTT RT AREA
Inj-1 7.20 66282960
Inj-2 7.20 66505399
Inj-3 7.24 66339299
AVG 7.22 66375886
%RSD 0.22 0.17
KTT AREA
Inj-1 133922965
Inj-2 134086659
Inj-3 134112650
Inj-4 134341797
Inj-5 134175567
Inj-6 134737464
Mean Area 134229517

IAJPS, 2014, Volume1, Issue (2), 80-89 Srinivas et al ISSN 2349-7750
87
www.iajps.com
Table: 1.20 Assay Preparation (100%) for KTT Sample by proposed method
Table: 1.21 Assay Preparation (150%) for KTT Sample by proposed method
KTT RT AREA
Inj-1 7.19 189121033
Inj-2 7.18 189439078
Inj-3 7.18 189931659
AVG 7.19 189497257
%RSD 0.08 0.22
Table: 1.22 % Recovery of Ketorolac tromethamine
Name Level – 1 (50%) Level –2 (100%) Level –3 (150%)
Ketorolac 99.9 99.98 99.88
Linearity of detector response:
The standard curve was obtained in the
concentration range of 100-600μg/ml. The linearity
of this method was evaluated by linear regression
analysis. Slope, intercept and correlation coefficient
[r2] of standard curve were calculated and given in
Fig: 1.30 and Table: 1.23 to demonstrate the
linearity of the method.
Table: 1.23 Linearity of Response for KTT by proposed method
Linearity of Response for Ketorolac
% Level (Approx.) Concentration (µg/ml) Average Area
25 100 33529388
50 200 65190691
75 300 98857127
100 400 129736371
125 500 165224031
150 600 191902593
% Y-intercept 1.38
CC 0.9991
KTT RT AREA
Inj-1 7.26 132279622
Inj-2 7.27 132559113
Inj-3 7.21 132781766
AVG 7.25 132540167
%RSD 0.31 0.19

IAJPS, 2014, Volume1, Issue (2), 80-89 Srinivas et al ISSN 2349-7750
88
www.iajps.com
Fig: 1.30 - Linearity curve for Ketorolac
LOD and LOQ:
Limit of detection was found to be 27μg/ml and Limit of quantification was found to be 92μg/ml.
Table: 1.24 Limit of Detection for KTT by proposed method
LOD Ketorolac
RT Area Height S/N
7.26 8788 813 3.25
7.25 8442 909 3.42
7.27 8964 839 3.30
AVG 10.26 8731 854 3.32
%RSD 0.09 3.04 5.82 2.63
Table: 1.25 Limit of Quantification for KTT by proposed method
LOQ Ketorolac
RT Area Height S/N
7.27 32807 2550 10.38
7.29 33310 2504 9.78
7.26 31371 2501 9.97
7.25 35666 2595 10.07
7.25 33300 2495 9.98
7.26 33761 2564 10.27
AVG 7.26 33369 2529 10.04
%RSD 0.18 4.18 1.7 2.19
CONCLUSION:
A fast, simple and reliable analytical method
for determination of KTT in pharmaceutical
preparation using HPLC with UV detection. An
analytical run takes about 7.25min. Separation of
compounds is very fast, with good reproducibility
and peak asymmetry. Validation of this method was
accomplished, getting results meeting all
requirements. The method is simple, reproducible,
with a good accuracy and precision.
Ketorolac linearity y = 1E+06x + 2E+06
R2 = 0.9991
0
50000000
100000000
150000000
200000000
250000000
0 20 40 60 80 100 120 140 160
Concentration
Are
a
IAJPS, 2014, Volume1, Issue (2), 80-89 Srinivas et al ISSN 2349-7750
89
www.iajps.com
REFERENCES:
[1] W.H. Rooks 2end, Pharmacotherapy, 1990, 10,
30S.
[2] W.H Rooks, P.J. Maloney, L.D. Shott, M.E.
Schuler, H. Sevelius, A.M. Strosberg, L.
Tanenbaum, A.J.Tomolonis, M.B. Wallach, D.
Waterbury, Drug Exp. Clin. Res., 1985, 11, 479.
[3] B. Kamath, K. Shivram, S. Vangani, Anal. Lett.
1994, 27, 103.
[4] B. Kamath, K. Shivram, A. Shah, J. Pharm.
Biomed. Anal., 1994, 12, 343.
[5] M.S. Prakash, S. Meena, Indian Drugs, 1996, 12,
343.
[6] S. N. Razzaq, I. Mariam, I.U. Khan, M. Ashaq, J.
Liq. Chrom. Rel. Tech., 2012, 35, 651.
[7] J. Squella, I. Lemus, J. Sturm, L. Nunez-Vergara,
Anal. Lett., 1997, 30, 553.
[8] B.P. Reddy, M.V. Suyanarayana, S.
Vemkatraman, G.L. Krupadanam, C.S. Sastry, Indian
Drugs, 1993, 30,176.
[9] P.V. Devarajan, S.P. Gore, S.V. Chavan, J.
Pharm. Biomed. Anal., 2000, 22, 679.
[10] S. Orlandini, S. Furlanetto, S. Pinzauti, G.
D’Orazio, S. Fanali, J. Chrom. A., 2004, 1044, 295.
[11]. S. Orlandini, S. Fanalo, S. Furlanetto, A.
Marras, S. Pinzauti, J. Chrom. A., 2004, 1032, 253.
[12] J. Sturm, H. Canelo, L. Nunez-Vergara, J.
Squella, Talanta, 1997, 44, 931.
[13] ICH, Q2B, Validation of Analytical Procedures:
Methodology, International Conference on
Harmonization, Geneva, November, 1996.
[14] M. Sugumaran, M. Poornima, M. Yogesh
Kumar, S. Ramarajasekhar, Der Pharmacia Sinica,
2011, 2, 12.
[15] M. Mohideen, M. Shivakanth, P. Suresh Kumar,
S. Navaneetha Krishnan, Y. Surendranath, T.
Satyanarayana, Der Pharmacia Sinica, 2011, 2, 114.
[16] A. Shrivastava, A. Chakraborty, S. Rambhade,
U. Patil, Der Pharmacia Sinica, 2011, 2, 263.
[17] M. Narenda Kumar, V. Krishna Reddy, H.
Kumar Sharmal, T. Mastanainah, Der Pharmacia
Sinica, 2012, 3,450.
[18] R. Manmodel, A. Dhamankar, J. Manwar, S.
Laddha, Der Pharmacia Sinica, 2011, 2, 8