de-icing salts, salt-tolerant vegetation and calcium sulfate
Upload
canterbury-nzCategory
view
2download
0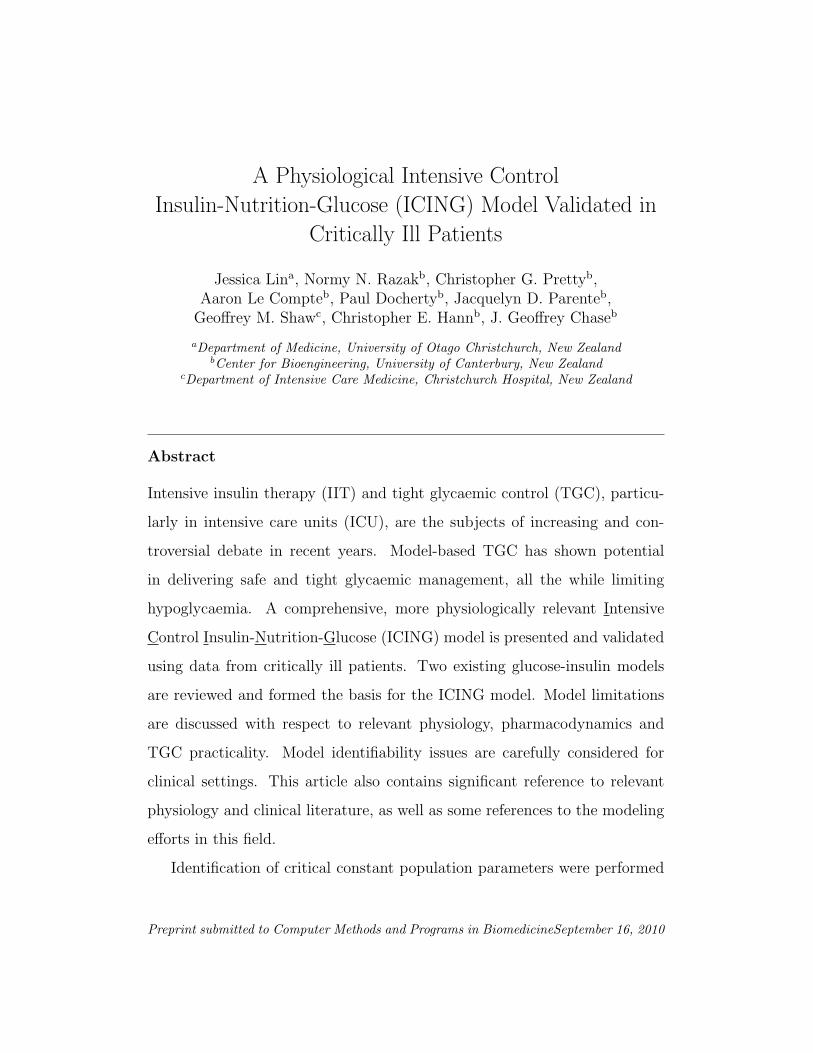
A Physiological Intensive Control
Insulin-Nutrition-Glucose (ICING) Model Validated in
Critically Ill Patients
Jessica Lina, Normy N. Razakb, Christopher G. Prettyb,Aaron Le Compteb, Paul Dochertyb, Jacquelyn D. Parenteb,
Geoffrey M. Shawc, Christopher E. Hannb, J. Geoffrey Chaseb
aDepartment of Medicine, University of Otago Christchurch, New ZealandbCenter for Bioengineering, University of Canterbury, New Zealand
cDepartment of Intensive Care Medicine, Christchurch Hospital, New Zealand
Abstract
Intensive insulin therapy (IIT) and tight glycaemic control (TGC), particu-
larly in intensive care units (ICU), are the subjects of increasing and con-
troversial debate in recent years. Model-based TGC has shown potential
in delivering safe and tight glycaemic management, all the while limiting
hypoglycaemia. A comprehensive, more physiologically relevant Intensive
Control Insulin-Nutrition-Glucose (ICING) model is presented and validated
using data from critically ill patients. Two existing glucose-insulin models
are reviewed and formed the basis for the ICING model. Model limitations
are discussed with respect to relevant physiology, pharmacodynamics and
TGC practicality. Model identifiability issues are carefully considered for
clinical settings. This article also contains significant reference to relevant
physiology and clinical literature, as well as some references to the modeling
efforts in this field.
Identification of critical constant population parameters were performed
Preprint submitted to Computer Methods and Programs in BiomedicineSeptember 16, 2010
in two stages, thus addressing model identifiability issues. Model predictive
performance is the primary factor for optimizing population parameter val-
ues. The use of population values are necessary due to the limited clinical
data available at the bedside in the clinical control scenario. Insulin sensi-
tivity, SI , the only dynamic, time-varying parameter, is identified hourly for
each individual. All population parameters are justified physiologically and
with respect to values reported in the clinical literature. A parameter sensi-
tivity study confirms the validity of limiting time-varying parameters to SI
only, as well as the choices for the population parameters. The ICING model
achieves median fitting error of <1% over data from 173 patients (N = 42,941
hrs in total) who received insulin while in the ICU and stayed for ≥72 hrs.
Most importantly, the median per-patient one-hour ahead prediction error is
a very low 2.80% [IQR 1.18, 6.41%]. It is significant that the 75th percentile
prediction error is within the lower bound of typical glucometer measurement
errors of 7–12%. These results confirm that the ICING model is suitable for
developing model-based insulin therapies, and capable of delivering real-time
model-based TGC with a very tight prediction error range. Finally, the de-
tailed examination and discussion of issues surrounding model-based TGC
and existing glucose-insulin models render this article a mini-review of the
state of model-based TGC in critical care.
Key words: model-based control, tight blood glucose control, TGC, blood
glucose, insulin therapy, insulin sensitivity, critical care, predictive
performance
2

1. Introduction
Since the landmark study in surgical intensive care unit (ICU) patients
by Van Den Berghe et al. [1], which reduced mortality 18-45% using tight
glycaemic control (TGC), the attitude towards tolerating hyperglycaemia in
critically ill patients has changed. Hyperglycaemia worsens outcomes, in-
creasing the risk of severe infection [2], myocardial infarction [3], and critical
illnesses such as polyneuropathy and multiple organ failure [1]. However, re-
peating these results has been difficult, and thus the role of tight glyceamic
control during critical illness and suitable glycaemic ranges have been under
scrutiny in recent years [4, 5, 6, 7, 8, 9, 10, 11]. However, conclusions are
varied with both success [1, 12, 13, 14], failure, [15] and, primarily, no clear
outcome [16, 17, 18, 19, 20, 21].
Although it is now becoming an unacceptable practice to allow excessive
hyperglycaemia and its associated effects [8, 22, 23, 24], moderately elevated
blood glucose levels are tolerated or recommended [11] because of the fear
of hypoglycaemia and higher nursing effort frequently associated with TGC
[8, 10, 25, 26]. Interestingly, some TGC studies that reported a mortality
reduction also had reduced and relatively low hypoglycaemic rates [13, 14],
whereas almost all other reports had increased and often excessive hypogly-
caemia [15, 17]. Finally, model-based and model-derived TGC methods have
shown the ability to provide very tight control with little or no hypoglycaemia
[13, 27, 28, 29, 30].
Many studies have developed glucose-insulin models with varying degrees
of complexity for a wide range of uses, primarily in research studies of insulin
sensitivity [27, 31, 32, 33, 34, 35, 36]. A more comprehensive model review
3

can be found in [28]. For a model to be successful in delivery of TGC, it needs
to reflect observable physiology, as well as known biological mechanisms. In
addition, it should be uniquely identifiable, and the type and number of
parameters to be identified should reflect the clinically available data that
will provide validation. Finally, the most important aspect for a model to be
used in model-based TGC is its predictive ability, where most studies provide
only fitting error as validation [29, 33, 36, 37].
This paper presents a more comprehensive model, ICING (Intensive Con-
trol Insulin-Nutrition-Glucose model), for the use of glycaemic control par-
ticularly in the ICU. The model addresses several incomplete or implicit
physiological aspects from prior models by Chase et al. [27] and Lotz et al.
[38]. Model limitations are discussed with respect to physiology, pharma-
codynamics and TGC practicality. Model identifiability issues are carefully
considered for clinical settings. The ICING model is validated using clinical
data from critically ill patients and assessed for both its fitting, and more
critically for TGC, predictive performance. Finally, issues surrounding TGC
and existing glucose-insulin models are extensively reviewed and discussed.
2. Glucose-Insulin Physiology Model
Two clinically validated glucose-insulin physiology models set the basis of
this study. Both models share the same basic structure of the Minimal Model
[32]. The model from Chase et al. [27] was developed and validated for gly-
caemic level management in the ICU. This model captures the fundamental
dynamics seen in critically ill patients, yet has a relatively simple mathe-
matical structure enabling rapid identification of patient-specific parameters
4

[39]. This model only requires measurements in blood glucose levels (BG),
therefore it can be used by the bedside for clinical real-time identification
and control. This structure has been widely used in clinical TGC studies
and other analyses [30, 40, 37].
The second model from Lotz et al. [38] was developed for diagnosis of
insulin resistance. The modeled insulin sensitivity has high correlation to the
euglycaemic hyperinsulinemic clamp (EIC) and high repeatability [38, 41].
This model has more patient specific parameters, but is not suitable for real-
time patient-specific parameter identification because it also requires non-
real-time plasma insulin and C-peptide assays [42]. Recent work has sought
to eliminate this issue in healthy subjects, but at a loss of precision [43].
2.1. Critical Care Glucose-Insulin Model (ICU Model)
Equations (1)–(5) presents the model used for glycaemic control in inten-
sive care from Chase et al. [27], hereafter referred to as the “ICU Model”.
ICU Model
G = −pGG(t)− SI(G(t) +GE)Q(t)
1 + αGQ(t)+P (t)
VG(1)
Q = −kQ(t) + kI(t) (2)
I = − nI(t)
1 + αII(t)+uex(t)
VI(3)
P (ti < t < ti+1) = Pi+1 + (P (ti)− Pi+1)e−kpd(t−ti) where Pi+1 < P (ti) (4)
P (ti < t < ti+1) = Pi+1 + (P (ti)− Pi+1)e−kpr(t−ti) where Pi+1 > P (ti) (5)
The symbols G [mmol/L] denotes the glucose above an equilibrium level,
5

GE [mmol/L]. Plasma insulin is I [mU/L] and exogenous insulin input is
uex(t) [mU/min]. The effect of previously infused insulin being utilized over
time in the interstitium is represented by Q [mU/L], with k [1/min] ac-
counting for the effective life of insulin in the system. Patient endogenous
glucose removal and insulin sensitivity are pG [1/min] and SI [L/mU/min]
respectively. The parameter VI [L] is the insulin distribution volume and
n [1/min] is the constant first order decay rate for insulin from plasma. Ex-
ternal nutrition is P (t) [mmol/min]. In Equations (4)–(5), kpr [1/min] and
kpd [1/min] are the rise and decay rates of exogenous (enteral) plasma glu-
cose appearance, and Pi and Pi+1 are the stepwise consecutive enteral glucose
feed rates used to model dextrose control. The glucose distribution volume
is VG [L]. Michaelis-Menten functions are used to portray saturations, with
parameter αI [L/mU] used for saturation of plasma insulin disappearance,
and αG [L/mU] for saturation of insulin-stimulated glucose removal.
This model was developed and validated in critical care glycaemic control
studies [27, 36, 37, 44]. All the compartmental transport and utilisation rates
are treated as constants except insulin sensitivity SI . Insulin sensitivity SI
is the critical dynamic parameter, and is typically fitted to patient data
hourly, producing a step-wise hourly varying profile. The SPRINT glycaemic
control protocol [13, 45, 46] was developed using this model. Importantly,
the pre-trial virtual trial simulation of SPRINT gave very similar results to
the subsequent actual clinical implementation results [27], providing a further
measure of validation.
However, this model does not realistically describe the gastric uptake of
glucose. Equations (4) and (5) express simple exponential rises and decays of
6

glucose absorption, which eventually reach a steady state equal to the feeding
rate. This simple expression works well in critical care where nasogastric
feeding rate is not adjusted frequently. If the feeding rate is changed more
frequently than once every 2 hours, Equations (4) and (5) fail to describe the
gastric absorption correctly.
This model also employs an “equilibrium blood glucose level” term, GE,
which is usually set to either the patient’s blood glucose level at the start of
insulin therapy or a long moving average. This term effectively addresses the
endogenous balance of glucose and insulin. Hence, this model does not explic-
itly express endogenous insulin production. Thus, when there is a significant
shift in this balance in a patient, for any number of reasons [36, 44, 47], GE
often needs to be adjusted to capture the patient’s (then) current clinical
glucose-insulin dynamics. Hence, the term is non-physiological, unidentifi-
able and was ignored in later model evolutions [30, 48, 49].
This model also has relatively simple insulin kinetics compared to other
more extensive models [50, 51, 52, 53]. It does not explicitly express different
routes of insulin clearance and transport from plasma. Instead, the lumped
out-flux from plasma is expressed by a saturable term −nI/(1 + αII). In
addition, as only kI appears as an input to interstitial insulin Q, the differ-
ence between n and k is implicitly the insulin clearance by liver and kidneys,
which was validated in Lotz et al. [41]. The insulin flux between plasma and
interstitial is also only one way in this model, ignoring the diffusion from
interstitium back to plasma, as it was designed for TGC using IV insulin
boluses. Therefore, the insulin concentration gradient between plasma and
the interstitium using bolus delivery is generally large enough that diffusion
7

back to plasma is negligible. However, the use of boluses is less typical in
general clinical settings and neglecting diffusion can introduce error in either
case.
2.2. Glucose-Insulin Model for Insulin Sensitivity Test (SI Test Model)
Equations (6)–(8) presents the model used for insulin sensitivity testing
from Lotz et al. [38], hereafter referred to as the “SI Test Model”.
SI Test Model
G = −pGG(t)− SI(G(t) +GE)Q(t)
1 + αGQ(t)+P (t)
VG+ EGP (t) (6)
Q =nIVQ
(I(t)−Q(t))− nCQ(t) (7)
I = −nKI(t)− nLI(t)
1 + αII(t)− nIVP
(I(t)−Q(t)) +uex(t)
VP
+(1− xL)uen(t)
VP(8)
The nomenclature for this model is largely the same as that for the ICU
Model in Section 2.1. This model has more parameters and more exten-
sive insulin kinetics. It includes the endogenous glucose production rate
EGP [mmol/L/min], as well as the endogenous insulin production
uen [mU/min]. The endogenous insulin production can be calculated from
C-peptide measurements using a well validated insulin-C-peptide kinetics
model [54]. Endogenous insulin goes through first pass hepatic extraction,
where xL is the fraction of extraction. This model also has more explicitly
defined physiologically specific insulin transport parameters compared to the
8

ICU Model, where nK is the kidney clearance rate of insulin from plasma
[1/min], nL is the liver clearance rate of insulin from plasma [1/min], nI is
the diffusion constant of insulin between compartments [L/min], and nC is
the cellular insulin clearance rate from interstitium [1/min]. Finally, it also
uses different volumes for each compartment, where VP is the plasma volume
(+Fast exchanging tissues) [L] and VQ is the interstitial fluid volume [L]. The
experimental VP and VQ are however very close [38].
In [38, 42], measurements from insulin and C-peptide are used to identify
nL and xL for each person. SI and VG are then calculated for each person
using BG measurements. All other parameters are treated as population
constants. The insulin sensitivity SI identified using this model correlates
highly (r > 0.97) to EIC results [38, 41]. Therefore, this model is effective as
a diagnostic tool for insulin resistance. However because plasma insulin and
C-peptide measurements cannot be obtained in real time, this model cannot
be readily adapted for TGC for ICU patients.
2.3. Intensive Control Insulin-Nutrition-Glucose Model (ICING Model)
The new and more physiologically comprehensive model developed from
the best aspects of both models [27, 38] is defined:
˙BG = −pGBG(t)− SIBG(t)Q(t)
1 + αGQ(t)+P (t) + EGPb − CNS
VG(9)
Q = nI(I(t)−Q(t))− nCQ(t)
1 + αGQ(t)(10)
I = −nKI(t)− nLI(t)
1 + αII(t)− nI(I(t)−Q(t)) +
uex(t)
VI
+(1− xL)uenVI
(11)
9

P1 = −d1P1 +D(t) (12)
P2 = −min(d2P2, Pmax) + d1P1 (13)
P (t) = min(d2P2, Pmax) + PN(t) (14)
uen(t) = k1e− I(t)k2
k3 when C-peptide data is not available (15)
The nomenclature for this model is largely the same as defined in Sections
2.1 and 2.2. However, “equilibrium blood glucose level” GE is no longer
present, andBG(t) is the absolute BG level per more recent works [55, 30, 48].
A constant “basal” endogenous glucose production term EGPb [mmol/min],
which is the endogenous glucose production rate for a patient receiving no
exogenous glucose or insulin, is thus added. This model has an additional
insulin independent [56] central nervous system glucose uptake, CNS, with
an experimental value between 0.29–0.38 mmol/min [56, 57, 58, 59, 60, 61,
62, 63, 64].
In Equation (9), insulin independent glucose removal (excluding central
nervous system uptake CNS) and the suppression of endogenous glucose
production from EGPb with respect to BG(t) are compounded and repre-
sented by pG. Insulin mediated glucose removal and the suppression of EGP
from EGPb are similarly compounded and represented by SI . Consequently,
SI effectively represents the whole-body insulin sensitivity, which includes
tissue insulin sensitivity and the action of Glucose Transporter-4 (GLUT-4).
The action of GLUT-4 is associated with the compounding effect of receptor-
10

binding insulin and blood glucose, and its signaling cascade is also dependent
on metabolic condition and can be affected by medication [65, 66, 67, 68].
Therefore, SI is time varying and can reflect evolving patient condition. Its
variation through time can be significant, particularly for highly dynamic,
critically ill patients [40, 37].
Equations (10) and (11) define the insulin pharmacokinetics similarly to
[38] and Equations (7)–(8). Insulin clearance from plasma is saturable, as
well as its degradation after receptor binding in the interstitium [69]. The
receptor-bound insulin Q/(1 + αGQ) is also the insulin effective for glucose
removal to cells. Hence this term also appears in Equation (9) for glucose
dynamics. Note that nI in Equations (10) and (11) has unit [1/min] rather
than [L/min] as in Equations (7) and (8). This is because the new model in
Equations (9)–(15) does not use different volumes for plasma and interstitial
insulin distribution, since the experimental values are very similar in [38, 70].
To compare and convert nI from Lotz el al., its value needs to be divided by
VP from Lotz et al.
Equations (12)–(14) present the gastric absorption of glucose, where
P1 [mmol] represents the glucose in the stomach and P2 [mmol] is for the gut.
Transport rates between the compartments are d1 [1/min] and d2 [1/min].
Amount of dextrose from enteral feeding is D(t) [mmol/min]. Glucose ap-
pearance, P (t) [mmol/min] from enteral food intake D(t), is the glucose
flux out of the gut P2. This flux is saturable, and the maximal out flux
is Pmax = 6.11 [mmol/min]. Typically, for ICU patients on enteral feed-
ing, Pmax is not reached. Any additional parenteral dextrose is represented
by PN(t). This dextrose absorption model conserves ingested glucose, and
11

therefore is also suitable for modeling meal ingestion over a short period of
time in contrast to the simpler model of Equations (4) and (5).
Equation (15) is a generic representation of endogenous insulin production
when C-peptide data is not available from the patient for specific identifica-
tion of its production. Endogenous insulin production, with the base rate
being k1 [mU/min], is suppressed with elevated plasma insulin levels. The
exponential suppression is described by generic constants k2 and k3.
3. Model Validation Methods
Validation of the glucose-insulin model presented in Equations (9)–(14) is
performed using data from 173 patients (42,941 total hours) that were on the
SPRINT TGC protocol [13] for 3 or more days, which also had a statistically
significant hospital mortality reductions. These patients also had long enough
stays to exhibit periods of both dynamic evolution and metabolic stability.
The median APACHE II score for this cohort is 19 [IQR 16, 25] and the
median age is 64 [IQR 49, 73] yrs old. The percentage of operative patients
is 33%.
Insulin sensitivity, SI is the critical patient specific parameter that is fitted
hourly to clinical blood glucose measurements using an integral-based fitting
method [39]. The rest of the parameters are kept as population constants.
This approach was verified for the ICU model via a sensitivity study [39].
(A sensitivity study is also performed in this study for the ICING model –
see Section 3.4). The model is assessed for its accuracy by fitting errors,
as well as robustness, or adaptability, by prediction errors. Fitting error is
simply the error between the measured and the modelled blood glucose levels.
12

When an hourly SI is identified, a prediction of blood glucose level in one
hour using this identified SI is also made given the clinical record of insulin
and nutrition support. The prediction error is then the error between the
prediction and the actual blood glucose level.
Intra- and inter-patient variability are examined by looking at the data
on a by-cohort or per-patient basis. By-cohort analysis looks at the statis-
tics on all the available hourly fitting and prediction errors (weighting each
hour equally), whereas per-patient analysis looks at the statistics on each
individual patient (weighting each patient equally).
Essentially the model improvements from the ICU model to the ICING
model are made in two stages: firstly on the glucose compartment, secondly
on the insulin pharmacokinetics. During each stage, the important popu-
lation constant parameters are optimised using grid-search methods. The
grid-search approach is robust to measurement noise and can provide an
assessment of parameter sensitivity.
During the first stage of improvements on the glucose compartment,
EGPb and pG are optimised as a pair. The insulin pharmacodynamics are
kept as in Equations (2)–(3) during this stage – as the constant parameters
in Equations (10)–(11) are yet to be optimised. In the second stage of model
improvement, the ICING model takes its complete form and the constant in-
sulin pharmacokinetics parameters are optimised. Finally a re-assessment of
pG and EGPb, as well as a parameter sensitivity using the completed ICING
model are performed.
13

3.1. Identification of pG and EGPb – Stage 1
In the first stage of model improvement, pG and EGPb are optimised as a
pair. Constant parameter values used in this stage of parameter identification
can be seen in Table 1. These constant parameters are consistent with values
found in surveys of population studies [36, 37, 55], and have been verified for
their suitability of being set to population constants in a previous parameter
sensitivity study [39] and clinical glycaemic control studies [30, 36, 44, 48].
The range of the grid search covers pG = 0.001 → 0.1 [1/min] with
increments of 0.001, and EGPb = 0.0→ 3.5 [mmol/min] with increments of
0.1. Fitting and prediction errors are calculated for each pG, EGPb coordinate
for each patient to find the optimal combination.
3.2. Identification of Insulin Kinetics Parameters – Stage 2
Model improvements on Insulin pharmacokinetics are made in the second
stage, and the model takes its final form as defined in Equations (9)–(15).
Parameters associated with insulin kinetics are identified in this stage. Lotz
et al. [38] uses measurements from insulin and C-peptide to identify patient
specific liver clearance nL and first pass endogenous insulin hepatic uptake
xL in Equations (7)–(8). The value for kidney clearance, nK , was taken from
a well validated population model of C-peptide kinetics, and the transcap-
illary diffusion rate nI was calculated by a method proposed by the same
authors [54]. For this study, ICU patient data does not contain the insulin
measurements to allow for unique identification of nL and xL. However, the
transition from Equations (2) and (3) to Equations (10) and (11) makes nI
the critical parameter to be investigated.
14

Table 1: Models and constant parameter values and/or ranges
Constant ICU SI Test ICING
Parameters Model [27] Model [38] Model (Final)
GE [mmol/L] starting BG* starting BG* -
CNS [mmol/min] - - 0.3
αG [L/mU] 0.0154 0 0.0154
VG [L] 13.3 10.00–15.75 13.3
αI [L/mU] 0.0017 0.0017 0.0017
n [1/min] 0.16 - -
k [1/min] 0.0198 - -
pG [1/min] 0.01 0.01 to be identified
EGPb[mmol/min] - - to be identified
nI - 0.21–0.36 [L/min] to be identified [1/min]
nC [1/min] - 0.032–0.033 = nI
nL [1/min] - 0.10–0.21 0.1578
nK [1/min] - 0.053–0.064 0.0542
xL - 0.50–0.95 0.67
VI [L] 3.15 - 3.15
VQ [L] - 4.44–7.47 -
VP [L] - 3.90-5.96 -
kpr [1/min] 0.0347 - -
kpd [1/min] 0.0069 - -
d1 [1/min] - - 0.0347
d2 [1/min] - - 0.0069
Pmax [mmol/min] - - 6.11
k1 [mU/min] - - 45.7
k2 - - 1.5
k3 - - 1000
15

The interstitial insulin transfer rate, k, in Equation (2) was calculated to
correspond to the active interstitial insulin half-life [44]. Effectively, Equation
(2) thus represents a delay compartment for insulin action in the interstitium,
and can be re-written:
Q(t) = k
∫ t
0
I(τ)e−k(t−τ)dτ (16)
On the other hand, the analytical solution of Q in Equation (10) is:
Q(t) = nI
∫ t
0
I(τ)e−(nI+nC)(t−τ)dτ (17)
Therefore, the decay rate of interstitial insulin is nI + nC in Equation (10),
and this rate should be comparable to k in Equation (2).
Studies indicated that steady state interstitial to plasma insulin ratio is
between 0.4 − 0.6 [71, 72, 73]. Lotz et al. [38] uses a population value
of 0.5 for this ratio. Therefore nI = nC can be assumed from the steady
state calculation using Equation (10) provided the steady state Q is low so
Q/(1 + αGQ) ≈ Q.
In this study, a grid search of nI is used to obtain a suitable model
value. Again, integral fitting is used to identify hourly SI . The grid covers
nI = nC = 10−4 → 0.02 [1/min]. The fitting and prediction error are
calculated at each grid for each patient. Other constant parameter values
are listed in Table 1. The value for nK is taken from Van Cauter et al. [54]
and nL is the mean fitted value found in Lotz et al. [38, 70]. First pass
hepatic insulin uptake, xL was also a fitted parameter in Lotz et al. [38], and
is coupled with liver clearance nL. In this study, xL is assumed to be 0.67,
which is within the range reported by Lotz et al. [38, 70]. In this study, xL
16

has a relatively insignificant role, as patients on intensive insulin therapy can
be assumed to have their endogenous insulin production suppressed due to
elevated plasma insulin levels. The other constant parameters are kept the
same as in the identification of pG and EGPb.
3.3. Re-assessment of pG and EGPb
A re-assessment of the population constant values of pG and EGPb is
performed using the complete ICING model. The grid analysis covers pG =
0.005→ 0.025 [1/min] and EGPb= 0.5→ 2.5 [mmol/min] with an increment
step of 0.0033 and 0.33 respectively.
3.4. Parameter sensitivity analysis
The robustness of model population parameters nL, nK , nC and αG on
the model fit and predictive performance of the ICING model is tested by
modifying individual model values (summarized in Table 1) by ±50%. While
one parameter is being altered, the rest of the parameters are kept at their
original values in Table 1. Changes in model performance can indicate the
suitability of their assumed values, and whether or not they should be used
as population constants.
4. Results
4.1. pG and EGPb – Stage 1
The per-patient median fitting and prediction errors over the ranges
pG = 0.001 → 0.1 [min−1] and EGPb = 0 → 3.5 [mmol/min] are
shown in Figure 1. Sub-figures 1(a) and 1(c) show the median of all median
17

hourly % errors for each patient. Sub-figures 1(b) and 1(d) show the me-
dian range of the 90% confidence interval in hourly % error for each patient.
Smaller (tighter) range means tighter distribution with less outliers. In gen-
eral, lower fitting and prediction errors and error ranges are produced in the
lower pG and lower EGPb regions, where the plot is darkest.
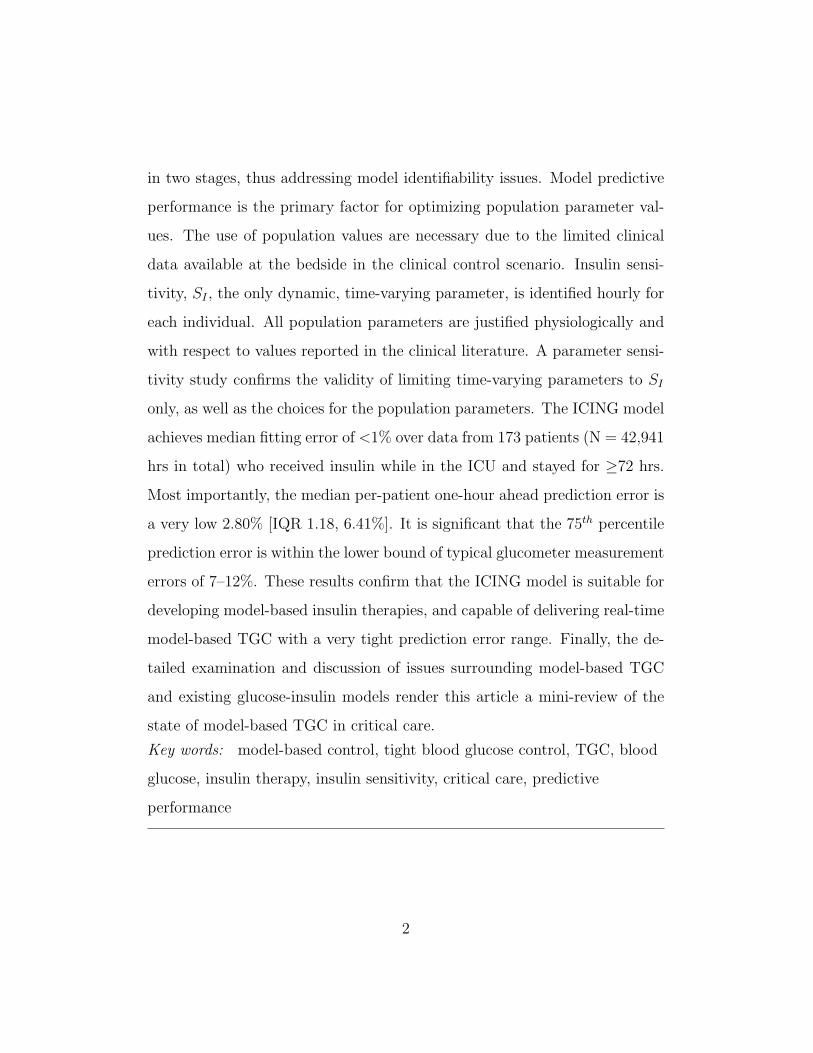
Figure 2(a) shows the cumulative distribution function of the prediction
error over all available hourly data for the selected pG and EGPb combina-
tions. The performance is very similar for [pG, EGPb] = [0.002, 0.5], [0.006,
0.8] and [0.006, 1.16]. However, the predictive performance is significantly
worse for EGPb = 2.3 mmol/min, where this value is tested to demonstrate
the impact of applying an extreme, supra-physiological value across the entire
cohort. In contrast, Figure 2(b) shows the cumulative distribution function
of the fitting error for the same combinations of pG and EGPb values. The
model clearly delivers the best fitting error with [pG, EGPb] = [0.006, 1.16].
From the figures of prediction and fitting error generated, it can be ob-
served that the best balance between fitting and prediction is achieved by
the combination [pG, EGPb] = [0.006, 1.16]. Glucose metabolism studies re-
ported EGP values range from 0.91→ 1.4 [mmol/min] [48, 74, 75]. The value
for EGPb identified in this study is therefore physiologically valid. Reported
values for pG from studies have been shown to range between 0.004→ 0.047
min−1 [32, 76, 77, 78]. Therefore, the identified pG = 0.006 [1/min] is also
physiologically valid.
4.2. Insulin Kinetics Parameters – Stage 2
The median of the 25th, 50th and 75th percentile fitting and prediction
errors for each patient across nI = 10−4 → 0.02 min−1 in the full ICING
18
(a) Median % fitting error (b) 90% confidence interval in % fitting error
(c) Median % prediction error (d) 90% confidence interval in % prediction
error
Figure 1: Per-patient percentage fitting and prediction error with respect to pG and EGPb.
Each coordinate plots the median of the results from individual patients. 1(a) and 1(c)
show the median of the median hourly % error for each patient. 1(b) and 1(d) show the
median range of the 90% confidence interval in hourly % error for each patient. Smaller
(tighter) range means tighter distribution with less outliers.
19
(a) Prediction error (%)
(b) Fitting error (%)
Figure 2: Cumulative distribution functions (cdf) of by-cohort prediction and fitting errors
with different combinations of pG and EGPb. Every hourly error contribute to the cdf.
model are shown in Figure 3. It can be seen that nI = 0.003 min−1 provides
the best predictive performance while fitting error is low through the entire
range.
Patient 5004 is shown in Figure 4 as an example of typical model fit using
the fully identified ICING model. The results show the model is capable
of capturing the patient’s highly variable dynamics during critical illness,
20

(a) Fitting Error (%) (b) Prediction Error (%)
Figure 3: Fitting and prediction error from nI grid search.
particularly from the 50th hour to the end of the patient’s stay, where the
insulin requirement varied significantly from hour to hour.
In Figure 4, only end-of-hour insulin levels in plasma and interstitial are
plotted for readability. The response curves from insulin injections plotted
by the minute can be seen in Figure 5. The impact of nI on modeled insulin
can be seen with two different values used. The receptor bound insulin us-
ing nI = 0.0476 min−1 from Lotz et al. [38] peaks and decays a lot faster
than having the smaller nI = 0.003 min−1 found in grid search. More im-
portantly, the large nI value does not allow receptor-bound insulin levels to
accumulate over time. Applying this large nI value, the model fails to cap-
ture a patient’s long term glucose-insulin response. The per-patient fitting
error also increases to 5.32 [IQR 0.98, 9.70]% from 2.80 [IQR 1.18, 6.41]%.
More specifically, over 25% of the hourly modeled BG fails to capture clinical
21

Figure 4: Model simulation results on Patient 5004 using the parameters identified for the
ICING model. Only end-of hour data are plotted for readability. In the top panel, the
solid line (–) illustrates the blood glucose model simulation while crosses (×) represents
the actual blood glucose measurements. The second panel demonstrates the plasma insulin
appearance (–) and plasma glucose appearance (· · ·). The third panel shows the interstitial
insulin (–) and the effective (receptor-bound) interstitial insulin (· · ·). Model fitted insulin
sensitivity is displayed in the bottom panel.
22

measurements, which typically have a measurement error of 7%.
Figure 5: Dose response curves of plasma insulin and receptor bound interstitial insulin
from an insulin injection of 3U at the beginning of each hour.
The improvements in model performance from the the ICU model, through
improvements in glucose compartment (Stage 1), and finally the ICING
model in Equations (9)–(15) are shown in Table 2. The table shows the
median and IQR for absolute percentage model fit and predictive error for
the total 42941 hours of clinical data from 173 patients. Results are shown on
both per-patient and by cohort basis to highlight any inter- and intra-patient
variability in model performance.
The final model achieved improvements in performance compared to the
23

ICU model in Equations (1)–(5). The predictive ability of the ICING model
improved significantly with much lower median prediction errors. More im-
portantly, the spread of error is tighter, evident by a much lower upper
quartile (75th percentile) error, which is now within measurement error for
both by-cohort and per-patient results. The main reduction is in the upper
quartile cohort prediction error, which is reduced to 6.47% from 10.64%, in-
dicating significantly better management of inter-patient variability in the
final model.
Main results in Table 2 show:
1. Improvement in glucose compartment reduces intra-patient variabil-
ity with lower per-patient upper quartile prediction.
2. Finalised ICING model reduces inter-patient variability with lower
upper quartile by-cohort prediction errors.
4.3. Re-Identification of pG and EGPb
Grid search for the re-identification of pG and EGPb near the previously
identified [pG, EGPb] = [0.006, 1.16] from Section 4.1 re-affirm these val-
ues. This combination of pG and EGPb values provides very low fitting and
prediction errors in the grid search region, and does not require adjustments.
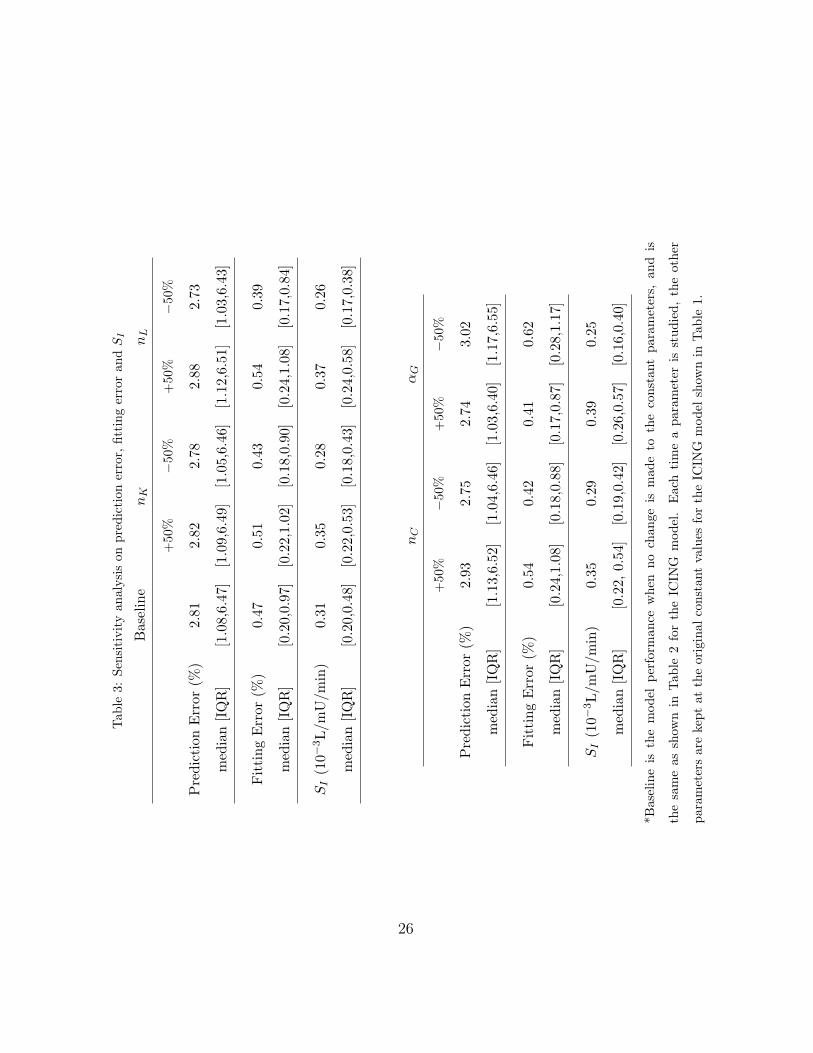
4.4. Parameter Sensitivity
The parameter sensitivity study results for nK , nL, nC and αG are shown
in Table 3. Changes of ±50% from their final parameter values for the ICING
model in Table 1 have no clinically (as opposed to statistically) significant
effect on simulation results in terms of prediction error, fitting error and
24

Table 2: Comparison of median and IQR for prediction and fitting error
Prediction Error (%) median [IQR]
Improved GlucoseOriginal ICU Model Compartment ICING Model
Per-Patient# 5.90 [4.75,7.51] 5.23 [4.20,6.36] 2.80 [1.18,6.41]
By Cohort+ 5.59 [2.46,10.64] 5.02 [2.11,10.34] 2.81 [1.08,6.47]
Fitting Error (%) median [IQR]
Per-Patient# 1.11 [0.84,1.63] 0.86 [0.58,1.18] 0.50 [0.21,0.99]
By Cohort+ 1.02 [0.41,1.94] 0.71 [0.23,1.44 ] 0.47 [0.20,0.97]
SI (10−3 L/mU/min) median [IQR]
Per-Patient# 0.25 [0.11,0.45] 0.21 [0.13,0.41] 0.31 [0.23,0.40]
By Cohort+ 0.24 [0.14,0.40] 0.21 [0.14,0.32] 0.31 [0.20,0.48]
# Per-patient analysis weights each patient equally, indicating inter-patient variability.+ By-cohort analysis weights each hour of data equally, indicating intra-patient
variability.
identified insulin sensitivity, SI . The values for pG, EGPb and nI are 0.006
[1/min], 1.16 [mmol/min] and 0.003 [1/min] respectively. These sensitivity
study results suggest nK , nL, nC and αG can be fixed at their current popu-
lation values without over simplifying the model. However, αG does produce
a notable shift in insulin sensitivity, SI as expected, given their trade-off
relationship mathematically. A previous study showed changes in αG pro-
duce a magnification in insulin sensitivity SI without compromising model
performance unless it approaches non-physiological levels [79].
25
Tab
le3:
Sens
itiv
ity
anal
ysis
onpr
edic
tion
erro
r,fit
ting
erro
ran
dS
I
Bas
elin
enK
nL
+50
%−
50%
+50
%−
50%
Pre
dict
ion
Err
or(%
)2.
812.
822.
782.
882.
73
med
ian
[IQ
R]
[1.0
8,6.
47]
[1.0
9,6.
49]
[1.0
5,6.
46]
[1.1
2,6.
51]
[1.0
3,6.
43]
Fit
ting
Err
or(%
)0.
470.
510.
430.
540.
39
med
ian
[IQ
R]
[0.2
0,0.
97]
[0.2
2,1.
02]
[0.1
8,0.
90]
[0.2
4,1.
08]
[0.1
7,0.
84]
SI
(10−
3L
/mU
/min
)0.
310.
350.
280.
370.
26
med
ian
[IQ
R]
[0.2
0,0.
48]
[0.2
2,0.
53]
[0.1
8,0.
43]
[0.2
4,0.
58]
[0.1
7,0.
38]
nC
αG
+50
%−
50%
+50
%−
50%
Pre
dict
ion
Err
or(%
)2.
932.
752.
743.
02
med
ian
[IQ
R]
[1.1
3,6.
52]
[1.0
4,6.
46]
[1.0
3,6.
40]
[1.1
7,6.
55]
Fit
ting
Err
or(%
)0.
540.
420.
410.
62
med
ian
[IQ
R]
[0.2
4,1.
08]
[0.1
8,0.
88]
[0.1
7,0.
87]
[0.2
8,1.
17]
SI
(10−
3L
/mU
/min
)0.
350.
290.
390.
25
med
ian
[IQ
R]
[0.2
2,0.
54]
[0.1
9,0.
42]
[0.2
6,0.
57]
[0.1
6,0.
40]
*Bas
elin
eis
the
mod
elpe
rfor
man
cew
hen
noch
ange
ism
ade
toth
eco
nsta
ntpa
ram
eter
s,an
dis
the
sam
eas
show
nin
Tab
le2
for
the
ICIN
Gm
odel
.E
ach
tim
ea
para
met
eris
stud
ied,
the
othe
r
para
met
ers
are
kept
atth
eor
igin
alco
nsta
ntva
lues
for
the
ICIN
Gm
odel
show
nin
Tab
le1.
26

5. Discussion
The new ICING model presented in this study is an integration and im-
provement of two clinically validated glucose-insulin physiological models
[27, 38]. This new model has more explicit physiological relevance with-
out increasing the number of patient-specific parameters to be identified. In
particular, the insulin kinetics is expressed with distinctive routes for insulin
clearance and transport from plasma, which reflects biological mechanisms.
A more realistic model for gastric glucose absorption accounting for the stom-
ach, gut and saturable glucose appearance is also introduced.
Parameters for endogenous glucose removal pG, and basal endogenous
glucose production EGPb trade off each other. Therefore, it is important
that they are identified as a pair. The definition for EGPb implies this pa-
rameter stays constant for any given patient. The decision to keep pG as a
constant is based on its relatively constant behaviour in ICU patients [39].
Grid analysis for the identification of pG and EGPb as constants popula-
tion parameters found the most suitable combination of parameter values in
reported physiological ranges [32, 48, 74, 76].
Many models have tried to include an estimated time-varying function
for endogenous glucose production, typically for use in experimental tracer
studies [80, 81, 82, 83]. Others developed functions based on study data
[34, 84, 85, 86, 87]. In reality, tracer studies require different assumptions
depending on experimental settings, and results are highly variable between
individuals and influenced by different conditions [75, 88, 89, 90, 91, 92]. This
study uses a basal endogenous glucose production EGPb as a constant in the
mathematical model. This choice allows the variation in actual endogenous
27

glucose production be described by combining EGPb, variable suppression
via pG and G, and also SI and I. More importantly, this approach allows
SI be uniquely identified given the available data is limited to 1-2 hourly
BG measurements. The value for pG found in this study is somewhat at the
lower end of the range found in other studies [32, 76, 77, 78]. It is suspected
for hyperglycaemic ICU patients that the suppression of EGP by plasma
glucose levels is minimized compared to otherwise healthy subjects, which
has been reported elsewhere due to high levels of circulating catecholamines,
thus reducing the suppression of EGP from elevated G and I [2, 3, 93, 94, 95].
Glucose uptake is strongly correlated with interstitial insulin [96]. How-
ever, interstitial insulin concentrations and dynamics are difficult or impos-
sible to measure experimentally. This study attempted to find a realistic
description of interstitial insulin by linking plasma insulin and BG response
through known biological mechanisms and parameter identification. The dif-
fusion rate between plasma and the interstitial space nI , was identified as
the critical parameter, and its population value is chosen using grid search.
The identified optimal parameter value provided low fitting and prediction
error in BG and particularly reduced inter-patient variability in prediction
error.
“Effective” insulin half lives have been reported to be between 25–130
mins (k in Equation (16) or nI + nC in Equation (17) to be between 0.0277–
0.0053 min−1) [31, 97, 98]. The value for k in the Critical Care Model was
0.0198 min−1, which corresponds to a interstitial half life of 35 mins. The
value for nI +nC in the ICING model is 0.006 since nI = nC = 0.003 min−1,
and correspond to a half life of 115.5 mins. The half lives from both models,
28
although both within the reported ranges, were on the opposite ends of the
spectrum. However, when k was chosen for the Critical Care Model, clinical
data were limited for its optimization [27, 36, 44]. The grid search on nI
performed in this study clearly optimized this value for model performance
using currently available data.
The value for nI identified for the new model is very low compared to that
of Lotz et al. [38, 70] (0.003 v.s. ∼0.0476 min−1). Lotz et al. [38, 70] used
a method to calculate nI adopted from Van Cauter et al. [54]. This method
estimates nI from an individual’s age, sex, weight, BSA, BMI and diagnosis
of type 2 diabetes, developed using a model for C-peptide and its measure-
ments. However, the nI population value calculated using this method fails
to capture long term blood glucose-insulin dynamics. Specifically, insulin
“pooling” and delayed utilization effects have been observed in critically ill
patients by Doran et al. [47, 99]. With nI at such a high value, these features
are lost from the model because the modeled insulin degradation is too fast.
Note that given nI = nC = 0.0476 min−1, the interstitial half life of insulin
from Lotz et al. [38] is more than 3 times shorter than the shortest reported
time.
The discrepancy between nI found in this study and Lotz el al. [38] may
have several explanations. These explanations include inherently different
plasma-interstitium diffusion rates under critical illness and insulin diffusion
across barrier being a saturable process. The latter possibility arises because
the experimental diffusion rates are determined by using C-peptide measure-
ments. Although C-peptide has very similar molecular properties to insulin,
it does not go through a high and variable degree of first pass extraction in
29

the portal vein [54]. Therefore its concentration is several folds higher than
insulin in plasma. If the diffusion process is to any level saturable [50], the
rates determined using C-peptide measurements will not be reflective of in-
sulin. In addition, the plasma concentration achieved in critically ill patients
is very different to that in EIC experiments or otherwise healthy diabetic in-
dividuals. Patients in [70] were subjected to an overnight fast. Hence, their
plasma concentrations are relatively low and diffusion rates are faster for the
short, very low insulin dose tests used in that research. In contrast, criti-
cally ill patients are often hyperinsulinaemic and infused with large amount
of insulin. These ideas need to be further investigated with more insulin and
C-peptide studies.
A further important issue addressed throughout this study is model iden-
tifiability. Given the limited data available, it is crucial to maintain a
model that is uniquely identifiable with bedside (glucose) measurements. Al-
though the model presented in this study requires many population assump-
tions, and resulted in a much simpler structure compared to many others
[33, 34, 35, 100], it is able to accurately capture the highly dynamic response
in critical illness. It is the authors’ conclusion that given limited data in a
noisy and highly variable environment, such as critical care, a model that
requires the minimal number of parameters to be identified will potentially
cope most successfully both mathematically and clinically. Given all the pa-
rameters kept as population constants have been carefully studied and their
sensitivity analysed, this paper presents a clinically applicable yet compre-
hensive glucose-insulin model that is uniquely identifiable for each patient
at any given time. The low, and more importantly tightly distributed, pre-
30

diction errors, where few fail to be within the clinical measurement error
of 7-12% [13, 27], indicates the model is well suited for use in real-time,
patient-specific TGC.
However, all models have limitations and this model would benefit from
further investigation into some parameters. The critical parameters are those
that influence the shape of Q/(1+αGQ), as this level is the ultimate unknown
(being unmeasurable) and the critical link between insulin and BG response.
These parameters are effectively nI and αG, as the parameters that only
appear in the plasma insulin equation (Equation (11)) can be more readily
identified given insulin and C-peptide measurements. Simulation studies
had been carried out to investigate the impact of these parameters, namely
“effective” insulin half life and insulin-stimulated glucose removal saturation
[44, 79]. Both variables have direct impact on SI . However, given that both
parameters are kept in reported range of physiological levels, their variation
simply creates a shift or magnification in the identified SI profiles and do
not compromise model fitting or prediction performance. Ultimately, it is
the control, or prediction performance, that is the most critical for a model
designed for model-based therapeutics.
6. Conclusions
A new, more comprehensive glucose-insulin model is presented and val-
idated using data from critically ill patients. The model is capable of ac-
curately capturing long term dynamics and evolution of a critically ill pa-
tient’s glucose-insulin response. Insulin sensitivity SI is the only parameter
that is identified hourly for each individual. Its identification is guaranteed
31

to be unique given the integral fitting method used in this study. Popu-
lation constant parameters pG, EGPb and nI have been identified in steps
to avoid model identifiability issues. Parameter sensitivity analysis further
confirms the validity of limiting time-varying parameters to SI only. The
model achieved low fitting and, most importantly, low prediction error when
fitted to blood glucose data from critically ill patients. Fitting errors and
the 75th percentile prediction errors were all well below measurement error
for 173 patient and 42,941 hours of data. The new model outperforms its
critical care predecessors, and has greater physiological relevance and more
detailed insulin kinetics. This model therefore offers a platform to develop
robust insulin therapies for tight glycaemic control.
References
[1] G. Van Den Berghe, P. Wouters, F. Weekers, C. Verwaest, F. Bruyn-
inckx, M. Schetz, D. Vlasselaers, P. Ferdinande, P. Lauwers, R. Bouil-
lon, Intensive insulin therapy in the critically ill patients, The New
England Journal of Medicine 345 (19) (2001) 1359–67.
[2] B. Bistrian, Hyperglycemia and Infection: Which is the Chicken and
Which is the Egg?, J Parenter Enteral Nutr 25 (4) (2001) 180–181.
[3] K. McCowen, C. Friel, J. Sternberg, S. Chan, R. Forse, P. Burke, B. Bis-
trian, Hypocaloric total parenteral nutrition: effectiveness in preven-
tion of hyperglycemia and infectious complications–a randomized clin-
ical trial, Crit Care Med 28 (11) (2000) 3606–11.
[4] M. J. Schultz, M. J. de Graaff, M. A. Kuiper, P. E. Spronk, The
32
new Surviving Sepsis Campaign recommendations on glucose control
should be reconsidered, Intensive Care Med 34 (4) (2008) 779–80, doi:
10.1007/s00134-008-1027-6.
[5] G. Van Den Berghe, A. Wilmer, I. Milants, P. J. Wouters, B. Bouck-
aert, F. Bruyninckx, R. Bouillon, M. Schetz, Intensive insulin therapy
in mixed medical/surgical intensive care units: benefit versus harm,
Diabetes 55 (11) (2006) 3151–9, doi:10.2337/db06-0855.
[6] J.-C. Preiser, NICE-SUGAR: the end of a sweet dream?, Critical Care
13 (3) (2009) 143, doi:10.1186/cc7790.
[7] P. Kalfon, J.-C. Preiser, Tight glucose control: should we move from
intensive insulin therapy alone to modulation of insulin and nutritional
inputs?, Critical Care 12 (3) (2008) 156, doi:10.1186/cc6915.
[8] J.-C. Preiser, P. Devos, Clinical experience with tight glucose control
by intensive insulin therapy, Critical Care Medicine 35 (9 Suppl) (2007)
S503–7, doi:10.1097/01.CCM.0000278046.24345.C7.
[9] J. G. Chase, G. M. Shaw, Is there more to glycaemic control than meets
the eye?, Critical Care 11 (4) (2007) 160, doi:10.1186/cc6099.
[10] I. Vanhorebeek, L. Langouche, G. Van Den Berghe, Tight blood glu-
cose control: What is the evidence?, Critical Care Medicine 35 (Suppl)
(2007) S496–S502, doi:10.1097/01.CCM.0000278051.48643.91.
[11] E. S. Moghissi, M. T. Korytkowski, M. DiNardo, D. Einhorn, R. Hell-
man, I. B. Hirsch, S. E. Inzucchi, F. Ismail-Beigi, M. S. Kirkman,
33

G. E. Umpierrez, American Association of Clinical Endocrinologists
and American Diabetes Association consensus statement on inpatient
glycemic control, Endocr Practice 15 (4) (2009) 353–69.
[12] G. Van Den Berghe, A. Wilmer, G. Hermans, W. Meersseman, P. J.
Wouters, I. Milants, E. V. Wijngaerden, H. Bobbaers, R. Bouillon,
Intensive insulin therapy in the medical ICU, The New England Journal
of Medicine 354 (5) (2006) 449–61, doi:10.1056/NEJMoa052521.
[13] J. Chase, G. Shaw, A. J. Le Compte, T. Lonergan, M. Willacy,
X. Wong, J. Lin, T. Lotz, D. Lee, C. E. Hann, Implementation and
evaluation of the SPRINT protocol for tight glycaemic control in crit-
ically ill patients: a clinical practice change, Crit Care 12 (2) (2008)
R49, doi:10.1186/cc6868.
[14] J. S. Krinsley, Effect of an intensive glucose management protocol on
the mortality of critically ill adult patients, Mayo Clin Proc 79 (8)
(2004) 992–1000.
[15] The NICE-SUGAR Study Investigators, Intensive versus Conventional
Glucose Control in Critically Ill Patients, The New England Journal of
Medicine 360 (13) (2009) 1283–97, doi:10.1056/NEJMoa0810625.
[16] R. Shulman, S. J. Finney, C. O’Sullivan, P. A. Glynne, R. Greene,
Tight glycaemic control: a prospective observational study of a com-
puterised decision-supported intensive insulin therapy protocol, Criti-
cal Care 11 (4) (2007) R75, doi:10.1186/cc5964.
34

[17] F. M. Brunkhorst, C. Engel, F. Bloos, A. Meier-Hellmann, M. Ra-
galler, N. Weiler, O. Moerer, M. Gruendling, M. Oppert, S. Grond,
D. Olthoff, U. Jaschinski, S. John, R. Rossaint, T. Welte, M. Schaefer,
P. Kern, E. Kuhnt, M. Kiehntopf, C. Hartog, C. Natanson, M. Loef-
fler, K. Reinhart, for the German Competence Network Sepsis (Sep-
Net), Intensive insulin therapy and pentastarch resuscitation in severe
sepsis, The New England Journal of Medicine 358 (2) (2008) 125–39,
doi:10.1056/NEJMoa070716.
[18] G. De La Rosa, J. Donado, A. Restrepo, A. Quintero, L. Gonzalez,
N. Saldarriaga, M. Bedoya, J. Toro, J. Velasquez, J. Valencia,
C. Arango, P. Aleman, E. Vasquez, J. Chavarriaga, A. Yepes,
W. Pulido, C. Cadavid, Grupo de Investigacion en Cuidado inten-
sivo: GICI-HPTU, Strict glycaemic control in patients hospitalised in
a mixed medical and surgical intensive care unit: a randomised clinical
trial, Critical Care 12 (5) (2008) R120, doi:10.1186/cc7017.
[19] R. S. Wiener, D. C. Wiener, R. J. Larson, Benefits and risks of tight
glucose control in critically ill adults: a meta-analysis, JAMA 300 (8)
(2008) 933–44, doi:10.1001/jama.300.8.933.
[20] M. Treggiari, V. Karir, N. Yanez, N. Weiss, Intensive insulin therapy
and mortality in critically ill patients, Crit Care 12 (1) (2008) R29.
[21] D. E. G. Griesdale, R. J. de Souza, R. M. van Dam, D. K. Heyland, D. J.
Cook, A. Malhotra, R. Dhaliwal, W. R. Henderson, D. R. Chittock,
S. Finfer, D. Talmor, Intensive insulin therapy and mortality among
35

critically ill patients: a meta-analysis including NICE-SUGAR study
data, CMAJ 180 (8) (2009) 821–7, doi:10.1503/cmaj.090206.
[22] M. Brownlee, Biochemistry and molecular cell biology of diabetic com-
plications, Nature 414 (6865) (2001) 813–20, doi:10.1038/414813a.
[23] I. Hirsch, M. Brownlee, Should minimal blood glucose variability be-
come the gold standard of glycemic control?, J Diabetes Complications
19 (3) (2005) 178–81.
[24] M. Egi, R. Bellomo, E. Stachowski, C. French, G. Hart, Variability of
blood glucose concentration and short-term mortality in critically ill
patients, Anesthesiology 105 (2) (2006) 244–52.
[25] J. G. Chase, S. Andreassen, K. Jensen, G. M. Shaw, Impact of human
factors on clinical protocol performance: a proposed assessment frame-
work and case examples, Journal of Diabetes Science and Technology
2 (3) (2008) 409–16.
[26] D. Aragon, Evaluation of nursing work effort and perceptions about
blood glucose testing in tight glycemic control, Am J Crit Care 15 (4)
(2006) 370–7.
[27] J. G. Chase, G. M. Shaw, T. Lotz, A. J. Le Compte, J. Wong, J. Lin,
T. Lonergan, M. Willacy, C. E. Hann, Model-based insulin and nutri-
tion administration for tight glycaemic control in critical care, Current
Drug Delivery 4 (4) (2007) 283–96.
36

[28] J. G. Chase, G. Shaw, X. Wong, T. Lotz, J. Lin, C. E. Hann, Model-
based Glycaemic Control in Critical Care - A review of the state of the
possible, Biomedical Signal Processing & Control 1 (1) (2006) 3–21.
[29] R. Hovorka, J. Kremen, J. Blaha, M. Matias, K. Anderlova, L. Bosan-
ska, T. Roubicek, M. E. Wilinska, L. J. Chassin, S. Svacina, M. Haluzik,
Blood glucose control by a model predictive control algorithm with
variable sampling rate versus a routine glucose management protocol
in cardiac surgery patients: a randomized controlled trial, The Jour-
nal of Clinical Endocrinology and Metabolism 92 (8) (2007) 2960–4,
doi:10.1210/jc.2007-0434.
[30] A. Le Compte, J. G. Chase, A. Lynn, C. E. Hann, G. Shaw, X.-W.
Wong, J. Lin, Blood Glucose Controller for Neonatal Intensive Care:
Virtual Trials Development and First Clinical Trials, Journal of Dia-
betes Science and Technology 3 (5) (2009) 1066–1081.
[31] A. Mari, A. Valerio, A Circulatory Model for the Estimation of Insulin
Sensitivity, Control Eng Practice 5 (12) (1997) 1747–1752.
[32] R. Bergman, L. Phillips, C. Cobelli, Physiologic evaluation of factors
controlling glucose tolerance in man: measurement of insulin sensitiv-
ity and beta-cell glucose sensitivity from the response to intravenous
glucose, J Clin Invest 68 (6) (1981) 1456–1467.
[33] R. S. Parker, F. J. Doyle, Control-relevant modeling in drug delivery,
Advanced Drug Delivery Reviews 48 (2-3) (2001) 211–28.
37

[34] R. Hovorka, L. J. Chassin, M. Ellmerer, J. Plank, M. E. Wilinska, A
simulation model of glucose regulation in the critically ill, Physiological
Measurement 29 (8) (2008) 959–78, doi:10.1088/0967-3334/29/8/008.
[35] R. Hovorka, L. J. Chassin, M. E. Wilinska, V. Canonico, J. A. Akwi,
M. O. Federici, M. Massi-Benedetti, I. Hutzli, C. Zaugg, H. Kaufmann,
M. Both, T. Vering, H. C. Schaller, L. Schaupp, M. Bodenlenz, T. R.
Pieber, Closing the loop: the adicol experience, Diabetes Technology
& Therapeutics 6 (3) (2004) 307–18, doi:10.1089/152091504774197990.
[36] X. Wong, I. Singh-Levett, L. Hollingsworth, G. Shaw, C. E. Hann,
T. Lotz, J. Lin, O. Wong, J. G. Chase, A novel, model-based insulin
and nutrition delivery controller for glycemic regulation in critically ill
patients, Diabetes Technol Ther 8 (2) (2006) 174–90.
[37] J. Lin, D. Lee, J. G. Chase, G. M. Shaw, A. J. Le Compte, T. Lotz,
J. Wong, T. Lonergan, C. E. Hann, Stochastic modelling of insulin
sensitivity and adaptive glycemic control for critical care, Computer
Methods and Programs in Biomedicine 89 (2) (2008) 141–52, doi:
10.1016/j.cmpb.2007.04.006.
[38] T. F. Lotz, J. G. Chase, K. A. McAuley, G. M. Shaw, X.-W. Wong,
J. Lin, A. J. Le Compte, C. E. Hann, J. I. Mann, Monte Carlo analy-
sis of a new model-based method for insulin sensitivity testing, Com-
puter Methods and Programs in Biomedicine 89 (3) (2008) 215–25,
doi:10.1016/j.cmpb.2007.03.007.
[39] C. E. Hann, J. G. Chase, J. Lin, T. Lotz, C. V. Doran, G. M.
38

Shaw, Integral-based parameter identification for long-term dynamic
verification of a glucose-insulin system model, Computer Meth-
ods and Programs in Biomedicine 77 (3) (2005) 259–70, doi:
10.1016/j.cmpb.2004.10.006.
[40] J. Lin, D. Lee, J. Chase, G. Shaw, C. E. Hann, T. Lotz, J. Wong,
Stochastic modelling of insulin sensitivity variability in critical care,
Biomedical Signal Processing and Control 1 (3) (2006) 229–242, doi:
10.1016/j.bspc.2006.09.003.
[41] T. Lotz, J. G. Chase, K. McAuley, D. Lee, J. Lin, C. E. Hann, J. Mann,
Transient and steady-state euglycemic clamp validation of a model for
glycemic control and insulin sensitivity testing, Diabetes Technology
and Therapeutics 8 (3) (2006) 338–46.
[42] T. Lotz, U. Goltenbott, J. G. Chase, P. Docherty, C. E. Hann, A min-
imal C-peptide sampling method to capture peak and total prehepatic
insulin secretion in model-based experimental insulin sensitivity stud-
ies, Journal of Diabetes Science and Technology 3 (4) (2009) 875–86.
[43] P. D. Docherty, J. G. Chase, T. Lotz, C. E. Hann, G. M. Shaw, J. Berke-
ley, J. I. Mann, K. A. McAuley, DISTq: An iterative analysis of glucose
data for low-cost, real-time and accurate estimation of insulin sensi-
tivity, The Open Medical Informatics Journal 3 (2009) 65–76, ISSN
1874-4311.
[44] J. G. Chase, G. Shaw, J. Lin, C. Doran, C. E. Hann, M. Robertson,
P. Browne, T. Lotz, G. Wake, B. Broughton, Adaptive bolus-based
39

targeted glucose regulation of hyperglycaemia in critical care, Med Eng
Phys 27 (1) (2005) 1–11.
[45] T. Lonergan, A. J. Le Compte, M. Willacy, J. G. Chase, G. M. Shaw,
X.-W. Wong, T. Lotz, J. Lin, C. E. Hann, A simple insulin-nutrition
protocol for tight glycemic control in critical illness: development and
protocol comparison, Diabetes Technol Ther 8 (2) (2006) 191–206, doi:
10.1089/dia.2006.8.191.
[46] T. Lonergan, A. J. Le Compte, M. Willacy, J. G. Chase, G. M. Shaw,
X.-W. Wong, T. Lotz, J. Lin, C. E. Hann, A Pilot Study of the SPRINT
Protocol for Tight Glycaemic Control in Critically Ill Patients, Dia-
betes Technology and Therapheutics 8 (4) (2006) 449–462.
[47] C. Doran, N. Hudson, K. Moorhead, J. G. Chase, G. Shaw, C. E. Hann,
Derivative weighted active insulin control modelling and clinical trials
for ICU patients, Med Eng Phys 26 (10) (2004) 855–66.
[48] A. Blakemore, S.-H. Wang, A. J. Le Compte, G. M. Shaw, X.-W.
Wong, J. Lin, T. Lotz, C. E. Hann, J. G. Chase, Model-Based Insulin
Sensitivity as a Sepsis Diagnostic in Critical Care, Journal of Diabetes
Science and Technology 2 (3) (2008) 468–177.
[49] J. Chase, S. Andreassen, U. Pielmeier, C. E. Hann, K. McAuley,
J. Mann, A glucose-insulin pharmacodynamic surface modeling vali-
dation and comparison of metabolic system models, Biomedical Signal
Processing and Control 4 (4) (2009) 355–363.
40

[50] B. Thorsteinsson, Kinetic models for insulin disappearance from
plasma in man, Dan Med Bull 37 (2) (1990) 143–53.
[51] E. Ferrannini, C. Cobelli, The kinetics of insulin in man. II. Role of
the liver, Diabetes Metab Rev 3 (2) (1987) 365–97.
[52] E. Ferrannini, C. Cobelli, The kinetics of insulin in man. I. General
aspects, Diabetes Metab Rev 3 (2) (1987) 335–63.
[53] G. Toffolo, M. Campioni, R. Basu, R. Rizza, C. Cobelli, A minimal
model of insulin secretion and kinetics to assess hepatic insulin extrac-
tion, Am J Physiol Endocrinol Metab 290 (1) (2006) E169–E176.
[54] E. Van Cauter, F. Mestrez, J. Sturis, K. Polonsky, Estimation of insulin
secretion rates from C-peptide levels. Comparison of individual and
standard kinetic parameters for C-peptide clearance, Diabetes 41 (3)
(1992) 368–77.
[55] X.-W. Wong, J. G. Chase, C. E. Hann, T. F. Lotz, J. Lin, A. J.
Le Compte, G. M. Shaw, Development of a Clinical Type 1 Diabetes
Metabolic System Model and in Silico Simulation Tool, Journal of Di-
abetes Science and Technology 2 (3) (2008) 424–435.
[56] S. G. Hasselbalch, G. M. Knudsen, C. Videbaek, L. H. Pinborg, J. F.
Schmidt, S. Holm, O. B. Paulson, No effect of insulin on glucose blood-
brain barrier transport and cerebral metabolism in humans, Diabetes
48 (10) (1999) 1915–21.
[57] S. G. Hasselbalch, P. L. Madsen, G. M. Knudsen, S. Holm, O. B.
Paulson, Calculation of the FDG lumped constant by simultaneous
41

measurements of global glucose and FDG metabolism in humans, J
Cereb Blood Flow Metab 18 (2) (1998) 154–60.
[58] S. G. Hasselbalch, P. L. Madsen, L. P. Hageman, K. S. Olsen, N. Juste-
sen, S. Holm, O. B. Paulson, Changes in cerebral blood flow and carbo-
hydrate metabolism during acute hyperketonemia, Am J Physiol 270 (5
Pt 1) (1996) E746–51.
[59] A. D. Baron, G. Brechtel, P. Wallace, S. V. Edelman, Rates and tissue
sites of non-insulin- and insulin-mediated glucose uptake in humans,
Am J Physiol 255 (6 Pt 1) (1988) E769–74.
[60] H. Takeshita, Y. Okuda, A. Sari, The effects of ketamine on cerebral
circulation and metabolism in man, Anesthesiology 36 (1) (1972) 69–
75.
[61] P. J. Cohen, S. C. Alexander, T. C. Smith, M. Reivich, H. Woll-
man, Effects of hypoxia and normocarbia on cerebral blood flow and
metabolism in conscious man, Journal of Applied Physiology 23 (2)
(1967) 183–9.
[62] G. Strauss, K. Moller, F. Larsen, J. Kondrup, G. M. Knudsen, Cere-
bral glucose and oxygen metabolism in patients with fulminant hepatic
failure, Liver Transplantation 9 (12) (2003) 1244–1252.
[63] N. Hattori, S.-C. Huang, H.-M. Wu, E. Yeh, T. C. Glenn, P. M. Vespa,
D. McArthur, M. E. Phelps, D. A. Hovda, M. Bergsneider, Correlation
of Regional Metabolic Rates of Glucose with Glasgow Coma Scale After
Traumatic Brain Injury, J Nucl Med 44 (11) (2003) 1709–16.
42

[64] E. M. Bingham, D. Hopkins, D. Smith, A. Pernet, W. Hallett, L. Reed,
P. K. Marsden, S. A. Amiel, The role of insulin in human brain glucose
metabolism: an 18fluoro-deoxyglucose positron emission tomography
study, Diabetes 51 (12) (2002) 3384–90.
[65] A. M. McCarthy, J. S. Elmendorf, GLUT4’s itinerary in health & dis-
ease, Indian J Med Res 125 (3) (2007) 373–88.
[66] L. J. Foster, A. Klip, Mechanism and regulation of GLUT-4 vesicle
fusion in muscle and fat cells, Am J Physiol, Cell Physiol 279 (4) (2000)
C877–90.
[67] N. J. Bryant, R. Govers, D. E. James, Regulated transport of the
glucose transporter GLUT4, Nat Rev Mol Cell Biol 3 (4) (2002) 267–
77, doi:10.1038/nrm782.
[68] S. K. Andersen, J. Gjedsted, C. Christiansen, E. Tønnesen, The roles of
insulin and hyperglycemia in sepsis pathogenesis, Journal of Leukocyte
Biology 75 (3) (2004) 413–21, doi:10.1189/jlb.0503195.
[69] W. C. Duckworth, R. G. Bennett, F. G. Hamel, Insulin degradation:
progress and potential, Endocr Rev 19 (5) (1998) 608–24.
[70] T. Lotz, High Resolution Clinical Model-Based Assessment of Insulin
Sensitivity, PhD Thesis, Mechanical Engineering, University of Can-
terbury, Christchurch, New Zealand .
[71] S. Gudbjornsdottir, M. Sjostrand, L. Strindberg, J. Wahren,
P. Lonnroth, Direct measurements of the permeability surface area for
43

insulin and glucose in human skeletal muscle, The Journal of Clinical
Endocrinology and Metabolism 88 (10) (2003) 4559–64.
[72] M. Sjostrand, A. Holmang, P. Lonnroth, Measurement of interstitial
insulin in human muscle, Am J Physiol 276 (1 Pt 1) (1999) E151–4.
[73] M. Sjostrand, A. Holmang, L. Strindberg, P. Lonnroth, Estimations
of muscle interstitial insulin, glucose, and lactate in type 2 diabetic
subjects, Am J Physiol Endocrinol Metab 279 (5) (2000) E1097–103.
[74] L. Tappy, M. Berger, J. M. Schwarz, M. McCamish, J. P. Revelly,
P. Schneiter, E. Jequier, R. Chiolero, Hepatic and peripheral glucose
metabolism in intensive care patients receiving continuous high- or low-
carbohydrate enteral nutrition, JPEN Journal of parenteral and enteral
nutrition 23 (5) (1999) 260–7.
[75] C. Chambrier, M. Laville, R. B. K, M. Odeon, P. Bouletreau, M. Bey-
lot, Insulin sensitivity of glucose and fat metabolism in severe sepsis,
Clin Sci 99 (4) (2000) 321–8.
[76] C. Cobelli, A. Caumo, M. Omenetto, Minimal model SG overestima-
tion and SI underestimation: improved accuracy by a Bayesian two-
compartment model, Am J Physiol 277 (3 Pt 1) (1999) E481–488.
[77] C. McDonald, A. Dunaif, D. Finegood, Minimal-model estimates of
insulin sensitivity are insensitive to errors in glucose effectiveness, J
Clin Endocrinol Metab 85 (7) (2000) 2504–2508.
[78] G. Pillonetto, G. Sparacino, P. Magni, R. Bellazzi, C. Cobelli, Minimal
model SI = 0 problem in NIDDM subjects: nonzero Bayesian estimates
44

with credible confidence intervals, Am J Physiol Endocrinol Metab
282 (3) (2002) E564–573.
[79] J. G. Chase, G. M. Shaw, J. Lin, C. V. Doran, M. Bloomfield, G. C.
Wake, B. Broughton, C. Hann, T. Lotz, Impact of Insulin-Stimulated
Glucose Removal Saturation on Dynamic Modelling and Control of Hy-
perglycaemia, International Journal of Intelligent Systems Technologies
and Applications (IJISTA) 1 (1/2) (2004) 79–94.
[80] C. Dalla Man, A. Caumo, R. Basu, R. Rizza, G. Toffolo, C. Cobelli,
Minimal model estimation of glucose absorption and insulin sensitivity
from oral test: validation with a tracer method, American Journal of
Physiology-Endocrinology and Metabolism 287 (4) (2004) E637–E643.
[81] A. Avogaro, P. Vicini, A. Valerio, A. Caumo, C. Cobelli, The hot
but not the cold minimal model allows precise assessment of insulin
sensitivity in NIDDM subjects, Am J Physiol 270 (3 Pt 1) (1996) E532–
40.
[82] A. Caumo, C. Cobelli, Hepatic glucose production during the labeled
IVGTT: estimation by deconvolution with a new minimal model, Am
J Physiol 264 (5 Pt 1) (1993) E829–41.
[83] A. Mari, J. Wahren, R. A. DeFronzo, E. Ferrannini, Glucose absorption
and production following oral glucose: comparison of compartmental
and arteriovenous-difference methods, Metab Clin Exp 43 (11) (1994)
1419–25.
45

[84] D. Araujo-Vilar, C. A. Rega-Liste, D. A. Garcia-Estevez, F. Sarmiento-
Escalona, V. Mosquera-Tallon, J. Cabezas-Cerrato, Minimal model of
glucose metabolism: modified equations and its application in the
study of insulin sensitivity in obese subjects, Diabetes Research and
Clinical Practice 39 (2) (1998) 129–41.
[85] U. Picchini, A. D. Gaetano, S. Panunzi, S. Ditlevsen, G. Mingrone,
A mathematical model of the Euglycemic Hyperinsulinemic Clamp,
Theor Biol Med Model 2 (2005) 44.
[86] E. Ruiz-Velazquez, R. Femat, D. Campos-Delgado, Blood glucose con-
trol for type I diabetes mellitus: A robust tracking H∞ problem, Con-
trol Engineering Practice 12 (2004) 1179–1195.
[87] H. E. Silber, P. M. Jauslin, N. Frey, R. Gieschke, U. S. H. Simonsson,
M. O. Karlsson, An integrated model for glucose and insulin regula-
tion in healthy volunteers and type 2 diabetic patients following in-
travenous glucose provocations, The Journal of Clinical Pharmacology
47 (9) (2007) 1159–71, doi:10.1177/0091270007304457.
[88] A. D. Cherrington, D. Edgerton, D. K. Sindelar, The direct and indirect
effects of insulin on hepatic glucose production in vivo, Diabetologia
41 (9) (1998) 987–96.
[89] M. Mevorach, A. Giacca, Y. Aharon, M. Hawkins, H. Shamoon, L. Ros-
setti, Regulation of endogenous glucose production by glucose per se is
impaired in Type 2 diabetes mellitus, The Journal of Clinical Investi-
gation 102 (4) (1998) 744–753.
46

[90] L. U. Monzillo, O. Hamdy, Evaluation of insulin sensitivity in clinical
practice and in research settings, Nutr Rev 61 (12) (2003) 397–412.
[91] A. Cherrington, Banting Lecture 1997. Control of glucose uptake and
release by the liver in vivo, Diabetes 48 (5) (1999) 1198–214.
[92] D. Elahi, G. Meneilly, K. Minaker, D. Andersen, J. Rowe, Escape of
hepatic glucose production during hyperglycemic clamp, Am J Physiol
257 (5 Pt 1) (1989) E704–11.
[93] B. Mizock, Alterations in fuel metabolism in critical illness: hypergly-
caemia, Best Pract Res Clin Endocrinol Metab 15 (4) (2001) 533–51.
[94] A. Thorell, O. Rooyackers, P. Myrenfors, M. Soop, J. Nygren,
O. Ljungqvist, Intensive insulin treatment in critically ill trauma pa-
tients normalizes glucose by reducing endogenous glucose production,
J Clin Endocrinol Metab 89 (11) (2004) 5382–6.
[95] K. M. Dungan, S. S. Braithwaite, J.-C. Preiser, Stress hyperglycaemia,
Lancet 373 (9677) (2009) 1798–807.
[96] R. Poulin, G. Steil, D. Moore, M. Ader, R. Bergman, Dynamics of
glucose production and uptake are more closely related to insulin in
hindlimb lymph than in thoracic duct lymph., Diabetes 43 (2) (1994)
180(11).
[97] A. Natali, A. Gastaldelli, S. Camastra, A. Sironi, E. Toschi, A. Masoni,
E. Ferrannini, A. Mari, Dose-response characteristics of insulin action
on glucose metabolism: a non-steady-state approach, Am J Physiol
Endocrinol Metab 278 (5) (2000) E794–801.
47

[98] K. Turnheim, W. Waldhausl, Essentials of insulin pharmacokinetics,
Wien Klin Wochenschr 100 (3) (1988) 65–72.
[99] C. Doran, J. G. Chase, G. Shaw, K. Moorhead, N. Hudson, Automated
insulin infusion trials in the intensive care unit, Diabetes Technol Ther
6 (2) (2004) 155–65.
[100] R. S. Parker, F. J. Doyle, N. A. Peppas, The intravenous route to blood
glucose control, IEEE engineering in medicine and biology magazine:
the quarterly magazine of the Engineering in Medicine & Biology So-
ciety 20 (1) (2001) 65–73.
48
Copyright © 2022 FDOKUMEN