A baseline study of trace metals in a coral reef sedimentary environment, Lakshadweep Archipelago
Upload
khangminh22Category
view
0download
0
JAMES COOK
UNIVERSITY
OF NORTH
QUEENSLAND
GEOMECHANICAL INVESTIGATION
OF CORAL REEF STRUCTURE
Report submitted to
GREAT BARRIER REEF MARINE PARK AUTHORITY,
TOWNSVILLE
by
Dr. Helmut Bock Senior Lecturer in Civil Engineering
DEPARTMENT OF CIVIL AND SYSTEMS
ENGINEERING

ACCESSION No.
"GEOMECHANICAL INVESTIGATION
OF CORAL REEF STRUCTURE"
Report submitted to
GREAT BARRIER REEF MARINE PARK AUTHORITY, TOWNSVILLE
By
Dr. Helmut Bock
Senior Lecturer in Civil Engineering
James Cook University of North Queensland
t

GBRMPA REPORT STATUS
TITLE: Engineering Properties of Coral Reefs.
AUTHOR: Dr H. Bock.
AUTHORITY ACCEPTANCE OF REPORT: MPA: 57
DATE: 8 December, 1982.
DECISION relating to acceptance of report:
The Authority accepted the report of the project specified above.
DECISION relating to publication of report:
(Parts of the report have been published elsewhere.) The Authority will not publish the report.
Name of Project Officer: Richard Kenchington.

With its letters of 22nd and 23rd March, 1979 the Great Barrier Reef
Marine Park Authority, Townsville granted funds in support of the
following two research projects:
"A Review of the Design and Construction Principles of
Structures on Coral Reefs" and
"Geomechanical Investigation of Coral Reef Structure".
These research projects have been continuously carried out throughout
the year 1979 with what is believed to be quite considerable success.
The results of this research are presented in three independent papers
which are enclosed in the appendix.
Appendix 1: Summarising the activities, referring to the principal
problems when building on coral reefs and presenting the main
results so far gained:
BOCK, H. & E.T. BROWN: "Foundation Properties of Coral Reefs -
Site Investigation Techniques and Preliminary Results".
Appendix 2: Referring to the site investigations on coral reefs
undertaken in the year 1979:
BILLINGHAM, S.L.: "The Study of Site Investigation Techniques
for determining the Engineering Properties of Coral Reefs".
Appendix 3: Referring to a Literature Study which made use of hardly
accessible documents in different governmental institutions
throughout Australia:
BULGARELLI, G.: "A Review of the Design and Construction Principles
of Structures on Coral Reefs".
Townsville, 20 December 1979
Dr. H. Bock Senior Lecturer in Engineering James Cook University of North Queensland

Appendix 1
BOCK, H. & E.T. BROWN:
"Foundation Properties of Coral Reefs - Site Investigation
Techniques and Preliminary Results".

To be published in
Proceed. Int. Conf. Structural Foundations on Rock, Sydney, Vol. 1 Rotterdam (Balkema) 1980
FOUNDATION PROPERTIES OF CORAL REEFS - SITE INVESTIGATION TECHNIQUES AND PRELIMINARY
RESULTS
H. Bock Department of Civil and Systems Engineering, James Cook University of North Queensland, Townsville, 4811, Australia
E.T. Brown Imperial College of Science and Technology, London, U.K.
SUMMARY Foundations on coral reefs are becoming prolific in different parts of the world. After discussing some general foundation problems which are encountered on reefs and referring to a number of actual cases, the paper outlines activities which have been undertaken within the Department of Civil and Systems Engineering of James Cook University, Townsville since 1972. The objective of these activities is the determination of the near-surface geotechnical properties of coral reefs, down to a depth of about 25 m. The work was and will continue to be carried out in Pursuit of the following two aims.
Its first objective is to study the feasibility of different site investigation tech-niques on coral reefs. A total of three techniques have been applied: diamond drill-ing, dynamic penetration and seismic refraction. It has been found that dynamic penetration is by far the best method of exploring the near-surface structure of coral reefs in detail. It is not only capable of penetrating through hard coral limestone but it also enables the determination of weak zones such as cavities or pockets of loose sand and it is these zones which will be critical for any foundation design. The second objective of the project is to gain more knowledge on the principal distrib-ution of the dominant geotechnical units (coral limestone, sand and cavities) over the area of an individual coral reef. For this, Keeper Reef (approximately 60 km north-east of Townsville) was systematically investigated alongside a section running from the outer reef into the lagoon. First results will be presented indicating that in both horizontal and vertical directions there are characteristic changes in the near-surface reef structure. The engineer should be familiar with these changes when planning a foundation on coral reefs.
1 INTRODUCTION
Coral reefs of one sort or another are found in all warmer oceans (Stoddart 1969; Ladd 1977). Major reef provinces are found in the Indian and Pacific Oceans, the Red Sea, the Caribbean and the Arabian Gulf. The world's largest coral province is Australia's Great Barrier Reef, so named by Captain James Cook in 1770.
Coral reefs and, in particular, The Great Barrier Reef have long been a source of great fascination and scientif-ic interest. Cook himself wrote in his journal of 17 April, 1777, "There are different opinions amongst ingenious theorists, concerning the formation of such low islands". In recent years,
however, coral reefs have become of increas-ing engineering interest. Because of the proximity of reefs to continental shore lines in certain parts of the world and because large numbers of coral islands exist in the Indian and Pacific Oceans and in the Caribbean, engineered structures are being increasingly founded on corals. A majority of these structures may be classed as marine structures (docks, jetties off-shore oil terminals, navigational aids). Some, such as a platform constructed as a scientific base in the Red Sea, are more exotic, while others, such as the multi-storey buildings and airports constructed on islands such as the Seychelles, are of a more conventional nature. In all cases, the unusual geotechnical properties of the coral deposits have caused construction difficulties.

This paper describes the research into the near-surface geotechnical properties of coral reefs that has been undertaken at James Cook University of North Queens-land in recent years. The authors' initial interest in the subject was stim-ulated by a request that they erect a radar beacon on The Great Barrier Reef off Townsville (Cameron 1975), but this experience soon led to the wider study of site investigation techniques for use on coral reefs that is reported herein.
2 THE NATURE AND GENESIS OF CORAL REEFS
Coral reefs are built in clear, warm, shallow water primarily by anthozoan corals of the class Scleractinia, of which the hermatypic of reef-building members are remarkable for their ability to construct massive skeletal structures of calcium carbonate (Stoddart 1969). Minor contributions to the accumulation of calcium carbonate are made by other corals and by other reef-dwelling organisms such as molluscs, foraminifera and algae. The calcium carbonate framework is capable of withstanding wave action and, as a result, may form topographic features which rise from the sea floor to sea level.
Following Darwin (1842), coral reefs were classically considered to be of three types - fringing reefs, barrier reefs and atolls. Darwin's concept was that fringing reefs are formed at shallow depths around landforms such as islands formed by the tips of submerged volcanoes. With continued subsidence of the land-mass (or rise in the sea level) and continued reef growth, a barrier reef is formed. Such reefs occur some distances from coasts, being separated from them by lagoons that are generally too deep to permit coral growth. As a final stage, the island becomes completely submerged, and a ring of coral or atoll, enclosing a salt water lagoon, is formed.
Recent workers in this field such as 4axwell (1968) and Stoddart (1969) have irawn a sharp distinction-between )ceanic reefs (the Darwinian fringing ind barrier reefs and atolls), and ontinental or shelf reefs found, as the lame implies, in the shallow waters of :ontinental shelves. The Great Barrier :eef is of this latter type. The Great arrier Reef has been most closely studied ly Maxwell (1968; 1973), who distinguished Kpme 13 morphological reef types, in ddition to fringing reefs bordering the oast and continental islands. The 13
types each belong to one of two major groupings - platform reefs and wall reefs. Platform reefs are formed when the factors controlling their development (water temperature, current and wind directions, topography) exert equal influence in all directions producing a roughly circular reef platform. A typical cross-section showing the various zones of such a reef is shown in Figure la. An important f eat-ure of many of these reefs is the hard algal rim that grows up to a metre above low tide level.
If, on the other hand, hydrologic and topographic influences cause the reef to develop in a preferred direction, a wall reef is produced. Keeper Reef, the subject of the site investigation studies to be reported below, is the "open-ring" variety of this type as indicated in Figure lb.
In addition to coral reefs, The Great Barrier Reef province also contains coral islands of a number of types.
Deep borings in reefs (Ladd et al. 1953; Traves 1960; Goodell et al. 1969) have conclusively confirmed the general argu-ment of Darwin that oceanic reefs developed by progressive subsidence of their foundat-ions. Such reefs may be hundreds, or even thousands, of metres thick. The deepest borehole in The Great Barrier Reef province was drilled to a depth of 578 m at Wreck Island in 1959 (Goodell & Garman 1969). This bore went through coral rock into quartz sandstone at 121 m and then through a series of sandstones and calcarenites reaching basement rocks at 547 m.
Darwin's theory was developed before the general recognition of continental glaciat-ion and the attendant shifts of sea level in the Pleistocene, and so omitted an Important control on the development of reefs. In a series of papers published between 1910 and 1920, R.A. Daly drew attention to the consequences of sea-level shifts on reef morphology and proposed a glacial control theory of coral reefs. Daly argued that marine abrasion during glacial low sea levels prepared platforms on which reefs grew in post-glacial time. Reefs were generally unable to grow during low sea levels because of lowered ocean temperatures and the presence of sediment in the water.
Although the details of Daly's theory have been shown to be deficient in many Important respects (Stoddart 1969), its essential concept is accepted. This has

-20
- 40
-60
Depth Em)
0
-20
-40
Em)
( b) Open Ring & Composite Apron Reefs
Off - reef
Floor
Off-reef Floor
Terraces
A 12 ,.., .7„
tcP .;§
k kr c_CP
(a) Platform Reef
Figure 1 Plans and cross section of two types of shelf reefs (a) Platform reef, (b) Open ring and composite apron reef. (After Maxwell 1968: 106)
important geotechnical implications in that disconformities in the reef sequence might be expected to be present at depths corresponding to previous sea-or erosional levels. There are conflicting interpretat-ions of the geological and geomorphological
- evidence (Stoddart 1969; Maxwell 1973) but according to most recent investigations, it appears that in The Great Barrier Reef such disconformity, formed during the Holocene transgression, might be expected at depths of approximately 20 m below present sea level (Davies et al. 1977; Thom et al. 1978).
The calcareous skeleton produced by the corals and other organisms is a structure high in pore space and often containing large cavities left between sections of the skeleton. As the reef grows upwards, these cavities, which generally have communicating passages with the sea, become filled with sediment, including reef fragments and coralline sand. Cementation of the mass takes place by a number of processes including chemical precipitation by circulating sea water and marine organ-isms. It has also been found that deeper in the reef, solution, particularly of residual aragonite, may take place. The reefs are also subject to attack by marine borers, and cycles of solution and reprec-ipitation may also accompany changes in sea level. The net result is that, although the coral in the upper 100 m or so becomes lithified into what Maxwell (1962) describes as shallow reef rock or algal-coral limestone, it may remain almost as porous as when it was first formed. The wide-spread presence of cav-ities, generally filled with sand, is a major geotechnical characteristic
of coral reefs (Field & Hess 1933; Broadhead 1970; Ridgway 1977; Dennis 1978).
3 ENGINEERED STRUCTURES FOUNDED ON CORAL
Drilling in coral and coralline sediments, for whatever purpose, is often fraught with difficulty. Core recoveries are low, runn-ing sands and hole collapses cause jamming and/or loss of the drill string, and drilling fluid circulation may be lost (Ladd et al. 1953; Field & Hess 1933; Broadhead 1970; Ridgway 1977). Pile-driving and grouting are also attended by difficulties associated with the porous and cavernous nature and vertical variabil-ity of the materials. As a result, contractors' claims for compensation for extra costs incurred by "unforeseen conditions" are not uncommon. For example the second author was recently involved in a major arbitration case arising from a large off-shore piling operation in corals in the Caribbean. In this case,
A wide variety of engineered structures , have been founded on modern coral reefs or
islands and on fossil coral reefs. These structures have included drilling plat-forms, scientific platforms, navigational aids, off-shore oil terminals and tanker berths, a variety of harbour and port structures including breakwaters, jetties and docks, airstrips, and multi-storey buildings such as hotels. These structures are generally, though not always, supported on piled foundations. Excavation of corals and coral-derived reef and beach-rock to form shipping channels and berths, for example, presents another class of engineer-ing problem.

some 75 cylindrical steel piles having diameters ranging from 1.068 to 2.502 m and with nominal lengths of 42.7 to 55.0 in were required to be driven to refusal (defined as 20 blows or more for the last inch of penetration) and provided with a grouted anchor system to resist uplift. Difficulties were experienced in obtaining the specified refusal, with some piles being driven several meters below design depth at very low resistance levels. Where piles were driven through intact coral limestone, the plugs of rock left inside the piles proved difficult to remove. The presence of cavities distributed irregular-ly throughout the rock caused great diffic-ulties in drilling the 180 mm diameter anchor holes to an average depth of 22 m below pile tip elevation. Cave-ins caused the drilling tools to become jammed and sometimes lost, and the wide-spread presence of cavities resulted in the consumption of several times the quantity of grout anticipated at the tender stage.
Experiences such as this suggest that improved site investigation and construct-
- ion techniques are required if foundations are to be more effectively constructed on coral reefs. Because of the unique environment and geotechnical characteristics of corals, special site investigation techniques may be required. A major need is for the development of techniques that can be used to locate the cavities and pockets of sand that provide the major source of difficulty in foundation construction on coral. It is with the development of such techniques that the rest of this paper is concerned.
4 SITE INVESTIGATION ON CORAL REEFS
4.1 General
After what has been outlined in Section 2 it becomes evident that the best basis for an evaluation of foundation properties on coral reefs will be a comprehensive study of the regional geology and geomorph-ology. This will provide a framework within which the detailed information, subsequently gathered by local site investigations, can most adequately be interpreted. Maps and air photographs will be the principal sources of information at this early stage of site investigation. The importance of air photographs, in particular, can hardly be over-emphasized. They provide the basis not only for regional studies but also for the identif-ication of more local features which may be of concern for a particular foundation
site. A good example in this respect is sinkholes, which are quite common on coral reefs (Purdy 1974); sinkholes often can clearly be recognized in air photographs, however hardly identified from the reef surface, as they are usually filled with reef detritus or overgrown by patchy corals. In addition, air photographs are often the only tool for defining actual positions on coral reefs, which is a delicate quest-ion when, for example, moving across the reef or selecting a location for a site investigation test.
It will rarely happen that the information from these general sources can be considered as sufficient. Special investigations such as drilling or the application of geophysic-al methods have to be carried out. When trying to do this in the environment of coral reefs, two main questions arise:
What technique can be applied in order to shift the equipment to a particul-ar reef location at which a test should be carried out? (Access problem)
What methods and equipment should be selected in order to gain appropriate information on the foundation properties of coral reefs? (Data acquisition problem)
These two questions will be discussed in turn.
4.2 Access to the Site
The following technique has been developed and found most useful: After sailing aboard a motor vessel into a sheltered position at the back of a reef, the equip-ment such as drilling rig or heavy penetro-meter (ref. Section 4.3) is loaded onto a raft (details: see Appendix 1). Preferably during the outgoing high tide, the raft is manoeuvred to the desired reef location using an outboard motor (Fig. 2). Here the raft is anchored.
If the reef surface falls dry during the low tide then the test is commenced as soon as the raft is settled onto the reef surface (Fig. 3). Depending on factors such as reef morphology, weather and tide conditions a time span of up to three hours is available for performing the test, operating from a completely fixed position.
If the reef surface is still submerged even at low tide then the raft is anchored at four points. Each anchor is operated via a 5 mm steel cable by a hand winch, mounted on one of the corners of the raft. By this technique, which allows for adjustment to changing weather and tide conditions, the raft can be held almost

stationary. Furthermore, the particular wave pattern inside a reef, usually consist-ing of waves of small amplitudes and wave lengths (choppy conditions), imposes only a minimal degree of lurching of the raft. It was found that, due to these favourable circumstances, a site investigation test could be performed even from a floating position, but only if the wind velocity is not exceeding 20 knots. When combining these two techniques, almost any point of a coral reef surface is accessible and can be thoroughly investigated for its foundat-ion properties.
- - -
- - - - -
Figure 2 Light drilling rig on self- constructed raft
Figure 3 Raft stranded on reef surface at low tide in order to enable diamond drilling from fixed position
4.3 Site Investigation Techniques
Three special site investigation techniques - diamond drilling, dynamic penetration and seismic refraction - have been applied.
Diamond Drilling
The first step in the site investigation programme undertaken was by diamond drill-ing. Using Atlas Copco's Minuteman Mobile Drilling Machine with a BX-series single-or double-tube core barrel (see appendix) a total of five tests were performed. All drilling tests showed very disappointing results. The core recovery was rather poor (from 0% up to a maximum of 35%), although all drilling tests were carried out on the hard algal rim (ref. Section 2). Furthermore, running sand caused an early jamming of the core barrel between 2.8 m and 6.1 m penetration, which is well below the machine's usual capacity.
In all, only six suitably sized cores were recovered and thoroughly tested in the laboratory. The main results are (Foster 1974; Moss 1976):
Unconfined compressive strength: 17.5 ± 2.6 MPa with peak values of 26.5 MPa maximum and 10.3 MPa minimum;
Young's modulus: 2540 ± 340 MPa;
Porosity: 39-49%.
Measures to improve the core-recovery such as casing the borehole or the application of Rocha's (1971) integral sampling method were discarded, because these methods would have slowed down the drilling operation to a degree which was judged to be unacceptable for a coral reef environment.
During drilling operations it was ob-served that pockets of sand and substant-ially sized cavities constituted most of the near-surface parts of the reef. Realizing that diamond drilling is not capable of giving quantitative infor-mation on these weak zones and, on the other hand, bearing in mind that it is just these weak zones and not so much the more solid parts of the reef which will normally be critical for a foundation design on coral reefs (ref. Section 3), the scope of this site investigation study was substantially reorientated. The question now was to find a particular technique capable of gaining quantitative information on these weak spots, if necessary accepting a certain loss of

15 20 25
c3 Australiane se hveeigl ht datum
1,5 mean sea level
e
low water 0 level X
5 10
Townsville - harbour Coral
limestone - 2 -
-4-
Cavities - 6 -
-8-
Sand
-16
-18-
-2 0
[Depth)
[No of blows/10 cm penetration
information on the more solid coral lime-stone. As outlined in the following section, a heavy penetrometer is a very suitable instrument for this purpose.
Dynamic Penetration
In planning the dynamic penetration tests, there were two principal questions to be answered:
Would it be possible to penetrate through hard layers such as the surface crust of the algal rim?
Would the dynamic penetration technique be as sensitive to jamming as diamond drilling?
In order to be better equipped to answer the first question, a number of different-ly shaped tips were tested on big samples of hard coral limestone before performing in-situ tests on the reef itself. It was found that a 90 ° cone-shaped tip was suit-able for penetrating through even the hardest coral limestone encountered (which was subsequently confirmed by the in-situ tests), whereas the hollow cylinder of the Standard Penetration Test (SPT) proved to be less capable in this respect. There-fore, a 90° cone-shaped driving point of 15 cm2 cross-sectional area was chosen, which is in agreement with the specif i-cations of the German Standard DIN 4094 (Sheet 1). Referring to the second question raised it was decided, again in line with DIN 4094, to use a slightly bigger driving point than the sounding rods (43.7 mm versus 32 mm diameter). This measure proved successful in avoiding any jamming even at considerable pene-tration depths.
The machine used was a Heavy Penetro-meter, manufactured by Nordmeyer, West Germany (for more details see Appendix 1). Figure 4 presents typical results from one of the 16 dynamic penetration tests per-formed. (A complete documentation of these tests is given in Billingham 1979.) The following aspects are particularly noteworthy: - Considerable penetration depth of
22.0 m; (the maximum depth reached within the test series was 26.0 m, which still was not at the upper limit of the penetrometer's capability); Identification of zones with different penetration resistances, particularly spotting cavities (e.g. between -4.4 m and - 6.1 m), pockets of loose sand (e.g. between -1.6 m and -3.3 m; several layers between -10.5 m and -17.2 m) and hard coral limestone
Figure 4 Result of a dynamic penetration test (Penetration Test No. 5). Note that this test disclosed substantially sized cavities and pockets of loose sand
(e.g. at -8.5 m and with increasing frequency from -17.0 m onwards);
- Penetration test from a floating position (1 m water coverage still left at low water datum).
After becoming familiarized with the dynamic penetration technique and the special environmental conditions on coral reefs, one penetration test down to a depth of about 22 m was performed within approximately two hours. Allowing for the time needed to set up and relocate the raft before and after a test, a total of up to three tests could be performed per day. This makes dynamic penetration a relatively economic site investigation technique. As it also gives appropriate quantitative information particularly on weak spots in the underground - which, as outlined before, are the controlling fac-tors of the foundation properties - it becomes obvious that dynamic penetration is a site investigation technique which is capable of coping with the special geo-

Dynamic Penetration
00
No. of blows / 10 cm penetration)
20 60 80 100 3
Diamond Drilling
Core
Drilling time / 10 cm penetration [min.] recovery 0 1
0
1
35 0/0
0/0
0
0/0
— -2,0 E m) Depthl
Test No.1
- 0,8-
1,2-
1,6-
2,0-- 1 E m) Depth
Figure 5 Comparison of the results from diamond drilling and dynamic penetration tests performed at the same location
technical conditions of coral reefs. From a foundation engineering point of view, it appears that on reefs this method is superior to diamond drilling.
Strictly speaking, this statement applies only to the particular drilling machine used; however, it might be extended to any other machine which is not equipped to monitor continuously pertinent drilling parameters such as penetration rate, thrust and torque, and this will be the case for almost any machine presently on the market. Figure 5 suggests that, despite the ex-tremely poor core recovery, a graph of the drilling rate versus the depth at constant thrust gives information which is almost equivalent to that from the dynamic penetration test.
Seismic Refraction
Having found a suitable technique, it was of interest to cross-check the results by use of alternative methods. The most obvious one in this respect is seismic refraction, particularly as this method has recently been applied to The Great Barrier Reef region by Harvey (1977a and b) and Harvey et al. (1978, 1979).
Normally the refraction method is appli-cable when the stratum to be investigated possesses higher seismic velocity than that of the overlying strata; furthermore, each consecutively deeper layer must possess a certain finite thickness, related to velocity contrasts and depths. Usually, to be detectable, each succeeding layer must be thicker than the one above it. It
can therefore be expected that seismic refraction should be able to disclose both geometry and depth of at least the Holo-cene/Pleistocene interface, as this dis-continuity defines the boundary between predominantly unconsolidated Holocene top layers and more consolidated Pleistocene sediments in the deeper underground.
On the other hand, as velocity _reversals cannot be recorded by seismic refraction (Baule and Dresen 1973), weak spots such as cavities and pockets of loose sand underlying harder coral limestone will not be detectable. This means a substantial decrease in the general usefulness of the refraction method to the foundation engin-eer when building on coral reefs. The scope within this study was therefore con-fined to checking the capability and reliability of the refraction method in detecting major disconformities and com-paring its results with those from the dynamic penetration tests.
The seismograph used was a portable, single channel time-distance plotting in-strument (HUNTEC, FS-3; details in Appendix 1). In the field a particular methodology as outlined in detail in Harvey (1977b) was applied, which takes into account the special intertidal envir-onment of coral reefs.
It was found that a successful use of this seismograph on coral reefs depends very sensitively on the actual sea condit-ions. Even a minimal surf at the reef edge constitutes a considerable ambient noise level so that seismic signals,

triggered either by hammer blow or small detonation, became obscured in about 50 m distance from the seismic source. This limited the investigation depth substant-ially to about 10 m. As indicated in Figure 8, refraction horizons were spotted in about 6 m depth, which correlate well with some layers of increased resistance as detected in the dynamic penetration tests, particularly in the region of the reef front (penetration tests 1 and 15). The seismic velocities for most of the top layers is about 1.6 km/sec, which is in accordance with Harvey's (1977a and b) experience, however substantially increased (2.1 km/sec) in the algal rim. The sub-surface velocity averages 2.2 km/sec.
5 APPLICATION
The in-situ tests have been performed on Keeper Reef, approximately 60 km north-east of Townsville (Figs. 6 and 7). This is in Maxwell's (1968:106) terminology an "open ring and composite apron reef" belonging to the family of "shelf reefs".
As indicated in Figure 6(c) Keeper Reef has been tested approximately alongside a section running from the outer reef front into the lagoon. Most tests were done by dynamic penetration. Typical results of these tests are synoptically presented in Figure 8. It can be realized that in both vertical and horizontal directions there are some significant changes in the near-surface structure of the reef. The most remarkable features are as follows.
In the lagoon (left in Fig. 8) a systematic increase in the penetration resistance is evident at a depth of about -16 m. It is of interest that investi-gations in other parts of The Great Barrier Reef (Davies 1974; Davies et al. 1977; Hopley et al. 1978) have all disclosed a major discontinuity at similar depths. Most recently, radiocarbon tests on sam-ples from Bewick, Hayman and Heron Islands (Thom et al. 1978; Hopley et al. 1978; Davies and Marshall 1979) have verified the idea that this discontinuity repre-sents the Holocene/Pleistocene interface. This should provide ample evidence to justify interpreting the subsurface structure on Keeper Reef in the same way.
There are some indications (ref. penetration tests 8 and 2) that the pre-Holocene unconformity may rise from the central part of the reef towards the algal rim and reef margin. Similar tendencies have been observed by Harvey et al. (1978)
in the Capricorn and Bunker Groups of The Great Barrier Reef. However, with respect to the situation on Keeper Reef the authors would like to have some more test results available before commenting on this ques-tion in more detail.
Enough data, on the other hand, are available to state that the lowest 2 to 3 in of the Holocene sediment are characterized by a particularly low penetration resist-ance, as this has been disclosed in almost every penetration test. This indicates that the Holocene base consists of uncon-solidated sand of low relative density.
The upper Holocene layers are subject to quite significant variations in their geotechnical properties. In the lagoon weak layers, consisting of coral sand, extremely porous coral limestone and cavities, are dominant. Towards the reef front higher strength limestone varieties become more prominent and cavities, if any, are less numerous and smaller in size. This holds true particularly for the algal rim, where some layers of extreme pene-tration resistance and increased seismic velocity were encountered (penetration test No. 1, ref. Figs. 5 and 8).
6 CONCLUSIONS
Comparison between the three different site investigation methods applied indicates that, from a foundation engineer's point of view, dynamic penetration is a method which on coral reefs is superior to both diamond drilling and seismic refraction, as it accurately indicates the presence of problem areas such as cavities and loose sand. Penetration tests on reefs should adopt some specifications of the German Standard DIN 4094, as cone-shaped driving points are more capable of penetrating through hard coral limestone than hollow cylinder ends as used in the SPT. Further-more, different diameters of sounding rods (32 mm) and driving points (43.7 mm) con-tribute significantly in avoiding jamming. Diamond drilling could only be considered an alternative if important drilling para-meters such as penetration rate, thrust and torque could be controlled and continu-ously monitored in order to obtain truly quantitative information on weak spots. Seismic refraction may be a useful tool for the disclosure of some more general subsurface structures; however, it is not possible to investigate thoroughly small areas for their pertinent foundation pro-perties by exclusive use of this method.

0 20
km
r-
e
0 •
0
Keeper Reef
3
Australia
ti
,
p
16 0 0 250 500
Metre
A B 4
5 — - —•
6
8
— —02 1 30
7
00
0 9 • _
Legend
Diamond drilling 50 Dynamic penetration with
test number Seismic refraction line
A Radar beacon Profile AB [Fig. 8 ) Location
ti
ti
Map Keeper Reef
.
10-14 0(80 0
tri „2.
4 .
•
Figure 6 (above) Map of Keeper Reef with location of the different site investigation tests performed.
Figure 7 (left) Aerial view of Keeper Reef with cross section AB as indicated in Figure 6.

L4--4 o M W
W rH ai
P CIO
4-1 0
Cti
a) .-1
4-) 0 o
4-4.H
4-) -4
6.0 9-4 '4 a)
fa,
1-)
0
t4-i T-1
4-4 P a) a) W
U)
4J rH
W X 0
w
a)'H P 4-1
o
;-1
4--) • m W.
4-) CZ
'44 W
I P
CZ 41
Z
C a)
to
co
0
cc
E
0
t he
lag
oon
csi a z
0 z
Depending on the position within a coral reef, significantly different foundation properties can be expected. The outer reef area, particularly the algal rim, is char-acterized by relatively sound foundation properties, although even here cavities and loose sand still may occur. Without doubt this area would be most suitable for a foundation on coral reefs. However, it is often associated with some other problems as this site is particularly exposed to waves and not easily accessible by boat. Therefore, most major engineered structures will be erected in the more inner, shelter-ed parts of the reef (as in the case of the large research platform on Britomart Reef north of Townsville, which is present-ly planned by the Australian Institute of Marine Science), although these lagoonal areas tend to have very poor foundation properties with coral sand, porous lime-atone and substantially sized cavities. Where it is proposed to utilize piles for a foundation in this area, and this will be done in the majority of cases, tests should be carried out at each individual pile position, since in the lagoon the variability in extent, thickness and com-petence of coral strata within the overall mass can be extreme.
ACKNOWLEDGEMENTS
The authors wish to thank Mr. Rod Matheson, Technical Officer, for his notable and dedicated technical work, without which this project would not have been launched. Dr. D. Hopley (Geography Department, James Cook University, Townsville) supported the project by discussions and by generously making the seismograph available to us. Funding was from The Great Barrier Reef Marine Park Authority, Townsville (Grants No. 9.5.3.1 and No. 9.5.3) and from various University grants, all of which are grate-fully acknowledged.
7 REFERENCES
Baule, H. & L. Dresen 1973, Methods of de-limitation sink-hole areas and the local-isation of subterranean cavities (in German), Proceed.Sink-holes and subsi-dence Hannover, Paper G3.
Billingham, S.L. 1979, The study of site investigation techniques for determining the engineering properties of coral reefs, B.E.Thesis James Cook Univ. Townsville.
Broadhead, A. 1970, A marine foundation problem in the Arabian Gulf, Quart.J.Eng. Geol. 3:73-84.
Cameron, P.A. 1975, Light construction on The Great Barrier Reef, B.E.Thesis James

Cook University, Townsville. Darwin, C. 1842, The structure and distri-
bution of Coral Reefs, 1-214 London, Smith, Elder & Co.
Davies, P.J. 1974. Subsurface solution un-conformities at Heron Island, Great Barrier Reef, Proceed.2nd.Int.Conf.Sympos Coral Reefs Brisbane, 2:573-578.
Davies, P.J. & J.F. Marshall 1979, Aspects of Holocene reef growth - substrate age and accretion rate, Search (in press).
Davies, P.J., J.F. Marshall, B.G. Thom, N. Harvey, A.D. Short & K. Martin 1977, Reef development - Great Barrier Reef, Proceed.3rd.Int.Sympos.Coral Reefs Miami, 2:331-337.
Dennis, J.A.N. 1978, Offshore structures, Quart.J.Eng.Geol. 11:79-90.
Field, R.M. & H.H. Hess 1933, A bore hole in the Bahamas, Transact.Amer.Geophys. Union 14:234-235.
Foster, D.F. 1974, Geomechanical properties of coral rock, B.E.Thesis James Cook Univ .
Townsville. Goodell, H.G. & R.K. Garman 1969, Carbonate
geochemistry of Superior Deep Test Well, Andros Island, Bahamas, Bull.Amer.Assoc. Petr.Geol. 53:513-536.
Harvey, N. 1977a, The identification of subsurface solution disconformities on the Great Barrier Reef, Australia, between 14
oS and 17
oS, using shallow
seismic refraction techniques, Proceed. 3rd.Int.Sympos.Coral Reefs, Miami, 2:45- 52.
Harvey, N. 1977b, Application of shallow seismic refraction techniques to coastal geomorphology: A coral reef example, Catena 4:333-339.
Harvey, N., P.J. Davies & J.F. Marshall 1978, Shallow reef structure: Southern Great Barrier Reef, Dep.Nat.Developm. Raft: Bur.Min.Resources, Geol.Geophys.Record Self constructed, consisting of a square-
1978/96:1-9. steel framework (50 x 50 R.H.S.) with 10 Harvey, N., P.J. Davies & J.F. Marshall 1979, to 14 200-litre fuel drums supplying flotat-
Seismic refraction - a tool for studying ion. coral reef growth, BMR J.Australian Geol. Working area on the raft's platform:
Geophys. 4:141-147. 3.00 x 3.70 m Hopley, D., R.F. McLean, J.F. Marshall & Draught, when fully loaded: 48 cm
A.S. Smith 1978, Holocene-Pleistocene Outboard motor: 18.6 kW boundary in a fringing reef: Hayman Is- Anchor: Reef picks land, North Queensland, Search 9:323-325. Anchor cables: 5 mm (1) galvanized steel
Ladd, H.S. 1977, Types of coral reefs and cable their distribution. In Jones, O.A. & Remarks: A sheetmetal cowling on the front
R. Endean (eds.), Biology and Geology of of the raft facilitates towing behind Coral Reefs; 4:1-19, New York, Academic research vessel.
Press Inc. Ladd, H.S., E. Ingerson, R.C. Townsend, M. Russell & H.K. Stephenson 1953, Drill-ing on Eniwetok Atoll, Marshall Islands, Bull.Amer.Assoc.Petr.Geol. 37:2257-2280.
Maxwell, W.G.H. 1962, Lithification of carbonate sediments in the Heron Island
Reef, Great Barrier Reef, J.Geol.Soc. Australia 8:217-238.
Maxwell, W.G.H. 1968, Atlas of the Great Barrier Reef, 1-258, Amsterdam, Elsevier.
Maxwell, W.G.H. 1973, Geomorphology of Eastern Queensland in relation to The Great Barrier Reef. In Jones, O.A. & R. Endean (eds.), Biology and Geology of Coral Reefs, 1:233-272, New York, Academic Press Inc.
Moss, K.H. 1976, Geotechnical studies of coral reef materials, B.E.Thesis James Cook Univ. Townsville.
Purdy, E.G. 1974, Reef configurations: cause and effect. In Laporte, L.F. (ed.), Reefs in time and space, Soc.Econ. Palaeont.Mineral.Spec.Publ. 18:9-76.
Ridgway, G. 1977, Mombasa dry-dock carved from coral, New Civil Eng. 259:19.
Rocha, M. 1971, A method of integral sampling of rock masses, Rock Mech. 3:1-12.
Stoddart, D.R. 1969, Ecology and morphol-ogy of recent coral reefs, Biol.Rev. 44: 433-498.
Thom, B.G., G.R. Orme & H. Polack 1978, Drilling investigations at Bewick and Stapleton Islands, Phil.Trans.Roy,Soc. London 291:37-54.
Traves, D.M. 1960, Wreck Island, subsur- face; J.Geol.Soc.Australia 7:369-371.
APPENDIX 1: TECHNICAL INFORMATION ON EQUIPMENT USED
Vessel: James Cook University's Research Vessel "James Kirby". Overall length: 17.2 m Engine: Mercedes Diesel 132 kW at 2000 RPM Max.speed: 9.5 knots
Drilling Machine: Atlas Copco 'Minuteman' Mobile Drilling Machine, model M/M, manufactured under licence by Fox Manufacturing Company. Max.power: 3.7 KW at 3600 RPM Max.torque: 10.4 N.m at 3000 RPM

Heavy Penetrometer: Manufactured by W. Nordmeyer D3150 Peine/ W.-Germany Total weight: 880 kg Drop weight: 50 kg Height of fall: 50 cm Sounding rods: 32 mm diameter, 1 m long, engraved with 10 cm marks Driving points: 90 conical-shaped tips of hardened steel, 43.7 mm diameter (=15 cm2
cross sectional area), pinned (not screwed) to the sounding rods in order to lose the tip when recovering the rods ("lost-point" approach) Motor: air-cooled Diesel engine, 3 kW at 2500 RPM
Refraction Seismograph: FS-3 portable Facsimile Seismograph, manufactured by Huntec Ltd., Scarborough/ Canada. This is a single channel time-distance plotting instrument which perman-ently records an entire seismic event produced either by a hammer blow to the surface of the ground, or by an electric-ally detonated explosive charge. The record, produced on electro-sensitive paper, is in the form of short dashes which signify the positive zero crossings of each cycle of the shock waves (wave- length) initiated by the hammer or explosive charge. Geophones: Hall Sears HS-J, Model Ll, Velocity Sensitive, Coil Resistance - 280 ohms, Natural Frequency - 14 Hz. Amplifiers Dual Channel: Input Impedance - 700 ohms, Frequency Response. Gain Control: Adjustable attenuator; 6 db steps from 0 - -66 db. Printing Sensitivity: 2 micro-volts peak to peak with attenuator control at 0 db. Time Base: 3 to 180 milliseconds (Normal), 163 to 340 milli-seconds (Delayed), Accuracy - ±1%, Size: 45 x 35 x 15 cm.

Appendix 2
BILLINGHAM, S.L.:
"The Study of Site Investigation Techniques for determining
the Engineering Properties of Coral Reefs".

TABLE OF CONTENTS
Page
Declaration
Acknowledgements ii
Abstract iii
Table of Contents iv
List of Illustrations vi
List of Tables ix
Chapter 1 - Introduction 1
Chapter 2 - Literature Review 4
Chapter 3 - Experimental Equipment and Principles 7
3.1 Introduction 7
3.2 Drilling Machine 7
3.3 Penetrometer • 9
3.4 Seismograph
11
3.4.1 Theory 13
Chapter 4 - Preliminary Testing 16
4.1 Introduction 16
4.2 Onshore Testing 16
4.3 Seismograph - Douglas Campus 16
4.4 Seismograph - Pallarenda 18
4.5 Penetrometer - Douglas Campus 21
4.6 Technical Problems 24
Chapter 5 - Site Operations 26
5.1 Core Drilling Operations 26
5.1.1 Introduction 26
5.1.2 Drilling Operations 26
5.1.3 Comments and Recommendations 32
5.2 Seismic Operations 34
iv

V
Page
5.2.1 Introduction 34
5.2.2 Seismic Tests 34
5.2.3 Test Results 36
5.2.4 Comments and Recommendations 42
5.3 Penetrometer Operations 42
5.3.1 Introduction 42
5.3.2 Testing Operations 44
5.3.3 First Series of Tests 44
5.3.4 Second Series of Tests 62
5.3.5 Testing Limitations 64
5.3.6 Test Results 65
5.3.6.1 Sensitivity Test 66
5.3.7 Errors 68
5.3.8 Comments and Recommendations 71
Chapter 6 - Correlation of Test Results 72
6.1 Introduction 72
6.2 Drilling and Penetration 72
6.3 Seismograph and Penetrometer 76
6.4 Comments and Conclusions 77
Chapter 7 - Geology of Keeper Reef 80
7.1 Introduction 80
7.2 Basic Geology 80
7.3 Comments and Conclusions 82
Chapter 8 - Conclusions and Recommendations 83
8.1 Conclusions 83
8.2 Recommendations 83
Appendix A 85
Appendix B 88
Appendix C 105
References 126

LIST OF ILLUSTRATIONS
Page
1.0 Location Map 2
3.1 Drilling Machine 8
3.2 Recording of Shockwaves 11
3.3 Example of Time Distance Curve 12
3.4 Mechanism of Refracted Waves 14
4.1 Profile of Seismic Tests 17
4.3 Classification Chart of Geological Materials
From Seismic Velocities (Dry) 20
4.5 Penetration Tests P1 22
4.6 Penetration Tests P2 23
5.1 Site Plan for Drilling and Seismic Tests 27
5.3 Core Recovered from Drilling Tests 29
5.4 Results of Monitored Drilling Test 30
5.6 Seismic Operations on Keeper Reef 33
5.8_ Penetration Test No.15 37
5.9 Penetration Test No.1 38
5.10 Classification Chart of Geological Materials
from Seismic Velocities (Saturated) 39
5.11 Penetrometer 43
5.12 Site Plan for all Tests 45
5.13 Penetration Test No.4 -46
5.14 Penetration Test No.5 47
5.15 6 48
5.16 I t II 7 49
5.17 8 50
5.18 II 9 51
5.19 U " 10 52
vi

Page
5.20 Penetration Test No. 11 53
5.21 Penetration Test No. 12 54
5.22 n " 13 55
5.23 n II " 14 56
5.24 n II 11 1 57
5.25 n n 2 58
5.26 II 11 3 59
5.27 n " 15 60
5.28 n " 16 61
6.1 Monitored Drilling Test 73
6.2 Penetration Test No.1 74
6.4 Profile of Test Site 75
7.1 Profile of Geological Features along Transect 79
Appendix A
Al Waterproofed connection 87
A2 Inertia Switch 87
Appendix B
Bl Seismic Run 1 (Douglas Campus:April) 89
B2 Seismic Run 2 (Douglas Campus:April) 90
B3 Seismic Run 1 (Douglas Campus:May) 91
vii
May) 92
93
94
95
97
99
101
103
B4
11
" 2
B5
11
" 1 (Pallarenda)
B6
11
" 2 (Pallarenda)
B7
" I (Keeper. Reef)
B8
" II (Keeper Reef)
B9
" III (Keeper Reef)
B10
I t
" IV (Keeper Reef)
B11
" V
11 )

Page
Appendix C Results of Penetration Tests
Cl No.4
106
C2 No.5
107
C3 No.6
108
C4 No.7
109
C5 No.8
110
C6 No.9
111
C7 No.10
112
C8 No.11
114
C9 No.12
116
C10 No.13
118
Cll No.14
120
C12 No.15
122
C13 No.16
124
viii

LIST OF TABLES
Page
4.2 Results of Seismic Runs 19
4.4 Geological Materials Tested 21
5.2 Core Recovery; Drilling Test 1 28
5.5 Core Recovery; Drilling Test 2 31
5.7 Seismic Data from Keeper Reef 40
5.29 Relative Firmness of Coral Limestone 68
5.30 Corrected Depths of Discontinuity 69
6.3 Comparison of Results; Drilling - Penetrometer 72
6.5 Comparison of Results; Seismic - Penetrometer 77
ix

CHAPTER 1 - INTRODUCTION
The majority of the substantial civil engineering structures
(tourist resorts, research and weather stations) on coral reefs along
the Queensland coastline, have been constructed on reefs and cays,
which are exposed at high tide. As the number of these available
islands are gradually becoming exhausted, there is a growing interest
from community sectors into the possibility of erecting structures on
bare coral reefs. Enterprises which may utilise these reefs, are
the tourist and fishing industries, as well as research organizations.
Although a very political issue, bare coral reefs may also be used
by different mining organizations (e.g. oil companies etc.) in
connection with future exploration.
The framework of bare coral reefs, range from well developed
reef tidelands to fully submerged coral outcrops.
Previously designed structures for bare coral reefs (that
is lighthouses and weather stations) have not been structurally disadvant-
aged from an economical point of view. Thus, little has been learnt
of the geomechanic properties of coral reefs from their construction.
This is due to the loss against cost benefit that would arise, in
case of a failure.
As no commercial undertakings have been developed on bare
coral reefs, it has not been warranted to produce a more rational
approach to foundation designs. To develop feasible foundation
design criteria, the engineering properties of coral reef limestone
would first have to be investigated.
From previous research (Smith, 1972, Moss 1976) a substantial
amount of material has been gathered on the geomechanical properties
of coral limestone. However, sand, holes and very weak coral are
more critical to the behaviour of foundations than the overall

1;22
2

3
geomechanical properties of coral limestone. Thus, it is endeavoured
to increase the available knowledge of the engineering properties of
coral reefs to depths of 25 metres. As most foundations would not
have any effect on the coral at a depth of 25 metres, investigations
have been limited to depths shallower than 25m. To determine the
basic geomechanic units at such depths, drilling, sounding and
geophysical techniques are a few methods that can be used.
It is the aim of this thesis, to study the feasibility of
different site investigation techniques, in determining the engineering
properties of coral reefs, to a depth of 25 metres. As a secondary
objective, testing will be performed along a transect, so collected
data may be used to determine the geology of the reef along this
section. This is to confirm the genesis of the reef, so favourable
construction sites on the reefs may be ascertained in the future.
The study was undertaken on Keeper Reef, which is a bare
coral reef, located 60 kilometres north-east of Townsville. The
position of the reef is shown in Figure 1.

CHAPTER 2 - LITERATURE REVIEW
Within the last decade, various research projects have
studied the characteristics of coral reefs, throughout the Great
Barrier Reef province. As little was known of the origin and
structure of the reefs, research into the geology and engineering
properties evolved.
Research carried out by the Engineering, Geography and Geology
departments of J.C.U.N.Q., have collected data on the structure and
development of reefs, as well as the mechanical properties of coral
materials. A brief outline of some of the various research programs
undertaken by these departments during the previous seven years, are
listed below.
P.T. SMITH (1972: Engineering)
Conducted standard tests (Uniaxial compression and Indirect
tension tests) on samples of coral rock, to enable the classification
of the rock under existing engineering classification systems.
Results allowed only an approximate classification, as large variations
in the strength of samples occurred. These were not accounted for,
as little was known of the basic structure of different types of coral.
D.F. FOSTER (1974: Engineering)
Classified coral rock according to existing rock classification
schemes and found the scheme proposed by Stapleton (1968) best suited
for coral limestone. This scheme is based on the unconfined compressive
strength of dry samples. All samples tested, were obtained from depths
of only 2-3m.
P.A. CAMERON (1975: Engineering)
Constructed a radar beacon (approximately 7m high) for
navigational purposes and designed a marine platform for use on reefs.
Very little information was obtained of the engineering properties of
4

the coral limestone from the construction. However, some experience
was gained of the difficulties involved in working in a marine
environment while erecting the beacon.
K.H. MOSS (1976: Engineering)
Performed research into ways of understanding the behaviour
of the coral rock mass and associated materials with reference to
engineering problems. Several in-situ bearing capacity tests were
carried out and the behaviour of marine carbonate sands when used in
concrete was investigated. Core drilling operations were performed
to obtain core samples as well as evaluating core drilling operation
as a site investigation technique.
N. HARVEY (1977: Geography)
Carried out seismic refraction surveys using a Huntec FS-3
portable seismograph, to investigate the presence of subsurface
solution disconformities beneath reefs. The studies revealed a
marked seismic discontinuity, which was interpreted as representing
a solution disconformity ranging in depth from 6.3m to 19.3m, for
seven reefs between 14 °S and 170S.
A.I.M.S. (SEPT. 1979: Geology)
A drilling test was performed onBritomart Reef to a depth of
70m, to determine the geology of a proposed site for the erection of
a research platform. The test returned a wide range of core recovery
per metre (3-80%), of which very little was suitable for laboratory
tests. As a high percentage of fine material (carbonate sand) was
not collected with the core recovery, no estimations of the insitu
strength of the coral can be obtained.
From the research performed, a substantial amount of information
has been collected on the geomechanical properties of coral materials
and the geology of coral reefs. However, very little information has
been gathered on the engineering properties of coral reefs for any
5

great depth. Although drilling tests have been performed, the
amount of data that may be obtained of the engineering properties of
the subsurface material, is negligible.
Thus a study of various site investigation techniques for
determining the engineering properties of coral reefs, has been
carried out. The basic objective of the research project, is to
widen the knowledge of the engineering properties of coral reefs to
a depth of approximately 20m. It is concerned with the distribution
and mechanical properties of the different geomechanic units such as
coral limestone, sand or holes which make up the underground of reefs.
An outline of the research project is , given in the following
chapters of the thesis and the basic steps undertaken to achieve the
research objectives are listed below.
Onshore tests were performed to become familiar with the
mechanics of the testing equipment.
Results from the onshore tests were used to calibrate the
various equipment, allowing future comparison with on-site
test results.
Extensive testing was performed on site (Keeper Reef)
with each technique.
Test results and testing procedures were studied to
ascertain the feasibility of each technique.
4) As a secondary objective, the test results were used to
determine the geology of a section of reef, that had been
tested.
6

CHAPTER 3 - EXPERIMENTAL EQUIPMENT AND PRINCIPLES
3.1 INTRODUCTION
Although there are many site investigation techniques that
may be used to determine the basic geomechanical units of the coral,
only three were examined in any detail on the reef.
The research work involved the use of a small drilling
machine, a dynamic heavy penetrometer and a portable facsimile
seismograph. Although all three methods were studied, the penetrometer
was used extensively throughout the program, as drilling and seismic
tests were limited by technical problems and time. The type and basic
principles of each machine has been outlined below.
3.2 DRILLING MACHINE
The rotary drilling machine and associated equipment used
for core recovery operations on Keeper Reef are shown in Figure 3.1
in an operational state. The drilling and core recovery operation,
incorporated the use of a Minuteman Mobile Drilling Machine, Model
M/M manufactured by Fox Manufacturing Company.
Rotary drilling machines are generally used for recovering
core samples of highly resistant materials. A rotating drill bit
cuts and grinds the material at the base of the hole into very fine
particles. Water which is continuously circulated through the
hollow drill rods, washes the ground material from the cutting face
to the surface of the bore hole. This water is pumped into the
drill rods via a swivel coupling situated at the base of the
drilling machine.
As drilling progresses, a cylindrical sample is cut out
of the underground. The greater part of the operational time is
consumed with the recovery of the core barrel, after sufficient
penetration. The core sample is then removed and the procedure
repeated.

1.7, 1; •

0
Single tube core barrels can be used, but a smaller percentage
of the finer material is collected, as the circulating water is passed
through the core samples. The percentage of recovery may be improved
if a triple tube core barrel is used, as this type of barrel prevents ,
the circulating water from being washed through the core recovery.
Laboratory tests can then be performed, (uniaxial compression
test, direct shear test etc.) on the core samples recovered, to
determine the geomechanical properties of the material. By determining
the properties at different depths, some indication of the coral
structure can be obtained.
3.3 PENETROMETER
A Nordmeyer dynamic heavy penetrometer was used for all
penetration tests performed. The 880 kg self-contained instrument
is powered by a 4 HP Farremann single cylinder air cooled diesel
engine. With the mast in a lowered position, the unit has the
approximate overall dimensions of 3600, 1600 and 1400 mm.
A percussion mechanism is mounted on the mast, and is free
to travel downwards as penetration progresses. The unit is rested on
the anvil screwed to the top of the 32 mm diameter sounding rods.
The mechanism is activated by a series of catches on an endless chain.
Each catch lifts the 50 kg drop weight to the correct height of 50cm
before releasing it.
Thus, as testing proceeds the sounding rods are hammered
into the subsurface with a constant energy per blow. Therefore, the
relative hardness of subsurface formations, are directly proportional
to the number of blows required to penetrate a given distance.
Measuring grooves machined into the rods at 10cm intervals,
enables the number of blows required to penetrate 10cm to be recorded.
The blows produced are counted by a simple blow counter tripped by

10
the catches on the endless chain.
Depending upon the hardness or depth of a deposit to be
penetrated, a lost point or recoverable tip may be used. The
difference between the tips, is that one is secured by a shear pin
and the other screwed onto the sounding rods respectively.
Non recoverable tips are used where difficulties may occur
in recovering the sounding rods, due to the hardness of a medium being
penetrated. By applying an upward force to the rods, the shear pin
is severed leaving the tip behind. As the outside diameter of the
tip (43.7 mm) is larger than that of the sounding rods (32 mm), no
difficulties occur in recovering the rods.
To recover the sounding rods, the percussion mechanism is
connected to the anvil, and winched to the top of the mast. By
removing one rod, the anvil can be screwed to the next rod and the
procedure repeated. The rods are prevented from falling by a special
ball clamp, which only allows upward movement 6f the rods to occur.
In the United States, the most widespread test performed
using a penetrometer, is known as the standard penetration test.
A hammer weighing 62.5 kg is dropped from a height of 76.2 cm onto
drill rods which have the same outside diameter as the penetration
tip. For the German penetrometer, the drop weight and fall of height
is different and the penetration tip has a larger diameter than the
sounding rods. This gives a more accurate value of the penetration
resistance at the tip, as less friction is developed along the sounding
rods.
By determining the penetration resistance of the subsurface
with depth, a complete profile of the materials relative hardness at
the test site, can be ascertained. From a plot of the penetration
resistance against depth, the engineering properties and geology of
the site can be interpreted.

3.4 SEISMOGRAPH
A single channel portable Huntec FS-3 facsimile seismograph
was used to accomplish refraction surveys on Keeper Reef. The
instrument permanently records on a time-distance plot, the entire
seismic event initiated by either a hammer blow or an electrically
detonated explosive charge.
The seismic wave train received by the geophones, is plotted
on electro-sensitive paper in the form of short two millesecond dashes.
Each dash represents the positive zero crossing of the shock wave,
as shown in Figure 3.2. Recorded events are plotted over a 3 to 180
millesecond time base, with a specified accuracy of - 1%. The time
distance curve is produced by manually advancing the paper for each
seismic event. An example of a time-distance curve is shown in
Figure 3.3.
Noise Signal Train Train
ga. A A A111 A. - -yr - Iv w
0 10 20 30 40 50 60 70 80 90 100
Time (Milliseconds)
• FIGURE 3.2
For a stratum to be detected by refraction, the distance
between the shot point and the detector, has to be several times the
depth of the layer. However, as the distance increases, the intensity
of the signal detected by the geophones decreases. Over long
distances, seismic detonators (manufactured by ICI Australia) can be
used instead of a 4.5 kg hammer, due to the greater resolution
11
rj Printing Threshold

FIGURE 3.3
12

yielded. The use of a hammer is further limited by the high level
of ambient noise.
Because of the instruments size (450 x 300 x 150 mm) and
light weight (14.5 kg with NiCad batteries) it has an advantage of
being easily handled around small boats. The Ni-Cad rechargeable
batteries, also eliminated the need for replacement batteries as
240 V power was available on the mother ship.
As the seismograph had been designed for land based
operations, a number of technical problems arose, when it was
initially used in an aquatic environment. Such problems and how
they were overcome are discussed in Appendix A.
3.4.1 Theory
The seismic method depends fundamentally on the propagation
of seismic waves in an elastic media. The principles governing the
propagation of seismic waves are similar to those that govern the
propagation of light waves. Thus the laws of reflection and
refraction are applicable to seismic studies.
Where no information is available on the subsurface geology,
reflection surveys give little information on the compaction of the
underlying media. Reflection surveys are directed towards determining
the geometry of subsurface formations. However, with refraction,
seismic velocities (degree of relative hardness) as well as the
geometry can be obtained.
The mechanism of refracted waves in a two layered subsurface
is shown in Figure 3.4. The upper layer has a velocity of V o and
the lower stratum that of V1. For the lower layer to be detected
the velocity of the near surface layer must be less than that of the
lower stratum.
13

Sin i = V
Sin r vi
D
FIGURE 3.4
From an energy source S, generated seismic waves travel in
a hemispherical wavefront centred around the source. On striking
the interface, the rays are refracted into the lower layer, with a
corresponding velocity change. The velocity and angle change of the
rays, is governed by Snells Law. That is:-
At a particular point C on the wavefront, the refracted
ray will travel along the interface, with the velocity of the lower
layer. Thus the angle that ray SC makes with the boundary is the
critical angle. As this wavefront travels along the interface, new
disturbances are generated due to the oscillating stresses in the
upper medium. These new disturbances spread out spherically in the
upper and lower media with velocities Vo
and V1 respectively. This
is shown at point E. In the lower medium the wave will travel a
distance EG compared with EH in the upper medium for the same time.

It can be shown, the new wavefront FG, will return to the surface at
a critical angle with the perpendicular to the interface.
Sin ic
EF Vo x t V
EG
The ray that first arrives at the detector D, will depend
upon the distance D is away from S. If the distance SD is small,
the surface ray will arrive first, due to the extra distance that the
refracted ray has to travel. However, as SD increases, the refracted
wave arrives first due to the time saved in travelling through the
faster medium.
Therefore, by plotting the first arrival times against the
short-detector distance, a useful curve of the refraction data can
be obtained. The velocity of each layer, can be derived from the
slope of the curve, corresponding to each layer. Either a Critical
Distance or Intercept-Time Method can be used to calculate the thick-
ness of each stratum. The accuracy of interpretation is in the order
of 10%, which can be reduced if reverse spreads are performed.
Thus, as a direct relationship exists between the hardness
and seismic velocity of a material, a variety of engineering problems,
can be solved using refraction techniques.
15
V x t1

CHAPTER 4 - PRELIMINARY TESTING
4.1 INTRODUCTION
Prior to using the penetrometer and seismograph on site
(Keeper Reef), several onshore tests were performed. These tests
allowed an insight into the mechanics of the equipment to be obtained
and minor testing techniques and technical problems to be overcome
before site testing. The results of the tests were used to calibrate
the equipment, so as the site investigation results could be better
appreciated.•
By knowing the penetration resistance of different
geological materials from onshore tests, the soundness of the sub-
surface on site can be visualized by comparing results. Similarly,
the hardness of the materials can be related to their seismic
velocities and a comparative firmness of the formations on site can
be determined.
4.2 ONSHORE TESTING
Several seismic spreads and penetration tests were performed
at Douglas Campus and Pallarenda. The seismic tests were performed
in April and May and two penetration tests also in May.
4.3 SEISMOGRAPH - DOUGLAS CAMPUS
The southern end of Douglas Campus was chosen for testing
as the location is situated at the base of Mt. Stuart. It was
anticipated that shallow subsurface formations would exist below
the topsoil, due to the adjacent hill slopes. The topsoil consisted
of a fine grained material with a small percentage of rocks. Deeper
layers would most likely contain a much higher percentage of rocks
or weathered granite.
From the initial seismic test (April), a shallow layer was
detected at an approximate depth of 2.1m. From further tests
16

Profile of Seismic Penetration Tests at Douglas Campus. FIGUI1E 4.1
0
5
10 15 20 25
30
35
40
LONGITUDINAL DISTANCE C m

performed (May) , the interface between the two top layers, was
profiled for a distance of 30m. To produce the profile, reverse
spreads were done, and Hawkins (1961) Method was used to plot the
profile from the back and forth shots.
The results of the survey are shown in Figure 4.1, from
which the subsurface formation is situated at an average depth of
1.96m within a 0.8 to 2.68m range. The average seismic velocity of
the near surface material is V = 500m/sec and the lower stratum
V2
= 1312m/sec.
However, results from the (April) tests, determine the
seismic velocities V1
and V2 as 544 and 1290m/sec respectively,
which vary from the values determined in May. These differences, may
be accounted for by the error that occurs in interpreting the results
and the variation in moisture content of the test site between tests.
Both could account for the differences that occurred in the seismic
velocities. The raw data of both series of tests, April and May,
are shown in Appendix B.
4.4 SEISMOGRAPH - PALLARENDA
The tests at Pallarenda, were performed at the base of a
hill, in an attempt to locate the bedrock beneath the topsoil of
loose sand. Due to the uneven topography of the area, a profile of
the lower strata has not been plotted. The effect on the profile,
from the variation of elevation, would probably be greater than the
actual irregularities of the interface.
The curve can be corrected for elevation, as set out in
Dobrin, but such an exercise was unwarranted as only the average
seismic velocities were required for calibration purposes. However,
the method of correction has been detailed below.
18

vi M .S ,L.
d
= Path before correction
-= Path after correction
E = Elevation of detector
e = Elevation of shot station
19
CORRECTION = ( e 2 2
+ E - 2d) i/V1 - V sec.
V1
Vo
The new correction is subtracted from the arrival time of
each new shot point.
The curves obtained from the surveys, indicate that three
layers of different materials exist. The seismic velocities and
approximate thickness of each layer, have been tabulated for both
runs in Table 4.2.
TABLE 4.2
RUN 1 RUN 2 LAYER VELOCITY THICKNESS VELOCITY THICKNESS
m/s m m/s m
1 250 3.65 250 3.39
2 2780 • 5.83 2500 1.89
3 5280 5000
As the seismic velocities and layer thickness for layer
two is different for both tests, the interface between layers two
and three is dipping. Thus layer three is most likely to be bedrbck,
from the magnitude of its seismic velocity and the fact that it is
dipping.
As the velocity of sound in water is approximately 1500m/sec,
fully saturated soils have a seismic velocity equal to or exceeding

Sh ,ite
1:Lit one,Dolc:Iite
1 Mdterials from Seismic Velocities FIGURE 4.3
Classification of Gc:ologic
GEOLOGICAL MATERIAL
TopE'oil Organic 1:,aterial
Loose sand
Silt
Gravel
Clay, Till
nracted Clay
Sandstone _:), ,7:eke Con ome:ate
Weathe ,-- cd,Shered Fract,ared cks
Netorphoed Sedimentary Rocks
Basic ignous Volcanic Rocks
0 0 C)
0 0
fl
u-N
0 C)
C.)
WAVE VELOCITY m/sec 0 C) C C,
C) C`,J INC \
( 2, LC' 1 t C \
0 0
Lf- 1
Ago
pAwArardiror

21
this value. From the test results, there is no indication of the
ground being saturated for depths above 3.5m.
For comparison with values given in Figure 4.3, Classification
Chart of Geological Materials from Seismic Velocities, all the
geological materials tested, have been tabulated in Table 4.4. By
comparing materials for a given seismic velocity it is quite clear
that test results correlate closely with those given in Figure 4.3.
TABLE 4.4
SEISMIC VELOCITY GEOLOGICAL MATERIAL m/sec
250 Loose sand
500 Fine grain topsoil
1300 Conglomeration of rock and sand
2500-2800 Dense sand and/or weathered rock
5000-5280 Igneous rock (granite)
Thus, to determine the relative soundness of a material
from its seismic velocity, Table 4.4 and Figure 4.3 may be used to
obtain a similar geological material for that velocity. From this
material, the relative firmness of the unknown material may then be
ascertained.
4.5 PENETROMETER - DOUGLAS CAMPUS
The two shallow penetration tests performed in May 1979,
were on a section which had previously been surveyed by several
seismic spreads. Only 2.3m of sounding was done for each test, as
the depth of the lower stratum was known to be approximately 2m. The
main aim of the tests, was to compare the results obtained with those
of the siesmograph.
0
E
LL JO 0
o
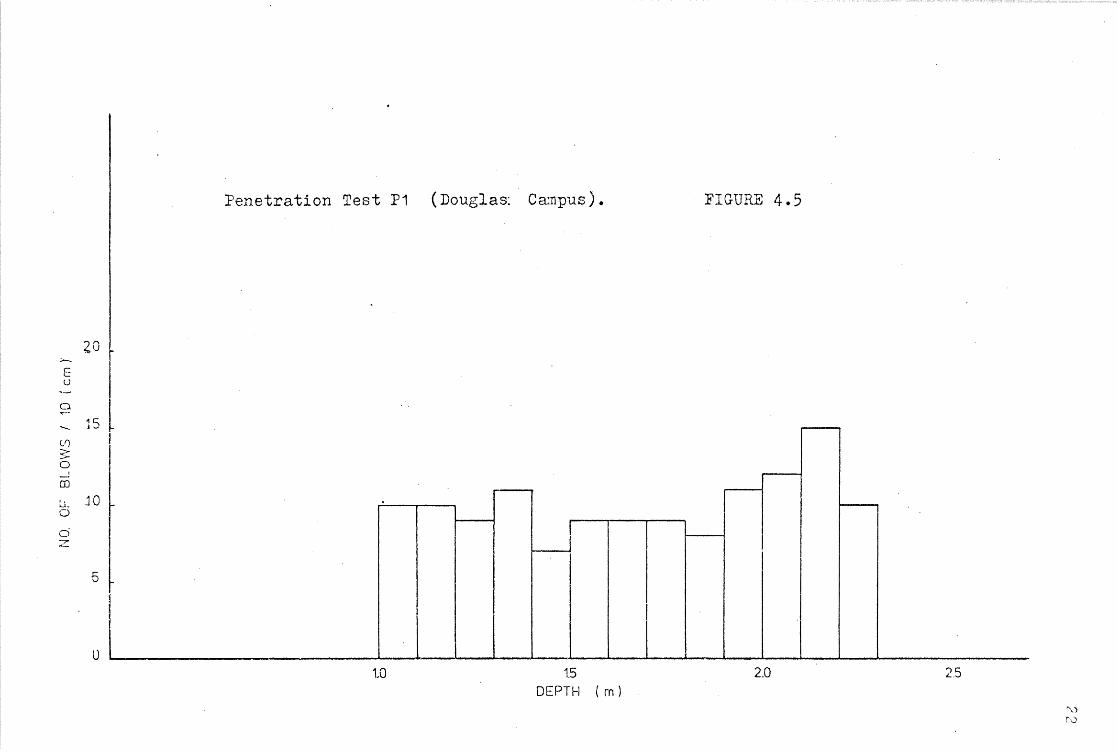
Penetration Test P1 (Douglas*. Campus). FIGURE 4.5
to
1.5 2.0 2 .5 DEPTH ( m )

Penetration Test P2 (Douglas Campus) FIGURE 4.6
20
E
15
(y)
0
aD
10 0
5
•••■■■•.1.01■01INIIIIN.
.5 1.0 1.5 2.0 DEPTH (m)

The results of both tests have been plotted as a graph of
the number of blows required to penetrate 10cm against depth. The
graphic form of the results are shown in Figures 4.5 and 4.6. The
tests were performed at a distance of 25.3 and 30.5m from the zero
position of the seismic survey. Their position are indicated in
Figure 4.1 by P 1 and P2 respectively.
From test P1,
Figure 4.5, an increase in penetration
resistance occurs at a depth of 1.9m, with a corresponding increase
in the average N values of 9 to 12 blows per 10cm.
In test P 2, Figure 4.6, two increases in penetration
resistance occurs at depths of 1.3 and 2.1m. The soil above a depth
of 1.3m has an average N value of 8, while below 1.3m, the N values
increase to an average of 15 blows per 10cm.
By comparing the results of tests P 1 and P2 , with those of
the seismograph, the increases in penetration resistances align very
well with the profile of the lower stratum obtained by the seismograph.
Thus it can be seen that both techniques are capable of detecting the
same formations, even if only for shallow depths.
Due to the simplicity of the penetrometer, a limited amount
of testing was required to become conversant with the machines
mechanics. Therefore, little information has been collected, to
allow the calibration of the machine.
However, by considering the average penetration resistance
of the soil of Douglas campus, 10 - 15, the relative soundness of a
material can be obtained by comparing N values.
4.6 TECHNICAL PROBLEMS
From these initial tests, the method of recording raw data
was found to be inadequate. As collected data from tests was soon

disorganized or forgotten, field sheets for recording the penetrometer
and seismograph results were fabricated. Examples of the field sheets
can be found in Appendix B and C.
25

CHAPTER 5 - SITE OPERATIONS
5.1 CORE DRILLING OPERATION
5.1.1 Introduction
Core sampling is one of the oldest methods of determining
properties of subsurface formations, for foundation problems. From
the core recovery, the variation in engineering characteristics of
the lower strata, can be determined by laboratory testing.
Drilling operations were performed over a two day period, on
the low tides of May, 1979. The tests were carried out on Keeper
Reef and their respective locations are shown in Figure 5.1.
5.1.2 Drilling Operations
On passage to Keeper Reef, the raft was towed behind the
research vessel 'James Kirby' completely unloaded, due to the rough
sea conditions often encountered. On arrival, the vessel was anchored
on the sheltered side of the reef. The drilling machine and other
auxiliary equipment were loaded upon the raft and prepared for
drilling operations the next day.
As with all testing involving the use of the raft, the raft
was motored to, or as close as possible to the test site. On
several occasions, the test sites could not be reached under power
and the raft had to be manhandled the remaining distance. As the
tide was sometimes misjudged, or the test site was covered with
small coral outcrops, themanoeuvreabilityof the craft was severely
limited.
On reaching the test site, the raft was anchored and allowed
to settle onto the reef, with the receding tide. Prior to being
stranded, the drilling machine and other equipment were prepared to
commence drilling.
A position close to the radar beacon was chosen for drilling,
as it is on the algal rim of the reef, where the coral growth is
2

I V
BEACON
1
SITE PLAN
V
Drilling Test
Seismograph Test
0 500
FIGURE 5.

developed the most. As this position it was assumed that core
recovery would be satisfactory.
The first hole was drilled to a depth of 2.1m, which returned
a total core recovery of 17% and a maximum of 30% for a 600mm section.
Of this recovery, there were no samples of suitable length to allow
laboratory testing. An 8.2cm intact section of core sample is
required for laboratory testing, if a 4.1cm diameter core sample is
recovered. The largest intact sample recovered was approximately 3cm
long.
Drilling was stopped after 51 minutes of operation time due
to the inflow of sand into the bore hole, on removal of the core
barrel. This meant drilling back through the sand periodically,
with the possibility of the drill bit jamming in the process. A
qualitative description of the core recovered with depth is shown in
Table 5.2.
TABLE 5.2
Depth
Core Recovered In Description Length Percentage/600mm
0 poor recovery 18cm 30%
.6
.6 no recovery
1.2
1.2 poor recovery 15cm 25%
1.8
1.8 no recovery
2.1
A photograph of the total core recovered from the test is
shown in Figure 5.3 labeled test 1.
28

r4a- -

3.5
DRILLING TEST FIGURE 5.4
3.0 CORE
RECOVERY E U
0
w2.0 .4
.G
.8
0 DEPTH 1.0
( m ) I I NI I ■• I I NW 1.0 1.2
1.4
1.6
1.8
2. 0
GOOD
POOR
5 cm
NONE
0 .2 .4 .6 .8 1.0 1.2 1.4 1.6 1.8 2.0 DEPTH ( m )

As the raft was still stranded on completion of the test, the
drilling machine could only be moved approximately .6m from the
original hole. As the subsurface geology was unlikely to be
different at this distance, drilling was ceased for the day.
For the second test, the rate of drilling was monitored,
in an attempt to increase the amount of obtainable data from the
drilling operations. That is, a tape measure was mounted on the
drilling machine so as the time required to drill 10cm could be
recorded. Thus by plotting the time to drill 10cm against the depth,
an idea of the relative hardness with depth can be ascertained. The
results for the second test is shown in Figure 5.4.
Drilling was discontinued after 43 minutes of operation, at
a depth 2.4m due to the inflow of sand into the bore hole. The
operation returned a total core recovery of 19%, and a maximum of
68% for a 600mm section. Of the core recovered, no samples were
suitable for laboratory tests. A qualitative description of the test
is given in Table 5.5.
TABLE 5.5
Depth m Description
Core Recovered Length Percentage/600mm
0
.6
.6
1.2
1.2
1.8
1.8
2.4
Good recovery
Poor recovery
-No recovery
No recovery
41cm
5cm
68%
8%
31

Of the time taken throughout the test, 58% of the operational
time was used drilling and the remaining 42% in retrieving the core
barrel and inserting or removing drill rods. A portion of the drill-
ing time also consisted of penetrating the sand in the bore hole.
No further testing was performed with the drilling machine
throughout the year, as the technique had been thoroughly tested
before by (Moss, 1976). The drilling tests were carried out so that
the performance and feasibility of the technique, could be compared
and commented against that of other methods.
5.1.3 Comments and Recommendations
From the operations, a definite need for a casing procedure
to be introduced into the technique was noted, if core recovery is
to be expected from any great depth. This has also been determined
earlier by (Moss, 1976) who estimated the cost of adapting the drilling
machine including casings, to be around $3000. However, this would
stop the inflow of sand into the bore hole, but for the percentage of
useful core recovered, the adaption would not be financially viable.
As seen in Figure 5.4 information of the relative hardness ,
can be obtained directly if the drilling rate is monitored. To
successfully achieve this, a constant pressure is required on the
cutting face, so as a relatively constant drilling rate may be
maintained. A hydraulic feed would be required on the machine, to
obtain this aim. The extra information collected, would supplement
the poor core recovery obtained.
For site investigations (coral reefs) the manoeuverability of
the drilling machine or mode of transport would have to be improved
to allow some flexibility into the technique. With the present
method, the success of the operation is constrained by the tide and
prevailing weather conditions.
32

•
-`10"w- -----sermumnrier AMNION r
Rook or.*
. ' !m
'
e
I
g'li a
,
. 4..V.e ' ,., 4•..
,
.
P
i
,..:
7 .
:
.w.. ,"...
,,
.,.
.
.
-.
— * . 4
.:,.... 4
. „
i ' 1t•
. • • 1
•
,
4 ipie •
° . •
4 , d' ..",'aigiel. .; Alt 40* . le
...‘ .:P's '. • • Pr/4 if ' _ 0416
. • . OgOodb •• ' " ' i t. * 'NA w Tit-, • A, email_ • , sr & . - 4 •4rThr VW
g S 10 4";dir - Air . 4,* VII if; ..°:044"11WINI lieb;)1. 4 .9,-"T's1141.44• ;14 Ofieer' Alig 47. 4, ' ..
•
'• .0 Akil, 4°‘ + • i• •• ' dr . iih.' . 44, 41 f°. . ,10 P .. - P . • , i •• ' 1 ,, co.,, .1..
•
....„ , .. , ..
, • ; IV '. ity."..liii, . '00 'pa .
w , -..ir , '0.
..„," ..,,,Arl:-, fritoti . 11 *v. .% fictito 4
t i . 1 ', 471 ,41 I 1,1 - . i• ..'. , , • ito; OP • '
a 1 • .1411 0 g 04 . 1 8 i ... 4 ' * ir ! i , • -
8 . .' * " , • ' . 1..; , 1 . eie,
,
.6 fral". a 4 1 0104 ule Mr )1 4 .014■ " , .4., • 4. . , •
' -
• ms,
5 . 6
.1 •
.•••••,, - • .
,."*Airm,04;40 *

5.2 SEISMIC OPERATIONS
5.2.1 Introduction
Before seismic methods were introduced for geophysical explor-
ations the same principles has been applied by earthquake seismologists,
to determine the properties of the earth's interior. By the same
physical laws, seismic prospecting can be used to ascertain the
subsurface geology on a smaller scale.
Several short seismic spreads (90m) were performed on Keeper
Reef during June and August of 1979. The main objective was to
detect the engineering properties of the coral limestone.
5.2.2 Seismic Tests
Due to the tidal conditions that exist on bare coral reefs,
two different techniques were improvised to perform the seismic
surveys. Normal land based operations were used on a small section
of the reef and a fully afloat technique involving two small boats,
was used on the submerged areas.
Land based operations involved the use of a 4.5kg hammer and
a metal plate to generate a seismic source. A hydrophone was used
instead of normal geophones, because of the wet surface conditions.
By using a hydrophone, the hammerman moves along the traverse, as in
normal land based operations (Figure 5.6).
The variations that occur in the surface hardness affects the
amount of energy transferred into the lower strata by a hammer blow.
With this and the ambient noise level, the resolution yielded with
the hammer decreases rapidly with distance. Seismic detonators were
used, but are uneconomical and slower to use than the hammer.
Although Keeper Reef is approximately 3km long and lkm wide,
only a 200m strip along the seaward edge becomes fully exposed at
low tide. Of this area, about 10% consists of a hard flat surface,
34

while the majority is covered with numerous coral outcrops and
deposits of loose coral. When the surface becomes covered with more
than 2-3cm of water, it is inconvenient to work with a steel plate
and hammer. Furthermore, the surface conditions deteriorates in a
leeward direction due to the degree of coral development decreasing
towards the lagoon.
Although land based operations are practical and financially
viable, the method is limited by the length of spreads and the
resolution yielded. The main factors limiting this type of operation
are the tide, weather and general reef development.
To overcome such limitations, a method involving the operation
of equipment from two dinghies, working along a float line was
improvised.
To perform the operation, a float line is first anchored
over the test site, with buoys and reef picks. A hydrophone is placed
at the end of the line where the seismograph is stationed in an
anchored dinghy. A second dinghy is then rowed along the float line,
laying charges at the required distances marked by the floats.
Although the method sounds simple, care was required to keep
the electrical firing cable from being fouled on the coral. This
was to avoid unnecessary abrasion to the insulation, when moving
along the traverse and retrieving the cable.
In case of injury to personnel, extreme care was also required
when firing the seismic detonators, as the shot box was situated at
the hydrophone end. As the distance between stations increased, a
reliable method of signalling had to be developed for firing the
detonators.
This method requires more back up equipment and man power
(at least four) than land based operations, but allows a greater
35

degree of operational flexibility. The length of electrical cable
on each seismic detonator is the only physical limitation to the
depth of water in which the operation can be performed. As a 6.2m
cable can be ordered, there is no area within the confines of Keeper
Reef, that could not have been surveyed.
Although the method is flexible, it is far more time consuming
and uneconomical than land based operations, because of the necessary
man-power and cost of seismic detonators ($1.70 each). However, this
method of surveying allows the use of a single channel seismograph into
a marine environment, where other geophysical methods are limited by
the reef's topography.
Both methods above, were used to obtain seismic data from a
total of five 90 metre spreads. The location of the runs are shown
on the site plan of Keeper Reef in Figure 5.1. Four runs were
performed on the reef flats and the remaining one a distance of 300m
in a northern direction from the beacon.
Runs I, II and V were carried out using the floating method,
while III and IV were performed by land based operations. A hydro-
phone was used instead of the normal geophones for all operations.
5.2.3 Test Results
From the raw data of each seismic survey, the seismic velocity
of the two shallowest formations, along with the depth of the inter-
face between them, has been calculated. The values from the five runs
are shown in Table 5.7. The raw data collected from the surveys is
given in Appendix B.
From Table 5.7, the values of V1
fall within a 7% range,
except for run III, where the surface material has a seismic velocity
of 2.14km/sec. It must be remembered, that the surface velocity is
obtained from the material near the beginning of a spread. The
36

I
10
r
70
60
50 E
Q
NO
. OF
BLO
WS
30
20
• ■•
Penetration Test No. 15
FIGURE 5.8
cr) cx=nin
1
UM,
1
6
8 10 12 14 16 18 20
DEPTH ( m )

30
Penetration Test No.
FIGURE 5.9 25
E
.4 20
0
cc
cr)
15 0
d
1 1 0
1
0 0 2 4 8 10
12
DEPTH ( m ) 14 1G 18 20

• 0 0
0 0 0 LC\
0 0
o 0 0
■.0
o o o 0 WAV VELOCI7),m/cu o o 0 o 0 o - 0 o o in 0 0 o L('\ c\I V.\ Nt
GEOLOGICAL MATERIAL
Classification of Gologica1 Materials from Seismic Velocitie,,
FICTIVE 5,10
'c Ma r oil
triai
Loose Sand
Silt
Gravel
Clay, Till
Compacted Clay
:-)crdstoni-,Graywacke Conglomerate
Shale,milThve Argillite
Limestone ,Dolomite
Weathered, Sheared ' ac -mred Rocks
0 0 0

starting position of spreads III and IV also roughly coincide with
penetration tests 15 and 1 respectively. From the graphs of these
tests, Figure 5.8 and 5.9, the soundness of the near surface material
around test 1 is observed to be extremely harder than that of test 15.
The variation in V1 for run III can therefore be accounted for. Thus
the seismic velocity of the general reef surface may be taken as
approximately 1.7km/sec and 2.1km/sec for harder sections on the
reef flats.
TABLE 5.7
Run No. Layer Velocities V1
(km/s) V2
Layer Thickness(m)
I 1.67 2.22 6m
II 1.67 2.09 5m
III 2.14 2.62 5.9m
IV 1.67 2.18 * 3.6m *
V 1.56 1.85 5.1m
Due to the obscurity of the time-distance curve of the first
arrivals, an accurate value of V2 cannot be ascertained. The
depth of the interface between layers, also contains gross errors.
The second layer detected on the reef, has an average seismic
velocity of 2.2km/sec, and occurs at a depth of 5-6m. Layers deeper
than 6m have not been detected, due to the shortness of the runs.
Runs of 300m or more, would be required to determine the depths of
deeper deposits.
By comparing the materials given in, the Classification Chart
of Geological Materials from Seismic Velocities, Figure 5.10, for
the seismic velocities of the reef material, the relative soundness
of the coral limestone can be obtained.
40

As the velocity of all saturated low speed materials fall
within the same velocity range 1.3 to 1.7km/sec, no comparison can
be made for the surface material with a velocity V 1 = 1.7km/sec.
However, the coral limestone with V 1 = 2.14km/sec, has a similar
velocity of compacted clay through to shale, which is firmer than
the topsoil on Douglas Campus (V 1 = 500m/sec).
The seismic velocity of the second layer, corresponds to the
velocity of compacted clay through to weathered, sheared or fractured
rock. Thus the relative firmness is substantially higher for the
coral limestone than the lower stratum detected at Douglas Campus,
which had a seismic velocity of 1.31km/sec.
Therefore, from the seismic velocities obtained of the lime-
stone it could be generally assumed that the coral limestone is
firmer than the topsoil at Douglas Campus.
For a layer to be detected by refraction methods, its velocity
must be higher than that of the preceding layer. This must occur for
all successively deeper layers. When a stratum has a seismic velocity
lower than the one above it, it will not occur on the time-distance
plot of the first arrivals. Therefore, layers of sand or very porous
coral which occur below firmer material, will not be detected. Errors
will result in the calculation of depths and thickness for layers
below these weaker layers.
As the presence of softer material cannot be detected, a
hole full of water within the limestone will not be detected also.
This is due to the seismic waves propagating across the hole, via
the fluid medium.
Therefore, the results of any survey will only allow the
characteristics of the firmer strata that exist on the test site to
be detected. Thus, the seismic velocity, depth and thickness of

42
each layer are the only characteristics that can be derived directly
from a time-distance plot of a spread.
5.2.4 Comments and Recommendations
The seismograph is not capable of determining the engineering
properties of coral reefs, with respect to holes and weak spots that
exist within the coral limestone. However, the general subsurface
formation of the reef can be determined, with an indication of the
relative soundness of each stratum.
By using a floating survey technique, far more flexibility
is obtained than by land based operations. Also the cost factor
involved in the floating techniques, is outweighed by the amount of
surveying that can be performed.
For future surveys, it would be more advantageous to use a
lx2 channel operation rather than a single channel, due to the
increase in signal to noise ratio. Therefore, by using two h ydrophones ,
instead of one, the clarity of the time distance plot may be improved.
Due to the electrical cable fouling on coral outcrops, it
would be helpful if attachable floats could be connected to the cable
while being fed out. This would allow the cable to be kept off the
reef floor, allowing furthermanoeuverability to the shot station.
5.3 PENETROMETER OPERATIONS
5.3.1 Introduction
The main use of heavy dynamic penetrometers in the past, was
for onshore site investigation work. The determination of various
strata thicknesses and their relative hardness, was one aspect of
the machine's capabilities.
As the penetrometer has had only minor previous testing
(three soundings in 1978) it is intended to perform further testing
to assess its feasibility as a site investigation technique on bare

-.E.' i Ui L 5.11

coral reefs. The objective is to determine the engineering properties
of coral limestone to a depth of 25m.
5.3.2 Testing Operations
The heavy penetrometer used for the investigation, is shown
in Figure 5.11, mounted on the raft in an operational state. Two
series of tests were achieved in June and August of 1979, where six
and ten soundings were achieved respectively.
For previously performed tests, the raft was anchored over
the test site and allowed to become stranded before testing was
started. However, from the May trip (drilling series 1979) it was
observed that the testing procedure could be made more flexible, if
tests were performed while the raft was afloat.
Prior to the June trip, manually operated winches were
installed onto the raft at each corner. The purpose was to prevent
any slack occurring in the anchor cables, thus stopping any appreciable
movement of the raft while anchored. This was done in an attempt to
increase the work potential of the raft, by allowing tests to be
performed while afloat. Thus testing would not be restricted to a
small percentage of the reef area, consisting of the seaward edge of
the reef and isolated outcrops. Furthermore, the available testing
time in a day would not be limited to a few hours either side of low
tide.
5.3.3 First Series of Tests
The first series of penetration tests were carried out during
four days of extremely bad weather in June. A total of six tests to
an average depth of 22m were performed, of which five were achieved
while afloat and the other test performed stranded on a large coral
outcrop.
The initial test was executed in approximately 2m of water,
44

SITE PLAN 16 o
4 8-
09 2 3 'clo
o 5 6-7
10-14 o
- BEACON
o PENETRATION TEST
o DRILLING TEST
- SEISMOGRAPH TEST
O
500 m
FIGURT;' 5.12

0 4 2 6 12 14 16 18 20 22
Penetration Test No. 4
FIGURE 5.13
10
DEPTH (m)
30
25
C
20
(.1)
0 CL
15 0
0
10

0 2 4 6 a 10 DEPTH ( m )
12 14 16 18 2 0 22
30
(5
20 r)
C)
oJ
15
ci
10
Penetration Test No. 5
FIGURE 5.14
L
KIT
111

Penetration Test No. 6
30 FIGURE 5.15
1
0
2
4
6
8 10 12 DEPTH ( m )
14 16 18 20 22
J
25
- 20
ED
(f)
15
ci
10

OF
BL
OW
S
15
Penetration Test No. 7 30
FIGURE 5.16
—25 E
20
I
TI
0 2 4 6 8 10 12 14 16 18 20 DEPTH ( m

Penetration Test No. 8
FIGURE 5.17
J
•-t
•••••••••
L
2
4
6
8 10 12
14
16
18
20
22 DEPTH (m)
30
E
_ in
b
z
25
20
15
10

Penetration Teat No. 9
FIGURE 5.18
OF
BL
OW
S
L
1 r
J
id* L
4 6 8 10 12 16 18 20 22 24 26
DEPTH Cm) 2

8 N
Penetration Test No. 10
30 FIGURE 5.19
— 25
1
L
LI j-
2 22 20 14 16 18 6 4 8 10 12 DEPTH ( m )

(N
15
1
1.
12 4
16 18 20 22 4 2 8 10
DEPTH Cm )
35
Penetration Test No. 11
FIGURE 5.20 30
25 E
4.1
1 Li)
0

1 L
J ft
1
22 20 18 1G 14 6 4 2
Penetration Test No. 12
FIGURE 5.21
10 12 DEPTH Cm )
ni l
30
25 E
20
0
LL 15 rTh
10

iT
rlLLIr Lu
0
•••
1
30
Penetration Test No. 13
FIGURE 5.22
25 E
20 (f)
0
LL 15 0
10
Jr Jr
0 2 4 6 8 10
12 DEPT HCm )
14 16 18 20 22

d
rir
4 6 8 10 12 DEPTH ( m )
14
16
Penetration Test No. 14 30
FIGURE 5.23
25 E U
18 20 22

Penetration Test No. 1
FIGURE 5.24
I
1
•••■•■••■•■•■•■■1■
2
4
6
8 10 12 14 16 18 20 DEPTH Cm )

0 2
4
6
8 1C 12 14 16 DEPTH ( m )
Penetration Test No. 2
FIGURE 5.25
r
r
I
18 20
30

35
30
25
E U
20 (1)
CD
15 0 d z:
10 L I-
Ti
Penetration Test No. 3
FIGURE 5.26
T
L
m
2
4
6
8 10
12
11+ 16
18
20 DEPTH Cm)

Penetration Test No. 15
FIGURE 5.27
r
c-D
— 40
0
IL 30 0
50 E
70
60
20
10
5 6 10 12 14 16
DEPTH ( )
18
ijrs 1
20

6 4 2 8 10 12 14 DEPTH ( m
20 18 16
Penetration Test No. 16
FIGURE 5.28

to observe the effectiveness of the winches in keeping the raft
stable. It was found that a penetration test could be performed
while the raft was afloat, with no major problems occurring in the
equipment. However, due to the rise and fall of the tide, the winches
required periodic adjustment to keep the raft centred over the hole.
The results of test 4 are shown in Figure 5.13 and its location is
indicated on the site plan in Figure 5.12.
One test in this series was executed while the raft was
stranded on a coral outcrop within the lagoon. This was to determine
if any variation in soundness existed between the coral outcrops and
the floor of the lagoon. The results of test 5 are shown in Figure
5.14.
By using a floating technique, it was possible to do two
soundings in the same area, by moving the raft a few metres using the
winches. This allowed more than one test to be achieved on any
particular site, where previous procedures allowed only one test to
be performed. The remaining four tests in this series were carried
out in pairs, and the results of these tests (6-9) are shown in
Figures 5.15-5.18.
5.3.4 Second Series of Test
This series was performed over five working days in August,
1979. A total of ten soundings were attempted of which seven were
completed to an average depth of 20m, and three more were abandoned
due to technical problems.
The first five tests were performed within an area of approx-
imately nine square metres, to carry out a sensitivity test. The
tests were performed in a small pocket of water 2-3m deep which
permitted testing to continue throughout a whole day. Two and three
tests were performed over two consecutive working days. The results
62
of tests 10-14 are shown in Figures 5.19 - 5.23, while the location
is shown on the site plan, Figure 5.12.
In September, 1978, three penetration tests were carried out
by H. Bock, on the seaward edge of the reef. The results of tests
1-3 are shown in Figures 5.24 - 5.26. As the depth of penetration
was only to 14m, a further test was planned to a depth of 20m.
Two tests were attempted, but both were abandoned due to
malfunctioning of the penetrometer, which resulted in several metres
of sounding rods being damaged. As the problems were caused by the
prevailing sea conditions, it was futile to attempt further tests
and the raft was motored to a large bommie on the leeward side of
the reef.
The raft was allowed to settle onto the bommie and a test
started. At a very shallow depth severe bends occurred in the
sounding rods and the test was discontinued. This was caused by
large cavities in the coral deflecting the rods off course, when the
penetration tip encountered the side of a hole. The penetrometer
was then rotated 180° and another test attempted approximately 1.5m
from the first. However, the same problem occurred and no further
tests were performed on bommies on the outer leeward edge of the reef.
Of the two tests completed at the end of this series, one was
performed on the extreme seaward edge and the other approximately
500m from the leeward side of the reef. The results of test 15 and
16 are shown in Figures 5.27 and 5.28 respectively. Test 15 was
performed while the raft was stranded during the extremely low tides
(-.1m) that were experienced at the time.
The results of all the tests carried out on Keeper Reef,
have been plotted as a graph of the number of blows required to
penetrate 10cm against depth. The tests have been numbered in a
chronological order and their respective positions plotted on a
6

site plan given in Figure 5.12. The raw data collected from the
penetration tests is given in Appendix C.
The actual location of each test was determined by means of
the research vessels radar. Bearings and distances (accuracy of -.01
of a nautical mile) were obtained of the raft and radar beacon with
respect to the vessels position. From these values, the test
locations were plotted on a site plan relative to the radar beacon.
When plotting the test results, the datum used is a calculated
value of the tidal datum. While performing a test, the starting and
finishing times along with the corresponding depth of water were
recorded. With these values and times and heights given in the Tide
Tables, it is possible to approximate the tidal datum from calculations
assuming a sinisoidal tidal variation. The depth of water below the
datum can then be obtained for each test, allowing all the results
to be plotted with respects to the same datum.
The locations of the thirteen tests performed, were as close
as possible to a line with an approximate bearing of 165° with respect
to the radar beacon. The tests were performed along this section so
as any changes in the reefs composition may be noted.
5•3.5 Testing Limitations
Because of a combination of human, technical and geological
factors, the amount of testing that can be achieved for any given
period, is far from predictable.
Due to the reef topography, it is not possible to manoeuvre
the raft within the reef's confines, other than at high tide. Thus,
once a test is completed another cannot be started at any great
distance from the present position, until sufficient water returns
to allow repositioning. However, this situation was aggravated by
the fact that testing was carried out while the lowest tides for the
64

year were being experienced. This could be improved if testing was
performed during the neap tides, where the rise and fall is minimal.
The sea conditions over the test site can sometimes cause the
malfunctioning of equipment. If the movement of the raft is excessive,
the endless chain can catch on the percussion mechanism and prematurely
lifts it to the top of the mast. This then violently hits the rods
when it falls back, sometimes causing damage to the sounding rods
and other equipment.
Testing was successfully performed in water 3m deep, and no
excessive deflection of the unsupported sounding rods was noticed.
The greatest depth of water that testing can be performed in, will
have to be determined by trial and error.
Another factor limiting testing procedures is the physical
endurance of the personnel involved with the operations. Although
a test can be achieved within two hours, it has been found that
three tests a day is very tiring. This is due to being totally
exposed to the environment while working on the reef for several hours.
5.3.6 Test Results
By closely examining the results of any test, it is clear
that the penetrometer can detect the geomechanic constituents of the
coral quite precisely. The basic units of interest from an engineering
point of view, are the various strata, deposits of sand and weak spots.
If test 14 (Figure 5.23) is used as an example, it is clear
that different stratum and weak spots within the coral's composition
can be detected. At the approximate depths of 5, 15 and 18m, distinct
examples of holes or weak material that exists within the coral are
shown. Basic layer formations are shown to exist at depths of 3-10,
10-17, 18-21 and 22 metres and have corresponding approximate N values
of 3, 7, 10 and >50 respectively. Thus, from test results, it is
6 5

possible to clearly record the composition of the subsurface at the
particular test site.
However, from the results obtained from a test hole, it
could not be assumed that the same conditions exist over a large
area, due to the way that coral reefs are formed. To determine the
variation of formations with distance, five tests were performed
within a small area to determine the sensitivity of the coral limestone.
5.3.6.1 Sensitivity Test
From the sensitivity test (tests 10-14) some distinct geol-
ogical features have been reproduced, but their respective depths
and soundness varies considerably over an area of approximately nine
square metres.
Five of the most noticeable features detected by the tests
have been listed below.
A very weak layer exists within the depth range of 3-5
metres and has an approximate average N value of 0-1.
For depths below 10m, an increase in the average penetration
resistance occurs.
Around the depths of 14 and 18m a general decrease in the
average penetration resistance exists.
A very distinct geological discontinuity is clearly shown
in all five tests at an approximate depth of 22 metres.
The discontinuity (4) is accompanied by a noticeable drop
in the penetration resistance for one metre prior to the
discontinuity.
For the five tests, only points 1, 4 and 5 are reproduced
with any degree of accuracy for all the tests. Other noticeable
features vary considerably for the tests within a space of 3 metres.
Thus, for tests within a small area, it could be assumed that major
geological features lie within a -20% range, both for depth and N values.
66

67
However, geological features that exist on one section of the
reef differ from those determined 500m away. By inspecting the
tests performed along the transect bearing 165 ° , several distinct
variations in coral development have been noticed. The four most
noticeable variatims have been listed below.
The surface hardness increases from the seaward edge
N15
= 10) to the top of the reef flats (N 1 = 60) and
then gradually decreases (N3 = 10, N 2 = 5) and stabilizes
on the lagoon floor (N5 = 5, N8 = 3).
A distinct discontinuity occurs at varying depths across
the reef. Shallower on the seaward edge than in the
lagoon.
For over 500m within the lagoon region, two general
decreases in penetration resistances have been recorded
at approximate depths of 6 and 13m (+1m) respectively.
The general penetration resistance within the reef flats,
suffers very large variations over short distances (20m).
As very few tests were completed on the leeward edge of the
reef, a complete picture of the underground geology cannot be made.
However, the geology of the seaward edge has been investigated further
in Chapter 7.
As the results of sixteen tests have been collected, it is
possible to correlatethe relative density of the limestone with its
corresponding N values. Thus, the relative density can be scaled
over the range of penetration resistance values obtained from the
tests. However, material with N values greater than 50 have all
been classified as extremely hard, although the hardest material
sounded required 516 blows to penetrate approximately 1cm. Given in
Table 5.29 is the physical properties of the coral limestone with
* Subscript indicates test numbers.

its corresponding penetration resistance.
TABLE 5.29
N
Relative Density of
Possible blows/10cm Coral Limestone Material
0-2 Very weak (VW) Holes - sand
2-5 Soft (S) Loose-porous coral
5-10 Firm (F) Soft coral limestone
10-20 Hard (H) Hard coral deposits
20-50 Very Hard (VU) Hard to cemented
>50 Extremely hard (EH) Cemented Limestone
5.3.7 Errors
Several errors have been found to exist in the recording
procedures used for performing some of the thirteen tests in June and
August. The errors are a direct result of the relative movement of
the raft while subject to tide, waves and wind. The cause of the
largest errors in the recorded values, is the resultant rise or fall
in the tide that occurs while testing is carried out.
As the arbitrary point chosen to record the depth of penetration
was fixed to the raft, values recorded do not account for the effects
of the tide.
If a test was performed during a falling tide, a resultant
error equal to the fall in height of the tide would occur. Thus, if
a 0.5m fall in the tide was experienced, then the depth of the sounding
rods would be 0.5m deeper than that recorded. Also the number of
blows recorded to penetrate 10cm would also be higher than the actual
penetration resistance of the material being penetrated. This is
due to the extra length of rod that has to be sounded into the sub-
surface for each 10cm recorded.
62

Similarly, a reverse situation occurs when a test is recorded
on a rising tide. This results in the recorded depth being deeper
than the actual case, and N values becoming progressively under-
estimated with depth.
As a test continues, the error occurring from the tide, pro-
gressively increases as the depth of penetration increases. This
results in the error being largest at the end of a test, and zero at
the beginning. However, the variation is not linear, due to the
different rates of penetration that occurs with depth.
To observe the effect that this error can have on tests, it
is possible to correct the depth of the discontinuity (N>50) detected
in the sensitivity test. As testing was stopped at the discontinuity,
the tide correction is equal to the tidal variation for each test.
Thus by adding or subtracting the appropriate tidal variation. to the
depth of the discontinuity, the recorded depths can be corrected.
Shown in Table 5.30 are the recorded and corrected depths to the
beginning of the discontinuity.
TABLE 5.30
Test Recorded Depth
Tidal Variation
Corrected Depth
10 21.2m *
-0.9m 22.1
11 22.2 +0.4 21.8
12 21.8 -0.8 22.6
13 21.7 -0. 1 21.8
14 22.6 +0.3 22.3
D=21.9m D =22.1 C.
6 ---
* Negative denotes a falling tide.

As can bu scun, the averayc depLh Lo the discontinuity has
not been affected greatly, D = 21.9 and D = 22.1m. However, the
range of depths has been decreased by 0.6m, giving a total range of
0.8m compared with 1.4m before correction.
Thus the correction for the tide can account for a major part
of the variation of depths, that occurs for some geological features.
Although it would be possible to correct a complete test for depths
and N values using a computer program, it would be far more advantage -
ous to prevent the errors than to correct for them.
When recording the number of blows required to penetrate a
10cm section, errors occur due to the fluctuation of the raft from
wave effects. If the rate of penetration is slow, difficulties arise
in defining the cut off point for each 10cm sections, if the raft is
fluctuating by 2cm. Therefore the errors in the N values increases
as the rate of penetration decreases.
Errors also occur in calculating the tidal datum which was
used as the datum for plotting the test results. For calculating
the datum the times and height for Townsville's tides have been used,
assuming the turn of tide occurs 20 minutes earlier on Keeper Reef.
As the tidal data for Keeper Reef is unknown, the size of the errors
arising from this assumption cannot be calculated.
To overcome the errors caused by the relative movement of the
raft, a datum fixed to the reef surface would have to be used for
all recording purposes. One method of producing a fixed reference
point, is to use a length of sounding rod embedded into the surface,
until it becomes stable. Once a reference rod has been established
the raft could be shifted aside, until sufficient room is available
for the operation of the equipment. A test could then be performed,
using the measuring grooves on the reference rod as the datum for
recording purposes. The reference rod could be retrieved in the

71
normal way, after completion of the test.
By using calibrated sounding rods, no errors can occur when
recording the depth and corresponding penetration resistance.
accurate measure of the depth of water at the start and finish of
each test, can also be obtained using this method.
To decrease the errors created in calculating a datum, a
semi-permanent tide gauge in the form of a calibrated rod, could be
established on the reef prior to a series of tests. By taking a
reading from the tide gauge at the end of each test, a series of
tests could be related accurately to any chosen datum. For future
purposes, a permanent mark could be installed on the reef, so as the
datum used for each series of tests can be related to a known height.
5.3.8 Comments and Recommendations
Testing operations showed that penetration testing while
afloat, is a very feasible technique for determining the geomechanical
units (coral limestone, sand and holes) of coral reefs. Though there
are a few geological and technical problems which restricts the
technique, forward planning can overcome or moderate these restrictions.
For future testing series, the trips should be planned to
align with the neap tides, instead of the extremely low tides. This
will allow far more flexibility into the testing procedure, as
testing for a day will not be restricted to the one position, as in
previous cases.
The introduction of a fixed reference and a tide gauge into
future testing procedures, would allow , a higher degree of accuracy to
be achieved in the test results.
In carrying out site investigation work, a very thorough grid
of tests would be required to obtain a clear indication of subsurface
formations, over a large area. If the location of proposed foundations
are known, spot checks could readily be performed, saving time and money.

CHAPTER 6 - CORRELATION OF TEST RESULTS
6.1 INTRODUCTION
As three site investigation techniques were tested, the
results can be compared enabling the degree of correlation between
methods to be ascertained. However, comparisons between the drilling
penetration and seismic-penetration tests can only be made, as
information derived from the drilling tests is inadequate to allow
comparison with the seismic spreads.
6..2 DRILLING AND PENETRATION
As the monitored drilling test (test 2) was performed close
to the site of a penetration test (test 1), results can be readily
compared. The results of both tests are shown in Figure 6.1 and 6.2
respectively. Three distinct sections or layers have been detected
by both tests at approximately the same depths. The depth of the
layers are shown in Table 6.3.
TABLE 6.3
LAYER DRILLING PENETROMETER
DEPTH OF PENETRATION DEPTH OF INTERFACE
1
2
0.8m 0.7m
3
1.4m 1.4m
Although the general layers have been detected quite accurately
by both tests, the soundness for individual 10cm sections varies
considerably. The differences could be accounted for by either one
or two factors;
• 1) The hardness of the limestone is different between both
test sites.
2) A constant pressure was not maintained on the cutting face,
which would have caused variations in the drilling rate.
72

3.5
DRILLING TEST
COPE
RECOVERY 3.0 FIGURE 6 . 1
_J
cx
C
1.0
.2 .4 .6 .8 1.0 1.2 1.4 1.6 1.8 2.0
DEPTH ( m )
0
,2
.4
.6
.8
DEPTH 1.0
C m) 1.2
1.4
16
1 .8
GOOD
POOR
5 cm
NONE

PENETRA■TION TEST
FIGURE 6.2 1 1
100
E 2 90
80
70
60 0
50
40
30
20
10
0 .2 .4 .6 .8 1.0 1.2 1.4 1.6 18 2.0
DEPTH ( m )

6 -4
E 8
12 1 5 15 7
0 FIGURE 6 . 4
2 3
150 300 450 600 .,720
10
0-5 5
10 (3)
5 (5) 7
8
0111. 9 Nalsommos.••■■•••0
10 10 1 0
10 (7) 15 15
18 ■ 17
50
10
5 4 6-7 8-9 TEST NUMBER
20
22'
10111. 1 15
TIDAL DATUM
a: 10 a_ LiJ 0 12
25 5 • (10)
DISTANCE ( m)

Even though differences do exist between sections, the
relative hardness of each layer can still be determined from both
tests.
As an insignificant amount of drilling was performed, it is
not possible to ascertain whether the monitoring of drilling tests,
is a feasible site investigation technique.
6.3 SEISMOGRAPH AND PENETROMETER
To readily compare the depth of subsurface formations determined
by the seismograph with those derived from penetration tests, a profile
of various disconformities detected by the penetrometer have been
plotted.
By assuming all the penetration tests lie along the same
longitudinal section, the depth of distinct features can be plotted
and contoured. This allows underground formations to be visualized
easier than a series of graphs can portray.
The following list of disconformities have been plotted and
contoured for fifteen penetration tests carried out on the seaward
edge of the reef over a 720m section.
Layers of generally weak material
A layer of extremely hard material (N>50)
Zones of isolated material of relatively high resistances
The profile of this section is shown in Figure 6.4.
The results of only four of the five seismic spreads performed
on the reef will be considered, as gross errors are known to exist
in the calculations of depths for run IV.
For shallow formations, the calculated depth of a stratum,
is the depth of the layer at an offset distance from the start of a
run. Thus the results of the nearest penetration test to the beginning
of a seismic run, will be used for comparison purposes. Therefore
76

the results of penetration tests 3, 1, 1 and 6-7 will be compared with
the depths of formations derived from seismic surveys I, II, III and
V respectively.
The depth of the lower stratum determined by the seismic
spreads, have been tabulated along the depths of the corresponding
formations detected by the penetrometer (Table 6.5).
TABLE 6.5
SEISMIC SURVEYS PENETRATION TESTS VARIATION DEPTH OF DEPTH OF IN DEPTHS %
RUN NO. LOWER STRATUM TEST NO. CLOSEST LAYER
I 6.0 3 5.4 10
II 5.0 1 5.7 12.3
III 5.9 1 5.7 3.4
V 5.1 6-7 5.8 12
From the table, a maximum variation of 12.3% exists between
the depths determined by the seismograph and penetrometer for the
same formation. However, when considering the error of the seismograph
(±10%) and those in the results of a penetration test (tide, datum
etc.) a 12.3% error is quite acceptable.
6.4 COMMENTS AND CONCLUSIONS
Although the results of the monitored drilling test compared
closely to those of the corresponding penetration test, the degree
of correlation cannot be estimated as an insignificant number of
drilling tests were performed.
From the comparison between the penetrometer and seismograph,
the results show a possible 12.3% variation in depths for shallow
formations. As no results for deeper formations were obtained from
the seismograph, comparisons cannot be made for deeper strata.
The variations that have occurred may possibly be decreased,
77

if the testing procedure for penetration tests are modified as
recommended in Chapter 5.

Irf
S Very ''':eak Soft
Firm
2 3 8-9 TEST NUMBER
0 150 300 450 600 -720
F F
15
,rd
1
FIGURE 7.1
E: 1 y
H Hrd
iiard
DISTANCE C m )

CHAPTER 7 - GEOLOGY OF KEEPER REEF
7.1 INTRODUCTION
When referring to the geology of Keeper Reef, only a 720m
section of a transect, bearing 165 ° with respects to the radar beacon
on the seaward edge will be considered. Only formations above an
average depth of 20m can be considered, as testing was limited to
approximately this depth.
7.2 BASIC GEOLOGY
The type of material within this 20m section cannot be
specifically classified, as very little core recovery was obtained
throughout the section. Thus the coral limestone can only be described
in terms of its relative density, which is directly proportional to
its penetration resistance.
Therefore, the results from the penetration tests will be
used to determine the basic geology in this section, due to the
significant amount of testing performed along the transect.
Using Table 5.29(Correlation of penetration resistance with
the physical properties of coral limestone) in conjunction with
Figure 6.4 (profile of distinct geological features along the transect)
the general relative density of formations to a depth of 20m along
the transect can be outlined as shown in Figure 7.1.
The characteristics that have been indicated on the profile
are the distinct geological features that were detected over the
section. Although fifteen tests were achieved it is not possible to
clearly plot the general geology in some regions, due to the distances
between tests. Within the areas marked (A), (B) and (C) in Figure
7.1, some doubt does exist to the limits of the various geological
formations.
In region (A), the lower disconformity (9) has been detected
co

with a relatively lower penetration resistance (N = 25) than else-
where (N>50). Either the actual disconformity is located at a deeper
depth and has not been sounded, or the relative hardness in this
region is less than normal. However, as the lower layer (9) is
accompanied by a weak layer (8), it is probable that it is softer in
this region. This is based on the observation that a weak layer
exists on top of the extremely hard disconformity throughout the
section.
The actual thickness of the lower disconformity (9) has not
been ascertained in different positions, as most tests were discontinued
once this layer had been located.
In area (B) the weak layer (6) has not been continued as its
position is not clearly defined in tests 1 to 3. This is due to
large variations in the general hardness and depth of formations
that occur from test to test within this region.
Within zone (C) the limits of the underground formations (11),
(12) and (3) have only been estimated, as insufficient information is
available to allow accurate contouring. In test 1, a 2m layer of
very hard limestone has been detected with an average N value of 60.
However, a distance of 33m away, test 15 showed the near surface layer
as having an average N value of 10. Thus the boundary of these form-
ations can only be found by further testing within this section.
However, from the information available a few general character-
istics of the reefs geology can be obtained. These are listed below.
The coral growth on the seaward edge of the reef is
developed more than the lagoon region.
The seaward edge is approximately 2m higher than the lagoon
floor.
The coral limestone is harder for the first 10m on the
seaward edge than in the centre of the lagoon.

A general increase in hardness occurs with depth, more
so beneath the lagoon than the seaward edge.
Several thin weaker layers exist at various depths through-
out the reef.
An extremely hard layer occurs between a depth of 8-22m
across the section.
Disconformities occur at deeper depths beneath the lagoon
than under the seaward edge.
From the section tested, the seaward edge is much harder at
shallow depths (0-10m) than the lagoon. Therefore, it would provide
the most favourable foundation site on the reef. However, structures
erected on the seaward edge would be subject to the full force of the
prevailing seas.
As all testing was performed on one side of the reef, very
little is known of the geology on the leeward side. Thus, further
testing is required on different sectors to determine the full
potential of the reef in respects to favourable foundation sites.
7.3 COMMENTS AND CONCLUSIONS
The general geology of the reef is very complex, and distinct
geological features vary considerably for different sections of the
reef. The seaward edge is the most complex and developed area of
the reef. Further testing is required on the leeward side, to obtain
a complete profile of geological features.
To detail the geology of the whole reef, further testing is
required along several longitudinal and cross sections of the reef.
Extensive testing would be required on the reef flats, due to the
complex coral development in this region.
82

CHAPTER 8 - CONCLUSIONS AND RECOMMENDATIONS
8.1 CONCLUSIONS
Of the three site investigation techniques tested, the
penetrometer is the most feasible method for determining the
engineering properties of coral reefs. A penetration test can detect
all the basic geomechanical units of coral reefs to a depth of 25m.
Single channel portable seismographs are not capable of
detecting all the engineering properties of coral reefs. Basic
layer formations can be recorded, but holes and deposits of weak coral
and sand cannot be detected. However, seismographs allow a fast
method of determining the depth and relative firmness of layer
formations.
Core drilling operations are an inefficient method of
determining the engineering properties of coral reefs. The percentage
of useful core samples recovered from the coral is negligible and
very little data with respects to foundation properties can be derived
from them. Until the percentage of useful core recovery can be
improved, this type of drilling operation on coral reefs should be
restricted from further use.
8.2 RECOMMENDATIONS
For future testing series or site investigation work, with
the penetrometer, changes to the testing procedure as recommended in
section 5.3.8 should be adhered to. This would ensure a high degree
• of accuracy in the test results.
Further testing could be performed on Keeper Reef, to
ascertain its complete geology to a depth of 20m. This may allow
favourable foundation sites to be related to the genesis of the reef.
Thus, for reefs of a similar structure, promising foundation sites
may be located without major site investigation work.
83

As a recommendation for future research, several test piles
could be driven into previously sounded coral limestone and typical
load test performed. Thus, the loading capacity of various piles
could be related to the data obtained from penetration tests, allowing
basic design criteria for piles in coral limestone to be formulated.
84

APPENDIX A

When the portable seismograph was initially used in an
aquatic environment (May, 1977, Keeper Reef) several technical
problems occurred which rendered the instrument inoperative. The
main problem was the seepage of sea water into various electrical
connections and switches.
As connections were open to the air, sea water was able to
penetrate and cause high resistances between terminals, preventing
the reopening of the triggering circuit. To overcome the problem,
connections, switches and electrical cable had to be waterproofed.
From previous usage, the insulation on the original triggering
cable had been damaged in several places. Therefore, the cable was
replaced with 100m of two core double insulated electrical cable.
Due to the thicker insulation, the new cable had more protection from
abrasion than the original.
To waterproof the connections on the triggering cable, the
end of each electrical plug was encased in a solid cylindrical fibre-
glass block. This prevented the soldered joints from coming in
contact with air or water and being damaged from general handling.
For simplicity, double pole single pin electrical plugs were used
for all connections.
To form the fibreglass block around the connections, a piece
of clear plastic tubing (18mm inside diameter) was used as the mould.
By using the tubing as a mould, a similar piece of slightly reduced
diameter could then be used to form a skintight casing.
To assemble the connection, the connectors were forced into
the casing and insulated at each end with silicone rubber. Thus once
the silicone rubber had set, a very waterproof connection was obtained.
A diagram of the connections used are shown in Figure 1. The inertia
switch used for triggering the seismograph for each hammer blow, is
shown in Figure 2 completely insulated.
Ei6

// / / / / l/ LL//// W////////,/
Fibreglass
Sinle Pin Double
Pole Connectors
Two Core
Electrical
Cable-
FIGURE Al
Single Pin Double Fib:.7eglass Clear Plastic
role liug Switch
Tubing
(__ //////d/ a Th
AMY AIIMMII,
TNEHTIA SWITCH
Silicone
-- Rubber
FIGURE.

88
APPENDIX B

8 9
Seismic Run Douglas Campus:April)
FIGURE BI. *

Seismic Run 2 (Douglas Campus:April)
FIGURE B2 - •

Seismic Run 1 (Douglas Campus:May) ,
FIGURE B3.
91

•
4 .
- - -
14
i -f'• - 4 - • -
;
- -
1
Ia
.4 4. 4
.7)
Seismic Run 2 (Douglas Campus:May)
FIGURE B4.
92

Seismic Run I (Pallarenda)
FIGURE B5.
93

Sedsmic Run 2 (Pnllarenda)
FIGURE B6.

0,-
Seismic Run I (Keeper Reef)
FIGURE B7.
95
•
.F3 3
EE: I.;. 111-.
Ji
.te,4-4.4)(4,4' ,0
/
j • ;
-
SOIL CO:.LIC I tY Y.:
. er It/A./"T -c
raTi.o., 3:01 BE. LIYEL dB
SCALING ON PAPE., .. 1..:
FROM . . .1n TO O. .m
FRO-. .41). .rn TO
1B0. TO
1,0 41 to f 47,i,43,/‘ XecoV,CV".4
SPA CD:C.= S.--
SPACING .
SPACING in
in
in
In
LaGM (.1: RUN '0
PROFILING
INITIAL POINT ...... ..m
aDOY . NO.
TITVATION OF SBOTPOINTS
F...N.D POINT
BUOY
in
. • • • • • • • • 0 * • • • •
,000 .000 0.000 .0000
•
• • • 000* 0000 • • •
• 0 • • • • • • • • • • • • • 4. 0 00 • • o • • 0 0 0 0 0.00
SY.rA`e:4. .. ftf-f
44-4-044'' /4-Va-x-4 ---`41 424
... .. . ... .
Lh
SYITCHIS

96

Seismic Run II (Keeper)
FIGURE B8.
LEIS: ; OG
?./.. /42
r. , ersof,-(c k/zt- resr dr.sok-2, /
3.0. CPG:,..-.07-330.aT.
si >4
SOIL C: 72 0:: . IfevAJD XT7
ATiE CO3:DI 71 CI. -rkaw -r -̀'/4"-<
La TILL ; LEbIL
SCALING O.: PAP12-1 / • /•'''
FROM m TO 7P.. .to SPACING=
FRO.. m TO SPACING
FR ro TO SPACING
TGni OF RUN f°
PROFILING
INITIAL PC)INT E,d) POINT
J OY NO. BUOY NO
ELEVATION OF SBOTPOINTS
• • • •• • o •• • • • • • • • • • • • • • • • • • • • • • • • s • • • a. • • • els
• • 0.00 000 00400 • • • • • • • • • • 0000 0000 0 • 0000
.1.14ARKS
c,_
a4 .7/ e-4
SKETCFa.:S
rt

98

Seismic Run III (Keeper Reef)
FIGURE B9.
. LCC:
: :: -Ai
.e.frr.q ...
RU:
V,
. J.:). OF C; EOPR rir.
Si
SOIL CC::DIT10::.. ...,r0A/Am /74 x,z-
OM:DI:11C, -r" F-(4
L TIAL FM SE LIT:EL dB
SC-ial.l:G Of: PJtPii . . : •
FRO! . .m TO 7.4. .m SPACING= .....
FRO.. m TO SPACING
m0:. TO SPACING
1,1 --;;CTB OF RUN .
PROFITING
POINT En E.D POINT
BUOY NO. BUOY NO
. ELEVATION OF SHOTPOINTS . • * • •••• .••• •••• •••• •••• .•••
ows• •••• •••• •••• •••• •■ ••• *a" •••••• ••••• •••• ••■ ••
*000 4.41.00 41.0•0 • • • • • • •• • •• • • • • • • • •
Ell;ARES
SKETCIU_S
99

i • •
1 ;
•
, .
• •
3 1 r 2. .1„
; 1
;
•
; 3
t ; 1
;
t I . J. I . I •
$ •
t •
11`.1 1. ,
I
•-• $ • :
; 1 14
!
1 • '
'• ..--.--. :—."—
;
I •
3 !I
----
- i
o 0
0
0 =
1 1 . ;
t
. :
1 : I
: • ,_:- I • " 1 ! •
. 3
-: ! - :
14 - •
, • 1 _ ;
'411, :
% it!
1 :
. •
1 1 -1 ; • rt' • I 1 ;
.r,
. •
0. ; • •
. , • ,
. - •• 1 :. -, • , , r 1.--:, -, -3 3 : 1 ; - r I 1 :.1
... ...1 .;,..2.— ::4 • ; • . : ,...-. -
I • 11 — -
.-;----H..: • 1 :, -1 .!, --4:.1.- '''
......• ,•,.• .... , a .....,. i i 1 , , 1
.."
i t ! 1 -1 I. 1 ' ' •- : • ' - —
:-.-4 ; ; ':
!...!.L.L : ' 1
1. , ,-1 i • ri .. ,-,-., ..• , :,.., _ , ,, • , c
, ,..,- - - H.1 -. 7, •
. • , . ,..,-, • . i , , I
t
. '1' :i 1. , . .i ,_:-,.
: •
..- -,----' .. !—I r. ' i 11: •
: ; i 1. 1 ; I 1 1 1 • i i 1 ,
......._.. ,.; ..:, -.. ,, :• , „ ..,„.1 „,1..; , ,-.:., _.......,
, • : ; • . 1 f :i....j. i I :.I . -* C . : • • . • • -.4. .. -L. • 'ION, 1 , ■ , i . . • : ', i : , 1 :. i : I -• ' .1 4 1;
: i 3 •• . • ; • • ' i • I • .. tf- .1 '.i )•
, . . ... t • . . 1
— .; ,..— 1.. .--- ...!. , ........ : 1 -.1 : •.1 • • 1 ' . . : ! 3 13 i ?...... '
' . ' ; i . 1 -3 . C ! , .• • ' , : ; i 1 3,
„ . • 4 • .. ..: : ---- t
YT *--*--, ,7,-..-7 ■T '! ":. :,:74 , •.. : , 1! '" - . * . . .
; •: 7 ; .
• ' • , ! • ! • l'f * 0
"
1 ... i
100
... : f
t ; - . : •
; ; 1 ' : • :. ; , !, • 1„ : , 3 ;
! - ,.., 1 7---- f.'• ,- '.--1-L-
il -1.; $ I'
i ......-1.4—.4-..."-... 4--
1' III 1". !.I .C. i .-i:.; 11-j. ' ;7::;•..!:-. 1 i 1 j' I -3 ' '1- •', t-
i; ..:: : : ; ; 4 ; , 1, s• ! I
i ll , '• *. • - .:_—__..:_I•2.:;--..-7—i .: ', II
i i * I I '. '• -• • . ! i' l
; • •
• ; • ; • •
c . . • t •
' ; 4.. —1 - - • : ;
•
-
- a .1 • •
Tic --"•••••••••••
*
••• .W 4 } • 4 ,
I :1 ;
$ • ! ! .
1. - -
C

*BUOY O.
. 00.0 **OA • • 10 • • • • • •
• • • • • • ••• • • • • • • • • • •••• 0•0 • • ••• .• • •
•• • • • • • • • ••• ••• • • ••• • • •• 0000 000
BUOY NO.
ELEVATION OF SHOT.PODITS
*000 0000
•
Seismic Run IV (Keeper Reef)
PIGURE B10.
101
•
fl: ECO:
SEIS.'10CT-,APH T.E.:11*
. . 027 y_t2E .
LCTIO .
C . - "V
_ER
I • "2
CkTZBS
SCIL . .
COI :LIT
RU1, N3 -
C:
1 O. CF C.1.--OFBOYLS
Si 3•-•
CO.€.44
1'A9 ,C'41:,V
I_ a TIAL IL-70-EL d.B
SAT TVG 0:: PA_I-- 1.1R .. /.. : .4.....07.•
FRO 1.1 . . O. m TO .y0. .m SPACING-. ,, (0 m
FRoy. m TO m SPACING m
PRO:. m TO m SPACING m
1.1.,:GTH OF RUN , 4?
PROFILING
'Nina POINT El) POINT
3.ilLKAyas: 4 -7e- 4c.,j(I
SKETCHES

102

-4o04-4c 60p.e.ef4
.Z •
SOIL CG2:LI.7
OS *000 • • • • • • • • • • • • • • A. • • • • • • • • • • • • • • •
• • • • * • • • 0. 00 0000 *0 0.' 00 • • • • 41.•
... laY‘LRKS :
Seismic Run V (Keeper Reef)
FIGURE B11.
3a:GRfl TL. PGRA
. 1.:.
.// 27.-. .0.
C. • C rv":
SI
IATTS CONDI Ti . :
1,...1 T1 kl ;WISE LL-- 'LL
SCALING 0: PAPER . . / . : Z --
FRO.. . P . .Th TO ., a • m SPA CINC . 60 m
FRO... rn TO r3 SPACING m
FRO:. m TO m SPACING m
La;GTE 01' RUN f° 7
PROFILING
III' TILL POINT E.I) POI; a
-D3 OY NO. BUOY NO.
.I.LEVATI ON OF SBOTPOINTS . • • • •• . . • . • . • • • • • . . • . . • ..
sEETcHis
103

• . . _
U z
- • -
•
- •
■ + ^
#
4
r-
r_i
104

1 05
APPENDIX C

Observer :.Z/ Date:
...ef...192:7
Location: .
Field Record
HEAVT PETiETRO IIETER TEST M=.3, MIGICLCCMCWWW MMMMMMMM
S total number of blows (Reading of counter) - number of blows to penetrate 10 cm
0.1
0.2
0. 3
0.4
0.5
0.6
0.7
0.8
0.9
1 .0
Penetration Test No. 4 FIGURE Cl.
MO I r I • , •
n. O-1:-
in 1-2
in in 2-3 - 3-4
7 7
4-5 in in
5-6 un 6-7 7-8
in
, z: ,-.
i
mu
tir 111.24—
8-9 n in
9-10
'., • e
- _::
'71
Ili
10-1111-12 1 '
,-.; .
r
2 .0
al - =
ii ,
-7 Ill
1111b- ,
.e.1
,, _ 11
7 mem 4
20 ., , • -3
iiii 1.11
Owl i., AI '111 . , _ , II 1 9, NI Ing4421111' fy, '52
ig 0111111 7 1111 I 4,, i a
..„, IBIE 1111110111.11111 j
c-
., ,, „. II nri illehilhaill I ,.. -
Brum ' ..., _ , 11 _tr. _ „ „zoo.% 0 lir?
! . r . 2.15 L..." „J • ,... . . 7_,, „.
__._ .., .. .„, r L..„..i ,.,. > 7 1:_ 1...„J 1...._. ,
13
Remarks :
106
0.1
0.2
0.3
0.4
0.5
0.6
0.7
0.8
0.9
1 .0

Penetration Test No. 5
FIGURE C2.
NO
Field Record
HEAVY PEFETROMETER TEST WWW. WWWCW,C.WC=1111.K.V.WWWW..CWMIC OCRWMCWRICLIPM....CM.WW
total number of blows (Reading of counter) wnumber of blows to penetrate 10 cm
ID : 0-1:
in 1-2
v n ID
2-3 3-4
' ,/77
in
4-5
in
5-6
.277,- - c
In
6-7
.
in
7-8
,
In
,
8-9
in 9-10
I
.;
SD 10_1111-12
El
1111110. 1111111111311
i
1
;
'
/77 '1"/%).--- - --;
4
%11111111 II III 111111M MIMI-
° 6.. 1111 III III II IIII 1151311111111111111
e., Z
'. ` 7 :
• ,
.5 111111 111 IIIIIIIII II
3 la 11111211111111111111111111111 111 II gm
.:1"
., ,.. r
,,, lal
Bi- 1/21111111/1 1111111111
. o
, ii 7 , 2
... a in 111- ::-
i..,,,,,i , _ illiiilig-i JIM .,_ hip ,,- imillamiLlrf, 0 1111-3111P-Willi Ili s
0.1
0 . 2
0.3
0.4
0.5
0.6
0.7
0.8
0.9
1.0
Remarks :
107
Obaerver: f Date:
47//
Location: ..
.
0.1
0.2
0.3
0.4
0 . 5
0.6
0.7
0.8
0.9
1.0

/2
77 Field record
0.1
0.2
0. 3
0. 14
0.5
0.6
0.7
0.8
0.9
1 .0
Penetration Test No. 6
FIGURE 03.
zra
e /L-r,
HEAVI PENETROMETER TEST WWWWWCOGICCWWWWWL.WWWWC=WMFMW.C.CWMCMGCCI.MWIUMWWSKM
S. total number of blows (RendinF of counter) T . number of blows to penetrate 10 cm
/0 S
In 0-1:
1111111
in 1-2
-,-773 -
in in 2-3 3-4
i
' '
in 4-5
in 5-6
'',,,,
in 6-7
7,
MME
Ilia
J 7-8
,-;7,
in
,.--7- a
: 8-9 in in
9-10 10-1111-12 in n
*27,;I— ''''''
..- -/C, c. if 11111111111
1/
al / ° MI .-, Nil I i illilliela
' * i -s V f',. ill I 2 (
I- III ''' fq 1111112
III IIIII Ill II OMNI. III
Y MI II
II
1 11111111111111110111 to 111
.s-
,c_ AIM iiiii91111111101%1.11111 w II ill
a ll ri Ell 1..5
7/111 0 pi Ill 2.,. S
Remarks :
108
0.1
0.2
0.3
0.4
0.5
0.6
0.7
0.8
0.9
1.0
Observer- Date:
•
.192/
Location: .

Penetration Test No. 7
FIGURE C4.
o /: /: os
Field Record
HEAVY PENETROMETER TEST MMICCWICIOCC,CLC.M.MCMOCCWWW.
C.M.CLWMtWW.C11..M.FM=.111t
. total number of blows (Reading of counter) oS
fi ------ we to penetrate 10 cm
Observer:. Date:
1.-c) A‘ '1 9
Location: .
1 ," .1. I 1 1 1 1 I " I I •■• E I
m. 0 1:
7T-*
m m 1-2 2--3
n 3-4
n 4-5
m 5-6
in 6-7
m 7-8
in 8-9
in 9-10
/11
10-1 m in
11-12
1777;" /i- ---- 7-,, --27- --- 7 77/.
n II
111110511111
, fir;
NEI it III' _ ea ilimial itr--. , ' / II II II En
Mal giro In 11% II ' 0 .4'0
OM
i - • t 0 1 a arall
Doi IA II ime ions 0 lin
II MUM
MI5 III 111
*AV 1111 11111 Mt 111 IIII Ulm IMO r
Remarks
109
0.1
0.2
0 . 3
0.4
0.5
0.6
0.7
0.8
0.9
1.0

•
Field Record
IlEAVT PEI;ETROriETEREST
W.Wilf.,WIC“KICW.11CMICW,MICWWKWWWWWKWICWW.F.C1CMGFIC.MICWIll
= total number of blows (Reading of counter) - number of blows to penetrate 10 cm
0.1
0.2
0.3
0. 4
0.5
0.6
0.?
0.8
0. 9 L__J 1.22J
1.0
Remarks :
•
ormto. •■• • °
Penetration Test No. 8
FIGURE 05.
110

Penetration Test No. 9
FIGURE C6.
/4-
S
e Field Record
().= /- 7z#. As- „ eni r” •
REAVT FENETRO TIETER TEST
. total number of blows (Reading of counter) 4. T number of blows to penetrate 10 cm in-
0-1:
:- -,-;7,4 '-:?-7. -
in 1-2
in 2-3 3-4
--72-: • ; 7:- ,:',
in
---::
in 4-5
-;;:',7,-, .?'
-7 in
5-6
'7;7:7 .--f , J in
' - „..,... ,
6-7
_
in 7-8
in in 8-9 9-10 10-T
m 11-12
in
r --el .; ? II / ': 7
. T ,
7/ II 12 A 11
gai Elia I II
110 III:
III , 1 III , , Illa , 1.i: 011 lit _ , ' ' r -./ s';'"
, I 0 i 1 )14 as Ill 4 iii" /- ma a, Irina 3 11 13 III IN 111 .9 111 . , fil II
X • ..;,-.= '
' r 1 2 3 I II ...ro 111: -
- / 2 /t- • , ./
Remarks :
in
12.--1,
in .
13-14
in in
14-1 ''' 15-16
in in in
16-17 7-18 18 -19 19-20
in
?0-21 21-22
in in
22-2123 /
?
G
)
7
7
,,(
7 / .
.e-
-
7 m
1
7
6
.
1
m7 t
1;
z
2
o
f-
?
/
3
f
r
2K
i
(
n
' 111
S'- -/
‘ 3 tr 3-2 B II 11
/?, /
-1 c,-.57 , - c; _ _ _ _ 4 --La
fo III 2 r /0 37 in Fil
Ill 111 1 111 ''' - 2 .4
12
3
, . o s e
/e.' _
a 7' -...
e i e ' ri 111 111 I Z 2..
/
.
z 2 Y l --....,
/
5 2 2.;$
3
1 C
21,
0. 1
0.2
0.3
0.4
0-5
0.6
0.7
0.8
0.9
1.0
111
Observer: Date:
/. . 97. 7.
Location: .
0.1
0.2
0.3
0.4
0.5
0.6
0.7
0.8
0.9
1.0

1\
LE F E OF .
. z . OF VA 'IL •
1Y.2E CF V...E.Tia- • T1.1 OF LO TIDE: .
TLI 01 LIGE TIDE. 46
Penetration Test No. 10
FIGURE 07.
112
RL
as.t.1T). 1'T T1T
. . • A- fre'f,e
AVEaLGL DEPTH OF DATID1* .17 z
LEP ID OF WATES .1.,'ELO\.: DAM* •
: /di 1.41 .1-4A'Aj e:11-•
. .. •?..,"?. • 044';
...
r(cf.."-,</-x-rAfee//-v -6Pc
SI=C RE- S:
Aje, tf.r.<''r,9■dcir
0 —1 22.41 7"/ c•- •

Fi c3d Record
AJ"(7f HEAVY PEFETROEETER TEST
total number of blows (Peadin r. of counter)
number of blows to penetrate 10 cn
113
Observer: Date:
.4./4
Location: ..
.aff

Penetration Test No. 11
FIGURE C8.
1 VY 3 . E . LT
t• :
A-4" er-e-ecr e Ac/ d 1'1/ . . . egr.(1.4PP.
Tv7- ry, • • - • -;) •
l'a/ "•-• 1)1"-si OF V/. t e
TLI OF 1,0"; TIDE:
Till Or OE TIDE: ...
DLPT.:i OF ',A TL,: . A
1.;L:Fi'L OF WA rail, •
- th z e. VF1...L DI GE D OF pl Tux • zr D
1..=11 OF WA TEE BELOW DA TIT" - -
5,--ra4aA" /./r
tcc,.qce- •42:(/ (/tce-r .4,4's-r-
"FerAwp.-0,,f. • K<`.
S :
.z z •
rf #44( 7 O' f-
/ . /
1 1 4

Field Record
Observer: if-S. Date:
Jr./4-1927
Locati on: .
1 1 5
EMIT PEr ETROIIETER TEST Orw.sWicm.c.irim....icrwW , wcww.cccoc c wor icc ic lic = 1. “C. w..c lix
. total number of blows (ReadinE, of counter)
xaurber of blows to penetrate 10 cm
IL. 0-1;
IL IL 1-2 J 2 - 3 3-4
7
zinn
7,7/-%
4-5 5-6 m
6-7
r
m 7-8
I ,. I r
/ c
/e
' -72
8-9 r r
9-10
, 4"-f; 0
In
10_11i_12
c t
m
::/-71," , ':i 7 2 CI t
- •
11111 ' III .
14 pi 15.1
I J r r 7 1 / DI
7 7Z 4' - rg _. s-
.11
112 r ri mi .. 12 a 1111111111211/ 77
c ..er;. ,
° s I z ‘
z is IS "IN° ,..
/ l fl CI II .116111 loggsairoraus 0 0 i III Cr , %AMIN Illilli
IIIIIIIIII1 gig 1/4 Ii: III 51111111 - Illipii_ . Ili III • „,
aallIWRIlloti, 11-11111111-11111
1 /0 I 7..r- - f ('-' s-s-
.' i ( 1( 7 t ,
i1/211 , 7 -
0.1
0.2
0.3
0.4
0 . 5
0.6
9. 7 0.8

Penetration Test No. 12
FIGURE C9.
•
116
r
1 . 2 T. );O.
• rr • WA. TCP.
DE.? OF :
TLI OF LOW TT TT: DEPT: .• OF V.4 1T.:
(2- 23
Till O. UGH TILL: .. .. 1.1-...?1z. OF la :
ISLRA GE DEPTH OF DATUM:
=Pill OF lo.'ATFL: BELO:: DATUM: -e-
SKETCFCS :

Field Record
EELVI FEVETROnETER TEST
Observer: Date:
Location: ..
3/r
total nu_mber of blows (ReadinE of counter)
nar:ber b3o1...- s to, penetrate 10 cm /
6-?
0.14
0.5
0.6
0.,?
0.8
0.. 9
1.0
0.1
0.2
0.3
0.4
0.5
0.6
0.?
1 .o
Remarks :
.1
1-2 2-3
0.
0.2
0 . 3
0.8
0
117

Penetration Test No. 13
•
fl Li S
O. T
C :
e: - 1.1,7 • r" • -•• •
; .o. : ... .
- "'rm.' r- c: ; •
171.1:11.111.1:0 LE.PIE OF VA' T' • 2 7
TL E OF LOW TIM::•... 1)=111 OP VIL 'Ea' •
Tli‘i O JL OF WA'rr-11: . ..
AVERAGE DETi OF MM.
LEPTII CF WI.TE BELOV J1t,TC•
2ay_s:
2.27 s`
z Z •
...................... ..
SKETC
118

F eld Record
FEL VT PET ETR 011ETER TEST W .MCW=C.CmICGCMCW.C..WWWCWICILIGMCC WW.KftWC2C.CCICMCWICWW
S = total number of blows (ReadinE of counter) r nuzber of blows to enetrate
Observer: M.-e! Date:
v
M 0-1
IL 1-2
ID 2-3
'
-
0 /
n 3-4
Z.
IL 4-5
', 27,, ----L4 il / , i
2 -' )
I
71; 5-6
IL 6-7
= 7-8 7 - ,7-
8-9 IL ID
9-10
/ r
n 10-11
M 11-12
./- I)
,; ',: /P
-- 0
Y ,5-2,7-- /•-/; -
4 ,7 mi _ . 1 o Ill —
12 •
_
? 0
' ,/,'
i .
go,
MI ....
- c 1 C ° 0 /0
III 111% i III 0 „
f
2, III 0
,0 Ism o ° ,,,, a ' a
.7 P sEat Se . b
ell - Oils .,,i III 0 0
......... in ,
_, _e: _ 77 . a • Om lol .c . - ...—.• ......' • L'.....i 11.._ j
o. 3
0.1
0.2
0.4
0.5
0.6
0.7
0.8
0.9
1.0
Remarks
119
.\
0.1
0.2
0.3
0.4
0.5
0.6
0.7
0.8
0.9
1.0

:,0. ..... 1
'..EAVY FE 0..11:Ti.T.'„ TEST
OF VATal • •11
4 *
.5.
1,0 c - ; •
1.1.71.
':11::LSHL.3 TLI: S: CO
0 MD' T.: OF "VA 'TT; • TE M OF LOW TIDE: .
Penetration Test No. 14
FIGURE 011.
TIIM OY HIGH TIDE: ir • ran OF WATER •
120
z—o /-""zr- /0k1 p Pr", Y
--C
1'
7C. 73 oc: -c
AVERAGE DEF'a OF DATUM.'
DEPTH OF WATER BELOW mATun.
or' 4-- el'orAf ,fr".--f:v.r7 •C7 /. •"/•Ir
cr c
,

Field Record
BELYT PEPETROrETER TEST WWX=. 7,L.C,WIECC.1.1.C.W.WCWCW W . 1"-CWIM.A.M.1,.X.I.LCIOCCICW
S total number of blows (Reading of counter) -rnber of blows to penetrate 10 cm
0-1 .: 1-2
7,,,77,, 2-3 5-4
_
4-5
; 5-6 6-7
,,c.
7-8
7, d
8-9 9-10 101'. 11-12 1/7-----"'
- - 7 ',-7
.e 0 , ; 7/ /4 ;,
is :4.)
dt-
3 •.(
-
i - 111, „e• 0 Il 111 ri if a 111
114 111 fa
Vail
lehi imp ° iii 4i'I
MU- Or -
a
ON lir'
111 'CT gr 1 Mil 1 11 ad
7
44 IIII H 1- DikT7 um .,,,._
7 -2 a o /
i .
!I DI! ° illisimmen 0 2,e „ e „ 110110% in
111. 4,0 . IL y a emu g III gi _. Y
u 12-'P
n m in 13_14114- -1 :15-16
- in 16-17
7;
11 7 I
.n 17-18
in 18-1919-20
7111i.
in -n 20-21
in 21-22 22-23
n - in 23-2
-11 7 '/ Agr II 2 -
2
IMO imentri 7 / - A
III ill Ali a
S nal III 7 4/ ow Q III 3? III 1111
, SI
III nom iii
IIF-- _CT
.s• re ,
i 3 /7 tc WA imi Iligii /0 III Ea I (
III :' i
- ; ne .,e
,,,,, 2
As
II:
1.111 III iz
11 IIIII , - - 0 ill 11111 mon mg mu
I MI
=LI gi a . d i . 0 /7 /1 ' tillIM Ill II ,,, /
Remarks :
0.1
0.2
0.3
0.4
0.5
0.6
0.7
0.8
0.9
1.0
121
Q. 1
0.2
0.3
0.4
0. 5
. 0.6
0.7
- 0.8
0. 9
1.0

TEST
tP"--
, AVERAGE DEPai OF BATON: --er
I:EP TR OF WATER =LOW DA 7117.1 :
ARYLS:
,tf
.. •
.)*4
L-.)
0
r-
0
0
Penetration Test No. 15 FIGURE C12. .
•
}LL 3
KEAVI 7- T
: . eiciA6f
eff. //ft',
122
LLTL
Tr I: J
sS r 171lE.ILI.i.0 Ma:: /DI'
A
TEl OF LO : TT TY;;:' 40--
TLI 0: HIGH TILL:
Cri :
LLPIH OF %.171.11:
MD>TI; OF WA'117.. : - .
LEPTE: OF 1:AT.a . . . . ......

12 3
01)aerver Date:
,9e, Flead Record
P.EAVI PEFETROrETEE TEST Location: ..
•
.446 c . = total number of blowc (Reading of counter) F . number of blows to penetrate 10 cm - .
IL .
0-1:
7';i f - -
L
1-2
3,;477:4 -=-
s
TB 2-3
,?`/,(;" /
'---
IL 3-4
;7 /- - - '''
4-5 IL n
5-6
'..777.,/
‘
n 6-7
'''',
TB 7-8
' ' - / o -
2,7 4 ‘" I r _.-
8-9 n n
,-10
/ / a
n 10-1- .
I r. 11-12
7.7-,1—
,
.37.7'=— ..s
'-,- F 4. ic II 1; . III
bi In ' 7 111-1117
, o v iz , s r._
r : 12 /0 i III /7 ' 7 Mil
111111 4E co ci - ,?.., in
11111 I , , r - * - ,...z I I
111.111 IIIII
.-.? - (TO
Ills 0_2111111n Y 7
- 7 W
f
II 12 M II ' . 7-.
, r - 1.- S
1111;111,11111r 1 i FA J
iimm
U Ill
II AO , /O in
II% an nal III I 111 gielhellingigl1/211
II f - 27
III 1 fil In 0 !PM IM1/4I
II -
i T 111 . r - .-, r7 -2 ' -frl'
L-.I IZ
1-......) j1:..--i i , lU
Remarks
N
0.1
0.2
0•3
0.4
0.5
0.6
0.7
0.8
0.9
1.0

AITMAGE DEPD3 OF BATUM • 0 . • •
tEP l'FI OF WATER IELOW DATUZ::
JIMA= • KILL 7,4
o - O kfl /-
SEITCIES
• 6—
Penetration Test No. 16 FIGURE C13.
flLL 7: CJI-LL:::
PL T'21--: T3 T S-
'.17LIST :.O. .....
/ Ad
:
: .4-11(447:
LL
5LLTL.Tr
UHL: Tli.1 -
TLI OF LOW TIDE: .
LT-PIE OF : • tS-
DIY71] OF 'WA `IL • 19)1
Tin 0: GB TIE" • '71 DEPTE OF WATER:
124

S = total number of blows (Reading of counter) 4 - number of blows to penetrate 10 cm
0-1 : • L
1-2 Z
2-3 T1,
3-4
- 7 ft 71/- 14 -5
IL r.: 5-6 /2-7:
n 6-7 m 7-8 8-9 1111111r;
mm 9-10
m 0-11 r. 1 1 -12 V 7: ' 7/4 ' /'"/ '''' - 71
[i,fraa l 1, "/ o
/
6
i0 ji
n1:
i11
41
,11
01.
41
i
o
-IIII . MIMI
ji 1 1
7 71 % 11111111. „ a 11 1111 i 2° 7 rlljnPIIIRIIIIIII II 111 II 4Y 77 III 7 f-
I r#11101111121111111111
11 .1210111.1% 111 IIII i° Ilan 1111111 FI
Remarks :
4,4 dr.-trete-0-c
=
0. 1
0.2
0. 3
0.4
0.5
0.6
0.7. 0.8
0.9
1.0
Observer:.I.Kdc Date:
lc'?"
Location: .
Field Record
EL- AVT PEliETROMETER TEST WW W ICK =m ic-c lr .C. C =Ctorm WCW .... C=1.. ....M.WWKW ILLIC CW irC acc MIC
125

REFERENCES
CAMERON, P.A., 1975. Light Construction on the Great Barrier Reef.
Thesis submitted for the degree of Bachelor of Engineering.
DOBRIN, M.B.,1976. Introduction to Geophysical Prospecting.
McGraw-Hill, Inc., U.S.A., 1976.
FOSTER, D.F., 1974. Geomechanical Properties of Coral Rock. Thesis
submitted for the degree of Bachelor of Engineering.
HARVEY, N., 1977. Catena, Vol. 4, 333-339.
MOSS, K.H., 1976. Geotechnical Studies of Coral Reefs Material.
Thesis submitted for the degree of Bachelor of Engineering.
PECK, R.B., HANSON, W.E. and THORNBURN, T.H. Foundation Engineering,
John Wiley & Sons, Inc., New York, 1974.
SMITH, P.T., 1972. Geomechanical Properties of Coral Rock. Thesis
submitted for the degree of Bachelor of Engineering.
Operator's Manual. Huntec FS-3 Portable Facsimile Seismograph,
Toronto.
1 2 6

Appendix 3
BULGARELLI, G.:
"A Review of the Design and Construction Principles of
Structures on Coral Reefs".

ABSTRACT
With the increasing interest being shown in utilizing the vast
resources of the Great Barrier Reef, it is inevitable that major
engineering structures, on the reef itself, will be required. The
majority of significant structures on the reef, at present, are
lighthouses and a few automatic weather stations. Many of these
structures are founded on bare coral sites that are either fully,
or partly, submerged.
Marine platform-type structures are used extensively by the
petroleum industry on non-coral reef situations, but some of the
basic design and construction principles employed for these
structures can be applied to any marine environment.
This project involves a review of the design and construction
principles of existing structures on coral reefs, and, a
consideration of principles used in other marine situations that
could be applied. The problems associated with both the design
and construction are also discussed extensively. It is hoped that
the information acquired from this review will assist future
development on the Great Barrier Reef.

(L)
j '7 NTS
The author wishes to thank Dr. H. Bock, Lecturer in Civil
Engineering, for his help and guidance throughout the project.
Thanks are also due to Dr. R. Kenchington of the Great Barrier acef
Marine Park Authority for the keen nterest shown by him in getting
the project underway.
Mrs. J. Petersen is also thanked for all the typing work,
•

TABLE OF CONTENTS
FT? 0)TIGT[ON
CHAPTER 2
CLA, ' IPTION
6
2.1
Introduction
6
2.2
Dorwtn's Classification
6 •
2.3
Classification
9
2.4
Lithificatiori
12
CHAPTER 3
TYPES OF STRUC TURES ON CORAL EEFS 4
3.1 Lighthouses
14
3.2 Weather Stations 18
3.3 Radar Beacons
18
3.4 General Marine Platforms
20
3.5 Tourist Resorts
23
CHAPYER 4
GENERAL PROBLEMS ASSOCIATED WITH DESIGN
AND CONSTRUCTION OF ENGINEERING
STRUCTURES CORAL REEFS
. 4.1 Remoteness of Site
25
4.2 Condition of Actual Site
4.3 Dependability on the Wea 97
TER 5
FOUNDATION DESIGN
28
5.1 Site Investigation 28
5.1.1 Introduction
5.1.2 Core Drilling Operations
2 )
5.1.3 Penetrometer
35
5.1.4 Seismic Testing 39
5.2 Suitable Foundations for Structures on
Coral Reefs
40
5.2.1 Introduc on
40
5.2.2 Piles
40
5.2.3 Spread Foo
48
CHAPTER
DESIGN OF THE SUPERSTRUCTURE
50
6.1 introduction 5 0
6.2 Materials 50

TABLE OF CONTENTS (CONTINUD)
o .
6.3 Structural Loads
6.3.1 Introduction 58
6.3.2 Wind Loads
59
Wave Lo ;x
64
6.3.4 Impact Loads
67
,ITAPTER 7 COSTRUCTION ON A CORAL REEF 70
7.1 Introduction
70
7.2 Types of Working Platforms
71
7.3 Use of Concrete
75
7.4 Erection of Superstructure
77
CHAPTER 8
CONCLUSIONS
81
REFERENCES
84
APPENDIX A
LITERATURE REVIEW
86
APPENDIX B
RESEARCH ACTIVITIES
91

Figure
1.1
2.1
T '
The Great Barrier Reef
Darwin's Subsidence Theory
(iv)
5
8
2.2 Maxwell's Reef Classification 10
3.1 Location of Lighthouses on the Great
Barrier Reef 15
3.2 Lighthouse in Type 'A' Environment
(Waterwitch Reef) 16
3.3 Lighthouse in Type 'C' Environment
(Hanah Island) 17
Elevations of Typical Automatic Weather
Station 19
3.5 Radar Beacon on Keeper Reef 21
3.6 United States Coastguard Tower 21
3.7 Caisson-type Foundation 23
3.7 Basic Framed Structure 23
5,1 Location Map 30
5.2 Core Drilling Operation on Reef
5,3 Core Obtained from Michaelmas Cay 33
5.4 Core Obtained from Heron Island 34
5.5 Penetrometer Test on Keeper R 37
5.6 Penetrometer Test on Keeper Reef 38
5.7 Foundation Details of Frederick Reef Tower 45
5.8 (a) Localised Failure in Reef Mass 46
5.8 (b) Pile Preored to Prevent Failure 46
6.1 Maintenance on Lighthouse Towers 55
6.2 Expenditure on Lighthouse Towers 57
6.3 Frederick Reef Tower 63
6.4 Prestressed Cantilever Pile Fenders 69

LIST OF FIGULC:17, (CONTT 7 "
Figure
7.1
Typical. Template-type Structure
7.2
installation of Template Structure 73
7.3 Installation of Self-elevating Frge 74
7.4 Installation of Submersible-type Platform 74
(v )

CHAPTER 1
INTRODUCTION
The Great Barrier Reef been described as of
beautiful natural wonders of the world and, due to its relat1.v
inaccessibility, it has remained in its natural state, virtually
untouched by man. It is only in the last fifteen to twenty years
that a real interest has been s b.iwn in utilizing tHe vast and varied
resources of this natural wonderland.
The extent of the reef is in itself staggering: running foi:
2000 kilometres parallel to the Queensland coast from a latitude of
degrees south in the Torres Strait to Lady Elliot Island situated
in the parallel of 24 degrees south. The average distance of rle
barrier's outer edge from the mainland does not exceed 56 kilometres
and at one or two isolated points, the distance is as little as 19
kilometres. Figure 1.1 shows the reef and its relarionship to the
Queensland coast.
The activities for which the reef's resources could most
effectively be utilized are recreation and as a major food source,
both of .which are almost unlimited. Food production would not only
involve the catching and processing of fish and marine O il
but
also planned cultivation and harvesting. With the exception of Heron
Island, tourist activities on the reef prop present restricted
to one-day or week-end trips on pleasure boats. A much more attractive
proposition to the public would be permanent hoteitype structures on
the reef itself. Permanent or semi psnnanent structures would also be
required for any cultivating activities or major scientific projects.

he activities mentioned above would eJuly be restricted to
two types of coral reef environments. These are:
(A) Cays and islands of coral reef cr. i ,ons, These are usually
and very flat, and construction in is '• • ", easier by
fact that you have a firm terrestrial base. A structure in such
an environment would be concerned more with the problems of
construction in soft sand than on bare coral.
(B) Bare coral reefs. They have no terrestrial formation upon them
whatsoever and are either completely submerged all of the time,
or partly exposed at low tide. Although this type of environment
is the most difficult for construction purposes, it is usually
the most suitable for the activities concerned.
In the past, construction on these reef environments has been
mainly restricted to lighthouses, and a few automatic weather stations.
The types of structures found on the Great Barrier Reef at present, as
well as those that may be used in the future, are discussed in
Chapter 3.
If the resources of the reef are to be utilized, it will involve
the construction of major engineering structures that will have to be
commercially viable. That is, the structure will have tobe as
economic to build as possible, but at the same time serving its
required purpose with maximum efficiency. Previous structures such
as lighthouses and weather stations were considered essential, which
meant that the economic aspect was not the primary consideration.
With the increasing interest being shown in the Great Barrier
Reef, it is essential that some sort of general design and
construction guidelines be set up in order to assist and control

development on the reef. Whei -, Sing up these guideli
thing should remain pcsunt: delicate ecoLogical -
this - rewr he enviscs.nnL. SUftJ.d not be adversely affess
proposed development.
It is the aim of this thesis to revi , design el
construction principles employed for previous structures, to discuss
the problems involved, and to suggest the best prnr7edures with the
view to setting up general guidelines. In order
ly
illustrate the special design principles em yed for structures on
coral reefs, the review of these principles will be divided into two
sections: the foundations (Chapter 5) and the superstructure
(Chapter 6). The special problems associated with the design will
also be discussed in these chapters, while Chapter 3 will discuss
general problems stemming from the fact that we are considering
coral reef situation. Chapter 7 will discuss the construction
techniques and principles that have been used on coral reefs, as
as considering those that could be appli gd if necessary.
When considerin esign and construction on a coral reef, it is
helpful to have an insight into the formation and type of reef that
is present, and because of this a brief discussion on reef classifi-
cation and description have been included (Chapter 2). The final
chapter (Chapter 8) will discuss conclusions deduced h _out, as
well as proposing suitable recommendations that could be e ployed
in future construction on coral reefs.
Originally it was hoped to collect information concerning
structures on coral reefs from all parts of the world, but due to the
apparent limited experience in this field that exists overseas, and
also the difficulty associated with contact TniL ss: -tions,

the c ity of the discussion will refer to structures on the
Great Barrier Appendix B gives a summary of the contc
both in Australia and overseas, as well as the research activities
undertaken.
Also, a detailed literature review was und, -J7tn in order to
ascertain what publications exist, concerning structure on coral
reefs. Appendix A details the work undertaken and the results
obtained, and also gives a list of articles that may be of interest
when planning a structure in a coral reef environment.
It is hoped that the information that has been acquired from
the abovementioned sources and collated in the following disci discssion
will assist in the future design and construction of engineering
structures on coral reefs, particularly the Great Barrier Reef.

FIGURE 1.1
The Great B.,:rrier ee
(Af ter 4)

6.
C 'PTER 2
REEF CLASSIFICATION. DESC..2—
2.1 iptrnduction
Coral reefs develop as a result of the growth of tiny lime
secreting plants and animals. The gnts and animals requirea
certain amount of nutrient and oxygen, as well as suitable (' as
of temperature and light penetration in order to survive. The
proximity of the ocean floor to the surface of the water, along with
the regional hydrology, are the main factors determining the degree
of temperature and light penetration. The other requirements, such
as nutrient, degree of aeration and aiount of carbonate in thewater,
are supplied by the cold ocean currents sweeping up over the
continental slopes from the deep ocean basins.
All of the above requirements are essential for reef growth ,
but varying degrees of them give rise to differing reef formations.
When considering engineering structures on reefs, the type of reef
formation present is important since it can assist in determining the
condition of the coral mass, the condition of the lagoon floor, the
presence and extent of individual coral masses within the overall
structure, and other related factors that have to be considered in
the design and construction.
2.2 Darwin s Classification
Charles Darwin first proposed a reef classification theory in
1898, in which he divided reefs into three groups: fringi.sg reefs,
barrier reefs, and atolls. His classification was based on a

subsidence theory that deiljo the three types of reefs as ..,
7.
of an evolution process as shown in Fi.urn 2.1.
Fringing reefs are essentially C C :tens ions of insular
shores (i.e. island shores). They form, when the various coral
organisms and aiaae necessary for reef growth be ,- along
rocky coasts. Fringing reefs are eraily fair'
flat plat-
forms which can be awash or even exposed at low tides. The reef
formations on places like Lizard Island and. Palm Island are examples
of fringing reefs.
Barrier reefs form due to further subsidence the island in
the fringing reef case. The coral platform becomes rated from
the island shores by a relatively shallow body of water called a
lagoon. The watr in these lagoons is generally very calm since most
of the energy of approaching ocean waves is dissipated on the reef.
When the barrier reef is an appreciable distance from the shore it
may fail to act as a natural breakwater, since the distance of
exposed water within the lagoon is sufficient to form windgenerated
waves of significant size. The Great Bar
' is an obvious
example of such a situation. In a situation like this, it
possible for fringing reefs to develop along the coastline behind
the barrier reef. There is virtually no limit to the size of a
barrier reef.
Attols are annular-shaped reef islands that may Or nay not
completely enclose a lagoon. The majority of the atoll is either
submerged or partly awash at low tide, although there are usually
small islands or islets that project ) ,Je sea level. 2 usually
form less than one per cent of the total atoll area.

Barrier Reef.
Atoll.'
FICURE 2.1
Darwin s Subsidence Theory

The atoll is usually breached by one or more deep channels that are
found in the or Hel ered side of the atoll. The waters
enclosed in the lagoon are always placid and t. channels provi de
natural entrances to these quiet anchorages. Thete is a general
relationship within the lagoon between water depth and atoll
circumference. Many Pacific atolls have an aveen dir ceter of 32
kilometres and maximum lagoon depths of aTTrunin1ately 90 metres.
2.3 Maxwell's C
Maxwell proposed a scheme in 1968 that divided reefs into two
broad categories: Oceanic and Shelf Reefs. Shelf reefs may be
further subdivided into platform reefs or wall reefs as shown in .
Figure 2.2.
An oceanic reef has an evolution process that is the same as the
Darwin theory. (See Figure 2.1). That is, an oceanic reef forms in
a ring around an island in the middle of the ocean and evolves into a
barrier reef which eventually becomes an atoll.
Continental or shelf reefs are usually nd in the shallow water
of the continental shelf off the coast of continents. These reefs
have the same coral types as oceanic reefs, hot the coral structures
that are forined vary widely. Oceanic reefs are formed with a minimum
of land area available for coral growth, but with an unrestricted
food supply, carried by currents from the surrounding ocean depths.
On the other hand, shelf reefs are formed with an unlimited surface
area on which to build, but with a limited food supply, since the food
supplying currents are restficter .
T the contine ntal

1 0.
Maxwell's Reef C1::,.,:;sificati:on FIGURE 2.2
CLOSED Ras.C; REEF.
OCEANIC REEFS-
, ErT,I.- Eiic co(ony
roa'i 5) in 74-17,70
0/0-;: tr0,1
nCe
orlico g- owIA expansion of lagoon
Ick'a Li
lox)nci reef growth
radio/ centre, ecoy
o Platform lq ,of
Cuspote R
CUS„.0.0:2 in VC ,
R.Tig Reef
13 PlugPlug
ong loTinclion
N'N.
7 P7- 3,12g.
rn7 I 7
b
14_Resorbed Re, f r
Plotforrn Reef
SHELF RE E FS
1 12 11 Closed flog Reef

11
The Great Barrier Reef as a whole can be classifind cs a
shelf reef, but the numerous individual reefs constituting its
overallstructure can be subdivided according to their formation.
The individual formations are controlled by growth restricting
factors that are dependant on the environunt.
A platform reef forms when the growth controlling factors are
equal in all directions thus giving rise an approximately circular
platform. A lagoon eventually develops since the inner reef becomes
more and more sheltered from the waves and currents, which means that
less nutrients are available for growth, thus causing the outer reef
parts to grow faster than the inner. Well developed lagoons may
contain small reefs that are independant of the original reef
structure. The size and development of the lagoon can be used to
estimate the age of the reef.
A wall reef forms when a hydrologic or topographic feature
caases the reef to develop in one direction only. This type of reef
can he changed further by differing hydrological factors into a
cusped shape or a pronged reef as shown figure 2.2. A proi
reef forms in areas of high tidal influence where strong currents are
generated between reefs thus ulating outward growth due to the
ready supply of nutrient and well aerated water. Both cuspate and
prong reefs develop into a closed ring structure with a lagoon in
the centre.
Distinguishing between a platform reef and a wall reef is very
easy when both types are at an early stage of growth and the wall
reef has not yet formed a well developed closed ring. Then the reefs
are mature, the majcr discernible differences are the depth of the
lagoon and the development of a protective layer called an algae rim.

12,
An algae rim is a protective rowth ot
the seaward or open side of the reef. The inner - nal side of a
platform reef has no need of protection so therefore no algae rim
forms, while the inner side of a closed ring reef is expa, to the
.open sea for a short time which causes an underdeveloped algae rim to
form. Also, the lagoons of platform reefs are significantly shallower
than those of closed ring reefs,
A mature reef will eventually develop into a sand cay and then a
coral island unless unfavourable topographic or hydrologic changes
take place that could cause the reef to degenerate. This degeneration
is called the resorbtion stage and is characterized by scattered reef
projections left by the coherent shape of the reef as it disappears.
2.4 Lithification
Lithification describes the process which changes the uncon
solidated mass of coral, algae, and animal deritus into a coherent
rock mass. There are two types of rock found in the reef mass:
beach rock and reef rock. Reef rock forms the greater proportion of
the mass while beach rock forms a shallow layer overlying it. The
layer of beach rock is generally not well developed and usually only
occurs around islands where conditions for its development are
favourable. So most of the reef mass is composed of reef
covered with a thin layer of sand or living coral.
Lithification occurs by several. process- that are not directly
related to each other or influenced by the factors.
Recrystallization is the most effective of the ,.e processes, while
compaction plays a lesser role and ceTitation b cipftaLion p]
a subordinate role to both of the above.

1 3.
Recrystallization is by far the most dominant process in the
formation of shallow reef rock,since compaction is not effective
due to the shallow depths of overburden involved. Basically, the
process involves the recrystallization of al-7;3 onite, an unstable
polymorph of calcite, into calcite, which in so doinc, gives a more
coherent matrix structure. Leaching of the unstable aragonite
inhibits the matrix recrystallization and causes the formation of
cavities and unconsolidated sand pockets, in what is otherwise a
coherent rock mass. These imperfections can be of critical
importance when designing the foundations of structures on a reef
mass.
Lithification by compaction is most effective where there is a
fair proportion of the matrix structure compressed into the inter-
granular spaces. That is, the process usually occurs when the reef
mass is at a late stage of its development. The same applies for
the process of cementation.
When considering construction on a reef mass, it is only the
top 10 to 30 metres that is of interest, or alternatively, the
young portion of the reef. So therefore because of the time
dependant nature of all the lithification processes, it stands to
reason that in this region, these processes are only partly completed.

1 4.
P'-.{V,R 3
TYPES OF STRUCTURES ON CORAL ELS
3.1 Lighthouses
The Commonwealth Department of Construction has built numerous
lighthouses on the Great Barrier Reef over the last fifty years.
Figure 3.1 shows the location of lighthouses that are situated on
bare reefs or sand cays. The majority of them are situated. in the
north of the state where the reef is closest to the coast, thus posing
the greatest risk to shipping. Those towers that will be discussed
specifically in later chapters are indicated on the map.
The Department of Construction classifies reef environments into
three different categories:
Type A Coral reefs completely submerged at high tide and either
dry or submerged by 5 to 10 feet at low tide. Figure 3.2
shows a tower in such an environment at Waterwitch Reef.
Type B Si
to type A but with a sand cay on the reef. The
cay may not be permanent but at this stage is above high
water level.
Type C Similar to type B but land area is stable, fairly flat, of
low elevation and with tree growth (Figure 3.3).
The majority of existing light towers are lattice-type towers in
piled foundations. Up until recently, these towers were almost
exclusively constructed of painted or galvanised mild steel, but
recent trends have been towards stainless steel since this material
is virtually maintenance free in a marine environment.

FIGURE 3.1 Location of Lighthouses on the Great Barrier Reef

FIGURE 3.2
Lighthouse in a Type 'A' Environment
(Waterwitch Reef)

'.`'...;.•-
' • 0 , r. ' _ • .., Z., , .
,1,':7$;-• , - ; .‘.:,„
: ,4'.....y,". r'' .:•••1 'I , i. . . . .! ,se;'• ;
.*:;:i.itiil, ; :-::: .: '-,, :wst's , 1" -
::, St ..':: .• ..
'.....', -i, .
-%; ..ot,;■•No. , : .,..
. • ' •'`fs . .. ., ■, : 4.., '. ,..,„,, 1.
17;2!:::'.4.....' \:::::;::;Y"•:f' : '.5111.,.1.- ;1 .:4
' t • .
- 1 '. ■
ON, • .: LI q, „ - ' ■ f . . ... I
‘;',. NI 1 I , ...._.,• 11. 4,4
' 4' . 1 . :►' ' . . 4 Nk1 t . . • . :a' : . ") . ''.. ..1 :.‘; :21" 4 .; . ' i I :I: 14. 4 . I. . I
. V .:. , . ' . l ......_ 41 +1. , ',..v.3 ,;: : ̀, . S.s!.
, . . et .. , c • , s. •
i• ' . .--'-' - + ,
.., ,..,..; ■ , . 4. ,. ; .. • • . ..,_ , "00. •... 7' 1".
'4 r4,40.: . ts. s.. :' , . ' ' i'l.is'Iti._' „o,". .,.. ..;,.., <1
.ii ,. ......t d- c. ; • . '*.t .',•.''..f(P?4'''' '''.........:1:.‘•:11.:i ?‘■ II.: ffterAd . ,`i ..*4„..‘ "L. .r.• ' .---.44,:.q.I.7 .:?.. ,,..
.... ••• - s. '.. rd .... • ...... ..,I z7.....: , ;:. - -72— pi,..... -,;:-...... .:;.. 11...:0....,74,, , el ..)..e..,;,..4-. .. ' •-■..S.,.., , :,1.7..:',7i,
''., ..,;,:i ri, . • • d
. ,i0.,:•%‘' , - '47 ,(,.47- k: ir,.,:-14 .....44: ' ; ' ;0Z, .• .4 ',;: , 1 • e
1..1 '. ":"" . ? ' ' . 4 • • .,' ilrl * '. , •• . 'w 1 , I!! j
''.!..... 4 a ...t. ', - 3). - • k , 4, : '-,' ...... 2. -. ,r• - or . . ' ,...., . , ' ".r; 4 .''' • • • fil. •
.0 ' • •,. '
:4: : ..4 •. ' 4 a.. 1.
. ';' '..
- .. 1 .c.-.2.,,,r. ' - :....# .;'.« .'. .: 0 •%*:, 4 11.. 7 ." 4 , •
... . fp oft ..!..;‘,,, . 1.,...• . i ...; .0 , t i, ..... ,,,,' ../..• .
. . ' 114.`-'Z "S4r.; ' .. . ;;, •
. .. ' . . ''' : a:
' . :4'4 '•"....s... : -.....4.„--416.416, ..: , , 1 ' C•%P.
FIGURE 3.3
Lighthouse in a Type 'C' Environment
(Hanah Island)

18.
Several mild steel and stainless steel free stancli tubular towers
have also been constructed. This type of tower is only suitable for
Construction on sand cays or small islands since the tower is trans-
ported in sections bolted or welded together on the ground and
lifted into position, and in order to do this a level site with
adequate working space is required.
3.2 Weather Stations
There are several unmanned, automatic weather stations situated
on reefs off the Queensland coast. These stations are also designed
and built by the Department of Construction and their function is to
collect weather data for analysis by the Bureau of Meteorology.
These structures are constructed of anti-corrosive stainless steel.
with piled foundation and with a typical form and dimension as shown
in Figure 3.4.
3.3 Radar Beacons
Radar beacons are probably the simplest structures situated in
the Great Barrier Reef. They act as navigation aids to mark various
reefs and to indicate safe passages between them.
The design and construction of these structures is very simple
and usually consists of a single, mast with a reflector at the top.
Cameron (1975) designed one such beacon on Keeper Reef off Townsville,
as a part of his final year thesis and a photograph of it is shown in
Figure 3.5. The beacon is 6.6 metres high with a reflector on the
top made of three 1.73 metre squares of insect screen wire with light
aluminium tube framing, placed in the X, Y and Z directions.

V
VIE W °C `
FIGURE 3.4 Elevations of a Typical Automatic Weather Station

20.
The beacon has a range on radar of approximately thirteen kilotres.
Navigation through the maze of reefs that constitute the Great
Barrier Reef has always been a major problem and a system of radar
beacons such as the simple one described above would be all that is
required to provide a suitable navigation system. The Department of
Mapping and Surveying is contemplating such a scheme, that would
involve the construction of hundreds of these beacons. The beacons
would be placed all along the reef thus enabling safe navigation
through it at any point.
3.4 General Marine Platforms
A marine platform is the general name given to offshore
structul'es, other than towers, that have one or more levels of flat
working space. An automatic weather station is a marine platform on
a small scale. Marine platforms are used extensively in the petroleum
industry for such things as oil drilling, offshore storage and loading
complexes, and scientific research stations. These operations
usually involve construction in deep water, whereas construction on
the Great Barrier Reef would involve no more than 10 to 12 metres of
water and in most cases less than 6 metres.
Marine platforms are used extensively the United states Coast-,
guard in place of their light ships, which were previously permanently
moored at the required position. Figure 3.6 shows a typical design of
these platforms. No large scale platforms have yet been built on the
Great Barrier Reef, but structures similar to the one in Figure 3.6
would be quite feasible.

United States Coastguard Tower (After Offshore Technology Conference 1975,
Ref. 5)
FIGURE 3.6
us AL r LAN° t
LANTV04 Crwril
Otew tECT , 0
YEAH eivaTtA
JACKET
DRWCW PiLk
Radar Beacon on Keeper Reef

22.
The Australian Institute of Marine Science Z..,S) has obtained
a preliminary design for a large scale research station on Britomart
Reef, off Townsville. This struc une will involve a self-contained
platform large enough to accommodate up to six people for several
months at a time, and with mooring facilities for different size
vessels. A helicoptor landing pad will also be incorporated in the
structure. The preliminary design was carried out by McIntyre and
Associates, Consulting Engineers of Townsville, and at this stage no
definite decision has been made by AIMS on whether to go ahead with
the project.
Cameron (1975) carried out a preliminary design for a marine
platform situated in a lagoon area of Broadhurst Reef. He proposed
asic framed structure on a caisson type foundation as shown in
Figure 3,7, A caisson type foundation was practical due to the
fact that the water in the lagoon is shallow and the bottom is flat
and sandy.
The designs for ocean platforms are influenced greatly by the
specific environment in which they have to operate. Construction of
fixed platforms is affected by the geology of the bottom, water
depth, currents, tides and the state of the sea.
3.5 Tourist Resorts
There is only one tourist resort on the reef proper in Queensland
and this is on Heron Island, east of Rockhampton, in the Capricorn
group of reefs. Other resorts that boast live coral would better be
classified as offshore islands with small fringing reefs (e.g. Hook
Island, Lizard Island).

23.
FIGURE a. Caisson-TyiDe Foundation
, R - 3,7 b. a.'AC Structure

24.
Although these types of resorts do allow tourists to view coral and
associated marine organisms in their natural state, exploring
Great Barrier Reef itself is unsurpa .ssed. When the full potential
of this activity is realized, it is inevitable that tourist resorts
on the reef itself will become much more commonplace. Although the
development of the tourist potential of the reef should be encouraged,
it should also be sensibly controlled so as not to spoil the natural
beauty as has been the case in some parts of the world.

L). .
C A •TEI,
GENERAL PROBLEMS ASSOCIATFJ ESIGN AND CONSTRUCTION OF
ENGINEER. STRUC' •flN CC T REEFS
4.1 Remoteness of Site
Although the distance of the reef from the mainland is only
thirty miles on the average, the distance of a proposed site from an
adequately sized part can be quite large. This creates numerous
problems in the actual design of a structure on such a site, and also
in the planning of the overall operation. The onomic aspect of the
project is probably the most important factor that arises from this.
The cost involved in transporting men and equipment to the site
can he quite staggering when one considers that this cost is incurred
before anybody even sets foot on the actual site. The size and
number of vessels required obviously depends on the scale of the
project and the distance of the nearest suitable port. Conversely )
when designing the structure, it is desirable to know the type of
vessels that will he available in order to ascertain what sort of
equipment can be taken out and to determine the size of any pre-
fabricated sections that may have to be used.
If the site of a proposed structure is an appreciable distance.
from a suitable port, it may he most economical to engage the
services of one large boat that takes all the men, materials and
equipment out in the initial trip. The boat would then anchor at
some safe spot close to the site, and smaller barge-type ve'isls would
be used to transport wen and equipment onto the reef itself. These
vessels could be carried on the deck, or in the hold of the mother ship.

26.
Of course, this method depends somewhat on the condition of the
actual site as discussed in Section 4.2.
An alternative scheme that could be employed if the site was
relatively close to a port, would be to have several small boats
transporting the equipment and materials out as they are needed. The
advantage of this is that only one small vessel has to remain idle at
the site to act as a base, while any others are useL: when they are
needed. This means that less money is lost on idle equipment and
labour (i.e. the boat and its crew). Two boats would probably be
sufficient for the whole operation and, as before, small barge-type
vessels would be used to get onto the actual site. If these vessels
won't fit on the boats, they.could be towed behind, since the distance
to the site is small. In an operation such as this one, good planning
is essential, because if materials did not arrive on schedule it would
mean lost money due to workers and equipment at the site being idle.
Regardless of what method is used, the cost associated with
getting men and materials to a reef site can be a vital factor when
determining if a proposed structure is economically feasible.
4.2 Condition of Actual. Site
Construction on a completely or partly submerged reef can
present numerous problems, but it is generally something that cannot
be avoided when the proposed structure is on the reef proper. The
condition of the reef itself can be a deciding factor in the choice
of a site. For example, it may be desirable to have the structure
at a certain spot on the reef, but because the reei surface was
never dry or was very rough and uneven thus making it extre:illy

27.
difficult to work on, the site may have to be moved to a more
favourable position. On the other hand, due to navigational require-
ments it is not always possible to position a proposed light
structure in the area that will give the simplest and most economical
foundations.
As mentioned in Section 4.1, barge-type vessels can be used to
get men and equipment onto the reef itself, and this usually has to
be done at high tide. This is due to the fact that the leeward side
of most reefs is scattered with numerous, isolated coral outcrops or
bommies that are generally very close to the surface of the water at
low tide. In fact, it is not unusual for them, to be actually stick-
ing out of the water, thus making movement on the reef at any time
other than high tide very difficult and dangerous.
4.3 DeLperidability on the Weather
Without a doubt, the weath
is the most unpredictable of.
factors controlling work in a coral reef environment. Unfavourable
weather conditions mightn't necessarily stop work completely, but it
can lead to a decrease in the standard of the work carried out and
cause friction among the labour force, due to the uncomfortable
working conditions. Bad weather conditions can mean a delay in the
supply of materials to the site, and this possibility should be
considered when planning the operation. In extreme ccs, adverse
weather conditions may completely halt work, and if the construction
is at a critical stage, the structure may be in jeopardy unless
preventative measures are taken.

28.
FOUNDATION DESIGN
5.1 Site Investigation
5.1.1 Introduction
A detailed site investigation is one of the basic requirements
for any engineering project, including offshore structures. A proper
site investigation involves a determination of the stratigraphy of
the area in question, and a determination of the engineering properties
he soil or rock present.
Core drilling is probably the best method for determining the
stratigraphy of a site, while pentrometer and seismic tests can be
used to obtain an idea of the layers present and their relative
strength. These methods are all quite straightforward when carried
out on dry land, but when applied to offshore situations, they become
much more complex.
To determine the engineering properties, a variety of laboratory
tests can be used, either on their own or in conjunction with in-situ
tests. Regardless of what sort of laboratory tests are used, core
drilling usually has to be carried out beforehand in order to obtain
a sample suitable for testing.
The fact that we are dealing with coral rock in a coral reef
environment ultimately leads to problems never before encountered,
that must be overcome to successfully determine the engineering
properties of the rock.

29.
5.1.2 Core Drilling Operations
A core drilling operation is probably the most effective way of
determining the stratigraphy of a site and obtaining samples of the .
rock present. Drilling on a bare reef, whether it is partly submerged
or completely submerged, presents many problems that have to be over-
come.
Even though in some cases the surface of the
F may be dry at
low tide, it is often very rough and uneven thus making setting up of
the drill rig very difficult. In the case of a completely submerged
reef, drilling would have to be carried out from a platform that
could be either floating or semi-permanent. A floating platform
would have to have an extremely effective anchoring system to keep
the rig stationary thus reducing the difficulties involved in
drilling. Varying types of semi-permanent structures such as mobile
template platforms or self-elevating platforms can be readily
utilized for drilling in coral reef situations. These type of plat-
forms are discussed further in Chapter 7. Such methods are used
extensively in the petroleum industry for both exploratory drilling
and extraction of the oil. Appendix A indicates relevant papers and
journals that can be consulted for a more detailed review of drilling
methods employed for offshore situations.
Figure 5.2 shows a core drilling operation in progress on
Keeper Reef, using a Minuteman Mobile Drilling Machine, Model M/M
and under license by Fox Manufacturing Company. The drill
rig is mounted on a raft, made up of a framework of ten 200 litre
fuel drums arranged so that an opening is left in the centre for
drilling. The complete raft measures 3.5 metres square and is 0.8
metres to deck level.

30.
FIGURE 5 . 1
Location Map

4,77_
-",sticatta" 411 .-21■0,
AM.
•
-
31.
FIGURE 5.2 Core Drilling Operation on Keeper Reef

32.
It is fitted with an outboard motor so that it can transport the
rig onto the reef at high tide. The raft is then allowed to settle.
on the reef surface as the tide goes down so that drilling can be
carried out from a stable platform. It would be quite possible to
use this raft for drilling in a floating situation, as long as a
suitable anchoring system was used.
A common problem encountered when core drilling a reef mass is
the poor recovery rate often achieved due to the occurrence of cracks,
fissures, cavities and pockets of unconsolidated sand throughout the
mass. Moss (1976) describes a detailed core drilling operation
conducted on Keeper Reef. He describes the problems encountered and
recommends changes to improve the operation. .Sand inflow was the main
problem and a suggested improvement was the inclusion of a casing
procedure to increase recovery. The average core recovery rate he
achieved was only 12 per cent and the percentage of core suitable for
testing was generally only 5.
In an endeavour to determine the thickness of the reefs and the
nature of the foundation on which they are built, the Great Barrier
Reef Committee (1942) has sunk two bores through coral reefs. The
first one was at Michaelmas Cay, a small sand cay about 35 kilometres
NNE of Cairns, in the centre of the Great Barrier Reef. Figure 5.3
shows the results of this bore. The second bore was on Heron Island,
a flat, roughly oval, wooded sand cay in the Capricorn group of reefs
east of Rockhampton. The results of this bore are shown in Figure 5.4.
The bores sunk by the Great Barrier Reef Committee were done by
means of a Victoria Boring Plant of the rotary and percussion type.
At both sites, there were unexpected difficulties encountered during
boring; the most common being the striking of narrow hard bands

Depth (metres
33.
porites - white coral roc):
calcareous :;and
' 1 reef rock - eynphy
calcite crystal
fine calcareous detritus
soft reef rock
forarniniferal sand & soft reef rock
foraminiferal sand
grey-green sand
forPniniferal quart
foraminiferal quartz sa
FIGURE 5.3 Sub-surface Profile obtained from drilling at
Michaelmas Cay. (Blank sections indicate no
core recovered.)

34,
Living Coral
Quartzose Sandstone
FIGURE 5.4 Core obtained from Heron Island.
Limestone
Quartzose Sand
Quartzose Sand
Quartzose Sand ,
Si I
547

35.
through which the casing could not be driven, and reduction in
sizes were called for more frequently than was anticipated or
desired. The drilling in such a friable material for both sites
necessitated the use of several lines of casing.
In 1947 four holes were drilled in Bikini Island by the U.S.
Navy in co-operation with the U.S. Geological Survey 1954).
Also, in 1952, two holes were drilled into opposite , sides of Eniwetok
Atoll by the Atomic Energy Commission and the Los Alamos Scientific
Laboratory in co-operation with U.S. Geological Society (Ladd, 1953;
Ladd and Schlanger, 1960) Both of the bores at Eniwetok penetrated
to sufficient depth to reach the basement rock at 1267 metres and
1405 metres. The drill used was a Frank Model 137/33, rotary type,
trailer-mounted. Rock bits were used for straight drilling, and
diamond bits for coring. In both Bikini and Eniwetok drillings,
large amounts of soft rock ere encountered, much of it being poorly
cemented coral sand. Also, large caverns caused difficulty with loss
of tools.
5.1.3 Penetrometer Tests
Penetrometer tests are generally not used for offshore site
investigations, although tests have been carried out at Keeper Reef,
off Townsville, using a Nordmeyer Heavy Dynamic Penetrometer with a
drop weight of 50 kilograms and -a full height of 50 centimetres.
The basic procedure behind these tests was to record the number
of blows required to adVance the rods ten centimetres, thus enabling
you to get an idea of the relative hardness and strength of the
layers. The tests are also very useful for indicating the presence

of sub-surface cavities or wak layers consisting of pockets of
unconsolidated sand. Figure 5.5 is the result of one such penetrometer
test. This test indicates the presence of a very hard layer at a
depth of approximately eleven metres with a lesser one occurring at
six metres. The test also shows that the first metre of the reef
mass is relatively harder than the following five metres„ and after a
depth of approximately 16 metres, the reef mass appears to be fairly
uniform. Figure 5.6 illustrates the capability of the penetrometer
tests to indicate the presence of sub-surface cavities. This test
shows that there is an extremely large cavity at a depth of about 4.5
metres that could be critical in the foundation design.
The .penetrometer tests were carried out with the rig sitting on
a barge, the same as that used for the core drilling operation shown
in Figure 5.2 . The barge is held in position by means of winches
at each corner, connected to anchors that are embedded in the coral.
The winches are held taut in order to keep the rig stationary, and
they have to be adjusted regularly in accordance with tidal
fluctuations. Even though the barge is held in position by these
winches, wave motion still caused appreciable up and down movements
of the barge thus leading to slight inaccuracies in the readings.
Using the procedure described above as many as three tests per
day could be carried out, and this rate could be easily increased if
a more efficient procedure was formulated. Disposable tips were
used in order to speed up the process by making the extraction of the
rods much easier. The tests on Keeper Reef were carried out in
situations where there was less than two metres of water, and in some
cases the barge was actually sitting on the reef surface at low tide.
This method could readily be adapted to deeper water with the only
modification possibly being in the anchoring system.

70
FIGURE 5.5
0 12 14 16 16 20
DEPTH (71)
Penetrometer Test on Keeper Reef

2 4 6 14 16 18 20
FIGURE 5.6
10 DEPTH (ri-1)
Penetrometer Test on Keeper Reef

39.
Penetrometer tests should be considered as ving a qualitative
view of what lies under the surface, in order to assist in the
design of the foundations and in detecting any problem areas that
may exist. It should be noted that these tests can only be used to
estimate the engineering properties of the coral rock, not to
actually determine them.
5.1.4 Seismic Testing
Seismic testing can be used to determine the depth, thickness,
and relative density of different layers present in the reef mass.
The basic principle behind the technique involves the analysis of
waves produce] by a detonator after they have been refracted or
reflected off the various layers. The waves are received by a
geophone and their velocities can be calculated and related to the
relative densities and thicknesses of the layers.
This method is useful for determining the presence of any
particularly dense sub-surface stratums that may have to be utilized
in the foundations. For example, tests carried out on Keeper Ree f
show that an uncomformity exists at approximately 20 metres. This
unconformity is thought to be the interface between the low stand of
the sea level and growth produced since then. This level represents
a more lithified and coherent rock mass compared to the overlying
layers. That is, the material, is more dense when compared to the
younger overlying coral deposits. Such a layer could be used as a
safe bearing stratum for massive foundations that have very high
loads placed on them. Seismic surveying can also be useful for
indicating the presence of large sub-surface holes and bodies of
unconsolidated sand that would have to be avoided in foundation

40.
construction.
Activity in the field of seismic research applied to coral
reefs is very limited and much more is needed before the reliability
of the technique can be properly evaluated.
5.2 Suitable Foundations for Structures on Coral Reefs
5.2.1 Introduction
Foundations for offshore structures can be broadly divided into
two main categories: piles and spread footings. The special form
that they take is dependent upon the condition of the site, the
methods of construction available, and the loading that they are
required to withstand.
The foundations of an offshore structure have to be designed
for both horizontal loads produced by wind and wave forces and
vertical loads due to wave forces and the weight of the structure.
The horizontal loads produce a shear at foundation level as well as
an obvious overturning moment. In deep water this overturning
moment can be quite large and is due primarily to wave loads,
whereas in a shallow water situation, such as a coral reef environment,
the overturning moment due to wave loathn;:,, is greatly reduced.
5.2.2 Piles
Pile foundations are used almost exclusively for the support of
permanent offshore structures, including those on coral reefs. The
last two decades have seen tremendous advancement in the technology

41.
behind the design and construction of fixed offshoLe platforms, due
primarily to increasing offshore oil production. Areas—such as the
North Sea, the Florida coast, and Bass Strait, are dotted with fixed
platforms used for various functions including, storage and loading
facilities, primary treatment plants, and scientific research bases.
These generally involve water depths of anything between 50 and 300
metres and situations where wind and wave loading can become quite
severe.
The design of such structures usually consists of cross-braced
hollow steel piles, while hollow cylindrical prestressed concrete
piles are sometimes used for unbraced or free standing pile
foundations. The steel pile-type structure can be readily applied
to a coral reef situation whereas concrete piles in coral presents
special problems that will be discussed later. The methods of
construction and installation of such structures are described in
detail in Chapter 7. A large number of publications that deal with
the design of piles in a variety of different situations are
documented in many journals, the best being the Offshore Technol gy
Conference (OTC) series.
Myers (1969) suggests that pile types for offshore - structures
should be selected in terms of the following factors:
Suitability of bearing material
Length of pile required to reach this material
Character of structure to be supported
Character of loading (constantly static, intermittent, lateral
impact, buoyant uplift, duration, etc.)
Availability of materials

42.
Means of transport of piles and equipment
• Factors causing deterioration
Amount and estimated costs of maintenance
Estimated economic life required
Estimated costs of piles and foundations (if not the same
with different pile types)
Availability of funds
Obviously, all of the above factors apply to the situation of a
structure on a coral reef, with particular emphasis focused on
suitability of bearing material due to the limited experience in this
field. Almost without exception, existing structures on coral reefs
are supported by driven steel piles. Lighthouses constitute the
majority of what can be termed substantial structures, situated on
the Great Barrier Reef.
In 1975, the Department of Construction erected lighthouses on
Pith Reef and Rib Reef, north of Townsville. (See Figure .1).
Both sites were always submerged by at least one metre of water and
the foundations were situated on bare coral.
The Pith Reef tower consists of a reinforced concrete base,
6.5 metres square and 1.8 metres thick, founded on the coral and
anchored to four steel piles. Four concrete columns are cast on the
slab and tied with a concrete ring beam at the top, 4.1 metres above
the base slab. The actual tower is a 24.5 metre high, standard
lattice tower sitting on the ring beam. Below is a brief description
of the design values used:
Calculated uplift on piles = 232 KN
Assumed friction = 30 K.P.a. (6000 psi) .
Permissable bond stress = 690 KPa (100 psi)

Factor of safety moment resisting moment overturning
1.5
43.
Required length of embeddment in pile cap
224 mm
Piles required to be driven to a depth of 8 m.
The Rib Reef tower consists of a 3.5 metre diameter, 1 m thick
reinforced concrete base founded on the coral and anchored to four
steel piles. In the centre of the base is cast a cylindrical
reinforced concrete column, 1.2 metres in diameter which is capped by
a 4 metre diameter, 0.2 metre thick concrete platform. The platform
is 9 metres above the base, and the actual light just sits upon
The design values for the foundations of this tower are very similar
to those used for the Pith Reef tower.
In both cases, 232 mm x 220 mm x 123 kg/m steel 'H' piles were
used, driven by the drop hammer method. The weight of the hammer was
1.5 tonnes and the drop height was 1.8 metres. In both cases, the
piles were driven to a depth of approximately 6.5 metres, where
virtual refusal was encountered (compared to the design depth of 3m).
This left a length of ernbeddment in the pile cap of approximately
1 metre, since 7.3 metre lengths were being used for driving
(compared with required embeddment of 224 mm). The pile driving
details from both sites were virtually the same, and they are shown
below:
First 1.2 metres, penetration of 40 - 50 mm per blow
Next 3.7 metres, penetration of 230 - 250 mm per blow
Next 0.9 metres, penetration of 75 - 150 mm per blow
Next 0.6 metres, penetration of 25 - 50 mm per blow
Virtual refusal encountered at 6.5 metres
Even though the above design specified a pile length of 8
es,

44.
due to the hardness of the coral rock they could only be iven to
6.5 metres, where it was assumed that sufficient bond had been
developed to satisfy the design. This discrepancy illustrates the
uncertainty involved in the design of foundations in coral rock;
due mainly to the limited knowledge of the engineering properties
involved. It is common for the pile depth to be deleted from the
design and left up to the judgement of the engineer on site.
Figure 5.7 shows a portion of a plan for the foundations of a 30
metre, free standing tubular tower situated on a sand cay at
Frederick Reef. The design specifications state that the pile
length is to be determined on site and if the coral prevents
driving, piles are to be deleted. If the piles are deleted, the
design wind velocity and design wave height are increased in order
to increase the factor of safety.
Another common method employed by the Department of Construction
is to specify a range for the pile driving depths in the design
(e.g. 6 to 8 metres). If the piles cannOt be driven to a depth in
this range, then extra piles, have to be added to the design.
Although driven steel piles are the best foundation types for a
coral reef, there are still numerous problems that may be encount-
ered. Cavities or pockets of porous coral and unconsolidated
sediments may cause sudden slip of the pile, resulting in loss of
end bearing and side friction. In cases where the structure is on
the slope between the reef and the normal sea bed, driving may
cause localised failure in the coral as illustrated in Figure 5.8.
To prevent this, the coral would have to be prebored down to a
suitable level and then driving started from there.

/vole : I-1 .9 bolls nor .1110,n in "hi'. .
for Irscolion and d.iloils
scs QS0 /GB
r.• co
it1 . • 0 . 0.0
foyy e r e d
h . gawrs
/ey e,- •
•• j.7? • .1:■ors.,
ircor ot jig./ ••'
2 .eve. r
icyor cyf _0061
d
NOTE:
Cos.. orl.rcle oest of .0 . one .1' •
bo,.. to j, robe...a.ce b ifs. ,tt
. 1=4 • 1.T
--r-Frocl ,tob.10
1 41o.
\ • . 11 c bo,a.
C..1€•" b°
r * -
LAYOUT PLAN sc ., 3 rd. LAYER
OF STEEL.
DETAILS.
8
knyth •Ir 41,4
on *at,
Pderi /0 tc o'vlolotf,/ Csons,ly
CI co-of peorendi
dr ;ring
ID • bc,-, Sfaupr , isd
re, h
. Coy a rrr.c.de
bo , a s),-....n) ...it
l'n • L.., sr Cho sr ,
I j •
8.1
bo,s
E-E.
2nd LAYER
Or 5 TELL.
Gib
-11 2 o- a
PLAN OF RDNFORCE ENT.
th. LAYER
OF ST ELL.
Pi Or C
Co.-" lo co'c-rofe lo be oro...rnd0
O. k.pa r .15-1..../ I.. be J00
ra.,14..c..er-roo,, lc+ Ca al o--)la
ft* aIa a.a and 1..esfAcer .1. 'FO t'oLa Ja Q.S capco.
.1.51 LAYER
OF STEEL.
TOWER FOUNDATION
FIGURE 5.7 Foundation Details of Frederick Reef Tower. (Note Pile Details indicated.)

46.
Coral Reef Mass
Failure
FIGURE 5.8 a. Localised Failure occurs due to Pile Driving
FIGURE 5.8 . Pile ebored to prevent Failure.

47.
This situation could often arise where marine platforms are used,
since the deep water is utilized for the docking of large vessels.
Concrete is widely used for piles on offshore structures because
it resists decay, marine borer and insect attacks, corrosion; and
because it can be cast in place or at a nearby location. However,
such piles are heavy to handle and require relatively heavy drive
hammers. Concrete piles are generally made at or close to the site
at which they are used because of their weight. They may be precast
before driving or poured in place, although poured-in-placed piles
are not well suited to use in exposed marine locations. For heavy
marine use they should be precast and prestr ssed to prevent cracking
and disintegration.
Cameron (1975) used a form of cast-in-place concrete pile for
the foundation of the radar beacon on Keeper Reef. The base of the
mast was placed in a 0.5 metre deep cored hole, and then concrete
was poured around it. The original design required the hole to be
1.5 metres deep, but due to the extreme hardness of the coral
penetration was only to 0.5 metres and because of this it was assumed
that 0.5 metres was sufficient.
Cast in place or pressure grouted concrete piles can be totally
impractical when there are large cracks, fissures, cavities or
pockets of unconsolidated sand, because of the large amounts of
concrete that would be wasted in these defects. Generally, where the
coral mass is very uniform, any concrete cast into it has good
cohesion because of the porous nature of the coral. Probably the main
advantage that coral has over other soft unconsolidated soils when
used as a foundation is that it is not subject to scour.

48.
5.2.3 Spread Footings
Spread footings include any size or shape of foundation
element that develops its supporting power primarily by soil bearing-
at or near the sea floor. Moveable offshore structures designed for
drilling or construction purposes usually employ some form of spread
footing because of the equipment simplification afforded by the use
of shallow support. Such foundations are not frequently used for
permanent construction because they are vulnerable to erosion and
have limited resistence to lateral forces.
Mat footings are usually large in area and are planned for sea-
floor penetrations that are quite small in comparison to the foundation
width. This type of foundation is commonly employed for semi-
submersible drilling barges that are used in relatively shallow water;
usually less than 10 metres. In contrast to mats, some structures use
individual footings designed to penetrate up to one or two times the
width of the footing, thereby gaining lateral resistence and, in many
cases, support of stronger bearing material. This type of footing is
commonly used in connection with the elevating-deck type of moveable
structure. This type of structure is in wide use throughout the
world for petroleum drilling; some having been designed for operation
in water depths up to 95 metres. The utilization and installation of
semisubmersible and self-elevating structures is discussed further
in Chapter 7.
Cameron (1975) proposed a caisson-type foundation in the
preliminary design of a platform on Broadhurst Reef. This form of
foundation is basically a mat footing and was chosen in this case
because the proposed site was in the lagoon area of the reef where
the water is shallow and the bottom is flat and sandy.

49.
These are basic requirements if this type of foundation is to be
used. Another factor influencing the choice of a mat footing was
the fact that the proposed structure was a relatively small platform
with a design life of only five years, meaning that the loads are
greatly reduced. A mat footing would be impractical for a very large
platform because of the massive dimensions, and quantities of concrete
that would be required.
Footings have been used for the foundations of lighthouses and
weather stations on sand cays, but with very limited success. It
was found that even though the cay was permanent and stable at the
time of construction, this is not the case in the long run. Severe
weather conditions such as cyclones, and changes in the regional
hydrology, lead to drastic alterations in the structure and shape of
the cay. This can lead to severe erosion under the footing, thus
endangering the stability of the structure.

50.
CHAPTER
DESIGN OF THE SUPERSTRUCTURE
6.1 introduction
The superstructure of an offshore structure is that part of it
above the foundation level, and, to simplify the discussion, I will
refer to this as the structural part or simply the structure.
The fact that lighthouses constitute 99 per cent of the
ructures on The Great Barrier Reef makes it very difficult to
ascertain what sort of structural design is suitable for reefs,
based on past experience. Where the foundations are concerned, it
is the special problems encountered with the coral that is important,
regardless of what the structure is. So, therefore, one can assume
that the foundations of lighthouses can be readily applied to any
structure, regardless of its form.
In the case of lighthouses, the structure is very stereotyped;
that is, there is a standard structural design that can be applied
to any situation. This standard design is basically a tower and it
is useful for lighthouses, and nothing else. But, it can be assumed
that the structural design principles employed for offshore
situations are universal. That is, the materials and structural
form may differ, but analysis of the loads will be the same; with
their magnitudes depending on the particular environment.
6.2 Materials
A typical coral reef situation is an extremely corrosive

environment and this, along with cost, are the major factors
controlling choice of a structural material. In this type of
situation maintenance costs can be very high, so therefore the
structures should be designed so that they require the absolute
minimum of maintenance throughout a long life. Reduction of mainten-
ance can be achieved by using corrosive-resistant materials such as
aluminium and stainless steel, or by using protective coatings that
can either be chemical or metallic. The final decision on what to
use will be based on the long term cost and reliability of the
respective methods. The actual design or form of the structure can
also be used to reduce maintenance. For example, a free standing
tubular tower has fewer joints and discontinuities (corners) than a
lattice tower, so therefore it requires less maintenance.
The Commonwealth Department of Construction conducted a survey
in 1971 into the suitability of four different types of materials for
use on lighthouse structures in harsh marine environments; in
particular, coral reef situations. The aterials tested were:
general purpose structural grade mild steel manufactured to
Australian Standard Specification A149-1965; high strength low alloy
structural steel manufactured to ASTM Standard Specification A242-66
(Austen 50); stainless steel, American Iron and Steel Institute Type
31b; and aluminium of the Aluminium Development Council Specifications
5000 and 6000 series. Each of these materials was examined to
determine its suitability with regard to corrosion resistance and
strength.
Mild steel, galvanised and/or painted, is the most widely used
material on lighthouses to date. Its principal advantage is its low
initial cost, while its disadvantages are that it readily corrodes

52.
in a marine atmosphere and it requires regular maintenance. An
example of the rate of corrosion is at Miles Reef where galvanised
mild steel angles positioned 3 metres above high water on an
exposed site were reduced by 3.2 mm in nine years.
High strength low alloy structural steel (Austen 50) shows a
tendency to corrode under conditions of wetting and drying, develop-
a dense oxide layer which becomes denser and more adherent with
age and tends to inhibit further corrosion. Austen 50 is not
recommended for use unpainted in a marine environment, and laboratory
tests show that the paint life on low alloy steels in a marine
atmosphere is at least doubled when compared with the paint life on
mild steel at the same site.
Stainless steel of AISI Type 361 has been used extensively for
lighthouse structures off the Queensland coast, and has proved most
successful in service. Stainless steel, due to its oxide coating,
is a passive metal which allows it to be exposed to severe corrosion
environments without deterioration of the stainless steel surface.
However, stainless steel is subject to certain types of corrosion
that can cause failure of structures and that must be considered and
checked for at regular intervals. These are: intergranuiar
corrosion, stress corrosion, pitting corrosion, service corrosion
and galvanic corrosion.
Aluminium has been widely used with considerable success for boat
hulls and ship superstructures for nearly fifty years, but the use of
aluminium on lighthouses has been very limited. Temporary aluminium
tubular scaffolding structures have been erected as light and beacon
supports at several points along the Australian coast, and aluminium

53.
has also been used for radar reflectors on beacon structures.
Due to fatigue behaviour of aluminium whereby it does not have an
endurance limit in marine environments, structures of aluminium must
not have members subjected to fluctuating stress conditions.
Protective coating can be a very efficient method for reducing
corrosion in structural materials, but its efficiency depends on
regular maintenance to keep the coating in good conition. Mild
steel and low alloy copper steel must be coated with a protective
paint to prevent corrosion in marine environments and must receive
regular maintenance depending on the type of paint system and the
base metal. With aluminium and stainless steel, the prime advantage
is that the oxide film for both metals is protective to the extent
that painting is not required and hence maintenance is reduced to a
minimum. If aluminium and stainless steel are painted, regular
maintenance is required as the paint surface will hold water and
assist pitting if not maintained in good condition.
In considering any paint system for a marine environment, it is
essential that the initial coating be shop applied to sandblasted
white metal surface. The requirements of a paint system are that:
It is resistant to abrasion and impact so that sections
can be transported and handled with the minimum of
damage to the paint surface.
Repairs and repainting can be readily made to the paint
system with the minimum of preparation and equipment.
The finishing or envelope coats must be resistant to
inc and ultra-violet attack for extended periods up
to 10 years.

54.
(iv) The priming or sacrificial coats should be anodic to the
base metal and will offer protection if the finishing
coats fail at isolated points.
Many different paint systems are available that generally
satisfy the above requirements. These include vinyls, urethanes, tar
epoxys and chlorinated rubber with zinc base primers or with aluminium
spray. The tar epoxys give a hard surface, which may be brittle and
they are generally difficult to overcoat, without sandblasting before-
hand. The other top coats are easier to overcoat.
Figure 6.1 shows the estimated structural maintenance time
required for lighthouse towers constructed of the four different
materials discussed above. These figures were calculated for a
program that involved the construction of 70 towers off the
Australian coast, and they indicate the extra maintenance time per
year required (i.e. on top of maintenance for existing towers).
Approximately one-third of the towers involved in this program are
in coral reef environments, or similar situations off the Queensland
coast. This diagram illustrates the tremendous saving in maintenance
afforded by using stainless steel instead of mild steel or austen.
The values obtained in Figure 6.1 were based on previous
maintenance programs for towers of the type shown, and since
aluminium is very much an unknown quantity as far as use in
lighthouses is concerned, the values obtained for it should be
treated with caution. However, stainless steel, mild steel and
austel have been used extensively for lighthouses, so therefore a
comparison of these three can accurately be obtained from Figure 6.1.

(f)
cm
0
Li
50
EGEND
STAINLESS STEEL
MILD ST EL
STE N
L UM: N!UM
0
J
FIGURE 6.1 TIN/1E INJ YEARS
ESTIMATE OF ALL MALNTENANCE REQUIRED
IN DAYS FOR 70 TOWERS BUILT OVER X
TEN YEAR PERIOD.
55.

Design Service Fabrication
Yield strength Corrosion resistance Joining
Ultimate strength Stress - corrosion Forming
resistance
Young's modulus Machining Corrosion - fatigue
resistance
56.
Figure 6.2 shows the variation of the estimated total
expenditure on one tower versus age of the tower. Obviously, the
initial cost at zero years is the construction cost of the tower.
The total expenditure is based on actual cost; that is, the sum of
money which invested now will finance initial costs and all other
commitments including structural and routine maintenance. From the
graph it can be seen that a stainless steel tower isthe most
expensive -to build, while mild steel is the least; but after just
nine years the total expenditure on the mild steel tower is greater
than that on the stainless steel one. And, after 25 years, the,
stainless steel tower will, prove to be cheaper than any of the others.
It must be noted that the actual monetary values shown are not
accurate since the figures were formulated in 1970, but the behaviour
the lines exhibit could be assumed accurate. The only major changes
possibly being increases or decreases in the initial costs due to
price fluctuations of materials.
Of course, corrosion isn't the only criteria by which
structural materials for offshore structures are chosen, but it is
often the deciding factor since other factors can be controlled
somewhat by changes in the design. The characteristics of a
material that are important for offshore use can be divided into
three general categories: Design, Fabrication, and Service. The
individual characteristics of each category are:

r-
Th FIGURE 6 . 2
ESI1MATE D TM-AL EXPENDITURca ON C
TOWER BASED ON ACTUAL COSTS.
57.

Fabrication Service
Density
Poisson's ratio
Fatigue resistance
Brittle-fracture
resistance
Quality control Repair
Maintenance
Creep resistance
58.
The importance of the design and service characteristics is
obvious, but fabrication is equally important for offshore structures
since the materials have to be fabricated and machined before they
are transported to the actual site. So therefore it is imperative
that the materials form into the required components precisely,
since no major machining or fabricating is possible on site.
6.3
Structural Loads
6.3.1
Introduction
The structural design loads of an offshore structure are a
function of predicted sea conditions, duration of operations and the
acceptable risk for exceeding the predicted load values. This risk
will be governed by the actual states of seas encountered during the
useful life of a platform and the increased structural cost the
operator is willing to accept. In general, design of offshore
structures involves probability aspects that are much more important
than in the design of onshore structures.

59.
Important considerations in the design of offshore structures
include: selection of. a structural design life; computations of
maximum expected wind-speed, storm-tide, and wave characteristics;
and selection of design allowance for any long-term detrimental
effects on the structure from the elements (e.g. corrosion). The
relative importance of each of these factors for a single application
is dependant upon factors such as the particular meteorology and
submarine topography of the site.
As has been stated previously: the analysis of the structural
member stresses is the same in a coral reef environment as any other
offshore situations, and is basically the same as a similar terrestial
structure. It is the actual determination of the design loads for the
particular environment that is specialized. For this reason, the
discussion in this chapter will be strictly limited to the determination
of the design loads for a coral reef environment and will not consider.
the structural analysis.
6.3.2 Wind Loads
Owing to the statistical nature of severe storm or cyclone
occurrences, the most probable adverse conditions that a structure
will encounter depend on the length of time during which the
structure is required to perform its planned function in the
environment; that is, its design life. The Commonwealth Department
of Construction recently conducted a study into the design of a
standard lighthouse tower for remote sites on the Australian coast,
particularly those in coral reef environments off Queensland. The
design life was chosen so as to comply with the economic and

60.
maintenance analysis conducted in the study. A value of thirty
years was decided upon, but it should be noted that this does not
mean that the towers will cease to be useful after that period. The
basic procedure used by the Department of Construction for determin-
ing the design wind speed is described below.
The selection of a single design wind speed for standard
lighthouse towers would result in all towers being capable of with-
standing the most intense wind likely, within the design period, for
any point on the Australian coast. Due to the range of wind
velocities that can be expected on the Australian coast, such a
design philosophy would result in conservative designs for a large
proportion of towers.
An analysis of annual maximum wind gusts at various locations on
the Australian coast was made using the Gumbel's standard skewed
distribution as described in "Extreme Wind Gusts in Australia" by
H. E. Wittingham. The design wind for a thirty year period was
determined on a constant risk basis, so that there is a 20 per cent
chance that the factored design wind will be exceeded one or more
times within a thirty year period. For cyclonic areas, this design
wind is slightly greater than the return period wind which could be
equalled or exceeded on the average, once in thirty years. Together
with this analysis, the detailed history of major cyclones between
1957 and 1967 within a number of areas on the Australian coast was
examined and an estimation of the likely winds to be expected within
the design period was made.
The analysis showed that for a thirty year period a design wind
of 240 kilometres per hour is suitable for all areas. This value

61.
was used for the Australian coast north of latitude 27 degrees
south, while south of this in areas not subject to cyclones a
design wind of 176 kilometres per hour was decided on. This can be
compared favourably with the design wind speeds calculated according
to the Australian Standard Wind Loading Code (AS1170, Part 2 - 1975),
as shown below:
Structure in cyclone region
Cyclone factor (multiplier) = 1.15
Structure in terrain category 1
Assume maximum height of tower 30 metres (100 feet)
Velocity multiplier = 1.16 From Table 4
Regional basic wind velocity for a 30 year return period
51 mis - From Table 2
Design wind velocity 1.15 x 1.16 x 51 m/s
68.03 m/s
= 245 kilometres/hour
(Compared with design wind speed of 240 km/hour used by
Department of Construction.)
Up until recently, all lighthouse structures in Great Barrier
Reef waters have been standard steel lattice towers of varying
heights. Because of this, the analysis of the member stresses due
to wind loading is a relatively simple procedure, with computer
programs being used in more recent years. The trend towards the use
of free standing tubular towers in some situations has lead to special
problems being encountered when considering the wind loading. This is
illustrated in the design of the Frederick Reef tower.
The Frederick Reef tower is a 30.48 metre high, free standing

62.
tubular tower constructed of stainless steel and situated on a
sand cay, east of Mackay, on the outer edge of the reef (see
Figure 3.1). The basic shape and dimensions of the tower are shown
in Figure 6.3. Experience with similar land-based structures, and
wind tunnel investigations indicated that significant stresses could
be induced in the tower by vortex shedding. This vortex shedding
gives rise to a lateral thrust on the tower and, an oscillatory
motion normal to the free stream velocity will develop, especially
if the frequency of vortex formation is close to the natural
frequency of vibration of the tower. It should be noted that the
line of maximum induced stress is perpendicular to the wind direction.
The natural periods of the tower were ascertained as:
1st mode - 0.38 seconds
2nd mode - 0.096 seconds
3rd mode - 0.041 seconds
The corresponding critical wind velocities for vortex shedding
are:
1st mode - 37.7 km/hr.
2nd mode 149.4 km/hr.
3rd mode 349 km/hr.
The likelihood of the 3rd mode ever being reached is remote
since the design wind speed of the tower is 240 km/hr.
Conservative calculations based on the above values concluded
that vortex-induced flexural stresses of approximately 86 t'fPa may
occur. In order to reduce these stresses, it was decided to put in
a series of vertical slots as shown in Figure 6.3.

Slots are 1.22 m
long and 152 mm
wide
63.
General Shape and Dimensions Enlarged View of Top Section of
of Frederick Reef Lighthouse Tower showing arrangement of
Vertical Slots used to reduce
effect of Vortex Shedding.
FIGURE 6.3

64.
These slots, which are 152.4 mm wide by 1.22 metres long, were
found, primarily by wind tunnel testing, to significantly reduce
the vortex-induced stresses.
It was stated previously, that among other things, the structural
design loads of an offshore structure are a function of the acceptable
risk for exceeding the predicted load values. This "acceptable risk"
approach to design is especially important in the case of projects
that are a commercial venture; that is, the project has to be a
viable economic proposition. This concept is a field of research
within itself and involves a variety of probabilistic, semi-
probabilistic, deterministic, and stochastic analysis methods that
are far too complex to be considered in the context of this discussion.
Appendix A gives a number of references that could be helpful in
pursuing this aspect further.
6.3.3 Wave Loads
Just as the design of a structure to withstand wind loading is
based on a design wind speed, the wave loading design is based on a
design wave height. As well as being used to determine the wave-
induced member stresses, the design wave height determines the
elevation of the lowest deck of a platform-type structure, since it
is desirable to keep this deck above water at all times. The accept-_
able risk of exceeding the predicted values that the operator is
willing to undertake is once again a major factor in the choice of a
design value.
The maximum wave height, or crest elevation, is comprised of
three components:

65.
The astronomical or tidal component,
The barometric component, and
The wind-stress component.
The tidal component is simply the change in water level due to the
attractive forces of the moon and sun. It is probably the easiest to
determine since the tidal range for most points on the Queensland
coast is known, thus allowing the range for points just off the
coast to be predicted with reasonable accuracy. Alternatively, tidal
gauges can be installed at the proposed site in order to obtain
accurate measurements.
The barometric and wind-stress components are more commonly
referred to as the storm surge; that is, the increase in height that
occurs during severe storms or cyclones. Obviously, this is the time
when the maximum crest elevation will occur. The barometric component
is the general rise in water level in a given area, due to the
pressure drop associated with a severe storm. In Great Barrier Reef
Waters, a rise in water level of 0.3 metres for every drop of 30
millibars in pressure could be expected.
The wind-stress component is a result of the onshore wind
stresses acting on the water surface and is in effect a piling up of
a water mass against the coastline. In a reef situation, this
component is generally not significant, due to the breakwater effect
that the reef has. That is, the distance of exposed water between
the structure and the reef (the fetch length) is not sufficient to
generate waves of significant size.
According to Myers (1959), there are three basic steps that
should be undertaken when determining the actual wave forces acting

66.
on a structure. These are:
selection of a design wave amplitude and period,
selection of the appropriate wave theory to compute
velocities and accelerations within the wave, and
selection of drag and mass coefficients and a suitable
theory for wave-force calculations.
It should be noted that in each of the above steps a selection
process is required. That is, from the many alternatives available,
the designer must choose the one which he regards as the best for
the particular situation.
Cameron (1975) used the Morrison formula to calculate wave
forces acting on a marine platform in Broadhurst Reef. The formula
states:
F 2 2 pgDa cos 0 (1 + a cos 9
PID2
p g 4 a sin K (d + a cos Q)
where F is the force on the pile;
P, •g are the density and gravitational constants respectively;
a is half the wave height;
is the phase angle;
is the depth of water;
is the pile diameter; and
2 P1 K is the wave no. = where L
o is the deep water
0
wavelength of the wave
Using a maximum crest elevation of approximately .5 metres,
parameter values for different wave periods were substituted into

67.
the formula and the worst case a. evaluated. A fifteen second wave
gave the largest force on the section. The sensitivity of this
force to large variations of the wavelength parameter, L0 , which is
difficult to evaluate accurately, was tested and found to be
acceptable.
In the case of structures on bare coral reefs that are covered
by water all or some of the time, the wave forces are relatively
small because of the shallow depths involved and the energy-
dissipation effect that the reef has. Lighthouses in such a
situation are generally designed so that the wave forces present
are not critical. The design usually consists of the actual tower
sitting on a concrete slab that is connected to the base slab by
massive concrete columns. The columns are the part of the structure
actually subjected to direct wave forces. In the design of the
Pith Reef and Rib Reef towers, the Department of Construction used a
design wave of 3.6 metres and a period of 7.4 seconds.
6.3,4 impact Loads
Impact loads arise in situations where the offshore structure
provides mooring facilities for boats. The loads are usually
absorbed by some sort of guard system which ensures that excessive
loads are not placed on the actual structure. Fenders are the most
common form of protection utilized.
Fenders are protective devices located and arranged in such a
way that they will, absorb a calculated amount of kinetic energy when
struck by a moving ship while bringing it to rest. Some energy, if
kept below harmful limits, will be absorbed by the deformation of

68.
the ship's hull. Piles are used extensively as vertical fenders
set out in front of a marine structure. Figure 6.4 shows prestressed
cantilever-pile guard fenders.
In most cases, cantilever piles alone absorb too little energy
and require too much deflection to develop the required pile strength
in bending. Fender piles are generally supported laterally at the
deck of the structure to reduce the deflection. Howaver, the piles
will absorb too little energy and will probably arrest the approach
of the ship with too little movement, thus increasing the reaction.
So, therefore, fender piles are often separated from the structure
by some sort of energy-absorbing device such as hard rubber pads.
The performance and load capacity of the various types of energy-
absorbing devices and fender systems available are usually given in
the manufacturer's specifications.
Fender piles can be used in various arrangements as guards to
prevent ships from accidently running into a marine structure. The
type of construction will depend upon water depth, size and speed of
the vessel, current, soil characteristics, and economic factors
based on expected frequency and degree of damage to the vessels and
fender system-/ Fender piles would be required in the case of a
platform situated on the leeward edge of a coral reef, such that
one side is in deep water, to allow for ships to dock alongside.

69.
FIGURE 6.4 Prestressed Cantilever Pile Fenders

70.
CHAPTER 7
CONSTRUCTION ON A CORAL REEF
7.1 Introduction
When designing a structure in a coral reef environment, it is
essential to take into account the major construction difficulties
that will inevitably arise. These difficulties can be kept to a
minimum by designing the structure such that the construction is kept
as simple as possible, and by efficient planning of the overall
operation.
Construction on a coral reef, whether it be on the bare coral
itself or in the deeper water areas of the lagoon and the leeward
edge, generally involves the use of a working platform from which all
operations are carried out. The types of platforms that have been
used as well as those that could be used in coral reef situations are
discussed in Section 7.2. It should be noted that as well as being
used as working platforms, the platforms discussed could be utilized
as permanent or semi-permanent structures in their own right. When
the proposed structure is situated on a sand cay or a small island,
construction is obviously much simpler because of the fact that you
have a firm, dry base from which to work. In situations like this,
conventional land-based construction techniques can be used to a
major extent.
The foundations of a shallow-water offshore structure,
particularly those on coral reefs, usually involves the use of
considerable quantities of concrete. In situations where the site
is submerged, numerous problems arise in the mixing and placing

71.
the concrete, and its strength and durability can be adversely
affected. These problems and ways of overcoming them are discussed
in Section 7.3.
7 . 2 Types of Working Platforms
It was stated in Section 5.2 that the most common type of marine
platform currently in use consists of a crossed-braced hollow steel
pile foundation. The main advantages of this type of platform is
that they can be used in virtually any depth of water and they are
easy to install. Also, they can vary in size and small scale
versions can be utilized as temporary working platforms. Figure 7.1
shows a typical crossed-braced template type structure used for oil
drilling in deep water. The installation procedure for this type of
structure is illustrated in Figure 7.2, and described below.
The procedure begins with the placement on the sea floor of a
prefabricated substructure or template,ithat is usually constructed
at a shore facility and transported in its entirety to the site.
The legs of the template are open tubular columns through which
bearing piles are driven. The pile driving rig would be on a large
floating barge or raft that is securely anchored in position next to
the template. Once the pile driving operation is completed, the
deck structure can be easily erected since the top of the template
is sticking out of the water, thus providing a stable base from
which to work.
The template-type structure discussed above is essentially a
fixed platform. In some cases, a movable working platform is a much
more practical proposition since, as well as being used for the

72.
construction, it can be used for the initial site investigation to
determine the most favourable position of the proposed structure.
The self-elevating barge is a mobile-type platform that has
been used for many years for petroleum explorations in water depths
of up to 100 metres. It consists of a steel barge with wells at the
corners and along the sides, through which steel caissons or legs are
placed. The barge is towed to the site of the proposed structure
with the legs fully raised so as to reduce drag. When the required
location has been reached, the legs are released to rest on,the
bottom and jacking devices over each well location are used to drive
the legs into the soil until the force exerted is sufficient to
raise the barge out of the water to a height above the maximum wave
height. The jacks have to be then operated continuously to hold the
barge on the legs. Figure 7.3 illustrates the basic procedure behind
the installation of a self-elevating platform,
A submersible or bouyant type platform is a movable platform
that basically consists of a column-supported deck resting on a
bouyant frame. The platform is towed out to the specified location
and the frame is then sunk so that it rests on the sea bottom and
acts as a mat footing (see Figure 7.4). This type of structure is
usually restricted to shallow water situations where there is a
reasonably flat bottom. In deep water, the frame can be'adjusted so
that it floats at an intermediate elevation, with the structure held
in place by an anchoring system.
All of the above platform types are suitable for use as working
platforms when the proposed structure is very large, thus requiring
heavy equipment for both the construction and the site investigation.

7
FIGURE 7.1
Typical Template-type Structure used for Oil
Drilling (after Civil Engineering in the
Oceans, Ref. 7).
FIGURE 7.2
Installation of Template-type Structure: Placement of Prefabricated Substructure, Bearing Piles in Place, (c) Deck Structure Erected.

74.
FIGURE 7.3
Installation of Self-elevating Type Platform
Positioned over Site
Legs Released to Rest on Bottom
Deck Jacked up
FIGURE 7.4
Installation of Submersible or Bouyant Type
Platform (a) Positioned over Site
Bouyant Frame Submerged
Resting on Bottom.

75.
In a coral reef situation they can be utilized when the proposed •
structure is in the deep water areas of the lagoon and the leeward
edge.
In cases where the proposed structure is relatively small and
the water shallow, construction can be carried out from simple,
temporary working platforms that are built over the site. An example
of this is the Pith Reef and Rib Reef lighthouses, where the site was
a bare coral reef. always submerged to at least 1 metre. The platform
consisted of a standard steel pipe scaffold tube and fittings,
similar to that used for formwork. With a labour force of 9 men,
the total working time for both towers was approximately 14 weeks, of
which 11/2 were taken to construct the working platforms.
7.3 Use of Concrete
Concrete is used extensively in the construction of structures
in coral reef environments, and for that - matter any marine environ-
ment. Many structures can be constructed of precast concrete
elements that are cast by conventional methods and then placed into
position. In some cases, such as the base slab of the Pith Reef and
Rib Reef towers, the concrete has to be cast in place under the water.
In addition to the usual requirements for all concrete, concrete
in marine environments must be selected with special attention to
its durability. A marine environment can severely test the
durability of concrete, and if improperly constructed the concrete
may suffer rapid and serious deterioration. The main factors
causing this deterioration and some common preventative measures are
listed as follows:

76.
ABRASION. Abrasion is due to the presence of suspended
particles of sand and gravel moving about in the water. It
can be resisted by increasing the strength and density of the
concrete, while at the same time using abrasion-resistant
aggregate and ensuring a good surface finish.
MARINE ORGANISMS. Organisms, such as the boring clam, that
attack concrete are especially prevalent in tropical waters.
Their attacks are normally effective only on weak, porous and
soft concrete, and a hard dense concrete surface will usually
provide adequate protection.
CHEMICAL ATTACK. Chemical attack on concrete takes place from
the action of sulphates and chlorides in the seawater, and is
once again most prevalent in tropical waters. Use of sulphate-
resistant cement and the avoidance of corners and sharp edges
in the design will significantly reduce chemical attack.
CORROSION OF REINFORCEMENT. This is probably the most serious
factor that can lead to a deterioration in the strength and
durability of structural concrete. In broad general terms,
this corrosion takes place in permeable, porous concrete which
is exposed alternately to salt water splash and to air, such as
in the tidal and wave-splash zones. Salt is deposited in the
concrete, thus setting up electro-chemical action which
corrodes the reinforcing and leads to the spalling.of of the
protective concrete. The corrosion is affected by a number of
factors including temperature, type of reinforcing, concrete
cover, cracks, and type of cement.

77.
Underwater placement of concrete is generally unavoidable when
founding a structure on a bare coral reef. Specialized techniques
have been developed to ensure that concrete placed underwater is
properly and efficiently placed, and that it will develop its
required strength and other characteristics. Some of the more common
processes include: the Tremie process; underwater buckets; grout
intrusion; hydraulic cements; and bagged and sacked concrete. It
should be noted that the general effect of submergence on concrete
may often be positive. That is, good quality concrete may increase
in strength with the passage of time.
In some places of the world, recrystallized coral (coral sand)
has very high strengths with excellent engineering properties. On
Guam Island, it is used for coarse as well as fine aggregate in
concrete mixes. In Hawaii, it is quarried and used in the
manufacture of cement. However, in many places, severe concrete
distress has occurred due to the use of improperly washed coral
aggregate, or the use of salt water in concrete batching. Moss (1976)
conducted a brief investigation into the suitability of unconsolidated
coral sediments (sand) for use as a concrete aggregate. Tests were
conducted to determine the strength of both the aggregate and the
final concrete mix using sand from Keeper Reef. The results of his
investigations are detailed in the report.
7.4 Erection of Superstructure
Because of the many difficulties associated with construction
in a marine environment, the proposed structure should be designed
so as to make the erection of the superstructure as simple and as
quick as possible. Probably the most widely used and most efficient

78.
method for ensuring this is the utilization of prefabricated
sections. Basically, the process involves the joining or splicing
together of sections that have been fabricated on the mainland and
transported in their entirety to the proposed site.
The number and size of the prefabricated sections depends
primarily on the shape or form of the proposed structure, the
condition of the site, and the method of transportation to the site.
It is fairly obvious that a tower - type structure lends itself to the
use of prefabricated sections more readily than a platform-type
structure. This is due to the fact that the sections of a tower are
all basically the same shape with identical splices, thus greatly
simplifying the erection. In the case of a platform-type structure,
the sections would be of varying shapes and sizes, thus increasing
the complexity of the splices which in turn increases the time of
erection.
Because of the limited working space available on bare coral
reefs, any prefabricated sections that are to be used for such a
situation must be an easily manageable size. This is brought about
by the fact that the sections have to be extensively manhandled at
all stages of the operation because of the limited amount of
auxilliary equipment, such as heavy cranes and hoists, that can be
employed in such a situation.
The method by which the sections are transported to the actual
site also has to be considered when determining their size. If the
sections are relatively small, they can be transported in the hold
or on the deck of a ship, whereas large sections may have to he
towed to the site. The towing of sections should be avoided wherever

79.
possible, because of the many difficulties associated with such an
operation.
Figure 7.5 shows the design of a standard, lattice-type
lighthouse tower proposed for remote sites off the Queensland coast.
The tower consists of six prefabricated sections that can be trans-
ported to the site on board the lighthouse tender. ship. The sections
are spliced at the levels shown in the diagram, and they are
transported from the tender to the actual site on the reef by means
of amphibious vehicles known as LARCS. The whole design was geared
towards a tower that will require the minimum of on-site labour, and
time, for its erection.

Light
Solar Cells . Plat form
Day mark
Aerial Fixing
Alternative Accommodation Positions
R.L. 43
R.L.63
adder
-- 2nd. Level Platform
R.L.19 1st: Level. Platform
Accommodation
R L. 100
R.L 96
R.L. 78
R.L.
23
80.
Levels of Splices
in Tower Leg5
PROPOSED STANDARD 100 FT.
LIGHTHOUSE TOWER
FIGURE 7.5

81.
CHAPTER 8
CONCLUSIONS AND RECOMMENDATIONS
When planning a major engineering structure, a thorough site
investigation is probably the single most important step. Although
it can be initially expensive, a site investigation may often save
money in the long run by ensuring that the structure is not over-
designed, and by detecting problem areas that would have otherwise
been discovered during construction, thus leading to an exorbitant
increase in cost. When the proposed structure is on a coral reef,
the importance of the site investigation is even more prominent
because of the extreme variability of a reef mass.
The different site investigation techniques applicable to coral
reef situations were discussed in Section 5.1. Comparison between
the methods indicates that penetrometer tests are best suited to a
coral reef situation. They can be used to accurately indicate the
presence of problem areas, and the relative strengths of layers in
the reef mass. Where it is proposed to utilize piles for the
foundation, tests should be carried out at each individual pile
position, since the variability in extent, thickness and competence
of coral strata within the overall mass can be extreme.
Without exception, piles are the most suitable foundation for
a structure on a coral reef. EkisLing structures on the Great
Barrier Reef are almost exclusively founded on driven steel piles,
although prestressed concrete piles could be applicable for larger
structures. Cast-in-place or pressure grouted piles could only be
used in situations where investigations have proved beyond doubt

82.
that the reef mass is extremely uniform and coherent.
In cases where the structure is massive, and very large
prestressed concrete piles are required, driving can create special
problems. On the main island of Hawaii, where high-rise buildings
are supported by prestressed concrete piles, all skin friction
capacity is neglected when estimating pile capacities. This is
because the brittle nature of coral fragments results in particle
crushing rather than densification when compacted or when a pile is
driven into it.
The costing involved in construction on a coral reef can lead
to great flexibility in the foundation design. The cost of driving
the actual piles is insignificant when compared to the cost of getting
the men and equipment out to the site. This means that the increase
in cost incurred by driving a pile deeper than specified in the
design is negligible. So, therefore, if the coral is weaker than was
expected and the pile was not achieving the required resistance or
set at the depth specified in the design, driving should continue
until sufficient resistance is encountered.
A structure in a coral reef environment should be designed so
that the utilization of prefabricated sections is taken full
advantage of. This is in order to keep the actual on-site construction
down to a minimum. Corrosion-resistant materials should be used wher-
ever possible, in order to keep maintenance to a minimum and to
increase the long-term strength of the structural members.
In summary, when designing a structure on a coral reef, the
engineer should have a thorough knowledge of the proposed site and
he should allow for a certain amount of flexibility in the foundation

83.
details. Also, wherever possible, the design engineer should be on
site when the piles are driven so as to enable him to determine
whether any variations in the design are necessary.

84.
REFERENCES
DARWIN, C., 1898, "The Structure and Distribution of Coral
Reefs", 3rd ed., D. Appleton and Co. Inc., New York.
MAXWELL, W.G.H., 1968, "Atlas of the Great Barrier Reef",
Elsevier Publishing Co., Amsterdam.
MYERS, HOLMES and MacALLISTER (Eds.), 1969, "Handbook of Ocean
and Underwater Engineering", McGraw-Hill, New York.
ROUGHLY, T. C., 1936, "Wonders of the Great Barrier Reef",
Angus and Robertson, Sydney.
5, BADER, J., 1970, "Ocean Platform - State of the Art",
Proceedings of the Offshore Technology Conference, 1970
(No. OTC 1282).
CAMERON, D. A. 1975, "Light Construction on the Great
Barrier Reef", B.E. Thesis, James Cook University of
North Queensland.
CONFERENCE ON CIVIL ENGINEERING IN THE OCEANS, San Francisco,
1969, A.S.C.E., Special Publication.
FOSTER, D. F., 1974, "Geochemical Properties of Coral Rock",
B.E. Thesis, James Cook University of North Queensland.
MOSS, K. H. .1976, "Geotechnical Studies of Coral Reef
Materials", B.E. Thesis, James Cook University of North
Queensland.

85.
SMITH, P. T., 1972, "Geomechanical Properties of Coral Rock",
B.E. Thesis, James Cook University of North Queensland.
BRAHTZ, J. F. (Ed.), 1968, "Ocean Engineering", Wiley
Publishing Co.
STANDARDS ASSOCIATION OF AUSTRALIA, 1973, Wind Loads,
AS 1170, Part 11.
REPORT ON STANDARD LIGHTHOUSE TOWERS FOR REMOTE SITES ON THE
AUSTRALIAN COAST, 1971, Special Publication by
Commonwealth Department of Works.
PALMER, H. D. "Coral Reefs and Atolls", Special
Publication.

86.
APPENDIX A
LITERATURE REVIEW
A detailed literature review was undertaken in order to obtain
any publications concerning structures on coral reefs. This proved
extremely difficult, and no publications specifically relating to
design and construction on coral reefs were located. There were
innumerable articles found concerning general offshore structures
in a variety of marine situations. These were mainly based on work
carried out by the Petroleum industry in areas such as the North
Sea, the Gulf of Mexico, and Bass Strait. Although these articles
do not refer to coral reefs whatsoever, some of the basic design and
construction principles illustrated in them could be applied to any
type of marine environment.
Some of the journals and indexes that were thoroughly
investigated include: The Engineering Index; The Geodex Soil
Mechanics Information Service; The Geomechanics Abstracts; The
Offshore Technology Conference series; and the Civil Engineering
in the Oceans Series. The Offshore Technology Conference Series of
Publications yielded the best results by far.
Given below is a list of articles that may be of interest when
planning a structure in a coral reef environment, and for that
matter any type of marine environment.
A.1 ENGINEERING INDEX
1.
1975 Vol. 74, Part II
No. 044066
"Offshore Regulations and their Impact on Permanent Offshore
Structures"

87.
1978 (Feb.) Vol. 16 No. 2
No. 012175
"Offshore Structure Reliability Engineering".
1978 (Oct.) Vol. 16 No. 10
No. 076178
"State of the Art: Behaviour of Structures and Structural
Design".
1976 Vol. 75 Part II
No. 043556
"Feasibility of a Fixed Platform for 1300 feet of Water".
A.2 OFFSHORE TECHNOLOGY CONFERENCE PROCEEDINGS
1977, Vol. I
No. OTC 2802
"Inspection and Monitoring of Concrete Structures for Steel
Corrosion".
1977, Vol.
No. OTC 2746
"Statistical Design Basis for Obtaining Additional Information
for the Design of Offshore Platforms".
1977, Vol.
No. OTC 2794
"Wave Loads on North Sea Gravity Platforms: A Comparison of
Theory and Experiment".

88.
1977, Vol. II
No. OTC 2809
"Platform Verification - A View from a Member of the Industry".
1977, Vol. II
No. 2861
"Application of Regulations and Design Codes for Offshore
Installations".
1977, Vol. II
No. OTC 2863
"Norweigan Regulations for Design of Offshore Structures".
1977, Vol. III
No. OTC 2944
"Response of Offshore Piles to Cyclic Loading",
1977, Vol. IV
No. OTC 2961
"Mackeral/Tuna Platform Design and Installation".
1977, Vol. IV
No. OTC 3028
"Offshore Platform Risk".
1976, Vol.
No. OTC 2477
"Controlled Piledriving Above and Under Water with a
Hydraulic Hammer" . .
1976, Vol. I
No. OTC 2503
"Performance of Mat Supported Jack - Up Drilling Rigs".

39.
1976, Vol. II
No. OTC 2553
"Offshore Platforms: Observed Behaviour and Comparisons with
Theory".
1976, Vol. II
No. OTC 2604
"Fatigue of Structural Steel for Offshore PlaLforms".
1976, Vol. II
No. OTC 2607
"Fatigue Design of an Offshore Structure".
1976, Vol. II
No. OTC 2608
"Probabilistic Fatigue Analysis of Fixed Offshore Structures".
1976, Vol. IV
No. OTC 1949
"The Role of Research in the Design of Concrete Offshore
Structures".
1976, Vol. IV
No. OTC 1948
"Vortex Excited Structural Oscillations of a Circular Cylinder
in Steady Currents".
. 1976, Vol. IV
No. OTC 1958
"Corrosion in the Offshore Environment".

19. 1976, Vol. IV
No. OTC 1962
"Metal Exposures at Tropical and Marine Sites".
20, 1975, Vol. II
No, OTC 2311
"Pile Load Tests in Calcerous Soila Conducted in 400 feet of
Water from a Semi-submersible Exploration Dig",
1975, Vol. II
Nos, OTC 2333
"Numerical Calculation of Storm Surges: An Evaluation of
Techniques".
1971, Vol. II
No, OTC 1405
No. OTC 1406
No. OTC 1407
23, 1970, Vol. I
No. OTC 1180
"Wave-Exciting Forces and Moments on an Ocean Platform".
24. 1970, Vol. II
No, OTC 1311
"Submarine Placing of Concrete by the Tremie Method".
90.

91.
APPENDIX B
RESEARCH ACTIVITIES
The majority of the information on which the discussion in the
preceeding text was based came from sources associated with
construction on the Great Barrier Reef. Efforts were made to obtain
information from overseas sources, and some of the organizations
that were contacted, include: Dames and Moore, an American
engineering company with experience in the field of construction on
coral rock (mainly in Hawaii); the Museum of Natural History in
French Polynesia; CEA and ORSTOM, scientific organizations in
Tahiti; and the Australian Embassy in the West Indies.
The above contacts yielded no specific information about the
design and construction of structures on coral reefs, apart from
things that were already known from experience gained on the Great
Barrier Reef.
The main avenue of research concerning structures on our own
reef was the Commonwealth Department of Construction, whose head
office was in Melbourne at the time, but is now in Canberra.
During a four day visit to Melbourne at the beginning of July,
research was undertaken at the Department's head office and visits
were also made to the CSIRO Department of Applied Geomechanics, the
Department of Transport, and the_Department of Harbours and Marine.
Some time was also spent in Brisbane contacting the Department of
Mapping and Surveying, and the Queensland Divisions of the
Departments of Construction and Transport.
The information obtained from the abovementioned was invaluable
in ensuring the progress and value of the project.
Copyright © 2022 FDOKUMEN